air quality and greenhouse gas emissions. · this chapter analyzes potential impacts to air quality...
TRANSCRIPT
This chapter analyzes potential impacts to air quality and climate change in the study area.
The alternatives considered in this EIS may contribute to regional air quality impacts. The analysis focuses on the following pollutants of concern: carbon monoxide (CO), particulate matter (PM), ozone precursors (nitrogen dioxide and volatile organic compounds), and toxic air pollutants (TAPs). TAPs and fine particulate matter (PM2.5) are analyzed to the degree feasible to identify potential public health impacts from locating new sensitive receptors within trans-portation corridors.
This chapter also analyzes how the alternatives may contribute to global climate change through greenhouse gas emissions related to transportation and land uses. Transportation systems contribute to climate change primarily through the emissions of certain greenhouse gases (CO2, CH4, and N2O) from nonrenewable energy (primarily gasoline and diesel fuels) used to operate passenger, commercial, and transit vehicles. Land use changes contribute to climate change through construction, operational use of electricity and natural gas, water demand, and waste production.
3.9.1 AFFECTED ENVIRONMENT
AIR QUALITY
Regulatory Agencies and Requirements
Federal, state, and local agencies regulate air quality in the Puget Sound region: the U.S. EPA, the Washington State Department of Ecology (Ecology), and the Puget Sound Clean Air Agency (PSCAA). Each has its own role in regulating air quality. The City of Seattle codifies air quality policies in SMC
3.9 AIR QUALITY AND GREENHOUSE GAS EMISSIONS.
MHA Draft EISJune 2017
3.314
25.05.675.A that provide limited regulatory authority over actions that could degrade air quality.
U.S. Environmental Protection Agency
The 1970 Clean Air Act (last amended in 1990) requires that regional planning and air pollution control agencies prepare a regional air quality plan to outline how stationary and mobile sources of pollutants will be controlled to achieve all standards by the deadlines specified in the Act. Intended to protect the public health and welfare, these ambient air quality standards are specify the concentration of pollutants (with an adequate margin of safety) to which the public can be exposed without adverse health effects. The standards are designed to protect the people most susceptible to respiratory distress, including asthmatics, the very young, the elderly, people weak from other illness or disease, and people engaged in strenuous work or exercise.
As required by the 1970 Clean Air Act, EPA initially identified six criteria air pollutants found in urban environments for which state and federal health-based ambient air quality standards have been established. EPA calls these criteria air pollutants because it has regulated them by developing specific public health- and welfare-based criteria as the basis for setting permissible levels. EPA originally identified ozone, CO, PM, nitrogen dioxide (NO2), sulfur dioxide (SO2), and lead as the six criteria air pollutants. Since then, EPA has identified and set permissible levels for subsets of PM. These include PM10 (matter less than or equal to 10 microns in diameter) and PM2.5 (matter less than or equal to 2.5 microns in diameter).
The Clean Air Act established National Ambient Air Quality Standards (NAAQS), with primary and secondary standards, to protect the public health and welfare from air pollution. Areas of the U.S. that do not meet the NAAQS for any pollutant are designated by EPA as nonattainment areas. Areas once designated nonattainment but now achieving the NAAQS are termed maintenance areas. Areas with air pollution levels below the NAAQS are termed attainment areas. In nonattainment areas, states must develop plans to reduce emissions and bring the area back into attainment of the NAAQS.
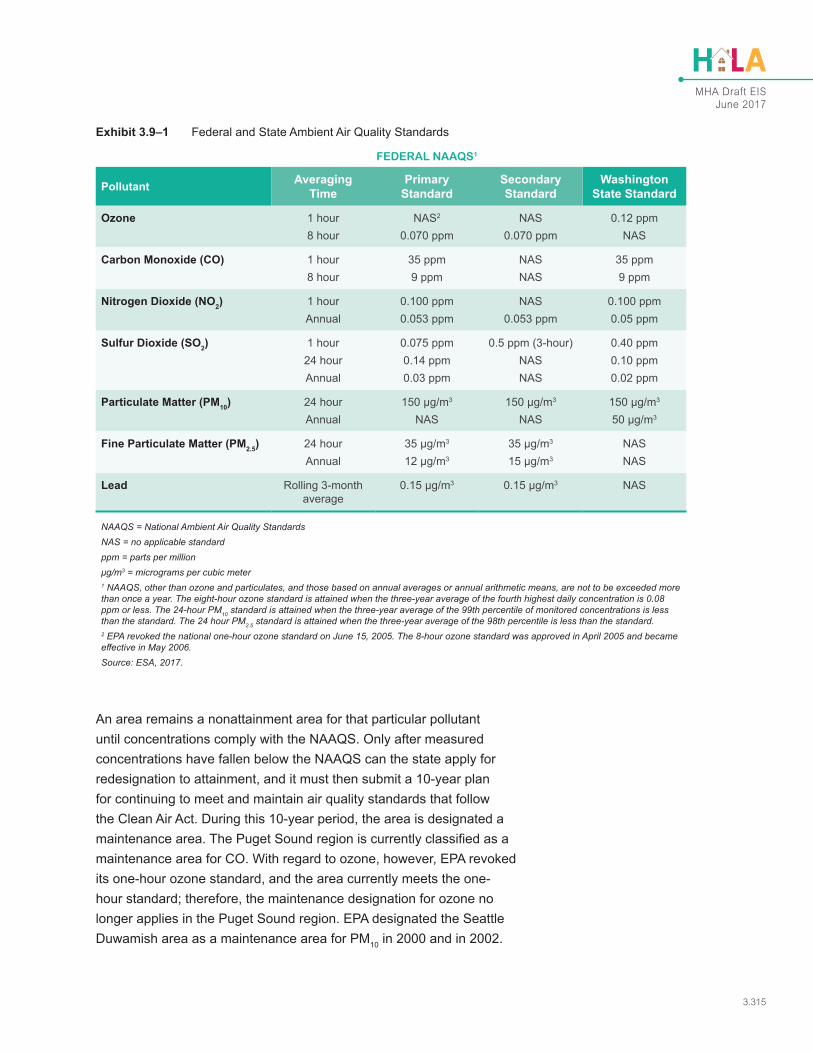
Exhibit 3.9–1 displays the primary and secondary NAAQS for the six criteria pollutants. Ecology and PSCAA have authority to adopt more stringent standards, though many state and local standards are equivalent to the federal mandate.
MHA Draft EISJune 2017
3.315
An area remains a nonattainment area for that particular pollutant until concentrations comply with the NAAQS. Only after measured concentrations have fallen below the NAAQS can the state apply for redesignation to attainment, and it must then submit a 10-year plan for continuing to meet and maintain air quality standards that follow the Clean Air Act. During this 10-year period, the area is designated a maintenance area. The Puget Sound region is currently classified as a maintenance area for CO. With regard to ozone, however, EPA revoked its one-hour ozone standard, and the area currently meets the one-hour standard; therefore, the maintenance designation for ozone no longer applies in the Puget Sound region. EPA designated the Seattle Duwamish area as a maintenance area for PM10 in 2000 and in 2002.
Exhibit 3.9–1 Federal and State Ambient Air Quality Standards
FEDERAL NAAQS1
Pollutant Averaging Time
Primary Standard
Secondary Standard
Washington State Standard
Ozone 1 hour8 hour
NAS2
0.070 ppmNAS
0.070 ppm0.12 ppm
NAS
Carbon Monoxide (CO) 1 hour8 hour
35 ppm9 ppm
NASNAS
35 ppm9 ppm
Nitrogen Dioxide (NO2) 1 hourAnnual
0.100 ppm0.053 ppm
NAS0.053 ppm
0.100 ppm0.05 ppm
Sulfur Dioxide (SO2) 1 hour24 hourAnnual
0.075 ppm0.14 ppm0.03 ppm
0.5 ppm (3-hour)NASNAS
0.40 ppm0.10 ppm0.02 ppm
Particulate Matter (PM10) 24 hourAnnual
150 μg/m3
NAS150 μg/m3
NAS150 μg/m3
50 μg/m3
Fine Particulate Matter (PM2.5) 24 hourAnnual
35 μg/m3
12 μg/m3
35 μg/m3
15 μg/m3
NASNAS
Lead Rolling 3-month average
0.15 μg/m3 0.15 μg/m3 NAS
NAAQS = National Ambient Air Quality StandardsNAS = no applicable standardppm = parts per millionμg/m3 = micrograms per cubic meter1 NAAQS, other than ozone and particulates, and those based on annual averages or annual arithmetic means, are not to be exceeded more than once a year. The eight-hour ozone standard is attained when the three-year average of the fourth highest daily concentration is 0.08 ppm or less. The 24-hour PM10 standard is attained when the three-year average of the 99th percentile of monitored concentrations is less than the standard. The 24 hour PM2.5 standard is attained when the three-year average of the 98th percentile is less than the standard.2 EPA revoked the national one-hour ozone standard on June 15, 2005. The 8-hour ozone standard was approved in April 2005 and became effective in May 2006.Source: ESA, 2017.
MHA Draft EISJune 2017
3.316
Washington State Department of Ecology
Ecology maintains an air quality program to safeguard public health and the environment by preventing and reducing air pollution. Washington’s main sources of air pollution are motor vehicles, outdoor burning, and wood smoke. Ecology strives to improve air quality throughout the state by overseeing the development of and conformity with the State Implementation Plan (SIP), the state’s plan for meeting and maintaining the NAAQS. Ecology has maintained its own air quality standard for one-hour ozone concentrations and established its own more stringent air quality standards for one-hour ozone, one-hour and 24-hour SO2, and annual NO2, SO2 and PM10 concentrations, as shown in Exhibit 3.9–1.
Puget Sound Clean Air Agency
The PSCAA has local authority for setting regulations and permitting of stationary air pollutant sources and construction emissions. PSCAA also maintains and operates a network of ambient air quality monitoring stations throughout its jurisdiction.
Existing Climate and Air Quality
The City of Seattle is in the Puget Sound lowland. Buffered by the Olympic and Cascade mountain ranges and Puget Sound, the Puget Sound lowland has a relatively mild, marine climate with cool summers and mild, wet, and cloudy winters.
The prevailing wind direction in the summer is from the north or northwest. The average wind velocity is less than 10 miles per hour. Persistent high-pressure cells often dominate summer weather and create stagnant air conditions. This weather pattern sometimes contributes to the formation of photochemical smog. During the wet winter season, the prevailing wind direction is south or southwest.
There is sufficient wind most of the year to disperse air pollutants released into the atmosphere. Air pollution is usually most noticeable in the late fall and winter, under conditions of clear skies, light wind, and a sharp temperature inversion. Temperature inversions occur when cold air is trapped under warm air, thereby preventing vertical mixing in the atmosphere. These can last several days. If poor dispersion persists for more than 24 hours, the PSCAA can declare an “air pollution episode” or local “impaired air quality.”
MHA Draft EISJune 2017
3.317
Pollutants of Concern and Trends
Pollutants generated by both natural and manmade sources affect air quality. In general, the largest manmade contributors to air emissions are transportation vehicles and power-generating equipment, both of which typically burn fossil fuels. The main criteria pollutants of interest for land use development are CO, PM, ozone, and ozone precursors (volatile organic compounds (VOCs) and oxides of nitrogen (NOx)). Both federal and state standards regulate these pollutants, along with two other criteria pollutants, SO2 and lead. The Puget Sound region is in attainment for ozone, NO2, lead, and SO2.
The major sources of lead emissions have historically been mobile and industrial sources. Due to the phase-out of leaded gasoline, metal processing is currently the primary source of lead emissions, and no lead emissions are associated with development under the alternatives in this EIS. SO2 is produced by the combustion of sulfur-containing fuels, such as oil, coal, and diesel. Historically, Washington has measured very low levels of SO2. Because the levels were so low, most monitoring was stopped. SO2 emissions have dropped over the past 20 years because control measures were added for some sources, some larger SO2 sources shut down, and the sulfur content of gasoline and diesel fuel was reduced nearly 90 percent. SO2 emissions would not be appreciably generated by development under any alternative and, given the attainment status of the region, are not further considered in this analysis.
The largest contributors of pollution related to land development activity are construction equipment, motor vehicles, and off-road construction equipment. The main pollutants emitted from these sources are CO, PM, ozone precursors (VOC and NOx), GHGs and TAPs. Motor vehicles and diesel-powered construction equipment also emit pollutants that contribute to the formation of ground-level ozone. This section discusses the main pollutants of concern and their impact on public health and the environment.
Carbon Monoxide
CO is an odorless, colorless gas usually formed as the result of the incomplete combustion of fuels. The largest sources of CO are motor vehicle engines and traffic, and industrial activity and woodstoves. Exposure to high concentrations of CO reduces the oxygen-carrying capacity of the blood and can cause headaches, nausea, dizziness, and fatigue; impair central nervous system function; and induce angina (chest
MHA Draft EISJune 2017
3.318
pain) in persons with serious heart disease. Very high levels of CO can be fatal. Puget Sound region is designated as a maintenance area for CO (Ecology 2017).
Particulate Matter
PM is a class of air pollutants that consists of heterogeneous solid and liquid airborne particles from manmade and natural sources. PM is measured in two size ranges: PM10 and PM2.5. Fine particles are emitted directly from a variety of sources, including wood burning (both outside and indoor wood stoves and fireplaces), vehicles, and industry. They also form when gases from some of these same sources react in the atmosphere.
Exposure to particle pollution is linked to various significant health problems, such as increased hospital admissions and emergency department visits for cardiovascular and respiratory problems, non-fatal heart attacks, and premature death. People most at risk from fine and coarse particle pollution exposure include people with heart or lung disease (including asthma), older adults, and children. Pregnant women, newborns, and people with certain health conditions, such as obesity or diabetes, may also be more susceptible to PM-related effects.
The federal annual PM2.5 standard has not been exceeded in the Puget Sound area since EPA established its NAAQS in 2007. The federal daily PM2.5 standard has not been exceeded in the Puget Sound area since the initiation of monitoring for this pollutant in 2001 (PSCAA 2015). In 2012, EPA strengthened the annual standard from 15 micrograms per cubic meter to 12 micrograms per cubic meter. The Puget Sound area is in attainment with the revised PM2.5 standard. Notwithstanding the continued attainment of federal PM10 standards, portions of the Puget Sound region continue to be designated as maintenance areas for PM10.
Ozone
Ozone is a secondary air pollutant produced in the atmosphere through a complex series of photochemical reactions involving VOCs (which regulating agencies sometimes call reactive organic gases or ROGs) and NOx. The main sources of VOC and NOx, often called ozone precursors, are combustion processes (including motor vehicle engines) and the evaporation of solvents, paints, and fuels. Ozone levels are usually highest in the afternoon because of the intense sunlight and the time required for ozone to form in the atmosphere. Ecology currently monitors ozone from May through September, the period of concern for elevated
MHA Draft EISJune 2017
3.319
ozone levels in the Pacific Northwest. No violations of the NAAQS for ozone have occurred at the Seattle monitoring station since monitoring commenced there in 1999.
Elevated concentrations of ground-level ozone can impair lung function, cause respiratory irritation, and aggravate asthma. Ozone has also been linked to immune system impairment. People with respiratory conditions should limit outdoor exertion during elevated ozone levels. Even healthy individuals may experience respiratory symptoms on a high-ozone day. Ground-level ozone can also damage forests and agricultural crops, interfering with their ability to grow and produce food. The Puget Sound region is designated as an attainment area for the federal ozone standard.
Toxic Air Pollutants
Other pollutants known to cause cancer or other serious health effects are called air toxics. Ecology began monitoring air toxics at the Seattle Beacon Hill site in 2000. The Clean Air Act identifies 188 air toxics; EPA later identified 21 of these air toxics as mobile source air toxics (MSATs) and then extracted a subset of nine priority MSATs: benzene, ethylbenzene, formaldehyde, acetaldehyde, diesel particulate matter/diesel exhaust organic gases, acrolein, naphthalene, polycyclic organic matter, and 1,3-butadiene. Exposure to these pollutants for long durations and sufficient concentrations increases the chances of cancer; damage to the immune system; and neurological, reproductive, developmental, respiratory, and other serious health problems.
Diesel particulate matter poses the greatest potential cancer risk (70 percent of the total risk from air toxics) in the Puget Sound area (PSCAA 2011). This pollution comes from diesel-fueled trucks, cars, buses, construction equipment, and rail, marine, and port activities. Particulate matter from wood smoke (a result of burning in woodstoves and fireplaces or outdoor fires) presents the second-highest potential cancer health risk. Wood smoke and auto exhaust also contain formaldehyde, chromium, benzene, 1,3-butadiene, and acrolein. Chromium is also emitted from industrial plating processes. EPA prioritizes reductions of these air toxics.
Air Quality Information Sources, Monitoring, and Trends
The PSCAA monitors criteria air pollutant concentrations at three locations within Seattle city limits. The primary monitoring station in Seattle is in Beacon Hill. This station collects data for ozone, CO, NO2, PM2.5, and SO2. The other locations are 10th Ave S and S Weller St and
MHA Draft EISJune 2017
3.320
Duwamish. The 10th and Weller station monitors concentrations of CO, NO2, and PM2.5. The Duwamish station monitors concentrations of PM2.5.
Exhibit 3.9–2 displays the most recent three years of available monitoring data at these locations and shows that the air pollutant concentration trends for these pollutants remain below the NAAQS.
Emission projections and ongoing monitoring throughout the central Puget Sound region indicate that the ambient air pollution concentrations for CO and PM2.5 have decreased over the past decade. Measured ozone concentrations, in contrast, have remained relatively static. The decline of CO is primarily due to improvements to emission controls on motor vehicles and the retirement of older, higher-polluting vehicles. However, the Puget Sound Regional Council estimates that by 2040 the Puget Sound region population will grow by one million people, a 27 percent increase from 2013, to reach a population of 4.9 million people (PSRC 2015). The highest population increase is estimated to be in King County. These estimates indicate that CO, PM2.5, and ozone emissions will increase, which could lead to future NAAQS violations.
Air toxic pollutant emissions are also of concern because of the projected growth in vehicle miles traveled. EPA has been able to reduce benzene, toluene, and other air toxics emissions from mobile sources through stringent standards on tailpipe emissions and by requiring the use of reformulated gasoline. The FHWA estimates that even if VMT increases by 45 percent from 2010 to 2050, a combined reduction of 91 percent in the total annual emissions for the priority MSAT is projected for the same time period (FHWA 2016).

MHA Draft EISJune 2017
3.321
Exhibit 3.9–2 Ambient Air Quality Monitoring Data for Monitoring Stations in Seattle
MAXIMUM CONCENTRATIONS
Pollutant Station Averaging Time 2014 2015 2016 NAAQS
Standard
Ozone Beacon Hill 1 hour8 hour
0.058 ppm0.048 ppm
0.062 ppm0.050 ppm
0.060 ppm0.050 ppm
0.070 ppmNAS
Carbon Monoxide (CO) 10th & Weller 1 hour8 hour
3.309 ppm2.0 ppm
2.216 ppm1.8 ppm
1.999 ppm1.6 ppm
35 ppm9 ppm
Beacon Hill 1 hour8 hour
1.078 ppm1.0 ppm
1.1 ppm0.9 ppm
1.198 ppm0.9 ppm
35 ppm9 ppm
Particulate Matter (PM10) Beacon Hill 24 hourAnnual
24 μg/m3
9.76 μg/m3
38 μg/m3
10.94 μg/m3
24 μg/m3
9.24 μg/m3
150 μg/m3
NAS
Fine Particulate Matter (PM2.5) 10th & Weller 24 hourAnnual
33.6 μg/m3
9.96 μg/m3
26.5 μg/m3
9.29 μg/m3
20.6 μg/m3
7.71 μg/m3
35 μg/m3
12 μg/m3
Beacon Hill 24 hourAnnual
27.1 μg/m3
5.88 μg/m3
33.1 μg/m3
6.55 μg/m3
16.2 μg/m3
5.46 μg/m3
35 μg/m3
12 μg/m3
Duwamish 24 hourAnnual
44.0 μg/m3
8.14 μg/m3
31.7 μg/m3
9.77 μg/m3
30.2 μg/m3
6.53 μg/m3
35 μg/m3
12 μg/m3
Nitrogen Dioxide (NO2) 10th & Weller 1 hourAnnual
0.091 ppm0.024 ppm
0.106 ppm0.024 ppm
0.071 ppm0.036 ppm
0.1 ppm0.05 ppm
Beacon Hill 1 hourAnnual
0.060 ppm0.012 ppm
0.055 ppm0.011 ppm
0.058 ppm0.025 ppm
0.1 ppm0.05 ppm
Sulfur Dioxide (SO2) Beacon Hill 1 hour24 hourAnnual
0.003 ppm0.001 ppm0.001 ppm
0.009 ppm0.003 ppm0.002 ppm
0.008 ppm0.002 ppm0.001 ppm
0.075 ppm0.14 ppm0.03 ppm
NAAQS = National Ambient Air Quality StandardsNAS = no applicable standardppm = parts per millionμg/m3 = micrograms per cubic meterSource: ESA, 2017.
MHA Draft EISJune 2017
3.322
Sources of Air Pollution
Air pollution sources in Seattle and its environs can be categorized into point sources, transportation sources, and area sources.
Transportation sources include freeways, highways, and major arterial roadways, particularly those supporting a high percentage of diesel truck traffic, such as State Routes 99 and 599. A Washington State Department of Health (DOH) health risk assessment found that on-road mobile sources contribute to the highest cancer and non-cancer risks near major roadways over a large area of south Seattle and that risks and hazards are greatest near major highways and drop dramatically about 200 meters (656 feet) from the center of highways (WSDH 2008).
The DOH analysis focuses on the south Seattle/Duwamish Valley area. Georgetown and South Park residents asked DOH to assess pollutant impacts on their health. To date this is the only such assessment for the greater Seattle area. Most land use in the Duwamish Valley is commercial or industrial except for the two residential communities of Georgetown and South Park. The study’s findings, particularly related to exposure from highway sources, is likely to be similar for north Seattle.
EPA identifies risk above 100 per one million persons (100 excess cancer risk) as a criterion for conducting air toxic analyses and making risk management decisions at the facility and community-scale level and, consequently, may be interpreted as a relatively high cancer risk value from a single air pollutant source (BAAQMD 2009). Other states have identified recommended separation distances of residential uses from rail yard sources of 1,000 feet. This 1,000-foot distance correlates to increased cancer risks below 500 in one million. Sensitive land uses inside this area are considered inappropriate and could represent a moderate to severe air quality impact (CARB 2005). These mapped areas represent an increased cancer risk. Cancer estimates are expressed in scientific notation, for example 1e-6 or 1 x 10⁻⁶, This means one excess cancer per million individuals exposed, or an individual’s probability of getting cancer from exposure to air pollutants is one in 1,000,000. These risks should not be interpreted as estimates of disease in the community but only as a tool to define potential risk.
Additional transportation sources include railway lines supporting diesel locomotive operations. BNSF Railway Company (BNSF) owns and operates a mainline dual-track from Portland to Seattle. Union Pacific owns and operates a single mainline track with two-way train operations between Tacoma and Seattle. BNSF owns and operates tracks that
MHA Draft EISJune 2017
3.323
extend north from downtown Seattle to Snohomish County and then east to Spokane. A connecting spur, operated by the Ballard Terminal Rail Company, serves the Ballard and the western ship canal area. Other transportation sources that contribute to regional and localized pollutant concentrations include aircraft (from Boeing Field) and marine sources (ferries, tugs, container ships, etc.).
Point sources (also called stationary sources) are generally industrial equipment and are almost always required to have a permit to operate from PSCAA. Examples include industrial turbines and cement manufacturing plants. Area sources include ports, truck-to train intermodal terminals, and distribution centers.
The Port of Seattle aims to reduce PM emissions from ships by 70 percent while they are in port and from land-based equipment by 30 percent (Port of Seattle et al. 2007). Measures to reduce emissions include providing power plug-ins to ships while they are in port.
Sensitive Populations
People more sensitive to the health effects of air pollutants include the elderly and the young; populations with higher rates of respiratory disease, such as asthma and chronic obstructive pulmonary disease; and people with other environmental or occupational health exposures (e.g., indoor air quality) that affect cardiovascular or respiratory diseases. Therefore, land uses and facilities such as schools, children’s daycare centers, hospitals, and nursing and convalescent homes are considered more sensitive than the general public to poor air quality because the people associated with these uses are more susceptible to respiratory distress.
Parks and playgrounds are considered moderately sensitive to poor air quality because people engaged in strenuous work or exercise have increased sensitivity to poor air quality. However, exposure times are generally shorter in parks and playgrounds than in residential locations and schools. Residential areas are considered more sensitive to air quality conditions compared to commercial and industrial areas because people generally spend more time at home and thus have proportionally greater exposure to ambient air quality conditions. Workers are not considered sensitive receptors because all employers must follow regulations set forth by the Occupational Safety and Health Administration (OSHA) to ensure the health and well-being of their employees with regard to their own operations.
MHA Draft EISJune 2017
3.324
GREENHOUSE GASES AND CLIMATE CHANGE
Gases that trap heat in the atmosphere are referred to as greenhouse gases because, like a greenhouse, they capture heat radiated from the earth. The accumulation of GHGs are a driving force in global climate change. Definitions of climate change vary between and across regulatory authorities and the scientific community. In general, however, climate change can be described as the changing of the earth’s climate due to natural fluctuations and anthropogenic activities (i.e., activities relating to, or resulting from the influence of, human beings) that alter the composition of the global atmosphere.
Increases in GHG concentrations in the earth’s atmosphere are believed to be the main cause of human-induced climate change. GHGs naturally trap heat by impeding the exit of solar radiation that hits the earth and reflects into space. This trapping of heat is called a “greenhouse effect.” Some GHGs occur naturally and are necessary for keeping the earth’s surface habitable. But increases in their atmospheric concentrations during the last 100 years have decreased the amount of solar radiation reflected back into space, intensifying the natural greenhouse effect and increasing global average temperature.
Pollutants of Concern
The principal GHGs of concern are CO2, CH4, N2O, SF6, perfluorocarbons (PFCs) and hydrofluorocarbons (HFCs). Electric utilities, including Seattle City Light, use SF6 in electric distribution equipment. Each principal GHG has a long atmospheric lifetime (one year to several thousand years). In addition, the potential heat-trapping ability of each of these gases varies substantially. CH4 is 23 times as potent as CO2 at trapping heat, while SF6 is 23,900 times more potent than CO2. Conventionally, GHGs have been reported as CO2 equivalents (CO2e). CO2e reflects the relative potency of non-CO2 GHGs and converts their quantities to an equivalent amount of CO2 so that all emissions can be reported as a single quantity.
The primary human-made processes that release GHGs include combustion of fossil fuels for transportation, heating, and electricity generation; agricultural practices that release CH4, such as livestock production and crop residue decomposition; and industrial processes that release smaller amounts of high global warming potential gases like SF6, PFCs and HFCs. Deforestation and land cover conversion also
MHA Draft EISJune 2017
3.325
contribute to global warming by reducing the earth’s capacity to remove CO2 from the air and altering the earth’s albedo (surface reflectance), thereby allowing more solar radiation to be absorbed.
Regulatory Rules and Plans
Washington State Department of Ecology
In December 2010, Ecology adopted Chapter 173-441 Washington Administrative Code—Reporting of Emissions of Greenhouse Gases. This rule institutes mandatory GHG reporting for:
• Facilities that emit at least 10,000 metric tons of GHGs per year in Washington; and
• Suppliers of liquid motor vehicle fuel, special fuel, or aircraft fuel that supply products equivalent to at least 10,000 metric tons of CO2 per year in Washington.
In 2016, Ecology established GHG emission standards for certain large emitters. Chapter 173.442 WAC establishes emission standards for GHG emissions from certain stationary sources located in Washington, including natural gas distributors, petroleum product producers (i.e., refineries and importers), power plants, waste facilities, and metal, cement, pulp and paper, and glass manufacturers.
Seattle Climate Action Plan
Seattle was the first city in the nation to adopt a green building goal for all new municipal facilities. In 2001, the City created a Leadership in Energy and Environmental Design (LEED) incentive program for private development projects. Resolution 30144 established Seattle City Light’s long-term goal of meeting all of Seattle’s electrical needs with zero net GHG emissions. Seattle City Light achieved GHG neutrality in 2005 by reducing emissions, inventorying remaining emissions, and purchasing offsets for remaining emissions and has maintained GHG neutrality since (SCL 2012).
In 2011, the City Council adopted Resolution 31312 establishing a long-term climate protection vision for Seattle that included achieving net zero GHG Emissions by 2050 and preparing for the likely impacts of climate change. The City prepared a Climate Action Plan (2013 CAP) that details the strategy for achieving these goals. The strategy focuses on City actions that reduce GHG emissions while also supporting other
MHA Draft EISJune 2017
3.326
community goals, including building vibrant neighborhoods, fostering economic prosperity, and enhancing social equity. The 2013 CAP focuses on sources of emissions where City action and local community action will have the greatest impact: road transportation, building energy, and waste, which together account for most local emissions. The 2013 CAP identifies the Comprehensive Plan as one of many plans that will implement the Climate Action Plan. With 2008 as the baseline year, the 2013 CAP identifies the following targets by 2030:
• 20 percent reduction in vehicle miles traveled
• 75 percent reduction in GHG emissions per mile for Seattle vehicles
• 10 percent reduction in commercial building energy use
• 20 percent reduction in residential building energy use
• 25 percent reduction in combined commercial and residential building energy use
The 2013 CAP also calls for identifying equitable development policies to support growth and development near existing and planned high-capacity transit without displacement.
Existing Greenhouse Gas Emissions and Trends
In August 2016, the City published its 2014 Seattle Community Greenhouse Gas Emissions Inventory. Primary sources (core emissions) of GHG emissions include on-road transportation, building energy, and waste generation. Transportation sources comprise about 66 percent of inventoried emissions, building energy (electricity generation and natural gas and other fuel combustion) 32 percent, and waste sources three percent. From 2008 to 2014, core emissions of GHGs declined five percent from 3.6 million to 3.4 million metric tons of CO2e. This reduction occurred despite an overall increase in population of 13 percent during the same period (City of Seattle 2016).
Ecology estimates that in 2013, Washington produced about 94.4 million gross metric tons of CO2e (MMTCO2e, or about 104 million U.S. tons) (Ecology 2016). Ecology found that transportation is the largest source, at 42.8 percent of the state’s GHG emissions, followed by electricity generation (both in-state and out-of-state) at 19 percent, and residential, commercial, and industrial energy use at 22 percent. The sources of the remaining 16.2 percent of emissions are agriculture, waste management, and industrial processes.
MHA Draft EISJune 2017
3.327
Transportation Related Greenhouse Gas Emissions
The analysis completed for this EIS builds on the findings in the 2014 Seattle Community Greenhouse Gas Emissions Inventory. This analysis calculates transportation GHG emissions at the citywide level. The Seattle inventory estimates 2,283,000 metric tons of CO2e (MTCO2e) in 2014.
Based on a review of traffic and fuel economy trends, the 2014 GHG emissions estimate is assumed to adequately represent current conditions and may be conservatively high. Appendix L has additional details.
3.9.2 IMPACTS
IMPACTS COMMON TO ALL ALTERNATIVES
Air Quality
Construction-Related Emissions
Future growth under any alternative would result in development. Most development projects in the city would entail demolition and removal of existing structures or parking lots, excavation and site preparation, and construction of new buildings. Emissions generated during construction activities would include exhaust emissions from heavy duty construction equipment, trucks used to haul construction materials to and from sites, worker vehicle emissions, and fugitive dust emissions associated with earth-disturbing activities and other demolition and construction work.
Fugitive dust emissions are typically generated during construction phases. Activities that generate dust include building and parking lot demolition, excavation, and equipment movement across unpaved construction sites. The PSCAA requires dust control measures (emissions control) for construction projects through Article 9, Section 9.15. Measures applicable to fugitive dust include (1) using control equipment, enclosures, or wet suppression techniques, (2) paving or otherwise covering unpaved surfaces as soon as possible, (3) treating construction sites with water or chemical stabilizers, reducing vehicle speeds and cleaning vehicle undercarriages before entering public roadways, and (4) covering or wetting truck loads or providing freeboard in truck loads. Given these requirements, impacts related to construction dust are concluded to be less than significant.
MHA Draft EISJune 2017
3.328
During construction activities, diesel-powered demolition and construction equipment would emit criteria air pollutants. Other emissions during construction would result from trucks used to haul construction materials to and from sites and from vehicle emissions generated during worker travel to and from construction sites. Exhaust emissions from diesel off-road equipment represent a relatively small percentage of the overall emission inventory in King County: 0.6 percent of countywide CO, 8.8 percent of countywide NOx, 6.7 percent of countywide PM2.5 and 0.9 percent of countywide VOC (PSCAA 2008). Consequently, the primary emissions of concern (greater than one percent contribution) from construction equipment are NOx and PM2.5 (the latter a priority air toxic). NOx is primarily an air quality concern with respect to its role in (regional) ozone formation, and the Puget Sound air shed has long been designated as an attainment area (meeting standards) with respect to ozone. Construction-related NOx emissions are not expected to generate significant adverse air quality impacts nor lead to violation of standards under any of the alternatives. The same conclusion is reached for diesel-related emissions of PM2.5, which could generate temporary localized adverse impacts within a few hundred feet of construction sites.
Federal regulations require cleaner off-road equipment. Specifically, EPA has set emissions standards for new off-road equipment engines, classified as Tier 1 through Tier 4. Tier 1 emission standards were phased in between 1996 and 2000, and Tier 4 interim and final emission standards for all new engines were phased in between 2008 and 2015. To meet Tier 4 emission standards, engine manufacturers must provide new engines with advanced emission-control technologies. Although the full benefit of these regulations will not be realized for several years, EPA estimates that by implementing the federal Tier 4 standards, NOx and PM emissions will be reduced by more than 90 percent (U.S. EPA 2004). Consequently, it is anticipated that, as the region-wide construction fleet converts to newer equipment, the potential for health risks from off-road diesel equipment will be substantially reduced. Given the transient nature of construction-related emissions and regulatory improvements scheduled to be phased in, construction related emissions associated with all three alternatives would be considered only a minor adverse air quality impact.
MHA Draft EISJune 2017
3.329
Land Use Compatibility and Public Health Considerations
Future growth could result in more people living near to mobile and stationary sources of air toxics and particulate matter PM2.5. The impact of the action alternatives is that they would increase the potential number of people, or other “sensitive receptors” like hospitals, schools, daycare facilities, or senior house, located near existing sources of harmful air pollutants.
As discussed under Sources of Air Pollution (above), portions of Seattle located along major roadways (freeways and the most-traveled highways) are exposed to relatively high cancer risk values. Modeling indicates increased cancer risks in existing residential areas of up to 800 in one million. These risks are not estimates of disease in the community but a tool to define potential risk. A risk above 100 per one million persons (100 excess cancer risk) is a criterion identified by EPA guidance for conducting air toxic analyses and making risk management decisions at the facility and community-scale level. Residential parcels are located near such highway traffic corridors in south Seattle (although often above Interstate 5 on Beacon Hill and in some areas buffered by greenbelts), and thus at least some parcels are located in areas of higher exposure and risk. Risks and hazards drop dramatically in areas more than 200 meters (656 feet) from the center of highways. A similar phenomenon occurs in proximity to rail lines that support diesel locomotive operations. Accordingly, it would be prudent to consider risk-reducing mitigation strategies such as set-backs for residential and other sensitive land uses from major traffic corridors and rail lines and/or to identify measures for sensitive land uses proposed in areas near such sources.
Portions of Seattle are also exposed to relatively high cancer risk values from stationary sources. Risks could be similarly high near port operations where ship emissions and diesel locomotive emissions and diesel forklift emissions can all occur. Similarly, distribution centers that involve relatively high volume of diesel truck traffic can also represent a risk hazard to nearby sensitive land uses. This would also warrant consideration of setbacks from industrial sources for residential and other sensitive land uses and/or measures to reduce the potential risk for receptors proposed in areas near such sources. This is considered a moderately adverse impact to air quality.
Fourteen urban villages are within 200 meters of a major highway, rail line, or port terminal. In both action alternatives, these urban villages account for about 50 percent of all projected residential growth in the
MHA Draft EISJune 2017
3.330
city through 2035, though only a portion of each urban village is within the 200-meter buffer and therefore the portion of new residents who could affected would be smaller. The action alternatives also include development capacity increases within this 200-meter buffer and outside urban villages. Under any alternative, increased residential densities could be expected within this buffer.
The following urban villages are within the 200 meter buffers:
• First Hill–Capitol Hill
• University District (the Ravenna Urban Center Village and a small portion of the University District Northwest Urban Center Village)
• Northgate
• Bitter Lake
• Fremont
• Lake City
• 23rd & Union–Jackson
• Aurora–Licton Springs
• Eastlake
• Green Lake
• North Beacon Hill
• Roosevelt
• South Park
• Wallingford
This potential increased exposure to cancer risk is considered a potential moderate adverse impact related to air quality.
Accordingly, it would be prudent to consider risk-reducing mitigation strategies such as setbacks for residential and other sensitive land uses from major traffic corridors, rail lines, port terminals, and point sources of particulates from diesel fuel.
Greenhouse Gases and Climate Change
The scale of global climate change is so large that the impacts of one action can be considered only on a cumulative scale. It is not anticipated that a single development project or programmatic action, even at the citywide scale of MHA, would have an individually discernible impact on global climate change. It is more appropriate to conclude that GHG
MHA Draft EISJune 2017
3.331
emissions from future development in Seattle would combine with emissions across the state, country, and planet to cumulatively contribute to global climate change.
Construction-Related Greenhouse Gas Emissions
During construction activities, diesel-powered demolition and construction equipment would emit GHGs. Other emissions during construction would result from trucks used to haul construction materials to and from sites and from vehicle emissions generated during worker travel to and from construction sites. Industrial equipment operations, which include the operation of construction equipment, represent approximately 3.2 percent of the emissions estimated in the 2014 GHG emissions inventory (City of Seattle 2016).
Construction-related GHG emissions from any given development project that may occur in the next 20 years would be temporary and would not represent an ongoing burden to the City’s inventory. However, varying levels of construction activities in Seattle would occur cumulatively under any alternative, and thus cumulative construction-related emissions would be more than a negligible contributor to GHG emissions in the city. An estimate of the GHG emissions resulting from 20 years of construction envisioned under the alternatives was calculated using the City’s SEPA GHG Emissions Worksheet. Estimated total construction-related emissions are 13.8 million metric tons of CO2e under Alternative 1, 15.8 million metric tons under Alternative 2, and 15.6 million metric tons under Alternative 3. The estimated total construction-related emissions also include “embodied “or “life-cycle” emissions related to construction, such as those generated by the extraction, processing, and transportation of construction materials.
The Climate Action Plan recognizes the relevance of construction-related GHG emissions and includes actions to be implemented by 2030 to address them:
• Support new and expanded programs to reduce construction and demolition waste, such as creating grading standards for salvaged structural lumber so that it can be more readily reused;
• Expand source reduction efforts to City construction projects, and incorporate end-of-life management considerations into City procurement guidelines; and
• Phase-in bans on the following construction and demolition waste from job sites and private transfer stations: recyclable metal, cardboard, plastic film, carpet, clean gypsum, clean wood and asphalt shingles.
MHA Draft EISJune 2017
3.332
Consequently, although construction-related emissions would not be negligible, the combination of regulatory improvements and actions already underway means that construction-related GHG emissions associated with all three alternatives would be considered a minor adverse air quality impact.
Transportation-related Greenhouse Gas Emissions
The approach to estimating future year transportation-related GHG emissions considers two factors:
• The projected change in vehicle miles traveled (VMT)
• The projected change in fuel economy of the vehicle fleet
VMT in 2035. Travel demand models include findings about projected vehicle miles traveled in future years for various classes of vehicles (e.g., cars, trucks, buses). The model generally assumes a continuation of current economic and demographic trends, with minor shifts toward shorter trips and more trips made by modes other than automobile travel. This will reduce VMT per capita, but total VMT in the region would continue to rise modestly due to population and employment growth.
If projected based solely on the increase in VMT, with no changes assumed to fuel economy, emissions under each alternative would increase about 15 percent compared to 2015. But the trend toward more stringent federal standards makes it reasonable to assume improved fuel economy by 2035.
Fuel Economy in 2035. Federal programs mandate improved fuel economy and reduced GHG emissions for passenger cars and light trucks in 2017-2025. According to those standards, fuel economy for passenger cars and light trucks would improve from 33.8 miles per gallon (mpg) in 2015 to 54.5 mpg by 2025. This equates to a GHG emissions decrease of roughly 38 percent for new passenger cars and light trucks entering the vehicle fleet (U.S. EPA 2010; 2012). Similarly, EPA and the NHTSA issued fuel efficiency standards for medium and heavy trucks for model years 2014 to 2018 (phase one) and model years 2018-2027 (phase two). When these standards are fully phased in, tractor-trailers will achieve up to 25 percent lower CO2 emissions and fuel consumption than in 2018 (NHTSA, 2016).
Although these regulations will result in improved fuel economy for new vehicles, older vehicles would still comprise some portion of the 2035 fleet. To account for this, the analysis used the California Air Resource Board’s EMFAC 2011 tool, which includes GHG emissions forecasts
MHA Draft EISJune 2017
3.333
adjusted for future vehicle fleet composition. The resulting estimate is that GHG emissions of the 2035 vehicle fleet would be 30 percent lower than the 2015 vehicle fleet for passenger cars and light trucks. For heavy trucks, 2035 GHG emissions are projected to be four percent lower than 2015 emissions. Note that these reflect conservative assumptions of no additional gains in new vehicle fuel economy beyond 2025.
Fuel economy for buses was also considered. King County Metro (KCM) and Sound Transit (ST) set goals for GHG emission reductions in their respective sustainability plans. KCM’s goal equates to a roughly 41 percent reduction in emissions between 2015 and 2030 (KCM 2014). ST’s goal equates to a roughly 30 percent reduction in emissions between 2015 and 2030 (Sound Transit 2014). For this analysis, bus emissions were assumed to be reduced by 35 percent between 2015 and 2030. This is a conservatively low assumption given that most of the fleet is operated by KCM, which has a higher reduction goal, and the EIS horizon year is 2035, five years beyond the goal date set by each transit agency.
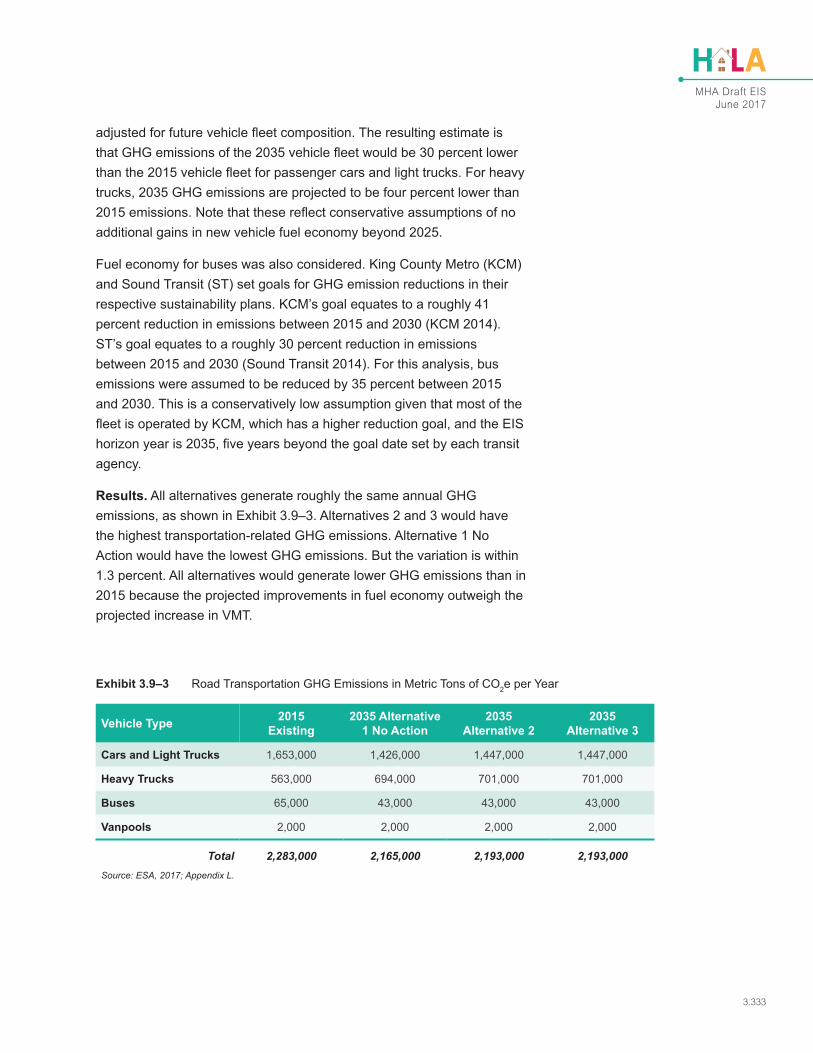
Results. All alternatives generate roughly the same annual GHG emissions, as shown in Exhibit 3.9–3. Alternatives 2 and 3 would have the highest transportation-related GHG emissions. Alternative 1 No Action would have the lowest GHG emissions. But the variation is within 1.3 percent. All alternatives would generate lower GHG emissions than in 2015 because the projected improvements in fuel economy outweigh the projected increase in VMT.
Exhibit 3.9–3 Road Transportation GHG Emissions in Metric Tons of CO2e per Year
Vehicle Type 2015 Existing
2035 Alternative 1 No Action
2035 Alternative 2
2035 Alternative 3
Cars and Light Trucks 1,653,000 1,426,000 1,447,000 1,447,000
Heavy Trucks 563,000 694,000 701,000 701,000
Buses 65,000 43,000 43,000 43,000
Vanpools 2,000 2,000 2,000 2,000
Total 2,283,000 2,165,000 2,193,000 2,193,000Source: ESA, 2017; Appendix L.
MHA Draft EISJune 2017
3.334
GHG emissions can also be considered from a regional perspective. While the variation among the alternatives’ projected emissions in Seattle is minor, the same amount of growth in other jurisdictions in the area would result in very different results. To that end, VMT for auto trips with at least one endpoint outside Seattle was compared to VMT for trips with at least one endpoint in Seattle. VMT per population/job is nearly 55 percent higher outside of Seattle (but within the four-county—Snohomish, King, Kitsap, Pierce—region) than inside Seattle. This suggests that the same amount of development outside Seattle would result in substantially higher emissions since 2035 fuel economy would remain equivalent across jurisdictions. Exhibit 3.9–3 shows road transportation GHG emissions.
IMPACTS OF ALTERNATIVE 1 NO ACTION
Alternative 1 would not implement MHA or increase development capacity. 76,746 new households are expected under Alternative 1, similar to the 20-year minimum growth estimate of 70,000 additional households in the Seattle 2035 Comprehensive Plan. Under Alternative 1, redevelopment, demolition, and new construction projects could occur in the study area.
Air Quality
Transportation and Energy-Related Emissions
Under Alternative 1, VMT in the study area would increase due to population and employment growth. Projected changes in VMT were extracted from the projected travel demand model for automobiles and light-duty trucks and for medium and heavy-duty trucks. The travel demand model generally assumes existing economic and demographic trends continue with minor changes due primarily to mode share shifts and shortened trips due to increased traffic congestion. These changes cause projected VMT per capita to decline slightly by 2035, but total VMT would continue to rise due to population and employment growth. Increases in energy related emissions (e.g., natural gas usage in residential and commercial buildings) would increase emissions of air pollutants of concern.
All alternatives in 2035 are expected to generate lower air pollutant emissions than in 2015, resulting in a net decrease in transportation- and energy-related air pollutant emissions. This is because the projected improvement in fuel economy outweighs the projected increase in
MHA Draft EISJune 2017
3.335
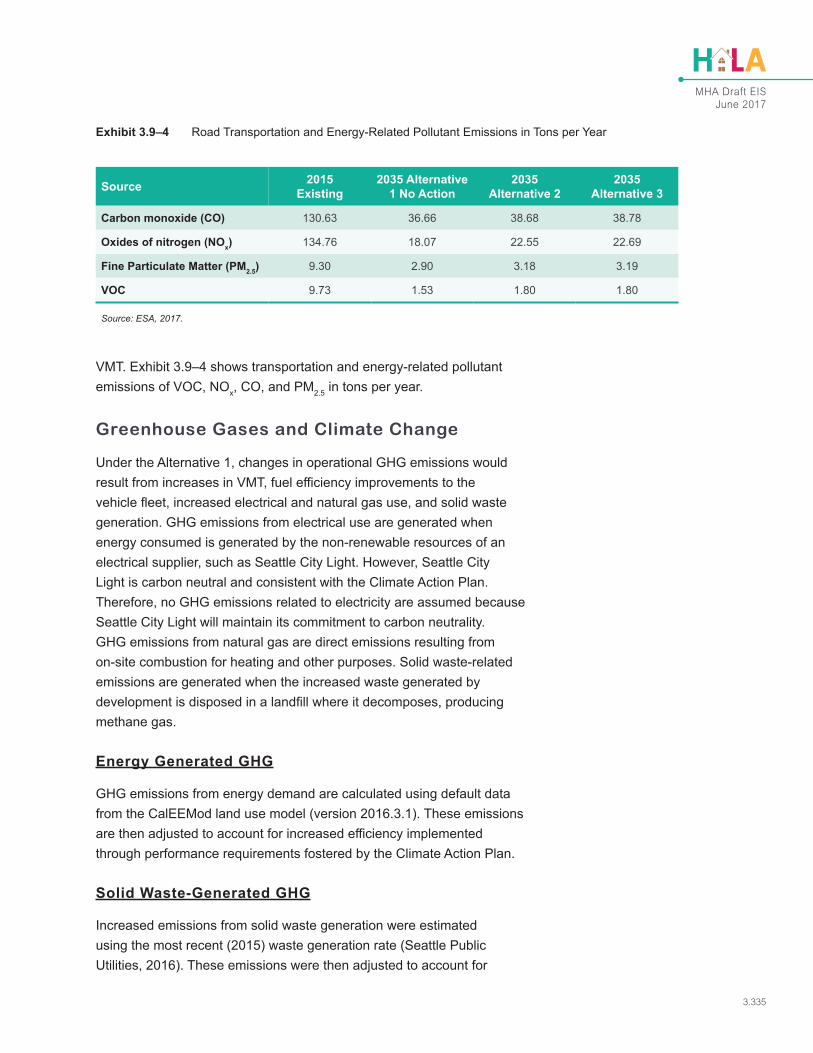
VMT. Exhibit 3.9–4 shows transportation and energy-related pollutant emissions of VOC, NOx, CO, and PM2.5 in tons per year.
Greenhouse Gases and Climate Change
Under the Alternative 1, changes in operational GHG emissions would result from increases in VMT, fuel efficiency improvements to the vehicle fleet, increased electrical and natural gas use, and solid waste generation. GHG emissions from electrical use are generated when energy consumed is generated by the non-renewable resources of an electrical supplier, such as Seattle City Light. However, Seattle City Light is carbon neutral and consistent with the Climate Action Plan. Therefore, no GHG emissions related to electricity are assumed because Seattle City Light will maintain its commitment to carbon neutrality. GHG emissions from natural gas are direct emissions resulting from on-site combustion for heating and other purposes. Solid waste-related emissions are generated when the increased waste generated by development is disposed in a landfill where it decomposes, producing methane gas.
Energy Generated GHG
GHG emissions from energy demand are calculated using default data from the CalEEMod land use model (version 2016.3.1). These emissions are then adjusted to account for increased efficiency implemented through performance requirements fostered by the Climate Action Plan.
Solid Waste-Generated GHG
Increased emissions from solid waste generation were estimated using the most recent (2015) waste generation rate (Seattle Public Utilities, 2016). These emissions were then adjusted to account for
Exhibit 3.9–4 Road Transportation and Energy-Related Pollutant Emissions in Tons per Year
Source 2015 Existing
2035 Alternative 1 No Action
2035 Alternative 2
2035 Alternative 3
Carbon monoxide (CO) 130.63 36.66 38.68 38.78
Oxides of nitrogen (NOx) 134.76 18.07 22.55 22.69
Fine Particulate Matter (PM2.5) 9.30 2.90 3.18 3.19
VOC 9.73 1.53 1.80 1.80
Source: ESA, 2017.
MHA Draft EISJune 2017
3.336
waste diversion implemented through waste reduction, recycling, and composting fostered by the City’s carbon-neutral goal target of 70 percent waste diversion by 2030.
Total Emissions
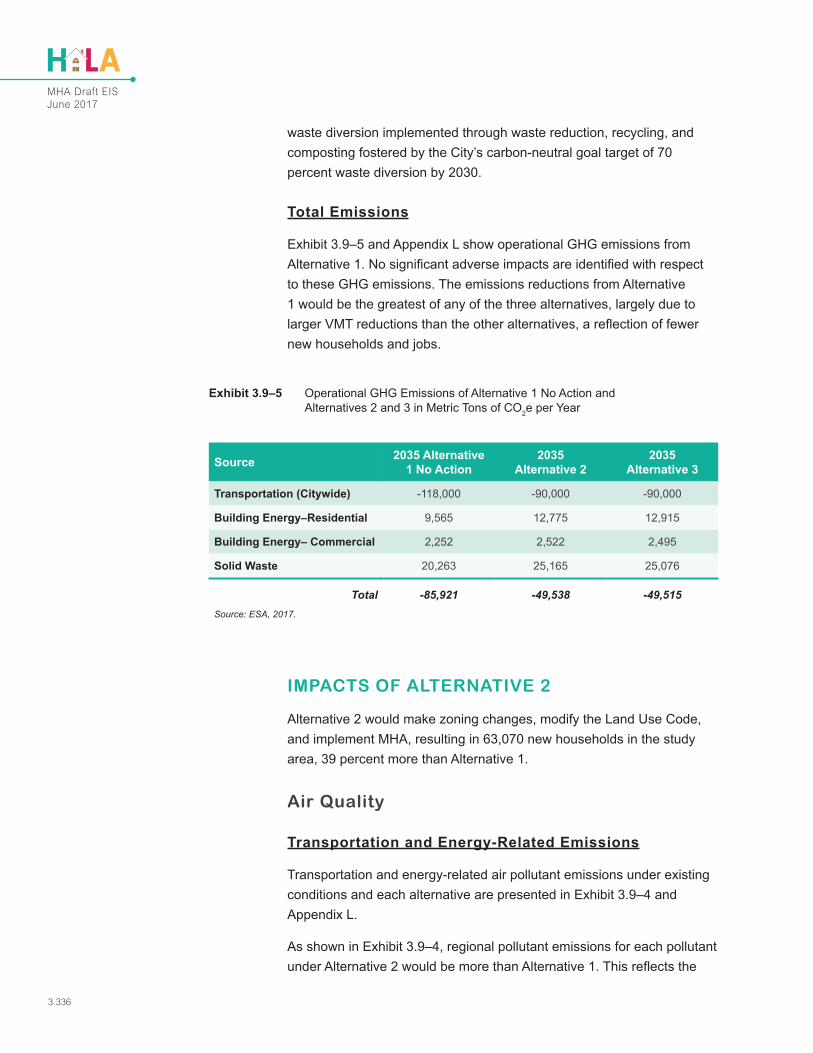
Exhibit 3.9–5 and Appendix L show operational GHG emissions from Alternative 1. No significant adverse impacts are identified with respect to these GHG emissions. The emissions reductions from Alternative 1 would be the greatest of any of the three alternatives, largely due to larger VMT reductions than the other alternatives, a reflection of fewer new households and jobs.
IMPACTS OF ALTERNATIVE 2
Alternative 2 would make zoning changes, modify the Land Use Code, and implement MHA, resulting in 63,070 new households in the study area, 39 percent more than Alternative 1.
Air Quality
Transportation and Energy-Related Emissions
Transportation and energy-related air pollutant emissions under existing conditions and each alternative are presented in Exhibit 3.9–4 and Appendix L.
As shown in Exhibit 3.9–4, regional pollutant emissions for each pollutant under Alternative 2 would be more than Alternative 1. This reflects the
Exhibit 3.9–5 Operational GHG Emissions of Alternative 1 No Action and Alternatives 2 and 3 in Metric Tons of CO2e per Year
Source 2035 Alternative 1 No Action
2035 Alternative 2
2035 Alternative 3
Transportation (Citywide) -118,000 -90,000 -90,000
Building Energy–Residential 9,565 12,775 12,915
Building Energy– Commercial 2,252 2,522 2,495
Solid Waste 20,263 25,165 25,076
Total -85,921 -49,538 -49,515Source: ESA, 2017.
MHA Draft EISJune 2017
3.337
projected increase in VMT in Alternative 2 compared to Alternative 1. This percent difference is minimal. However, as indicated in Exhibit 3.9–4, all alternatives would result in air quality improve-ments compared to baseline due to increased fuel efficiency and a cleaner vehicle fleet.
Greenhouse Gases and Climate Change
GHG emissions under development of Alternative 2 were calculated using the same methodologies as Alternative 1 but reflect the differences among the alternatives. Operational GHG emissions from Alternative 2 are presented in Exhibit 3.9–5 and Appendix L. No significant adverse impacts are identified with respect to these GHG emissions. The emissions reductions from Alternative 2 would be the second greatest of any of the three alternatives, largely as the result of greater VMT which reflects the greater number of residential development and jobs.
IMPACTS OF ALTERNATIVE 3
Alternative 3 would make zoning changes, modify the Land Use Code, and implement MHA, resulting in 62,858 new households in the study area, 38.6 percent more than Alternative 1.
Air Quality
Transportation and Energy-Related Emissions
Transportation and energy-related air pollutant emissions under existing conditions and each of the three alternatives are presented in Exhibit 3.9–4 and Appendix L.
As shown in Exhibit 3.9–4, regional pollutant emissions under Alternative 3 would be more than Alternatives 1 and 2. This is because of the projected increase in VMT in Alternative 3 compared to Alternatives 1 and 2. This percent difference is minimal. However, as indicated in Exhibit 3.9–4, all alternatives would result in air quality improve-ments compared to baseline due to increased fuel efficiency and a cleaner vehicle fleet.
Land Use Compatibility and Public Health Considerations
Of the 14 urban villages within 200 meters of a major highway, rail line, or port terminal, the ones with the highest proportion of the urban village affected represent 47 percent of all projected residential growth in the
MHA Draft EISJune 2017
3.338
city through 2035, compared to 49 percent for Alternative 2 and 48 percent for Alternative 1. Only a portion of each urban village is within the 200-meter buffer, so the potentially affected portion of the new residents would be smaller.
Greenhouse Gases and Climate Change
GHG emissions under development of Alternative 3 were calculated using the same methodologies as those used for Alternatives 1 and 2 but reflect the differences among the alternatives. Operational GHG emissions from Alternative 3 are presented in Exhibit 3.9–5 and Appendix L. No significant adverse impacts are identified with respect to these GHG emissions. The emissions reductions realized from implementation of Alternative 3 would be less than those of Alternatives 1 and 2.
3.9.3 MITIGATION MEASURESMitigation recommendations proposed in Section 3.2.3 of the Seattle 2035 Comprehensive Plan EIS would also apply to the potential impacts identified for this project, including potential setbacks to separate residences and other “sensitive receptors” (i.e. hospitals, schools, daycare facilities, senior housing) from freeways, railways, and port facilities. Where separation by a buffer is not feasible, consider filtration systems for such uses. No other mitigation would be required.
3.9.4 SIGNIFICANT UNAVOIDABLE ADVERSE IMPACTS
No significant unavoidable impacts to air quality and greenhouse gas emissions are anticipated under any of the proposed alternatives.