air transport and equipment market review & outlook for...
TRANSCRIPT

Slide 1
Dublin, January 17th 2017
Air transport and equipment market
Review & outlook for 2017

Slide 2
Disclaimer
This presentation was prepared by DVB Bank SE (“DVB”) exclusively for the benefit and internal use of the addressee mentioned on the cover page. Neither this
presentation nor any of its contents may be used by any other party or for any other purpose without the prior written consent of DVB. The oral commentary from DVB
accompanying this presentation is an integral part of the presentation and the presentation is not complete without such commentary.
This material is for distribution only under such circumstances as may be permitted by applicable law. It has no regard to the specific investment objectives, financial
situation or particular needs of any recipient. It is published solely for informational purposes and is not to be construed as a solicitation or an offer to buy or sell any
securities or related financial instruments. The contents of this presentation should not be treated as advice relating to legal, tax or investment matters.
No representation or warranty, either express or implied, is provided in relation to the accuracy, completeness or reliability of the information contained herein, nor is it
intended to be a complete statement or summary of the securities, markets or developments referred to in the presentation. Any opinions expressed in this presentation
are subject to change without notice and DVB is not under any obligation to update or keep current the information contained herein or communicate any updates to the
addressee mentioned on the cover page. In particular, the information in this presentation reflects prevailing conditions and our views as of this date, all of which are
subject to change. In preparing this presentation, we have relied upon and assumed, without independent verification, the accuracy and completeness of information
available to us from public sources.
Furthermore, neither DVB nor any of its affiliates, directors, employees or agents accept any liability for any loss or damage arising out of the use of all or any part of this
presentation.
In the UK, DVB is regulated in the conduct of its investment business by the Financial Conduct Authority. In the United States of America, DVB acts through DVB Capital
Markets LLC, which is a broker dealer registered with the U.S. Securities and Exchange Commission and admitted by the Financial Industry Regulatory Authority to
conduct securities business in the U.S.
Forward looking statements:
Statements made in this presentation, other than statements of historical fact, are forward-looking statements that involve risks and uncertainties. These statements relate
to future aircraft deliveries, growths of the air transportation market and the aircraft leasing market. In some cases, forward-looking statements can be identified by
terminology such as “may”, “will”, “should”, “expect”, “anticipate”, “intend”, “plan”, “believe”, “estimate”, “potential”, “continue”, “outlook”, “could”, “target”, “project”, “seek”,
“may”, “assume”, the negative of these terms or other comparable terminology. Actual results, and actual events that occur, may differ materially from those projected in
any forward-looking statement as a result of certain risks and uncertainties.
You are cautioned not to place undue reliance on forward-looking statements, which speak only as of the date of this presentation and are based on information currently
and reasonably known to us. Except as required by law, we undertake no obligation to update or revise any forward-looking statements, whether as a result of new
information, future events or otherwise.
Slide 3
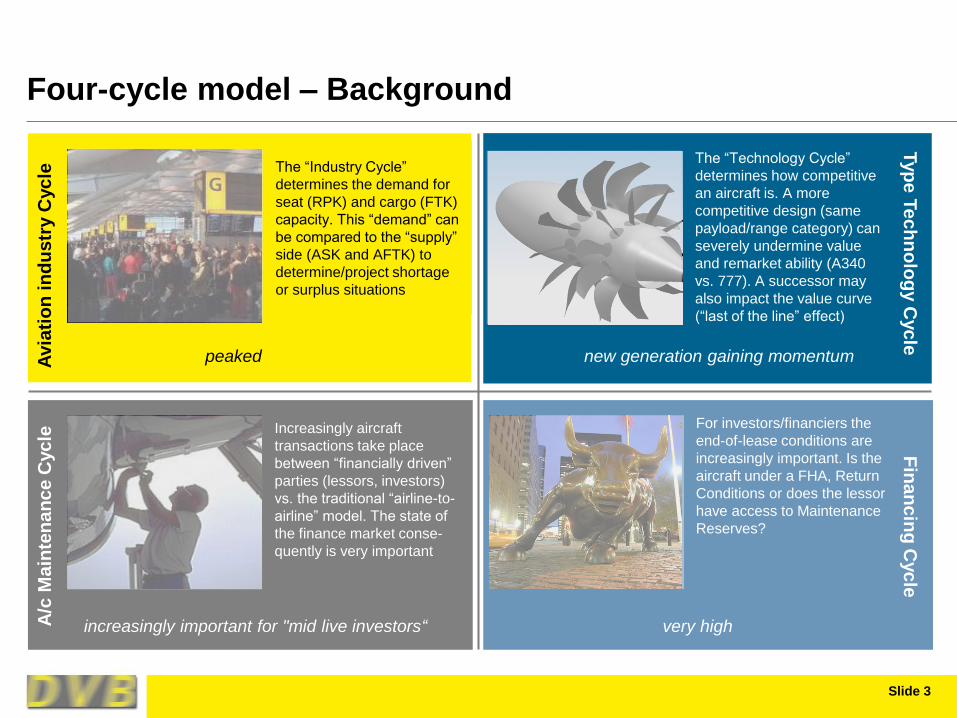
Four-cycle model – Background
The “Industry Cycle”
determines the demand for
seat (RPK) and cargo (FTK)
capacity. This “demand” can
be compared to the “supply”
side (ASK and AFTK) to
determine/project shortage
or surplus situations
The “Technology Cycle”
determines how competitive
an aircraft is. A more
competitive design (same
payload/range category) can
severely undermine value
and remarket ability (A340
vs. 777). A successor may
also impact the value curve
(“last of the line” effect)
Increasingly aircraft
transactions take place
between “financially driven”
parties (lessors, investors)
vs. the traditional “airline-to-
airline” model. The state of
the finance market conse-
quently is very important
For investors/financiers the
end-of-lease conditions are
increasingly important. Is the
aircraft under a FHA, Return
Conditions or does the lessor
have access to Maintenance
Reserves?
Avia
tio
n i
nd
us
try
Cyc
leTyp
e T
ec
hn
olo
gy C
yc
leA
/c M
ain
ten
an
ce
Cyc
leF
ina
nc
ing
Cyc
le
increasingly important for "mid live investors“ very high
peaked new generation gaining momentum
Slide 4
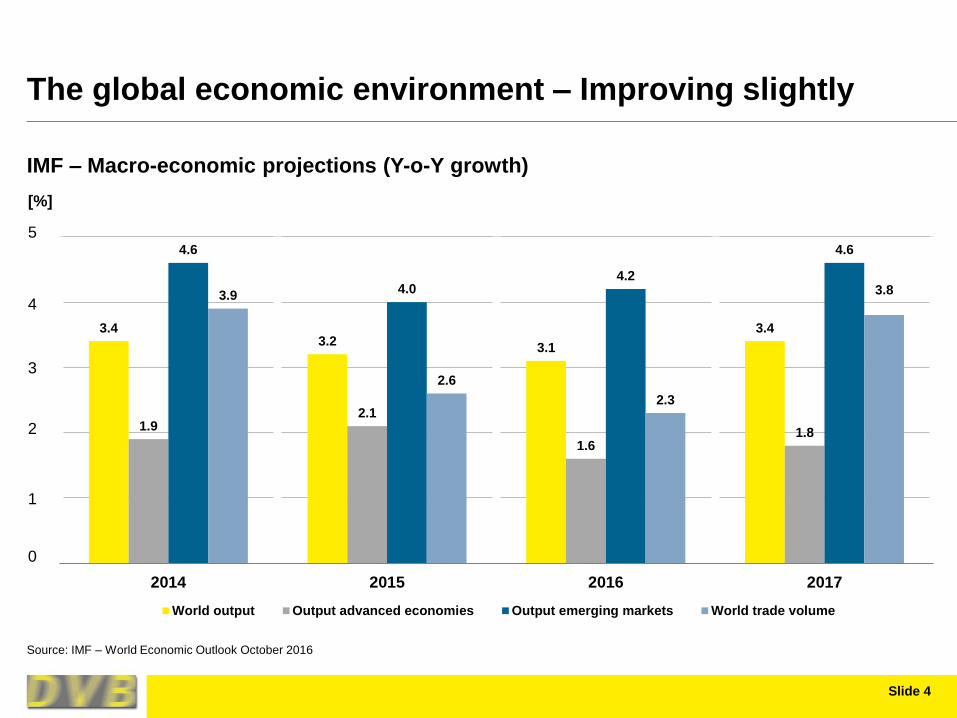
The global economic environment – Improving slightly
3.43.2
3.1
3.4
1.92.1
1.61.8
4.6
4.04.2
4.6
3.9
2.6
2.3
3.8
2014 2015 2016 2017
World output Output advanced economies Output emerging markets World trade volume
IMF – Macro-economic projections (Y-o-Y growth)
Source: IMF – World Economic Outlook October 2016
[%]
5
4
3
2
1
0
Slide 5
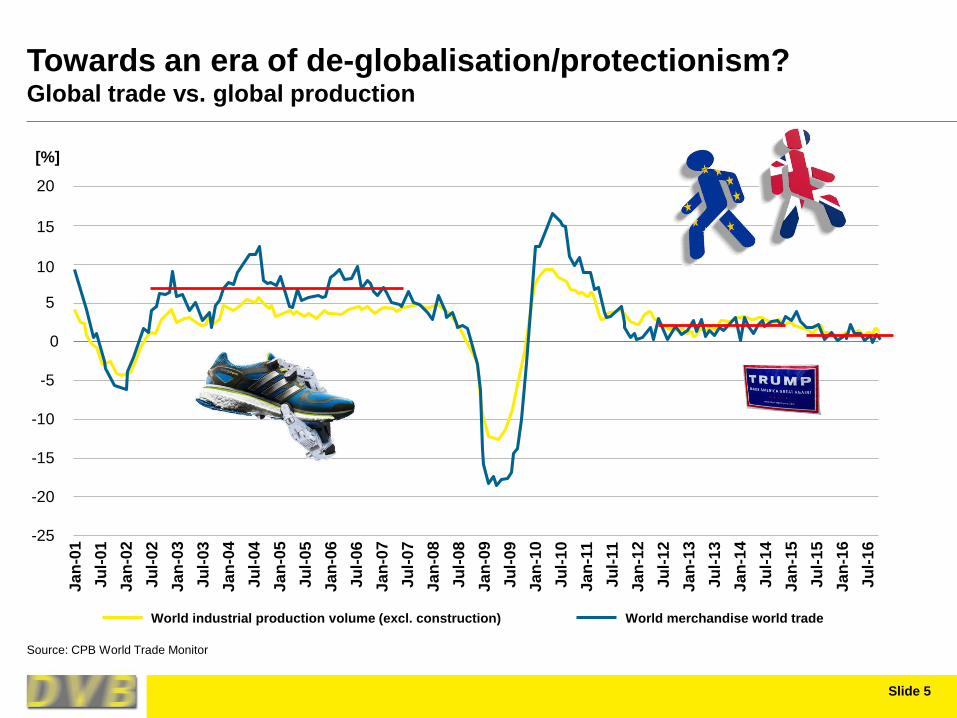
Towards an era of de-globalisation/protectionism?Global trade vs. global production
Source: CPB World Trade Monitor
20
15
10
5
0
-5
-10
-15
-20
-25
Ja
n-0
1
Ju
l-0
1
Ja
n-0
2
Ju
l-0
2
Ja
n-0
3
Ju
l-0
3
Ja
n-0
4
Ju
l-0
4
Ja
n-0
5
Ju
l-0
5
Ja
n-0
6
Ju
l-0
6
Ja
n-0
7
Ju
l-0
7
Ja
n-0
8
Ju
l-0
8
Ja
n-0
9
Ju
l-0
9
Ja
n-1
0
Ju
l-1
0
Ja
n-1
1
Ju
l-11
Ja
n-1
2
Ju
l-1
2
Ja
n-1
3
Ju
l-1
3
Ja
n-1
4
Ju
l-1
4
Ja
n-1
5
Ju
l-1
5
Ja
n-1
6
Ju
l-1
6
World industrial production volume (excl. construction) World merchandise world trade
[%]
Slide 6
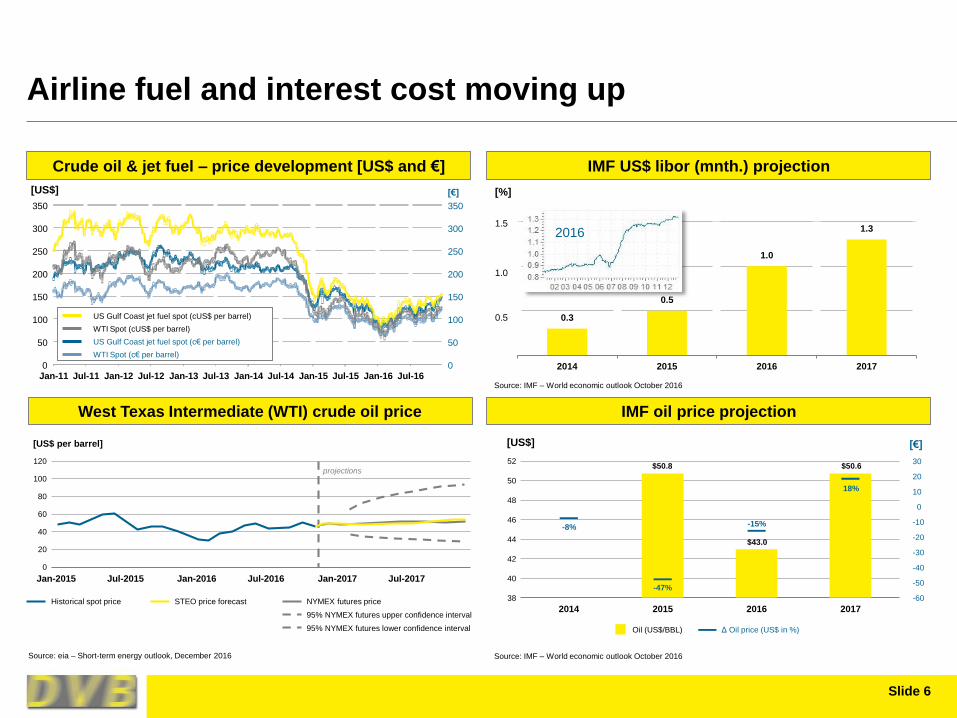
0.3
0.5
1.0
1.3
0%
1%
1%
2%
2014 2015 2016 2017
1.5
1.0
0.5
Airline fuel and interest cost moving up
Crude oil & jet fuel – price development [US$ and €]
Source: eia – Short-term energy outlook, December 2016
IMF US$ libor (mnth.) projection
West Texas Intermediate (WTI) crude oil price IMF oil price projection
0
50
100
150
200
250
300
350
0
50
100
150
200
250
300
350
Jan-11 Jul-11 Jan-12 Jul-12 Jan-13 Jul-13 Jan-14 Jul-14 Jan-15 Jul-15 Jan-16 Jul-16
[€][US$]
US Gulf Coast jet fuel spot (cUS$ per barrel)
WTI Spot (cUS$ per barrel)
US Gulf Coast jet fuel spot (c€ per barrel)
WTI Spot (c€ per barrel)
[US$ per barrel]
0
20
40
60
80
100
120
Jan-2015 Jul-2015 Jan-2016 Jul-2016 Jan-2017 Jul-2017
projections
STEO price forecast NYMEX futures priceHistorical spot price
95% NYMEX futures lower confidence interval
95% NYMEX futures upper confidence interval
Source: IMF – World economic outlook October 2016
2016
2014 2015 2016 2017
Oil (US$/BBL) Δ Oil price (US$ in %)
-8%
-47%
$50.8
-15%
$43.0
18%
$50.6
40
42
44
46
48
50
52
38 -60
-50
-40
-30
-20
-10
0
10
20
30
[US$]
[%]
Source: IMF – World economic outlook October 2016
[€]

Slide 7
14.9
8.9
6.9 7.9
2.4
-1.2
8.06.3 5.3 5.2 5.7
7.45.9
5.1
2.81.0
6.6
1.7
8.3
-13.7
9.5
7.5
-1.4
-3.9-5.5
-10.7
-8.0
0.0
73.5
75.0
76.2
78.5
79.479.7
79.980.4 80.2
79.8
70
72
74
76
78
80
82
-20
-15
-10
-5
0
5
10
15
20
2004 2005 2006 2007 2008 2009 2010 2011 2012 2013 2014 2015 2016E 2017F
RPK growth Pax. yield PLF
2010–2016 passenger traffic robust, but yields down
Source: IATA
IATA passenger market data
[%]
RPK growth & pax yield
[%]
PLF
RPK = Revenue passenger-km PLF = Passenger load factor
Slide 8
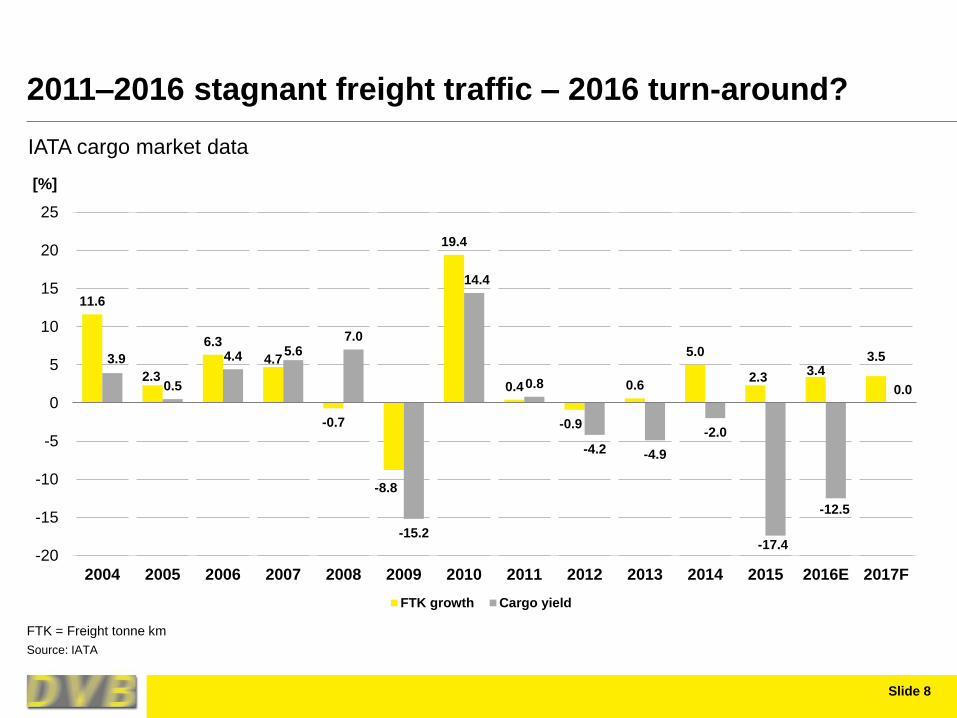
11.6
2.3
6.3
4.7
-0.7
-8.8
19.4
0.4
-0.9
0.6
5.0
2.33.4
3.53.9
0.5
4.4 5.67.0
-15.2
14.4
0.8
-4.2 -4.9
-2.0
-17.4
-12.5
0.0
-20
-15
-10
-5
0
5
10
15
20
25
2004 2005 2006 2007 2008 2009 2010 2011 2012 2013 2014 2015 2016E 2017F
FTK growth Cargo yield
2011–2016 stagnant freight traffic – 2016 turn-around?
Source: IATA
IATA cargo market data
[%]
FTK = Freight tonne km
Slide 9
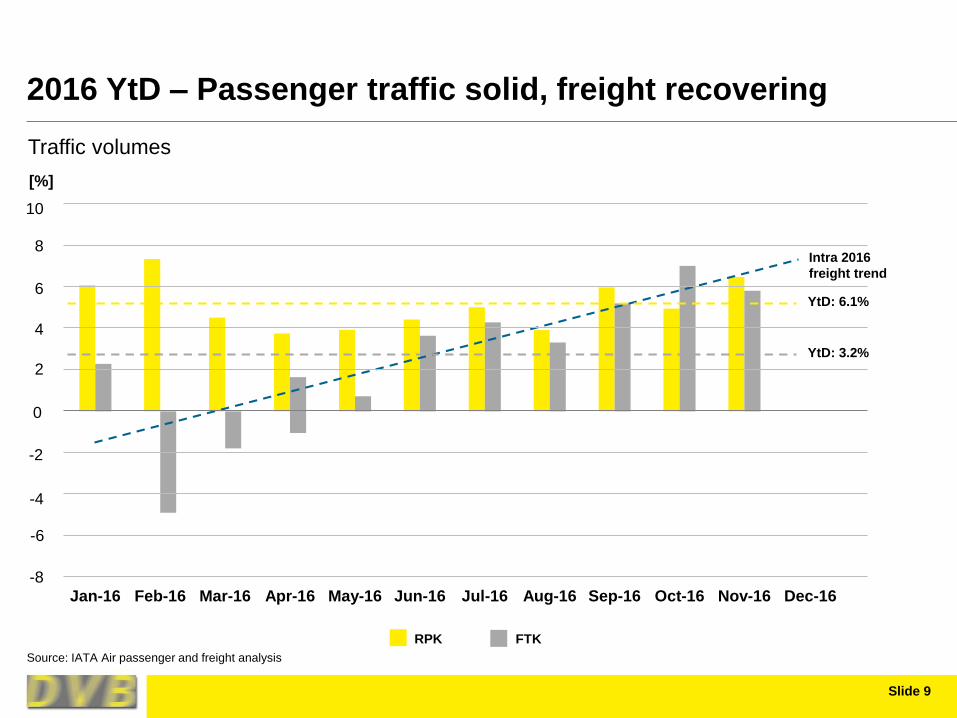
2016 YtD – Passenger traffic solid, freight recovering
Source: IATA Air passenger and freight analysis
10
8
6
4
2
0
-2
-4
-6
-8
Jan-16 Feb-16 Mar-16 Apr-16 May-16 Jun-16 Jul-16 Aug-16 Sep-16 Oct-16 Nov-16 Dec-16
Intra 2016
freight trend
YtD: 6.1%
YtD: 3.2%
RPK FTK
[%]
Traffic volumes
Slide 10
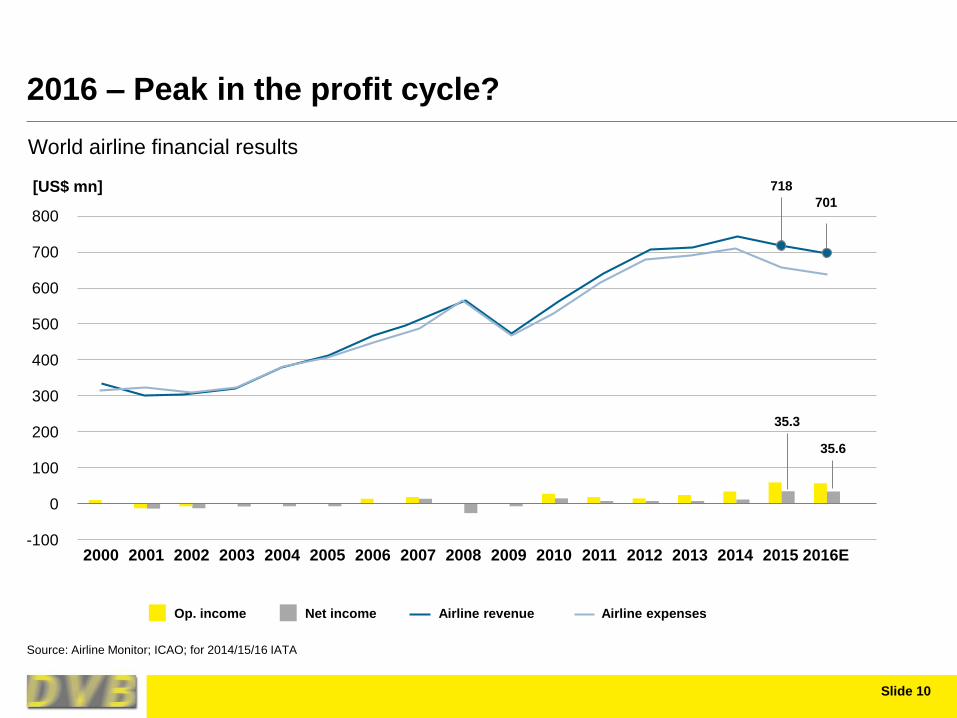
2016 – Peak in the profit cycle?
800
700
600
500
400
300
200
100
0
-1002000
Source: Airline Monitor; ICAO; for 2014/15/16 IATA
Op. income Net income Airline revenue Airline expenses
2001 2002 2003 2004 2005 2006 2007 2008 2009 2010 2011 2012 2013 2014 2015 2016E
701
718
35.3
35.6
[US$ mn]
World airline financial results
Slide 11
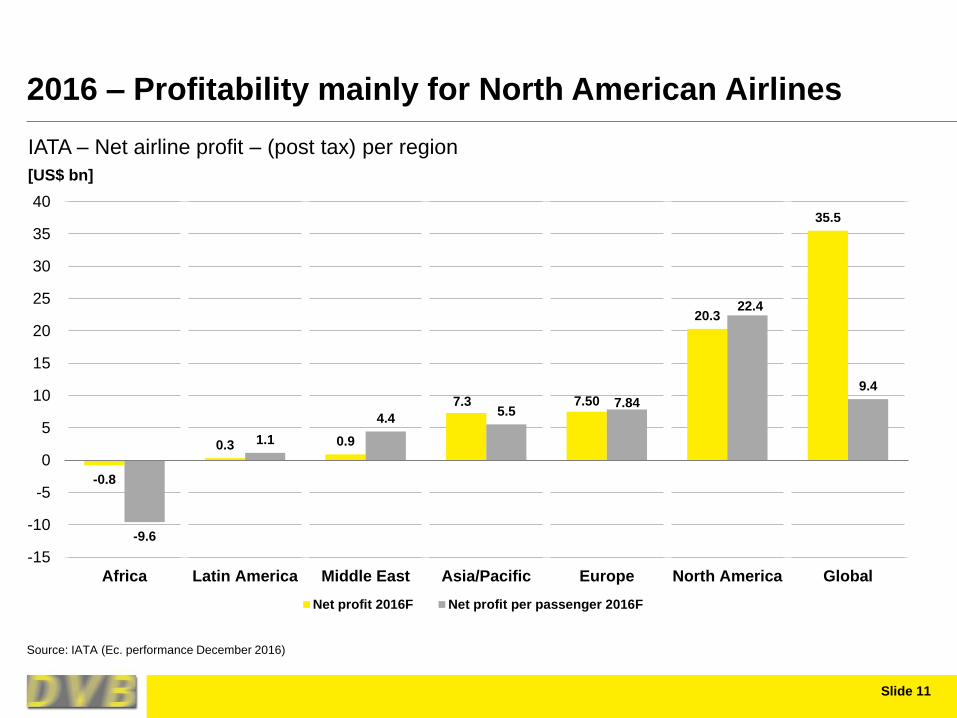
-0.8
0.3 0.9
7.3 7.50
20.3
35.5
-9.6
1.1
4.45.5
7.84
22.4
9.4
-15
-10
-5
0
5
10
15
20
25
30
35
40
Africa Latin America Middle East Asia/Pacific Europe North America Global
Net profit 2016F Net profit per passenger 2016F
2016 – Profitability mainly for North American Airlines
Source: IATA (Ec. performance December 2016)
[US$ bn]
IATA – Net airline profit – (post tax) per region
Slide 12
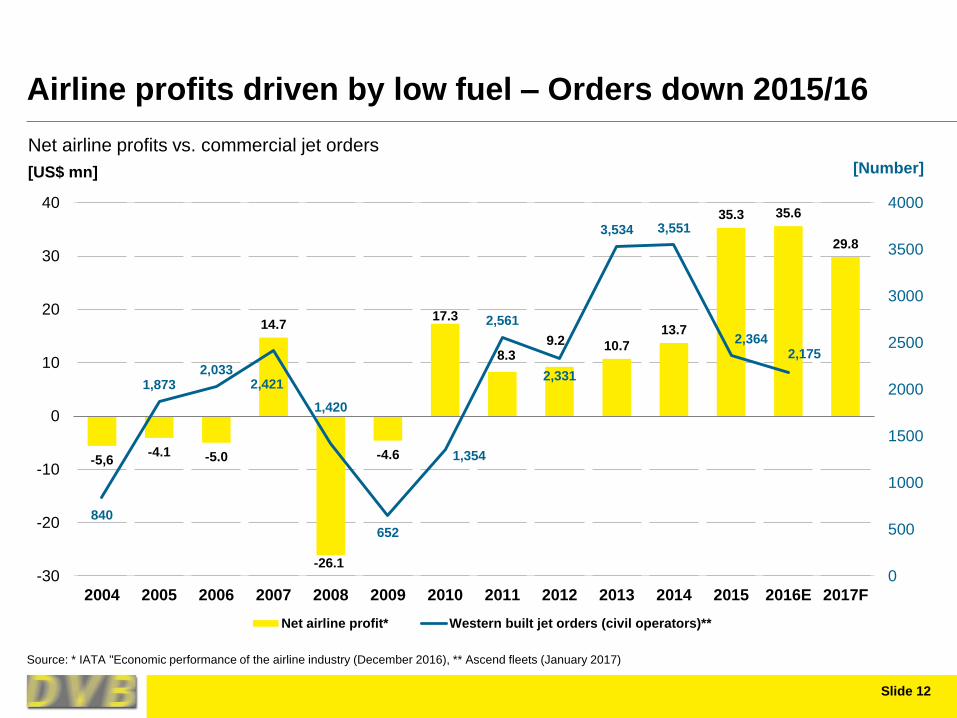
-5,6-4.1 -5.0
14.7
-26.1
-4.6
17.3
8.39.2 10.7
13.7
35.3 35.6
29.8
840
1,8732,033
2,421
1,420
652
1,354
2,561
2,331
3,534 3,551
2,3642,175
0
500
1000
1500
2000
2500
3000
3500
4000
-30
-20
-10
0
10
20
30
40
2004 2005 2006 2007 2008 2009 2010 2011 2012 2013 2014 2015 2016E 2017F
Net airline profit* Western built jet orders (civil operators)**
Airline profits driven by low fuel – Orders down 2015/16
Source: * IATA "Economic performance of the airline industry (December 2016), ** Ascend fleets (January 2017)
[US$ mn]
Net airline profits vs. commercial jet orders
[Number]

Slide 13
Lessor‘s share remains stagnant at high level (39%)
Source: Flightglobal/Ascend; West.B.Jets, all civil opserators
Lessor % in global jet fleet Lessor % in jets on order
45
40
35
30
25
20
15
10
5
01970 1975 1980 1985 1990 1995 2005 2010 20152000
39.1%
18.3%
[%]
Lessor share in global commercial jet fleet/orders
Slide 14
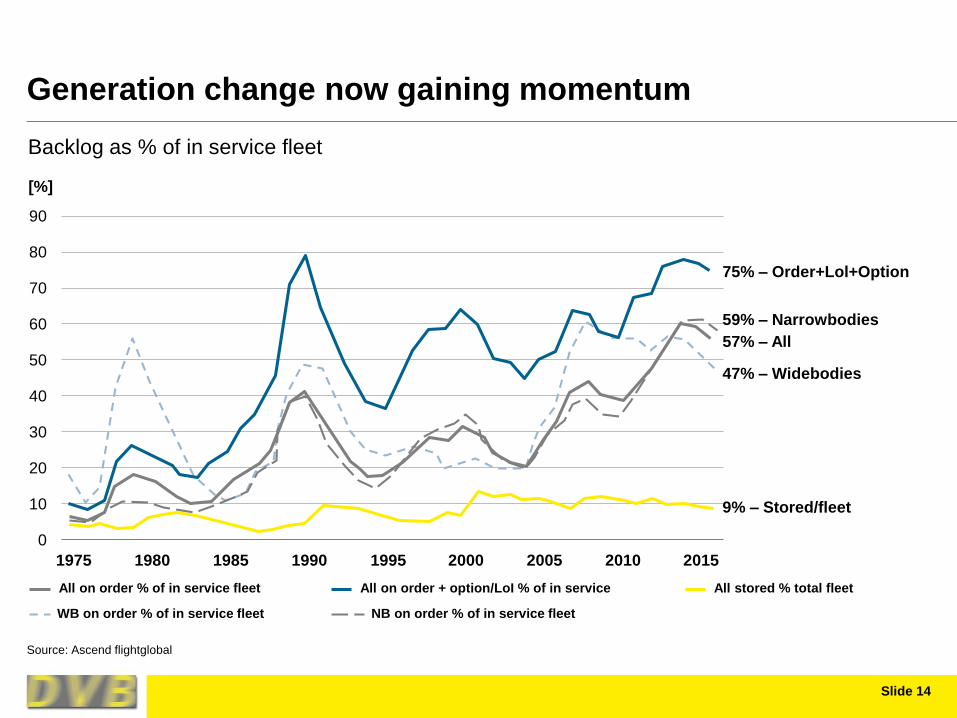
Generation change now gaining momentum
Source: Ascend flightglobal
90
80
70
60
50
40
30
20
10
0
1975
75% – Order+Lol+Option
59% – Narrowbodies
57% – All
47% – Widebodies
9% – Stored/fleet
1980 1985 1990 1995 2000 2005 2010 2015
All stored % total fleet
WB on order % of in service fleet
All on order % of in service fleet All on order + option/LoI % of in service
NB on order % of in service fleet
[%]
Backlog as % of in service fleet
Slide 15
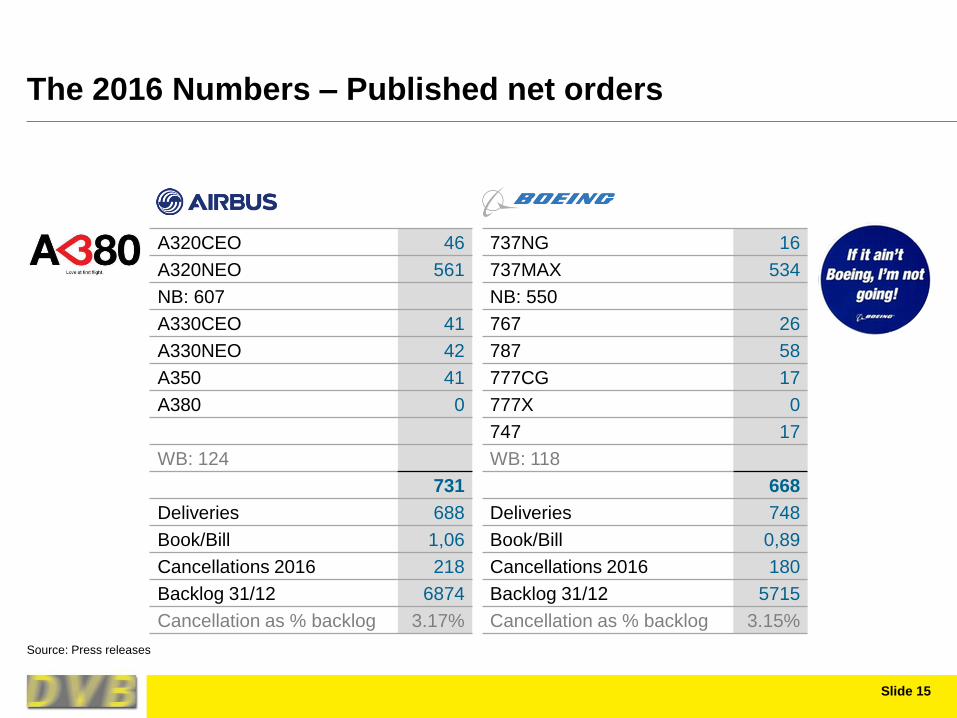
The 2016 Numbers – Published net orders
Source: Press releases
A320CEO 46
A320NEO 561
NB: 607
A330CEO 41
A330NEO 42
A350 41
A380 0
WB: 124
731
Deliveries 688
Book/Bill 1,06
Cancellations 2016 218
Backlog 31/12 6874
Cancellation as % backlog 3.17%
737NG 16
737MAX 534
NB: 550
767 26
787 58
777CG 17
777X 0
747 17
WB: 118
668
Deliveries 748
Book/Bill 0,89
Cancellations 2016 180
Backlog 31/12 5715
Cancellation as % backlog 3.15%

Slide 16
231
785
136
540
405
80 51 64
32 23 129 21 10 7 2 18 10
500
1000
1500
2000
2500
3000
3500
4000
4500
Order Intake 2012 - 2016 (Western Jet, All Civil Ops.)Source : Ascend (data incl. "type swaps")
2012 2013 2014 2015 2016
Recent order intake per aircraft family
Source: Ascend (data incl. "type swaps")
Gross Orders
(incl. type
swaps) 2012 2013 2014 2015 2016
Backlog
31/12/16
A320CEOFam 278 435 496 146 231 653
A320NEOFam 407 830 1050 941 785 4992
737NG 217 469 265 234 136 837
737MAX 908 699 900 412 540 3605
E-Jets E1 69 203 69 126 40 185
E-Jets E2 0 150 60 57 5 272
787 36 181 49 99 80 700
A350 40 239 57 16 51 754
A330CEO 68 54 48 103 64 145
A330NEO 0 0 120 52 32 204
777 Current 75 55 54 38 23 134
777X 0 66 220 20 0 306
CSeries 15 25 61 0 129 353
CRJ 67 36 47 27 21 61
MRJ 100 0 26 32 10 233
767 22 2 4 49 7 70
A380 8 50 20 3 2 112
747 7 17 2 6 18 28
Others 14 23 3 3 1 15
2331 3534 3551 2364 2175 13659
Order intake 2012–2016 (western jet, all civil operators)
Slide 17
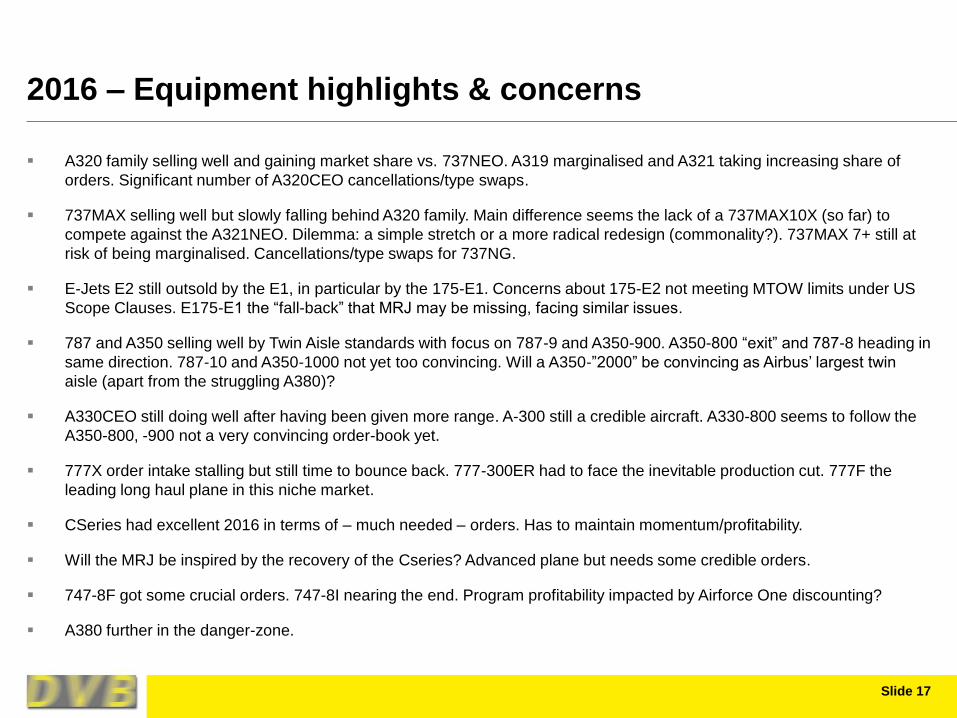
2016 – Equipment highlights & concerns
A320 family selling well and gaining market share vs. 737NEO. A319 marginalised and A321 taking increasing share of
orders. Significant number of A320CEO cancellations/type swaps.
737MAX selling well but slowly falling behind A320 family. Main difference seems the lack of a 737MAX10X (so far) to
compete against the A321NEO. Dilemma: a simple stretch or a more radical redesign (commonality?). 737MAX 7+ still at
risk of being marginalised. Cancellations/type swaps for 737NG.
E-Jets E2 still outsold by the E1, in particular by the 175-E1. Concerns about 175-E2 not meeting MTOW limits under US
Scope Clauses. E175-E1 the “fall-back” that MRJ may be missing, facing similar issues.
787 and A350 selling well by Twin Aisle standards with focus on 787-9 and A350-900. A350-800 “exit” and 787-8 heading in
same direction. 787-10 and A350-1000 not yet too convincing. Will a A350-”2000” be convincing as Airbus’ largest twin
aisle (apart from the struggling A380)?
A330CEO still doing well after having been given more range. A-300 still a credible aircraft. A330-800 seems to follow the
A350-800, -900 not a very convincing order-book yet.
777X order intake stalling but still time to bounce back. 777-300ER had to face the inevitable production cut. 777F the
leading long haul plane in this niche market.
CSeries had excellent 2016 in terms of – much needed – orders. Has to maintain momentum/profitability.
Will the MRJ be inspired by the recovery of the Cseries? Advanced plane but needs some credible orders.
747-8F got some crucial orders. 747-8I nearing the end. Program profitability impacted by Airforce One discounting?
A380 further in the danger-zone.

Slide 18
Outlook 2017 – Softening but no “doom & gloom“
According to IMF global economy heading for fragile continuation of the recovery. Event risk omni-present.
CPB data suggest de-globalisation (production growth > trade growth). Production technology (robotisation) and
protectionism? Long term risk!
Fuel slowly moving up, rising interest rates, labor cost increasing – airline profitability under pressure.
Ticket prices to increase, potentially reducing passenger traffic growth. Cargo recovering, beyond the Hanjin effect.
More order deferrals/cancellations in selected regions. Order slump to continue in 2017.
Programs that have not built strong backlog in 2013/14 may struggle to gain momentum.
Money remains plentiful, even without EXIM/ECA
Investors may be disappointed by residual value of selected twin aisle. No major impact expected yet of the last-of-the-line
effect, but… Big difference remarketability aircraft on lease or naked.
Will we see in 2017 :
‒ MAX 10 (yes)
‒ A350-2000 (no)
‒ CS500 (no)
‒ 777-10X (no)
‒ C919 making first flight (yes)

Slide 19
THANK YOU