alberto rodriguez gallego - diva portal790867/fulltext01.pdf · 4-pole 7.5 kw induction motor...
TRANSCRIPT

Degree project in
Design and Optimization of an IE44-pole 7.5 kW Induction Motor
Alberto Rodriguez Gallego
Stockholm, Sweden 2014
XR-EE-E2C 2014:003
Electrical Machines and Drives

i
Design and Optimization of an IE4, 4-pole, 7.5 kW
Induction Motor
by
ALBERTO RODRÍGUEZ GALLEGO
Master Thesis
Royal Institute of Technology
School of Electrical Engineering
Electrical Energy Conversion
Stockholm 2014
XR-EE-E2C 2014:003

ii
Design and Optimization of an IE4, 4-pole, 7.5 kW Induction Motor
ALBERTO RODRÍGUEZ GALLEGO
© ALBERTO RODRÍGUEZ GALLEGO, 2014.
School of Electrical Engineering
Department of Electrical Energy Conversion
Kungliga Tekniska Högskolan
SE-100 44 Stockholm
Sweden

iii
“Who sees further a dwarf or a giant? Surely a giant for his eyes are situated at a higher
level than those of the dwarf. But if the dwarf is placed on the shoulders of the giant
who sees further? ... So too we are dwarfs astride the shoulders of giants.”
Isaiah di Trani ben Mali (c. 1180 – c. 1250)


v
Abstract
In this thesis, a High Efficiency (IE2), 7.5 kW, 4-pole, induction motor (IM) is studied and redesigned using finite element method (FEM) software with the purpose of
increasing its efficiency to the new Super Premium Efficiency (IE4) level.
First, a pre-existing model of the motor is analyzed and improved. Then, different methods to improve the efficiency of the motor are investigated and the performance of the machine is studied after each modification. Thirdly, a complete optimization of the design is carried out with the goal of developing an IE4 IM compatible with IEC standard frames. Finally, a similar optimization of the motor is performed substituting the aluminum squirrel cage by a copper one. The pros and cons of this
change are studied.
The results show the feasibility of reaching the IE4 efficiency level by this type of IM with a standard shaft height. Preserving the original cross-section design of the stator, this efficiency level is only reached if a copper squirrel cage is used and if the rotor cross-section is redesigned. However, if the external diameter of the stator is increased and the rotor and stator cross-sections are redesigned, aluminum rotor
bars and short-circuit rings can be used to reach the IE4 efficiency level.
Key words: induction motor, IE4, Super Premium Efficiency


vii
Sammanfattning
I detta examensarbete analyseras en 7.5 kW 4-pol induktionsmotor med verkningsgradsklass IE2 med hjälp av Finita Element Metoden (FEM). Syftet med arbetet är att utvärdera olika metoder för att öka motorns verkningsgrad och att föreslå designförändringar som kan möjliggöra en uppgradering till verkningsgradsklass IE4.
Först analyseras och justeras en befintlig modell av motorn som sedan används för att utvärdera effekterna av olika designförändringar. Sedan optimeras motorn för att öka verkningsgraden, detta görs både med aluminium och med koppar som
rotorledarmaterial.
Resultaten visar att det är möjligt att uppnå verkningsgradsklassen IE4 genom att använda antingen aluminium eller koppar som rotorledarmaterial. För båda fallen krävs att motorns längd ökas. Då koppar används krävs endast en ny tvärsnittsgeometri för rotorn medan då aluminium används behöver både rotor och statorgeometri ändras.


ix
Resumen
Este Proyecto Final de Carrera (PFC) estudia y rediseña un motor de inducción IE2 (High Efficiency) de 7.5 kW y 4 polos mediante el uso de simulaciones por el método de los elementos finitos (FEM). El objetivo es mejorar la eficiencia de este motor
hasta alcanzar el nivel IE4 (Super Premium Efficiency) de eficiencia.
En primer lugar, se analiza y mejora un modelo por ordenador previo del motor. Tras esto, distintos métodos para mejorar la eficiencia del motor son investigados y puestos en práctica, documentando las modificaciones en el comportamiento del motor tras cada cambio. A continuación, se realiza una completa optimización del diseño del motor, cuyo fin es conseguir alcanzar los niveles IE4 de eficiencia, así como unas dimensiones exteriores compatibles con las carcasas utilizadas habitualmente para este tipo de motores según los estándares de la IEC. Finalmente, se realiza una optimización similar a la anterior tras sustituir la jaula de ardilla de aluminio por una
de cobre, estudiándose los posibles beneficios derivados de este cambio.
Este estudio demuestra que es factible alcanzar los niveles IE4 de eficiencia en este tipo de motores utilizando las carcasas estándar que marca el IEC. En el caso de utilizar una jaula de ardilla de cobre, estas eficiencias pueden ser alcanzadas sin modificar la sección original del estator, únicamente optimizando el diseño del rotor. Por su parte, la utilización de una jaula de ardilla de aluminio requiere de un completo rediseño de la sección y dimensiones externas del motor para alcanzar el nivel IE4 de eficiencia.
Palabras clave: motor de inducción, IE4, Super Premium Efficiency


xi
Acknowledgements
I wanted to thank especially my supervisor at ABB LV Motors, Alexander Stening, for leading my work in the right direction and for always giving very useful input. His
knowledge made this thesis better and his support has been incalculable.
I would also like to thank my supervisor and examiner at KTH, Oskar Wallmark, for his feedback, help with the paperwork and also for informing me about this opportunity at ABB (the same applies to Mats Leksell).
Thanks also to the people at the ATU department and all the nice people I met at ABB LV Motors, it has been a pleasure to work with them.
I am grateful to Professor Francisco Blázquez García and Professor Jaime Rodríguez Arribas, professors at the Technical University of Madrid, for instilling in me the
interest in electrical machines.
I have to thank also all my friends in Westeros, Stockholm and Spain, especially the last “survivors” in Lappis, who made the last 20 months a great experience I will not forget.
Finally, the support of my family has been inestimable all my life and I will never be
able to repay it, though I will try.
Alberto Rodríguez Gallego Västerås, Sweden March 2014


xiii
Contents
Introduction ....................................................................................................................1
1.1 Background ................................................................................................................................ 1
1.2 The power losses in induction machines ....................................................................... 2
1.3 How to measure the losses .................................................................................................. 3
1.4 Methods to reduce the losses in IMs ................................................................................ 5
1.4.1 Stator losses.............................................................................................................................. 5
1.4.2 Rotor losses ............................................................................................................................... 6
1.4.3 Core losses ................................................................................................................................. 6
1.4.4 Stray losses ............................................................................................................................... 8
1.5 Thesis focus ............................................................................................................................... 8
1.5.1 Thesis outline ........................................................................................................................... 9
Modeling of the reference induction motor ...................................................... 11
2.1 Introduction to 2D-FEM software ................................................................................... 11
2.1.1 Redistribution of the losses ............................................................................................. 12
2.2 The winding resistance ....................................................................................................... 13
2.3 The stator and rotor temperature rise .......................................................................... 14
2.4 The core material .................................................................................................................. 14
2.4.1 B-H curve extrapolation ................................................................................................... 15
2.4.2 Loss coefficients ................................................................................................................... 17
2.4.3 Agreement with test data ................................................................................................ 18
2.5 The airgap length ................................................................................................................... 19
2.6 Final reference model .......................................................................................................... 22
Analysis of different techniques to improve the motor efficiency ............ 23
3.1 Increased stator slot fill factor ......................................................................................... 23
3.2 Electrical steel with reduced losses ............................................................................... 23
3.3 Lengthening of the machine .............................................................................................. 25
3.3.1 Same rotor cross section .................................................................................................. 28
3.3.2 Redesign of the rotor slots’ shape ................................................................................ 32
3.4 Influence of the stator slot opening width (SSOW) .................................................. 34
3.5 The stator and rotor slot number combination ......................................................... 36
Full optimization of the design .............................................................................. 41
4.1 Definition of the optimization profile ............................................................................ 42
4.1.1 The objectives ....................................................................................................................... 42
4.1.2 The constraints .................................................................................................................... 43
4.1.3 The variables ......................................................................................................................... 44
4.2 Results ....................................................................................................................................... 45

xiv
4.2.1 Optimization with other core materials .................................................................... 46
4.3 Conclusions ..............................................................................................................................47
Copper squirrel cage analysis ................................................................................ 49
5.1 Original cross-section ..........................................................................................................50
5.2 Optimized rotor cross-section ..........................................................................................52
Conclusions and future work ................................................................................. 53
6.1 Conclusions ..............................................................................................................................53
6.2 Future work .............................................................................................................................54
Bibliography ................................................................................................................ 55
Appendix A. Basic theory on synchronous torques ........................................ 59
Appendix B. Description of the main design proposals ................................ 61

1
Chapter 1
Introduction
1.1 Background
Reducing or optimizing our energy consumption must be a priority in order to succeed in building a sustainable future and helping reduce our carbon footprint and processes’ costs derived from energy consumption. In this regard, electrical machines – “electric motor-driven systems” – are responsible of up to 46% of the total electricity consumption in the world, according to [1]. Furthermore, this study show that industry accounts for a 64% of the total energy consumed by electrical machines, most of it induction machines – IMs. Consequently, it is a key factor to improve the efficiency of this kind of machines in order to make a better use of the generated energy.
When the predominant electric motor type is analyzed in terms of motor size it turns out that sizes between 0.75 and 375 kW (medium size) represent almost three quarters of the total installed capacity of electric motors [1]. Using the expected installed capacity of electric motors in 2015 and their life cycle [2], and the mandatory efficiency improvements imposed by the standards, Figure 1 in [3] shows an estimate of the allocation of the energy saving potential in different motor rating ranges with respect to the total expected energy savings. It can be seen how the greatest saving potential is located in the range of 0.75-70 kW.
0
5
10
15
20
25
30
35
<0.75 kW 0.75 kW to4 kW
4 kW to 10kW
10 kW to30 kW
30 kW to70 kW
70 kW to130 kW
130 kW to500 kW
>500 kW
Ele
ctr
ic e
ne
rgy
sa
vin
g p
ote
nti
al
[%]
Motor size
Figure 1. Allocation of the saving potential by installed motors in the industrial sector (installed capacity multiplied by the average efficiency improvement) in percentage [3].

2
In recent years, new efficiency policies have been introduced and new international standards on efficiency classes have been defined. Figure 2 shows these efficiency classes for a 4-pole, 50-Hz electric motor, included in the Final Draft International Standard IEC 60034-30-1 Ed. 1 (2014), where the step between each efficiency class represents a reduction in the losses of about 20% . The new efficiency classes represent a huge challenge for manufacturers and researchers since they are not easy to reach, especially for smaller motors. In fact, some manufacturers had serious doubts about the technical feasibility of IE4 induction machines with former IEC frame sizes used for IE1/2 class IMs [5]. However, in September 2012 the Brazilian manufacturer WEG launched a whole range of IE4 IMs with standard frame sizes [6],
proving the feasibility of this efficiency class for induction motors.
1.2 The power losses in induction machines
In order to improve the efficiency of the induction machines it is necessary to analyze the origin of the losses. Normally, the losses of an induction motor are classified in
five categories:
- Stator losses: Resistive losses in the stator winding. - Rotor losses: Resistive losses in the rotor winding. - Core losses (iron losses): due to hysteresis and eddy currents. - Friction and windage losses: mechanical and aerodynamic losses. - Stray losses: the additional losses. Difficult to determine and model.
Figure 2. Efficiency classes for a 4-pole electrical machine at 50 Hz [4].
3
(a) (b)
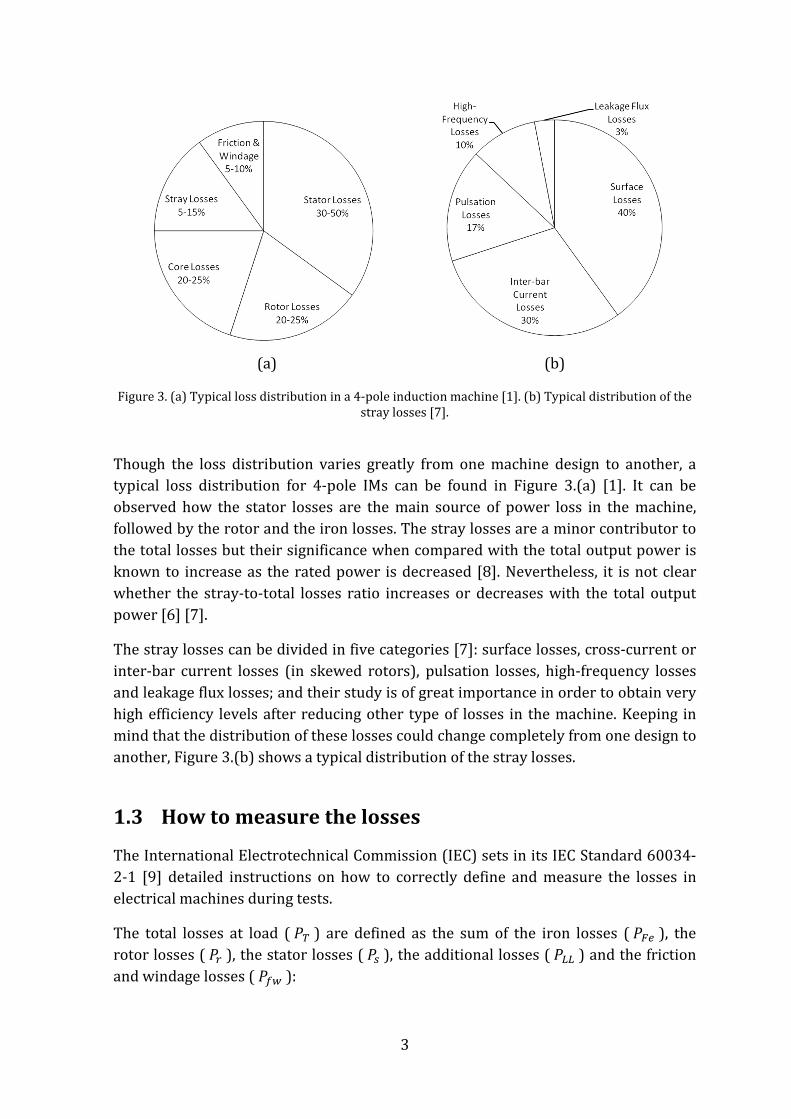
Figure 3. (a) Typical loss distribution in a 4-pole induction machine [1]. (b) Typical distribution of the stray losses [7].
Though the loss distribution varies greatly from one machine design to another, a typical loss distribution for 4-pole IMs can be found in Figure 3.(a) [1]. It can be observed how the stator losses are the main source of power loss in the machine, followed by the rotor and the iron losses. The stray losses are a minor contributor to the total losses but their significance when compared with the total output power is known to increase as the rated power is decreased [8]. Nevertheless, it is not clear whether the stray-to-total losses ratio increases or decreases with the total output power [6] [7].
The stray losses can be divided in five categories [7]: surface losses, cross-current or inter-bar current losses (in skewed rotors), pulsation losses, high-frequency losses and leakage flux losses; and their study is of great importance in order to obtain very high efficiency levels after reducing other type of losses in the machine. Keeping in mind that the distribution of these losses could change completely from one design to another, Figure 3.(b) shows a typical distribution of the stray losses.
1.3 How to measure the losses
The International Electrotechnical Commission (IEC) sets in its IEC Standard 60034-2-1 [9] detailed instructions on how to correctly define and measure the losses in electrical machines during tests.
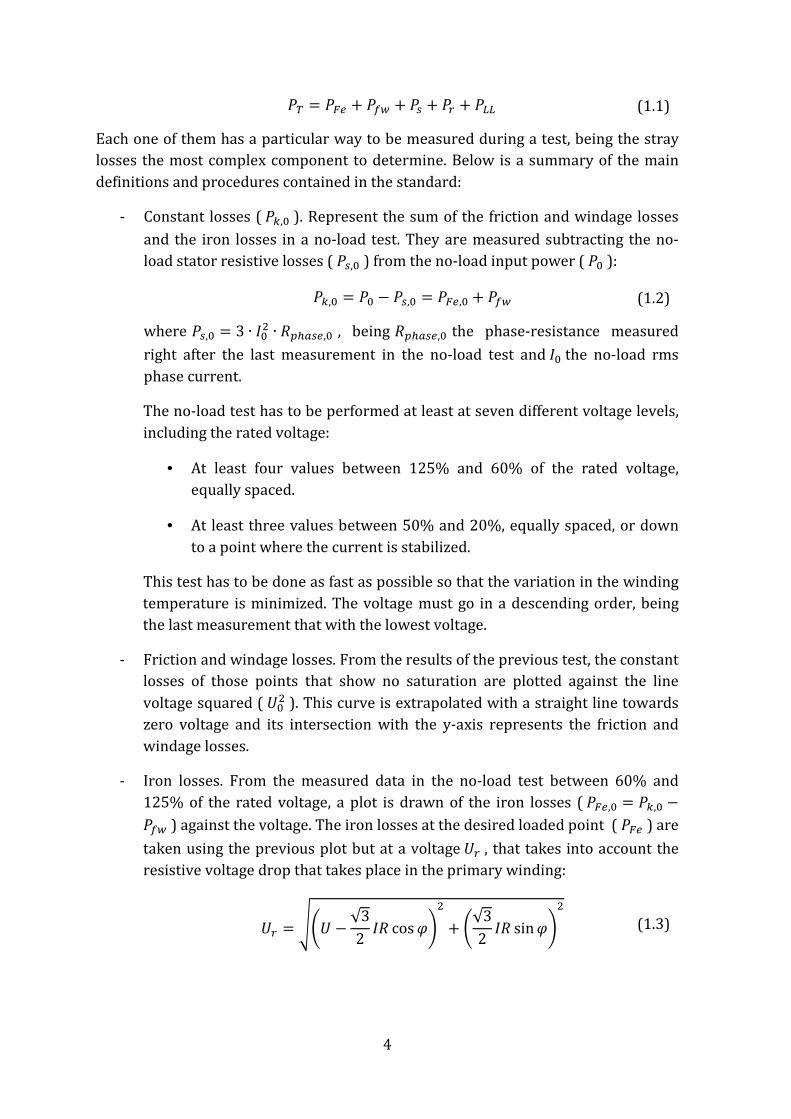
The total losses at load (�� ) are defined as the sum of the iron losses (���), the rotor losses (��), the stator losses (��), the additional losses (���) and the friction and windage losses (�):
4
�� = ��� + � + �� + �� + ��� (1.1)
Each one of them has a particular way to be measured during a test, being the stray losses the most complex component to determine. Below is a summary of the main
definitions and procedures contained in the standard:
- Constant losses (� ,�). Represent the sum of the friction and windage losses
and the iron losses in a no-load test. They are measured subtracting the no-load stator resistive losses (��,�) from the no-load input power (��):
� ,� = �� − ��,� = ���,� + � (1.2)
where ��,� = 3 ∙ ��� ∙ ������,� , being ������,� the phase-resistance measured
right after the last measurement in the no-load test and �� the no-load rms
phase current.
The no-load test has to be performed at least at seven different voltage levels,
including the rated voltage:
• At least four values between 125% and 60% of the rated voltage, equally spaced.
• At least three values between 50% and 20%, equally spaced, or down
to a point where the current is stabilized.
This test has to be done as fast as possible so that the variation in the winding temperature is minimized. The voltage must go in a descending order, being the last measurement that with the lowest voltage.
- Friction and windage losses. From the results of the previous test, the constant losses of those points that show no saturation are plotted against the line
voltage squared (���). This curve is extrapolated with a straight line towards zero voltage and its intersection with the y-axis represents the friction and
windage losses.
- Iron losses. From the measured data in the no-load test between 60% and 125% of the rated voltage, a plot is drawn of the iron losses (���,� = � ,� −�) against the voltage. The iron losses at the desired loaded point (��� ) are
taken using the previous plot but at a voltage ��, that takes into account the resistive voltage drop that takes place in the primary winding:
�� = ��� − √32 �� cos!"� + �√32 �� sin!"� (1.3)
5
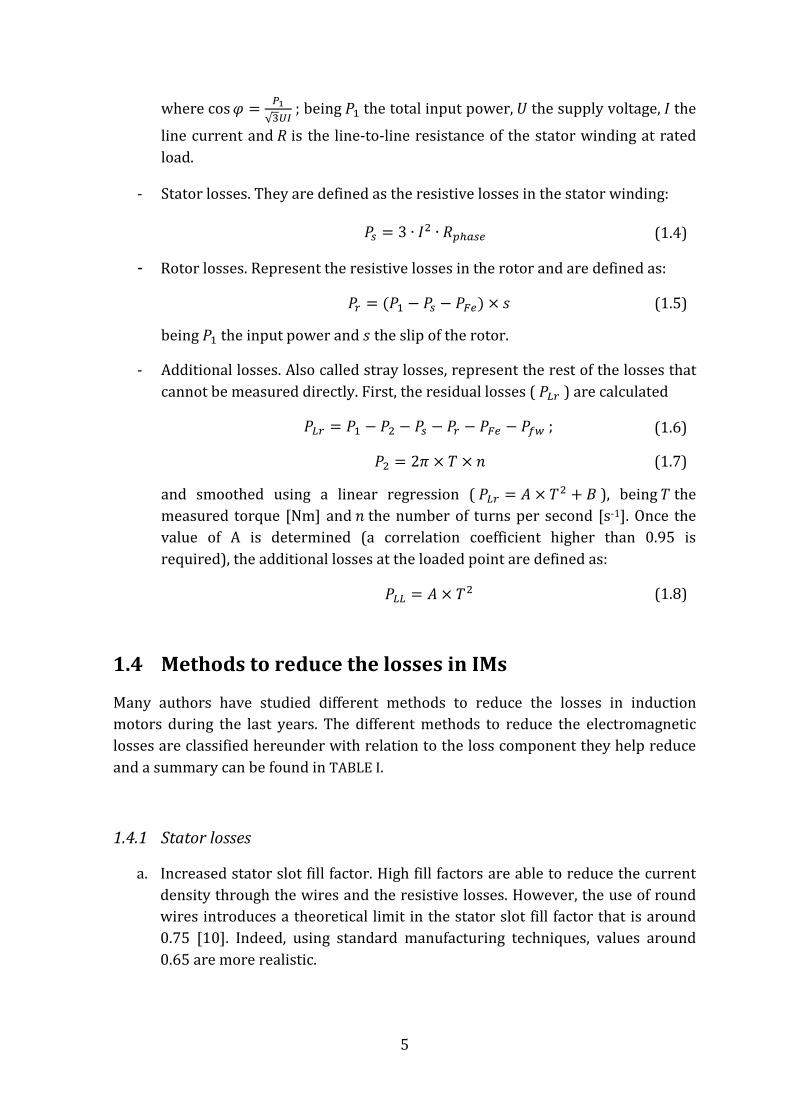
where cos! = %&√'() ; being �* the total input power, � the supply voltage, � the
line current and � is the line-to-line resistance of the stator winding at rated
load.
- Stator losses. They are defined as the resistive losses in the stator winding:
�� = 3 ∙ �� ∙ ������ (1.4)
- Rotor losses. Represent the resistive losses in the rotor and are defined as:
�� = (�* − �� − ���) × . (1.5)
being �* the input power and . the slip of the rotor.
- Additional losses. Also called stray losses, represent the rest of the losses that
cannot be measured directly. First, the residual losses (���) are calculated
��� = �* − �� − �� − �� − ��� − �; (1.6)
�� = 20 × 1 × 2 (1.7)
and smoothed using a linear regression (��� = 3 × 1� + 4), being 1 the measured torque [Nm] and 2 the number of turns per second [s-1]. Once the value of A is determined (a correlation coefficient higher than 0.95 is
required), the additional losses at the loaded point are defined as:
��� = 3 × 1� (1.8)
1.4 Methods to reduce the losses in IMs
Many authors have studied different methods to reduce the losses in induction motors during the last years. The different methods to reduce the electromagnetic losses are classified hereunder with relation to the loss component they help reduce
and a summary can be found in TABLE I.
1.4.1 Stator losses
a. Increased stator slot fill factor. High fill factors are able to reduce the current density through the wires and the resistive losses. However, the use of round wires introduces a theoretical limit in the stator slot fill factor that is around 0.75 [10]. Indeed, using standard manufacturing techniques, values around
0.65 are more realistic.

6
b. Decreased end-winding length. Reducing the winding’s path out of the motor
reduces the resistive losses and also the end-winding leakage flux.
c. Winding coating. A winding coating with higher thermal conductivity improves the performance of a motor by reducing its temperature. Higher
power densities or lower winding resistances can be obtained [11].
1.4.2 Rotor losses
a. Copper rotor bars. They improve the efficiency thanks to the reduced resistance of copper bars compared to aluminum bars. However, the costs increase notoriously, both because of the higher raw material price and the increased manufacturing costs – the die-casting process applied to copper is much more expensive because of its higher melting point. The starting performance (torque and current) may be worsened.
b. Al/Cu rotor bars. One of the most novel ideas is to mix both copper and aluminium in the bars. Thanks to the skin effect that takes place during the starting, the effective resistance of the rotor bars is increased by using aluminium in the outer section of the rotor slots, which increases the starting torque and reduces the starting current. At rated operation, the current flows through the whole cross-sectional area of the rotor bar, largely decreasing its resistance with the use of copper in the inner part of the slot and, consequently, the resistive losses are reduced. This way, a compromise between the starting characteristics and efficiency at rated operation is obtained. This concept has the great problem of achieving a good electrical contact between both rotor materials, as exposed in [12]. This issue can be observed in Figure 4.(a). Some designs of Al/Cu rotor bars that solve this problem have already been patented by Siemens (see Figure 4.(b)), proving the technical feasibility of this technique [13]. These designs use inserted copper bars impregnated with a coating that improves the affinity between both metals during the die-casting process where the rest of the slot is filled with aluminium. It is believed that using this coating and a careful design of the slot shape, a crystalline compound is obtained between both materials and, consequently, a good electrical contact. One further advantage of this
method is that the high costs of the copper die casting process are avoided.
1.4.3 Core losses
a. Core axial lengthening solution. As presented in [14], choosing the optimal stack length can significantly increase the efficiency and is one of the easiest solutions. It is equivalent to a power derating of a bigger machine.

7
(a) (b)
b. Increased diameter. Same principle as before but with higher tooling costs in
general.
c. Thermal treatment. It is well known that the stator and rotor annealing improves the magnetic and energetic characteristics of the rotor and the
stator core reducing the hysteresis losses [12].
d. Decreased lamination thickness. Reduces the magnitude of the eddy-currents by reducing their path length. Increased costs derived from the manufacturing of thinner steel sheets and the increased number of punches for the same stack length.
e. Amorphous steel. This material is not grain oriented and the thickness of this kind of laminations is usually less than one tenth the usual laminations [6]. Consequently, eddy-currents are highly reduced and very good magnetic properties are obtained. They are not ductile at room temperature. The
manufacturing costs are highly increased.
f. Low-loss electrical steel. The use of electrical steels with reduced losses is a simple way of increasing the efficiency of electrical machines. Electrical steels have a characteristic magnetization curve that may demand a complete
redesign of the motor when an optimized magnetic flux distribution is desired.
Figure 4. (a) Contact area between copper and aluminium. “A” is a bad contact area with presence of oxide and impurities, while “B” shows good interaction (crystalline compound) with
copper having a higher diffusion into the aluminium [12]. (b) Rotor bar design with copper (striped lower area) and aluminium (striped upper area) [13].

8
1.4.4 Stray losses
a. Thermal treatment. As shown in [7] and [15], inter-bar resistance is increased after a heat shock, reducing the inter-bar currents and increasing
the efficiency.
b. Rotor bars insulation. The rotor slots are insulated before the casting, highly increasing the inter-bar resistance and reducing the inter-bar currents [16]. This insulation material must withstand the temperatures reached in the
aluminium or copper die-cast process and increases the manufacturing costs.
c. Non-machining of rotor surface. Since the surface losses are mainly caused by eddy currents, not machining the outer surface of the rotor laminations reduces the imperfections (electrically connected laminations) derived from the machining operation [7].
d. Stator magnetic insulation. In cast iron frame motors, in order to effectively reduce the leakage flux flowing through the ferromagnetic material, a thin layer of a diamagnetic material (e.g. graphite paste) between the stator core
and the frame effectively reduces the flux leakage [17].
e. Magnetic/semi-magnetic wedges. The magnetic flux distribution along the air gap is distorted by the stator slot openings, giving rise to a series of harmonics in the magnetic flux distribution. The slot openings are necessary to insert the copper windings in the slots but their negative influence can be reduced by using magnetic wedges, offering a better path for the magnetic flux. The magnetizing current is reduced and the power factor is improved. In addition to the decrease in the stray losses, the resistive and core losses are also reduced [18]. It has a similar effect as reducing the stator slot opening
width.
1.5 Thesis focus
In this Master Thesis work, a 4-pole, 7.5 kW, IE2 induction motor for industrial purposes with a shaft height of 132 mm is studied. The motor has aluminum rotor bars and is designed for direct-on-line operation at 50 Hz. Different techniques to improve its efficiency are analyzed both performing analytical studies and finite element method (FEM) simulations, and their influence on the performance of the machine is investigated. FCSmek is the 2D-FEM software that will be used for the simulations.
9
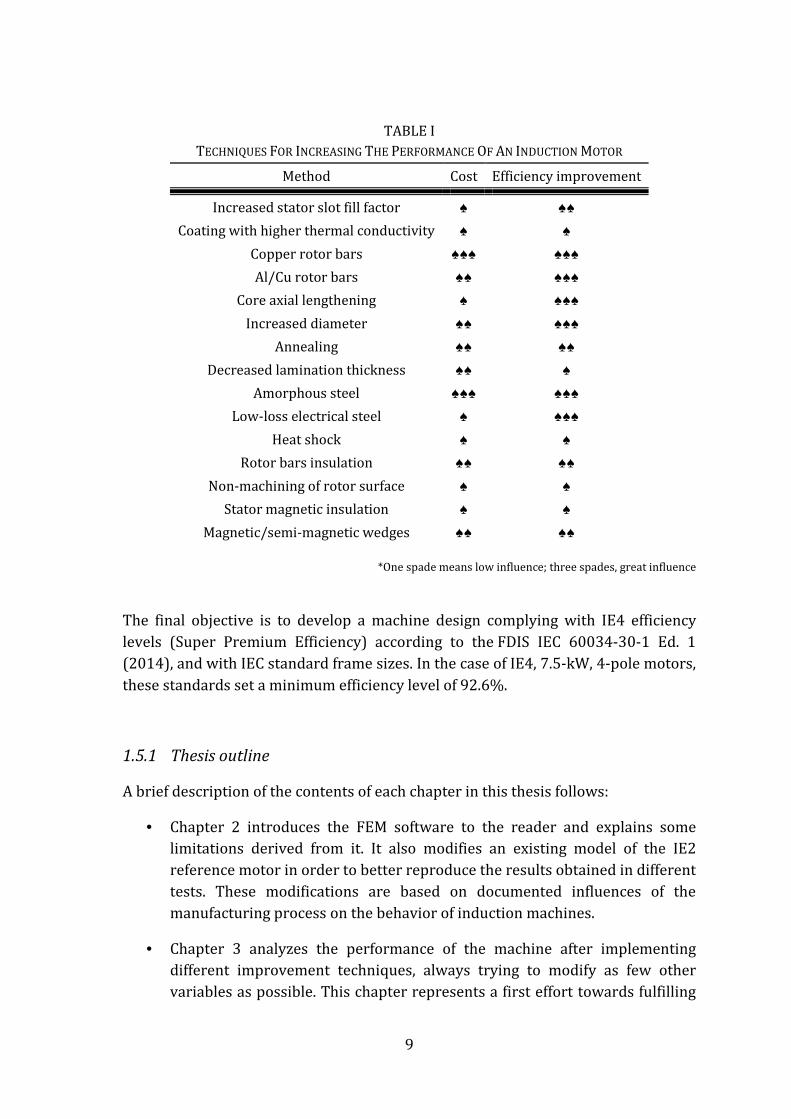
TABLE I
TECHNIQUES FOR INCREASING THE PERFORMANCE OF AN INDUCTION MOTOR
Method Cost Efficiency improvement
Increased stator slot fill factor ♠ ♠♠
Coating with higher thermal conductivity ♠ ♠
Copper rotor bars ♠♠♠ ♠♠♠
Al/Cu rotor bars ♠♠ ♠♠♠
Core axial lengthening ♠ ♠♠♠
Increased diameter ♠♠ ♠♠♠
Annealing ♠♠ ♠♠
Decreased lamination thickness ♠♠ ♠
Amorphous steel ♠♠♠ ♠♠♠
Low-loss electrical steel ♠ ♠♠♠
Heat shock ♠ ♠
Rotor bars insulation ♠♠ ♠♠
Non-machining of rotor surface ♠ ♠
Stator magnetic insulation ♠ ♠
Magnetic/semi-magnetic wedges ♠♠ ♠♠
*One spade means low influence; three spades, great influence
The final objective is to develop a machine design complying with IE4 efficiency levels (Super Premium Efficiency) according to the FDIS IEC 60034-30-1 Ed. 1 (2014), and with IEC standard frame sizes. In the case of IE4, 7.5-kW, 4-pole motors, these standards set a minimum efficiency level of 92.6%.
1.5.1 Thesis outline
A brief description of the contents of each chapter in this thesis follows:
• Chapter 2 introduces the FEM software to the reader and explains some limitations derived from it. It also modifies an existing model of the IE2 reference motor in order to better reproduce the results obtained in different tests. These modifications are based on documented influences of the manufacturing process on the behavior of induction machines.
• Chapter 3 analyzes the performance of the machine after implementing different improvement techniques, always trying to modify as few other variables as possible. This chapter represents a first effort towards fulfilling

10
the mentioned final goal and has a theoretical purpose more than a practical
intention.
• Chapter 4 takes advantage of the knowledge acquired in the previous section and optimizes the design of the machine. It represents the final effort towards reaching the objective of this work, involving as much variables as possible, and observes every single dimensional, electrical and
manufacturing constraint.
• Chapter 5 offers a different approach to Chapters 3 and 4 by replacing the aluminum rotor bars with copper. Similar techniques as in Chapter 3 are investigated in order to increase the efficiency of this design and, due to the higher cost of copper, manufacturing cost are kept as low as possible. A final optimization of this motor concept is carried out, modifying the criteria indicated in Chapter 4.

11
Chapter 2
Modeling of the reference induction motor
The main objective of this work is to improve the efficiency of an already existing motor, as has been previously discussed. Consequently, a reliable model of this reference design is vital to successfully compare the efficiencies of future designs with the original one and to thoroughly understand the implications of each modification, not just on paper but also on the actual machine. Understanding the limitations of 2D-FEM programs is also a good way to forecast the differences
between the model and the actual machine.
For this reason, a great care must be taken to set the parameters of the reference model of the machine or to interpret the results given by FCSmek. In this section, a preexisting model of the machine is modified to better reproduce the results from complete tests performed on different motors of the same type. Most of the effort is made on the definition of the magnetic and electrical properties of the lamination
steel.
2.1 Introduction to 2D-FEM software
Two-dimensional FEM software has some constraints that limit the extrapolation of the results obtained in the simulations to the real world. Their main limitations can
be summarized as follows:
- Three-dimensional systems are simulated with two-dimensional models. Consequently, axial effects such as the skewing of the machine or the surface losses due to imperfections in the insulation between laminations (caused during the machining process of the rotor) are not taken into account. The exception in this study is the end-winding leakage inductance, which will be
calculated using separate analytical software.
- The accuracy and range of the B-H curve of the electrical steel. At high magnetic flux densities, due to the complexity of measuring so strong magnetic fields, this curve becomes imprecise and, hence, it is usually only given up to 1.8 T. Nevertheless, peak flux densities above 2 T can occur in an electrical machine. If data is needed out of the given flux density range, the

12
curve must be extrapolated and this sets up another important source of
inaccuracy.
- Temperature distribution. The stator and rotor temperature rises are calculated using an analytical program according to the model presented in Section 2.3. This model provides accurate solutions for the temperatures in the reference machine but, since the original geometry and parameters are
modified throughout the thesis, an uncertainty is introduced in new designs.
- Other sources of inaccuracy inherent to any FEM software include the mesh density, the number of sinusoidal periods used for the calculations, the
precision of the measured physical dimensions, etc.
One further issue is that the loss distribution obtained from standard tests is not directly comparable with the loss distribution given by the FEM software. The rotor, stator and iron loss components calculated by a FEM program include the stray losses. The simulated losses need therefore to be recalculated to agree with the corresponding definitions used in the tests. The following section tackles this subject and proposes a solution for it.
2.1.1 Redistribution of the losses
The following method is proposed and implemented to rearrange the distribution of the losses given by the FEM software. The purpose of this transformation is to
enable a comparison between test and corresponding simulation results:
- The stator losses are recalculated as the resistive losses in the stator winding caused by the fundamental component of the current through the stator. The difference with the total stator losses represents the stray losses in the stator
winding.
- The iron losses are defined, for simplicity, as the no-load iron losses at rated voltage calculated by the program. The standard method differs slightly from this one because the voltage drop at rated load in the primary winding, according to (1.3), is not taken into account. Neglecting this voltage drop results in an overestimation of the iron losses of around ten watts for the machines considered in this thesis. The difference between the iron losses at load and the iron losses at no-load defines the stray losses in the iron core.
- The rotor losses are calculated in a similar way as in the standard:
�� = (�567 + ��89:� ,� + �) × . (2.1)

13
where ��89:� ,� is the rotor losses given by FCSmek and �567 is the output
power. The stray losses in the rotor are represented by the difference between ��89:� ,� and �� .
- The total stray losses calculated by FCSmek will be the sum of all the mentioned contributions. It is a great advantage to know the contribution of each component of the electrical machine to the total stray losses, especially
when comparing different designs and concepts.
After these steps, the sum of all the losses is still equal to the total losses calculated by the FEM software. At this point it is possible to carry out more accurate comparisons between the test data and the simulations and suitable modifications
in the reference model can be introduced.
2.2 The winding resistance at 20°C
The value of the per-phase resistance of the stator winding at 20°C is influenced by the half coil length (;<*) and has a linear relation with it. Hence, it is very simple to correct the value of the resistance by modifying the half coil length:
;<*=�;<*5>? = �*=��*5>?
Simulations show that the new calculated resistance value agrees with the
measured values after changing the half coil length.
In future chapters, since no measurements will be available to compare the half coil length with, a model for the calculation of the coil length will be required. In this regard, the following equation, derived from [10], has been proven to predict the half coil length with sufficient accuracy:
;<* = 0@�A2 ∙ 0(B + CDD)E� + ;F5�� (2.2)
where @�A is the average mechanical half coil pitch, B the inner stator diameter, CDD is the height of the stator slot, E� is the number of stator slots and ;F5�� the stack length. This formula will be used in the analysis of new motor designs in subsequent
chapters.

14
2.3 The stator and rotor temperature rise
As was previously mentioned, the temperature rise in the rotor and in the stator is calculated using an analytical model. This model uses empirical heat constants to define the temperature rise in Kelvin per watt. The system of equations used is usually referred to as the Broströms formula after the engineer who first defined it, and is written as:
G∆I� = JF�K��(�� + �� + ���)∆I� = JF�K��(�� + �� + ���) (2.3)
where ∆I� and ∆I� are the stator and rotor temperature rises, respectively, and Kcs and Kcr are the heat constants. TABLE II shows the values of these constants
calculated from the tests.
TABLE II
HEAT CONSTANTS FROM TEST RESULTS
Averaged test values JF� 0,0938 JF� 0,1661 ∆I� [K] 58,2 ∆I� [K] 70*
*The temperature rise in the rotor is assumed to be around 10 K higher than that of the stator
2.4 The core material
A deeper investigation is carried out on how to define the machine’s electrical steel (which is of type M700-50A) in the FEM program. FCSmek includes a predefined M700-50A steel model based on several test results performed throughout several years and, thanks to the accumulated experience, its parameters are tuned to better reproduce the results in the tests and its B-H curve is extrapolated up to very high magnetic flux densities. Therefore, this definition is different from the data supplied by the manufacturer because it includes the effects introduced by the manufacturing process.
For this reason, a different M700-50A steel is defined based on the data provided by Surahammars Bruk (hereinafter referred to as M700-50A-SURA); a company specialized in the manufacturing of electrical steels and part of the Tata Steel Group, the second largest steel producer in Europe. However, this company only provides data for the B-H curve up to 1.8 T, so this curve must be extrapolated. This is done by forcing the relative permeability of the material to tend progressively to one as

15
the magnetic flux is increased. In the next section, this method for extrapolating the
B-H curve is proposed and tested.
2.4.1 B-H curve extrapolation
The magnetic permeability is defined as the slope of the B-H curve and is
characterized by the vacuum permeability (L�) and the relative permeability (L�).
M4MC = L�L�; L� = 40 ∙ 10QR S1 ∙ T3 U
It is known that, due to saturation, for very high values of magnetic flux density the relative permeability of the lamination will tend to one. In fact, some FEM programs set the relative permeability directly to one for flux densities higher than the given values. However, this can lead to misleading results when the relative permeability is still high for the last given value of magnetic flux density. Hence, an exponential evolution for the magnetization is proposed at high magnetic flux density values. The method used is called Exponential Law Extrapolation (ELE) [19] and is defined as
V4 = L�W<�X1 − YQZ[\ + C]M4MC = L� + L�<�^YQZ[ (2.4)
where <� is the saturation magnetization and ^ is the exponential coefficient. Thanks to the data provided by SURA, the values of μr are obtained up to 1.8 T
(TABLE III). For higher values, the extrapolation method is used.
TABLE III
DATA FROM M700-50A-SURA
B [T] H [A/m] μr
1,6 1760
1,7 4230 32,22
1,8 8130 20,40
Substituting in the system of equations with the last available values
G1.8 = 40 ∙ 10QRW<�X1 − YQa*'�Z\ + 8130]20.4045 = 1 + <�^YQa*'�Z

16
the values obtained for our unknowns are
<� = 1.4696 ∙ 10e3/T^ = 4.27823 ∙ 10Qh
Figure 5, Figure 6 and Figure 7 show the evolution of the relative permeability and the B-H curve of the electrical steel (M700-50A-SURAextr) after implementing the ELE method. The difference in the B-H curve between the strategy of setting μr equal to one beyond the given data and the method proposed is clear, considering the latter a better approximation to reality. Figure 8 compares the old definition of
M700-50A steel with M700-50A-SURAextr.
Figure 5. Extrapolation of the relative permeability. Logarithmic scale.
Figure 6. Zoom at the extrapolated area. Linear scale.
1
10
100
1000
10000
0 0,5 1 1,5 2 2,5 3
μr
B [T]
M700-50A-SURA
M700-50A-SURAextr
0
50
100
150
200
250
1,5 1,6 1,7 1,8 1,9 2
μr
B [T]
M700-50A-SURA
M700-50A-SURAextr

17
Figure 7. Extrapolated B-H curve.
Figure 8. B-H curve of the existing M700-50A definition in FCSmek and of the new definition.
2.4.2 Loss coefficients
In order to complete the definition of M700-50A-SURAextr in FCSmek, the eddy-currents (ij=) and hysteresis (i[=) loss coefficients need to be set. These losses are
calculated in FCSmek according to the following equations:
���[ = k lmi[=(2n�)4=�o
=p* qMrsF
(2.5)
���j = k lm ij=(2n�)�4=�o
=p* qMrsF
(2.6)
where ���[ represents the hysteresis losses, ���j the eddy-currents losses, n� is the synchoronous frequency and 4= is the magnetic flux density. With the purpose of obtaining an accurate calculation of the loss coefficients, data of the losses at different magnetic flux densities and frequencies should be fitted with a curve fitting. However, Sura’s website only provides the value of the losses at 50 Hz for
1,5
1,7
1,9
2,1
2,3
2,5
2,7
0 100.000 200.000 300.000 400.000 500.000 600.000
B [
T]
H [A/m]
M700-50A-SURA
Vacuum permeabilityabove 1.8(T)M700-50A-SURAextr
1
1,5
2
2,5
3
0 50.000 100.000 150.000 200.000
B [
T]
H [A/m]
M700-50A-SURAextr
M700-50A

18
M700-50A steel, not making it possible to obtain a nice fitting of the eddy-currents and hysteresis losses data. Consequently, the value of these constants is set to the
value they had in the M700-50A steel already defined in FCSmek.
2.4.3 Agreement with test data
Now the old and new definition of the iron material can be compared with the tests to find out which one correlates better with the core material of the actual machine. This comparison is made by means of a no-load test. The reason of this is that during a no-load test the current through the rotor is virtually zero and the behavior of the machine is mainly affected by the magnetization branch of the equivalent circuit, i.e., it is mainly affected by the properties of the core material.
� Note on FCSmek’s simulation profile
There are two methods of performing simulations in FCSmek: time stepping or
harmonic/magneto-static. Simulating no-load tests using time stepping simulations is a time
consuming task but offers a really good accuracy whereas magneto-static simulations are a
much faster solution that give, in turn, a poorer accuracy. Figure 9 compares these two
methods with the results obtained in one of the tests (TEST 1), concluding that the precision
obtained with the harmonic/magneto-static method is very low. This method should be
avoided and only time-stepping simulations will be used henceforth. With this type of
simulations, a trade-off between accuracy and speed is achieved using time steps of 100 μs.
Figure 9. No-load power curve using the time stepping method or the harmonic/magneto-static
method.
0
0,1
0,2
0,3
0,4
0,5
0,6
0,7
0,05 0,15 0,25 0,35 0,45
Po
we
r [k
W]
U [kV]
TEST 1
Time stepping M700-50A
Harmonic simulation M700-50A
19
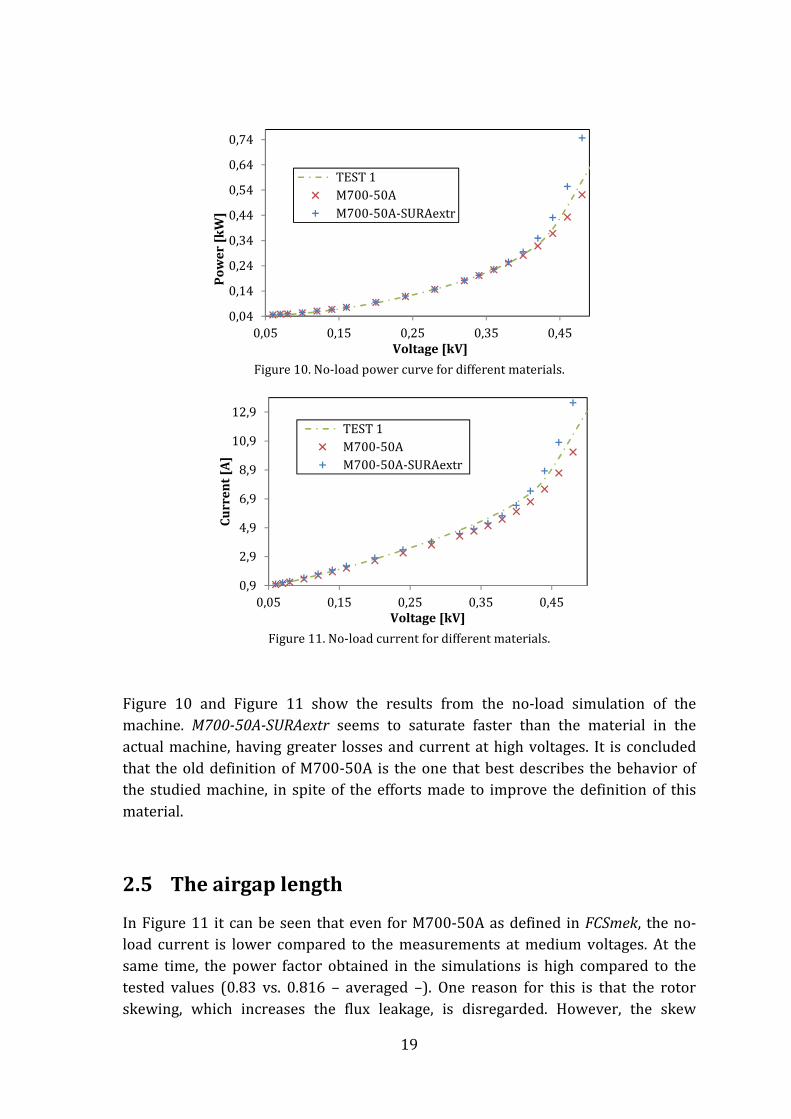
Figure 10. No-load power curve for different materials.
Figure 11. No-load current for different materials.
Figure 10 and Figure 11 show the results from the no-load simulation of the machine. M700-50A-SURAextr seems to saturate faster than the material in the actual machine, having greater losses and current at high voltages. It is concluded that the old definition of M700-50A is the one that best describes the behavior of the studied machine, in spite of the efforts made to improve the definition of this
material.
2.5 The airgap length
In Figure 11 it can be seen that even for M700-50A as defined in FCSmek, the no-load current is lower compared to the measurements at medium voltages. At the same time, the power factor obtained in the simulations is high compared to the tested values (0.83 vs. 0.816 – averaged –). One reason for this is that the rotor skewing, which increases the flux leakage, is disregarded. However, the skew
0,04
0,14
0,24
0,34
0,44
0,54
0,64
0,74
0,05 0,15 0,25 0,35 0,45
Po
we
r [k
W]
Voltage [kV]
TEST 1
M700-50A
M700-50A-SURAextr
0,9
2,9
4,9
6,9
8,9
10,9
12,9
0,05 0,15 0,25 0,35 0,45
Cu
rre
nt
[A]
Voltage [kV]
TEST 1
M700-50A
M700-50A-SURAextr

20
leakage cannot account for the entire reduction of the power factor. There are other
effects that are not being taken into account.
In fact, due to some manufacturing processes that apply high pressures [20] or cause plastic deformations [21] on the laminations, the magnetic properties of the electrical steel are largely worsened locally. Higher pressures result in a greater destruction of the magnetic properties and a larger affected area. During the punching process of the rotor and stator laminations, very high pressures applied on the edges cause the local destruction of the magnetic properties of the steel. This effect is reduced along the rotor surface because it is machined after the punching process, but the magnetic properties in the stator tooth tips are not recovered. Consequently, the actual airgap length seen by the magnetic flux is higher than the
measured physical airgap, which in this case was 0.52 mm.
By trial-and-error, an increase in the simulated airgap length of 0.05 mm is defined for a better agreement with the tests, removing material from the stator teeth. The increased airgap length notably improves the simulated no-load current giving a similar no-load power curve (Figure 12 and Figure 13) and the power factor at rated load (TABLE IV), reinforcing the theory previously exposed. The destruction of magnetic properties that might take place in other regions of the electrical steel is disregarded.
TABLE IV
COMPARISON FOR DIFFERENT AIR GAP LENGTHS
Air gap length [mm] 0,52 (physical) 0,57 Averaged test values
Power factor 0,83 0,82 0,82
Rated current [A] 14,71 14,89 15,03
* Rotor and stator temperature rise of 70K and 58,2K, respectively
The final distribution of the no-load losses in the reference model of the machine (hereinafter referred to a Reference model) is shown in TABLE V. The most interesting figure contained in it is the no-load iron losses because this figure will be used as the iron losses at load. Remember that according to the standard the iron losses at load are also obtained from the no-load test, but after correcting the value
of the voltage, as explained in Section 1.3.

21
Figure 12. No-load current for different airgap lengths.
Figure 13. No-load power for different airgap lengths.
TABLE V
NO-LOAD LOSSES DISTRIBUTION AT RATED VOLTAGE
Average test values Reference model
Stator losses [W] 78 78 Rotor losses [W] 0 4 Core losses [W] 174 163
Friction and windage losses [W] 39 41
Total losses [W] 291 286
0
2
4
6
8
10
12
0,05 0,15 0,25 0,35 0,45
Cu
rre
nt
[A]
Voltage [kV]
TEST 1
Physical gap
Air gap length 0.57
0
0,1
0,2
0,3
0,4
0,5
0,6
0,7
0,05 0,15 0,25 0,35 0,45
Po
we
r [k
W]
Voltage [kV]
TEST 1
Physical gap
Air gap length 0.57

22
2.6 Final reference model
All the modifications that have been explained in this section are included in the final version of the reference model. The results obtained are compared with the
tests in TABLE VI.
TABLE VI
COMPARISON BETWEEN THE TESTS AND THE MODEL OF THE REFERENCE MACHINE
Average test results Reference model
Efficiency [%] 88,39 89,09
Rated current [A] 15,03 14,89
Power factor 0,82 0,82
Starting current [A] 100 120
Starting torque [Nm] 112 120
Friction and windage losses [W] 39 41
Iron losses [W] 162 162
Stator losses [W] 465 438
Rotor losses [W] 212 199
Stray losses [W] 118 79
Total losses [W] 996 919
* Rotor and stator temperature rise of 70K and 58.2K, respectively
Some conclusions and ideas must be pointed out from the results obtained with the
reference model:
- The efficiency obtained in the simulations is slightly higher than the actual efficiency. This means that, in order to make sure that a certain prototype based on a future model of the machine actually reaches IE4 efficiency levels, a small margin in the efficiency is required to account for stray losses not taken into account by FCSmek and for disregarded three-dimensional effects.
- The power factor of the actual machine is still slightly lower than the simulated one. Not taking the skewing into account can explain this
difference.
- The simulated figure of the starting current is slightly higher than the measured one. Also, since the rotor is at standstill during starting, the
harmonic/magneto-static simulation could potentially be used in this case.
- The value of the friction and windage losses is set to 41 W. This value will be
used throughout this thesis.

23
Chapter 3
Analysis of different techniques to improve the
motor efficiency
In this chapter, the Reference model is modified step by step with the goals of increasing the efficiency and testing some of the techniques to improve the efficiency mentioned in Section 1.4. Its purpose is to compare these methods and arrive to useful conclusions that will be used in a full optimization of the machine in the following chapter.
3.1 Increased stator slot fill factor
The stator slot fill factor measures the percentage of slot area that is actually occupied by the copper wires. Having a high fill reduces the current density in the stator winding and the losses are consequently reduced. When efficiency is not an objective, high fill factors can also be used to increase the power density of the machine. There are many reasons why this factor cannot be close to one, as would be desirable:
- Round copper wires are not able to fill the space completely.
- The insulation applied to each wire reduces the available space.
- The insulation between the lamination steel and the winding also decreases the area available for the winding.
The highest feasible fill factor for the motor studied is considered to be around 0.68 whereas the actual stator slot fill factor is 0.538. Hence, a great improvement can be introduced in this parameter, showing TABLE VII the improved performance of the motor after this change.
3.2 Electrical steel with reduced losses
In this section, it is studied whether the electrical steel used in the original motor is the most appropriate regarding the efficiency. Out of all the different non-oriented, fully processed, electrical steel laminations with a thickness of 0.5 mm commercially available, a representative assortment is presented in Figure 14 using data available at Sura´s website. It is concluded that, for this assortment, M270-50A is the best

24
choice regarding the efficiency since it has the lowest losses at 50 Hz. This is also true at 100, 200, 400, 1000 and 2500 Hz. Data from Sura for this material is only given up to 1.8 T so its B-H curve is extrapolated using the method described in Section 2.4.1. This new material is defined in FCSmek under the name of M270-50A-SURAextr.
In contrast to the M700-50A steel, the losses at higher frequencies are publicly available for M270-50A in Sura’s website and the loss coefficients can be determined. The coefficients chosen are those who minimize the total relative error obtained when predicting the losses with (2.5) and (2.6). This is achieved by setting i[= = 0.922 and ij= = 0.241, as seen in Figure 15.
Figure 14. Core losses at 50(Hz) for different electrical steel.
Figure 15. Predicted losses and losses data provided by Sura for M270-50A at 1 T.
TABLE VII shows the improvements using the new core material in the machine. The model with an increased stator slot fill factor and the new core material is labeled as
0
1
2
3
4
5
6
7
8
9
0 0,5 1 1,5
Lo
sse
s [W
/k
g]
B [T]
M800-50A
M700-50A
M600-50A
M530-50A
M400-50A
M270-50A
1
10
100
1000
40 400 4000
Lo
sse
s [W
/k
g]
Frequency [Hz]
Data
Predicted
25
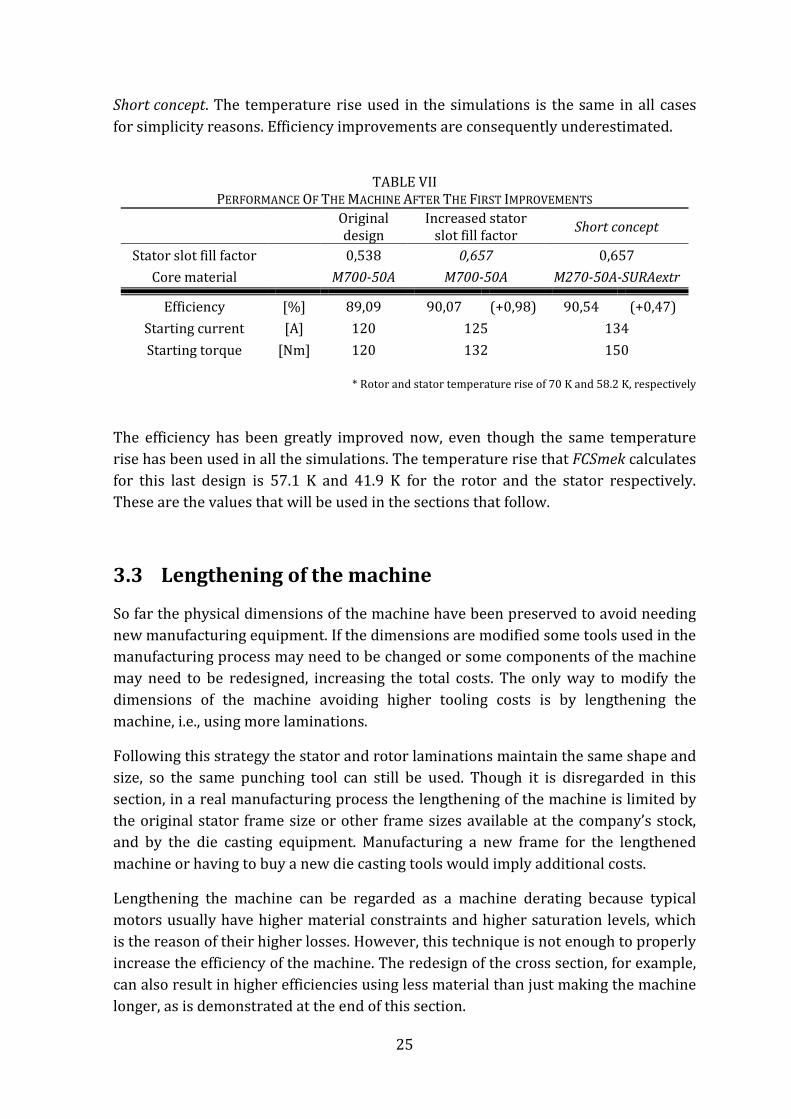
Short concept. The temperature rise used in the simulations is the same in all cases
for simplicity reasons. Efficiency improvements are consequently underestimated.
TABLE VII
PERFORMANCE OF THE MACHINE AFTER THE FIRST IMPROVEMENTS
Original design
Increased stator slot fill factor
Short concept
Stator slot fill factor 0,538 0,657 0,657
Core material M700-50A M700-50A M270-50A-SURAextr
Efficiency [%] 89,09 90,07 (+0,98) 90,54 (+0,47)
Starting current [A] 120 125 134
Starting torque [Nm] 120 132 150
* Rotor and stator temperature rise of 70 K and 58.2 K, respectively
The efficiency has been greatly improved now, even though the same temperature rise has been used in all the simulations. The temperature rise that FCSmek calculates for this last design is 57.1 K and 41.9 K for the rotor and the stator respectively. These are the values that will be used in the sections that follow.
3.3 Lengthening of the machine
So far the physical dimensions of the machine have been preserved to avoid needing new manufacturing equipment. If the dimensions are modified some tools used in the manufacturing process may need to be changed or some components of the machine may need to be redesigned, increasing the total costs. The only way to modify the dimensions of the machine avoiding higher tooling costs is by lengthening the
machine, i.e., using more laminations.
Following this strategy the stator and rotor laminations maintain the same shape and size, so the same punching tool can still be used. Though it is disregarded in this section, in a real manufacturing process the lengthening of the machine is limited by the original stator frame size or other frame sizes available at the company’s stock, and by the die casting equipment. Manufacturing a new frame for the lengthened
machine or having to buy a new die casting tools would imply additional costs.
Lengthening the machine can be regarded as a machine derating because typical motors usually have higher material constraints and higher saturation levels, which is the reason of their higher losses. However, this technique is not enough to properly increase the efficiency of the machine. The redesign of the cross section, for example, can also result in higher efficiencies using less material than just making the machine longer, as is demonstrated at the end of this section.
26
In order to predict how the machine performance is affected at rated load when the length is modified, using a technique similar to the one used in [12], the following
equations are used:
t = 4.44 ∙ 4uv ∙ w ∙ ; ∙ x ∙ B = x yΦy{ (3.1)
1 = 0B�4 ; ∙ 4uv ∙ D|� ∙ cos ^ (3.2)
where ; is the stack length, x the equivalent number of conductors, t the rms-
induced phase voltage, 4uv the amplitude of the fundamental airgap flux density, D|� the amplitude of the fundamental rotor current loading, B the airgap diameter, 1 the rated torque and w the mains frequency. Considering a fixed airgap diameter and a variable number of conductors in the stator, these relations are obtained:
r� ∝ ; ∙ 4uv ∙ x; 1 ∝ ; ∙ 4uv ∙ D|�; t ∝ x ∙ Φ;4uv ∝ Φ;
The voltage supply (r�) is typically constant, as well as the mains frequency. Assuming that the voltage supply does not vary, the induced voltage also remains roughly constant. Since the rated torque is constant (same output power), the
previous relations are simplified.
1 = ;′; 4uv′4uv x′x
1 = ;′; 4uv′4uv D|�′D|�
Φ′Φ = xx′
These results can be rewritten as follows:
D|� ′
D|� = x′x (3.3)
4uv ′
4uv = ;;′
xx′ (3.4)
Φ′Φ = xx′ (3.5)
According to these equations, the lengthening of the machine has to be followed by a change in the effective number of conductors in the stator slots if an optimal

27
magnetic flux density level is desired. Once the length and the number of conductors
are set, the remaining parameters are determined.
For a fixed number of equivalent conductors, increasing the length above a certain level reduces the magnetic flux density in the machine to unacceptable levels while decreasing the length may turn the flux density too high. There is an optimal stack length, as shown by Figure 16. Note that the starting current is reduced as the machine is lengthened.
The same happens if the number of conductors is changed and the length is maintained: there is an optimal conductor number. Decreasing the number of conductors too much make the flux density become too high, saturating the machine and increasing the core losses (see Figure 17). Increasing the number of conductors
is a good strategy to reduce the starting current.
Figure 16. Loss reduction (compared to the efficiency of the Short concept) when the length is increased, for a fixed equivalent number of conductors (x=36). Results from FEM simulations.
80
90
100
110
120
130
140
150
-15
-10
-5
0
5
140 160 180 200 220
Cu
rre
nt
[A]
Lo
ss r
ed
uc
tio
n [
%]
Length [mm]
Loss reduction
Starting current

28
Figure 17. Loss reduction (compared to the efficiency of the Short concept) when changing the number
of equivalent conductors for a fixed stack length (;=155 mm). Results from FEM simulations.
3.3.1 Same rotor cross section
The objective now is to design a lengthened machine with the optimum number of conductors that gives the maximum efficiency at each length. From the efficiency map found in [14] the following relation can be derived for the relation between the
optimal number of conductors and the stack length for maximum efficiency:
x~ = x − ;~ − ;; ∙ ���Q� ∙ x (3.6)
being ���Q� an empirical constant. For the machine studied in this section, the most
accurate results for steps of 20 mm in the machine length are obtained with ���Q�=0.69, as shown in Figure 18. In this figure, the airgap magnetic flux density is
also included, showing how its value decreases for the optimal efficiency as the machine is lengthened, as it was expected according to (3.4). In turn, the current loading of the machine is reduced according to (3.3). The loss reduction and starting
current for each of the simulated points in the previous plot is shown in Figure 19.
It must be pointed out how the optimal loss reduction in Figure 19 seems to tend to a
maximum value as the length is increased.
Focusing only on the efficiency is a dangerous approach since the starting performance of the machine is usually worsened by this method. It can be seen in Figure 19 how the starting current roughly follows the same tendency as the efficiency.
100
110
120
130
140
150
160
170
-4
-3
-2
-1
0
1
2
33 34 35 36 37 38
Cu
rre
nt
[A]
Lo
ss r
ed
uc
tio
n [
%]
Ns
Loss reduction
Starting current

29
Figure 18. Equivalent number of conductors that gives the maximum efficiency for each length using
FEM simulations.
Figure 19. Optimal loss reduction as function of the axial length (compared with Short concept). FEM
simulations.
In the light of this result, a conservative approach to the lengthening of the machine can be to focus on preserving the starting performance of the original design instead of centering on maximizing the efficiency. Neglecting the magnetizing current during the start, the following relations are deduced for the starting current and torque:
��� = ���~ = r���~ + �> (3.7)
1� = 3�*2n* ��~ t���~ � + �>� (3.8)
where 1� is the starting torque, ��� the starting current, ��~ the rotor resistance referred to the stator, �> the total leakage reactance and ���~ is the current in the rotor
during the starting referred to the stator.
0,665
0,685
0,705
0,725
0,745
0,765
0,785
17
19
21
23
25
27
29
31
33
35
155 195 235 275 315
Ma
gn
eti
c f
lux
de
nsi
ty [
T]
Eq
uiv
ale
nt
nu
mb
er
of
co
nd
uc
tors
Length [mm]
Simulated
Predicted (k=0.69)
Airgap flux density
120
140
160
180
200
220
240
260
0
5
10
15
20
25
30
35
155 205 255 305C
urr
en
t [A
]
Lo
ss r
ed
uc
tio
n [
%]
Length [mm]
Loss reduction
Starting current

30
Notice that the total leakage reactance can be separated into the slot leakage reactance, the differential leakage reactance, the end-winding leakage reactance and the skew leakage reactance (not taken into account by 2D-FEM programs) [10]. On the one hand, the differential leakage reactance (composed of the zigzag and the belt leakage and proportional to the unsaturated magnetization reactance) and the slot leakage reactance, as well as ��~ , are proportional to the length and the squared number of conductors. On the other hand, the end-winding leakage reactance is also proportional to the equivalent number of conductors squared but it does not depend on the length of the machine. However, in order to obtain a rough model of the starting performance of the machine, it will be assumed that the total leakage reactance is virtually proportional to the length and to the equivalent number of
conductors squared.
��,�~ , �>,� ∝ ;�x�� →����� ��′��,� = ;�;′ Sx�x′U�1�′1�,� = ;�;′ Sx�x′U�
For the same starting current, the previous equations give the following relations:
;′;� = Sx�x′U� (3.9)
1�′1�,� = 1
It is deduced that the starting torque is affected in the same way as the starting current when the axial length and the number of conductor are changed. Equation (3.9) shows an approximate relation between the length and the number of
conductors when maintaining the same starting characteristics.
It is concluded that more equivalent conductors than the optimal one have to be used in the stator in order to maintain the same starting current. The machine is lengthened following this relation and the result is shown in Figure 20. It is observed how, just by lengthening the machine, the loss reduction is roughly equivalent to an upgrade of a whole efficiency level, according what was said in Section 1.1. Any
thermal effects are neglected.

31
Figure 20. Loss reduction as function of the axial length for the same starting performance in the FEM
simulations.
According to this approach, a design is proposed – Concept A – (see TABLE VIII). The length of this proposal is selected in order to achieve an efficiency increase of roughly one efficiency class (20%). The change in the stator and rotor temperature rise is not considered. This concept has a much higher efficiency than the shortened design and a similar starting performance, showing the benefits of the lengthening method if the higher material costs can be afforded. The stator losses are reduced thanks to the lower number of equivalent conductors, which results in a reduced current loading, as is deduced from (3.3). Despite the longer core, the reduced magnetic flux density is able to slightly reduce the iron losses. Finally, the lower slip and current loading of the rotor reduce the rotor losses in the lengthened design.
This is the most conservative and simple approach that can be made in the lengthening process. Concept A represents the maximum efficiency that can be achieved without any need to redesign the shape of the stator and rotor laminations. It is a very simple solution, but it is not enough for the aim of this work, since the IE4 efficiency level is still far. A more challenging approach is performed in the next section in order to develop a second machine concept - Concept B – with a redesign of
the slot shape.
0
20
40
60
80
100
120
140
160
180
0
5
10
15
20
25
150 200 250 300
Cu
rre
nt
[A]
/ T
orq
ue
[N
m]
Lo
ss r
ed
uc
tio
n [
%]
Length [mm]
Loss reduction
Starting current
Starting torque

32
TABLE VIII PERFORMANCE OF THE MACHINE AFTER INCREASING THE LENGTH
Short concept Concept A
Core length [mm] 155 300 External diameter [mm] 220 220
Eq. conductors 36 26 Fill factor 0,657 0,679
Electrical steel M270-50A M270-50A Slip [%] 2,39 2,14 4uv [T] 0,75 0,54
Efficiency [%] 90,84 92,27 Rated current [A] 15,0 14,5 Power factor 0,79 0,81
Starting current [A] 134 143 Starting torque [Nm] 150 171
Iron losses [W] 118 114 Stator losses [W] 344 240 Rotor losses [W] 186 166 Stray losses [W] 67 67
Total losses [W] 756 628
3.3.2 Redesign of the rotor slots’ shape
The new approach to this problem is to obtain the same starting performance by redesigning the rotor slots instead of using a much higher number of equivalent conductors – as was done in Concept A. This way, an equivalent number of conductors much closer to the optimal one can be used. In order to keep the same total rotor bar resistance and have a fair comparison, neither the total area of the rotor slots nor the
short-circuit rings are modified.
Figure 21. Old rotor slot type (teardrop).
33
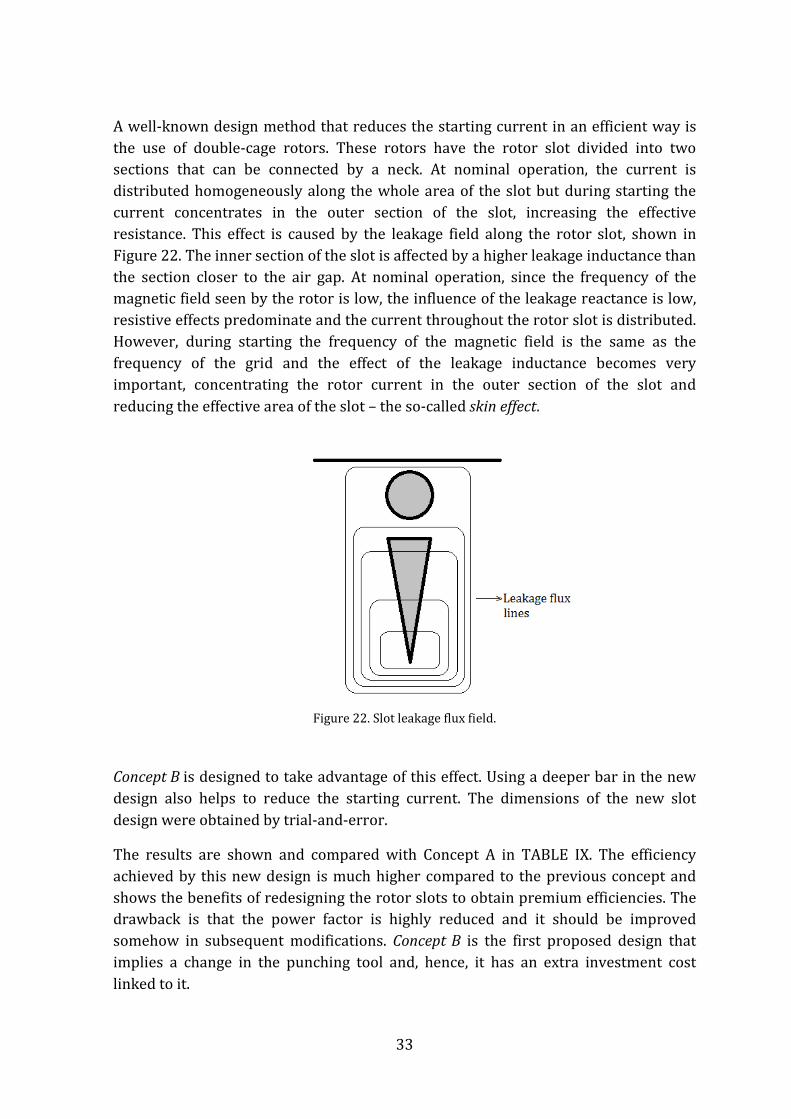
A well-known design method that reduces the starting current in an efficient way is the use of double-cage rotors. These rotors have the rotor slot divided into two sections that can be connected by a neck. At nominal operation, the current is distributed homogeneously along the whole area of the slot but during starting the current concentrates in the outer section of the slot, increasing the effective resistance. This effect is caused by the leakage field along the rotor slot, shown in Figure 22. The inner section of the slot is affected by a higher leakage inductance than the section closer to the air gap. At nominal operation, since the frequency of the magnetic field seen by the rotor is low, the influence of the leakage reactance is low, resistive effects predominate and the current throughout the rotor slot is distributed. However, during starting the frequency of the magnetic field is the same as the frequency of the grid and the effect of the leakage inductance becomes very important, concentrating the rotor current in the outer section of the slot and
reducing the effective area of the slot – the so-called skin effect.
Figure 22. Slot leakage flux field.
Concept B is designed to take advantage of this effect. Using a deeper bar in the new design also helps to reduce the starting current. The dimensions of the new slot
design were obtained by trial-and-error.
The results are shown and compared with Concept A in TABLE IX. The efficiency achieved by this new design is much higher compared to the previous concept and shows the benefits of redesigning the rotor slots to obtain premium efficiencies. The drawback is that the power factor is highly reduced and it should be improved somehow in subsequent modifications. Concept B is the first proposed design that implies a change in the punching tool and, hence, it has an extra investment cost
linked to it.

34
TABLE IX COMPARISON BETWEEN THE TWO NEW CONCEPTS
Concept A Concept B
Core length [mm] 300 300 Eq. conductors 26 22 Rotor bar area [mm2] 112,4 112,5 Rotor slot type Old New
Slip [%] 2,13 1,53 4uv [T] 0,54 0,65
Efficiency [%] 92,27 92,84 Rated current [A] 14,5 16,03 Power factor 0,81 0,72
Starting current [A] 143 144 Starting torque [Nm] 171 174
Iron losses [W] 114 156 Stator losses [W] 240 210 Rotor losses [W] 166 117 Stray losses [W] 67 54
Total losses [W] 628 579
The new slot type, thanks to its improved ability of reduction of the starting current, allows higher flux densities in the airgap. This higher flux density notably increases the iron losses in the rotor but the stator, rotor and stray losses are highly reduced in turn. The stator losses are reduced because of the higher flux density, which forces the current loading down, according to (3.3) and (3.4). At the same time, rotor losses experience a 30% decrease because of the lower slip (lower current in the rotor). Finally, the main reduction of the stray losses takes place in the rotor bars, which seems also a consequence of the new slot type. In the light of the results, Concept A is considered an inadequate approach and further improvements will be focused on
Concept B.
3.4 Influence of the stator slot opening width (SSOW)
The air gap length is not constant along the circumference of the airgap. The stator slot openings give rise to sudden local variations in the airgap length which, in turn, increases the harmonic content in the airgap magnetic flux distribution. These harmonics are undesirable and can be highly reduced by reducing the stator slot opening width.

35
The existence of openings in the stator slot is necessary in order to allow the insertion of the copper wires that form the primary winding. Consequently, its width cannot be randomly chosen. To evaluate the effect of the stator slot opening width on Concept B, its value was decreased a 10%. This was assumed to be an acceptable decrease. TABLE X shows the improvement experienced in the performance of the
machine.
TABLE X
IMPROVEMENT IN THE MACHINE PERFORMANCE WHEN THE STATOR SLOT OPENING WIDTH IS REDUCED
Concept B Concept B*
Stator slot opening width [mm] 3,15 2,8 4uv [T] 0,65 0,64
Efficiency [%] 92,84 92,95 Rated current [A] 16,03 15,91 Power factor 0,72 0,73
Starting current [A] 144 143 Starting torque [Nm] 174 172
Iron losses [W] 156 152 Stator losses [W] 210 207 Rotor losses [W] 117 117 Stray losses [W] 54 51
Total losses [W] 579 569
In Figure 23, the frequency spectrum of the air gap magnetic flux density shows how the harmonic frequencies related to the slot harmonics (see Appendix A) – 17th/19th, 37th/39th – are reduced. The reduced harmonics reduce the resistive losses due to high frequency currents in both stator and rotor, as can be seen in the previous table. The improved power factor reduces the current in the stator winding and its resistive losses. The iron losses are also reduced probably due to the lower magnetic flux density in the airgap and the lower magnetic flux density in the stator tooth tips (wider tips).

36
Figure 23. Frequency spectrum of the airgap flux density referred to the fundamental component of
Concept B’s airgap flux density.
At this point of the work, the high efficiency reached by Concept B* has to be pointed out. An expected efficiency of 92.95% provides a margin in relation to the theoretical limit of the IE4 efficiency class (92.6%) large enough to account for stray losses and three-dimensional effects not taken into account by FCSmek. Moreover, the temperature rises used in the calculations are not updated to this new design, making the safety margin even larger. Consequently, it can be asserted that this design is the first proposal that is believed to meet the IE4 requirement on efficiency. From this point on, studies will be focused on reducing the size and the copper mass of the motor and on improving other characteristics, e.g., the power factor, the starting current, etc.
3.5 The stator and rotor slot number combination
In this section, a different stator/rotor slot number combination is investigated and compared to the original 36/28 combination. The goal is to have a more sinusoidal distribution of the magnetic flux in the airgap to reduce the harmonic losses, which can be done by increasing the number of stator slots (x�):
x� = 6 ∙ �* ∙ � (3.10)
The number of pole pairs (�*) is a constant, so only the number of slots per pole and per phase (�) can be increased – its current value is 3 (x� = 36). Because of the relatively small size of the motor, only the value of � = 4 (x� = 48) will be investigated. Regarding the number of rotor slots, a cautious selection has to be done to avoid the appearance of significant synchronous parasitic torques. These torques are caused by the interaction of a stator harmonic and rotor harmonic of the same
0
0,1
0,2
0,3
0,4
0,5
0,6
0,7
0,8
0,9
1
0 10 20 30 40 50
Am
pli
tud
e [
p.u
.]
#
Concept B
Concept B*

37
order that originate from different stator harmonics and rotate at the same speed at a
certain moment.
Several guidelines and relations are given in Appendix A which summarize different methods to avoid or minimize synchronous torques based on general experience and electromagnetic theory. Following these guidelines, a stator/rotor slot combination of 48/40 is considered to satisfy most of the conditions contained in that appendix.
Hence, Concept C is proposed by adapting Concept B*’s design to the new slot combination and its performance is analyzed. In order to have a fair comparison
between both proposals some conditions are established:
- The total rotor bar area is maintained to have the same resistance in the rotor.
- The total copper mass in the stator winding is preserved and the fill factor is kept as close to the original one as possible.
- The total height of the rotor and stator slots is maintained. Whenever possible, only the widths are modified.
- Same magnetic flux density in the air gap is aimed.
It must be taken into account that the half coil length is also modified when the number of slots is changed. Its new value is calculated using (2.2). Since the half coil length used in the 36/28 model is obtained from the tests, only the proportional variation that takes place using this equation when the slot number is increased from
36 to 48 will be used to obtain the expected half coil length in the 48/40 design.
Using a relation obtained from (3.2) in Section 3.3, a new relation can be derived:
V 1� ∝ ; ∙ 4uv ∙ D|�D|� ∝ x@� ∝ x ∙ E� → 1� ∝ ; ∙ 4uv ∙ x ∙ E�
Again, the rated torque is roughly constant. Consequently, if the stack length is fixed
and the same magnetization level is desired in the machine:
1 = x′x E�′E� (3.11)
This implies that the equivalent number of conductors in the stator slot needs to be modified in line with the change in the stator slots to obtain the same air gap flux
density.
x′ = xE�E�′ = 22 ∙ 3648 = 16,5

38
Note that in order to obtain an equivalent number of conductors of 16.5, the stator winding must have two parallel branches instead of one, which forces the number of
random conductors in the stator slot to be a multiple of 2.
However, simulations with this number of equivalent conductors show an unacceptable value for the starting current. As a result, the number of equivalent conductors needs to be slightly increased in order to obtain the same starting current as in Concept B* and have a fair comparison between concepts (see TABLE XI).
TABLE XI
COMPARISON BETWEEN THE 36/28 SLOTS DESIGN AND THE 48/40
Concept B* Concept C Concept C*
Stator/Rotor slot number 36/28 48/40 48/40 Stator slot opening width [mm] 2,8 2,8 2,1
Core length [mm] 300 300 300 External diameter [mm] 220 220 220
Total rotor slot area [mm2] 3150 3152 3152 Copper mass [kg] 9,45 9,47 9,47
Eq. conductors 22 17 17 Fill factor 0,674 0,678 0,678
Slip [%] 1,53 1,60 1,58 4uv [T] 0,64 0,63 0,63
Efficiency [%] 92,95 92,95 93,22 Rated current [A] 15,91 15,63 14,59 Power factor 0,72 0,74 0,75
Starting current [A] 143 143 141 Starting torque [Nm] 172 186 179
Iron losses [W] 152 155 145 Stator losses [W] 207 210 203 Rotor losses [W] 117 121 122 Stray losses [W] 51 42 35 Total losses [W] 569 569 546
Both concepts show a similar efficiency, having Concept C a better power factor. The substantial reduction in the stray losses is a result of the more sinusoidal flux distribution in the airgap, while the increase in the stator losses can be explained because of the increased stator phase resistance. The iron and rotor losses are also
slightly increased, so the total losses are unchanged.
The ratio between the stator slot opening width (DD��) and the stator slot pitch (@�)
can be defined as:
���7F� = DD��@� (3.12)

39
This ratio should be kept constant in both Concept B* and Concept C. Since the stator slot pitch is reduced when the number of stator slots is increased, the slot opening width should be reduced accordingly, resulting in a width of 2.1 mm. This represents further reduction of this width of a 25%. If the width is not reduced (as in Concept C), the stator slot harmonics are slightly increased in spite of the reduction of the rotor slot harmonics, as shown in Figure 24. This figure also shows the fact that the order of the slot harmonics of Concept C have changed according to (A.2) and (A.3) in Appendix A.
Since, theoretically, the width of the opening can be reduced, Concept C* is designed to analyze the benefits of doing so. The conclusion is that a considerably higher efficiency is obtained for this design, as it was shown in the previous table. The lower stator slot harmonics can explain this reduction of the losses.
Figure 24. Frequency spectrum of the airgap flux density referred to the fundamental component of
Concept B* ’s airgap flux density.
0
0,1
0,2
0,3
0,4
0,5
0,6
0,7
0,8
0,9
1
0 10 20 30 40 50
Am
pli
tud
e [
p.u
.]
#
Concept B*Concept C
Concept C*


41
Chapter 4
Full optimization of the design
In previous sections, changes have been done with the purpose of comparing different strategies and methods to increase the efficiency. This implied that some characteristics (e.g., the total copper mass, the total slot area, etc.) were preserved in order to reduce the number of variables involved and make fairer comparisons. This has constrained so far the significance of the improvements made.
In this section a completely free redesign of the machine is carried out with the goals of reducing the length of the motor and of fully optimizing the machine performance. Nevertheless, thanks to the previous studies made in this work, some variables are known to be already at its optimum and will not be defined as variables in the
optimization process:
- The core material. M270-50A is chosen from a representative assortment of electrical steel types as the best one when only the losses are considered
(amorphous steel is not considered an option because of its great cost).
- The stator slot fill factor. The maximum feasible value was set in a previous
section.
- The rotor slot type. Based on the results of Section 3.3.2 it was decided that the double cage slot type is the most convenient in order to reduce the starting current and obtain high efficiencies at the same time.
- The stator slot opening width will be fixed at 2.8 mm to simplify the optimizing process.
So far, all the designs that have been proposed have a much longer core than the reference motor. If this is inappropriate from a manufacturing point of view, increasing the stator diameter could be a solution to obtain a shorter design. This solution is studied further in this chapter. The effect of the external diameter on the machine performance is explained by this equation:
1 = 0B�4 ; ∙ 4uv ∙ D|� ∙ cos ^ (4.1)
where the angle ^ has a typical value of 5°-10°, depending on the machine reactance. The output power of the machine is constant, so the torque will also remain more or less constant. On the one hand, increasing the diameter (which increases the total

42
volume of the machine) forces the magnetic flux density or the rotor current loading to be reduced. On the other hand, the iron losses and the resistive losses are roughly dependent on the magnetic flux density squared and the rotor current loading squared, respectively. It is hence concluded that a machine with a bigger outer diameter can have a shorter stack length if the same efficiency is aimed. Accordingly, the stator outer diameter is set to 232(mm) for the optimization. TABLE XII
shows the change in the external dimensions that is made in this chapter.
TABLE XII
EXTERNAL DIMENSIONS
Concepts B* and C
value Optimization
External stator diameter [mm] 220 232
Core length [mm] 300 As low as possible
4.1 Definition of the optimization profile
The design optimization of the motor is the process where some objective functions are maximized/minimized. In order to do this, the parameters to be modified need to be specified, as well as which values of certain parameters cannot be exceeded, e.g., a minimum starting torque.
4.1.1 The objectives
The objectives are the characteristics that the designer wants to minimize or maximize. When more than one objective is given, a good value for all the objectives is sought.
Choosing the right objectives is essential to obtain a satisfactory and useful result from the optimization. For example, somebody could artlessly suggest defining the efficiency as an objective to be maximized. However, it has been shown in previous sections that the efficiency is high enough so far and does not need to be further improved. The objective of this work has never been to obtain the maximum possible efficiency but to reach the IE4 efficiency level, which has already been achieved.
Maximizing the efficiency is thus discarded as an objective.
It has been previously motivated why reducing the cost of the machine is very important. The total copper mass can be used as an approximate way of estimating the cost-effectiveness of a certain model, provided that the cost of copper is several

43
times higher than the cost of the electrical steel or the shaft material (see Chapter 5).
Consequently, the total copper mass is defined as an objective to be minimized.
Regarding the starting current, the standard [22] sets a maximum to the ratio between the starting apparent power and the rated power (apparent power in per
unit):
D�7��7,:��(r3) = D�7��7,:��(r3)�=(�) = √3 ∙ 400(r) ∙ ��7��7,:��(3)7,5(��) = 12
→ ��7��7,:�� = 129,9(3)
This value has been slightly exceeded in all the previous design proposals. For this reason, the starting current has to be reduced. But, should it be defined as an objective and minimized? The answer is no: the standard sets a limit to the starting current, but reducing its value any further does not improve the performance of the machine and is generally bad for the efficiency. In fact, it was shown in Chapter 3.3 that a longer core reduces the starting current. Consequently, the optimization might
result in a longer motor instead of a shorter one.
Against this background, the length also has to be defined as an objective. Setting the maximum length as a constraint would not exactly give the desired results because, once the stack length were between the limits, it would not be further reduced. A shorter length reduces the total material cost, is faster to manufacture (fewer laminations to be punched and stacked) and might allow shorter frames. Defining the length as an objective to be minimized is the best way to remark its importance in the
optimization process.
To sum up, the total length and the total copper mass are selected as the objectives that are going to be minimized in the optimization.
4.1.2 The constraints
The constraints or restrictions are those variables that must be between certain limits. These limits may be imposed by the standards, by the manufacturing process,
etc. The following constraints are set for the optimization:
- Starting apparent power to rated power ratio. After dismissing to include this parameter as an objective in the previous subsection, it is reasonable to include it as a constraint. A small margin is added for precaution, setting its
maximum value to 11.6 instead of 12, which is the value defined in [22].
- Starting torque and maximum torque. The same standard defines a minimum value for these parameters of 1.6 p.u. and 2 p.u., respectively.

44
- The efficiency. As previously discussed, the efficiency is set as a restriction.
Every design with efficiency lower than 92.9% will be discarded.
- The power factor. It has been a problem all along this work, usually being worsened every time an improvement in efficiency was achieved. To only
accept designs with a high power factor, a lower limit of 0.78 is fixed.
4.1.3 The variables
A variable is a parameter that is assigned different values between two predefined limits, with a certain step that is fixed by the user. In this case the aim is to fully optimize the complete machine, which means that almost every variable related to
the dimensions and performance of the machine needs to be defined as a variable:
- Each single variable describing the geometry of the stator and rotor slot,
except for the slot type.
- The inner diameter of the stator (sometimes referred to as the air gap diameter) and the air gap length.
- The equivalent number of conductors.
- The core length. It has to be defined also as a variable; otherwise its value would not be modified, making it impossible to minimize the length of the machine.
The range given for each variable needs to be carefully considered. For example, a certain combination of values of the variables must not result in total rotor slot heights bigger than the available space in the rotor, since the slot would somehow “invade” the area where the shaft is, leading to a wrong optimization. However, the ranges given to the variables cannot be too restrictive if a genuine optimization is desired.
It is important to note that:
- The stator outer diameter and the shaft diameter are defined as constants for this study. The reason to fix the stator outer diameter was explained before and the shaft diameter is dependent on the rated torque of the machine, which
remains virtually constant.
- The half coil length of the machine and the short circuit ring dimensions are affected by changes in the core length, the stator inner diameter, the air gap length and the stator slot dimensions. This means that every model has to recalculate the dimensions of both the half coil length and the short circuit ring to adapt them to new designs. The half coil length will be calculated using

45
(2.2) and the short circuit ring will be defined in order to keep the same cross-
sectional area and have the same height as the corresponding rotor slots.
- Both the 36/28 and the 48/40 slot combinations were proved to give similar results regarding the efficiency, so only the 36/28 case is analyzed in this
section.
4.2 Results
Two concepts, Concept D215 and Concept D220, are selected as the best designs obtained in the optimization process of the design of the motor. The reason for picking these designs is their short length and their low starting current. For comparison purposes, the same optimization is performed using the old (teardrop) rotor slot type, obtaining from this process two more design proposals – Concept
D215_Old and Concept D220_Old. TABLE XIII compares the performance of these designs.
TABLE XIII
COMPARISON BETWEEN DIFFERENT OPTIMIZED DESIGNS
Concept
D215 Concept
D215_Old Concept
D220 Concept
D220_Old Core length [mm] 215 220
External diameter [mm] 232 232
Rotor slot area [mm2] 155,8 172,9 163,1 193,0
Fill factor 0,679 0,676 0,676 0,677
Eq. conductors 29 31 29 31
Copper mass [kg] 9,71 11,62 9,53 11,22 4uv [T] 0,63 0,57 0,62 0,56
Efficiency [%] 92,92 92,94 92,94 92,95
Power factor 0,79 0,79 0,78 0,79
Starting torque [p.u.] 2,44 2,65 2,37 2,47
Maximum torque [p.u.] 3,86 3,89 3,83 3,93
Sstart,max [p.u.] 11,56 11,59 11,58 11,58
Iron losses [W] 134 130 125 125
Stator losses [W] 221 216 232 231
Rotor losses [W] 118 127 116 119
Stray losses [W] 58 56 55 53
Total losses [W] 572 570 570 569

46
The designs with the old rotor slot type have higher losses in the rotor (because of the lower magnetic flux density) but, conversely, have reduced iron and stator losses. It must be highlighted that the designs with the old slot type require around a 20% more copper than those with the new one in order to reach the same efficiency levels,
which confirms the benefits of using the new slot type.
With the intention of quantifying the difference between the old and the new rotor slot type in terms of efficiency, Concept D215 is optimized again but changing its rotor slot type to the reference one. In this optimization, the stator dimensions are fixed, only the rotor slot geometry, the air gap length and the number of equivalent
conductors are modified, and the efficiency is maximized.
With the same requirements on the starting current and torque, on the maximum torque and on the power factor, the maximum efficiency obtained now is 92.63%. This means that the efficiency loss using the old rotor slot is roughly 0.3%, a crucial difference when super premium efficiencies are desired. The old rotor slot type has greater difficulties reducing the starting current, which results in the need of more equivalent conductors in the stator, reducing the efficiency. This result further
demonstrates the advantages of the new slot type.
There are some differences between the two proposed concepts with the new rotor slot type. Concept D215 is a shorter machine, which not only saves electrical steel but also reduces the number of punches done by the punching machine, reducing the wearing out of the tool. Also, its higher power factor is a positive characteristic. Nevertheless, it is not clear which design will have a better behavior and be more cost-efficient in the production line. A complete economic study should be done to be
able to safely opt for one of them.
4.2.1 Optimization with other core materials
The point of this study is to find out if a design of an IE4 induction motor could be
achieved with a lower grade electrical steel. The materials to be analyzed are:
- M400-50A. It is a softer material, which is beneficial for the stamping tool.
- M470-50HP. This material has greater losses but its high permeability may be useful to reduce the saturation level and the magnetization current in the
machine.

47
Data from Sura is again used to define these materials in FCSmek, whose B-H curves are extrapolated using the ELE method. Thanks to the data available also the loss
coefficients can be determined in the same way as in previous chapters.
The result is that none of the two materials are able to reach the same performance as both concepts “D” with a stack length equal or lower than 220 mm. In general, it is observed that machines with these materials in the core need around 50% more copper than the best designs obtained for M270-50A in order to have the same performance. This means that the extra cost of using so much copper might
overshadow the savings derived from the use of these core materials.
The objective in the next section will be to analyze if IE4 efficiency levels can also be reached substituting the aluminium in the rotor bars and short-circuit rings by
copper and the pros and cons this change entails.
4.3 Conclusions
The study performed in this chapter has demonstrated that it is feasible to manufacture IE4, 7.5 kW, 4-pole, induction motors with external dimensions compatible with the assumed IEC standard frame sizes, which was the main objective of this thesis work. Moreover, this study shows that using aluminium in the rotor bars and short-circuit rings is not an obstacle to obtain Super Premium Efficiency levels.
The old slot type in the rotor is not flexible enough to reduce the rotor and iron losses while keeping a low starting current. Compared with the new proposed rotor slot type, the old one can only reach the IE4 efficiency level when using a 20% more mass
of copper than the new one.
Concept D215 offers two interesting features compared to Concept D220:
- Shorter design. This implies that the punching tool has to punch fewer laminations per motor, reducing the wear of the tool and cutting manufacturing times.
- Higher power factor. The low power factor was one of the problems inherent
to all the designs studied and Concept D215 is the best proposal in this regard.

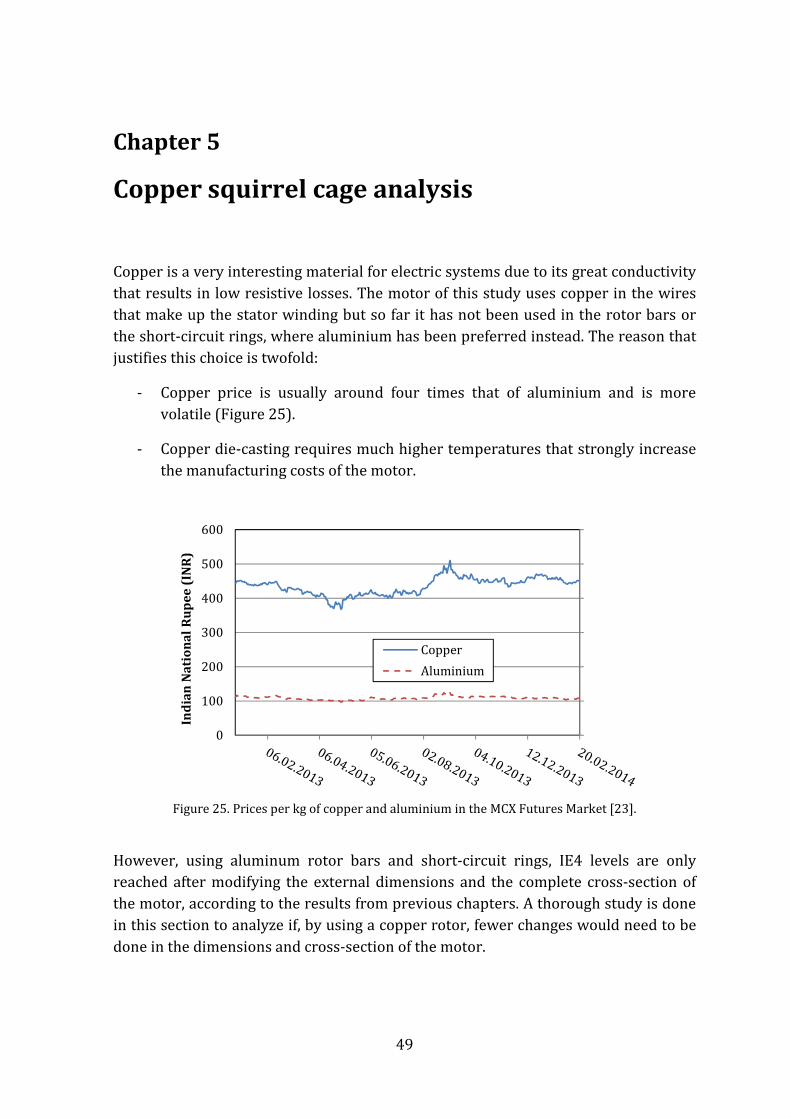
49
Chapter 5
Copper squirrel cage analysis
Copper is a very interesting material for electric systems due to its great conductivity that results in low resistive losses. The motor of this study uses copper in the wires that make up the stator winding but so far it has not been used in the rotor bars or the short-circuit rings, where aluminium has been preferred instead. The reason that justifies this choice is twofold:
- Copper price is usually around four times that of aluminium and is more volatile (Figure 25).
- Copper die-casting requires much higher temperatures that strongly increase the manufacturing costs of the motor.
Figure 25. Prices per kg of copper and aluminium in the MCX Futures Market [23].
However, using aluminum rotor bars and short-circuit rings, IE4 levels are only reached after modifying the external dimensions and the complete cross-section of the motor, according to the results from previous chapters. A thorough study is done in this section to analyze if, by using a copper rotor, fewer changes would need to be done in the dimensions and cross-section of the motor.
0
100
200
300
400
500
600
Ind
ian
Na
tio
na
l R
up
ee
(IN
R)
Copper
Aluminium

50
5.1 Original cross-section
Since the main goal is to make as few changes in the cross-section and external dimensions as possible, the machine derived from Section 3.2 (original machine with increased fill factor and better electrical steel) is used as the starting point. For this design, the aluminum rotor bars and short-circuit rings are substituted by copper ones in the FEM software. TABLE XIV compares both concepts, showing an increase of roughly one point in the efficiency by just introducing this change, i.e., a 10% decrease in the losses, equivalent to an upgrade of half an efficiency class. The loss
reduction is mainly seen in the rotor losses.
TABLE XIV
ALUMINUM VS. COPPER SQUIRREL CAGE
Squirrel cage material Al Cu
Efficiency [%] 90,84 91,77 Power factor 0,79 0,78
Starting current [A] 134 147 Starting torque [Nm] 150 128
Iron losses [W] 118 118 Stator losses [W] 344 341 Rotor losses [W] 186 102 Stray losses [W] 67 70
Total losses [W] 756 672
The drawback of using copper in the rotor bars is that, because of the reduced resistance and the constant voltage supply, the starting current is increased and the
starting torque drops – see (3.8).
Once the increase in the efficiency using copper bars has been proven, the next step is to lengthen the machine. For comparative reasons, the same length as in the optimized aluminum motor is used. This lengthened design is named as Concept A
Copper. TABLE XV compares the outcome of this modification with Concept D220. Note that the number of conductors is chosen to obtain the same starting performance and that the external diameter is larger in Concept D220. The efficiency obtained for the copper design is still very far from reaching the same efficiency
levels that were obtained in Concept D220.

51
TABLE XV CONCEPT A COPPER VS. CONCEPT D220
Concept A Copper Concept D220
Core length [mm] 220 External diameter [mm] 220 232
Eq. conductors 33 29 Rotor slot type Old New
Squirrel cage material Cu Al
Efficiency [%] 92,14 92,94 Power factor 0,82 0,78
Starting current [A] 127 125 Starting torque [Nm] 115 115
Iron losses [W] 97 125 Stator losses [W] 307 232 Rotor losses [W] 117 116 Stray losses [W] 78 55
Total losses [W] 640 570
A sharp reader could rightfully reproach the author at this point that using the same manufacturing tools also allows the designer to modify to a certain extent the air gap length. This is perfectly correct since the rotor is machined after the stamping process and the airgap length can be adjusted at the expense of modifying the height of the steel rotor bridges that close the rotor slots and isolate them from the airgap. However, as shown in Figure 26, changing the airgap length does not result in significant efficiency changes. It is thus demonstrated that it is not possible to reach
IE4 efficiency levels using copper rotor bars and short-circuit rings together with
the original cross-section.
Figure 26. Loss reduction vs. airgap length when L=220 mm and Ns=33. FEM simulations.
-1,5
-1
-0,5
0
0,5
1
1,5
0,5 0,55 0,6 0,65 0,7 0,75 0,8 0,85
Lo
ss r
ed
uc
tio
n [
%]
Airgap length [mm]
Loss reduction
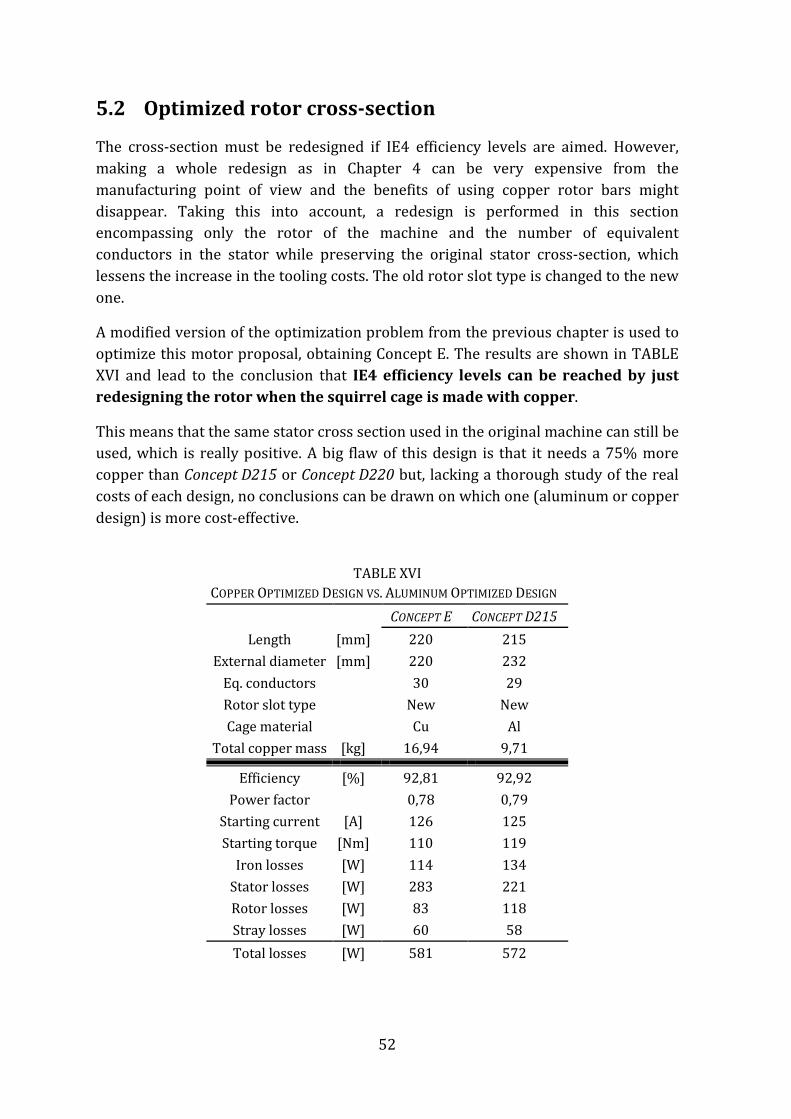
52
5.2 Optimized rotor cross-section
The cross-section must be redesigned if IE4 efficiency levels are aimed. However, making a whole redesign as in Chapter 4 can be very expensive from the manufacturing point of view and the benefits of using copper rotor bars might disappear. Taking this into account, a redesign is performed in this section encompassing only the rotor of the machine and the number of equivalent conductors in the stator while preserving the original stator cross-section, which lessens the increase in the tooling costs. The old rotor slot type is changed to the new
one.
A modified version of the optimization problem from the previous chapter is used to optimize this motor proposal, obtaining Concept E. The results are shown in TABLE XVI and lead to the conclusion that IE4 efficiency levels can be reached by just
redesigning the rotor when the squirrel cage is made with copper.
This means that the same stator cross section used in the original machine can still be used, which is really positive. A big flaw of this design is that it needs a 75% more copper than Concept D215 or Concept D220 but, lacking a thorough study of the real costs of each design, no conclusions can be drawn on which one (aluminum or copper
design) is more cost-effective.
TABLE XVI
COPPER OPTIMIZED DESIGN VS. ALUMINUM OPTIMIZED DESIGN
CONCEPT E CONCEPT D215
Length [mm] 220 215
External diameter [mm] 220 232
Eq. conductors 30 29
Rotor slot type New New
Cage material Cu Al
Total copper mass [kg] 16,94 9,71
Efficiency [%] 92,81 92,92
Power factor 0,78 0,79
Starting current [A] 126 125
Starting torque [Nm] 110 119
Iron losses [W] 114 134
Stator losses [W] 283 221
Rotor losses [W] 83 118
Stray losses [W] 60 58
Total losses [W] 581 572

53
Chapter 6
Conclusions and future work
6.1 Conclusions
This Master Thesis has analyzed an existing IE2 induction machine design and has endeavoured to improve its efficiency through different techniques. Finite Element Method (FEM) simulations have been used to model the motor and study each
technique.
Increasing the stator slot fill factor and substituting the M700-50A electrical steel in the core by M270-50A (higher grade electrical steel) were the first modifications introduced in the motor. Thanks to them, a loss reduction of 13% was achieved.
Then, the modified model of the motor was lengthened. This technique proved to be very positive if an adjustment of the equivalent number of conductors in the stator was made (in order to obtain an optimal magnetic flux density in the airgap). Maintaining the cross-section design, a reduction in the losses of 17% was obtained when the length was increased by 90%. The loss reduction was higher if the rotor slot shape was redesigned (23%).
The influence of the stator slot opening width was also studied. This study showed that reducing the width of the opening by 11% helped to reduce the losses by 1.7%. In addition, a new stator/rotor slot number combination was tried. A 48/40-slots concept was compared to the original 36/28 combination concluding that, for this particular motor, the increased number of slots was only beneficial when the stator
slot opening width was proportionally reduced.
The last method for the reduction of the losses studied was the use of a copper squirrel cage. This change resulted in a reduction of 11% of the losses, but the starting performance was worsened.
Finally, applying the studied techniques, the motor design was optimized, with the intention of minimizing its length and its total copper mass. Using an aluminum rotor, two designs with a 38% loss reduction compared to the original model was obtained after optimizing both the stator and the rotor cross-sections. These designs are a 40% longer than the original one. Using this increased length and a copper rotor, only a redesign of the rotor cross-section was necessary to reach the same efficiency. A 38% loss reduction is equivalent to an upgrade of two International Efficiency classes. This implies an upgrade of the motor from IE2 to the IE4 efficiency level.

54
6.2 Future work
It would be of great interest to manufacture a prototype based on the designs proposed in this work. Testing the prototype would validate the proposals or rebuff them. Together with this, an exhaustive study of the costs of the different designs proposed throughout this thesis could lead to a better understanding of each model
and to correctly estimate the cost-effectiveness of each one of them.
In addition, a deep investigation should be carried out on the modeling of the magnetic properties of the electrical steel after the manufacturing process. This is essential to be able to rely on the results obtained in the simulations.
Finally, it has been shown in this work the benefits of having narrow stator slot openings. Further studies are needed to determine the optimum slot opening width and its dependence on the airgap length In any case, in order to allow for the insertion of the winding in the stator, there might be a limit in the reduction of the slot opening width. Magnetic wedges partially solve this issue but they greatly increase the manufacturing costs of the motor.

55
Bibliography
[1] P. Waide and C. U. Brunner, "Energy-Efficiency Policy Opportunities for Electric Motor-Driven Systems" (2011), International Energy Agency Web site [Online]: http://www.iea.org/publications/freepublications/publication/EE_for_ElectricSystems.pdf
[2] University of Coimbra (Portugal), EDF (France), ENEL (Italy), ETSU(UK), FhG-ISI (Germany) and NESA (Denmark), "Improving the Penetration of Energy-Efficient Motors and Drives", SAVE II Programme 2000, Directorate-General for
Transport and Energy, European Commission, 2000.
[3] "Rotating Electrical Machines - Part 30: Efficiency Classes of Single-Speed, Three-Phase, Cage-Induction Motors (IE-code)", International Electrotechnical Commission (IEC), International Standard 60034-30, Ed. 1, November 2008.
[4] ABB Technical Note, "Standard on Efficiency Classes for Low Voltage AC Motors", IEC 60034-30, 2011.
[5] A.T. de Almeida, F. Ferreira, and J. Fong, "Standards for Super-Premium Efficiency Class for Electric Motors", in Industrial & Commercial Power Systems
Technical Conference, May 2009.
[6] A.T. de Almeida, F. Ferreira, and G. Baoming, "Beyond Induction Motors - Technology Tends to Move Up Efficiency", in IEEE/IAS 49th Industrial &
Commercial Power Systems Technical Conference, May 2013.
[7] H. Nishizawa, K. Itomi, S. Hibino, and F. Ishibashi, "Study on Reliable Reduction of Stray Load Losses in Three-Phase Induction Motor for Mass Production",
IEEE Trans. Energy Convers., vol. EC-2, no. 3, pp. 489-495, September 1987.
[8] IEEE, "Standard Test Procedure for Polyphase Induction Motors and
Generators", IEEE, Std. 112-2004, November 2004.
[9] "Rotating Electrical Machines - Part 2-1: Standard Methods for Determining Losses and Efficiency from Tests (Excluding Machines for Traction Vehicles)", International Electrotechnical Commission (IEC), International Standard
60034-2-1, Ed. 1, September 2007.
[10] Chandur Sadarangani, Design and Analysis of Induction and Permanent Magnet
Motors. Stockholm, Sweden: Division of Electrical Machines and Power Electronics, School of Electrical Engineering, Royal Institue of Technology,

56
2006, p. 136.
[11] S. Nategh, "Thermal Analaysis and Management of High-Performance Electrical Machines", Ph.D. dissertation, Department of Electrical Energy Conversion,
Royal Institute of Technology, Stockholm, 2013.
[12] A. Boglietti, A. Cavagnino, L. Ferraris, M. Lazzari, and G. Luparia, "No Tooling Costs Process for Induction Motors Energy Efficiency Improvements", IEEE
Trans. Ind. Appl., vol. 41, no. 3, pp. 808-816, May-June 2005.
[13] K. Büttner, M. Müller, and N. Woehner, "Squirrel Cage Rotor", International
Patent 66 954, September 29, 2011.
[14] L. Alberti, N. Bianchi, A. Boglietti, and A. Cavagnino, "Core Axial Lengthening as Effective Solution to Improve the Induction Motor Efficiency Classes", IEEE
Trans. Ind. Appl., vol. PP, no. 99, June 2013.
[15] A. Nakahara, S. Kikuchi, K. Nishihama, T. Miyoshi, and K. Kaihatsu, "Interbar Current Losses in Cage Induction Motors Due to Harmonic Flux", in IEEE
International Electric Machines & Drives Conference, Chicago, IL, May 2013, pp.
1364-1368.
[16] Y. N. Feng, J. Apsley, S. Williamson, A. C. Smith, and D. M. Ionel, "Reduced Losses in Die-Cast Machines with Insulated Rotors", IEEE Trans. Ind. Appl., vol. 46, no. 3, pp. 928-936, May-June 2010.
[17] C. Choudhury and N. K. Deshmukh, "A novel Method for Reduction of Stray Loss in Induction Motor", in IEEE Power and Energy Conf., Champaign, IL, February 2013, pp. 101-105.
[18] R. Curiac and H. Li, "Improvements in Energy Efficiency of Induction Motors by the Use of Magnetic Wedges", in Rec. 58th Annu. IEEE Industry Applications
Society Petroleum and Chemical Industry Conf. Papers, Toronto, ON, September
2011, pp. 1-6.
[19] A. E. Umenei, Y. Melikhov, and D. C. Jiles, "Models for Extrapolation of Magnetization Data on Magnetic Cores to High Fields", IEEE Trans. Magn., vol.
47, no. 12, pp. 4707-4711, December 2011.
[20] C. C. H. Lo, E. Kinser, and D. C. Jiles, "Modeling the Interrelating Effects of Plastic Deformation and Stress on Magnetic Properties of Materials", J. Appl. Physics, vol. 93, no. 10, pp. 6626-6628, May 2003.
[21] M. Fukuhara, T. Yonamine, F. J. G. Landgraf, and F. P. Missell, "Evolution of Magnetic Properties and Crystallographic Texture in Electrical Steel with Large

57
Plastic Deformation", J. Appl. Physics, vol. 109, no. 7, April 2011.
[22] "Rotating Electrical Machines - Part 12: Starting Performance of Single-Speed Three-Phase Cage Induction Motors", International Electrotecnical Commission
(IEC), International Standard 60034-12, Ed. 2.1, September 2007.
[23] Investing.com. [Online]. http://www.investing.com/commodities/real-time-futures
[24] Ion Boldea and A. Nasar, "Airgap Field Space Harmonics, Parasitic Torques, Radial Forces and Noise", in The Induction Machine Handbook. Boca Raton, FL:
CRC Press LLC, 2002, ch. 10, sec. 9.


59
Appendices
Appendix A
Basic theory on synchronous torques
Different kinds of harmonics can appear in an induction motor according to [24]:
- Stator mmf harmonics:
�* = 6�* ± 1 (A.1)
- Harmonics due to the stator slotting effect:
�* = �*x��* ± 1 (A.2)
- Harmonics due to the rotor slotting effect:
�* = ��x��* ± 1 (A.3)
where �* is the harmonic order and �* is a whole number different from zero. The
synchronous speed for a certain stator harmonic can be written as
2*�& = w*�*�* (A.4)
while the speed of a rotor harmonic with respect to the stator is
2*��~ = w*�*�′ �1 + �� x��* (1 − .)� (A.5)
A synchronous torque takes place when both speeds are the same, which happens
when the slip of the machine is:
. = 1 when the two harmonics rotate in the same direction (�* = +�′)
. = 1 + ��&F�o� when they rotate in opposite direction (�* = −�′)
Additionally to the harmonics mentioned above, there are other sources of harmonics that give further conditions and equations for the rise of stator and rotor harmonics, their order and their rotating speed. To avoid the appearance of synchronous torques at a certain rotation speed, the concurrence of harmonics of the same order in the
60
stator and in the rotor must be avoided, i.e., �* ≠ ±�′. Some general guidelines and relations that a machine designer can follow to prevent the rise of big synchronous
torques are listed below:
- The synchronous torque originated by the leakage saturation is avoided if:
x� ≠ 2�*(3�* ∓ 1); �* = 1,2,3… (A.6)
- Harmonics caused by the slotting effect in the stator and the rotor are of different orders if:
x� ≠ �* ��⁄ ⋅ x�; �*, �� = ±1,±2 (A.7)
- The synchronous torque between the stator mmf and the rotor slotting
harmonics does not take place if:
6�* + 1 ≠ �� x� �*⁄ + 1; �*, �� = ±1,±2 (A.8)
- In delta-connected machines, which is the case of this study, rotor mmf harmonics take place and may cause the so-called secondary armature
reaction, which can be eschewed by setting:
|x� −x�| ≠ (3� ∓ 1)�*; � = 1, 3, 5… (A.9)
- When using parallel path stator windings, the secondary armature reaction can also appear because of harmonic currents circulating within the windings. For this reason, the following relation must be avoided, as it gives rise to these currents:
|x� − x�| = 3�* (A.10)
- The greatest common divisor of Ns and Nr should be low – two if possible– in order to reduce the maximum tangential force per unit rotor area due to the
synchronous torques.
- An odd number of rotor slots is associated to high noise levels and should be
avoided.
- A number of rotor slots lower than the stator slots results in less parasitic
torques and may be used without skewing.
- The most significant and dangerous synchronous torques are those of a lower
harmonic order.
x� is the number of rotor slots and �, �* and �� are coefficients.

61
Appendix B
Description of the main design proposals
• Reference model. This is the FEM model of the original IE2 motor design. See Section 2.6.
• Short concept. This model is the result of increasing the stator slot fill factor in Reference model and changing the iron material to M270-50A. See Section 3.2.
• Concept A. The previous design is lengthened and its equivalent number of conductors in the stator is changed. See Section 3.3.1.
• Concept B. The rotor slot design in Concept A is modified and the number of conductors is adapted to obtain the same starting current. See Section 3.3.2.
• Concept B*. Same design as Concept B except for the narrower stator slot opening. See Section 3.4.
• Concept C. A stator/rotor slot combination of 48/40 is implemented in this concept. Concept B* (36/28) is used as the starting point of this design. See Section 3.5.
• Concept C*. Same concept as Concept C, but with a narrower stator slot opening width. See Section 3.5.
• Concept D220. Using Concept B* as the starting point, its design is optimized regarding the length and the copper mass. See Section 4.2.
• Concept D215. It is derived in the same way as Concept D220. It has a length of 215 mm instead of 220 mm and different stator and rotor slot dimensions (but same rotor slot type). See Section 4.2.
• Concept D220_Old. The optimization of Concept D220 is repeated using the old rotor slot type. Both have the same stack length. See Section 4.2.
• Concept D215_Old. It is derived in the same way as Concept D220_Old and has the same length as Concept D215. See Section 4.2.
• Concept A Copper. A similar approach as in Concept A is used. In this case, the model is only lengthened up to 220 mm and the aluminum squirrel cage is substituted by a copper one. See Section 5.1.
• Concept E. Similar optimization as in Concept D220 and Concept D215 but optimizing only the rotor cross-section and the number of equivalent conductors. See Section 5.2.

62
TABLE XVII BASIC FEATURES OF THE MAIN MOTOR CONCEPTS
L
[mm] Dout
[mm] Ns RST ES
SSOW [mm]
FF S/R SCM
Reference model
155 220 36 O M700-50A 3,15 0,538 36/28 Al
Short concept 155 220 36 O M270-50A 3,15 0,657 36/28 Al
Concept A 300 220 26 O M270-50A 3,15 0,679 36/28 Al
Concept B 300 220 22 N M270-50A 3,15 0,674 36/28 Al
Concept B* 300 220 22 N M270-50A 2,8 0,674 36/28 Al
Concept C 300 220 17 N M270-50A 2,8 0,678 48/40 Al
Concept C* 300 220 17 N M270-50A 2,1 0,678 48/40 Al
Concept D220 220 232 29 N M270-50A 2,8 0,676 36/28 Al
Concept D215 215 232 29 N M270-50A 2,8 0,679 36/28 Al
Concept D220_Old
220 232 31 O M270-50A 2,8 0,677 36/28 Al
Concept D215_Old
215 232 31 O M270-50A 2,8 0,676 36/28 Al
Concept A Copper
220 220 33 O M270-50A 3,15 0,670 36/28 Cu
Concept E 220 220 30 N M270-50A 2,8 0,679 36/28 Cu
L= Stack length; Dout= Stator’s external diameter; Ns= Number of stator equivalent conductors; RST= Rotor slot type: O= Old, N= New; ES= Electrical steel; SSOW= Stator slot opening width; FF= Stator fill factor; S/R= Stator/rotor slot number combination;
SCM= Squirrel cage material.

