alessandra venturini - the demand of caregivers
TRANSCRIPT

www.migrationpolicycentre.eu MPC
The demand of Caregivers
Anna Di Bartolomeo, Sona Kalantaryan,
Alessandra Venturini
MPC,EUI, Florence
Forum on Migration, Citizenship and Demography
Conference Demography
MPC, EUI, Florence 4-5 February 2016

www.migrationpolicycentre.eu MPC
• Women migration has increased in Europe 49.5% of total
migrant population
• The increase in supply, in the average level of education
• but not increase in the quality of the women jobs
• 34% in low (ISCO9) and 41% in medium skilled jobs (ISCO4-8)
• 30-40% according to the definition in the care sector.
• growth of native care workers 17% 2006-2012
• growth of foreign care workers 84% 2006-2012
• Foreign share 6% 2006 to 17% 2012
www.migrationpolicycentre.eu MPC
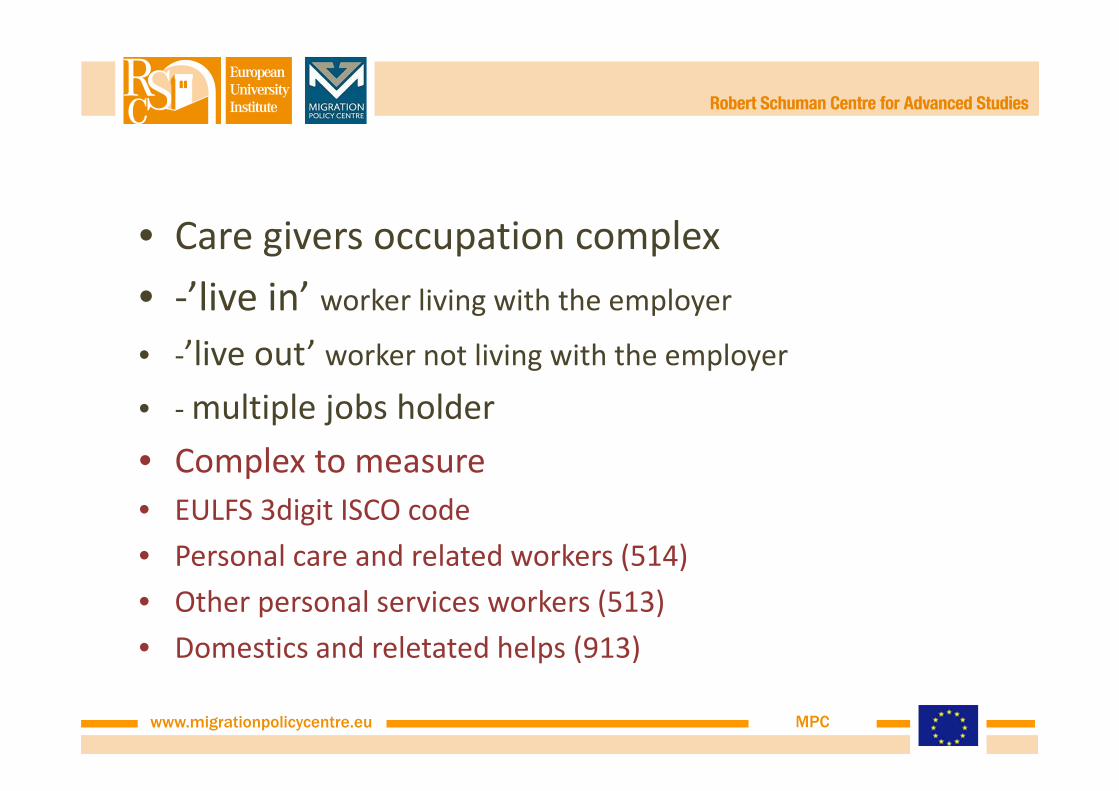
• Care givers occupation complex
• -’live in’ worker living with the employer
• -’live out’ worker not living with the employer
• - multiple jobs holder
• Complex to measure
• EULFS 3digit ISCO code
• Personal care and related workers (514)
• Other personal services workers (513)
• Domestics and reletated helps (913)
www.migrationpolicycentre.eu MPC
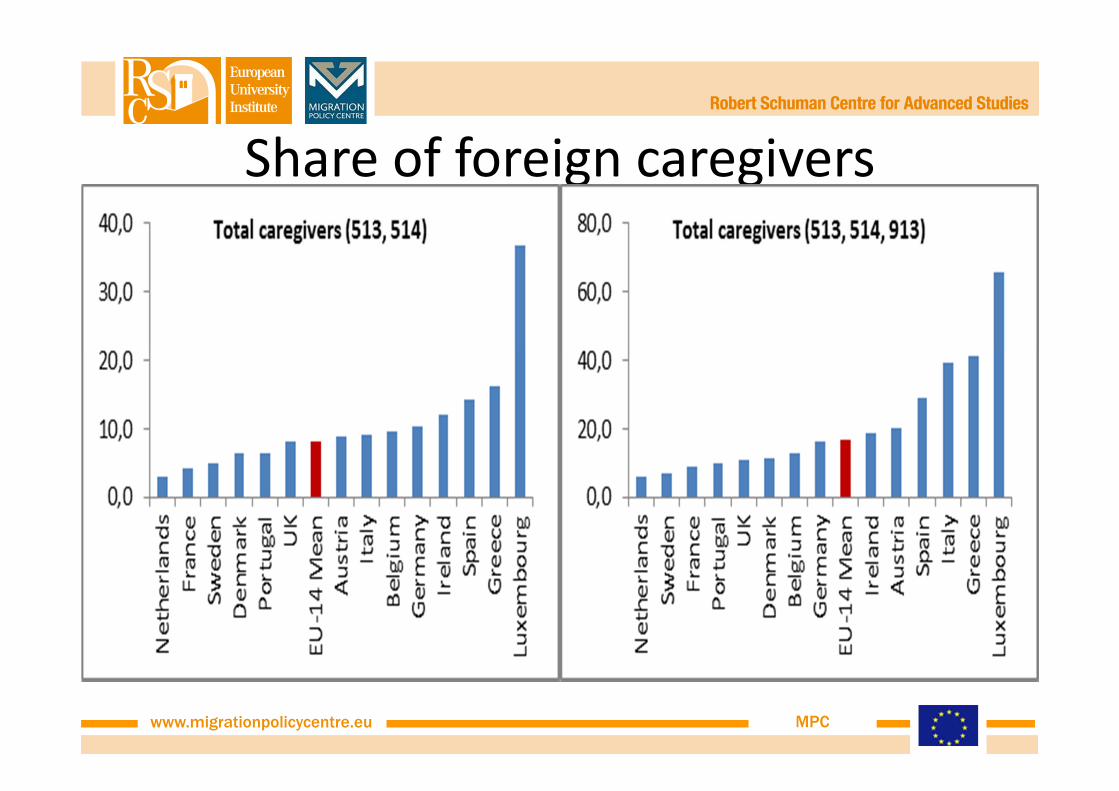
Share of foreign caregivers
www.migrationpolicycentre.eu MPC
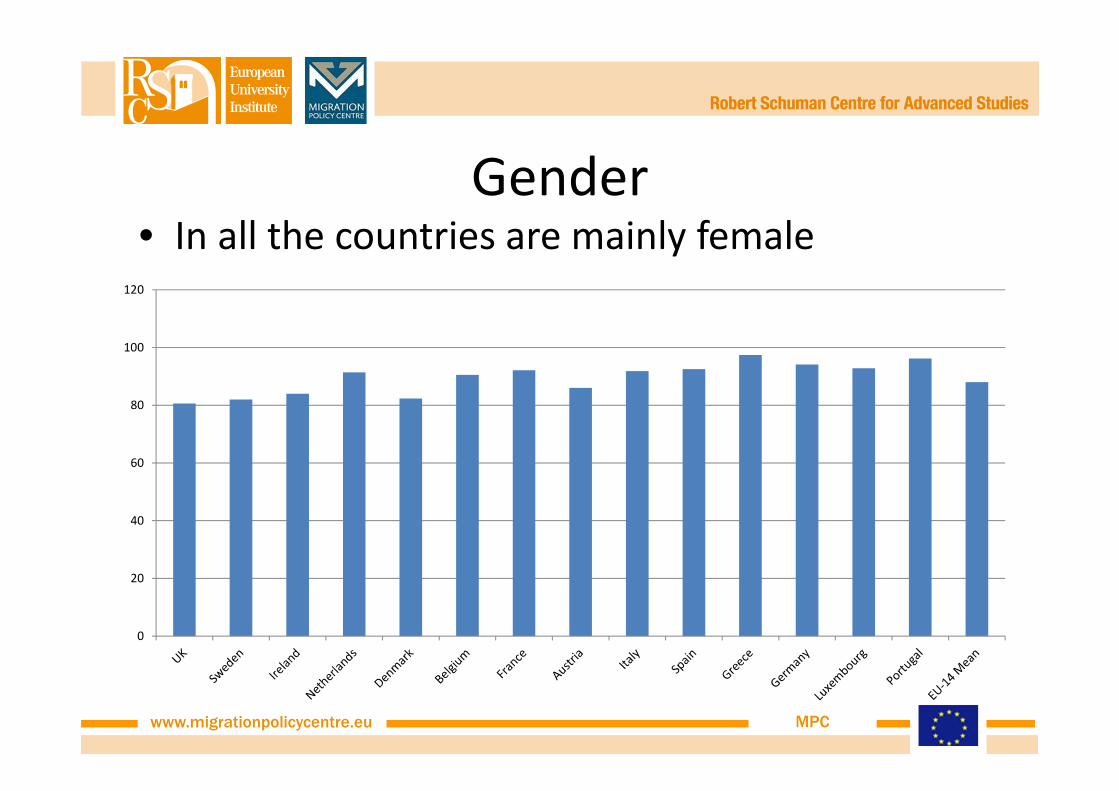
Gender• In all the countries are mainly female
0
20
40
60
80
100
120

www.migrationpolicycentre.eu MPC
0.0
15.0
30.0
45.0
60.0
75.0
90.0
Total caregivers (513, 514, 913)
%TCNs

www.migrationpolicycentre.eu MPC
• The objective of the research is to model and
forecast the demand of caregivers
• Factors affecting the demand:
www.migrationpolicycentre.eu MPC
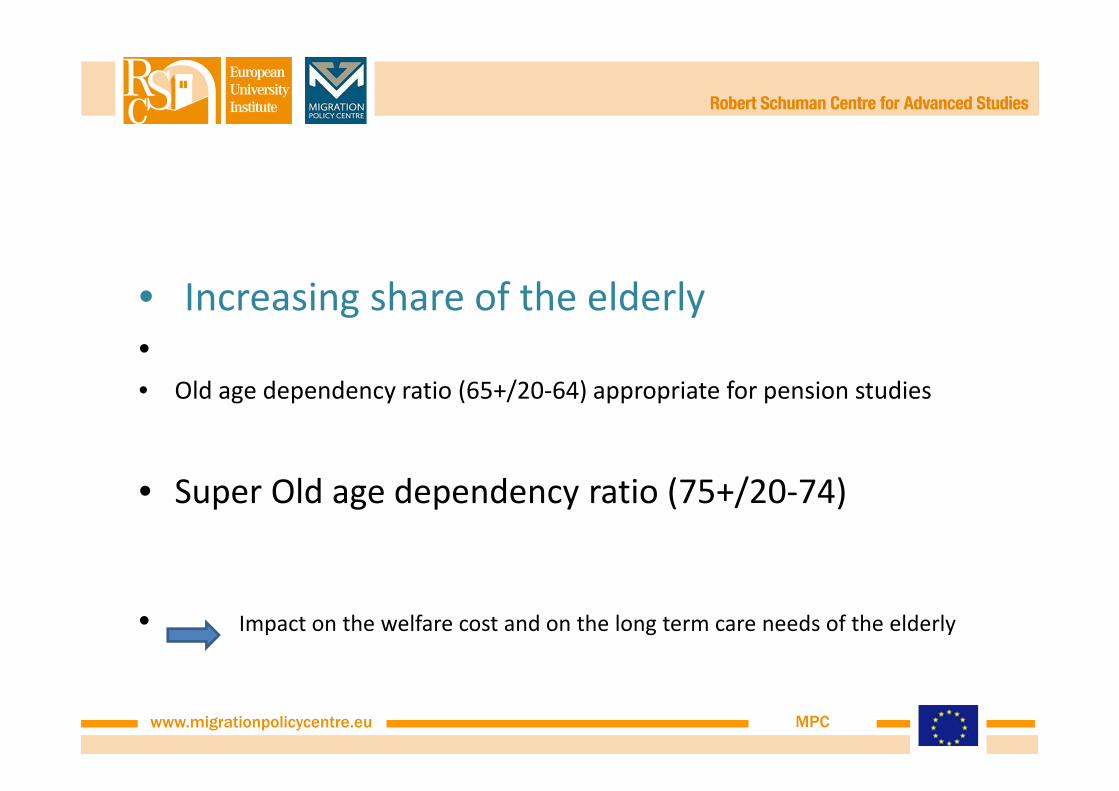
• Increasing share of the elderly
•• Old age dependency ratio (65+/20-64) appropriate for pension studies
• Super Old age dependency ratio (75+/20-74)
• Impact on the welfare cost and on the long term care needs of the elderly

908/02/2016 MPC - www.migrationpolicycentre.eu
Fig.1: Old age dependency ratio 1952-2050
0%
10%
20%
30%
40%
50%
60%
70%
1950 1970 1990 2010 2030 2050
Po
pu
lati
on
65+
/ 20
-65
World
27 MS
Source: Philippe Fargues, 2011, Author's calculation based on UN Population Data Online
www.migrationpolicycentre.eu MPC
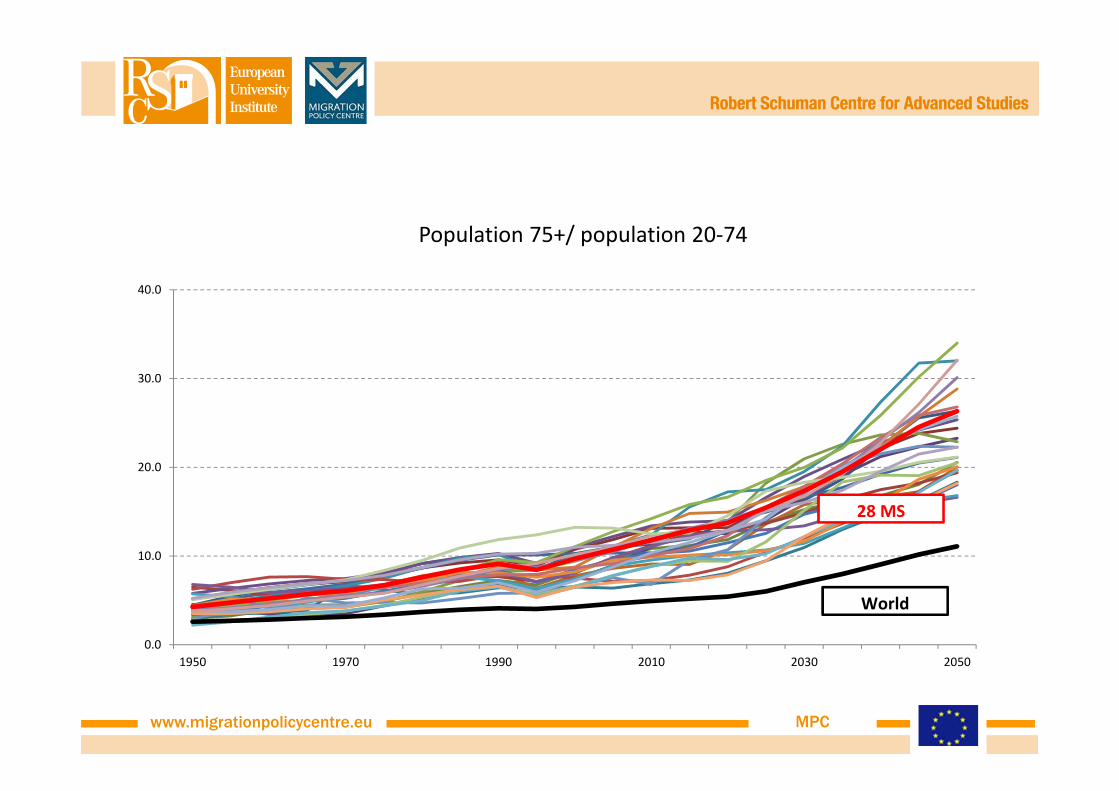
Population 75+/ population 20-74
0.0
10.0
20.0
30.0
40.0
1950 1970 1990 2010 2030 2050
28 MS
World

www.migrationpolicycentre.eu MPC
Morbility% people perceiving severe long-standing limitations in usual activities due to health
problem
0
5
10
15
20
25
30
35
40
65+
75+
www.migrationpolicycentre.eu MPC

www.migrationpolicycentre.eu MPC
The demand for care services will increase
and the demand of care givers in the public, private and
family sectors according to the type of welfare state model
prevailing in the economy will increase .
Demand of care givers will increase not only because the
elderly persons increase
but also becuase the domestic labour supply declines.
www.migrationpolicycentre.eu MPC
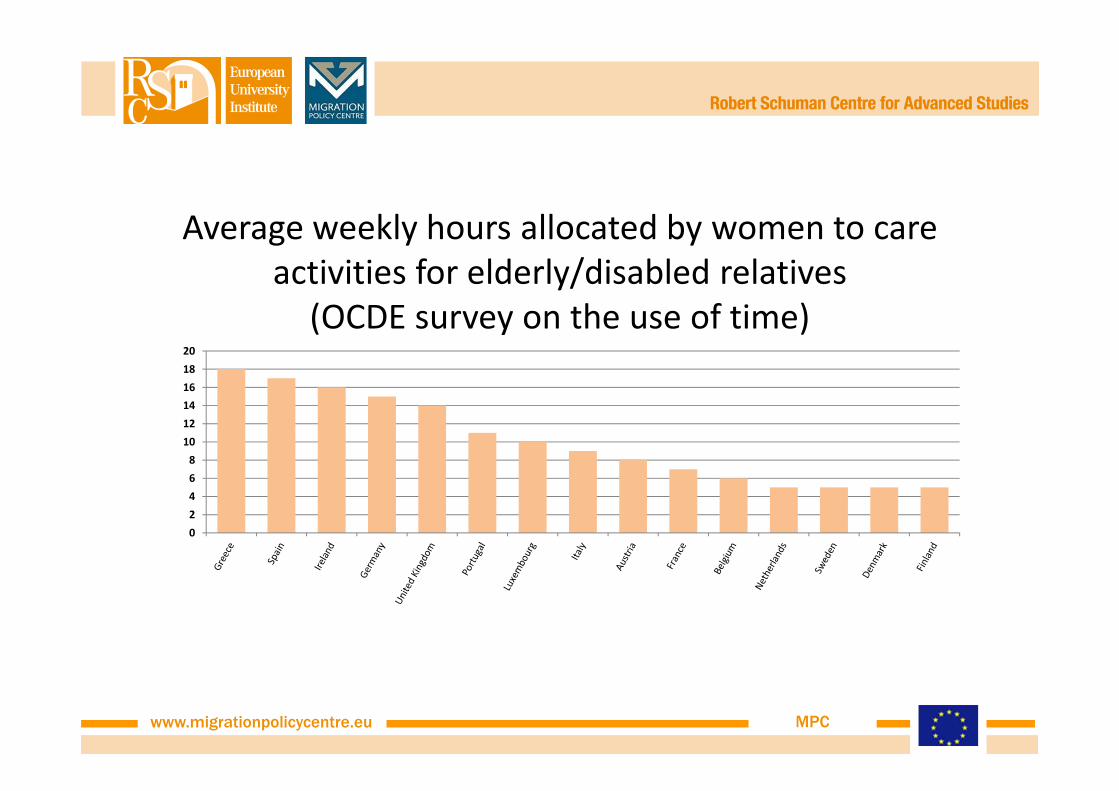
Average weekly hours allocated by women to care
activities for elderly/disabled relatives
(OCDE survey on the use of time)
0
2
4
6
8
10
12
14
16
18
20

www.migrationpolicycentre.eu MPC
0
10
20
30
40
50
60
% of unemployed and inactive on pop aged 15-64 Females

www.migrationpolicycentre.eu MPC
Long term expenditure in kind and in cash benefits %
on GNP SHA and ESSPROS database
01
23
40
12
34
01
23
40
12
34
2006 2008 2010 2012
2006 2008 2010 2012 2006 2008 2010 2012 2006 2008 2010 2012
Austria Belgium Germany Denmark
Spain France Greece Ireland
Italy Luxembourg Netherlands Portugal
Sweden UK mean
Ltce
xpok
yearGraphs by country
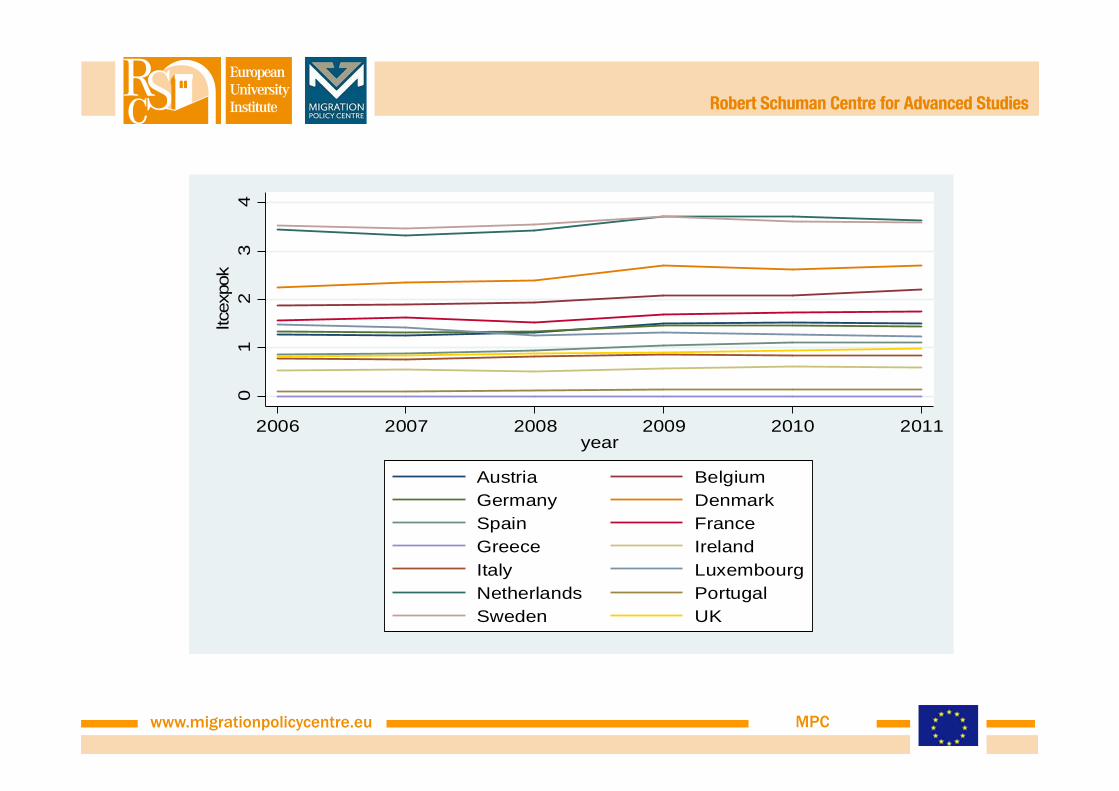
www.migrationpolicycentre.eu MPC
01
23
4ltc
expo
k
2006 2007 2008 2009 2010 2011year
Austria BelgiumGermany DenmarkSpain FranceGreece IrelandItaly LuxembourgNetherlands PortugalSweden UK
www.migrationpolicycentre.eu MPC
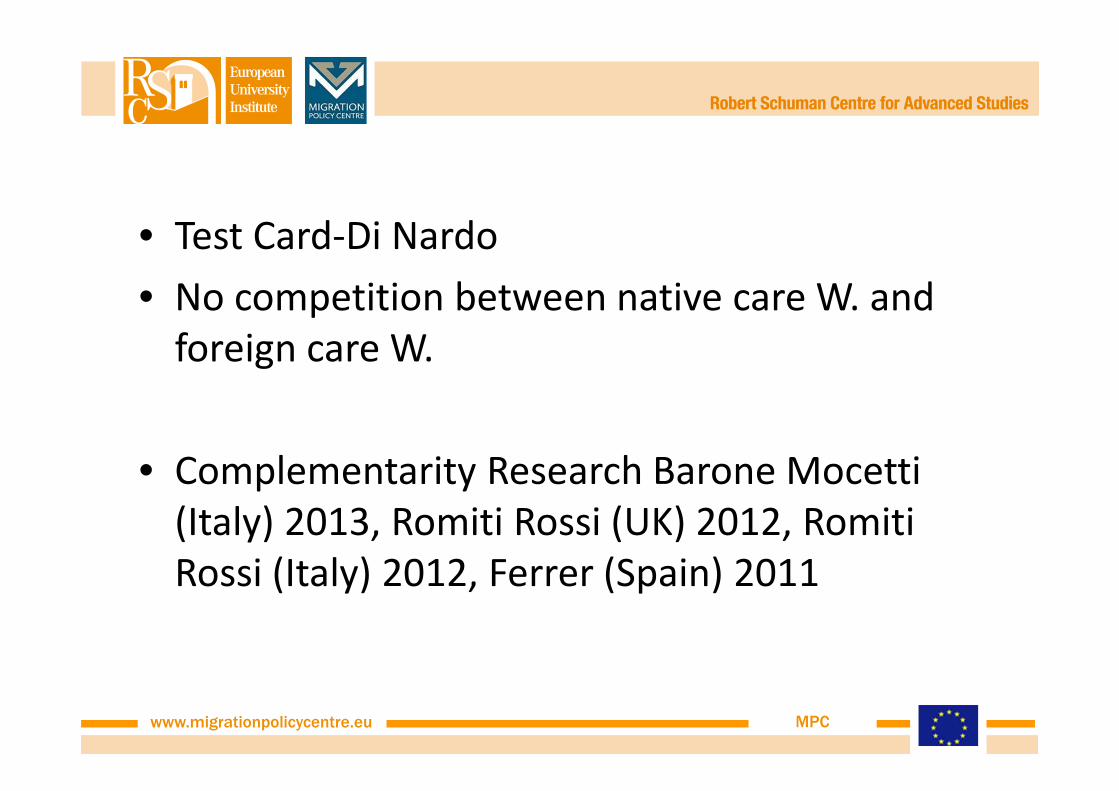
• Test Card-Di Nardo
• No competition between native care W. and
foreign care W.
• Complementarity Research Barone Mocetti
(Italy) 2013, Romiti Rossi (UK) 2012, Romiti
Rossi (Italy) 2012, Ferrer (Spain) 2011
www.migrationpolicycentre.eu MPC
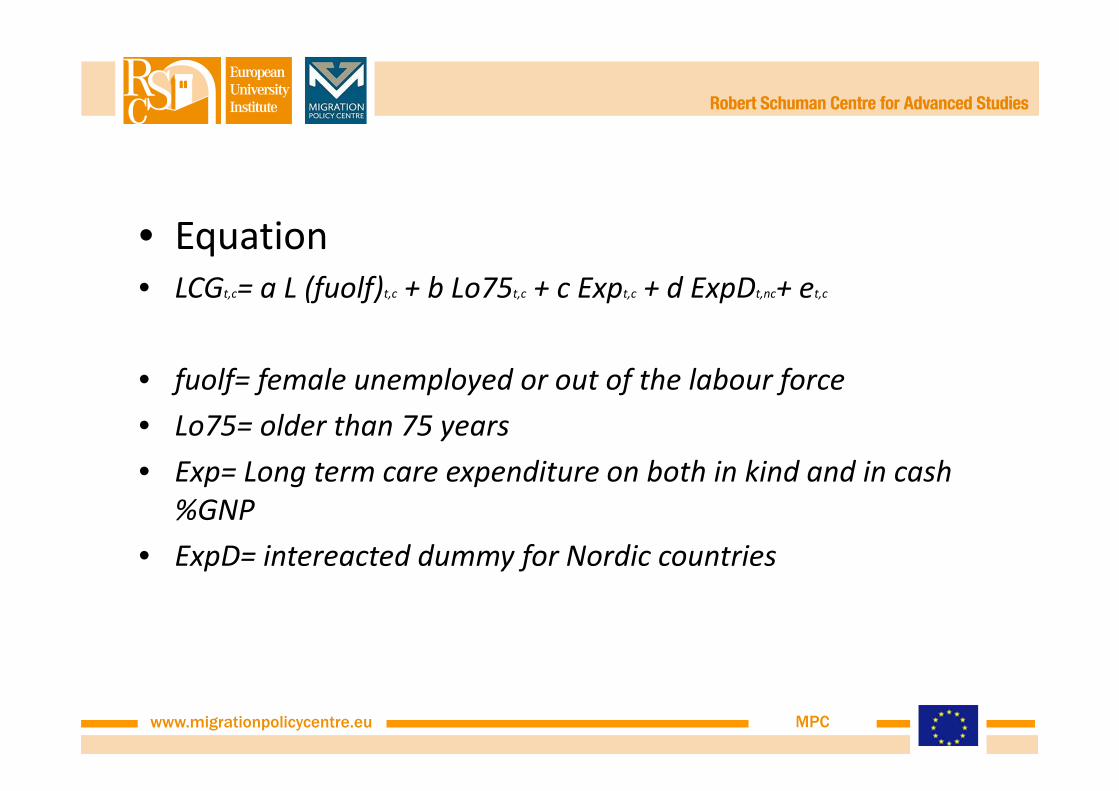
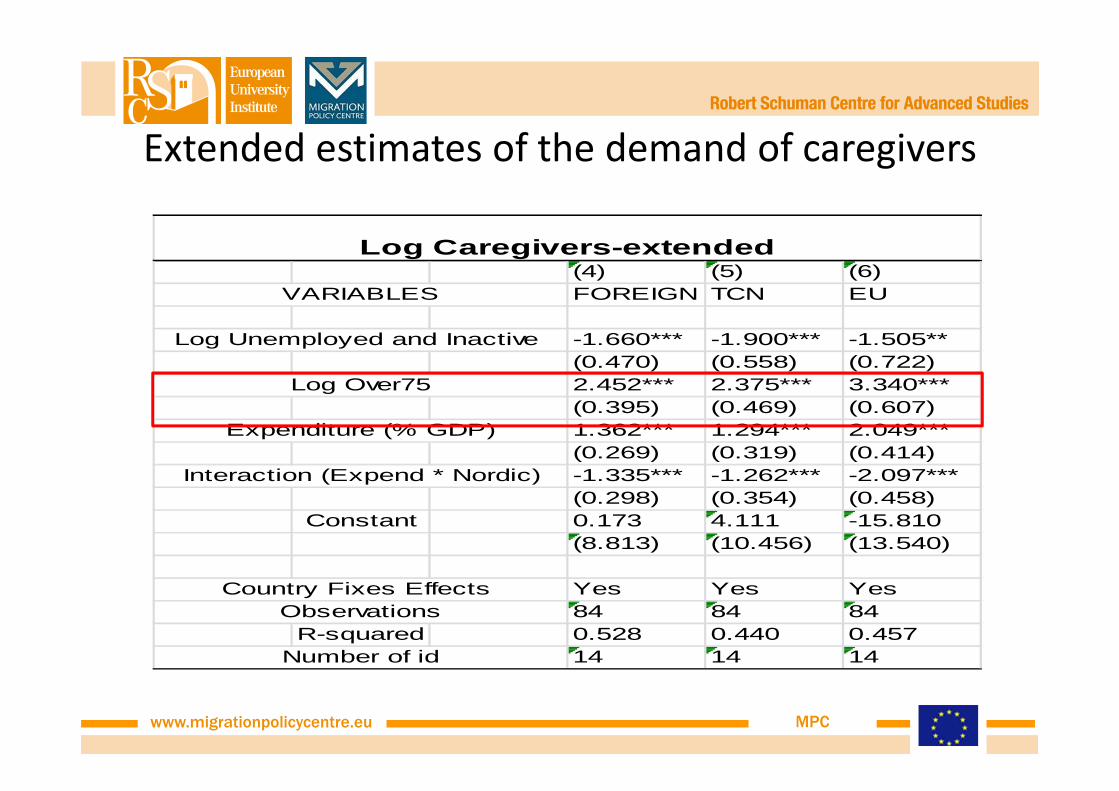
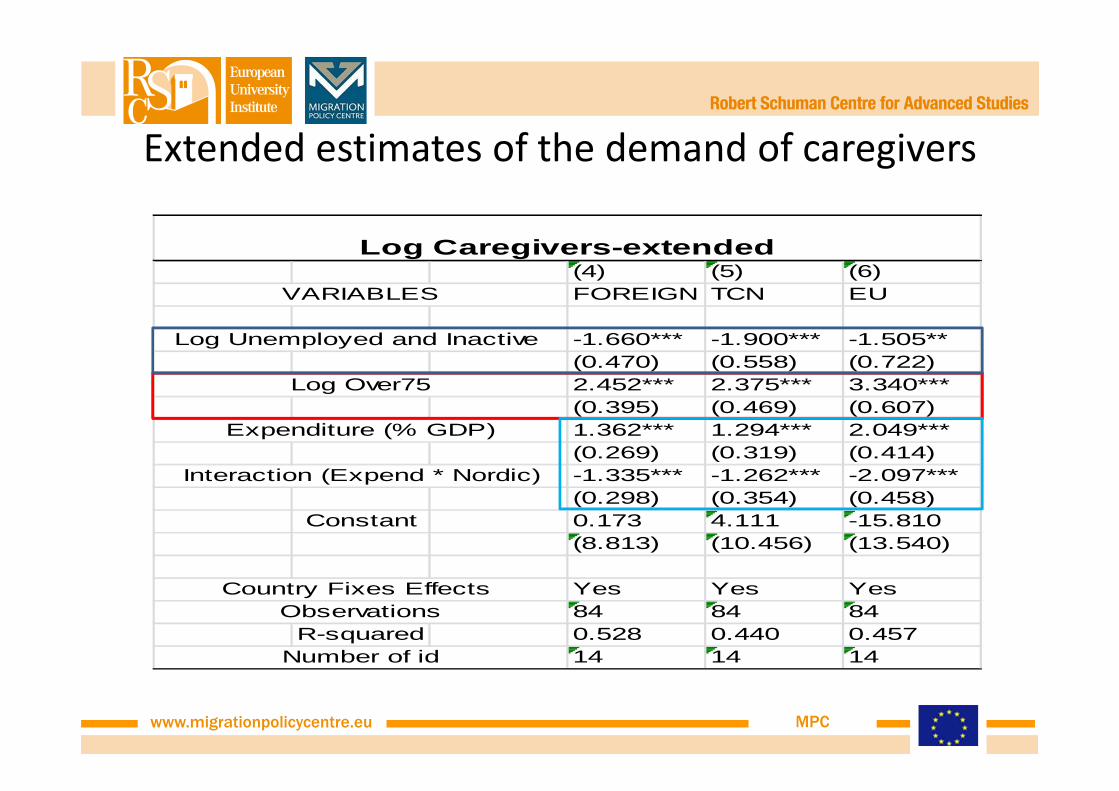
• Equation
• LCGt,c= a L (fuolf)t,c + b Lo75t,c + c Expt,c + d ExpDt,nc+ et,c
• fuolf= female unemployed or out of the labour force
• Lo75= older than 75 years
• Exp= Long term care expenditure on both in kind and in cash
%GNP
• ExpD= intereacted dummy for Nordic countries
www.migrationpolicycentre.eu MPC
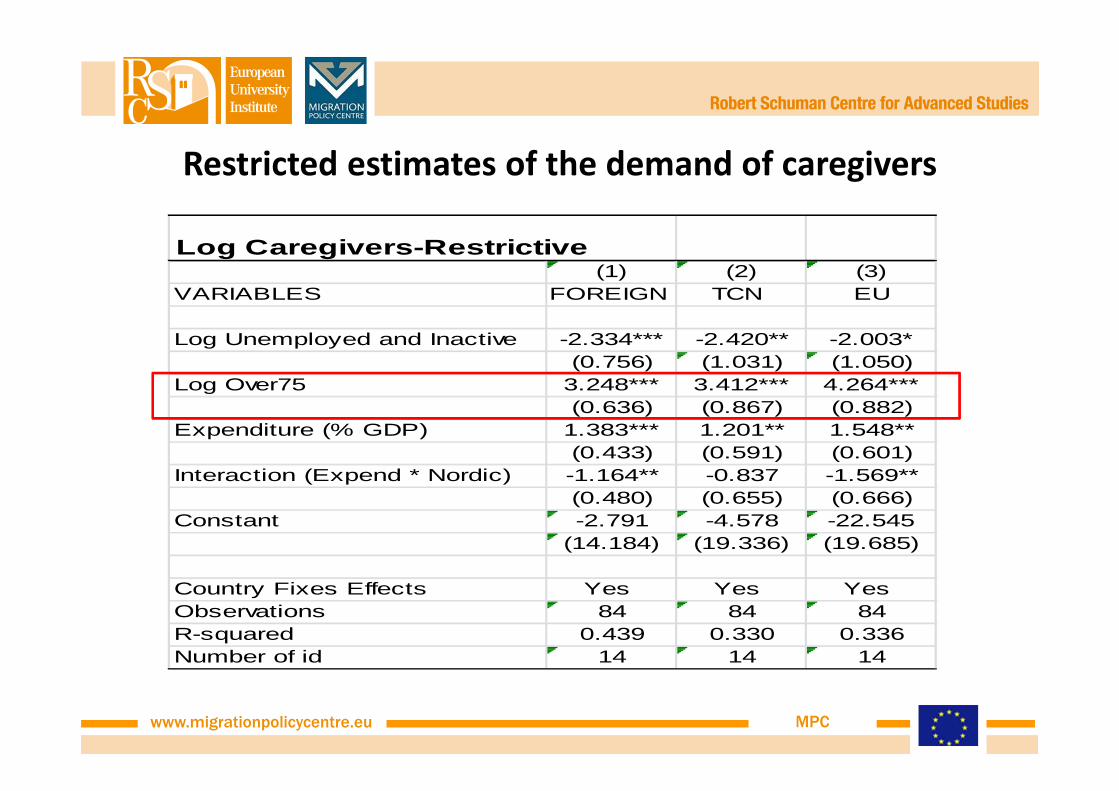
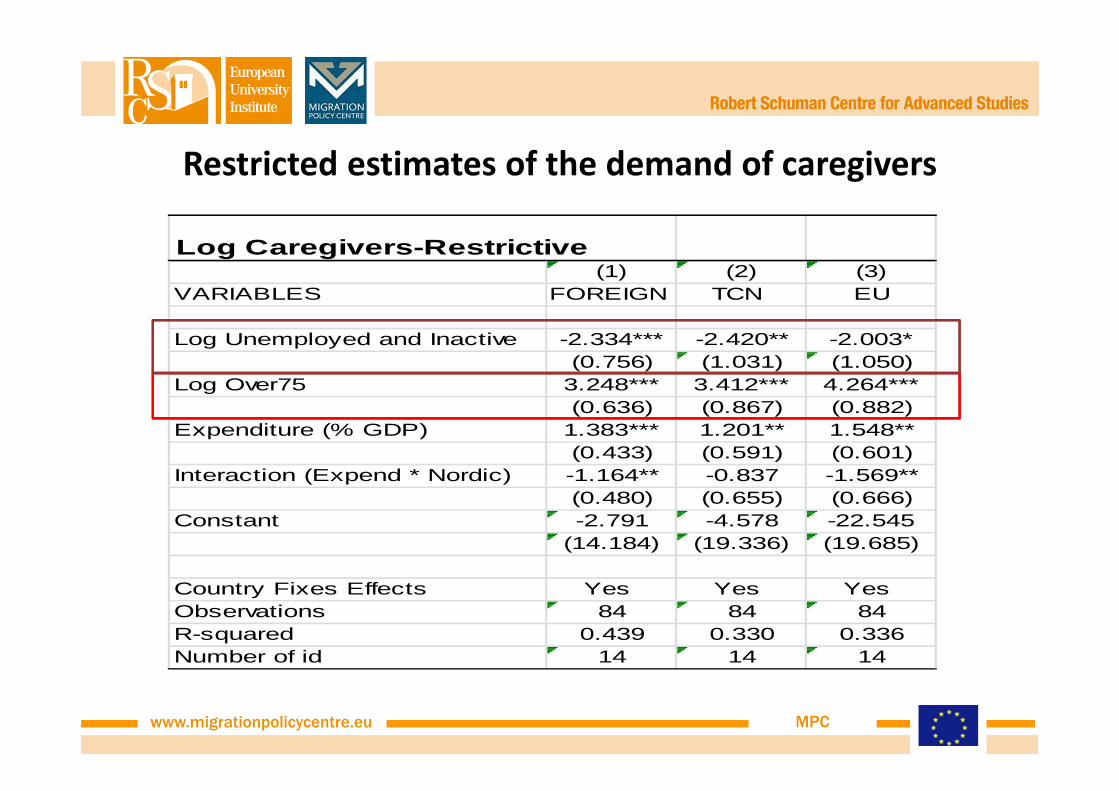
Restricted estimates of the demand of caregivers
Log Caregivers-Restrictive(1) (2) (3)
VARIABLES FOREIGN TCN EU
Log Unemployed and Inactive -2.334*** -2.420** -2.003*(0.756) (1.031) (1.050)
Log Over75 3.248*** 3.412*** 4.264***(0.636) (0.867) (0.882)
Expenditure (% GDP) 1.383*** 1.201** 1.548**(0.433) (0.591) (0.601)
Interaction (Expend * Nordic) -1.164** -0.837 -1.569**(0.480) (0.655) (0.666)
Constant -2.791 -4.578 -22.545(14.184) (19.336) (19.685)
Country Fixes Effects Yes Yes Yes Observations 84 84 84R-squared 0.439 0.330 0.336Number of id 14 14 14
www.migrationpolicycentre.eu MPC
Restricted estimates of the demand of caregivers
Log Caregivers-Restrictive(1) (2) (3)
VARIABLES FOREIGN TCN EU
Log Unemployed and Inactive -2.334*** -2.420** -2.003*(0.756) (1.031) (1.050)
Log Over75 3.248*** 3.412*** 4.264***(0.636) (0.867) (0.882)
Expenditure (% GDP) 1.383*** 1.201** 1.548**(0.433) (0.591) (0.601)
Interaction (Expend * Nordic) -1.164** -0.837 -1.569**(0.480) (0.655) (0.666)
Constant -2.791 -4.578 -22.545(14.184) (19.336) (19.685)
Country Fixes Effects Yes Yes Yes Observations 84 84 84R-squared 0.439 0.330 0.336Number of id 14 14 14
www.migrationpolicycentre.eu MPC
Extended estimates of the demand of caregivers
(4) (5) (6)VARIABLES FOREIGN TCN EU
Log Unemployed and Inactive -1.660*** -1.900*** -1.505**(0.470) (0.558) (0.722)
Log Over75 2.452*** 2.375*** 3.340***(0.395) (0.469) (0.607)
Expenditure (% GDP) 1.362*** 1.294*** 2.049***(0.269) (0.319) (0.414)
Interaction (Expend * Nordic) -1.335*** -1.262*** -2.097***(0.298) (0.354) (0.458)
Constant 0.173 4.111 -15.810(8.813) (10.456) (13.540)
Country Fixes Effects Yes Yes Yes Observations 84 84 84
R-squared 0.528 0.440 0.457Number of id 14 14 14
Log Caregivers-extended
www.migrationpolicycentre.eu MPC
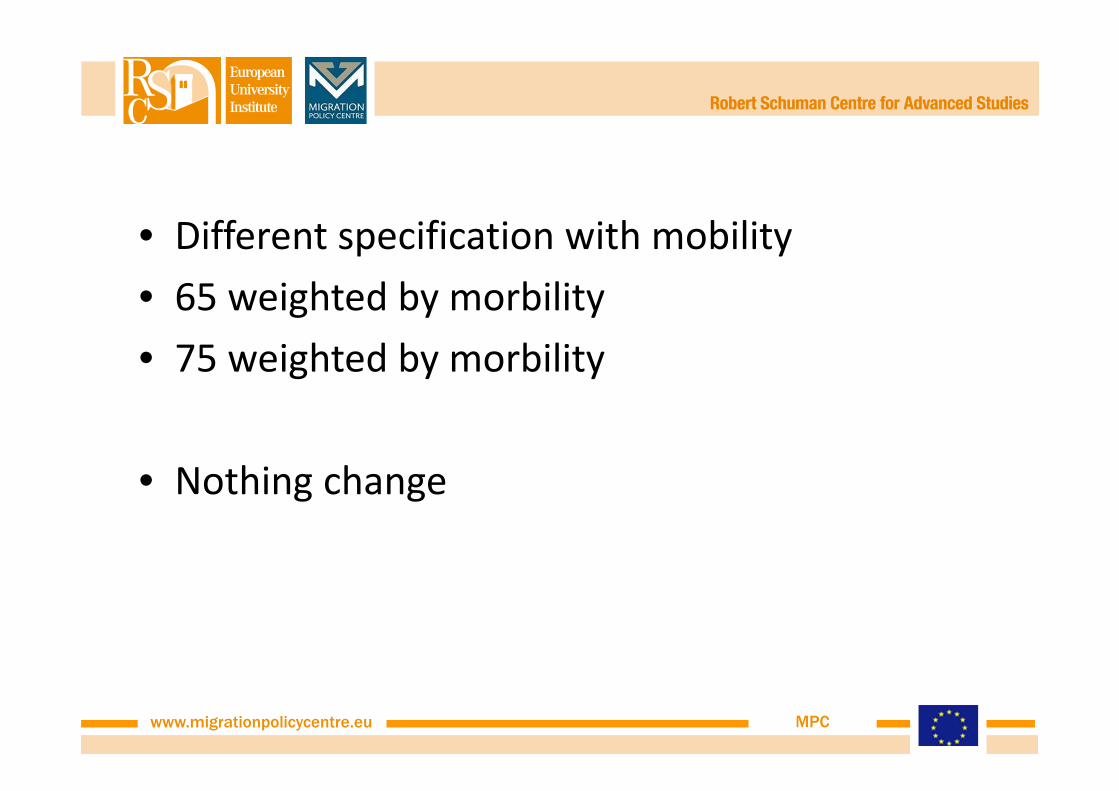
• Different specification with mobility
• 65 weighted by morbility
• 75 weighted by morbility
• Nothing change

www.migrationpolicycentre.eu MPC
Forecasts
34,711 37,329 45,479 56,485 66,465
897 1,116
1,800
2,724
3,561
2,749
3,258
4,840
6,978
8,916
0
1,000
2,000
3,000
4,000
5,000
6,000
7,000
8,000
9,000
10,000
2011 2020 2030 2040 2050
Tho
usan
ds
Restricted FOR
Extended FOR

www.migrationpolicycentre.eu MPC
Forecasts are sensitive to the female participation
• if it increases demand increases
• Forecasts are sensitive to morbility
• If morbility improuves less caregivers

www.migrationpolicycentre.eu MPC
Forecasts (000)
34,711 37,329 45,479 56,485 66,465
897 1.116
1.800
2,724
3,561
2,749 3,258
4,840
6,978
8,916
0
1,000
2,000
3,000
4,000
5,000
6,000
7,000
8,000
9,000
10,000
2011 2020 2030 2040 2050
Tho
usan
ds Restricted FOR
Extended FOR

www.migrationpolicycentre.eu MPC
• Forecasted stock but not the flows
• Circular migration larger inflows
• Reunified family members thus lower
lavour inflows