alessandro masullo * , tilo burghardt, dima damen , toby
TRANSCRIPT

sensors
Article
Person Re-ID by Fusion of Video Silhouettesand Wearable Signals for Home MonitoringApplications†
Alessandro Masullo * , Tilo Burghardt, Dima Damen , Toby Perrett and Majid Mirmehdi
Department of Computer Science, University of Bristol, Bristol BS8 1UB, UK; [email protected] (T.B.);[email protected] (D.D.); [email protected] (T.P.); [email protected] (M.M.)* Correspondence: [email protected]† This paper is an extension version of the conference paper: Masullo, A.; Burghardt, T.; Damen, D.; Perrett, T.;
Mirmehdi, M. Who Goes There? Exploiting Silhouettes and Wearable Signals for Subject Identification inMulti-Person Environments. In Proceedings of the IEEE International Conference on Computer VisionWorkshops, Seoul, Korea, 27 October–2 November 2019.
Received: 3 April 2020; Accepted: 28 April 2020; Published: 1 May 2020�����������������
Abstract: The use of visual sensors for monitoring people in their living environments is criticalin processing more accurate health measurements, but their use is undermined by the issue ofprivacy. Silhouettes, generated from RGB video, can help towards alleviating the issue of privacyto some considerable degree. However, the use of silhouettes would make it rather complex todiscriminate between different subjects, preventing a subject-tailored analysis of the data withina free-living, multi-occupancy home. This limitation can be overcome with a strategic fusion ofsensors that involves wearable accelerometer devices, which can be used in conjunction with thesilhouette video data, to match video clips to a specific patient being monitored. The proposedmethod simultaneously solves the problem of Person ReID using silhouettes and enables homemonitoring systems to employ sensor fusion techniques for data analysis. We develop a multimodaldeep-learning detection framework that maps short video clips and accelerations into a latent spacewhere the Euclidean distance can be measured to match video and acceleration streams. We train ourmethod on the SPHERE Calorie Dataset, for which we show an average area under the ROC curve of76.3% and an assignment accuracy of 77.4%. In addition, we propose a novel triplet loss for whichwe demonstrate improving performances and convergence speed.
Keywords: sensor fusion; digital health; silhouettes; accelerometer; ambient assisted living
1. Introduction
Ambient Assisted Living (AAL) is now a well-established area of research, fuelled by the continuouslyageing and longer life expectancy of the population [1]. The majority of video monitoring applicationsfor AAL make use of RGB images to provide clinically relevant measurements [2]. While thepresence of monitoring CCTV (Closed-Circuit Television) cameras is nowadays accepted in publicspaces, such as shops and city centres, due to privacy reasons, people are often reluctant to installthem in their own homes for any purpose other than security, for example, even for constanthealth monitoring [3–5]. Silhouettes constitute an alternative form of data for video monitoringin privacy-sensitive environments [6]. Due to their light weight representation, silhouettes are oftenthe preferred form of data in Internet of Things (IoT) and AAL applications [7]. In our previousworks, we demonstrated that silhouettes can be reliably employed for long-term home monitoringapplications to measure important health-related parameters, for example, measurement of calorieexpenditure [8] and the speed of transition from sitting to standing or standing to sitting (StS) [9],
Sensors 2020, 20, 2576; doi:10.3390/s20092576 www.mdpi.com/journal/sensors

Sensors 2020, 20, 2576 2 of 20
which are proxy measurements for sedentary behaviour, musculoskeletal illnesses, fall history andmany other health-related conditions. Previous work in the field also showed that silhouettes can besuccessfully employed for fall detection [10] and abnormal gait analysis [11]. The recent work fromColantonio et al. [12] highlighted some of the challenges that are still open in AAL from a ComputerVision perspective, including the assessment of reliability of these measurements for clinical purposes,the robustness of the operating conditions in real-life settings and the final user acceptance of themonitoring system, which we will address through this paper.
Under the auspices of the SPHERE project [13] (a Sensor Platform for HEalthcare in a ResidentialEnvironment), we recorded data from voluntary participants in 52 real-world homes, includingsilhouettes, body accelerations and a variety of different environmental sensors’ data. The latter areoutside the scope of this present work and not used here. The analysis of these silhouettes allowsmonitoring the health of the participants while respecting their privacy; however, silhouette-basedmeasurements are limited in that they cannot be assigned to a specific individual in the house. Due totheir anonymous and often noisy nature, silhouettes hinder the discrimination of different individuals,preventing a subject-tailored analysis of the data. This problem is of critical importance for scenariosof home monitoring, particularly in long-term observations. For example, in the HEmiSPHEREproject [14], patients undergoing hip and knee replacement spend their rehabilitation period at homewhile being monitored with the SPHERE sensors. It is essential to be able to automatically discriminatebetween the silhouettes of the patient to be monitored and the rest of the household or occasionalguests such that clinicians can investigate the recovery trends of their patient only, while also respectingthe privacy of all those within view.
The solution we propose is to take advantage of wrist-worn accelerometers, for which themeasurements can be unequivocally assigned to the person wearing it. Matching the motion from thevideo silhouettes with the motion from the accelerometers enables us to assign each video measurementto a specific individual. Thanks to this approach, not only can we reliably monitor each participant inthe house but we can also enable a sensor fusion approach to improve the quality of the silhouette-basedmeasurements, overcoming the limitations of both wearables and videos. While matching video andacceleration streams has already been attempted in the past, previous works only focused on the useof RGB images and long observation times (i.e., >1 min). Moreover, existing methodologies require allsubjects appearing in the video to be carrying an accelerometer, which is not suitable for real worldmonitoring applications. Patients may have guests, and they cannot be required to wear accelerometersat all times.
In this paper, we extend our previous work [15] on the Video-Acceleration Matching problemthat sets new state-of-the-art results in privacy-sensitive Home Monitoring applications. We considerreal-life monitoring scenarios and we tackle the rather complex case where only the monitoredparticipants wear an accelerometer whilst being visually recorded amongst other persons, as Figure 1illustrates. Moreover, our pioneering solution to the Video-Acceleration matching problem canoperate on even short (≈3 s) video snippets, so that quick and clinically relevant movements(e.g., Sit-to-Stand [9]) can be associated to a specific individual in spite of the length of the event.We propose a novel multimodal deep-learning detection framework that maps video silhouettes andaccelerations into a latent space where the Euclidean distance can be measured to match video andacceleration streams. Further, we propose a novel loss function that may be used as an alternativeto triplet loss for dual stream networks. We present results for video-acceleration matching on thechallenging SPHERE-Calorie dataset [16,17].

Sensors 2020, 20, 2576 3 of 20
Subject A
Subject B
Guest
Subject A
Subject B
? ?
Accelerometers
Video
? ?
?Wearables
Camera
Figure 1. Description of a typical real-life scenario for home monitoring. Two subjects (A and B) arewearing an accelerometer, but only one of them appears within camera view, together with a guest.Our aim is to understand which of the two monitored targets appears in the video silhouette frames.
2. Related Work
The main objective of our work is to identify people from a video stream of silhouettes. We groupthe related literature for re-identification into three broad categories: methods that operate on apersons appearance in single images, methods that utilise videos, and methods that exploit the fusionof two different modalities (i.e., video-acceleration matching). We also review some of the worksrelated to Audio-Video Synchronisation, because of the very close similarity of this problem with theVideo-Acceleration Matching.
2.1. ReID from Images
Appearance based—Identifying people from their silhouettes can be approached as are-identification (ReID) problem [18–20]. The vast majority of the literature on person ReID makesuse of RGB images, as detailed in the review from Bedagkar-Gala et al. [21] and the more recentdeep-learning review from Wu et al. [22]. Deep-learning algorithms on RGB images constitute thestate-of-the-art in person ReID; however, as addressed in [22], the majority of them are mainly focusedon short-term scenarios. Person ReID for home monitoring includes very demanding challenges,such as strong change in appearance (i.e., clothes), appearance impaired scenarios, etc., that need to bespecifically addressed. While some recent works have tried to tackle these issues [23,24], the use of RGBimages remains unsuitable for home monitoring due to ethical reasons [5]. In fact, while ReID featurescould potentially be computed with RGB images before they are discarded, the use of deep-learningalgorithms requires a large computational power, which is often not available on the small IoT devicesused for monitoring. Outsourcing this computation to external servers exposes serious dangers for theprivacy of the monitored subjects and strict ethical restrictions prevent such a solution.
Motion based— To deal with appearance impaired scenarios and solve the problem of long-termReID, several works make use of motion to re-identify people, in particular (temporal) gait [25].Features like the transitional characteristic of gait [26], motion patterns on tracklets [27] and deeplearning motion descriptors [28] have been successfully employed to re-identify people while walking,either using silhouettes or RGB images. The hypothesis behind these works is that every person walksin a different way, exhibiting patterns that can be exploited to identify them. While this hypothesis isvalid for ReID of pedestrians, it does not apply to indoor scenarios, where smaller environmentsdo not allow for full development of gait sequences. Moreover, as we showed in [9], patientsundergoing physically-impairing surgery will show drastic changes in their mobility. Such changescompletely violate the main hypothesis of motion-based ReID algorithms, rendering them inapplicableto long-term clinical monitoring.
Sensors 2020, 20, 2576 4 of 20
2.2. Audio-Video Synchronisation
The Audio-Video Synchronisation task carries similar challenges to the Video-AccelerationMatching problem, and many works can be found on this topic, such as [29–31]. In particular,Active Speaker Detection is the problem of identifying which of the people in a video an utterancecan be attributed to at a given time, and correspondingly, the ReID from silhouettes domain requiresto establish which accelerometer can be attributed to which person. Chung et al. [32] proposed atwo-stream architecture that learns a joint embedding between the sound and the motion of the lipsfrom a video. The network is trained using sequences of frames for the video and Mel-frequencycepstral coefficients (MFCC) for the corresponding audio. Synchronisation between audio and videowas also used by Korbar et al. [33] as a form of self-supervised training, exploited to learn usefulfeatures for secondary tasks, like classification of videos and sounds.
2.3. Matching Video and Acceleration
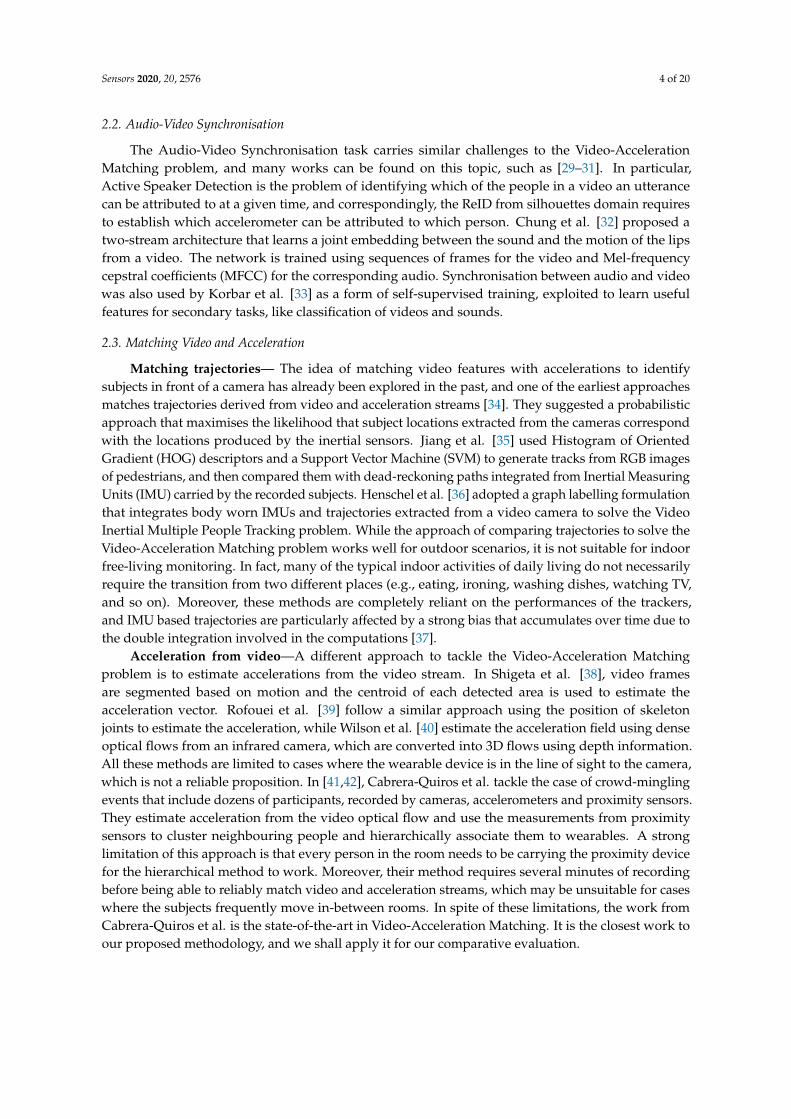
Matching trajectories— The idea of matching video features with accelerations to identifysubjects in front of a camera has already been explored in the past, and one of the earliest approachesmatches trajectories derived from video and acceleration streams [34]. They suggested a probabilisticapproach that maximises the likelihood that subject locations extracted from the cameras correspondwith the locations produced by the inertial sensors. Jiang et al. [35] used Histogram of OrientedGradient (HOG) descriptors and a Support Vector Machine (SVM) to generate tracks from RGB imagesof pedestrians, and then compared them with dead-reckoning paths integrated from Inertial MeasuringUnits (IMU) carried by the recorded subjects. Henschel et al. [36] adopted a graph labelling formulationthat integrates body worn IMUs and trajectories extracted from a video camera to solve the VideoInertial Multiple People Tracking problem. While the approach of comparing trajectories to solve theVideo-Acceleration Matching problem works well for outdoor scenarios, it is not suitable for indoorfree-living monitoring. In fact, many of the typical indoor activities of daily living do not necessarilyrequire the transition from two different places (e.g., eating, ironing, washing dishes, watching TV,and so on). Moreover, these methods are completely reliant on the performances of the trackers,and IMU based trajectories are particularly affected by a strong bias that accumulates over time due tothe double integration involved in the computations [37].
Acceleration from video—A different approach to tackle the Video-Acceleration Matchingproblem is to estimate accelerations from the video stream. In Shigeta et al. [38], video framesare segmented based on motion and the centroid of each detected area is used to estimate theacceleration vector. Rofouei et al. [39] follow a similar approach using the position of skeletonjoints to estimate the acceleration, while Wilson et al. [40] estimate the acceleration field using denseoptical flows from an infrared camera, which are converted into 3D flows using depth information.All these methods are limited to cases where the wearable device is in the line of sight to the camera,which is not a reliable proposition. In [41,42], Cabrera-Quiros et al. tackle the case of crowd-minglingevents that include dozens of participants, recorded by cameras, accelerometers and proximity sensors.They estimate acceleration from the video optical flow and use the measurements from proximitysensors to cluster neighbouring people and hierarchically associate them to wearables. A stronglimitation of this approach is that every person in the room needs to be carrying the proximity devicefor the hierarchical method to work. Moreover, their method requires several minutes of recordingbefore being able to reliably match video and acceleration streams, which may be unsuitable for caseswhere the subjects frequently move in-between rooms. In spite of these limitations, the work fromCabrera-Quiros et al. is the state-of-the-art in Video-Acceleration Matching. It is the closest work toour proposed methodology, and we shall apply it for our comparative evaluation.

Sensors 2020, 20, 2576 5 of 20
3. Materials and Methods
Before matching video sequences with accelerations, the video stream must be processed to detectdifferent subjects appearing in the frame. In our work, we use the person detector and tracker fromOpenNI [43], which provides bounding boxes and tracking information. Similarly to the works inActive Speaker Detection, we developed our framework to match short video/acceleration clips (≈3 s).The reason behind this choice is that we are interested in identifying subjects while performing short,clinically relevant movements. Shorter clips also helps to minimise possible errors of the trackers, forexample, exchanging bounding boxes of different subjects.
3.1. Video-Acceleration Matching
A typical installation of a real-life home in the SPHERE project [6] provides for a camera ineach communal room and corridor, and an accelerometer for each participant. Guests can visit themonitored house at any time but will not carry an accelerometer. All the video and accelerometersensors are synchronised via their time-stamps.
Let us consider a set of K silhouette video clips V = {v1, ..., vK} portraying one person at atime (i.e., the sequence of frames cropped around the bounding boxes) while wearing the wristband.Time-synchronised acceleration samples from the wristband are also recorded and grouped intoconsecutive sequences Ap = {a1, ..., aK}. The accelerations Ap constitute a positive match for thevideos V by construction. We can define a set of non-matching accelerations An by selecting for eachVi the acceleration from a different monitored subject (details on different types of negatives will bediscussed in Section 3.3). The objective of the video-acceleration matching is to find two optimalencoding functions f (·) and g(·), so that the Euclidean distance d is minimised for d{ f (V), g(Ap)} andmaximised for d{ f (V), g(An)}. The functions f and g are two CNNs that take as input of the videoclip and the raw accelerations respectively, and produce for output feature vectors. During testing,the matching between a generic video stream and a specific accelerometer can be verified by comparingthe Euclidean distance of the two encoded streams with a threshold, the optimal value of which can bederived from the Receiver Operating Characteristic (ROC) curve described in Section 4.1.
3.2. Loss Function
One potential way to address the problem of video-acceleration matching is to reformulate it as aclassification problem. Given the videos V and the accelerations Ap and An, we can build the pairs(V, Ap; 1) and (V, An; 0) for the classes “matching” and “non-matching”. With this setting, standardcross-entropy can be used to train the video and acceleration encoders f (·) and g(·). However, it hasbeen shown in [33] that for audio and video matching, the binary classification task constructed in thisway is difficult to train and we therefore discarded it.
A valid alternative to the cross-entropy for binary classification is the triplet loss, that was firstproposed to train Siamese Networks for face recognition [44]. A triplet is defined as a set of threeelements comprising an anchor, a positive match and a negative match. Here, we use the video asanchor, and a matching and non-matching sequence of accelerations for the positive and the negativematch respectively,
(anchor, positive, negative) ≡(V, Ap, An
). (1)
With this definition of triplet, the loss is defined as:
Ltriplet = max{∣∣ f (V)− g(Ap)
∣∣2 − | f (V)− g(An)|2 + α, 0}
(2)
where α is a constant, empirically set to 0.2. The behaviour of the triplet loss is described in Figure 2a:by minimising the quantity described in Equation (2), the pairs of (V, Ap) are pulled together, while(V, An) are pushed apart, to a distance greater than α.

Sensors 2020, 20, 2576 6 of 20
In addition to the standard triplet loss, we also experimented using alternative formulations thattake advantage of the triplets. One of the problems we experienced with the standard triplet lossis that it does not guarantee that a single threshold can be used to discriminate between matchingand not-matching pairs. In fact, the objective of the triplet loss is to separate the (V, Ap) pair fromthe (V, An) pair, no matter what the intra-pair distances are. For example, given two triplets T1 ≡(V1, A1
p, A1n) and T2 ≡ (V2, A2
p, A2n) as described in Figure 2b, optimising for the standard triplet loss
ensures that:d{ f (V1), g(A1
n)} − d{ f (V1), g(A1p)} > α (3)
andd{ f (V2), g(A2
n)} − d{ f (V2), g(A2p)} > α. (4)
However, it is entirely possible that the distances are such that d{ f (V2), g(A2p)} �
d{ f (V1), g(A1n)}. As it will be shown later, this behaviour is very common for some training strategies
and renders the model inoperative, since no single threshold can be used to discriminate betweenmatching and non-matching sequences.
The objective of the training must therefore be such that the model can be used with a singleuniversal threshold. The limitation of the standard triplet loss is that it becomes identically zeroonce the distances in Equation (2) are greater than α. To overcome this limitation, we propose anew loss function, Reciprocal Triplet Loss (LRTL), which does not involve any distance margin α andcontinuously optimises the distances between anchor, positive and negative match:
LRTL =∣∣ f (V)− g(Ap)
∣∣2 + 1
| f (V)− g(An)|2(5)
As it will be shown in the experiments, the use of the RTL function helps in improving theperformance of our model and enables it to be operable more robustly with a single universal threshold.
V
Ap
An
(a)
V1
Ap
An
α 1
1
V2
Ap
An
α 2
2
(b)
Figure 2. (a) Example of triplet constituted by an anchor video of silhouettes and two accelerationsequences for positive and negative matches. (b) Possible problem occurring while training with thestandard triplet loss and a fixed margin α.
3.3. Negative Samples
When the standard triplet loss is used to train a deep learning model, the samples constitutingeach triplet must be cleverly selected in a way that they can actively contribute to improving the model.In fact, if the distance between the video anchor and the accelerations from Equation (2) is greaterthan α, the triplet will have zero loss and it will not contribute to the training. In the original paper onthe triplet loss [44], hard mining of triplets was considered as a crucial step to deal with this problem.In our case, the triplets are constrained by the problem of matching videos with accelerometers, and theanchor-positive pair must be a video clip with the matching acceleration sequence. However, the choiceof the non-matching acceleration can vary substantially and it has a strong effect on the outcome of thetraining process.

Sensors 2020, 20, 2576 7 of 20
Let us consider an example where a group of N subjects (Sub1, ..., SubN) is performing a set ofactivities (standing, walking, cleaning, ...). Given an anchor video portraying a subject doing a specificactivity, as depicted in Figure 3, a non-matching acceleration can be selected from a different subjectdoing a different activity (DSDA) or doing the same activity (DSSA), or it could be from the samesubject doing the same activity (SSSA) or a different activity (SSDA). The possible combinations ofnegative samples are summarised in Table 1 for clarity.
Table 1. Description of possible negative samples for the triplet learning.
Same Activity (SA) Different Activity (DA) Overlapping
Same Subject (SS) SSSA SSDA OVLPDifferent Subject (DS) DSSA DSDA
The objective of this work is to train a model that learns the matching between video andacceleration streams. However, if negative samples are only drawn from a different subject doing adifferent activity (DSDA), the video-acceleration matching problem degenerates into a simple activityor identity classifier. Let us consider, for example, a triplet where the anchor is the video of Sub1 while“walking”. The positive match will be the acceleration of Sub1 while “walking”, whereas a DSDAnegative could be Sub2 doing “cleaning”, as depicted in Figure 3:(
V, Ap, An)≡ ({Sub 1; Walking} , {Sub 1; Walking} , {Sub 2; Cleaning}) . (6)
Since the non-matching acceleration An will always be from a different subject doing a differentactivity, the neural network will try to learn either the identity of the subjects or the activity beingperformed through the encoding functions f (·) and g(·). Equivalently, training only with DSSAnegatives reduces to an activity-agnostic identity classifier, while training with SSDA negatives leadsthe classifier to only learn activities. A model trained exclusively on DSDA, DSSA or SSDA negativeswill not learn anything about the actual correlation between the video and the accelerations, but itwill merely compare the action or identity predicted from the video with the one predicted fromthe accelerations. This type of model is therefore expected to fail when tested on unseen subjectsor activities.
To overcome this limitation and truly associate visual and acceleration features in the temporaldomain, a non-matching acceleration can be selected from the same subject while performing thesame activity (SSSA). We call this type of negative “hard-negative” (in contrast to the “easy-negatives”DSDA, DSSA and SSDA), since a simple activity or subject classifier is unable to solve this problemand it requires the network to encode information about the actual correlation between video andaccelerations. Similarly to Korbar et al. [33], we also consider a further type of negative sampleconstituted by an acceleration that is out-of-synchronisation with the video but it is still overlappingwith it, as presented in Figure 3. The out-of-synchronisation negative will be very similar in shape tothe synchronised positive match; we call this type of negative overlapping (OVLP), and we refer tois as “very hard-negative”. It is important to clarify that amongst all the negative types tested, thosefrom the “Same Subject” or “Overlapping” category are only used for training purposes, since thesame subject cannot really appear in multiple locations of the same video clip.
In this work, we tested a variety of training strategies that include different combinations of easy,hard and very-hard negatives, as described in Table 2. From an inference point of view, the samesubject cannot appear in multiple locations at the same time, therefore the validation data only includesnegative types of DSDA and DSSA, while the SSSA and SSDA negative types are only used for training.
The data used in this study (described in detail in Section 3.7) was split into training and testingbased on subject identities, so that the subjects used for testing were never seen during training.Regarding the choice negative samples, a 50% balance between DSDA and DSSA was chosen and waskept constant across all the experiments.

Sensors 2020, 20, 2576 8 of 20
Video Subject 1
Acceler. Subject 1
Video Subject 2
Acceler. Subject 2
SSSA
OVLP
Anchor
PositiveMatch
DSDA
SSDA
DSSA
Activity Standing Walking Cleaning
Figure 3. Description of the different possibilities for the negative samples in the triplet. The anchor isthe video clip marked in orange, while the positive match is marked in green. A single example of eachdifferent negative sample is marked in red.
Table 2. Description of training strategies.
Easy Hard Very Hard
DSDA DSSA SSDA SSSA OVLP
Easy negatives only Easy 50% 50%Mixed easy/hard negatives Easy/Hard 25% 25% 50%
Hard negatives only Hard 100%Mixed hard/very-hard negatives Hard/VeryH 50% 50%
Very-hard negatives only VeryH 100%Mixed easy, hard, very-hard negatives All 11% 11% 11% 33% 33%
3.4. Data Preprocessing
Silhouettes from each subject detected in the scene are cropped around the bounding boxes andresized to a constant value of 100 pixels (keeping the original aspect-ratio). The video sequence ofeach subject is then truncated into short clips of 100 frames (≈3 s) each. In order to avoid any loss ofinformation from the cropping process, bounding box coordinates are also fed into our video encodernetwork together with the silhouettes. The logic behind this is that the human body can be seen as adeformable body that can either translate or change its shape, and bounding boxes will better capturelarge rigid displacements (e.g., walking) while the cropped silhouettes will address smaller changeswithin the body shape (e.g., wiping a surface).
The accelerometer data comprises a 3-channel vector, i.e., the IMU measurements in x, y and z.Typically, machine learning algorithms for audio analysis make use of some transformation of the audiosignal in the frequency domain, for example, using Perceptual Linear Predictive coefficients (PLPs) [45]or variations of the MFCC [32,46,47]. However, since the accelerometer signal is sampled at a frequencythat is several orders of magnitude lower than audio (typically around 50 Hz for IMU [48] and 32-48kHz for audio [49]), we feed the raw amplitude of the accelerometers into the network, leveragedby our previous work [8] where we observed that the direct convolution of acceleration amplitudesyielded satisfactory results. Due to the variability of the sampling rate of the accelerometers used inour experiments, the only pre-processing we perform on the acceleration stream is sub-sampling ofthe data to match the video frame rate (while sub-sampling in our experiment was dictated by theminimum sampling rate of the accelerometer devices, our method does not require the video samplingrate to match the accelerometer and it can be applied to mismatching rates by simply adjusting the

Sensors 2020, 20, 2576 9 of 20
input size of the network). Conceptually, this leaves data transforms to be a responsibility of thenetwork itself.
3.5. Network Architecture
The most important element of our algorithm is the function of the two encoders f (·) and g(·),represented by different CNNs, that process the video and acceleration streams independently toproduce the feature vectors. In particular, the video encoder f (·) is the sum of the silhouettes encoderfsil(·) and the bounding box encoder fbb(·). Our encoders fsil(·), fbb(·) and g(·) then constitute athree-stream architecture that is able to take video and acceleration data as input and produce thedistance between the two in the latent space as output.
We implemented 3 different architectures, as illustrated in Figure 4, and tested their performancesunder different conditions to find the best configuration.
Fully Convolutional (fully-conv)— The idea behind deploying this architecture is to reducethe input size using a sequence of convolution and max-pooling operations while simultaneouslyincreasing the number of features being produced. For the video branch only, both convolution andmax-pooling operations are performed with a 3D kernel to extract spatio-temporal information, while1D kernels are used for the branches processing bounding boxes and accelerations.
LSTM with temporal pooling (LSTM+TP)— This architecture is similar to the fully convolutionalnetwork, but it uses fewer max-pooling layers in time, so that a temporal feature vector is produced bythe convolutional stack. This temporal feature vector is fed into a Long Short-Term Memory (LSTM)layer that produces the final embedding.
LSTM without temporal pooling (LSTM)— Inspired by [45], we developed an architecture thatdoes not involve any temporal pooling at all. The expectation here is that fine temporal information isimportant to learn the correlations between video and acceleration streams and helps to provide betterresults with the matching task. As in the previous case, the final temporal feature vector is fed into anLSTM layer to produce the final embedding vector.
•(100,100,100)
Input
•(98,98,98,16)
Convolution (16), Relu
•(49,49,49,16)
Space-Time Max Pool
•(47,47,47,32)
Convolution (32), Relu
•(23,23,23,32)
Space-Time Max Pool
•(21,21,21,64)
Convolution (64), Relu
•(19,19,19,64)
Convolution (64), Relu
•(9,9,9,64)
Space-Time Max Pool
•(7,7,7,128)
Convolution (128), Relu
•(3,3,3,128)
Space-Time Max Pool
•(1,1,1,128)
Convolution (128), Relu
•(128)
Reshape, Tanh
•(100,100,100,1)
Input
•(100,100,100,8)
Convolution (8), Relu
•(50,50,50,8)
Space-Time Max Pool
•(50,50,50,16)
Convolution (16), Relu
•(25,25,50,16)
Space Max Pool
•(25,25,50,32)
Convolution (32), Relu
•(13,13,25,32)
Space-Time Max Pool
•(13,13,25,64)
Convolution (64), Relu
•(7,7,25,64)
Space Max Pool
•(7,7,25,128)
Convolution (128), Relu
•(4,4,13,128)
Space-Time Max Pool
•(13, 2048)
Permute, Reshape
•(128)
LSTM (128)
•(100,100,100,1)
Input
•(100,100,100,8)
Convolution (8), Relu
•(50,50,100,8)
Space Max Pool
•(50,50,100,16)
Convolution (16), Relu
•(25,25,100,16)
Space Max Pool
•(25,25,100,32)
Convolution (32), Relu
•(13,13,100,32)
Space Max Pool
•(13,13,100,64)
Convolution (64), Relu
•(7,7,100,64)
Space Max Pool
•(7,7,100,128)
Convolution (128), Relu
•(4,4,100,128)
Space Max Pool
•(100, 2048)
Permute, Reshape
•(128)
LSTM (128)
fully-conv LSTM+TP LSTM
Figure 4. Architecture of the video branch fsil(·) for the three networks tested in this work.The other branches fbb(·) and g(·) present the same architecture with 3D operators replaced bythe 1D counterpart.

Sensors 2020, 20, 2576 10 of 20
All the architectures tested used a kernel size of 3, spatial dropout after each convolutional layerand activation ReLu. Only the fully-conv architecture uses a final activation using tanh after the lastconvolution, while the remaining networks use the standard LSTM internal activation functions.
3.6. Baseline Method
In order to show the advantages of our method, we implemented some algorithms from theliterature to use for baseline comparison. The first work is the state-of-the-art method for matchingvideo and wearable acceleration streams by Cabrera-Quiros et al. [41], where they estimate accelerationdata from the video stream using dense optical flow and then compare it with the actual accelerationstream. The wearable devices adopted in their experiment also included an embedded proximitysensor that they used to cluster neighbouring devices. Since the target of our study is matching videoand acceleration streams without any further sensor input, we implemented their algorithm withoutthe hierarchical approach for the Hungarian method.
In addition to Cabrera-Quiros et al., we also implemented a method inspired by Shigeta et al. [38].In their work, accelerations are estimated using the centroid of each bounding box detected in thevideo stream and are compared with a low-pass filtered version of the acceleration stream. Whileimplementing this work, our experiments showed that better results were achieved using a high-passfiltered version of the acceleration. Moreover, Shigeta et al. use normalised cross-correlation to comparethe video and accelerometer signal because their target is streams that are temporally not synchronised.Since we are dealing with a case where the video and acceleration streams are always synchronised,we compared the signals using Euclidean distance, as per our work.
3.7. Dataset
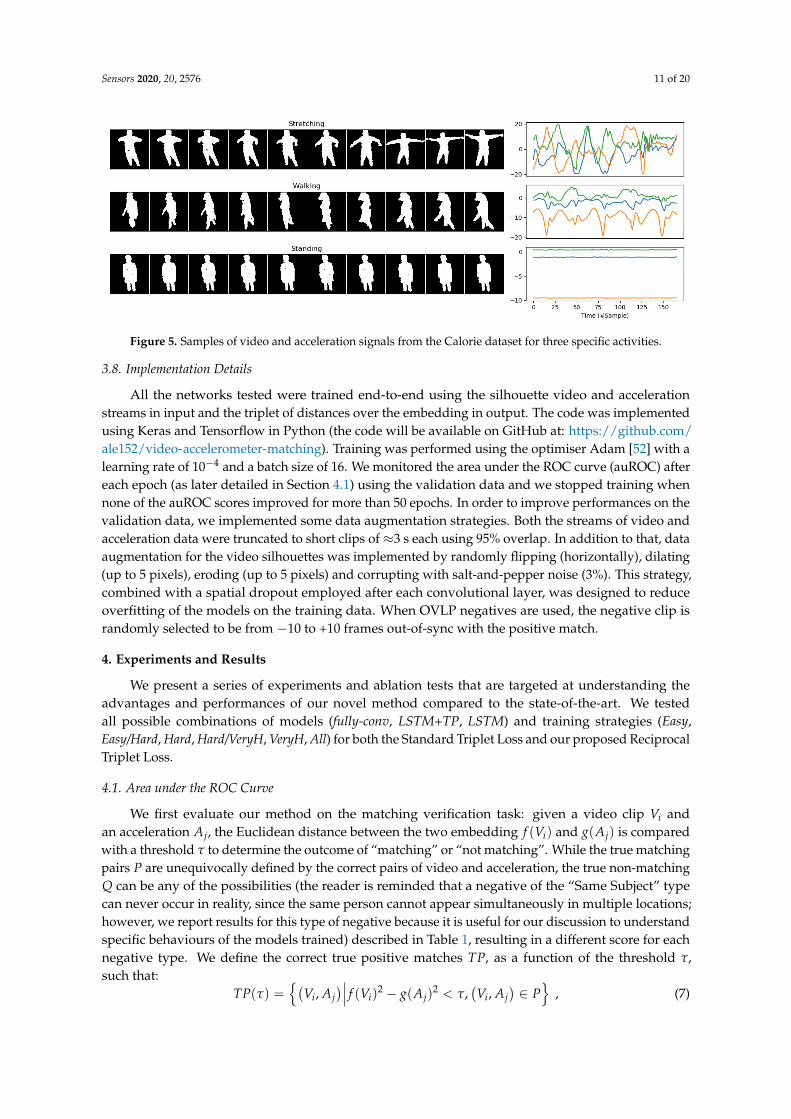
Our dataset is a modified version of the SPHERE-Calorie dataset [16], which includes RGB-Dimages, bounding boxes, accelerations and calorie expenditure measures obtained from a Calorimeter,from 10 different individuals doing a set of 11 activities in two different sessions. In this work,we discarded the calorie data and converted the RGB-D images into silhouettes. Silhouettes weregenerated by processing the RGB images with OpenPose [50] to extract the skeleton joints for eachframe of the dataset and then running GrabCut on the depth images using a mask initialised withdetected skeletons. Samples for the silhouettes and accelerations in the dataset are shown in Figure 5.The dataset includes 11 different activities, from which we kept actions that involve movement(i.e., walking, wiping a surface, vacuuming, sweeping, exercising, stretching, cleaning). The datasetincludes more than 2.5 million individual silhouettes, which were used to generate ≈50,000 video clips(and matching acceleration sequences). To the best of the Authors’ knowledge, the SPHERE-Caloriedataset is the only large dataset including RGB-D and acceleration data from wearable devices that issuitable for the Video-Acceleration Matching problem using silhouettes (while the Authors are awareof the existence of the MatchNMingle dataset [51], the combination of high view angle (top view) andlow focal lens used to record the RGB data make it very difficult to generate silhouettes).
The data from the SPHERE-Calorie dataset was recorded one subject at a time, which enabled usto automatically pair the correct matches between videos and wearables. To simulate the presenceof multiple people in each room, we followed the widely adopted strategy of virtual streams [34,41]whereby the video and acceleration streams were split into smaller intervals and treated as if they wereoccurring at the same time. While this approach might be limiting in that subjects never interact witheach other, it allows us to push the number of subjects present in a frame beyond the actual capacityof a room, assessing the limits of our method. The split between training and testing was performedbased on the subject identities: subjects 1 to 7 for training the algorithm and subjects 8 to 10 for testing.This split ensured that the network could not exploit any visual appearance cues to identify peopleand forced it to learn the actual correlation between video and acceleration streams.
Sensors 2020, 20, 2576 11 of 20
Figure 5. Samples of video and acceleration signals from the Calorie dataset for three specific activities.
3.8. Implementation Details
All the networks tested were trained end-to-end using the silhouette video and accelerationstreams in input and the triplet of distances over the embedding in output. The code was implementedusing Keras and Tensorflow in Python (the code will be available on GitHub at: https://github.com/ale152/video-accelerometer-matching). Training was performed using the optimiser Adam [52] with alearning rate of 10−4 and a batch size of 16. We monitored the area under the ROC curve (auROC) aftereach epoch (as later detailed in Section 4.1) using the validation data and we stopped training whennone of the auROC scores improved for more than 50 epochs. In order to improve performances on thevalidation data, we implemented some data augmentation strategies. Both the streams of video andacceleration data were truncated to short clips of ≈3 s each using 95% overlap. In addition to that, dataaugmentation for the video silhouettes was implemented by randomly flipping (horizontally), dilating(up to 5 pixels), eroding (up to 5 pixels) and corrupting with salt-and-pepper noise (3%). This strategy,combined with a spatial dropout employed after each convolutional layer, was designed to reduceoverfitting of the models on the training data. When OVLP negatives are used, the negative clip israndomly selected to be from −10 to +10 frames out-of-sync with the positive match.
4. Experiments and Results
We present a series of experiments and ablation tests that are targeted at understanding theadvantages and performances of our novel method compared to the state-of-the-art. We testedall possible combinations of models (fully-conv, LSTM+TP, LSTM) and training strategies (Easy,Easy/Hard, Hard, Hard/VeryH, VeryH, All) for both the Standard Triplet Loss and our proposed ReciprocalTriplet Loss.
4.1. Area under the ROC Curve
We first evaluate our method on the matching verification task: given a video clip Vi andan acceleration Aj, the Euclidean distance between the two embedding f (Vi) and g(Aj) is comparedwith a threshold τ to determine the outcome of “matching” or “not matching”. While the true matchingpairs P are unequivocally defined by the correct pairs of video and acceleration, the true non-matchingQ can be any of the possibilities (the reader is reminded that a negative of the “Same Subject” typecan never occur in reality, since the same person cannot appear simultaneously in multiple locations;however, we report results for this type of negative because it is useful for our discussion to understandspecific behaviours of the models trained) described in Table 1, resulting in a different score for eachnegative type. We define the correct true positive matches TP, as a function of the threshold τ,such that:
TP(τ) ={(
Vi, Aj)∣∣∣ f (Vi)
2 − g(Aj)2 < τ,
(Vi, Aj
)∈ P
}, (7)

Sensors 2020, 20, 2576 12 of 20
and the false positive matches FP as:
FP(τ) ={(
Vi, Aj)∣∣∣ f (Vi)
2 − g(Aj)2 < τ,
(Vi, Aj
)∈ Q
}, (8)
where P and Q are the sets of all positives and all negatives, respectively. By varying the threshold τ,we can plot the true positive rate TPR against the false positive rate FPR, defined as:
TPR =TPP
and FPR =FPQ
, (9)
resulting in a ROC curve. The auROC curves tested with each training strategy (Section 3.3) and theaverage across negative types (AVG) is presented in Tables 3–5.
Table 3. Results of auROC for fully-conv.
Standard Triplet Loss Reciprocal Triplet Loss
DSDA DSSA SSSA OVLP AVG DSDA DSSA SSSA OVLP AVG
Easy 65.3 60.3 57.1 55.6 59.6 84.4 75.5 69.1 62.7 72.9Easy/Hard 61.2 58.6 56.9 55.4 58.0 82.9 76.8 73.6 72.0 76.3
Hard 59.2 58.5 57.2 55.7 57.6 79.9 79.2 74.8 70.5 76.1Hard/VeryH 59.7 59.5 57.3 55.5 58.0 79.7 78.1 75.0 72.1 76.2
VeryH 59.7 59.2 58.1 56.7 58.4 78.7 78.1 74.1 72.4 75.8All 60.9 58.6 56.8 55.0 57.8 81.4 77.8 73.5 69.8 75.6
Table 4. Results of auROC for Long Short-Term Memory (LSTM)+TP.
Standard Triplet Loss Reciprocal Triplet Loss
DSDA DSSA SSSA OVLP AVG DSDA DSSA SSSA OVLP AVG
Easy 62.5 58.6 55.4 52.5 57.3 69.3 60.7 57.8 51.1 59.7Easy/Hard 66.1 61.5 59.7 57.2 61.1 70.3 65.1 59.3 53.2 62.0
Hard 64.3 62.2 59.4 57.7 60.9 67.8 65.1 58.7 52.4 61.0Hard/VeryH 64.0 62.3 61.0 59.4 61.7 67.8 65.0 57.1 53.6 60.9
VeryH 61.4 60.6 59.3 57.3 59.7 68.1 65.9 60.3 54.2 62.1All 61.7 59.4 57.5 55.7 58.6 69.6 64.1 58.2 53.1 61.2
Table 5. Results of auROC for LSTM.
Standard Triplet Loss Reciprocal Triplet Loss
DSDA DSSA SSSA OVLP AVG DSDA DSSA SSSA OVLP AVG
Easy 66.7 59.7 57.5 54.6 59.7 70.1 60.5 55.9 50.9 59.3Easy/Hard 63.8 62.2 59.4 58.7 61.0 70.2 63.2 59.0 53.3 61.4
Hard 60.3 60.1 58.9 58.3 59.4 74.1 73.8 68.0 64.9 70.2Hard/VeryH 57.1 57.0 57.0 56.2 56.8 74.7 72.6 69.6 67.5 71.1
VeryH 56.3 56.1 55.4 55.2 55.8 74.1 72.2 69.4 67.7 70.8All 55.1 55.0 53.9 53.7 54.4 72.8 69.0 64.9 62.5 67.3
A comparison between the three tested architectures reveals that the best performances areobtained by the fully-conv model when trained using our novel RTL, with an AVG auROC of 76.3%.The full ROC curves for this particular model are presented in Figure 6c, together with the ROCcurves for the baseline method of Shigeta et al. [38] in Figure 6a and Cabrera-Quiros et al. [42] inFigure 6b, which only manage to achieve AVG auROCs of 55.6% and 52.1%, respectively. In termsof best AVG auROC, the best model was trained on a combination of Easy and Hard negatives;while adopting harder negatives samples during training may improve the performances for SSSAauROC, the degradation over other scores leads to a lower AVG auROC. As already expected from the

Sensors 2020, 20, 2576 13 of 20
discussion in Section 3.3, the use of Easy negatives exclusively leads to the worst results in the majorityof the experiments performed.
If we only consider models trained with the STL, the best one is LSTM+TP, trained with acombination of Hard and Very-Hard negatives. This model presents an AVG auROC of 61.7%, whichis almost 15% lower than the best model trained with our novel RTL, confirming the advantages of ournovel loss function. In addition to that, we also experienced a much faster training when using ourproposed RTL, that reached maximum performances in fewer iterations when compared to the STL.Comparing the LSTM models in Tables 4 and 5, we notice that the absence of temporal pooling withthe LSTM layer does improve performances, as predicted in Section 3.5. This improvement is likelyrelated to the more granular temporal information that is fed into the LSTM layer, that better capturesthe correlation between the video and acceleration streams. However, with auROC values of 71.1% forLSTM and 61.7% for LSTM+TP, these two models remain inferior to fully-conv. Moreover, because ofthe missing temporal pooling, LSTM requires 50% longer training time with respect to fully-conv andLSTM+TP.
A comparison between the STL and RTL functions across all the models and negative strategiestested shows a clear superiority of our novel loss function in terms of auROC. Although 17 of our 18experiments support the superiority of RTL over STL, we stress that these results are only valid in thecontext of the Video-Acceleration Matching problem. While the implementation of the RTL to otherComputer Vision problems is straightforward, the performance analysis of our novel loss function forgeneral application is out of the scope of this article.
0.0 0.2 0.4 0.6 0.8 1.0FPR
0.0
0.2
0.4
0.6
0.8
1.0
TPR
DSDA (0.555)DSSA (0.570)SSSA (0.562)OVLP (0.579)
(a)
0.0 0.2 0.4 0.6 0.8 1.0FPR
0.0
0.2
0.4
0.6
0.8
1.0
TPR
DSDA (0.564)DSSA (0.530)SSSA (0.511)OVLP (0.506)
(b)
0.0 0.2 0.4 0.6 0.8 1.0FPR
0.0
0.2
0.4
0.6
0.8
1.0TP
R
DSDA (0.821)DSSA (0.747)SSSA (0.707)OVLP (0.719)Optimal threshold
(c)Figure 6. ROC curves for (a) Shigeta et al. [38], (b) Cabrera-Quiros et al. [41] and (c) our proposedalgorithm. Optimal threshold for our proposed method is also highlighted in the figure.
4.2. Temporal Results
Temporal results for our algorithm are presented in Figure 7 for two example subjects (Subject 9and Subject 10) from the testing data. We illustrate the situation where both subjects appear in front ofthe camera but only one of them is wearing a wearable, the other being a guest. The objective is to findwhich short video clip from each sequence matches the monitored accelerometer. The experiment iseven more challenging, since both subjects are simultaneously doing the same sequence of activities.We encoded both the video and acceleration sequences using the f (·) and g(·) deep encoders from thebest model we found and we evaluated the Euclidean distances between the two pairs of features:
dMatching =
√√√√ N
∑i=1
[ f (V9)− g (A9)]2 (10)

Sensors 2020, 20, 2576 14 of 20
and
dNon-matching =
√√√√ N
∑i=1
[ f (V9)− g (A10)]2. (11)
The results show the detailed temporal performances for the best fully-conv model from Table 3.A very different behaviour can be seen between activities that involve movement (i.e., walking,exercising) and those that do not (i.e., sitting, reading). In fact, active movements involve a varietyof gestures that produce a strong motion signature which can be exploited to match video andaccelerations. On the other hand, the output signal of the accelerometers while resting is almostidentically nil, no matter which person is wearing it, hindering the ability to match differentaccelerations to different video streams.
Monitored subject video
Monitored subject accelerometer
Guest video
Time
1
2
Dist
ance
Matching distanceNon matching distance
standing sitting walking wiping vacuuming sweeping exercising stretching cleaning reading
Figure 7. Temporal results for our best model showing the distance between an acceleration sequenceand its matching video and the video sequence of a potential guest.
4.3. Performances Varying the Number of People
In this subsection, we set out to study the performance of our matching algorithm when varyingthe number of subjects, focusing on the effect of multiple guests. We define the number of peopleappearing in front of the camera Nvid (not necessarily wearing an accelerometer) and the number ofpeople carrying a wearable Nacc (not necessarily appearing in front of the camera). By defining Nsync
to denote the number of subjects appearing in front of the camera while carrying the accelerometer,we can compute the number of guests Nguest (people appearing within camera view while not wearingan accelerometer) as
Nguest = Nvid − Nsync . (12)
To study all the possible circumstances that can apply to a regular house, we designed threedifferent experiments. In the first, we fix Nsync = 1 while we vary Nacc from 2 to 10. This experimentreflects a condition where one single person is wearing the accelerometer in front of the camera, whileother monitored participants are in different rooms or simply not in the field of view of the videosystem. We compute the distance (in the learnt embedded space) between the video of the subjectwithin camera view and all remaining acceleromters. We then sort those distances and obtain the rankof the matching acceleromter Ri, and thus the mean average precision (mAP) as
mAP =1
Nvid
Nvid
∑i
1Ri
. (13)
In the second experiment, we fix Nsync = 1 while we vary Nvid from 2 to 10, which simulates acondition where a total of Nvid people are in front of the camera, but only one subject is being monitoredwith the accelerometer and the rest are guests. We measure again the mAP, as per Equation (13),to estimate the performances in retrieving the accelerometer of the monitored participant againstthe guests.

Sensors 2020, 20, 2576 15 of 20
In the last experiment, we keep Nvid = Nacc = Nsync and we change their value from 2 to 10.This simulates a condition where all the participants are in front of the camera simultaneously andeach is wearing an accelerometer. For each value of N = 2, .., 10 we measure the N× N distance matrixbetween all the videos and the accelerations as D = d(Vi, Aj) for all i, j = 2, .., 10.
To each video clip, we then assign an acceleration sequence based on the minimum distance,
(Vi, Ak) , ki = arg minj
{Di,j}
, (14)
and compute the assignment accuracy as
Accuracy =1
Nvid
Nvid
∑i=1
{δi,ki
}, (15)
where δi,j is the Kronecker delta.The results of these experiments are presented in Figure 8, which shows that our method
outperforms the baselines for every case studied, in spite of a degradation of performances when thenumber of people increases from 2 to 10. Despite Cabrera et al. [42] being explicitly designed to dealwith mingling events and crowded scenes, when their algorithm is applied to the short video clips,their performances drastically drop, with results that are almost on par with random guesses in thehardest scenario (i.e., DSSA, SSSA in Figure 7c).
2 3 4 5 6 7 8 9 10#N hidden subjects with wearable
0.1
0.2
0.3
0.4
0.5
0.6
0.7
0.8
mAP
One person in front of the cameraCabrera et al. @ DSDACabrera et al. @ DSSACabrera et al. @ SSSAShigeta et al. @ DSDAShigeta et al. @ DSSAShigeta et al. @ SSSAProposed Method @ DSDAProposed Method @ DSSAProposed Method @ SSSARandom
2 3 4 5 6 7 8 9 10#N visible subjects without wearable
0.1
0.2
0.3
0.4
0.5
0.6
0.7
0.8
mAP
One person with wearableCabrera et al. @ DSDACabrera et al. @ DSSACabrera et al. @ SSSAShigeta et al. @ DSDAShigeta et al. @ DSSAShigeta et al. @ SSSAProposed Method @ DSDAProposed Method @ DSSAProposed Method @ SSSARandom
(a) (b)
2 3 4 5 6 7 8 9 10#N visible subjects with wearable
0.1
0.2
0.3
0.4
0.5
0.6
0.7
0.8
Accu
racy
All subjects visible with wearableCabrera et al. @ DSDACabrera et al. @ DSSACabrera et al. @ SSSAShigeta et al. @ DSDAShigeta et al. @ DSSAShigeta et al. @ SSSAProposed Method @ DSDAProposed Method @ DSSAProposed Method @ SSSARandom
(c)
Figure 8. Results showing mAP and assignment accuracy for different experiments varying the numberof people.

Sensors 2020, 20, 2576 16 of 20
4.4. Variable Clip Length
One of the novelties of our method is its ability to cope with very short clips when matchingvideo and acceleration streams. While we are able to accurately assign each video stream to thecorrect accelerometer with just ≈3 s of data, the simultaneous lack of motion in both modalitiescan hinder a correct association. This effect can easily be mitigated by increasing the observationtime for each stream. We considered all the three subjects from the validation split (8, 9 and 10) andsimulated an experiment where they all appear in front of the camera while wearing the accelerometer.The assignment accuracy was computed again as in the previous section, based on the minimumdistance between each of the modalities. We then increased the number of clips observed for eachsubject and considered the average distance to study the behaviour of the assignment accuracy for avarying time interval.
Figure 9 illustrates the performances of each method for a variable observation time. The plotsshow that the baseline methods improve drastically with longer observation times, while our proposedalgorithm hugely outperforms them by saturating to almost 100% assignment accuracy after only 2min of observation time.
0 1 2 3 4 5 6 7Observation time (minutes)
0.4
0.5
0.6
0.7
0.8
0.9
1.0
Assig
nmen
t acc
urac
y
Cabrera et al.Shigeta et al.Proposed Method
Figure 9. Assignment accuracy for different lengths of observation time. The area coloured in shaderepresents the variance for each plot.
5. Conclusions
Novel technologies like IoT and AAL are becoming increasingly more popular and can potentiallyproduce a change in the current paradigm of healthcare. An important aspect that needs to be carefullyconsidered while working with these technologies is privacy, and video silhouettes have already showna great potential in this regard, allowing for digital health monitoring while overcoming the ethicalrestrictions imposed by the use of traditional cameras. In spite of their compatibility with privacy concerns,silhouettes anonymity is a double-edged sword that both prevents identification of the household andhinders the ability to identify and track the progress of monitored subjects amongst others.
In this paper, we developed a novel deep learning algorithm that allows the identification andtracking of the monitored individuals thanks to the matching of video sequences from silhouetteswith the acceleration from a wearable device carried by the subject. Differently to previous works, ouralgorithm is able to work also in the presence of guests as it requires only the monitored subject tobe wearing the accelerometer. Moreover, our algorithm outperforms previous works by enabling thematching of video and acceleration clips of very short durations (≈3 s), making it highly suitable forshort and clinically relevant movements like the transition from sitting to standing. We demonstratethe validity of our results in a series of experiments and ablation studies, presenting an average

Sensors 2020, 20, 2576 17 of 20
auROC of 76.3% and an assignment accuracy of 77.4%. With our results, we show that a deep-learningalgorithm largely outperforms traditional methods based on tailored features when tackling theVideo-Acceleration Matching problem.
Author Contributions: Methodology, A.M., T.B., D.D., T.P., M.M.; software, A.M.; data curation, A.M.;writing–original draft preparation, A.M.; writing–review and editing, A.M., T.B., D.D., T.P., M.M. All authors haveread and agreed to the published version of the manuscript.
Funding: “This research was funded by the UK Engineering and Physical Sciences Research Council (EPSRC),grant number EP/R005273/1.”
Acknowledgments: This work was performed under the SPHERE Next Steps Project funded by the UKEngineering and Physical Sciences Research Council (EPSRC), Grant EP/R005273/1.
Conflicts of Interest: The authors declare no conflict of interest.
References
1. Maskeliunas, R.; Damaševicius, R.; Segal, S. A Review of Internet of Things Technologies for AmbientAssisted Living Environments. Future Internet 2019, 11, 259.
2. Sathyanarayana, S.; Satzoda, R.K.; Sathyanarayana, S.; Thambipillai, S. Vision-based patient monitoring:A comprehensive review of algorithms and technologies. J. Ambient Intell. Humaniz. Comput. 2018, 9, 225–251,doi:10.1007/s12652-015-0328-1.
3. Zagler, W.; Panek, P.; Rauhala, M. Ambient Assisted Living Systems—The Conflicts between Technology,Acceptance, Ethics and Privacy. In Assisted Living Systems—Models, Architectures and Engineering Approaches;Schloss Dagstuhl: Dagstuhl, Germany, 2008; pp. 1–4.
4. Ziefle, M.; Rocker, C.; Holzinger, A. Medical Technology in Smart Homes: Exploring the User’s Perspectiveon Privacy, Intimacy and Trust. In Proceedings of the IEEE Annual Computer Software and ApplicationsConference Workshops, Munich, Germany, 18–22 July 2011; doi:10.1109/COMPSACW.2011.75.
5. Birchley, G.; Huxtable, R.; Murtagh, M.; ter Meulen, R.; Flach, P.; Gooberman-Hill, R. Smart homes,private homes? An empirical study of technology researchers’ perceptions of ethical issues in developingsmart-home health technologies. BMC Med. Ethics 2017, 18, 23, doi:10.1186/s12910-017-0183-z.
6. Hall, J.; Hannuna, S.; Camplani, M.; Mirmehdi, M.; Damen, D.; Burghardt, T.; Tao, L.; Paiement, A.;Craddock, I. Designing a Video Monitoring System for AAL applications: The SPHERE Case Study. InProceedings of the IET International Conference on Technologies for Active and Assisted Living, London, UK,24–25 October 2016, doi:10.1049/ic.2016.0061.
7. Chaaraoui, A.A.; Climent-Pérez, P.; Flórez-Revuelta, F. A review on vision techniques applied toHuman Behaviour Analysis for Ambient-Assisted Living. Expert Syst. Appl. 2012, 39, 10873–10888,doi:10.1016/j.eswa.2012.03.005.
8. Masullo, A.; Burghardt, T.; Damen, D.; Hannuna, S.; Ponce-Lopez, V.; Mirmehdi, M. CaloriNet: Fromsilhouettes to calorie estimation in private environments. In Proceedings of the British Machine VisionConference, Newcastle, UK, 3–6 September 2018; pp. 1–14.
9. Masullo, A.; Burghardt, T.; Perrett, T.; Damen, D.; Mirmehdi, M. Sit-to-Stand Analysis in the WildUsing Silhouettes for Longitudinal Health Monitoring. In Image Analysis and Recognition; Springer NatureSwitzerland: Basel, Switzerland, 2019; pp. 1–26, doi:10.1007/978-3-030-27272-2_15.
10. Akagündüz, E.; Aslan, M.; Sengür, A.; Wang, H.; Ince, M.C. Silhouette Orientation Volumes for Efficient FallDetection in Depth Videos. IEEE J. Biomed. Health Inform. 2017, 21, 756–763.
11. Nieto-Hidalgo, M.; Ferrández-Pastor, F.J.; Valdivieso-Sarabia, R.J.; Mora-Pascual, J.; García-Chamizo, J.M.A vision based proposal for classification of normal and abnormal gait using RGB camera. J. Biomed. Inform.2016, 63, 82–89, doi:10.1016/j.jbi.2016.08.003.
12. Colantonio, S.; Coppini, G.; Giorgi, D.; Morales, M.A.; Pascali, M.A. Chapter 6—Computer Vision forAmbient Assisted Living: Monitoring Systems for Personalized Healthcare and Wellness That Are Robust inthe Real World and Accepted by Users, Carers, and Society. In Computer Vision for Assistive Healthcare; Leo, M.,Farinella, G.M., Eds.; Computer Vision and Pattern Recognition; Academic Press: Cambridge, MA, USA,2018; pp. 147–182, doi:10.1016/B978-0-12-813445-0.00006-X.

Sensors 2020, 20, 2576 18 of 20
13. Zhu, N.; Diethe, T.; Camplani, M.; Tao, L.; Burrows, A.; Twomey, N.; Kaleshi, D.; Mirmehdi, M.; Flach, P.;Craddock, I. Bridging e-Health and the Internet of Things: The SPHERE Project. IEEE Intell. Syst. 2015,30, 39–46, doi:10.1109/MIS.2015.57.
14. Grant, S.; Blom, A.W.; Whitehouse, M.R.; Craddock, I.; Judge, A.; Tonkin, E.L.; Gooberman-Hill, R. Usinghome sensing technology to assess outcome and recovery after hip and knee replacement in the UK:The HEmiSPHERE study protocol. BMJ Open 2018, 8, e021862, doi:10.1136/bmjopen-2018-021862.
15. Masullo, A.; Burghardt, T.; Damen, D.; Perrett, T.; Mirmehdi, M. Who Goes There? Exploiting Silhouettesand Wearable Signals for Subject Identification in Multi-Person Environments. In Proceedings of the IEEEInternational Conference on Computer Vision Workshops, Seoul, Korea, 27 October–2 November 2019.
16. Tao, L. SPHERE-Calorie; University of Bristol: Bristol, UK, 2016, doi:10.5523/bris.1gt0wgkqgljn21jjgqoq8enprr.17. Tao, L.; Burghardt, T.; Mirmehdi, M.; Damen, D.; Cooper, A.; Hannuna, S.; Camplani, M.; Paiement, A.;
Craddock, I. Calorie Counter: RGB-Depth Visual Estimation of Energy Expenditure at Home; LectureNotes in Computer Science; Springer: Berlin/Heidelberg, Germany, 2017; Volume 10116, pp. 239–251,doi:10.1007/978-3-319-54407-6_16.
18. Yao, Z.; Wu, X.; Xiong, Z.; Ma, Y. A Dynamic Part-Attention Model for Person Re-Identification. Sensors2019, 19, 2080.
19. Gohar, I.; Riaz, Q.; Shahzad, M.; Ul Hasnain Hashmi, M.Z.; Tahir, H.; Ehsan Ul Haq, M.Person Re-Identification Using Deep Modeling of Temporally Correlated Inertial Motion Patterns. Sensors2020, 20, 949.
20. Zeng, Z.; Wang, Z.; Wang, Z.; Zheng, Y.; Chuang, Y.Y.; Satoh, S. Illumination-adaptive person re-identification.IEEE Trans. Multimed. 2020, doi:10.1109/TMM.2020.2969782.
21. Bedagkar-Gala, A.; Shah, S.K. A survey of approaches and trends in person re-identification.Image Vis. Comput. 2014, 32, 270–286, doi:10.1016/j.imavis.2014.02.001.
22. Wu, D.; Zheng, S.J.; Zhang, X.P.; Yuan, C.A.; Cheng, F.; Zhao, Y.; Lin, Y.J.; Zhao, Z.Q.; Jiang, Y.L.; Huang, D.S.Deep learning-based methods for person re-identification: A comprehensive review. Neurocomputing 2019,337, 354–371, doi:10.1016/j.neucom.2019.01.079.
23. Layne, R.; Hannuna, S.; Camplani, M.; Hall, J.; Hospedales, T.M.; Xiang, T.; Mirmehdi, M.; Damen, D.A Dataset for Persistent Multi-target Multi-camera Tracking in RGB-D. In Proceedings of the IEEEConference on Computer Vision and Pattern Recognition Workshops, Honolulu, HI, USA, 21–26 July 2017,doi:10.1109/CVPRW.2017.189.
24. Munaro, M.; Fossati, A.; Basso, A.; Menegatti, E.; Van Gool, L. One-Shot Person Re-identification with aConsumer Depth Camera. In Person Re-Identification; Springer: London, UK, 2014; Volume 6, pp. 161–181,doi:10.1007/978-1-4471-6296-4_8.
25. Nambiar, A.; Bernardino, A.; Nascimento, J.C. Gait-based Person Re-identification. ACM Comput. Surv.2019, 52, 1–34, doi:10.1145/3243043.
26. Wang, L.; Tan, T.; Ning, H..; Hu, W.. Silhouette analysis-based gait recognition for human identification.IEEE Trans. Pattern Anal. Mach. Intell. 2003, 25, 1505–1518, doi:10.1109/TPAMI.2003.1251144.
27. Gou, M.; Zhang, X.; Rates-Borras, A.; Asghari-Esfeden, S.; Sznaier, M.; Camps, O. PersonRe-identification in Appearance Impaired Scenarios. arXiv 2016, arXiv:1604.00367. Available online:https://arxiv.org/abs/1604.00367 (accessed on 3 April 2020).
28. Zhang, P.; Wu, Q.; Xu, J.; Zhang, J. Long-Term Person Re-identification Using True Motion from Videos.In Proceedings of the IEEE Winter Conference on Applications of Computer Vision, Lake Tahoe, NV, USA,12–15 March 2018, doi:10.1109/WACV.2018.00060.
29. Bredin, H.; Chollet, G. Audiovisual Speech Synchrony Measure: Application to Biometrics. EURASIP J. Adv.Signal Process. 2007, 2007, 070186, doi:10.1155/2007/70186.
30. Arandjelovic, R.; Zisserman, A. Look, Listen and Learn. In Proceedings of the IEEE International Conferenceon Computer Vision, Venice, Italy, 22–29 October 2017, doi:10.1109/ICCV.2017.73.
31. Roth, J.; Chaudhuri, S.; Klejch, O.; Marvin, R.; Gallagher, A.; Kaver, L.; Ramaswamy, S.; Stopczynski,A.; Schmid, C.; Xi, Z. et.al AVA-ActiveSpeaker: An Audio-Visual Dataset for Active Speaker Detection.In Proceedings of the ICASSP 2020—2020 IEEE International Conference on Acoustics, Speech and SignalProcessing (ICASSP), Barcelona, Spain, 4–8 May 2020.
32. Chung, J.S.; Zisserman, A. Learning to lip read words by watching videos. Comput. Vis. Image Underst. 2018,173, 76–85, doi:10.1016/j.cviu.2018.02.001.

Sensors 2020, 20, 2576 19 of 20
33. Korbar, B.; Tran, D.; Torresani, L. Cooperative Learning of Audio and Video Models from Self-SupervisedSynchronization. In Proceedings of the 2018 Conference on Neural Information Processing Systems,Montreal, QC, Canada, 3–8 December 2018.
34. Teixeira, T.; Jung, D.; Savvides, A. Tasking networked CCTV cameras and mobile phones to identify andlocalize multiple people. In Proceedings of the ACM International Conference on Ubiquitous Computing,Copenhagen, Denmark, 26–29 September 2010, doi:10.1145/1864349.1864367.
35. Jiang, W.; Yin, Z. Combining passive visual cameras and active IMU sensors for persistent pedestriantracking. J. Vis. Commun. Image Represent. 2017, 48, 419–431, doi:10.1016/j.jvcir.2017.03.015.
36. Henschel, R.; Marcard, T.V.; Rosenhahn, B. Simultaneous Identification and Tracking of Multiple PeopleUsing Video and IMUs. In Proceedings of the IEEE Conference on Computer Vision and Pattern RecognitionWorkshops, Long Beach, CA, USA, 16–20 June 2019.
37. Jimenez, A.; Seco, F.; Prieto, C.; Guevara, J. A comparison of Pedestrian Dead-Reckoning algorithms using alow-cost MEMS IMU. In Proceedings of the IEEE International Symposium on Intelligent Signal Processing,Budapest, Hungary, 26–28 August 2009, doi:10.1109/WISP.2009.5286542.
38. Shigeta, O.; Kagami, S.; Hashimoto, K. Identifying a moving object with an accelerometer in a camera view.In Proceedings of the IEEE/RSJ International Conference on Intelligent Robots and Systems, Nice, France,22–26 September 2008, doi:10.1109/IROS.2008.4651201.
39. Rofouei, M.; Wilson, A.; Brush, A.; Tansley, S. Your phone or mine?: Fusing body, touch and device sensingfor multi-user device-display interaction. In Proceedings of the ACM Annual Conference on Human Factorsin Computing Systems, Austin, TX, USA, 5–10 May 2012, doi:10.1145/2207676.2208332.
40. Wilson, A.D.; Benko, H. Crossmotion: Fusing device and image motion for user identification, trackingand device association. In Proceedings of the International Conference on Multimodal Interaction,Istanbul, Turkey, 12–16 November 2014, doi:10.1145/2663204.2663270.
41. Cabrera-Quiros, L.; Hung, H. Who is where? Matching People in Video to Wearable AccelerationDuring Crowded Mingling Events. In Proceedings of the ACM on Multimedia Conference,Amsterdam, The Netherlands, 15–19 October 2016, doi:10.1145/2964284.2967224.
42. Cabrera-Quiros, L.; Hung, H. A Hierarchical Approach for Associating Body-Worn Sensors to Video Regionsin Crowded Mingling Scenarios. IEEE Trans. Multimed. 2019, 21, 1867–1879, doi:10.1109/TMM.2018.2888798.
43. OpenNI. Available online: https://structure.io/openni (accessed on 30 April 2020).44. Schroff, F.; Kalenichenko, D.; Philbin, J. FaceNet: A unified embedding for face recognition and clustering.
In Proceedings of the IEEE Conference on Computer Vision and Pattern Recognition, Boston, MA, USA,7–12 June 2015, doi:10.1109/CVPR.2015.7298682.
45. Hinton, G.; Deng, L.; Yu, D.; Dahl, G.E.; Mohamed, A.-R.; Jaitly, N.; Senior, A.; Vanhoucke, V.; Nguyen, P.;Sainath, T.N. Deep Neural Networks for Acoustic Modeling in Speech Recognition: The Shared Views ofFour Research Groups. IEEE Signal Process. Mag. 2012, 29, 82–97, doi:10.1109/MSP.2012.2205597.
46. Bredin, H. TristouNet: Triplet loss for speaker turn embedding. In Proceedings of the 2017 IEEEInternational Conference on Acoustics, Speech and Signal Processing, New Orleans, LA, USA, 5–9 March2017, doi:10.1109/ICASSP.2017.7953194.
47. Torfi, A.; Dawson, J.; Nasrabadi, N.M. Text-Independent Speaker Verification Using 3D ConvolutionalNeural Networks. In Proceedings of the IEEE International Conference on Multimedia and Expo,San Diego, CA, USA, 23–27 July 2018, doi:10.1109/ICME.2018.8486441.
48. Chen, C.; Jafari, R.; Kehtarnavaz, N. A survey of depth and inertial sensor fusion for human actionrecognition. Multimed. Tools Appl. 2017, 76, 4405–4425, doi:10.1007/s11042-015-3177-1.
49. Lagadec, R.; Pelloni, D.; Weiss, D. A 2-channel, 16-bit digital sampling frequency converter for professionaldigital audio. In Proceedings of the IEEE International Conference on Acoustics, Speech, and SignalProcessing, Paris, France, 3–5 May 1982, doi:10.1109/ICASSP.1982.1171661.
50. Cao, Z.; Simon, T.; Wei, S.E.; Sheikh, Y. Realtime Multi-Person 2D Pose Estimation using Part Affinity Fields.arXiv 2018, arXiv:1812.08008. Available online: https://arxiv.org/abs/1812.08008 (accessed on 30 April2020).
51. Cabrera-Quiros, L.; Demetriou, A.; Gedik, E.; van der Meij, L.; Hung, H. The MatchNMingledataset: A novel multi-sensor resource for the analysis of social interactions and group dynamicsin-the-wild during free-standing conversations and speed dates. IEEE Trans. Affect. Comput. 2018, 1,doi:10.1109/TAFFC.2018.2848914.

Sensors 2020, 20, 2576 20 of 20
52. Kingma, D.P.; Ba, J. Adam: A method for stochastic optimization. arXiv 2014, arXiv:1412.6980. Availableonline: https://arxiv.org/pdf/1412.6980.pdf (accessed on 30 April 2020).
c© 2020 by the authors. Licensee MDPI, Basel, Switzerland. This article is an open accessarticle distributed under the terms and conditions of the Creative Commons Attribution(CC BY) license (http://creativecommons.org/licenses/by/4.0/).