algebra 2- student lesson 2- the golden ratio - txar ii/algebra 2- student...algebra 2 tmt3 algebra...
TRANSCRIPT
Algebra 2
TMT3 Algebra 2: Student Lesson 2 140
Materials Advanced Preparation:
Student access to computers with Geometer’s Sketchpad and necessary sketches and/or a projection device to use the computer activities as a demonstration Student or teacher access to the Internet Chart paper and markers or blank transparencies Graphing calculator connected to an overhead projector or presenter Transparencies provided with this lesson Copies of “Technology Tutorial: The Golden Ratio” for each group of students.
2A.1(B) collect and organize data, make and interpret scatterplots, fit the graph of a function to the data, interpret the results, and proceed to model, predict, and make decisions and critical judgments.
2A.4(B) extend parent functions with parameters such as a in f(x) = a/x and describe the effects of the parameter changes on the graph of parent functions
2A.8(B) analyze and interpret the solutions of quadratic equations using discriminants and solve quadratic equations using the quadratic formula
2A.11(B) use the parent functions to investigate, describe, and predict the effects of parameter changes on the graphs of exponential and logarithmic functions, describe limitations on the domains and ranges, and examine asymptotic behavior
2A.11(C) determine the reasonable domain and range values of exponential and logarithmic functions, as well as interpret and determine the reasonableness of solutions to exponential and logarithmic equations and inequalities
2A.11(F) analyze a situation modeled by an exponential function, formulate an equation or inequality, and solve the problem.
G.1(B) recognize the historical development of geometric systems and know mathematics is developed for a variety of purposes
G.2(A) use constructions to explore attributes of geometric figures and to make conjectures about geometric relationships
G.5(A) use numeric and geometric patterns to develop algebraic expressions representing geometric properties
G.5(B) use numeric and geometric patterns to make generalizations about geometric properties, including properties of polygons, ratios in similar figures and solids, and angle relationships in polygons and circles;
G.11(A) use and extend similarity properties and transformations to explore and justify conjectures about geometric figures
G.11(B) use ratios to solve problems involving similar figures
Algebra 2
TMT3 Algebra 2: Student Lesson 2 141
For each student: Graphing calculator The Eye of the Beholder activity sheet Creating a “Golden” Exponential Function activity sheet Algebra and the Golden Ratio activity sheet The Golden Ratio in Art and Architecture activity sheet Golden Areas activity sheet
ENGAGE The Engage portion of the lesson is designed to create student interest in the application of the number phi (golden ratio) to everyday life. This part of the lesson is designed for groups of two to four students using a computer station for Internet access and The Geometer’s Sketchpad. 1. Show Transparency – The Eye of the Beholder.
2. Hand each student a copy of the activity sheet The Eye of the Beholder and have each student group open the Geometer’s Sketchpad sketch Face Sample. Students will use Geometer’s Sketchpad to obtain data to calculate ratios of the facial features indicated on the sketch. They will record these ratios on the activity sheet. Each ratio will be approximately 1.6.
3. Groups will also log on to the Internet and use the website shown on their activity sheet or similar sites that have photos of celebrities. Each group is to find one celebrity photo that they want to copy and insert into Geometer’s Sketchpad. If your school’s firewall blocks the use of such sites, you can download some photos yourself and give them to the students in a Word file. They can then copy and insert whichever photo they choose.
4. Students may want to open a new sketch in which to insert their celebrity photo instead of inserting into the same file as the sample. Once students have inserted a copy of the celebrity photo, they will use Geometer’s Sketchpad and take the same types of measurements as on the face sample and record these on the activity sheet.
5. Once the groups have recorded their measurements and ratio values, have them share their findings with the whole class. You may want to record their findings on chart paper or a transparency so students can have fun discussing who is the most handsome or beautiful.
Algebra 2
TMT3 Algebra 2: Student Lesson 2 142
EXPLORE The Explore portion of the lesson provides an opportunity for the student to connect the concept of the golden ratio to an exponential function. This part of the lesson is designed for groups of two to four students working with Geometer’s Sketchpad and a graphing calculator. 1. Distribute the Creating a “Golden” Exponential Function activity sheet.
2. Inform students that there are several geometric models of the golden ratio. A representation of the exact value of the golden ratio will be discovered through patterns of golden triangles. Display Transparency 1 – The Golden Triangle. On the transparency, sketch a bisector of ∠BAC and name its intersection with the leg BC point D.
Facilitation Questions – Engage Phase • What facial features do you find attractive in another person?
Answers may vary. Let students briefly share to enhance the engagement aspect.
• Besides ratios, what other mathematical terms or concepts can you apply to a person’s physical appearance? Symmetry, orientation of features (crooked smile, etc.), overall size of head compared to body
• Do certain feature measurements of species other than humans have an affect on their “attractiveness”? Animals look for features in their potential mates such as overall proportion, strength, speed, etc. to ensure that their offspring have a greater chance of survival. Judges at dog and cat shows look for certain physical features to judge the pureness of a breed.
• What are some of the different ways that ratios can be expressed? Ratios can be written as fractions or decimals or using the word “to” or a colon to separate the terms of the ratio.
• What is the decimal value (to the nearest tenth) of the ratios found from the face sample? They all were close to 1.6.
• Consider the following ratios. What are their decimal equivalents and what do
you notice? 3 5 8 13 21
, , , ,2 3 5 8 13
Each new numerator is equal to the sum of the numerator and denominator from the previous fraction; the decimal values seem to approach about 1.6.
• How do the decimal equivalents in the sequence of ratios above compare to the ratios in your celebrity’s facial feature ratios? In the most attractive faces, the ratios were close to 1.6 – same as the ratios in the sequence.
Algebra 2
TMT3 Algebra 2: Student Lesson 2 143
3. Prompt students to recognize characteristics of ΔABC and ΔCAD that they may remember from Geometry such as:
4. Students should open the Geometer’s Sketchpad sketch Golden Triangle and find the measurements and ratios indicated. To find the measurements, students can click on the appropriate action buttons.
5. Prompt students to enter their measurements on the activity sheet. Each group will probably have different segment measurements if they resized the triangle in the sketch. However, the ratios should all be the same, about 1.6.
6. Use Transparency 2 – The Golden Triangle to show how to create more triangles within the original triangle. As more triangles are created, help students see each new golden ratio. Use colored markers if possible. The Golden Triangle 2 page in the Geometer’s Sketchpad sketch Golden Triangle has the triangles already created, but students will have to find the measurementss on their own.
7. Students could spend lots of time listing every ratio from the seven nested triangles. However, our emphasis now is to show how the golden triangles are connected to an exponential function using 1.6 as the common ratio (e.g., “b” in the function y = a•bx. ) The value of “a” would be whatever the student’s initial leg length is. Do NOT encourage them to use the exponential regression. If you do, make sure you have a discussion about how the values are related to the data.
8. Important! Have students share the function that they derived and how they calculated it.
Facilitation Questions – Explore Phase
• What are the measures of the base angles of ΔABC? Why? 72°. If the vertex angle is 36°, that leaves 180-36 = 144 degrees to split equally among the two base angles.
• If you bisect ∠BAC, what are the measures of the two new angles? Why? 36°, because bisecting an angle cuts the angle measure in half.
• How are ΔABC and ΔCAD related? They are both isosceles triangles with 36° vertex angles.
• Are ΔABC and ΔCAD similar? How do you know? Yes, because all corresponding angles are congruent.
• What does this imply about the lengths of certain sides of ΔABC and ΔCAD? Why?
Corresponding sides have proportional lengths, such as BC ADAC DC
= . Other
proportions can be made using corresponding sides in a similar fashion.
Algebra 2
TMT3 Algebra 2: Student Lesson 2 144
Facilitation Questions – Explore Phase • What happens if you change the size of your triangle in either of the
sketches? The side lengths will change but the ratios all remain about 1.618.
• How many proportions can you make from the segments in Golden Triangle 2? Answers may vary but there’s a lot.
• Why are you asked to write an exponential function instead of a linear, quadratic, or other type of function? From y-value to y-value, there is a common ratio which is about 1.618.
• What window did you use to display your data? Why? The window depends on the size of the largest segment recorded, BC . A possible window could be x: 0 , 10, 1 and y: 0, 10, 1.
• How did you use your table to develop an exponential function for your data? Answers may vary. Students may have found successive ratios of leg lengths in the table. They may have guessed at the initial value by using transformations of the graph.
• Is your function exactly the same as other students’ functions? Why or why not? No, the “b” value is the same (1.618) but the “a” value may be different. If the original triangle is changed in size, the side lengths will vary. However, all of the triangles are “golden,” so the ratio of leg to base will always equal phi and is the ratio of the exponential function.
• How can you use the table, graph, and/or function to find the next term in the sequence of leg lengths? Table: multiply the preceding term by 1.618 Graph: trace on the function curve to x = 8 and read the y-value Function: on the home screen, enter x = 8 into the function rule and evaluate
• Where would the 8th term value appear on the set of golden triangles? Extend side AC out to the left. Construct a 36° angle with vertex B so that one side contains BA and the other side intersects AC . Label this point of intersection point P. The length of BP is the 8th term. Its value should equal BC ÷ 1.618.
• If you created another triangle inside of ΔGHC, describe the side that fits the data in your table.
Bisect ∠GHC and name its intersection with GC point J. The length of side HJ has a value approximately equal to GC ÷ 1.618. This value would fit before the first term and equals the initial value used in the function.
Algebra 2
TMT3 Algebra 2: Student Lesson 2 145
EXPLAIN The Explain portion of the lesson is directed by the teacher to allow the students to formalize their understanding of the actual value of the golden ratio, known as phi. 1. Refer to Transparency – The Golden Section to connect the golden ratio to the
Fibonacci sequence. Revisit the proportion of the golden ratio on Transparency – The Algebra of the Golden Ratio in order to derive the exact value of the ratio.
2. Lead students through the discussion of solving the proportion. You may want to stay with the variable “a” when solving, then introduce the symbol for phi at the end.
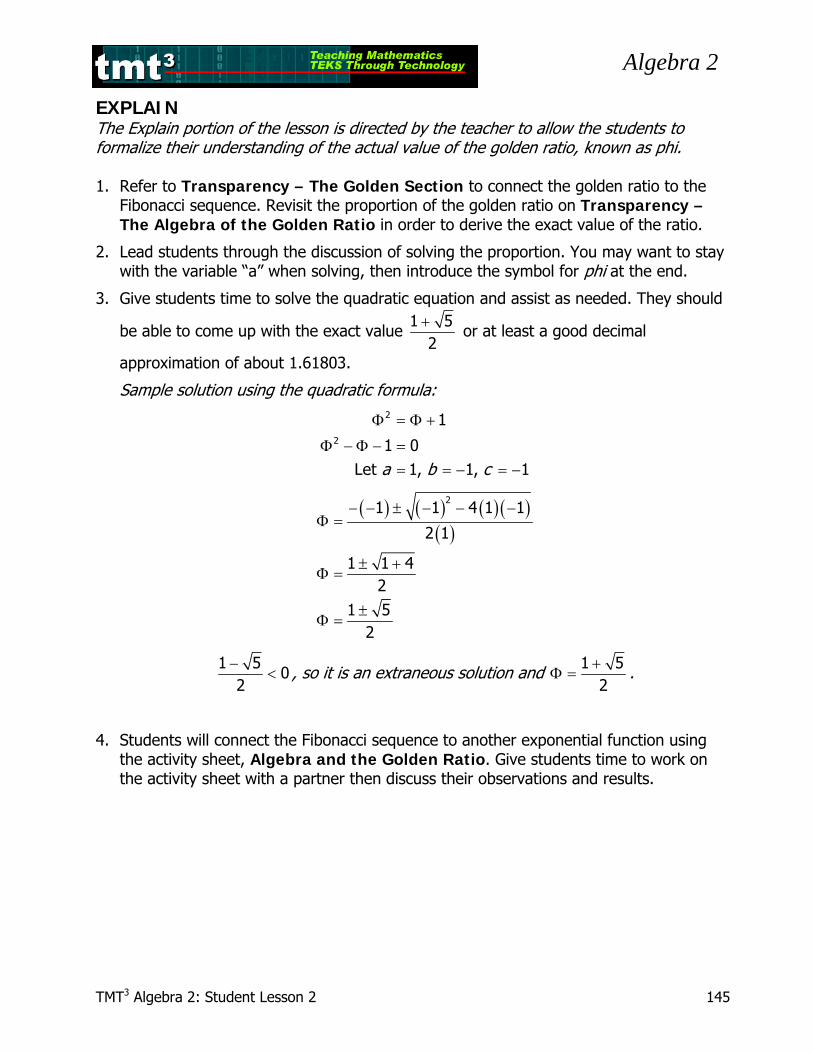
3. Give students time to solve the quadratic equation and assist as needed. They should
be able to come up with the exact value 1 5
2+
or at least a good decimal
approximation of about 1.61803.
Sample solution using the quadratic formula:
Φ = Φ +
Φ − Φ − == = − = −
2
2
1
1 0Let 1, 1, 1a b c
( ) ( ) ( ) ( )( )
− − ± − − −Φ =
± +Φ =
±Φ =
21 1 4 1 1
2 1
1 1 42
1 52
−<
1 50
2, so it is an extraneous solution and +
Φ =1 5
2.
4. Students will connect the Fibonacci sequence to another exponential function using the activity sheet, Algebra and the Golden Ratio. Give students time to work on the activity sheet with a partner then discuss their observations and results.
Algebra 2
TMT3 Algebra 2: Student Lesson 2 146
ELABORATE The Elaborate portion of the lesson provides the student with an opportunity to extend what they’ve learned to real-word applications in art and architecture. This part of the lesson is designed for students to work in groups of two to four. 1. Show how the numbers in the Fibonacci sequence approximate phi in the golden
rectangle model. See Transparency – The Golden Rectangle.
2. Students will search the Internet for “golden ratio” and “art” or “architecture.”
3. Give each group a copy of the activity sheet The Golden Ratio in Art and Architecture.
4. Students are to find one example of how the golden ratio has been used in architecture and one example of art (painting, sculpture, etc.). Each group will record their findings on the activity sheet and present their findings to the class.
Facilitation Questions – Elaborate Phase • What examples did you find of the golden ratio?
Answers will vary but will probably include structures such as the pyramids, the Parthenon, the United Nations building, and the Notre Dame cathedral. Art may include works by Leonardo da Vinci, Georges Seurat, Rembrandt, and Salvador Dali.
Facilitation Questions – Explain Phase • Is the value of the golden ratio really a fraction/ratio?
Technically, a fraction or rational number is a ratio of whole numbers so the “golden ratio” is not a fraction.
• Are the ratios made from consecutive Fibonacci numbers the same as the golden ratio? These ratios are approximations. The larger the Fibonacci numbers used, the better the approximation to phi. (Actually the limit of these ratios = the golden ratio but that may be a discussion for another class!)
• How did you solve the quadratic equation? Answers may vary. Students could use the quadratic formula or find a reasonable approximation on a graphing calculator.
• Is there just one value for the golden ratio? Yes and no. When you solve the quadratic, you get two answers, but the larger value of 1.61803… is commonly accepted as the value of the golden ratio, often called φ. Curiously however, the other value, 0.61803… shares
the same decimal part and is equal to ϕ1 .
Algebra 2
TMT3 Algebra 2: Student Lesson 2 147
EVALUATE The Evaluate portion of the lesson provides the student with an opportunity to demonstrate his or her understanding of the TEKS addressed in the lesson. This assessment is intended for groups of two to four students. 1. Provide each group a copy of the activity sheet Golden Areas.
2. Provide each student with a graphing calculator.
3. Upon completion of the activity sheet, a rubric should be used to assess student understanding of the concepts addressed in the lesson.
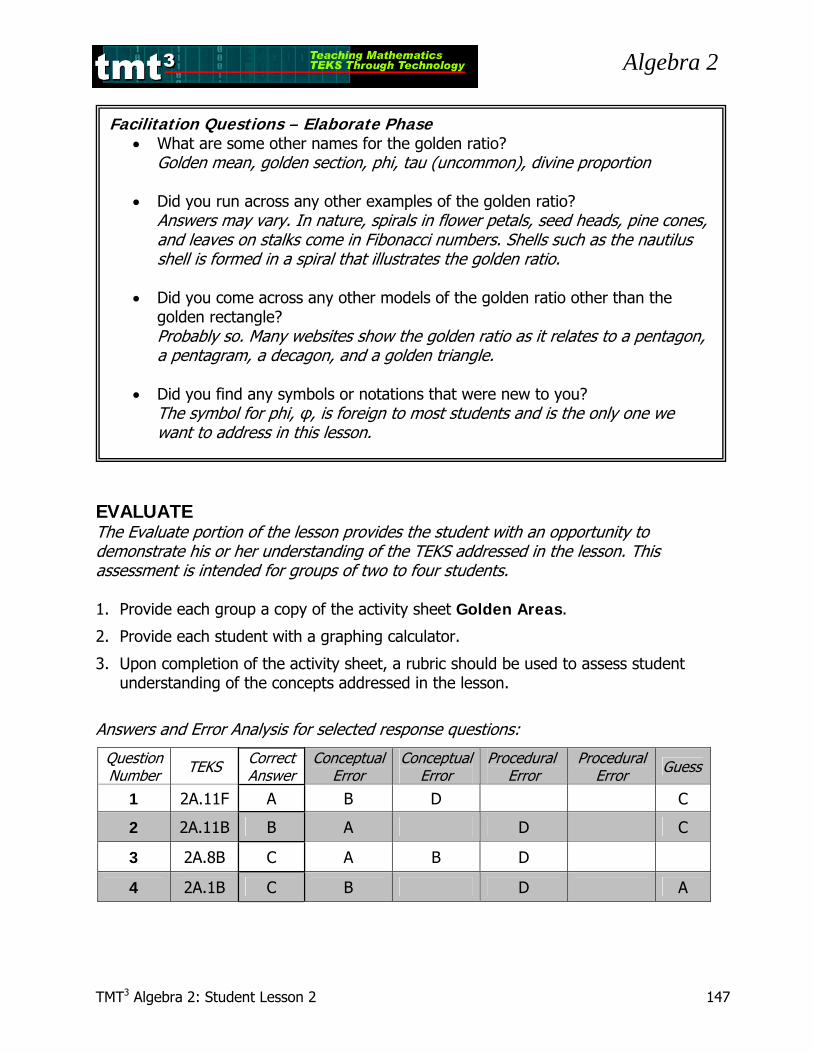
Answers and Error Analysis for selected response questions: Question
Number TEKS Correct Answer
ConceptualError
ConceptualError
Procedural Error
Procedural Error Guess
1 2A.11F A B D C
2 2A.11B B A D C
3 2A.8B C A B D
4 2A.1B C B D A
Facilitation Questions – Elaborate Phase • What are some other names for the golden ratio?
Golden mean, golden section, phi, tau (uncommon), divine proportion
• Did you run across any other examples of the golden ratio? Answers may vary. In nature, spirals in flower petals, seed heads, pine cones, and leaves on stalks come in Fibonacci numbers. Shells such as the nautilus shell is formed in a spiral that illustrates the golden ratio.
• Did you come across any other models of the golden ratio other than the
golden rectangle? Probably so. Many websites show the golden ratio as it relates to a pentagon, a pentagram, a decagon, and a golden triangle.
• Did you find any symbols or notations that were new to you? The symbol for phi, φ, is foreign to most students and is the only one we want to address in this lesson.
Algebra 2
TMT3 Algebra 2: Student Lesson 2 148
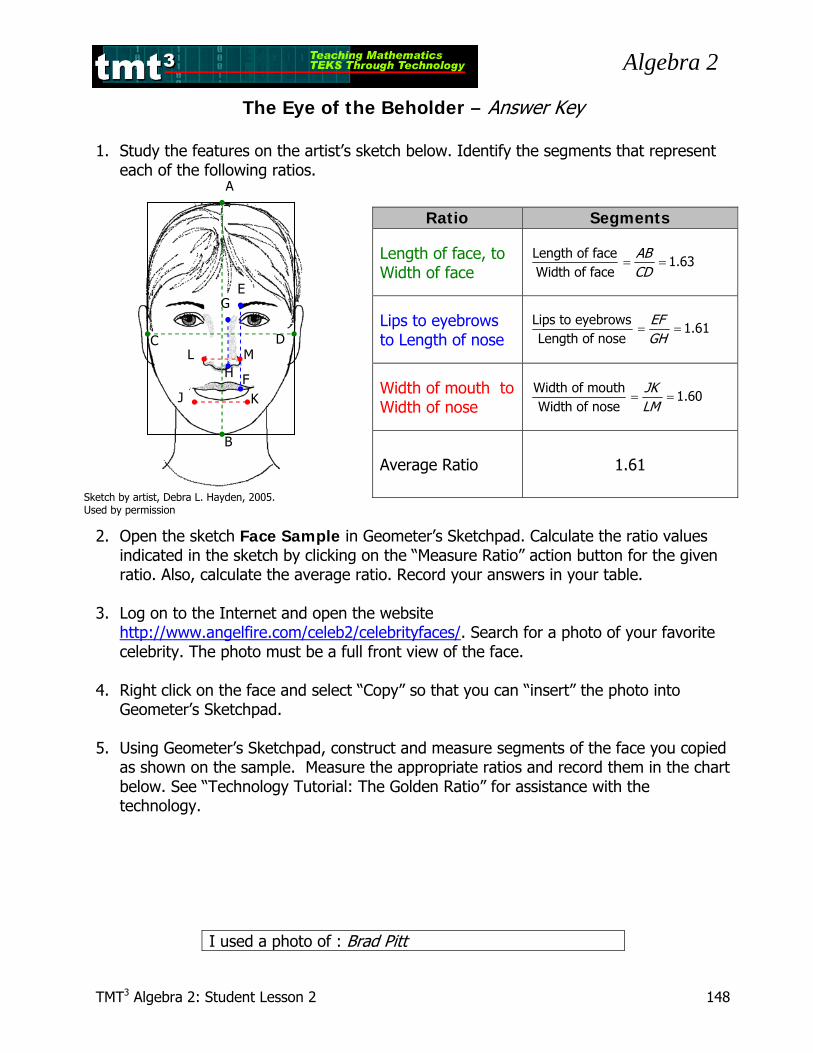
The Eye of the Beholder – Answer Key 1. Study the features on the artist’s sketch below. Identify the segments that represent
each of the following ratios.
2. Open the sketch Face Sample in Geometer’s Sketchpad. Calculate the ratio values indicated in the sketch by clicking on the “Measure Ratio” action button for the given ratio. Also, calculate the average ratio. Record your answers in your table.
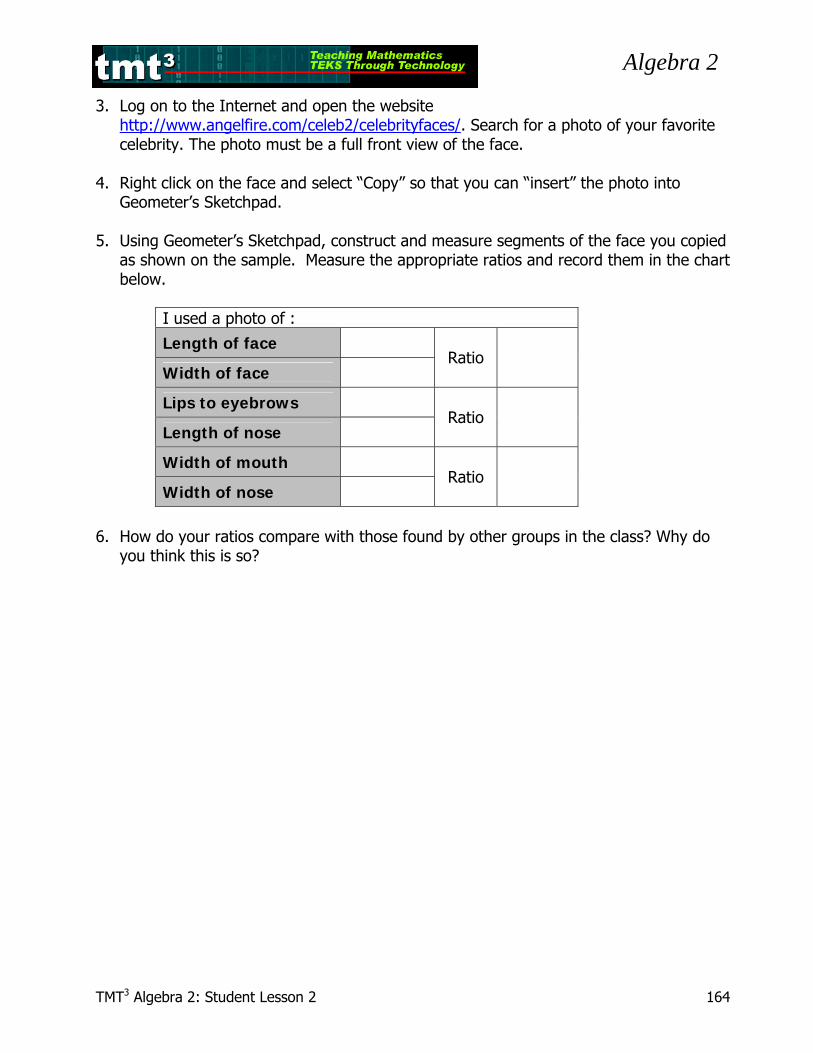
3. Log on to the Internet and open the website
http://www.angelfire.com/celeb2/celebrityfaces/. Search for a photo of your favorite celebrity. The photo must be a full front view of the face.
4. Right click on the face and select “Copy” so that you can “insert” the photo into
Geometer’s Sketchpad. 5. Using Geometer’s Sketchpad, construct and measure segments of the face you copied
as shown on the sample. Measure the appropriate ratios and record them in the chart below. See “Technology Tutorial: The Golden Ratio” for assistance with the technology.
I used a photo of : Brad Pitt
Ratio Segments
Length of face, to Width of face
= =Length of face
1.63Width of face
ABCD
Lips to eyebrows to Length of nose
= =Lips to eyebrows
1.61Length of nose
EFGH
Width of mouth to Width of nose
= =Width of mouth
1.60Width of nose
JKLM
Average Ratio 1.61
A
B
C D
E
F
G
H
J K
L M
Sketch by artist, Debra L. Hayden, 2005. Used by permission
Algebra 2
TMT3 Algebra 2: Student Lesson 2 149
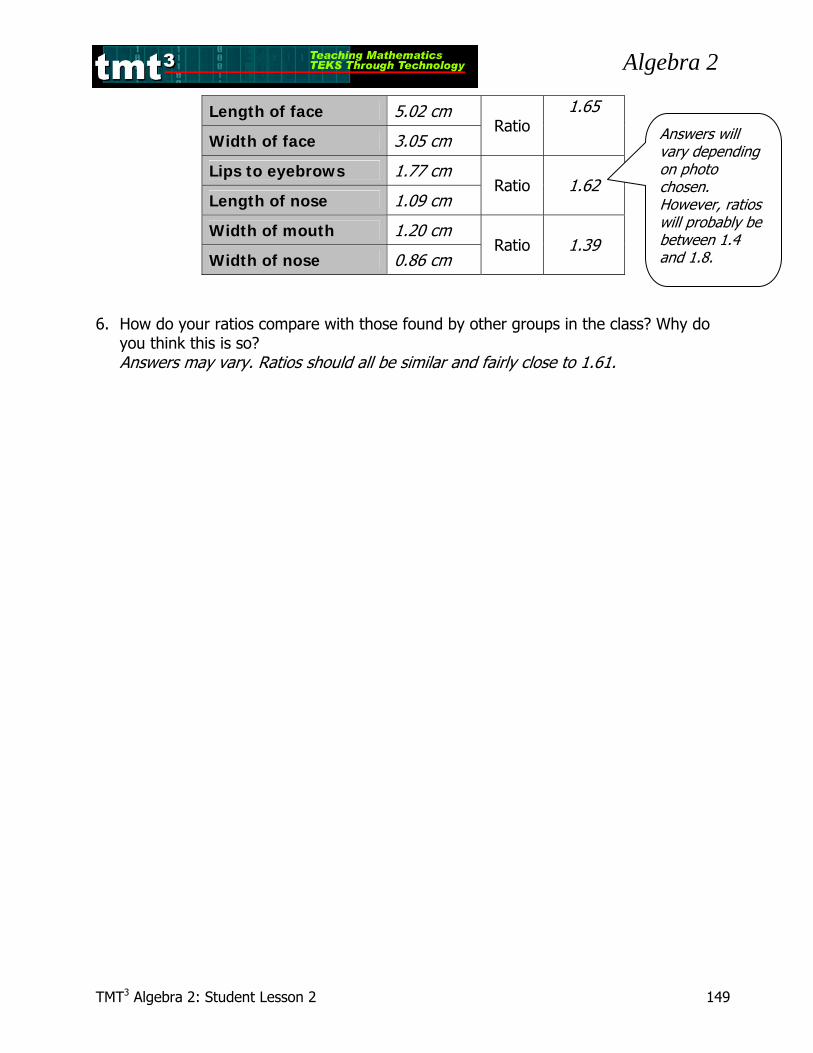
Length of face 5.02 cm
Width of face 3.05 cm Ratio
1.65
Lips to eyebrows 1.77 cm
Length of nose 1.09 cm Ratio 1.62
Width of mouth 1.20 cm
Width of nose 0.86 cm Ratio 1.39
6. How do your ratios compare with those found by other groups in the class? Why do you think this is so? Answers may vary. Ratios should all be similar and fairly close to 1.61.
Answers will vary depending on photo chosen. However, ratios will probably be between 1.4 and 1.8.
Algebra 2
TMT3 Algebra 2: Student Lesson 2 150
H
G
F
E
D
C
B
A
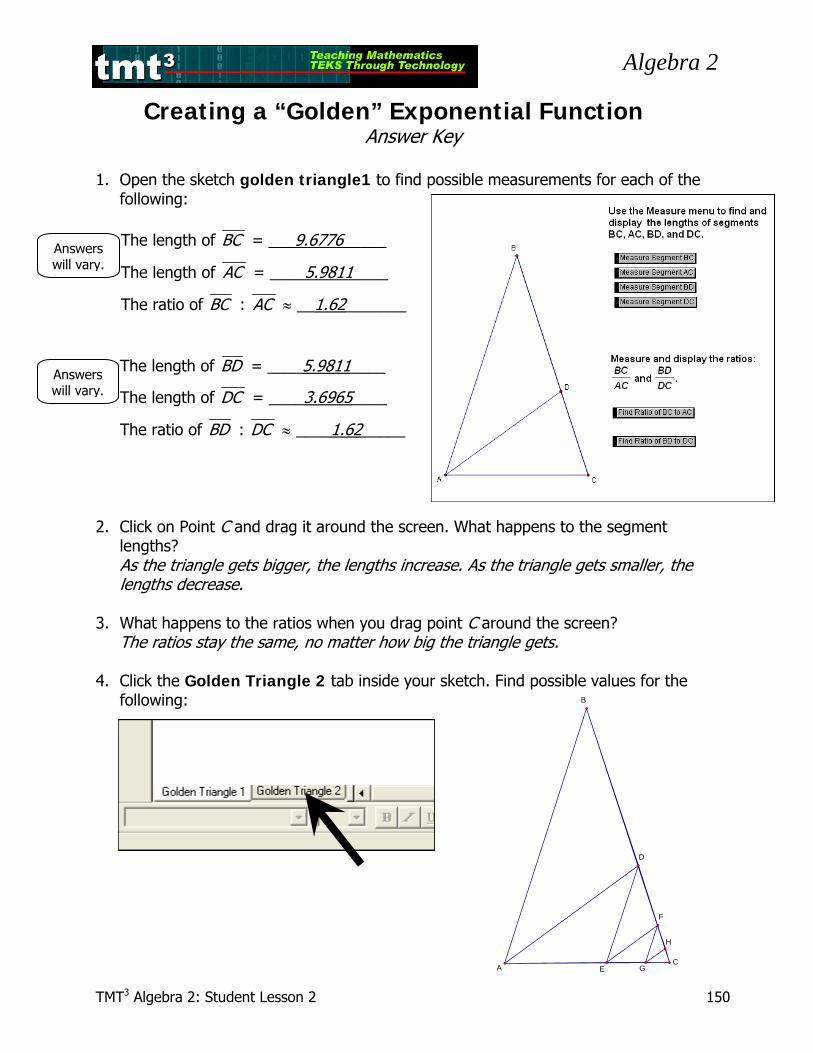
Creating a “Golden” Exponential Function Answer Key
1. Open the sketch golden triangle1 to find possible measurements for each of the
following: The length of BC = ___9.6776_____
The length of AC = ____5.9811____
The ratio of BC : AC ≈ __1.62_______
The length of BD = ____5.9811____
The length of DC = ____3.6965____
The ratio of BD : DC ≈ ____1.62_____ 2. Click on Point C and drag it around the screen. What happens to the segment
lengths? As the triangle gets bigger, the lengths increase. As the triangle gets smaller, the lengths decrease.
3. What happens to the ratios when you drag point C around the screen? The ratios stay the same, no matter how big the triangle gets.
4. Click the Golden Triangle 2 tab inside your sketch. Find possible values for the
following:
Answers will vary.
Answers will vary.
Algebra 2
TMT3 Algebra 2: Student Lesson 2 151
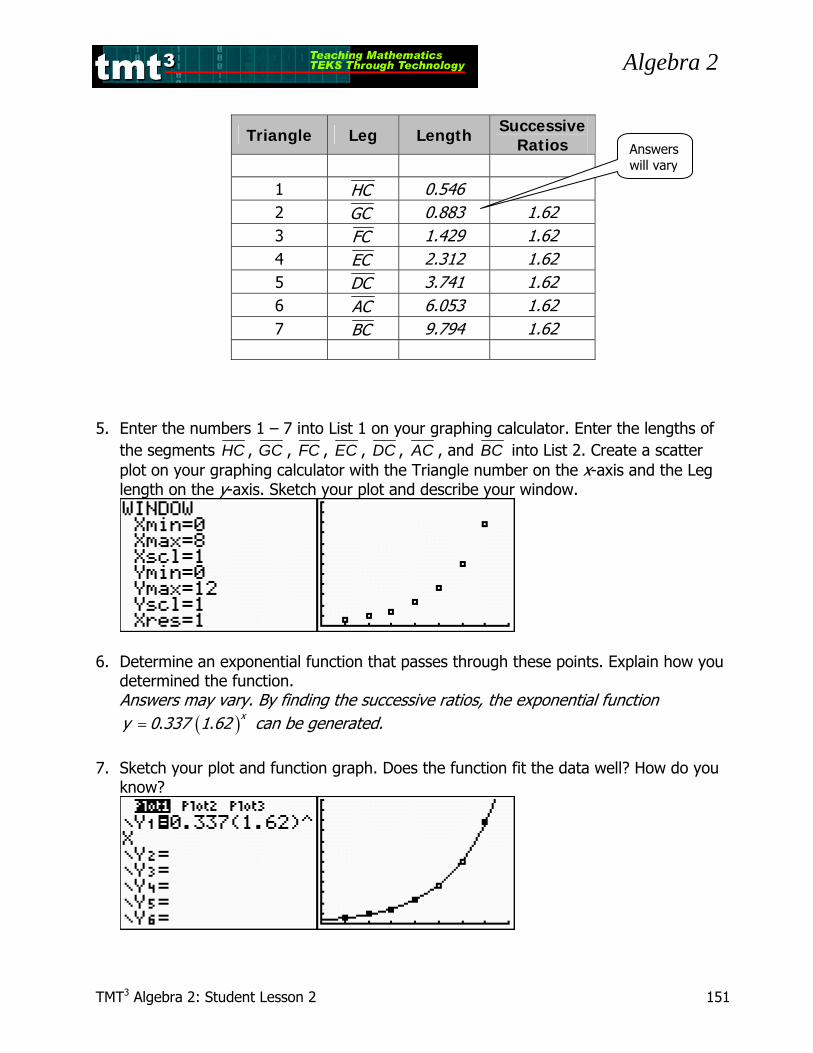
Triangle Leg Length Successive Ratios
1 HC 0.546 2 GC 0.883 1.62 3 FC 1.429 1.62 4 EC 2.312 1.62 5 DC 3.741 1.62 6 AC 6.053 1.62 7 BC 9.794 1.62
5. Enter the numbers 1 – 7 into List 1 on your graphing calculator. Enter the lengths of
the segments HC , GC , FC , EC , DC , AC , and BC into List 2. Create a scatter plot on your graphing calculator with the Triangle number on the x-axis and the Leg length on the y-axis. Sketch your plot and describe your window.
6. Determine an exponential function that passes through these points. Explain how you
determined the function. Answers may vary. By finding the successive ratios, the exponential function
( )= . .xy 0 337 1 62 can be generated.
7. Sketch your plot and function graph. Does the function fit the data well? How do you
know?
Answers will vary
Algebra 2
TMT3 Algebra 2: Student Lesson 2 152
8. What does the coefficient in your function represent in the golden triangle? How did you obtain this value? The coefficient represents the leg length of the “0” triangle, or the one preceding triangle GHC in the sequence. In other words, the coefficient is the initial value when x = 0. I had to divide the first leg length by 1.62 to find the y-value that corresponds with x = 0.
9. What does the base of the power in your function represent in the golden triangle?
The base represents the successive ratio between consecutive terms. In this case, it is the golden ratio rounded to approximately 1.62.
Algebra 2
TMT3 Algebra 2: Student Lesson 2 153
Algebra and the Golden Ratio Answer Key
You have found the exact value of the golden ratio to be 1 5
2+
. Let’s look at how this
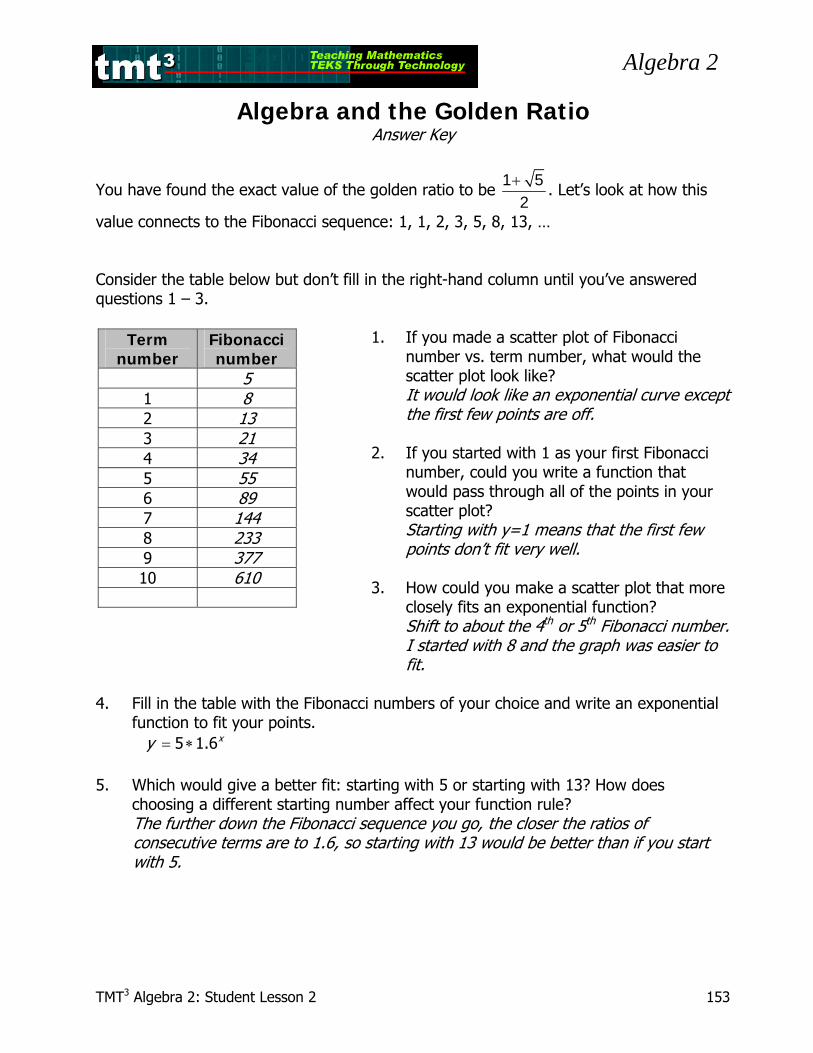
value connects to the Fibonacci sequence: 1, 1, 2, 3, 5, 8, 13, … Consider the table below but don’t fill in the right-hand column until you’ve answered questions 1 – 3.
1. If you made a scatter plot of Fibonacci number vs. term number, what would the scatter plot look like?
It would look like an exponential curve except the first few points are off.
2. If you started with 1 as your first Fibonacci
number, could you write a function that would pass through all of the points in your scatter plot?
Starting with y=1 means that the first few points don’t fit very well.
3. How could you make a scatter plot that more
closely fits an exponential function? Shift to about the 4th or 5th Fibonacci number.
I started with 8 and the graph was easier to fit.
4. Fill in the table with the Fibonacci numbers of your choice and write an exponential
function to fit your points. 5 1.6xy = ∗ 5. Which would give a better fit: starting with 5 or starting with 13? How does
choosing a different starting number affect your function rule? The further down the Fibonacci sequence you go, the closer the ratios of
consecutive terms are to 1.6, so starting with 13 would be better than if you start with 5.
Term number
Fibonacci number
5 1 8 2 13 3 21 4 34 5 55 6 89 7 144 8 233 9 377 10 610
Algebra 2
TMT3 Algebra 2: Student Lesson 2 154
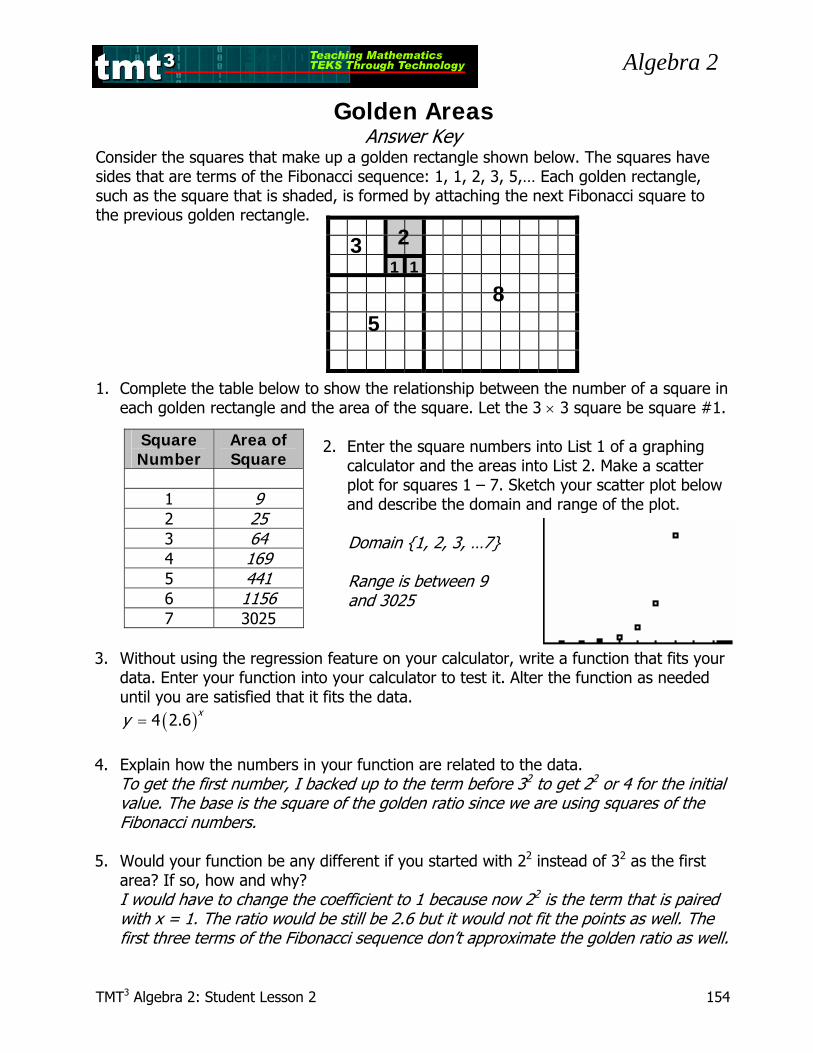
Golden Areas Answer Key
Consider the squares that make up a golden rectangle shown below. The squares have sides that are terms of the Fibonacci sequence: 1, 1, 2, 3, 5,… Each golden rectangle, such as the square that is shaded, is formed by attaching the next Fibonacci square to the previous golden rectangle. 1. Complete the table below to show the relationship between the number of a square in
each golden rectangle and the area of the square. Let the 3 × 3 square be square #1.
2. Enter the square numbers into List 1 of a graphing calculator and the areas into List 2. Make a scatter plot for squares 1 – 7. Sketch your scatter plot below and describe the domain and range of the plot.
Domain {1, 2, 3, …7} Range is between 9 and 3025
3. Without using the regression feature on your calculator, write a function that fits your data. Enter your function into your calculator to test it. Alter the function as needed until you are satisfied that it fits the data.
( )= 4 2.6xy
4. Explain how the numbers in your function are related to the data. To get the first number, I backed up to the term before 32 to get 22 or 4 for the initial
value. The base is the square of the golden ratio since we are using squares of the Fibonacci numbers.
5. Would your function be any different if you started with 22 instead of 32 as the first
area? If so, how and why? I would have to change the coefficient to 1 because now 22 is the term that is paired with x = 1. The ratio would be still be 2.6 but it would not fit the points as well. The first three terms of the Fibonacci sequence don’t approximate the golden ratio as well.
1 1
23
58
Square Number
Area of Square
1 9
2 25
3 64 4 169 5 441 6 1156 7 3025
Algebra 2
TMT3 Algebra 2: Student Lesson 2 155
Sketch by artist, Debra L. Hayden, 2005. Used with permission.
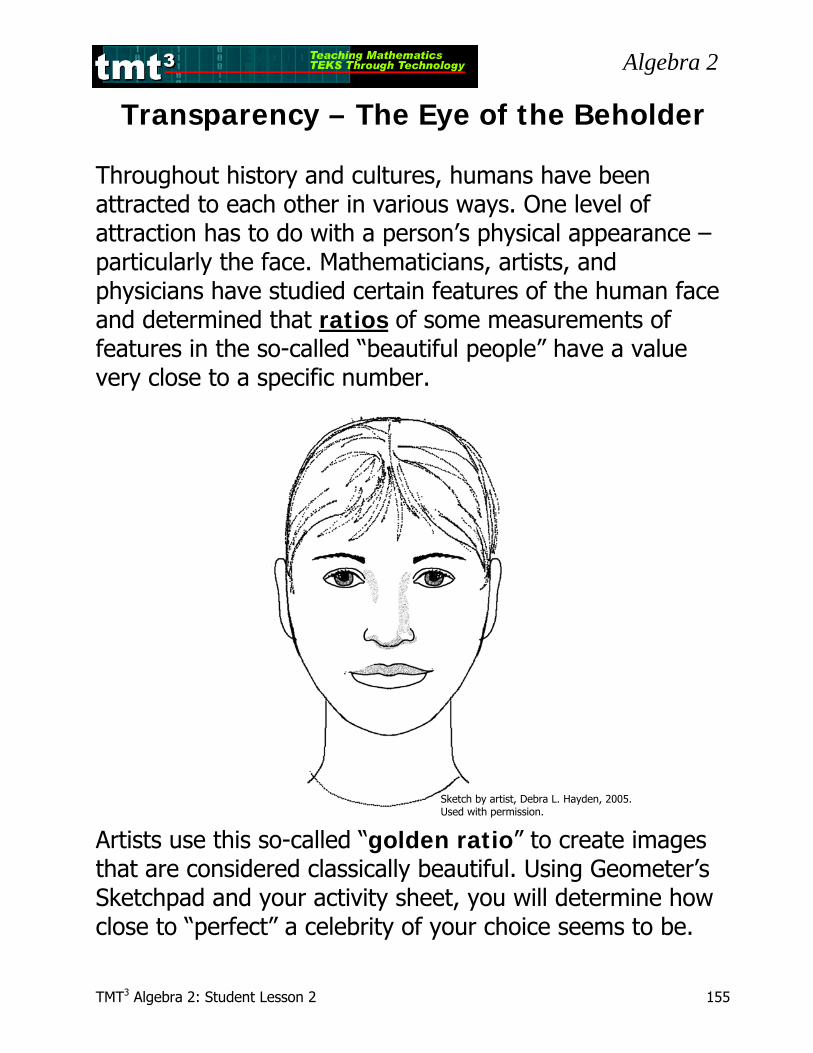
Transparency – The Eye of the Beholder
Throughout history and cultures, humans have been attracted to each other in various ways. One level of attraction has to do with a person’s physical appearance – particularly the face. Mathematicians, artists, and physicians have studied certain features of the human face and determined that ratios of some measurements of features in the so-called “beautiful people” have a value very close to a specific number. Artists use this so-called “golden ratio” to create images that are considered classically beautiful. Using Geometer’s Sketchpad and your activity sheet, you will determine how close to “perfect” a celebrity of your choice seems to be.
Algebra 2
TMT3 Algebra 2: Student Lesson 2 156
Transparency 1 – The Golden Triangle
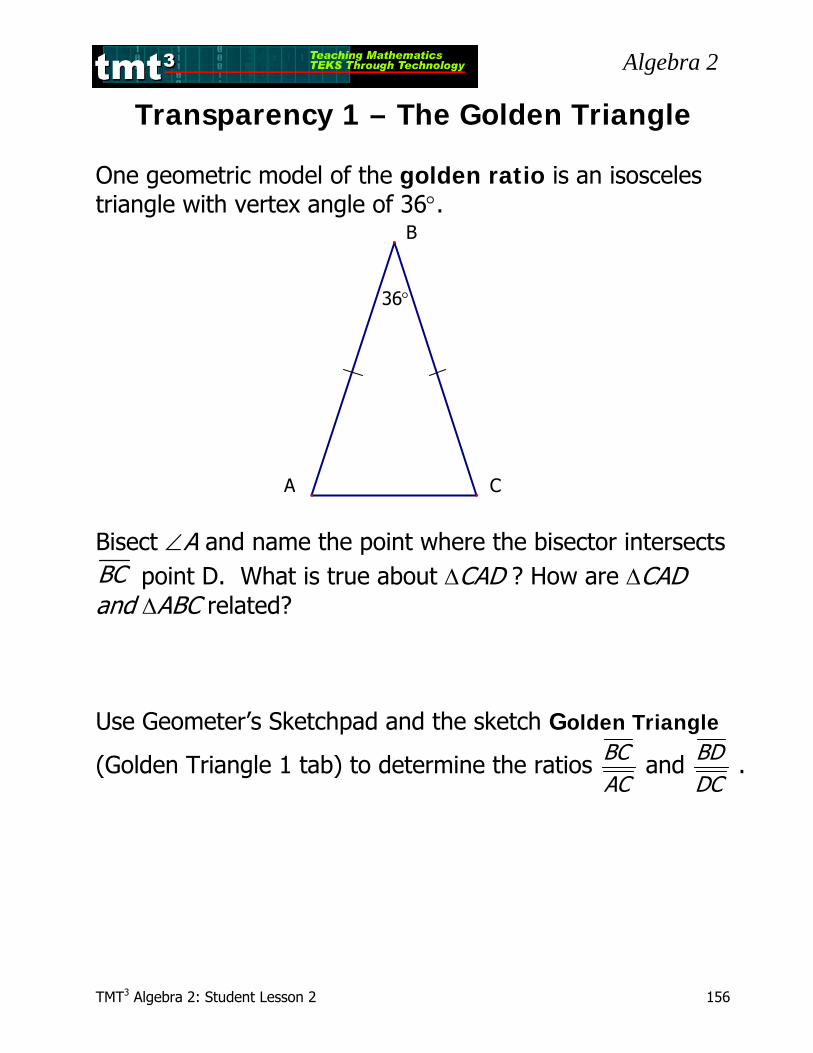
One geometric model of the golden ratio is an isosceles triangle with vertex angle of 36°.
Bisect ∠A and name the point where the bisector intersects BC point D. What is true about ΔCAD ? How are ΔCAD and ΔABC related? Use Geometer’s Sketchpad and the sketch Golden Triangle
(Golden Triangle 1 tab) to determine the ratios BCAC
and BDDC
.
CA
BB
CA
36°
Algebra 2
TMT3 Algebra 2: Student Lesson 2 157
H
G
F
E
D
C
B
A
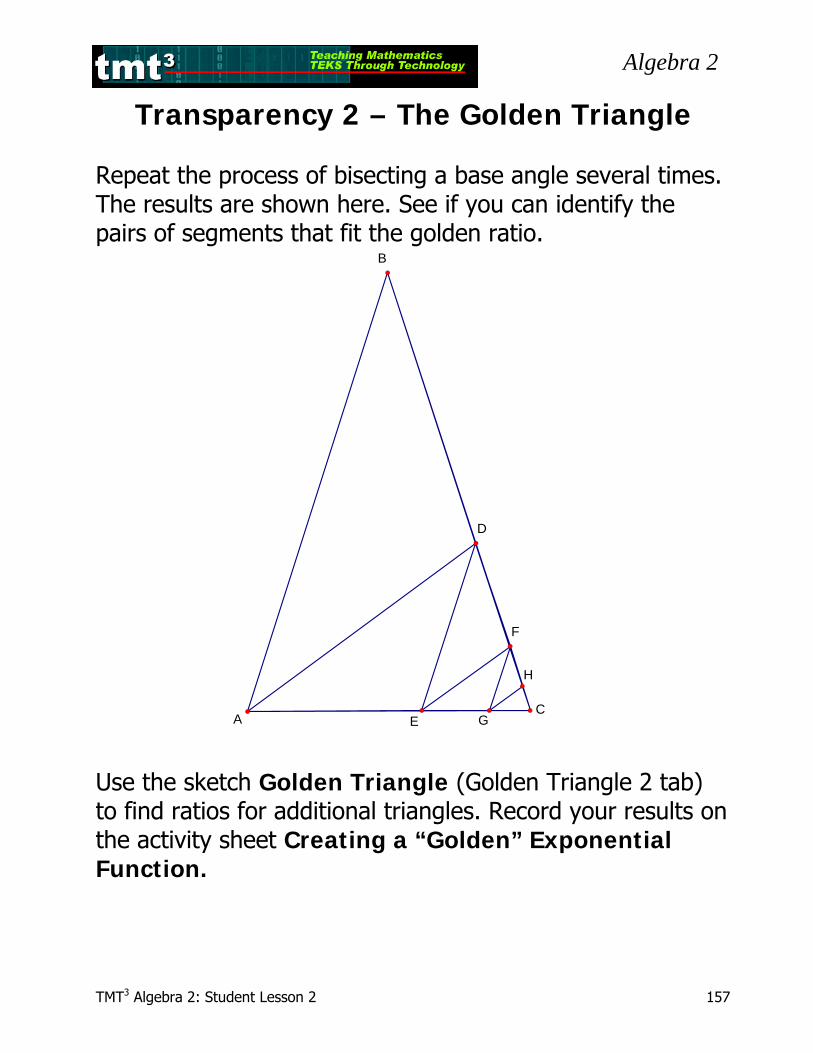
Transparency 2 – The Golden Triangle
Repeat the process of bisecting a base angle several times. The results are shown here. See if you can identify the pairs of segments that fit the golden ratio. Use the sketch Golden Triangle (Golden Triangle 2 tab) to find ratios for additional triangles. Record your results on the activity sheet Creating a “Golden” Exponential Function.
Algebra 2
TMT3 Algebra 2: Student Lesson 2 158
Transparency 3 – The Golden Section
Consider the sequence of numbers: 1, 1, 2, 3, 5, 8, 13, 21, 34, 55, 89, 144, … After the first number, the ratios of any
number to the preceding number eventually
approximate what we call the “golden ratio”.
The sequence of numbers was discovered by
Leonardo Fibonacci around 1200 A.D.
Algebra 2
TMT3 Algebra 2: Student Lesson 2 159
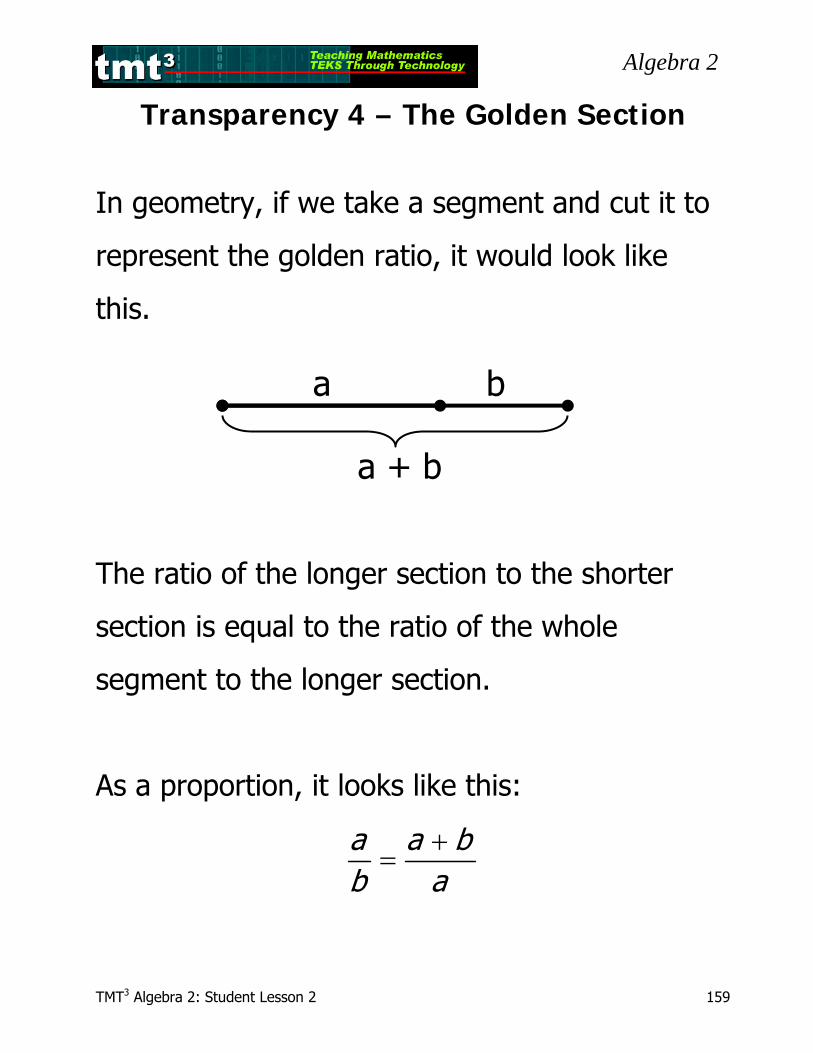
Transparency 4 – The Golden Section
In geometry, if we take a segment and cut it to
represent the golden ratio, it would look like
this.
The ratio of the longer section to the shorter
section is equal to the ratio of the whole
segment to the longer section.
As a proportion, it looks like this:
a a bb a
+=
a b
a + b
Algebra 2
TMT3 Algebra 2: Student Lesson 2 160
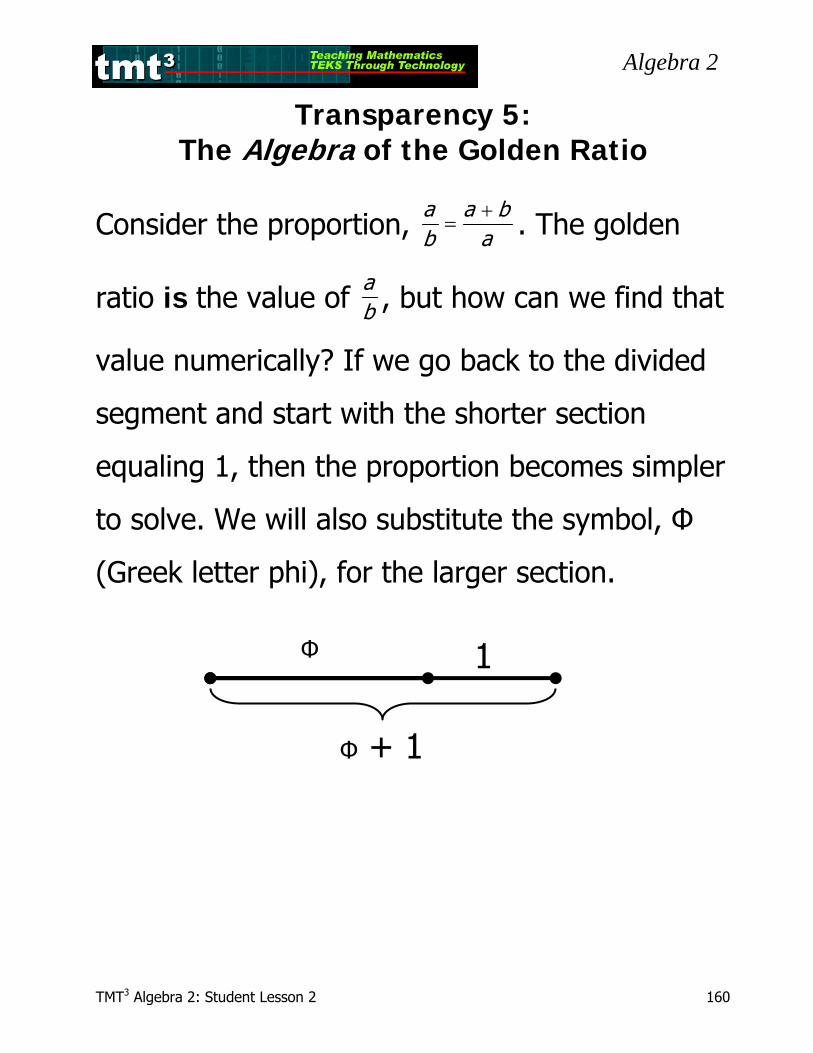
Transparency 5: The Algebra of the Golden Ratio
Consider the proportion, a a bb a
+= . The golden
ratio is the value of ab , but how can we find that
value numerically? If we go back to the divided
segment and start with the shorter section
equaling 1, then the proportion becomes simpler
to solve. We will also substitute the symbol, Φ
(Greek letter phi), for the larger section.
Φ 1
Φ + 1
Algebra 2
TMT3 Algebra 2: Student Lesson 2 161
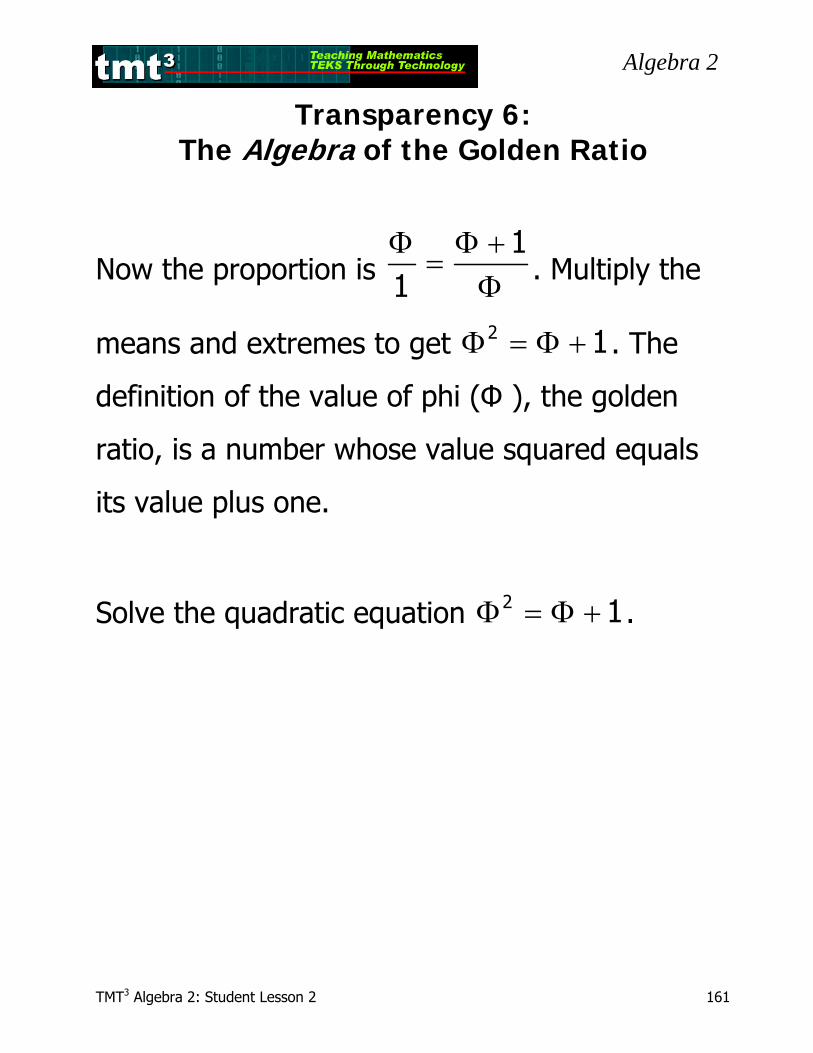
Transparency 6: The Algebra of the Golden Ratio
Now the proportion is Φ Φ +
=Φ
11 . Multiply the
means and extremes to get Φ = Φ +2 1. The
definition of the value of phi (Φ ), the golden
ratio, is a number whose value squared equals
its value plus one.
Solve the quadratic equation Φ = Φ +2 1.
Algebra 2
TMT3 Algebra 2: Student Lesson 2 162
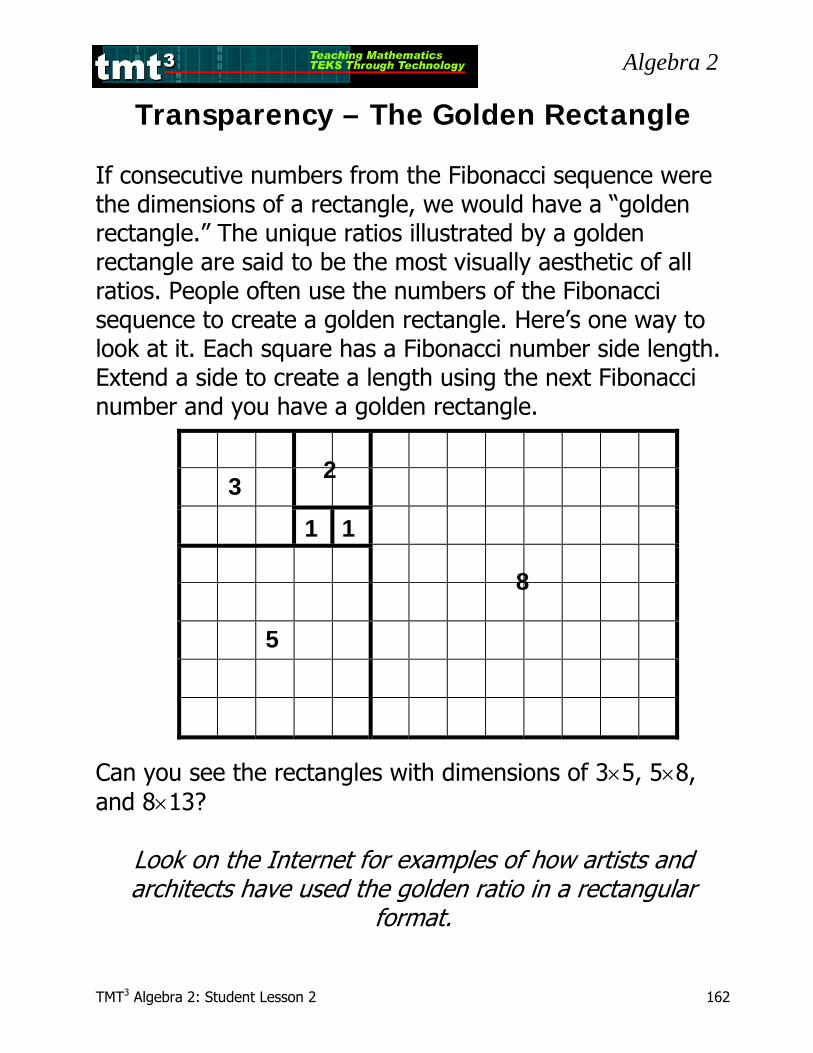
Transparency – The Golden Rectangle If consecutive numbers from the Fibonacci sequence were the dimensions of a rectangle, we would have a “golden rectangle.” The unique ratios illustrated by a golden rectangle are said to be the most visually aesthetic of all ratios. People often use the numbers of the Fibonacci sequence to create a golden rectangle. Here’s one way to look at it. Each square has a Fibonacci number side length. Extend a side to create a length using the next Fibonacci number and you have a golden rectangle.
Can you see the rectangles with dimensions of 3×5, 5×8, and 8×13?
Look on the Internet for examples of how artists and architects have used the golden ratio in a rectangular
format.
1 1
23
5
8
Algebra 2
TMT3 Algebra 2: Student Lesson 2 163
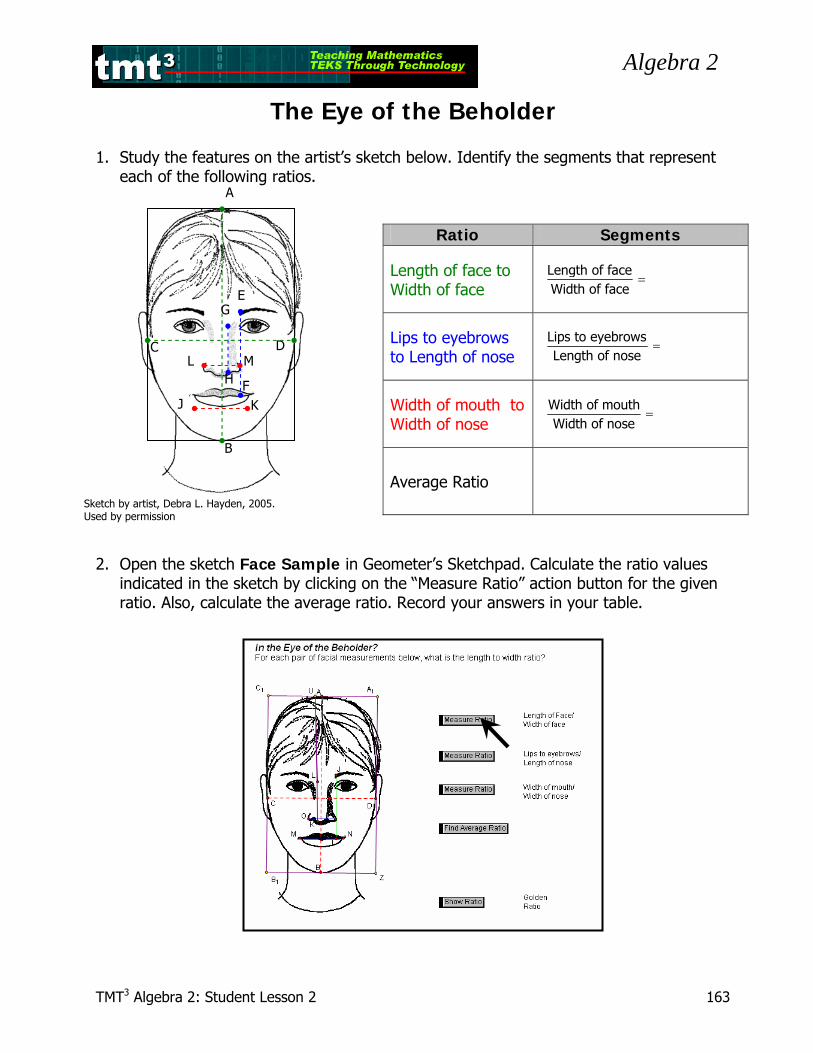
The Eye of the Beholder 1. Study the features on the artist’s sketch below. Identify the segments that represent
each of the following ratios.
Ratio Segments
Length of face to Width of face
Length of faceWidth of face
=
Lips to eyebrows to Length of nose
=Lips to eyebrowsLength of nose
Width of mouth to Width of nose
=Width of mouthWidth of nose
Average Ratio
2. Open the sketch Face Sample in Geometer’s Sketchpad. Calculate the ratio values indicated in the sketch by clicking on the “Measure Ratio” action button for the given ratio. Also, calculate the average ratio. Record your answers in your table.
A
B
C D
E
F
G
H
J K
L M
Sketch by artist, Debra L. Hayden, 2005. Used by permission
Algebra 2
TMT3 Algebra 2: Student Lesson 2 164
3. Log on to the Internet and open the website http://www.angelfire.com/celeb2/celebrityfaces/. Search for a photo of your favorite celebrity. The photo must be a full front view of the face.
4. Right click on the face and select “Copy” so that you can “insert” the photo into
Geometer’s Sketchpad. 5. Using Geometer’s Sketchpad, construct and measure segments of the face you copied
as shown on the sample. Measure the appropriate ratios and record them in the chart below.
I used a photo of :
Length of face
Width of face Ratio
Lips to eyebrows
Length of nose Ratio
Width of mouth
Width of nose Ratio
6. How do your ratios compare with those found by other groups in the class? Why do
you think this is so?
Algebra 2
TMT3 Algebra 2: Student Lesson 2 165
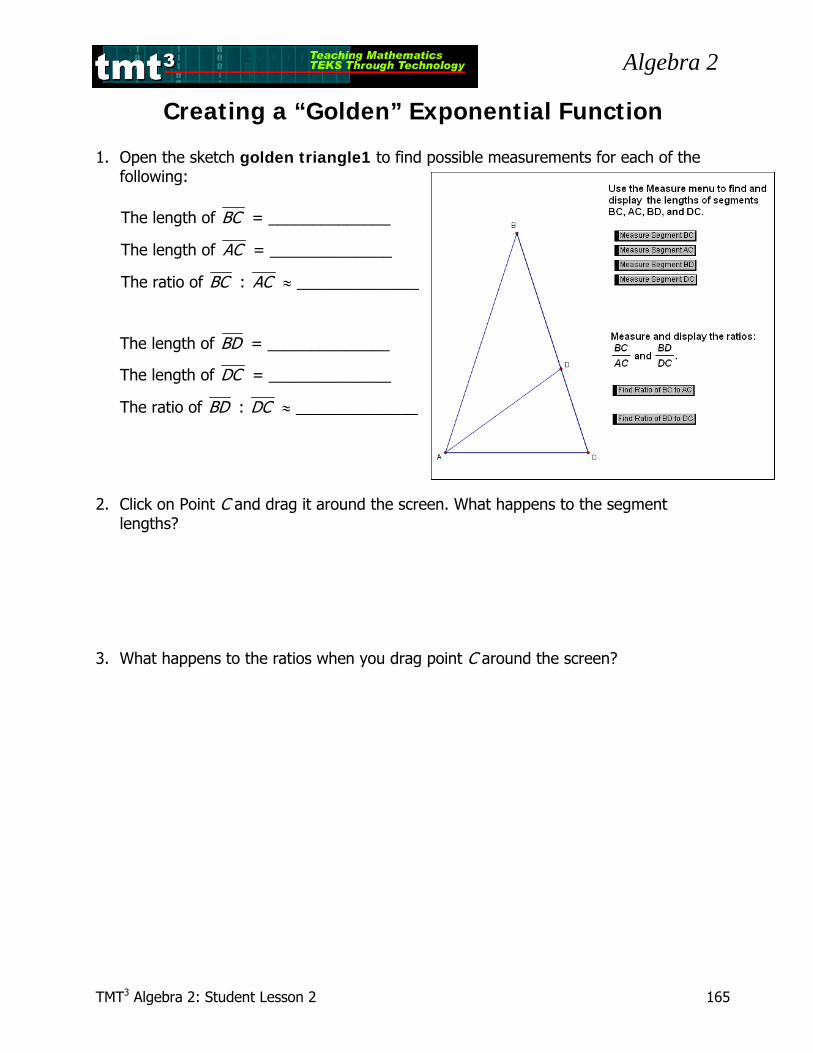
Creating a “Golden” Exponential Function 1. Open the sketch golden triangle1 to find possible measurements for each of the
following: The length of BC = ______________
The length of AC = ______________
The ratio of BC : AC ≈ ______________
The length of BD = ______________
The length of DC = ______________
The ratio of BD : DC ≈ ______________ 2. Click on Point C and drag it around the screen. What happens to the segment
lengths?
3. What happens to the ratios when you drag point C around the screen?
Algebra 2
TMT3 Algebra 2: Student Lesson 2 166
H
G
F
E
D
C
B
A
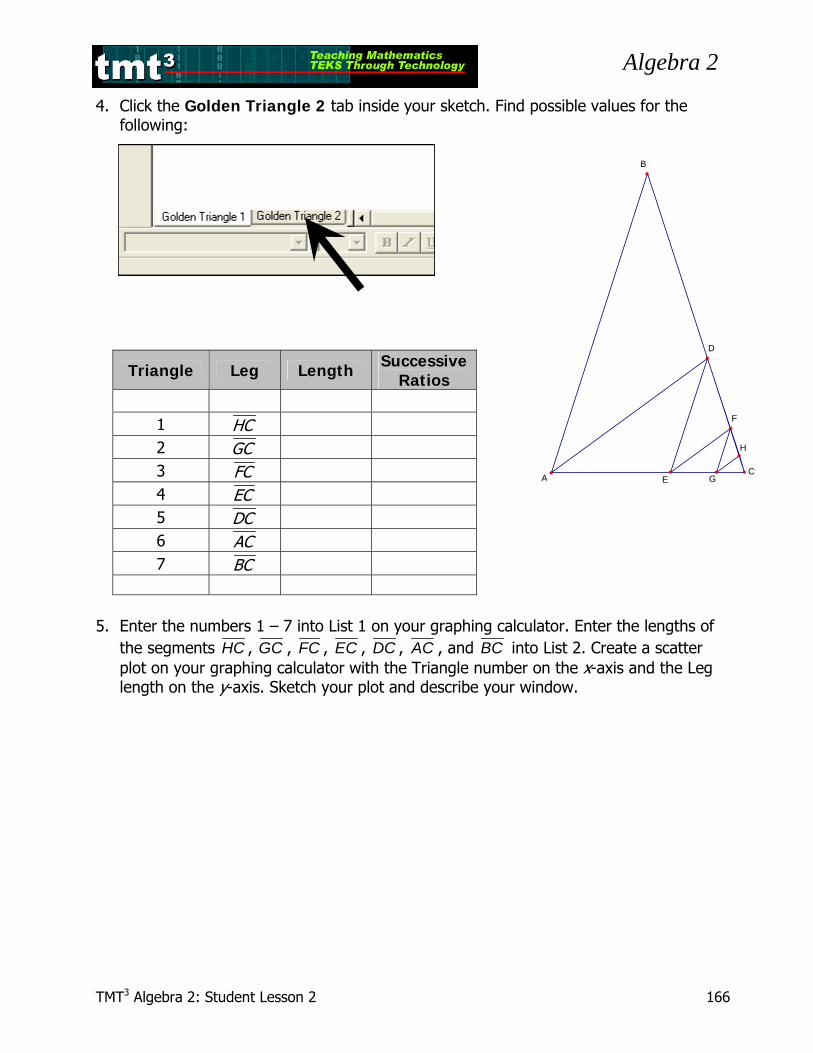
4. Click the Golden Triangle 2 tab inside your sketch. Find possible values for the following:
5. Enter the numbers 1 – 7 into List 1 on your graphing calculator. Enter the lengths of
the segments HC , GC , FC , EC , DC , AC , and BC into List 2. Create a scatter plot on your graphing calculator with the Triangle number on the x-axis and the Leg length on the y-axis. Sketch your plot and describe your window.
Triangle Leg Length Successive Ratios
1 HC 2 GC 3 FC 4 EC 5 DC 6 AC 7 BC
Algebra 2
TMT3 Algebra 2: Student Lesson 2 167
6. Determine an exponential function that passes through these points. Explain how you determined the function.
7. Sketch your plot and function graph. Does the function fit the data well? How do you
know?
8. What does the coefficient in your function represent in the golden triangle? How did you obtain this value?
9. What does the base of the power in your function represent in the golden triangle?
Algebra 2
TMT3 Algebra 2: Student Lesson 2 168
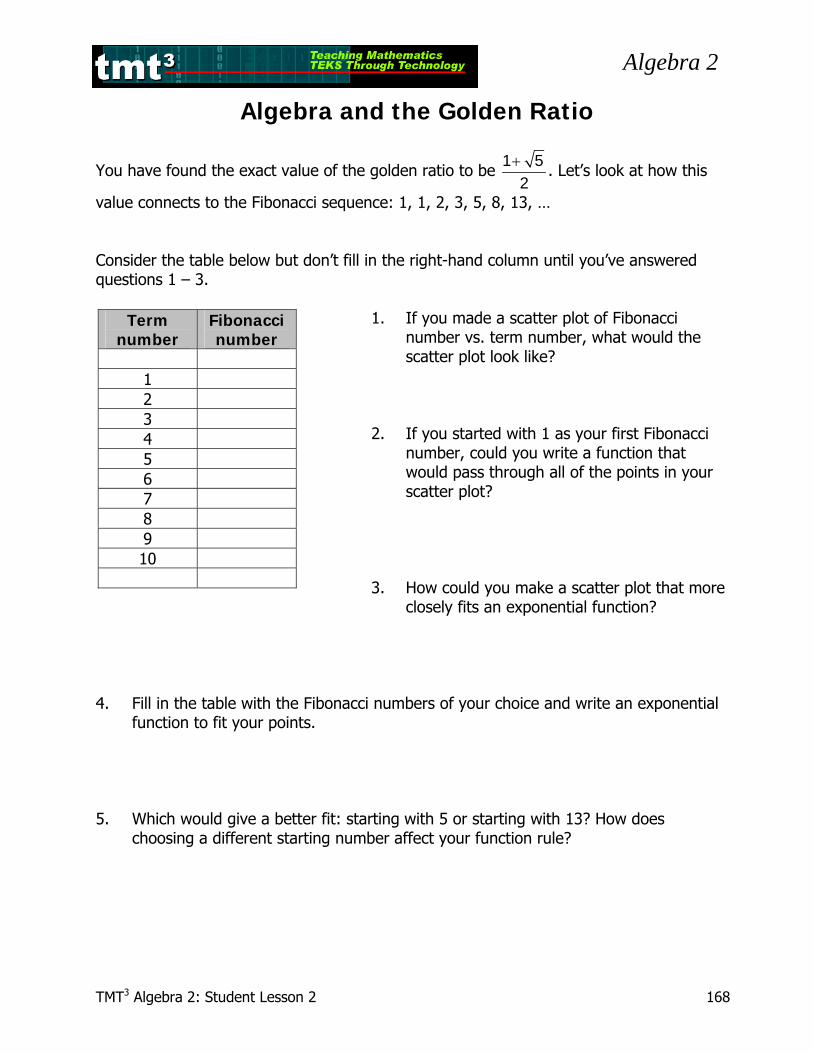
Algebra and the Golden Ratio
You have found the exact value of the golden ratio to be 1 5
2+
. Let’s look at how this
value connects to the Fibonacci sequence: 1, 1, 2, 3, 5, 8, 13, … Consider the table below but don’t fill in the right-hand column until you’ve answered questions 1 – 3.
1. If you made a scatter plot of Fibonacci number vs. term number, what would the scatter plot look like?
2. If you started with 1 as your first Fibonacci
number, could you write a function that would pass through all of the points in your scatter plot?
3. How could you make a scatter plot that more
closely fits an exponential function?
4. Fill in the table with the Fibonacci numbers of your choice and write an exponential
function to fit your points. 5. Which would give a better fit: starting with 5 or starting with 13? How does
choosing a different starting number affect your function rule?
Term number
Fibonacci number
1 2 3 4 5 6 7 8 9 10
Algebra 2
TMT3 Algebra 2: Student Lesson 2 169
The Golden Ratio in Art and Architecture Search the Internet using key words “golden ratio” and “art” or “architecture.” Find one example of how the golden ratio is used in art and one example of its use in architecture. Record at least the following information for each example. Art Example The artist is/was ____________________________
The name of the painting, sculpture, etc. is ___________________
Give a brief description or simple sketch of how the golden ratio is used in this work.
Architecture Example The architect is/was _________________________(or give country where it is located)
The name of the painting, sculpture, etc. is ___________________
Give a brief description or simple sketch of how the golden ratio is used in this structure.
Algebra 2
TMT3 Algebra 2: Student Lesson 2 170
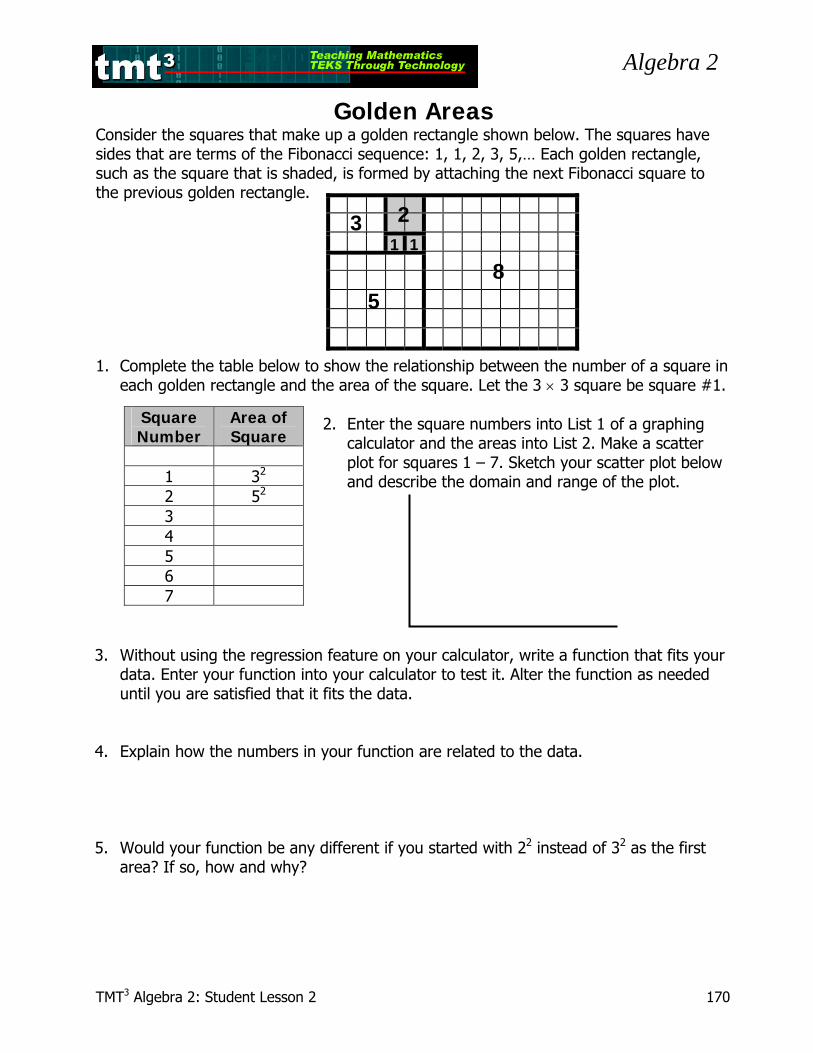
Golden Areas Consider the squares that make up a golden rectangle shown below. The squares have sides that are terms of the Fibonacci sequence: 1, 1, 2, 3, 5,… Each golden rectangle, such as the square that is shaded, is formed by attaching the next Fibonacci square to the previous golden rectangle. 1. Complete the table below to show the relationship between the number of a square in
each golden rectangle and the area of the square. Let the 3 × 3 square be square #1.
2. Enter the square numbers into List 1 of a graphing calculator and the areas into List 2. Make a scatter plot for squares 1 – 7. Sketch your scatter plot below and describe the domain and range of the plot.
3. Without using the regression feature on your calculator, write a function that fits your data. Enter your function into your calculator to test it. Alter the function as needed until you are satisfied that it fits the data.
4. Explain how the numbers in your function are related to the data. 5. Would your function be any different if you started with 22 instead of 32 as the first
area? If so, how and why?
1 1
23
58
Square Number
Area of Square
1 32
2 52
3 4 5 6 7
Algebra 2
TMT3 Algebra 2: Student Lesson 2 171
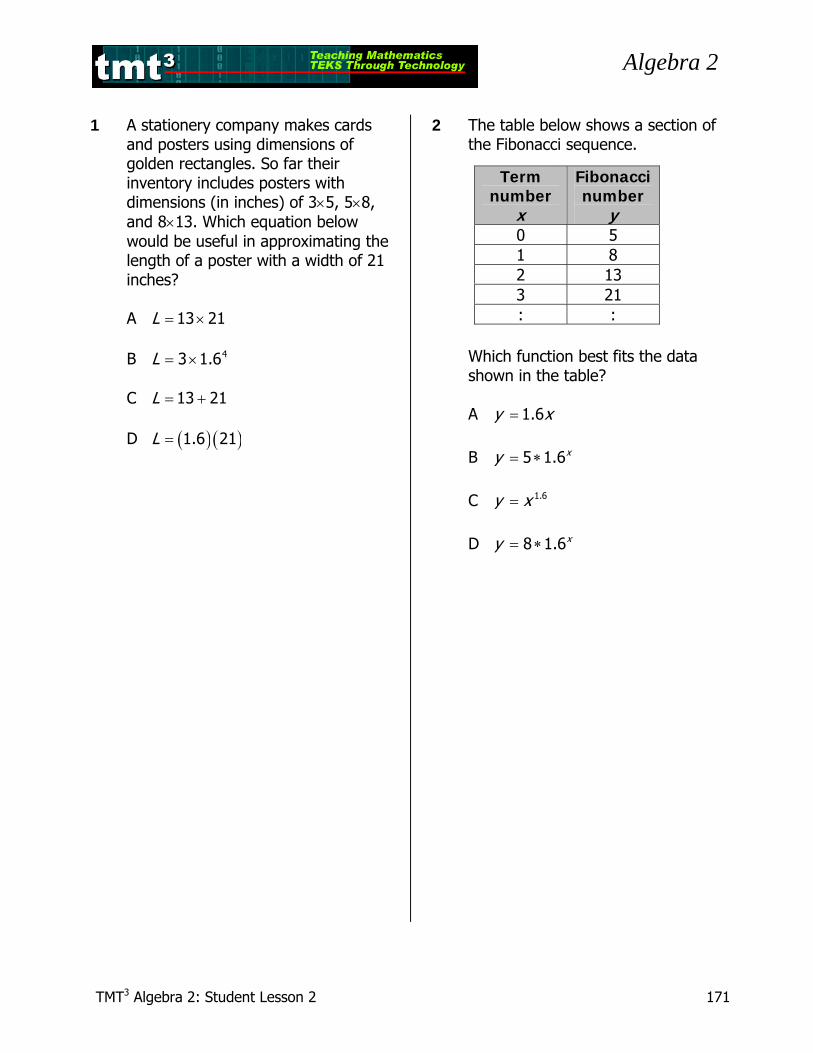
1 A stationery company makes cards
and posters using dimensions of golden rectangles. So far their inventory includes posters with dimensions (in inches) of 3×5, 5×8, and 8×13. Which equation below would be useful in approximating the length of a poster with a width of 21 inches?
A 13 21L = ×
B 43 1.6L = ×
C 13 21L = +
D ( ) ( )1.6 21L =
2 The table below shows a section of the Fibonacci sequence.
Which function best fits the data
shown in the table? A 1.6y x=
B 5 1.6xy = ∗
C 1.6y x=
D 8 1.6xy = ∗
Term number
x
Fibonacci number
y 0 5 1 8 2 13 3 21 : :
Algebra 2
TMT3 Algebra 2: Student Lesson 2 172
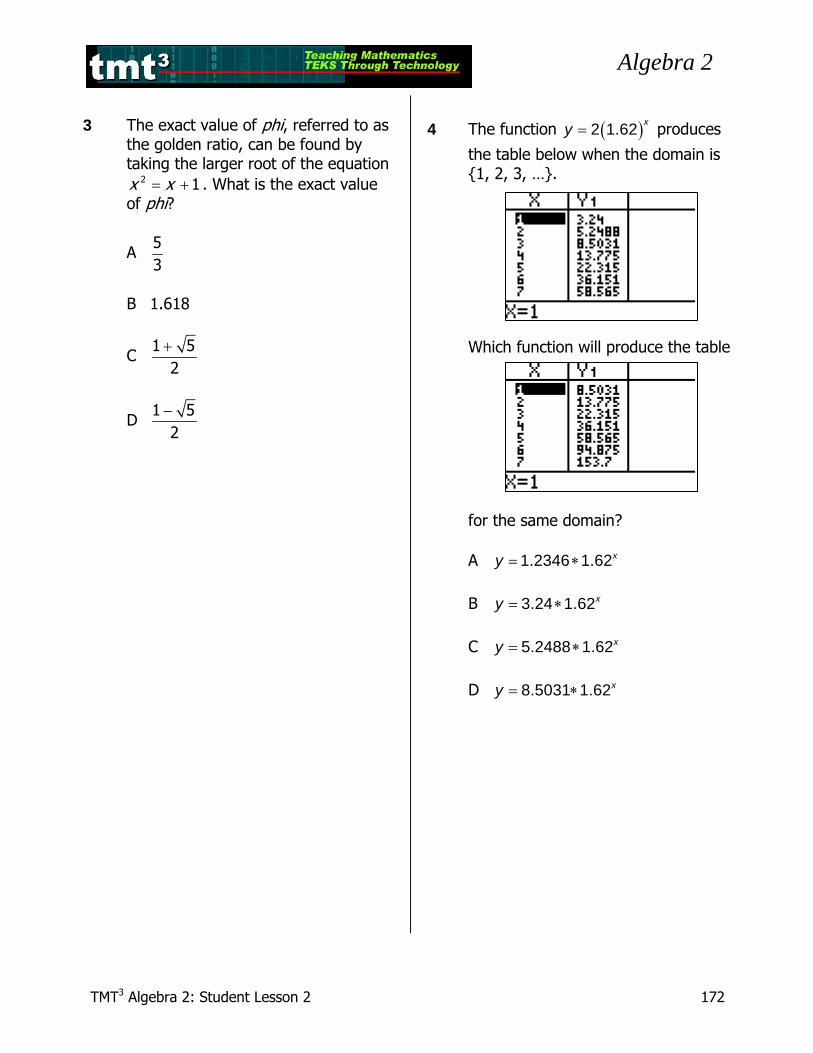
3 The exact value of phi, referred to as
the golden ratio, can be found by taking the larger root of the equation
2 1x x= + . What is the exact value of phi?
A 53
B 1.618
C 1 5
2+
D 1 5
2−
4 The function ( )2 1.62 xy = produces
the table below when the domain is {1, 2, 3, …}.
Which function will produce the table for the same domain? A 1.2346 1.62xy = ∗ B 3.24 1.62xy = ∗ C 5.2488 1.62xy = ∗ D 8.5031 1.62xy = ∗