amping up electric vehicle manufacturing in the pnw
TRANSCRIPT

1
Seattle Jobs Initiative 1200 12TH AVENUE SOUTH | SEATTLE, WASHINGTON
Amping Up Electric Vehicle Manufacturing in the PNW
OPPORTUNITIES FOR BUSINESS, WORKFORCE, AND EDUCATION

2
Contents Contents ........................................................................................................................................................ 2
Tables ............................................................................................................................................................ 3
Figures .......................................................................................................................................................... 3
Abbreviations ................................................................................................................................................ 4
Executive Summary ...................................................................................................................................... 5
The Openings for New Business that Electric Vehicle Production Can Create ............................................ 8
Good News: The Barriers to Entry Are Lower in EV-Related Industries ................................................... 9
Who Could Enter the EV Field? The Supply Chain in More Detail ......................................................... 10
Existing and Potential Businesses in the EV-Related Industries ................................................................ 13
Identifying EV-Related Firms in Oregon and Washington ....................................................................... 13
Identified Firms in the Region .................................................................................................................. 14
Volume of Business in the Region .......................................................................................................... 18
The Current and Future Workforce in the EV-Related Industries ............................................................... 20
The Occupational Infrastructure Exists: Workers in EV-Related Occupations ....................................... 25
Challenges that Workforce Development Faces: Low Education Occupations Will Grow Slowest ........ 29
Demographics of Workers Highlight the Need for Workforce Development Initiatives ........................... 31
Key Partners for Innovation in Workforce Development ............................................................................. 38
Recommendations ...................................................................................................................................... 44
References .................................................................................................................................................. 46
Appendix A .................................................................................................................................................. 49
Appendix B .................................................................................................................................................. 50
Appendix C .................................................................................................................................................. 66
Appendix D .................................................................................................................................................. 67
Appendix E .................................................................................................................................................. 69
Appendix F .................................................................................................................................................. 72

3
Tables Table 1. NAICS Codes for Manufacturing of EV Components ................................................................... 12 Table 2. EV-Related Manufacturers ............................................................................................................ 16 Table 3. Industry Purchases and Sales in Oregon and Washington in 2018: All Motor Vehicle Industry .. 18 Table 4. Electric Motor Vehicle-Related Industry Purchases and Sales in Oregon and Washington in 2018
.................................................................................................................................................................... 19 Table 5. Predicted Change in Jobs in Electric Motor Vehicle-Related Industries in 2019-2025 ................ 22 Table 6. Electric Motor Vehicle-Related Occupations in Oregon ................................................................ 25 Table 7. Electric Motor Vehicle-Related Occupations in Washington......................................................... 27 Table 8. Required Education and Experience in Electric Motor Vehicle-Related Occupations .................. 30 Table 9. Projected Growth in Electric Motor Vehicle-Related Occupations ................................................ 31 Table 10. Share of Women in Electric Motor Vehicle-Related Occupations by Subgroup in Oregon,
Washington, and the United States, 2019 (Growth in Jobs in Parenthesis) ............................................... 36 Table 11. Share of People of Color in Electric Motor Vehicle-Related Occupations by Subgroup in
Oregon, Washington, and the United States, 2019 .................................................................................... 37 Table 12. Share of Women and People of Color in Electric Motor Vehicle-Related Occupations by
Expected Growth between 2019-2025, Oregon and Washington .............................................................. 37 Table 13. Occupations in Decline in Oregon and Washington (combined), 2019 ...................................... 39 Table 14. Completions in EV-related Programs in Oregon and Washington, 2018 ................................... 42
Figures Figure 1. Comparison of Chevy Bolt and Comparable ICE Car Components ............................................ 11 Figure 2. Map of EV-Related Manufacturing in Oregon & Washington ...................................................... 15 Figure 3. Projected Change in Electric Motor Vehicle-Related Industries ................................................. 21 Figure 4. Occupational Makeup of Electric Motor Vehicle-Related Industries in Oregon, 2019 ................. 23 Figure 5. Occupational Makeup of Electric Motor Vehicle-Related Industries in Washington, 2019 .......... 24 Figure 6. Gender Distribution of Electric Motor Vehicle –related Occupations in OR and WA, 2019 ........ 32 Figure 7. Gender Distribution of Electric Motor Vehicle –related Occupations in OR and WA, and in
Overall OR and WA Workforce, 2019 ......................................................................................................... 32 Figure 8. Race and Ethnicity Distribution of Electric Motor Vehicle-Related Occupations in Oregon and
Washington and the US, 2019 .................................................................................................................... 33 Figure 9. Race and Ethnicity Distribution of Electric Motor Vehicle-Related Occupations in Oregon and
Washington and Overall in Oregon and Washington Workforce, 2019 ...................................................... 34 Figure 10. Age Breakdown of Electric Motor Vehicle-Related Occupations in Oregon, Washington, and
the United States, 2019 ............................................................................................................................... 35 Figure 11. Age Breakdown of Electric Motor Vehicle-Related Occupations in Oregon and Washington,
and in Overall Oregon and Washington Workforce, 2019 .......................................................................... 35

4
Abbreviations EV………………………………………………………….……………………….…….............…Electric Vehicle
ET………………………………………………………….…………………………………………..Electric Truck
GST…………………………………………………….……………………………...General Service Technician
I-BEST…….………………………………………….……….…Integrated Basic Education and Skills Training
ICE……...……………………………………………………………………………Internal Combustion Engines
NAICS…………………………………………….….………….North American Industry Classification System
OEM………………………………………………….………………………….Original Equipment Manufacturer
PSADA……………………………………………………..…Puget Sound Automotive Dealership Association
SJI…………………………………………………….……………………………………….Seattle Jobs Initiative
ZEB……………………………………………………….…………………………………….Zero-Emissions Bus

5
Executive Summary
Both Oregon and Washington are national leaders in adopting and supporting climate change policies
and initiatives. A key component in both states’ broader climate strategy is the electrification of
transportation. Only by significantly increasing the share of electric passenger and commercial cars (EVs)
on the roads will the states be able to reduce their greenhouse gas emissions and meet their climate
goals.
This report addresses the capacity of Oregon and Washington to advance the electrification of their
transportation systems through economic and workforce development strategies. The report analyzes the
existing EV manufacturing sector in the two states and its capacity for growth, as well as the current
workforce and training programs in the EV field. The analysis suggests that Oregon and Washington are
well positioned to attract new EV-related business, given the existing activity in the field and the strength
of well-established regional tech and aerospace sectors, both of which offer potential synergies in the
production of EVs.
Despite the strength and potential of EV manufacturing in the two states, additional workforce initiatives
are needed to ensure the field is more equitable and sustainable. In particular, women and people of
color are currently over-represented in EV-related occupations with negative economic outlook. By
designing and implementing training initiatives that increase access to promising career paths, and by
working with the private and education sectors to develop EV specific curricula, the public sector can help
build a pipeline of qualified and diverse workers to support the growth of EV business in the region.
Key Findings Supply chains are developing, making room for new businesses. The production of electric motor
vehicles, including passenger and commercial fleets, is undergoing dramatic changes due to
technological innovations and new business models in the field. Many of the main components of EVs are
not among the key competencies of traditional car manufacturers. Consequently, the barriers to entry to
EV manufacturing are low, and new small- and medium-sized companies that have been excluded from
the traditional car supply chain have more room to enter the market.
Oregon and Washington have existing EV business and the potential for growth. This report draws
from existing work and original research to identify 39 companies in Oregon and Washington in the EV
field. The companies include large multinational corporations, such as Daimler in Oregon and Paccar and
its subsidiary Kenworth Trucks in Washington, and smaller businesses such as custom car producers
Arcimoto in Oregon and Commuter Cars Corporation in Washington. The number of identified companies
with explicit connections to the EV supply chain does not fully reflect the region’s potential to EV
manufacturing, however. This is because the region hosts well-established tech and aerospace
industries, which offer potential synergies in the EV field.
Jobs in EV supply chains are predicted to grow, though the predicted growth varies across
occupations. With the increasing electrification of transportation, jobs in the EV supply chain in the
region are growing. Oregon is predicted to have 6% more jobs in occupations most closely related to the
EV supply chain in 2025 than in 2019, and the predicted growth in Washington is 7%. There are
differences between occupations, however. For example, jobs for Electricians, Software Developers, and
Operations Research Analysts, the highest growing occupations in both states, are expected to grow at
an average of 13.4% in Oregon and 15.0% in Washington. At the same time, the occupations with most
negative outlook, Electronic Equipment Installers and Repairers for Motor Vehicles, and Electrical,

6
Electronic, and Electromechanical Assemblers are predicted to decline at an average of 8.0% in Oregon
and 9.3% in Washington.
Women and people of color in the EV-related workforce are particularly vulnerable to economic
trends. The different growth rates of occupations most closely related to the EV supply chain have
dramatic implications for the workforce because the demographics of the workforce varies across
occupations. In particular, the share of women is much higher in the occupations that are expected to see
a decline in jobs, 33%, than in the occupations with expected growth, 16%. For comparison, the overall
share of women in the field in the Pacific Northwest is 19%. Similarly, the share of people of color is
higher in the occupations with a negative outlook: 36% of the workforce in the declining occupations are
people of color, compared to the 31% in the occupations with predicted growth. Overall, people of color
are 33.5% of the workforce in the field in the Pacific Northwest. The demographics vary greatly between
occupational groups and occupations, however. For example, the share of Asian and Asian American
workers is particularly high in many Architecture and Engineering Occupations (19% of the workforce in
Oregon and 18% in Washington) and Computer and Mathematical Occupations (21% of the workforce in
Oregon and 39% in Washington), thus driving up the overall share of people of color in the field and in the
EV-related occupations with a positive outlook. For comparison, the share of Asian and Asian American
workers in the overall workforce in the Pacific Northwest is 8.0%.
Recommendations To ensure a pipeline of qualified workers in the growing EV field, and to develop a workforce development
strategy that leads to a more equitable and more sustainable sector, this report recommends the
following:
Innovate together with key partners in industry, the public sector, and education and training
institutions. Multiple industry experts consulted for this project called for collaboration and coordination
between the public, private, and education sectors. The findings of this report support such collaboration.
The final section presents the Professional Automotive Training Center at Shoreline Community College
in Washington as an example of a successful public-private training partnership: The Center hosts
various Service Technician training programs in which auto manufacturers work together with the college
to provide the curriculum. The Center has trained more than 1,300 students and the programs have
resulted in significant savings in training costs for the partnering employers. Moreover, the programs have
successfully placed students in living-wage jobs. By bringing the different stakeholders together, the
public sector can play a leading role in ensuring that the technological and business advancements
occurring in the EV field are coupled with equally innovative training programs and initiatives in the public
sector.
Design and implement training initiatives directed at underserved populations. The workforce
research highlights a lack of diversity in certain EV-related occupations and economic trends with
negative implications for women and people of color. We recommend designing training programs in the
EV field that would target underserved populations and connect them to living wage jobs. For example,
the I-BEST programs in Washington provide educational access to individuals who have traditionally
struggled in college-level occupational programs, including adult basic education and English-as-a-
second-language students. The I-BEST programs provide joint instruction by a basic skills teacher and a
technical or academic teacher, helping students with low levels of academic skill to succeed in college-
level coursework. In addition to these sorts of college-led programs, underserved populations can benefit
from shorter training programs that focus on creating access to entry-level positions. These initiatives
have shown promise in many other sectors.

7
Develop EV-specific curricula and trainings. As the technology in electric vehicles continues to
develop and the mass production of EVs expands, the need for a more specialized workforce increases.
We recommend working with institutions that have strong educational programs in the EV-related fields to
develop curricula and training that is directed at the particular needs of EV production. Public-private
training partnerships can also play a role here, as partners in the private sector know the rapidly-changing
industry and its occupational needs best, whereas the public sector can ensure that the interventions and
initiatives adopted lead to a more diverse and inclusive industry.

8
The Openings for New Business that Electric
Vehicle Production Can Create
As the electrification of transportation continues in the U.S., drivers in the Pacific Northwest have proven
to be the among the early adopters. In 2018, the market share of sold electric vehicles (EVs) was higher
in Washington (4.3%) and Oregon (3.4%) than in any other state, except for California (7.8%).1 Moreover,
the growing number of electric motor vehicles in the region is not limited to electric cars. For example, the
region has adopted an electric school bus,2 an electric solid waste truck,3 and electric buses powered by
wind energy.4
Yet, for two main reasons, we have a very limited understanding of the potential implications of growing
electric vehicle* sales on workers. First, the supply chains of electric motor vehicles are still developing,
due to dramatic technological changes in the field. Many of the key actors in the emerging electric motor
vehicle manufacturing are start-ups or small-to-medium sized enterprises that may not be involved in the
established supply chains of non-electric motor vehicles.5–7 Given this emergence of new actors, and the
dramatic changes in technology and business models that are closely related to their entrance to the field,
the impacts of growing electric motor vehicle manufacturing on the labor force are hard to predict.
Second, the existing labor market data does not track the businesses and jobs in electric motor vehicle
manufacturing. More specifically, the standard classification system for businesses and jobs in the U.S.,
the North American Industry Classification System (NAICS), does not distinguish between the
manufacturing of traditional cars and electric cars; or the manufacturing of electric and traditional light
trucks and utility vehicles; or the manufacturing of electric and traditional heavy-duty trucks. As a result,
the classification does not allow us to analyze the labor force involved in electric motor vehicle
manufacturing.† The lack of labor market data complicates the analysis of current workers in the sector
and this, in turn, makes it difficult to predict future trends.
This report is based on original research that Seattle Jobs Initiative (SJI) conducted with the goal of
analyzing the electric motor vehicle-related business in Oregon and Washington, assessing the current
and future regional occupational needs in the industry, and identifying potential partners to engage in
workforce training. To overcome some of the challenges that the changing supply chains and the lack of
data pose, and to achieve a comprehensive assessment of Oregon’s and Washington’s capacity and
potential in EV-related motor vehicle production, SJI undertook the following research tasks:
• Review of existing literature on electric motor vehicle production, including cars, trucks, and
buses. The literature review helped us identify the NAICS codes most relevant to the electric
* In this report, the term “electric motor vehicle” will include both electric cars and electric commercial vehicles, including buses and trucks. † The Bureau of Labor Statistics (BLS) began to address this issue in 2010 by developing a coding standard that would identify industries and jobs related to producing goods or services that benefit the environment or conserve natural resources.8 However, due to budget cuts, the project was cancelled in March 2013. In that time, BLS identified the sectors of the auto industry that contain production of green goods and services. However, it is of limited use for analyzing EVs, ETs, and ZEBs production today because the coding does not consider heavy duty truck manufacturing, a significant part of the emerging EV industry.9

9
motor vehicle supply chains. The existing literature and the NAICS codes that we selected for
further analysis are presented in the first section of the report.
• Database and online search to identify and examine the businesses in Oregon and Washington
that have electric motor vehicle–related production. The details of the research methodology and
the results will be presented in the second section.
• Analysis of the existing and potential workforce in electric motor vehicle manufacturing in Oregon
and Washington. The third section focuses on analyzing the industry in the region and, especially,
its occupational makeup and future occupational demand.
• Identification of key partners. The fourth section introduces institutions and organizations with the
greatest potential to contribute to the education and training of the future EV-related workforce in
the region.
• The fifth section offers recommendations for future steps.
Throughout this report, the terms “electric vehicle” (EV) and “electric motor vehicle” will be used
interchangeably when referring to electric passenger cars and electric commercial vehicles, including
buses and trucks. The next section will introduce some technical differences between different types of
electric vehicles. However, in general the term “electric car” will refer to battery-run passenger cars, and
the terms “electric bus” and “electric truck” will refer to all zero-emissions buses and trucks, including
battery- and hydrogen fuel cells –powered vehicles.
Good News: The Barriers to Entry Are Lower in EV-Related Industries Perhaps the most important difference between the production of EVs and traditional, internal combustion
engine vehicles (ICEs) is in the barriers to entry: the barriers to entry are much lower in EV production
than in the production of ICEs.* This, in turn, creates openings for new small- and medium-sized
companies that have been excluded from the existing ICE supply chains. The high entry barriers in the
conventional auto industry are created by the well-established manufacturing process: the car is divided
into different car sub-systems, or modules, that are then produced simultaneously. This allows companies
to increase the scale of production and shrink the associated costs. However, it also requires expensive
upfront investment in assembly line equipment, making it difficult for new actors to break into the
industry.10
Some of these high entry barriers are removed in the mass production of electric vehicles. In EVs, the
traditional components of the powertrain (fuel storage, engine and related transmission) are replaced by
new modules: battery, electric motor and related transmission. Moreover, many components that are
currently used in internal combustion engine vehicles will be no longer necessary (e.g. exhaust, intake,
O2 sensor, exhaust gas recirculation or EGR).10 Other components, such as air conditioning, water units,
brakes and steering systems need to be adapted.11 All these changes are reflected in the supply chain;
car manufacturers have traditionally considered the ICE powertrain module as one of their core
competencies and, in turn, have not focused on electrical components.11 As a result, the production of
EVs requires new components and competencies outside the existing, established auto supply chain.
This creates room for small- and medium-sized enterprises excluded from the traditional car supply chain
to enter EV production.10,12,13 †
* Given proprietary rights, the lack of standard classification system for the industry, and the challenges created by the changing technology and business models, the existing research on electric motor vehicle supply chains remains limited. This section is based on analyses that identify some key differences between the supply chains of electric vehicles (EV) and traditional, internal combustion engine (ICE) vehicles. † For example, about 56% of the content of a Chevy Bolt, an EV, comes outside the traditional supply chain.

10
Less research exists on the supply chain of electric commercial vehicles but, in general, their
manufacturing is undergoing similar changes as EVs. Various traditional truck and bus manufacturers are
currently working on developing electric models and addressing the technical challenges in the sector,
and, since 2016, there has been notable progress especially in the development of heavy-duty trucks and
city buses.14 Just as with EVs, the manufacturing of electric trucks and buses has also opened the
industry to new actors: according to analysts, new manufacturers like Nikola and Tesla have the potential
to disrupt the market and make electric trucks more available even sooner than currently expected.6 An
example of the innovation taking place in the electric bus sector is U.S.-based company, Proterra, that
recently announced a partnership with Mitsui & Co. to lease electric batteries. By separating the cost of
batteries from the costs of its buses, Proterra promises to bring the cost of its electric buses to roughly the
same with a diesel bus.15
Who Could Enter the EV Field? The Supply Chain in More Detail In order to identify the companies in EV-related production, and the companies with potential to enter the
field, we need to establish the unique components in electric vehicle production. The key difference
between an electric motor vehicle and the corresponding traditional vehicle is their power source: while
traditional vehicles have an internal combustion engine that generates power by burning gasoline, electric
motor vehicles run either on energy stored in rechargeable batteries or on hydrogen fuel.16*† The
replacement of the internal combustion engine with a battery and an electric motor – the more common
technology in passenger cars – changes the established supply chain dramatically, since the internal
combustion engine is one of traditional auto manufacturers’ core competencies.11 Consequently, they
have built the engine in-house with components from established suppliers that specialize in auto
hardware. With EV production, things change: many of the components of internal combustion engine
vehicles will no longer be necessary (e.g., exhaust, intake, O2 sensor, EGR)10 and manufacturers will
need to direct their focus to electrical components. Moreover, other existing components, such as air
conditioning, water units, brakes and steering systems need to be adapted.11 These differences force
auto manufacturers to modify their existing supply chain.
To compare the components of electric cars and ICEs in more detail, we can look at the supply chain of
Chevy Bolt, an electric car. The financial firm UBS took a Chevy Bolt apart and compared the breakdown
to a similar ICE car.13 Figure 1, below, present the key differences between the cars’ main components.
The figures illustrate that the role of the traditional auto hardware suppliers, often called Tier 1 suppliers,
diminishes dramatically when moving from producing an ICE to producing a Chevy Bolt: whereas the role
of Tier 1 suppliers beyond powertrain electronics is 68% in the ICE, this percentage is only 28% in the
Chevy Bolt. In turn, the battery and powertrain electronics are 56% of Chevy Bolt’s contents, while the
ICE does not have a battery and the powertrain electronics are only about 2% of the car’s contents. In
short, many traditional Tier 1 suppliers have only a small role in EV production, and EV production is
creating openings for new businesses outside the established supply chains, especially in the production
of batteries and electronics.
* In electric passenger cars, the battery-driven cars dominate the market, and, for this reason, the analysis below focuses on that technology. The development of hydrogen fuel technology is more advanced in commercial vehicles so the sections on electric trucks and buses will return to the topic. † The Appendix (Appendix A) includes a more detailed presentation of the ICE supply chain.

11
Source: Hummel P, Lesne D, Radlinger J, et al. UBS Evidence Lab Electric Car Teardown-Disruption Ahead?13
Figure 1. Comparison of Chevy Bolt and Comparable ICE Car Components
To identify the openings for new companies in the sector, we tracked down the NAICS codes for the
suppliers of Chevy Bolt, as identified by UBS. More specifically, we conducted online searches to find the
primary NAICS codes of particular companies supplying certain components to Chevy Bolt. The results of
our research are listed in Table 1.* This list will then help identify which companies in Oregon and
Washington operate in industries that are related to the EV supply chain.
* It is important to note that there is no central agency that assigns companies their “official” NAICS
codes. Moreover, the federal government does not release data on companies’ NAICS codes or indicate
the codes that some of its entities have assigned to businesses. Consequently, different sources might
list different codes for companies, making it difficult to establish their “true” NAICS codes. That said, we
11%
28%
5%13%
43%
Content of Chevy Bolt
OEMs
Other tier 1 suppliers
Raw materials
Powertrain electronics (LG)
Battery (LG)
20%
68%
10%2%
Content of Comparable ICE Car
OEMs
Other tier 1 suppliers
Raw materials
Powertrain electronics (LG)
Battery (LG)

12
Table 1. NAICS Codes for Manufacturing of EV Components
Component NAICS code
Battery Cell 335911 – Storage Battery Manufacturing
335912 - Primary Battery Manufacturing (for fuel
cell technology)
Battery Management
Battery Pack
Battery Charger 335999 - All Other Miscellaneous Electrical
Equipment and Component Manufacturing
Electric Motor 335312 - Motor and Generator Manufacturing
Gearbox 336350 - Motor Vehicle Transmission and Power
Train Parts Manufacturing
Power Distribution Module 336320 – Motor Vehicle Electrical and Electronic
Equipment Manufacturing
Inverter 334419 - Other Electronic Component
Manufacturing
DC/DC Converter 334413 – Semiconductor and Related Device
Manufacturing, 335999 - All other miscellaneous
electrical equipment and component
manufacturing
Thermal Management 336390 - Other Motor Vehicle Parts
Manufacturing
Connections/Wiring 336390 - Other Motor Vehicle Parts
Manufacturing
Source: Hummel P, Lesne D, Radlinger J, et al. UBS Evidence Lab Electric Car Teardown-Disruption Ahead, SJI’s research
Consultations with industry experts suggest that the NAICS codes for electric commercial vehicle
production resemble those of EV production. As with electric cars, the supply chains of electric trucks and
buses are still developing. In fact, the Director of Product Planning at Kenworth, one of the main truck
manufacturers globally, describes the supply base for all electrified components as “relatively immature.”7
The increasing mass production of electric cars does not translate directly to the manufacturing of trucks,
as the electrified components of cars cannot be simply applied to trucks. Consequently, truck
manufacturers must work with their suppliers to develop electrified components and build up the
production of those components.7 For example, Kenworth is currently ordering components from
suppliers and integrating them into the chassis in-house but, at the same time, it is working towards a
more vertically integrated supply chain, aiming to build the components in-house at the lowest price
possible.17
Whereas the mass production of electric vehicles has converged on battery-powered vehicles, electrified
trucks and buses are being developed and produced with both battery and hydrogen fuel cell
technology.16 This is partly because of the technical limitations of batteries: today’s batteries are too
heavy and too expensive to be viable for commercial vehicles.18 Hydrogen cell technology, in contrast,
gives trucks a greater range and quicker refueling times.16 For this reason, the demand for hydrogen fuel
cell buses is also increasing.16 In order to be able to identify the companies that could participate in the
electric commercial vehicle supply chain, we complement the list presented in Table 1 with the code for
Primary Battery Manufacturing (335912), a category we identified for businesses that supply fuel cell
consulted industry experts on the list of NAICS above, and they confirmed the codes’ relevance to the EV
production.

13
technology used to power electric trucks and buses.19 The next section of the report proceeds to identify
the companies that operate under these NAICS codes in Oregon and Washington, with the goal of
establishing the state of the EV related business in the region and the opportunities that the lower barriers
to entry in the field offer for business.
Existing and Potential Businesses in the EV-
Related Industries
One of the most consistent recommendations across the field of economic development is to improve
coordination between industry, education and training institutions, and the public sector. Coordination is
needed because when there is a local shortage of appropriate labor, offshoring and automation become
increasingly cost-effective options, moving economic activity and jobs out of the region. In addition, many
fields are evolving so quickly that workers need to engage regular training and upskilling in order to stay
relevant in their field. To facilitate the coordination, we have identified the businesses in Oregon and
Washington that are or may be part of the EV supply chain.
Identifying EV-Related Firms in Oregon and Washington As the electric vehicle industry is emerging, the North American Industry Classification System (NAICS)
has not yet developed a classification for it. For this reason, we identified EV-related businesses by
searching in two main directions: traditional motor vehicle manufacturing and manufacturing of additional
EV-related components, such as electronics and battery manufacturing. By including these two directions,
we aim to capture both businesses involved in developing new EV technology, and businesses that
integrate existing technology into new, EV products.
We used the database “Business Data” by DatabaseUSA.com, provided by labor market analytics
software Emsi.19* Database USA uses sources such as new business filings, press releases, corporate
websites, and annual reports to gather data on existing businesses. For the motor vehicle manufacturing,
we used their database to identify all companies in Oregon and Washington that lists their primary NAICS
code as any of the following:
3361 Motor Vehicle Manufacturing
3362 Motor Vehicle Body and Trailer Manufacturing
3363 Motor Vehicle Parts Manufacturing
These 4-digit NAICS codes capture manufacturing in the entire motor vehicle industry, including
automobiles, light trucks and utility vehicles, and heavy-duty trucks. In other words, these codes capture
the ICE-vehicle manufacturing that is or can also be part of EV-vehicle supply chain. The code 336310 -
Motor Vehicle Gasoline Engine and Engine Parts Manufacturing was excluded, however, as that code
contains production exclusive to ICE cars.
The list includes parts manufacturing but, importantly, there are several firms that manufacture body
panels that are not captured via this list. Body panels are particularly important for EV production, as
* DatabaseUSA.com collects the data using proprietary methods, Emsi does not endorse or warrant the data’s accuracy or consistency.

14
electric cars need to be lighter than their ICE counterparts. For this reason, the following codes were
added:
331315 Aluminum Sheet, Plate, and Foil Manufacturing
331318 Other Aluminum Rolling, Drawing, and Extruding
331512 Steel Investment Foundries
335991 Carbon and Graphite Production*
In order to capture the parts of electric motor vehicle industry that are not classified under the codes for
traditional motor vehicle manufacturing, we supplemented the search codes with the EV-relevant NAICS
codes, as identified in Section 1.† These NAICS codes include:
334419 Other Electronic Component Manufacturing
335312 Motor and Generator Manufacturing
335911 Storage Battery Manufacturing
335912 Primary Battery Manufacturing
335999 All Other Miscellaneous Electrical Equipment and Component Manufacturing
336320 Motor Vehicle Electrical and Electronic Equipment Manufacturing
336350 Motor Vehicle Transmission and Power Train Parts Manufacturing
Identified Firms in the Region The Business Data database identifies a total of 355 locations for 353 unique firms in Oregon and
Washington associated with the selected NAICS codes. This search was augmented by reviewing
previous research done in the area, adding design, engineering, and manufacturing for a total of 417
businesses.‡ We reviewed the companies’ websites for any connection or potential connection to EV
related business, including trucks and buses, and identified six categories of business:
1. Explicit EV Manufacturing
2. EV Infrastructure Manufacturing (Charging)§
3. General Automotive Manufacturing
4. ICE-Oriented Automotive Manufacturing
5. Other Related Manufacturing
6. Not Related11
We excluded 204 businesses. This included businesses which were no longer in operation, distributors,
metal fabrication and electronic manufacturing that are unrelated to EV, those that manufactured
materials tools and instruments that were not themselves EV components, small automotive
customization businesses, automotive repair shops, and integrated lock installation companies. The final
count is 213 business in 13 industries (Figure 2 & Appendix B).
* The Business Data database returned no Carbon and Graphite Production businesses currently operating in Oregon or Washington. † The NAICS code 334413 Semiconductor and Related Device Manufacturing was excluded. DatabaseUSA.com identifies 47 businesses in Oregon and Washington with 334413 as their primary NAICS code. ‡ Other work has looked more broadly at EV market and infrastructure including sales and advocacy, which are outside of the scope of this work. In addition, a number of the businesses identified are either no longer in operation or no longer in operation in the region. § Though EV charging was explicitly excluded from the scope of this project, eleven firms identified both through the database search and previous work manufacturing charging stations.

15
Figure 2. Map of EV-Related Manufacturing in Oregon & Washington
16
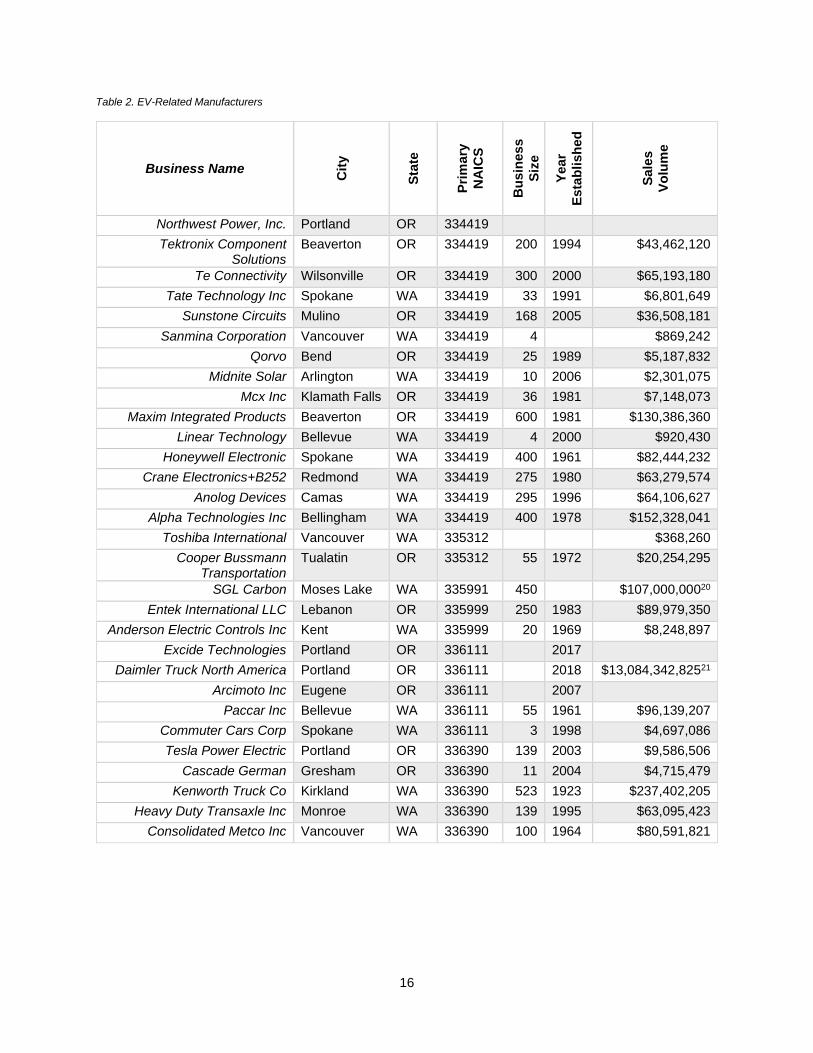
Table 2. EV-Related Manufacturers
Business Name
Cit
y
Sta
te
Pri
mary
NA
ICS
Bu
sin
es
s
Siz
e
Yea
r
Esta
bli
sh
ed
Sale
s
Vo
lum
e
Northwest Power, Inc. Portland OR 334419
Tektronix Component Solutions
Beaverton OR 334419 200 1994 $43,462,120
Te Connectivity Wilsonville OR 334419 300 2000 $65,193,180
Tate Technology Inc Spokane WA 334419 33 1991 $6,801,649
Sunstone Circuits Mulino OR 334419 168 2005 $36,508,181
Sanmina Corporation Vancouver WA 334419 4
$869,242
Qorvo Bend OR 334419 25 1989 $5,187,832
Midnite Solar Arlington WA 334419 10 2006 $2,301,075
Mcx Inc Klamath Falls OR 334419 36 1981 $7,148,073
Maxim Integrated Products Beaverton OR 334419 600 1981 $130,386,360
Linear Technology Bellevue WA 334419 4 2000 $920,430
Honeywell Electronic Spokane WA 334419 400 1961 $82,444,232
Crane Electronics+B252 Redmond WA 334419 275 1980 $63,279,574
Anolog Devices Camas WA 334419 295 1996 $64,106,627
Alpha Technologies Inc Bellingham WA 334419 400 1978 $152,328,041
Toshiba International Vancouver WA 335312
$368,260
Cooper Bussmann Transportation
Tualatin OR 335312 55 1972 $20,254,295
SGL Carbon Moses Lake WA 335991 450 $107,000,00020
Entek International LLC Lebanon OR 335999 250 1983 $89,979,350
Anderson Electric Controls Inc Kent WA 335999 20 1969 $8,248,897
Excide Technologies Portland OR 336111
2017
Daimler Truck North America Portland OR 336111
2018 $13,084,342,82521
Arcimoto Inc Eugene OR 336111
2007
Paccar Inc Bellevue WA 336111 55 1961 $96,139,207
Commuter Cars Corp Spokane WA 336111 3 1998 $4,697,086
Tesla Power Electric Portland OR 336390 139 2003 $9,586,506
Cascade German Gresham OR 336390 11 2004 $4,715,479
Kenworth Truck Co Kirkland WA 336390 523 1923 $237,402,205
Heavy Duty Transaxle Inc Monroe WA 336390 139 1995 $63,095,423
Consolidated Metco Inc Vancouver WA 336390 100 1964 $80,591,821

17
The database search identified 30 companies with explicit connections to the sector (see Table 3) and
additional 19* were drawn from prior research. These firms are a variety of sizes. There are several small
businesses alongside large multinational corporations. The presence of the small firms is evidence there
are lower barriers to entry in the EV-sector. However, these firms are by-and-large established firms.
Twenty-one of them were established 20 years or more ago and none were founded this decade.
The presence of the large multinationals is evidence that this is a viable business model, particularly as
EVs require new infrastructure—charging stations and overhead lines—and the large multinational
corporations also manufacture EV infrastructure.
Fourteen of the companies identified operate in Oregon, and 15 in Washington. According to the
Business Data database none of the companies is female- or minority-owned. Their median number of
employees is 139, and their median sales volume is $39,985,150.50†, though this is the overall sales
volume and not unique to EV manufacturing with a few key exceptions. However, we are missing data
from a few key firms, both those represented in the Business Data and those not represented in that data.
According to our research, six companies in the
region produce electric motor vehicles. Daimler in
Oregon and Paccar and its subsidiary Kenworth
Trucks in Washington manufacture electric heavy
trucks, Commuter Cars Corporation in Washington
and Arcimoto in Oregon produce custom-made
electric commuter cars, and Boxx and RYNO
Motor make specialty scooters. In addition to
these actors, other employers in the sector are
involved in battery manufacturing, battery
management and control, body panels, and other
components (such as axles), particularly related to
heavy industry.
The firms that already have explicit connections to EV manufacturing do not fully reflect the potential for
EV manufacturing in the region. Outside of the powertrain, ICE vehicle and EV manufacturing are largely
comparable. For example, both ICE vehicles and EV have seats, mirrors, and body panels, though
innovative EV companies may also employ unconventional materials or production methods in many of
their components. Other components may be more specific to one or the other but existing ICE capacity
can be retooled and retrained to make the EV analog.
In contrast, electronics and battery manufacturers, particularly those that do not already have explicit
connections to EV manufacturing are not necessarily good fits for the EV supply chain. Several make
products that are not directly applicable (e.g., glassware for semi-conductor manufacturing). Others are
explicitly committed to another industry (e.g., aerospace) supply chain and, though they may produce
something directly applicable to EV production, would have to develop a new market. However, the large
presence of both aerospace, defense, and electronics/computer hardware manufacturing in the region
means there are many firms that make applicable parts, including several firms that specialize in
* Because they were not present in the Business Data database, we do not have data regarding their size, founding, or sales volume. These companies are a mix of local, multinational, small, and large. They are included in Appendix B. † Excludes Daimler Truck North American Sales as the only figures available were sales for the global corporation and not the operations in the Pacific Northwest.
18
customizing and supporting rapid prototyping, which is promising for an emerging field and keeps barriers
to entry low as new firms can contract with these producers for small components.
Volume of Business in the Region Many of the companies reviewed are privately owned and, as a result, detailed information on their
markets, revenues, and role in electric motor vehicle supply chains are not publicly available. However,
we can assess the purchases that the companies with the electric motor vehicle relevant NAICS codes
are making in and out the region. While this does not allow us to focus only on EV-related business, it
gives us an estimation of how much of their supply comes from within and outside the Pacific Northwest.
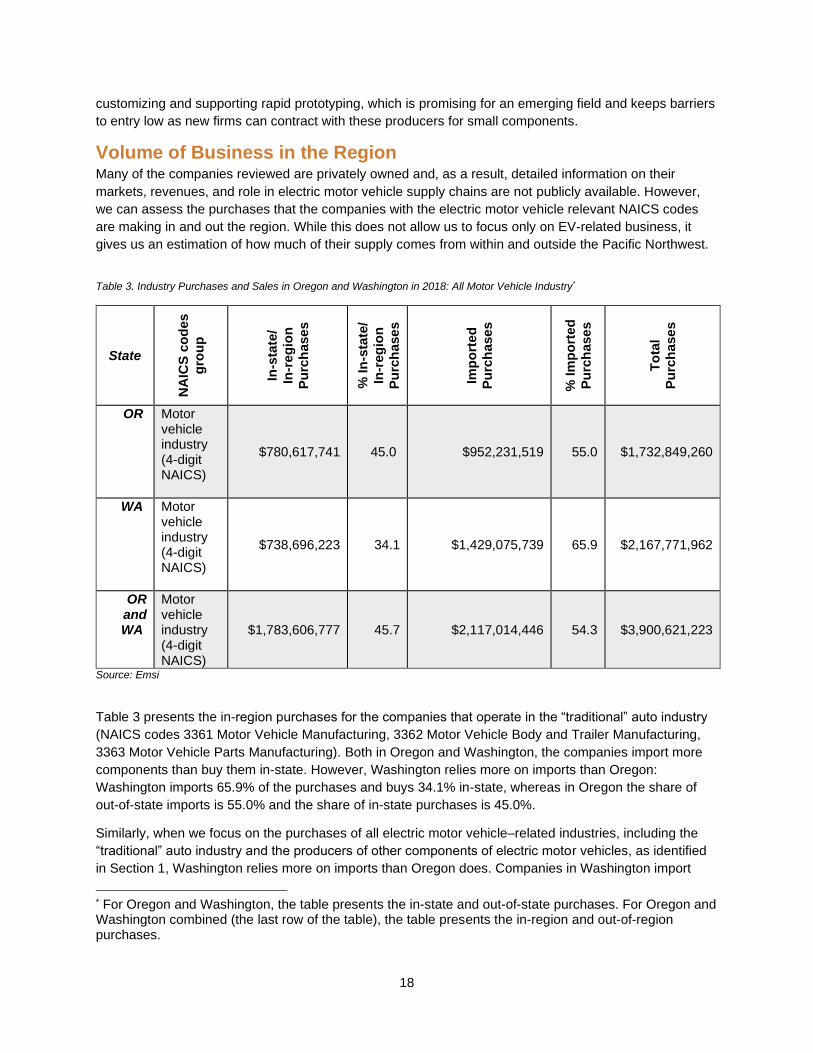
Table 3. Industry Purchases and Sales in Oregon and Washington in 2018: All Motor Vehicle Industry*
State
NA
ICS
co
des
gro
up
In-s
tate
/
In-r
eg
ion
Pu
rch
ase
s
% In
-sta
te/
In-r
eg
ion
Pu
rch
ase
s
Imp
ort
ed
Pu
rch
ase
s
% Im
po
rted
Pu
rch
ase
s
To
tal
Pu
rch
ase
s
OR Motor vehicle industry (4-digit NAICS)
$780,617,741 45.0 $952,231,519 55.0 $1,732,849,260
WA Motor vehicle industry (4-digit NAICS)
$738,696,223 34.1 $1,429,075,739 65.9 $2,167,771,962
OR and WA
Motor vehicle industry (4-digit NAICS)
$1,783,606,777 45.7 $2,117,014,446 54.3 $3,900,621,223
Source: Emsi
Table 3 presents the in-region purchases for the companies that operate in the “traditional” auto industry
(NAICS codes 3361 Motor Vehicle Manufacturing, 3362 Motor Vehicle Body and Trailer Manufacturing,
3363 Motor Vehicle Parts Manufacturing). Both in Oregon and Washington, the companies import more
components than buy them in-state. However, Washington relies more on imports than Oregon:
Washington imports 65.9% of the purchases and buys 34.1% in-state, whereas in Oregon the share of
out-of-state imports is 55.0% and the share of in-state purchases is 45.0%.
Similarly, when we focus on the purchases of all electric motor vehicle–related industries, including the
“traditional” auto industry and the producers of other components of electric motor vehicles, as identified
in Section 1, Washington relies more on imports than Oregon does. Companies in Washington import
* For Oregon and Washington, the table presents the in-state and out-of-state purchases. For Oregon and Washington combined (the last row of the table), the table presents the in-region and out-of-region purchases.

19
54.8% of their purchases, whereas that share is only 40.1% in Oregon. Table 4 presents these in-state
and out-of-state purchases for electric motor vehicle–related industries in Oregon, Washington, and the
states combined*. The table also lists the total in-region sales to other industries. The last two columns of
the table show that while the total purchases in these industries are about the same in Oregon and
Washington, the industries in Washington sell more of their products and services to other industries in
the state ($1,317,983,538) than the industries in Oregon do ($913,268,274).
Finally, it is important to keep in mind that the traditional auto industry is relatively small in the Pacific
Northwest. According to EMSI, the traditional auto industry (NAICS codes 3361, 3362, 3363) employed
10,525 people in Oregon and Washington in 2019. The number is 71% below the national average. A
producer of a custom-made electric car in Washington suggests that the lack of well-established
passenger car manufacturing makes it difficult to find parts in the region. We consulted with Rick
Woodbury, President of Commuter Cars, in order to gain additional insight into the in-region purchases of
the EV field. Commuter Cars, based in Spokane, WA, produces the Tango, an extra-narrow electric car.
According to Woodbury, it is hard to obtain parts for the Tango in the region. He has made deals with
local dealerships for some parts of the Tango and bought some of the required materials, such as copper
sheets and carbon fiber, regionally. Most of the components, however, have been ordered online, usually
from the U.S. Midwest or China.
Table 4. Electric Motor Vehicle-Related Industry Purchases and Sales in Oregon and Washington in 2018†
State
In-s
tate
/
In-r
eg
ion
Pu
rch
ases
% In
-sta
te/
In-r
eg
ion
Pu
rch
ases
Imp
ort
ed
Pu
rch
ases
% Im
po
rted
Pu
rch
ases
To
tal P
urc
hases
To
tal In
-sta
te/
In-r
eg
ion
Sa
les (
to o
ther
ind
ustr
ies
)
OR $1,379,502,171 59.4 $942,406,992 40.1 $2,321,909,163 $913,268,274
WA $771,288,206 35.2 $1,420,764,015 54.8 $2,192,052,221 $1,317,983,538
OR & WA
$2,449,214,803 54.3 $2,064,746,582 45.7 $4,513,961,385 $3,760,325,847
Industries of companies identified above (6-digit NAICS). Source: Emsi
* The industries include the following NAICS codes: 3361, 3362, 3363, 334419, 335312, 335911, 335912, 335999, 336320, 336350. † For Oregon and Washington, the table presents the in-state and out-of-state purchases. For Oregon and Washington combined (the last row of the table), the table presents the in-region and out-of-region purchases.

20
To conclude, the EV industry has a foothold in the region. This is thanks to a combination of low barriers
to entry, making it possible for new firms to enter, along with the well-established tech sector and
aerospace industry, which have a cadre of firms that make customized components for rapid prototyping.
This is promising for the industry as a whole, even if the region has not been considered a stronghold for
manufacturing of traditional passenger cars. Our consultations with industry representatives suggest that
while there are not many regional suppliers overall, there are potential synergies in the EV and related
fields like aerospace and computer hardware manufacturing, large industries in Oregon and Washington.
Taking advantage of the potential synergies in the EV and other related fields does present some specific
workforce challenges, however. Namely, workers must be adaptable and receive ongoing training in an
emerging industry that is developing prototypes. In order to take advantage of the strengths created by
these existing, emerging industries, effective coordination with players in the field is critical so that both
workers entering the field and incumbent workers are supported. The next section of the report takes a
closer look at the workforce that is connected to the EV-related industries in the Pacific Northwest, and
Section 4 will identify key partners to consider for workforce development.
The Current and Future Workforce in the EV-
Related Industries
This section analyzes the workforce related to the electric vehicle supply chain in Oregon and
Washington. The research leads to a few important conclusions. First, the EV-related industries employ
plenty of workers in Oregon and Washington. While the overall predictions for future job openings in
these industries are somewhat negative, partly due to offshoring and automation, there is notable
variation between different occupations. For example, openings in occupational groups such as
Engineering and Computer Science Occupations
are predicted to increase, while jobs in many
Production Occupations are expected to decrease.
Furthermore, when we analyze the current
workforce in these occupations in more detail, we
uncover some concerning trends. For instance, the
occupations with disproportionally high shares of
women and people of color tend to have more
negative outlooks than the occupations that are
dominated by white and male workers. The findings
have clear implications when considering preparing
the regional workforce for the electrification of
transportation: while the EV-related industries
employ plenty of workers, education and training policies and initiatives are needed to ensure that the
most vulnerable workers in these sectors are able to enter the growing fields.

21
Figure 3 presents the projected overall change in the number of jobs in the industries connected to the
EV supply chain from 2019 to 2025.* In 2019, Oregon and Washington employed 37,884 and 15,826
workers in the sector, respectively.† The workforce in Oregon is projected to decline by 11 jobs (0%) and
in Washington by 328 jobs (2%) by 2025. For comparison, the graph also includes the predicted change
in the U.S. as a whole which is, at a 4% increase, higher than in the Pacific Northwest.
Source: Emsi
Figure 3. Projected Change in Electric Motor Vehicle-Related Industries
In both states, the Semiconductor and Other Electronic Component Manufacturing (NAICS code 3344)
industries employ the largest share of workers: 79% of the workforce in Oregon and 44% of the workforce
in Washington works in that sector. To ensure that changes in this industry–or any other industry among
the electric motor vehicle-related industries–is not driving the overall pattern in Figure 3, we can examine
* The analysis is done with the following 4-digit NAICS codes: Motor Vehicle Manufacturing (NAICS code 3361, includes the manufacturing of cars, light trucks and utility vehicles, and heavy duty trucks), Motor Vehicle Body and Trailer Manufacturing (NAICS code 3362), Motor Vehicle Parts Manufacturing (NAICS code 3363), Semiconductor and Other Electronic Component Manufacturing (NAICS code 3344), Electrical Equipment Manufacturing (NAICS code 3353), and Other Electrical Equipment and Component Manufacturing (3359, includes primary battery and storage battery manufacturing). † The share of workers in these industries of overall workforce in the state is 2.0% in Oregon and 0.5% in Washington.

22
the projections in each EV-related industry individually. Table 5 presents these projections, highlighting
some variation between the industries.
Table 5. Predicted Change in Jobs in Electric Motor Vehicle-Related Industries in 2019-2025
Industry Oregon Washington United States
Motor Vehicle Mfg (3361) -7%
(791 and 733)
10%
(1,353 and 1,489)
9%
(238,287 and 259,350)
Motor Vehicle Body and
Trailer Mfg (3362)
4%
(3,569 and 3,694)
2%
(797 and 813)
7%
(165,133 and 176,878)
Motor Vehicle Parts Mfg(
3363)
-3%
(1,604 and 1,551)
2%
(2,412 and 2,460)
5%
(601,655 and 630,203)
Semiconductor and Other
Electronic Component Mfg
(3344)
0%
(29,897 and 29,943)
-1%
(6,954 and 6,910)
-2%
(373,151 and 365,065)
Electrical Equipment Mfg
(3353)
4%
(658 and 686)
10%
(3,183 and 3,500)
1%
(142,396 and 143,212)
Other Electrical Equipment
and Component Mfg (3359)
-8%
(1,369 and 1,265)
-13%
(1,128 and 983)
7%
(147,842 and 158,757)
Source: Emsi
Analysts often point out that electric cars are mechanically less complex than traditional cars and, for that
reason, the production of electric cars is less labor intensive. This is predicted to disrupt the workforce in
the traditional auto industry.22 Unfortunately, since the NAICS codes do not distinguish production of
electric motor vehicles from production of traditional motor vehicles, the data does not allow us to tease
out the impacts of electrification of transportation on the workforce in more detail. However, Table 2
suggests that the Pacific Northwest should be somewhat insulated from this trend. This is because the
industries that include the traditional auto manufacturing – Manufacturing of Motor Vehicles, Motor
Vehicle Bodies, and Motor Vehicle Parts – are relatively small employers in the Pacific Northwest. Their
share of the workers in the region is 20%, compared to the remaining 80% employed in the industries
identified as exclusive to the EV supply chain. Moreover, the outlook for job growth between 2019 and
2025 is better for the exclusively EV-related industries: those jobs are predicted to grow in the region at
an average rate of 1.7%, compared to a 1.7% average decline in jobs in the traditional auto
manufacturing industries.*
To analyze the occupations that work in the industries connected the electric motor vehicle supply chain,
we can map out the industries’ occupational makeup following the federal Standard Occupational
Classification (SOC) system, a system that classifies all workers into one of over 800 occupational
categories.23 Figures 4 and 5 present the broader groups of occupations that work in the electric motor
vehicle –related industries in Oregon and Washington.
* It is important to keep in mind that the industries considered “traditional auto manufacturing industries” also include activity related to EV production, and the “exclusively EV-related industries” contain production outside of EV components. Since the NAICS codes do not separate between ICE and EV production, this analysis is the closest estimation possible of their differences.

23
Source: Emsi
Figure 4. Occupational Makeup of Electric Motor Vehicle-Related Industries in Oregon, 2019
15,697, 39%
9,831, 24%
7,926, 19%
3,135, 8%
2,181, 5%1,842, 5%
EV-Related Industries in Oregon2019
Production Architecture & Engineering Other
Management Office & Administrative Support Computer & Mathematical

24
Source: Emsi
Figure 5. Occupational Makeup of Electric Motor Vehicle-Related Industries in Washington, 2019
In both states, Production Occupations are the most common occupations in these industries: in Oregon,
they form 39% and in Washington 49% of the total workforce connected to these industries*. The second
largest occupational group in both states is Architecture and Engineering Occupations, with 24% of the
workforce in the industries in Oregon and 17% in Washington†. After these two occupational groups, the
remaining workforce in both states is divided relatively equally between Management, Business and
Financial Operations, Office and Administrative Support, Computer and Mathematical Occupations; and
to somewhat lesser extent between other occupational groups such as Transportation and Material
Moving; and Installation, Maintenance, and Repair Occupations.
This high-level analysis illustrates that Oregon and Washington have industries connected to the EV
supply chain. Moreover, the growth in industries that produce EV components outpaces that of the
traditional auto industries: jobs are expected to increase 1.7% in the former and decrease 1.7% in the
latter. This analysis is tentative, since the absence of industry codes prevents us from fully separating the
production of EVs and their components from the production of traditional cars. Keeping this in mind, the
* The three most common occupations in this occupational groups in these sectors are Semiconductor Processors; Electrical, Electronic, and Electromechanical Assemblers; and Assemblers and Fabricators in Oregon; and Assembler and Fabricators; Electrical, Electronic, and Electromechanical Assemblers; and First-Line Supervisors of Production and Operating Workers in Washington. † The three most common occupations in this group are General and Operations Managers; Industrial Production Managers, and Computer and Information Systems Managers in Oregon; and Industrial Engineers; Electrical Engineers; and Electronics Engineers in Washington.
7,679, 49%
2,669, 17%
2,300, 15%
996, 7%
955, 6%
948, 6%
EV-Related Industries in Washington2019
Production Architecture & Engineering Other
Business & Finance Operations Office & Administrative Support Management

25
analysis offers reason for some optimism: some of the workforce necessary for the electrification of
transportation already exists in the Pacific Northwest, and jobs in some of the industries connected to EV
supply chain are projected to grow. The following section will take a closer look at this workforce and their
demographics.
The Occupational Infrastructure Exists: Workers in EV-Related
Occupations To gain insight into the regional workforce in jobs most relevant to the EV supply chains, we build on the
work of the Luskin Center for Innovation at UCLA. The Center has developed a list of occupations related
to the supply chain of plug-in electric vehicles*. We modify their list by excluding the occupations that are
not core to the production: Customer Service Representatives, Fire Fighters, Police and Sheriff’s Patrol
Officers, and Retail Salespersons. Our conversations with industry experts confirm that the list that we
adopt after these modifications – 30 occupations in total – include the key occupations in electric truck
and bus manufacturing, as well.†
Tables 6 and 7 offer key labor market data for jobs in these occupations in Oregon and Washington,
respectively. Specifically, the table presents for each occupation the number of jobs in 2019, the number
of projected annual openings (including new jobs and openings due to retiring workforce), the percent
change in jobs from 2019 to 2025, the median hourly earnings in 2019, and the median hourly earnings
adjusted to cost of living.
Table 6. Electric Motor Vehicle-Related Occupations in Oregon
Occupation
2019
Jo
bs
An
nu
al
Op
en
ing
s (
incl.
new
jo
bs &
reti
rem
en
ts)
2019
- 2
025 %
Ch
an
ge
Med
ian
Ho
url
y
Earn
ing
s
CO
L A
dju
ste
d
Med
ian
Ho
url
y
Earn
ing
s
Architecture
and
Engineering
Occupations
Chemical Engineers 403 35 11% $44.11 $38.36
Computer Hardware Engineers 1,316 90 2% $53.59 $46.60
Electrical Engineers 2,613 220 10% $42.73 $37.16
Electronics Engineers, Except
Computer
5,512 389 3% $41.60 $36.17
Industrial Engineers 4,084 341 10% $42.62 $37.06
Materials Engineers 529 41 2% $42.66 $37.10
Mechanical Engineers 4,140 330 9% $39.75 $34.57
Mechanical Drafters 580 61 10% $26.31 $22.88
Electrical and Electronics Engineering
Technicians
3,525 325 3% $30.17 $26.23
Electro-Mechanical Technicians 105 12 13% $25.64 $22.30
Mechanical Engineering Technicians 594 58 4% $24.69 $21.47
† To be clear, the data on occupations does not allow for an exclusive focus on electric motor vehicle-related business either, but it offers us a more detailed picture of the workforce in jobs most relevant to the EV supply chains.

26
Total Jobs, Openings, and % Change;
Median Earnings
23,401 1,901 6% $41.60 $36.17
Computer and
Mathematical
Occupations
Computer Systems Analysts 5,650 447 8% $42.61 $37.05
Computer Programmers 2,489 160 (-2%) $39.07 $33.97
Software Developers, Applications 15,967 1,431 13% $48.11 $41.83
Software Developers, Systems
Software
2,878 246 11% $50.90 $44.26
Network and Computer Systems
Administrators
3,832 293 8% $38.71 $33.66
Operations Research Analysts 1,238 114 17% $38.62 $33.58
Total Jobs, Openings, and % Change;
Median Earnings
32,054 2,690 10% $40.84 $35.51
Construction
and Extraction
Occupations
Electricians 8,955 1,254 14% $34.12 $29.67
Total Jobs, Openings, and %
Change; Median Earnings
8,955 1,254 14% $34.12 $29.67
Installation,
Maintenance,
and Repair
Occupations
Telecommunications Equipment
Installers and Repairers, Except Line
Installers
2,234 236 (-3%) $29.04 $25.25
Electric Motor, Power Tool, and
Related Repairers
239 25 5% $20.87 $18.15
Electronic Equipment Installers and
Repairers, Motor Vehicles
82 8 (11%) $19.95 $17.35
Automotive Service Technicians and
Mechanics
6,779 699 5% $20.93 $18.20
Total Jobs, Openings, and %
Change; Median Earnings
9,334 967 3% $20.90 $18.17
Life, Physical,
and Social
Science
Occupations
Chemists 679 76 11% $33.62 $29.23
Materials Scientists 95 10 9% $46.99 $40.86
Urban and Regional Planners 907 84 6% $39.01 $33.92
Total Jobs, Openings, and % Change;
Median Earnings
1,680 170 8% $39.01 $33.92
Management
Occupations
Industrial Production Managers 2,798 225 5% $43.30 $37.65
Total Jobs, Openings, and %
Change; Median Earnings
2,798 225 5% $43.30 $37.65

27
Production
Occupations
Electrical, Electronic, and
Electromechanical Assemblers, Except
Coil Winders, Tapers, and Finishers
5,079 576 (-8%) $16.11 $14.01
Assemblers and Fabricators, All Other,
Including Team Assemblers
12,351 1,439 (-2%) $15.70 $13.65
Computer-Controlled Machine Tool
Operators, Metal and Plastic
2,392 270 6% $19.83 $17.24
Machinists 3,444 421 10% $22.79 $19.82
Total Jobs, Openings, and %
Change; Median Earnings
23,265 2,706 (-1%) $17.97 $15.63
Total Jobs, Openings, and %
Change; Median Earnings
101,48
9
9,912 6% $38.67 $33.62
Source: Emsi
Tables 6 and 7 point out a notable difference between Oregon and Washington: Washington employs
twice as many workers in the occupations related to the EV supply chain as Oregon: 225,116 workers in
Washington compared to Oregon’s 101,489 workers. Most of this difference is driven by the much greater
demand in Computer and Mathematical Occupations in Washington: 112,964 of the state’s workers are in
this occupational group, whereas that number is 32,054 in Oregon. Overall, the high numbers of workers
in the different occupational groups suggests that when it comes to considering starting new electric
motor vehicle business in the Pacific Northwest, a key piece of infrastructure, occupational supply, exists
in the region already.
Table 7. Electric Motor Vehicle-Related Occupations in Washington
Occupation
2019
Jo
bs
An
nu
al O
pen
ing
s
(in
cl. n
ew
jo
bs &
reti
rem
en
ts)
2019
- 2
025 %
Ch
an
ge
Med
ian
Ho
url
y
Earn
ing
s
CO
L A
dju
ste
d
Med
ian
Ho
url
y
Earn
ing
s
Architecture
and
Engineering
Occupations
Chemical Engineers 629 45 2% $48.29 $42.36
Computer Hardware Engineers 1,701 130 7% $57.95 $50.83
Electrical Engineers 5,794 403 2% $53.71 $47.11
Electronics Engineers, Except
Computer
3,338 229 2% $51.40 $45.09
Industrial Engineers 7,082 531 5% $50.11 $43.96
Materials Engineers 1,024 77 0% $51.87 $45.50
Mechanical Engineers 7,875 541 3% $43.52 $38.18
Mechanical Drafters 2,040 182 1% $38.23 $33.54
Electrical and Electronics
Engineering Technicians
2,404 227 4% $34.58 $30.33
Electro-Mechanical Technicians 150 14 1% $42.31 $37.11
Mechanical Engineering
Technicians
980 88 (-2%) $30.89 $27.10

28
Total Jobs, Openings, and %
Change; Median Earnings
33,018 2,463 3% $48.29 $42.36
Computer and
Mathematical
Occupations
Computer Systems Analysts 18,196 1,436 8% $45.12 $39.58
Computer Programmers 9,723 620 (-2%) $63.23 $55.46
Software Developers, Applications 56,467 5,435 17% $61.63 $54.06
Software Developers, Systems
Software
16,718 1,309 8% $58.40 $51.23
Network and Computer Systems
Administrators
8,839 679 8% $43.00 $37.72
Operations Research Analysts 3,021 271 16% $44.15 $38.73
Total Jobs, Openings, and %
Change; Median Earnings
112,96
4
9,751 12% $51.76 $45.40
Construction
and Extraction
Occupations
Electricians 18,992 2,457 9% $31.56 $27.68
Total Jobs, Openings, and %
Change; Median Earnings
18,992 2,457 9% $31.56 $27.68
Installation,
Maintenance,
and Repair
Occupations
Automotive Service Technicians
and Mechanics
13,452 1,349 4% $22.88 $20.07
Electric Motor, Power Tool, and
Related Repairers
340 37 6% $26.33 $23.10
Electronic Equipment Installers
and Repairers, Motor Vehicles
221 20 (-
17%)
$25.64 $22.49
Telecommunications Equipment
Installers and Repairers, Except
Line Installers
4,924 526 (-2%) $32.22 $28.26
Total Jobs, Openings, and %
Change; Median Earnings
18,938 1,932 (-2%) $25.99 $22.79
Life, Physical,
and Social
Science
Occupations
Chemists 1,739 171 4% $38.73 $33.97
Materials Scientists 396 36 0% $50.33 $44.15
Urban and Regional Planners 2,126 201 7% $38.90 $34.12
Total Jobs, Openings, and %
Change; Median Earnings
4,261 408 5%
$38.90 $34.12
Management
Occupations
Industrial Production Managers 2,806 221 4% $57.59 $50.52
Total Jobs, Openings, and %
Change; Median Earnings
2,806 221 4% $57.59 $50.52
Production
Occupations
Electrical, Electronic, and
Electromechanical Assemblers,
Except Coil Winders, Tapers, and
Finishers
4,861 556 (-9%) $18.66 $16.37
Assemblers and Fabricators, All
Other, Including Team Assemblers
16,685 1,931 (-4%) $17.22 $15.11

29
Computer-Controlled Machine Tool
Operators, Metal and Plastic
2,212 237 3% $28.42 $24.93
Machinists 10,380 1,108 2% $24.09 $21.13
Total Jobs, Openings, and %
Change; Median Earnings
34,137 3,831 (-2%) $21.38 $18.75
Total Jobs, Openings, and %
Change; Median Earnings
225,11
6
21,063 7% $42.55 $37.42
Source: Emsi
A closer look at the occupations suggests that there is wide variation in the projected demand. Among the
occupational groups, the Computer and Mathematical Occupations and the Construction and Extraction
Occupations (including only Electricians) are expected to grow the fastest in both states. The lowest
growth rates are predicted for Production Occupations: a 2% decrease in Washington and a 1% decrease
in Oregon. However, there is a significant variation within the different Production Occupations as well: in
both states, Computer-Controlled Machine Tool Operators will be in demand, whereas the number of jobs
for Electrical, Electronic, and Electromechanical Assemblers are expected to decrease. This decrease in
jobs for Electrical, Electronic, and Electromechanical Assemblers may seem surprising at first, but the
trend is a part of a wider decline in manufacturing labor force, caused by offshoring and automation.
Finally, we also examined the regional variation in future occupational needs in the electric motor vehicle-
related occupations. Perhaps the most striking regional difference is in the demand for Electricians. The
predicted increase in these jobs is 18.4% in the Portland metropolitan area, defined as the Portland-
Vancouver-Hillsboro OR-WA metropolitan statistical area by the U.S. Census Bureau. The predicted
growth for electricians is smaller in Oregon overall, 13.7%, and it is significantly lower in the Seattle
metropolitan area, defined as the Seattle-Tacoma-Bellevue area, at 6.4%. For more on the regional
variation between the occupational groups, see the Appendix (Appendix C).
Challenges that Workforce Development Faces: Low Education
Occupations Will Grow Slowest Importantly, most of the electric motor vehicle-related occupations require high levels of education. Table
8 lists the key occupations according to the typical level of education required for an entry-level position,
together with required work experience and typical on-the-job training. Twenty-one of the 30 occupations
require at least an associate degree, and only seven are open for candidates with only high school
diploma. In 2019, those seven occupations employed 32% of the workers in EV-related occupations in
Oregon and 24% in Washington.

30
Table 8. Required Education and Experience in Electric Motor Vehicle-Related Occupations
Occupation Typical Entry Level
Education
Work
Experience
Required
Typical On-The-
Job Training
Electricians High school diploma or
equivalent
None Apprenticeship
Electric Motor, Power Tool, and Related
Repairers
High school diploma or
equivalent
Less than 5
years
Moderate-term on-
the-job training
Electronic Equipment Installers and
Repairers, Motor Vehicles
High school diploma or
equivalent
None Moderate-term on-
the-job training
Electrical, Electronic, and
Electromechanical Assemblers, Except
Coil Winders, Tapers, and Finishers
High school diploma or
equivalent
None Moderate-term on-
the-job training
Assemblers and Fabricators, All Other,
Including Team Assemblers
High school diploma or
equivalent
None Moderate-term on-
the-job training
Computer-Controlled Machine Tool
Operators, Metal and Plastic
High school diploma or
equivalent
None Moderate-term on-
the-job training
Machinists High school diploma or
equivalent
None Long-term on-the-
job training
Telecommunications Equipment
Installers and Repairers, Except Line
Installers
Postsecondary
nondegree award
None Moderate-term on-
the-job training
Automotive Service Technicians and
Mechanics
Postsecondary
nondegree award
None Short-term on-the-
job training
Mechanical Drafters Associate degree None None
Electrical and Electronics Engineering
Technicians
Associate degree None None
Electro-Mechanical Technicians Associate degree None None
Mechanical Engineering Technicians Associate degree None None
Industrial Production Managers Bachelor's degree 5 years or
more
None
Computer Systems Analysts Bachelor's degree None None
Computer Programmers Bachelor's degree None None
Software Developers, Applications Bachelor's degree None None
Software Developers, Systems
Software
Bachelor's degree None None
Network and Computer Systems
Administrators
Bachelor's degree None None
Operations Research Analysts Bachelor's degree None None
Chemical Engineers Bachelor's degree None None
Computer Hardware Engineers Bachelor's degree None None
Electrical Engineers Bachelor's degree None None
Electronics Engineers, Except
Computer
Bachelor's degree None None
Industrial Engineers Bachelor's degree None None
Materials Engineers Bachelor's degree None None

31
Mechanical Engineers Bachelor's degree None None
Chemists Bachelor's degree None None
Materials Scientists Bachelor's degree None None
Urban and Regional Planners Master's degree None None
Source: Emsi
Assessing the job growth by education level, projected growth is highest for jobs that require a bachelor’s
or a master’s degree. The trend holds for both Oregon and Washington, as well as the Pacific Northwest
and the country as a whole: the predicted increase in openings is almost 10% across the regions. In turn,
the occupational demand is predicted to grow the slowest in the occupations that require only a high
school diploma. The exception is Washington, where the predicted growth is slightly slower for the
occupations that require an associate degree. Table 9 presents these growth rates in more detail.
Table 9. Projected Growth in Electric Motor Vehicle-Related Occupations
Occupational Group by
education
2019 – 2025 %
Change in
Jobs, OR and
WA
2019 – 2025 %
Change in
Jobs, OR
2019 – 2025 %
Change in
Jobs, WA
2019 – 2025 %
Change in
Jobs, United
States
HS diploma or Postsecondary
nondegree award
2.3 3.2 1.7 1.8
Associate degree 2.7 3.9 1.6 5.3
Bachelor's degree or master’s
degree
9.5 8.7 9.8 10.0
Source: Emsi
Demographics of Workers Highlight the Need for Workforce
Development Initiatives This section analyzes the demographics of the workers in the occupations related to electric motor
vehicle production in the region. Starting with gender, a breakdown of the workforce reveals that the
occupations are dominated by male workers. Figure 6 shows that female workers form only 19.2% of the
workforce in Oregon and 18.9% in Washington. The share of female workers is somewhat lower in both
states than nationally, as the share of female workers in the electric motor vehicle-related occupations is
21.0% across all U.S. states.
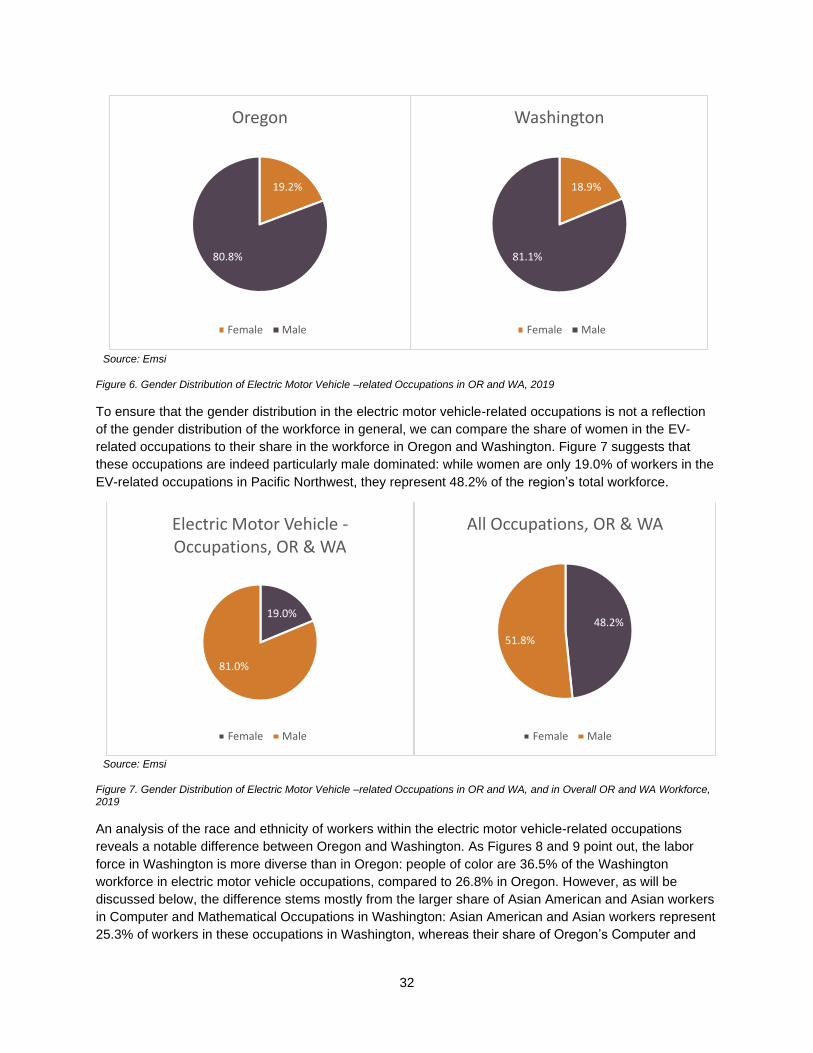
32
Source: Emsi
Figure 6. Gender Distribution of Electric Motor Vehicle –related Occupations in OR and WA, 2019
To ensure that the gender distribution in the electric motor vehicle-related occupations is not a reflection
of the gender distribution of the workforce in general, we can compare the share of women in the EV-
related occupations to their share in the workforce in Oregon and Washington. Figure 7 suggests that
these occupations are indeed particularly male dominated: while women are only 19.0% of workers in the
EV-related occupations in Pacific Northwest, they represent 48.2% of the region’s total workforce.
Source: Emsi
Figure 7. Gender Distribution of Electric Motor Vehicle –related Occupations in OR and WA, and in Overall OR and WA Workforce, 2019
An analysis of the race and ethnicity of workers within the electric motor vehicle-related occupations
reveals a notable difference between Oregon and Washington. As Figures 8 and 9 point out, the labor
force in Washington is more diverse than in Oregon: people of color are 36.5% of the Washington
workforce in electric motor vehicle occupations, compared to 26.8% in Oregon. However, as will be
discussed below, the difference stems mostly from the larger share of Asian American and Asian workers
in Computer and Mathematical Occupations in Washington: Asian American and Asian workers represent
25.3% of workers in these occupations in Washington, whereas their share of Oregon’s Computer and
19.0%
81.0%
Electric Motor Vehicle -Occupations, OR & WA
Female Male
48.2%
51.8%
All Occupations, OR & WA
Female Male
18.9%
81.1%
Washington
Female Male
19.2%
80.8%
Oregon
Female Male

33
Mathematical Occupations is only 14.5%. When we exclude the Computer and Mathematical
Occupations from the analysis, the share of people of color of the EV-related workforce is 25.7% in
Oregon and 26.5% in Washington.
Source: Emsi
Figure 8. Race and Ethnicity Distribution of Electric Motor Vehicle-Related Occupations in Oregon and Washington and the US, 2019
A comparison with all US workers in these occupations reveals that the share of people of color in the
EV-related occupations in the U.S. as a whole (35.0%) is about the same in Washington (36.5%) and
nearly ten percentage points higher than in Oregon (26.8%). The share of Hispanic or Latino workers is
notably lower in both Oregon (7.7%) and Washington (5.6%) than nationally (10.4%).
Finally, there are some differences between the demographics of people who work in the EV-related
occupations in Oregon and Washington, and people in the regional workforce in general. Most notably, as
Figure 9 illustrates, the electric motor vehicle-related occupations have disproportionally more Asian
American and Asian workers. At the same time, the shares of Hispanic or Latino workers and white
workers are smaller than in the regional workforce at large.
7.7
%
0.6
%
14
.5%
1.6
%
0.3
%
2.2
%
73
.2%
5.6
%
0.4
%
25
.3%
2.4
%
0.4
%
2.5
%
63
.5%
10
.4%
0.3
%
14
.3%
8.5
%
0.1
%
1.3
%
65
.0%
0.0%
10.0%
20.0%
30.0%
40.0%
50.0%
60.0%
70.0%
80.0%
Hispanic orLatinx
NativeAmerican or
Alaska Native
Asian Americanor Asian
Black or AfricanAmerican
NativeHawaiian orOther Pacific
Islander
Two or MoreRaces
White
Race and Ethnicity Distribution of EV-Related Occupations
Oregon Washington United States

34
Source: Emsi
Figure 9. Race and Ethnicity Distribution of Electric Motor Vehicle-Related Occupations in Oregon and Washington and Overall in Oregon and Washington Workforce, 2019
Looking at the age distribution of workers in the EV-related occupations, the workers in Oregon and
Washington skew somewhat younger than the overall labor force in these occupations in the U.S. Figure
10 presents the age breakdown of the occupations. The biggest share of workers in the electric motor
vehicle occupations in the Pacific Northwest are between 35-44 years old. This is also the most populated
age group across all U.S. states, but the share of this age group is smaller nationally (24.6%) than in
Oregon (27.1%) and Washington (27.5%). In Washington, the share of workers in the age group 25-34,
27.6%, is notably higher than in Oregon (24.1%) and in the country as a whole (24.5%).
11
.3
0.9
8.0
3.7
0.5
2.9
72
.6
6.2
0.5
21
.9
2.1 0
.3
2.4
66
.5
0.0
10.0
20.0
30.0
40.0
50.0
60.0
70.0
80.0
Hispanic orLatinx
NativeAmerican or
Alaskan Native
Asian Americanor Asian
Black or AfricanAmerican
NativeHawaiian or
Pacific Islander
Two or MoreRaces
White
Race and Ethnicity Distribution of Workforce in Oregon & Washington
All Occupations, OR and WA Electric Motor Vehicle -Occupations, OR and WA
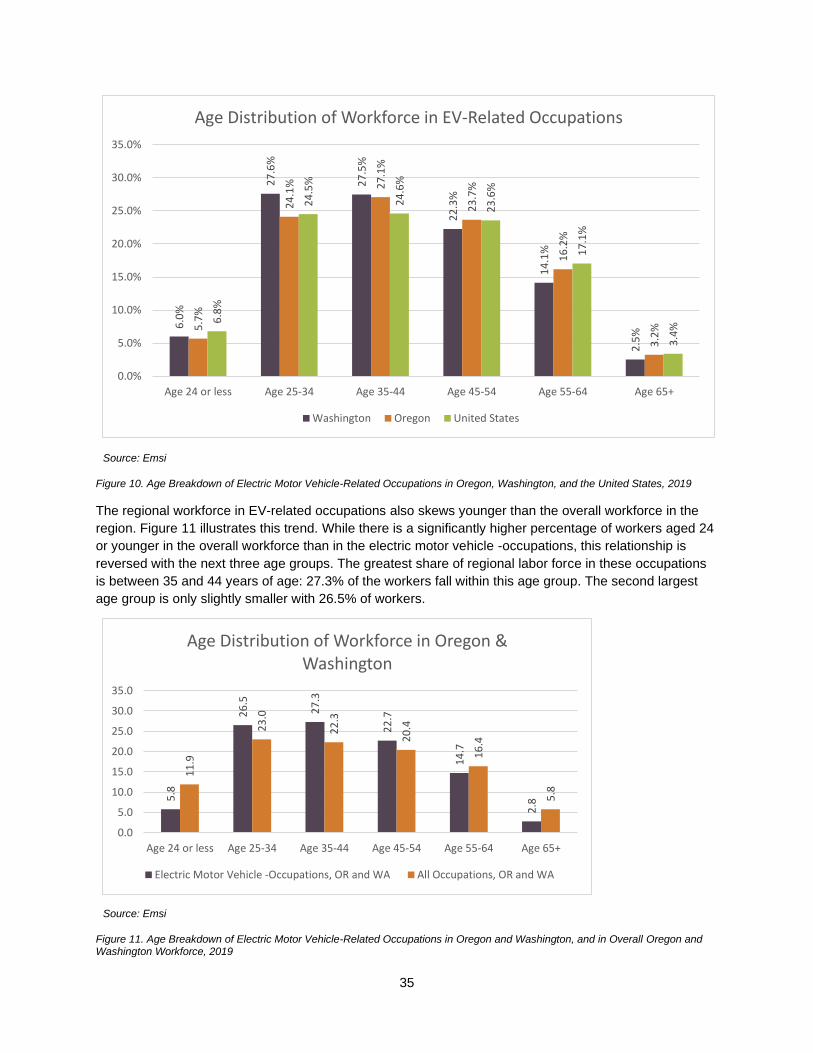
35
Source: Emsi
Figure 10. Age Breakdown of Electric Motor Vehicle-Related Occupations in Oregon, Washington, and the United States, 2019
The regional workforce in EV-related occupations also skews younger than the overall workforce in the
region. Figure 11 illustrates this trend. While there is a significantly higher percentage of workers aged 24
or younger in the overall workforce than in the electric motor vehicle -occupations, this relationship is
reversed with the next three age groups. The greatest share of regional labor force in these occupations
is between 35 and 44 years of age: 27.3% of the workers fall within this age group. The second largest
age group is only slightly smaller with 26.5% of workers.
Source: Emsi
Figure 11. Age Breakdown of Electric Motor Vehicle-Related Occupations in Oregon and Washington, and in Overall Oregon and Washington Workforce, 2019
6.0
%
27
.6%
27
.5%
22
.3%
14
.1%
2.5
%5.7
%
24
.1% 27
.1%
23
.7%
16
.2%
3.2
%
6.8
%
24
.5%
24
.6%
23
.6%
17
.1%
3.4
%
0.0%
5.0%
10.0%
15.0%
20.0%
25.0%
30.0%
35.0%
Age 24 or less Age 25-34 Age 35-44 Age 45-54 Age 55-64 Age 65+
Age Distribution of Workforce in EV-Related Occupations
Washington Oregon United States
5.8
26
.5
27
.3
22
.7
14
.7
2.8
11
.9
23
.0
22
.3
20
.4
16
.4
5.8
0.0
5.0
10.0
15.0
20.0
25.0
30.0
35.0
Age 24 or less Age 25-34 Age 35-44 Age 45-54 Age 55-64 Age 65+
Age Distribution of Workforce in Oregon & Washington
Electric Motor Vehicle -Occupations, OR and WA All Occupations, OR and WA

36
To make sure that these demographic trends are not driven by certain occupational groups, we compare
the demographics of workers in different occupational subgroups. Table 10 presents the gender
distribution for all EV–related subgroups. The shares are, overall, close to those at the national level.
However, both in Oregon and Washington, and in the U.S. as a whole, there are clear differences
between the subgroups. Within the subgroups, the greatest share of women works in Life, Physical, and
Social Occupations, a group that includes Chemists, Material Scientists, and Urban and Regional
Planners. The share of women in these occupations is 42.3% in Oregon and 41.2% in Washington. The
smallest percentage of women, in turn, is in Construction and Extraction Occupations, a group that
includes Electricians: 2.3% of Electricians in Oregon are women and the share of female Electricians is
3.1% in Washington.
Table 10. Share of Women in Electric Motor Vehicle-Related Occupations by Subgroup in Oregon, Washington, and the United States, 2019 (Growth in Jobs in Parenthesis)
Electric Motor Vehicle-Related
Occupations
Oregon Washington United States
Architecture and Engineering
Occupations
11.9 (6%) 13.0 (3%) 13.1
Computer and Mathematical
Occupations
24.0 (10%) 22.2 (12%) 25.1
Construction and Extraction
Occupations
2.3 (14%) 3.1 (9%) 2.7
Installation, Maintenance, and
Repair Occupations
3.4 (3%) 4.1 (-2%) 4.1
Life, Physical, and Social Science
Occupations
42.3 (8%) 41.2 (5%) 40.8
Management Occupations 15.5 (5%) 17.2 (4%) 17.1
Production Occupations 31.4 (-1%) 27.6 (-2%) 32.4
Source: Emsi
Similarly, there are some significant differences between occupational subgroups when it comes to the
ethnicity of the workforce, presented in Table 11. The labor force in electric motor vehicle –related
occupations in Pacific Northwest is least diverse in Construction and Extraction Occupations: the share of
people of color in these occupations is 12.8% in Oregon and 17.1% in Washington. The workforce is most
diverse in Computer and Mathematical Occupations: the share of people of color is 29.2% in Oregon and
46.6% in Washington. These numbers are mostly driven by Asian American and Asian workers: their
share of workers in Computer and Mathematical Occupations is 20.7% in Oregon and 38.5% in
Washington. The percentage in Washington is much higher than in the country as a whole, where Asian
American and Asian workers are 27.4% of the employees in these occupations.

37
Table 11. Share of People of Color in Electric Motor Vehicle-Related Occupations by Subgroup in Oregon, Washington, and the United States, 2019
Electric Motor Vehicle-Related
Occupations
Oregon Washington United States
Architecture and Engineering
Occupations
28.0 (6%) 26.7 (3%) 27.8
Computer and Mathematical
Occupations
29.2 (10%) 46.6 (12%) 41.3
Construction and Extraction
Occupations
12.8 (14%) 17.1 (9%) 25.4
Installation, Maintenance, and
Repair Occupations
19.3 (3%) 25.4 (-2%) 31.3
Life, Physical, and Social Science
Occupations
18.5 (8%) 25.1 (5%) 32.5
Management Occupations 16.0 (5%) 19.0 (4%) 20.5
Production Occupations 32.5 (-1%) 32.9 (-2%) 37.6
Source: Emsi
We also evaluated the demographics of workers in occupations with lower educational requirements and
compared those to demographics of workers in occupations with higher educational requirements. The
differences are not drastic in Oregon, due to the high share of Asian American and Asian workers in the
Architecture and Engineering Occupations and Computer and Mathematical Occupations, occupations
that oftentimes require a bachelor’s degree. The share of non-white workers in the occupations that
require a bachelor’s or a master’s is 28.0% in Oregon, compared to the share of non-white workers in the
occupations with only high school diploma or equivalent required, 25.3%. In Washington, non-white
workers are actually a greater share of workers in occupations with high educational requirements: 41.8%
of workers in occupations with bachelor’s or master’s required are non-white, whereas in high school
diploma required occupations this share is only 26.7%.
To assess the demographics of growing versus declining occupations, Table 12 groups together the
occupations in Oregon and Washington that are expected to experience job growth between 2019 and
2025, and the occupations that are projected to lose jobs within that time frame. The share of women is
much higher in the declining occupations, 32.6%, compared to 16.0% in the growing occupations.
Similarly, the share of people of color is higher in the occupations with a negative outlook: 36.0% versus a
31.1% share in the occupations experiencing growth. The table includes a separate category for Asian
American and Asian workers, as their higher number in the growing occupational groups that include
engineering and computer science-related fields drives up the share of people of color in the category for
growing occupations.
Table 12. Share of Women and People of Color in Electric Motor Vehicle-Related Occupations by Expected Growth between 2019-2025, Oregon and Washington
Electric Motor Vehicle-Related
Occupations
Female People of Color Asian American
and Asian (%)
Growing Occupations (9.1%) 16.0 31.1% 23.0%
Declining Occupations (-3.7%) 32.6 36.0% 17.4%
Source: Emsi
Finally, there is some variation across the occupation groups in the age of the workforce. For example,
there are more younger workers in Production Occupations than in some of the occupations that require

38
higher education or more experience, especially Management Occupations. However, these differences
are less notable. The table illustrating these trends is included in the Appendix (Appendix D).
This section has analyzed the current workforce in the industries connected to the EV supply chain and
its growth projections. Due to lacking data, the analysis cannot examine the workers employed directly in
EV-related industries. However, we can examine the overall labor force in jobs considered essential for
EV production. Such analysis is of interest when considering the region’s potential for new electric motor
vehicle business. For example, most of the workers in Computer and Mathematical Occupations in
Washington are undoubtedly employed in high tech. One industry expert consulted for this research
described the implications for the EV industry: on the one hand, the region has trained and attracted
plenty of skills and talent in fields relevant to EV production. On the other, that talent is often not in the
exact fields most in need in EV production and, moreover, the competition for that talent is intense. In
other words, the existence of a workforce with training and skills needed for EV production is an asset for
the region. However, specific training or other interventions might be necessary to prepare that workforce
for the electrification of transportation.
The demographic analysis of the current and future workforce stresses a need for policies and
interventions, as well. It is important to note that the demographic data vary greatly among the relevant
occupations and the occupational groups. For example, women are about a fifth of the workforce in
Computer and Mathematical Occupations both in Oregon and Washington, while their share of
Electricians is 2.3% and 3.1% respectively. However, overall, women and people of color will be
challenged by the economic decline in EV-related occupations more than men and white people. This is
because the shares of women and people of color are notably higher in the EV-related occupations that
are expected to decline in the short-to-median term.* In other words, women and minorities are
particularly vulnerable to economic changes in the field. Therefore, we need interventions that aim to
ensure that women and people of color have opportunities to upskill or gain additional training that
prepare for economic trends in the EV fields. In a similar vein, policies and initiatives can increase access
for women and people of color into fields they are currently underrepresented in and that are
economically promising.
Key Partners for Innovation in Workforce
Development The analysis so far has established that Oregon and Washington have both plenty of business with
possible openings in the EV supply chain, and a labor force with workers in the occupations required for
the EV production. However, the analysis has also shown that workforce development is needed in order
to prepare industry and the labor force better for the electrification of transportation. For that development
to happen, coordination between industry, public sector, and education is required.
This section assesses the educational infrastructure that currently prepares local workforce for
occupations relevant to EV production in the Pacific Northwest. The section also highlights where
curricula and training development is needed. In particular, there are two types of recommended
interventions. First, in order to ensure a diverse workforce in the sector, we need to consider how to
* As a reminder, the share of Asian and Asian American workers is high in the Computer and Mathematical Occupations, especially in Washington. When we exclude these occupations from the analysis, the difference between the demographics of growing and declining occupations becomes more evident.

39
increase access to the trainings that provide a pipeline for the EV sector and, especially, how to increase
access for those populations who are currently left behind. Second, collaboration between industry, the
public sector, and the education sector is required to ensure that the education and training programs in
the region are well suited for the demands of the EV sector. The first intervention is about ensuring
access to the field, and the second aims to improve the existing education and training programs in the
region so that they include EV specific components.
Table 13 presents some demographic data for EV related occupations that are expected to experience
negative growth between 2019 and 2025 in Oregon and Washington. The share of women in these
declining occupations is 32.6%. For comparison, female workers represent 16.0% of the labor force in
growing occupations. In other words, the share of women in declining occupations – most with low entry-
level educational requirements – is dramatically higher than in the growing occupations – most of which
require an associate degree or higher. The relationship is similar for people of color, though not quite as
striking: in the declining occupations, people of color are 36.0% of the workforce, compared to 33.1% in
growing occupations. For this difference, it is important to keep in mind that Asian American and Asian
workers form a disproportionally great share of many of the growing occupations that require relatively
high education.
Table 13. Occupations in Decline in Oregon and Washington (combined), 2019
Occupation 2019-2025 %
Change in Jobs
Typical Entry
Level Education
Female % People of Color
%
Computer Programmers
-1.8 Bachelor’s degree 20.9 37.8
Telecommunications Equipment Installers and Repairers, Except Line Installers
-2.2 Postsecondary
nondegree
10.6 22.5
Electronic Equipment Installers and Repairers, Motor Vehicles
-15.5 High school
diploma or
equivalent
3.6 28.3
Electrical, Electronic, and Electromechanical Assemblers, Except Coil Winders, Tapers, and Finishers
-8.3 High school
diploma or
equivalent
51.6 47.4
Assemblers and Fabricators, All Other, Including Team Assemblers
-3.2 High school
diploma or
equivalent
36.7
36.1
Total -3.7 32.6 36.0
Source: Emsi
This data underscores a need for initiatives and training programs that can provide underserved
populations access to career pathways in the growing occupations. The focus of such initiatives should
be on trainings that are relatively short, in order to ensure the participants’ ability to complete the
programs and begin earning. Moreover, the programs should pay extra attention to the support needs of
participants.

40
Shoreline Community College in Washington offers an example of an institution that has embraced such
educational innovations. Shoreline College’s Automotive Department partnered with Seattle Jobs Initiative
in 2005 to test a pilot project curriculum for Automotive General Service Technician (GST) training with a
group of students from low-income backgrounds traditionally excluded from college-driven training
programs. The goal of the pilot was to place program participants in living wage automotive careers and,
at the same time, test whether the program could serve as an ongoing entry point to the sector for
underserved populations. The college provided the students with tuition and free tutoring, while SJI
assisted them with wrap-around supports and case management services, including job readiness
training, job search assistance, and support for job retention, among other supports.
The pilot was a part of a broader initiative to increase access to training for underserved populations, and
was among the first Integrated Basic Education and Skills Training (I-BEST) programs, developed by the
Washington State Board for Community and Technical Colleges together with the community and
technical colleges in the state. I-BEST programs are designed to provide low-income students with a
structured pathway to jobs in high-demand, high-wage industries. The instruction is team based: one
teacher is in charge of basic skills teaching in reading, math and/or English language, while another
teacher provides technical skills training. In this way, students who might lack the basics skills needed to
enter traditional college-level occupational classes gain access to a promising field.
I-BEST programs, including the Automotive GST program at Shoreline College, have been a success.
Research shows that I-BEST students are more likely to continue into credit-bearing coursework, earn
credits toward a college credential, earn occupational certificates, and make point gains on basic skills
tests than basic skills students in general.24 Moreover, the students in I-BEST programs are older and
more often female than average basic skills students, and higher percentage of them come from the
lowest quintiles of socioeconomic status.25 Based on these positive outcomes, community and technical
colleges across Washington have expanded the number of I-BEST programs, now numbering 239, and
the programs have attracted attention and interest in replication around the country, as well.25–27
The Automotive Department at Shoreline College has also succeeded in building strong partnerships with
the private sector. An instructor in the College approached the Puget Sound Automotive Dealership
Association (PSADA) in the 1980s with the goal of connecting better with local employers for the good of
the community and the college students.28 He highlighted the savings that employers would realize by
leasing training space on the college campus rather than training incumbent workers in Portland.* Thanks
to the instructor’s advocacy and two capital campaigns he mounted, the college opened a new training
facility, the Professional Automotive Training Center in 1992. The Center was further expanded in 2010.
In this space, the instructor brought the college and local dealers together and helped in setting up
multiple dealer-sponsored programs in the college. Today, the training site hosts programs with partners
such as Chrysler, General Motors, Honda, Tesla and Toyota, and more than 1,300 students have
graduated from the Center.28
Interestingly, the most recent program addition in Shoreline College’s Automotive Department focuses on
training in the EV field. Tesla’s START program started in the College in the fall of 2018, and it is currently
one of several START programs across the country. The selected students go through an intensive, 12-
week training program that prepares them for Service Technician positions at Tesla Service Centers in
* According to Shoreline College and Washington Auto Dealers Association, the partnership with the college would save employers approximately $8,594/worker that needs ongoing training; $26,928/worker requiring training to the equivalency of a program graduate; $34,152 in employing and training a program graduate; and, if four hours of labor of the eight hours that the student works at the dealership over two years in the program are counted, the dealership realizes $170,280 in additional labor income. For more details on the project and the return on investment calculation, see Nagley 2017.28

41
the U.S.29 The program is attractive for students for various reasons. According to Sarah Budriunas, Sr.
Project Manager of Tesla’s Workforce Development and Education Programs, the on-the-job training for
an electric vehicle technician takes a traditional automotive technician about 1-1.5 years on average.
Tesla’s program offers students an opportunity to gain EV training in only 12 weeks. The program is a
paid internship allowing students to focus on training and coursework throughout the program duration.
Finally, Tesla assists successful graduates with job placement at Tesla Service Center in the U.S. As of
December 2019, over 300 students have graduated from Tesla START, 13% of which are from Shoreline.
The goal of Tesla’s program is to build a pipeline of trained professionals for a growing field. The
company has a significant presence is the Pacific Northwest: it has three regional service centers in the
Seattle area, one regional service center in Spokane, and one in Portland. As more and more consumers
choose electric vehicles, the program aims to ensure a supply of service technicians required for that
growth. In addition to building a local talent pipeline, one of Tesla’s goals for the program is to invest in
the community.25
The innovations and initiatives in the Automotive Department at Shoreline College highlight how public-
private partnerships can institutionalize and continue to develop in a way that responds to the needs of
students and employers. Beyond these examples, there are a number of somewhat less specialized
programs in the healthcare industry that aim to increase local access to entry level positions with potential
for upskilling in the future.* These kinds of short-term trainings designed in collaboration with industry and
the public and education sectors have great potential for increasing diversity in the workforce, as the
programs can consider both specific industry needs and provide support services that are essential for
ensuring that people who enter the program can complete it successfully.
Apprenticeships offer another potential path
towards the creation of a more diverse workforce.
Just like the shorter trainings discussed above,
apprenticeships can be more accessible than
traditional college programs, as the on-the-job
training component allows trainees to earn while
learning new skills. Some relevant programs exist
in the region already, including The Puget Sound
Electrical Joint Apprenticeship and Training
Committee’s programs for electrical contractors
and the program for General Journeyman
Electricians.30,31
Finally, it is important not to overlook opportunities that exist in the occupations with a negative outlook.
Assembler jobs, for example, are entry-level jobs that only require a high school diploma and moderate
on-the-job training. Assembler positions in the Pacific Northwest are expected to decline dramatically
between 2019 and 2025, partly due to offshoring and automation. Yet, these can be critical jobs in
advanced manufacturing career pathways as individuals work while waiting for apprenticeship openings
or other upskilling opportunities in the same company. Acknowledging the role that they can play in
moving someone towards a career path is important and identifying key employers who are willing to
support their workers in this way could be a first step in developing more opportunities to upskill for
underserved populations, even if the number of jobs in these occupations declines in the future.
* See, for example, https://hospitaltoolkits.org/workforce/case-studies/johns-hopkins-university-health-system/ and http://www.seattlejobsinitiative.com/job-seekers/growhire/.

42
Another type of key workforce development initiative would focus on improving the existing education and
training programs in the field by designing components that focus specifically on EV-related skills training.
The Luskin Center for Innovation at UCLA identified the occupations in the EV supply chain with the most
urgent need for such component.32 They did so by examining which EV related occupations are likely to
experience both an increase in openings and a change in the nature of the work. The occupations
undergoing these changes need training and curriculum development, in order to ensure the pipeline of
qualified workforce amidst the changes. We modify their list by including only the occupations related to
EV supply chain. The resulting priority occupations are: Computer Systems Administrators & Analysts,
Computer Programmers, Computer Software Developers; Materials, Chemical and Computer Engineers,
Chemists, Material scientists, and Operations research analysts.
The following table identifies the institutions in Oregon and Washington that reported completed degrees
in 2018 in the programs that most directly translate into these occupations.* The listing of completions in
all the EV-related occupations is presented in the Appendix (Appendix E). The institutions in Table 14 are
candidates for partners in curriculum development for EV-specific education and training components, as
they have existing programs training workforce to these occupations. We recommend engaging these
institutions for planning and designing of new educational components that focus on the specific needs of
the EV industry. The Appendix (Appendix F) also provides a list of the institutions that rank in top 10 in
the region when it comes to the number of completions in different types of programs.
Table 14. Completions in EV-related Programs in Oregon and Washington, 2018†
Institution Sta
te
Ch
em
ists
Co
mp
ute
r
Pro
gra
mm
ers
Mate
rial
En
gin
ee
rs
Ch
em
ica
l
En
gin
ee
rs
Co
mp
ute
r
Hard
ware
En
gin
ee
rs
Mate
rial
Scie
nti
st
So
ftw
are
Develo
pers
Bates Technical College WA 6 Bellevue College WA 51 Big Bend Community College WA 5 Cascadia College WA 57 1 Central Washington University WA 17 Centralia College WA 5 Clark College WA 0 Clover Park Technical College WA 16 Columbia Basin College WA 8 Concordia University-Portland OR 2 Eastern Washington University WA 13 Edmonds Community College WA 69 4 George Fox University OR 3 Gonzaga University WA 4
* The data for program completions is collected following the Classification of Instructional Programs (CIP). Since there is no official crosswalk between the occupations analyzed in the previous section, classified according to SOC, and CIP, we conduct this crosswalk according to our best effort. There were no reported completions in programs in Computer Systems Analysis and Operations Research Analysis. More research is needed to identify the programs that prepare students for these occupations in the region. † Includes distance offered and non-distance offered programs.

43
Green River College WA 77 9 Heritage University WA 2 Highline College WA 6 Klamath Community College OR 31
Lake Washington Institute of Technology WA 27 Lane Community College OR 11 Lewis & Clark College OR 17 Linfield College-McMinnville Campus OR 2 Linn-Benton Community College OR 1 Lower Columbia College WA 7 2 Mt Hood Community College OR 1 North Seattle College WA 6 Olympic College WA 6 1 Oregon Institute of Technology OR 44
Oregon State University OR 80 163 12 Pacific Lutheran University WA 19 Pacific University OR 15 Peninsula College WA 10 Portland State University OR 33 9 Reed College OR 12 Renton Technical College WA 77 Rogue Community College OR 2 22
Saint Martin's University WA 1 Seattle Central College WA 10 Seattle Pacific University WA 7 Seattle University WA 5 Shoreline Community College WA 2 Skagit Valley College WA 1 South Puget Sound Community College WA 16 Southern Oregon University OR 16 Spokane Falls Community College WA 2 Tacoma Community College WA 1 University of Oregon OR 89 University of Portland OR 29 University of Puget Sound WA 10 University of Washington-Bothell Campus WA 3 University of Washington-Seattle Campus WA 130 97 118 Walla Walla University WA 3 Washington State University WA 34 57 57 Western Oregon University OR 6 Western Washington University WA 42 Whitman College WA 9 Whitworth University WA 21 Willamette University WA 23
Source: Emsi

44
In addition to the partners listed in this section, there are plenty of organizations focused on advocating
for growing the EV field. When planning the suggested interventions, or other initiatives in the field, these
organizations could provide crucial expertise and outreach capacity. Some of these organizations include
Plug-in America, Forth, PEV Dialogue Group, and West Coast Electric Fleets.
In conclusion, this report has emphasized the need for coordination between industry, education, and
public sector in order to prepare the workforce for the growing EV production. This section presents two
types of initiatives and proposes potential partners for such initiatives: first, addressing the lack of
diversity in the EV related occupations with training programs that target underserved populations.
Second, engaging existing educational programs that train workforce for the EV industries that are in
most need when it comes to trained professionals. The goal of this engagement would be to start
developing program components and trainings that focus specifically on EV-related content.
Recommendations The growing adoption of electric passenger vehicles and electric commercial vehicles is creating new
business opportunities for companies that have not formed a part of the traditional vehicle supply chains
in the past. To be sure, traditional manufacturers are working hard to establish the required supply chains
for mass production. Yet, there are also new players entering the field, producing different components
for the traditional manufacturers – or even producing their own electric vehicles. As the demand for EVs
continues to grow, so do these opportunities, both for established and emerging businesses.
This report has shown that Oregon and Washington are off to a good start when it comes to continuing to
develop regional EV production. Both states have plenty of ongoing and potential EV-related business
and both have workforce needed in the field. However, the report has also highlighted some challenges
that the region faces. Some of these challenges are specific to the Pacific Northwest. Most importantly,
the workforce in the EV-related occupations in the region is less diverse than nationally, and many of the
more diverse occupations in Oregon and Washington are projected to decline in the short-to-medium
term. More specifically, the analysis finds that occupations with a greater share of women and people of
color compared to their overall share of the EV-related workforce have a negative economic outlook in the
next five years. Other challenges are not unique to the Pacific Northwest: the negative growth projections
for certain occupations are partly due to offshoring and automation, both trends occurring regionally and
nationally. Another key challenge, also observed across the U.S., is the lack of training and training
components that would meet the demand for highly specialized workers in the EV field.
To answer these challenges and continue to work towards greater electrification of transportation, this
report recommends the following:
- Innovate Together with Key Partners in Industry, Public Sector, and Education: Multiple
industry experts consulted for this project called for collaboration and coordination between the
public, private, and the education sectors. In fact, some viewed this sort of collaboration essential
for the region to ensure a pipeline of qualified professionals for the rapidly changing industry. The
research conducted for this report supports such collaboration. The industry needs to be included
to share their understanding of the dramatic changes in the field and their occupational needs.
The public sector has a crucial role in coordinating the work, and, perhaps even more importantly,
ensuring that the resulting interventions and initiatives create a more diverse and inclusive
industry. Finally, the education sector offers expertise and existing educational infrastructure to
be able to design and implement education and training components quickly. The Professional
Automotive Training Center at Shoreline Community College in Washington serves as an

45
example of a successful and sustainable private-public partnership. By learning from their
experiences, and the experiences of other similar partnerships, and by inviting all the
stakeholders in the table, the region can develop a creative and comprehensive workforce
strategy that prepares the region better for the continuing electrification of transportation.
- Training Initiatives Directed to Underserved Populations: The workforce research highlighted
lack of diversity in the EV-related occupations, and some troubling trends when it comes to the
occupations with least educational requirements. We recommend designing and implementing
training initiatives that would specifically target underserved populations. For example, the I-
BEST programs in Washington, college programs that combine basic skills training with technical
training, have succeeded in improving the educational outcomes for many underserved
populations. Similarly, short-term training programs that focus on creating access to entry-level
positions have proven to be promising in other sectors. Working with employers willing to upskill
their workforce is another way of targeting workers who need help in getting on to a career path.
To create a pipeline of qualified and diverse EV professionals, we recommend workforce
initiatives that adopt these approaches.
- Developing EV-specific Curriculum and Trainings: As the technology in electric vehicles
continues to develop and their mass production becomes more and more common place, the
need for increasingly specialized labor force increases. We recommend working with institutions
that have strong educational programs in the EV-related fields to develop training that is directed
at the particular needs of EV production. Another promising venue for improving EV-specific
curriculum is to work in close collaboration with the industry. By bringing part of the training in-
house, companies can train their workforce in a very targeted way. At the same time, the public
sector can ensure that the adopted solutions consider the greater goals of workforce
development as well, including diversity and sustainability.

46
References 1. EV Market Share by State – EVAdoption. https://evadoption.com/ev-market-share/ev-market-share-
state/. Accessed December 19, 2019.
2. Inslee GJ. Washington’s first electric school bus rolls through Tacoma. Medium. https://medium.com/wagovernor/washingtons-first-electric-school-bus-rolls-through-tacoma-5e3959547ec3. Published August 19, 2019. Accessed December 10, 2019.
3. Seattle gets first all-electric refuse truck from BYD. Fleet Owner. https://www.fleetowner.com/running-green/seattle-gets-first-all-electric-refuse-truck-byd. Published May 23, 2019. Accessed December 10, 2019.
4. Dzikiy P. Portland’s new electric buses run on wind energy, a first in US transit. Electrek. April 2019. https://electrek.co/2019/04/22/portland-electric-buses-wind/. Accessed December 10, 2019.
5. Kalaitzi D, Matopoulos A, Clegg B. Managing resource dependencies in electric vehicle supply chains: A multi-tier case study. Supply Chain Manag Int J. 2019;24(2):256-270. doi:10.1108/SCM-03-2018-0116
6. E-trucks to reach financial tipping point in 2028†” Supply Chain Movement. https://www.supplychainmovement.com/e-trucks-to-reach-financial-tipping-point-in-2028/. Accessed December 19, 2019.
7. Crissey A. Executive interview: Kenworth is rolling with the changes. Fleet Equip. 2019. https://www.fleetequipmentmag.com/executive-interview-kenworth/. Accessed December 3, 2019.
8. U.S. Bureau of Labor Statistics. Green Jobs: U.S. Bureau of Labor Statistics. https://www.bls.gov/green/. Accessed November 11, 2019.
9. Kenworth. Kenworth and Toyota Collaborate To Develop Zero Emission Trucks. https://www.kenworth.com/news/news-releases/2019/january/t680-kenworth-toyota/. Published January 8, 2019. Accessed November 18, 2019.
10. Rossini M, Ciarapica F, Matt D, Spena PR. A preliminary study on the changes in the Italian automotive supply chain for the introduction of electric vehicles. J Ind Eng Manag. 2016;9(2):450-486. doi:10.3926/jiem.1504
11. Klug F. How electric car manufacturing transforms automotive supply chains. In: EUROMA European Operations Management Association Conference. Dublin; 2013.
12. Zhou L, Watts JW, Sase M, Miyata A. Charge Ahead: Battery Electric Vehicles and the Transformation of an Industry. Deloitte; 2010. https://www2.deloitte.com/us/en/insights/deloitte-review/issue-7/charging-ahead-battery-electric-vehicles-and-the-transformation-of-an-industry.html#.
13. Hummel P, Lesne D, Radlinger J, et al. UBS Evidence Lab Electric Car Teardown-Disruption Ahead? UBS; 2017. https://neo.ubs.com/shared/d1mFW2YvNRvHXA/.
14. Heid B, Hensley R, Knupfer S, Tschiesner A. What’s Sparking Electric Vehicle Adoption in the Truck Industry? McKinsey & Company; 2017. https://www.mckinsey.com/~/media/McKinsey/Industries/Automotive%20and%20Assembly/Our%20Insights/Whats%20sparking%20electric%20vehicle%20adoption%20in%20the%20truck%20industry/Whats-sparking-electric-vehicle-adoption-in-the-truck-industry.ashx.

47
15. Proterra and Mitsui & Co., Ltd. Create $200 Million Credit Facility to Scale Proterra Battery Leasing Program. Proterra. https://www.proterra.com/press-release/proterra-and-mitsui-co-ltd-create-200-million-credit-facility-to-scale-proterra-battery-leasing-program/. Published 2019. Accessed November 18, 2019.
16. LeSage J. Tesla’s Largest Competitor Is Hidden in Plain Sight. https://finance.yahoo.com/news/tesla-largest-competitor-hidden-plain-190000790.html. Published 2019. Accessed December 3, 2019.
17. Boeker P. Kenworth Expert Talks Zero Emission Trucks. https://blog.ballard.com/zero-emission-trucks. Published 2018. Accessed December 3, 2019.
18. Park J. Electric Trucks: Zap in the Pan? Truckinginfo. https://www.truckinginfo.com/157686/electric-trucks-zap-in-the-pan. Published 2017. Accessed November 18, 2019.
19. Emsi. https://w.economicmodeling.com. Published 2019. Accessed December 13, 2019.
20. Featherstone CH. SGL Group buys BMW stake in Moses Lake Carbon fiber plant. https://www.columbiabasinherald.com/local_news/20171204/sgl_group_buys_bmw_stake_in_moses_lake_carbon_fiber_plant. Published 2017. Accessed January 13, 2020.
21. Daimler Annual Report 2019.; 2019. https://www.daimler.com/documents/investors/reports/annual-report/daimler/daimler-ir-annual-report-2018.pdf.
22. Taking the High Road: Strategies for a Fair EV Future. Detroit, MI: UAW Research; 2019. https://uaw.org/wp-content/uploads/2019/07/EV-White-Paper-Spring-2019.pdf.
23. Standard Occupational Classification (SOC) System 2018. https://www.bls.gov/soc. Accessed December 19, 2019.
24. Jenkins D, Zeidenberg M, Kienzl G. Educational Outcomes of I-BEST Washington State Community and Technical College System’s Integrated Basic Education and Skills Training Program: Findings from a Multivariate Analysis. New York, NY: Community College Research Center, Teachers College, Columbia University https://www.sbctc.edu/resources/documents/colleges-staff/programs-services/basic-education-for-adults/ccrc_working_paperNo16_may2009.pdf. Accessed February 7, 2020.
25. Wachen J, Jenkins D, Van Noy M. How I-BEST Works: Findings from a Field Study of Washington State’s Integrated Basic Education and Skills Training Program. New York, NY: Community College Research Center, Teachers College, Columbia University; 2010.
26. Washington State Board for Community and Technical Colleges. I-BEST Program Information. https://ibestprograms.sbctc.edu/default.aspx. Accessed February 7, 2020.
27. Durden W. Integrated Basic Education and Skills Training (I-BEST). Olympia, WA: Washington State Board for Community and Technical Colleges; 2018.
28. Nagley A. Employer-Training Partnerships in Seattle/King County. Seattle, WA: Seattle Jobs Initiative; 2017.
29. Tesla START. https://www.tesla.com/careers/tesla-start. Accessed January 13, 2020.
30. Puget Sound Electrical JATC. https://www.psejatc.org/. Accessed January 13, 2020.

48
31. Apprenticeship and Training Division: General Journeyman (Inside) Electrician. https://www.oregon.gov/boli/ATD/pages/a_ctrades_electrician.aspx. Accessed January 13, 2020.
32. Williams B, DeShazo JR, Kerbel Shein A, Xu T. Transportation Electrification Curriculum Development. UCLA Luskin School of Public Affaird; 2015. https://innovation.luskin.ucla.edu/wp-content/uploads/2019/03/Transportation_Electrification_Curriculum_Development.pdf.

49
Appendix A There are five key actors in the production of a traditional car: cars are designed and manufactured by
original equipment manufacturers, or OEMs. The OEMs receive necessary components from Tier 1
suppliers who specialize in auto hardware and usually work closely with one or two OEM. Tier 1 suppliers,
in turn, receive components from Tier 2 suppliers who are experts in their specific domain and serve
clients across industries. All of these actors—OEMs, Tier 1 and Tier 2 suppliers—also receive raw
materials from Tier 3 suppliers. The ready product is sold at a dealership, which in turn provides OEMs
information about their demand - necessary information for OEMs to guarantee the supply of new cars.
The table below presents these actors, together with their products and a few examples of products and
companies.
Supplier Product Product example Company example
Supplies to
Tier 3 Raw or close-to-raw materials
Metal, plastic Tiers 1 and 2 and OEMs
Tier 2 Specific parts Computer chip manufacturer
Intel, NVIDIA Tier 1
Tier 1 Automotive-grade hardware
In-car entertainment technologies, steering systems
Delphi, Bosch OEM
OEM (original equipment manufacturer)
Design, marketing, and assembling cars
Car Ford, Toyota Dealers
Dealership Customer service, maintenance and repair
Source: Modified from https://medium.com/self-driving-cars/the-automotive-supply-chain-explained-d4e74250106f
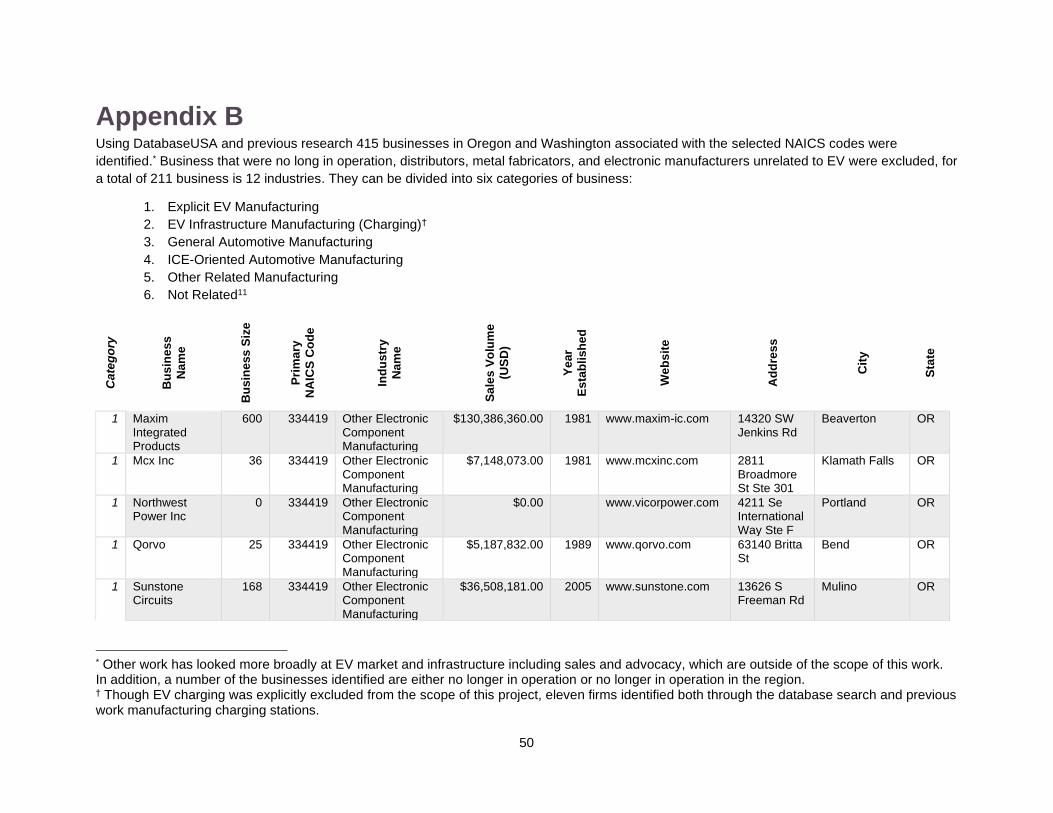
50
Appendix B Using DatabaseUSA and previous research 415 businesses in Oregon and Washington associated with the selected NAICS codes were
identified.* Business that were no long in operation, distributors, metal fabricators, and electronic manufacturers unrelated to EV were excluded, for
a total of 211 business is 12 industries. They can be divided into six categories of business:
1. Explicit EV Manufacturing
2. EV Infrastructure Manufacturing (Charging)†
3. General Automotive Manufacturing
4. ICE-Oriented Automotive Manufacturing
5. Other Related Manufacturing
6. Not Related11
* Other work has looked more broadly at EV market and infrastructure including sales and advocacy, which are outside of the scope of this work. In addition, a number of the businesses identified are either no longer in operation or no longer in operation in the region. † Though EV charging was explicitly excluded from the scope of this project, eleven firms identified both through the database search and previous work manufacturing charging stations.
Cate
go
ry
Bu
sin
ess
Nam
e
Bu
sin
ess
Siz
e
Pri
ma
ry
NA
ICS
Co
de
Ind
us
try
Nam
e
Sa
les
Vo
lum
e
(US
D)
Ye
ar
Es
tab
lish
ed
We
bs
ite
Ad
dre
ss
Cit
y
Sta
te
1 Maxim Integrated Products
600 334419 Other Electronic Component Manufacturing
$130,386,360.00 1981 www.maxim-ic.com 14320 SW Jenkins Rd
Beaverton OR
1 Mcx Inc 36 334419 Other Electronic Component Manufacturing
$7,148,073.00 1981 www.mcxinc.com 2811 Broadmore St Ste 301
Klamath Falls OR
1 Northwest Power Inc
0 334419 Other Electronic Component Manufacturing
$0.00
www.vicorpower.com 4211 Se International Way Ste F
Portland OR
1 Qorvo 25 334419 Other Electronic Component Manufacturing
$5,187,832.00 1989 www.qorvo.com 63140 Britta St
Bend OR
1 Sunstone Circuits
168 334419 Other Electronic Component Manufacturing
$36,508,181.00 2005 www.sunstone.com 13626 S Freeman Rd
Mulino OR

51
1 Te Connectivity
300 334419 Other Electronic Component Manufacturing
$65,193,180.00 2000 www.te.com 10025 SW Freeman Dr
Wilsonville OR
1 Tektronix Component Solutions
200 334419 Other Electronic Component Manufacturing
$43,462,120.00 1994 www.component-solutions.tektronix.com
2905 SW Hocken Ave
Beaverton OR
1 Alpha Technologies Inc
400 334419 Other Electronic Component Manufacturing
$152,328,041.00 1978 www.alpha.com 3767 Alpha Way
Bellingham WA
1 Anolog Devices
295 334419 Other Electronic Component Manufacturing
$64,106,627.00 1996 www.linear.com 4200 NW Pacific Rim Blvd
Camas WA
1 Crane Electronics+B252
275 334419 Other Electronic Component Manufacturing
$63,279,574.00 1980 www.craneae.com 10301 Willows Rd Ne
Redmond WA
1 Honeywell Electronic Materials
400 334419 Other Electronic Component Manufacturing
$82,444,232.00 1961 www.honeywen.com 15128 E Euclid Ave
Spokane WA
1 Linear Technology
4 334419 Other Electronic Component Manufacturing
$920,430.00 2000 www.linear.com 2018 156th Ave Ne
Bellevue WA
1 Midnite Solar 10 334419 Other Electronic Component Manufacturing
$2,301,075.00 2006 www.midnitesolar.com
17722 67th Ave Ne
Arlington WA
1 Tate Technology Inc
33 334419 Other Electronic Component Manufacturing
$6,801,649.00 1991 www.tatetech.com 3102 E Trent Ave Ste 100
Spokane WA
1 Toshiba International Corp
1 335312 Motor and Generator Manufacturing
$368,260.00 1875 https://www.toshiba.com/
12321 NW 24th Ave
Vancouver WA
1 SGL Carbon 450 335991 Carbon and Graphite Product Manufacturing
$107,000,000 1992 https://www.sglcarbon.com/
8781 Randolph Rd NE
Moses Lake WA
1 Entek International LLC
250 335999 All Other Miscellaneous Electrical Equipment and Component Manufacturing
$89,979,350.00 1983 www.entek.com 250 Hansard Ave
Lebanon OR
1 Anderson Electric Controls Inc
20 335999 All Other Miscellaneous Electrical Equipment and
$8,248,897.00 1969 www.aecontrols.com 8639 S 212th St
Kent WA

52
Component Manufacturing
1 Arcimoto Inc 0 336111 Automobile Manufacturing
$0.00 2007 Arcimoto Inc. 2034 W 2nd Ave
Eugene OR
1 Daimler Truck North America
0 336111 Automobile Manufacturing
$13,084,342,825.00
2018 www.daimler.com 4810 N Lagoon Ave
Portland OR
1 Excide Technologies
0 336111 Automobile Manufacturing
$0.00 2017 https://www.exide.com/en
13806 Ne Airport Way
Portland OR
1 Commuter Cars Corp
3 336111 Automobile Manufacturing
$4,697,086.00 1998 www.commutercars.com
715 E Sprague Ave Ste 70
Spokane WA
1 Paccar Inc 55 336111 Automobile Manufacturing
$96,139,207.00 1961 www.paccar.com 777 Math Ave Ne
Bellevue WA
1 Cascade German
11 336390 Other Motor Vehicle Parts Manufacturing
$4,715,479.00 2004 https://www.cascadegerman.com/
710 Ne Cleveland Ave
Gresham OR
1 Tesla Power Electric
139 336390 Other Motor Vehicle Parts Manufacturing
$59,586,506.00 2003 https://www.tesla.com/energy
101 SW Madison St
Portland OR
1 Consolidated Metco Inc
100 336390 Other Motor Vehicle Parts Manufacturing
$80,591,821.00 1964 www.conmet.com 5701 Se Columbia Way
Vancouver WA
1 Heavy Duty Transaxle Inc
139 336390 Other Motor Vehicle Parts Manufacturing
$63,095,423.00 1995 www.hdtransaxle.com 35409 State Highway 2
Monroe WA
1 Kenworth Truck Co
523 336390 Other Motor Vehicle Parts Manufacturing
$237,402,205.00 1923 www.kenworth.com 10630 Ne 38th Pl
Kirkland WA
1 Cooper Bussmann Transportation
55 335312 Motor and Generator Manufacturing
$20,254,295.00 1972 www.cooperindustries.com
10955 SW Avery St
Tualatin OR
1 Alltrax Inc 30 335312 Motor and Generator Manufacturing
2001 https://alltraxinc.com/ PO Box 179 Wilderville OR
1 Amfor Electronics
336320 Motor Vehicle Electrical and Electronic Manufacturing
1961 http://www.amforelect
ronics.com/ 5061 N Lagoon Ave
Portland OR
1 Blue Sky Design
1
1992 https://www.blueskydsn.com/
82811 Jackson Marlow Rd.
Eugene OR
1 Boxx
https://www.boxxcorp.com/site/6
939 SE Alder St
Portland OR

53
1 Cafe Electric
https://www.cafeelectric.com/
311 SW 2nd St
Corvallis OR
1 Cascadia Motion
2019 https://www.cascadiamotion.com/
7929 SW Burns Way
Wilsonville OR
1 Cummins
1919 https://www.cummins.com/
300 W Valley View Rd
Talent OR
1 Eaton
1911 https://www.eaton.com/us/en-us.html
10955 SW Avery St
Tualatin OR
1 EnerG2
2003 https://energ2.com/ 3000 SW Calapooia St
Albany OR
1 EVDrive
2011 https://evdrive.com/ 2123 NE Aloclek Dr
Hillsboro OR
1 Hydro Extrusion
331318 Other Aluminum Rolling, Drawing, and Extruding
1905 https://www.hydro.co
m/en-us 2929 W 2nd St
Dallas OR
1 Hydro Extrusion
166 331318 Other Aluminum Rolling, Drawing, and Extruding
$96,853,663.00 1905 https://www.hydro.com/en-us
7933 NE 21st Ave
Portland OR
1 Hydro Extrusion
331318 Other Aluminum Rolling, Drawing, and Extruding
1905 https://www.hydro.com/en-us
2001 Kotobuki Way
Vancouver WA
1 Hyster/Nuvera
1929 https://www.hyster.com/north-america/
400 NE Blue Lake Rd
Fairview OR
1 Intel
334413 Semiconductor and Related Device Manufacturing
1968 https://www.intel.com 2501 NE
Century Blvd Hillsboro OR
1 KersTech
2008 http://kerstech.com/ P.O. 1895 Beaverton OR
1 Metric Mind Corporation
1999 http://www.metricmind.com/
10117 SE Sunnyside Rd
Clackamas OR
1 RYNO Motors
http://rynomotors.com
Beaverton OR
1 ShiftEV
2009 https://shiftev.com/ 127 SE 2nd Ave
Albany OR
1 Tinitron Inc
1997 http://www.tinitron.com/index.html
6501 NW Croeni Rd
Hillsboro OR
2 Delta Products Corporation Beaverton Oregon
1 334419 Other Electronic Component Manufacturing
$217,311.00 1993 www.delta-americas.com
15125 SW Koll Parkway
Beaverton OR
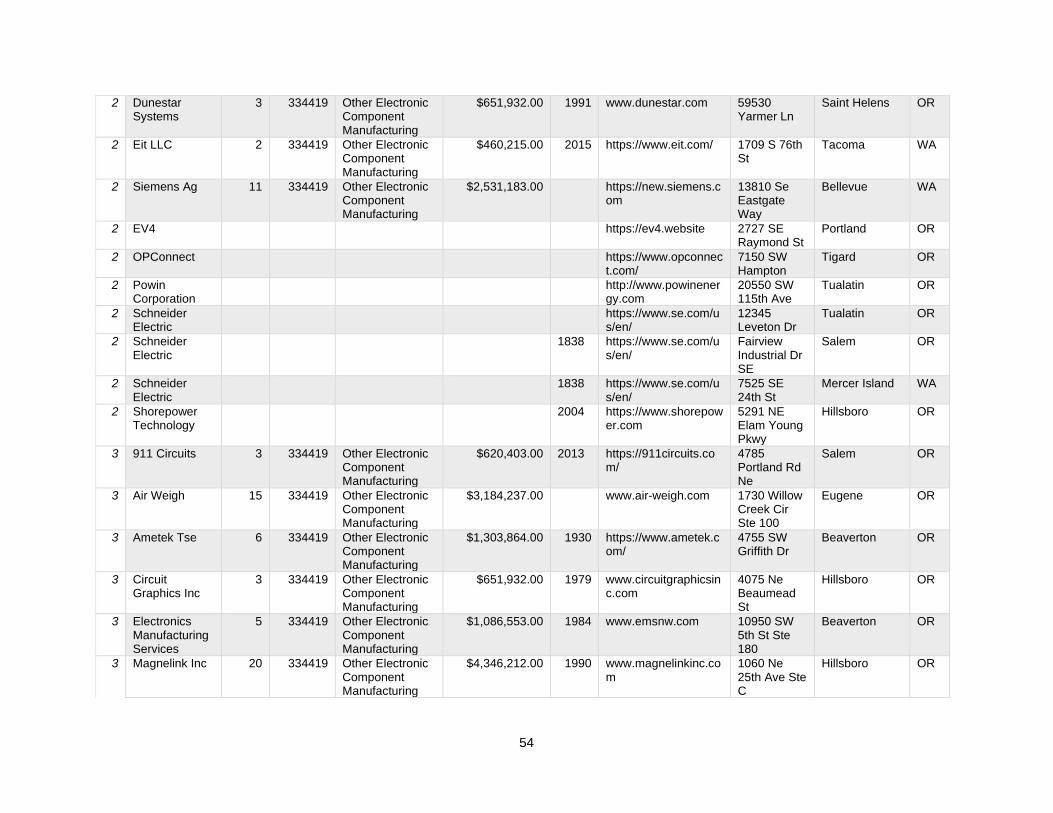
54
2 Dunestar Systems
3 334419 Other Electronic Component Manufacturing
$651,932.00 1991 www.dunestar.com 59530 Yarmer Ln
Saint Helens OR
2 Eit LLC 2 334419 Other Electronic Component Manufacturing
$460,215.00 2015 https://www.eit.com/ 1709 S 76th St
Tacoma WA
2 Siemens Ag 11 334419 Other Electronic Component Manufacturing
$2,531,183.00
https://new.siemens.com
13810 Se Eastgate Way
Bellevue WA
2 EV4
https://ev4.website 2727 SE Raymond St
Portland OR
2 OPConnect
https://www.opconnect.com/
7150 SW Hampton
Tigard OR
2 Powin Corporation
http://www.powinenergy.com
20550 SW 115th Ave
Tualatin OR
2 Schneider Electric
https://www.se.com/us/en/
12345 Leveton Dr
Tualatin OR
2 Schneider Electric
1838 https://www.se.com/us/en/
Fairview Industrial Dr SE
Salem OR
2 Schneider Electric
1838 https://www.se.com/us/en/
7525 SE 24th St
Mercer Island WA
2 Shorepower Technology
2004 https://www.shorepower.com
5291 NE Elam Young Pkwy
Hillsboro OR
3 911 Circuits 3 334419 Other Electronic Component Manufacturing
$620,403.00 2013 https://911circuits.com/
4785 Portland Rd Ne
Salem OR
3 Air Weigh 15 334419 Other Electronic Component Manufacturing
$3,184,237.00
www.air-weigh.com 1730 Willow Creek Cir Ste 100
Eugene OR
3 Ametek Tse 6 334419 Other Electronic Component Manufacturing
$1,303,864.00 1930 https://www.ametek.com/
4755 SW Griffith Dr
Beaverton OR
3 Circuit Graphics Inc
3 334419 Other Electronic Component Manufacturing
$651,932.00 1979 www.circuitgraphicsinc.com
4075 Ne Beaumead St
Hillsboro OR
3 Electronics Manufacturing Services
5 334419 Other Electronic Component Manufacturing
$1,086,553.00 1984 www.emsnw.com 10950 SW 5th St Ste 180
Beaverton OR
3 Magnelink Inc 20 334419 Other Electronic Component Manufacturing
$4,346,212.00 1990 www.magnelinkinc.com
1060 Ne 25th Ave Ste C
Hillsboro OR

55
3 Northwest Regulator Supply Inc
50 334419 Other Electronic Component Manufacturing
$10,865,530.00 1963 www.amforelectronics.com
5061 N Lagoon Ave
Portland OR
3 Action Controls Inc
11 334419 Other Electronic Component Manufacturing
$2,531,183.00 1991
8320 S 259th St
Kent WA
3 Creative Microsystems Inc
19 334419 Other Electronic Component Manufacturing
$4,372,043.00 1987 www.loadman.com 15224 Se Renton Issaquah Rd
Renton WA
3 Custom Interface Inc
99 334419 Other Electronic Component Manufacturing
$20,449,812.00 1997 www.custominterface.net
410 S Larch St
Bingen WA
3 Electronetics LLC
20 334419 Other Electronic Component Manufacturing
$4,602,151.00 1983 www.electronetics.us 1320 75th St SW
Everett WA
3 Fox Link International Inc
2 334419 Other Electronic Component Manufacturing
$460,215.00
www.foxlink.com 2840 Northup Way Ste 108
Bellevue WA
3 Instrument Sales & Services Inc
11 334419 Other Electronic Component Manufacturing
$2,531,183.00 2011 www.instrumentsales.com
7051 S 234th St
Kent WA
3 Stress-tek Inc 35 334419 Other Electronic Component Manufacturing
$8,053,764.00 1978 www.stress-tek.com 5920 S 194th St
Kent WA
3 Tri Coastal Industries
10 334419 Other Electronic Component Manufacturing
$2,301,075.00 1998 www.tciscales.com 17611 Ok Mill Rd
Snohomish WA
3 Advanced Truck Equipment Inc
28 336111 Automobile Manufacturing
$45,152,223.00 2002 www.advancedtruck.com
4825 Table Rock Rd
Central Point OR
3 Rogue Truck Body
8 336111 Automobile Manufacturing
$12,261,964.00 2013 www.roguetruckbody.com
30400 Redwood Hwy
Cave Junction OR
3 Smith Equipment & Welding
18 336111 Automobile Manufacturing
$27,149,759.00 1985 www.watertrucks-tanks.com
13800 Ne Allen Creek Rd
Prineville OR
3 Star Manufacturing Co
22 336111 Automobile Manufacturing
$34,326,286.00 2001 www.startlrs.com 230 Highway 241
Sunnyside WA
3 Trivan Truck Body LLC
110 336111 Automobile Manufacturing
$179,782,031.00 2002 www.trivan.net 1385 W Smith Rd
Ferndale WA
3 Cozy Cruiser Manufacturing Inc
3 336212 Truck Trailer Manufacturing
$784,107.00 1996 www.cozycruiser.com 790 30th St Springfield OR

56
3 Eagle Trailer Manufacturing
11 336212 Truck Trailer Manufacturing
$2,943,159.00 2017 https://trailerworldoforegon.com
6500 Se Johnson Creek Blvd
Portland OR
3 Eagle Trailer Manufacturing
0 336212 Truck Trailer Manufacturing
$0.00
https://trailerworldoforegon.com
7766 Se 82nd Ave
Portland OR
3 St Johns Corporation
20 336212 Truck Trailer Manufacturing
$5,351,198.00 2013
8801 N Vancouver Ave
Portland OR
3 Nor E First Response Inc
13 336212 Truck Trailer Manufacturing
$3,443,738.00 1997 www.nor-e.com 1975 Midway Ln Ste J
Bellingham WA
3 Tri Van 3 336212 Truck Trailer Manufacturing
$849,948.00 2009 www.trivan.com 13985 Interurban Ave S Ste 200
Seattle WA
3 Battery Charger Sales & Service
3 336320 Motor Vehicle Electrical and Electronic Equipment Manufacturing
$1,176,075.00 1924 www.philbingroup.com
28 N Russell St
Portland OR
3 Benz Spring Co
139 336390 Other Motor Vehicle Parts Manufacturing
$56,704,815.00
www.benzspring.com 4897 Indian School Rd Ne Ste 150
Salem OR
3 Griffith Rubber Mills
35 336390 Other Motor Vehicle Parts Manufacturing
$51,012,908.00 1911 www.griffithrubber.com
2625 NW Industrial St
Portland OR
3 Hurd's Hardware & Custom
12 336390 Other Motor Vehicle Parts Manufacturing
$4,753,366.00
www.hurdsinc.com 204 Moore St
Harrisburg OR
3 Piaa 12 336390 Other Motor Vehicle Parts Manufacturing
$5,144,159.00 1963 www.piaa.com 3004 Ne 181st Ave
Portland OR
3 Truck Rack Custom Fabrication LLC
139 336390 Other Motor Vehicle Parts Manufacturing
$59,586,506.00
www.truckrackinc.com
5819 Se Johnson Creek Blvd
Portland OR
3 Tk Innovation 7 331318 Other Aluminum Rolling, Drawing, and Extruding
$3,989,690.00 1996 https://www.tkinnovationllc.com/services
90433 Prairie Rd
Eugene OR
3 Kaiser Alutek Inc
75 331318 Other Aluminum Rolling, Drawing, and Extruding
$41,503,871.00 2010 www.kaiseraluminum.com
3401 N Tschirley Rd
Spokane WA

57
3 Pro-tech Industries
88 331318 Other Aluminum Rolling, Drawing, and Extruding
$51,344,110.00 1979 www.protech.net 14113 Ne 3rd Ct
Vancouver WA
3 Solatens 55 331318 Other Aluminum Rolling, Drawing, and Extruding
$30,436,172.00
16004 E Euclid Ave
Spokane WA
3 AIMCO
33399 All Other General Purpose Machinery Manufacturing
http://www.aimco-global.com/
10000 SE Pine Street
Portland OR
3 Anixter
1957 https://www.anixter.com/en_us.html
7661 SW Cirrus Dr
Beaverton OR
3 IRC Aluminum and Stainless
1981 http://www.ircalum.com/
9038 N Sever Ct
Portland OR
3 Professional Plastics
1984 https://www.professionalplastics.com/
19801 SW 95th Ave
Tualatin OR
3 Warn Industries
https://www.warn.com 12900 SE Capps Rd
Clackamas OR
4 Advanced Flight Systems Inc
10 334419 Other Electronic Component Manufacturing
$2,173,106.00 1995 www.advanced-flight-systems.com
320 S Redwood St
Canby OR
4 Agri Tronics 40 334419 Other Electronic Component Manufacturing
$7,942,303.00 1995 www.agritronics.com 57701 Ione Gooseberry Rd
Ione OR
4 Ascentron Inc 110 334419 Other Electronic Component Manufacturing
$23,351,071.00 2002 www.ascentron.com 994 Antelope Rd
White City OR
4 Assembly Line Inc
5 334419 Other Electronic Component Manufacturing
$992,788.00 1988 www.assembly-line.com
231 Wharf St
Brookings OR
4 Axiom Electronics Inc
90 334419 Other Electronic Component Manufacturing
$19,557,954.00 1990 www.axiomsmt.com 19545 NW Von Neumann Dr
Beaverton OR
4 Epic Technical Sales
4 334419 Other Electronic Component Manufacturing
$869,242.00 2017 https://www.epicnw.com
1049 SW Baseline St
Hillsboro OR
4 Future Technology Devices International
10 334419 Other Electronic Component Manufacturing
$0.00 2013 www.ftdichip.com 7130 SW Fir Loop
Portland OR
4 Jocko Inc 7 334419 Other Electronic Component Manufacturing
$1,452,593.00 1999 www.jodeco.com 217 SW Pumice Ave Ste G
Redmond OR

58
4 Macsema 25 334419 Other Electronic Component Manufacturing
$5,187,832.00 1989 www.macsema.com 1080 Se Centennial St Ste 1
Bend OR
4 Siemens Mobility Rail Automation
0 334419 Other Electronic Component Manufacturing
$0.00
www.siemens.com 20393 SW Avery Ct
Tualatin OR
4 South Valley Design
8 334419 Other Electronic Component Manufacturing
$1,738,485.00 1983 https://www.southvalleydesign.com
31841 Se Compton Rd
Boring OR
4 Bic Inc 20 334419 Other Electronic Component Manufacturing
$4,602,151.00 1962 www.bicharn.com 10401 Mountain Loop Hwy
Granite Falls WA
4 Blue Sea Systems
75 334419 Other Electronic Component Manufacturing
$16,136,445.00 1993 www.bluesea.com 425 Sequoia Dr Ste 101
Bellingham WA
4 Kemcor Inc 15 334419 Other Electronic Component Manufacturing
$3,451,613.00 2001 www.kemcor.com 15925 Woodinville Redmond Rd Ne
Woodinville WA
4 Lyn-tron Inc 78 334419 Other Electronic Component Manufacturing
$16,076,625.00 1957 www.lyntron.com 6001 S Thomas Mallen Rd
Spokane WA
4 M-tronic Inc 7 334419 Other Electronic Component Manufacturing
$1,442,774.00 2001 http://mtronic.net/ 1620 E Houston Ave Ste 700
Spokane WA
4 Pacific Aerospace & Electronics Inc
164 334419 Other Electronic Component Manufacturing
$33,915,387.00
www.pacaero.com 430 Olds Station Rd
Wenatchee WA
4 Pei Genesis 4 334419 Other Electronic Component Manufacturing
$920,430.00 2015 https://www.peigenesis.com/
Kirkland WA
4 Qualitel Everett
11 334419 Other Electronic Component Manufacturing
$2,531,183.00
https://qualitel.com/ 11831 Beverly Park Rd Bldg A
Everett WA
4 Schippers & Crew Inc
65 334419 Other Electronic Component Manufacturing
$14,956,990.00 1990 www.schippers.com 5309 Shilshole Ave NW Ste 100
Seattle WA
4 Tasc 20 334419 Other Electronic Component Manufacturing
$4,602,151.00 1991 www.tasc-wa.com 2222 N Pacific St
Seattle WA
4 Electrochem Solutions
250 335911 Storage Battery Manufacturing
$105,281,850.00 1985 www.greatbatch.com 9305 Sw Nimbus Ave
Beaverton OR

59
4 Western Star 770 336111 Automobile Manufacturing
$1,271,096,827.00
1969 www.westernstartrucks.com
6936 N Fathom St
Portland OR
4 Pioneer Truckweld
42 336390 Other Motor Vehicle Parts Manufacturing
$17,133,829.00 1972 www.pioneertruckweld.com
4355 Turner Rd Se
Salem OR
4 Superior Torque Converters
139 336390 Other Motor Vehicle Parts Manufacturing
$59,586,506.00
https://www.superiortorqueconverter.com
3711 Se Caruthers St
Portland OR
4 Pacbrake Company
4 336390 Other Motor Vehicle Parts Manufacturing
$1,697,692.00 1961 www.pacbrake.com 1670 Grant Ave
Blaine WA
4 Red Start Racing
139 336390 Other Motor Vehicle Parts Manufacturing
$61,722,626.00
www.redstartracing.com
2633 Willamette Dr Ne
Olympia WA
4 JAE Oregon Inc
https://jaeoregon.com/
11555 SW Leveton Dr
Tualatin OR
4 Lektro
https://www.lektro.com
1190 SE Flightline Dr
Warrenton OR
5 Volta Volare
http://www.voltavolare.com
4040 Cirrus Ave
McMinnville OR
5 Crescent Heart Software
10 334419 Other Electronic Component Manufacturing
$2,173,106.00 1981 www.c-h-s.com 2143 Se 55th Ave
Portland OR
5 Matheson 24 334419 Other Electronic Component Manufacturing
$5,215,454.00 1956 www.mathesongas.com
3030 NW 29th Ave
Portland OR
5 Microridge Systems Inc
5 334419 Other Electronic Component Manufacturing
$1,037,566.00 1983 www.microridge.com 56888 Enterprise Dr
Bend OR
5 Mixsignal Design LLC
2 334419 Other Electronic Component Manufacturing
$434,621.00 2002 www.mixsignaldesign.com
3255 Ne Henderson Rd
Corbett OR
5 Msr 15 334419 Other Electronic Component Manufacturing
$3,259,659.00 2009
8255 Ne Jacobson St Ste 100
Hillsboro OR
5 Multi-tek 0 334419 Other Electronic Component Manufacturing
$0.00 1994 www.multi-tek.com 3122 Ne 181st Ave
Portland OR
5 Northwest Rail Electric
20 334419 Other Electronic Component Manufacturing
$4,346,212.00 1983 www.nwrail.com 2630 Se Steele St
Portland OR
5 Sartron Inc 12 334419 Other Electronic Component Manufacturing
$2,607,727.00 1957 www.sartron.com 114 N Main St
Newberg OR

60
5 Spark Electronics
9 334419 Other Electronic Component Manufacturing
$1,910,542.00 2002 https://www.sparkfun.com/
35470 Ross Ln
Cottage Grove OR
5 Squires Electronics Inc
44 334419 Other Electronic Component Manufacturing
$9,561,666.00 1976 https://supplyfx.com/ 503 N 13th Ave
Cornelius OR
5 Stilwell Baker 4 334419 Other Electronic Component Manufacturing
$869,242.00
www.stillwellbaker.com
6077 Lakeview Blvd. Ste B
Lake Oswego OR
5 Swift Bridge Technologies Inc
0 334419 Other Electronic Component Manufacturing
$0.00
www.swiftbridgetechnologies.com
6975 Sw Sandburg St Ste 200
Portland OR
5 Creative Motion Control
46 334419 Other Electronic Component Manufacturing
$10,584,947.00 2010 www.creativemotioncontrol.com
15520 Woodinville Redmond Rd Ne Ste D100
Woodinville WA
5 Delta Computer Systems
29 334419 Other Electronic Component Manufacturing
$6,302,007.00 1982 www.deltamotion.com 1818 Se 17th St
Battle Ground WA
5 Electronic Systems Technology Inc
11 334419 Other Electronic Component Manufacturing
$2,322,763.00 1982 www.esteem.com 415 N Quay St Ste B1
Kennewick WA
5 Exxelia Deyoung Inc
50 334419 Other Electronic Component Manufacturing
$11,505,377.00 1971 www.exxelia.com 12920 Ne 125th Way
Kirkland WA
5 Front Panel Express LLC
18 334419 Other Electronic Component Manufacturing
$4,141,936.00 2002 www.frontpanelexpress.com
5959 Corson Ave S Ste I
Seattle WA
5 Goodwinds Kites Inc
5 334419 Other Electronic Component Manufacturing
$1,059,254.00 2008 www.goodwinds.com 1829 Railroad Ave
Mount Vernon WA
5 Hamilton Sunstrand Corporation
130 334419 Other Electronic Component Manufacturing
$29,913,980.00
www.utcaerospacesystems.com
4020 Lake Washington Blvd Ne Ste 312
Kirkland WA
5 Jrw Components
3 334419 Other Electronic Component Manufacturing
$690,323.00 2010
31810 Ne 115th Pl
Carnation WA
5 La Components LLC
2 334419 Other Electronic Component Manufacturing
$460,215.00
24314 Se 2nd Ct
Sammamish WA

61
5 Larkin Power Components
3 334419 Other Electronic Component Manufacturing
$618,332.00 1994 www.larkinpower.com 1725 N Park Rd
Spokane WA
5 Leidos 4 334419 Other Electronic Component Manufacturing
$901,958.00 2014 www.leidos.com 26279 12 Trees Ln NW Ste A
Poulsbo WA
5 Luma Technologies LLC
42 334419 Other Electronic Component Manufacturing
$9,664,517.00 2006 www.lumatech.com 13226 Se 30th St
Bellevue WA
5 Microtemp Electronics
2 334419 Other Electronic Component Manufacturing
$434,621.00 1997
2716 Ne 168th Ave
Vancouver WA
5 Microvision Inc 85 334419 Other Electronic Component Manufacturing
$10,891,000.00 1993 www.microvision.com 6244 185th Ave Ne
Redmond WA
5 Netig LLC 80 334419 Other Electronic Component Manufacturing
$18,408,603.00 1975 www.net-ig.com 21229 72nd Ave S
Kent WA
5 Omnisistem 15 334419 Other Electronic Component Manufacturing
$3,451,613.00 1986 www.omnisistem.com 6403 S 2082th St
Kent WA
5 Panasonic Avionics
50 334419 Other Electronic Component Manufacturing
$11,505,377.00 1990 www.panasonic.aero 22333 29th Dr Se
Bothell WA
5 Prologic Engineering Inc
10 334419 Other Electronic Component Manufacturing
$2,151,526.00 1993 www.prologic-eng.com
3979 Hammer Dr Ste B
Bellingham WA
5 Rockwell Collins Inc
11 334419 Other Electronic Component Manufacturing
$2,531,183.00 2013 www.rockwellcollins.com
2377 S 200th St
Seattle WA
5 Rugid Computer
21 334419 Other Electronic Component Manufacturing
$4,727,121.00 1986 www.rugidcomputer.com
Olympia WA
5 Sensors In Motion Inc
0 334419 Other Electronic Component Manufacturing
$0.00 2006 https://www.unmannedsystemstechnology.
com/
727 Harvard Ave E
Seattle WA
5 Shipboard Electrical Systems
1 334419 Other Electronic Component Manufacturing
$230,108.00 1973
15300 Se 344th St
Auburn WA
5 Silicon Forest Electronics
110 334419 Other Electronic Component Manufacturing
$23,904,166.00 1998 www.siliconforestelectronics.com
6204 E 18th St
Vancouver WA

62
5 Souriau Pa&e 200 334419 Other Electronic Component Manufacturing
$41,360,228.00 1976 www.pacaero.com 434 Olds Station Rd
Wenatchee WA
5 Spectralux Avionics
70 334419 Other Electronic Component Manufacturing
$16,107,528.00 1973 www.spectralux.com 12335 134th Ct Ne
Redmond WA
5 Spindle Dynamics LLC
5 334419 Other Electronic Component Manufacturing
$1,150,538.00 2005 www.spindledynamics.com
7006 27th St W Ste D
Tacoma WA
5 System To Asic Inc
11 334419 Other Electronic Component Manufacturing
$2,531,183.00 2012 www.system-to-asic.com
12100 Ne 195th St Ste 180
Bothell WA
5 Ultrasonics International Inc
6 334419 Other Electronic Component Manufacturing
$1,290,916.00 1992 www.sonicpro.com 7044 Portal Way
Ferndale WA
5 Wegners Wires
3 334419 Other Electronic Component Manufacturing
$690,323.00 1999
7308 139th Street Ct E
Puyallup WA
5 Kaman Industrial Tech
9 335312 Motor and Generator Manufacturing
$3,314,339.00 1948 www.kamandirect.com
1703 Ne Argyle St
Portland OR
5 Dykman Electrical Inc
7 335312 Motor and Generator Manufacturing
$2,577,819.00 2005 www.dykman.com 3004 Ne 112th Ave Ste E
Vancouver WA
5 Jims Electric Trolling
2 335312 Motor and Generator Manufacturing
$698,560.00 1991
4214 S Sunderland Dr
Spokane WA
5 Mer Marine Engines & Repair
18 335312 Motor and Generator Manufacturing
$7,019,026.00 1964 www.merequipment.com
2400 W Commodore Way
Seattle WA
5 Johnson Controls
7 335912 Primary Battery Manufacturing
$2,947,892.00 2018 https://www.johnsoncontrols.com/
800 NW 3rd Ave
Canby OR
5 American Grounding Systems Inc
7 335999 All Other Miscellaneous Electrical Equipment and Component Manufacturing
$2,491,263.00 1996 www.ags.bz 385 NW 1st St
Toledo OR
5 Black Hawk Tech
43 335999 All Other Miscellaneous Electrical Equipment and Component Manufacturing
$15,938,829.00
https://blackhawktech.com/contact/
220 S 8th St Aumsville OR

63
5 Electro Scientific Industries Inc
300 335999 All Other Miscellaneous Electrical Equipment and Component Manufacturing
$367,884,000.00 1944 www.esi.com 13900 Nw Science Park Dr
Portland OR
5 Laservia Corp 43 335999 All Other Miscellaneous Electrical Equipment and Component Manufacturing
$16,748,827.00 2001 www.laservia.com Corbett OR
5 Optimal Control Systems Inc
10 335999 All Other Miscellaneous Electrical Equipment and Component Manufacturing
$3,599,174.00 1984 www.optimalcontrol.net
2324 Three Lakes Rd Se
Albany OR
5 Ditco Inc 12 335999 All Other Miscellaneous Electrical Equipment and Component Manufacturing
$4,949,338.00 1980 www.ditco.net 106 E Titus St
Kent WA
5 Farwest Aircraft Inc
30 335999 All Other Miscellaneous Electrical Equipment and Component Manufacturing
$12,373,345.00 1967 www.farwestair.com 1415 Meridian Ave E
Puyallup WA
5 Motors & Controls Corporation
9 335999 All Other Miscellaneous Electrical Equipment and Component Manufacturing
$8,021,022.00
www.motors-controls.com
430 Carpenter Rd Se
Lacey WA
5 R P M Rod Pool Motorsports Inc
3 336111 Automobile Manufacturing
$4,812,165.00 1984
428 S Highland Dr
Kennewick WA
5 Forest River Rv
1 336213 Motor Home Manufacturing
$254,620.00 2016 https://forestriverinc.com/rvs/
Dallas OR
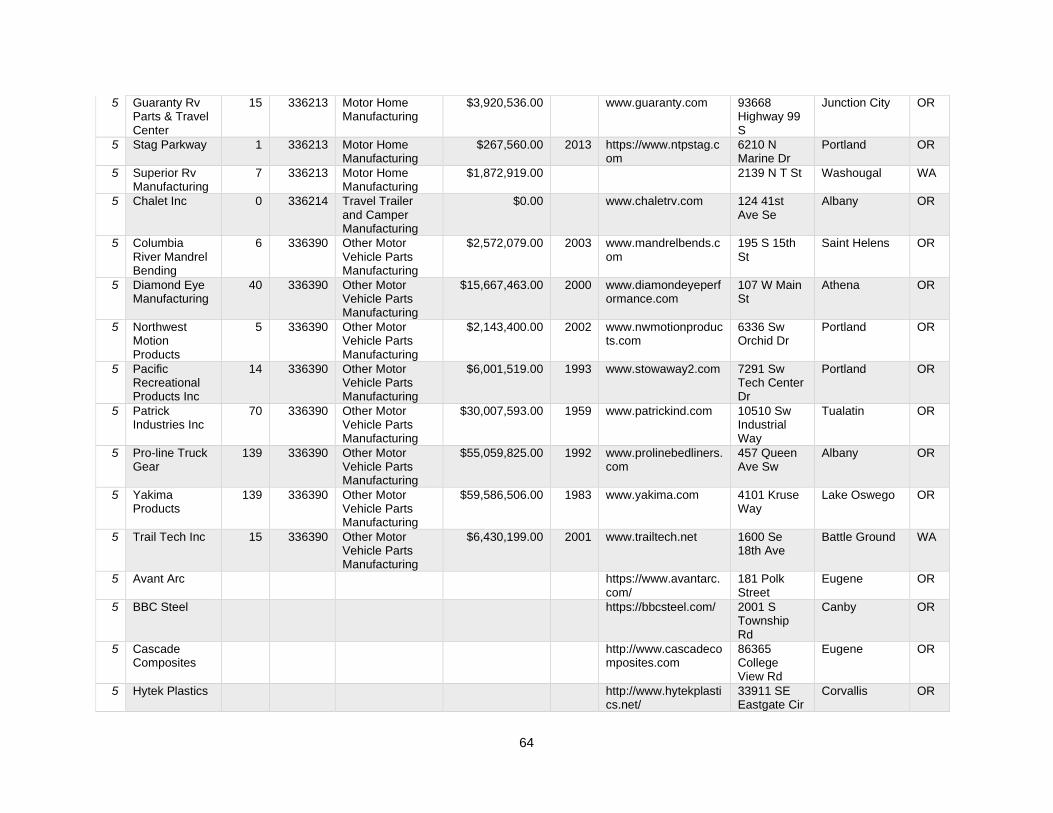
64
5 Guaranty Rv Parts & Travel Center
15 336213 Motor Home Manufacturing
$3,920,536.00
www.guaranty.com 93668 Highway 99 S
Junction City OR
5 Stag Parkway 1 336213 Motor Home Manufacturing
$267,560.00 2013 https://www.ntpstag.com
6210 N Marine Dr
Portland OR
5 Superior Rv Manufacturing
7 336213 Motor Home Manufacturing
$1,872,919.00
2139 N T St Washougal WA
5 Chalet Inc 0 336214 Travel Trailer and Camper Manufacturing
$0.00
www.chaletrv.com 124 41st Ave Se
Albany OR
5 Columbia River Mandrel Bending
6 336390 Other Motor Vehicle Parts Manufacturing
$2,572,079.00 2003 www.mandrelbends.com
195 S 15th St
Saint Helens OR
5 Diamond Eye Manufacturing
40 336390 Other Motor Vehicle Parts Manufacturing
$15,667,463.00 2000 www.diamondeyeperformance.com
107 W Main St
Athena OR
5 Northwest Motion Products
5 336390 Other Motor Vehicle Parts Manufacturing
$2,143,400.00 2002 www.nwmotionproducts.com
6336 Sw Orchid Dr
Portland OR
5 Pacific Recreational Products Inc
14 336390 Other Motor Vehicle Parts Manufacturing
$6,001,519.00 1993 www.stowaway2.com 7291 Sw Tech Center Dr
Portland OR
5 Patrick Industries Inc
70 336390 Other Motor Vehicle Parts Manufacturing
$30,007,593.00 1959 www.patrickind.com 10510 Sw Industrial Way
Tualatin OR
5 Pro-line Truck Gear
139 336390 Other Motor Vehicle Parts Manufacturing
$55,059,825.00 1992 www.prolinebedliners.com
457 Queen Ave Sw
Albany OR
5 Yakima Products
139 336390 Other Motor Vehicle Parts Manufacturing
$59,586,506.00 1983 www.yakima.com 4101 Kruse Way
Lake Oswego OR
5 Trail Tech Inc 15 336390 Other Motor Vehicle Parts Manufacturing
$6,430,199.00 2001 www.trailtech.net 1600 Se 18th Ave
Battle Ground WA
5 Avant Arc
https://www.avantarc.com/
181 Polk Street
Eugene OR
5 BBC Steel
https://bbcsteel.com/ 2001 S Township Rd
Canby OR
5 Cascade Composites
http://www.cascadecomposites.com
86365 College View Rd
Eugene OR
5 Hytek Plastics
http://www.hytekplastics.net/
33911 SE Eastgate Cir
Corvallis OR

65
5 Machine Sciences
100
2001 https://www.machinesciences.com/contact-us
10165 SW Commerce Circle
Wilsonville OR
5 Madden Fabrication
1992 http://www.madfab.com/
2550 25th Place
Portland OR
5 Parks Metal
http://www.parksmetal.com/
19460 SW Shaw
Aloha OR
5 Summit Manufacturing
https://www.summitmfgusa.com/
3050 SE 61st Ct
Hillsboro OR
5 The Lynch Company
1919 https://www.thelynchco.com/
4706 SE 18th Ave
Portland OR
5555 N Channel Ave
Portland OR
5 Vigor
https://vigor.net 9700 SE Lawnfield Rd
Clackamas OR
5 Vigor
https://vigor.net 1801 16th Ave SW
Seattle WA
5 Vigor
https://vigor.net 3515 SE Columbia Way
Vancouver WA

66
Appendix C Regional Variation in Growth of EV-related Occupations, 2019 - 2025
Occupational Group 2019 - 2025 %
Change, OR
2019 - 2025 %
Change,
Portland-
Vancouver-
Hillsboro, OR
2019 - 2025 %
Change, WA
2019 - 2025 %
Change,
Seattle-
Tacoma-
Bellevue, WA
Architecture and
Engineering
Occupations
6.3 5.7 3.1 1.7
Computer and
Mathematical
Occupations
10.2 11.0 11.7 11.4
Construction and
Extraction Occupations
13.7 18.4 8.8 6.4
Installation,
Maintenance, and
Repair Occupations
3.0 3.0 2.0 0
Life, Physical, and
Social Science
Occupations
8.0 8.7 4.9 5.9
Management
Occupations
5.3 5.5 4.5 1.7
Production
Occupations
-0.9 -1.2 -2.4 -4.5
Source: Emsi
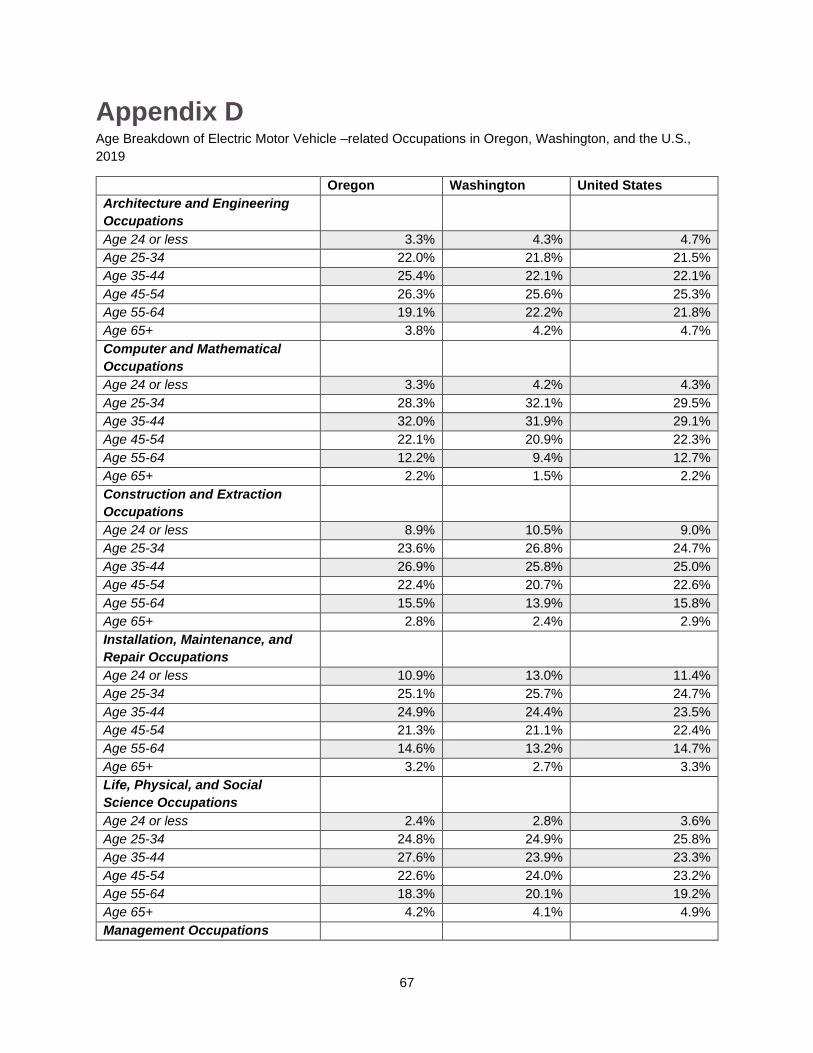
67
Appendix D Age Breakdown of Electric Motor Vehicle –related Occupations in Oregon, Washington, and the U.S.,
2019
Oregon Washington United States
Architecture and Engineering
Occupations
Age 24 or less 3.3% 4.3% 4.7%
Age 25-34 22.0% 21.8% 21.5%
Age 35-44 25.4% 22.1% 22.1%
Age 45-54 26.3% 25.6% 25.3%
Age 55-64 19.1% 22.2% 21.8%
Age 65+ 3.8% 4.2% 4.7%
Computer and Mathematical
Occupations
Age 24 or less 3.3% 4.2% 4.3%
Age 25-34 28.3% 32.1% 29.5%
Age 35-44 32.0% 31.9% 29.1%
Age 45-54 22.1% 20.9% 22.3%
Age 55-64 12.2% 9.4% 12.7%
Age 65+ 2.2% 1.5% 2.2%
Construction and Extraction
Occupations
Age 24 or less 8.9% 10.5% 9.0%
Age 25-34 23.6% 26.8% 24.7%
Age 35-44 26.9% 25.8% 25.0%
Age 45-54 22.4% 20.7% 22.6%
Age 55-64 15.5% 13.9% 15.8%
Age 65+ 2.8% 2.4% 2.9%
Installation, Maintenance, and
Repair Occupations
Age 24 or less 10.9% 13.0% 11.4%
Age 25-34 25.1% 25.7% 24.7%
Age 35-44 24.9% 24.4% 23.5%
Age 45-54 21.3% 21.1% 22.4%
Age 55-64 14.6% 13.2% 14.7%
Age 65+ 3.2% 2.7% 3.3%
Life, Physical, and Social
Science Occupations
Age 24 or less 2.4% 2.8% 3.6%
Age 25-34 24.8% 24.9% 25.8%
Age 35-44 27.6% 23.9% 23.3%
Age 45-54 22.6% 24.0% 23.2%
Age 55-64 18.3% 20.1% 19.2%
Age 65+ 4.2% 4.1% 4.9%
Management Occupations

68
Age 24 or less 0.9% 0.9% 1.1%
Age 25-34 13.4% 13.4% 12.6%
Age 35-44 25.4% 26.7% 25.0%
Age 45-54 31.8% 31.4% 32.4%
Age 55-64 24.7% 23.4% 25.0%
Age 65+ 3.6% 4.0% 3.9%
Production Occupations
Age 24 or less 8.8% 8.2% 9.4%
Age 25-34 21.7% 21.2% 21.1%
Age 35-44 23.0% 21.1% 21.1%
Age 45-54 23.7% 24.4% 24.2%
Age 55-64 18.7% 21.0% 20.1%
Age 65+ 4.2% 4.1% 4.2%
Source: Emsi

69
Appendix E Number of Completions in Programs that Prepare Students for Specific EV-related Occupations in Oregon and Washington, 2018
Institution State
Co
mp
leti
on
s in
All (
201
8)
Co
mp
leti
on
s i
n
Arc
hit
ec
ture
an
d
En
gin
ee
rin
g
Oc
cu
pa
tio
ns
Co
mp
leti
on
s i
n
Co
mp
ute
r a
nd
Ma
the
ma
tica
l
Oc
cu
pa
tio
ns
Co
mp
leti
on
s i
n
Co
ns
tru
cti
on
an
d
Ex
trac
tio
n
Oc
cu
pa
tio
ns
Co
mp
leti
on
s i
n
Ins
talla
tio
n,
Ma
inte
na
nce
, a
nd
Rep
air
Oc
cu
pa
tio
ns
Co
mp
leti
on
s i
n
Lif
e,
Ph
ys
ical,
an
d S
oc
ial
Sc
ien
ce
Oc
cu
pa
tio
ns
Co
mp
leti
on
s i
n
Ma
na
ge
men
t
Oc
cu
pa
tio
ns
Co
mp
leti
on
s i
n
Pro
du
cti
on
Oc
cu
pa
tio
ns
University of Washington-Seattle Campus WA 1,025 824 201
Oregon State University OR 840 748 92
Washington State University WA 697 590 34 73
Green River College WA 468 43 162 164 99
Portland State University OR 436 313 1 1 58 63
Spokane Community College WA 284 262 22
Big Bend Community College WA 266 3 5 96 162
Shoreline Community College WA 192 10 182
Perry Technical Institute WA 163 75 67 21
Oregon Institute of Technology OR 155 111 44
Eastern Washington University WA 152 122 30
Portland Community College OR 146 24 22 76 24
Renton Technical College WA 142 77 36 29
University of Portland OR 132 103 29
University of Washington-Bothell Campus WA 129 126 3
Lake Washington Institute of Technology WA 128 7 27 43 51
Clover Park Technical College WA 126 16 88 22
Bellingham Technical College WA 123 10 49 30 34
Everett Community College WA 118 36 30 52
University of Oregon OR 110 110
Gonzaga University WA 109 105 4

70
South Puget Sound Community College WA 107 9 16 82
Clark College WA 106 10 64 32
Central Oregon Community College OR 101 101
Bates Technical College WA 99 8 6 38 33 14
Edmonds Community College WA 95 23 72
Seattle University WA 91 72 14 5
Mt Hood Community College OR 89 7 22 1 59
Walla Walla Community College WA 83 2 61 20
Bellevue College WA 77 26 51
Peninsula College WA 71 10 59 2
Western Washington University WA 65 23 42
Cascadia College WA 60 3 57
South Seattle College WA 56 1 55
Lower Columbia College WA 53 7 7 24 15
Tacoma Community College WA 47 47
Linn-Benton Community College OR 46 6 1 39
Klamath Community College OR 45 31 14
Central Washington University WA 42 25 17
Chemeketa Community College OR 39 12 26 1
Rogue Community College OR 39 2 22 15
Saint Martin's University WA 39 32 1 6
Olympic College WA 39 31 8
Clackamas Community College OR 35 1 30 4
Lane Community College OR 35 11 1 23
Wenatchee Valley College WA 31 21 10
Pierce College-Puyallup WA 25 25
Grays Harbor College WA 24 22 2
Willamette University OR 23 23
Whatcom Community College WA 22 22
Seattle Pacific University WA 14 7 7

71
Centralia College WA 7 2 5
Highline College WA 20 20
North Seattle College WA 14 14
Seattle Central College WA 14 14
Pierce College-Fort Steilacoom WA 9 9
Yakima Valley College WA 21 8 1 7 5
Columbia Basin College WA 21 8 8 5
Skagit Valley College WA 19 1 17 1
DigiPen Institute of Technology WA 6 6
Umpqua Community College OR 8 8
Clatsop Community College OR 8 8
Reed College OR 12 12
Pacific Lutheran University WA 19 19
Southern Oregon University OR 16 16
Lewis & Clark College OR 17 17
Walla Walla University WA 8 5 3
Whitworth University WA 21 21
Pacific University OR 15 15
University of Washington-Tacoma Campus WA 9 9
Whitman College WA 9 9
Concordia University-Portland OR 2 2
George Fox University OR 3 3
Western Oregon University OR 6 6
Heritage University WA 2 2
Linfield College-McMinnville Campus OR 2 2
University of Puget Sound WA 10 10
Spokane Falls Community College WA 12 12
Source: Emsi

72
Appendix F Top 10 Institutions in the Region per Number of Completions in Different Types of Programs that Prepare Students for Specific EV-related
Occupations, 2018. Type of institution and number of enrolled students listed below
In t
op
10
fo
r
co
mp
leti
on
s in
foll
ow
ing
pro
gra
ms
:
Ins
titu
tio
n
Sta
te
All
Co
mp
leti
on
s
All
Cert
ific
ate
s
All
Deg
ree
s
Aw
ard
of
les
s
tha
n 1
ye
ar
Aw
ard
of
at
lea
st
1 b
ut
les
s
tha
n 2
ye
ars
Ass
oc
iate
's
Deg
ree
Aw
ard
of
at
lea
st
2 b
ut
les
s
tha
n 4
ye
ars
BA
Deg
ree
Po
stb
acc
ala
ure
ate
Cert
ific
ate
MA
Deg
ree
All programs, BAs, MAs University of Washington-Seattle Campus
WA 1,025
1,025
558
372
All programs, BAs, MAs Oregon State University OR 840
840
614
160
All programs, BAs, MAs Washington State University WA 697 40 657
495 40 108
All programs, Certificates, Awards less than 2 years, Associates
Green River College WA 468 360 108 359 1 73
35
All programs, BAs, MAs Portland State University OR 435 6 429
176 6 232
All programs, Certificates, Awards less than 2 years, Associates
Spokane Community College WA 285 234 51 220 14 51
All programs, Certificates, Awards less than 2 years
Big Bend Community College WA 266 247 19 227 20 19
All programs, Certificates, Awards less than 2 years
Shoreline Community College WA 192 166 26 140 26 26
All programs, Certificates Perry Technical Institute WA 163 163 0
58 0 105
All programs, BAs Oregon Institute of Technology OR 155
155
1
154
BAs Eastern Washington University WA 152 1 151
145 1 6
Associates Portland Community College OR 146 60 86
13 86 47
Certificates, Awards less than 2 yrs Renton Technical College WA 142 104 38 7 84 38 13
BAs University of Portland OR 132
132
132
0
BAs, MAs University of Washington-Bothell Campus
WA 129
129
115
14
Certificates, Awards less than 2 yrs, Associates
Lake Washington Institute of Technology
WA 128 80 48 45 35 48
Certificates, Awards less than 2 yrs Clover Park Technical College WA 126 88 38 64 12 38 12

73
Certificates, Awards less than 2 yrs, Associates
Bellingham Technical College WA 123 81 42 23 58 42
Awards less than 2 yrs, Associates Everett Community College WA 118 78 40 77 1 40
MAs University of Oregon OR 110
110
28
63
Bas Gonzaga University WA 109
109
103
6
Certificates, Awards less than 2 yrs Central Oregon Community College OR 101 99 2 99 0 2
Associates Bates Technical College WA 99 22 77 3 19 77
BAs, MAs Seattle University WA 91 5 86
77 5 9
Associates Mt Hood Community College OR 89 40 49 40 0 49
Associates Bellevue College WA 77 17 60 3 14 60
MAs Western Washington University WA 65
65
54
11
Associates Tacoma Community College WA 47
47
47
MAs Saint Martin's University WA 39
39
28
11
MAs University of Washington-Tacoma Campus
WA 9
9
0
9
Source: Emsi
Institution Type of institution, location, and number of enrolled students
University of Washington-Seattle Campus
Public university in Seattle, WA. Servers approx. 54,000 students annually
Oregon State University Public university in Corvallis, OR. 32,011 enrolled students in 2018
Washington State University Public university in Pullman, WA. 20,976 enrolled students
Green River College Public college in Auburn, WA. 19,113 enrolled students in 2015-16
Portland State University Public university in Portland, OR. 27,285 enrolled students in 2018-19
Spokane Community College Public community college in Spokane, WA. Students served in 2018-19: 17,837
Big Bend Community College Public community college in Mosel Lake, WA
Shoreline Community College Public community college in Shoreline, WA. Approx. 10,000 enrolled students per year
Perry Technical Institute Private technical institution in Yakima, WA. Over 750 enrolled students
Oregon Institute of Technology Public polytechnic university with main campus in Kalamath Falls, OR. Total enrollment in 2019: 5,319
Eastern Washington University Public university with main campus in Cheney, WA. 12,635 students enrolled in 2018
Portland Community College Public community college in Portland, OR. Serves approx. 73,000 students

74
Renton Technical College Public community college in Renton, WA. 9,651 enrolled students
University of Portland Private Catholic university in Portland, WA. Approx. 4,000 students
University of Washington-Bothell Campus
Public university in Bothell, WA, one of the three campuses of UW. Enrollment approx. 6,000
Lake Washington Institute of Technology
Public technical institute in Kirkland, WA. 6,571 enrolled students
Clover Park Technical College Public community college in Lakewood, WA. 6,523 enrolled students
Bellingham Technical College Public technical college in Bellingham, WA. Annual student headcount in 2017-18: 5,332
Everett Community College Public community college in Everett, WA. 19,079 enrolled students in 2018-19
University of Oregon Public university in Eugene, OR. 22,615 enrolled students
Gonzaga University Private Jesuit university in Spokane, WA. 7,566 enrolled students in 2018
Central Oregon Community College Public community college in Bend, OR. 15,701 enrolled students in 2017-18
Bates Technical College Public technical college in Tacoma, WA. Serves approx. 3,000 career training students and 10,000 more community members
Seattle University Private Jesuit university in Seattle, WA. 7,291 enrolled students in 2018
Mt Hood Community College Public community college in Gresham, OR. Serves approx. 33,000 students annually
Bellevue College Public college in Bellevue, WA, with more than 32,000 students served annually
Western Washington University Public university with main campus in Bellingham, WA. 16,142 enrolled students in 2019
Tacoma Community College Public community college with main campus in Tacoma, WA. 12,352 students served in 2017-2018 academic year
Saint Martin's University Private Benedictine university in Lacey, WA. Approx. 1750 enrolled students
University of Washington-Tacoma Campus
Public university in Tacoma, WA, one of the three campuses of UW. Total enrollment in 2019: 5,352
Source: Institutions’ websites