an analysis of competition in collection and disposal of · chapter page executive summary and...
TRANSCRIPT

MAINE ATTORNEY GENERAL
An Analysis of Competition in Collection and Disposal of
Solid Waste in Maine
Prepared by
Ralph E. Townsend Professor of Economics
University of Maine Orono, ME 04469
and
Francis Ackerman
Assistant Attorney General State of Maine
Augusta, ME 04330
December 31, 2002
1

Table of Contents
Chapter Page
Executive Summary and Policy Recommendations.....................................................1 1. Purpose and Background of Report............................................................................10 2. State and Federal Environmental Policy on Solid Waste ...........................................12 3. Competition in National Solid Waste Industry ..........................................................18 4. Maine’s Solid Waste Industry ....................................................................................49 5. Assessing Competition in Maine’s Waste Management Industry..............................91 6. Policy Recommendations .........................................................................................123 Acknowledgements ...............................................................................................................141 Cases Cited ............................................................................................................................144 References .............................................................................................................................147 Appendices ............................................................................................................................149
List of Tables 1. National MSW Disposal - 1990-2001 ...........................................................................20 2. Ten Largest US Waste Management Firms – 2000.......................................................21 3. Estimated Fixed Costs per Ton for North Dakota Landfill Construction - 1992...........23 4. Trends in Maine’s MSW and CDD Flows ....................................................................50 5. Disposal Shares for Maine’s Residential MSW - 2000 .................................................51 6. Disposal Shares for Maine’s Bulky Waste – 2000 ........................................................52 7. Maine’s Waste to Energy Facilities ...............................................................................53 8. Summary of Waste to Energy Plant Revenues - 1992-2001 .........................................58 9. Landfills for MSW and Ash Disposal in Maine ............................................................60 10. CDD Disposal Sites .......................................................................................................62
2

11. Population Weighted Shares of Municipal Curbside Collection Contracts – 2000.......65 12. RWS Hauler shares – FY 92/93 to FY 00/01 ................................................................68 13. Commercial Delivers to Tri-Community Landfill – 2000 (Partial Year) ......................69 14. New Entrants in Hauling and Collection - 1990-2001 ..................................................71 15. Casella Waste Hauling Acquisitions – 1996-Present ....................................................72 16. Regional Waste Systems Tipping Fees and Assessments – 1979-2002 ........................77 17. Crossroads Landfill (WMI) Gate Fees - 1990-2001 (Selected Years) ..........................78 18. Tri-Community Landfill Tipping Fees – 1995-2001.....................................................78 19. Bath Landfill Disposal Fees – 1992-2002 .....................................................................78 20. Hatch Hill Solid Waste Facility Tipping Fees - 1987-2002 ..........................................79 21. MMWAC Tipping Fees – 1995-2002............................................................................80 22. PERC Disposal Fees – 1992-2001.................................................................................80 23. Pine Tree Landfill Disposal Fees – 1992-2001 .............................................................81 24. Maine Energy Tipping Fees – 1995-2001 .....................................................................81 25. Municipal Waste management Costs – 1996 and 2001.................................................84 26. Chartwell Northeast Region Solid Waste Price Index – September 2001.....................86 27. Biocycle Disposal Fees – 1994 and 2000 ......................................................................87 28. New Hampshire Disposal Fees – 1990-1999.................................................................94
3

An Analysis of Competition in Collection and Disposal of
Solid Waste in Maine
Executive Summary and Policy Recommendations
The Attorney General’s Office, with assistance from the University of Maine
Margaret Chase Smith Center for Public Policy, prepared this report to assess the state of
competition in Maine’s solid waste management industry and to examine factors that will
affect competition in the future. The report identifies three policy steps to assure robust
competition in the industry.
Our key findings about the state of competition in Maine’s solid waste
management industry are:
• There has been significant consolidation in Maine, as in the rest of the U.S. Maine’s
solid waste management industry has changed dramatically in the past 15 years.
Environmental restrictions have closed the old municipal open dumps. To meet new
environmental requirements, disposal facilities are now much larger and commercial
disposal capacity has become a large part of total disposal capacity. There has been
substantial consolidation in the collection and hauling of solid waste, and most of this
consolidation has been by vertically integrated firms. The changes in Maine’s solid
waste industry mirror virtually identical national changes. This consolidation in the
solid waste industry has raised concerns in Maine, in other states and at the national
level that competition in various aspects of solid waste management may be
diminished.
• Maine’s ban on new commercial landfills reduces potential competition. In 1989,
Maine enacted a ban on new commercial solid waste landfills. This ban was enacted
1

because Maine did not want to become a “dumping ground” for waste from New
England and the northeastern U.S. While the ban may reduce out-of-state waste
disposal in Maine, the two existing commercial landfills are insulated from the threat
of competitive entry by the ban. With a protected position in disposal, commercial
landfills may be able to raise disposal fees or, through vertical integration, to reduce
competition in collection and hauling. Waste management policy in Maine has not
carefully considered the potential for the ban to reduce competition in the industry.
• Disposal fees have been stabilized by adequate national disposal capacity, but Maine
fees have increased in late 1990s. National waste disposal fees increased in the 1980s
and early 1990s as old, inexpensive open dumps were replaced with modern, more
environmentally engineered and expensive landfills. There was widespread concern
that a shortage in waste disposal capacity, caused by the inability to site new landfills,
would increase disposal fees dramatically. The problem was expected to be
especially severe in New England and the northeast. The siting of very large landfills
and the reduction in the rate of growth in the demand for waste disposal has meant
that the expected crisis has not occurred. National disposal fees have stabilized in the
late 1990s. New England and Maine fees remain well above national fees. Although
there are a number of limitations in the available data, the evidence indicates that
Maine and New Hampshire fees have increased in the late 1990s, in contrast with
national fees.
• Out-of-state competition is not an adequate restraint on Maine’s disposal prices. The
high cost of moving trash insulates in-state disposal sites from interstate competition
to a significant degree. The cost of moving solid waste is on the order of $.10 per ton
2

per mile. If the nearest competitive disposal facility is 200 to 300 miles away, the
local disposal site can raise fees $20.00 to $30.00 per ton above the distant
competitor.
There is reason to be concerned that out-of-state competition is weakening. Of
the nearest five disposal sites in New Hampshire, four are operated by the same two
firms that operate commercial disposal sites in Maine. Furthermore, New Hampshire
has recently convinced its largest landfill (Turnkey, operated by Waste Management)
to substantially reduce imports of out-of-state waste. New Hampshire disposal prices
increased 15% to 36% during 1997-99.
Competition from New Brunswick disposal is limited by provincial policy that
allows landfills to accept only waste from Washington County and some parts of
Aroostook County.
• Entry of new state or municipal landfill capacity is a key issue for competition.
Because distance insulates disposal sites from out-of-state competition, competition
within the state is very important. In-state competition for the two commercial
landfills is essentially competition from municipal facilities. The alternatives to
commercial landfills are: one waste-to-energy incinerator owned by one of the
commercial landfill owners; one independent commercial incinerator with close ties
to a municipal group; two municipal waste-to-energy plants; 7 municipal landfills for
municipal solid waste (MSW); and 24 municipal landfills for construction and
demolition debris (CDD). Because of the ban on new commercial facilities, new
competition will be state or municipal capacity.
3

The capacity for MSW and incinerator ash disposal in Maine is roughly in line
with current volumes generated, and this rough balance should continue for
approximately ten years. The current adequacy of disposal capacity does not mean
that Maine can ignore the difficult issue of siting new landfill capacity for the present.
There are several reasons to be concerned now. First, the stream of construction
debris and bulky goods is growing. These items cannot be incinerated, so they must
go to landfills. There is evidence of upward pressure on CDD disposal fees at least in
some parts of the state. Second, the options for disposal of incinerator ash and front-
end process residue (FEPR) are more limited. The two commercial landfills provide
a much larger share of disposal capacity for ash and FEPR than they do for MSW.
Third, it takes several years to site a new landfill. Making decisions in advance of a
crisis is likely to avoid costly mistakes. Fourth, the closure of even one major
disposal facility in Maine could put very significant pressure on prices.
The threat of opening a state owned landfill probably does not constrain
current market behavior by disposal sites. The proposed Carpenter Ridge site is
remote from population centers. Under the current statute, legislative action to open
that site will not be considered until only four years of capacity remain elsewhere in
the state.
New capacity will almost certainly be in the form of landfills. Additional
entry of waste-to-energy plants is very unlikely. Unless fees in competitive
wholesale electric markets rise substantially above current levels, waste-to-energy
plants will have great difficulty achieving disposal costs that are competitive with
new landfill capacity.
4

• There is no clear economic rationale for the substantial consolidation in collection
and hauling. The national waste management industry typically suggests that the
consolidation in collection and hauling is driven by economies of scale in collection.
There are some modest economies of scale in collection, but these modest economies
do not explain the emergence of large national and multi-state firms. Critics of the
industry, on the other hand, suggest that the consolidation is driven by the objective
of extending the market power of scarce landfill facilities into collection and hauling.
• Evergreen contracts restrict the ease of entry into collection. Collection and hauling
is a trucking business. Entry at an efficient scale might require something like seven
to eight trucks and several hundred containers (also known as ’dumpsters’). This
investment is not a serious barrier to entry. But the “evergreen contracts” used in the
industry do make it difficult for a new entrant to attain sufficient scale and density of
routes to compete efficiently. Evergreen contracts are self-renewing commercial
hauling contracts with onerous notice, termination and first refusal provisions.
Action to restrict evergreen contracts has been a key feature of federal and state
antitrust enforcement actions.
This assessment of competition in the waste management industry leads us to
make the following three policy recommendations. The first recommendation addresses
competition in collection markets; the last two address pricing in disposal markets.
Recommendation 1: That legislation be enacted to restrict small container
commercial contracts by:
(i) requiring contracts to be clearly identified as contracts and to be easily readable;
5

(ii) prohibiting so-called “first refusal” or “right-to-compete” clauses that require
that the incumbent hauler be provided notice of and/or an opportunity to match a
new entrant’s offer;
(iii) requiring that small container commercial contracts permit customers to
terminate such contracts on 30 days notice by mail, fax, or e-mail;
(iv) requiring such contracts to limit the financial charge for early termination of
the contract to the lesser of Seventy-Five Dollars ($75) or two times the current
monthly charge or two times the average monthly charge over the most recent six
month period;
(v) allowing collection companies to submit bids that would otherwise violate
requirements (iii) and (iv) where competitive bid specifications by the customer
request such terms, and then to enforce the resulting contract; and
(vii.) declaring inconsistent provisions in existing contracts unenforceable.
The best protection for competition in the collection sector of the waste industry
is the threat of new entry. The investment required to enter the collection industry is
modest, but restrictive evergreen contracts make it difficult for new entrants to achieve
the route density required to attain competitive costs. By removing this barrier to entry,
the state can rely on competition to protect consumers. The proposed restrictions are
those to which Casella is subject in Maine’s nine northern and easternmost counties
under the terms of a merger consent decree negotiated with the Maine Attorney General.
The last two recommendations are steps to incorporate pricing and competition
into state disposal capacity policy.
Recommendation 2: That the State Planning Office expand its current data
collection to gather more detailed disposal fee information. This recommendation
would require some changes in data collection by the State Planning Office. It
6

would also require legislative authority to collect revenue data from landfills, which
creates a requirement analogous to one now imposed on incinerators. Further, we
recommend that the five-year solid waste management plans and the biennial
disposal capacity reports by the State Planning Office include analyses of how
capacity changes are likely to impact prices. That analysis should assess whether
existing commercial disposal facilities are likely to earn windfall profits as disposal
capacity declines.
The State Planning Office currently collects some information on disposal costs
from municipalities and from incinerators, but the resultant information is not sufficient
for policy development on disposal pricing. For the municipal survey, we recommend
that specific per-ton disposal costs for MSW, CDD, bulky goods, and tires be collected.
We also recommend that the statute that requires submission of disposal tonnages and
revenues by incinerators be expanded to require analogous data from landfills. The
legislation should enable the State Planning Office to collect tonnage and revenues for six
categories of waste (MSW, CDD, bulky goods, FEPR, incinerator non-processibles, and
incinerator ash) for five major customer groups (incinerators, municipalities and other
government units, instate commercial accounts, spot market from instate sources, and
out-of-state sources).
With this price data information, the State Planning Office can use its analytical
capabilities, both in waste management and in economics, to inform the Legislature how
changes in available disposal capacity are likely to impact disposal prices.
Recommendation 3: That legislation be enacted to affirm that commercial disposal
sites should not receive windfall profits through higher disposal fees as disposal
7

capacity declines. When the State Planning Office determines that a decline in
disposal capacity has the potential to increase disposal fees, it should be required to
submit that finding and concurrently submit a proposal for corrective legislation to
the Legislature.
The language in this third recommendation parallels the current legislation on
opening Carpenter Ridge. Under the current statute, the State Planning Office must
estimate when remaining state disposal capacity falls below four years’ requirements and
ask the Legislature for permission to open Carpenter Ridge at that point. Under this
recommendation, when Maine’s landfill capacity reaches levels that may increase landfill
prices, the State Planning Office would be required to notify the Legislature and to
recommend a policy direction to avoid that outcome. Embedded in this recommendation
is the implicit assumption that the State Planning Office will need to initiate and
coordinate a broad policy discussion about how to respond to higher disposal prices well
before higher prices are realized. Draft Legislation incorporating these recommendations
is attached hereto as Appendix D.
The range of policy choices that the State Planning Office might consider in
policy development is broad. This study identifies at least four options; there are
probably more. First, the state could open Carpenter Ridge and perhaps additional state-
owned capacity on a schedule that maintains stable disposal prices. Second, legislation
could be enacted to increase municipal interest in siting new disposal sites. For example,
the state could substantially reduce the financial risk of attempting to site a new disposal
facility by assuming a large share of the cost of up-front, pre-construction investments,
whether or not the facility were opened. The state could also share some of the financial
8

risks associated with regulatory changes and with site closure. A third option would be to
allow at least one of the two existing commercial landfills to expand beyond the
limitations in the current legislation. If Maine is to rely heavily on a single commercial
landfill, it might consider some form of public utility regulation to prevent price
escalation. Fourth, Maine might consider a tax on landfill disposal to discourage
landfilling of waste in preference for waste reduction strategies and incineration.
Revenues from such a tax might be returned to municipalities on a per-capita basis to
partially offset higher fees and to finance other waste management costs. Under this
strategy, the state accepts (indeed, mandates) higher landfill costs, but diverts the
revenues from commercial landfills to government.
The report does not take a position on any of these choices. Pricing is but one
component of waste disposal policy, and other objectives must and will be considered.
But we emphasize that current policy has great potential to result in significantly higher
landfill disposal fees in the next ten to fifteen years. We doubt that the Legislature
intended to generate windfall profits for the existing commercial landfills, but policy
action is necessary to avoid that outcome. Because the policy choices in landfill siting
are inherently difficult, it is important to place the issues before the Legislature in a
coherent and timely way. The longer we delay addressing this difficult policy area, the
fewer the choices the state will have to reconcile competing policy objectives.
A number of parties have submitted comments on earlier drafts of this report and
may submit further comments on this final report. Copies of these comments are
obtainable by contacting Kathi Peters at the Office of the Attorney General.
9

An Analysis of Competition in Collection and Disposal of
Solid Waste in Maine
Chapter 1
Purpose and Background of Report
The Office of the Maine Attorney General prepared this report, with assistance
from the University of Maine Margaret Chase Smith Center for Public Policy. The
project is a direct outgrowth of a research effort started by the Maine Legislature. In
1999, the Maine Legislature authorized a task force to examine the question of
competition in the solid waste industry in Maine. The task force issued an interim report
(Maine Legislature, 2000), which included an outline for a full study of competition in
waste management. Funding to complete the second year of the study did not become
available. Because the Attorney General had been involved in questions about
competition in waste management through a series of antitrust enforcement actions, this
office decided to complete the study outlined by the task force report. The Attorney
General contracted with the Smith Center to provide assistance with economic analysis in
the report.
Work on the study began in fall 2001. A draft report was issued for comment on
March 5, 2002. Comments were received from both industry and government; a list of
those providing comments appears in the acknowledgements at the end of the report. A
presentation of the draft report was made to the Natural Resources Committee of the
Legislature on March 20, 2002. At the time of the presentation to the Natural Resources
Committee, the authors submitted a preliminary revision of the recommendations, which
10

reflected some of the comments received by that date. The final report is being issued in
December 2002.
This report is concerned with municipal solid waste (MSW) and associated waste
material flows. MSW includes non-hazardous waste generated by residential and
commercial sources. Closely associated with this flow are construction and demolition
debris (CDD), bulky goods and furniture, yard waste and wood, and tires. This flow
results in residue from incinerators, which includes ash, front end process residue
(FEPR), and large bulky non-processible items. Ash from incinerators (and also from
municipal burn piles) is the only type of special waste addressed by this report. This
report does not address other kinds of waste, such as sludges from mills and sewer
treatment plants, hazardous wastes, or medical wastes.
The report attempts to provide a broad background from which to understand
competition in Maine’s waste management industry. The solid waste industry has been
shaped by environmental policies to ensure safe solid waste disposal. At least partially as
a result of those environmental policies, the solid waste management industry has seen
very rapid consolidation, both nationally and in Maine, during the 1990s. The report
assembles information on Maine’s solid waste management industry and uses that
information to assess the state of competition in the industry. Finally, the report
examines possible policy responses and makes three specific recommendations for steps
to promote competition in both collection and disposal.
11

Chapter 2
State and Federal Environmental Policy on Solid Waste
Federal Policy
The Resource Recovery and Conservation Act of 1976 (RCRA) broadly
addressed waste disposal. The act made hazardous waste management an area of primary
federal responsibility, and established a policy objective of moving away from landfill
disposal of hazardous waste. Non-hazardous waste (which includes MSW) would be
primarily a state responsibility, and landfill disposal of non-hazardous waste would
continue to be authorized.
In 1984, the federal government enacted the Hazardous and Solid Waste
Amendments to RCRA. The Hazardous and Solid Waste Amendments (HSWA)
substantially increased the federal role in solid waste management. States were directed
to implement solid waste management strategies, and these plans are subject to EPA
approval. The HSWA added Subtitle D to the RCRA, which defined federal standards
for the design and operation of solid waste landfills. Modern landfills that meet these
federal criteria are often called “Subtitle D Landfills”.
In 1991, the Environmental Protection Agency issued new rules for solid waste
disposal facilities, to become effective in 1993. These rules tightened the standards for
construction, operation, and post-closure monitoring of landfills. The rules also created
mandatory combustion standards and air emissions standards for solid waste incinerators.
These rules replaced what had been only guidelines for state incinerator regulation.
The shared state-federal role for solid waste management is not unusual for U.S.
environmental policy. For both air and water pollution, federal legislation establishes a
12

shared responsibility. The general concept is that the federal government would establish
broad criteria, and states would implement those criteria for their specific circumstances.
In solid waste management, for example, state implementation could take into account
specific soil characteristics in the specification of detailed design criteria for landfills.
This shared responsibility for solid waste disposal policy creates two tensions
within federal policy. First, different states can choose to implement the policy in very
different ways. Some states may choose to exceed federal minimum standards; others
may barely reach those standards. These variations in regulatory approaches can imply
significantly different costs of compliance for municipalities and businesses in different
states. Second, the tiering of responsibilities makes states the intermediary between
federal standards and municipal implementation. The federal government directly
reviews only state plans. Those state plans in turn specify the standards that communities
must meet if they site and operate a disposal facility.
Maine Solid Waste Policy
The overall thrust of state policy can be summarized as having seven elements:
State environmental regulation of municipal and commercial disposal sites.
The Department of Environmental Protection has the authority and responsibility to
regulate all waste disposal facilities in Maine, which includes insuring compliance with
federal solid waste regulations. This regulatory authority is basically reactive in nature:
the DEP responds to proposals to license or re-license disposal sites and then enforces
license requirements. This regulatory authority does not include the authority or
responsibility for a state waste management plan. The state, through a series of bond
issues, has provided subsidies to towns to assist with closures of old landfills.
13

State promotion of a “hierarchy of waste management”. The planning
function for solid waste policy was initially vested in the Maine Waste Management
Agency (MWMA) and was moved to the State Planning Office in 1995, when MWMA
was closed.
Like many other states, Maine has formally adopted a policy of reducing the
volume of waste that requires disposal. Maine has endorsed the hierarchy of waste
options favoring first waste reduction, second reuse, third recycling, and fourth
composting. Waste disposal through incineration, or lastly through landfilling, are the
least favored options. Although recycling is the third option in this hierarchy, it has
received the most attention from state and local governments.
State historical preference for incineration at waste-to-energy plants. Maine
depends heavily upon incineration for its waste disposal, with roughly 65% of Maine’s
MSW going to four waste-to-energy plants. This differs substantially from the national
experience, where only 10% is incinerated, but is closer to the rate in other New England
states (Goldstein and Madtes, 2001).
Maine’s preference for incineration is consistent with the goal of reducing the
volume of waste. Incineration reduces both the weight and the volume of material that
must be landfilled. Weight is reduced by approximately 60 -75% and volume by
approximately 80-90%.
Through public utility policies that favored alternative energy sources, Maine
created strong economic incentives for waste-to-energy plants. The significant electric
rate impacts of Maine’s preferential treatment of alternative electric generation became
clear in the 1990s. Maine has since reduced the rates paid for new alternative energy
14

contracts and has also tried to restructure existing contracts to lower the rate impacts.
The electricity prices paid to existing waste-to-energy plants have been reduced
somewhat as a result of debt restructuring, but rates are still above what new plants would
receive in the current open market.
While Maine’s formal policy still prefers waste-to-energy plants over landfilling,
market conditions make new incinerators unlikely. Under current wholesale electric
rates, large landfills are likely to have significant cost advantages over new incinerators.
Ban on new commercial disposal restricts importation of trash. Maine
became very concerned that it would become the recipient of large volumes of waste
from the rest of New England, which has relatively limited waste disposal capacity.
Maine banned all new commercial disposal facilities in 1989 (38 M.R.S.A. § 1310-V; 38
M.R.S.A. § 1303-C [30]). The ban allowed existing disposal facilities to continue to
operate. The decision to ban new commercial facilities, rather than simply banning waste
imports, correctly anticipated later court limitations on how states could control waste
flow under the Commerce Clause of the federal Constitution. (See the discussion of flow
control in Chapter 3.)
Preference for interlocal municipal agreements over state responsibility in
siting. Prior to the state and federal initiatives to regulate local landfills, operation of
waste disposal sites was a local responsibility and was typically met by a small
municipally operated landfill. The stricter environmental standards resulted in much
larger waste disposal facilities, so solid waste from a number of municipalities usually
flows to a disposal site. Where commercial sites operate, municipalities can contract
individually with the operators. But Maine’s ban on new commercial disposal requires
15

that some government entity must operate new additions to capacity, so some form of
government unit larger than municipalities is usually required. The role of county
government in Maine is limited (except in law enforcement) and the state was not eager
to accept the responsibility to site new facilities or the financial risks associated with
operations. The remaining option was to create interlocal agreements or other kinds of
joint municipal actions, which occurred in Maine. The largest of these agreements is the
Municipal Review Committee (MRC) in central and eastern Maine, with 140 member
communities. The MRC was formed to negotiate and manage the municipal contracts
with the PERC incinerator.
Ambiguous policy on siting state-owned landfills. The state has taken initial
steps to site a state-owned landfill at Carpenter Ridge, near Lincoln. The site has been
identified and a permit for special waste disposal issued. The site is permitted for special
waste because it is envisioned primarily as a disposal site for incinerator ash, as opposed
to unprocessed MSW. No further action can be taken on the site until construction is
authorized by the Legislature. The State Planning Office is directed to inform the
Legislature when only four years of landfill capacity remains in the state, at which time
legislative consideration will begin. When two years for construction and some period
for legislative action are deducted, this four-year cushion is quite short. This schedule
would suggest some reluctance to open a state-owned landfill. The report of the most
recent state task force on solid waste policy (Maine State Planning Office, 1999) suggests
that the role of Carpenter Ridge in state disposal is subject to two different
interpretations. It could be the next (or one of the next) major additions to disposal
capacity. Or it could be a last resort or safety net, which the state in fact hopes never to
16

open. While a majority of the 1999 Task Force endorsed the first interpretation, the four-
year triggering mechanism seems more consistent with the second interpretation.
Focus on quantity of landfill space, rather than cost. Maine’s waste disposal
policy was developed as the closure of most municipal landfills generated concern that
Maine would run out of disposal capacity. Recycling and incineration were highly
desirable because they reduced the volume of waste to be landfilled and therefore
increased the life of remaining landfill capacity. State policy, as reflected in
requirements for a biennial disposal capacity report and the capacity trigger for Carpenter
Ridge, focuses narrowly on remaining disposal capacity. The connection between
disposal capacity and the price of disposal is, at most, a secondary consideration. The
cost of disposal to municipalities and businesses has been a minor issue for state policy.
Only recently has municipal pressure over increasing local costs become a state issue.
17

Chapter 3
Competition in National Solid Waste Industry
National disposal trends
Table 1 presents a summary of national trends in total MSW and disposal
methods for 1990-2001. Total MSW tonnage has grown at a rate of about 4% per year
over this period. The growth rate slowed in the mid-1990s, but was at 7% for 2000-2001.
The fraction being recycled increased steadily, from under 8% in 1990 to 30% in 1998.
The recycling rate has been roughly constant since 1998. The share being landfilled fell
dramatically, from 84% in 1990 to 63% in 1996. Again, landfill fees have stabilized in
the late 1990s. While the share of MSW being landfilled has fallen, the total tonnage
going to landfills has increased about 10% over the period, due to overall growth in
MSW. Incinerator share peaked at 11.5% in 1991 and has declined slowly since. Total
tonnage incinerated has declined slightly over the period.
Consolidation in the U.S. waste management industry
The U.S. waste management industry has seen great consolidation in the 1990s.
The scale of disposal facilities has increased significantly. The number of landfills has
fallen from about 7900 in 1989 to only 2142 in 2001 (Goldstein, 2000; Goldstein and
Madtes, 2001). Despite the decline in the number of facilities, there is no imminent
national crisis in landfill capacity, although there are regional issues. Capacity at large
disposal facilities has substantially replaced the small municipal landfills that were closed
for environmental reasons. These disposal facilities are increasingly owned by a few
firms that operate nationally and even internationally. The commercial firms that own
18

disposal facilities are almost always vertically integrated in collection and transfer
activities. These firms often supply a range of waste management services, including
collection and processing of recycled materials and implementation of waste reduction
programs. These firms usually handle a range of wastes, including MSW, special wastes,
and hazardous wastes.
The consolidation in the disposal and collection sectors of the waste management
data is clearly reflected in the national four-firm concentration data (see New Hampshire,
2001, Appendix D). For Standard Industrial Code 4953, refuse systems, which includes
disposal management, the top four firms controlled only 2.9% of all revenues in 1987,
but that rose to 42.6% in 1992. The North American Industrial Classification System
(NAICS) replaced the SIC codes for the 1997 Census of Business. NAICS Code 5622,
waste management and disposal, showed that the top four firms controlled 48% in 1997.
Clearly, the large increase in concentration in disposal occurred in the late 1980s and
early 1990s as environmental regulations caused older open landfills to be replaced with
modern, secure landfills.
The SIC code definitions for waste collection for 1987 and 1992 are not
comparable. The 1992 four-firm concentration for SIC 4212, garbage and trash
collection, was 34.5%. The four-firm concentration for the comparable NAICS industry
had risen to 48.4% by 1997. These data indicate that concentration in the collection
sector occurred slightly after concentration in the disposal sector.
As a rough measure, a four-firm concentration ratio of 50% (that is, when the 4
largest firms control 50% of total revenues) is often considered the threshold at which
concerns over competition arise. Both the disposal and collection sectors have four-firm
19

national concentrations ratios near 50%. But these national ratios understate the degree
of concentration in any particular regional market, because not all firms operate in every
market. Given the level of national concentration, the level of concentration in most
regional markets is likely to be well above the 50% threshold.
Table 2 presents data on revenues and employees for the ten largest waste
management firms. Three large firms, Waste Management, Inc. (WMI), Allied Waste
Industries, and Republic Services, operate nationally and account for 83% of the revenues
earned by the top 100 firms (Source: Waste Age 100 [2001]). Maine’s two largest waste
management firms, Waste Management and Casella, are first and sixth on this list. One
other firm from Maine, Regional Waste Systems (a public entity) appears on the Waste
Age 100 list, as number 62. Although the large national firms account for an increasing
share of total revenues, there remain a large number of local and regional waste
management companies.
Table 1 National MSW Disposal
1990-2001 Year Total tonnage Landfill Recycled Incinerated (million tons) (%) (%) (%)
1990 269.0 84 8 8 1991 293.6 77 11.5 11.5 1992 280.7 76 14 10 1993 291.7 72 17 11 1994 306.9 71 19 10 1995 322.9 67 23 10 1996 326.7 63 27 10 1997 327.5 62 28 10 1998 340.5 61 30 9 1999 374.6 61 31.5 7.5 2000 382.6 60 33 7 2001 409.0 61 32 7 Source: Goldstein and Madtes (2001)
20

Table 2 10 Largest US Waste Management Firms
2000
Company 2000 Revenues (millions) Employees 1. Waste Management $11,200 57,000 2. Allied Waste Industries $ 5,710 28,000 3. Republic Services $ 2,103 12,700 4. Onyx N.A. $ 1,165 8,660 5. Safety-Kleen Corp. $ 559 n/r 6. Casella Waste Systems $ 480 n/r 7. Norcal Waste Systems $ 350 2,000 8. Stericycle, Inc. $ 323 2,285 9. Waste Connections, Inc. $ 304 n/r 10. Rumpke Consolidated Companies $ 278 2,500 “n/r” indicates not reported in source. Source: Waste Age 100 (2001).
Mergers have been very significant in shaping the structure of the waste
management industry. WMI, which heads the list in Table 2, was formed in 1998 when
USA Waste acquired the former Waste Management. USA Waste then adopted the name
of the acquired entity. Allied was formed in 1999 by the merger of BFI and Allied. The
rate of mergers and acquisitions in the late 1990s was quite startling. In preparing its
Waste Age 100 for 1999, Waste Age magazine contacted 200 firms it considered eligible.
Of the 200 firms, 71 (35%) reported that they had been acquired that year.
Although a few national firms are very important in waste management, waste
markets are in fact local or regional in scope. Transportation costs are a significant limit
on the scope of the market. The increase in the cost of disposal relative to collection and
hauling has probably increased the size of local markets somewhat in the past 20 years.
The trend towards fewer, larger landfills has meant that waste moves greater distances
21

today than in the past. Goldstein and Madtes (2001), for example, find the number of
transfer stations continues to increase, while the number of disposal facilities declines.
Scale economies in solid waste management
A potential explanation for the rapid consolidation in the waste management
industry in the 1980s and 1990s is that economies of scale in collection and disposal
require larger firms. A second argument has been that vertical integration provides
economies of scope. This section assesses the evidence for economies of scale and
economies of scope in the waste management industry.
There is general agreement that there are significant economies of scale in landfill
construction. These economies of scale were increased by the more elaborate
construction standards under RCRA Subtitle D and by the expense of siting any new
landfill. A firm or municipality siting a landfill must spend several million dollars on site
acquisition, engineering studies, and participation in regulatory proceedings prior to
construction. These regulatory costs may increase as larger landfills are proposed, but
probably do not increase in proportion to the size of the landfill.
Construction costs also exhibit economies of scale. The total acreage required for
buffering the landfill from surrounding property does not increase proportionately with
landfill size. The geometry of constructing stable slopes on landfills means that large
landfills lose less airspace to slope angles and are able to fill more deeply than smaller
landfills. A larger landfill can hold more waste per acre of footprint than a smaller
landfill. The cost of access roads, monitoring systems, administrative buildings, truck
scales, and related support equipment also does not increase proportionately with landfill
size.
22

In operations, there may be modest economies of scale in labor and equipment
costs for larger operations. More substantial economies of scale may be present in the
operation of leachate collection systems and monitoring systems.
Table 3 presents estimates from Dooley et al. (1994) for the fixed and variable
costs per ton for landfill construction in North Dakota. Their data is based upon landfills
with a 20-year life. Their estimates indicate that economies of scale in both fixed and
variable costs are significant for landfills with capacity of less than 175 tons per day.
Table 3 Estimated Fixed Costs per Ton for
North Dakota Landfill Construction 1992
Landfill size (tons/day) 20 75 175 250 400
Fixed costs/ton 22.19 12.36 8.41 7.96 7.48 Variable costs/ton 11.26 9.45 6.50 5.92 5.44
Total costs/ton 33.45 21.81 14.91 13.88 12.92
Source: Dooley, et al. (1994).
_______________________________________________
There is more debate over the significance of economies of scale in collection.
There are two issues. First, how significant is route density in affecting costs? And
second, what are the economies of operating multiple routes by the same firm?
Economies of scale that result from route density are frequently cited. The logic
for these economies is simple. A truck that collects all the containers on a given street
can minimize the travel time between containers. This logic applies both to curbside
collection from residential containers and commercial collection with container lift
service.
23

The argument is also made that a firm needs to operate some minimum number of
vehicles to achieve minimum efficient scale in fleet operations. Maintenance is a
significant factor in this type of equipment. Economies of scale in maintenance per se
are less important, because maintenance can be contracted and because the minimum
economies of maintenance can be achieved by firms with multiple trucking activities.
But the firm needs spare equipment to continue to function while vehicles are being
serviced. The ratio of necessary spare equipment to routes falls as firm size increases.
For residential curbside collection, Stevens (1978) found that significant
economies of scale exist in communities below 20,000 population and that the economies
of scale are exhausted for cities of 50,000 or more. When using trucks as the measure of
scale, she found economies for up to four trucks, but that all economies were exhausted at
more than five trucks. (Stevens submitted comments on our preliminary report that
suggested the minimum scale might require seven to eight trucks today.) For a Canadian
sample, Tickner and McDavid (1986) also found significant economies of scale in
curbside collection. Because of the correlation between population density and
community population (that is, the larger communities are also the most dense) neither
Stevens (1978) nor Tickner and McDavid (1986) could statistically separate whether the
economies are due to route density or to absolute community size. Callan and Thomas
(2001) found constant returns to scale in collection of both waste and recycled materials
for Massachusetts. They find economies of scope in collecting waste and collecting
recycled materials together. At mean values for their sample, towns would save about
5% in joint provision of waste collection and recycled material collection relative to the
cost of separate programs.
24

If there is a cost disadvantage for small-scale entry, the size of that cost
disadvantage matters. If the cost disadvantage is relatively small, a firm that is prepared
to sustain small losses while building the business to an efficient scale can successfully
enter. For a small owner-operator, the investment to overcome these small cost
disadvantages might be made by “sweat equity” from the owner’s time. Unfortunately,
the statistical evidence on the size of the cost disadvantage associated with small-scale
entry is weak. The Tickner and McDavid (1986) study suggests a 15% cost advantage
when firm size doubles over all firm sizes. However, their statistical methodology did
not really identify whether this cost disadvantage disappeared at some firm size.
For business services, quality of service is an important issue in retaining
customers. Commercial container collection is such a business service. Missing
collections, failure to maintain canister hardware, and collections at inconvenient times
might all be dimensions of service. A firm does not necessarily need the lowest price to
attract customers. Customers who are unhappy with some aspect of service might be
willing to switch to a firm with higher costs but better service.
Finally, the economies of scale issue is more complicated than simply whether
economics of collection favors monopoly local collection. We also need to examine
whether the markets are “contestable” (Baumol et al., 1982). In a contestable market, the
threat of entry by a potential competitor constrains the behavior of current firms, perhaps
even in the case of a single monopoly supplier. A market is said to be contestable if a
firm could enter and exit the market quickly and at relatively low cost. If a firm in a
contestable market attempts to raise price, it risks entry by new firms. This threat of
entry is sufficient to restrain prices. Contestability requires low fixed costs, or capital
25

that can be easily moved to alternative uses. The theory of contestable markets has been
applied to airlines, for instance. Low-volume routes may not be large enough to
accommodate more than one or two carriers. But the major capital investment in airline
service, the airplane, can be easily moved into or out of a market. Therefore, an existing
airline knows that higher prices will attract entry from other firms, and its pricing is
thereby constrained.
Waste collection is a contestable market. The primary assets used in commercial
service, trucks and containers, are clearly mobile. There is an active market in used
equipment for an entrant to acquire equipment or to dispose of excess equipment. Even if
economies of density favor a single provider on any given route, the threat exists that
higher prices will attract entry to take entire routes. And a firm that serves an adjoining
area may be able to enter by taking parts of nearby routes.
For municipal curbside collection, use of public employees is a competitive
option for the municipality. Savas (1987, pp. 124-131) summarizes the results of nine
studies (five in the U.S., two in Canada, one each in Switzerland and Japan) of public
versus private contract costs of curbside collection. Savas draws from these studies a
35% cost disadvantage for public collection. While these studies are somewhat dated
(conducted between 1975 and 1984), there is little reason to think that the economics of
public versus contract commercial collection have changed much in 15 years. If public
provision is the only constraint on private pricing in the collection market, this 35% cost
differential means that public provision is a weak competitive threat. Private industry
frequently suggests that government enjoys several cost advantages over commercial
collection firms, including lower interest financing for equipment (because of tax-free
26

municipal borrowing) and no property/excise or sales taxes on equipment. The
productivity disadvantage of public collection would seem to more than offset these tax-
driven advantages.
For hauling, there is little evidence of economies of scale. Hauling would include
moving waste from transfer stations to disposal sites or hauling of roll-on, roll-off
containers (for example, of construction debris). These are straightforward trucking
operations. In tractor-trailer applications, the tractor is not specialized, and could even be
shared with other trucking operations. A wide range of heavy trucking firms, such as
construction companies and logging contractors, would find entry into hauling relatively
easy.
Economies of scope are distinct from economies of scale. Economies of scope
arise when there are cost advantages to be achieved by vertical integration or by
operating in several distinct markets. Economies of scope may arise when combining
successive stages in the production process can reduce costs. Planning may increase
efficiency if successive stages in the production process can be coordinated, even if the
steps are still distinct.
We could find no statistical analysis on economies of scope in collection, hauling
and disposal, so the issue cannot be resolved quantitatively. There are no obvious
technological reasons to expect economies from integrating collection and hauling with
disposal. The physical assets used in collection and hauling are quite distinct from the
physical assets used at a landfill or incinerator. It is difficult to see where physical
economies would arise in joint operation of collection and disposal. One might postulate
some economies in coordinating delivery times. Careful scheduling might minimize idle
27

time caused by trucks standing in line. While such economies are conceivable, it is
difficult to see why such coordination can only be accomplished by a vertically integrated
firm.
Industry commentary has suggested that bringing professional management to
small collection firms was a major impetus for merger activity, which implies economies
of scope in management. While professional management may be important in
complicated tasks such as siting and operating waste disposal facilities, the management
required to operate collection routes does not seem so specialized as to require large
national firms. And several firms involved in major merger activity in the 1990s, such as
WMI, Allied, and Casella, have had weak financial results in the aftermath of their
acquisitions. A larger firm faces increased challenges in communication and control that
may offset benefits from more specialized central management.
Economies of scope are distinct from strategic competitive reasons for owning
both disposal capacity and collection services in an area. A collection firm may be
reluctant to enter an area where competitors control all disposal facilities. The firm may
worry that competitor control of the price of disposal, a crucial input, places it at a serious
disadvantage. The firm might worry, for example, that competition in collection could be
subsidized from higher prices in disposal. These strategic issues arise not from the cost
advantages of vertical integration but rather from competitive advantages in market
power in the disposal market.
Federal Antitrust Actions to Promote Competition The federal antitrust statutes include the Sherman Act, the Clayton Act, and the
Federal Trade Commission Act. The Sherman Act prohibits contracts, combinations, and
28

conspiracies in restraint of trade and monopolization. The Sherman Act sanctions
violations with criminal as well as civil penalties. The Clayton Act, among other
provisions, bars mergers and acquisitions “where the effect may be substantially to lessen
competition or tend to create a monopoly in any line of commerce.” The Federal Trade
Commission Act declares unfair methods of competition to be unlawful, a category that
includes, but casts its net somewhat beyond, established antitrust offenses. The Clayton
Act is enforced jointly by the Department of Justice and the Federal Trade Commission.
Under the Sherman Act, Department of Justice (“Justice”) jurisdiction is supplemented
by private enforcement.
There are four primary opportunities for antitrust enforcement authorities to
intervene for the purpose of addressing market power. First, a proposed merger or
acquisition that reduces competition is subject to challenge. Second, collusive agreements
or combinations among competitors (e.g., price fixing or market allocation agreements)
are subject to attack. Third, exclusionary conduct by a market participant with a high
market share may be addressed as a monopolization offense. Finally, each of these
violations can be brought to court as an unfair method of competition.
Antitrust enforcement authorities are confined to addressing market power
problems on an ad hoc rather than a systematic basis. Possessing market power is not
illegal; only certain actions that abuse or extend that market power violate antitrust
statutes. For example, pre-existing market power that is exercised unilaterally to increase
price is beyond the reach of the antitrust laws. Where existing market power is at issue, it
may be appropriate to consider specific legislative remedies directed at the structure or
conduct of a specific industry.
29

The federal enforcement record in the trash industry includes more than a dozen
criminal and civil antitrust cases over a fifteen-year period that charge combinations in
restraint of trade, such as price fixing or customer allocation. This record attests to “an
industry highly susceptible to tacit or overt collusion among competing firms.” (See U.S.
v. USA Waste Services, Inc. [1996], Competitive Impact Statement at 14.) In some cases
the problem of collusion may transcend antitrust laws. (See, for example, U.S. v. Private
Sanitation Industry Association of Nassau/ Suffolk, Inc. [1994] involving a massive
conspiracy to control the Long Island solid waste disposal industry through the threat and
use of force in violation of Racketeer Influenced and Corrupt Organizations Act [RICO].)
Justice has brought at least two monopolization cases and has filed a series of
complaints and consent decrees in significant merger cases. The two monopolization
cases merit special attention because of their focus on so-called evergreen contracts (U.S.
v. BFI of Iowa, Inc., 1996; U.S. v. Waste Management of Georgia, Inc., 1996). In
consent decrees to settle the two monopolization cases, Justice obtained prohibitions on
the inclusion of the following terms in commercial hauling contracts in affected markets:
• an initial term longer than two years;
• a renewal term longer than one year;
• any requirement that notice of termination be provided earlier than 30 days prior to the expiration of an initial or renewal term;
• any requirement that the customer pay liquidated damages (i.e., a termination penalty) during the first twelve months of service that exceeds three times the greater of current charges or the six-month average monthly charge, or pay liquidated damages after the first twelve months that exceed two times the greater of its current or average monthly charge;
• any “right to compete” clause requiring notice of a competitive offer of service
and an opportunity to match a competitor’s prices.
30

In addition, the consent decrees required that the contracts be “easily readable,”
and clearly identified as contracts for solid waste services. In at least one subsequent
case, Justice obtained a more restrictive standard that limited the initial contract term to
one year (U.S. v. USA Waste Services, Inc., 1996).
In its Competitive Impact Statements, Justice explained why evergreen contracts
had been singled out for special prosecutorial attention in affected markets:
Many of these contracts contain terms that, when taken together … make it more difficult and costly for customers to switch to a competitor…and allow Defendants to bid to retain customers approached by a competitor. The contracts enhance and maintain Defendants’ market power … by significantly raising the cost and time required by a new entrant or small incumbent firm to build its customer base and obtain efficient scale and route density …. Defendants’ use of these contracts … raise barriers to entry and expansion [in affected markets]. (U.S. v. BFI of Iowa, Inc., 1996.)
Justice has obtained similar restrictions on evergreen contracts in its merger
consent decrees. (See, for example, U.S. v. Allied Waste Industries, Inc. [May 2000] and
U.S. v. Allied Waste Industries, Inc. [September 2000])
In most merger cases, the primary relief sought and obtained in federal consent
decrees consists of targeted divestitures to protect competition in specific affected
markets (e.g., U.S. v. USA Waste Services, Inc., 1998, divestitures in a dozen states; U.S.
v. Waste Management, Inc., 1999, divestitures in three states). Justice has also obtained
consent decree provisions requiring defendants to provide advance notice of certain
categories of future acquisitions or to provide nondiscriminatory access to a particular
facility for competitors (U.S. v. Allied Waste Industries, Inc., September 2000, notice
provision; U.S. v. USA Waste Services, Inc., 1998, notice and access provisions; U.S. v.
Reuter Recycling of Florida, Inc., 1996, access provision).
31

The Canadian agency responsible for competition in Canadian markets, the
Competition Tribunal, has also undertaken enforcement actions with respect to solid
waste management. Because the major U.S. firms also operate in Canada, the same firms
are often subject to competition enforcement there. The Competition Tribunal has
adjudicated four waste management cases in the past decade. In 1992, the Laidlaw Waste
Management Systems case (CT-91/02) resulted in numerous restrictions on evergreen
contracts used by Laidlaw in British Columbia. In 1997, the Canadian Waste Services
case (CT-97-01) led to a consent decree to divest some assets acquired by merger in
Ontario. In 1998, the Canadian Waste Services case (CT-98/01) led to a consent decree
to divest some assets acquired by merger in Edmonton, Alberta. In 2001, the Tribunal
ordered divestiture of a landfill acquired by Canadian Waste Services Holding (CT-
2000/002) in southern Ontario. The arguments in these cases are similar to arguments
made about competition in waste management in the U.S.
Other States’ Responses to Competition Concerns in Waste Management.
Competition in the waste management industry has been an issue for a number of
other states. The most direct evidence of that concern is antitrust enforcement activities
and direct state regulation of waste management pricing.
Antitrust activities. State Attorneys General have often participated in Justice
actions brought to enforce the Clayton Act. See, for example, U.S. v. Reuter Recycling,
1996 (Florida Attorney General was co-plaintiff); U.S. v. USA Waste Services, Inc., 1996
(Texas and Pennsylvania); U.S. v. Browning-Ferris Industries, Inc., 1995 (Florida and
Maryland); U.S. v. USA Waste Services, Inc., 1998 (Arizona, California, Colorado,
Florida, Kentucky, Maryland, Michigan, Ohio, Pennsylvania, Texas, Washington and
32
Wisconsin); U.S. v. Waste Management, Inc., 1999 (Florida, New York and
Pennsylvania). A limited survey of other states by the Task Force (Maine Legislature,
2000) found additional antitrust activity or interest in Connecticut, Missouri,
Pennsylvania, and Utah.
Regulatory Responses. Three states, Alaska, Washington, and West Virginia,
subject parts of the waste management industry to public utility regulation. The
regulation in all three states traces its roots to state regulation of trucking. Of the three
states, only West Virginia has adopted a regime of comprehensive regulation of solid
waste landfills. The West Virginian regime was prompted at least in part by concerns
over competition and market behavior in the solid waste disposal industry.
The Regulatory Commission of Alaska sets fees for residential and commercial
curbside pick-up. Firms providing commercial containerized pick-up and roll-on, roll-off
service must file their fees with the Commission. There is a requirement for non-
discrimination in these container and roll-on, roll-off services. The same rate must be
charged to customers receiving the same service in an area covered by a filed rate. Most
disposal takes place at municipally operating facilities, whose fees are not subject to
Commission rate-setting. The Alaskan regulation of curbside pick-up suggests an
assumption that economies of scale in local curbside pick-up yield natural monopoly
characteristics. The reliance on non-discrimination requirements in larger volume
commercial services suggests only modest concerns with market power in that sector.
The Utilities and Transportation Commission of the State of Washington also
regulates some parts of the waste management industry. Specific state regulation of
waste collection was authorized in 1951, and the current structure was established in
33

1961. Both curbside pick-up and commercial container service are regulated. The state
Utilities and Transportation Commission shares responsibility for regulation with local
municipalities. Local municipalities may choose to contract for services on behalf of
their citizens or to regulate collection services. The Utilities and Transportation
Commission has authority in rural, unorganized areas or in municipalities that decline to
exercise their option to regulate. Most municipalities do regulate, so the commission is
primarily responsible for setting fees for the unorganized areas. Neither the state nor the
municipalities currently regulate landfill fees.
Regulation of the solid waste industry in West Virginia also traces its roots to
state regulation of trucking. West Virginia expanded its regulation in 1989 to include
landfills and commercial container service. Curbside pick-up by municipal employees is
not subject to regulation. Contracts between municipalities and commercial firms for
curbside pick-up must be filed for approval with the Public Service Commission.
Collection companies have an obligation-to-serve in their designated territories. Most
fees for collection services are determined by negotiation between the service provider
and the customer. However, if a customer is dissatisfied with the offered rate, the
customer may request that the Public Service Commission initiate a proceeding to set the
rate. The threat of going to the Public Service Commission strengthens the bargaining
position of the customer if there is disagreement over the rate.
In 1989, the West Virginia Public Service Commission was given authority to
regulate landfills and transfer stations. Both commercial and municipal landfills are
subject to rate regulation. In 1989, there were about 40 landfills. At present, there are
approximately 20 landfills and 10 transfer stations. A traditional public utility rate base
34

approach is used to set fees at each landfill for MSW, CDD, bulky goods, and tires.
Some special waste fees are negotiated rather than regulated. Out-of-state waste faces the
same fees as in-state waste. West Virginia imposes a tax of $8.75 per ton on all waste to
finance closures of old landfills and to cover various state program costs. Fees in West
Virginia are now in the range of $40 per ton for MSW (including the state fee) and $20
per ton for CDD. Landfills are subject to non-discrimination provisions with respect to
trucks delivering to a landfill, under a “first-come, first-served” requirement.
West Virginia’s regulation of landfill fees illuminates the types of issues and
problems that would arise under state regulation of landfills. First, most of the revenues
from landfill services come from a relatively small number of categories that are easily
defined: MSW, CDD, bulky goods, and tires. There may be some categories of special
wastes that have distinct characteristics that make uniform tariffing difficult.
Second, an obvious set of questions about the boundary of the regulated industry
arises.
• Should interstate waste, as well as instate waste, be subject to rate regulation?
One could argue that interstate waste is subject to price competition in its
originating jurisdiction. However, unless a landfill has an obligation-to-serve,
it may refuse instate waste in favor of higher priced interstate waste. For
vertically integrated firms, the pricing of interstate waste is especially
problematic, because it is impossible to regulate transfer prices within a firm.
• Should transfer stations be regulated?
• Should landfills run by local governments be subject to rate regulation?
Utility commissions, including Maine’s, have generally tried to shed
35

responsibilities for regulating municipally-provided utility services. However,
a municipal landfill may serve other communities and commercial haulers, as
well its own residents.
Third, public utility regulation typically involves the grant of an exclusive
franchise and the concomitant imposition of an obligation-to-serve. For that reason, West
Virginia has a certificate of need process to license new landfill capacity. In West
Virginia, the landfill licensing process is essentially a closely coordinated activity
between the Public Service Commission and the Department of Environmental
Protection. Regulation of landfills raises an interesting question about whether an
obligation-to-serve should be imposed and what it might entail. Without an obligation-
to-serve, a disposal site unhappy with its fees might simply refuse to accept waste, or
decide to accept only certain kinds of waste. Could an obligation-to-serve extend beyond
the immediate provision of services to include an expectation that the landfill will
manage its available capacity to meet the needs of a state’s citizens for some period into
the future? But restricting capacity for future instate use might violate flow control
limitations under the federal Commerce Clause.
Fourth, public utility regulation encounters difficulties when only part of a
company’s activities are regulated. Most commercial landfills will be run by vertically
integrated, interstate firms. Both vertical integration and interstate operations complicate
public utility rate setting. When a firm has both competitive and regulated activities, rate
base regulation must determine which investments and expenses are attributed to the
regulated entity and which to the competitive activity. Under the cost-plus incentives of
rate-base regulation, the firm has strong incentives to shift costs to the regulated activity.
36

This raises the possibility that regulation may result in cross-subsidies from the regulated
business to the unregulated business, to the detriment of competitors in the unregulated
activity.
Public utility regulation of telecommunications has increasingly faced the
problem of regulating only part of a company. A response has been “price cap”
regulation, instead of cost-plus, rate-base regulation. Under price cap regulation, a rate is
set for the current year and allowed to increase automatically in relation to an inflation
index, perhaps with an offset for increased productivity. Because the rate is set by
formula and does not change as the firm’s costs change, there is no incentive to cross-
subsidize competitive activities from regulated activities. Price cap regulation might be
preferable to rate-base regulation for any landfill price regulation.
Fifth, West Virginia’s extension of regulation to landfills in 1989 illustrates the
inherently ad hoc process of initiating rate-base regulation. West Virginia initially froze
fees in 1989. Thereafter, it brought firms under rate-base regulation by eventually
completing a rate case for each firm. The process of initiating rate-base regulation must
determine the rate base, which is the value of the assets used by the newly regulated firm.
The issue is complicated for assets acquired prior to regulation at a price that exceeded
their book value. The excess of acquisition price over book value is typically capitalized
as “goodwill” by the acquiring firm. The goodwill may include a premium for the
acquisition of assets that earn above-average returns because of market power. If the
goodwill is not included in the rate base, the firm suffers a loss from its inability to
recover the entire purchase price. But if goodwill is included, then regulation allows the
firm to set a price that is based upon built-in expectation of above-normal profits.
37

Legal status of flow control State and municipal regulation of the flow of waste has been an important issue in
competition. Local governments, including some in Maine, have directed residential and
commercial waste generated within their borders to specific disposal sites. These
controls help local communities meet commitments to deliver certain minimum tonnages
to disposal sites, and especially to waste-to-energy plants. These controls have also been
used by municipalities to subsidize their disposal costs. Municipalities can bargain for
preferential rates from disposal sites in return for a captive commercial market, which can
then be charged higher fees. On the other hand, some states would like to restrict the
flow of waste into their states to avoid importing environmental problems from other
states. These restrictions have run into the constitutional issue of whether solid waste
flow control violates the Commerce Clause of the U.S. Constitution, which reserves the
regulation of interstate commerce as a federal prerogative.
The federal Commerce Clause (Article I, §8, cl. 3) provides, in pertinent part, that
Congress shall have the Power…[t]o regulate Commerce with Foreign Nations, and among the several states….
Although this language does not explicitly prohibit state regulation in the absence of
Congressional action, such prohibition has been held to exist by implication in a string of
U.S. Supreme Court decisions stretching back to Gibbons v. Ogden (1824). That case
held that power to regulate interstate commerce could not be shared by two sovereigns.
The rationale for the judicial creation of this so-called “dormant Commerce Clause”
prohibition was the preservation of a national marketplace unimpeded by the constraints
of parochial economic protectionism. (See H.P. Hood & Sons v. DuMond, 1949.)
38

The frontier separating prohibited economic protectionism from legitimate state
and local regulation to protect health and safety has proven difficult to define. Over the
past decade, the courts’ struggle to distinguish permissible regulation from prohibited
protectionism has coincided with state and local government efforts to cope with solid
waste management through flow control. As a result, the solid waste industry has found
itself at the cutting edge of Commerce Clause jurisprudence (S. Cox, 1997).
Although application of the dormant Commerce Clause to state and local
regulation of the solid waste industry remains complicated, the governing case law
provides three basic principles. First, a state or local government does not run afoul of the
Commerce Clause unless it is acting as a regulator in a governmental capacity. If the
government entity is simply participating in the market as a private enterprise might, no
constitutional issue arises (Sal Tinnerello & Sons v. Town of Stonington, 1998; United
Haulers Association, Inc. v. Oneida-Herkimer Solid Waste Management Authority,
2002). Second, if the government action is regulatory in nature and discriminates on its
face against interstate commerce, a virtual per se rule of invalidity applies (City of
Philadelphia v. New Jersey, 1978). This strict scrutiny is triggered by “differential
treatment of in-state and out-of-state economic interests that benefit the former and
burden the latter” (Oregon Waste Systems v. Department of Environmental Quality,
1994). Despite the per se label, if the discriminatory regulation is necessary to address a
public health threat for which no alternative remedies are available, the measure will be
upheld (Maine v. Taylor, 1986). Third, if the regulation is nondiscriminatory and its
impact on interstate commerce can be characterized as incidental, a more lenient
balancing test applies. In such a case, the regulation is upheld unless the burden on
39

interstate commerce is clearly excessive in relation to putative local benefits (Pike v.
Bruce Church, Inc., 1970).
These principles can be readily articulated, but they have proven difficult to
apply. The courts have pieced together a patchwork of decisions that is not always either
clear or consistent, and which leaves important unresolved issues. Among the options
available to state and local governments, it is possible to identify three categories: those
that are clearly prohibited, those that currently appear permissible, and finally those
which may be permissible but remain subject to controversy.
Clearly prohibited (unless they can be justified as necessary health or safety
measures for which no alternative exists under the stringent Maine v. Taylor [1986] test)
are state or local regulatory measures which:
• discriminate against out-of-state solid waste by barring its importation for
disposal at private facilities (City of Philadelphia v. New Jersey, 1978; Fort
Gratiot Sanitary Landfill v. Michigan Department of Natural Resources, 1992);
• levy discriminatory fees or taxes on imported out-of-state solid waste (Chemical
Waste Management, Inc. v. Hunt, 1992; Oregon Waste Systems v. Department of
Environmental Quality, 1994.); or
• require that locally generated solid waste be directed to a specific private facility
(C&A Carbone, Inc. v. Town of Clarkstown, 1994; SSC Corp. v. Town of
Smithtown, 1996).
Apparently permissible under current law are:
• state regulations setting limits on available capacity at disposal sites (Fort Gratiot
Sanitary Landfill v. Michigan Department of Natural Resources, 1992);
40
• state regulations which require separation of out-of-state solid waste according to
types of material and apply equally to in-state waste (National Solid Waste
Management Association v. Meyer, 1999);
• restrictions on acceptance of out-of-state waste at publicly-owned and controlled
facilities, if adopted by state or local government in the capacity of a market
participant, including a ban or higher fee on out-of-state waste (e.g., SSC Corp. v.
Town of Smithtown, 1996);
• state and local government contracts with haulers for collection and transportation
of waste to a designated disposal facility where (a) the government entity has a
put-or-pay agreement with the facility and the contract with the hauler provides
for reimbursement of the tip fee; or (b) the hauler is permitted to tip for free at the
disposal facility and the system is financed by taxes and fees charged to
generators of waste (SSC Corp. v. Town of Smithtown, 1996; USA Recycling, Inc.
v. Town of Babylon, 1995; but see Huish Detergents, Inc. v. Warren County,
2000);
• local government flow control regulations that require haulers to collect and
transport solid waste collected within the municipality to designated private
facility or facilities selected by an open, fair and competitive bid process that is
even-handed toward out-of-state interests or conducted pursuant to
nondiscriminatory criteria (Harvey & Harvey, Inc. v. County of Chester, 1995;
Maharg, Inc. v. Van Wert Solid Waste Management District, 2001; Houlton
Citizens’ Coalition v. Town of Houlton, 1999);
41

• state and local government regulations requiring residents to subscribe to solid
waste collection and disposal service provided by State, municipality or exclusive
contractor, provided exclusive contractor is selected by open, fair and competitive
bid process (Sal Tinnerello & Sons v. Town of Stonington, 1998; Houlton
Citizens Coalition v. Town of Houlton, 1999).
Finally, flow control strategies which may be permissible, but remain subject to a
degree of continuing controversy include:
• state and local government flow control regulations requiring haulers to collect
and transport solid waste collected within a given municipality and destined for
in-state disposal to a designated private facility, provided the requirement does
not apply to waste destined for out-of-state disposal (Ben Oehrleins & Sons &
Daughter v. Hennepin County, 1997; United Waste Systems of Iowa, Inc. v.
Wilson, 1999; but see U&I Sanitation v. City of Columbus, 2000);
• local government flow control regulations requiring that all or part of solid waste
generated within the municipality be directed to publicly owned facilities (United
Hauler Association v. Oneida-Herkimer Solid Waste Management Authority,
2001; but see Waste Management of Tennessee v. Metropolitan Government of
Nashville & Davidson County, 1997).
Although the precise contours of the Commerce Clause are not always easy to
discern, it is at least clear that the Constitution does not deprive the State or its political
subdivisions of the power to regulate the solid waste hauling and disposal industries.
Moreover, the range of options available to address market power problems without
offending the Commerce Clause is relatively broad. For example, the State could
42

legitimately consider a provision imposing a moratorium on acquisitions of solid waste
assets within the State by vertically integrated companies, or requiring divorcement of
hauling and disposal operations. Other states have required analogous divestiture of
retail outlets by petroleum refiners. (See Exxon Corp. v. Governor of Maryland [1978],
where a petroleum divorcement measure was upheld over due process and Commerce
Clause challenges)
Commerce Clause jurisprudence affecting the solid waste industry remains a work
in progress, so this summary is necessarily provisional and incomplete. However, the
overall impact of this jurisprudence on competition in solid waste markets has probably
been marginal. The central tenet of dormant Commerce Clause doctrine is the prohibition
against protectionist measures. To the extent they have been faithful to this purpose, the
courts have sought to preserve competition in interstate markets. Where competition is
waning, or competitive markets have failed to adequately address the considerable
problems posed by solid waste management, state and local governments appear to retain
a workable range of policy options.
Flow control has been a particular issue with respect to “put-or-pay”
commitments made by communities before constitutional issues arose with regard to flow
control. Communities may face significant penalties if they committed to sending
commercial waste to a particular plant, and that waste goes somewhere else. The issue is
similar for communities that build large disposal facilities, such as waste-to-energy
incinerators, on the assumption that they could direct commercial waste to the facility.
Even so, communities with put-or-pay commitments or large dedicated disposal
facilities are not without options. A community can subsidize commercial disposal at the
43

contracted facility. This makes economic sense for communities facing a put-or-pay
penalty. For example, consider a town that faces a $50 per ton penalty for falling below
its contracted volume. Suppose that the disposal cost at the contracted site is $50, while
commercial customers are offered $40 per ton at another site. The town would provide a
subsidy of $11 per ton to commercial customers, which lowers the effective rate to $39 at
the contract site for commercial customers. It is preferable to pay the subsidy of $11/ton
than the penalty of $50/ton. When a municipally-owned disposal facility lowers its fees
to compete for commercial customers, the lower price is economically identical to the
subsidy above. Another option would be for the community to shift the entire cost of
waste management to the municipal budget by collecting both residential and commercial
waste in its community.
Towns are understandably distressed that their best response to the loss of flow
control is to lower the revenues from commercial customers and to shift more of the cost
of disposal onto the property tax base. One can debate the equity of this shift. In some
cases, commercial fees under flow control were greater than the fees for municipal
residential waste. In such cases, the effect of flow control was to create a local municipal
monopoly that raised prices in the commercial market. But many communities entered
into put-or-pay contracts that specified the same price for municipal and commercial
waste. The communities were not attempting to subsidize local residential disposal from
commercial disposal. Their volume commitment may have been an effort to insure that
their businesses would have access to disposal at predictable rates. Perhaps
unknowingly, these communities were accepting the risk that flow control would be
invalidated at the same time competitive disposal fees fell. The owners of commercial
44

disposal sites may have understood the risks and thus negotiated a risk-sharing
arrangement to their benefit.
Under one circumstance, market power issues may arise with respect to put-or-
pay contracts. A vertically integrated firm with more than one disposal site may be able
to manipulate its put-or-pay contracts with municipalities to its benefit. Consider the
following example. Before flow control was called into question, a municipality
Anytown passes an ordinance requiring all solid waste generated within the municipality
to be hauled to Incinerator A. Anytown then enters a put-or-pay contract with Vertically
Integrated, Inc., the owner of Incinerator A, pursuant to which
• all residential waste, comprising 40% of the tonnage generated within Anytown, will be tipped at Incinerator A for a fee of $50/ton, to be paid by the municipality;
• all commercial waste, comprising 60% of the tonnage generated within
Anytown, will be tipped at Incinerator A pursuant to the flow control ordinance for a fee of $50 per ton, to be paid by the hauler;
• to the extent Incinerator A receives less than 100% of the tonnage generated
within Anytown, the municipality will pay $50/ton for each ton by which it falls short of its commitment.
Legal decisions prevent Anytown from enforcing its flow control ordinance. VI, Inc., a
commercial hauler that is a subsidiary of Vertically Integrated, begins to haul commercial
waste from Anytown to Landfill B, a second disposal facility also owned by Vertically
Integrated. Thus, Vertically Integrated is able to charge twice for the same waste --
receiving payment once from the town at Incinerator A, and once from the hauler (and
through the hauler, from commercial customers) at Landfill B.
Vertically Integrated, Inc. is uniquely situated to profit by diverting commercial
waste from one disposal site to another. While a non-vertically integrated firm might
45

compete for commercial waste and so cause put-or-pay penalties to be incurred, it does
not realize a competitive advantage from those penalties. Vertically Integrated does
receive the benefit of those penalties, and thus has a competitive advantage in competing
with other firms for commercial waste. The diversion of the waste in this scenario may
therefore be described as an exercise of vertical market power. (Of course, two firms
could collude to accomplish this effect, but such collusion would clearly violate Section 1
of the Sherman Act.)
A legislative remedy could be enacted to bar any company from receiving both
payment for delivery of waste to one facility and at the same time a penalty for its non-
delivery to another facility under put-or-pay contracts signed prior to some date. As we
discuss in the following section, there seems no legal or constitutional difficulty with a
limited regulatory intervention of this nature.
Federal legislation has been proposed to provide communities with a limited
exemption to enforce flow-control ordinances signed prior to 1994 if the community had
built a disposal site or had signed a long-term contract on the basis of the flow control
ordinance. Such exemptions would be limited to the life of the facility or contract.
While such relief seems a plausible response to the circumstances, it has not been
enacted. States that want broader authority to control out-of-state waste have tied support
for this limited relief to the broader and more contentious issue of limits on importation
of waste.
Impairment of contracts and takings issues
Two other federal constitutional provisions have formed the basis for occasional
challenges to regulations affecting the solid waste hauling and disposal industry: the
46

contract clause and the takings clause. Each has a counterpart in the state constitution that
is interpreted in accordance with federal case law (Clark v. Rust Engineering Co., 1991,
with regard to the contract clause; MC Associates v. Town of Cape Elizabeth, 2001, with
regard to the takings clause).
The federal contract clause provides in seemingly absolute terms that “[n]o state
shall…pass any…law impairing the Obligation of Contracts.” However, the courts have
made clear that this language does not absolutely prohibit the impairment of private or
government contracts. Rather, “there is a need to harmonize the command of the [c]lause
with a state’s police power to protect its citizens” (Sal Tinnerello & Sons v. Town of
Stonington, 1998). To justify a challenge to a police power regulation, the complaining
party must demonstrate that the resulting contractual impairment is substantial.
Moreover, the impairment will not be considered substantial if the regulation was
reasonably foreseeable. (See Houlton Citizens Coalition v. Town of Houlton [1999, at
190]: “they would have had to be troglodytes not to have known that the waste collection
and disposal industry is subject to fairly pervasive regulation.”) Even if this hurdle is
passed, the law will be upheld if it is shown (a) that its provisions serve a significant
public purpose; and (b) that the means chosen to accomplish that purpose are reasonable
and appropriate (Houlton Citizens Coalition v. Town of Houlton, 1999).
Among the provisions upheld in recent contract clause challenges are flow control
ordinances that effectively terminated contractual relationships with municipal residents
(Sal Tinnerello & Sons v. Town of Stonington, 1998; Houlton Citizens Coalition v. Town
of Houlton, 1999). Thus, a regulatory measure must be demonstrably arbitrary before it
will be struck down under the state or federal contract clause. Measures designed to
47

address market power problems by placing restrictions on the enforceability of certain
contract provisions (e.g., “evergreen” clauses) are, accordingly, unlikely to encounter
constitutional difficulties.
The standards governing a claim of a regulatory violation of constitutional takings
provisions are similar. The federal takings clause prohibits the taking of “private
property … for public use, without just compensation.” In evaluating a claim of
regulatory taking, courts “weigh … the character of the government action, its economic
impact on the plaintiff, and the degree to which it interferes with the plaintiff’s
reasonable, investment-backed expectations” (Houlton Citizens Coalition v. Town of
Houlton, 1999, at 190). A reasonable exercise of the state’s police power whose purpose
is the public welfare and whose chosen means bears a rational relationship to the intended
goal is likely to survive constitutional attack. (See Maine Beer & Wine Wholesalers v.
State, 1993.) Flow control ordinances and related exclusive hauling contracts are no
more likely to run afoul of the takings clause than they do of the contracts clause
(Houlton Citizens Coalition v. Town of Houlton, 1999). See also Tri-State Rubbish, Inc.
v. Waste Management, Inc. (1993), which held that government can for public purposes
impose general regulations that may severely limit the value of an ongoing business
without compensation. A provision that survives scrutiny under the contracts clause,
accordingly, is unlikely to be seriously jeopardized by a takings clause challenge.
48

Chapter 4
Maine’s Solid Waste Industry
In 1999, Maine generated over 1.4 million tons of MSW and another 240,000 tons
of CDD (see Table 4). Both of these streams have grown substantially since 1991, with
25% growth in MSW and 200% growth in CDD. Increased recycling has almost exactly
offset the growth in MSW, so the total tonnage of MSW that is incinerated or landfilled
has remained roughly constant. There has been a clear shift from landfill disposal of
MSW to incineration. Part of the growth in CDD no doubt reflects a building boom
associated with the strong economic growth of the 1990s. But much of the apparent
growth in CDD almost certainly results from changes in disposal patterns of CDD. In the
past, a large share of CDD disposal was through alternatives to licensed disposal sites,
such as being burned, used as fill, or dumped in old gravel pits. As stricter environmental
regulation has reduced options for CDD, more finds its way to licensed disposal sites.
Chapter 4 assembles the available information on Maine’s disposal and collection
industries. This information includes identification of major participants and historical
information on pricing. The final section of the chapter discusses how state antitrust
enforcement has affected the industry.
49

Table 4
Trends in Maine’s MSW and CDD Flows
1991 1995 1999 MSW CDD MSW CDD MSW CDD Incinerated 458,480 539,637 669,845 Landfilled* 305,165 42,000 89,590 77,802 91,201 159,065 Recycled 319,635 38,260 538,485 18,311 645,152 39,469 Exported 82,210 ** 60,456 15,072 50,862 40,412 Totals 1,165,490 80,260 1,327,960 111,185 1,457,060 238,946 Generated - tons 1,245,750 1,339,353 1,696,006 * includes only unprocessed solid waste tonnage delivered ** figures for 1991 do not separate CDD from MSW in exported tonnages Source: State Planning Office Disposal sector
Waste disposal in Maine involves four waste-to-energy incinerators, two
commercial landfills, seven municipal landfills, two municipal special waste (ash)
landfills, twenty-four municipal CDD sites, six commercial CDD sites, and out-of-state
disposal at two landfills in New Hampshire and at two landfills in New Brunswick.
Table 5 summarizes how MSW from municipalities in 2000 was distributed
among these different disposal categories. (This information is based upon tonnage only
for MSW reported by municipalities, and therefore does not include most commercial
waste. The percentage data should roughly reflect the shares for the entire waste stream.)
50

Roughly 70% of the MSW went to the four waste-to-energy incinerators. The remaining
30% went to a variety of landfills. Note that these percentages do not include ash, FEPR,
CDD and bulky goods, or materials that were recycled. As discussed earlier, this heavy
reliance on waste-to-energy incinerators is a direct result of Maine policy in the late
1980s that strongly favored waste-to-energy incinerators.
Table 6 indicates that the pattern is completely different for CDD and bulky
waste. Of the total CDD/bulky waste stream in 2000, 85% went to landfills. Note from
Table 4, that the tonnage of CDD landfilled exceeds the tonnage of MSW that is directly
landfilled. CDD is generally less dense than MSW, so it consumes more landfill space
per ton. When comparing these flows, note however that the tonnage of ash and FEPR
from incinerators would exceed the CDD tonnage. But it is clear that the growing stream
of CDD and bulky goods to licensed disposal facilities represents a very significant
demand on remaining landfill capacity. Of course, much of the CDD stream goes to the
24 municipal CDD disposal sites (below), where the capacity is specifically for CDD.
Table 5
Disposal Shares for Maine’s Residential MSW 2000
Percent
Waste-to-energy plants 69% Commercial landfills 7% Municipal landfills 14% Disposal in New Hampshire 3% Disposal in New Brunswick 3% Source: Maine State Planning Office, 2000. Note that figures do not add to 100%
because some towns use more than one disposal method and some or all of their waste is not attributed to these categories.
51

Table 6 Disposal Shares for Maine’s Bulky Waste
2000
Percent
Waste-to-energy 15%
Landfill 85%
Total 100%
Source: Maine State Planning Office, 2000.
Waste-to-energy incinerators. Maine has four waste-to-energy incinerators with a
total annual capacity of 760,000 tons of MSW (see Table 7). Penobscot Energy
Recovery Corporation (PERC) is a commercial incinerator with ENI/NRG Energy as the
general partner. Its limited partners include towns in the Municipal Review Committee,
ENI, and SET PERC Investment, LLC. Maine Energy Recovery Corporation is a
commercial facility owned by Casella. Regional Waste Systems (RWS) and Mid-Maine
Waste Action Corporation (MMWAC) are public entities owned by groups of
municipalities. RWS has 21 member communities in the greater Portland region and
York County. MMWAC has 12 member communities in the Auburn area.
52

Table 7
Maine’s Waste-to-energy Facilities
Annual Year Capacity Ash Incinerator Facility Owner(s) (tons) Type Disposal opened Maine Energy Casella 250,000 RDF Crossroads 1987 PERC ENI/NRG , 270,000 RDF PTL 1988 MRC towns, SET RWS RWS 170,000 Mass burn RWS 1988 MMWAC MMWAC 70,000 Mass burn Lewiston 1992 RDF: Refuse-derived fuel Source: Capacity data from State Planning Office, 1998, p. 41
Maine has two types of incinerators: mass burn and refuse derived fuel. In a
mass burn unit, all the waste that is small enough to go through the incinerator door is
burned. In a refuse-derived fuel unit, the waste is first processed to remove some
material with low BTU value. The removed material includes metals, organics, and
glass. As a result of the removal of some of the waste, the waste stream going into the
incinerator provides a better fuel. The metals that are removed are sold into recycling
markets. The glass and grit removed prior to burning is called “front end process
residue” or “FEPR”. This FEPR is essentially a kind of ground-up MSW and is
landfilled. FEPR is sometimes used by landfills as a filling layer between MSW and the
final layer of soil that encloses the landfill. Using FEPR as part of the landfill cover
reduces the amount of soil required and is therefore often accepted by landfills at fees
below ordinary MSW. Prior to 1999, FEPR was also used to shape old, closed landfills
53

before the final layer of soil was added. Both types of incinerators also generate a stream
of “non-processibles”, such as furniture that is too large for the equipment to handle.
Like bulky waste and CDD, most non-processible material is landfilled.
All incinerators generate bottom ash and fly ash that requires disposal, and the
refuse derived fuel units generate FEPR that requires disposal. Therefore, the markets for
disposal of ash and FEPR are important to the economics of these plants. Ash is a special
waste that requires somewhat higher landfill standards than MSW. Because ash is denser
than MSW, a ton of ash requires less landfill space than a ton of MSW.
Each of the four waste-to-energy incinerators has different arrangements for its
ash. PERC uses Pine Tree Landfill (PTL, owned by Casella; formerly SERF, Sawyer
Environmental Recovery Facility). MMWAC has an agreement with Lewiston whereby
MMWAC takes Lewiston MSW at a price of $42.50/ton and Lewiston accepts MMWAC
ash at its landfill for $40.00/ton. The two revenue streams are approximately the same,
so Lewiston essentially provides MMWAC with ash disposal in return for accepting
about the same tonnage of its MSW. Because ash takes less space than an equivalent
tonnage of MSW, Lewiston is extending the life of its landfill under this arrangement.
RWS has its own landfill in Scarborough. Maine Energy currently sends its ash toWMI’s
Crossroads landfill.
The two existing commercial waste-to-energy incinerators, Maine Energy and
PERC, are granted an exemption under Maine’s ban on new commercial landfills to
develop landfills for ash (and only for ash) under the standard environmental siting
process. This special consideration is probably unimportant, however. An ash-only site
for one incinerator will have higher costs than a larger special waste landfill, because
54

disposal volumes would be low. Casella, Maine Energy’s owner, has access to its own
landfill capacity at PTL and at out-of-state landfills. Given PERC’s financial ties to
MRC communities (see below), PERC and the MRC communities would probably find it
advantageous to develop a municipal special waste landfill rather than a stand-alone ash
site, were PERC to need additional ash disposal.
While PERC is a commercial incinerator, it has a special contractual relationship
with the Municipal Review Committee (MRC). When PERC opened in 1988, it entered
into contracts to provide waste disposal to communities in eastern Maine at very
favorable rates. In 1990, after two years of operation, PERC announced that it could not
honor those contracts and asked the municipalities to enter into contract renegotiations.
The municipalities were not pleased with the prospect of higher disposal fees, but few
options were available to them. The municipalities formed the MRC to negotiate with
PERC, and the MRC has represented the interests of area communities with PERC since
then. As a result of the 1990 renegotiations, the municipalities did agree to higher fees,
but obtained a “performance credit” from PERC that allowed municipalities to share in
any profits that the plant might generate. The MRC currently has 114 members,
including municipalities, counties, waste districts and interlocal waste agreements, that
represent 162 municipalities and counties.
In 1998, Bangor Hydro-Electric asked PERC and MRC to renegotiate PERC’s
electric contract. This renegotiation was part of an effort by Maine’s utilities (in
conjunction with regulators and the Legislature) to reduce the cost of alternative energy
contracts. A central feature of the renegotiations was the use of public debt to replace the
private debt of energy producers. Public debt has a lower interest rate than private debt,
55

because interest on state bonds is not subject to federal income taxes. The interest saved
by refinancing can be used to reduce electric rates. In PERC’s case, debt repayment was
also extended by 14 years, from 2004 to 2018, thus lowering current debt payments.
PERC’s financial structure was again altered when the electric contract was
renegotiated. The MRC obtained the option for its members to become limited partners
in PERC by pre-paying part of the bond debt. MRC towns currently own 21% of PERC
and may purchase up to 50%. The MRC towns also have the option to purchase the
PERC plant in 2018. The MRC communities, in turn, entered into put-or-pay agreements
to deliver minimum MSW tonnages to PERC to insure financing by the Finance
Authority of Maine (FAME). Under the terms of the agreement, PERC, MRC members,
and Bangor Hydro shared the future performance credits equally.
Both MRC communities and the PERC partners received warrants to purchase
Bangor Hydro stock at $7.00 per share. These warrants had a value of approximately $16
million for MRC communities when Emera purchased Bangor Hydro in 2000. At that
point, there were 90 MRC members representing 116 municipalities; these members were
designated as “Equity Charter Municipalities”. These warrants were converted into a
promissory note from Bangor Hydro to the MRC to be paid over seven years. The MRC
has used the proceeds of the promissory note along with the performance credits to
maintain an effective rate of $45/ton for Equity Charter members. Funds above those
needed to maintain the $45 per ton rate are invested in PERC through repurchase of the
outstanding bonds. Members who joined the MRC after July 1, 2000, were designated as
“New Charter Municipalities”; there are 24 New Charter members representing 46
56

municipalities and one county. These New Charter members qualify for a rate that is
120% of the Equity Charter rate, which yields a current disposal rate of $54/ton.
Prior to 1999, KTI was operator and majority general partner in PERC and Maine
Energy. Energy National, Inc. (ENI) was the minority general partner. The plant also
had ENI and SET PERC Limited, LLC, as limited partners. ENI is a wholly owned
subsidiary of NRG Energy, a wholly owned subsidiary of Xcel Energy, a large publicly
traded energy firm. When Casella acquired KTI in 1999, concerns were raised about the
impact on competition in eastern Maine. Casella already owned the Sawyer
Environmental Recovery Facility (SERF) (now PTL) and was the dominant hauler in
eastern Maine in 1999. The Maine Attorney General entered into a consent decree to
address some of the concerns (discussed in detail below).
In January 2000, the MRC filed a suit against PERC alleging that PERC had
agreed to pay SERF too much for disposal of residues. ENI, the other partner in PERC,
essentially supported the MRC’s claims. Casella disputed the claim. The suit was settled
in March 2001. The settlement included a five-year contract with a 33% reduction in
disposal fees. Also in March 2001, Casella agreed to sell its interest in PERC to
ENI/NRG Energy, while ENI/NRG Energy sold its interest in Maine Energy to Casella.
The waste-to-energy incinerators are required to file annual financial reports with
the State Planning Office. In Table 8, the revenues per ton from electric revenues and
from all other sources (which includes tipping fees and sales of recovered materials, such
as metals) are summarized. Note that the 1995 data is missing one plant and therefore is
not comparable to other years. In particular, the apparent increase in electric revenue per
ton in 1995 is due to omitted data. In the early 1990s, tip fees at incinerators increased
57

substantially as it became clear that the early contracts for incineration were too
optimistic. This is reflected in the 30% increase in other revenue per ton between 1992
and 1996. The renegotiation of electric contracts is reflected in the decline in electric
revenues per ton after 1998. The renegotiation of electric contracts had only a small
impact on tipping fees, because most of the reduction in electric revenue was offset by
reductions in debt service. However, part of the renegotiation for some incinerators did
involve trading lower electric prices (and hence higher tipping fees) in early years for
higher electric prices (and hence lower tipping fees) in later years. That is, there were
elements of rate stabilization for both electric rates and tipping fees implicit in the
renegotiated contracts. Part of the increases in recent years reflects this rate stabilization.
Table 8
Summary of Waste-to-Energy Plant Revenues 1992-2001
($/ton)
Other Electric Revenue Revenue
Year per Ton per Ton
1992 $38.86 $82.90 1993 $43.02 $70.32 1994 $47.56 $71.15 1995 $45.32 $81.91 1996 $51.50 $56.99 1997 $51.82 $48.39 1998 $57.82 $52.48 1999 $57.58 $48.26 2000 $54.41 $47.37 2001 $59.84 $43.10
Note: 1995 data is incomplete, as data is missing for one firm.
Source: Derived from annual reports filed with State Planning Office.
58

Landfills. Maine has two commercial landfills, seven municipal landfills for
MSW, two municipally-owned special waste (ash) disposal landfills, 24 municipal CDD
disposal sites, and 6 commercial CDD disposal sites (see Tables 9 and 10).
Pine Tree Landfill (PTL), a commercial landfill in Hampden that predates the ban
on new commercial facilities, has been used for ash, FEPR, CDD, and incinerator non-
processibles. Pine Tree Landfill has recently received permission to expand the landfill
capacity by 3.1 million cubic yards. Under the expansion license, PTL may take MSW
only from Maine’s four incinerators. This may consist of MSW bypassed from PERC or
MERC under municipal contract; or MSW from an entity with an interruptible contract
with PERC, or work deliveries in excess of processing capacity from any of the
incinerators. The amount of MSW that PTL may take from MERC is currently capped at
310,000 tons. (Litigation with the Town of Hampden that had delayed final action on the
expansion has now ended.) Because of the physical limitations at the site, this expansion
is expected to be the last major expansion of the Pine Tree Landfill. PTL is owned by
Casella, the sixth largest U.S. waste management firm, with operations in New England
and New York.
The Crossroads Landfill, in Norridgewock, is also a commercial facility that was
licensed prior to the current ban on new commercial waste facilities. Crossroads accepts
MSW, CDD, FEPR and special waste, including incinerator ash. A 4,000,000 cubic yard
expansion of the Crossroads facility was recently approved. Crossroads Is owned by
WMI, the largest waste management company in the U.S.
59

Table 9
Landfills for MSW and Ash Disposal in Maine
Location Licensee Permit year Capacity Life Municipal landfills Augusta City of Augusta 1991 586,000 CY 6 yrs. Bath City of Bath 1982 11-20 yrs Brunswick Town of Brunswick 1983, 1991 1,055,000 CY 20 yrs. Fort Fairfield Tri-Community Landfill 1995 1,176,000 CY 18-26yrs. Moosehead Town of Greenville 1985, 1995 72,800 CY 40 yrs. Junction Twp. Presque Isle City of Presque Isle 1981, 1994 682,650 CY 30 yrs. West Forks Caratunk, Forks, 1989, 1997 38,000 CY 40 yrs. West Forks Commercial Landfills Hampden Pine Tree Landfill 1998 3,300,000 CY 15-20 yrs. Norridgewock Waste Management Disposal 1985, 1995 4,410,000 CY 10 yrs. Services of Maine, Inc. Municipal Special Waste (Ash) Landfills Lewiston City of Lewiston 1989 801,800 CY 11 yrs. Scarborough Regional Waste Systems 1986 755,000 CY 9 yrs. Source: Maine Department of Environmental Protection website The legislation that banned new commercial waste disposal facilities also
specified limits on expansion of the existing commercial landfills. The two landfills are
allowed to expand onto contiguous land that was owned prior to December 31, 1989, if
that land is suitable for landfill space. One option that could increase future landfill
capacity in Maine would be to modify the exemption to expand the two existing
commercial landfills to include adjacent property acquired within some period after 1989.
Both facilities apparently own land that might qualify as adjacent but purchased after
1989. The general assessment is that such expansion is likely to be more feasible at
Crossroads than at PTL.
60

Two municipal landfills are used for ash disposal. RWS has a landfill in
Scarborough for its own ash needs This facility is the subject of a currently pending
application for expansion which, if approved, would add 1.4 million cubic yards of
capacity. The Lewiston landfill is licensed for MSW, CDD, and special waste. It is
currently used to dispose of ash from MMWAC and for CDD/bulky waste. Under the
contract between MMWAC and Lewiston, Lewiston sends its MSW to MMWAC.
(Lewiston is not a member of MMWAC.)
Seven additional municipal landfills accept MSW. Six of these the facilities in
Bath, in Brunswick, at Hatch Hill in Augusta, in Presque Isle, in West Forks, and
Greenville’s facility in Moose Township, are located at sites where municipalities had
operated older landfills. One, the Tri-Community Landfill, is a new facility that opened
in 1995.
61

Table 10 CDD Disposal Sites
Location Licensee Permit year Capacity Life Municipal CDD Sites Baileyville Town of Baileyville 1996 155,428 CY 40-117 yrs. Blue Hill Town of Blue Hill 1984, 1994 11 yrs. Brewer City of Brewer 1994 100,000 CY 5 yrs. Brunswick Town of Brunswick 1984 (Expired, Applying) Corinna Mid-Maine Solid Waste Ass’n. 1989, 1996 30 yrs. Corinth Central Penobscot Solid Waste1995 130,060 CY 84 yrs. Dover-Foxcroft Town of Dover-Foxcroft 1995 80,000 CY 20-25 yrs. Freeport Town of Freeport Schedule of Compliance 2 –3 yrs. Glenburn Town of Glenburn 1973, 1993 16,500 CY Greenbush Town of Greenbush 1995 30,445 CY 47 yrs. Kittery Town of Kittery 1992 Limestone Loring Development Auth. 1999 36,000 TONS 18 mths. Marion Twp. Marion Transfer Station, Inc. 1999 120,000 CY 20 yrs. Mechanic Falls Town of Mechanic Falls 1992 61,000 CY 41 yrs. Norway Norway-Paris Solid Waste 1992 Oakland Town of Oakland 1994 257,000 CY 43 yrs. Old Town City of Old Town 1990, Renewal Pending Orono Town of Orono 1995 110,600 CY 30.2 yrs. Rangeley Town of Rangeley Renewal Pending Camden/Rockport Mid-Coast Solid (license decision pending)
Waste Corp. Waldoboro Town of Waldoboro Renewal Pending Yarmouth Town of Yarmouth (application pending) Kittery Town of Kittery 1994 Milo Penquis Solid Waste Corp. 1999 79,000 CY 20 yrs. Source: Maine Department of Environmental Protection website
The Tri-Community landfill is a quasi-municipal entity established by an interlocal
agreement between Caribou, Fort Fairfield, and Limestone. It serves an additional 35
communities in northern Maine. Tri-Community is licensed to accept some special
waste, such as contaminated soil and sand blast sand. Although not currently licensed to
accept incinerator ash, it could probably be licensed for that disposal if some operational
changes were made.
62

Maine has 24 municipal CDD sites; currently, no commercial CDD sites are in
operation1 (see Table 10). Virtually all of these sites are less than six acres in size.
Municipal CDD landfills under six acres are subject to less stringent regulatory standards
than larger CDD sites or MSW sites. As CDD options have diminished and CDD/bulky
goods waste streams grow, municipalities have opened new CDD landfills. It seems
likely that additional municipal and perhaps commercial CDD sites will be constructed in
the future.
Collection and hauling
The collection and hauling of MSW and related waste streams includes several
somewhat distinct services, including private curbside collection, municipal and
municipally-contracted curbside collection, commercial canister (dumpster) collection,
compactor service, roll-on/roll-off service, hauling from transfer stations to disposal sites,
and hauling of ash/FEPR/incinerator overflow. Because many small firms are involved
in this industry, collection and hauling cannot be delineated as completely as disposal. It
is probably impossible to assemble an authoritative list of who is engaged in collection
and hauling of MSW and CDD at any given point in time. While a state license is
required to transport MSW, that license is so broad that many firms not involved in
hauling MSW or CDD for hire are licensed.
Collection and hauling market participants. This sector is relatively diverse, and
includes both a large number of small firms and a few large entities. The available data
indicates that the two largest firms in collection and hauling are Casella and WMI and
suggests 50%-65% as a reasonable estimate for their share of MSW collection in most
1 Per conversation with Paula Clark, Director, Division of Solid Waste Management, Department of Environmental Protection.
63

areas of Maine. There are some regional differences in the relative shares of these two
firms and also in the market share of smaller participants.
Private curbside collection involves a large number of firms, many very small.
Particularly in areas without municipally-supplied curbside collection, many small
owner-operators collect small volumes of trash and haul it to a transfer station. Because
the scale of operation is so small, entry and exit is common. It is not possible to identify
all those serving this part of the market.
Municipal reports provide data on firms that contract to provide municipal
curbside collection. Of Maine’s population, 30% lives in communities with curbside
collection by private firms under municipal contract and another 16% lives in
communities where municipal employees provide curbside collection. Table 11 presents
data derived from municipal reports submitted to the State Planning Office for 2000. In
Table 11, the populations of the towns are used as a proxy for the volume of MSW
collected. The first column in Table 11 expresses each company’s share as a percent of
all contracts for municipal collection; the second column expresses each company’s share
as a percent of total population served by curbside pickup, including collection by
municipal employees.
64
Table 11
Population Weighted Shares of Municipal Curbside Collection Contracts 2000
% of % of Contracted Total
Company Collection Collection Casella 46% 30% WMI 9% 6% BBI Waste 7% 5% Bestway Disposal 6% 4% Griffin 6% 4% Archie’s 5% 3% Herrick 5% 3% Others (14) 16% 10%
Municipal --- 34% Total 100% 100%
Source: Calculations by authors from municipal annual reports submitted to the State
Planning Office . Percentages based upon populations of towns served The owners of Maine’s two commercial landfills, Casella and WMI, together
provide over half the curbside collection contracted by municipalities, or slightly more
than one-third of total collection (when municipal employee collection is included).
There are five additional firms with at least 5% of municipal contract collection and 14
smaller firms. Until recently, WMI did not serve eastern Maine and thus did not compete
for municipal curbside collection there. Casella accounts for slightly over 50% of
municipal contracted curbside collection in eastern and northern Maine.
Firms providing small commercial container service require investments in
containers and collection trucks. The minimum investment is above that required for
simple curbside collection. While there are fewer participants in the commercial
container business, it is still possible for a relatively small firm to enter with a few
containers and a back-loading truck, which might also be used in curbside collection.
65

There is no centralized data on this sector, and direct survey of the participants is likely to
be seriously biased by non-response, particularly from smaller firms (who may not even
be identified).
We did attempt to obtain data from disposal sites on volumes delivered by
individual commercial haulers. This approach has some inherent limitations, because not
all loads of commercial waste delivered to disposal sites are billed to the hauler. For
example, some towns are billed for disposal of commercial waste from their
communities. In other cases, the generating firm may be billed directly. Large
institutions like hospitals often negotiate disposal contracts directly and then seek
separate bids for hauling. And material delivered to transfer stations cannot be captured
from disposal site information.
Despite these inherent limitations, data from the disposal sites is the only feasible
way to assess the hauling market. We asked the four incinerators and the Crossroads
landfill to provide any available data on deliveries of commercial MSW. (PTL did not
accept MSW at that time.) RWS and MMWAC responded. Some data from a one-time
survey at Tri-Community Landfill was also available. Casella and PERC indicated that
their accounting systems did not allow them to generate such information. WMI did not
provide data.
Data submitted by RWS appears in Table 12. The RWS data show that in its
fiscal year 1992- 93, there was one large hauler (the old WMI, with nearly a 40% share)
and an additional six firms with at least a 5% share. By 2000- 01, three firms, WMI, Pine
Tree (Casella), and Troiano, account for virtually all the commercial waste disposed at
RWS. This concentration has occurred largely because of mergers, such as Casella’s
66

acquisitions of Pine Tree, Enviropac and Yarmouth Rubbish Removal, United’s
acquisition of Harris, and WMI’s subsequent acquisition of United Waste. One
independent, Troiano, has substantially increased its share of deliveries to RWS during
this period.
MMWAC reported that for its 2001 fiscal year, Casella and WMI accounted for
76% of the waste hauled to its facility by commercial haulers.
The 2000 Legislative Task Force asked the State Planning Office to work with
Tri-Community landfill to obtain data on deliveries for a period in 2000. The results of
that sampling are reported in Table 13. Boyds, a Casella unit, delivers all waste from
Houlton to Tri-Community under a contract with the town. This accounts for about 40%
of the Tri-Community receipts during the sample period. Outside of Houlton, no single
firm has a large share of Tri-Community area waste.
New entry in collection and hauling. Because there are no unique licensing
requirements for firms that enter commercial collection and hauling, new entrants are not
easily identified. Entry at a very small scale is possible, such as a single small truck that
collects curbside. Existing trucking firms can readily enter services such as roll-on/roll-
off or hauling for transfer stations as a sideline to other trucking businesses. The assets
involved in collection and hauling are easily moved to other locations or sold for other
uses, so exit from a market is also easy. This makes it very difficult to identify exactly
who is active in collection and hauling.
67

Table 12 RWS Hauler Shares FY 92/93 to FY 00/01
92/93 93/94 94/95 95/96 96/97 97/98 98/99 99/00 00/01
% of total
% of total
% of total
% of total
% of total
% of total
% of total
% of total
% of total
Astro 11.35% 12.05% 13.24% 8.93% 10.34% 10.29% 5.43% 0.00% 0.00%BFI 2.40% 3.16% 6.98% 7.50% 4.27% 3.45% 0.00% 0.00% 0.00%Carey 5.26% 4.84% 4.72% 1.21% 1.94% 1.49% 1.56% 0.65% 0.42%Coadco 0.00% 0.00% 0.00% 1.14% 1.19% 0.58% 0.00% 0.00% 0.00%Enviropac 8.91% 9.72% 5.38% 3.75% 14.65% 13.24% 0.00% 0.00% 0.00%Harris 6.58% 6.01% 6.45% 0.00% 0.00% 0.00% 0.00% 0.00% 0.00%United Waste 0.00% 0.00% 0.00% 9.64% 11.09% 7.78% 1.56% 0.00% 0.00%Herrick 2.19% 2.04% 1.73% 0.76% 1.70% 1.52% 1.12% 1.94% 3.36%McCormick 0.81% 0.80% 0.90% 1.13% 0.61% 0.49% 0.51% 0.51% 0.53%Pine Tree 0.00% 0.00% 0.00% 0.00% 0.00% 8.57% 24.23% 28.84% 23.64%WMI 38.99% 36.54% 38.31% 45.53% 25.67% 25.59% 37.19% 39.80% 35.24%Troiano Waste 13.46% 16.13% 17.97% 16.17% 21.24% 20.77% 24.48% 28.01% 36.82%Yarmouth Rubbish 10.04% 8.71% 4.31% 4.24% 7.30% 6.24% 3.93% 0.26% 0.00% 100.00 100.00 100.00 100.00 100.00 100.00 100.00 100.00 100.00 Source: Provided by RWS.
68

Table 13
Commercial Deliveries to Tri-Community Landfill 2000 (partial year)
Hauler Share (%) Adams 7 Bob’s <1 Boyd’s (Casella) 41 Bouchard 3 Brooker 1 City Sanitation 5 Crown of Maine 8 Deschaine 2 Gary’s Sanitation 1 Gil’s Sanitation 1 Landeen 2 Maple Grove 5 McNeal’s 10 Saucier 6 Searles 2 Star City <1 Residential 6
Source: Maine Legislature Task Force, 2000, Appendix D.
We invited the largest disposal sites to identify firms that they believed to be new
entrants within the last five years. Data submitted by RWS did not indicate new entry in
the past five years (see Table 12). Casella responded to our request with a list of 26
firms. (PERC also identified a few of the entrants identified by Casella.) Table 14 lists
nine firms for whom we verified entry had occurred since 1990. (Of the remaining 16
identified by Casella, five had been in business prior to 1990, two did not handle solid
waste, and nine we were unable to contact.)
The level of entry into the industry is consistent with our earlier conclusion that
financial and technical barriers to entry are low. The type of entry is varied. Some firms
69

have entered the full range of collection and hauling services. Some firms have entered
only the curbside and container business. As suggested in the economic analysis, entry
by construction firms into roll-on/roll-off and hauling from transfer stations seems
relatively easy.
There seems to have been significant interest in entry into the greater Bangor and
eastern Maine areas in recent years. In addition to the entrants in Table 14, Waste
Management has extended its service territory into eastern Maine, where it had not
previously operated. The consent decree with Casella, which places limits on the use of
restrictive customer contracts by Casella (see below), makes it easier for new entrants to
secure customers in eastern Maine. Moreover, in 2001, Casella sold its interests in PERC
and thus ended Casella’s strong vertical integration in eastern Maine. These significant
changes in market conditions may have generated increased interest in entry in eastern
Maine.
Vertical integration of disposal and hauling. Vertical integration has been an
important development in the waste management industry in Maine. The owners of
Maine’s only two commercial landfills, Casella and WMI, are also the two largest firms
in collection and hauling, by a significant margin. Casella now owns Maine Energy and
had a financial interest in PERC during 1999-2001. These two firms also have a strong
market presence in other New England states. This increasing vertical and horizontal
integration is typical of changes in the national waste management industry.
70

Table 14 New Entrants in Hauling and Collection
1990-2001
Entrant Business location Year entered Services
Evergreen Bangor, 2000 Curbside, container, Old Town area roll-on/roll-off
Griffin’s Disposal Bangor, Orono unknown Curbside, container area Northern Waste and Penobscot County 1996 Curbside, container, Recycling Services and unorganized roll-on/roll-off territories DM&J Eastern Maine 1995 Roll-on/roll-off,
transfer Mark Wright Hancock, 2000 Container, Construction Washington Counties roll-on/roll-off John Goodwin Mount Desert 2002 Roll-on/roll-off All Mighty Waste Auburn 1994 Curbside, container, roll-on/roll-off,
transfer
Black Bear Waste Augusta south 2000 Roll-on/roll-off (Plans to enter
curbside, container)
Johnson Trash Knox County 1990 Curbside, container, Removal roll-on/roll-off,
transfer
Source: Compiled as part of study.
71
Table 15
Casella Waste Hauling Acquisitions 1996-present
Company Year Acquired Bangor/Coastal Area Sawyer 1996 BFI 1996 Ray’s Trucking 1996 Jordan Trucking 1997 Coastal Disposal 1997 Pinkerton Disposal 1999 Penway Waste 1998 Ted’s Rubbish 1999 Bickford Disposal 1998 Houlton Area Boyd’s Sanitation 1998 Andino’s 1998 Spellman’s Trucking 1998 White Knight 1998 Augusta/Waterville area Capitol City Transfer 1999 Larry Choate 1999 Charriers Disposal 2000 Southern Maine Pine Tree Waste 1997 Enviropac 1996 T & R Associates 1997 Yarmouth Rubbish Removal 1999 D & E Sanitation 1997 Welton’s Waste 2000 Source: Casella reply to Task Force, Maine Legislature 2000, Appendix B.
72

Casella’s acquisitions in the late 1990s led to involvement in some related waste
material processing activities, such as tire processing. In 2001, however, Casella
announced divestiture plans that focused its activities more narrowly on solid waste
disposal, waste collection and hauling, and recycling activities directly connected to
disposal. Casella’s decision to sell its interest in PERC in 2001 was especially notable
because it reversed the trend towards greater vertical integration. Casella’s recent
application to accept MSW at PTL, which was granted in part, may be seen as an effort to
restore its vertical integration in eastern Maine.
WMI is also vertically integrated in Maine and in nearby New England states. It
operates the Crossroads disposal site in Maine and a number of disposal sites in New
Hampshire and Massachusetts. WMI is a much larger, international company and is
involved in a broader range of waste services, including handling hazardous wastes.
WMI also owns a controlling interest in Wheelabrator Sherman, an electric power plant
in Sherman that is fueled by wood waste and wood chips.
Mergers and Acquisitions. Mergers and acquisitions have been largely
responsible for the horizontal concentration and vertical integration in this industry in the
1990s. Both Casella and WMI entered Maine through mergers and acquisitions, and both
have expanded their initial activities through additional mergers and acquisitions. Table
15 presents Casella acquisitions in waste collection and hauling since its entry into the
state in 1996. Note that information upon which this table relies (Maine Legislature,
2000) does not reflect merger activity by firms acquired by Casella before they were
acquired. For example, BFI had acquired Grant’s, an independent in the Bangor area,
prior to Casella’s acquisition of BFI assets in Maine. Similarly, the Task Force
73

information does not reflect mergers by the “old” WMI, prior to its acquisition by USA
Waste in 1998. (Because USA Waste chose to assume the name of the acquired Waste
Management, some confusion can arise when discussing the corporate history of WMI.)
For example, the “old” WMI became the owner of the Crossroads landfill through the
acquisition of Consolidated Waste Services (CWS). These earlier mergers are difficult to
track, because some of the acquisitions involved non-publicly traded corporations and
because large firms like WMI do not identify smaller acquisitions in financial documents.
The merger activity in Maine parallels national merger activity, which was
discussed earlier. The vertical and horizontal integration by WMI and Casella are not
remarkable in the national context. Nor is the decision by another national firm, BFI, to
exit Maine’s market after some initial acquisitions unusual. The firms involved in the
consolidation of the national waste industry frequently dispose of assets in markets where
they are unable to establish a strong, vertically integrated market position.
Pricing in Maine’s municipal waste markets
This study was motivated in part by concerns that Maine’s municipalities and
businesses may face higher costs and fewer options for waste management services. This
section gathers information on the recent history of disposal fees at Maine’s MSW
disposal sites. The study also conducted a stratified random sample of municipalities to
gather information on municipal waste management costs. Finally, some comparative
national data was gathered.
The study did not gather information on pricing for commercial collection and
hauling services. Because these contracts are individually priced, this price data is very
difficult to gather. Direct surveys of commercial customers could be conducted, but low
74

response rates, especially when historical data is sought, make direct surveys unattractive.
This is unfortunate, because competition in commercial collection is certainly an
important issue.
Disposal Fees. Tables 16 to 24 present disposal fee information for most Maine
MSW disposal sites. Table 16 presents RWS tipping fees for commercial waste, waste
from corporate towns (members of RWS) and associate towns (non-members) for 1979 to
the present. The “assessments” to RWS communities cover the difference between total
facility costs and tipping fee revenues. Table 17 presents gate fees for MSW, CDD, and
special waste at WMI’s Crossroads Landfill for selected years between 1990 and 2001.
Because these are gate rates, they probably overstate average prices paid for disposal.
Table 18 presents Tri-Community’s MSW fees since 1995, when the current secure
landfill was opened. Table 19 presents tipping fees for MSW and CDD at the Bath
landfill for 1988 to the present. Table 20 presents the tipping fee structure at the Hatch
Hill Solid Waste Facility in Augusta for 1987 to the present.
Table 21 presents tipping fees at MMWAC for member communities, for
commercial firms from member communities, and for commercial waste from non-
member towns for 1995 to the present. Recall that Lewiston’s waste enters MMWAC
under a special contract that also covers ash disposal at Lewiston’s landfill. The
MMWAC member fees do not include debt payments on its $43 million investment nor
any MMWAC distributions back to members. In 2001, the debt service payments of
members totaled $4.4 million, while members received distributions back of $403,000.
The distribution in 2001 was the exception rather than the historical rule for MMWAC.
75

The debt service is nearly $60 per ton of annual plant capacity, which probably gives the
plant the highest per ton disposal costs in the state.
Table 22 presents PERC’s average tipping fees for 1992 to 2001 for MSW from
MRC charter communities and for in-state and out-of-state spot markets. The first
column represents PERC’s computed charges to member communities, not including the
performance credit. The second column represents the MRC’s effective rate to Equity
Charter communities after the performance credit and after the effect of asset
management by the MRC. The performance credit became effective in 1994. (The
difference between PERC and MRC figures for 1992 and 1993 represent minor
computational differences only.) The MRC asset management program began with the
1998 financial restructuring of PERC. The Bangor Hydro payments became part of the
asset management program in 2000. For New Charter members, who joined after July 1,
2000, the rate is 120% of the Equity Charter rate ($54/ton in 2001). The MRC net rate
also does not include the MRC membership fee, which was $1.25/ton for 2001.
76

Table 16
Regional Waste Systems Tipping Fees and Assessments 1979-2002
($/ton)
Tip Fees & Assessments Fiscal Effective Commercial Corporate Associate Year Date Tip Fees Tip Fees Assessment Total Tip Fees
78/79 7/1/78 $ 8.60 $ - $ 8.60 $ 8.60 n/a 79/80 7/1/79 $ 9.75 $ - $ 9.75 $ 9.75 n/a 80/81 7/1/80 $ 11.75 $ - $ 11.75 $ 11.75 n/a 81/82 7/1/81 $ 14.00 $ - $ 14.00 $ 14.00 n/a 82/83 7/1/82 $ 15.00 $ - $ 14.00 $ 14.00 n/a 83/84 7/1/83 $ 15.80 $ - $ 14.00 $ 14.00 n/a 84/85 7/1/84 $ 16.80 $ - $ 14.00 $ 14.00 n/a 85/86 7/1/85 $ 17.80 $ - $ 16.00 $ 16.00 n/a 86/87 7/1/86 $ 26.00 $ - $ 16.00 $ 16.00 n/a 87/88 7/1/87 $ 31.60 $ - $ 16.00 $ 16.00 n/a 88/89 7/1/88 $ 40.00 $ - $ 25.00 $ 25.00 n/a 89/90 7/1/89 $ 48.00 $ - $ 31.00 $ 31.00 n/a 90/91 7/1/90 $ 58.00 $ - $ 40.00 $ 40.00 $ 48.00 91/92 7/1/91 $ 58.00 $ - $ 40.00 $ 40.00 $ 48.00 92/93 7/1/92 $ 61.00 $ - $ 43.00 $ 43.00 $ 51.60 93/94 7/1/93 $ 68.00 $ - $ 50.00 $ 50.00 $ 60.00 94/95 7/1/94 $ 68.00 $ - $ 55.00 $ 55.00 $ 66.00
2/1/95 $ 55.00 $ - $ 55.00 $ 55.00 $ 66.00 95/96 7/1/95 $ 55.00 $ - $ 85.00 $ 85.00 $ 85.00
5/1/96 $ 40.00 $ 40.00 $ 55.00 $ 95.00 $ 85.00 96/97 7/1/96 $ 40.00 $ 40.00 $ 55.00 $ 95.00 $ 85.00
6/15/97 $ 43.00 $ 43.00 $ 52.00 $ 95.00 $ 85.00 97/98 7/1/97 $ 43.00 $ 43.00 $ 52.00 $ 95.00 $ 85.00
9/15/97 $ 49.00 $ 49.00 $ 46.00 $ 95.00 $ 85.00 98/99 7/1/98 $ 49.00 $ 49.00 $ 46.00 $ 95.00 $ 85.00
10/5/98 $ 53.00 $ 53.00 $ 42.00 $ 95.00 $ 85.00 99/00 7/1/99 $ 60.00 $ 60.00 $ 25.00 $ 85.00 $ 85.00
3/13/00 $ 69.00 $ 69.00 $ 16.00 $ 85.00 $ 85.00 00/01 7/1/00 $ 74.00 $ 74.00 $ 24.00 $ 98.00 $ 98.00 or 117.60 01/02 7/1/01 $ 80.00 $ 80.00 $ 22.00 $ 102.00 $ 101.04, 102.00, 122.40
Source: Supplied by RWS.
77

Table 17
Crossroads Landfill (WMI) Gate Fees 1990-2001 (selected years)
($/ton)
Year MSW CDD Special Waste
1990 $55.00 $57.50 $50.00
1992 $57.50 $62.00 $55.00
1995 $60.00 $65.00 $55.00
1998 $62.50 $67.50 $55.00
2001 $66.50 $71.50 $60.00
Source: Supplied by WMI.
Table 18
Tri-Community Landfill Tipping Fees 1995-2001
($/ton)
Effective date Tipping fee 1995 $64.18 1999 $58.00
Source: Supplied by Tri-Community Landfill.
Table 19 Bath Landfill Disposal Fees
1992-2002 ($/ton)
Tipping fees
Effective date MSW CDD 1988 $20.00 $20.00 1990 $36.00 $36.00 1992 $48.00 $48.00 1994 $46.00 $46.00 2000 $60.00 $50.00
Source: Supplied by Town of Bath.
78

Table 20 Hatch Hill Solid Waste Facility Tipping Fees
1987-2002 ($/ton)
Effective date Material Tipping Fee
January 1987 All $15.00 January 1989 All $30.00 July 1989 All $45.00 August 1991 MSW $55.00 Recyclables $35.00 Tires $90.00 July 1994 MSW $58.00 Recyclables $35.00 Tires $90.00 July 1995 MSW $58.00 Residential recyclables $25.00 Recyclable wood
and asphalt $40.00 Tires $90.00 July 2001 MSW $58.00 Residential recyclables $25.00 Recyclable wood
and asphalt $45.00 Tires $90.00
Source: Supplied by Public Works Department, City of Augusta.
79

Table 21
MMWAC Tipping Fees 1995-2002
($/ton)
Member Member Non-member Year MSW Commercial Commercial
FY95 $80.00 $80.00 $38.00 FY96 $55.00 $48.00 $44.00 FY97 $52.00 $48.00 $50.00 FY98 $42.00 $48.00 $55.00 FY99 $39.00 $48.00 $62.50 FY00 $35.00 $48.00 $62.50 FY01 $31.50 $48.00 $65.00 FY02 $30.00 $48.00 $68.25
Note: Member MSW fee excludes debt service.
Source: Supplied by MMWAC. Fiscal years are 7/1-6/30.
Table 22
PERC Disposal Fees 1992-2001
($/ton)
Year Municipal MRC Spot Spot Charter Net Maine Other States 1992 $22.79 $22.52 $34.47 $17.35 1993 $34.97 $35.01 $38.51 $17.87 1994 $41.13 $38.76 $43.23 $25.03 1995 $45.50 $37.52 $47.42 $25.00 1996 $47.02 $43.81 $52.05 $25.36 1997 $49.18 $43.32 $50.75 $21.45 1998 $52.52 $41.02 $48.20 $25.01 1999 $56.13 $45.00 $61.62 $28.89 2000 $56.93 $45.00 $61.95 $31.96 2001 $56.37 $45.00 $62.02 $27.14
Source: Supplied by PERC. MRC net supplied by MRC.
80

Table 23
Pine Tree Landfill Disposal Fees 1996-2001
($/ton)
Maine Maine PERC PERC PERC Energy Energy C&D C&D Year Ash FEPR NP FEPR NP (local) (long-haul) 1996 $58.40 $36.03 $36.03 n/a n/a $65.00 n/a 1997 $59.62 $37.10 $37.10 $18.00 $18.00 $82.00 n/a 1998 $58.82 $38.36 $38.36 $18.00 $18.00 $82.00 n/a 1999 $60.26 $42.00 $42.00 $48.50 $48.50 $92.00 n/a 2000 $60.51 $34.00 $39.00 $45.50 $45.50 $85-$100 $40-$50 2001 $60.51 $34.00 $39.00 $45.50 $45.50 $85-$100 $42-$52 NP: non-processibles Fees for Ash, FEPR, and NP include transportation and state fee. Source: Supplied by Casella. Fiscal year data.
Table 24
Maine Energy Tipping Fees 1995-2001
($/ton)
Long-term Short-term Year Municipal Municipal Commercial Spot 1995 $41.66 $37.41 $39.88 $33.77 1996 $38.30 $38.87 $37.82 $35.32 1997 $34.77 $39.63 $42.18 $34.88 1998 $34.82 $40.14 $43.51 $39.93 1999 $41.61 $43.64 $51.58 $51.24 2000 $41.71 $55.21 $67.65 $60.51 2001 $50.59 $55.26 $54.45 $45.30 Source: Supplied by Casella.
81

Table 23 presents Pine Tree Landfill fees for ash, FEPR, incinerator non-
processibles, and CDD for 1996 to 2001. Note that the fees for Maine Energy and PERC
disposal at PTL include transportation and a state fee. Casella indicated that the increase
in FEPR and non-processible fees for Maine Energy in 1998 occurred when these
materials stopped being used to shape closed landfills. Table 24 presents Maine Energy’s
tipping fees for municipal waste, commercial waste, and spot markets for 1995-2001.
Brunswick reported that the tipping fee at its landfill went from $38.00/ton to
$44.00/ton in 1993 and has remained at $44.00 since. Presque Isle reported that the
current commercial tipping fee at its facility is $40.00 per ton. There are no tipping fees
at the two smallest landfills, which are the Greenville and the West Forks facilities.
These two facilities are financed directly from tax revenues.
Survey of Municipalities. This study mailed surveys to 65 towns to obtain
information on municipal waste management costs in 1996 and 2001. The survey
instrument is presented in Appendix A. A stratified random sample was drawn from a
list of towns and disposal districts that reported municipal waste management
information to the State Planning Office in 2001. (A town that belonged to a waste
disposal district was not directly sampled.) The sample design intentionally over-
sampled towns with curbside collection under municipal contract to obtain better
information on those contracts. Approximately half the sample had curbside municipal
collection under a contract with a commercial hauler. Of the surveys mailed, 46 (71%)
were returned. A list of the 46 towns in the final sample appears in Appendix B.
Table 25 reports the results of that survey for the following cost categories:
curbside collection contracts; per-ton disposal fees for MSW, CDD and tires; and
82
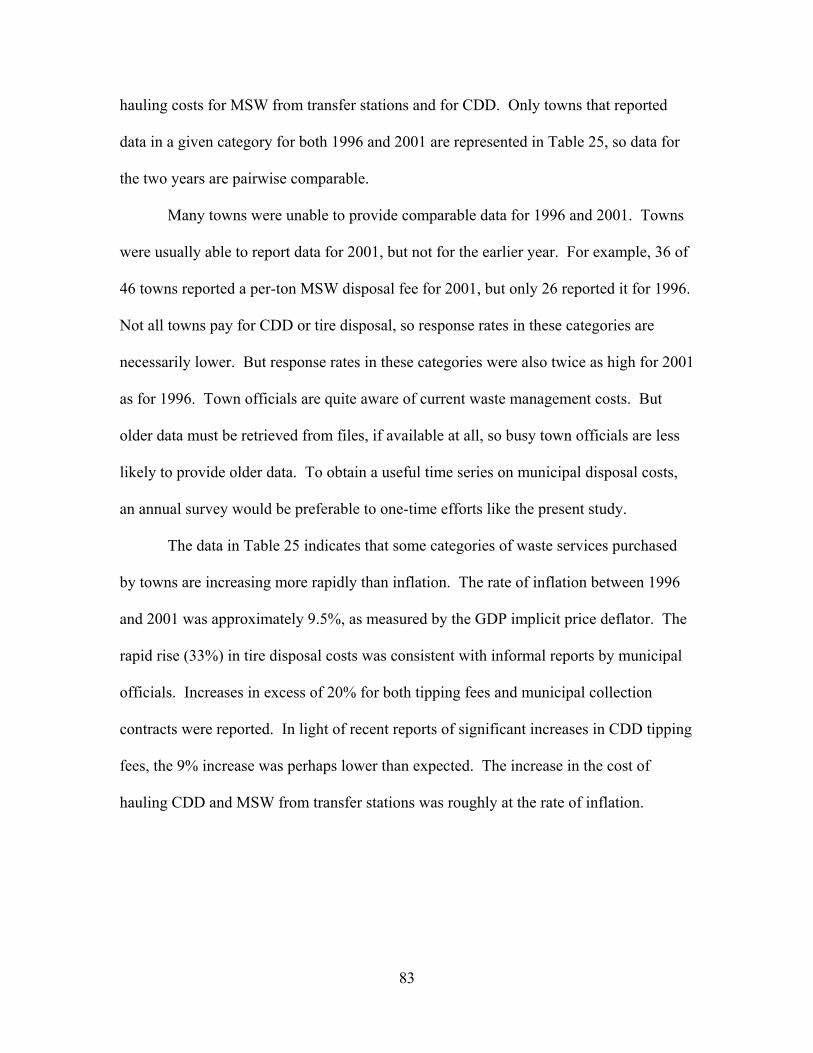
hauling costs for MSW from transfer stations and for CDD. Only towns that reported
data in a given category for both 1996 and 2001 are represented in Table 25, so data for
the two years are pairwise comparable.
Many towns were unable to provide comparable data for 1996 and 2001. Towns
were usually able to report data for 2001, but not for the earlier year. For example, 36 of
46 towns reported a per-ton MSW disposal fee for 2001, but only 26 reported it for 1996.
Not all towns pay for CDD or tire disposal, so response rates in these categories are
necessarily lower. But response rates in these categories were also twice as high for 2001
as for 1996. Town officials are quite aware of current waste management costs. But
older data must be retrieved from files, if available at all, so busy town officials are less
likely to provide older data. To obtain a useful time series on municipal disposal costs,
an annual survey would be preferable to one-time efforts like the present study.
The data in Table 25 indicates that some categories of waste services purchased
by towns are increasing more rapidly than inflation. The rate of inflation between 1996
and 2001 was approximately 9.5%, as measured by the GDP implicit price deflator. The
rapid rise (33%) in tire disposal costs was consistent with informal reports by municipal
officials. Increases in excess of 20% for both tipping fees and municipal collection
contracts were reported. In light of recent reports of significant increases in CDD tipping
fees, the 9% increase was perhaps lower than expected. The increase in the cost of
hauling CDD and MSW from transfer stations was roughly at the rate of inflation.
83
Table 25 Municipal Waste Management Costs
1996 and 2001
Number of Expense Category Observations 1996 2001 % change
Collection contract 13 $37,924 $45,864 21% (cost/year) MSW disposal ($/ton) 26 $51.99 $63.47 22% CDD disposal ($/ton) 11 $66.09 $71.82 9% Tire disposal ($/ton) 8 $73.18 $97.66 33% MSW hauling ($/trip) 10 $130.46 $142.54 9% CDD hauling ($/trip) 6 $184.17 $207.48 13%
Source: Survey of municipalities conducted by study. National Comparisons. For comparison, data on disposal costs in Maine and
other states was obtained from two sources: Chartwell’s disposal price index from Solid
Waste Management and Biocycle’s annual nationwide survey. The Chartwell data for
September 2001 is reported in Table 26. The Biocycle data for 1994 and 2000 is reported
in Table 27.
These two surveys rely upon different methodologies and hence are not directly
comparable. The Chartwell index is proprietary and is based upon Chartwell’s ongoing
monitoring of the industry. The Biocycle data is based upon a survey sent to state
agencies in every state. This data therefore reflects estimates by state officials.
The patterns in the two sources are generally similar. Disposal fees in Maine are
generally somewhat below disposal fees in other New England states, although the
84

Biocycle survey reports substantially lower fees in Rhode Island. Both data sources agree
that New England fees are now the highest in the nation and are well above the national
average disposal fees.
The Biocycle data indicate that New England fees increased more rapidly than
those in the rest of the country between 1994 and 2000 and that New England has
replaced the Mid-Atlantic as the most expensive disposal region. Because of incomplete
reporting, Biocycle did not compute regional or national average disposal fees for 2001.
However, Vermont, Massachusetts, New Hampshire, and Maine (in that order) finished
as the top four states with the most expensive landfill fees in the 2001 survey. in that
order. Although fewer states reported incinerator fees in the 2001 survey, New England
fees again lead the nation. Alaska had the highest incinerator fees, with New Hampshire,
Massachusetts, Maine and Connecticut in second through fifth places, respectively.
Rhode Island and Vermont reported no incinerators operating in 2001.
85

Table 26 Chartwell Northeast Region Solid Waste Price Index
September 2001 ($/ton)
State Disposal fee index
Maine $52.81 New Hampshire $63.87 Vermont $57.67 Massachusetts $66.92 Connecticut $61.50 Rhode Island $60.64 New York $60.74 Pennsylvania $52.70 New Jersey $59.48 Maryland $50.39 Delaware $47.06 Northeast region $56.41 U.S. $36.97*
Source: Chartwell, Inc., Solid Waste Digest, Northeast Edition, September 2001. *U.S. average is for October 2001, as cited in Goldstein and Madtes (2001).
86

Table 27 Biocycle Disposal Fees
1994 and 2000 ($/ton)
1994 2000 State/Region Landfill Incinerator Landfill Incinerator Maine $45 $38 $65 $60 New Hampshire $50 $45 $66 $74 Vermont $75 $60 $75 n/a Massachusetts $55 $50 $67 $66 Connecticut $60 $73 n/r $57 Rhode Island $32 n/a $40 n/a Mid-Atlantic $56 -- -- -- New England $48 -- -- -- Great Lakes $33 -- -- -- West $29 -- -- -- South $26 -- -- -- Midwest $24 -- -- -- Rocky Mountain $16 -- -- -- U.S. weighted ave. $31 $47 -- -- n/a indicates not applicable, because state had no facility of indicated type n/r indicates not reported by state -- indicates averages were not computed by survey authors Source: Steuteville (1995), Goldstein and Madtes (2001)
87

Maine Antitrust Enforcement
Like many other states, Maine has enacted a state analog to each of the federal
antitrust laws. Maine possesses a “mini-Sherman Act”, a merger statute, and the Unfair
Trade Practices Act, modeled on the federal FTC Act (10 M.R.S.A. §§1101--1102-A; 5
M.R.S.A. § 207). These state statutes receive the same legal interpretations as their
federal counterparts (Tri-State Rubbish v. Waste Management, Inc., 1993; 5 M.R.S.A. §
207).
Despite limited resources, the Maine Attorney General has played an active role
over the past two decades in enforcing antitrust law in the solid waste industry. In
particular, in 1999 the Attorney General brought a lawsuit challenging the acquisition of
KTI, Inc. by Casella Waste Systems, Inc. (State of Maine v. Casella Waste Systems, Inc.,
1999). Because this case presents a microcosm of the market power problems that are the
focus of this report, and indeed provided some of the impetus for this report, it bears
discussion.
The acquisition enabled Casella to increase its share of Maine’s disposal capacity
and to increase its vertical integration by adding Maine Energy and an interest in PERC.
The Attorney General was concerned by both the horizontal and the vertical market
power implications of the proposed acquisition. The acquisition was eventually
permitted to proceed under the conditions set forth in a consent decree.
The Casella Consent Decree placed three conditions on the proposed acquisition.
First, the Consent Decree restricted Casella’s ability to employ evergreen contracts in
commercial collection and hauling markets in Maine’s nine northern and easternmost
counties, where the merger allowed Casella to increase its already substantial market
88

share. This condition was designed to address horizontal market power concerns. Under
the Consent Decree, Casella’s commercial hauling contracts in the nine affected counties
must permit termination on 30 days notice by mail, fax or email. Such contracts can
exact early termination penalties no greater than the lesser of: $75; twice the current
monthly charge; or twice the average monthly charge incurred under the contract. The
Attorney General hoped this condition would promote new entry and a resurgence of
competition, and there are some indications that it has had the desired effect.
The second and third conditions imposed by the Consent Decree were designed to
address vertical and horizontal market power in northern and eastern hauling and disposal
markets. The Consent Decree required Casella to operate the gate, scalehouse and
disposal area at PERC in a nondiscriminatory fashion—i.e., without favoring its own
hauling operations. The decree also required Casella to let contracts for PERC residue
disposal pursuant to a competitive procurement process. These conditions reflected the
Attorney General’s concern that Casella’s status as a vertically integrated company
combining hauling, incineration, and ash/residue disposal might allow Casella to increase
rivals’ costs and to enhance its profits at the expense of PERC’s municipal partners.
Since the Consent Decree was entered, the Attorney General’s vertical market
concerns with this merger have been mitigated to some degree by Casella’s divestiture of
its interest in PERC. Some vertical concerns persist with Casella’s continuing integration
of the PTL disposal facility (whose license was recently modified) with its hauling
operations. In addition, the Attorney General continues to have serious concerns with
regard to horizontal concentration in commercial collection and hauling markets.
89

Negotiation of the Casella Consent Decree represents the most significant
instance of state antitrust enforcement in this industry in recent years. This was not,
however, an isolated foray but part of an enforcement record that extends over two
decades. Investigations and formal actions have focused on alleged collusion and
monopolization offenses as well as mergers (e.g. State of Maine v. Truck-A-Way System,
1984, market allocation and predatory pricing; State of Maine v. Trainor, 1987,
monopolization; In Re Proposed Merger of Consolidated Waste Services, Inc., and WM
Maine I, Inc., 1990, merger).
90

Chapter 5
Assessing Competition in Maine’s
Waste Management Industry The economic analysis of competition examines three aspects of a market:
structure, conduct and performance. Structure includes the number and relative size of
existing competitors and also the ease or difficulty of entry. Conduct includes business
practices that may reduce competition, such as restrictive contracts. Finally, performance
attributes include prices, range of services available to buyers, and profits in the industry.
Structure is the most fundamental and important issue. In a market without
effective competition, the existing firms will eventually increase prices and profits. In a
market with easy entry of new firms, the existing firms will not be able to raise prices
without attracting new competitors.
Conduct is primarily an issue in markets that fall between the extremes of
completely blocked entry and completely free access. In markets where there are a few
firms and where entry is difficult, but not totally impossible, the existing firms may adopt
formal or informal arrangements to reduce competition among themselves and to increase
the difficulty of new entry. Various kinds of restrictive contracts and predatory behavior
towards new entrants are examples of such conduct.
To evaluate the performance of an industry, economists examine whether prices
are in line with costs, whether prices are rising disproportionately to similar industries,
whether profits are high relative to the rest of the economy, and whether customers are
offered an appropriate range of services. Strong competition among firms results in lower
91

prices, a level of profit just sufficient to cover the cost of capital, and market
responsiveness to the needs of customers.
This chapter will use the information from previous chapters to identify and
assess key issues in the structure, conduct, and performance of Maine’s waste
management industry.
Structure: Disposal Capacity and New Entry in Disposal
A fundamental structural issue in Maine’s waste management industry is limited
disposal capacity in Maine and throughout New England. Maine’s ban on new
commercial waste facilities creates the potential for significant market power for existing
commercial facilities. A crucial component of market competition—the threat of new
commercial entry—is absent. The significance of that ban for competition depends upon
the competition that existing facilities face from the non-commercial disposal facilities
within Maine and from capacity elsewhere in New England and in Canada. Whether
state or municipal governments in Maine will install new disposal capacity to compete
with existing (and declining) commercial capacity is a key question.
There are three somewhat distinct sub-markets for disposal: MSW/FEPR,
CDD/bulky waste/incinerator non-processibles, and incinerator ash. These sub-markets
are created because many facilities process only one of these types of waste. The four
waste-to-energy incinerators process only MSW. The 24 municipal CDD sites handle
only CDD and bulky waste. Most municipal landfills handle only MSW, although they
may also handle CDD, bulky waste, and FEPR (in some cases). The disposal of
incinerator ash is handled at four special waste landfills, which must meet higher
regulatory standards than most municipal landfills currently meet. These markets are
92

interconnected, because three of the four special waste landfills are also licensed to
handle MSW and/or CDD.
New England Alternatives. Disposal in New Hampshire is the primary out-of-
state alternative for Maine’s waste. This is not simply because New Hampshire is the
nearest state; capacity in other New England states is very limited and declining. The
Northeast Waste Management Officials Association assembled data on net
imports/exports of waste for the six New England states and New York (cited in New
Hampshire, 2001, pp. 6-7). Maine and New Hampshire are the only net importers of
waste in this seven state region; the other four New England states and New York are net
exporters. Maine currently sends waste to two sites in New Hampshire: WMI’s Turnkey
landfill in Rochester and Casella’s North Country Environmental Services landfill in
Bethlehem.
New Hampshire depends more heavily upon privately owned disposal facilities
than does Maine (data from New Hampshire, 2001). In addition to the WMI and Casella
landfills, there is a Pulp and Paper Company of America landfill in Berlin. (The Berlin
landfill uses MSW to stabilize mill sludge. American Tissue, the parent of Pulp and
Paper Company of America, has been in bankruptcy proceedings and the Berlin mill has
been idle. The landfill has continued to operate, however.) These three landfills receive
55% of the waste stream. An additional 22% of the waste stream goes to two waste-to-
energy facilities in Claremont and Penacook, which are owned by Wheelabrator, Inc., a
WMI subsidiary.
The State of New Hampshire (New Hampshire, 2001), as part of its
comprehensive assessment of waste management in that state, surveyed disposal sites to
93

obtain a history of disposal fees. Ten of 16 sites responded; the report does not indicate
how this response rate might impact results. The data are reported in Table 28.
Table 28 New Hampshire Disposal Fees
1990-1999 ($/ton)
Gate Municipal Contract Commercial Year rate rate rate rate 1990 $52.00 $52.93 $38.67 $52.67 1991 $52.00 $53.63 $42.21 $52.33 1992 $52.00 $45.82 $41.12 $45.25 1993 $52.00 $47.95 $40.49 $44.87 1994 $52.17 $50.18 $44.71 $46.22 1995 $52.17 $49.97 $48.82 $49.58 1996 $52.17 $51.08 $43.12 $49.10 1997 $52.50 $52.32 $39.82 $50.15 1998 $58.00 $52.73 $39.76 $51.60 1999 $71.38 $59.05 $43.54 $57.50 Source: New Hampshire, 2001.
These fees were generally stable in dollar terms (and therefore decreasing slightly
when inflation is considered) from 1990 to 1997. The gate rate increased substantially in
1998 and 1999. All fees showed increases near 10% between 1998 and 1999.
The State of New Hampshire (New Hampshire, 2001, pp. 5-6) has recently
“crafted a mutually agreed upon permit modification” with WMI to reduce the volume of
waste imported from out-of-state to the Turnkey facility. As a result, total New
Hampshire out-of-state waste receipts fell by about 50% between 1998 and 2000.
The Chartwell and Biocycle data in Tables 26 and 27 clearly show that New
England has the most expensive disposal fees in the country. The Biocycle data indicate
substantial increases in disposal fees in New England in the past five years, which is
94

completely consistent with the data gathered by New Hampshire. With New
Hampshire’s recent action to reduce imports of waste to Turnkey, the pressure on
disposal fees can only increase. Moreover, New Hampshire provides limited competition
for the owners of commercial facilities in Maine, WMI and Casella. Those two firms
also own four of the five commercial disposal sites (two incinerators and three landfills)
in New Hampshire.
In summary, while waste capacity in New Hampshire does create disposal
alternatives in southern Maine, the competitive impact of out-of-state disposal is limited
and declining.
Canadian disposal alternatives. Two landfills in Canada currently accept
municipal solid waste from Maine. The Hemlock Knoll landfill in Lawrence Station
accepts waste from Calais and the Washington County Waste Disposal District, whose
members include Cherryfield, Cutler, Eastport, Baileyville, Princeton, and Whiting. The
COGERNO landfill in Rivière-Verte accepts waste from seven communities in northern
Aroostook County. The availability of disposal capacity in Canada could be an important
factor in the market for disposal in Maine, particularly in eastern and northern Maine.
Six relatively large state-of-the-art landfills operate in New Brunswick. The
Province of New Brunswick mandated the creation of twelve regional solid waste
districts. These districts were drawn along county lines. Landfills are operated by six of
the regional waste commissions. The remaining six districts dispose of waste at the six
landfills operated by other commissions. Part of the construction costs of the landfills
was borne by the province, so fees charged to New Brunswick municipalities are partially
subsidized.
95

The South West Solid Waste Commission opened the Hemlock Knoll landfill in
1997 on a 1000-acre site. It accepts approximately 300 metric tons of municipal solid
waste per day. At current fill rates, the landfill will last approximately 500 years. The
site also includes a construction and wood debris site. The waste district provides a full
range of recycling services, which are funded from tipping fees. Tipping fees for
members are currently $68.90 Canadian/metric ton (approximately US$37/short ton).
The district charges $58.90 Canadian/metric ton for disposal by municipalities that do not
use its recycling services. For construction debris, the rate is $20 Canadian/metric ton.
Construction debris is a relatively minor part of its operations.
The rate charged to Calais and the Washington County Waste Disposal District
reflects the full (unsubsidized costs) of the landfill, but not recycling services. That rate
is currently $80 Canadian/metric ton, or approximately US$43/short ton. Hemlock Knoll
does not have any contracts to accept demolition debris from Washington County.
License restrictions make importation of CDD unattractive for Hemlock Knoll. The
Maine communities entered into 25-year contracts with the South West Solid Waste
Commission in 1997, when the landfill opened. The management of the landfill
indicated that there was an implicit agreement with Calais and the other towns that any
additional towns from Washington County, who were given the option of joining in 1997,
would receive less favorable rates if they decided to contract with Hemlock Knoll at a
later date.
Hemlock Knoll uses some processed (ground-up) construction debris from Maine
in the cover mix for its landfill. Approximately two to three truckloads of this material
are used per day. In the past, Hemlock Knoll has used front-end process residue (FEPR)
96

from PERC as part of its cover material. Provincial permit modifications were granted to
use these materials from Maine.
The provincial regulations that govern Hemlock Knoll currently allow the landfill
to accept U.S.-generated MSW only from Washington County. While these provincial
regulations could conceivably be changed in the future, Hemlock Knoll will likely remain
an alternative only for Washington County municipalities and for some limited
CDD/FEPR for cover material.
The COGERNO facility in Rivière-Verte is operated by the Commission de
gestion enviro ressources du Nord-Ouest. That facility currently accepts MSW from the
Van Buren transfer station, the Upper St. John Valley waste district (St. Francis and St.
John), and the Northern Aroostook waste district (Fort Kent, Frenchville, St. Agatha, and
Madawaska). That material enters at a rate of $70 Canadian/metric ton, or roughly
$US37/short ton. COGERNO has accepted a limited volume of U.S. CDD, but that
waste must go into the secure landfill at the same $70/metric ton rate as MSW.
COGERNO would prefer not to accept U.S. CDD (which takes more space than MSW).
The contracts with Van Buren and the Upper St. John Valley district are three years,
while the Northern Aroostook district contract is for 25 years. However, both sides have
considerable flexibility to end the contracts. The facility currently handles 48,000 metric
tons per year, of which 10,600 metric tons are imported. At current fill rates, the
COGERNO facility has a projected life of 165 years.
The situation at COGERNO with regard to U.S. waste is quite similar to that of
Hemlock Knoll. COGERNO does take some ground-up CDD for cover. Provincial
approval would be necessary to accept U.S. waste from any source other than the current
97

three contracts. Adding additional communities from northern Aroostook County is a
conceivable development; adding substantial volumes from outside Aroostook County
(and even from the larger communities in southern Aroostook County) seems very
unlikely.
Waste disposal commissions in New Brunswick face new provincial guidelines to
reduce the type and volume of wastes that are landfilled. For example, by 2006, the
commissions face guidelines for diversion of most organic materials from landfills.
These new guidelines are still under development, and how exactly they will impact the
landfill operations is not completely known. The South West Solid Waste Commission
already operates a composting facility to divert some organics, and other steps will be
required to meet the 2006 requirement. The two facilities expect that imported waste will
not face exactly the same standards as waste from Canadian sources, but Maine
communities may need to show analogous efforts to reduce waste going into landfills.
Maine, of course, already has recycling standards of its own, so communities already
have taken some steps to reduce disposal tonnage.
For Washington County and northern Aroostook County, disposal at the two
Canadian landfills is a very attractive alternative. Disposal fees are low by Maine
standards and both landfills have very substantial capacity. However, this capacity is
very unlikely to be available to communities elsewhere in Maine, so the competitive
impact of these facilities for the state as a whole is small.
Long-term Municipal Waste-to-energy Commitments. Maine communities were
encouraged by state policy to build waste-to-energy plants or to enter into long-term
contracts with commercial waste-to-energy plants. Several outside forces, including
98

energy policy and federal court decisions, have substantially impacted those long-term
commitments. In general, communities have seen substantially higher disposal costs than
they anticipated when the commitments were made.
Many Maine communities have formed multi-town agreements or non-profit
corporations to operate or to contract with disposal facilities. MMWAC and RWS
operate two of Maine’s waste-to-energy incinerators. Tri-Community and the Caratunk
region both operate landfills. There are also a number of smaller inter-local arrangements
to share a transfer station and perhaps a CDD site, such as the Central Penobscot Solid
Waste Facility and the Marion Transfer Station. Approximately 160 communities are
represented by the Municipal Review Committee in their relationship with PERC.
These various commitments have three important consequences for markets.
First, the MRC, in particular, seems large enough to wield countervailing market power.
Second, some communities are in these markets as both consumers and suppliers. Third,
a large fraction of MSW enters disposal markets through long-term, irreversible
commitments.
The MRC was created precisely because the communities in eastern Maine
wanted countervailing power in their dealings with PERC. For much of eastern Maine,
PERC is essentially the only disposal option. The nearest alternative for most towns
would be 75 miles further away at the Crossroads Landfill in Norridgewock. The MRC
and PERC have been essentially a bilateral monopoly (e.g., a single buyer and a single
seller who each have no option but to reach agreement). Economic theory suggests that,
in general, a bilateral monopoly is preferable to a monopolist who has many customers.
The bargaining process in a bilateral monopoly will typically lead to a lower price and
99

higher output than a simple monopolist. And the record between the MRC and PERC
suggests some balance in bargaining power. While the initial renegotiation let PERC out
of its long-term rate commitments, the MRC did extract concessions with potential
benefits for MRC members. And the 1998 electric rate renegotiations gave the MRC an
option to acquire up to a 50% equity interest in PERC and an option to acquire the
facility in 2018. The MRC communities have acquired 21% of PERC to date. It is
notable that Casella decided to divest its interests in PERC, but not in Maine Energy, as
part of its corporate divestiture decisions in 2001. Maine Energy and PERC are similar
plants that originally had essentially identical financial structures. A plausible
explanation would be that the MRC’s representation of community financial interests
made PERC less attractive to Casella.
Municipalities (or groups of municipalities) that run their own disposal facilities
are both consumers and suppliers of disposal services. As a supplier of disposal services,
a municipality may be in the position of favoring higher disposal fees. Typically, these
facilities process their own residential waste and accept waste at market rates from
commercial haulers and perhaps also from non-member towns. When commercial (and
perhaps non-member) rates can be raised because of market conditions, less revenue
needs to be raised by the member communities. To understand the economic position of
these municipalities, consider a facility with per ton costs of $70/ton, where 50% of the
waste comes from member municipalities and 50% from commercial sources. If the
market dictates a commercial rate of $50/ton, then the member communities will have
costs of $90/ton for their own waste. Conversely, if commercial rates increase to
100
$90/ton, the member communities will face costs of only $50/ton for their own waste.
Municipal budgets benefit when commercial disposal fees increase.
On the other hand, a community or group of communities that entered into
commitments with relatively low costs can decide to make those low rates available to
commercial users in its jurisdiction. That is, it can treat trash as any other public service
that it provides to its residents and businesses.
There are communities in Maine in both of these positions. RWS and MMWAC
both have relatively high costs per ton. As commercial fees increased in the late 1990s,
the net costs to member communities of those organizations fell. On the other hand, most
of the municipal landfills have essentially a single-rate policy. And while PERC does
accept commercial waste from the spot market, the MRC and PERC pursue a policy of
enlisting all of the communities in their service territory under the member rate. This
policy reflects the long-term bilateral interests of PERC in a steady flow of waste and a
predictable revenue stream and of the MRC in predictable disposal fees for members.
Municipal participation in disposal markets means that a large share of MSW is
covered by long-term commitments or contracts. Municipalities that have financed
waste-to-energy plants are particularly committed. Because municipalities have the
power to tax, they cannot avoid bond commitments by declaring bankruptcy. Under
economic conditions that would cause a stand-alone commercial disposal facility to
declare bankruptcy, a municipal facility might well continue to operate. Trash under
these long-term commitments is insensitive to short-term market changes. As a result,
spot markets may be more volatile, as the effects of changes in supply and demand are
seen entirely in the spot market.
101

The federal court decisions on flow control left communities which were
committed to put-or-pay contracts or bond payments without the ability to direct
commercial waste to specific sites. Some would argue that municipalities should have
known that flow control would face serious problems with the Commerce Clause.
However, a Maine state statute [38 M.R.S.A. § 1304-B] purported to authorize flow
control. As discussed above in Chapter 3, municipalities can overcome most of the
obstacles to flow control presented by the Commerce Clause. To do so, however, the
municipality must typically shift some (although not necessarily all) of the cost of waste
management from fees onto property taxes. This has in fact occurred in Maine. Towns
in central Maine who have seen waste diverted from PERC to Norridgewock have
lowered disposal fees at their transfer stations to get waste back to PERC. RWS lowered
its commercial fees in the mid-1990s when flow control was restricted.
Chapter 3 also discussed whether vertically integrated firms are able to exploit
put-or-pay contracts to increase revenues and to reduce competition. Recall from the
earlier discussion that a vertically integrated firm with two disposal sites might collect
twice for the same waste and hence obtain a significant advantage over other, non-
integrated haulers. The current municipal concerns about put-or-pay clauses do not seem
to fit this scenario. The instances identified involve two sites owned by different firms
(i.e., PERC and Crossroads landfill), rather than two sites owned by the same firm.
State planning role for new MSW capacity. Because of the ban on new
commercial facilities, any new capacity will be state or municipal capacity. New
capacity will almost certainly be in the form of landfills. Additional waste-to-energy
plants are very unlikely. Without the very favorable electric rates that Maine accorded
102

alternative energy providers in the 1980s, waste-to-energy plants will have difficulty
achieving disposal costs that are competitive with new landfill capacity. Moreover,
waste-to-energy plants still require landfill disposal of ash, FEPR, and non-processibles.
The capacity for MSW disposal in Maine is roughly in line with current volumes
generated, and this rough balance is expected to continue for the next 10 years. The
adequacy of disposal capacity might suggest that Maine can delay the difficult issue of
siting new landfill capacity. This is incorrect for several reasons. First, the stream of
construction debris and bulky goods seems to be growing. These items cannot be
incinerated, so they must go to landfills. Second, the options for disposal of incinerator
ash are limited and there is reason to worry about competition for this disposal in the near
future. Third, it takes several years to site and open a new landfill. Last minute decisions
are more likely to result in costly, irreversible errors. Fourth, as capacity in Maine and
nearby New England states continues to decline, the risks increase that small market
changes will result in dramatic price increases. For example, the closure of even one
major disposal facility in Maine would put very significant pressure on prices.
As we discussed in Chapter 2, we do not believe that pricing decisions by market
participants are constrained by the proposed Carpenter Ridge landfill. The enabling
legislation and the political context create substantial uncertainty about when and
whether Carpenter Ridge might open. On the other hand, state policy about expansion at
existing commercial landfills and about new municipal sites is likely to affect capacity in
the next ten years.
It seems quite possible that within the next ten years Maine will reconsider the
current statutory limitations on the expansion of at least one of the two commercial
103

landfills. Expansion of an existing site is typically less contentious (although hardly
without controversy) than siting a completely new facility. Both because of community
opposition and site characteristics, expansion of PTL seems less likely than expansion at
Crossroads. If expansion at Crossroads were to be the only, or the only significant,
capacity expansion in the next ten years while other capacity continues to decline,
Crossroads would have a much more dominant market position than it has today.
A key issue for competition will be whether municipalities add new disposal
capacity. State policy can have a strong impact on these municipal decisions.
Municipalities, many of whom faced significant expense when their old landfills closed,
seem wary of the financial risks that any new landfill might pose. There seems to be
great reluctance by municipalities to site new MSW landfills, even though new landfills
are probably able to achieve costs that are quite competitive with current disposal fees in
Maine. Siting a landfill is contentious, and there is a risk that significant funds can be
spent on a site without assurance that the site will open. And the scale of investment in a
RCRA Subtitle D landfill is large in relation to the resources of any single municipality,
so a multi-community facility is probably required.
Under the current siting process, the state has the approval authority while all the
risks fall on municipalities. Because the addition of disposal capacity by a single town
(or group of communities) will indirectly benefit the entire state, it might be appropriate
to consider shifting some of the risk of new landfill development from individual
municipalities to the state.
104

Rapid changes in CDD disposal markets. Three factors are driving the CDD sub-
market, all driven to some extent by evolving environmental regulations. Whether CDD
capacity becomes a major issue will depend upon the interplay of these factors.
First, CDD disposal at licensed sites is growing rapidly. This is primarily because
other disposal options are disappearing. For example, burning of old buildings is rapidly
disappearing as a disposal option because of concerns over the environmental impact of
burning toxic materials. And disposal of CDD as fill or in old gravel pits is being more
heavily regulated. Second, local communities continue to open new CDD sites. Because
the licensing requirements and investments for these sites are significantly lower than for
new MSW landfills, these CDD-only facilities are being opened much more readily than
MSW landfills. Most of this capacity is being opened by small to medium-sized
communities. This may perhaps be related to the six-acre limit. Larger communities
would rapidly exhaust capacity at such small sites and would therefore frequently be in
the position of siting new CDD capacity. Third, state environmental policy will affect
how much CDD is diverted to beneficial re-use. At present, the primary re-use is as
wood chips for fuel at biomass plants. CDD contains materials, such as sulfur in
wallboard, lead in paint, and preservatives in treated lumber, that are subject to maximum
concentrations under environmental regulations if used as fuel. The higher the
environmental standards, the less the material that can be diverted to wood chips for fuel.
“Thin” markets for ash disposal. The market for ash disposal is a “thin” market,
in the sense that there are a very limited number of buyers and sellers. Ash disposal
contracts are typically long-term, with terms of five years or more common. There are
four generators of ash and four disposal sites; two of the generators (RWS and Casella)
105
also own ash disposal sites. The two commercial sites account for about two-thirds of the
ash disposal, so commercial sites account for a much larger share of ash disposal than of
MSW and CDD disposal.
Because ash is denser than MSW and CDD, hauling costs per ton are lower.
Therefore, the relevant market is somewhat larger for ash than for other wastes. There
are some potential entrants in the ash market, which may constrain the pricing of ash
disposal. RWS may have the option of expanding its ash disposal site to accommodate
the needs of other incinerators. Tri-Community was constructed to standards that might
permit it to be licensed for ash (with some operational changes). And were Carpenter
Ridge to open, its most economic use would probably be for ash from PERC. Given the
significant municipal commitment to PERC by MRC communities, MRC communities
might consider siting a multi-purpose landfill to service both PERC and some of their
own needs if PERC faced difficulties with ash disposal.
The historically contentious nature of the relationship among PERC, the MRC,
and Casella/Sawyer/PTL is reflective of the thin market. When transactions are few, a
great deal is at stake for every transaction. Each side would like to strengthen its
bargaining position in contract negotiation. This contentiousness will inevitably be part
of state legislative or regulatory decisions on ash disposal, because state policy can
strongly influence this relationship.
Structure: The impact of consolidation on collection markets
Maine’s waste management industry has become more concentrated, and the
impact of mergers in the past decade is clear. There has been horizontal concentration in
both disposal and collection. Two vertically integrated firms, Casella and WMI, are the
106

largest commercial firms in both disposal and collection. These two firms entered the
market through acquisitions and have increased their market share and their degree of
vertical integration through further acquisitions.
To assess competition in collection, we need to define a market and estimate the
market concentration. The Department of Justice (1997) uses the “Herfindahl-Hirschman
Index” (HHI) to classify markets for antitrust assessment of mergers. This measure is
applied widely in assessing competition. The Department of Justice regards a market
which registers an HHI of 1800 as highly concentrated, and describes a market falling
into the HHI range of 1000- 1800 as moderately concentrated. A market with an HHI
below 1000 is classified as unconcentrated.
The relevant market for collection services is less than statewide; a firm that
operates from southern Maine clearly does not compete directly for business in eastern or
northern Maine. Defining exact market boundaries for local services such as waste
collection can be difficult, because the boundaries of individual markets inevitably
overlap geographically. However, in the current context, the conclusions about market
concentration are insensitive to whether narrow or broad market definitions are applied.
Because Casella and WMI collectively supply a high percentage of collection services
throughout most of the state, the conclusions about market concentration are insensitive
to exact geographic boundaries of markets. The exception is Aroostook County north of
Houlton, where neither firm has a major presence. Throughout the primary population
centers along the I-95 corridor from York County to the Bangor area, the available
evidence leads us to estimate that Casella and WMI account for 50-65% of the
commercial collection business. These estimates of market share produce HHI values for
107

waste collection markets in Maine in the range of 1500 to 2400. These estimates support
the conclusion that collection markets in Maine are at least moderately concentrated and
probably would be considered highly concentrated.
The consolidation that yielded this market concentration gives rise to two
questions: First, has competition been reduced by the horizontal concentration in
collection? Second, has competition been reduced in collection and hauling because of
the vertical integration?
Collection of trash is a basically a material handling industry. The capital, human
resources, and technology in the movement of waste material are very similar to those in
the movement of other products. Entry into the trucking industry is generally considered
easy. The total investment to enter a trucking activity is relatively low. The necessary
equipment is easily obtained, either as new or used equipment. A firm that chooses to
leave the industry can easily sell the primary assets in used equipment markets. In
markets with easy entry and exit, one would usually expect strong competition. Mergers
that reduce the number of competitors will not increase prices because new entrants will
quickly respond to any opportunities for profit.
Concern over consolidation in waste collection and hauling might arise if
significant economies of route density cause new entrants to have much higher costs.
The industry often argues that these economies are very significant. However, while it is
clear that new entrants must cross some minimum threshold in terms of route density in
order to achieve visibility, the argument that significant economies flow from increased
route density does not appear to be supported by statistical or other available evidence..
That new firms continue to enter in this industry suggests that the economies of density
108

are not prohibitive. Even if there are some economies of scale in collection, we argued in
Chapter 2 that these markets are contestable. That is, because the assets used in
collection can be easily acquired and easily sold, the threat of rapid entry by new
competitors constrains the pricing behavior of existing firms. From a structural
viewpoint, the low barriers to entry would suggest little need for concern over
concentration due to mergers. However, this industry routinely uses restrictive customer
contracts that prevent new entrants from quickly achieving minimally competitive route
densities. We examine those contracts separately, below.
An important issue is whether concentrated ownership of disposal facilities
creates market power that can be transmitted into the collection sector. State law bars
new entry into the commercial landfill industry in Maine; we concluded that this ban does
reduce competition in disposal. In Chapter 2, we concluded that there is no evidence of
significant economies of scope in operating vertically integrated collection and disposal
activities. That leaves the issue of strategic behavior by a vertically integrated firm when
competing with non-integrated collection firms. Entrants into the waste hauling industry
require a crucial service: access to disposal facilities. If potential entrants believe that
vertically integrated waste management firms will restrict their access to disposal
facilities, then entry will be deterred. And terms of access involve more than simply
price. Hours of operation, turn-around time at the disposal facility, and access to
recycling or special waste disposal facilities may also be issues. Discrimination based on
these components of service is inherently difficult to detect and to assess. We invited
specific comment on this issue in our preliminary draft. Only Casella commented;
Casella stated that this kind of discrimination does not occur.
109

The major national waste disposal firms display reluctance to compete as non-
integrated haulers against incumbent vertically integrated competitors. BFI, for example,
made some initial acquisitions of collection assets in Maine but eventually sold those
interests to Casella. Waste Management entered eastern Maine only after Casella had
sold its interest in PERC. The major national firms have a long history of selling assets
in markets where their presence is small. Some of these sales are structured as concurrent
asset “swaps” between the major national firms. (For example, see Anderson [1998, pp.
11-12] for a list of asset exchanges between major firms during 1997-98.)
The behavior of these national firms probably needs to be interpreted in light of a
history of strategic (and even predatory) behavior in collection markets. As we noted in
Chapter 2, antitrust enforcement has in the past prosecuted such predatory behavior.
While this behavior may be less common today (perhaps in part due to antitrust
enforcement), national firms do have a historical basis for believing that integrated
competitors may be willing to use access to disposal as a strategic tool against non-
integrated haulers. Furthermore, national firms are much more likely to enter new
markets by acquisitions, rather than by de novo entry. Given the reluctance of national
firms to enter vertically integrated markets, the conditions of entry for local firms are
especially important.
Conduct: Evergreen contracts and right-to-compete clauses
An important issue for antitrust policy in the waste management industry has been
the use of evergreen contracts. Contracts for container collection of commercial waste
often specify that the contract will be automatically renewed unless advanced notice is
given (hence the name “evergreen”). Typical terms are three-year initial contracts with
110

automatic renewal for one year. Thirty to 180 days’ positive notice is typically required
to avoid automatic renewal. Absent customer action within the specified window, the
contract cannot be cancelled without significant “liquidated damages”. Liquidated
damage penalties of three to six months fee equivalent in the initial contract and damages
of one to six months fee equivalent in renewed contracts are now typical.
The contracts often allow rate increases that are very generous to the hauler.
Haulers may be permitted to increase fees both for direct cost increases in categories like
gate fees, fuel, taxes, and changes in regulations and also for overall inflation. Thus, if
all prices go up by 5%, the firm is allowed to increase fees by 5% for the general inflation
plus some additional amounts for the increases in the named categories. The customer
typically does not have the option of canceling the contract because of such automatic
rate increases.
Some contracts have “right-to-compete” or “right-of-first-refusal” clauses that
require the customer to accord the incumbent hauler the opportunity to match any
competitor’s price offer. These clauses facilitate predatory discounts against entrants. A
firm holding an option to match prices by any new entrant is given advance notice of any
new competition. Instead of lowering its prices to all customers to meet the new
competition, the existing firm need only lower prices to the few customers the entrant
attracts. These clauses also make it easier to enforce collusive agreements to raise prices.
If a member of a collusive agreement cheats by lowering price, customers are
contractually required to report that cheating to their current supplier.
Appendix C presents four small container contracts, two used by Casella and two
used by WMI. These contracts illustrate the features discussed above.
111

The Casella Pine Tree contract (C1 in Appendix C) is used by Casella in those
areas of the state not covered by the consent decree with the Maine Attorney General.
This contract has a three-year initial term, automatic one-year renewal if notice is not
given 30 days in advance, and 6 months liquidated damages (or the number of remaining
months in the contract, if less than 6). The contract allows automatic cost increases for
disposal rate changes, fuel, regulation changes, and taxes. Over and above the specified
costs, the firm is also allowed to increase fees for changes in the Consumer Price Index
(CPI) and “a reasonable margin”. The Casella Capitol contract (C2 in Appendix C) is an
amended version of the Pine Tree contract that is used in those parts of the state subject
to the consent decree. As specified in the consent decree, liquidated damages in this
contract are limited to the lesser of $75 or two months’ fees.
The first WMI contract (C3 in Appendix C) contains: a three-year initial term;
automatic renewal for one year unless notice is given during a window of 90-180 days
prior to contract expiration; liquidated damages of 6 months (or the number of remaining
months if less than 6) for the initial term and 3 months for renewal terms (or the number
of remaining months if less than 3); and a right of first refusal clause. The contract
allows automatic cost increases for disposal costs, fuel, taxes, and regulation changes and
also permits an overall increase for changes in the CPI.
The second WMI contract (C4 in Appendix C) contains a three-year initial term,
automatic renewal for three years unless notice is given during a window 60-180 days
prior to contract expiration, and liquidated damages equal to 30% of remaining fees. It
contains the same price escalation clause as the first contract. This second contract uses a
longer renewal (three year) and restructured liquidated damages, relative to the first
112

contract. For contracts with more than 18 months remaining, liquidated damages will be
higher; for contracts with less than 18 months remaining, liquidated damages with be
lower (relative to the flat 6-month liquidated damages).
National antitrust enforcement has had some restraining influence on these
contracts. The long contracts, narrow cancellation windows, and high damages have
been difficult to defend in antitrust enforcement actions. Some national firms have
responded with shorter terms and lower damages. But, as seen in the current Casella and
WMI contracts, long-duration self-renewing contracts remain the norm.
Noll (1991), a prominent antitrust economist, analyzed evergreen contracts and
right-to-compete clauses in the context of a Canadian Competition Tribunal case against
Laidlaw. Noll was analyzing an older contract with longer terms and higher liquidated
damages, and the analysis was conducted in the context of other anticompetitive practices
by Laidlaw. Noll’s conclusions about those contracts, however, apply broadly.
With respect to the long-term contracts and liquidated damages, Noll (1991, p.
14-15) makes the following assessment:
“As discussed above, one normally associates exclusive long-term contracts and
liquidated damages provisions to circumstances in which at least one party makes
a relation-specific investment … In waste disposal, the relation-specific
investments are extremely limited, consisting primarily of the costs of negotiating
the agreement … Consequently, there is no economic rationale for either a long-
term contract or liquidated damages … Thus, there is no plausible explanation for
these provisions other than to create an entry barrier by making customer
purchase decisions inflexible.”
113

With respect to automatic renewal provisions, Noll (1991, pp. 16-17) concludes:
“The automatic rollover provision in the contract forms constitutes a barrier to
entry yet has no significant efficiency benefit … Even if there were relation-
specific investments, they presumably are recovered by the first contract term, so
the seller would experience no loss by automatic continuation on a short-term
basis, and has no efficiency reason to rollover punitive liquidated damage
provisions … Thus, the long-term rollover provision — committing the buyer to
another long period of inflexibility — has no efficiency rationale, and can be
explained only on the basis of its function as a barrier to entry.”
On the right-to-compete clauses, Noll (1991, p. 17-18) finds:
“The right to compete and right of refusal provisions of contracts enable Laidlaw
to reduce still further the incentive of others to offer competitive service … The
sole function is to allow Laidlaw to know who is competing with it and on what
terms before the competitor succeeds in obtaining a single customer. Thus,
Laidlaw does not have to respond to competition by lowering prices generally.
Instead, it can target price reductions only on the customer a competitor seeks to
acquire, thereby reducing the costs of effectively competing and, indeed, of using
predatory or disciplinary pricing to dissuade price competition. Moreover, by
reducing the likely success of a competitive offer, Laidlaw’s notification
requirement serves to reduce the expected profitability of attempting to lure a
customer from Laidlaw. The effect is not only to retard entry, but also to
encourage collusive pricing if there are any other competitors in the market.
Specifically, this contract provision enlists buyers as the agent for enforcing a
114

collusive pricing agreement, should one exist, by requiring that they immediately
report any ‘cheating’ on the collusive agreement to the threatened competitor ...
But the more pernicious effect is that it can force a customer to continue dealing
with Laidlaw when the customer would be better off dealing with another
containerized commercial solid waste disposal company. For, example, both
companies may offer exactly the same terms, but Laidlaw’s competitor may have
a reputation for pursuing a less aggressive policy with respect to cost pass-through
provisions. Or the competitor may use less unsightly equipment and containers,
or may employ workers who exercise more care in collecting waste, creating less
litter and imposing less wear-and-tear on container storage sites. In general,
contracts do not do a very good job in dealing with qualitative aspects of
services…”
We find Noll’s analysis of these contracts compelling. As the decision in the
Laidlaw case suggested (Canadian Competition Tribunal, 1992, pp. 94-96), the industry
justification for these clauses seems to be that everyone else does the same. We would
note that the Noll analysis was made ten years ago, is well known in the industry, and is
frequently cited in antitrust analysis. Despite the role of this argument in antitrust cases
in the intervening period, we could not find, nor did industry identify for us, any
economic rebuttal of the Noll analysis.
In comments on our preliminary draft, WMI noted (as our presentation notes
above) that the evergreen contracts in the Laidlaw case were part of a broader set of anti-
competitive activities. WMI suggested that the Noll analysis should not be applied to
evergreen contracts that are not part of a broader pattern of anti-competitive activity. We
115

disagree; the logic of the Noll argument in no way depends upon other anticompetitive
actions. In an industry like commercial small container service, where the customer-
specific investment is low, the only purpose of restrictive long-term, self-renewing
contracts it to impede competition. Likewise, the only purpose of right-to-compete
clauses is to deter entry and to promote collusive behavior.
In comments on the earlier draft, Casella correctly pointed out that the argument
that customer-specific investments are low does not apply to some types of equipment
used in commercial collection. For example, the non-recoverable costs of installing fixed
compactor equipment may be large. We agree that the Noll argument applies specifically
to small container (dumpster) collections and we clarified our recommendations to apply
specifically to small container contracts.
Performance: Pricing
The purpose of protecting and enhancing competition in markets is to ensure
competitive prices. One cannot directly determine whether prices are competitive, but
one can make comparisons of prices in different markets or changes in price over time
that may suggest whether prices are competitive.
MSW disposal. Interpretation of the price data presented in Chapter 4 is not
without complications. First, some fees are “gate rates”, which may not reflect actual
fees. At most commercial facilities and some public facilities, gate rates are essentially
maximum prices. Second, there are features of rates that are specific to individual
facilities, and especially to the public facilities. For example, in 1994 RWS substantially
altered its commercial versus member rate structure in response to legal limits on flow
control. The large increase in PERC fees in 1992 reflects the first contract renegotiation.
116

The increase in FEPR fees at Pine Tree Landfill in 1999 represents a switch from using
FEPR to cap old landfills to secure landfilling. These idiosyncratic features must be
considered in any assessment of prices.
Of the data available to this study, we believe that the survey of municipalities
offers the best indication of the overall trend in waste disposal costs. The increase of
22% in disposal fees reported for 1996-2001 is in line with the increases reported by
facilities. For example, the increase in “other revenue per ton” (which is primarily
tipping fees) for the waste-to-energy plants was 16% between 1996 and 2001 (Table 8).
The Biocycle data (Table 27) suggest even higher rates of increase for disposal
fees in Maine during a similar period. For 1994-2000, the Biocycle data indicate a 44%
increase in landfill disposal fees and a 58% increase in incinerator fees. These increases
do seem higher than the average rate of increase at the individual disposal sites in Maine.
It is possible that the Biocycle data are more indicative of the short-term commercial
market than of long-term municipal contracts. As discussed above, in markets where a
large share of transactions occurs under long-term contracts, short-term prices may be
especially volatile.
Within the overall pattern of higher waste disposal costs, there is distinct evidence
of regional differences within the state, with greater price increases in southern Maine.
This is not surprising. Capacity in the rest of New England is limited and declining.
New Hampshire has recently taken steps that reduce its role as the primary importer of
waste in New England. On the other hand, significant disposal capacity in Canada is
available to communities in Aroostook and Washington Counties.
117

The price data from New Hampshire (Table 28), Chartwell (Table 26), and
Biocycle (Table 27) all tell the same story: disposal in New England is the most
expensive in the U.S. and the recent trend has seen significant increases. In New
Hampshire, disposal fees were relatively constant from 1990 to 1997, but had very
significant increases after 1997. Gate rates increased 36% between 1997 and 1999;
municipal disposal fees increased 13%, contract fees 9% and commercial fees 15%. All
these increases are substantially in excess of the overall inflation of only 2.5% in the
same period. Likewise, Biocycle data show increases in excess of 20% for all New
England states except Vermont between 1994 and 2000. (Vermont’s rate of $75/ton for
1994 did not increase in 2000, but this rate was the highest in the U.S. in both years.)
Commercial fees in southern Maine have likewise posted significant increases in
the late 1990s. During 1998-2001, RWS raised its commercial tipping fee 63%.
MMWAC raised commercial fees 47% between 1996 and 2001. Bath increased fees
30% between 1996 and 2000. At Maine Energy, short-term municipal fees increased
37% and commercial fees increased 25% for 1998-2001.
The situation in Aroostook County and Washington County is also clear. Tri-
Community landfill was the only site to lower fees (by 10%) during the 1990s. Presque
Isle accepts waste at $40/ton. Waste goes to COGERNO at $37/ton and to Hemlock
Knoll at $43/ton. For waste disposal at least, it is better to be far from the rest of New
England and nearer to Canada. But only about 10% of Maine’s population lives in these
two counties.
The situation in eastern Maine is dominated by the MRC/PERC/PTL relationship.
There is something close to a bilateral monopoly situation between the MRC and PERC
118

and also between PERC and PTL. These relationships have been contentious at times.
But the net effect seems to have been to produce a relatively stable long-term price
structure. The MRC currently pursues a pricing policy of stabilizing effective fees at
$54/ton for new members and $45/ton for equity (pre-2000) members. The MRC times
its equity investments in PERC to help achieve this stabilization. The MRC and PERC
also have a goal of bringing all communities into a long-term membership position, rather
than a short-term spot market relationship. The dominance of the MRC and PERC
relationship in eastern Maine allows it to act more like a traditional monopoly supplier of
a government service, with the same fees to all users. At least at present, the MRC/PERC
relationship seems to be providing moderate and stable costs to both municipalities and
commercial customers in eastern Maine.
For the Crossroads landfill, the other major disposal site in central Maine, the
available data is limited to gate rates and may not necessarily reflect average disposal
costs. The gate rates for both MSW and CDD increased 21% during 1990-1998 and by
6% during 1998-2001. These are almost exactly equal to the overall rate of inflation for
the same period. PERC and Crossroads compete for customers in a broad section of
central Maine, so we might expect stable prices at PERC to be matched by stable prices
at Crossroads.
The pricing evidence suggests that new municipal landfill capacity can be cost-
competitive. Tri-Community opened in 1995 with a rate of $64.18/ton and dropped that
rate to $58.00/ton in 1999. By the standards of large commercial landfills, Tri-
Community is relatively small; larger facilities could be expected to achieve somewhat
lower costs. Hatch Hill fees have been at $58.00/ton since 1994. Presque Isle has a
119

commercial rate of $40/ton and Brunswick has had a $44.00/ton rate since 1993. Of the
municipal landfills, only the Bath facility significantly increased fees between 1996 and
2000, from $46.00/ton to $60.00/ton. (However, note that the Presque Isle, Bath, and
Brunswick sites, which pre-date Subtitle D requirements for new facilities, may not be
indicative of current cost structures.)
Evidence from outside Maine also indicates that new landfills can be very cost-
competitive. The two large Canadian facilities report that the fees charged American
communities, of less than $45US/ton, reflect full costs. Large commercial facilities
elsewhere in the U.S. also achieve disposal fees at or below the $45/ton level. At
$45/ton, a new landfill could be located at a moderate distance from generating
population centers. The difference between $45/ton and current disposal costs in Maine
of $55-$60/ton would permit new facilities to be competitive with facilities 50 to 100
miles closer to generation centers.
The lack of municipal interest in siting new landfills (other than in Aroostook
County) is not because landfills could not compete on disposal cost. Rather,
municipalities are very reluctant to confront two related problems: the contentious siting
process and the financial risks of developing a proposal that is not approved.
The increase in tire disposal costs in the municipal survey is also noteworthy. A
large fraction of tires are now chipped for fuel or roadbed construction. The high rate of
re-use did not lower the costs of disposal, however. Tire disposal fees increased 33%
between 1996 and 2001; the rate is now twice that of MSW disposal. Efforts to increase
recycling fees generally may face the same economics: higher recycling fees may
involve processing costs that substantially exceed the costs of landfill disposal. While
120

there may be environmental policy reasons to increase recycling fees, disposal fees are
unlikely to be restrained by competition from recycling alternatives.
CDD disposal. The modest increase in CDD disposal fees reported in the
municipal survey was something of a surprise. A number of towns in eastern Maine
informally reported large increases in CDD disposal costs to us. These reports were
consistent with Casella’s 30% increase in local CDD fees at PTL between 1996 and
2001. There are two possible explanations for this inconsistency. First, the recent
increases may not be fully reflected in the survey because of existing long-term contracts.
Second, Casella’s decision to increase CDD fees may have diverted CDD to other, less
expensive, sites. CDD takes up more space per ton than ash or FEPR. As volume, not
tonnage, is the limiting factor in a landfill, Casella may be repricing CDD to reflect the
opportunity cost of the space. If PTL space is more valuable for ash and FEPR, it is
logical from both Casella’s business interest and from society’s interest in conserving
scarce secure landfill space to divert CDD to less expensive options, such as municipal
CDD sites. As discussed above, CDD disposal is undergoing significant changes at
present. Different forces are working both towards higher fees (growth in CDD; loss of
some disposal options) and more stable fees (greater re-use; development of more 6-acre
CDD sites).
Hauling and collections costs. Relatively little data is available to evaluate
changes in hauling and collection fees. There is no source from which to evaluate
commercial small container collection costs. Given the importance of this part of the
market, this is a serious limitation.
121

The data from the municipal survey does contain some useful information. The
costs of hauling CDD and of hauling MSW from transfer stations to disposal sites rose at
roughly the rate of inflation. This part of the market faces the threat of immediate entry
from construction firms, logging contractors, and other tractor/trailer fleet operators.
Competition should be greatest in this market, thereby restraining rate increases.
The rate of increase in municipal collection contracts was nearly twice the rate of
inflation. Although the survey design explicitly asked for collection costs separate from
disposal costs (see Appendix A), it is possible that a few towns might have misinterpreted
the survey. This could not, however, explain the entire increase. It is also possible that
changes in services (such as more households or curbside collection of recyclables) might
also explain part of the increase. But when combined with anecdotal reports from
municipalities that fewer bids were received on collection contracts in the late 1990s, the
increase in the cost of collection contracts does raise concerns over performance.
122

Chapter 6
Policy Recommendations
It remains for us to evaluate the legal and policy options available to address
competitive issues in the solid waste industry in Maine. The two underlying structural
issues are (1) the rapid horizontal consolidation and vertical integration within the
industry and (2) Maine’s ban on new commercial disposal facilities. These structural
features raise questions about the strength of competition in disposal (especially as
Maine’s existing landfill capacity declines) and about any competitive advantages that
vertically integrated firms may acquire through control of scarce landfill capacity. Our
analysis identifies a clear policy option to insure effective competition in collection and
hauling. In disposal, the choices are more complicated and more difficult. But we argue
that those choices must be addressed soon, because the risk of higher disposal prices in
Maine grows as landfill capacity is filled.
Collection: Promote Competition by Limiting Restrictive Contracts
The best protection for competition in the collection sector of the waste industry
is the threat of new entry. The investment required to enter the collection industry is
modest. The only significant barrier to entry is that restrictive evergreen contracts make
it difficult for new entrants to achieve the route density required to attain competitive
costs. These contracts often have multiple provisions that restrict competition, such as:
• automatic renewal provisions with burdensome notification requirements
for non-renewal;
123

• excessively long duration and excessive cancellation penalties that bear no
relation to costs incurred; and
• anticompetitive “first refusal” or “right-to-compete” requirements to
report price and service offers by potential competitors.
The anticompetitive effects of these provisions seriously handicap new entrants
into the collection market. To enter competitively, a new firm must assemble a set of
customers on a route structure that has some minimum density. Evergreen contract
provisions make it very difficult for new entrants to build efficient routes. The first
refusal requirements mean that the incumbent firm knows the areas targeted by potential
entrants and can selectively cut prices to deter entry. In some industries, long service
contracts are economically justified to allow recovery of large customer-specific
investments that cannot be recovered when the relationship ends. In the small container
market, the customer-specific investments that cannot be recovered by moving the
canister are minimal. Once the barrier to entry created by restrictive contracts is
removed, the state can rely on competition to protect consumers. There is no legal or
constitutional impediment to placing legislative restrictions on these types of contract
terms.
In consent decrees in merger and monopolization cases, the U.S. Department of
Justice and the Maine Attorney General have imposed ad hoc restrictions on the use of
restrictive contracts in certain waste collection markets. The Maine Attorney General
obtained consent decree restrictions on the use of evergreen contracts by Casella in
Maine’s nine northern and easternmost counties, but no such provisions apply to other
market participants or in any other part of the state. This lopsided restriction, while
124

salutary in some respects, can hardly be said to create a level playing field, as Casella has
correctly pointed out. Casella is not the only company to use evergreen contracts. Such
contracts can seriously inhibit competition even in markets less concentrated than those
in northern and eastern Maine. We believe that promoting competition in the hauling
sector argues for placing the entire industry under the same terms as those accepted by
Casella in its consent decree. Therefore, we recommend:
Recommendation 1: That legislation be enacted to restrict small container
(dumpster) commercial contracts as follows:
(i) to require contracts to be clearly identified as contracts and to be easily
readable;
(ii) to prohibit so-called “first refusal” or “right-to-compete” clauses that
require that the incumbent hauler be provided notice of and/or an
opportunity to match a new entrant’s offer;
(iii) to require that small container commercial contracts permit customers
to terminate such contracts on 30 days notice by mail, fax, or e-mail;
(iv) to require such contracts to limit the financial charge for early
termination of the contract to the lesser of Seventy-Five Dollars ($75) or two
times the current monthly charge or two times the average monthly charge
over the most recent six month period;
(v) to allow collection companies to submit bids that would otherwise violate
requirements (iii) and (iv) where competitive bid specifications by the
customer request such terms and then to enforce the resulting contract; and
(vii.) to declare inconsistent provisions in existing contracts unenforceable.
125

The specifics of this recommendation vary somewhat from those in our initial
draft report. In its comments, Casella correctly pointed out that our earlier proposal was
drawn too broadly, because it was not limited to the small container market. We concur
and have therefore limited the recommendation to small containers. In some types of
collection services, significant non-recoverable fixed investments, such as compactor
installation, are made. We agree that when significant customer-specific investments are
made and those investments cannot be recovered if a contract is cancelled, longer term
contracts with larger cancellation penalties are warranted. We therefore do not
recommend restrictions outside the small container market. Casella also argued that the
terms in our original proposal were significantly less favorable to the collection firm than
the terms in its current consent decree. The terms in the Casella consent decree meet the
objectives we have set forth, and therefore this proposal tracks those terms closely.
In the context of past antitrust enforcement actions, the Attorney General has
heard sporadic concerns that vertically integrated operators of waste disposal facilities
may discriminate in the terms on which disposal service is provided to non-integrated
haulers. Hard evidence on this issue is difficult to marshal. Legislation could be enacted
to require that disposal facilities not discriminate among haulers on either rates or terms
of access. While this standard seems simple in concept, complicated implementation
issues may arise in enforcing such provisions. Prices are negotiated individually with
haulers and generators; contract terms may be individualized. Nor are equal access
requirements without complications. For example, disposal facilities must exercise some
judgment in determining if a load of waste should be rejected for excess volumes of
waste that the facility cannot or is not licensed to process. Loads of waste from
126

households or commercial facilities typically contain small amounts of waste that would
be prohibited in large volumes. Distinguishing this legitimate discrimination from
prohibited discrimination might be difficult. Because such legislation raises complex
enforcement questions and absent compelling evidence of the need for such legislation,
we decline to recommend legislation governing terms of access of haulers to disposal
facilities.
Starting in 2000 and ending in 2002, a statutory provision required notice to the
Attorney General of acquisitions of solid waste hauling assets (38 M.R.S.A. § 2111).
That section was automatically repealed 90 days after adjournment of the last session of
the Legislature. In the preliminary draft report, we had recommended renewal of that
provision. We felt that renewal of the notification provision would help the Attorney
General address specific concerns of the Legislature over consolidation in this industry.
We also anticipated that the Legislature would not have time to address more
fundamental issues in collection and disposal during that session. Renewal of the notice
provision would have maintained some antitrust vigilance while the Legislature took time
to consider more specific measures. We also argued that the notification provision did
not impose undue burdens on the industry. In comments, the industry questioned the
need for special treatment of this industry and argued that the notification provision could
be burdensome in some cases.
We have decided not to recommend re-enactment of the notification provision.
As we have stated previously, antitrust enforcement is an inherently limited response to
deficiencies in competition. In this industry, the Legislature can guarantee competition in
collection and hauling by restricting the use of evergreen contracts. With that step taken,
127

no need exists for a notification provision on acquisitions of hauling firms. If, however,
no legislative action is taken to address the fundamental competitive issues in the solid
waste collection industry, it may be appropriate to revisit the notification provision.
Disposal Costs: Completing Maine’s Policy on Waste Disposal
The driving force behind change in the solid waste industry has been
environmental regulation. Particularly in disposal, environmental regulation has led to
fewer, larger facilities. The decline in the number of disposal facilities and the difficulty
of siting new facilities has created opportunities for market power for some existing
disposal facilities. Maine’s ban on new commercial disposal facilities, in particular,
means that all new competition in disposal must come from government facilities (38
M.R.S.A. § 1310-X). The central issue in Maine’s disposal markets is how competition
will be maintained in the absence of the threat of new commercial entry.
Given the ban on new commercial disposal facilities, antitrust enforcement can do
little to maintain competitive prices in disposal. Merger of the two firms that operate
landfills could, of course, be challenged under Maine’s merger statute (10 M.R.S.A. §
1102-A). But antitrust policy cannot prevent the two firms from raising landfill prices as
disposal capacity is depleted in Maine, as long as pricing decisions are made unilaterally,
without illegal consultation between competitors. Exercise of market power bestowed by
the state ban does not violate antitrust law or policy. This market power was conferred
by state action and not obtained by actions that violate the antitrust statutes. Accordingly,
antitrust enforcement has no useful role to play in maintaining competitive prices in
disposal. Maine needs to look beyond antitrust enforcement to accomplish this task.
128

Under the ban on new commercial disposal facilities, Maine placed responsibility
for the creation of new disposal capacity on state and/or municipal government. The
Maine Waste Management Agency was tasked to track state disposal capacity, a function
subsequently moved to the State Planning Office. Initial siting work was done for a state-
owned facility at Carpenter Ridge, near Lincoln. The site is permitted for special waste,
because it is primarily envisioned as an incinerator ash disposal site. While the Carpenter
Ridge facility is to be state-owned, the intent is that it will be operated by a private entity.
(A second site, closer to southern Maine, was originally envisioned, but planning for that
site has not moved forward.) When less than four years of capacity remains, current law
calls for the State Planning Office to seek legislative authorization for a plan to begin
actual construction at Carpenter Ridge (38 M.R.S.A. § 2156-A).
The statutory criterion for opening Carpenter Ridge is narrow: Is Maine in
imminent danger of running out of landfill capacity? This technical question of the
availability of some minimally adequate landfill capacity may address the environmental
concerns that have motivated waste management policy since the 1970s. But missing
from the statutory criteria, and largely missing from underlying policy discussions, is any
consideration as to how state siting policy will impact the cost of disposal to Maine’s
communities and businesses.
Waste disposal is not only an environmental issue; it is also a significant expense
for businesses and governments. For local governments in Maine, waste management
has become one of the top three or four budget categories and also one of the fastest
growing. Municipalities are demanding greater emphasis on the cost of waste
management in state policy. The formation of the Legislative Task Force on competition
129

in solid waste management in 2000 is indicative of the growing importance of price as a
waste management policy issue. We believe that Maine’s policy on disposal capacity is
presently incomplete, because it fails to take account of the historical and prospective
impact of policy choices on disposal prices.
In our preliminary draft, we suggested that the structure of the four-year capacity
trigger for a State Planning Office recommendation to move ahead with Carpenter Ridge
embodied deep-seated reluctance to open state-owned disposal capacity. The current
statutory language does not authorize opening Carpenter Ridge; it simply directs the State
Planning Office to ask the Legislature for permission to construct the facility. We also
suggested that the de facto policy is to delay any decision to site additional capacity for as
long as possible. The Department of Environmental Protection, in particular, did not
agree with this assessment, pointing to the approved site permit for Carpenter Ridge in
addition to the statutory calendar for opening it. However, we also received comments
that expressed general agreement with our original assessment. The most recent policy
document on Carpenter Ridge, the 1999 Task Force report (Maine State Planning Office,
1999) suggests the ambiguity about the role of Carpenter Ridge. Carpenter Ridge could
be a near-term major addition to Maine’s disposal capacity, or Carpenter Ridge could be
simply an option of last resort that the state would in fact prefer not to open. While a
majority on the task force endorsed the first alternative, the current four-year trigger
would seem more consistent with the second alternative. We continue to believe that,
under current policy, the opening of Carpenter Ridge remains highly speculative. We are
even less sanguine about a second state-owned facility closer to southern Maine.
130

But even if we assume that the statutory calendar is followed, and construction
duly authorized, Carpenter Ridge is unlikely to prevent escalation in disposal prices.
When two years of construction work for the site are factored in, Maine will be, at most,
two years from exhausting disposal capacity before the site opens. Upward pressure on
landfill prices is inevitable under such a strategy of brinkmanship. Moreover, extra
transportation costs to reach Carpenter Ridge further insulate existing landfills from
competition from that facility. Trucks from Maine’s population centers must travel 50 to
100 miles beyond existing commercial landfills to reach Carpenter Ridge. This creates
an automatic cost disadvantage of something like $10 per ton for Carpenter Ridge.
A necessary first step towards incorporating price and competition into disposal
capacity decisions is to closely monitor the price of disposal. Because of the unique
regulatory environment created by the ban, Maine government should be able to readily
assess what is happening to disposal prices. Even with a fair degree of effort, we have
been able to construct only a partial assessment of disposal pricing. This leads to our
second recommendation:
Recommendation 2: That the State Planning Office expand its current data
collection to gather more detailed disposal fee information. This recommendation
would require some changes in data collection by the State Planning Office. It
would also require legislative authority to collect revenue data from landfills, which
creates a requirement analogous to one now imposed on incinerators. Further, we
recommend that the five-year solid waste management plans and the biennial
disposal capacity reports by the State Planning Office include analyses of how
capacity changes are likely to impact prices. That analysis should assess whether
131

existing commercial disposal facilities are likely to earn windfall profits as disposal
capacity declines.
The State Planning Office currently conducts an annual survey of municipal solid
waste programs. Since 1997, that survey has collected budgetary information from
municipalities. That survey has not required that towns provide budgetary information in
any specific uniform format. Given the variations in the organization of waste
management functions in communities, the State Planning Office asks only that
communities submit financial data as presented in annual municipal reports. However,
our own survey of towns indicates that most communities were well aware of current per-
ton disposal costs for MSW, CDD, bulky goods, and tires (assuming that the municipality
paid to dispose of a category of waste) and could readily submit per-unit disposal costs.
We recommend that towns be asked a question such as: “Do you pay a per-ton fee to
dispose of MSW? If yes, what was that fee on January 1?”, with similar questions for
CDD, bulky goods, and tires. These four categories of waste account for most municipal
disposal costs at present. Like any data collection activity, it is important to keep abreast
of changes. Were additional disposal categories to become significant, the data collected
should reflect the changing disposal patterns. Burn pile ash illustrates the type of change
that might prompt collection of additional categories of disposal costs. Some
communities have expressed concern that recent changes in the application of
environmental standards might make burn pile ash a significant expense in the near
future.
We also recommend expanding the current reporting requirements for incinerators
to include municipal and commercial landfills. Under 38 M.R.S.A. § 2232, Maine’s four
132

incinerators provide annual data on tonnage and revenues. This data is reported in total
and separately for municipalities, commercial accounts, and the spot market. We
recommend expanding the statute to require landfills, both municipal and commercial, to
report tonnage and revenue data to the State Planning Office in a form specified by that
office. The statute should be framed broadly to allow the State Planning Office to adjust
data collection to changing market conditions. Initially, the State Planning Office should
collect tonnage and total revenues for the following categories of waste: MSW, CDD,
bulky goods, FEPR, incinerator non-processibles, and incinerator ash. The tonnage and
revenue data should be disaggregated by five major customer groups: municipalities and
other government units, incinerators, instate commercial accounts, spot market from
instate sources, and out-of-state sources. The current data collection from incinerator
may require minor modification to conform to these categories.
We would note that state collection and dissemination of disposal price data is not
unusual. A cursory search of the Internet shows that other states, including California,
New Jersey, Pennsylvania, and Florida, collect and post facility-specific fees.
We are not recommending collection of data on the collection and hauling sector.
There are significantly more firms in collection and hauling than in disposal. Because
collection and hauling contracts are typically specific to individual customers, it would be
difficult to collect data that provided meaningful comparisons either at a point in time or
across years.
We have also not recommended collecting data from firms providing disposal
services other than incineration and landfilling. Obviously, firms that reprocess waste
materials, such as chipping tires or deriving wood fuel chips from CDD, provide an
133

important service that substitutes for incineration or landfilling. These services are much
more varied than incineration and landfilling, and the nature of these services continues
to evolve. Again, meaningful data collection would be difficult. Nor are there are
obvious barriers to entry that raise competitive questions in this part of the market.
Having adequate data to monitor and assess changes in disposal prices is a
preliminary step in the policy process. That data must then be fed into a decision process
about disposal capacity. The current statutory criteria are based entirely on estimates of
remaining capacity, so there is no place in the current policy process to integrate
information on disposal costs. The policy process must be refined to respond
appropriately to issues of competition and price in disposal.
In our preliminary report, we suggested that the necessary policy change required
the state to assume a greater level of responsibility for development of new landfill
capacity. Our logic involved two points. First, we suggested that it is clear that new
landfill capacity will have to be provided by either the state or municipalities. Second,
we argued that the economics of landfill construction and operation require large
facilities whose scale is simply more appropriate for the state than for municipalities.
It is clear from the comments we received that, while there are those who agree
with this policy direction, there is also significant resistance to this kind of policy change.
For example, RWS in its comments argued that state policy is not and should not be to
maintain low landfill disposal prices. RWS argued that because landfilling is the least
desirable alternative in Maine’s hierarchy of waste management options, the landfill
prices should be higher to make other alternatives more economically viable. In a similar
vein, the State Planning Office suggested that Maine might be willing to accept higher
134

disposal costs as a way to fund and to encourage higher recycling/reuse rates. At the
discussion of our preliminary report before the Natural Resource Committee of the
Legislature, committee members raised the possibility of amending the current ban to
allow at least one of the existing commercial landfills to expand. Comments from the
Department of Environmental Protection indicate that they do not agree that siting a new
landfill is too large a responsibility for municipalities or groups of municipalities.
These comments, and others like them, have led us to a different recommendation
on how to modify state policy on new landfill capacity. We want to emphasize that
current policy has great potential to result in significantly higher landfill disposal fees,
and therefore windfall profits for commercial disposal sites, in the next ten to fifteen
years. There are a number of options to address this concern; the choice among these
options involves broader solid waste management questions. Therefore, we recommend:
Recommendation 3: That legislation be enacted to affirm that municipalities and
other customers should enjoy reasonable competitive options for the management
and disposal of solid waste as landfill capacity declines. When the State Planning
Office determines that a decline in disposal capacity has the potential to generate
supracompetitive prices, it should be required to submit that finding and
concurrently to submit a proposal for corrective legislation to the Legislature. It is
not the purpose of this study to advocate for specific choices among available
procompetitive solid waste policy options. We doubt that the Legislature intended
that the ban on new commercial disposal facilities should allow existing commercial
disposal facilities to earn higher profits, but some policy action is necessary to avoid
exactly that outcome. Because the policy choices in landfill siting are inherently
135

difficult, it is important to insure that the issue is placed before the Legislature in a
coherent and timely way.
The language in this third recommendation parallels the current legislation on
opening Carpenter Ridge. When Maine’s landfill capacity reaches levels that may
increase the prices that landfills can charge, the State Planning Office would have to
notify the Legislature of this development and to recommend a policy direction to avoid
that outcome. These broader criteria would almost certainly be triggered before the
current four-year capacity trigger for Carpenter Ridge.
To implement this expanded planning function, the State Planning Office will
need to initiate, and pursue in conjunction with the Legislature, an analysis and dialogue
over how to avoid potential windfall profits for commercial landfills. The policy choices
here are difficult, and the State Planning Office obviously cannot design, review and
select policy options in a vacuum. But a necessary first step is to assemble credible
analysis as a guide to decision-making. Given the State Planning Office’s central role in
planning for disposal capacity, that office is positioned to conduct such analysis and to
initiate the necessary dialogue. This recommendation links the current responsibility for
monitoring capacity with responsibility for monitoring pricing implications of those
capacity changes. With these joint responsibilities, combined with its broader economic
analysis capabilities, the State Planning Office will be appropriately positioned to guide
the difficult policy discussions that are necessary to resolve the competing goals of solid
waste policy. Draft Legislation incorporating these recommendations is attached hereto
as Appendix D.
136

There are a number of policy directions that the state can and should consider to
promote competitive pricing of disposal in the context of the ban on new commercial
disposal. We will briefly discuss some of those options to provide some sense of the
directions that might be available to the State Planning Office.
First, the state could open Carpenter Ridge and additional state-owned capacity on
a schedule that maintains stable disposal prices. As we suggested above, the relatively
remote location of Carpenter Ridge limits the competitive impact of opening that site. It
is unlikely that Carpenter Ridge alone will adequately restrain the growth in landfill
prices. While this approach would seem consistent with (though not mandated by)
current statutory language, comments received on our earlier draft lead us to believe that
this outcome remains controversial.
Second, municipalities or groups of municipalities could open new disposal sites.
In fact, current policy might be interpreted as preferring that municipalities assume that
responsibility. The timetable for opening Carpenter Ridge is short, perhaps, because the
state will open that facility only as last resort, after it is clear that municipalities will not
open necessary capacity. The nature of the opposition to disposal sites might place
municipalities in a better position than the state to site facilities. Local opposition to a
disposal site may be lower if residents view a facility as addressing their own disposal
problems, as compared to having waste shipped in from elsewhere.
If municipal siting were to be the center of Maine’s disposal capacity, the state
might consider reducing the financial risks that municipalities bear in developing new
sites. The expense of obtaining options to purchase land, doing engineering work, and
going through the environmental siting process represents a very sizable investment with
137

significant risks. The state could substantially reduce this risk by assuming a large share
of the cost (perhaps as much as 80%) of this up-front, pre-construction investment. To
reduce risk, the state would need to assume this expense whether or not the facility were
opened. A subsidy for actual construction costs is probably less desirable. Because the
risks are much lower once a permit is approved and construction begins, construction
costs do not create the same degree of risks. And construction subsidies have the effect
of lowering the cost of disposal, which may not be desirable in light of other policy
objectives. The state could bear some or all of the risk that state or federal legislative or
regulatory changes substantially increase the costs of operating a facility once it is
opened or seriously reduce its effective life. And the state might devise some type of
insurance program for unanticipated closure and post-closure costs. To provide
incentives to municipalities to operate disposal sites diligently, an insurance program
should probably not remove all post-closure risks from the municipalities.
A third option would be to allow at least one of the two existing commercial
landfills to expand beyond the limitations in the current legislation. Such an expansion is
probably more feasible at the Crossroads landfill in Norridgewock than at the Pine Tree
Landfill in Hampden. If Maine is to rely heavily on a single commercial landfill, it will
probably need to consider some form of public utility regulation to prevent price
escalation. Based upon our review of West Virginia’s efforts at price regulation of
landfill disposal, this does not seem like an inherently difficult task. Price cap regulation
may be more attractive than rate-base regulation. Price cap regulation requires less
regulatory effort and avoids incentives to cross-subsidize competitive business activity
from the regulated activities.
138

Fourth, Maine might consider strategies that increase the price of landfill disposal,
but with the proceeds of higher prices flowing to state or municipal governments, rather
than to commercial disposal sites. As RWS and the State Planning Office comments
suggest, higher landfill disposal prices encourage recycling and incineration. Simply
allowing landfill rates to increase as the existing capacity is filled will generate windfall
profits for commercial disposal sites. A preferable strategy may be to tax all landfilling
of waste. While the tax would probably be collected on a per-ton basis, the tax might be
differentiated by material to reflect the relative use of landfill space by different
materials. For example, the per-ton tax on incinerator ash might be lower than the per-
ton tax on MSW or bulky waste. This would provide an incentive use landfill space
efficiently. To offset the impact of such a tax on municipal budgets, the revenues could
be returned to communities to finance waste management budgets. For example, the
entire proceeds from a per-ton landfill fee could be returned to communities on a per
capita basis. The per-ton landfill fee would reward recycling and incineration, while the
per-capita return of the fees would minimize budgetary impacts. A tax on landfilling
would encourage recycling and reuse, because the tax could be avoided entirely for
material removed from the waste stream. A tax on landfilling would encourage
incineration, because incinerators reduce the tonnage and volume of waste. A tax on all
landfill disposal, from all sources, would also have the effect of discouraging imports and
encouraging exports of waste. If the goal is to stretch out existing landfill capacity for as
long as possible, the tax on landfilling should be implemented well before we start to run
out of capacity.
139

These policy options are not mutually exclusive. They could be combined to
achieve various combinations of policy objectives. There are likely other policy choices
to address the impact of declining landfill capacity on disposal prices. We are not
advocating here for a particular policy choice. But we do argue that this policy
discussion needs to begin. The longer we delay addressing this difficult policy area, the
fewer options the state will have to reconcile competing policy objectives.
140

Acknowledgements
Our work relied heavily upon the willingness of many individuals to share their
knowledge and expertise about various aspects of the solid waste management industry.
We are grateful for their many contributions and we extend our thanks for their
assistance. We would wish to acknowledge each of their contributions, but it is perhaps
inevitable that we will overlook some individuals. We apologize for any oversights.
The following individuals and organizations provided valuable comments on
preliminary drafts of our work: Barbara Stevens, Jim Hiltner, Jeff White, and Don
Meagher (Casella), Evan Richert and George MacDonald (State Planning Office), David
Lennett and Paula Clark (Department of Environmental Protection), Steve Changaris
(National Solid Waste Management Association), Nicholas Nadzo, Norman Justice, and
Charles Foshay (RWS), James Weiss and Gail Lynch (WMI), Greg Lounder (MRC),
Peter Prata (PERC), and Eric Higgins ( L. R. Higgins).
The following facilities provided data from their operations in Maine: Peter Prata
and Gary Stacey (PERC), Don Meagher (Casella, for Maine Energy and PTL), James
Weiss (WMI, for Crossroads), Charles Foshay and Rocco Marzilli (RWS), Joseph Kazar
(MMWAC), Ken Hensler (Tri-Community Landfill), Leslie Jones (Hatch Hill, Augusta),
and officials from the towns of Bath, Brunswick, Presque Isle, Greenville, and West
Forks.
Many individuals with various connections to the waste management industry in
Maine and elsewhere spoke or met with us. In addition to individuals who were
acknowledged above, these include: Geoff Herman (Maine Municipal Association), John
141

Halstead (University of New Hampshire), George Criner (University of Maine), Greg
Brown (Waterville), Stewart Marcoon (Lamoine), Paul Blanchette (Fairfield), Jim Porter
(Calais), Christine Therrien (Machias), Philip Marquis (Van Buren), Jim Guerra (Tri-
County Solid Waste Management Organization), Alison McCrady (Boothbay Region
Refuse Disposal District), Lee Yeaton (Pleasant River Solid Waste Disposal District),
Halldor Palsson (Canadian Competition Tribunal), Mark Cohen (U.S. Department of
Justice), Dan Harrington (South West Solid Waste Commission), Jean Bourque
(COGERNO), Ted Wolfe, Deanna St. Pierre, and David Wright (Department of
Environmental Protection), Richard Curry (Coastline Waste Services), Mitch Kessler
(private consultant), Senator John Martin, Senator John Nutting, Representative Robert
Duplessie, Senator Tom Sawyer, Representative Edward Povich, and Deborah Friedman
(Maine Legislature), Commissioner Thomas Welch (Maine PUC), Bill Flenner (Virginia
Public Service Commission), Chris Smith (Regulatory Commission of Alaska), Cathie
Anderson (Washington Utilities and Transportation Commission) and Bill Murdock (K-B
Corp.).
Nicholas Nadzo, Esq., (Jensen, Baird, Gardner & Henry) provided detailed legal
analysis of flow control options under the federal Commerce Clause. His analysis
formed the basis for our review of this issue. George MacDonald and Hank Tyler (State
Planning Office) patiently replied to our many requests for data and information. In
addition, George MacDonald brought his invaluable expertise to a full review of the final
draft of this report. We are particularly grateful for his assistance in this regard.
We wish to thank the forty-six towns (listed in Appendix B) that took the time to
respond to our survey.
142
The authors would also like to acknowledge the research assistance and editing
provided by Kathi Peters (Maine Attorney General’s Office) and Charlie Morris and
Chris Boynton (Margaret Chase Smith Center for Public Policy).
While the authors are grateful for the extensive support provided to this project,
they alone remain responsible for the contents of this report.
143

Cases Cited
Ben Oehrleins & Sons & Daughter v. Hennepin County, 115 F.3rd 1372 (8th Cir. 1997), cert. denied 522 U.S. 1029, 1036 (1997).
C&A Carbone, Inc. v. Town of Clarkstown, 511 U.S. 383 (1994). Chemical Waste Management, Inc. v. Hunt, 504 U.S. 334 (1992). City of Philadelphia v. New Jersey, 437 U.S. 617 (1978). Clark v. Rust Engineering Co., 595 A.2d 416 (Me. 1991). Director of Investigation and Research v. Laidlaw Waste Systems Ltd., 40 C.P.R. (3d)
289; 1992 C.P.R. LEXIS 1656 Exxon Corp. v. Governor of Maryland, 437 U.S. 117 (1978). Fort Gratiot Sanitary Landfill v. Michigan Department of Natural Resources, 504 U.S.
353 (1992). Gibbons v. Ogden, 22 U.S. 1 (1824). H.P. Hood & Sons v. DuMond, 336 U.S. 525, 539 (1949). Harvey & Harvey, Inc. v. County of Chester, 68 F.3rd 788 (3rd Cir. 1995), cert. denied 516
U.S. 1173 (1996). Houlton Citizens Coalition v. Town of Houlton, 175 F.3rd 178 (1st Cir. 1999). Huish Detergents, Inc. v. Warren County, 214 F.3rd 707 (6th Cir. 2000). In Re Proposed Merger of Consolidated Waste Service, Inc. and WM Maine I, Inc., (Me.
Super. Ct. Ken. C’ty, Oct. 1990). Maharg, Inc. v. Van Wert Solid Waste Management District, 249 F.3rd 544 (6th Cir.
2001). Maine v. Taylor, 477 U.S. 131, 149 (1986). Maine Beer & Wine Wholesalers v. State, 619 A.2d 94 (Me. 1993). MC Associates v. Town of Cape Elizabeth, 773 A. 2d 439 (Me. 2001).
144

National Solid Waste Management Association v. Meyer, 165 F.3rd 1151 (7th Cir. 1999). Oregon Waste Systems v. Department of Environmental Quality, 511 U.S. 93 (1994). Pike v. Bruce Church, Inc., 397 U.S. 137 (1970). Sal Tinnerello & Sons v. Town of Stonington, 141 F.3rd 46 (2nd Cir. 1998), cert. denied
525 U.S. 923 (1998). SSC Corp. v. Town of Smithtown, 66 F.3rd 502 (2nd Cir. 1995), cert. denied 516 U.S. 1112
(1996). State of Maine v. Casella Waste Systems, Inc., No. CV-99-212 (Me. Super. Ct., Ken C’ty
Sept. 1999). State of Maine v. Trainor, No. CV-87-260 (Me. Super. Ct, Ken. C’ty July 1987). State of Maine v. Truck-A-Way Systems, No. CV-83-450 (Me. Super. Ct. Ken. C’ty, Oct.
1984). Tri-State Rubbish, Inc. v. Waste Management, Inc., 998 F.2d 1073 (1st Cir. 1993). U&I Sanitation v. City of Columbus, 205 F.3rd 1063 (8th Cir. 2000). U.S. v. Allied Waste Industries, Inc., 2000 WL 33115588 (D.D.C., May 19, 2000). U.S. v. Allied Waste Industries, Inc., 2000 WL 33225559 (D.D.C., Sept. 8, 2000). U.S. v. BFI of Iowa, Inc., 1996 WL 426829 (D.D.C., March 5, 1996). U.S. v. Browning-Ferris Industries, Inc., 1995 WL 523613 (D.D.C., March 30, 1995). U.S. v. Private Sanitation Industry Association of Nassau/ Suffolk, Inc., 44 F.3rd 1082 (2nd
Cir. 1994). U.S. v. Reuter Recycling of Florida, Inc., 1996 WL 224761 (D.D.C., Jan. 22, 1996). U.S. v. USA Waste Services, Inc., 1998 WL 1285897 (N.D. Oh., Sept. 24, 1998). U.S. v. USA Waste Services, Inc., 1996 WL 812938 (D.D.C. Dec. 17, 1996). U.S. v. Waste Management, Inc., 1999 WL 1705508 (E.D. N.Y., Feb. 26, 1999). U.S. v. Waste Management of Georgia, Inc., 1996 WL 426830 (S.D. Ga., May 20, 1996).
145
USA Recycling, Inc. v. Town of Babylon, 66 F.3rd 1272 (2nd Cir. 1995), cert. denied 517 U.S. 1135 (1996).
United Haulers Association v. Oneida-Herkimer Solid Waste Management Authority, 261
F.3rd 245 (2nd Cir. 2001), cert. denied 2002 Lexis 270. United Waste Systems of Iowa, Inc. v. Wilson, 189 F.3rd 762 (8th Cir. 1999). Waste Management of Tennessee v. Metropolitan Gov’t of Nashville & Davidson County,
130 F.3rd 731 (6th Cir. 1997).
146

References
Anderson, P. 1998. “Comments by RecycleWorlds Consulting Corp. Pursuant to the Antitrust Procedures and Penalties Act on the Competitive Impact Statement, Consent Decree and Final Judgment In Re United States v. USA Waste Services in the District Court for the Northern District of Ohio Eastern Division Civil No. 98-CV-1616.” 18 pp.
Baumol, W. J., J. C. Panzar, and R. D. Willig. 1982. Contestable Markets and the Theory of Industrial Structure. New York: Harcourt Brace Jovanovich.
Beck, R. W. 1988. “State of Maine Solid Waste Disposal Capacity Needs Analysis.”
Prepared for Maine Department of Environmental Protection. December 1988. 11 pp.
Canadian Competition Tribunal. 1992. “Reasons for Order In the Matter of Laidlaw
Waste Systems, Ltd. (CT-91/02).”
Callan, S. J., and J. M. Thomas. 2001. “Economics of Scale and Scope: A Cost Analysis of Municipal Solid Waste Services.” Land Economics 77 (4): 548-560.
Cox, S. 1997. “Garbage In, Garbage Out: Court Confusion About the Dormant
Commerce Clause.” Oklahoma Law Review 50:155-156. Department of Justice. 1997. “Horizontal Merger Guidelines.” Dooley, F. J., D. A. Bangsund, and F. L. Leistritz. 1995. “Regional Landfills Offer Cost
Savings for Rural Communities.” Rural Development Perspectives 9 (3): 9-15. Goldstein, N. 2000. “The State of Garbage in America.” Biocycle April 2000,
Vol. 14 (4). Goldstein, N, and C. Madtes. 2001. “The State of Garbage.” Biocycle December 2001. Maine Department of Environmental Protection. 2002. “Active Landfills.” Website
address: www.state.me.us/dep/rwm/reports/ActiveLF.htm
Maine State Planning Office. 1996. Report of the Task Force on Solid Waste Landfills to the Joint Standing Committee on Natural Resources. 9 pp. + appendices
Maine State Planning Office. 1998. State of Maine Waste Management and Recycling
Plan. 82 pp.
147

Maine State Planning Office. 1999. Report of the Task Force Reviewing Solid Waste
Management Policies to the Joint Standing Committee on Natural Resources. 22 pp. + appendices.
Maine State Planning Office. 2000. “2000 Municipally Submitted Solid Waste Management Data.” Maine, 113th Legislature, First Regular Session. 1987. Study of Solid Waste
Management and Disposal Policy in Maine. June 18, 1987. 41 pp. + appendices. Maine, 119th Legislature, Second Regular Session. 2000. Interim Report of the Task
Force to Study Market Power Issues Related to the Solid Waste Hauling and Disposal Industry. 17 pp. + appendices.
New Brunswick Solid Waste Association. 2002. Website address:
www.nbsolidwaste.com New Hampshire. 2001. Report of the Governor’s Solid Waste Task Force. 76 pp. Noll, R. G. 1991. “Expert Affidavit.” Exhibit A-52 in Case CT-91/2 before the
Canadian Competition Tribunal. In the matter of Laidlaw Waste Systems, Ltd. Savas, E. S. 1987. Privatization: The Key to Better Government. Chatham, NJ:
Chatham House. Steuteville, R. 1995. “The State of Garbage.” Biocycle April 1995, pp. 54-63. Stevens, B. J. 1978. “Scale, Market Structure, and the Cost of Refuse Collection.”
Review of Economics and Statistics 60: 438-448.
Tickner, G., and J. C. McDavid. 1986. “Effects of Scale and Market Structure on the Costs of Residential Solid Waste Collection in Canadian Cities.” Public Finance Quarterly 14 (4): 371-393.
Waste Age. 2001. “8th Annual Waste Age 100.” September 1, 2001. Website address: www.industryclick.com/microsites/index.asp?srid=10023&magazineid=121&SiteID=27
148

APPENDIX A
Municipal Solid Waste Survey This questionnaire asks for the fees your municipality paid for: 1) disposal; and 2) hauling of: • municipal solid waste • construction and demolition debris • burn pile ash, and • tires. In addition, the questionnaire asks for any costs your municipality paid private vendors for curbside pick-up of municipal solid waste. Do not report the costs of curbside pick-up performed by municipal employees. We are asking for those municipal costs in both 2001 and in 1996. Because fiscal years and contracts vary, we are asking about the fees specified in contracts that were in effect on January 1 of each of those years. If, for some reason, information for 1996 is not available, we ask that you provide information for 1995 or 1997 and change the year accordingly on the questionnaire. Upon completion of the study, our report will be made available on the Margaret Chase Smith Center’s website, www.umaine.edu/mcsc. In that report, the information you provide on this questionnaire will not be associated with you personally or with the name of your municipality. Please complete and return this questionnaire in the enclosed postage-paid envelope as soon as possible. If you have any questions about the study or the questionnaire, please contact Charles E. Morris at the Margaret Chase Smith Center for Public Policy, 5715 Coburn Hall, University of Maine, Orono, Maine 04469; phone, 581-4135; email, [email protected]. We thank you in advance for your assistance in this important study. The following is being asked so that we may contact you for clarification if necessary. Name of municipality/disposal district: _____________________________________________ Name & title of person responding: ________________________________________________ Phone number: ___________________ email address: ______________________________
149

150
Fiscal year begins on: Month: _____________ Day: ___________
Municipal Solid Waste (MSW)
Curbside Pick-Up 2001 1996 Did municipal employees provide curbside pick-up of MSW? Yes No Yes No
Did your town contract with a private firm for pick-up of MSW? Yes No Yes No IF YES, what is the annual contract cost (not including tipping / disposal fees) for the contract in force that included January 1?
$__, __ __ __, __ __ __
$__, __ __ __ , __ __ __
Disposal
2001
1996 Did your town pay a per-ton disposal (“tipping”) fee for MSW? Yes No Yes No IF YES, what was the per-ton tipping fee on January 1? $ __ __ __ . __ __ $ __ __ __ . __ __ What disposal site did you use in 2001?____________________________________________________________ What disposal site did you use in 1996?____________________________________________________________ Please describe any other fees your town paid or rebates your town may have received on disposal of Municipal Solid Waste in 2001 _____________________________________________________________________________________ _____________________________________________________________________________________ in 1996 _____________________________________________________________________________________ _____________________________________________________________________________________�
Hauling
2001
1996 Did your town pay an independent contractor to haul municipal solid waste from a transfer station to a disposal site?
Yes No Yes No
IF YES, did the hauling cost include a fee per-trip? Yes No Yes No What was the fee per-trip on January 1? $ __ , __ __ __ . __ __ $ __ , __ __ __ . __
__ IF YES, did the hauling cost include a fee per-ton? Yes No Yes No What was the fee per-ton on January 1? $ __ __ __ . __ __ $ __ __ __ . __ __ Please describe any other fees your town paid for hauling Municipal Solid Waste in 2001 _____________________________________________________________________________________ _____________________________________________________________________________________ in 1996 _____________________________________________________________________________________ _____________________________________________________________________________________�

151
Construction and Demolition Debris (CDD)
Disposal
2001
1996
Did your town pay for disposal of construction and demolition debris? Yes No Yes No IF YES, what was the tipping fee per-ton of CDD on January 1? $ __ __ __ . __ __ $ __ __ __ . __ __ What disposal site did your town use for CDD in 2001?________________________________________________ What disposal site did your town use for CDD in 1996?________________________________________________ Please describe any other fees your town paid for disposal of construction and demolition debris in 2001 _____________________________________________________________________________________ _____________________________________________________________________________________ in 1996 _____________________________________________________________________________________ _____________________________________________________________________________________� If your town did not pay for CDD disposal, how was CDD disposed? in 2001 _____________________________________________________________________________________ _____________________________________________________________________________________ in 1996 _____________________________________________________________________________________ _____________________________________________________________________________________�
Hauling
2001
1996 Did your town pay an independent contractor to haul construction and demolition debris to a disposal site?
Yes No Yes No
IF YES, did the hauling cost include a fee per-trip? Yes No Yes No What was the fee per-trip on January 1? $ __ , __ __ __ . __
__ $ __ , __ __ __ . __ __
IF YES, did the hauling cost include a fee per-ton? Yes No Yes No What was the fee per-ton on January 1? $ __ __ __ . __ __ $ __ __ __ . __ __ Please describe any other fees your town paid for hauling construction and demolition debris in 2001 ______________________________________________________________________________________ ______________________________________________________________________________________ in 1996 ______________________________________________________________________________________ ______________________________________________________________________________________�
Burn Pile Ash
Disposal
2001
1996
152
Did your town pay for disposal of ash from a burn pile? Yes No Yes No IF YES, what was the tipping fee per-ton of ash on January 1? $ __ __ __ . __ __ $ __ __ __ . __ __ What disposal site did your town use for ash in 2001?________________________________________________ What disposal site did your town use for ash in 1996?________________________________________________
Hauling
2001
1996
Did your town pay an independent contractor to haul burn pile ash? Yes No Yes No IF YES, did the hauling cost include a fee per-trip? Yes No Yes No What was the fee per-trip on January 1? $ __ , __ __ __ . __
__ $ __ , __ __ __ . __ __
IF YES, did the hauling cost include a fee per-ton? Yes No Yes No What was the fee per-ton on January 1? $ __ __ __ . __ __ $ __ __ __ . __ __
Tires
Disposal
2001
1996
Did your town pay for disposal of tires (other than combining them with municipal solid waste)?
Yes No Yes No
Did the disposal cost include a fee per-ton? Yes No Yes No What was the fee per-ton on January 1? $ __ __ __ . __ __ $ __ __ __ . __ __ Did the disposal cost include a fee per-tire? Yes No Yes No IF YES, what was the fee per-passenger tire on January 1? $ __ __ __ . __ __ $ __ __ __ . __ __ IF YES, what was the fee per-truck tire on January 1? $ __ __ __ . __ __ $ __ __ __ . __ __ IF YES, what was the fee per-skidder tire on January 1? $ __ __ __ . __ __ $ __ __ __ . __ __ Did these tire disposal fees include hauling costs? Yes No Yes No IF NO, what tire hauling fees did you pay in 2001? ________________________________________________ What tire hauling fees did you pay in 1996? ________________________________________________ What disposal site did your town use for tires in 2001?________________________________________________ What disposal site did your town use for tires in 1996?________________________________________________�

153
APPENDIX B
LIST OF TOWNS AND DISTRICTS IN SURVEY SAMPLE
Acton Kennebunkport Belmont Leeds Berwick Medford Biddeford Monson Region Brewer Newry Brownfield Otisfield Carthage Passadumkeag Central Penobscot SWF Portland Clifton Pownal Dedham Rome Durham Sabattus Eddington Saco Embden Sebago Etna South Berwick Falmouth Standish Fayette Stonington Fryeburg Van Buren Greene Veazie Hartford Vienna Haynesville Waldoboro Solid Waste Facility Holden Oxford County Regional Solid Waste Corp.Islesboro Winterport K enduskeag Yarmouth

154


Appendix D
An Act To Promote And Monitor Competition In The Solid Waste Industry. Be it enacted by the people of the State of Maine as follows:
Sec. 1. Title 38 §________ is enacted to read: §________. Small container contract restrictions. 1. Definitions. As used in this section, the following terms have the following meanings.
A. “Small containerized solid waste hauling service” means providing solid waste collection, removal and hauling service to customers by providing the customer with a small container or dumpster that is picked up and emptied mechanically using a frontload or rearload truck, and expressly excludes hand pickup service, and service using a compactor that is attached to or part of a small container.
B. “Small container” means a 2 to 10 cubic yard container or dumpster. C. “Solid waste hauling” means the collection, removal and transportation to
a solid waste transfer station or disposal site of trash and garbage (but not construction and demolition debris, medical waste, hazardous waste, organic waste, special waste such as contaminated soil or sludge, or recyclable materials) from residential, commercial and industrial customers.
2. All contracts for the provision of small containerized solid waste hauling service to customers located in this State shall:
A. Permit customers to terminate such contracts by providing no more than 30 days notice prior to termination by any reasonable method, including, at a minimum, mail, fax and email; and
B. Limit the financial charge for early termination of the contract to a
maximum of the lesser of: $75; or two times the current monthly charge; or two times the average monthly charge during the most recent six-month period.
3. Notwithstanding the provisions of subsection (2) of this section, contracts for the provision of small containerized solid waste hauling service to customers located in this State may contain contract terms that do not conform to the requirements of subsection (2) when those alternative terms are specified in a bona fide request for proposals or request for bids initiated by the consumer. 4. Contracts for the provision of small containerized solid waste hauling service to customers located in this State may not require customers to inform a contractor concerning prices or other terms offered by competitors, or require customers to afford the contractor an opportunity to match or respond to a competitor’s offer.

5. Provisions in contracts in force on the effective date of this enactment that do not conform to the requirements of this section shall be unenforceable.
Sec. 2. Title 38 §2101, as enacted by P.L. 1989 C. 585 §A, 7, is amended by adding a new subsection 2 following subsection 1 as follows: 2. Competition. It is the policy of the State to ensure that municipalities and businesses enjoy reasonable competitive options for the management and disposal of solid waste.
Sec. 3. Title 38 §2124-A as enacted by P.L. 1995 c. 588 §4 is amended by adding the
following:
The report shall include an analysis of how changes in available disposal capacity have affected or are likely to affect disposal prices. When the office determines that a decline in available landfill capacity has generated or has the potential to generate supracompetitive prices, it shall include this finding in its report, and shall submit therewith a proposal for corrective legislation.
Sec. 4. Title 38 § 2231 as enacted by P.L. 1991 c. 676 § 1 by adding a new subsection 1-A
following subsection 1, as follows:
1-A. Landfill. “Landfill” means a facility that accepts municipal solid waste, FEPR, CDD, bulky waste, incinerator nonprocessibles, and incinerator ash, or any of the foregoing, and disposes of the waste through landfilling; and includes both commercial and municipal facilities.
Sec. 5. Title 38 § 2232 as enacted by 1991 c. 676 § 1 and amended by P.L. 1995 c. 656 §§ A-65-A-66, and further amended by P.L. 1999 c. 657 § 27, is further amended to read as follows:
Incineration facilities and landfills shall submit an annual report to the office no later than
90 days after the end of the facility's fiscal year. For reasonable cause shown and upon written application by an incineration facility or landfill, the office may grant an extension of the 90-day period. The report must be certified by an appropriate executive officer of the facility as being complete and accurate. The office may prescribe the form of the annual report and the number of copies that must be submitted. The report must include the following information: 1. Waste. The total weight in tons of all solid waste received by the incineration facility or landfill in the last completed fiscal year and each month of that year and a breakdown of these totals according to the waste types and waste source categories, as specified by the office; 2. Tipping fee. A schedule of various tipping fees imposed by the incineration facility or landfill on the facility's municipal and commercial customers over the last completed fiscal year including an identification of all changes in those fees and a similar schedule of fees to be imposed on municipal and commercial customers for the next fiscal year. The tipping fees for commercial customers must be set out separately by each rate charged to each category of commercial customer;

3. Revenue. The total revenue of the incineration facility or landfill from all sources for the last completed fiscal year and each month of that year. Revenue figures must identify revenues from each revenue source, including, but not limited to, revenues from disposal fees, disaggregated by waste type and waste source category as specified by the office, tipping fees and any revenue from sales of electricity to transmission and distribution utilities; 4. Other information. Any other information required by the office to comply with its obligations under this chapter.
SUMMARY
This bill imposes restrictions on the use of so-called “evergreen” contract clauses in small container commercial trash hauling contracts. The bill declares that it is the policy of the State to ensure that municipalities and businesses enjoy reasonable competitive options for the management and disposal of solid waste, and broadens the data collection and reporting responsibilities of the State Planning Office.