an assessment of long-term changes in anthropometric dimensions: secular trends … · in...
TRANSCRIPT

TECHNICAL REPORT NATICK/TR-91/006 An A£3o H\U
AN ASSESSMENT OF LONG-TERM CHANGES IN ANTHROPOMETRIC DIMENSIONS:
SECULAR TRENDS OF U.S. ARMY MALES
BY Thomas M. Greiner
Claire C. Gordon
December 1990
Final Report November 1988 - June 1990
APPROVED FOR PUBLIC RELEASE; DISTRIBUTION UNLIMITED
UNITED STATES ARMY NATICK RESEARCH, DEVELOPMENT AND ENGINEERING CENTER
NATICK, MASSACHUSETTS 01760-5020
SOLDIER SCIENCE DIRECTORATE
TECHNICAL LIBRARY U.S. AR.VY FIATiGK HD&E GENTES' ilATiCK, m 0I78Ö.-5ÜQ0

DISCLAIMERS
The findings contained in this report are not to
be construed as an official Department of the Army
position unless so designated by other authorized
documents.
Citation of trade names in this report does not
constitute an official endorsement or approval of
the use of such items.
DESTRUCTION NOTICE
lor Classified Documents:
Follow the procedures in DoD 5200.22-M, Industrial
Security Manual, Section 11-19 or DoD 5200.1-R,
Information Security Program Regulation, Chapter IX.
For Unclassified/Limited Distribution Documents:
Destroy by any method that prevents disclosure of
contents or reconstruction of the document.

UNCLASSIFIED5EC13:T ,cL AS~i , C NT , OF -- S -ILC:
Form AoDorovedREPORT DCC-M'NTATION PAGE O.VB No. 0704-0788
la. REPORT SECURITY CLASSIFICATION lb RESTRIC7IVE MARKINGS
UNCLASSIFIED
2a. SECURITY CLASSIFICATION AUTHORIT'? 3 DISTRIBUTION /AVAILABILITY OF REPORT
Approved for public release;2b. DECLASSIFICATION IDOWNGRADING SCHEDULE Distribution is unlimited
4. PERFORMING ORGANIZATION REPORT NUMBER(S) S MONITORING ORGANIZATION REPORT NUMBER(S)
NATICK/TR-91/006
6a. NAME OF PERFORMING ORGANIZATION 6t). OFFICE SYMBOL 7a. NAME OF MONITORING ORGANIZATION
US Arry Natick Research, De%)eloprrent (If applicable)
and Engineering Center STRNC-YBA
6c. ADDRESS (City, State, ana ZIP Code) 7b. ADDRESS (City, State, and ZIP Code)
Natick, MA 01760-5020
8a. NAME OF FUNDING iSPONSORING 8b. OFFICE SYMBOL 9 PROCUREMENT INSTRUMENT IDENTIFICATION NUMBERORGANIZATION (If applicabiok'
STRNC-YBA
8c. ADDRESS (City, State, an ZIP Code) 10 SOURCE OF FUNDING NUMBERS
PROGRAM PROJECT TASK WORK UNITELEMENT NO. NO. NO. ACCESSION NO.
728012.12 OMA
11. TITLE (Include Securrty Classification)An Assessment of Long-Term Changes in Anthropometric Dimer, ions:
Secular Trends of U.S. Army Males
12. PERSONAL AUTHOR(S)
Thomas M. Greiner and Claire C. Gordon
13a. TYPE OF REPORT 13b TIME COVERED 14. DATE OF REPORT (Year, Month, Day) 15. PAGE COUNTFinal FROM Nov 88 TOJ"90 December 1990 72
16. SUPPLEMENTARY NOTATION
17. COSATI CODES 18 SUBJECT TERMS (Continue on reverse if necessary and identify by block number)
FIELD GROUP SUB-GROUP Anthropometry Demography Secular TrendsSizes(Dimensions) Models Males
Race(Anthropology) Army Personnel19, ABSTRACT (Continue on reverse if necesury and identify by block number)
Data from the most recent US Army Anthropometric Survey provide aunique opportunity to assess long-term changes in body dimensions withinthe Army population. 'This report describesth .otaar tenAs4for 22body dimensions in four racial/cultural groups: Whites, Bla¢k;s,Hispanics and Asian/Pacific Islanders.
Individuals were grouped by birth year into 12 five-year cohorts,which span the years 1911 to 1970. Rates of change were calculated byregressing age-adjusted dimensions against cohort. Analyses of theserelationships showed that almost all dimensions sustained statisticallysignificant linear trends, the few exceptions being found within theAsian/Pacific Islanders group. Furthermore, except for theAsian/Pacific Islanders, the greatest relative rates of change werefound in dimensions related to soft tissue development rather thanskeletal dimensions. This pattern is consistent with the recent----
20 DISTRIBUTION/AVAILABILITY OF ABSTRACT 21 ABSTRACT SECURITY CLASSIFICATION
MU;,'CLASSIFIED/UNLIMITED [:1 SAME AS RPT C DTIC USERS UNCLASSIFIED
22a. NAME OF RESPONSIBLE INDIVIDUAL 12b TELEPHONE (Include Area Code) 22c. OFFICE SYMBOL
THOMAS M. GREINER (508) 651-4408 STRNC-YBA
00 Form 1473, JUN 86 Prevous eaitions are cb.oiere SEC'JR17Y CLASSIFICAT;ON OF TfrS DAC:
UNCLASSIFIED

19. ABSTACT (continued)
-,Azerican cultural emiasis on health and physical fitness. The markedlydifferent patterns seen in Asian/Pacific Islanders were best explained byimigration: they have experienced a linear increase in the proportion offoreign born members. /" 1 . 0
Finally, a method of applying these models to predict anthrocpetricdimensions of future ArmW populations is presented. The influery"% ofde=a-ic ccposition upon expected anthropavetric distributions isdemonstrated by predicting dinension values for six potential Army populationsin the year 2023. The utility, and limitations, of these models for predictingfuture anthropamtric dimensions are also discussed.
ii
TABLE OF CONTENTS
LIST OF FIGJRES v
LIST OF TABLES ix
PREFACE AND AC2 4 ENTS xi
1. INIROIUCION 1
2. METHODS 2
3. RESULTS AND DISCUSSIOtN 10
4. APPLICATION 15
5. MODEL LIMITATIONS 26
6. EEWTE 30
7. REFERENCES 31
8. APPENDIX I:Plots of Secular Change in the Four Racial/Cultural Groups 35
9. APPENDIX II:Program Source Code for Predicting Andhro.pmetric Dimensions 58
Aooession For
NTIS GRA&I~~DTIC TAB
Unannounced 0Ju6tiflcatio
By .Distributlon4
Avallabi l tr code --
Dit Spo----LLL

UST OF FIGJURS
1. vLcssal Guide to the Anthropotric Dimensions 3
2. Chianges Associated with Age Typical of Most AntqXuetricDizensicns 7
3. Plot of Chest Circumference vs. Birth Year Cohort for Whites 8
4. Plot of Age Adjusted Chest Circumference vs. Birth Year Oohortfor Whites 8
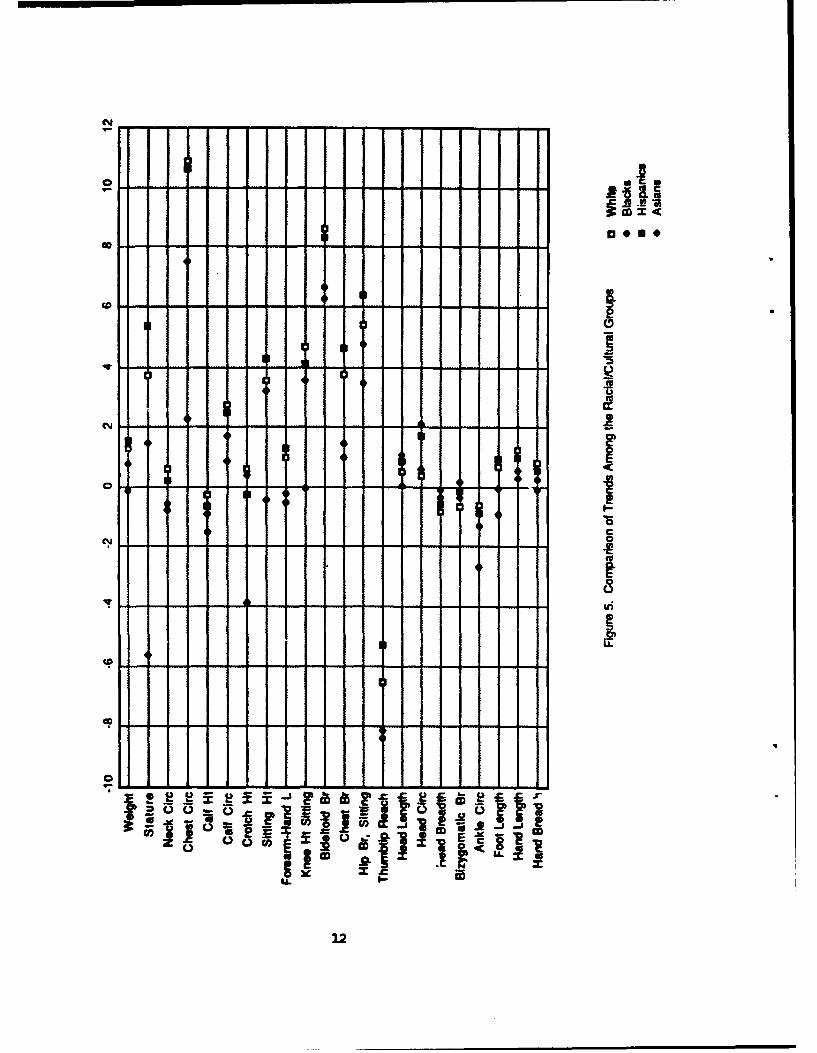
5. Qomparison of Trends Among the Racial/Cultural Groups 12
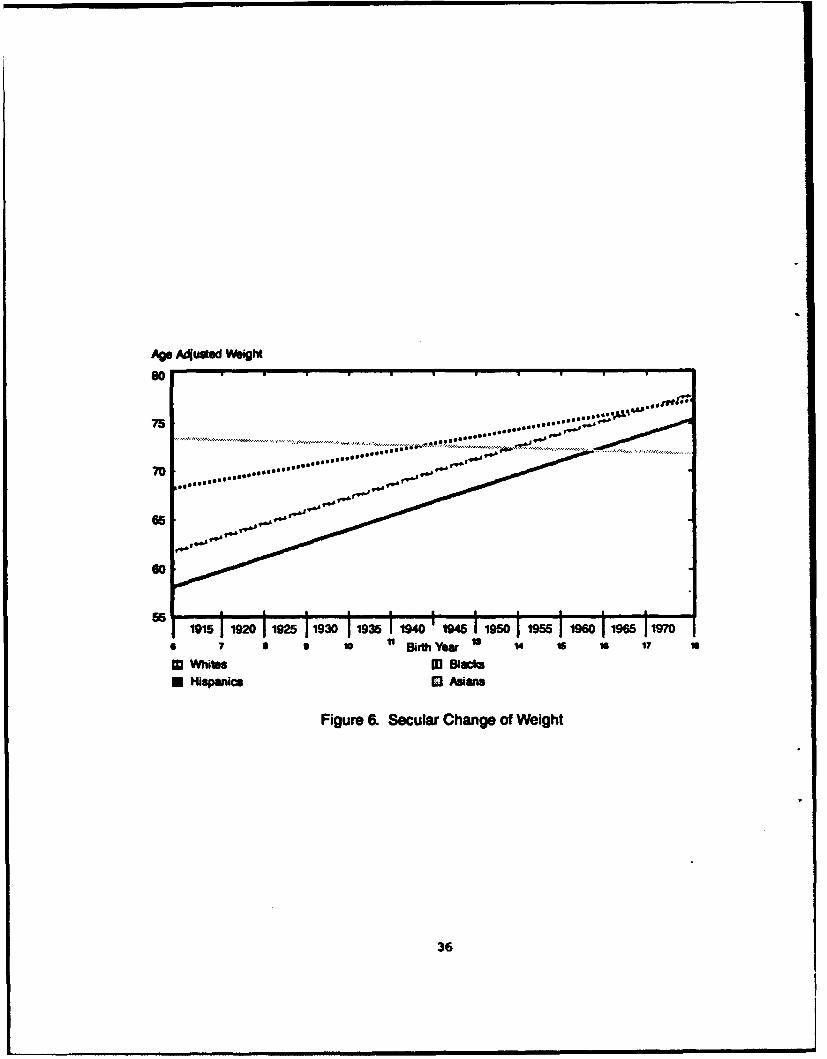
6. Secular Change of Weight 36
7. Secular Clange of Stature 37
8. Secular Change of Neck Circumference 38
9. Secular Change of Chest Circumference 39
10. Secular Change of Calf Height 40
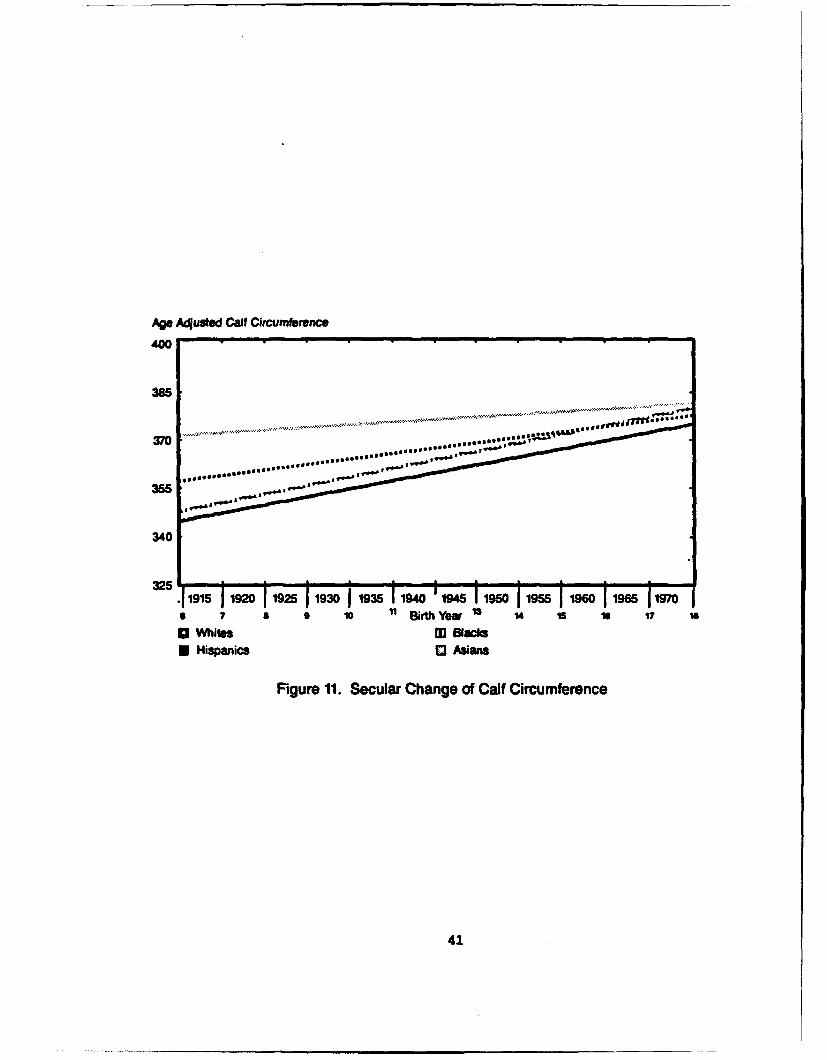
11. Secular Change of Calf Ciroumfererc 41
12. Secular Change of Crotch Height 42
13. Secular Change of Sitting Height 43
14. Seolar Chare of Forearm-Hard Length 44
15. Secular Change of Knee Height, Sitting 45
16. Secular Change of Bideltoid Breadth 46
17. Secular Change of Chest Breadth 47
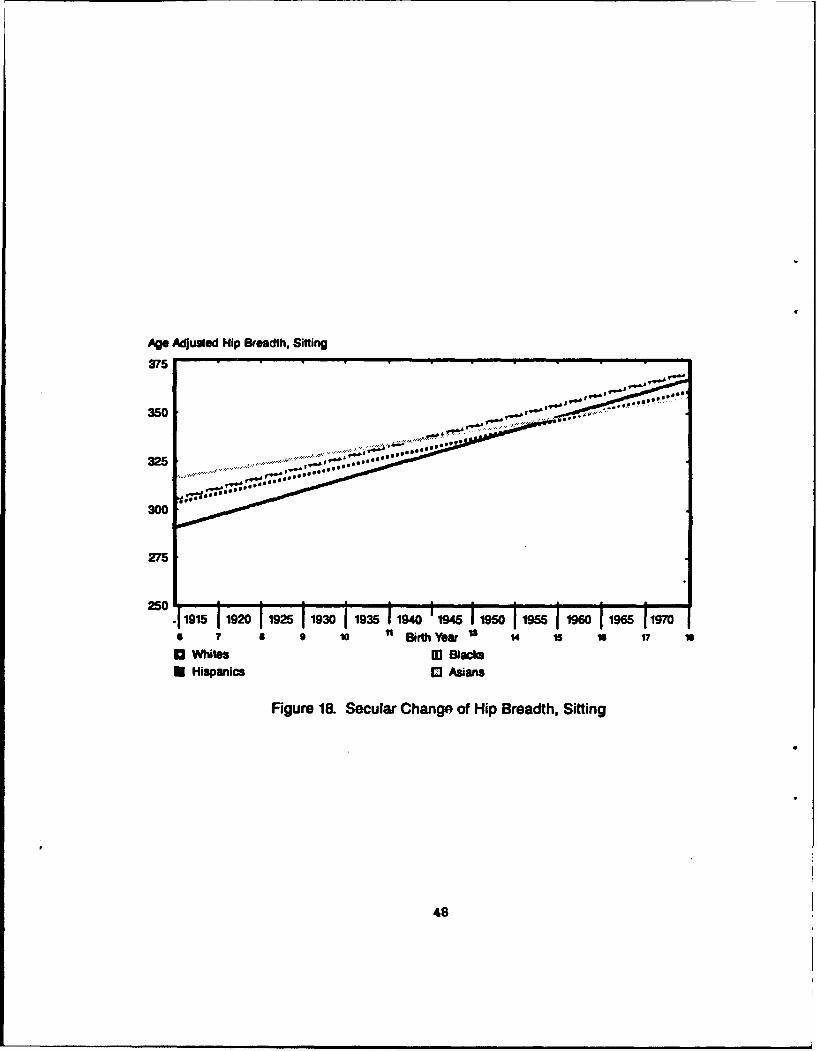
18. Secular Change of Hip Breadth, Sitting 48
19. Secular Change of Thubtip Reach 49
20. Secular Change of Head Length 50
21. Secular Change of Head Circumference 51
v
FIGURES CONT'D
22. Secular Change of Head Breadth 52
23. Secular Change of Bizygcmatic Breadth 53
24. Secular Chare of Ankle Circumference 54
25. Secular Change of Foot Length 55
26. Secu.lar Change of Hand lexqth 56
27. Secular Change of Hand Breadth 57
vii

LIST OF TABLES
Table
1. Cohort recakowr by Age and Birth-Year 4
2. Cohort Data Breakdown by Racial/Ciltural Group 5
3. Secular Trend Rates Within Racial/Culbral Groups 11
4. 1966 vs. 1988 Pooled Within-Groups Correlations BetweenMeasuremnts and Discriminant Functions 13
5. Evaluation of Immigration Patterns 16
6. Models for Whites 17
7. Models for Blacks 18
8. Models for Hispanics 19
9. Models for Asians/Pacific Islanders 20
10. Predicted Anthrqpcmetric Dimensions for 1946 22
11. Potential changes in Future Populations as Ozmpared to the1988 Survey Demographics 23
12. Demographic Breakdcwns of Population Projections for theYear 2023 24
13. Predicted Anthrocmietric Dimensions for the Year 2023 27
14. Predicted Time, in Years, for Measurable Cange to Occur 28
ix

PREFACE
This report is an outgrowth of research associated with the re:ent US ArmyAnthrOpametric Survey (ANSUR). As such, it represents one of the firstatterpts to use these data to address a critical anthropological researchquestion.
AMWEDNT
Research in the Anthropology Branch at NATICK is so mudh a collaborativeeffort that it is often difficult to assign primary credit for the results ofany project. Therefore, the contributions of the following people must beacknowledged: Sarah Donelson, Anthony Falsetti, Steven Paquette, KennethPartam, Robert Walker, and Ellen Wolfson. An extra note of gratitude goes toMs Wolfson, with later contributions by Rdert Petrin, for their efforts inpreparing the tables and graps within this report.
xi

1. INROUC NC
A secular trend is a progressive change correlated with tin. Seculartrends of human morphological traits spar~ing the last 200 years are welldocumented (Davenport and Iove, 1921; Morant, 1950; Trotter and Gleser, 1951b;Karpinos, 1958; Newman, 1963; Bawkin and Mclauglin, 1964; Damon, 1965; 1968;Polednak, 1975; Meredith, 1976; Mcullough, 1982; Taner, et al., 1982;Bradtmiller, et al., 1985; Sten, 1985; Takahashi, 1986; Ctrama, et al.,1987; Harlan, et al., 1988; Takamura, et al., 1988; Cline, et al., 1989).These descriptions focus on changes in adults, adolesents, or children.Generally, these trends are descriptions of changes in stature, weight, or thevarious milestones of maturity. Few reports discuss more than a handful ofanthropzmtric dimensions. Data are now available fro several anthropcoetricsurveys of the US Army (Newman and 1Wiite, 1951; %hite and O2wrchill, 1971;Gordon et al., 1989). These data provide a basis for an analysis of secularchange in a myriad of human body dimensions.
Many factors contribute to secular trends of antbropmetric dimensions.Although the root cause of secular trends rmains unknown, some of the morecomonly cited possibilities are: improved health, improved nutrition, changingrates of growth and maturation, assortative mating, immigration resulting innew population mixtures, imigration resulting in heterosis, changes insocioeconmic status, and changing cultural attitudes about physical fitness(Schreider, 1967; Meredith, 1976; Frisancho, 1977; Bielicki, et al., 1981;Flegal, et al., 1988; Lasker and Mascie-Taylor, 1989). A cplication existsin that, generally, these causes refer to populations - groups ofinterbreeding individuals. The Army, however, is not a population in thatsense, but rather a subsanple of the population of the United States. Becausethe Army is a reflection of that population, some of its secular trends will bederived from the same root causes. However, Army trends will also be affectedby changes in the Army's criteria for a pmtric standards, changes in theway the Army samples the main population (i.e., a draft versus an all-volunteerArmy), and changes in reasons for volunteering.
The Army anthropxmetric surveys also collected data on age zni race.Therefore, questions on how rates of change compare among racial subgroups canbe addressed. A preliminary investigation of these questions (Bradtmiller, etal., 1985) shows that statistically significant changes, in relation to age andrace, occurred for many body dimensions in the US Army population. Therefore,the potential influence of these trends on problem of sizing and design shouldbe investigated. The aims of this analysis are to: 1) quantitatively describethe secular trends of different dimensions for several racial/cultural groups;2) contrast the rates of change among those groups; 3) identify the grotp(s)that are undergoing the greatest secular changes; 4) identify particulardimensions that are showing the highest rates of change; 5) use these resultsto determine when measurable changes will occur in particular dimensions; and6) use these results to predict the anthrcxeic values of a future Armypopulation.
1

2. EIHODS
Data used in the analysis of male trends es from the 1966 and 1988anthrometric surveys of US Army men. A comparison of the measuringtechniques used in these two surveys (Mite and Churdill, 1971 and Clauser, etal., 1988) showed that there were 22 exactly comparable dimensions that can beinvestigated for secular trends (see Figure 1). Although the 1966 survey didnot collect data on race, Bradtmiller, et al. (1985) outline a method forconverting data on national origin into racial identifications. Therefore,this method was used, along with the race data collected in the 1988 survey, tosort the data into four racial/cultural groups: iutes, Blacks, Hispanics, andAsians/Pacific Islanders. Based on these groupings, 88 distinct models ofsecular change ware derived for US Army men.
Long-term trends were quantified using regression analysis. Because thereare only two data sets and because a model constructed fra only two values isinappropriate, the data were reorganized to develop meaningful models.Individuals ware grouped int cohorts that represent five year birth intervals(see Tables 1 and 2). This procedure divided the data from the two surveysinto 13 usable birth-year cohorts. However, both birth year and age atmeasurment vary within and between the surveys. Therefore, cohort dimensionswill vary for several reasons. Among the more important reasons are: 1)bserver error and methodological differei-s; 2) Age related changes; and 3)
Secular trerds. Because the analysis of secular trends is the crux of thisinvestigation, the first two effects should be controlled.
Only measurements cbtained through strictly comparable techniques wereanalyzed for secular trends. This careful check of comparability shouldminimize the effects of methodological differences. The influence of observererror, however, cannot be directly controlled. Instead, information onallowable observer error frum the 1988 survey (Clauser et al., 1988) was usedas a guide to determine the relevance of observed "secular" change. Althoughan observed change might be statistically significant, if it is not greaterthan the allowable observer error it may not be meaningful.
Ideally, regression analyses should be conducted using samples of equalvariance. This is, however, rarely the case in studies of secular trends. Toovercme this problem the mean value for each body dimension was calculated foreach cohort, and these were submitted to regression analysis. This method iscommonly used in secular change studies to overoume the limitations imposed bytraditional regression analyses (Trotter and Gleser, 1951a; 1951b; Newman,1963; Bawkin and Mclauglin, 1964; Hertzog, et al., 1969; Polednak, 1975; Himesand Mueller, 1977; Relethford and Lees, 1981; Borkan, et al., 1983; Price, etal., 1987). To acommodate very large differenes in sample sizes for eachcohort, each cohort's mean value was weighted by cohort size in the statisticalanalyses.
2

' 3.
4
r 7
10.
141
11 92
22
22
5 10
Figures 1. irculerene 1. tead Lnhooeth iesos1. Weit 12. hes7 Breadth
2. Stroh eih 13. Hipyoa Breadth tn3. Neckircuference 14. Ankleti CRcheec4. Coestrcumfe enth 15. Head Length
10. Knee Height, Sitting 21. Hand Length11. Bideltoid Breadth 22. Hand Breadth
3
3. Nck ircmfernc 14. Tumbti|Reac

TABLE 1.Cohort Breakdown by Age and Birth - Year
Cohort Birth - Year SubJcts' Ages According to Survey Year
I nterval 1988 1966
4 1900-1904 -62
5 1905-1909 61-57
6 1910-1914 56-52
7 1915-1919 51-47
8 1920-1924 -64 46-42
9 1925-1929 63-59 41-37
10 1930-1934 58-54 36-32
11 1935-1939 53-49 31-27
12 1940-1944 48-44 26-22
13 1945-1949 43-39 21-17
14 1950-1954 38-34 16-
15 1955-1959 33-29
16 1960-1964 28-24
17 1965-1969 23-19
18 1970-1974 18-
19 1975-1979
20 1980-1984
21 1985-1989
22 1990-1994
23 1995-1999
24 2000-2004
2 E 2005-2009
4
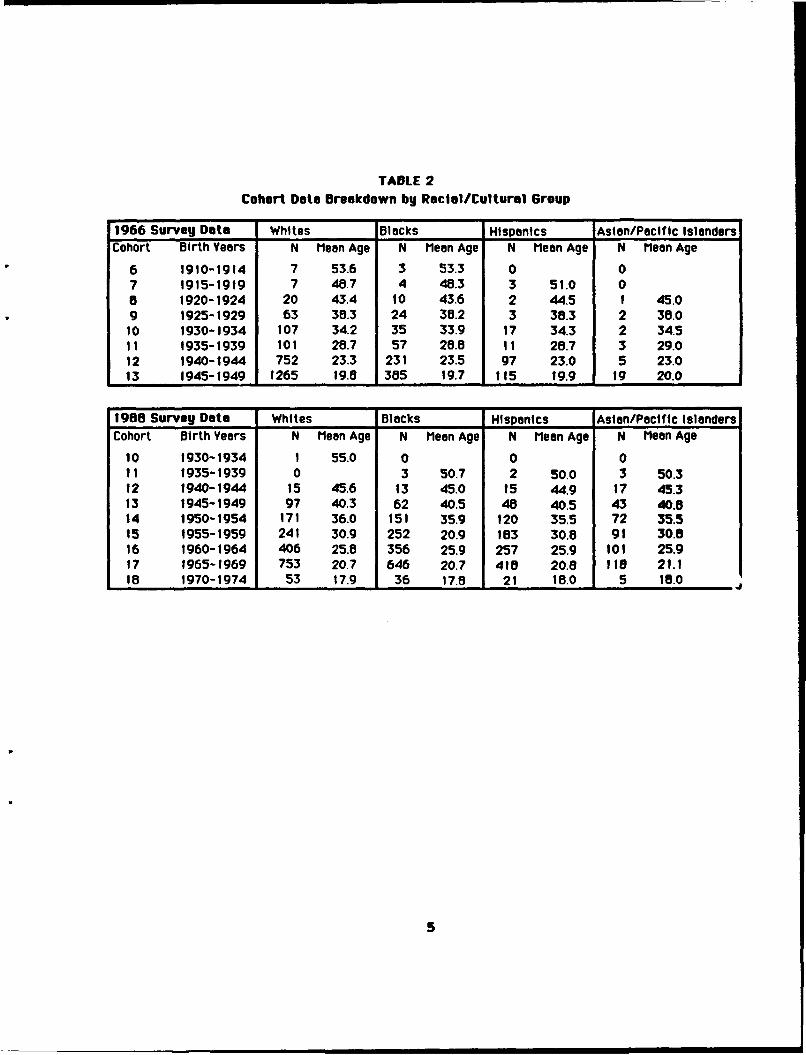
TABLE 2Cohort Data Breakdown by RaclallCultural Group
1966 Survey Data Whites Blacks Hispanics Asian/Pacific IslandersCohort Birth Years N Mean Age N Mean Age N Mean Age N Mean Age
6 1910-1914 7 53.6 3 53.3 0 07 1915-1919 7 487 4 48.3 3 51.0 0a 1920-1924 20 43.4 to 43.6 2 44.5 1 45.09 1925-1929 63 30.3 24 38.2 3 38.3 2 30.0
10 1930-1934 107 34.2 35 33.9 17 34.3 2 34.511 1935-1939 101 28.7 57 20.8 11 20.7 3 29.012 1940-1944 752 23.3 231 23.5 97 23.0 5 23.013 1945-1949 1265 19.8 385 19.7 115 19.9 19 20.0
1908 Survey Data Whites Blacks Hispanics Asian/Pacific IslandersCohort Birth Years N Mean Age N Mean Age N Mean Age N Mean Age
10 1930-1934 1 55.0 0 0 011 1935-1939 0 3 50.7 2 50.0 3 50.312 1940-1944 15 45.6 13 45.0 15 44.9 17 45.313 1945-1949 97 40.3 62 40.5 40 40.5 43 40.014 1950-1954 171 36.0 151 35.9 120 35.5 72 35.515 1955-1959 241 30.9 252 20.9 183 30.8 91 30.816 1960-1964 406 25.0 356 25.9 257 25.9 101 25.917 1965-1969 753 20.7 646 20.7 410 20.8 1i 21.11O 1970-1974 53 17.9 36 17.0 21 18.0 5 18.0
5

Controlling for age-related changes was more cxmplicated. Many dimensionsof the adult body change as a person ages (Trotter and Gleser, 1951a; Baer,1956; Hertzog, et al., 1969; Damon, et al., 1972; Himes and Mueller, 1977;Borkan, et al., 1983; Chumlea et al., 1988; Cline, et al., 1989). Typically,the adolescent growth spurt is followd by a lang period of little or nocarnge, whid is followed by a period of more rapid changes associated withsenescent decline (see Figure 2). The actual pattern and magnitude of thesechanges will vary for different anthropometric dimensions. The Armypopulation, however, is cmprised of men ranging fram 17 to about 50 years ofage. Therefore, age-related changes need only be examined within this range.Because this age range is not associated with rapid growth or decline, agerelated changes can be modelled as a straight line.
The cohorts used in this analysis vary by both age and birth year, i.e.,the same cohort drawn fram the two survey data bases will represent differentage groups. Therefore, the relationship between dimension and cohort isinfluenced by both age and secular changes. A plot of chest circumferenceversus cohort (see Figure 3) best illustrates this pattern. This example, andTable 1, show that the two surveys overlap by four cohorts. Because a cohortrepresents persons born in a specific interval of years, the observeddifference in values between a cohort in 1966 and the same cohort in 1988,represented by points A and B in Figure 2, must be because of age at the timeof measurement. This difference can be read as the dange due to age in a 22year period. Multiplying this value by 5/22 converts it into the rate of agerelated change per five year cohort. This creates a two point linear model ofage related change. As many as twenty such models, one for each birth-year inthe four overlapping cohorts, were generated in this fashion for eachan ic dimension in each racial/cultural graup. The inherent weaknessof a two-point linear model was addressed by using the mean value of the slopesof these models, for each dimension within a racial/cultural group, as the bestestimate of the rate of change due to aging (Hyde, 1980). Rates of age-relatedchange calculated in this fashion are comparable to previously reported values(Cline et al., 1989).
Mean rates of age-related change were used to factor aut the effects of agewithin each cohort. An age was chosen to represent the age of stardardexpression for anthrtcetric dimensions. Deviations fram this age were thenadjusted to control for age related effects (Relethford and Iees, 1981; Borkan,et al., 1983). Assuming that anthropcmetric dimensions reach their maximum, ormature, value at age 201, age adjusted values were calculated for eachdimension according to the following equation:
AAV = V - AF (((Y - 1900)/5) - C). (1)
In this equation AAV is the Age Adjusted Value; V is the observedanthropometric Value; AF is the Age correction Factor; Y is the survey Yearranded dawn to 5 year intervals; and C is the birth year Cohort. The term(Y-1900)/5 works out to the age cohort that would include 20 year olds for theyear Y. Figure 4, which is a plot of age adjusted values for chestciroamference versus ohtort, shaws the results of this transformation.
6

A B
C
C0
0 20 40 60 soAge
Figure 2. Chan ges associated with age typical of most anthropometricdimensions. See text for further discussion.
7

1200
1150
1100
1050
-100 a o
1 950 a
900 , . . 9 1 1 16 7 8 9 1011 12 13 14 1516 17 18
a 1966 Cohort0 1988
Figure 3. Plot of Chest Circumference vs. Birth Year Cohort for Whites
1000-
950 *
900
850
& 8001 1 1 1 1 1 1 1 1 1 .6 7 8 9 10 11 12 13 14 15 16 17 18
a low Cohort
0 1988
Figure 4. Plot of Age Adjusted Chest Circumference
vs. Birth Year Cohort for Whites
8

Presumably the remaining minor differences between two age adjusted values forthe same cohort are the results of unctrollable sampling and oberver error.
Secular trends were studied by regressing the age adjusted dimensions withcohort. These bivariate regressions produce the following generic equation:
AAV = a C + b. (2)
In this linear equation b is the y-intercept constant and a is the slope of theline. Because this equation describes the relationship between cohort (time)and an anthrcpcmetric dimension, controlled for non-secular influences, theterm a is the rate of secular change.
This linear equation was made into a predictive model by catbining it withequation one and solving the relationship for V, the original anthropmetricvalue, as follows:
V - AF (((Y - 1900)/5) - C) = a C + b. (3)
Adding the term AF (((Y - 1900)/5) - C) to both sides of the equation produces:
V=aC+b+ AF(((Y-1900)/5) -C). (4)
Simplifying the equation:
V = a C + b + AF (Y- 1900)/5 - AF C (5)
V = (a - AF) C + (b + AF (Y - 1900)/5) (6)
For a given year the terms b + AF (Y - 1900)/5 and (a - AF) will be constant.Therefore, equation six is a linear model that predicts V, whereb + AF (Y - 1900)/5 is the y-intercept and (a - AF) is the slope. Because thisequation is equivalent to Equation 2 it can be described by the same regressionstatistics. Thus, F tests, crrected for 22 simultaneous comparisons, wereused to evaluate the significance of the regression slope. In addition, thestandard error of the estimate (SEE) values calculated for equation two wereused to rate the confidence of predicted values.
Rates of secular change were cumpared between racial/cultural groups bytesting equality of regression slopes with analysis of covariance software.Slope comparisons with low F values and significance levels greater than 0.05,corrected for 11 simultaneous omqpariscns, were not considered to bestatistically different. This information was used to determine which groupswere undergoing markedly different trends for specific dimensions.
Discriminant analysis was then used to determine which dimensicns wereundergoing the most change relative to the other body dimensions. Thisanalysis was conducted by using the age adjusted dimensions to discriminatebetween the 1966 and 1988 survey populations. Those dimensions that showed thehighest within-group, correlations were identified as having changed the most.Patterns of dange were then cmpared by repeating this analysis for eachracial/cultural group.
9

3. RESULTS AND DISCUSSIC
The relationships between birth year cohort and the anthrcmetricdimensions are presented as Appendix I (Figures 6 through 27). Table 3 liststhe secular trends rates revealed by these relationships. The rate of secularchange for the stature of Wites estimated here (3.71 m per cohort or 0.7 cmper decade) is cparable to the ccmmm ly reported rate of 0.6 cm per decade(Bradtmiller et al., 1985; Annis, 1978). Several trends described in Table 3,all associated with Asians/Pacific Islanders, are not significantly differentfrom zero. This lack of relatinship implies that these dimensions are notunergoing significant secular trends. Visual inspection of the plots of somedimensions also suggest that, although significant slopes were dserved, theserates of chage may be decreasing. In these dimnsions secular change may nolonger be occurrir, or is occurring at a greatly reduced rate. Dimensionswith these patterns are: in Whites - calf height, crotch height, headbreadth, bizygomzatic breadth, and hand breadth; in Blacks - calf heightforearm-hard length, head length, head breadth, bizygamatic breadth, footlength, hand length, and hand breadth; in Hispanics - neck circumference,crotch height, sitting height, head breadth, bizygomatic breadth, and bandbreadth; and in Asians/Pacific Islanders - weight, sitting height,forearm-hand length, knee height sitting, head breadth, bizygainatic breadth,hard length, and hand breadth. All dimensions were explored using non-linearregression techniques. In no instance, however, were models markedly inproved,as judged by correlations and standard errors. Therefore linear models wereretained for all dinensions.
Qomparisons of secular change rates are presented in Figure 5. Tests forthe equality of slopes showed that all groups had significantly different ratesof secular change (p<.05), with the following exceptions: Blacks, Hispanicsand Asians/Pacific Islanders showed no significant differences in the rate ofchange for head breadth. Blacks and Asians/Pacific Islanders showed nosignificant differences in rates for five dimensions: neck circumference,bideltoid breadth, thunbtip reach, head length, and hand length. Blacks andHispanics showed no significant differences in rates for two dimensions: calfheight and bizygcumatic breadth. Whites and Hispanics showed no significantdifferences in rates for three dimensions: chest circumference, bideltoidbreadth, and hand breadth. In addition, Mtites and Hispanics showed verysimilar rates of change in 14 more dimensions.
Table 4 shows the results of the discriminant analyses. Those dimensionswith the highest within-group correlation to the discriminant function show thegreatest amrents of change between the survey years. Therefore, thosedimensions were judged to have undergone the most secular change. The analysiswas first used to test the entire sample of pooled races to determine thebaseline pattern of change for the entire population. In the test of pooledraces the measurements related to soft tissue (i.e., muscle and fat) were mosthighly correlated with discrimination; whereas skeletal dimensions, such asstature and head breadth, were poorly correlated with discrimination. This
10

TABLE 3.Secular Trend Rates Within Racial/Cultural Groups
Dimension Whites Blacks Hispanics Asians
Weight 1.36 0.77 1.44 -0.13'
Stature 3.71 1.46 5.34 -5.64
Neck Circumference 0.59 -0.66 0.22 -0.72
Chest Ci rcumference 10.78 7.48 10.74 2.26
Calf Height -0.27 -0.76 -0.70 -1.53
Calf Circumference 2.67 1.69 2.51 0.83
Crotch Height 0.46 0.44 -0.26 -3.88
Sitting Height 3.57 3.21 4.27 -0.42
Forearm-Hand Length 0.99 -0.22 1.27 -0.51
Knee Height, Sitting 4.68 3.55 4.09 -0.06'
Bideltoid Breadth 8.54 6.63 8.39 6.27
Chest Breadth 3.78 0.97 4.63 1.43
Hi p Breadt h, Sitting 5.41 4.77 6.37 3.46
Thumbtip Reach -6.53 -8.34 -5.29 -8.11
Head Length 0.51 0.03 0.79 0.89
Head Circumference 0.52 0.54 1.69 2.11
Head Breadth -0.25 -0.17 -0.18 -0.14
Bizygomatic Breadth -0.09 -0.05 -0.05 0.05'
Ankle Circumference -0.71 -1.28 -0.81 -2.67
Foot Length 0.71 -0.06 0.82 -0.92
Hand Length 0.98 0.40 0.91 0.44
Hand Breadth 0.46 0.25 0.44 -0.09
Val ues are presented in millimeters per cohort, which can be read as millimeters changeper five years. Data on weight are presented in kilograms per cohort. Trends markedwith a dagger (t) are not significantly different from zero at the .05 level.
11
122
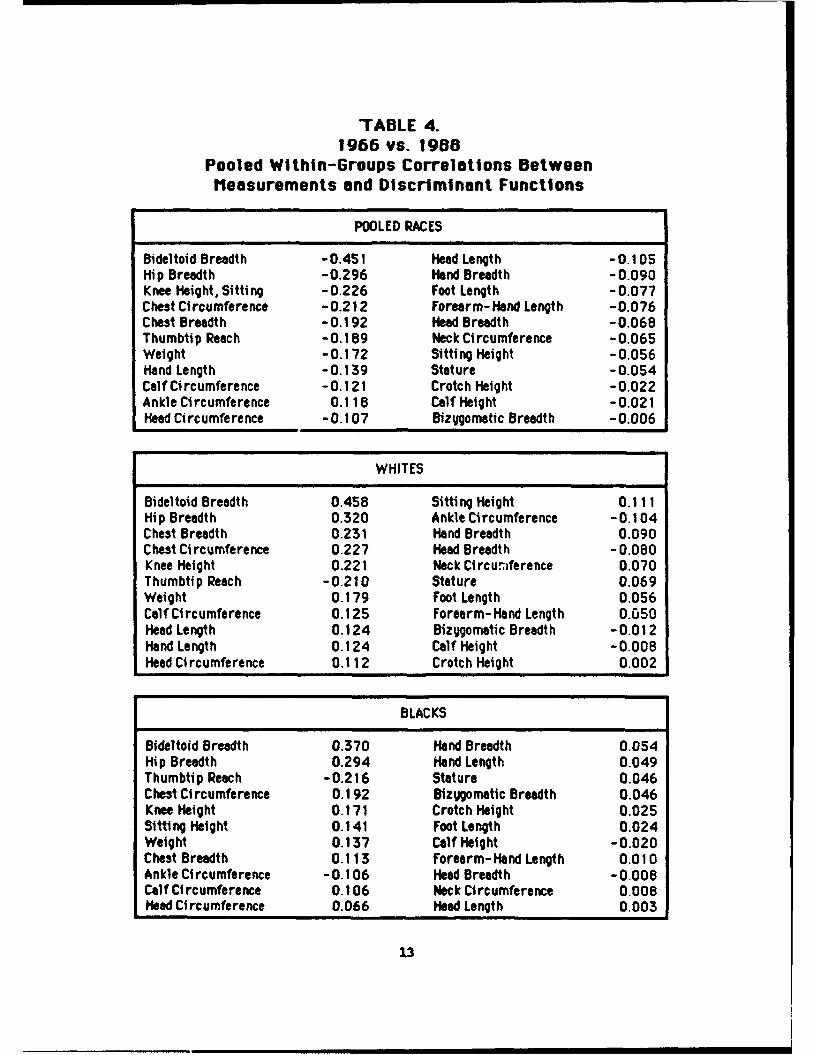
TABLE 4.1966 vs. 1980
Pooled Within-Groups Correlations BetweenMeasurements and Discriminant Functions
POOLED RACES
Bideltoid Breadth -0.451 Head Length -0.105Hip Breadth -0.296 Hand Breadth -0.090Knee Height, Sitti ng -0.226 Foot Length -0.077Chest Circumference -0.212 Forearm- Hand Length -0.076Chest Breadth -0.192 Head Breadth -0.068Thumbtip Reach -0.189 Neck Circumference -0.065Weight -0.172 Sitti ng Height -0.056Hand Length -0.139 Stature -0.054Calf Circumference -0.121 Crotch Height -0.022Ankle Circumference 0.118 Calf Height -0.021Head Circumference -0.107 Bizygomatic Breadth -0.006
WHITES
Bideltoid Breadth 0.458 Sitti ng Height 0.111Hi p Breadth 0.320 Ankle Circumference -0.104Chest Breadth 0.231 Hand Breadth 0.090Chest Circumference 0.227 Head Breadth -0.080Knee Height 0.221 Neck Circum;ference 0.070Thumbtip Reach -0.210 Stature 0.069Weight 0.179 Foot Length 0.056Calf Circumference 0.125 Forearm- Hand Length 0.050Head Length 0.124 Bizygomatic Breadth -0.012Hand Length 0.124 Calf Height -0.008Head Circumference 0.112 Crotch Height 0.002
BLACKS
Bideltoid Breadth 0.370 Hand Breadth 0.054Hip Breadth 0.294 Hand Length 0.049Thumbtip Reach -0.216 Stature 0.046Chest Circumference 0.192 Blzygomatic Breadth 0.046Knee Height 0.171 Crotch Height 0.025Sitting Height 0.141 Foot Length 0.024Weight 0.137 Calf Height -0.020Chest Breadth 0.113 Forearm- Hand Length 0.010Ankle Circumference -0.106 Heed Breadth -0.008Calf Ci rcumference 0.106 Neck Circumference 0.008Head Circumference 0.066 Head Length 0.003
13

TABLE 4.(Continued)
1966 vs. 1918Pooled Within-Groups Correlations BetweenMeasurements and Discriminant Functions
HISPANICS
Bideltoid Breadth 0.448 Sitting Height 0.095Hip Breadth 0.327 Head Length 0.091Chest Breadth 0.245 Foot Length 0.083Chest Circumference 0.243 Forearm- Hand Length 0.075Weight 0.208 Ankle Circumference -0.072Knee Height 0.188 Neck Circumference 0.069Calf Circumference 0.164 Stature 0.061Thumbtip Reach -0.158 Bizygomatic Breadth 0.044Head Circumference 0.118 Calf Height -0.034Hand Breadth 0.114 Head Breadth -0.012Hand Length 0.114 Crotch Height 0.012
ASI.AN/PACIFIC ISLANDERS
Bideltoid Breadth -0.256 Head Breadth 0.068Thumbtip Reach 0.211 Weight -0.058Ankle Circumference 0.173 Head Ci rcumference - 0.042Hip Breadth -0.170 Sitting Height 0.036Calf Height 0.122 Bizygomatic Breadth 0.028Crotch Height 0.118 Head Length -0.028Chest Circumference -0.105 Forearm- Hand Length 0.014Hand Length -0.092 Foot Length -0.012Stature 0.088 Neck Ci rcumference -0.009Chest Breadth -0.079 Knee Height -0.003Calf Circumference -0.071 Hand Breadth 0.001
14

pattern was, for the must part, reflected in the results of separatediscriminant analyses of each group. Because skeletal dimensions had thelowest correlation with discrimination the traditional explanations ofincreased health and nutrition cannot be invoked as important contributors tothe observed secular trends. Instead, these patterns may reflect the influenceof the recent cultural emphases on physical fitness and the "ideal" body, whichould be expected to affect the muscle/fat dependent measurements more than theskeletal dimensions (Takahashi, 1986).
The sole exception to this discrimination pattern was the Asian/PacificIslanders. The correlations of Asian/Pacific Islanders mirrored their generaltrend of decreasing anthrcpcmetric dimensions and suggested that culturalfactors may not be the best explanation of change in this group. Anexplanation for this difference was found in the immigration patterns of thefour greups.
Immigration patterns are presented in Table 5. These patterns wereevaluated using a Mantel-Haenszel/Chi-Square test (Mantel, 1963) of the linearrelationship between birthplace (USA vs. non-USA). Adjacent cohorts weresometimes pooled in these analyses to avoid sparse cells that would cxmprtmisethe validity of the Mantel-Haenszel test. Cells were scored according to themedian birth year of their membership. These tests showed no significantdifferences in the immigration pattern of Mites. Blacks and Hispanics bothshowed significant patterns of linear increase in the number of non-USA bornmembers, but these groups are still primarily ccmprised of native bornAmericans. Therefore, the effects of immigration may not be strong enough tohave had a large influence on their secular change patterns. Asians/PacificIslanders also show significant differences in their immigration pattern. Thisdifference was primarily because of a shift towards non-American bornmebership, with the Philippines as the modal birthplace. This suggests thatmigration is the primary influencing factor for the observed secular changes ofAsians/Pacific Islanders.
4. APPLICATION
Tables 6 through 9 present the linear models generated in this analysis.These models may be used by substituting the values for the constant (b),secular trend (a) and age trend (AF) into Equation 6. This will provide aprediction of an anthropxmtric dimension (V) for a specific cohort in aparticular year. Demographic information on age distributions should be usedto weight the predicted value for each cohort to determine an average value fora particular year.
This method was developed to predict the anthropazetric dimensions of afuture Army population. Its use, however, can be illustrated by predictingaverage values for a previous US Army anthruixmric survey. The results ofthe 1946 survey of US Army personnel (Newman and White, 1951) reports values ofWhite men. Therefore, the models for White men reported in Table 6 can be usedto predict dimensions of the 1946 Army that can be checked against the reportedvalues.
15

TABLE 5Evalunation of Immigration Patterns
WHITES: Observed/Expected Values
Bi rt hplace Median Blrthyjear_____1930 1943 1946 1951 1956 1961 1967
LISA 204 832 1318 164 228 388 770198.1 838.6 1315.8 165.2 232.8 392.2 761.3
Non- USA 1 36 44 7 13 18 181 7.0 29.4 46.2 5.8 8.2 13.8 26.7
Mantel-Haenszel Chi Scuare - 0.008 d.f. a 1 p.-.931
BLACKS: Observed/Expected Values
Bi rthpl ace Median Birthyear
USA 378 443 387 344 661
9.2 10.8 9.8 8.6 16.5
Me ntel -Hae nszel C hi Sq uare - 10.660 d.f. - 1 p - .001
HISPANICS: Observed/Expected Values
Birthplace Median Birthyear_____1943 1946 1952 1956 1961 1966
USA 56 88 61 86 141 30384.0 91.3 67.2 102.5 144.0 245.9
Non-USA 94 75 59 97 116 1361 66.0 71.7 52.8 80.5 113.0 193.1
Mantel-Haenszel Chi Square = 42.23 1 d.f. a 1 p -. 000
ASIANS. Observed/Expected Values
Birthplace Mein Birthyear_____1942 1946 1952 1957 1961 1966
USA 16 21 14 12 22 338.1 15.2 17.6 22.3 24.7 30.1
NnUA 17 41 58 79 79 9024.9 46.8 54.4 68.7 76.3 92.9
Mantel -Hoe nszel Chi Square - 4.270 d.f. - 1 p *.039
16
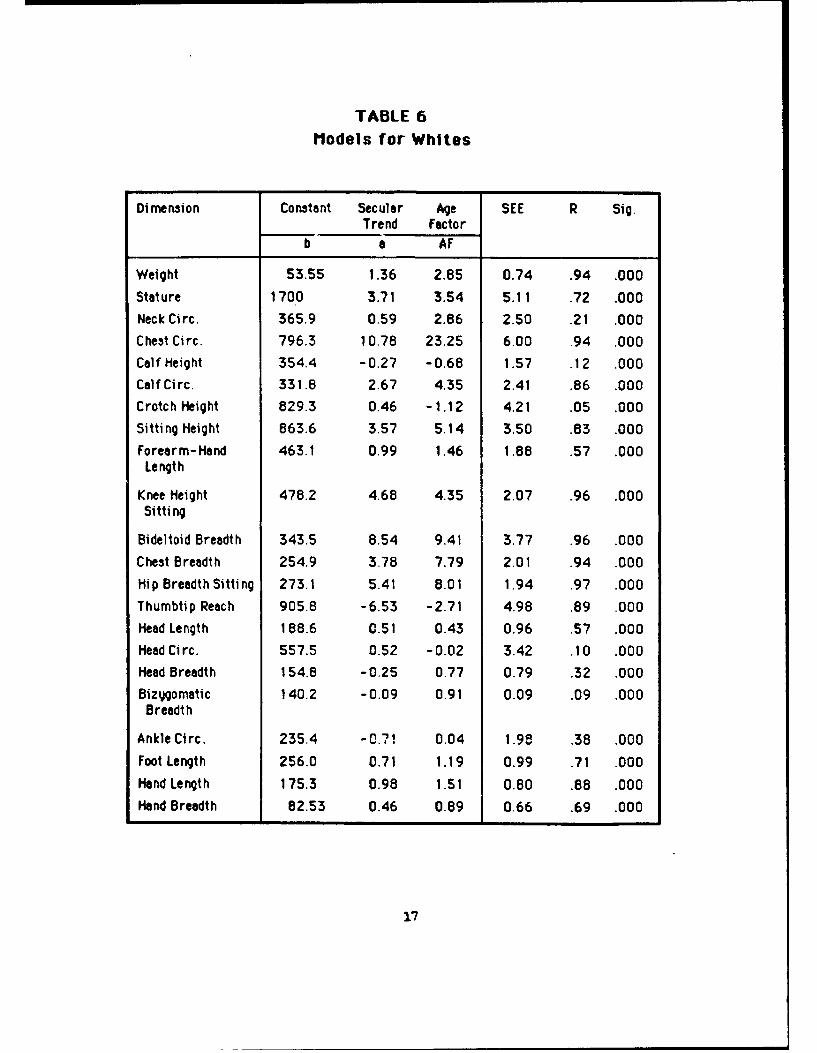
TABLE 6Models for Whites
Dimension Contant Secular Age SEE R Sig.Trend Factor
b a AF
Weight 53.55 1.36 2.85 0.74 .94 .000Stature 1700 3.71 3.54 5.11 .72 .000Neck Circ. 365.9 0.59 2.86 2.50 .21 .000Chest Circ. 796.3 10.78 23.25 6.00 .94 .000Calf Height 354.4 -0.27 -0.68 1.57 .12 .000Calf Circ. 331.8 2.67 4.35 2.41 .86 .000Crotch Height 829.3 0.46 -1.12 4.21 .05 .000Sitting Height 863.6 3.57 5.14 3.50 .83 .000Forearm- Hand 463.1 0.99 1.46 1.88 .57 .000Length
Knee Height 478.2 4.68 4.35 2.07 .96 .000Sitting
Bideltoid Breadth 343.5 8.54 9.41 3.77 .96 .000Chest Breadth 254.9 3.78 7.79 2.01 .94 .000Hip Breadth Sitting 273.1 5.41 8.01 1.94 .97 .000Thumbtip Reach 905.8 -6.53 -2.71 4.98 .89 .000Head Length 188.6 0.51 0.43 0.96 .57 .000Head Circ. 557.5 0.52 -0.02 3.42 .10 .000Head Breadth 154.8 -0.25 0.77 0.79 .32 .000Bizygomatic 140.2 -0.09 0.91 0.09 .09 .000Breadth
Ankle Circ. 235.4 -0.71 0.04 1.98 .38 .000Foot Length 256.0 0.71 1.19 0.99 .71 .000Hand Length 175.3 0.98 1.51 0.80 .88 .000Hand Breadth 82.53 0.46 0.89 0.66 .69 .000
17

TABLE 7Models for Blacks
Dimension Constant Secular Age SEE R Sig.Trend Factor
b a AF
Weight 6-.56 0.77 2.11 1.74 .48 .000
Stature 1732 1.46 -1.19 5.86 .23 .000
Neck Circ. 389.4 -0.66 0.87 3.24 .17 .000
Chest Circ. 835.1 7.48 18.89 9.68 .74 .000
Calf Height 382.8 -0.76 -2.20 2.87 .25 .000
Calf Circ. 347.2 1.69 2.80 3.30 .57 .000
Crotch Height 855.7 0.44 -4.77 4.10 .05 .000
Sitting Height 835.6 3.21 2.39 3.54 .80 .000
Forearm-Hand 502.6 -0.22 -0.18 1.79 .07 .000Length
Knee Height 509.6 3.55 2.87 2.30 .92 .000Sitti ng
Bideltoid Breadth 376.4 6.63 7.71 5.63 .87 .000
Chest Breadth 290.7 0.97 4.58 3.65 .25 .000
Hip Breadth Sitting 274.9 4.77 6.98 4.83 .82 .000
Thumbtip Reach 959.6 -8.34 -7.89 3.46 .97 .000
Head Length 196.7 0.03 0.53 0.51 .02 o00
Head Circ. 557.3 0.54 2.36 1.38 .42 .000
Head Breadth 153.4 -0.17 0.41 0.56 .30 .000
BizYgomatic 141.1 -0.05 0.56 0.84 .02 .000Breadth
Ankle Circ. 241.1 -1.28 -0.76 1.38 .80 .000
Foot Length 275.0 0.06 -0.10 1.04 .01 .000
Hand Length 192.0 0.40 1.16 0.71 .60 .000
Hand Breadth 86.34 0.25 0.84 0.45 .61 .000
18

TABLE BModels for Hispanics
Di mension Constant Secular Age SEE R Sig.
Trend Factorb a AF
Weight 49.50 1.44 2.29 1.32 .82 .000Stature 1622 5.34 2.77 7.60 .65 .000Neck Circ. 369.0 0.22 2.06 2.90 .02 .000Chet Circ. 792.4 10.74 20.57 8.66 .85 .000Calf Height 357.3 -0.70 -2.58 2.66 .21 .000Calf Circ. 329.7 2.51 1.83 3.95 .60 .000Crotch Height 816.0 -0.26 -5.84 3.90 .02 .000Sitting Height 823.8 4.27 4.91 5.07 .85 .000Forearm- Hand 450.1 1.27 0.05 2.70 .45 .000Length
Knee Height 475.3 4.09 2.46 2.60 .90 .000Sitti ng
Bideltoid Breadth 344.0 8.39 8.87 3.88 .95 .000
Chest Breadth 239.2 4.63 8.42 2.51 .93 .000Hip Breadth Sitting 252.4 6.37 8.38 2.47 .96 .000Thumbtip Reach 869.9 -5.29 -5.80 4.74 .82 .000
Head Length 180.2 0.79 0.75 0.79 .79 .000Head Circ. 533.9 1.69 2.56 1.32 .86 .000Head Breadth 155.1 -0.18 0.54 0.51 .32 .000Bizygomatic 141.6 -0.05 0.53 0.77 .02 .000
Breadth
Ankle Circ. 232.6 -0.81 -1.52 1.28 .60 .000Foot Length 251.1 0.82 -0.02 1.35 .58 .000Hand Length 173.2 0.91 0.97 1.03 .75 .000Hand Breadth 80.84 0.44 0.56 0.43 .80 .000
19

TABLE 9Models for Asfan/Paciff c Islanders
Dimension Constant Secular Age SEE R Sig.Trend Factor
b a AF
Weight 74.18 -0.13 0.43 1.95 .01 .011Stature 1791 -5.64 -8.87 12.31 .38 .000Neck Circ. 381.6 -0.72 1.07 3.47 .11 .000Chest Circ. 907.5 2.26 8.36 11.46 .10 .000Calf Height 355.1 -1.53 -2.13 4.58 .25 .000Calf Circ. 366.4 0.83 1.36 4.34 .10 .000Crotch Height 858.2 -3.88 -7.67 5.64 .58 .000Sitting Height 908.4 -0.42 -0.43 7.14 .01 .000Forearm-Hand 473.2 -0.51 -1.02 3.68 .05 .000
Length
Knee Height 531.5 -0.06 -1.51 4.09 .00 .556Sitti ng
Bideltoid Breadth 378.3 6.27 6.04 4.07 .87 .000Chest Breadth 283.5 1.43 4.29 3.84 .29 .000Hip Breadth Sitting 295.7 3.46 5.54 4.50 .63 .000Thumbtip Reach 902.5 -8.11 -8.04 3.79 .93 .000Head Length 175.7 0.89 0.75 1.45 .52 .000Head Circ. 524.8 2.11 2.82 3.75 .48 .000Head Breadth 157.1 -0.14 0.49 1.04 .05 .000Bizygometic 143.7 0.05 0.77 0.90 .01 .023
Breadth
Ankle Clrc. 264.5 -2.67 -3.35 1.99 .84 .000Foot Length 276.9 -0.92 -2.32 2.88 .23 .000Hand Length 180.7 0.44 0.28 1.82 .15 .000Hand Breadth 89.99 -0.09 -0.31 0.95 .02 .001
20

Demographic information from the 1946 survey provides the followingdistribution of birth-year cohorts: Cohort 10 at 0.399%, Cohort 9 at 47.3%,Cohort 8 at 20.8%, Cohort 7 at 24.8%, Cohort 6 at 5.5%, Cohort 5 at 0.879%, andCohort 4 at 0.350%. Equation six can be used to predict the value of staturefor cohort 10 in 1946, rounded down to 1945, as follows:
V = (a - AF) C + (b + AF (Y - 1900)/5)
subtittn:
STMURE = (3.71 - 3.54) * 10 + (1700 + 3.54 *(1945 - 1900)/5)
which yields:
S IU = 1733.72 mm.
Following this procedure for cohorts nine to four produces:
Cohort Proportion Prediction Weighted Value10 .00399 1733.56 6.929 .473 1733.39 819.898 .208 1733.22 360.517 .248 1733.05 429.806 .055 1732.88 95.315 .00879 1732.71 15.234 .0035 1732.54 6.06
Adding the weighted values gives a prediction for stature in 1946 of 1734 mm.The stardard error of the estimate for the Whites stature model of 5.11 =u plusan allowable observer error for stature of 10 m (Clauser, et al., 1988) makesthis prediction comparable to the 1739 m reported for stature by Newman andAite (1951). Table 10 compares predictions of available 1946 values to their
actual values for the other dimensions. In part, some the variations betweenthe actual and predicted values are due to different measuring tecniques usedin the 1946 survey. However, the greatest variations are seen in the softtissue dimensions, such as bideltoid breadth. If, as hypothesized, thesedimensions are more sensitive to cultural practices, then one would expectgreater potential inaccuracy in the prediction of these dimensions.
Anthrcpcmetric dimensions of future Army populations would be predicted ina similar fashion. Population values, however, also have to consider thecontribution of each of the racial/cultural groups. Therefore, thesepredictions must be supplied with information on the proportionalrepresentation of these groups in addition to the breakdown of cohorts withinthem. Thus, the precision of anthrxmtric predictions is dependent upon theaccuracy of demographic information.
To illustrate, six projections for possible Army demographics in the year2023 are presented in Tables 11 and 12. The mean value for an anthropcmtric
21
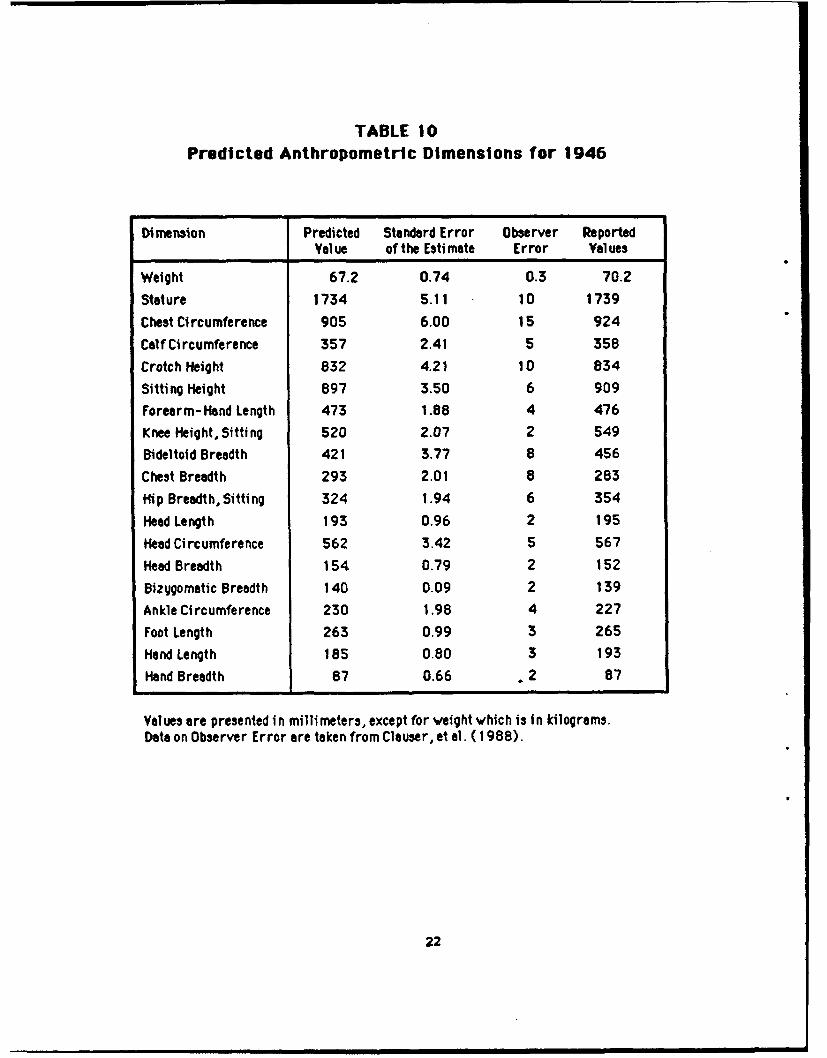
TABLE 10Predicted Anthropometric Dimensions for 1946
Di menasion Predicted Standard Error Observer Reported
Val ue of the Esti mate Error Values
Weight 67.2 0.74 0.3 70.2
Stature 1734 5.11 10 1739
Chest Circumference 905 6.00 15 924
Calf Circumference 357 2.41 5 358
Crotch Height 832 4.21 10 834
Sitti ng Height 897 3.50 6 909
Forearm- Hand Length 473 1.88 4 476
K nee Height, Sitting 520 2.07 2 549
Bideltoid Breadth 421 3.77 8 456
Chest Breadth 293 2.01 8 283
Hi p Breadth, Sitting 324 1.94 6 354
Head Length 193 0.96 2 195
Head Circumference 562 3.42 5 567
Head Breadth 154 0.79 2 152
Bizygomatic Breadth 140 0.09 2 139
Ankle Circumference 230 1.98 4 227
Foot Length 263 0.99 3 265
Hand Length 185 0.80 3 193
Hand Breadth 87 0.66 ,2 87
Values are presented in millimeters, except for weight which is in kilograms.Data on Observer Error are taken from Clauser, et al. (1988).
22

TABLE I I
Potential Changes In Future Populationsas Compared to the 1988 Survey Demographics
Population Age Racial/CulturalProjection Distribution Group Distribution
A No Change No Change
B No Change Increased Minorities
C Older Population No Change
D Older Population Increased Minorities
E Younger Population No Change
F Younger Population Increased Minorities
23
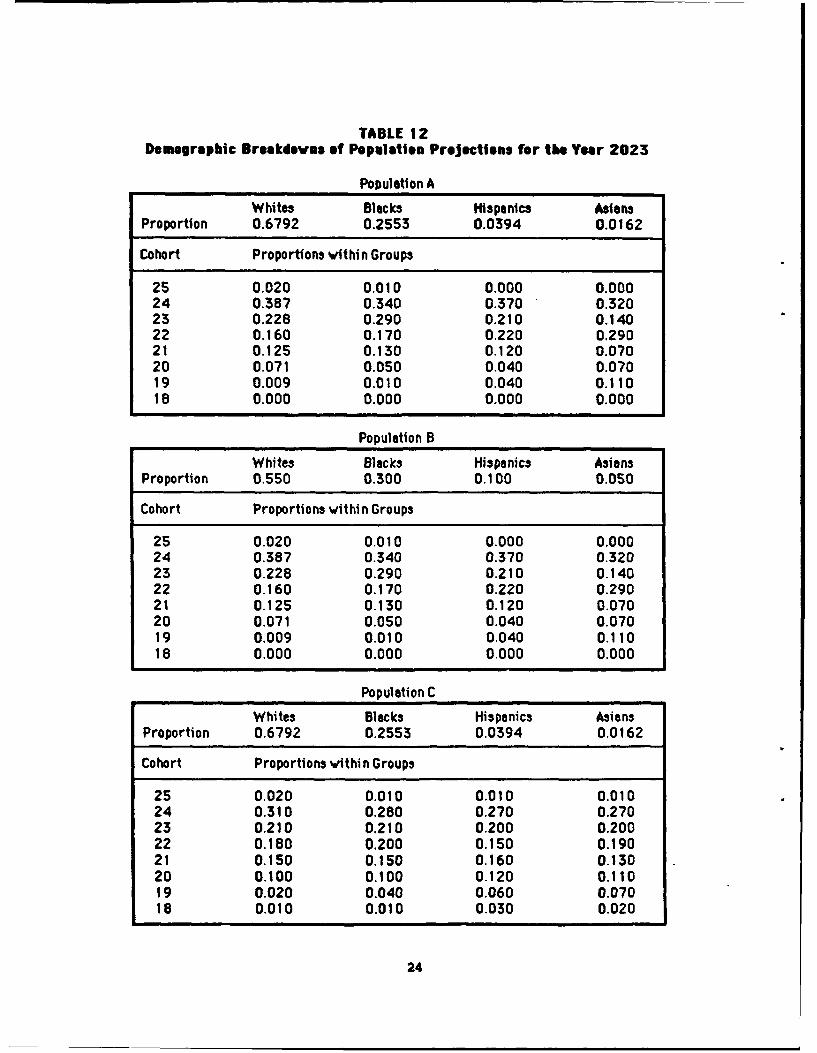
TABLE 12Demographic Breakdovns of Population Projections for the Year 2023
Population A
Whites Blacks Hispanics AsiansProportion 0.6792 0.2553 0.0394 0.0162
Cohort Proportions within Groups
25 0.020 0.010 0.000 0.00024 0.387 0.340 0.370 0.32023 0.228 0.290 0.210 0.14022 0.160 0.170 0.220 0.29021 0.125 0.130 0.120 0.07020 0.071 0.050 0.040 0.07019 0.009 0.010 0.040 0.11018 0.000 0.000 0.000 0.000
Population B
Whites Blacks Hispanics AsiansProportion 0.550 0.300 0.100 0.050
Cohort Proportions within Groups
25 0.020 0.010 0.000 0.00024 0.387 0.340 0.370 0.32023 0.228 0.290 0.210 0.14022 0.160 0.170 0.220 0.29021 0.125 0.130 0.120 0.07020 0.071 0.050 0.040 0.07019 0.009 0.010 0.040 0.11018 0.000 0.000 0.000 0.000
Population C
Whites B1ac ks Hispanics AsiansProportion 0.6792 0.2553 0.0394 0.0162
Cohort Proportions within Groups
25 0.020 0.010 0.010 0.01024 0.310 0.280 0.270 0.27023 0.210 0.210 0.200 0.20022 0.180 0.200 0.150 0.19021 0.150 0,150 0.160 0.13020 0.100 0.100 0.120 0.11019 0.020 0.040 0.060 0.07018 0.010 0.010 0.030 0.020
24

TABLE 12Centi uod
Population D
Whites Blacks Hispanics Asian$Proportion 0.550 0.300 0.100 0.050
Cohort Proportions withi n Groups
25 0.020 0.010 0.010 0.01024 0.310 0.280 0.270 0.27023 0.210 0.210 0.200 0.20022 0.180 0.200 0.150 0.19021 0.150 0.150 0.160 0.13020 0.100 0.100 0.120 0.11019 0.020 0.040 0.060 0.07018 0.010 0.010 0.030 0.020
Population E
Whites Blacks Hispanics AsiansProportion 0.6792 0.2553 0.0394 0.0162
Cohort Proportions vithin Groups
25 0.400 0.400 0.380 0.42024 0.320 0.310 0.350 0.27023 0.180 0.160 0.150 0.10022 0.050 0.080 0.090 0.06021 0.030 0.030 0.010 0.06020 0.010 0.010 0.010 0.09019 0.007 0.010 0.010 0.00018 0.003 0.000 0.000 0.000
Population F
Whites Blacks Hispanics AsiansProportion 0.550 0.300 0.100 0.050
Cohort Proportions within Groups
25 0.400 0.400 0.380 0.42024 0.320 0.310 0.350 0.27023 0.180 0.160 0.150 0.10022 0.050 0.080 0.090 0.06021 0.030 0.030 0.010 0.06020 0.010 0.010 0.010 0.09019 0.007 0.010 0.010 0.00018 0.003 0.000 0.000 0.000
25

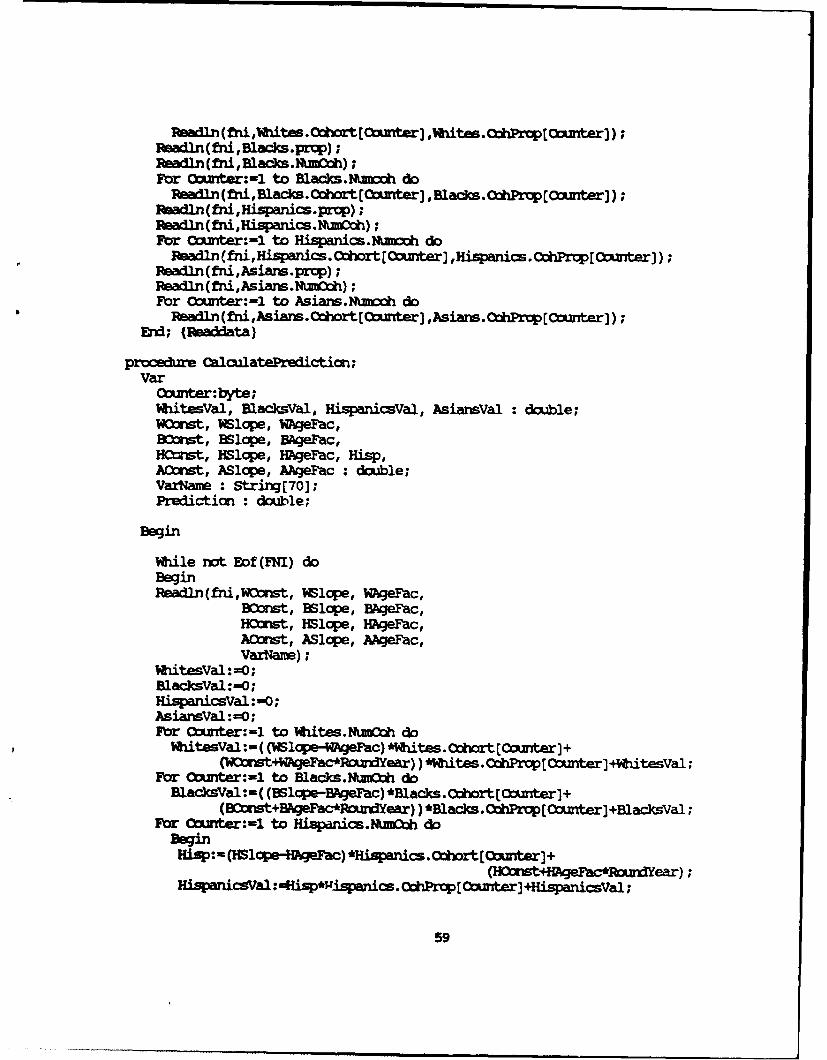
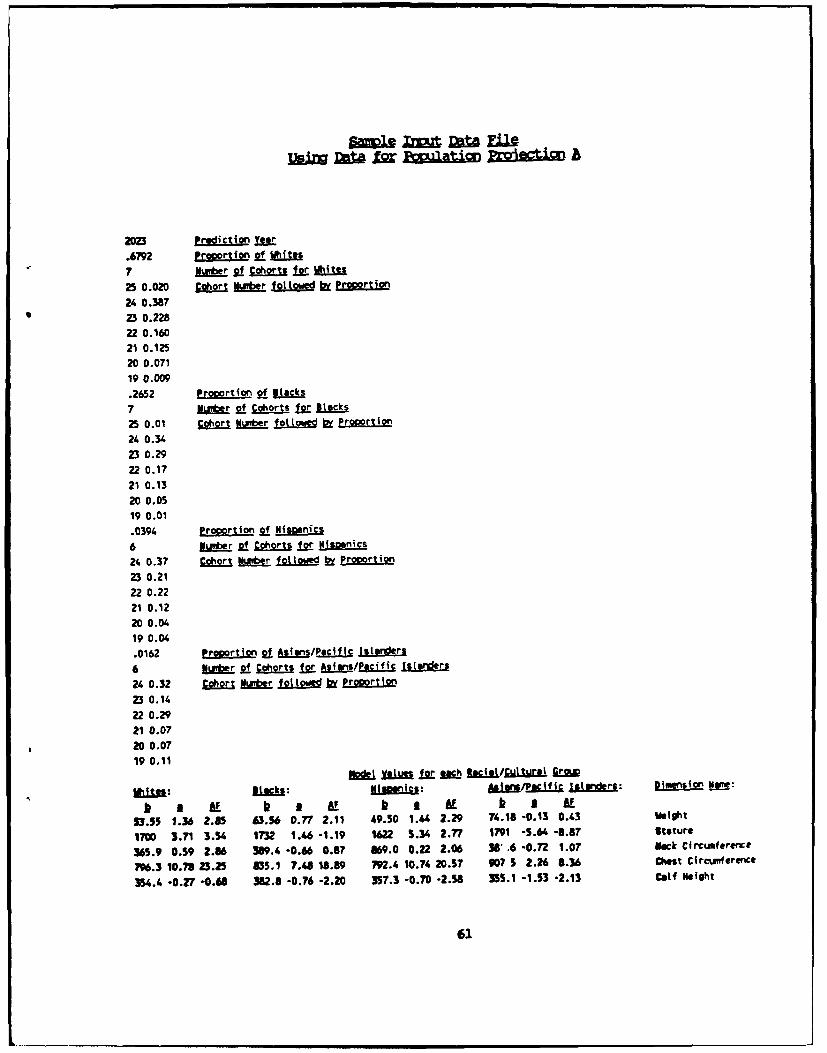
dimension is then predicted as follows. First, separate predictios arecalculated for each racial/cultural group, using the appropriate cohortproortions, according to the method outlined above. Then these fourpredictions are weighted accodning to their racial group proportions andsummed. The resulting value is the predicted population mean value (sourcecode for a omputer program written in Turbo Pascal that calculates thesepredictions is provided in Appendix II). The resulting predictions for each ofthe six possible Army populations are presented in Table 13. ien eachprediction is cmpared to the 1988 survey values it is clear that the magnitudeand direction of change is very dependent upon ---- grapic factors.
As an alternative to the prediction of actual dimensions, the modelspresented here can also be used to predict when measurable change will occurfor each dimension. Clauser, et al. (1988) provide information on thelimitations of current measuring techniques in their table of "AllowableObserver Error." These error values can be applied to the secular changemodels as benchmarks for the amount of change that must occur before it can bereliably detected. The limitations of each model are statistically expressedby the standard error of the estimate (SEE). The SEE expresses the confidenceof a prediction, and can be used to calculate the 95% confidence interval foreach predicted value. By using the greater of the 95% confidence interval orthe allowable observer error, it is possible to determine how much change mustoccur before it might reasonably be detectable. The rates of changeestablished in the secular change models can then be used to show the amount oftine needed to give rise to measurable change. Table 14 lists the amount oftime, in years, for measurable change to occur for each dimension in eachgroup-
5. MVOEL LIMITATIONS
The models presented here incorporate several assumptions concerning therelationships among anthrcpametric dimensions, birth year, and age. It isimportant that the implications of these assumptions, and the limitations of aregression based statement, are urlerstood before attempting to apply thesemodels.
These regression models only predict values of populations means; they donot make any statement concerning the distribution about the mean. Typicallydesigners are concerned with ranges of variation, so that items can accommodatethe 5th through 95th percentile values of a certain dimension within thepopulation. Unfortunately, no techniques exist that can be used to predictthis sort of information. One should never assume that because the mean valuehas increased by 10 mm the 5th and 95th percentile values will have alsoincreased by the same amount. This type of reasoning has no basis in thecurrent understanding of biological change, and would constitute a seriousmisapplication of these models.
26

-% ; Iall-NM Ov
r-V0M0 D0VI* )1) v 2 t
to OD
Ib:t
V) C0 D 9%OqOt BD Ch 0 r oq ro bV) C4 OD C
qt. -R1)1)O ) 1)p)r~ i - 'A
a I0P'-C .2 ZC)9MIWVf aM -000N t , 6_ b.
6 909 L
-O r.1 k tP-V1 OV0aC )rI
U~ ZdoI~ c.
.C 8 IL 89~ ~ ~~I ;;U 0) V I A89O
_- It julD1t )0M rp-N04-.A
270

TABLE 14Predicted Time. In Years, for Measurable Change to Occur
Dimension Whites Blacks Hispanics Asians
Weight 10 25 10 150Stature 15 25 15 25
Neck Circumference 55 50 140 50Chest Circumference 10 15 10 50Calf Height 60 40 40 30Calf Circumference 10 20 20 55Crotch Height 110 115 195 15Sitting Height 10 15 15 170Forearm- Hand Length 25 95 25 75Knee Height, Sitting 5 10 10 670Bideltoid Breadth 5 10 5 10Chest Breadth 15 45 10 30Hip Breadth, Sitti ng 10 10 5 15Thumbtip Reach 20 15 20 15Head Length 20 335 15 20
Head Ci rcumference 65 50 1s 20Head Breadth 45 60 60 75
Bizygomatic Breadth 115 205 205 205Ankle Circumference 30 20 25 10Foot Length 25 255 20 35Hand Length 20 40 20 45
Hand Breadth 25 45 25 115
28
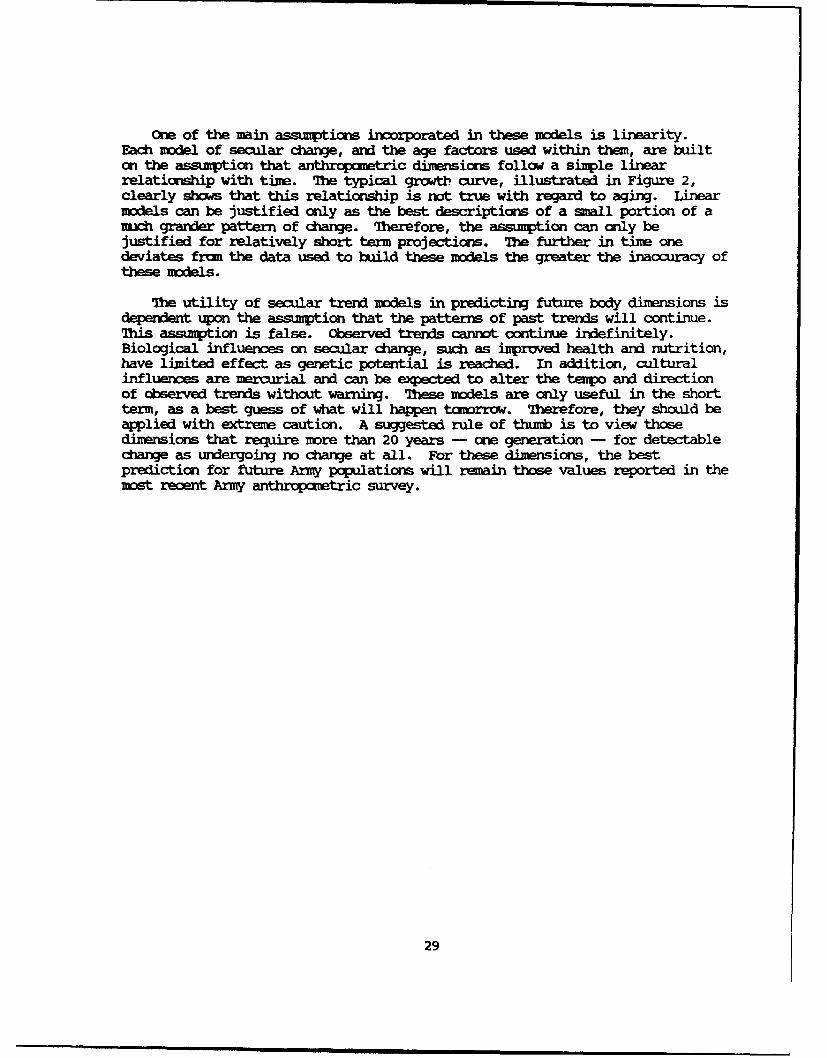
One of the main assumpticn incorporated in these models is linearity.Each model of secular change, and the age factors used within them, are builton the assumption that anthroxzietric dimensions follow a simple linearrelationship with time. The typical growth curve, illustrated in Figure 2,clearly shows that this relationship is not true with regard to aging. Linearmodels can be justified only as the best descriptions of a small portion of amuch grander pattern of change. Mherefore, the assumption can only bejustified for relatively short term projections. The further in time onedeviates from the data used to build these models the greater the inacuracy ofthese models.
The utility of secular trend models in predicting future body dimensions isdependent upon the assumption that the patterns of past trends will continue.This assumption is false. Observed trends cannot continue indefinitely.Biological influences on secular change, such as impruved health and nutrition,have limited effect as genetic potential is reached. In addition, culturalinfluences are mercurial and can be expected to alter the tempo and directionof observed trends without warning. These models are only useful in the shortterm, as a best guess of what will happen tomorrow. Therefore, they should beapplied with extreme caution. A suggested rule of thumb is to view thosedimensions that require more than 20 years - one generation - for detectablechange as undergoing no change at all. For these dimensions, the bestprediction for future Army populations will remain those values reported in themost recent Army antr tric survey.
29

6. ENMTE
1. The age of 20 was chosen for two reasns. First, as the Army is ccqxrxedprimarily of young people, the cohort that contains 20 year olds will tend tobe the most, or second most, populcus cohort. Therefore, this ccort wasselected as the most "typical." Second, previous studies (Trotter and Glesser,1951a; 1951b; Borkan, et al. 1983) show an increasing maturaticn rate withinthe US poplation, which has been used as an explanation of same oservedsecular changes. Because of this, some studies have chosen the age of 30 torepresent the age of maxinum growth (Trotter and Glesser, 1951a; Relethford andLees, 1981; McCullough, 1982). These studies, howver, were not investigatingmodern American populations. Current populaticns are obtaining maximum growthat a much younger age (Annis, 1978; Bradtmiller, et al. 1985). If this trendcontinues, then maxinum growth would be reached at even younger ages in futurepopulations. Therefore, it is appropriate to choose the age of 20 as the ageof maximum growth.
This document reports research undertaken at theUS Army Natick Research, Development and EngineeringCenter ad has been assigned No. NATICK/TR 0in the series of reports approved for publcato.
30

7. REFE1CES
Annis, JF (1978) Variability in Human Body Size. In Anthro tric SrceBook. Volume I: Anthropametry for Desiqnr. ed. by Webb Associates. NASAReference Publication 1024.
Baer, NJ (1956) Dimensional Changes in the Human Head and Face in the ThirdDecade of Life. American Journal of Physical Antbr~glogy 14:557-575.
Bakwin, H and SK McLauglin (1964) Secular Increase in Height, Is the End inSight? Lance 2:1195-1196.
Bielicki, T, H Szczotka and J Charzewski (1981) The Influence of ThreeSocio-concnic Factors on Body Height in Polish Army Conscripts. HumanBiolouy 53:543-555.
Borkan, GA, DE Hults and RJ Glynn (1983) Role of Longitudinal Change andSecular Trend in Age Differences in Male Body Dimensions. Human Biology55:629-641.
Bradtiller, B, J Ratnaparkhi, and I Tebbetts (1985) Denograiphic adAnthroyamtric Assessment of US Army Anthrgpgmetric Data Base. TechnicalReport NATICK/M-86/004 Natick, Mass.: US Army Natick Research andDevelqcpnt Command.
Chumlea, WC, PJ Garry, WC Hunt, and RL Rhyne (1988) Distributions of SerialChanges in Stature and Weight in a Healthy Elderly Population. HumanBioloxy 60:917-925.
Clauser, C, I Tebbetts, B Bradtmiller, J McConville and CC Gordon (1988)Measurer's Handbook: U.S. Army Anthroametric Survey 1987-1988. TechnicalReport NATICK/TR-88/043. Natick, Mass.: US Army Natick Research,Development and Engineering Center.
Cline, M, KE Meredith, JT Boyer and B Burrows (1989) Decline of Height withAge in Adults in a General Population Sample: Estimating Maximum Height andDistinguishing Birth Cohort Effects from Actual Loss of Stature withAging. Human Bioloy 61:415-425.
Damon, A (1965) Stature Increase among Italian-Americans: Environmental,Genetic, or Both? American Journal of Physical Anthrooloqy 23:401-408.
Damon, A (1968) Secular Trend in Height and Weight within Old AmericanFamilies at Harvard, 1870-1965 I. Within Twelve Fcur-Generation Families.American Journal of Physical Anthrciolorv 29:45-50.
Damon, A, CC Seltzer, HW Stoudt and B Bell (1972) Age and Physique in HealthyWhite Veterans at Boston. Journal of Gerontolory 27:202-208.
31

Davenport, CB and AG Iove (1921) Statistics: Army Anthretry vol. 15 PartOne. Medical Det. US Army, in the World War. Washington, DC: GovezmuntPrinting Office.
Flegal, KM, WR Harlan and JR Landis (1988) Secular Trerds in Body Mass Indexand Skinfold Thickness with socioecorxic Factors in Young Adult Men.American Journal of Clinical Nutrition 48:544-551.
Frisancho, AR, PE Cole, and JE Ilayman (1977) Greater Contribution to SecularTrend among Offspring of Short Parents. Human Biogy 49:51-60.
Gordon, C, B Bradtmiller, T Churchill, C Clauser, J Mcmwille, I Tebbets andRA Walker (1989) 1988 Anthrcxottric Suvey of US Army Personnel: Methodsand Summary Statistics. Technical Report NAICK/TR-89/044. Natick, Mass:US Army Natick aseardh, Development and Engineering Centpr.
Harlan, WR, JR Landis, KM Flegal, CS Davis and ME Miller (1988) Secular Trendsin Body Mass in the United States, 1960-1980. American Journal ofEvidemioloiy 128:1065-1074.
Hertzog, KP, SM Garn, and HO Heipy, III (1969) Partitioning the Effects ofSecular Trend and Ageing on Adult Stature. Amerin Journal of PhysicalAnth loVg 31:111-116.
Hiries, JH and WH Meller (1977) Aging and Secular Change in Adult Stature inRural Columbia. American Journal of Physical nthrploqy 46:275-280.
Hyde, J (1980) Determining an Average Slope. In Biostatistics Casebook. RGMiller, Jr., B Efron, BW Brown, Jr, and LE Moses, eds. New York: JohnWiley & Sons. pp. 171-189.
Karpinos, BD (1958) Height and Weight of Selective Service RegistrantsProcessed for Military Service during World War II. Human Biolox730:292-321.
Lasker, (G and QG Mascie-Taylor (1989) Effects of Social Class differences andSocial Mobility on Growth in Height, Weight and Body Mass Index in aBritish Cohort. Annals of Human Bioloy 16:
Mantel, N (1963) Chi-Square Tests with One Degree of Freedom; Extensions of theMantel-Haenszel Procedure. o of the Ameri Statistical Association58:690-700.
Mc1culough, JM (1982) Secular Trend for Stature in Adult Male Yucatec Maya to1968. American Journal of Physical Anthrooolcxj 58:221-225.
Meredith, HV (1976) Findings from Asia, Australia, Europe, and North Americaon Secular Change in Mean Height of Children, Youths, and Young Adults.American Journal of Physical Anthrolo 44:315-326.
32

Morant, GM (1950) Secular Changes in the Heights of British People.Proceedings of the Royal Society B 137:443-452.
Newman, IIV (1963) The Body Sizes of Tcworrow's Young Men. In Human Factors inTedhnolocy. E Bennett, J Degan and J Spiegel, eds. New York: McGraw-HillBook Cpany, Inc.
Newman, RW and K Wite (1951) Reference Anthrgpgm@ of Army Men.Environmental Protection Service Report No. 180. Lawrence, Mass.: US ArmyQuartermaster Climatic Research Laboratory.
Ohyama, S., A. Hisanaga, T. Inamasu, A. Yamamwto, M Hirata and N Ishinishi(1987) Scme Secular Changes in Body Height and Proportion of JapaneseMedical Students. American Journal of Phvsical Athruoloy 73:179-183
Polednak, AP (1975) Secular Trend in Body Size among College Athletes.American Journal of Physical Anth icy 42:501-506.
Price, B, N Cameron, and PV Tobias (1987) A Further Search for a Secular Trendof Adult Body Size in South African Blacks: Evidence from the Femur andTibia. Human Biolgy 59:467-475.
Relethford, JH and FC Lees (1981) The Effects of Aging and Secular Trend onAdult Stature in Ruxral Western Ireland. American Journal of PhysicalAnt~rpoloW 55:81-88.
Schreider, E (1967) Body-Height and Inbreeding in France. American Journal ofPhysical Anthropolo-y 26:1-4.
Steegman, AT, Jr. (1985) 18th Century British Military Stature: GrowthCessation, Selective Recruiting, Secular Trends, Nutrition at Birth, Coldand Occupation. Human Biolocy 57:77-95.
Takahashi, E. (1986) Secular Trend of Female Body Shape in Japan. HumanBioloy 58:293-301.
Takamura, K, S Ohayama, T Yamada and N Ishinishi (1988) Cianges in BodyProportions of Japanese Medical Students Between 1961 and 1986. AericanJournal of Physical Anthrovolov 77:17-22.
Tanner, JM, T Hayashi, NA Preece and N Cameron (1982) Increase in Length ofleg Relative to Trunk in Japanese Children and Adults frum 1957 to 1977;Cmparison with British and with Japanese Americans. Annals of HumanBioloy 9:411-423.
Trotter, M and GC Gleser (1951a) The Effect of Ageing on Stature. AericanJournal of Physical Anthropolo-y 9:311-324.
33

Trotter, M and & Gleser (1951b) Trerds in Stature of American Viites andNeras Born Between 1840 and 1924. American J=niA1 of PhysicalAnt1rogy 9:427-440.
ltiite, RM and E Oxurdhill (1971) The Body Size of Soldiers: US A&thrC = - 1966. Tednical Report 72-51-CE. Natick, Mass.: US ArmyQuartermaster Research ad Enineerin Center.
34

8. APPENDIX I
Plots of Secular Change in the Four Racial/Cultural Grups
Couparing the mgnitude and direction of secular change amongthe four racial/altural groups.
35
Age A~qUs. W~gM
75 ....
70
65to
60
55 1915 1 1920 1 1925 11930 1935 1940 IM 15 1950 195 196 196 19707 a 9 w Birth Yewari U 1
WWhifts 31Back0 Hispaics 0 Asans
Figure 6. Secular Change of Weight
36

Age Adjiused Stature
1,775
1,700
1.650 1 191 1 19012 I 1930 11935 11940 '1M4519501 1955 j 19601 1965 '11970a 7 a 0 10 Biarth Yewr1 Is w 17 1
M WhitesIMBak0 Hispanics 0 Asians
Figure 7. Secular Change of Stature
37

Age Austed Neck Circumference400
390
360
350 11 1 I 192 1925 1930 1935 I1940 119451195015 IM 1960 1965 1976 7 a 9 1v Birth Yewr 5 14 1 17 U
AWhfts M Backs*Hispanic 0 Asians
Figure &. Secular Change of Neck Circumference
38

Age Aclustd Chow Circumference
975
950
000i" 0000
900
150 15 11920 1 1925 1 1930 1 1935 11940 '1945 11950 1 1955 11960 11965 119706 7 6 9 10 Birthyj 1ew " Is 17 is
M While$s1 Blacks0 Hispanics E3 Asians
Figure 9. Secular Change of Chest Circumference
39

Age Acjusud Caff Height
400
380 ... e .......e46a..sase8000....
360
340
320
MS 511920 11925 11930 119351 1940 19I 1950 I1955 1960 SO 19706 7 a 9 10 BinhiiYw 1 14 Is U 17 1
9 Wites M Blacks0 Hispanics i Asians
Figure 10. Secular Change of Calf Height
40
Age AMusled Calf CirCumferenc400
385
340
325.11915 11920 11925 11930 1 1935 194"0 1945 11950 11951 1960 11965 11970* 7 a 9 10 Birth Year 5 " 4 U s 17 U
91 Whites IDBlacks*Hispanics 0 AMans
Figure 11. Secular Change of Calf Circumference
41

Age Adjuled Crotch Height875
855
835 -------''-
815
.11915 1 19M 1 1925 1 1930 1 1935 I1M4 1946 IM 01919 60 IM 96 11970a 7 a 9 10 BirthYor 1 4 1 5 17a Whites M Blacksa Hispanics 0 AsiaMs
Figure 12. Secular Change of Crotch Height
42

AgeAdustd ittngHeight950
875
850
825 114
1915 112112119011935 IM 114 1950 1956j 1960 1955 j19a 7 a 9 1 IfBitthy*W 1 1 a a 17 U5
RHispanics El Asians
Figure I&. Secular Change of Sitting Height
43

*OrarrflMH~fd Lergh
45
IV~a~ is iFigure u . secnanq)
ulrChange of ForearmnHand Lnt
44

Age Adjusted Knee Height, Sitting
560 4*
530 o
515 o
50 6115 1920 I1925 19301193511940 I19M 1950 1&19601 1965 1970v BirthYeaU 'm is 1 i i
0 Whites M Backs*Hispanics D Asians
Figure I& Secular Change of Knee Height, Sitting
45

Age A4uMsd Bideftoid Breadth
500
475
450
400
1915 71920* 1925 1930 j1935 1940 1945 195 195 196 196 1970sJi71 ~~Binth YwI n 1
*WhiteS M ElalS*Hispanics 0 Ain
Figure 16. Secular Change of Bideltoid Breadth
46

Age A4uftd Ches Breact
265
25
13 Whit Brh 96 w0 HiSpanics wac is is~g 17
Figure 17. Secular Change Of Chest Breadth
47
Age AMused Hip Breadth, Sitting
375
350
325
300
275
2 1190 1 1920!1 1925 1 1930 11935 I1940 '1945 I1950 19561 1960 1965 197* 7 a 9 10 Birth Yea 1 14 Is U 17 U
D Whites [DBlacks0 Hispanics 0 Asians
Figure 18. Secular Change of Hip Breadth, Sitting
48

Age Adjusted Thumbtip Reach
925
900
875 sm.
850
825
Boo
775
.51 I ~ J~~11915 114 19200 1955 1960 1935 IM IM 119M7MIM I
0 WhitesM lf0 Hispanics 3Ain
Figure 19. Secular Change of Thumbtip Reach
49
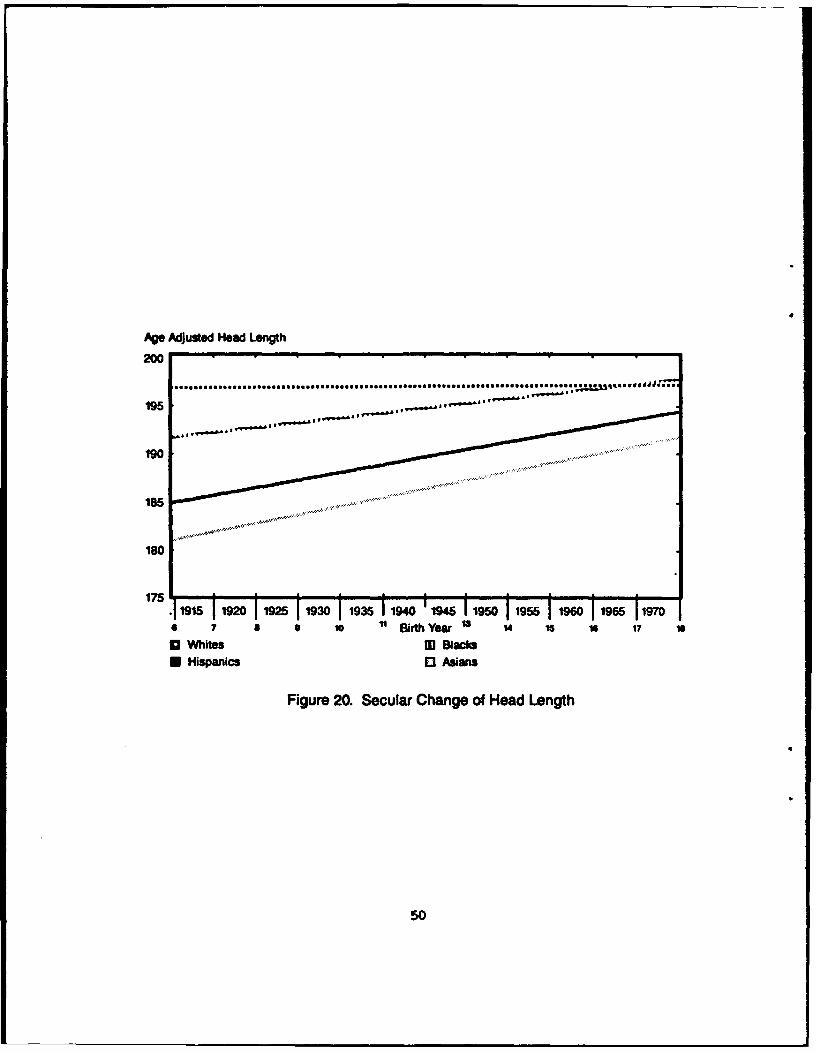
Age AdjUsted Head Length
195
190
185
1801
175.11915 1 1920 1 1925 1 1930 11935 1940 1M4 11950 11955 1960 1965 1970* 7 a S 10 Birth YearU 14 Is U 17 wI
9 Whites MI Blacks*Hispanics 0 Asians
Figure 20. Secular Change of Head Length
50

Age Adjusted Head Circumference
565
55
545
535
5.11915 1 1920 1 125 1 930 1 935 1 140 145 11950 15611960 11965 117a 7 a 9 U 0 Birth Yew U 14 Is w5 17 1
0 Whites M BlacksN Hispanics 0 Asians
Figure 21. Secular Change of Head Circumference
51

164
a1996
a ,41spanicz ng
igu re 22. S cu lar CtS~ e~ H a r
52

Age Adjusted Bazygmatic Breadth
145
1431
141
137
15.11915 1 1920 1 1925 11930 1 1935 I1940 1945 I1950 I1955 11960 1965 19704 7 6 9 10 Birth Year U1 17
0 WhtsMBlacks0 Hispanics a sin
Figure 23& Secular Change of Bizygomatic Breadth
53
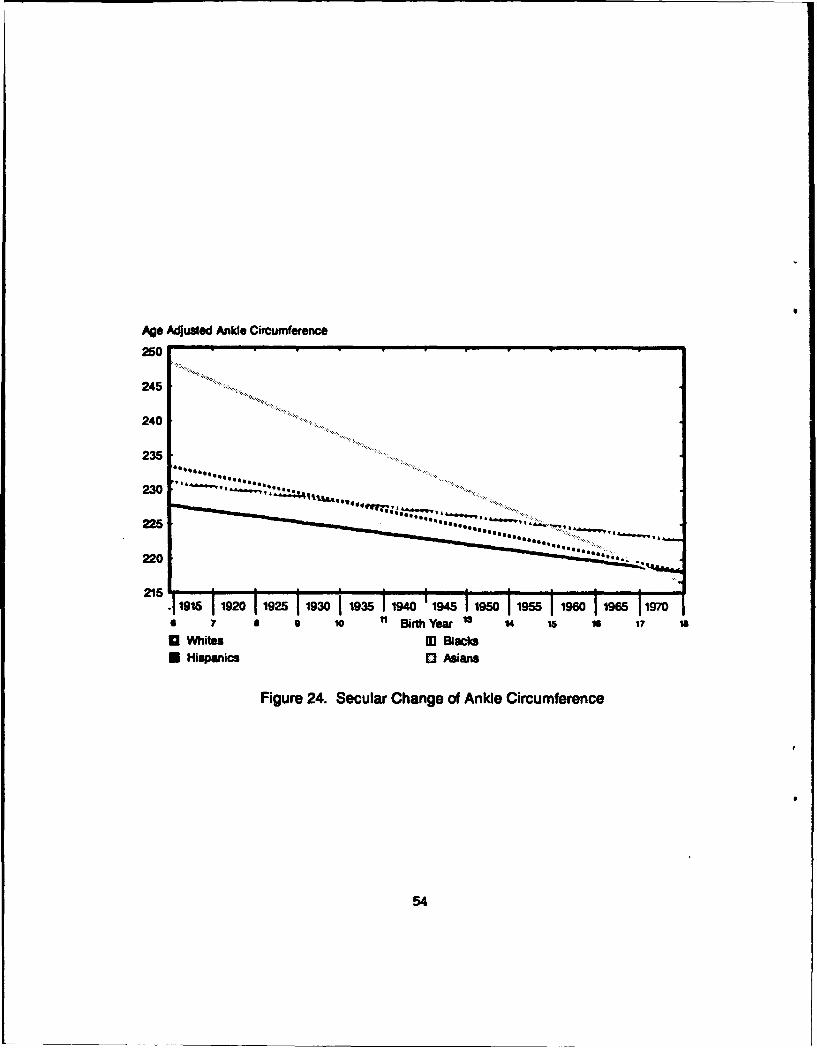
Age Acoused Ankle Circumference
250
245
240
235
21 . 1915 1920 j1925 j 1930 11935 1940 '1945 1950 195 1960 196 1970* 7 a 9 10 Birth Year t 14 15 M0 1? w
*Whites IDII .I0 Hispanics D Asians
Figure 24. Secular Change of Ankle Circumference
54
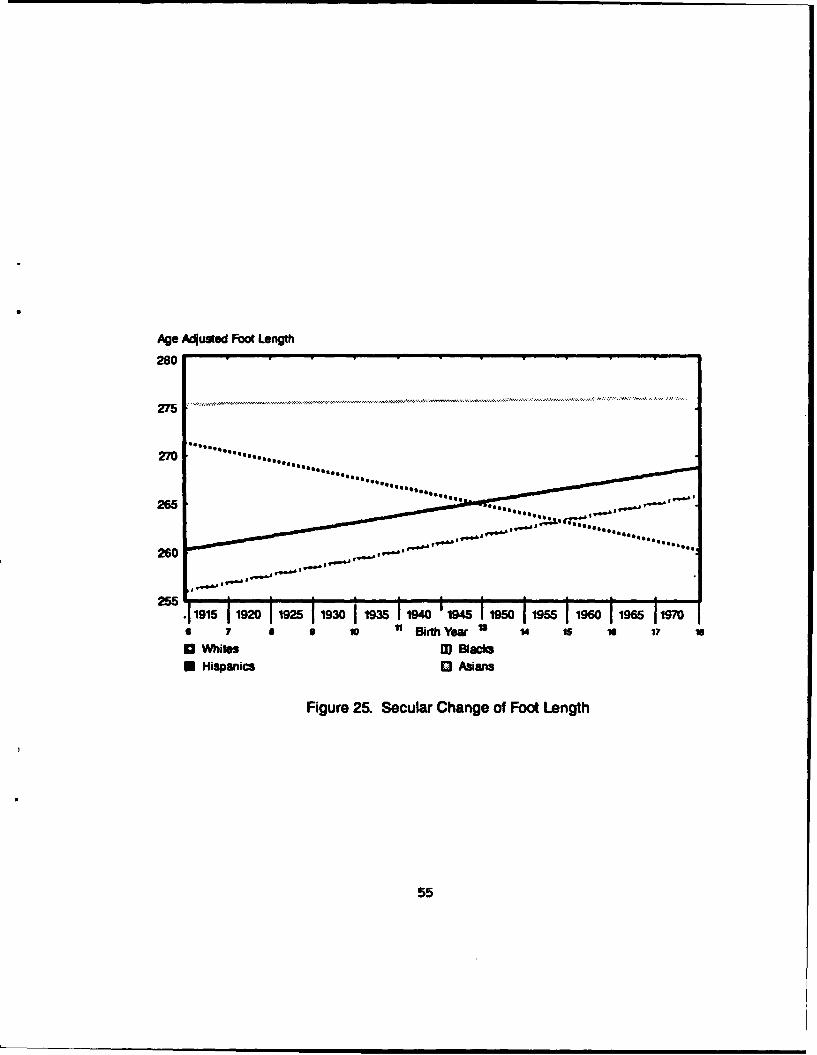
Age Adjusted Foot Length
280
275
265
260
255 5 192 1925 1930 1935 I1940 19I 1950 1955 1960 1965 197
13 Whites MD Racks0 Hispanics 0 Aiuans
Figure 25. Secular Change of Foot Length
55

Age Adjustod Hand Length
200
195 .....
190
165
170
6 7 9 10 BithYear1 14 15 16 17 m6
AWhites WBlacks*Hispanics M sans
Figure 26. Secular Change of Hand Length
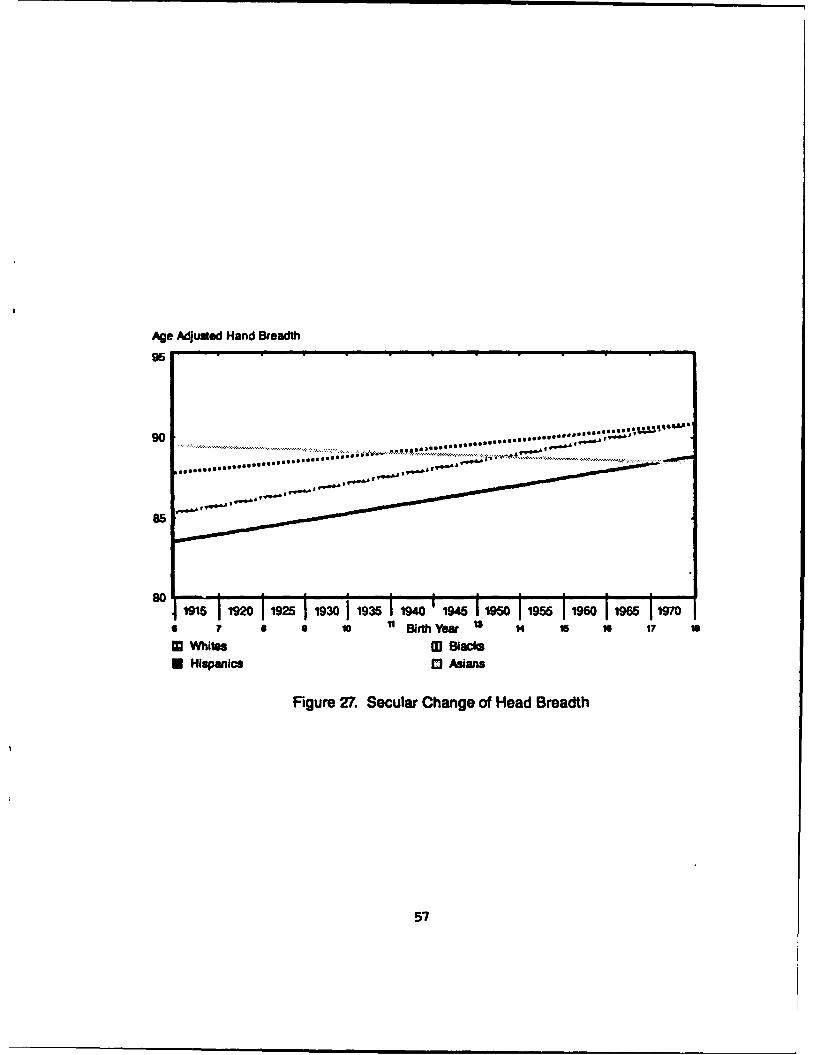
Age Adjused Hand Breadth
90
80191511920 19251 1930 1935! 1940 1945119501195611960 196511970* IF a 0 10 ~Birth Yea $4 is 1 17
M Whites (11Blck0 Hispanics 0 Asamn
Figure 27. Secular Change of Head Breadth
57

9. APEDl nl
progra Predict.AnthrqxzztricDiumrsicns;
(Thczzas M. Greiner, Research Anthrqpologist, US Army Natick)(April 1990)
($N+) (Turns on Math Corcessor)
uses crt;
TypeRacDatacrd
Prcp:double;Nu o: byte;CUort:array[l..l00) of byte!CbPrW~: array[ l.. 100) of dou~ble;
VarWites, Blacks, Hispanics, Asians : aoe[ata;Yearof Interest, RaoxzrxYear : word;fni, fno : text;
pr xxdure readdata;var
irptfile, (Xztputfle : Strirq[70];0mer : byte;
beginWrite ('IrIn)t data file namre: 1);PRuaxln(IrpxrtFile) ;Assign (fni, IrpitFile);Write (I'Cutpuzt data file name:')Readin(cxtptFile);Assign (fro, OzqztFile);Rewrite (fno);Reset (fni) ;readln(fni ,Yearofirlterest);if (Yeaoflnterest mod 5)=0 then JRjrdftar:-
(Yearoflnterest-1900) div 5else RoudYear:-(((YearofInterest div 5)*5)-1900) div 5;
Rsadln (fni,%hites .prc);
For Counter:-l to Vlhites.Nu.mo do
3beadn(fni,Blacks.prcp);RwadIn(fni ,Blacks.N~Um~);For Counter:=l to Blacks.Nmco do
Realn (fni, Blacks. Cohort[(outer] , Blacks. CofPrtCOxmterJ) ;Fbealn(fni ,Hispanics.prcW);Badlh(fni, Hisanics .N=Od);For Qiointer:=l to Hispanis.Nuoo do
Beadln(fni,Asiars.prop);Radin(frd ,Asian.Nuwidh);For Counter:=l to Asians.Nmoc do
Readin (fni ,Asiars. Cohrt[Omter) ,Asians. CiPrp (Couter)End; (Badata)
procedure Caclateftrdiction;Var
Ommer: byte;'WhitesVal, BlacksVal, HispianicsVal, AsiansVal :double;Monst, W#6lope, WAgeFac,Mmist, Blope, BAgeFac,Monrst, HSlcpe, HkgeFac, Hisp,
AIonist, ASlcpe, AAge~ac : dou~ble;VarName : Strirg(70];Prediction, : double;
Begin
While rxyt Eof (RFI) doBeginPeadln(frd,htCorst, 1~lcpe, WAgeFac,
B~onst, BSlope, BAgeFac,HNost, HSlope, H~geFac,AC~ost, ASlope, AMgeFac,VarNane);
WhitesVal: =0;BlacksVal :-;IHispanicsVal: =0;AsiarieVal: =0;For Cb.mter:=l to 1thites.Nui~dh do
NhitesVal: - ( (Wlpe-N~geFac) *Whites. Cohrt Counter) +(~Wont+HkpeFac*RoundYear) ) *Wie.Cirp[Cone Wie~l
For QCuter:=l to Blacks.Nwi~oh doBlacksVal : - ( (Ble-BAge~ac) *Blacks . Cohrt [Couter]+
(BDmit+BkqeFhc*RounYear) ) *BlackS.O iroCmter]+BlacksVa1;For Qounter:=l to Hispmdi.N~UmnO do
Begin
(H~mtMgeftFc Year);HisanicdVal: :-iqwjspanics. cIPrW [Counrter]4HispanicdVal;
59

ftr Cbuter:-l to Asians.Numa doAsiandVal :=( (ASlcpe-AAgeFuc) *Asians . Cdvrt[Cmvter]+
(A~cnst+AAgeFac*IRardYear) )*Asiaris. QhPrq4[Cmter+AsianVal;Predicticn: -Whites. Prcp*WLiteVal+Blac~cs. PrW*BlacksVal+
Hispanics. Prtp*HispanicsVal+AsiaYE .Prc*AsiarsVal;
Begin (Maidn Program)readdata;Writeln (frnh' Predicted Anthrqxzretric Diziensicwis for
',Yearoflrterest);Writein (frx0);calculatePrediction;Writeln( 'Qrrleted');Close(fno);*Close(fni);
60
2023 Prediction Year
.6792 Proportion 2f Whites
7 Nib.r I2 Cohorts frr Whites25 0.020 Cohort Nusbr forl by Prmrt
24 0.38723 0.22822 0.16021 0.12520 0.07119 0.009.2652 Provortion gf Blacks7 Umber Cohorts lr Slacks
25 0.01 Cohort Nuyber f kM Prcortion
24 0.34'23 0.29
22 0.1721 0.1320 0.0519 0.01
.0394 Proortion gf Hisoanics
24 0.37 Cohort Nubr foLlo~e k Procortin23 0.2122 0.2221 0.1220 0.0419 0.04.0162 Prcortion 2f Asijns/Pecifiz Istar.U
6 Nur.r 9-f Cohorts for ftj/Pacific Iltauders
24 0.32 Cchort Number 2ll by Proortion
23 0.14
22 0.2921 0.0720 0.0719 0.11
flgl giiM 12r MEh Raciil/Cutura. JrW
it.l: Sitck: Iisoiju: &jr"/I' f.j& Ist. ers: Djesi o we:
1? a k a A I? a A k a AE53.55 1.36 2.85 A3.56 0.77 2.11 49.50 1.44 2.29 74.18 -0.13 0.43 Weight
1700 3.71 3.54 1732 1.46 -1.19 1622 S.34 2.77 1791 -5.64 -8.87 Stature
365.9 0.59 2.86 389.4 -0.66 0.87 869.0 0.22 2.06 36 .6 -0.72 1.07 Nock circumference
796.3 10.75 23.25 135.1 7.48 18.89 7M.4 10.74 20.57 90? 5 2.26 8.36 Chest Circuoference
354.4 -0.27 -0.68 382.8 -0.76 -2.20 357.3 -0.70 -2.58 355.1 -1.53 -2.13 Calf Neight
61

331.8 2.67 4.35 347.2 1.69 2.80 329.7 2.51 1.15 366.4 0.83 1.36 CaLf Circof*we
129.3 0.46 -1.12 55.7 0."6 -4.77 816.0 -0.26 -5.4 58.2 -3.63 -7.67 Crotch Neight
863.6 3.57 5.16 5.6 3.21 2.39 823.8 4.27 4.91 906.4 -0.42 -0.43 sitting eight
463.1 0.99 1.66 502.6 -0.22 -0.18 450.1 1.27 0.05 473.2 -0.51 -1.02 Femonm-ftid Lwuth
67.2 6.68 4.35 509.6 3.55 2.57 47S.3 4.09 2.46 531.S -0.06 -1.51 Vm Height, Sitting
343.5 8.54 9.41 376.4 6.63 7.71 344.0 8.39 8.87 378.3 6.27 6.04 lideltoid Breadth
54.9 3.78 7.79 290.7 0.97 6.58 239.2 6.63 8.42 63.5 1.43 6.29 Chest Breadth
273.1 5.41 8.01 274.9 4.77 6.96 252.4 6.37 8.38 295.7 3.46 5.56 lip Breadth, Sitting
905.8 -6.53 -2.71 959.6 -5.34 -7.89 869.9 -S.29 -S.50 902.5 -8.11 -8.05 Tkobtip Reach
186.6 0.51 0.43 196.7 0.03 0.53 130.2 0.79 0.75 175.7 0.99 0.75 Need Length
557.5 0.52 -0.02 557.3 0.54 2.36 533.9 1.69 2.56 524.8 2.11 2.52 Need Circutference
154.8 -0.25 0.77 153.4 -0.17 0.41 155.1 -0.18 0.54 157.1 -0.14 0.49 led Breadth
160.2 -0.09 0.91 161.1 -0.05 0.56 161.6 -0.05 0.53 163.7 0.05 0.77 Szygomtic Breadth
235.6 -0.71 0.04 ?1.1 -1.28 -0.76 232.6 -0.81 -1.52 266.5 -2.67 -3.35 Akle Circumference
256.0 0.71 1.19 275.0 0.06 -0.10 251.1 0.62 -0.02 276.9 -0.92 -2.32 Foot Length
175.3 0.98 1.51 192.0 0.60 1.16 173.2 0.91 0.97 180.7 0.66 0.29 Mand Length
82.53 0.6 0.89 86.34 0.25 0.84 80.84 0.6 0.56 39.99 -0.09 0.31 Mand Breadth
62

emimL A
Predicted Anthrocoetric Dimensins for 2023
86.52 Weight1778.25 Stature400.11 Neck Circumference1057.56 Chest Circumferen350.62 Calf Height395.09 Calf Circumference841.32 Crotch Height938.91 Sittir Height489.29 Forearm-Han length589.37 Knee Height, Sitting545.70 Bideltoid Breadth341.81 Chest Breadth402.13 Hip Breadth, Sitting754.24 Thaztip Reach199.90 Head Length570.54 Head Circuference150.20 Head Breadth139.83 Bizygcmatic Breadth216.49 Ankle Circumference273.82 Foot Lenth199.98 Hand Length93.64 Hand Breadth
63