an empirical analysis of cellular demand in south africa1
TRANSCRIPT

An empirical analysis of cellulardemand in South Africa1
Farid GasmiToulouse School of Economics (ARQADE, GREMAQ, IDEI)
Marc IvaldiToulouse School of Economics (EHESS, GREMAQ, IDEI)
Laura Recuero VirtoTelecom ParisTech (ENST/SES)
AbstractWe analyze demand for prepaid cellular voice and short message service
(SMS) in South Africa by means of a demand-and-supply structural model
based on a multinomial specification fitted to a cross-sectional data set on
Vodacom customers collected in 2005. We find that consumers are very sen-
sitive to changes in prices, with higher price elasticities than those typically
found in developed countries. Consumers attach a higher value to commu-
nications during peak hours but since these are priced highly, they are as
much as twice more elastic than off-peak communications. In relative terms,
demand for communications during peak hours is more elastic for urban than
for rural consumers, while the reverse can be said about demand for off-peak
hours. The highest valuations are those placed by rural consumers on work-
ing hour communications. A policy implication of our analysis is that while
in terms of access cellular deployment in South Africa has gone a long way
into bridging the gap between the “first” and “second” economies, in terms
of usage if market organizations or regulatory institutions were to encour-
age further investment in network availability in rural areas this could be
rewarding both for the firm and its rural customers.
JEL-codes: C31, D12, D40, L96, R00Key words: Cellular demand, discrete choice model, price elasticity
July 2008
1Corresponding author: [email protected]. An earlier version of this paper hasbeen presented at the ENST and the PSE seminars, Paris, 2008, and at the ITS conference,Montreal, 2008, the EEA conference, Milan 2008, the EARIE conference, Toulouse, 2008,the AFSE conference, Paris 2008, the ITS conference, Rome 2008, and at the ASSETconference, Florence 2008. We thank participants to these events and Alison Gillwald foruseful comments. We thank Vodafone for having provided us with the data on which thisresearch is based. The views expressed in this paper and any remaining errors are onlyours however.

1 Introduction
Since 1994, the year of the advent of democracy in South Africa, this country
has embarked in the ambitious task of reversing the apartheid socio-economic
structure.2 However, the significantly high unemployment and poverty rates
highlight the fact that South Africa is still divided upon racial lines. South
Africa is indeed characterized by having a dual economy that is geograph-
ically segregated, with a so-called “first” economy, modern, integrated in
the global economy, containing a (white) minority, and producing most of
the economy’s wealth, and a so-called “second” economy, underdeveloped,
isolated from the global and first economies, containing most of the (black)
population, and contributing only weakly to the economy’s wealth (Van der
Merwe, 2006).3
With the explicit recognition of the South African government that with-
out addressing inequalities growth is not sustainable, the State has empha-
sized the need to mobilize capital for the implementation of a comprehensive
set of reforms aimed at integrating the second economy within the devel-
oped sector under the Accelerated and Shared Growth Initiative for South
Africa (AsgiSA) program. The development of infrastructures, in particular,
telecommunications networks, occupies an important place in these reforms.
The adoption of effective competition and effective regulation are taken as
the guiding principles for achieving the national telecommunications policy
objectives which are among other things, accessibility to telephony within
a walking distance of no more than 500 meters, availability of fixed-line or
cellular services in every household by 2010, and accessibility to Internet to
no less than 25% of the population also by 2010.
2Like many developing countries, South Africa has been strongly conditioned by itspast colonial ruling. This ruling has however, engendered an apartheid regime that hasmarginalized the majority of the population through discriminatory legislation and prac-tices that were present in every aspect of life. With the advent of democracy in 1994, SouthAfrica has faced the formidable challenge not only of dismantling the apartheid politicalregime and creating democratic institutions, but also of addressing a soaring economiccrisis and reversing the apartheid social and economic structures. By 2005, South Africahas succeeded in among other things, adopting a progressive constitution with democraticlaws, achieving a macro-economic stability with a five percent growth, and keeping abudget deficit of less than one percent.
3It should be noted however that the first economy is increasingly being composed bya mixed population.
2

In order to attain such network deployment objectives, both fixed-line
and cellular telecommunications technologies have been relied upon. The
fixed-line incumbent Telkom, has been recently privatized (1997) under a
five-year exclusivity period in voice services with rather challenging built-out
obligations that have unfortunately, resulted in high customer churn in ru-
ral areas (up to 70%) due to unaffordable bills. The cellular segment has
been liberalized with the introduction, next to the existing analogue oper-
ator Vodacom, of three other digital competitors, Vodacom (with 50% of
its capital owned by Telkom), MTN, and CellC operators.4 These digital
cellular operators have been also imposed a series of built-out obligations
which are being accomplished quite successfully. More than 90% of the pop-
ulation is currently covered directly by these operators or indirectly through
interconnection agreements with Vodacom.
Cellular service appears to be better adapted than fixed-line service to
customer requirements is terms of pricing and mobility as shown by the
growth rates during 2004-2005. Indeed, this period has known an exponential
growth of 38.2% in cellular subscribers to be compared with a weak 1.8%
growth in fixed-line deployment. The figures on coverage are quite instructive
too as 76.8 per 100 inhabitants have subscribed to cellular while only 10.7 per
100 inhabitants have subscribed to fixed-line service by 2005. This dynamic
cellular market is unequally shared by the operators with Vodacom possessing
over 50% of the market, MTN around 30%, and CellC around 15%. In terms
of revenues, the cellular market is expected to grow up to 54 billion Rands
by 2007.
As encouraging these figures may seem, the cellular market practices have
been closely monitored by ICASA, the telecommunications regulator created
in 2000 under the Department of Communications. Indeed, such high cellu-
lar growth rates have been accompanied by a series of decisions that could
potentially hinder consumer welfare. Among other things, the 2005 report of
The Telecommunications Pricing Working Group has pointed out the band-
ing of two-year contracts to handset sales, the high prices for voice and SMS
4The analogue operator Vodacom, operates in C-Netz 450 since 1986. As for the digitaloperators, Vodacom operates on GSM 900, GPRS, and MMS since 1994, and on 3G 2,100since 2004; MTN on GSM 900 since 1994, GSM 1,800 since 2003, and 3G 2,100 since 2005;CellC on GSM 900, and GSM 1,800 since 2001.
3

communications, the penalization of prepaid subscribers in terms of pricing
as compared to contract subscribers, and the 500% increase in the cellular
operators interconnection tariffs.5
While the cellular subscription figures render unquestionable the fact that
in terms of access, the cellular market has been so far able to bridge the
telecommunications gap between the first and second economies, the situa-
tion is not so clear in terms of usage as the conclusions of the ICASA report
suggest. This situation which can be extrapolated to other developing coun-
tries experiences, lead us to explore how market organizations and regulatory
institutions can adapt to the specificities of demand in such a context in order
to maximize both firms’ profits and consumer welfare.
In this sense, the major contribution of this article resides on the fact
that despite the important changes experienced recently by the telecommu-
nications market in Sub-Saharan Africa, there are, to our knowledge, no
micro-econometric studies that analyze data stemming directly from opera-
tors. Indeed, the bulk of the empirical literature in telecommunications is
constituted of macroeconomic studies based on aggregated country informa-
tion or microeconomic studies based on consumers surveys. Our paper is a
micro-econometric study based on revealed preferences data on South Africa
provided by the operator Vodacom. Hence, it departs from most of the other
micro-econometric studies in the field that are based on stated preferences
data, i.e., on data generated through surveys.
Relying then on a Vodacom cross-sectional data set on 6,936 consumers
collected in May 2005 in South Africa, we attempt to shed some light on
cellular phone demand in terms of usage. We focus on the prepaid market
that makes the bulk of Vodacom’s cellular growth with over 85% of the new
subscriptions in 2005 having adopted this type of service. Moreover, this
service accounts for 75% of the communications in the Vodacom data set.6
We explore both voice and SMS communications as 58.9% of the growth in
data revenue in Vodacom’s network in 2005 is imputable to the 2 billion SMS
transmitted.
5Network operators do not necessarily agree with ICASA’s statements. In particular,their views do not coincide with respect to the amount of increase in interconnection tariffs.
6Notice however that contract subscribers contribute equally if not more to the volumeand revenue of Vodacom.
4

In this article, we analyze own-price and cross-price elasticities between
different services offered by Vodacom for prepaid voice and SMS among which
we are accounting for peak and off-peak hours and for the type of correspon-
dent, that is, a Vodacom, MTN, CellC, or Telkom subscriber. We therefore
explore prepaid retail prices and also implicitly interconnection prices. We
develop a demand-and-supply structural model based on the multinomial
specification which we apply to the whole sample. This allows us evaluate
whether demand for cellular services is elastic as a consequence of high tar-
iffs and low average income, with higher price elasticities than those typically
associated with developed countries.
We then apply this model to two sub-samples that identify urban and
rural Vodacom consumers, which allows us to empirically analyze the be-
havior of consumers from the first and second economies. We attempt to
test the conjecture that price elasticities are lower for rural consumers since
among other things, major labor opportunities are concentrated in cities. In-
deed, rural consumers should have a stronger preference for cellular services
as it allows them to bypass more costly means of communications such as
public transportation. Lastly, we give some insights on the role of market
organizations and regulatory institutions under such environment.
This article is organized as follows. In section two, we give an overview
of the empirical literature on price elasticities associated with telecommu-
nications services in developing countries. In section three, we provide a
preliminary empirical analysis of the data set that allows us to define our
econometric setting by exploring some socio-economic features and by an-
alyzing consumer choice. In section four, we develop the structural model
under a demand-and-supply analysis, present the calibration procedure to
solve the system and report the associated results. In section five, we sum-
marize our findings and discuss some policy implications.
2 Price elasticities for telecommunications ser-
vices in developing countries
While the literature analyzing telecommunications demand in developed coun-
tries is fairly large, there are very few studies on this topic with data sets
5

on developing countries.7 The major motivation for exploring price elastic-
ities in developing countries, comes from the belief that these figures might
not coincide with those typically found in developed countries. Once an
initial penetration level has been attained in developing countries, the net-
work serves not only wealthy residential and business consumers, but also
the bulk of the low-income population. Among the most relevant differences,
developing countries’ networks are usually characterized by having telephone
bills that represent a much higher percentage of average income, by having a
lower percentage of business communications and by having a certain degree
of unmet demand.
Driven by these reasons, two main streams of empirical literature have
risen in the recent years on telecommunications demand in developing coun-
tries. There is a stream of literature on cross-country analysis based on
macroeconomic indicators that provides some evidence of directions of change
and orders of magnitude. There is a very thin but more reliable stream of
literature on single-country analysis based on household surveys measuring
stated preferences. In this article we attempt to provide further evidence
on price elasticities in line with this last stream of literature but based on
revealed rather than on stated preferences, since we are relying on network
information.
Within the cross-country studies, Fuss et al. (2005) focus on the usage of
telecommunications services. They analyze demand for cellular subscription
on a data set on 92 developing countries for the period 1980-2003, finding a
price elasticity of -1.5. This result is nevertheless difficult to interpret since
price is captured through revenue per subscriber. There are other cross-
country investigations that draw their attention not only towards usage but
also towards access to telecommunications services.8 Some of these studies
use a price index that accounts both for rental subscription and for the
price of average minutes of usage. Using a data set on 74 countries for
the years 1980 and 1985, Martins (2003) provides evidence of differences
7See Aldebert et al. (2004) for a short summary on the evolution of telecommunicationsdemand in developed countries.
8Indeed, while access is no more the focus in developed countries due to the large net-work expansion, this does not hold for every developing country. For example, OSIPTEL,the telecommunications regulator in Peru finds that “..one of the barriers for new mobileusers is the handset cost.”
6

in price elasticities for fixed-line services according to the country level of
development. Elasticities are over the unity and are systematically larger
in the sample of low-income countries as compared to the sample of high-
income countries whatever the specification used. Wheatley (2006) explores
demand for fixed-line services with a data set on 40 low-income countries in
1993. Though the elasticity he finds is below the unity, it is still above that
typically reported in developed countries.9
Some authors instead examine disaggregated measures of price elasticity
according to usage and access. By using a data set on 63 developing countries
for the period 1990-2001, Sridhar and Sridhar (2004) find that demand both
for fixed-line and cellular subscription is more sensitive to changes in access
price as measured through the rental tariffs than to changes in usage price
as captured by revenue per user. In addition, they observe that demand for
cellular subscription is more elastic than for fixed-line whatever price index
used.10 Like in Fuss et al. (2005), some of their results are however difficult
to interpret with usage being captured by revenue per user. In the GSM
Association (2005) report, demand for cellular subscription is analyzed with
a four year data set on 50 emerging countries. In the report prepaid demand
is more elastic than demand under contracts, with a price elasticity of -0.7
as compared to -0.5, where price accounts for subscription and minutes of
usage. Moreover, they find that the elasticity is the highest for demand for
handsets with a value of -1.0.11
Some single-country analysis based on surveys provide more reliable in-
sights on price elasticities in developing countries than the previous cross-
country analysis. Chowdhury et al. (2003) measure rural consumers’ willing-
ness to pay in Bangladesh and Peru for public fixed-line and cellular services
9Wheatley (2006) finds a price elasticity of -0.6 for rental and local calls, while thetypically reported in developed countries is between -0.1 and -0.6 for rental and between-0.1 and -0.5 for local calls.
10Overall in the literature there is evidence that in developed countries demand forcellular service is more elastic than demand for fixed-line services (Dewenter and Haucap,2004).
11Price elasticities of cellular demand are in general smaller in developed countries thanin developing countries. Indeed, the UK Competition Commission has reported own-priceelasticities of mobile subscriptions between -0.08 and -0.54. For mobile calls, own-priceelasticities between -0.48 and -0.62 have been measured. See Dewenter and Haucap (2004)for a summary of typical price elasticities of cellular demand in developed countries.
7

using a cross-sectional data set on 1,284 households. Their results suggest
that households’ willingness to pay for a single call is higher than the prevail-
ing tariff rates.12 However, this study included settlements without a public
telephone and therefore the value of the first call for these users could be
quite high.
Certain regulatory institutions have also studied telecommunications de-
mand in developing countries through household surveys. Using a cross-
sectional data set on 1,759 households, the CRT (2005) report explores de-
mand in terms of usage for fixed-line and cellular services in Colombia. They
find that demand for long distance calls is more elastic than demand for lo-
cal calls, with an elasticity of -0.9 as compared to the range of {-0.4,-0.9}.Demand for cellular services, with elasticities over the unity, is more elastic
than demand of fixed-line services. OSIPTEL (2005) with a cross-sectional
data set on 1,604 households finds that in terms of access the price elasticity
for fixed-line services for low-income consumers in Peru is over the unity,
specially at high rates. In line with these analyses, in this article we at-
tempt to provide further evidence on price elasticities by using a Vodacom
cross-sectional data set for the year 2005 with 6,936 individuals in South
Africa. We focus on price elasticities associated with the usage of voice and
SMS services which currently seems a more crucial issue than access in South
Africa.13 We compare urban and rural consumption patterns under the ex-
pectation that the demand for cellular services is more elastic for urban than
for rural consumers mainly due to the cost of alternatives borne by rural
users.
3 Preliminary empirical analysis
In this section we examine some of the properties of the data set that help
us in defining our econometric framework. We begin by describing the main
12The Grameen Technology Center (2005) report illustrates a similar scenario. Theydescribe how poor rural users in Uganda were ready to pay for a one minute call up to20% of their daily gross earnings for a day.
13Notice however that given the disparity of income levels, it would be important toassess the impact of any pricing strategies or policies considered on the affordability ofaccess to services. For example, a decrease in usage prices could lead to an increase inaccess prices, which would be to the determent of the so-called second economy.
8
ingredients of this data set. We then identify some of the socio-economic
characteristics associated with the areas of South Africa under study, and
discuss the correlations between these features and the exerted voice or SMS
communication.14 These analyses allow us to evaluate whether there is sam-
ple selection and explore the characteristics of urban and rural sub-samples,
and of voice and SMS communications. We lastly focus on consumer choice
by analyzing both the pricing scheme applied to each of the options Vodacom
users are facing and the consumer behavior derived from some basic statistics
in our sample. These enable us to select the appropriate consumer choice
set for our econometric modeling and to further investigate whether there
are behavioral differences between urban and rural sub-samples and between
voice and SMS communications.
Our data set consists on network information collected by Vodacom on
6,936 individuals in South Africa on May 2005.15 The data accounts for voice
and SMS communications originated by prepaid Vodacom consumers identi-
fying the day and the time of the communication, as well as the location of
user placing the communication, according to a urban vs rural classification.
In addition, we are able to retrieve the type of prepaid card used by the Vo-
dacom consumer. The data also captures the correspondent’s network which
can be the cellular operator Vodacom, the fixed-line incumbent Telkom, or
the other cellular operators CellC and MTN.
Regarding the areas of South Africa under study, in Table 1 hereafter
we can see the province, town and suburb where the communications were
originated as well as for each area, the urban vs rural nature, the number
of samples in our data set and the average income.16 Our data set contains,
14Statistics South Africa is the source of our socio-economic variables. In particular,2000 statistics for income (“Income and expenditure of households”), and 2001 Censusfor the other variables (“Census 2001: Primary tables”). The socio-economic data is notindividual specific, but rather derived from the province where the communication wasoriginated and from the urban vs rural nature of the area. Therefore, this analysis shouldbe seen as a preliminary study to have a better understanding of the nature of our dataset and not an exhaustive and precise exploration.
15Information was collected for six time frames in May: Monday 2nd between 10h-11h,Friday 6th between 10h-11h, Saturday 14th between 20h-21h, Wednesday 18th 20h-21h,Sunday 22nd between 10h-11h and Tuesday 24th between 10h-11h.
16The income is assigned depending on the province, the urban vs rural nature of thearea and, in some cases, the town. Since this data is extracted from 2000 statistics, 2005income has been adjusted with the gross domestic product deflator.
9

among other regions, the less developed areas of South Africa.17 Moreover, a
casual look at Table 1 brings our attention to the fact that of 6,936 samples
in our data set, 70.6% belong to rural areas which are those in the most
eastern part of South Africa. Income is significantly lower in rural areas as
compared to urban areas, as much as three times. In addition, while income
does not vary too much between the three surveyed rural areas, it does vary
significantly when comparing the surveyed urban areas, with Pretoria and
Queenstown lagging behind.
Table 1Average income in surveyed areas
Province Town Suburb Zone Obs. IncomeMpumalanga Pilgrim Rest Open Space Rural 685 24,668Kwazulu Natal Nqutu Open Space Rural 1,617 17,473Limpopo Thohoyandou Open Space Rural 2,598 21,282Limpopo Polokwana New Pietersburg Urban 822 65,945Gauteng Pretoria Pretoria Ctl Urban 41 47,781Gauteng Vereeniging Vereeniging Ctl Urban 390 65,945North West Mafikeng Montshiwa Urban 470 67,446Eastern Cape Queenstown Top Town Urban 313 40,845
In Table 2, we can see a series of statistics associated with each of the six
provinces under study. Population is the population in the province as % of
the country population, Young is the % of population under the age of 20
in the province, No education is the % of population aged 20 years or older
without schooling in the province, Labor is the % of population aged between
15-65 employed in the province, Water is the % of population whose main
water supply is piped water in the province, and Light is the % of population
whose energy source is electricity in the province.18 In this table, Gauteng
and North West which are located in the north-center of the South Africa, are
those provinces with the best indices in terms of education, labor force, and
17Six of the nine provinces in South Africa are represented in our data set. They arein the half east of the country, where African is the dominant population group, andwhere there is no common dominant language group across provinces. Relative to the twoprovinces in the west of the country, Northern Cape, and Western Cape, the provinces inour data set have higher density levels, lower population age, larger population with noschooling and fewer economically active population.
18The Census 2001 considers that piped water can be taken as main supply of water whenit is inside the dwelling, inside the yard, or on a community stand located at approximately200m.
10

infrastructure, and with the lowest percentage of young inhabitants. Eastern
Cape is certainly lagging behind in terms of infrastructure, and Limpopo
in terms of education having the latter in addition the highest percentage
of young inhabitants. Accordingly, there does not appear to be any severe
problem of sample selection between the urban and rural sub-samples.19
Table 2Socio-economic characteristics by province (%)
Province Population Young No education Labor Water LightMpumalanga 6.9 47.0 27.5 23.0 86.7 68.3Kwazulu Natal 20.6 46.7 21.9 27.8 73.2 61.8Limpopo 12.0 52.6 33.4 22.0 78.0 63.8Gauteng 19.2 32.1 8.4 45.0 97.5 80.8North West 8.2 41.9 19.9 31.8 85.8 70.5Eastern Cape 15.0 49.4 22.8 20.4 62.4 49.5
An examination of Table 3 points out the differences in the correlations
between the previous socio-economic characteristics and the type of voice
or SMS communication exerted. Indeed, when the sample is analyzed by
the type of communication we can see that SMS are positively correlated
with the level of development in the area, that is, the more SMS sent, the
lower levels of young inhabitants, higher levels of education and employment,
better infrastructure and higher income. Voice takes on the counterpart of
SMS correlations, being positively correlated with Young and No education,
and negatively correlated with Labor, Water, Light, and Income.
Table 3Correlations between
the socio-economic features and the type of communication
Population Young No education Labor Water Light IncomeVoice -0.090 0.318 0.315 -0.290 -0.137 -0.137 -0.221SMS 0.090 -0.318 -0.315 0.290 0.137 0.137 0.221
If we further examine voice communications by analyzing the correlation
between the socio-economic characteristics and the duration of the voice call
19Indeed, urban surveyed provinces include the most and least developed areas, i.e.,Gauteng and North West, and Eastern Cape, respectively. Rural surveyed provincesinclude moderate areas in terms of development. Limpopo, in particular, is subject toboth urban and rural analyses.
11

in seconds for the total sample and for the sub-sample of rural areas, in
Table 4 we can see some interesting features through some rough Ordinary
Least Squares (OLS) estimations under the standard assumption of an ho-
moskedastic error structure.20 Infrastructure is negatively correlated with
the duration of the voice call, which could signal the dependence of isolated
communities upon cellular devices. In addition, the older the population and
the higher the income, the longer the duration of the call. Surprisingly, the
correlation between the income and the duration of the voice call switches
to negative in the rural sub-sample. This might indicate that poor users in
rural areas might have greater need for cellular services due to the cost of
alternatives.
Table 4Correlations between
the socio-economic features and the duration of the voice call
OLS Total Rural Rural Ruralsample sub-sample sub-sample sub-sample
Population -0.338 0.493∗Young -1.523∗∗∗ -2.006∗∗∗ -2.324∗∗∗ -2.122∗∗∗Water -1.133∗∗∗ -0.494∗Income 0.001∗∗ -0.001∗
Focusing now on consumer choice we are first concerned with the pric-
ing schemes faced by Vodacom consumers. Actual choices made by users
depend on prices and these are charged according to the type of prepaid
card, to whether the type of communication is voice or SMS, to whether the
communication is made during peak or off-peak hours, and to the network
of the correspondent. Regarding prepaid offers, there are three possibilities.
4U Prepaid (4UP) advantageous for off-peak hours, Vodago (VGO) advan-
tageous for peak hours, and Vodago SmartStep (VSS) that treats peak and
off-peak hours in equal terms. The prepaid cards are not evenly selected in
our sample. From 6,259 prepaid voice communications, 93.3% are 4UP, 5.9%
20In Table 4, in the case of the total sample, Young, No education and Labor, on the onehand, and Water and Light, on the other hand, have correlation coefficients over 0.9 andare thus not simultaneously included in the OLS estimation to avoid multicollinearity. Inthe case of the rural sub-sample, Water and Income, Water and Population, and Incomeand Population are additionally correlated over 0.9, and similarly they are not includedsimultaneously in the estimations. In Table 4 and for the entire document ***/**/* indicatesignificance at the 1/5/10 % level.
12

are VGO and 0.8% are VSS. As for SMS, from 677 prepaid messages, 83.2%
are 4UP, 14.1% are VGO and 2.7% are VSS.
The user has to choose among placing a voice call or sending an SMS.
In the first case, the service is billed per minute of communication, while in
the second, the service is billed per message. The user also has to decide
upon placing a communication during peak or off-peak hours, where peak
hours are Monday to Friday from 7am to 10pm and off-peak hours are the
remaining time frames. Finally, the user has to select the correspondent
whose network can be mobile, that is, Vodacom, MTN or CellC, or fixed-line,
that is, Telkom. Since users are charged identically by the Vodacom network
when they communicate with Vodacom or Telkom, on the one hand, and
with CellC or MTN, on the other hand, we work hereafter with two type of
network correspondents instead of four. Tables 5 and 6 hereafter display the
prices for each of these previous options.
Table 5Voice prepaid prices per minute
Correspondent Hour Prepaid card4UP VG0 VSS
Vodacom-Telkom Peak 2.99 2.55Vodacom-Telkom Off-Peak 1.05 1.40 2.70 1st minCellC-MTN Peak 2.99 2.85 1.55 afterCellC-MTN Off-Peak 1.30 1.65
Table 6SMS prepaid prices per message
Correspondent Hour Prepaid cardAll Peak 0.80All Off-Peak 0.35
A close examination of some statistical features in our data set can pro-
vide further information on consumer choice by giving preliminary evidence
on consumer preferences. We focus on the number of observations associated
with the alternatives which are kept as relevant according to the previous
13

analysis on pricing schemes, that is, voice/SMS communications, peak/off-
peak hours, and Vodacom-Telkom/CellC-MTN correspondents.21 In Table
7, we see that there are about 10 times more voice calls than SMS. Moreover,
the 1.5 to one ratio Vodacom-Telkom to CellC-MTN is similar for both voice
and SMS communications, and peak and off-peak hours. In addition, what-
ever the type of correspondent, the sample size for consumers using voice
communications is fairly similar in peak and off-peak hours while, when it
comes to SMS, there are two to three times more messages during off-peak
than during peak hours.
Table 7Consumer choice: Total sample
Combination of alternatives Number of observationsVoice/Vodacom-Telkom/Peak 2,007Voice/Vodacom-Telkom/Off-Peak 1,978Voice/CellC-MTN/Peak 1,022Voice/CellC-MTN/Off-Peak 1,252SMS/Vodacom/Peak 112SMS/Vodacom/Off-Peak 296SMS/CellC-MTN/Peak 78SMS/CellC-MTN/Off-Peak 191
If we now analyze the number of observations associated with the differ-
ent alternatives according to the type of Vodacom consumer, that is, urban
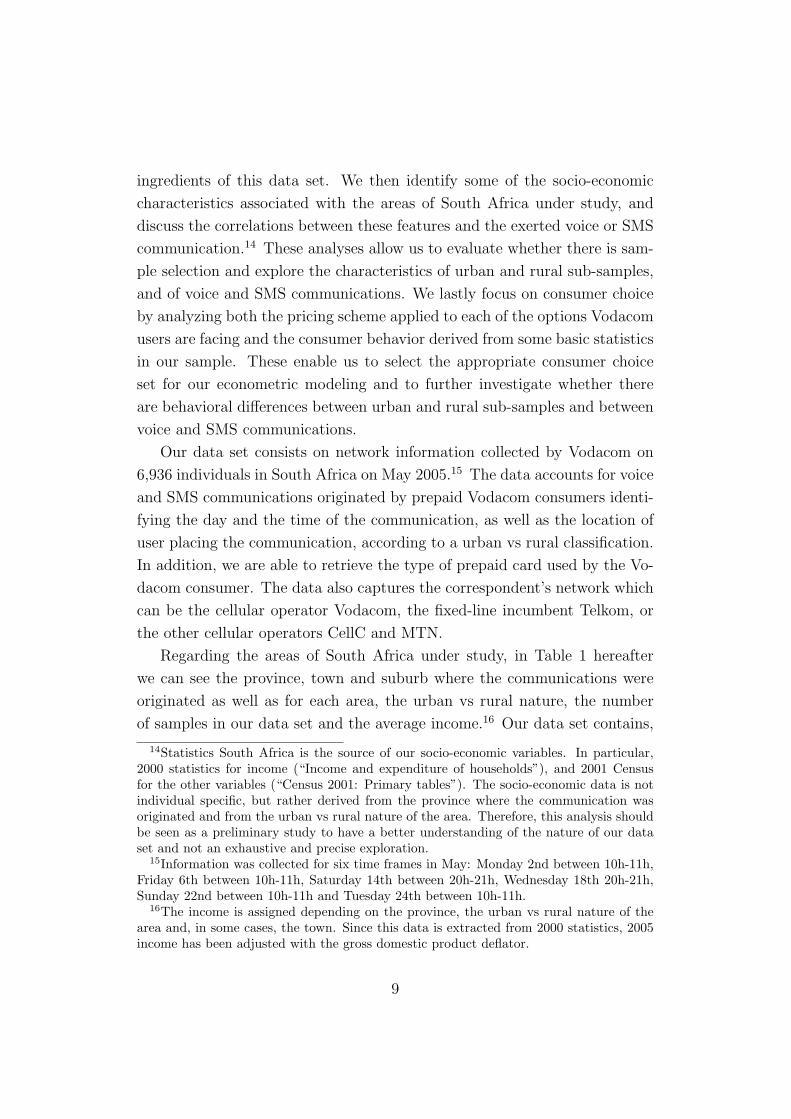
vs. rural, we obtain the figures exhibited in Table 8. It is striking that pre-
paid rural consumers make around five times more voice calls than urban
consumers during peak hours whatever the correspondent type, even if in
our sample there are only twice as many rural than urban consumers. An-
other striking feature is that despite the larger number of rural consumers
surveyed, urban consumers send more SMS, as much as the double during
off-peak hours.22 If we compare urban and rural sub-samples in Table 8
with the total sample in Table 7, we still find that overall consumers place
about twice more voice/SMS communications towards Vodacom-Telkom as
21In Table 7 we can see that all alternatives have a size greater than 30, minimum thatis necessary to obtain reliable estimations (McFadden, 1984).
22This might reflect that urban consumers have better knowledge of how to use mobilephones due to a typically higher educational level.
14

compared to CellC-MTN. However, while urban consumers place twice more
voice calls and send three times more SMS during off-peak hours than dur-
ing peak hours whatever the correspondent, rural consumers have a different
consumption pattern. They send fewer SMS, twice more SMS during off-
peak hours than during peak hours whatever the correspondent, and they
make more voice calls during peak times than during off-peak hours.
We can draw four lessons from this preliminary analysis. First, we find
evidence that supports the use of separate models for voice and SMS com-
munications due to their different underlying socio-economic characteristics,
pricing scheme, and sample pattern (see Tables 3, 6, 7 and 8). Second,
the analysis uncovers consumer choice, that is, a consumer in possession of
a certain type of prepaid card who wants to make a voice call or send an
SMS has the following options: the time of the communication which are
peak or off-peak hours, and the type of network correspondent which can
be Vodacom-Telkom or CellC-MTN.23 An outside option exists to account
for all other choices.24 Third, we find in the total sample that we are ac-
counting for the African dominant population provinces that contain, among
other regions, the less developed areas of South Africa. Forth and last, the
exploration calls for a separate analysis of urban and rural consumers and
also provides some evidence that one could use this division to proxy the first
and second economies in South Africa. Indeed, the analysis reveals signifi-
cant differences between the urban and rural sub-samples in terms of income
levels, income impact on voice and SMS communications and behavior in
terms of usage (see Tables 1, 4 and 8, respectively). Moreover, there is no
severe problem of sample selection in these urban and rural sub-samples.
23Notice that even if the price per message does not differ according to the type of corre-spondent (see Table 6), the preliminary sample analysis suggests accounting for Vodacom-Telkom and CellC-MTN as separate SMS options due to the differences in the sample sizesof the alternatives.
24This outside option take accounts for cases where the the individual is not using themobile phone or is making some other choices, e.g., placing an international call.
15
Table 8Consumer choice: Urban and rural sub-samples
Combination of alternatives Number of observationsUrban consumer Rural consumer
Voice/Vodacom-Telkom/Peak 334 1,673Voice/Vodacom-Telkom/Off-Peak 692 1,286Voice/CellC-MTN/Peak 158 864Voice/CellC-MTN/Off-Peak 401 851SMS/Vodacom/Peak 63 49SMS/Vodacom/Off-Peak 211 85SMS/CellC-MTN/Peak 47 31SMS/CellC-MTN/Off-Peak 130 61
4 Structural model
In this section we estimate a demand-and-supply structural model for the
Vodacom prepaid cellular market in South Africa, with separate models for
voice and SMS communications.25 Hereafter, we describe first the demand
model which follows the multinomial specification in Berry (1994) and sec-
ond, the supply model for a multiproduct monopole. We then explain the
calibration procedure used to solve the demand-and-supply system of equa-
tions. We finally report the results of the model and the price elasticities for
the total sample, and for the urban and rural sub-samples.
4.1 Demand
We assume a random utility model based on the deterministic decision rules
from the neoclassical economic theory, but where uncertainty is captured
by random variables. In both the voice and SMS analyses and derived
from the examination performed in section three, demand for the use of
cellular services is captured through a discrete choice model. Data is ag-
gregated according to the choice of the consumer in a set of J products,
25See section three for the arguments justifying the choice of analyzing separately voiceand SMS communications. These have been anyway subject to several joint regressionsunder multinomial logit and nested logit structures in order to identify own-price andcross-price elasticities with no consistent results.
16

j = 1, .., J = 4, contingent on the hour of the communication and on the
type of correspondent: Vodacom-Telkom/peak, Vodacom-Telkom/off-peak,
CellC-MTN/peak, CellC-MTN/off-peak, and where j = 0 accounts for an
outside option.26 We are assuming that products are competing symmetri-
cally under the multinomial logit specification.27 Figure 1 below shows the
choice model.
Figure 1
Choice set: Multinomial logit
↙ ↓ ↓ ↓ ↘
Vodacom-Telkom Vodacom-Telkom CellC-MTN CellC-MTN outsidepeak off-peak peak off-peak option
We choose to follow the methodology derived by Berry (1994) which al-
lows the use of instrumental variable techniques that are otherwise not appli-
cable in the context of discrete choice models under aggregated data where
endogenous regressors enter the demand equation non linearly.28 Both for
voice and SMS communications, the utility of consumer i for product j de-
pends on the characteristics of the consumer and the product
26The demand for usage of telecommunications services is often modeled using individ-ual data. It is sometimes modeled through a continuous system of equations with eachequation dealing with one traffic direction (local, long distance, international, towards mo-bile, ..) and depending on the prices of all other traffic directions (Wolak, 1996). Discretechoice models have also been used to model this type of demand, where consumers selecta portfolio defined as a particular number and average duration of calls to each trafficdirection and during each time of the day (Train et al., 1987). Unlike these investiga-tions, we lack information on total communications associated with each consumer duringa period, but deal with a punctual communication made by a consumer at a certain time.Hence, in order to be able to estimate interactions between consumer choices, we chooseto aggregate data.
27This assumption might be seen as constraining as one could suspect, e.g., some productdifferentiation between placing a communications towards Vodacom-Telkom or towardsCellC-MTN, from the pricing scheme and sample structure described in section three.However, no consistent results with random utility maximization were obtained undermore complex specifications such as the nested logit that relax this so-called Independencefrom Irrelevant Alternatives (IIA) assumption.
28Notice that while there is no endogenity problem when dealing with individual datasince individual consumers cannot alter prices there is however, this concern once the datais aggregated.
17

uij = δj + εij (1)
where i = 1, 2, ..., N, j = 1, 2, ..., J, δj is the deterministic part or the mean
valuation of product j common to all consumers, εij is a one-dimensional
random variable reflecting the consumer’s i deviation from the mean valua-
tion of product j.29 There are N potential consumers where each chooses one
product j that maximizes its’ utility. This number of potential consumers, N,
is the observed number of voice or SMS communications multiplied by 1 + r,
where r is the potential market factor.30 The observed number of consumers
is 6,257 for voice and 677 for SMS, and J = 4 in both cases. Next, taking a
closer look at the mean valuation of product j we have
δj = ψj − αpj + ξj (2)
where ψj is a scalar parameter representing the quality of product j, pj is
a one-dimensional regressor representing the price of the product j, α is the
sensitivity of utility to price or marginal utility of income, and ξj is the
mean of the consumers valuations of unobserved product characteristics. For
this model to be consistent with random utility maximization, α has to be
positive.
Given equation (2) and assuming that the random term, εij, is identically
and independently distributed across products and consumers with an ex-
treme value distribution, the probability that a potential consumer chooses
product j is given by
sj =eδj∑Jk=0 e
δk(3)
where
29In other words, εij represents consumer’s i unobserved product valuations, e.g., con-sumer’s i failure rate or voice quality when placing a communication towards the fixed-lineoperator Telkom during peak hours.
30Accounting for different values of the potential market factor allows us to perform asensitivity analysis, task taken up in section 4.3. Notice that exploring only the actualmarket instead of the potential one may lead to undesired overestimates in aggregatedprice elasticities (Ivaldi and Verboven, 2005). Indeed, as the potential market increases,the difference between the mean utility level of the inside good and the outside good islower, more consumers will switch to the outside alternative in case of an increase in theprice of the inside good and thus, the cross-price elasticity between the inside and theoutside good, αpoutsider/(1 + r), increases.
18

sj = qj/N (4)
with qj being the observed quantity of the product j, i.e, the number of voice
or SMS communications held by Vodacom consumers during the survey, and
sj the observed market share of product j. Therefore, at an aggregate level
the choice probability coincides with the market share. We can then invert
this predicted market share, to obtain an analytic expression for the mean
valuation of the product, δj, as a function of the demand parameters:
ln(sj)− ln(s0) = δj ≡ ψj − αpj + ξj (5)
where s0 is the market share of the outside good. We make the standard
assumption that the outside option yields zero utility. Furthermore, the net
consumer surplus, CS, which indicates the attractiveness of the set of J
products once the price payed by consumers has been substracted, has the
following expression
CS =1
αln(1 +
J∑j=1
expδj ) (6)
In this model, price elasticities, namely, the own-price elasticity of de-
mand for product j, ηj,j, and the cross-price elasticity between products j
and k, ηj,k, are given by
ηj,j = −αpj(1− sj) (7)
ηj,k = αpksk (8)
As we already mentioned, in this setting with aggregated data estimation
can be potentially plagued by endogeneity. One can reasonably expect prices
to be correlated with unobserved product characteristics (ξj). This suggests
the use of instruments and therefore, we develop hereafter the supply model
in subsection 4.2.
4.2 Supply
The Vodacom firm produces two sets of products, voice and SMS communi-
cations. Each set is composed of j = 1, 2, ..., J = 4 products. Its net profit in
19
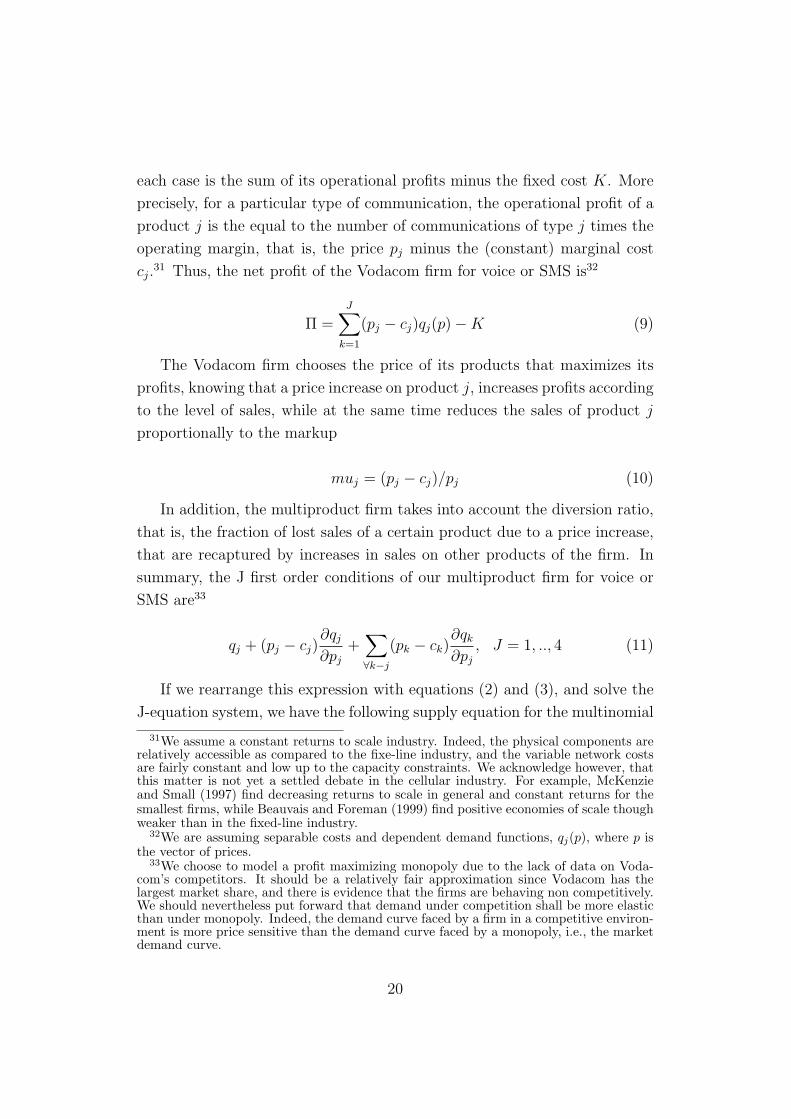
each case is the sum of its operational profits minus the fixed cost K. More
precisely, for a particular type of communication, the operational profit of a
product j is the equal to the number of communications of type j times the
operating margin, that is, the price pj minus the (constant) marginal cost
cj.31 Thus, the net profit of the Vodacom firm for voice or SMS is32
Π =J∑k=1
(pj − cj)qj(p)−K (9)
The Vodacom firm chooses the price of its products that maximizes its
profits, knowing that a price increase on product j, increases profits according
to the level of sales, while at the same time reduces the sales of product j
proportionally to the markup
muj = (pj − cj)/pj (10)
In addition, the multiproduct firm takes into account the diversion ratio,
that is, the fraction of lost sales of a certain product due to a price increase,
that are recaptured by increases in sales on other products of the firm. In
summary, the J first order conditions of our multiproduct firm for voice or
SMS are33
qj + (pj − cj)∂qj∂pj
+∑∀k−j
(pk − ck)∂qk∂pj
, J = 1, .., 4 (11)
If we rearrange this expression with equations (2) and (3), and solve the
J-equation system, we have the following supply equation for the multinomial
31We assume a constant returns to scale industry. Indeed, the physical components arerelatively accessible as compared to the fixe-line industry, and the variable network costsare fairly constant and low up to the capacity constraints. We acknowledge however, thatthis matter is not yet a settled debate in the cellular industry. For example, McKenzieand Small (1997) find decreasing returns to scale in general and constant returns for thesmallest firms, while Beauvais and Foreman (1999) find positive economies of scale thoughweaker than in the fixed-line industry.
32We are assuming separable costs and dependent demand functions, qj(p), where p isthe vector of prices.
33We choose to model a profit maximizing monopoly due to the lack of data on Voda-com’s competitors. It should be a relatively fair approximation since Vodacom has thelargest market share, and there is evidence that the firms are behaving non competitively.We should nevertheless put forward that demand under competition shall be more elasticthan under monopoly. Indeed, the demand curve faced by a firm in a competitive environ-ment is more price sensitive than the demand curve faced by a monopoly, i.e., the marketdemand curve.
20

logit specification
pj = cj +1
α(1−∑J
k=1 sk)+ ωj (12)
where ωj is the disturbance term that captures unobserved product char-
acteristics. By construction, estimation of equation (12) can be potentially
plagued by endogeneity coming through the correlation between sj and ωj,
and so has to be solved jointly with the demand equation.
4.3 Calibration
Regarding the joint estimation of the demand and supply equations (5) and
(12), we solve the system through a calibration procedure.34 We have eight
equations and nine unknowns, {α, ci, ψi} for i = 1, 2, 3, 4. We propose then
the following procedure based on some distributional assumptions:
1. We generate K times two vectors of four components for the own-price
elasticity ηj,j and the marginal costs cj, where ηj,j ∼ N(0, 1) and cj ∼N(a, b) being a the mean, which we define as the minimum price, and
b the standard deviation, which we define as the difference between
the maximum price and the minimum price. In order to derive α we
estimate jointly through the Non Linear Three Stage Least Squares
(N3SLS) methodology the own-price elasticity and supply equations,
(7) and (12), under the constraints.35
pj ≥ cj ∀j ⇒ α ≥ 0 (13)
cj ≥ 0 ∀j ⇒ α ≥ 1
pj(1− Σ∀k−1sk)∀j (14)
34Once the data has been aggregated we only have points points per equation to derivethe estimation.
35Estimations of the own-price elasticity equation under Ordinary Least Squares (OLS)gave systematically underestimated values of the sensitivity of utility to price, α. Berry(1994) similarly finds underestimated and sometimes positive coefficients on prices underOLS, while reasonable estimates with instrumental variables. He argues that under OLSestimates of α, the firm is pricing on the inelastic part of the demand curves, and thusresults contradicting economic theory are possible. Therefore, we are only going to reportthe N3SLS regressions estimates in the remainder of the paper. The Full InformationMaximum Likelihood (FIML) is not applicable since in some cases δj < 0 and then therandom term ξj does not follow a standard normal distribution.
21

2. We derive the marginal costs, cj, from the supply equation (12).
3. We derive the quality indices, ψi, from the demand equation (5).
4. We derive demand related results, namely, the consumer surplus in
equation (6) and the own-price and cross-price elasticities in equations
(7) and (8) and cost related results, namely, the markups in equation
(11).
5. The process 1-4 is repeated for each of the values of the potential market
factor r.
4.4 Results
In this subsection, we report the results of the calibration procedure for the
demand-and-supply system of equations in the case of voice and SMS com-
munications. In particular, we report the sensitivity of utility to price, the
cost related results, namely, the marginal costs and the markups, and the de-
mand related results, namely, the quality indices, the consumer surplus, and
the own-price and cross-price elasticities. We perform a sensitivity analysis
by applying the procedure to different values of the market potential factor
r, that is, to different shares of the outside good. We also provide results
for the different types of samples, that is, for the total sample, and for the
sub-samples of urban and rural consumers.
The preliminary empirical analysis of the data performed in section three
sets the ground for the selected demand-and-supply system of equations. Let
us briefly recall the different steps and outcomes of these analyses. First, we
find that voice and SMS communications are associated with significantly
different socio-economic characteristics, pricing scheme and sample pattern,
which favors a separate analysis of these two options. Second, we derive
for voice and SMS communications the set of five products contingent on
the hour of the communication and on the type of correspondent, namely,
Vodacom-Telkom/peak, Vodacom-Telkom/off-peak, CellC-MTN/peak, CellC-
MTN/off-peak and we also consider an outside option.
Third, our preliminary empirical analysis lead us to think that there is a
selectivity bias on the total sample, towards the African dominant popula-
tion areas. When it comes to exploring urban and rural sub-samples however,
22

there is no severe problem of sample selection and therefore, this allows an
unbiased comparison of the sub-samples. Lastly, we find that differences
between the urban and rural sub-samples in terms of income levels, income
correlation with voice and SMS communications, and behavior in terms of
usage, motivate a separate analysis of these sub-samples, which may be con-
sidered as rough approximations to the first and second economies in South
Africa.
Concerning our econometric framework, in order to perform the sensi-
tivity analysis we consider three scenarios contingent on the value of the
potential market factor r. First, a scenario where r = 0.5, that is, the poten-
tial market size is fifty percent larger than the observed market size. Indeed,
in our Vodacom data set consumers express their willingness to make a call
by sending around 30% free SMS with the text “Please Call Me” as compared
to the around 60% voice communications in the total number of incoming
communications.36 Second, two additional scenarios where we assume more
conservative values r = 2 and r = 4, that is, the potential market size is two
and four hundred percent larger than the observed market size, respectively.
These latter values aim at accounting for the possibility that there exists a
relatively large potential demand constrained by prices as put forward by the
ICASA report. The suitability of these selected potential market factors is
discussed below.
We proceed to analyze the calibration procedure results for voice and SMS
communications, which allows us to estimate own-price and cross-price elas-
ticities for prepaid consumers in South Africa. We make use of the demand-
and-supply system of equations which is based on the joint N3SLS estima-
tion of equations (7) and (12), where the parameters to be estimated are
{α, cj, ψj}.37 The observed variables are the prices pj, and the market shares
sj. The disturbance terms are the unobserved product characteristics ξj and
ωj. In Tables 9 and 10, we report the calibration estimates for the potential
market factors, r = 0.5, r = 2 and r = 4, and for the total sample, and the
urban and rural sub-samples. These tables show the estimated value of the
sensitivity of utility to price, α, the cost related results, namely, the marginal
36The “Please Call Me” service enables Vodacom subscribers to request a call with upto five free SMS per day.
37All of the specifications have an homoskedastic error structure, since the presence ofheteroskedasticity is always rejected at the one percent.
23

costs cj and the markups muj, and the demand related results, namely, the
quality indices ψj, the net consumer surplus CS, and the own-price and
cross-price elasticities ηj,j and ηj,k.
Regarding the estimates of the sensitivity of utility to price α in Tables
9 and 10, we recall this is the first parameter to be estimated through our
calibration procedure (see subsection 4.3). Following the first step of this
procedure we perform the N3SLS joint estimation of the own-price elasticity
and supply equations under the constraints (13) and (14). While the con-
straint (13) is not binding since we can see in the tables that α > 0, the
constraint (14) instead always binds, that is, in all cases ci = 0 for some
i. Therefore, α is given by 1/(pmin(1 −∑∀k−1 sk)), which in practice cor-
responds to 1/(p2(1−∑∀k−1 sk)) for voice, and 1/(p{2,4}(1−
∑∀k−1 sk)) for
SMS (see Tables 5 and 6).
A casual look at the tables reveals the following information about α.
First, we see that as r increases, α decreases. That is, as the potential
market factor increases, the sensitivity of utility to price decreases. Second,
since the minimum price is lower for SMS than for voice (0.35 as compared
to around 1.08), the sensitivity of utility to price is larger for SMS than for
voice, as much as three times. Third, since in the case of SMS the minimum
price is the same for all prepaid cards (4UP, VGO, VSS), α is the same for the
total sample, and the urban and rural sub-samples. However, in the case of
voice each prepaid card charges a different price and hence, the mean of the
minimum prices differs between the urban and the rural sub-samples. This
figure is higher for the urban than for the rural sub-sample and therefore,
the sensitivity of utility to price is lower for urban than for rural consumers.
We proceed to analyze the cost related results. By observing the marginal
cost estimates, we first note that c2 = 0 for voice and c2 = c4 = 0 for
SMS. Indeed, as we already explained the constraint (14) binds for those
products offering the lowest prices that is, for consumers placing a voice call
during off-peak hours towards Vodacom or Telkom users, and for consumers
sending an SMS during off-peak hours towards any operator. This finding is
consistent with costs depending on traffic congestion where in general lower
costs are associated with off-peak periods.38 We would nevertheless expect
38Notice however that since currently Vodacom has set tariffs with a large enough gapbetween peak and off-peak periods to smooth out the network load over the day, network
24

that marginal costs in cellular networks are above zero to some extent.39
Furthermore, we can see in the tables that the marginal costs are higher
for voice than for SMS, around three times more. Indeed, reserving a real
time end-to-end communication shall be more onerous than the transmission
of a message through the network. In Table 9 for voice communications we
also observe that marginal costs are slightly higher for rural than for urban
consumers. This is consistent with rural consumers placing many more (low
price) calls than urban consumers (see Table 8) and therefore with higher
levels of congestion in rural networks. In addition, rural consumers place
more long distance calls than urban consumers, towards those metropolitan
areas where services and employment are available. Higher operational ser-
vice costs should also be expected in relation to urban sites. Finally, also
in Table 9 we see that marginal costs associated with making a voice call
towards other mobile networks are higher than towards Vodacom or Telkom.
The analysis of the markups, muj, is then straight forward. We see that
markups are high for voice and SMS services with values in the range of
{0.366, 1} for voice and {0.437, 1} for SMS. The markups are the largest
for the off-peak hours when marginal costs are zero or close to zero, with
values between {0.821, 1}. In addition, the markups associated with SMS
are slightly larger than those associated with voice. For example, for the
total sample the markup for peak hours is around 0.36 for voice, while 0.47
for SMS. In accordance with the lower marginal costs for voice for urban
consumers as compared to rural consumers, the markup of urban consumers
is slightly higher. Also in the case of voice, the markups associated with calls
made towards Vodacom or Telkom are higher than those associated with the
other mobile operators, CellC and MTN.
We now proceed to explore the demand related results in Tables 9 and 10.
Starting with the quality index, ψi, one very visible result is that this index
busy hours often occur during the off-peak period.39In a cellular network, once geographical coverage has been achieved, virtually all
network elements are dimensioned for capacity. As traffic increases (given a fixed amountof radio spectrum), the network operator needs to build more radio sites, and install morecore network capacity. Therefore, marginal costs of a mobile network are expected tobe higher than those of a long distance fixed-line network where only some elements aredimensioned for capacity, and which in turn are higher than those of a local fixed-linenetwork where costs are fixed irrespective of capacity (and where marginal costs would beclose to zero).
25

is much larger for peak than for off-peak hours, specially for voice where the
ratio is around three to one. All consumers (urban and rural) are attaching a
greater value to communications during peak hours. Moreover, the values of
the quality index decrease as the potential market factor r increases. Indeed,
as the utility of the outside good increases with respect to the inside goods,
the value attached to inside goods decreases. We also observe that the quality
index is in general higher for voice than for SMS, specially during peak hours.
Indeed, the number of voice calls is 10 to 20 times larger than the number of
SMS in our data set (see Table 7).
If we compare sub-samples, we appreciate that the quality index during
peak hours is larger for rural than for urban consumers. Relatedly, the quality
index during off-peak hours is larger for urban than for rural consumers.
Hence, as we already highlighted in our preliminary study rural consumers
have a larger preference than urban consumers for peak hours, while urban
consumers have a larger preference than rural consumers for off-peak hours
(see Table 8). We can also analyze the quality index according to the type of
correspondent. For SMS in Table 10, the quality index is larger for messages
sent towards Vodacom than towards the other mobile operators. Indeed,
in Tables 7 and 8 we can see that between 1.5 and two times more SMS
sent to Vodacom than to CellC or MTN. For Voice in Table 9, the analysis
differs. While the quality index during peak hours is larger when reaching a
Vodacom user than other mobile operator users, this index during off-peak
hours is larger when reaching other mobile operator users than when calling
a Vodacom user. This is driven by the fact that prices during off-peak hours
are slightly higher for voice calls towards CellC or MTN as compared to
Vodacom or Telkom (see Table 5).
The least we can say is that the values of the net consumer surplus, CS,
are quite low with the values in the range of {0.06, 0.39}. We see that the
CS decreases as the potential market factor r increases. Again, an increase
in r implies that the utility of the outside good increases with respect to
the inside goods and therefore, the net consumer surplus associated with the
inside goods decreases. The net consumer surplus is larger for voice than for
SMS, as much as three times. This reflects the larger preference for voice than
for SMS communications (see Table 7) despite the larger prices attributed to
26
voice calls (see Tables 5 and 6). When we compare across urban and rural
sub-samples, we observe that the net consumer surplus is almost the same
in both cases.
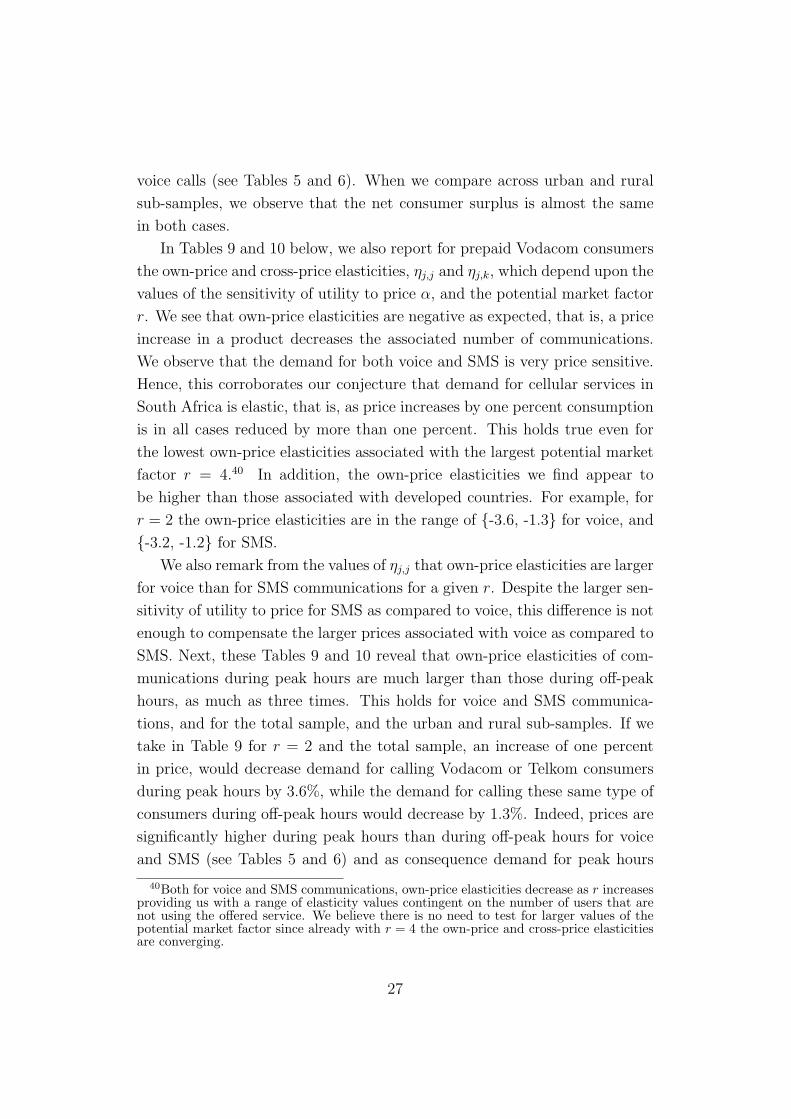
In Tables 9 and 10 below, we also report for prepaid Vodacom consumers
the own-price and cross-price elasticities, ηj,j and ηj,k, which depend upon the
values of the sensitivity of utility to price α, and the potential market factor
r. We see that own-price elasticities are negative as expected, that is, a price
increase in a product decreases the associated number of communications.
We observe that the demand for both voice and SMS is very price sensitive.
Hence, this corroborates our conjecture that demand for cellular services in
South Africa is elastic, that is, as price increases by one percent consumption
is in all cases reduced by more than one percent. This holds true even for
the lowest own-price elasticities associated with the largest potential market
factor r = 4.40 In addition, the own-price elasticities we find appear to
be higher than those associated with developed countries. For example, for
r = 2 the own-price elasticities are in the range of {-3.6, -1.3} for voice, and
{-3.2, -1.2} for SMS.
We also remark from the values of ηj,j that own-price elasticities are larger
for voice than for SMS communications for a given r. Despite the larger sen-
sitivity of utility to price for SMS as compared to voice, this difference is not
enough to compensate the larger prices associated with voice as compared to
SMS. Next, these Tables 9 and 10 reveal that own-price elasticities of com-
munications during peak hours are much larger than those during off-peak
hours, as much as three times. This holds for voice and SMS communica-
tions, and for the total sample, and the urban and rural sub-samples. If we
take in Table 9 for r = 2 and the total sample, an increase of one percent
in price, would decrease demand for calling Vodacom or Telkom consumers
during peak hours by 3.6%, while the demand for calling these same type of
consumers during off-peak hours would decrease by 1.3%. Indeed, prices are
significantly higher during peak hours than during off-peak hours for voice
and SMS (see Tables 5 and 6) and as consequence demand for peak hours
40Both for voice and SMS communications, own-price elasticities decrease as r increasesproviding us with a range of elasticity values contingent on the number of users that arenot using the offered service. We believe there is no need to test for larger values of thepotential market factor since already with r = 4 the own-price and cross-price elasticitiesare converging.
27

communications is much more elastic than for off-peak hours.
We can also see that own-price elasticities of those communications made
towards CellC or MTN consumers are higher than those made towards Vo-
dacom or Telkom consumers. This holds true for voice and SMS commu-
nications and for the total sample, and the urban and rural sub-samples.
Nevertheless, the differences in elasticities are not large and are admittedly
smaller than those observed when comparing communications made during
peak vs off-peak hours. Indeed, in Table 9 for r = 2 and the total sample, an
increase of one percent in price decreases calls made during off-peak hours to
CellC or MTN users by 1.7%, while the fall would be of 1.3% for Vodacom
or Telkom consumers. This is due to the slightly lower prices associated with
calls made towards Vodacom or Telkom users as compared to those made
towards CellC or MTN users (see Table 5) and to the fact that Vodacom
consumers make systematically around twice as many voice communications
towards Vodacom or Telkom than towards CellC or MTN users, that is, the
mean valuation of making a call towards Vodacom or Telkom is larger than
towards the other cellular operators. On the other hand, there are no price
differences between sending an SMS to Vodacom and sending it to other cel-
lular operator users. For SMS, differences in own-price elasticities according
to the type of correspondent are explained by the fact that there is a larger
number of SMS being sent towards Vodacom than towards the other cellular
operators.41
When analyzing the sub-samples of voice and SMS communications, we
observe that own-price elasticities when communicating during peak hours
are larger in the urban than in the rural sub-sample. Indeed, in Table 9
for r = 2 a one percent price increase when calling a Vodacom or Telkom
correspondent during peak hours, causes a fall in demand of 3.7% in the urban
sub-sample as compared to 3.5% in the rural sub-sample. In contrast, own-
price elasticities when communicating during off-peak hours are larger for
the rural than for the urban sub-sample. Following the previous example, a
one percent price increase when calling a Vodacom or Telkom correspondent
during off-peak hours, causes a fall in demand of 1.2% in the urban sub-
41This could be simply explained by the fact that Vodacom has around twice moreconsumers than the other two cellular competitors by 2005.
28

sample as compared to 1.3% in the rural sub-sample.42 Hence, these results
partly corroborate our conjecture that price elasticities are lower for rural
consumers. In that sense demand is less elastic for rural than for urban
consumers during peak hours which reflects, among other things, that major
services and labor opportunities are concentrated in cities. It may reflect as
well the absence of adequate transportation networks, and the greater time
loses associated with travel. In contrast, demand is more elastic for rural
than for urban consumers during off-peak hours which in turn reflects that
rural consumers are less prone to use cellular phones for leisure.
From Tables 9 and 10, we observe that cross-price elasticities are positive
as expected among substitutable products, that is, an increase in the price
of a product increases the consumption of other products. We are using
a rigid substitution scheme based on multinomial logit as we can see for
example in Table 9 for r = 2 and the total sample, where a one percent price
increase when calling a Vodacom or Telkom user during peak hours would
increase the number of calls made to these operators during off-peak hours
and to CellC or MTN users during peak or off-peak hours, by the same 0.4%
factor. Obviously, taking into account our preliminary analysis on prices and
sample patterns, this is rather simplistic but is allows however, to draw some
qualitative conclusions from our results.
If we proceed to analyze cross-elasticities comparing peak vs off-peak
hours, we observe for voice communications (see Table 9) that these are
larger for changes in peak hours prices {ηj,1, ηj,3}, as compared to changes
in off-peak hours prices {ηj,2, ηj,4}, specially in the rural sub-sample. This is
driven by the fact that prices are much larger during peak hours (see Table
5) and that rural consumers have a larger preference for peak hours (see
Table 8). However, this pattern does not hold true when analyzing voice
communications in the urban sub-sample with calls towards CellC or MTN
users. In this case, the larger prices attributed to peak hours than to off-
peak hours are not enough to compensate the large number of calls placed
during off-peak hours and thus, the situation is inverted. In the urban sub-
42This is consistent with the information in Table 8 where we see that urban consumersalways place more calls during off-peak hours, while rural consumers give a larger meanvaluation to peak hours, despite the higher prices associated with this time frame. Noticewe have taken r = 2 as example, and that the differences between price elasticities in urbanand rural sub-samples grow for larger values of the potential market factor. Moreover,these differences are systematic both for voice and SMS services.
29

sample for voice communications towards CellC and MTN correspondents,
cross-price elasticities are larger when the price of off-peak rather than of
peak hours changes.
If we now focus on analyzing cross-elasticities comparing peak vs off-
peak hours but this time for SMS communications (see Table 10), we see
that for the total sample, the situation is the reverse to the one described
for voice communications. The cross-price elasticities are larger with changes
in the price for off-peak hours as compared to peak hours. The story here
is explained through two features. First, the price differences are not as
large for SMS as for voice calls, when comparing peak and off-peak hours
(see Tables 5 and 6). Second and most importantly, the urban sub-sample
has much more weight than the rural sub-sample in SMS as compared to
voice communications and thus, since urban users are sending many more
SMS during off-peak hours than rural users, they are then driving the results
of the total sample. Indeed, we retrieve the same pattern when analyzing
the urban sub-sample for SMS that is, cross-price elasticities are larger with
changes in the price for off-peak as compared to peak hours. However, when
it comes to the rural sub-sample, we find instead that cross-price elasticities
are larger with changes in the price for peak hours as compared to off-peak
hours. Indeed, there are not as many SMS sent during off-peak hours as in
the urban sub-sample and hence, this weaker valuation of off-peak hours is
not enough to compensate larger prices during peak hours. To summarize
then, both for voice and SMS cross-elasticities are larger with changes in
prices for peak hours as compared to off-peak hours in the rural sub-sample,
while the reverse can be said for the urban sub-sample.
Cross-price elasticities are larger with changes in the price of reaching
Vodacom-Telkom users {ηj,1, ηj,2}, as compared to reaching CellC or MTN
users {ηj,3, ηj,4}. This holds for voice and SMS, and for the total sample, and
the urban and rural sub-samples. This feature is mainly due to the larger
market shares and thus the larger mean valuation associated with consumers
communicating towards Vodacom and Telkom users, with respect to CellC
and MTN users. The price differences are not playing an important role in
this matter, since given a particular time frame these are quite similar for
voice and equal for SMS (see Tables 5 and 6). Moreover, if we compare
30

directly urban and rural sub-samples, we see that cross-price elasticities for
changes in peak hours prices are larger for rural than for urban consumers.
On the other hand, cross-price elasticities for changes in off-peak hours prices
are larger for urban than for rural users. These results obviously only reflect
the different preferences of consumers, where rural users are placing more
communications during peak hours and urban consumers during off-peak
hours.
To summarize, our empirical analysis of the data set supports the propo-
sition that demand for cellular services is very sensitive to changes in price,
with larger price elasticities than those typically found in developed countries.
Every own-price elasticity is above the unity which implies that, without ca-
pacity constraints, a decrease in price will cause an increase in revenue to
the company, since the increase in quantity is quite larger than the change
in price. Moreover, we also give empirical substance to the conjecture that
urban demand for cellular services is more elastic than rural demand but
this only holds true during peak hours, that is, urban users are much more
sensitive to changes in prices during this time frame. However, we find that
rural demand for cellular services is more elastic than urban demand during
off-peak hours. In the same vein, the quality index is larger for rural than
for urban consumers during peak hours, while it is larger for urban than for
rural consumers during off-peak hours. Overall, results put forward that in
relative terms rural consumers have a higher preference for working hours,
while urban consumers for leisure hours. Next, for the same market factor,
own-price elasticities are larger for voice than for SMS, which is associated
to the larger prices of voice calls.
We also find that communications made during peak hours are much more
elastic than those made during off-peak hours, which is strongly driven by the
large prices associated with peak hours. In addition, for all consumers (urban
and rural) the quality index associated with peak hours is much larger than
that associated with off-peak hours. When it comes to cross-price elasticities
we find that overall for rural consumers cross-price elasticities are larger with
changes in prices for peak hours as compared to off-peak hours, reflecting
the larger prices and stronger preference for peak hours, while for urban
consumers cross-price elasticities are larger with changes in prices for
31

Table 9Calibration estimates for Voice
Total sample Urban sub-sample Rural sub-sample
� Potential market factorr 0.5 2 4 0.5 2 4 0.5 2 4� Sensitivity of utility to priceα 2.764 1.380 1.152 2.752 1.376 1.146 2.764 1.380 1.152Cost related results
� Marginal costc1 1.876 1.846 1.876c2 0 0 0c3 1.894 1.883 1.894c4 0.235 0.226 0.235� Mark upmu1 0.366 0.371 0.366mu2 1 1 1mu3 0.364 0.366 0.364mu4 0.821 0.828 0.821Demand related results
� Qualityψ1 7.741 2.257 0.888 7.215 1.789 0.421 7.853 2.367 0.999ψ2 2.539 -0.364 -1.306 2.854 -0.021 -0.965 2.401 -0.485 -1.426ψ3 7.113 1.605 0.232 6.569 1.092 -0.283 7.238 1.730 0.357ψ4 2.731 -0.481 -1.475 2.940 -0.256 -1.251 2.638 -0.574 -1.568� Consumer surplusCS 0.396 0.291 0.191 0.399 0.294 0.193 0.397 0.293 0.192� Own-price elasticityη1,1 -6.440 -3.650 -3.277 -6.945 -3.757 -3.223 -6.233 -3.599 -3.169η2,2 -2.364 -1.339 -1.170 -2.126 -1.282 -1.140 -2.448 -1.361 -1.181η3,3 -7.338 -3.889 -3.332 -7.641 -3.955 -3.342 -7.219 -3.860 -3.305η4,4 -3.162 -1.701 -1.459 -3.013 -1.658 -1.432 -3.205 -1.712 -1.465� Cross-price elasticityηj,1 1.751 0.437 0.218 1.134 0.282 0.141 1.953 0.487 0.242ηj,2 0.631 0.157 0.078 0.869 0.217 0.108 0.550 0.136 0.068ηj,3 0.895 0.221 0.109 0.539 0.137 0.064 1.014 0.251 0.126ηj,4 0.486 0.120 0.060 0.608 0.152 0.075 0.442 0.109 0.054
32

Table 10Calibration estimates for SMS
Total sample Urban sub-sample Rural sub-sample
� Potential market factorr 0.5 2 4 0.5 2 4 0.5 2 4� Sensitivity of utility to priceα 8.571 4.286 3.571 8.571 4.286 3.571 8.571 4.286 3.571Cost related results
� Marginal costc1 0.450 0.450 0.450c2 0 0 0c3 0.450 0.450 0.450c4 0 0 0� Mark upmu1 0.437 0.437 0.437mu2 1 1 1mu3 0.437 0.437 0.437mu4 1 1 1Demand related results
� Qualityψ1 5.743 0.936 -0.328 5.579 0.765 -0.500 6.021 1.207 -0.059ψ2 2.864 -0.019 -0.963 2.933 0.048 -0.897 2.714 -0.171 -1.115ψ3 5.382 0.574 -0.691 5.288 0.474 -0.791 5.563 0.749 -0.516ψ4 2.426 -0.458 -1.402 2.449 -0.437 -1.381 2.383 -0.502 -1.446� Consumer surplusCS 0.128 0.094 0.062 0.128 0.094 0.062 0.128 0.094 0.062� Own-price elasticityη1,1 -6.102 -3.240 -2.762 -6.225 -3.271 -2.779 -5.869 -3.181 -2.733η2,2 -2.126 -1.282 -1.141 -2.066 -1.267 -1.133 -2.249 -1.312 -1.156η3,3 -6.335 -3.298 -2.791 -6.383 -3.312 -2.799 -6.232 -3.274 -2.779η4,4 -2.435 -1.359 -1.179 -2.423 -1.356 -1.178 -2.462 -1.366 -1.183� Cross-price elasticityηj,1 0.754 0.188 0.094 0.603 0.157 0.077 0.987 0.246 0.122ηj,2 0.872 0.217 0.108 0.932 0.232 0.116 0.749 0.187 0.093ηj,3 0.521 0.130 0.060 0.473 0.116 0.057 0.623 0.154 0.077ηj,4 0.563 0.141 0.069 0.576 0.144 0.071 0.536 0.133 0.066
off-peak hours as compared to peak hours, because of their larger preference
or mean valuation for off-peak hours. Finally, we observe that demand for
communications towards CellC or MTN users is more elastic than that to-
wards Vodacom or Telkom users, though the difference is much smaller than
when comparing peak and off-peak communications. This situation is not
33

really explained through prices which are fairly similar when joining all cor-
respondents, but is due to consumers preferences over Vodacom and Telkom
correspondents, probably reflecting the larger consumer base of these com-
panies. On the other hand, also because of the larger preference or mean
valuation for communicating with Vodacom and Telkom, we find that the
cross-price elasticities are larger for changes in the price of reaching Voda-
com or Telkom users as compared to CellC or MTN.
5 Conclusion
A deeper understanding of demand for telecommunications services in the
growing markets in developing countries is clearly appealing so that market
organizations and regulatory institutions can better anticipate and adapt of-
fer. Few empirical studies have however, explored this domain. In particular,
there are, to our knowledge, no micro-econometric studies that analyze data
stemming directly from operators. In this paper, we investigate price elastic-
ities associated with voice and SMS cellular services using a cross-sectional
data set on 6,936 Vodacom consumers. In the particular context of South
Africa, we are concerned by the usage rather than the access to telecommu-
nications since there is a very high degree of cellular penetration.43
Before summarizing our main findings, we want to highlight that our re-
sults could be biased since they are based on the assumption of a monopolistic
market due to lack of data on Vodacom’s competitors. It should be kept in
mind therefore, that if Vodacom’s demand had been modeled accounting for
its competitors, we would have obtained more elastic price elasticities than
under the monopolistic model.44 Moreover, due to the nature of the data
and to the type of model used, we report long-run elasticities which are the
ones used to decide on investment.45
Our empirical findings provide evidence that demand for cellular services
is elastic, with higher price elasticities than those typically associated with
43We should acknowledge the fact that in developing countries cellular phone users oftenuse more than one SIM card to avoid high interconnection fees. This phenomenon, whichis not accounted for in our study, is however less an issue in South Africa than in otherSub-Saharan countries.
44Indeed, the demand curve faced by a firm in a competitive environment is more pricesensitive than the demand curve faced by a monopoly, that is, the total demand curve.
45Short-run elasticities based on time series data are typically much smaller than long-run elasticities.
34

developed countries. Cellular consumers are very sensitive to changes in
prices, with own-price elasticities most commonly between -1.3 and -3.8 for
voice and between -1.2 and -3.2 for SMS.46 In general terms, these results
suggest that consumers are not only making use of the cellular phone for
essential calls, where price elasticities would be rather small, but also for
maintaining relationships, for convenience, or simply for leisure, with money
being diverted from other non essential uses.
By far, the largest differences in our estimations are those between peak
and off-peak hour services. Voice or SMS communications made during peak
hours have a greater value for consumers, but since they are priced highly
than off-peak hours, they are more than twice more elastic. This leads us to
conclude that all subscribers (urban and rural) value the ability to place com-
munications during working hours presumably for the purpose of economic
activity.
We find that demand for joining CellC or MTN cellular consumers is
more elastic than the demand for joining the fixed-line or Vodacom cellular
consumers. However, this difference in elasticities is not as large as when
comparing time frames, since prices are not as different when trying to com-
municate with different correspondents. Interconnection tariffs therefore, do
not appear to account for the heaviest burdens in our data set.
We provide some empirical substance to the conjecture that price elas-
ticities are lower for rural than for urban consumers, where this statement
holds true in particular for peak hours.47 In contrast with this finding, we
obtain that price elasticities are lower for urban than for rural consumers
during off-peak hours. In the same vein, rural consumers attach a greater
value than urban consumers to peak hours, while urban consumers attach a
46There are several illustrations that provide evidence of similarly large price elasticitiesfor telecommunications services in developing countries. For example, when the cellularprovider Celtel in Congo reduced tariffs between Kinshasa and Brazzaville by one third,the traffic increased ten times. In India, in the fixed-line, tariff reductions led to monthlyrevenues increasing by a factor of 2.6 between September 1999 and August 2000 at Par-vathagiri Exchange in Andhra Pradesh.
47In general terms this argument can be explained by the cost of alternatives. The Cana-dian International Development Agency (CIDA) study on the village phone programmein rural Bangladesh, illustrates this idea. They find that the cost of the trip to the cityis two to eight times higher than the cost of a single phone call, which implies significantsavings for rural inhabitants. Similarly, in a Vodafone study on cellular users in Tanzaniaand South Africa, 50% to 70% of respondents claimed that their cellular phones led tolarge savings in travel time and cost.
35

greater value than rural consumers to off-peak hours. Even if these urban
vs rural differences are of second order in comparison with peak vs off-peak
hours differences, results reveal that in relative terms rural consumers have a
larger preference to use the cellular phone during working hours, while urban
consumers during leisure hours.
There is a particular interest to compare consumption patterns of urban
and rural consumers in the sample, as imperfect proxies for the so-called first
and second economies in South Africa. Indeed, recent market liberalization
policies in South Africa are under a broader program that is driven by the
desire of diminishing the distance between these first and second economies.
Our result on the preference of rural consumers for peak hours is consistent
with the mismatch between the areas where people live and those where work
opportunities exist, after decades of institutionalized discrimination. The
white minority lives in areas where almost all economic activity is based,
while the black majority lives either in a Bantustan, or a white-owned farm,
or in a black township near a white town, with virtually no commercial or
industrial activity and few opportunities for employment outside the informal
sector.
As recognized by Van der Merwe (2006) the geographic distance between
the places where the majority of people live, and those where businesses and
work opportunities exist, makes searching for employment difficult and ex-
pensive. In order to reduce unemployment and poverty, the government faces
the challenge of expanding the today narrow social networks that could lead
to employment amongst black people, easing access to work opportunities.
Our findings suggests that reducing the gap between the first and second
economies in South Africa, calls for an encouragement of investment efforts
in network availability in rural areas since usage in these areas appears to
support economic activity as highlighted by the high value and relative low
elasticity attached to working hours. These policy insights are consistent
with the universal access objectives fixed by the South African authorities.
Together with the report of the South African regulator ICASA that
states that voice and SMS cellular communications are heavily charged and
more so in the case of prepaid consumers, the high elasticities we report lead
us at first to suggest from a policy perspective that if market organizations
36

or regulatory institutions were to set price cuts on prepaid services this could
be rewarding both for consumers in terms of usage and for the firm in terms
of its revenues, and more so during peak hours.4849 Indeed, it is due to the
high prices in this time frame, that demand for peak hours is strongly more
elastic than demand for off-peak hours. However, this suggestion suffers from
two caveats.
Firstly, our data set is based on 2005 network information, while there
have been some efforts on price reductions on behalf of Vodacom in the mean
time.50 Secondly, though price reductions would increase revenue, they would
also increase peak time usage which could eventually raise network capacity
costs. Therefore, for the particular case of rural areas networks which are
running close to full capacity, it would be necessary to verify that the increase
in revenues would be sufficient to cover the eventual necessity of incremental
investments on more base stations.
In summary, if market organizations and regulatory institutions were to
react to the above specificities in terms of the high price elasticities and
the urban vs rural patterns of consumption, features that can be probably
extrapolated to other developing countries’ experiences, an enhancement of
both the firm’s profit and the consumer welfare could be expected.
48Network operators do not necessarily agree with ICASA’s statements.49Prepaid prices are however, comparable to those charged in Europe. In France for
example, the ratio of prepaid minute tariffs to average monthly income is not that differentfrom that in South Africa. The purchasing level in absolute terms, which should be smallerin South Africa, must be then playing a major role in defining consumer preferences.
50By 2007 Vodacom prepaid cards tariffs include the so-called “happy hours” from 5pmto 8pm during the week. The company is also offering a new prepaid card with lower tariffswhen placing a voice call towards other Vodacom consumers and during peak hours, atthe cost of an annual subscription of 899 Rands.
37

References
Aldebert, M., Ivaldi, M., and C. Roucolle, “Telecommunications
demand and pricing structure: An econometric analysis,” Te-
lecommunication Systems, 25(1), 2004, pp. 89-115.
Beauvais, E., and R.D. Foreman, “Scale economies in cellular
telephony: Size matters,” Journal of Regulatory Economics,
16(3), 1999, pp. 297-306.
Berry, S., “Estimating discrete-choice models of product differen-
tiation,” The RAND Journal of Economics, 25(2), 1994, pp.
242-262.
Chowdhury, S. K., Galdo, V., and M. Torero, “Willingness to
pay for the rural telephone service in Bangladesh and Peru,”
Information Economics and Policy, 15(3), 2003, pp. 327-361.
Comision de Regulacion de Telecomunicaciones (CRT), “Estudio
de estimacion de funciones de demanda de los mercados de
telefonıa local, telefonıa larga distancia y telefonıa movil y es-
timacion de elasticidades propias y cruzadas de cada servicio,”
CRT Working Paper, Colombia, 2005.
Dewenter, R., and R. Haucap, “Estimating demand elasticities
for mobile telecommunications in Austria,” University Federal
Armed Forces Economics Working Paper No. 33, 2004.
Fuss, M., Meschi, M., and L. Waverman, “The impact of mo-
bile phones on economic growth in developing countries,” In:
Africa: The Impact of Mobile Phones, The Vodafone Policy
Paper Series No. 3, 2005.
Grameen Technology Center, “Village phone replication manual,”
Grameen Foundation USA (eds.), 2005.
GSM Association, “Tax and the digital divide: How new ap-
proaches to mobile taxation can connect the unconnected,”
In:GSMA Mobile Tax Report, GSMA (eds.), 2005.
Ivaldi, M., and F. Verboven, “Quantifying the effects from hori-
zontal mergers in the European competition policy,” Interna-
38

tional Journal of Industrial Organization, 23(9-10), 2005, pp.
669-691.
Organismo Supervisor de Inversion Privada en Telecomunicaciones
(OSIPTEL), “Proyeccion de demanda acceso a telefonıa fija
en zonas urbano-marginales del Peru y conclusiones finales,”
Estudios en Telecomunicaciones No. 18, Peru, 2005.
Martins, M. L. C., “International differences in telecommuni-
cations demand,” Information Economics and Policy, 15(3),
2003, pp. 291-303.
McFadden, D., “Econometric analysis of qualitative response mod-
els,” In: Handbook of Econometrics, Vol II, Z. Griliches and
M. D. Intriligator (ed.), 1984.
McKenzie, D.J., and J.P. Small, “Econometric cost structure es-
timates for cellular telephony in the United States,” Journal
of Regulatory Economics, 12(2), 1997, pp. 147-157.
Sridhar, K.S., and V. Sridhar, “Telecommunications infrastruc-
ture and economic growth: Evidence from developing coun-
tries,” National Institute of Public Finance and Policy Work-
ing Paper (NIPFP), India, 2004.
Train, K., McFadden, D., and M. Ben-Akiva, “The demand for
local telephone service: A fully discrete model of residential
calling patterns and service choices,” Rand journal of eco-
nomics, 18(1), 1987, pp. 109-123.
Van der Merwe, S., “Informal institutions and development in
South Africa,” OECD International Seminar on Informal In-
stitutions And Development: What Do We Know And What
Can We Do?, Paris, 2006.
Wheatley, J. J., “Price elasticities for telecommunication services
with reference to developing countries,” World Dialogue on
Regulation for Network Economies Discussion Paper (London
School of Economics), 2006.
Wolak, F., “Can universal service survive in a competitive telecom-
39

munications environment? Evidence from the United States
consumer expenditure survey,” Information Economics and
Policy, 18(3), 1996, pp. 163-203.
40