south africa’s trade relationship with africa1
TRANSCRIPT
© Trade Law Centre, 2017
South Africa’s trade relationship with Africa1
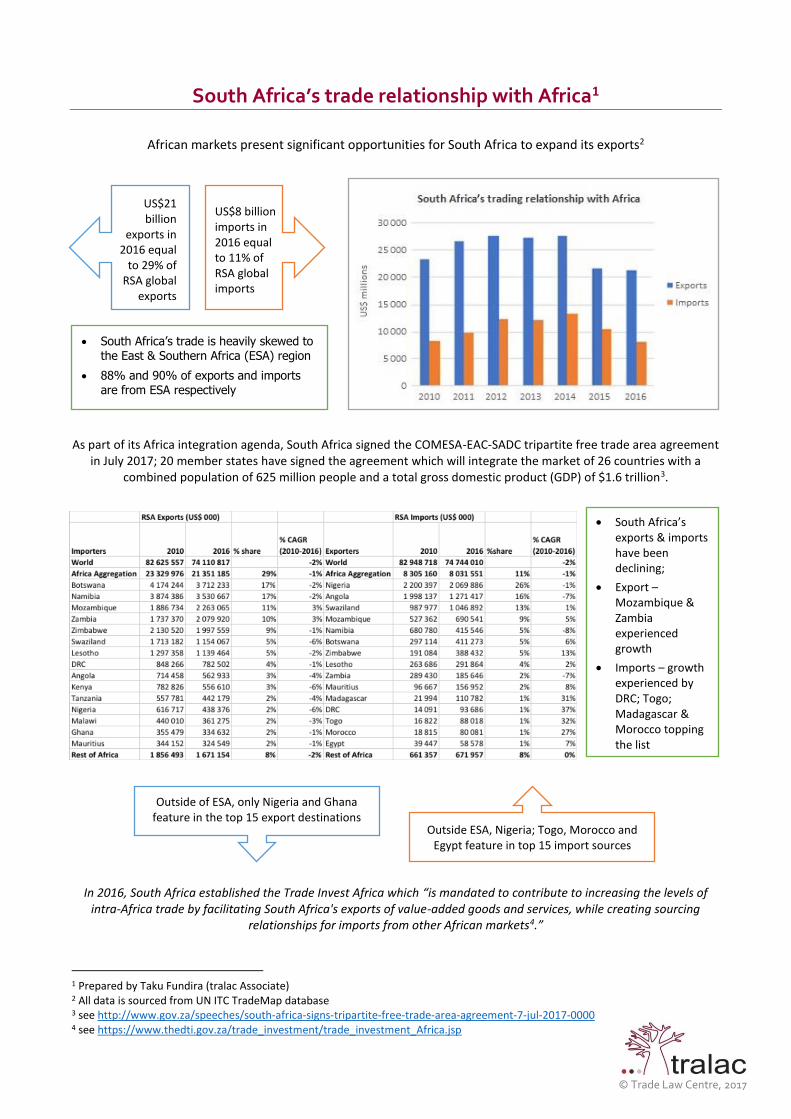
African markets present significant opportunities for South Africa to expand its exports2
As part of its Africa integration agenda, South Africa signed the COMESA-EAC-SADC tripartite free trade area agreement in July 2017; 20 member states have signed the agreement which will integrate the market of 26 countries with a
combined population of 625 million people and a total gross domestic product (GDP) of $1.6 trillion3.
In 2016, South Africa established the Trade Invest Africa which “is mandated to contribute to increasing the levels of intra-Africa trade by facilitating South Africa's exports of value-added goods and services, while creating sourcing
relationships for imports from other African markets4.”
1 Prepared by Taku Fundira (tralac Associate) 2 All data is sourced from UN ITC TradeMap database 3 see http://www.gov.za/speeches/south-africa-signs-tripartite-free-trade-area-agreement-7-jul-2017-0000 4 see https://www.thedti.gov.za/trade_investment/trade_investment_Africa.jsp
US$21 billion
exports in 2016 equal
to 29% of RSA global
exports
US$8 billion imports in 2016 equal to 11% of RSA global imports
• South Africa’s trade is heavily skewed to the East & Southern Africa (ESA) region
• 88% and 90% of exports and imports are from ESA respectively
Outside of ESA, only Nigeria and Ghana feature in the top 15 export destinations
Outside ESA, Nigeria; Togo, Morocco and Egypt feature in top 15 import sources
• South Africa’s exports & imports have been declining;
• Export – Mozambique & Zambia experienced growth
• Imports – growth experienced by DRC; Togo; Madagascar & Morocco topping the list
© Trade Law Centre, 2017
Exports by composition
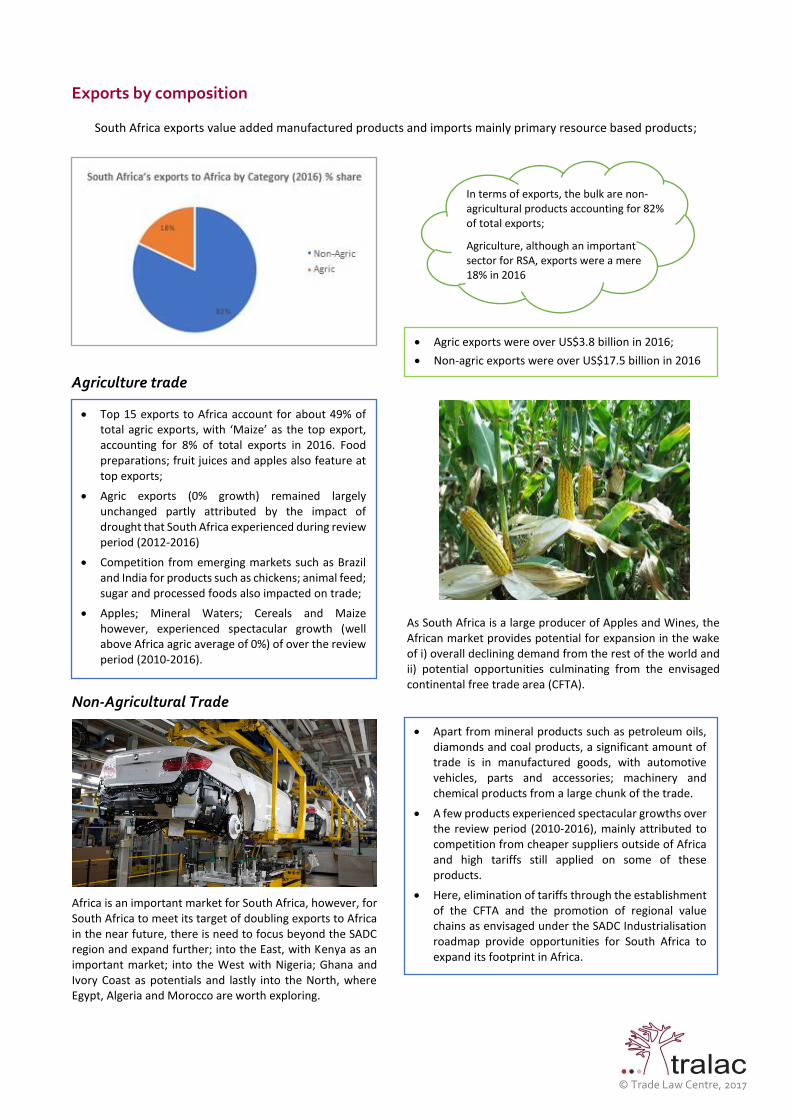
South Africa exports value added manufactured products and imports mainly primary resource based products;
Agriculture trade
As South Africa is a large producer of Apples and Wines, the African market provides potential for expansion in the wake of i) overall declining demand from the rest of the world and ii) potential opportunities culminating from the envisaged continental free trade area (CFTA).
Non-Agricultural Trade
Africa is an important market for South Africa, however, for South Africa to meet its target of doubling exports to Africa in the near future, there is need to focus beyond the SADC region and expand further; into the East, with Kenya as an important market; into the West with Nigeria; Ghana and Ivory Coast as potentials and lastly into the North, where Egypt, Algeria and Morocco are worth exploring.
In terms of exports, the bulk are non-agricultural products accounting for 82% of total exports;
Agriculture, although an important sector for RSA, exports were a mere 18% in 2016
• Top 15 exports to Africa account for about 49% of total agric exports, with ‘Maize’ as the top export, accounting for 8% of total exports in 2016. Food preparations; fruit juices and apples also feature at top exports;
• Agric exports (0% growth) remained largely unchanged partly attributed by the impact of drought that South Africa experienced during review period (2012-2016)
• Competition from emerging markets such as Brazil and India for products such as chickens; animal feed; sugar and processed foods also impacted on trade;
• Apples; Mineral Waters; Cereals and Maize however, experienced spectacular growth (well above Africa agric average of 0%) of over the review period (2010-2016).
• Agric exports were over US$3.8 billion in 2016;
• Non-agric exports were over US$17.5 billion in 2016
• Apart from mineral products such as petroleum oils, diamonds and coal products, a significant amount of trade is in manufactured goods, with automotive vehicles, parts and accessories; machinery and chemical products from a large chunk of the trade.
• A few products experienced spectacular growths over the review period (2010-2016), mainly attributed to competition from cheaper suppliers outside of Africa and high tariffs still applied on some of these products.
• Here, elimination of tariffs through the establishment of the CFTA and the promotion of regional value chains as envisaged under the SADC Industrialisation roadmap provide opportunities for South Africa to expand its footprint in Africa.