an energy consumption and energy efficiency study …
TRANSCRIPT
AN ENERGY CONSUMPTION AND ENERGY
EFFICIENCY STUDY OF HOTELS IN THE PACIFIC
ISLAND COUNTRIES – A FIJIAN CASE STUDY
By
Krishneel K Prasad
A thesis submitted in partial fulfillment of the
requirements for the degree of
Master of Science in Physics
Copyright © 2016 by Krishneel Prasad
School of Engineering and Physics
Faculty of Science, Technology and Environment
The University of the South Pacific
Suva, Fiji Islands
February, 2016

Declaration of Originality
Statement by Author
I hereby declare that the work presented in this thesis is of my own effort and to the best
of my knowledge does not contain any previous published materials, except where due
acknowledgement has been made in this text.
…………………………………….
Date ………………….
Krishneel K Prasad
Student Id: S11040726
Statement by Supervisor
The research in this thesis was performed under my supervision and the work contained
in this thesis is that of Krishneel K Prasad unless stated otherwise.
………………………………………
Date ……………………
Dr. Anirudh Singh
Principle Supervisor

i
Acknowledgments
This research work would not have been worthy without the support of some special
individuals. The compilation of this work has been only fruitful by the assistance of
those to whom I wish to share this success with. I am very thankful towards all those
who had assisted me in this research.
I would like to convey my sincere thanks to my supervisor, Associate Professor,
Anirudh Singh. He was instrumental in helping me achieve the necessary details for the
successful completion of this research work. I wish to thank him for his continued
guidance and support. I am also thankful to co-supervisors, Associate Professor, Atul
Raturi for his support and encouragement. I wish to appreciate the assistance from Prof.
David Harrison in helping me to get the case studies of the Hotels in Fiji. I thank the
research cluster group for providing the funding for this project, including the members,
Prof. Biman Prasad, Dr. Sunil Kumar, Dr. Gyaneshwar Rao, Mr. SolomoneFifita (SPC),
and Mr. Richard Lal. Together with that, I cannot fail to thank the research office in
accepting me as a candidate for a Graduate Assistant in Physics. Thanks to the Research
Officer, Miss Shaiza Janif in assisting me to transition well into the Master of Science
programme. I have great honor to thank the management/administration staff and the
technical/maintenance staff of the hotels where I carried out my field work for providing
me the details of the energy costs and utility bills and guiding me around the hotels to
note the energy consumption in different areas.
I wish to convey my gratitude towards my academic colleagues and the technical staff in
the School of Engineering and Physics. Much appreciated help from Mr. Abhikesh
Kumar, Mr. Atesh Gosai, Miss. Shirleen Swapna, Dr. Ravin Deo, Dr. Ajal Kumar, Mr.
Amol Kishore, Mr. Radesh Lal, Mr. Viti Buadromo, Mr Neil Singh, MrJoape
Cawanibuka and Mr. Shanil Deo. I also wish to acknowledge the Fiji Meteorological
Services in providing me the data for my analysis of results.

ii
Finally, I credit this work to my parents for their countless blessings, love and continued
words of support and encouragement. Heartfelt thanks goes to my sisters as well for
their well wishes and inspirations.
iii
Abstract
The Pacific Island Countries (PICs) have been heavily reliant on imported fossil fuels
for energy generation and the tourism industry uses enormous quantities of energy to
provide services and accommodation to tourists for its daily operations. In this study,
two hotels from Fiji of different building types and geographic locations have been taken
as case studies to study their energy consumption and identify energy efficiency
measures for possible energy and cost savings and reduction in carbon footprint.
Hotel 1 was a high rise building in the city used mostly by corporate businesses while
Hotel 2 was a beachfront villa-type hotel. An energy audit gave a relative measure of the
energy consumption in various areas of the buildings. The total energy usage as
determined by the utility was then used to determine the actual distribution of energy use
in the building. The effect of retrofitting and other energy efficiency measures were then
calculated using this model.
The annual energy consumption of the buildings was divided into three sectors viz:
Production, Services and Management. The highest energy consumption in Hotel 1 was
in the use of elevators at 58,432 kWh. In Hotel 2, the kitchen had the highest energy
consumption (187,309.9 kWh). Energy savings of 16 – 19% is possible through simple
retrofitting and energy efficiency discipline. In Hotel 1, the energy savings through
retrofitting was calculated at 52,019.47 kWh/year, which is a cost saving of
FJ$22,888.57/year. In Hotel 2, the energy savings were 240,195kWh/year, representing
a 19.6% energy savings or FJ$105,686.14 cost savings per year. The carbon-dioxide
emission reduction at the utility power station as a result of these savings were
12,484.67 kg for Hotel 1and 57,646.98 kg for Hotel 2.
Two energy performance indicators (EPIs) were developed. The first EPI gives energy
consumption (kWh) per unit area (m2) and the second is the energy consumption (kWh)
per occupied guest room. The analysis of EPI 2 showed a very clear seasonal trend for
both hotels. This is attributed to the use of air-conditioning systems which is the highest
energy consuming device in a guest room. The differences in energy consumption

iv
between the two hotels can be partly attributed to the different physical layout of the
building envelopes. Finally, a cooling load model for the hotels, and the use of
renewable energy were also considered for improving the energy efficiency and/or
reducing the carbon footprints of the hotels.
v
Abbreviations and units
Abbreviations
A/C air – conditioning system/unit
AC alternating current
BEC Building Energy Code
BEVs Battery Electric Vehicles
C Carbon
CL Cooling Load
DHW Domestic Hot Water system
DSL Direct Solar Load
E&T Equipment and Technology
EE Energy Efficiency
ECP Act Energy Conservation Promotion Act
ENCON Fund Energy Conservation Promotion Fund
EPA Environmental Protection Agency
EPIs Energy Performance Indicators
ERMs Energy Retrofit Measures
ETTV Envelope thermal transfer value
EUI Energy Use index
EUInorm normalized energy use index
FAESP Framework for Action on Energy Security in the Pacific
FEA Fiji Electricity Authority
FSC Fiji Sugar Cooperation
GHGs Greenhouse gases

vi
H2FC Hydrogen Fuel Cell
H2 ICE Hydrogen Internal Combustion Engine
HVAC Heating Ventilation and Air Conditioning
IM Induction Motor
IPESP Implementation Plan for Energy Security in the Pacific
IPMSM Interior Permanent Magnet Synchronous Motor
IPPs Independent Power Producers
LPG Liquefied Petroleum Gas
M&O Management and operations
NER Net energy ratio
N2O Nitrous oxide
OTTV Overall thermal transfer value
PER Primary energy ratio
PICs Pacific Island Countries
PIEPSAP Pacific Islands Energy Planning and Strategic Action Planning
Project
PV Photo Voltaic
PVT Photovoltaic-thermal
RL Room load
SHG Solar Heat Gain
SIDS Small Island Developing States
UNDP United Nations Development Programme
VSD Variable speed drive
vii
Units
cm centimeter
GJ Giga Joules
GJth/y Thermal energy in Giga Joules per year
GtCO2eq Giga tons of carbon dioxide equivalent
GtCO2 yr-1
Giga tons of carbon dioxide per year
GWh/y Energy in Giga-watt hours per year
kWh kilowatt hours
kWh/sq. ft kilowatt hours per square feet
kWh/m2 kilowatt hours per square meter
kWh/y kilowatt hours per year
m2 square meters
m2K/W thermal resistance in meter squared Kelvin per unit power
MJ/visitor Energy use in Mega Joules per visitor
ton CO2/y tons of carbon dioxide per year
toe tons of oil equivalent
toe/y tons of oil equivalent per year
W/m2/K Watt per square meter per Kelvin
Nomenclature
ηC the Carnot efficiency
Ti intake engine temperature (K)
To exhaust engine temperature (K)
TEact the total actual energy consumption (in kWh) for the whole
building from the tariff rates.
viii
Eroom Nominal use of energy in a room (kWh) per day
t Duty cycle of operation of the appliance per day (hours)
SectionnomE . Nominal monthly energy consumption in a section (kWh)
roomE Nominal energy consumption for a unit section per day. (kWh)
daysm No. of days in the particular month
n Represents the no. of rooms; (applicable to the no. of guest rooms;
all other sections such as administration, lobby/lounge, reception,
restaurant & bar etc. are taken as n=1)
occupancym Monthly occupancy rate (applicable mainly to guest rooms; all
other sectors are assumed to have 100% occupancy; that is,
operational full time.)
actE The actual energy consumption in a section per month (kWh)
nomE Nominal energy consumption per month for a section (kWh)
EffE Actual Energy efficient value in a sector after energy efficiency
and retrofitting (kWh)
RtfE Estimated energy per sector after retrofitting (kWh)
nomE Total nominal energy consumption per month for a particular
sector. (kWh)
actE actual energy consumption in a sector per month (KWh)
Esaved the amount of energy saved via retrofitting (kWh)
the specific CO2 emission (kgCO2/kWh)
Cf specific carbon content in the fuel (kgC/kgfuel)
hf specific energy content (kWh/kgfuel)
Cm specific mass carbon (kg/mol Carbon)
ix
specific mass carbon dioxide (kg/mol CO2)
Qc Conductive Heat Transfer
Qa Heat transfer due to air exchange
Qr Radiative Heat emission
∆T the temperature difference between the indoor and outdoor (K)
U heat transfer coefficient
A area of the conductive heat transfer (m2) eg. walls, ceilings
ρ density of air (kg m-3
)
ca specific heat capacity of air (1005 J kg-1
K-1
)
Fv volumetric flow rate of air (m3 s
-1)
Ti indoor temperature of air (K)
Te outdoor temperature of air (K)
P atmospherics pressure (Pa)
Rspecific specific gas constant for dry air = 287.058J/ (kg.K)
B the blackbody radiation in W/m2
σ the Stefan – Boltzmann constant (5.67 x 10⁻⁸
W m-2
K-4
)
ε emissivity of the object (the ratio of actual emission to the
maximum possible emission) For a perfect blackbody, ε = 1.
x
Table of Contents
Acknowledgements i
Abstract iii
Abbreviations and units v
List of Figures xiv
List of Tables xvi
Chapter 1 Introduction 1
1.1 Overview 1
1.2 Thesis Structure 2
1.3 Sources of Energy 3
1.4 The Use of Fossil Fuels and its consequences 5
1.5 Energy Use in the Tourism Industry 7
1.6 Objectives 8
Chapter 2 Literature Review 9
2.1 Introduction 9
2.2 Climate change from Conventional Energy Sources 10
2.3 Energy in the Pacific 12
2.3.1 Energy Generation in Fiji 13
2.3.2 Energy Consumption in the Tourism sector 15
2.4 Energy Consumption in Buildings 17
2.4.1 Building Structure and Envelope 19
2.4.2 Energy Analysis in Hotel Buildings 22
xi
2.4.3 Energy indices to measure Energy Performance 23
2.4.4 Development of Energy Policies 24
2.4.5 Passive Design Strategies in Buildings 25
2.5 Energy Efficiency 27
2.5.1 Retrofitting – An Energy Efficiency Measure 28
2.5.2 Use of Energy Efficient Materials 29
2.5.3 Barriers to Energy Efficiency 30
2.5.4 Management and Operations 31
2.6 Use of Renewable Energy 32
2.6.1 Solar Thermal Hot Water systems 34
2.6.2 Use of Photo-Voltaic (PV) systems 34
2.6.3 Wind Power 35
2.7 Conclusion 36
Chapter 3 Methodology 38
3.1 Introduction 38
3.2 Analysis of Energy Audit 39
3.2.1 Overview 39
3.2.2 Nominal Use of Energy for one room in a Section 40
3.2.3 Nominal Use of Energy in a Section 41
3.2.4 The Normalized Energy Consumption 42
3.3 Sector – Wise Analysis of Energy Consumption 43
3.4 Retrofitting with Energy Efficient Devices and Estimated Energy Savings 44
3.4.1 Scheme of Retrofit 44
3.4.2 Energy Savings after Retrofitting 45
3.5 Developing Energy Performance Indicators 46
xii
3.5.1 EPI 1 – Energy Consumption per unit area (kWh/m2) 46
3.5.2 EPI 2 – Energy Consumption per guest room
(kWh/occupied guest room) 47
3.5.3 Modeling energy consumption of an arbitrary hotel from the EPIs 47
3.6 Modeling of the Cooling Load 48
3.6.1 Overview 48
3.6.2 Heat Transfer by Conduction, Qc 49
3.6.3 Heat transfer by air exchange, Qa 50
3.6.4 Radiative Heat Emission, Qr 51
3.6.5 Application of Cooling Load Model in Case Studies 52
3.7 Comparison of Hotels around the regions 53
3.8 Chapter Conclusion 53
Chapter 4 Results and Discussions 54
4.1 Introduction 54
4.2 Energy Audit 55
4.2.1 Estimated Energy Consumption in various sections of the hotel 59
4.3 Energy Distribution and Sector-wise analysis of energy consumption in hotels 60
4.3.1 Energy Distribution 60
4.3.2 Energy Consumption Estimation 60
4.3.3 Normalization of Estimated to Actual Energy Consumption 61
4.3.4 Sector – wise analysis of Energy Consumption 64
4.4 Retrofitting with energy efficient devices and energy discipline 68
4.4.1 Energy Savings possible via Retrofitting 71
4.4.2 Simple Payback period calculation 74
4.5 Fuel Savings and Carbon Emission reduction 75
xiii
4.5.1 Estimated Fuel (Diesel) savings 75
4.5.2 Calculating the carbon emissions 76
4.6 Developing Energy performance Indicators 78
4.6.1 EPI 1 – Energy consumption per unit floor area 78
4.6.2 EPI 2 – Energy consumed per occupied guest room 81
4.7 Predicting Energy Consumption using EPIs 83
4.7.1 Energy Consumption in different sections of the Hotel 84
4.7.2 An Example of a Problem statement 84
4.7.2.1 Predicting the Energy Usage 85
4.7.2.2 Energy Costs 88
4.8 The Cooling load model & sample calculations on the case studies 90
4.8.1 Heat transfer by Conduction 90
4.8.2 Heat transfer by air exchange method (Convection) 92
4.8.3 Internal Radiative Heat 92
4.8.4 Heat Dissipating Devices/appliances 93
4.8.5 Application of the Cooling Load to the Case Studies 95
4.9 Comparison of Hotels from other regions 102
Chapter 5 Summary and Conclusions 105
5.1 Summary of Work 105
5.2 Conclusion 107
Bibliography 110
Appendices 115
xiv
List of Figures
Chapter 1
Figure 1.1 The total number of tourist arrivals to Fiji including visitors,
cruise-ships and transit passengers. 1
Figure 1.2 Various energy sources estimated to be used globally for electricity
generation 4
Figure 1.3 Measured CO2 in parts per million in the upper
atmosphere over the decades. 6
Chapter 2
Figure 2.1 The increasing trend in price of diesel oil and
heavy fuel oil over the years. 15
Figure 2.2 Total number of visitor arrivals, transit passengers by air
and sea to Fiji from 2000 to 2010 16
Figure 2.3 The electricity generation from the Butoni wind farm,
Sigatoka, Fiji. 36
Chapter 4
Figure 4.1 Plot of the electrical energy consumption of hotel 1
for each month from 2009 to 2011 58
Figure 4.2 Plot of the monthly electricity consumption of hotel 2
from 2010 to 2011. 58
Figure 4.3 Annual Energy consumption by the different sectors of Hotel 1 65
Figure 4.4 Energy consumption (kWh) of the various areas of Hotel 1 65
Figure 4.5 Annual Energy consumption by the different sectors of Hotel 2 67
xv
Figure 4.6 Energy consumption (kWh) of the various areas of Hotel 2 67
Figure 4.7 The effects of retrofitting on energy consumption
in different areas of Hotel 1 72
Figure 4.8 Retrofits applied to hotel 2 showing the current
and the retrofitted energy consumption. 73
Figure 4.9 Energy consumption per unit area for Hotel 1 as EPI 1 79
Figure 4.10 Energy consumption per unit area for Hotel 2 as EPI 1 79
Figure 4.11 Energy consumption per occupied guest room
on a particular month in Hotel 1 82
Figure 4.12 Energy consumption per occupied guest room
on a particular month in Hotel 2 82
Figure 4.13 The energy consumption in an occupied guest room in both
the hotels with seasonal variation of temperature change. 83
Figure 4.14 Energy inflows and outflows through a typical building. 89
Figure 4.15 Analysis of heat conduction in a small building
via ceiling & walls 90
Figure 4.16 The structural layout of Hotel 1 95
Figure 4.17 Conjoining guest rooms layout in Hotel 2 99
Figure 4.18 Plan View of the adjoining Offices in Hotel 2 100
xvi
List of Tables
Table 2.1 Pacific Island Countries and their renewable energy timescale targets 13
Table 4.1 Electricity tariff rates for Commercial and Industrial companies 55
Table 4.2 Value Added Tax (VAT) added to the utility bill 55
Table 4.3 Monthly Electricity Utility Bills Data 56
Table 4.4 Estimation of total electrical energy consumption
for a single room 59
Table 4.5 Various sections of Energy usage in hotel 1 60
Table 4.6 Nominal distribution of Monthly Energy Consumption
in Hotel 1 for the year 2009 62
Table 4.7 Normalized distribution of Monthly Energy Consumption
in Hotel 1 for the year 2009 63
Table 4.8 Monthly electrical energy consumption (kWh) for the
three different Sectors of Hotel 1 in year 2009 64
Table 4.9 Monthly mean electrical energy consumption for the
three sectors of Hotel 2 for years 2010 – 2012 66
Table 4.10 Estimated Energy consumption values for a single room
(Executive suite) after implementing retrofits
and energy efficiency measures 68
Table 4.11 Retrofitted estimated distribution of monthly energy
consumption (kWh) in different sections of Hotel 1 69
Table 4.12 Retrofitted normalized distribution of monthly energy
consumption (kWh) in different sections of Hotel 1 70
Table 4.13 Possible energy savings in terms of applying retrofits 71
xvii
Table 4.14 Some common fuels and their specific energy content
with CO2 emission levels. 76
Table 4.15 Electrical Energy consumption by hotels 1 and 2 76
Table 4.16 Energy and cost savings per annum after retrofitting
in the Hotel case studies 77
Table 4.17 Energy consumed per unit floor area for
different sections in Hotel 1 78
Table 4.18 Energy consumption in a unit area between
similar areas of the two hotels. 80
Table 4.19 Monthly variation of EPI 2 for Hotel 1 81
Table 4.20 Energy consumption per unit area in different
sections of the hotel 1 84
Table 4.21 Energy Performance Indicator and the Area of
the Example Hotel 85
Table 4.22 Energy consumption in areas that operate irrespective
of the guest occupancy level. 86
Table 4.23 Energy consumption calculation using EPI 1 in conference
rooms per month. 87
Table 4.24 Energy consumption calculation in guest rooms using the
EPI 2 with an occupancy level of 70% per month. 87
Table 4.25 Total Energy consumption of the hotel per month (kWh) 88
Table 4.26 Estimated monthly energy cost incurred by the hotel
related to its energy consumption. 88
Table 4.27 Small building constructed from materials with
different thermal properties used. 91
xviii
Table 4.28 List of appliances that add to the sundry heat gains by
heating processes in a building. 93
Table 4.29 Conductive Heat transfer in the building structure of Hotel 2 101
Table 4.30 Energy Performance Indicator (Annual total energy
consumption per unit area) from different parts of the world 103
Table 4.31 Computer simulations give a set of result for EPI 1 in
different countries. 104
Table 5.1 Annual savings as a result of retrofitting techniques
applied in Hotels 1 & 2 106
1
Chapter 1 Introduction
1.1 Overview
Tourism plays an important role in contributing to economic growth in Pacific Island
countries such as Fiji. Tourism is regarded as one of the major benefactor of social and
cultural activities and is even the world‘s largest industry(Marco Beccali et al., 2009).
From enhancing the improvements to conservation of cultural and natural traditional
heritage and infrastructural investments, it also contributes to the development of the
nation‘s economy through foreign currency, income generation and creating job
opportunities for many countries (Hunter, 2002).
Employment in this thriving sector is expanding on an intense scale. This is because
tourism is a labour intensive industry, operating 24 hours a day and seven days a week.
The employment is not limited to only qualified individuals as there also exists
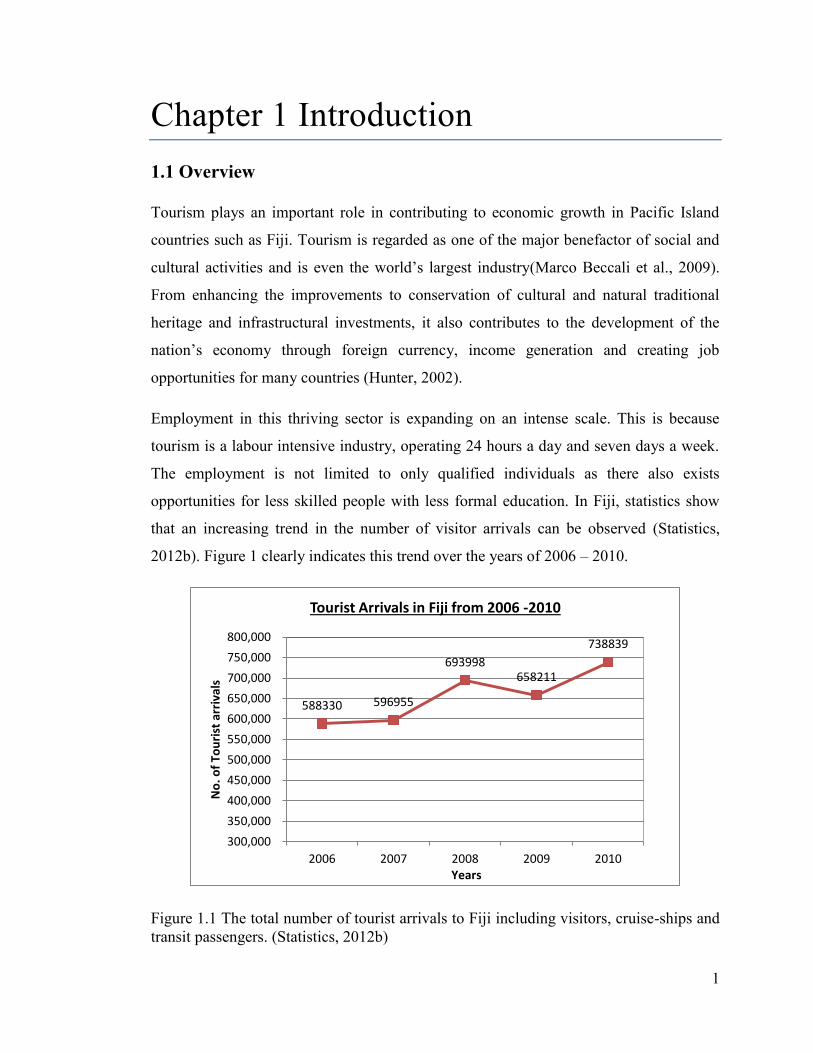
opportunities for less skilled people with less formal education. In Fiji, statistics show
that an increasing trend in the number of visitor arrivals can be observed (Statistics,
2012b). Figure 1 clearly indicates this trend over the years of 2006 – 2010.
Figure 1.1 The total number of tourist arrivals to Fiji including visitors, cruise-ships and
transit passengers. (Statistics, 2012b)
588330 596955
693998 658211
738839
300,000
350,000
400,000
450,000
500,000
550,000
600,000
650,000
700,000
750,000
800,000
2006 2007 2008 2009 2010
No
. of
Tou
rist
arr
ival
s
Years
Tourist Arrivals in Fiji from 2006 -2010
2
Increase in commercial development is also linked to the tourism industry supporting the
other sectors such as transport, agriculture, retailers, construction and creating
opportunities for the development of micro and smaller business enterprises. Tourism
not only improves the economic structure, but has social benefits associated with it. This
activity is promoted by the preservation of traditional and cultural heritage mostly in the
rural communities. Hence the local interests and awareness attracts more visitors
boosting the community‘s economy and improving the outlook and lifestyles of the
people.
There has been a rapid development of the tourism sector over the last decades and it is
currently amongst the most prominent global economic sectors. Hotels and resorts have
over the decades strived towards ‗sustainable tourism‘ which incorporates the economic,
environmental and socio-cultural aspects of the tourism industry by meeting the needs of
the tourists/guests while protecting and preserving opportunities for the future. Through
this scheme, a balance between the interest of tourists, the hosting community and the
environment is established to maintain the industry‘s future.
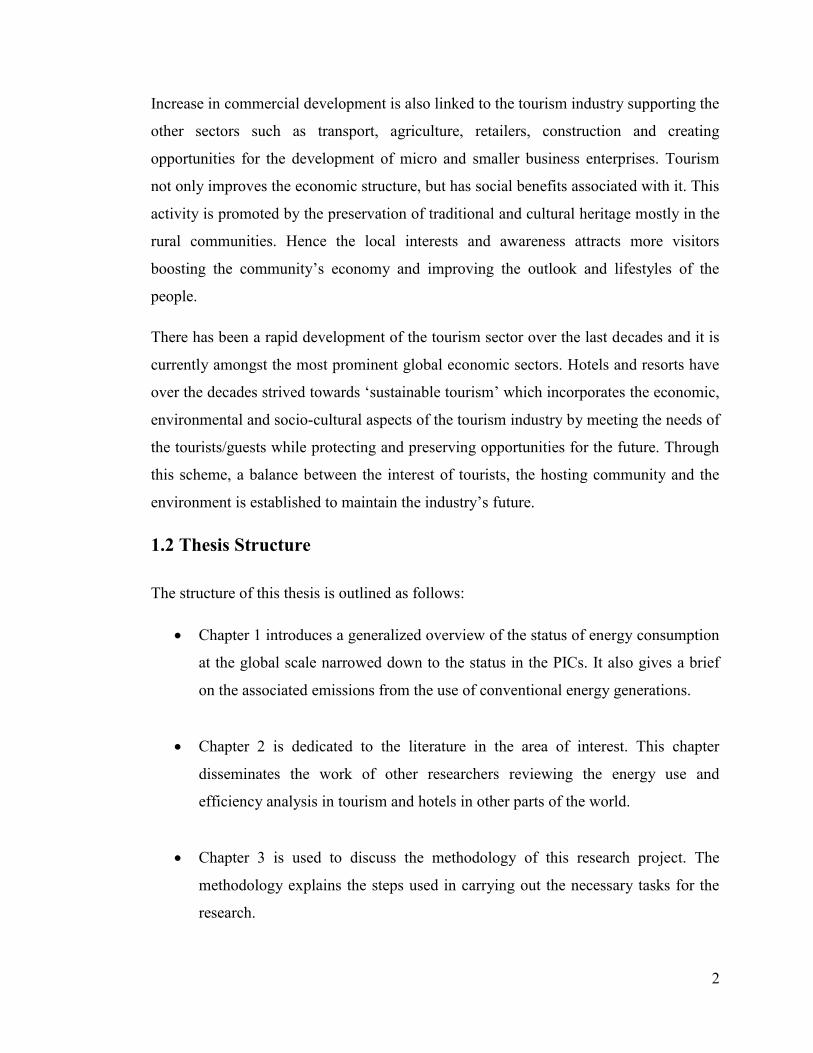
1.2 Thesis Structure
The structure of this thesis is outlined as follows:
Chapter 1 introduces a generalized overview of the status of energy consumption
at the global scale narrowed down to the status in the PICs. It also gives a brief
on the associated emissions from the use of conventional energy generations.
Chapter 2 is dedicated to the literature in the area of interest. This chapter
disseminates the work of other researchers reviewing the energy use and
efficiency analysis in tourism and hotels in other parts of the world.
Chapter 3 is used to discuss the methodology of this research project. The
methodology explains the steps used in carrying out the necessary tasks for the
research.
3
Chapter 4 deliberates the results obtained from carrying out the energy study on
the 2 hotels. It also confers the analysis and discusses the key aspects obtained
from the results.
Chapter 5 concludes with a summary of major results and findings from this
research.
1.3 Sources of Energy
Energy in natural form is termed to be primary energy. Primary energy consists of fossil
fuels such as coal, oil and gas. Uranium is another source of energy used in the form of
nuclear energy. However, these forms of energy have to be transformed into secondary
energy such as electricity, refined petroleum and processed natural gas to be used to
perform certain tasks. The major refined petroleum products consist of benzene,
diesoline, gasoline, kerosene, whereas, natural gas consists of mostly methane, butane,
propane. However, these forms of energy have to be transformed into secondary energy
such as electricity, refined petroleum and processed natural gas to be used to perform
certain tasks.
Following the first law of thermodynamics, in regard to the law of conservation of
energy, energy can neither be created nor destroyed, it just changes or transforms from
one state to another. Moreover, according to the second law of thermodynamics, it states
that there are unavoidable losses associated with conversion of states of energy. Since
100 percent of energy is not transformed to the next state, there is a loss of efficiency.
The efficiency of a system is expressed as the ratio of the output useful energy to that of
the input energy. The Carnot cycle is an idealized most efficient heat engine cycle that
consists of two isothermal processes and two adiabatic processes (Nave, 2014). To
achieve the Carnot efficiency, these processes must be reversible and involve no change
in entropy.
4
The Carnot efficiency is defined as:
i
oi
CT
TT )( …………..........….Equation 1.1
Where:
ηC– is the Carnot efficiency
Ti – is the intake engine temperature (K)
To– is the exhaust engine temperature (K)
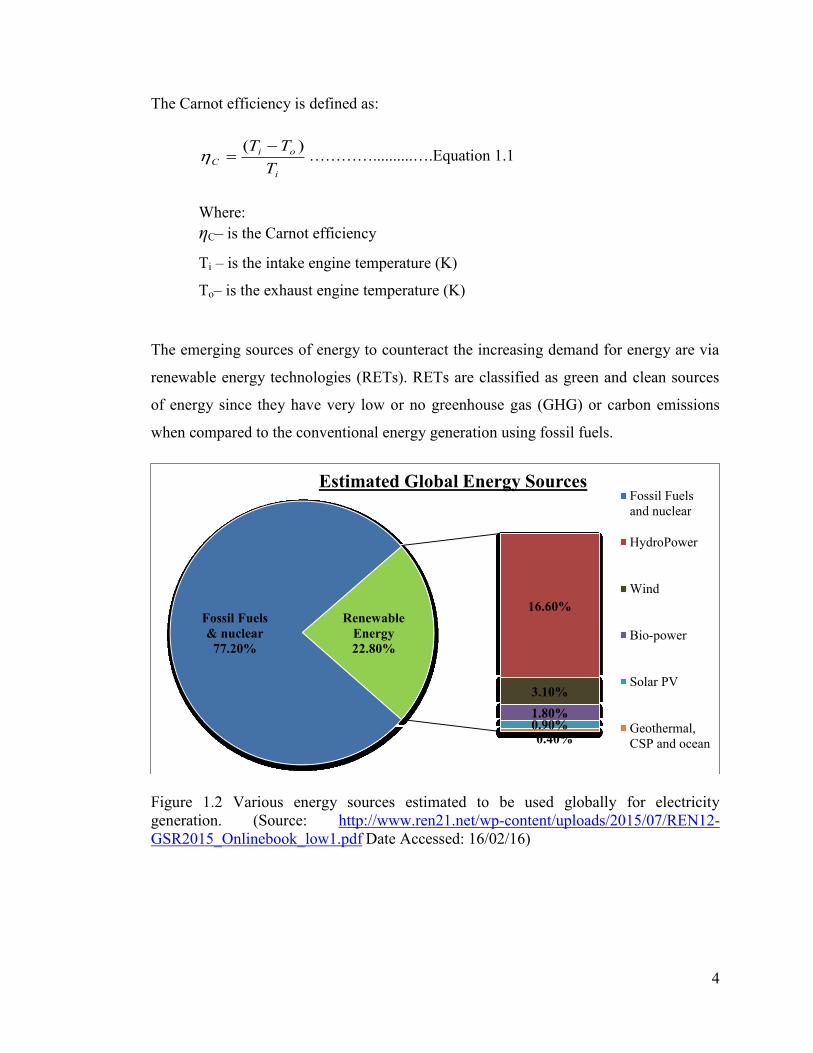
The emerging sources of energy to counteract the increasing demand for energy are via
renewable energy technologies (RETs). RETs are classified as green and clean sources
of energy since they have very low or no greenhouse gas (GHG) or carbon emissions
when compared to the conventional energy generation using fossil fuels.
Figure 1.2 Various energy sources estimated to be used globally for electricity
generation. (Source: http://www.ren21.net/wp-content/uploads/2015/07/REN12-
GSR2015_Onlinebook_low1.pdf Date Accessed: 16/02/16)
Fossil Fuels
& nuclear
77.20%
16.60%
3.10%
1.80% 0.90% 0.40%
Renewable
Energy
22.80%
Estimated Global Energy Sources Fossil Fuels
and nuclear
HydroPower
Wind
Bio-power
Solar PV
Geothermal,
CSP and ocean
5
1.4 The Use of Fossil Fuels and its consequences
Fossil fuels have been cordially recognized in this world since the nineteenth century.
The three main types of fossil fuels are classified as coal, oil (petroleum) and gas. The
demand for the fossil fuels has been increasing at an alarming rate over the years. Since
fossil fuel is a non-renewable source and is bound to finish in the near future, this has
led to the rise in fuel prices.
It has been accepted by many that the global warming has been gaining momentum over
the years. This is believed upon the following notable points:
1. Atmospheric CO2 levels are increasing
2. The mean global temperature is rising
3. Rising sea – levels
4. Climate change and extreme weather patterns (droughts, floods, cyclones,
hurricanes)
1.4.1 Environmental Impacts of Using Fossil fuels
Using fossil fuels has been linked to a number of adverse effects on the environment and
to the human society. This ranges from strengthening infrared radiation resulting in
global warming and climate change to neurological and biological health hazards.
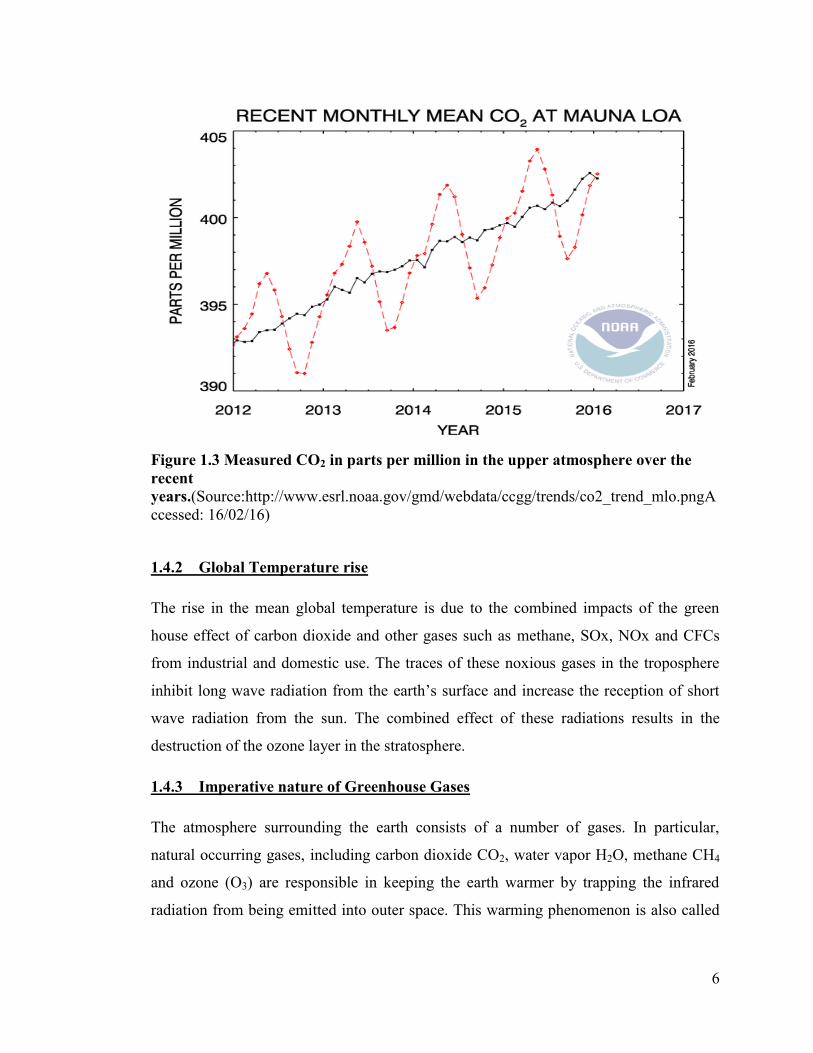
Carbon dioxide, CO2 is emitted into the atmosphere via respiration, fermentation, decay,
burning of vegetation and more commonly as the primary greenhouse gas released by
the use of fossil fuels. Since there has been increasing fossil fuel use in transportation,
industrial and commercial sectors, the amount of CO2 in the atmosphere did not have a
chance to be balanced by the natural processes of photosynthesis and be dissolved in the
seas. This is because many plants and trees have been continued to be cleared for
commercialization and to improve the human lifestyle. The CO2 emissions in the
atmosphere have been measured by the Mauna Loa Observatory to be 399.89 parts per
million (ppm) as of May 2013. The upper safety level of CO2 in the atmosphere of 350
ppm had been surpassed in 1988 and has stayed higher than ever since then. This
globally significant data is measured at a height of 3,397 meters.
6
Figure 1.3 Measured CO2 in parts per million in the upper atmosphere over the
recent
years.(Source:http://www.esrl.noaa.gov/gmd/webdata/ccgg/trends/co2_trend_mlo.pngA
ccessed: 16/02/16)
1.4.2 Global Temperature rise
The rise in the mean global temperature is due to the combined impacts of the green
house effect of carbon dioxide and other gases such as methane, SOx, NOx and CFCs
from industrial and domestic use. The traces of these noxious gases in the troposphere
inhibit long wave radiation from the earth‘s surface and increase the reception of short
wave radiation from the sun. The combined effect of these radiations results in the
destruction of the ozone layer in the stratosphere.
1.4.3 Imperative nature of Greenhouse Gases
The atmosphere surrounding the earth consists of a number of gases. In particular,
natural occurring gases, including carbon dioxide CO2, water vapor H2O, methane CH4
and ozone (O3) are responsible in keeping the earth warmer by trapping the infrared
radiation from being emitted into outer space. This warming phenomenon is also called
7
the ‗green house effect‘ which is the direct contribution of the atmospheric constituents
known as Green house gases.
However, over the past hundreds of years there has been a noticeable increase in the
concentration of the number of the green house gases. This has been linked to the human
activity in developing countries during the industrialization era. Together with carbon
dioxide CO2, carbon monoxide CO, methane CH4, sulphur-oxides SOx, nitrous-oxides
NOx, the release of artificial GHGs into the atmosphere such as chloroflurocarbons
(CFCs), hydrochloroflourocarbons (HCFCs) and hydroflurocarbons (HFCs) have
intensified the greenhouse effect trapping more infrared radiation warming the earth‘s
atmosphere. The artificial GHGs or halocarbon gases (since they contain elements from
the halogen group of the periodic table of elements) created by humans are ozone
depleting agents and have been utilized as refrigerants in refrigerators, freezers, air
conditioning units, chilling plants, in aerosol cans and in foam insulation of buildings.
1.5 Energy Use in the Tourism Industry
The tourism sector is quite heavily dependent upon the primary resource, the
environment. To stay in operation, the tourism sector requires in large quantities of
natural resources, mostly land and water, and energy resources such food, electricity, oil,
fuel and other commodities(2003). Fossil fuel oils have been used in large quantities for
transportation and electricity generation since some of the hotels and resorts are located
on secluded islands usually away from the mainland.
The use of energy in tourism sector is quite significant. Hotels have a high end use of
energy since their main focus is to provide the best services and activities. Inefficient
and inappropriate management of energy can be a concern to the environment in terms
of global warming and climate change. These contribute to heavy expenses in order to
maintain the primary tourist attractions which are at risk due to the emission of
greenhouse gases such as carbon dioxide and sulfur dioxides from burning of fossil
fuels. As a result, these can contribute to air pollution and acid rain which can
deteriorate tourists‘ health and local people as well as putrefy historical buildings,
landmarks and other monuments.
8
Therefore, sustainable tourism calls for maintaining clean and efficient utilization of
environmental resources. The threat on the environment can be reduced by reducing the
use of resources and the production of waste and emission. Considering the measures for
environmental sustainability, improvements in current designs implementing actions and
through good energy management, it is still possible to maintain the profitable margin.
The two main types of energy used in a tourism facility is electricity and thermal energy,
however, sometimes the thermal energy requirements are also generated through
electricity. Some of the necessary services that require electricity are lighting, air
conditioning, water heating, water pumping, plumbing, cooking, and laundry operations,
while thermal energy is required for hot water in guestrooms, kitchen and laundry.
1.6 Objectives
This research study was aimed at the studying the energy consumption and the energy
efficiency in hotels in the Pacific Island Countries (PICs). Two hotels in Fiji were
chosen as case studies.
The aims of this study are:
1. To study the energy consumption by carrying out an energy audit.
2. To divide the energy usage in a hotel into different sectors.
3. To retrofit the devices and compare energy savings.
4. To estimate fuel savings and carbon emission reductions at utility power
generation from two hotels practicing energy efficiency.
5. To develop Energy performance indicators to represent energy usage in various
sections.
6. To predict the energy consumption of a typical hotel using a simple model based
on EPIs
7. To develop a cooling load model for hotels in the Pacific island countries and to
use it to suggest methods for improving the energy efficiency.
8. To make comparisons of hotels from other region with the use of energy
efficiency indicators.
9
Chapter 2 Literature Review
2.1 Introduction
A country‘s economic growth is vastly impacted by its energy consumption. In a study
of 42 countries during 1986 – 2006 (Halkos and Tzeremes, 2011), it has been noted that
oil consumption has played a key component in the progress a country‘s developments.
Energy in the Pacific has been used for transportation, power generation and cooking.
Large amounts of fossil based fuels are imported to these island countries at a heavy
price. Transportation via sea, air and land requires refined petroleum products (Mofor et
al., 2013). The power sector generates energy from its diesel generators to supply
electricity to commercial, industrial, residential and government departments. Electricity
is consumed for mining, water treatment and supply, lighting, heating ventilation and air
conditioning (HVAC), consumer electronics and also cooking. People still use biomass
or wood fired stoves for cooking in almost all countries particularly in remote and outer
islands. However, there has been a shift to the use of kerosene stoves and liquefied
petroleum gas (LPG) for cooking purpose.
Renewable energy systems installed in countries like Fiji, Papua New Guinea, Samoa,
Tokelau and Vanuatu generates at least above 10% of the total energy demand while in
others, the electricity utility providers are heavily fuel dominated (Mofor et al., 2013).
Almost all PICs have established policies, frameworks and goals to generate energy
through renewable means reduce fuel imports and minimize their carbon emissions.
It is possible that fossil fuels will remain the energy source for many Pacific Islands in
the future. Energy security in the PICs remains a very concerning factor in these island
states (SPC, 2011). This is because it affects the nation‘s economy, health and
environment, infrastructure developments, public utility services such as water and
electricity, transportation and communication. Energy efficiency and renewable energy
are useful measures that can be undertaken to complement and reduce the high
petroleum imports.
10
2.2 Climate Change from Conventional Energy Sources
Fossil fuels such as petroleum oil, coal and gas has been in use over the centuries. These
energy sources are burnt to provide its energy to its secondary form generally as
electricity and transportation. The burning of these fossil fuels releases hazardous gases,
chemicals and un-burnt residue into the atmosphere. This pollution of the earth‘s
atmosphere is a threat to the global environment and leads to climate change.
The growing threat to energy security is being heavily felt by the Pacific Island
countries. As the demand for fossil based energy increases, the costs of meeting these
demand also increases. While energy does promote the economic growth of the nation,
the greenhouse gas emissions also increase. This in turn affects the environment through
climate change, variable weather patterns of droughts, severe flooding, rise in sea level,
global warming, ocean warming, melting of polar ice caps, coral bleaching, loss of sea
life and damage to marine ecosystems. This imbalance of nature will continue to cause
more destruction to the environment if these concerns are not attended.
The escalating demand of energy has a direct impact of natural resource depletion and
becoming a concerning threat to the global climate. Climate change is very evident is
terms of extreme weather patterns, sea level rise, rise in the sea temperatures. Climate
change puts people, societies, environment and a nation‘s economy at risk. Greenhouse
gas emissions from small island states have considered as almost negligible when
compared to the global emissions, however, these islands states are very disadvantaged
from the threats of climate change and sea level rise (II, 2014b).
Anomalies in ocean temperatures are evident from climate change. The global statistics
reveal that the ocean has been warming by 0.11⁰C per decade from 1971 to 2010.
Another observed phenomenon of climate change is the rise in sea level. The global sea
level has risen by 0.19m over the period from 1901 to 2010. Another factor that has
fuelled the sea level rise is the melting of glaciers and ice sheets from Greenland and
Antarctica (Hansen et al., 2008). Satellite observations from 1979 to 2012 indicates that
sea ice in the Arctic has decreased at a rate between 3.5 to 4.1% per decade.

11
Pacific Island countries are very susceptible to the effects of climate change. One of very
vulnerable country in the Pacific is Kiribati (Wyett, 2014). With islands only hundreds
of meters wide and three meters above sea level, it is very prone to the rising sea level. It
has been realized by the nation‘s government that relocation of its people may be
inevitable. The rate of sea level rise at Funafuti Atoll in Tuvalu has been approximately
three times higher than the global average from 1950 – 2009. Regular saline flooding of
low-lying areas are expected to become more frequent and severe in the future. Climate
change has affected the agriculture sector in terms of increased salinity of the mainland
and the harvest from the sea with low seafood supply.
The increasing CO2 levels have rendered the coral reefs defenseless against the thermal
stress and ocean acidification resulting in increased coral bleaching and decreased reef
calcification. This has affected the coastal communities in the islands who rely on the
marine ecosystem for their livelihood. For instance, in Kimbe Bay, Papua New Guinea,
the degradation of reefs, has seen a decline in the number of fish that depended on the
living corals as their habitat (I.W.G II, 2014b).
More than 60% of Europeans opt for a coastal destination for their holiday (I.W.G II,
2014a). With many hotels and resorts near the coastal shoreline, the tourism activities
such as snorkeling, coral reef watching and diving are also at a losing end and may
suffer the decreasing number of tourists. Sea related recreational activities contribute
US$11.5 billion to global tourism from more than a hundred countries.
The greenhouse gas emissions have increased over the years from the industrial era to
support the economic developments and the population growth. The highest recorded
GHG emissions were between the years 2000 to 2010. The atmospheric concentration
levels of carbon dioxide (CO2), Methane (CH4) and Nitrous oxide (N2O) have increased
by 40%, 150% and 20% since 1750 (IPCC., 2014). An excess of 40% of CO2 equivalent
to (880 ± 35) GtCO2 has remained in the atmosphere since 1750 from anthropogenic
means. A part of the total emissions has been absorbed by the natural carbon cycle and
by the ocean sinks. Unfortunately, the uptake of anthropogenic CO2 by the ocean sinks
lead to acidification of sea water threatening the marine ecosystem(IPCC., 2014).
Combustion of fossil fuels by industries produced 78% of CO2 from the total GHG
12
emissions from 1970 to 2010. From 2000 to 2010, the annual GHG emission was
increased by 10 GtCO2eq. The level of CO2 emissions from fossil fuels in 2010 was
about (32 ± 2.7) GtCO2 yr-1
.
2.3 Energy in the Pacific
Like most other developing economies, Pacific Island Countries have been experiencing
the escalating energy consumption over the years. The heavy demand for energy is
leading to the depletion of the oil reserves. Hence, these island nations have been facing
the full brunt of the rising oil prices. The concerning issue of these rising energy prices
has been shared by nearly all the Small Island Developing States (SIDS). In their
endeavor to reduce their reliance on the imported fossil fuels, similar sentiments have
been shared in terms of energy conservation, energy efficiency and alternative or
renewable energy technologies.
The SIDS in the Pacific have undergone the transformation from subsistence to export
oriented economies (Niles and Lloyd, 2013). The demand for energy is dependent on
economic development, energy prices and lifestyle factors. While the developments
have been appreciated over a wide scope, it is relevant to note the increased dependency
of these countries on imported energy to fuel the growth of their economies. These
countries include Cook Islands, Fiji, Kiribati, Marshall Islands, Federated States of
Micronesia, Nauru, Niue, Palau, Samoa, Solomon Islands, Tonga, Tuvalu and Vanuatu
have heavy reliance on imported fossil fuels to meet their energy needs (Secretariat,
2011).
The Pacific islands region has the highest petroleum fuel dependence when compared to
any other region in the world including the Caribbean (Johnston, 2012). The transport
sector in the Pacific consumes more than 60% of petroleum fuel while the rest are used
for electricity generation. A need to address the dominance of petroleum fuel by
transportation in the region should be of concern.
The abundance of renewable energy resources in the Pacific remains unutilized.
However, some of these island nations have started to venture into renewable energy to
13
sustain their economies (Mofor et al., 2013). The renewable sources in the Pacific are
available in the form of solar, wind, hydro, bio-energy, geothermal and ocean energy.
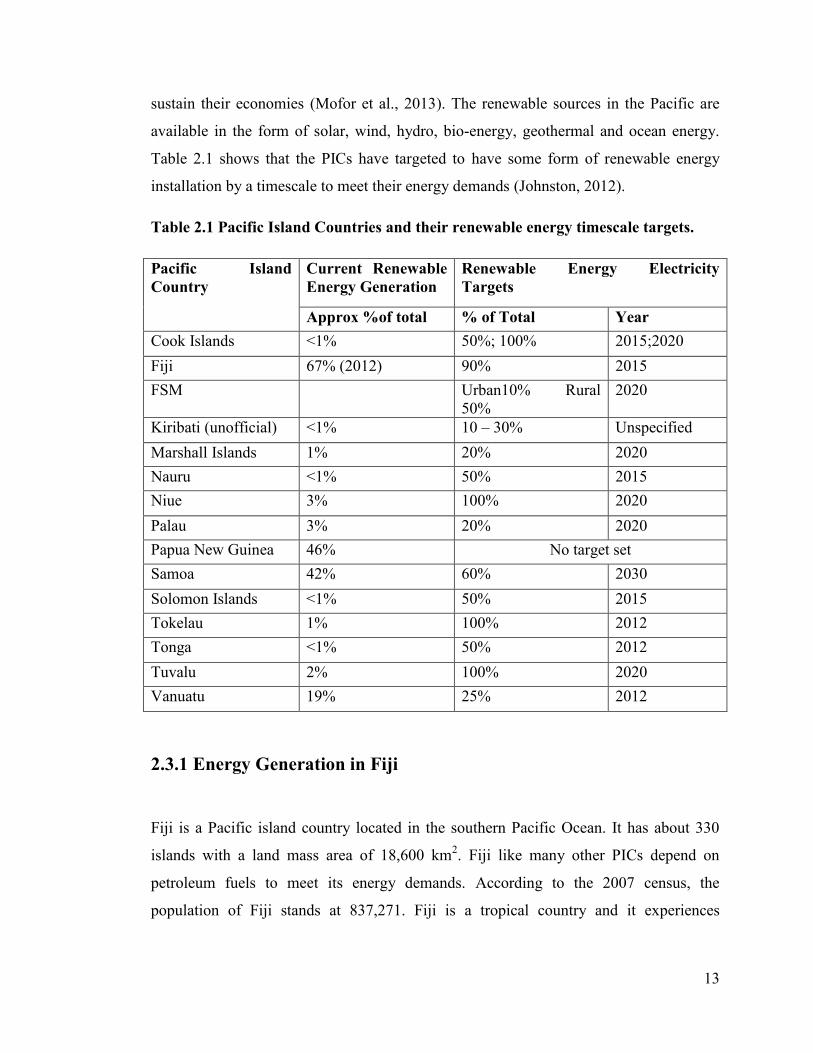
Table 2.1 shows that the PICs have targeted to have some form of renewable energy
installation by a timescale to meet their energy demands (Johnston, 2012).
Table 2.1 Pacific Island Countries and their renewable energy timescale targets.
Pacific Island
Country
Current Renewable
Energy Generation
Renewable Energy Electricity
Targets
Approx %of total % of Total Year
Cook Islands <1% 50%; 100% 2015;2020
Fiji 67% (2012) 90% 2015
FSM Urban10% Rural
50%
2020
Kiribati (unofficial) <1% 10 – 30% Unspecified
Marshall Islands 1% 20% 2020
Nauru <1% 50% 2015
Niue 3% 100% 2020
Palau 3% 20% 2020
Papua New Guinea 46% No target set
Samoa 42% 60% 2030
Solomon Islands <1% 50% 2015
Tokelau 1% 100% 2012
Tonga <1% 50% 2012
Tuvalu 2% 100% 2020
Vanuatu 19% 25% 2012
2.3.1 Energy Generation in Fiji
Fiji is a Pacific island country located in the southern Pacific Ocean. It has about 330
islands with a land mass area of 18,600 km2. Fiji like many other PICs depend on
petroleum fuels to meet its energy demands. According to the 2007 census, the
population of Fiji stands at 837,271. Fiji is a tropical country and it experiences
14
southeast trade winds. The economy of this country boasts a good tourism sector, sugar,
garment mining (gold and bauxite) timber and agricultural produce for exports.
Liquid petroleum fuel products are imported in Fiji by three major international
companies (Total, Pacific energy and Mobil) from Singapore and Korea while liquefied
petroleum gas (LPG) comes from Australia imported by Fiji Gas and Blue Gas. Fiji‘s
petroleum imports have grown dramatically from $400 million in 2004 to over $1.2
billion in 2008 (McGoon, 2013) and $1.13 billion in 2010 (Chandra, 2013). The Fijian
government in association with the national utility provider aims to have power
generation of 90% from renewable sources by 2015.
The Fiji Electricity Authority (FEA) is the main electricity producer in Fiji. It serves the
two major islands in Fiji via its grid connection. As of December 2012, FEA supplied
electricity to a total of 159,018 customers from industrial, commercial, institutional and
domestic sectors (FEA, 2012).
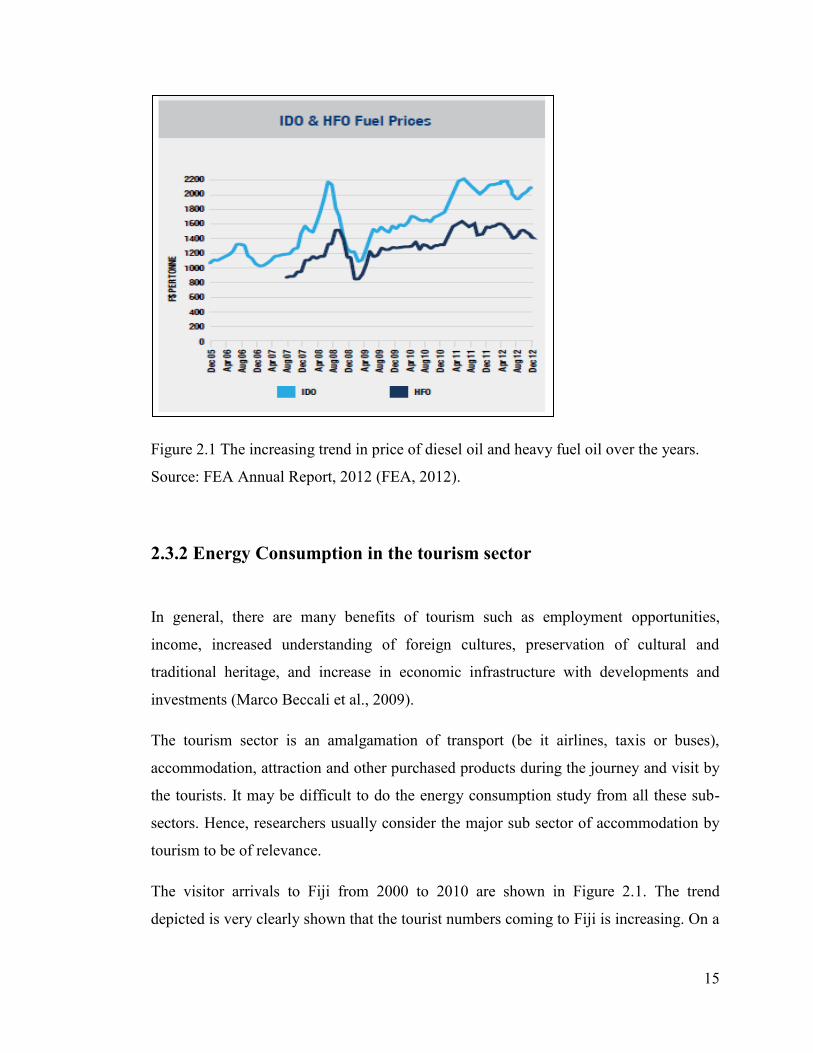
FEA generates electricity by both renewable and non-renewable (thermal) plants. The
generation mix in 2012 was such that 63.6% of electricity came from hydro power, 33%
from diesel fuel oil (DFO) and heavy fuel oil (HFO), 1% from wind and 2.4% from
Independent Power Producers (IPPs). To reduce the escalating fuel prices for electricity
generation, the company is assisted by IPPs to meet the energy demand of the country.
These IPPs namely, Tropik Wood Industries Limited and Fiji Sugar Corporation Limited
(FSC) supplied 19,451 MWh of electricity to the utility grid in 2012 (FEA, 2012). The
company consumed 58,996 metric ton of fuel costing about FJ$ 105,136,000.
15
Figure 2.1 The increasing trend in price of diesel oil and heavy fuel oil over the years.
Source: FEA Annual Report, 2012 (FEA, 2012).
2.3.2 Energy Consumption in the tourism sector
In general, there are many benefits of tourism such as employment opportunities,
income, increased understanding of foreign cultures, preservation of cultural and
traditional heritage, and increase in economic infrastructure with developments and
investments (Marco Beccali et al., 2009).
The tourism sector is an amalgamation of transport (be it airlines, taxis or buses),
accommodation, attraction and other purchased products during the journey and visit by
the tourists. It may be difficult to do the energy consumption study from all these sub-
sectors. Hence, researchers usually consider the major sub sector of accommodation by
tourism to be of relevance.
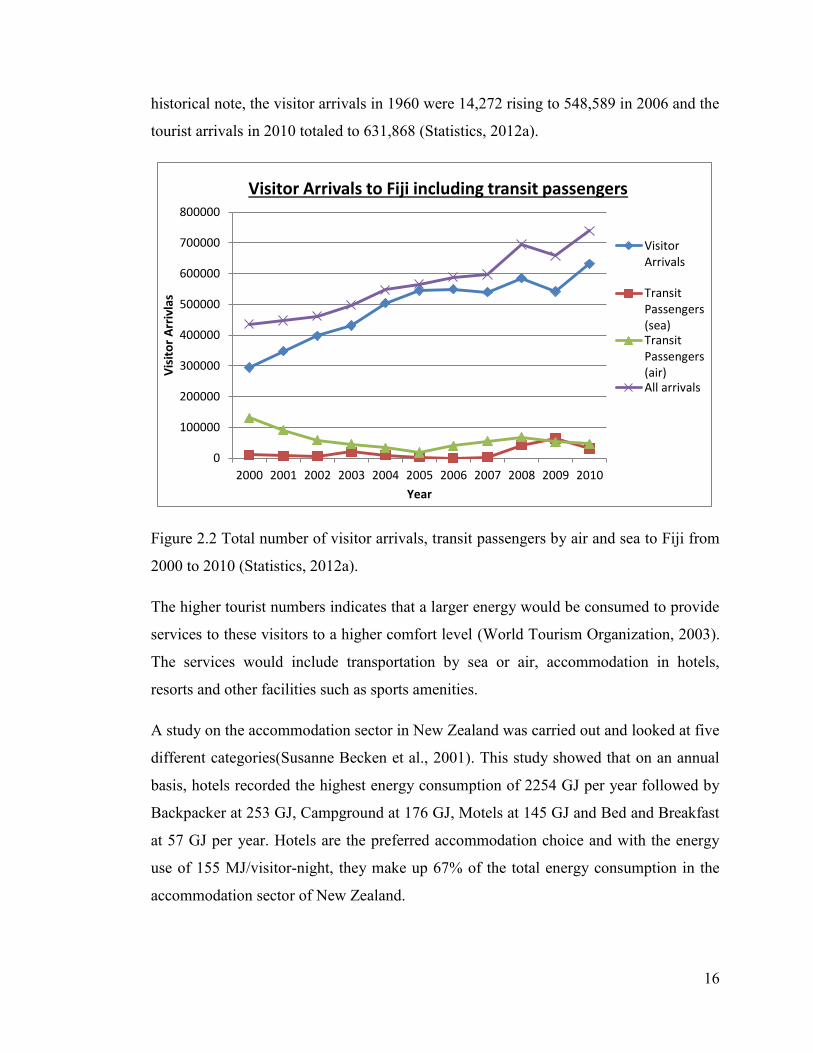
The visitor arrivals to Fiji from 2000 to 2010 are shown in Figure 2.1. The trend
depicted is very clearly shown that the tourist numbers coming to Fiji is increasing. On a
16
historical note, the visitor arrivals in 1960 were 14,272 rising to 548,589 in 2006 and the
tourist arrivals in 2010 totaled to 631,868 (Statistics, 2012a).
Figure 2.2 Total number of visitor arrivals, transit passengers by air and sea to Fiji from
2000 to 2010 (Statistics, 2012a).
The higher tourist numbers indicates that a larger energy would be consumed to provide
services to these visitors to a higher comfort level (World Tourism Organization, 2003).
The services would include transportation by sea or air, accommodation in hotels,
resorts and other facilities such as sports amenities.
A study on the accommodation sector in New Zealand was carried out and looked at five
different categories(Susanne Becken et al., 2001). This study showed that on an annual
basis, hotels recorded the highest energy consumption of 2254 GJ per year followed by
Backpacker at 253 GJ, Campground at 176 GJ, Motels at 145 GJ and Bed and Breakfast
at 57 GJ per year. Hotels are the preferred accommodation choice and with the energy
use of 155 MJ/visitor-night, they make up 67% of the total energy consumption in the
accommodation sector of New Zealand.
0
100000
200000
300000
400000
500000
600000
700000
800000
2000 2001 2002 2003 2004 2005 2006 2007 2008 2009 2010
Vis
ito
r A
rriv
las
Year
Visitor Arrivals to Fiji including transit passengers
VisitorArrivals
TransitPassengers(sea)TransitPassengers(air)All arrivals
17
To assess the tourism sustainability an assessment tool was developed as eco-efficiency
in terms of kg CO2-e/ € (Gossling et al., 2005). For a sustainable tourism, the benchmark
was derived to be 0.24kg CO2-e/ € as a global average. Hence tourists with the eco-
efficiencies below or equal to this benchmarked value would deem their travel journey
as sustainable. This can further create awareness amongst tourists in their decisions to
keep the total emissions at a sustainable level.
2.4 Energy consumption in buildings
With the advent of awareness in regards to high energy prices and owing to global
climate change and environmental concerns, there is a growing need to move towards
green/sustainable buildings (H.J.Han et al., 2010). The motive of having green buildings
is to increase the efficiency of energy consumption and reduce greenhouse gas (GHG)
emissions. (Sozer, 2010) states that decisions in the building design is critical to the
emphasis on energy efficiency besides the application of new and advanced
technologies. The building structure contributes to the total energy consumption and
impacts the operating costs. Hence it is up to the architects, engineers and policy makers
to uphold the sustainability principles for the life time of the building.
The construction industry is linked to the economic development of the nation utilizing
materials and energy resources. The construction of any building requires energy in
many forms including electrical, mechanical and even man power. The worldwide
statistics show that the construction and use of buildings contribute to 40% of energy
use, 25% of wood, 17% of timber resulting in 32% of CO2 emissions (Beatriz Rossello´-
Batle et al., 2010).
Energy savings in the building sector can be improved with construction elements,
advanced materials, energy management systems and finally the operation of energy
consumption used for heating, ventilation, cooling and domestic hot water supply
(Diakaki et al., 2010). This can be possible by a ―multi-objective decision model‖. The
parameters used in this model include the choice building envelope, building system
related energy consumption, CO2 emissions, initial investment costs.
18
Architects and engineers are usually confronted with the shape of a new building with
respect to its geological site to achieve an optimal energy efficient design. It has been
noted that the structural design of new buildings should incorporate sun – facing area
and the loss resistance to achieve optimum solar benefit (Harvey, 2006). The first step
would be to insulate the building properly including draught prevention and if necessary
controlled ventilation with heat recovery. The orientation, size and position of windows
should allow a sufficient product of ‗G‘ (incoming solar radiation) multiplied by ‗A‘
(perpendicular area to the glazing) for significant solar heating in winter, with shading
prevention overheating in summer. The windows themselves should have an advanced,
multi – surface construction so their resistance to heat transfer, other than short wave
solar radiation is large.
An energy audit is conducted to identify the cost – effective opportunities which thereby
can be used to improve the overall energy efficient operations of the facility or building
(Herzog, 1997). Simple energy audits may identify some of the measures that can be
readily implemented by the operational or maintenance staff with immediate energy
savings. On the other hand, complex energy audits may require a larger capital for a long
term investment plan in the building. This complex audit is usually collaborated with an
energy consulting firm to recognize the opportunities for energy savings. In the audits,
the historical and current utility data are used to benchmark the building‘s energy use
against a similar building to associate any discrepancy and identify the level of audit to
be carried out. The result of the energy audit should give the building owner information
such as:
- the recommended energy efficiency measures,
- the associated energy savings, and
- the cost effectiveness of the energy efficiency measures installation as a good
financial investment.
A common energy consumer in buildings of the tropical and moderate climate is the
cooling load (CL). A cooling load was discussed by Causone (Causone et al., 2010) for a
radiant system. In this paper, the solar heat gain (SHG) and the Direct Solar Load (DSL)
is defined as an F ratio. DSL = F.SHG
19
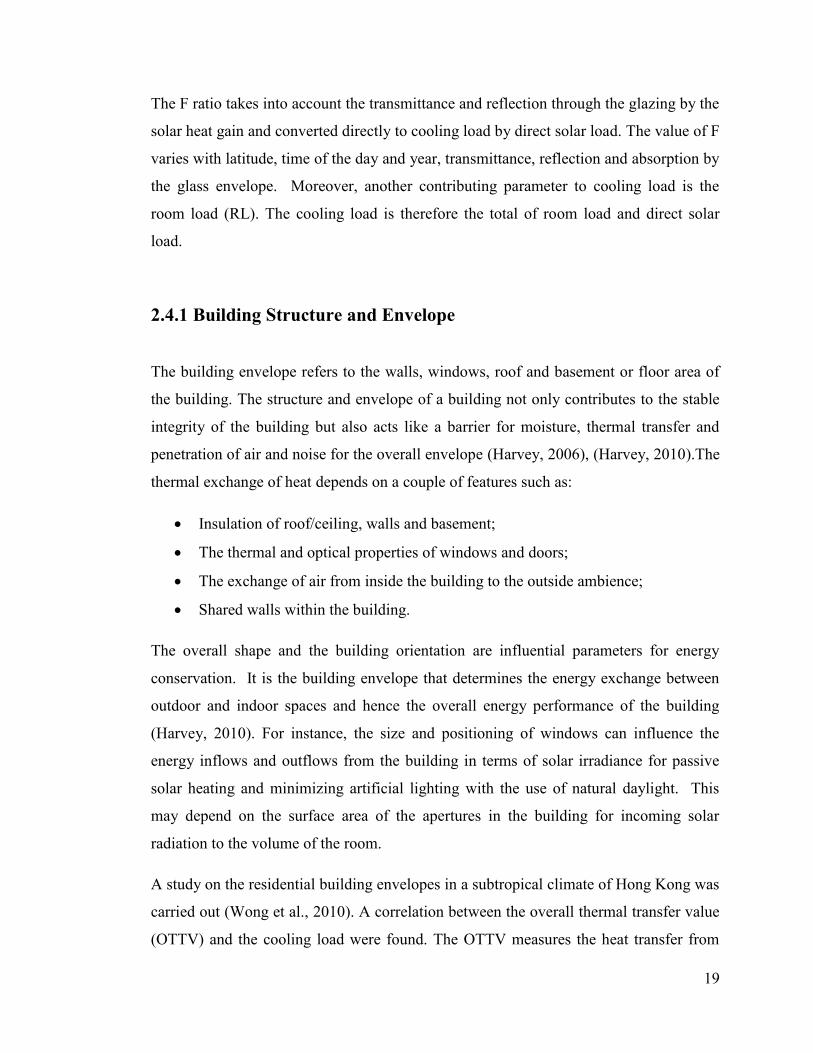
The F ratio takes into account the transmittance and reflection through the glazing by the
solar heat gain and converted directly to cooling load by direct solar load. The value of F
varies with latitude, time of the day and year, transmittance, reflection and absorption by
the glass envelope. Moreover, another contributing parameter to cooling load is the
room load (RL). The cooling load is therefore the total of room load and direct solar
load.
2.4.1 Building Structure and Envelope
The building envelope refers to the walls, windows, roof and basement or floor area of
the building. The structure and envelope of a building not only contributes to the stable
integrity of the building but also acts like a barrier for moisture, thermal transfer and
penetration of air and noise for the overall envelope (Harvey, 2006), (Harvey, 2010).The
thermal exchange of heat depends on a couple of features such as:
Insulation of roof/ceiling, walls and basement;
The thermal and optical properties of windows and doors;
The exchange of air from inside the building to the outside ambience;
Shared walls within the building.
The overall shape and the building orientation are influential parameters for energy
conservation. It is the building envelope that determines the energy exchange between
outdoor and indoor spaces and hence the overall energy performance of the building
(Harvey, 2010). For instance, the size and positioning of windows can influence the
energy inflows and outflows from the building in terms of solar irradiance for passive
solar heating and minimizing artificial lighting with the use of natural daylight. This
may depend on the surface area of the apertures in the building for incoming solar
radiation to the volume of the room.
A study on the residential building envelopes in a subtropical climate of Hong Kong was
carried out (Wong et al., 2010). A correlation between the overall thermal transfer value
(OTTV) and the cooling load were found. The OTTV measures the heat transfer from
20
the outside to the indoor environment through conduction in walls and solar radiation
through glass. Moreover, an increasing trend of cooling load was estimated over the
years. Results show an increasing trend between 0.013MWh/y to 0.022MWh/y from
2009 to 2100 representing the buildings annual cooling load.
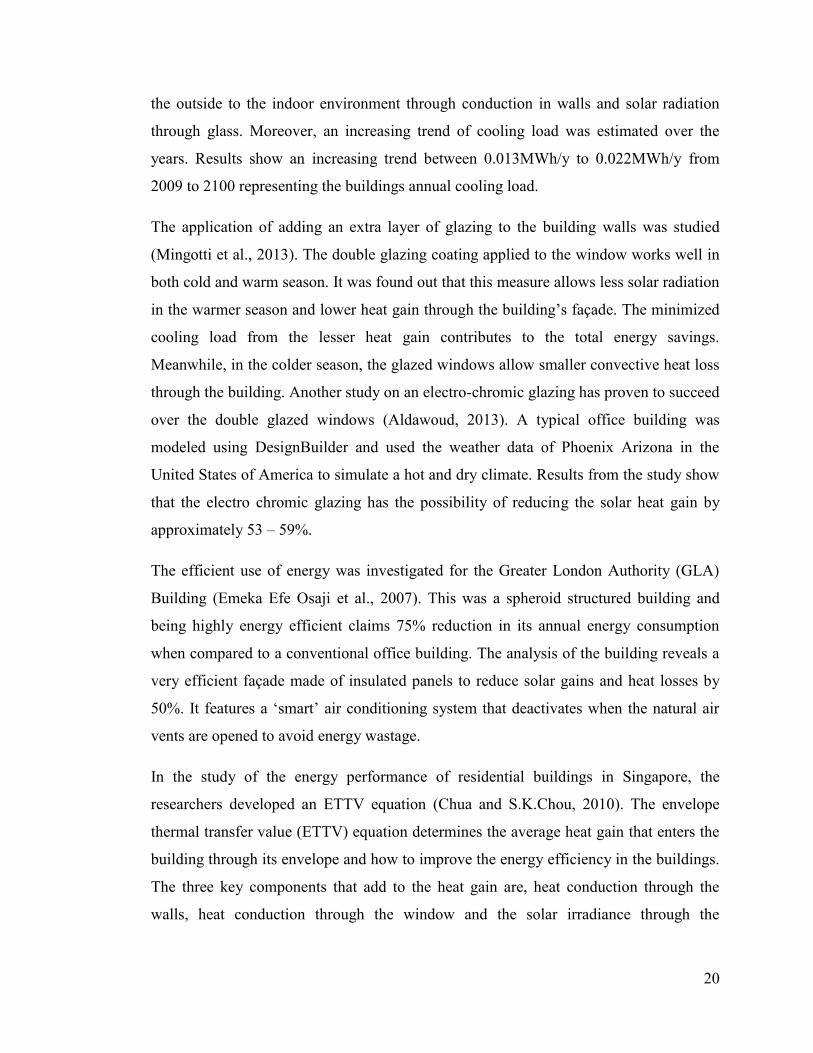
The application of adding an extra layer of glazing to the building walls was studied
(Mingotti et al., 2013). The double glazing coating applied to the window works well in
both cold and warm season. It was found out that this measure allows less solar radiation
in the warmer season and lower heat gain through the building‘s façade. The minimized
cooling load from the lesser heat gain contributes to the total energy savings.
Meanwhile, in the colder season, the glazed windows allow smaller convective heat loss
through the building. Another study on an electro-chromic glazing has proven to succeed
over the double glazed windows (Aldawoud, 2013). A typical office building was
modeled using DesignBuilder and used the weather data of Phoenix Arizona in the
United States of America to simulate a hot and dry climate. Results from the study show
that the electro chromic glazing has the possibility of reducing the solar heat gain by
approximately 53 – 59%.
The efficient use of energy was investigated for the Greater London Authority (GLA)
Building (Emeka Efe Osaji et al., 2007). This was a spheroid structured building and
being highly energy efficient claims 75% reduction in its annual energy consumption
when compared to a conventional office building. The analysis of the building reveals a
very efficient façade made of insulated panels to reduce solar gains and heat losses by
50%. It features a ‗smart‘ air conditioning system that deactivates when the natural air
vents are opened to avoid energy wastage.
In the study of the energy performance of residential buildings in Singapore, the
researchers developed an ETTV equation (Chua and S.K.Chou, 2010). The envelope
thermal transfer value (ETTV) equation determines the average heat gain that enters the
building through its envelope and how to improve the energy efficiency in the buildings.
The three key components that add to the heat gain are, heat conduction through the
walls, heat conduction through the window and the solar irradiance through the
21
windows. Results from the ETTV equation yields 3.5 to 4% of reduced annual cooling
energy for residential building with different building materials.
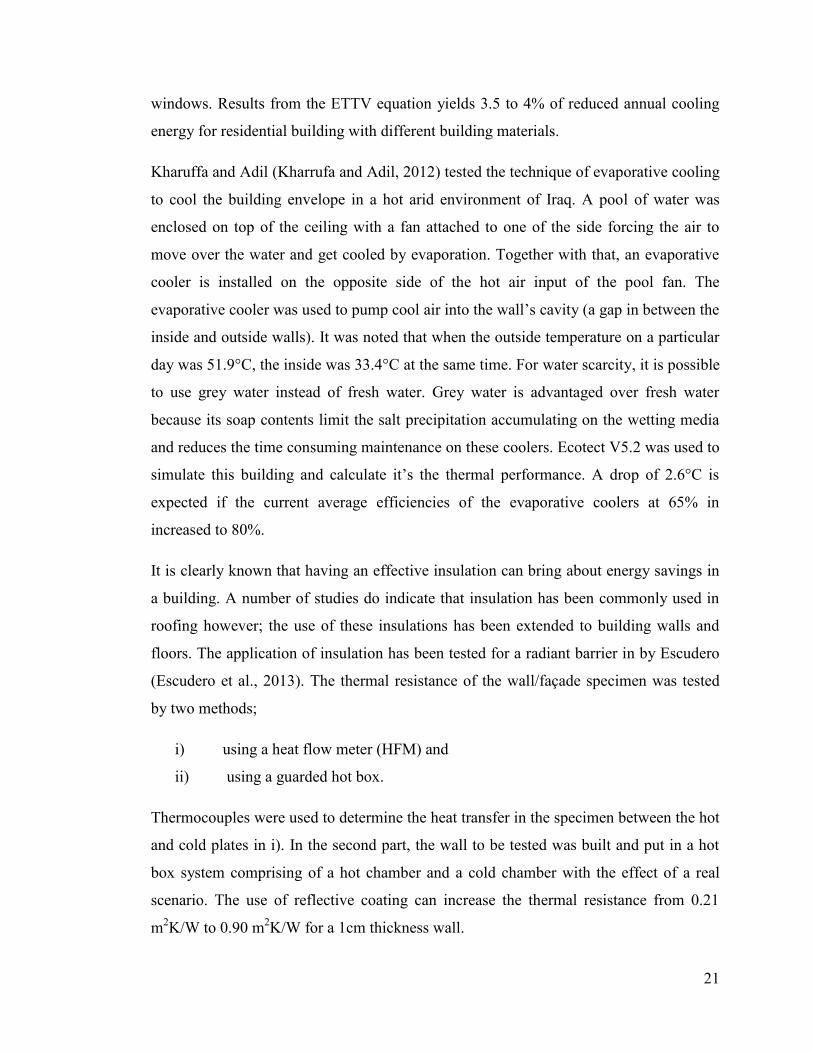
Kharuffa and Adil (Kharrufa and Adil, 2012) tested the technique of evaporative cooling
to cool the building envelope in a hot arid environment of Iraq. A pool of water was
enclosed on top of the ceiling with a fan attached to one of the side forcing the air to
move over the water and get cooled by evaporation. Together with that, an evaporative
cooler is installed on the opposite side of the hot air input of the pool fan. The
evaporative cooler was used to pump cool air into the wall‘s cavity (a gap in between the
inside and outside walls). It was noted that when the outside temperature on a particular
day was 51.9°C, the inside was 33.4°C at the same time. For water scarcity, it is possible
to use grey water instead of fresh water. Grey water is advantaged over fresh water
because its soap contents limit the salt precipitation accumulating on the wetting media
and reduces the time consuming maintenance on these coolers. Ecotect V5.2 was used to
simulate this building and calculate it‘s the thermal performance. A drop of 2.6°C is
expected if the current average efficiencies of the evaporative coolers at 65% in
increased to 80%.
It is clearly known that having an effective insulation can bring about energy savings in
a building. A number of studies do indicate that insulation has been commonly used in
roofing however; the use of these insulations has been extended to building walls and
floors. The application of insulation has been tested for a radiant barrier in by Escudero
(Escudero et al., 2013). The thermal resistance of the wall/façade specimen was tested
by two methods;
i) using a heat flow meter (HFM) and
ii) using a guarded hot box.
Thermocouples were used to determine the heat transfer in the specimen between the hot
and cold plates in i). In the second part, the wall to be tested was built and put in a hot
box system comprising of a hot chamber and a cold chamber with the effect of a real
scenario. The use of reflective coating can increase the thermal resistance from 0.21
m2K/W to 0.90 m
2K/W for a 1cm thickness wall.
22
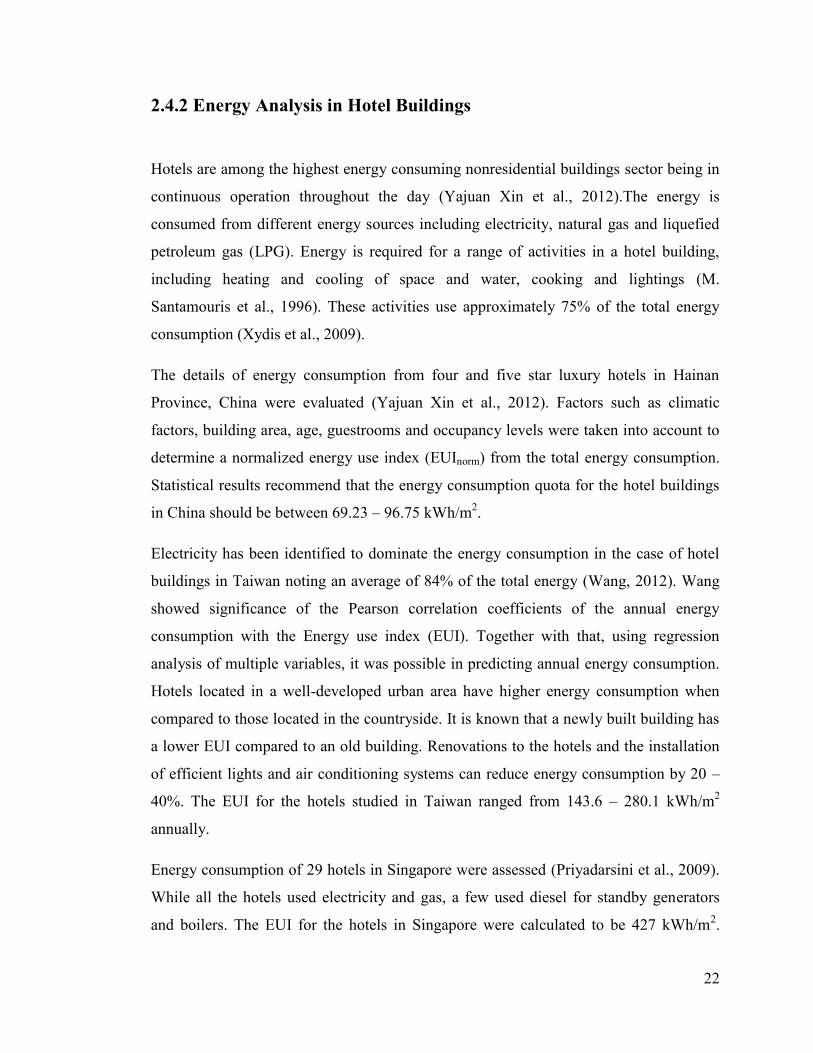
2.4.2 Energy Analysis in Hotel Buildings
Hotels are among the highest energy consuming nonresidential buildings sector being in
continuous operation throughout the day (Yajuan Xin et al., 2012).The energy is
consumed from different energy sources including electricity, natural gas and liquefied
petroleum gas (LPG). Energy is required for a range of activities in a hotel building,
including heating and cooling of space and water, cooking and lightings (M.
Santamouris et al., 1996). These activities use approximately 75% of the total energy
consumption (Xydis et al., 2009).
The details of energy consumption from four and five star luxury hotels in Hainan
Province, China were evaluated (Yajuan Xin et al., 2012). Factors such as climatic
factors, building area, age, guestrooms and occupancy levels were taken into account to
determine a normalized energy use index (EUInorm) from the total energy consumption.
Statistical results recommend that the energy consumption quota for the hotel buildings
in China should be between 69.23 – 96.75 kWh/m2.
Electricity has been identified to dominate the energy consumption in the case of hotel
buildings in Taiwan noting an average of 84% of the total energy (Wang, 2012). Wang
showed significance of the Pearson correlation coefficients of the annual energy
consumption with the Energy use index (EUI). Together with that, using regression
analysis of multiple variables, it was possible in predicting annual energy consumption.
Hotels located in a well-developed urban area have higher energy consumption when
compared to those located in the countryside. It is known that a newly built building has
a lower EUI compared to an old building. Renovations to the hotels and the installation
of efficient lights and air conditioning systems can reduce energy consumption by 20 –
40%. The EUI for the hotels studied in Taiwan ranged from 143.6 – 280.1 kWh/m2
annually.
Energy consumption of 29 hotels in Singapore were assessed (Priyadarsini et al., 2009).
While all the hotels used electricity and gas, a few used diesel for standby generators
and boilers. The EUI for the hotels in Singapore were calculated to be 427 kWh/m2.
23
Although there is a weak correlation between the guest occupancy level and the monthly
electricity consumption, the trends of high energy use gives a clear indication for the
need to improve the energy consumption in the building.
A life cycle analysis on two hotels was carried out in the Balearic Islands, Spain (Beatriz
Rossello´-Batle et al., 2010) under 4 phases, construction, operations, reforms and
demolition phase during a 50 year period. Within the assumed lifetime of 50 years, the
operation phase consumes 78% of total energy. With the application of 20% of
renewable energies, CO2 emissions are expected to reduce by 45% during the operation
phase.
Buildings in the subtropical climates usually have large cooling loads. The thermal
comfort of the occupancy is compensated by air conditioning systems. These loads
contribute to large energy use and high levels of CO2 emission (Wong et al., 2010).
The current energy demand is in need to be reduced. However, the solution to this ever –
growing problem is not entirely technological. Managerial, behavioral and current
lifestyle factors are far more important as are the future gross domestic product (GDP)
per person (Harvey, 2010).
2.4.3 Energy indices to measure Energy Performance
Energy performance indicators have been used by many researchers to determine the
performance and the efficiency level of hotel buildings. The energy indexes can be
calculated once an energy audit of the building has been done (Marco Beccali et al.,
2009), (Goncalves et al., 2012). An energy audit was carried out in a study of 158
Hellenic hotels. It was determined that the total energy consumption in hotels was
273kWh/m2
(M. Santamouris et al., 1996). Several simulations indicate a 20% of energy
savings after the proposed effective energy efficiency techniques such as changing the
buildings envelope and having more efficient heating cooling and lighting systems.
24
(Goncalves et al., 2012) considered the energy performance of a four star hotel building
in Coimbra, Portugal and carried out an analysis by the use of some simple indicators.
Some of the indicators used as part of their study include:
- Annual primary energy demand per square meter as 446kWh/m2,
- Primary energy ratio (PER) as 49% and,
- Exergy efficiency level at 17%.
For an easier analysis it is essential to normalize the unit of energy consumption as a
common unit. For instance, from a thermodynamic point of view the thermal energy
used for space heating or domestic hot water may be different to the electricity units.
These considerations were taken, where the energy consumption of a hotel building in
Coimbra, Portugal was analyzed from conducting an energy audit (Goncalves et al.,
2012).
2.4.4 Development of Energy Policies
The influence of donor agencies pushes for formulation and establishment of policies in
the energy sector in the SIDS. For instance, the development of National Energy policies
in the Pacific countries under the Project named ―Pacific Islands Energy Planning and
Strategic Action Planning Project (PIEPSAP)‖ was possible from the United Nations
Development Programme (UNDP) (Niles and Lloyd, 2013).
In 1997, (Yu and Taplin, 1997) report an expenditure of almost US$430 million for
developing renewable energy in the Pacific region. Meanwhile, another US$300 million
grant aid has been allocated for projects in the energy sector with expected more funding
via loans.(Secretariat of the Pacific Community, 2010).
The issue of energy security was recognized as a key tool for economic growth and
human development by the Pacific leaders in April, 2009. Hence, a ―Framework for
Action on Energy Security in the Pacific‖ (FAESP) was developed at the 40th
Pacific
Islands Forum in Cairns in August 2009 (SPC, 2011, Niles and Lloyd, 2013). The aim of
25
this framework is to allow people of the PICs to have access to sustainable clean
affordable and modern energy services replacing the high dependence on fossil fuels.
The FAESP comprises and focuses on seven different themes as follows; leadership and
governance, capacity development, policy and regulatory frameworks, energy
production, energy conversion, end-use energy consumption, energy data and
information, financing, monitoring and evaluation (Singh, 2011). Together with the
FAESP is the Implementation Plan for Energy Security in the Pacific (IPESP 2010 –
2015) to outline the implementation of the Framework.
An Energy Conservation Promotion Act (ECP Act) was established by the government
of Thailand in 1992. Together with that, an Energy Conservation Promotion Fund
(ENCON Fund) was created to carry out energy audits on 1900 designated buildings
(S.Chirarattananon et al., 2010). These energy conservation measures were revised and a
new Building energy code (BEC) was formed. This new energy code will be applied to
different building types that will be constructed to improve the energy efficiency of the
buildings. It had been determined that a 10% energy savings in an old building is
equivalent to 80% in a new building.
2.4.5 Passive design Strategies in buildings
A substantial amount of energy savings in buildings can be achieved by the applying
simple passive design techniques in the building (Harvey, 2006), (DiNola et al., 2014).
Some of these design strategies include:
- the building envelope and orientation
- shadings from attached overhangs and balconies
- natural ventilation from windows
- solar heating in winter
- day-lighting
26
The above passive design was modeled for a hotel building at Izmir, Turkey (Sozer,
2010). Simulations of energy analysis were carried out in e-QUEST, an energy analysis
program. Three design cases were taken to analyze the electricity and gas consumption.
The three cases had different levels of insulation from the building materials, glazing in
windows and shading effects. The overall results from the proposed design suggest a
40.1% energy savings when compared to a conventional hotel building.
In the process of cooling, some strategies and devices are employed that would be able
to reject the unwanted heat, reduce internal heat gain. For a building in a tropical
climatic zone, rejection of solar gain is important (DiNola et al., 2014).
The heating and cooling of guestrooms and other enclosed spaces depend on building
climate control. When a person considers a comfortable air temperature depends on the
humidity, the received radiation flux, the wind speed, clothing and that person‘s activity,
metabolism and life–cycle (Meckler, 1984). The room temperature is normally
considered comfortable in the range of 18 – 22° Celsius.
The complex interaction of the air conditioning system to provide the cooling makes it
difficult to estimate the energy consumption by the heating and cooling equipment
(Chua and S.K.Chou, 2010). Together with that, other parameters such as building
occupancy levels, operation times and the weather conditions influence the complexity
of determining the energy use.
Another feature that can reduce the unwanted solar heat gains in the buildings is by
making changes to its roof. A study on cool roof technology was carried out in London
(Kolokotroni et al., 2013). With the application of a reflective paint of the flat roof of the
building, it was found that the cooling energy demand was reduced; however, the
heating demand was increased. Nevertheless, the total energy savings with this
application was found to vary between 1 and 8.5% under normal conditions.
Air conditioning systems in hotels are almost an integral device. These allow in
regulating the temperature to a comfortable level for guests to occupy guest rooms,
restaurants, bars and other areas. There exists a need to improve the energy performance
of air conditioning systems since they consume the largest portion of the buildings total
27
electricity bill (Yu and Chan, 2010). A study on hotels in the subtropical climate of
Hong Kong was carried out. The building was modeled in the simulation program
TRNSYS 15 for its energy analysis. The annual energy required for cooling in a typical
hotel was calculated to be 17,692,414 kWh. This value represents 93.1% of the 8152
cooling hours from the total of 8760 hours/year. The implementation of water-cooled
chiller systems was studied based on 8 different schemes. The optimum configuration
based on variable speed drive (VSD) can bring an annual savings of HK$10.1/m2. In
other words, this scheme can save 8.63% of electricity and 14.81% of water
consumption annually.
A modeling study carried out by Taylor in (Taylor et al., 2010) has determined that it is
technically possible to reduce greenhouse gas emissions by 50% using passive and
newer technologies by the year 2030. The intervention to the building performance can
be reduced by improved lighting and appliances, HVAC changes, changes to the
building materials and envelopes, addition of insulation and glazing to windows.
2.5 Energy Efficiency
Efficiency in general is a very useful indicator that helps to determine the level of
performance of any system which has measurable inputs and outputs. Hence, energy
efficiency (EE) is defined as a ratio of useful output over energy input. The measure of
EE can range from an electrical appliance, energy conversion device, a building, an
industrial workplace, a sector or a nation‘s economy (Sorrell, 2007). The
implementation of energy efficiency and energy conservation represent viable economic
opportunities to bring down the energy bill. These measures are usually short term
solutions to tackle the rising energy prices from fossil fuels and require much less capital
investments than most renewable energy solutions.
Five office buildings in Barbados were subjected to an energy efficiency study (Edwards
et al., 2012). The energy consumption by these buildings was compared against that of
the ―best observable‖ consumption in the group. The indicator used to make this
comparison was energy consumption per unit area (kWh/sq. ft) IE = E/A. Energy
28
inefficiencies were identified from two different groups of energy consumption namely
Equipment & Technology (E&T) and Management & operations (M&O). It was found
out that E&T had inefficiencies between 10 to 14% and the overall inefficiencies rose as
high as 56%. Thus, M&O is of a serious concern and requires careful attention in order
to achieve higher efficiencies in office buildings. The results also reveal that efficiency
in electrical energy consumption in E&T is affected by the occupancy of the physical
space in the building.
2.5.1 Retrofitting – An energy Efficiency measure
Retrofitting has been identified as an efficiency measure to enhance energy savings. For
instance, in a study of Sicilian Hotels, retrofits were applied to building envelopes,
heating plants and the appliances were replaced with those of higher efficiencies (Marco
Beccali et al., 2009). The energy savings from these effective measures were analyzed to
save 11,436,985 kWh/y and 2859 toe/y. These energy savings yield a reduction of 4.6%
CO2 emissions saving 6162 tonCO2/y.
A building‘s energy consumption can differ in terms of energy source, age, size
occupancy levels, geographic location and building envelope (S.E.Chidiac et al., 2011).
Single and multiple energy retrofit measures (ERMs) were simulated to three office
buildings in Canada. The results of the retrofitted simulation present a reduction of 20%
of electrical energy and 19 – 32% of natural gas consumption. From the study, it was
also noted that combining multiple ERMs is not always as beneficial as a sum of
individual retrofit modeling.
It has been noted that older buildings tend to contribute to higher energy consumption
(M. Santamouris et al., 1996). This is because the newer buildings have to follow strict
building codes employing a whole range of energy efficient materials in construction
and energy consuming devices. The energy analysis in Hellenic Hotels in (M.
Santamouris et al., 1996) were based on the performance of heating cooling and lighting.
It has been simulated that retrofitting techniques employed by the hotel in a wide range
of areas can reach 20% of energy savings.
29
An energy audit was conducted in commercial buildings in Thailand (W.Mungwititkul
and Mohanty, 1997). A huge potential for energy savings was identified in these
buildings from the use of office equipment including computers, printers, copiers and
facsimile machine. Being an office environment, the operation times of these devices
occurs during the day. It had been noted that these equipment are turned on throughout
the day even when not in use. This unnecessary use of power contributes to uneconomic
energy bill for the building. Employing new features or devices with the power
managements systems can improve the energy operations and save about 15 – 26% of
annual energy consumption. Following this strategy in all the office buildings in
Thailand, the combined annual energy savings has been approximated to 700 GWh/y.
2.5.2 Use of Energy Efficient Materials
Energy efficient materials are used in the buildings to lower the energy consumption. A
study on the use of cool materials applied on rooftops has been shown to reduce the
cooling demands and improving the thermal comfort of residents (Kolokotroni et al.,
2013). Cool roofs increase the albedo of a building. Albedo is the reflective coefficient
of a material and this determines the ability of the material to reflect solar radiation.
Cool materials such as white painted roofs and putting aluminum sheets between the
roof and ceiling are effective in reflecting the solar radiation, a major contributor to heat
gain.
Different materials have different thermo physical properties (Harvey, 2006). (Ramesh
et al., 2012) modeled a residential building in India, for its life cycle energy (LCE)
demand of a fixed floor area of 85.5m2 and an assumed life span of 75 years. The house
was studied with the use of different building materials for its envelope with
conventional fired clay, hollow concrete, soil-cement, fly ash, aerated concrete and
insulation on wall and roof. This model was also evaluated under different climatic
conditions of India. Results from this study reveal that aerated concrete performs better
in terms of energy savings. The LCE savings vary from 10% in moderate climate to
~30% in warm and humid climate. Using alternative materials without any insulation,
30
the LCE demand is reduced in the range between 1.5 – 5%. The thickness of the
insulation applied in walls and roof is found to be effective at about 5cm for moderate
climate while approximately 10cm for hot and dry, warm and humid, composite and
cold climates. Thus, a limit exists for applying insulation thickness in building
envelopes.
2.5.3 Barriers to Energy Efficiency
While it is known that improving energy efficiency is essential for low greenhouse gas
emissions, reduced energy bill, health benefits due to less pollution and so forth, it is
also important to note its relevance to the type of energy required in different
commercial and service sectors. A study was carried out across the German energy
consuming sectors and highlights a few barriers that arise as a result of moving towards
energy efficiency (Schleich, 2009). These may include inadequate information, hidden
costs, risk and insecurity, direct access to capital, indifference and appropriateness.
Some organizations have inadequate information on specific energy saving technologies
and monitoring of energy consumption pattern and requirements. With the lack of
energy consumption information, the organization faces some difficulty in analyzing and
investing in the suitable energy efficient technologies.
If the organization does some inappropriate investment, it may incur some additional
hidden costs associated to the technology. Hence, the investment on energy efficiency
requires careful consideration to the output energy that is needed. For instance, the
operational performance of the new technologies may require extra regular maintenance
and training of staff.
Energy efficiency in some buildings has not been given much attention by their
management. A common reason in the hesitation of efficiency investment is that it is
presumed that energy represents a small portion of occupancy costs. On the contrary,
this may not always be true. This is because most buildings are equipped with air –
conditioning systems for space heating or cooling. The cost of operation of office
31
buildings in UK with A/C systems in 2000 was £53.82 per m2 compared to £37.24 per
m2 for non A/C buildings (Emeka Efe Osaji et al., 2007). The maintenance of these
systems increases the total service charge up to 35%.
With the employment of new technologies come the associated financial or technical
risks. With the risk of unreliability, these new technologies may lead to breakdowns and
disruption overcoming the potential benefits of the reduced energy costs. The
constriction to time and attention by the management of the organization limits the
access to capital to venture into energy efficiency. Energy efficiency investments are
sometimes given a lower priority to other essential projects in an organization.
2.5.4 Management and Operations
All organizations need various resources to stay in operation. These mainly include
manpower and energy. The role of management and operations in an organization is to
manage and account for the economic operations.
A stochastic frontier analysis was carried out for buildings in the Canadian commercial
sector (J. Buck and Young, 2007). The focus of the study was to determine the physical
and management characteristics which influence energy efficiency achievements. It was
noted that a higher level of energy efficiency is achieved in privately owned buildings.
Furthermore, the activity that is carried out in the building has an impact on the energy
use and its efficiency. For instance, the energy use intensity is different for the services
provided to customers in terms of retail food outlets, indoor recreational facilities and
thermal energy requirements.
The Environmental Protection Agency (EPA) in the United States recognizes energy
benchmarking as a critical energy management activity (Boyd et al., 2008). It enables
the organization to determine the energy consumption of its facility and assist them to
use energy more efficiently. The ENERGY STAR was designed by EPA to create
awareness in businesses and consumers about energy efficient solutions for cost savings
and energy conservation for environmental protection for future generation. The
32
ENERGY STAR label can be found on many appliances, office equipment, lightings
and buildings. The label is used to certify these items which meet or exceed the energy
performance guidelines. EPA now has established the ENERGY STAR recognition for
those companies that have an energy performance indicator (EPI) in the 75th
percentile
of greater. In an analysis of just 17 different plants, the difference between the actual
energy use and the energy use with the energy performance at the 50th
percentile results
in 3 billion lbs. of CO2 emission reduction.
2.6 Use of Renewable Energy
A higher concern of regard is required in terms of local capacity building, training and
educating the people to ease the transition from fossil fuel based power systems to
renewable energy technologies (Yajuan Xin et al., 2012). The shift from fossil to non –
fossil fuel sources such as bio-fuels, natural gas and biodiesel is expected to reduce the
environmental impacts from the tourism sector (Xydis et al., 2009).
As a tropical country, Fiji enjoys plentiful sunshine hours. The most suitable renewable
energy technology that can be readily used in hotel buildings and the tourism industry is
the use of solar energy. Solar energy can be used in two forms, either as thermal energy
for hot water systems or the installation of photovoltaic solar panels to generate
electricity.
Other forms of renewable energy technologies that can be used are hydropower, wind
energy, geothermal, biomass and biofuels (REN21, 2013). Energy can also be harvested
from the oceans, in terms of wave energy, tidal energy and Ocean thermal Electricity
Conversion (OTEC) systems. Before the setup of these technologies, the sources for
energy production require feasibility studies to determine the viability of using these for
energy generation.
With the scarcity of fossil fuel products used to provide energy, renewable energy
technologies are more desirable for its unending supply of environmental conscience
output. The sustainability analysis of renewable energy technologies (RETs) were
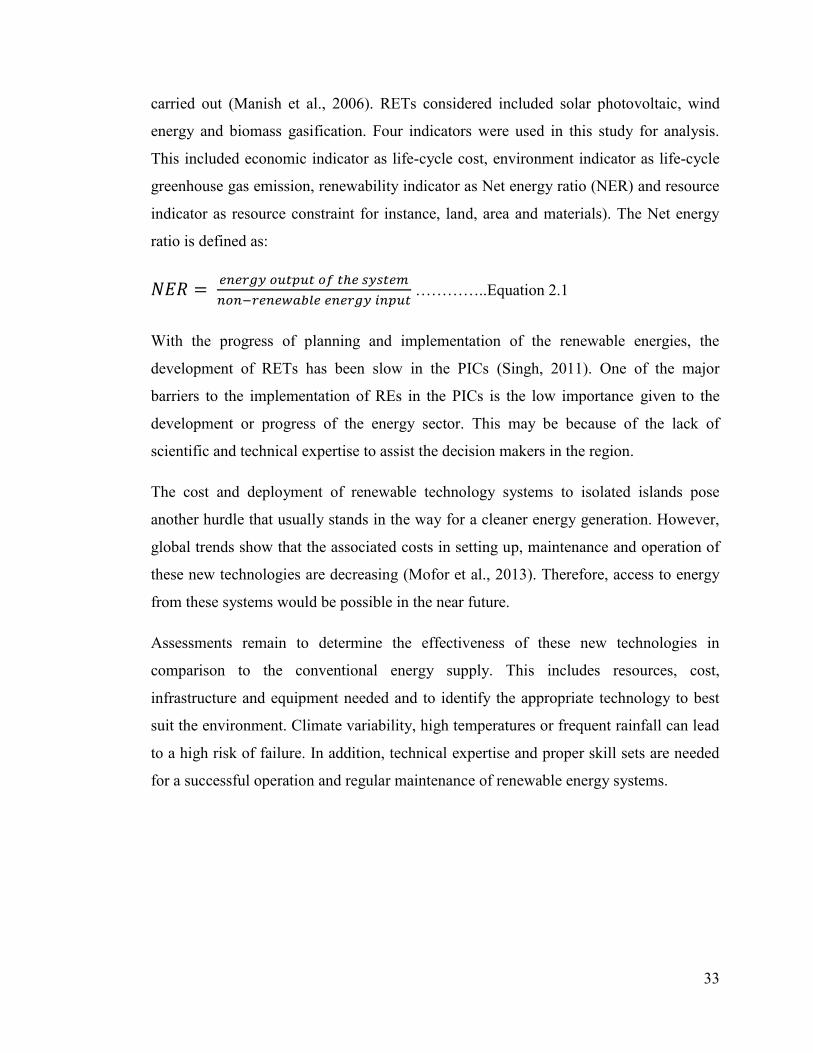
33
carried out (Manish et al., 2006). RETs considered included solar photovoltaic, wind
energy and biomass gasification. Four indicators were used in this study for analysis.
This included economic indicator as life-cycle cost, environment indicator as life-cycle
greenhouse gas emission, renewability indicator as Net energy ratio (NER) and resource
indicator as resource constraint for instance, land, area and materials). The Net energy
ratio is defined as:
…………..Equation 2.1
With the progress of planning and implementation of the renewable energies, the
development of RETs has been slow in the PICs (Singh, 2011). One of the major
barriers to the implementation of REs in the PICs is the low importance given to the
development or progress of the energy sector. This may be because of the lack of
scientific and technical expertise to assist the decision makers in the region.
The cost and deployment of renewable technology systems to isolated islands pose
another hurdle that usually stands in the way for a cleaner energy generation. However,
global trends show that the associated costs in setting up, maintenance and operation of
these new technologies are decreasing (Mofor et al., 2013). Therefore, access to energy
from these systems would be possible in the near future.
Assessments remain to determine the effectiveness of these new technologies in
comparison to the conventional energy supply. This includes resources, cost,
infrastructure and equipment needed and to identify the appropriate technology to best
suit the environment. Climate variability, high temperatures or frequent rainfall can lead
to a high risk of failure. In addition, technical expertise and proper skill sets are needed
for a successful operation and regular maintenance of renewable energy systems.
34
2.6.1 Solar Thermal Hot Water systems
A solar thermal system uses energy from the sun to heat up the water. Solar water
heating systems use solar panels, called collectors which are usually mounted on the
roof of a building.
The two common types of solar water heating panels are:
Evacuated tubes
Flat plate collectors
The solar thermal hot water systems are generally used for domestic use. Domestic hot
water (DHW) heating systems contributes to approximately 30% of residential energy
consumption (Evarts and Swan, 2013). A solar water heating system is capable to
replace other sources of water heating. The other sources used for domestic hot water
systems include oil, electricity, natural gas and propane. These sources come at a cost to
the environment with the emission of Greenhouse gases (GHGs). To compensate for
days with lack of or unavailable solar energy and to heat water, a conventional boiler or
an immersion heater can be incorporated with the design. The proposed use of solar
thermal systems in Sicilian Hotels (Marco Beccali et al., 2009) have been determined to
produce 18,805 GJth/y equal to 448 toe/y. This venture would reduceCO2 emissions by
3% amounting to 856 ton CO2/y and save 209 €/toe equivalent to 109 €/saved tons of
CO2.
2.6.2 Use of Photo-Voltaic (PV) systems
Photo voltaic or more commonly known as solar panel systems have been receiving
much attention from concerned stakeholders in regards to reduce energy costs and move
towards greener source of energy production.
It is of grave importance to make full use of the solar as an energy source. The climatic
condition in the Mediterranean area offers good opportunity for solar photovoltaic
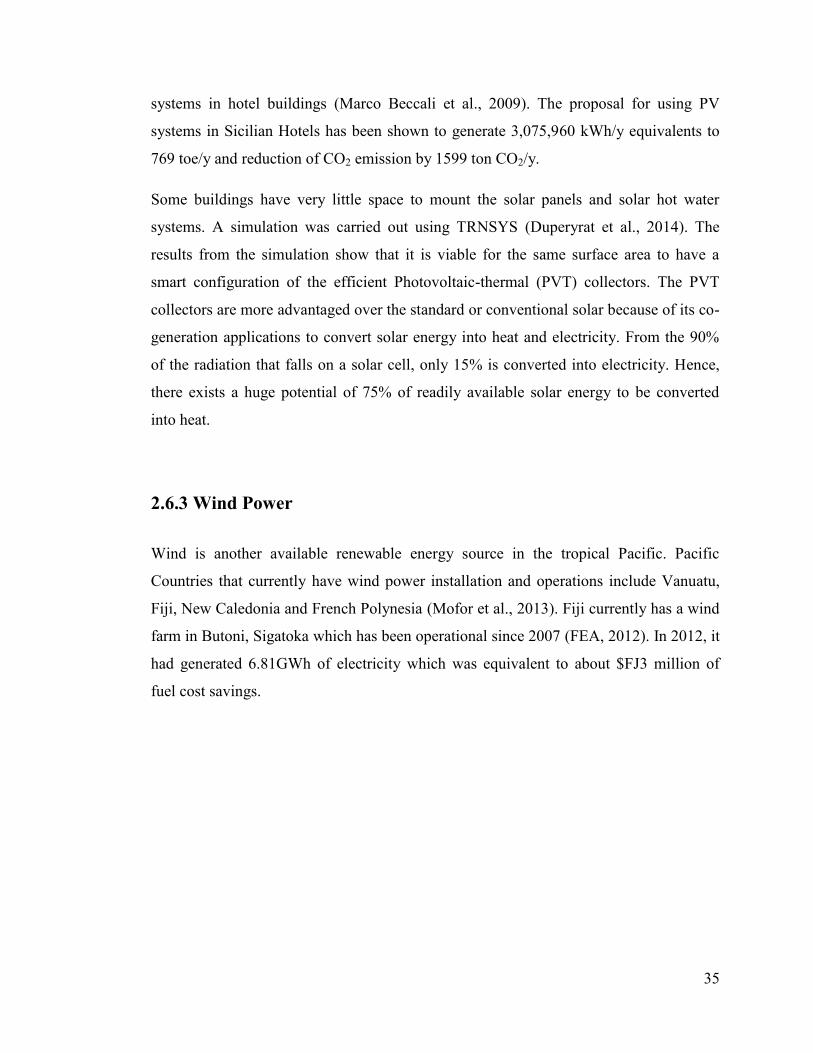
35
systems in hotel buildings (Marco Beccali et al., 2009). The proposal for using PV
systems in Sicilian Hotels has been shown to generate 3,075,960 kWh/y equivalents to
769 toe/y and reduction of CO2 emission by 1599 ton CO2/y.
Some buildings have very little space to mount the solar panels and solar hot water
systems. A simulation was carried out using TRNSYS (Duperyrat et al., 2014). The
results from the simulation show that it is viable for the same surface area to have a
smart configuration of the efficient Photovoltaic-thermal (PVT) collectors. The PVT
collectors are more advantaged over the standard or conventional solar because of its co-
generation applications to convert solar energy into heat and electricity. From the 90%
of the radiation that falls on a solar cell, only 15% is converted into electricity. Hence,
there exists a huge potential of 75% of readily available solar energy to be converted
into heat.
2.6.3 Wind Power
Wind is another available renewable energy source in the tropical Pacific. Pacific
Countries that currently have wind power installation and operations include Vanuatu,
Fiji, New Caledonia and French Polynesia (Mofor et al., 2013). Fiji currently has a wind
farm in Butoni, Sigatoka which has been operational since 2007 (FEA, 2012). In 2012, it
had generated 6.81GWh of electricity which was equivalent to about $FJ3 million of
fuel cost savings.
36
Figure 2.3 The electricity generation from the Butoni wind farm, Sigatoka, Fiji.
(FEA, 2012)
2.7 Conclusion
Energy conservation can result in increased financial capital, environmental quality,
national security, personal security, and human comfort. For optimal results in energy
consumption and energy efficiency, it is imperative to consider analyzing each hotel
when moving towards sustainable tourism (Xydis et al., 2009).
Existing technologies can contribute to dramatic improvements in energy efficiency and
energy consumption (O'Callaghan, 1993). Thus, energy savings can be easily achieved
through energy efficiency.
1. Limiting future population
2. Limiting economic growth
3. Increasing the price of energy
4. Promoting energy efficiency
5. Research and development in energy efficiency and renewable energy

37
With the current research in energy efficiencies, renewable energy technologies, climate
change mitigation and adaptation, there exists a need to realize the potentials of the
outputs of these studies. The need for reliable data and feasibility assessments are some
limitations that exist which confines the economic viability of alternative energy
resources.
Although the Pacific has very low greenhouse gas emissions with a low carbon
footprint, it is very vulnerable to the effects of climate change. The implementation of
energy policies by key stakeholders hold significance importance in lowering the carbon
footprint, reducing the fossil based energy imports and shifting towards the
implementation of further environment friendly and green renewable energy.
38
Chapter 3 Methodology
3.1 Introduction
To carry out this project, a set of procedures were followed in conjunction with the
objectives to achieve the outcome. This chapter intends to give the details of the
processes to
1. Choose hotels for study
2. Energy audit of the electrical consumption
3. Carry out a sector-wise analysis of energy consumption in the hotels
4. Calculate energy savings with assumed possible retrofitting
5. Develop energy performance indicators and determine the usefulness of this
technique
6. Formulate a cooling load model and use it in application to the case studies
7. Compare the Pacific hotels with other hotels around the world.
The stepping stone to begin with the research was to carry out an energy audit of the
hotel buildings chosen for this study.
The main milestone to achieve in this study was to identify efficiencies possible in
hotels. Following this, it was important to note the energy savings that accrue as a result
of adhering to energy efficiency in the buildings.
The climatic data was also acquired from the meteorological service. The weather
parameters were used to analyze and account for the changes in energy consumption
with the seasonal variations.
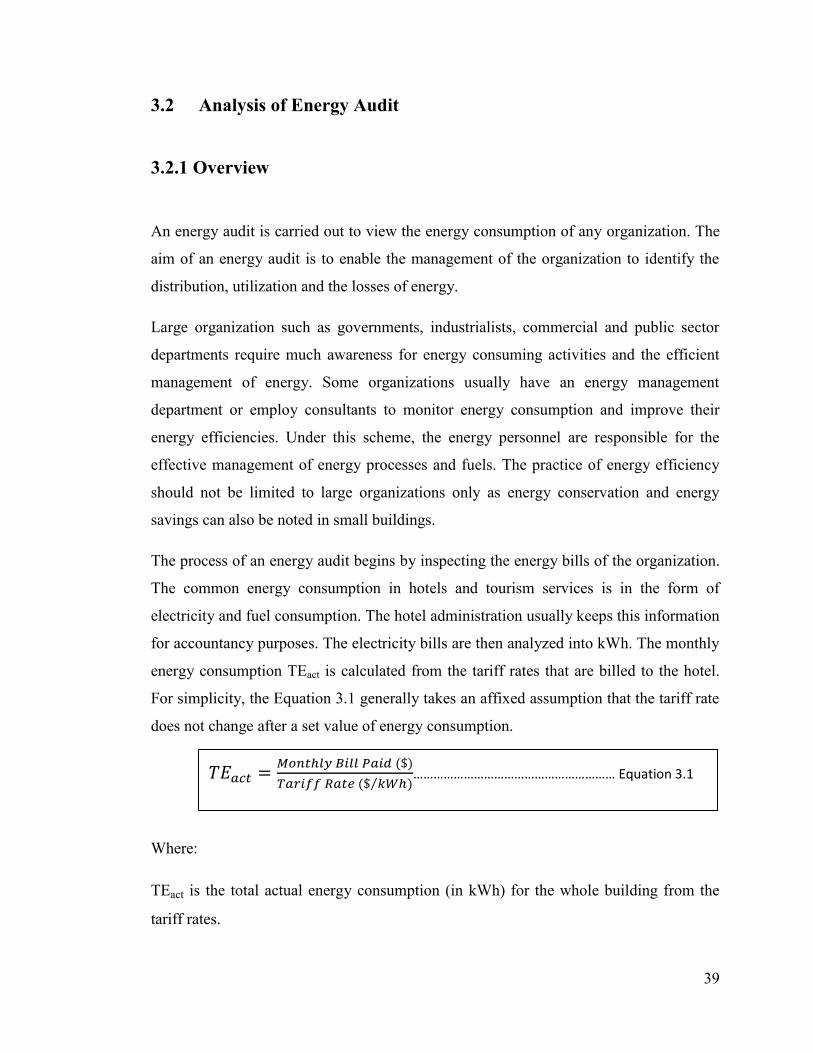
39
3.2 Analysis of Energy Audit
3.2.1 Overview
An energy audit is carried out to view the energy consumption of any organization. The
aim of an energy audit is to enable the management of the organization to identify the
distribution, utilization and the losses of energy.
Large organization such as governments, industrialists, commercial and public sector
departments require much awareness for energy consuming activities and the efficient
management of energy. Some organizations usually have an energy management
department or employ consultants to monitor energy consumption and improve their
energy efficiencies. Under this scheme, the energy personnel are responsible for the
effective management of energy processes and fuels. The practice of energy efficiency
should not be limited to large organizations only as energy conservation and energy
savings can also be noted in small buildings.
The process of an energy audit begins by inspecting the energy bills of the organization.
The common energy consumption in hotels and tourism services is in the form of
electricity and fuel consumption. The hotel administration usually keeps this information
for accountancy purposes. The electricity bills are then analyzed into kWh. The monthly
energy consumption TEact is calculated from the tariff rates that are billed to the hotel.
For simplicity, the Equation 3.1 generally takes an affixed assumption that the tariff rate
does not change after a set value of energy consumption.
Where:
TEact is the total actual energy consumption (in kWh) for the whole building from the
tariff rates.
⁄ …………………………………………………… Equation 3.1
40
∑ …………………………………….………………………. Equation 3.2
3.2.2 Nominal Use of Energy for one room in a Section
To get a clear understanding of the energy consumption in hotels used as case studies,
the detailed distribution of energy use in the whole building was evaluated.
This was carried out in two stages. In the first, the nominal energy use in each section of
the hotel (e.g. a guest room) was first evaluated in terms of the power ratings of the
appliances and their duty cycles. In the second stage, these results were normalized,
using electricity bills provided by the utility, to provide the actual energy use.
For the nominal energy use calculations, the different energy consuming devices in all
sections were noted with their power ratings as well as the estimated respective duty
cycle or the period for which they were in operation in a day.
For instance;
In the particular example of Table 4.4 in Chapter 4, taking an executive suite guest
room, the following procedures can be adopted.
1. The total number of electrical appliances was identified and their rated power
noted.
2. The duty cycles for each appliance in the room were noted.
3. This information was used to calculate the (nominal) total electrical energy
consumption for a particular room per day.
4. Table 4.4 gives the data on the estimated energy consumption for a single
executive suite room per day. (Note: this is in the case of an occupied guest
room).
Equation 3.2 was used to calculate the nominal energy consumption of an occupied
guest room per day.
Where:
: Nominal use of energy in a room (kWh) per day
41
)(. occupancydays
n
roomSectionnom mmEE ………………………… Equation 3.3
: is the power rating of an appliance used in the room (kW)
: is the duty cycle of operation of the appliance per day (hours).
and the summation is over all appliances in the room.
The hotels generate most of income from their guest rooms followed by conference
rooms and then the other areas. The energy used in a guest room relates entirely to the
guest‘s occupancy and behavior.
3.2.3 Nominal Use of Energy in a Section
Noting the total number of rooms in the sector and the hotel‘s monthly occupancy rate,
the (nominal) electricity consumption was estimated for each respective month for the
sector. Equation 3.3 is used to estimate the monthly energy consumption using the
occupancy level.
Where:
SectionnomE . : Nominal monthly energy consumption in a section (kWh)
roomE : Nominal energy consumption for a unit section per day. (kWh)
daysm : No. of days in the particular month
n: Represents the no. of rooms; (applicable to the no. of guest rooms; all
other sections such as administration, lobby/lounge, reception, restaurant
& bar etc. are taken as n=1)
occupancym : Monthly occupancy rate (applicable mainly to guest rooms; all other
sectors are assumed to have 100% occupancy; that is, operational full
time.)
Note: When considering other sectors apart from sector 1, the same formula can be used
by taking n=1 and moccupancy = 100%. This is because these areas such as administration,
42
reception and kitchen have to be operated daily, regardless of the number of guests
present.
3.2.4 The Normalized Energy Consumption
The nominal energy consumption was calculated for each month as above for each
section of the hotel. The results are displayed in Table 4.6 (Chapter 4) for all sections
together with the annual totals.
The nominal energy consumption for all sections (i.e. for the whole hotel) in a month
nomTE is simply given by summing SectionnomE . over all sections, i.e.
However, these calculations are for nominal energy consumption only. The actual
energy consumption in each section, actE may be obtained by comparing its nominal
value Enom to the total nominal value (given by equation 3.4) and then scaling the result
by the total energy consumption for the hotel as obtained from the utility bill. This
normalization is carried out as shown in equation 3.5 below.
Where:
actE : The actual energy consumption in a section per month (kWh)
nomE : Nominal energy consumption per month for a particular section (kWh)
: Total actual energy consumption per month for the whole building (from
utility bills) (kWh)
actTE
act
nom
nomact TE
TE
EE ………………………………….. Equation 3.5
tionall
Sectionnomnom ETEsec
. ………………...................... Equation 3.4
43
The normalized actual energy consumption in the different areas of the hotel was
calculated and recorded in Table 4.7 (Chapter 4).
3.3 Sector – wise analysis of Energy Consumption
It is of interest to carry out a sector-wise analysis of the energy consumption of the hotel,
where the various sections of the building are grouped into similar sectors.
To carry out this analysis, the different areas of the hotel were grouped into three distinct
sectors;
Production(Guest rooms, conference rooms, bar, restaurant, business center & internet
services-telecoms & networking)
Services(elevator/lift, Kitchen, hot-water systems, lobby/lounge, outdoor lightings,
outdoor activities-swimming pool)
Management (Administration office, reception area, staff room)
The Production sector is where the economic production occurs or revenue for the hotel
is generated. Most of the income in the hotel comes from guest rooms, followed by other
sections including conference rooms, restaurant and bars. The Services sector as the
name suggests consists of those sections that provides services to the guests. Thirdly, the
Management sector is responsible for energy consumption by the hotel staff in providing
the management services for the hotel. This sector consists of the staff authorized areas,
such as administration offices, reception area, staff room or maintenance workshops.
Table 4.8 shows the monthly energy consumption in the sectors for Hotel 1 and a pie
chart was plotted to show the sector–wise analysis of the annual energy consumption.
Similarly, the monthly energy consumption for Hotel 2 was tabulated in Table 4.9 and
the annual energy consumption of the sector – wise analysis in Figure 4.5 under Chapter
4.
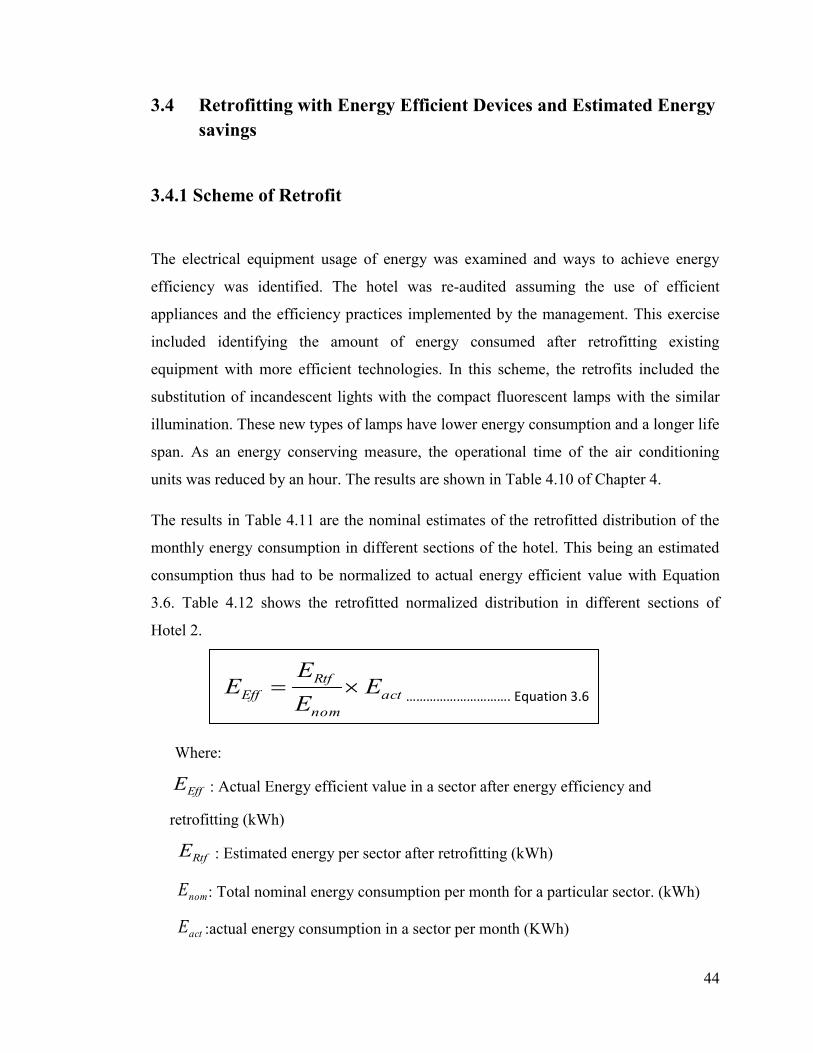
44
3.4 Retrofitting with Energy Efficient Devices and Estimated Energy
savings
3.4.1 Scheme of Retrofit
The electrical equipment usage of energy was examined and ways to achieve energy
efficiency was identified. The hotel was re-audited assuming the use of efficient
appliances and the efficiency practices implemented by the management. This exercise
included identifying the amount of energy consumed after retrofitting existing
equipment with more efficient technologies. In this scheme, the retrofits included the
substitution of incandescent lights with the compact fluorescent lamps with the similar
illumination. These new types of lamps have lower energy consumption and a longer life
span. As an energy conserving measure, the operational time of the air conditioning
units was reduced by an hour. The results are shown in Table 4.10 of Chapter 4.
The results in Table 4.11 are the nominal estimates of the retrofitted distribution of the
monthly energy consumption in different sections of the hotel. This being an estimated
consumption thus had to be normalized to actual energy efficient value with Equation
3.6. Table 4.12 shows the retrofitted normalized distribution in different sections of
Hotel 2.
Where:
EffE : Actual Energy efficient value in a sector after energy efficiency and
retrofitting (kWh)
RtfE : Estimated energy per sector after retrofitting (kWh)
nomE : Total nominal energy consumption per month for a particular sector. (kWh)
actE :actual energy consumption in a sector per month (KWh)
act
nom
Rtf
Eff EE
EE
…………………………. Equation 3.6
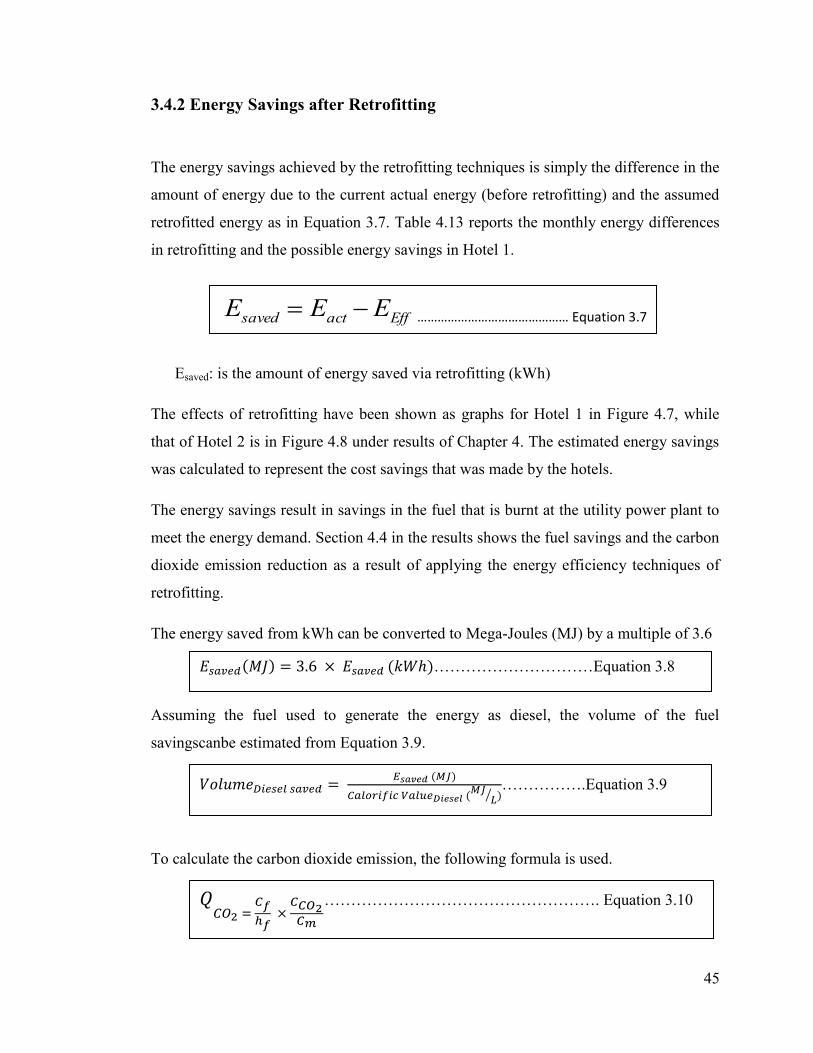
45
3.4.2 Energy Savings after Retrofitting
The energy savings achieved by the retrofitting techniques is simply the difference in the
amount of energy due to the current actual energy (before retrofitting) and the assumed
retrofitted energy as in Equation 3.7. Table 4.13 reports the monthly energy differences
in retrofitting and the possible energy savings in Hotel 1.
Esaved: is the amount of energy saved via retrofitting (kWh)
The effects of retrofitting have been shown as graphs for Hotel 1 in Figure 4.7, while
that of Hotel 2 is in Figure 4.8 under results of Chapter 4. The estimated energy savings
was calculated to represent the cost savings that was made by the hotels.
The energy savings result in savings in the fuel that is burnt at the utility power plant to
meet the energy demand. Section 4.4 in the results shows the fuel savings and the carbon
dioxide emission reduction as a result of applying the energy efficiency techniques of
retrofitting.
The energy saved from kWh can be converted to Mega-Joules (MJ) by a multiple of 3.6
Assuming the fuel used to generate the energy as diesel, the volume of the fuel
savingscanbe estimated from Equation 3.9.
To calculate the carbon dioxide emission, the following formula is used.
Effactsaved EEE ……………………………………… Equation 3.7
…………………………Equation 3.8
⁄ …………….Equation 3.9
……………………………………………. Equation 3.10
46
Where;
= the specific CO2 emission (kgCO2/kWh)
Cf = specific carbon content in the fuel (kgC/kgfuel)
hf = specific energy content (kWh/kgfuel)
Cm = specific mass carbon (kg/mol Carbon)
= specific mass carbon dioxide (kg/mol CO2)
3.5 Developing Energy Performance Indicators
Energy performance indicators were developed from the current energy consumption in
the hotel buildings. The energy performance indicators were used to evaluate the
performance of energy usage in hotel buildings and assist in the comparative analysis
between similar activities or areas such as bar, restaurant, kitchen, administration and
reception in different hotels.
The two energy performance indicators developed from the data were:
- EPI 1 as Energy consumption per unit floor area (kWh/m2)
- EPI 2 as Energy consumed per occupied guest room.(kWh/occupied guest room)
3.5.1 EPI 1 – Energy Consumption per unit area (kWh/m2)
The first EPI is defined as energy consumption per unit area (kWh/m2). It reveals the
spread of energy consumption by various electrical devices used within a certain floor
area. The dimensions of the floor area of different sections were taken to determine the
energy usage per area in square meters. Energy use per unit area has been identified as a
possible energy performance indicator (EPI) to assess energy performance of the hotel‘s
building structure. This key indicator can also be used to compare with other building‘s
energy performance. The results for Hotel 1 was calculated and recorded as in Table
4.17 and displayed graphically in Figure 4.9 of Chapter 4. Figure 4.10 shows the energy
consumed per unit area in Hotel 2.
47
The calculated values for EPI 1 in different sections of the hotels allowed an easier way
to see the variation of energy consumption in both the case studies. This was particularly
possible for the sections in the service sector. Table 4.18 shows a comparison between
the two hotels in some of the similar sections such as restaurant, administration &
reception, kitchen and bar.
3.5.2 EPI 2 – Energy consumed per guest room (kWh/occupied guest
room)
The energy consumption in the guest rooms depends upon the occupancy and the
behavior of the guests. The occupancy levels of the guests vary in the months and not all
the guest rooms may be occupied. In a guest room, there are many energy consuming
appliances such as electric kettle, iron, mini fridge, television, dvd player, different types
of lamps and the air conditioning unit. The air conditioning system is the major energy
consumer due to its high power rating.
Figure 4.11 shows the graph of EPI 2 values for Hotel 1 over the months while Figure
4.12 represents the same for Hotel 2. A close correlation between the energy
consumption and the outdoor temperature was observed. The graph in Figure 4.13 shows
this resemblance with the plot of EPI 2 values from the 2 hotels and the monthly mean
temperature.
3.5.3 Modeling energy consumption of an arbitrary hotel from the EPIs
The Energy Performance Indicators are suitable in assessing the energy consumption in
different sections of the building. Since EPIs are a great way to level the energy
consumption in the different sections, the energy savings can be reflected in the
improvement of the performance of energy consumption.
48
Another use for dividing the whole energy into performance characteristics of different
sections is that it can be used to calculate the energy consumption of an arbitrary
building. Given that a building is to be built of a similar structure as that in the case
study, Hotel 1, the energy consumption of the arbitrary building can be calculated via
the EPIs. Section 4.6.2 in Chapter 4 shows an example with a problem statement. For
this arbitrary hotel, the total energy consumption was calculated together with the costs
of energy per month.
3.6 Modeling the cooling load
3.6.1 Overview
The cooling load is the amount of heat that must be removed from a building to maintain
a comfortable temperature for its occupants using the heating, ventilation and air
conditioning (HVAC) equipment. This load is a sum of the net heat gains and losses
within a building. Mathematically, the cooling load can be modeled to be equal to the
heat flux through conductive heat transfer in walls plus the heat transfer by exchange of
air between the indoor and outdoor temperature, together with the heat radiated by
people, machinery and indoor processes.
CL – Cooling load (Power – given in kW)
Qc – Conductive Heat transfer
Qa – Heat transfer due air exchange (Indoor and Outdoor)
Qr – Radiative heat emission inside the building
Note: All of Qc, Qa, Qr are temperature dependent (therefore, temperatures must be
specified)
Equilibrium Requirement:
……………………..…........................................... Equation 3.11
49
From Chapter 4, Figure 4.14 shows the heat inflows into a building. The conductive heat
transfer Qc, is between walls of the buildings. This is due to the temperature difference
between the outdoor atmospheric temperature and the indoor temperature. The next term
of the equation is Qa. This is the heat transfer due to air exchange in open windows and
doors. Finally, Qr, the radiative heat emission is caused by the occupants of the building
from people and processes such as operating of some heat dissipating devices.
3.6.2 Heat transfer by Conduction, Qc
The heat flux per unit area across a wall due to conductive heat transfer is given by:
Where:
QC: is the conductive heat transfer (W)
∆T: is the temperature difference between the indoor and outdoor (K)
U: heat transfer coefficient (W/m2/K)
A – area of the conductive heat transfer (m2) eg. walls, ceilings.
For a given layer, the heat transfer coefficient, U in (W/m2/K) is given by the thermal
conductivity, k (W/m/K) for that material divided by its thickness in (m). The thermal
conductivity expresses the rate of heat energy transfer through a substance in the steady
state and is not time dependent. Hence, if a thicker material is used in construction, the
thermal conductivity will be lowered and the heat transferred through conduction shall
decrease. A sample calculation on the conductive heat transfer in a small building has
been show in chapter 4, section 4.7.1.
∑ …………………………..….Equation 3.12
…………………………………………...…. Equation 3.13
50
3.6.3 Heat transfer by air exchange, Qa
The heat transfer due to air exchange is often termed as convection. This process
transfers energy in a combination of heat conduction and by mixing motion of fluids.
The convective heat transfer is dependent upon:
- The geometry of the system
- Flow rate or the velocity of the air flow
- Mode of flow (laminar or turbulent)
- Fluid transfer characteristics
- Temperature difference in free convection
Heat gain/loss occurs when a difference of temperature exists between the outdoor air
and the indoor air. The greater the temperature difference, the more the amount of
energy required to lower the indoor temperature to a comfortable or desired level. The
common mode of air exchange is by the apertures such as windows and doors in a
building.
Where:
ρ – density of air (kg m-3
)
ca – specific heat capacity of air (1005 J kg-1
K-1
)
Fv – is the volumetric flow rate of air (m3 s
-1)
Ti – indoor temperature of air (K)
Te – outdoor temperature of air (K)
Qa – heat flux (W)
*NOTE: The flow of heat through a window depends on a number of distinct processes:
- Transmission of solar (short wave +/ diffuse) radiation
…………………………………………...…. Equation 3.14
51
- Emission of infrared (IR) radiation
- Conduction of heat through the glass, through the air between the panes and
through the frame and spacers between the panes
- Infiltration of outside air
The density of air changes with temperature according to the equation 3.15;
Where:
P the atmospherics pressure (Pa)
Rspecific is the specific gas constant for dry air = 287.058J/ (kg.K)
T is the atmospheric temperature (K)
ρ Density of air, ρ at 25 = 1.1839 kg/m3
An example of heat transfer due to air exchange or by convection has been shown in the
results under section 4.8.2 with assumed dimensions and parameters.
3.6.4 Radiative Heat Emission, Qr
Objects at a temperature radiate energy at a rate given by:
Where:
B – is the blackbody radiation in W/m2
σ – is the Stefan – Boltzmann constant (5.67 x 10⁻⁸
W m-2
K-4
)
T – is the temperature of the radiating body (K)
…………………………………………………….…………...…. Equation 3.15
…………………………………………………….…………...…. Equation 3.16
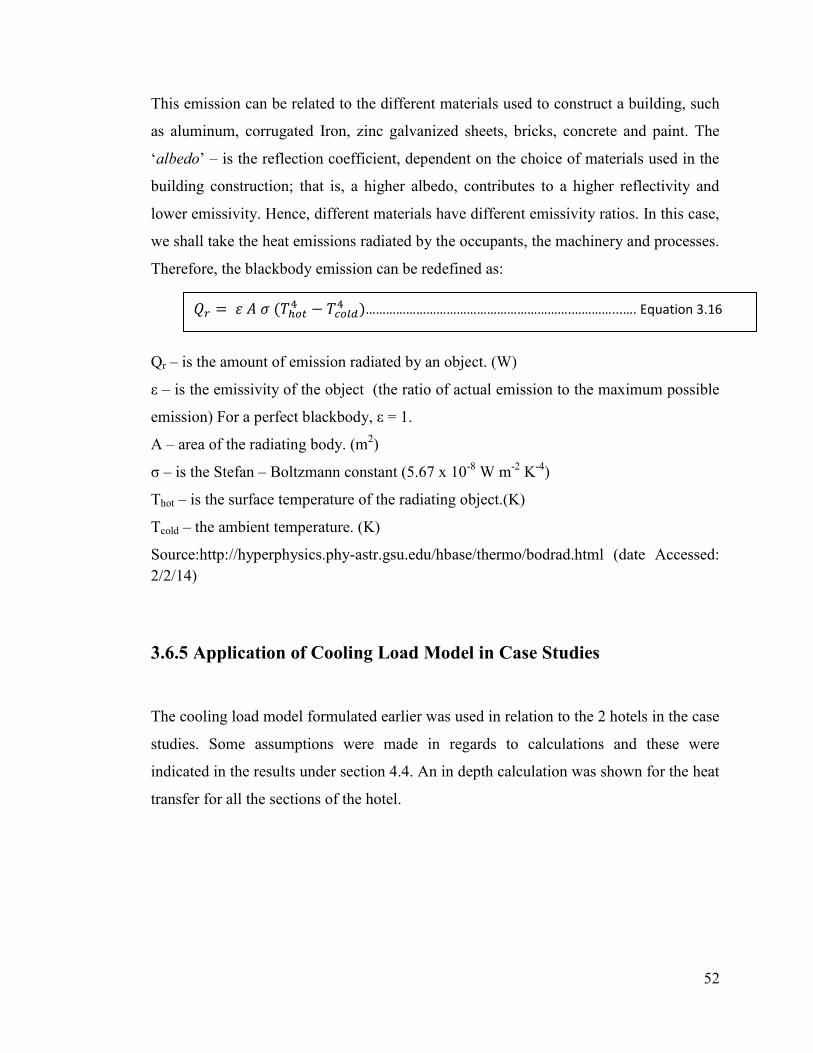
52
This emission can be related to the different materials used to construct a building, such
as aluminum, corrugated Iron, zinc galvanized sheets, bricks, concrete and paint. The
‗albedo‘ – is the reflection coefficient, dependent on the choice of materials used in the
building construction; that is, a higher albedo, contributes to a higher reflectivity and
lower emissivity. Hence, different materials have different emissivity ratios. In this case,
we shall take the heat emissions radiated by the occupants, the machinery and processes.
Therefore, the blackbody emission can be redefined as:
Qr – is the amount of emission radiated by an object. (W)
ε – is the emissivity of the object (the ratio of actual emission to the maximum possible
emission) For a perfect blackbody, ε = 1.
A – area of the radiating body. (m2)
σ – is the Stefan – Boltzmann constant (5.67 x 10⁻⁸
W m-2
K-4
)
Thot – is the surface temperature of the radiating object.(K)
Tcold – the ambient temperature. (K)
Source:http://hyperphysics.phy-astr.gsu.edu/hbase/thermo/bodrad.html (date Accessed:
2/2/14)
3.6.5 Application of Cooling Load Model in Case Studies
The cooling load model formulated earlier was used in relation to the 2 hotels in the case
studies. Some assumptions were made in regards to calculations and these were
indicated in the results under section 4.4. An in depth calculation was shown for the heat
transfer for all the sections of the hotel.
…………………………………………………….…………...…. Equation 3.16
53
3.7 Comparison of Hotels around the regions
From the literature review, data on energy consumption in hotels from different parts of
the world was extracted. This data was tabulated in Table 4.29 to compare the energy
consumption as EPI 1 – kWh/m2 for a year. This energy performance indicator was
compared to the case studies of hotels in Fiji and showed some similarity with the hotels
from other regions. Some authors had used software to simulate the energy consumption
and were noted in another Table 4.30.
3.8 Chapter Conclusion
This chapter discussed the methodology of the project. It also highlights the equations to
determine the relative outputs of the research. The relative outcomes of the procedure
followed produced the results as further discussed in chapter 4. The modeling technique
to determine the total energy consumption has been elaborated. In addition, the energy
performance indicators to measure the performance of energy consumption have also
been discussed. A cooling load model was also deduced as part of this project and
worked out for the case studies.
54
Chapter 4 Results & Discussion
4.1 Introduction
Two hotels of different types and building envelopes were studied. Hotel 1 was
classified as a business class corporate hotel. It is a high rise building located in an urban
area. On the other hand, the location of hotel 2 was near the coastal area and the beach.
It is a villa type resort spread over a large span of area.
Both these hotels use grid electricity supplied by the Fiji Electricity Authority (FEA) as
their major source of energy. The electricity is used to provide most of the services
offered by these hotels. These include lighting, air conditioning and ventilation,
refrigeration and cooling, electrical kitchen appliances, water pumping, elevators,
telecommunications and IT accessories. The two hotels each have a backup diesel
generator to cater for the buildings electrical load in case of an electrical disruption.
Apart from using electrical energy, both hotels use liquefied petroleum gas (LPG) for
domestic hot water heating in guest rooms and as well as for cooking in the kitchens. In
terms of services and amenities, Hotel 2 provides its guests with more opportunities as
compared to Hotel 1. Both hotels provide conference facilities, however, Hotel 2 also
offers snorkeling, deep sea diving, tennis court, gym and game center, a chapel for
weddings & reception functions, spa& sauna, and handicrafts.
The objectives of this research study were:
1. To study the energy consumption by carrying out an energy audit.
2. Divide the energy usage in a hotel into different sectors. (Sector–Wise Analysis)
3. To retrofit the devices and compare energy savings obtained.
4. Estimate fuel savings and carbon emission reductions at the utility power plant
due to energy efficiency measures by the two hotels.
5. To develop Energy performance indicators to represent energy usage in various
sections.
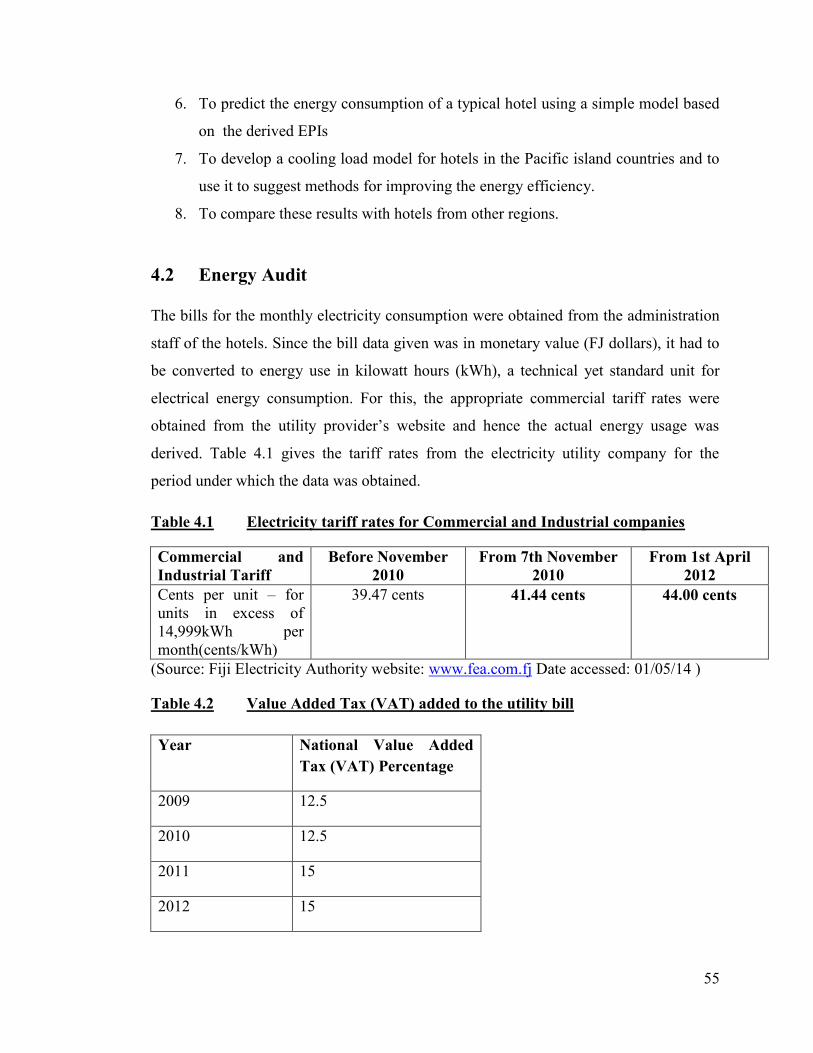
55
6. To predict the energy consumption of a typical hotel using a simple model based
on the derived EPIs
7. To develop a cooling load model for hotels in the Pacific island countries and to
use it to suggest methods for improving the energy efficiency.
8. To compare these results with hotels from other regions.
4.2 Energy Audit
The bills for the monthly electricity consumption were obtained from the administration
staff of the hotels. Since the bill data given was in monetary value (FJ dollars), it had to
be converted to energy use in kilowatt hours (kWh), a technical yet standard unit for
electrical energy consumption. For this, the appropriate commercial tariff rates were
obtained from the utility provider‘s website and hence the actual energy usage was
derived. Table 4.1 gives the tariff rates from the electricity utility company for the
period under which the data was obtained.
Table 4.1 Electricity tariff rates for Commercial and Industrial companies
Commercial and
Industrial Tariff
Before November
2010
From 7th November
2010
From 1st April
2012
Cents per unit – for
units in excess of
14,999kWh per
month(cents/kWh)
39.47 cents 41.44 cents 44.00 cents
(Source: Fiji Electricity Authority website: www.fea.com.fj Date accessed: 01/05/14 )
Table 4.2 Value Added Tax (VAT) added to the utility bill
Year National Value Added
Tax (VAT) Percentage
2009 12.5
2010 12.5
2011 15
2012 15
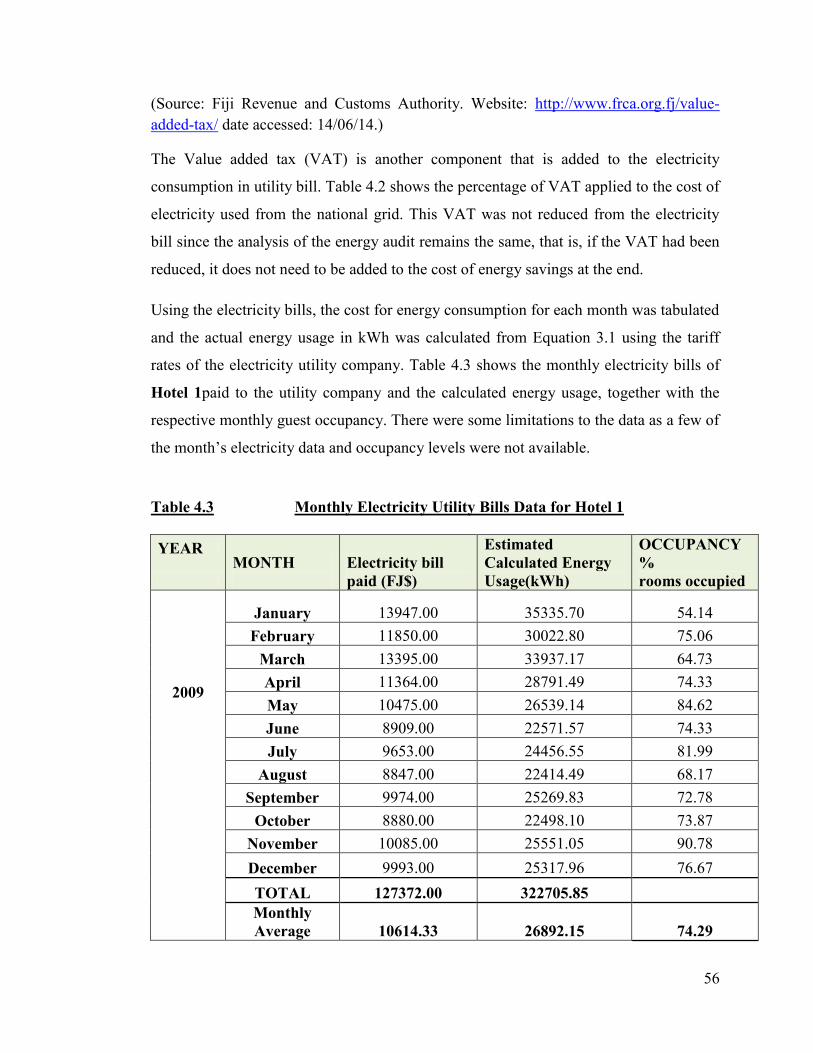
56
(Source: Fiji Revenue and Customs Authority. Website: http://www.frca.org.fj/value-
added-tax/ date accessed: 14/06/14.)
The Value added tax (VAT) is another component that is added to the electricity
consumption in utility bill. Table 4.2 shows the percentage of VAT applied to the cost of
electricity used from the national grid. This VAT was not reduced from the electricity
bill since the analysis of the energy audit remains the same, that is, if the VAT had been
reduced, it does not need to be added to the cost of energy savings at the end.
Using the electricity bills, the cost for energy consumption for each month was tabulated
and the actual energy usage in kWh was calculated from Equation 3.1 using the tariff
rates of the electricity utility company. Table 4.3 shows the monthly electricity bills of
Hotel 1paid to the utility company and the calculated energy usage, together with the
respective monthly guest occupancy. There were some limitations to the data as a few of
the month‘s electricity data and occupancy levels were not available.
Table 4.3 Monthly Electricity Utility Bills Data for Hotel 1
YEAR MONTH
Electricity bill
paid (FJ$)
Estimated
Calculated Energy
Usage(kWh)
OCCUPANCY
%
rooms occupied
2009
January 13947.00 35335.70 54.14
February 11850.00 30022.80 75.06
March 13395.00 33937.17 64.73
April 11364.00 28791.49 74.33
May 10475.00 26539.14 84.62
June 8909.00 22571.57 74.33
July 9653.00 24456.55 81.99
August 8847.00 22414.49 68.17
September 9974.00 25269.83 72.78
October 8880.00 22498.10 73.87
November 10085.00 25551.05 90.78
December 9993.00 25317.96 76.67
TOTAL 127372.00 322705.85
Monthly
Average 10614.33 26892.15 74.29
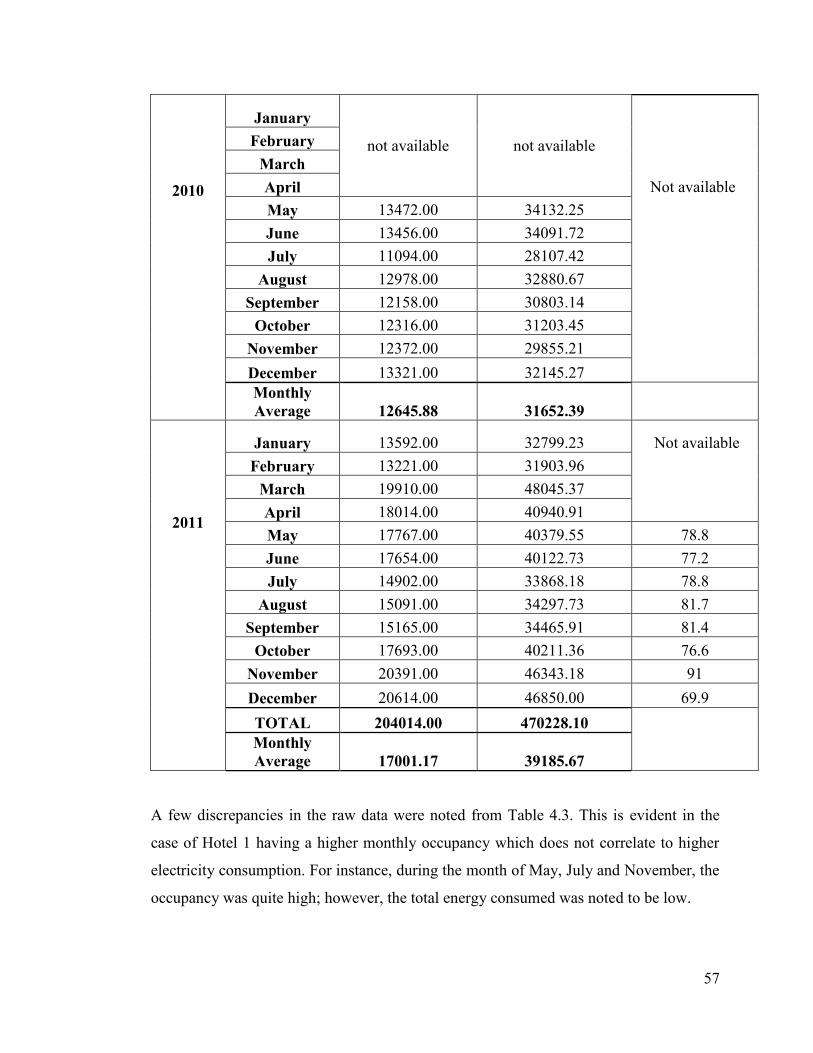
57
2010
January
not available not available
February
March
April Not available
May 13472.00 34132.25
June 13456.00 34091.72
July 11094.00 28107.42
August 12978.00 32880.67
September 12158.00 30803.14
October 12316.00 31203.45
November 12372.00 29855.21
December 13321.00 32145.27
Monthly
Average 12645.88 31652.39
2011
January 13592.00 32799.23 Not available
February 13221.00 31903.96
March 19910.00 48045.37
April 18014.00 40940.91
May 17767.00 40379.55 78.8
June 17654.00 40122.73 77.2
July 14902.00 33868.18 78.8
August 15091.00 34297.73 81.7
September 15165.00 34465.91 81.4
October 17693.00 40211.36 76.6
November 20391.00 46343.18 91
December 20614.00 46850.00 69.9
TOTAL 204014.00 470228.10
Monthly
Average 17001.17 39185.67
A few discrepancies in the raw data were noted from Table 4.3. This is evident in the
case of Hotel 1 having a higher monthly occupancy which does not correlate to higher
electricity consumption. For instance, during the month of May, July and November, the
occupancy was quite high; however, the total energy consumed was noted to be low.
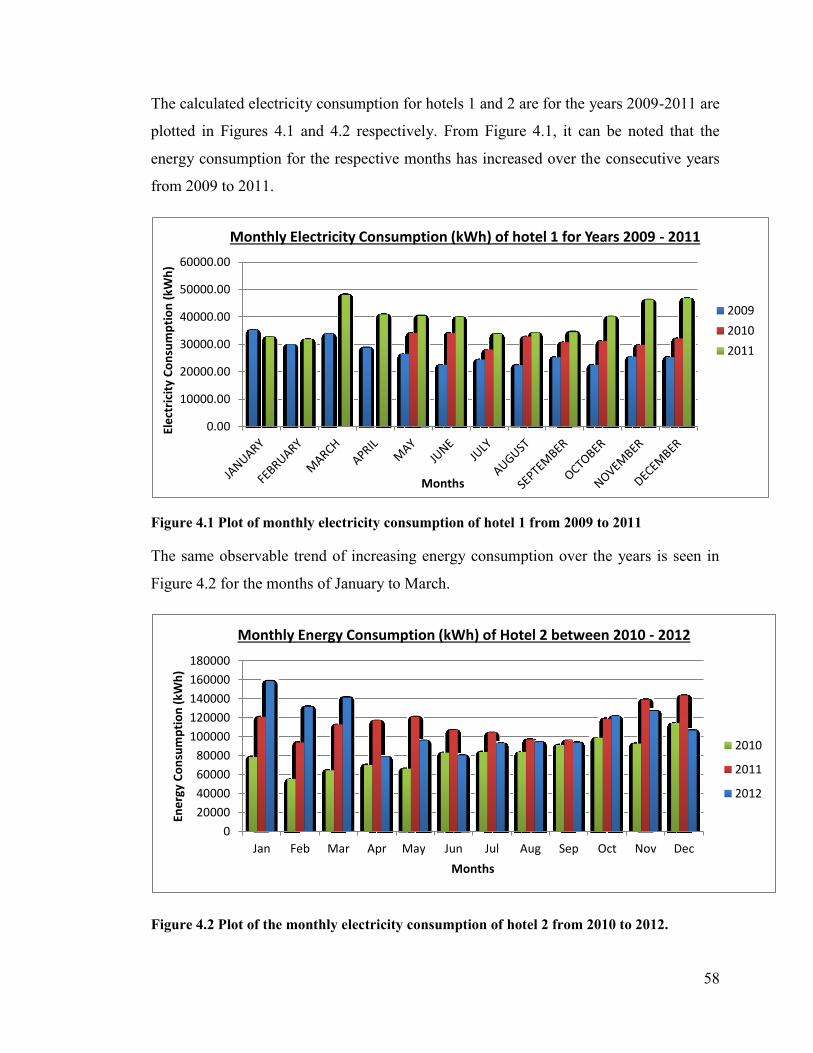
58
The calculated electricity consumption for hotels 1 and 2 are for the years 2009-2011 are
plotted in Figures 4.1 and 4.2 respectively. From Figure 4.1, it can be noted that the
energy consumption for the respective months has increased over the consecutive years
from 2009 to 2011.
Figure 4.1 Plot of monthly electricity consumption of hotel 1 from 2009 to 2011
The same observable trend of increasing energy consumption over the years is seen in
Figure 4.2 for the months of January to March.
Figure 4.2 Plot of the monthly electricity consumption of hotel 2 from 2010 to 2012.
0.00
10000.00
20000.00
30000.00
40000.00
50000.00
60000.00
Ele
ctri
city
Co
nsu
mp
tio
n (
kWh
)
Months
Monthly Electricity Consumption (kWh) of hotel 1 for Years 2009 - 2011
2009
2010
2011
0
20000
40000
60000
80000
100000
120000
140000
160000
180000
Jan Feb Mar Apr May Jun Jul Aug Sep Oct Nov Dec
Ene
rgy
Co
nsu
mp
tio
n (
kWh
)
Months
Monthly Energy Consumption (kWh) of Hotel 2 between 2010 - 2012
2010
2011
2012
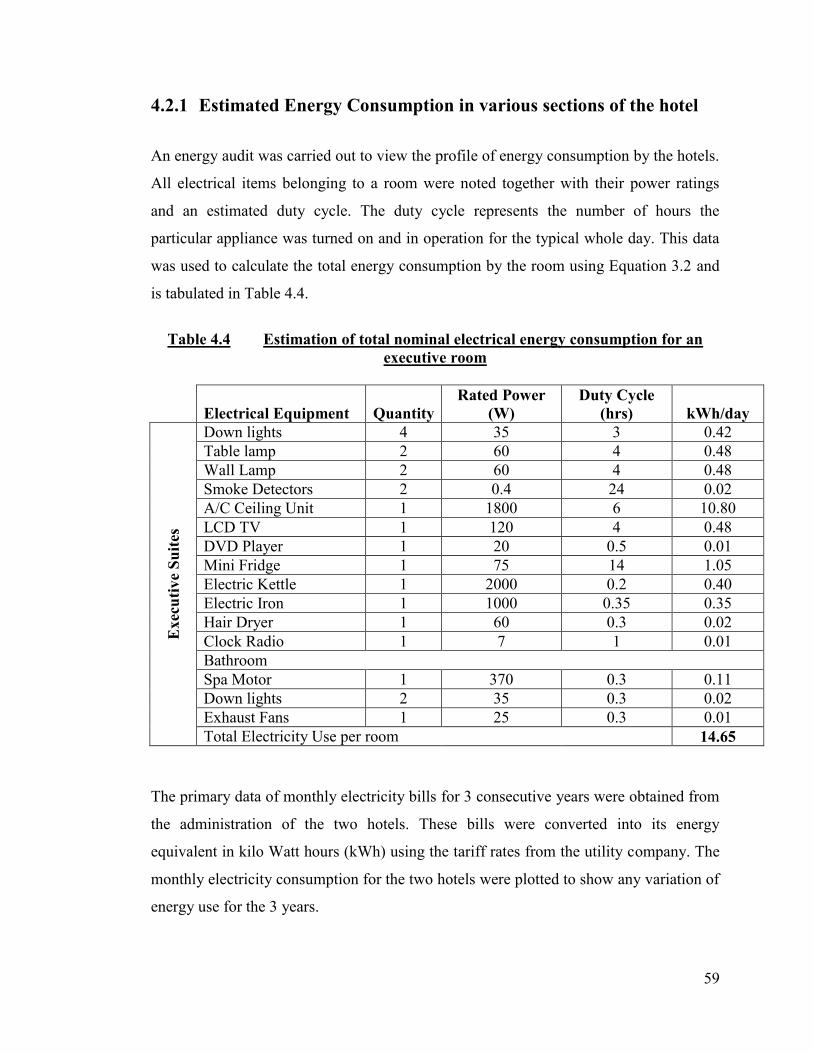
59
4.2.1 Estimated Energy Consumption in various sections of the hotel
An energy audit was carried out to view the profile of energy consumption by the hotels.
All electrical items belonging to a room were noted together with their power ratings
and an estimated duty cycle. The duty cycle represents the number of hours the
particular appliance was turned on and in operation for the typical whole day. This data
was used to calculate the total energy consumption by the room using Equation 3.2 and
is tabulated in Table 4.4.
Table 4.4 Estimation of total nominal electrical energy consumption for an
executive room
Electrical Equipment Quantity
Rated Power
(W)
Duty Cycle
(hrs) kWh/day
Exec
uti
ve
Su
ites
Down lights 4 35 3 0.42
Table lamp 2 60 4 0.48
Wall Lamp 2 60 4 0.48
Smoke Detectors 2 0.4 24 0.02
A/C Ceiling Unit 1 1800 6 10.80
LCD TV 1 120 4 0.48
DVD Player 1 20 0.5 0.01
Mini Fridge 1 75 14 1.05
Electric Kettle 1 2000 0.2 0.40
Electric Iron 1 1000 0.35 0.35
Hair Dryer 1 60 0.3 0.02
Clock Radio 1 7 1 0.01
Bathroom
Spa Motor 1 370 0.3 0.11
Down lights 2 35 0.3 0.02
Exhaust Fans 1 25 0.3 0.01
Total Electricity Use per room 14.65
The primary data of monthly electricity bills for 3 consecutive years were obtained from
the administration of the two hotels. These bills were converted into its energy
equivalent in kilo Watt hours (kWh) using the tariff rates from the utility company. The
monthly electricity consumption for the two hotels were plotted to show any variation of
energy use for the 3 years.
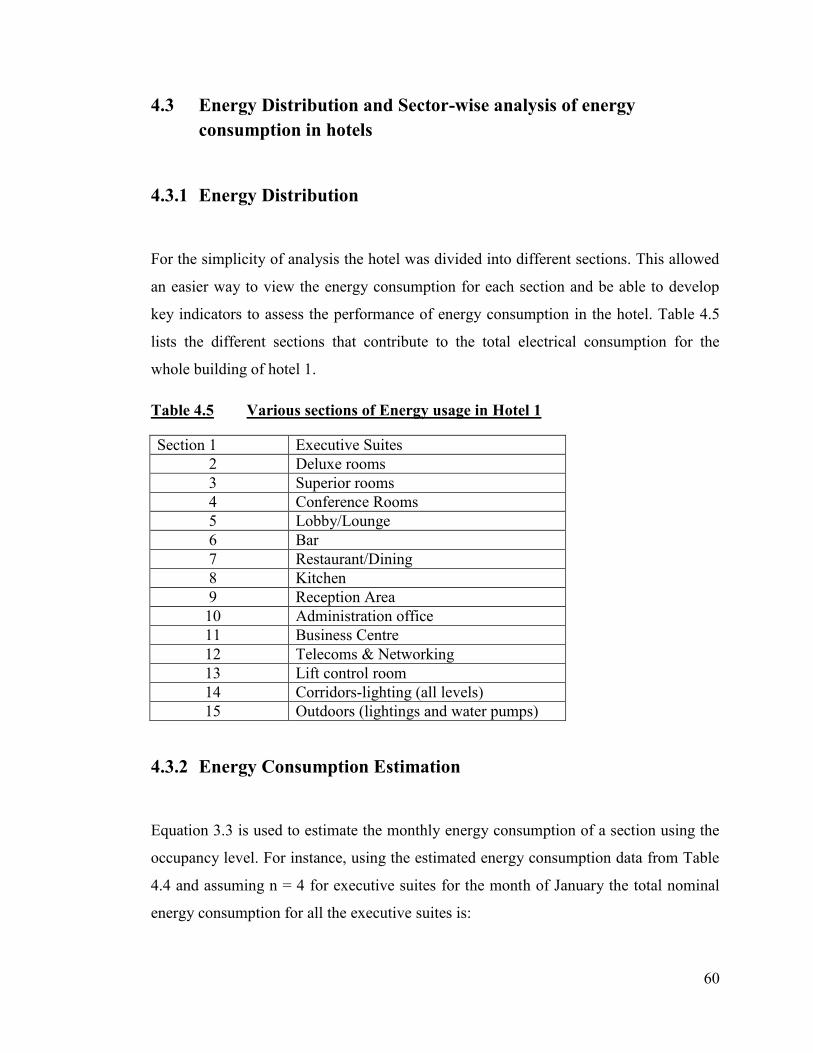
60
4.3 Energy Distribution and Sector-wise analysis of energy
consumption in hotels
4.3.1 Energy Distribution
For the simplicity of analysis the hotel was divided into different sections. This allowed
an easier way to view the energy consumption for each section and be able to develop
key indicators to assess the performance of energy consumption in the hotel. Table 4.5
lists the different sections that contribute to the total electrical consumption for the
whole building of hotel 1.
Table 4.5 Various sections of Energy usage in Hotel 1
Section 1 Executive Suites
2 Deluxe rooms
3 Superior rooms
4 Conference Rooms
5 Lobby/Lounge
6 Bar
7 Restaurant/Dining
8 Kitchen
9 Reception Area
10 Administration office
11 Business Centre
12 Telecoms & Networking
13 Lift control room
14 Corridors-lighting (all levels)
15 Outdoors (lightings and water pumps)
4.3.2 Energy Consumption Estimation
Equation 3.3 is used to estimate the monthly energy consumption of a section using the
occupancy level. For instance, using the estimated energy consumption data from Table
4.4 and assuming n = 4 for executive suites for the month of January the total nominal
energy consumption for all the executive suites is:
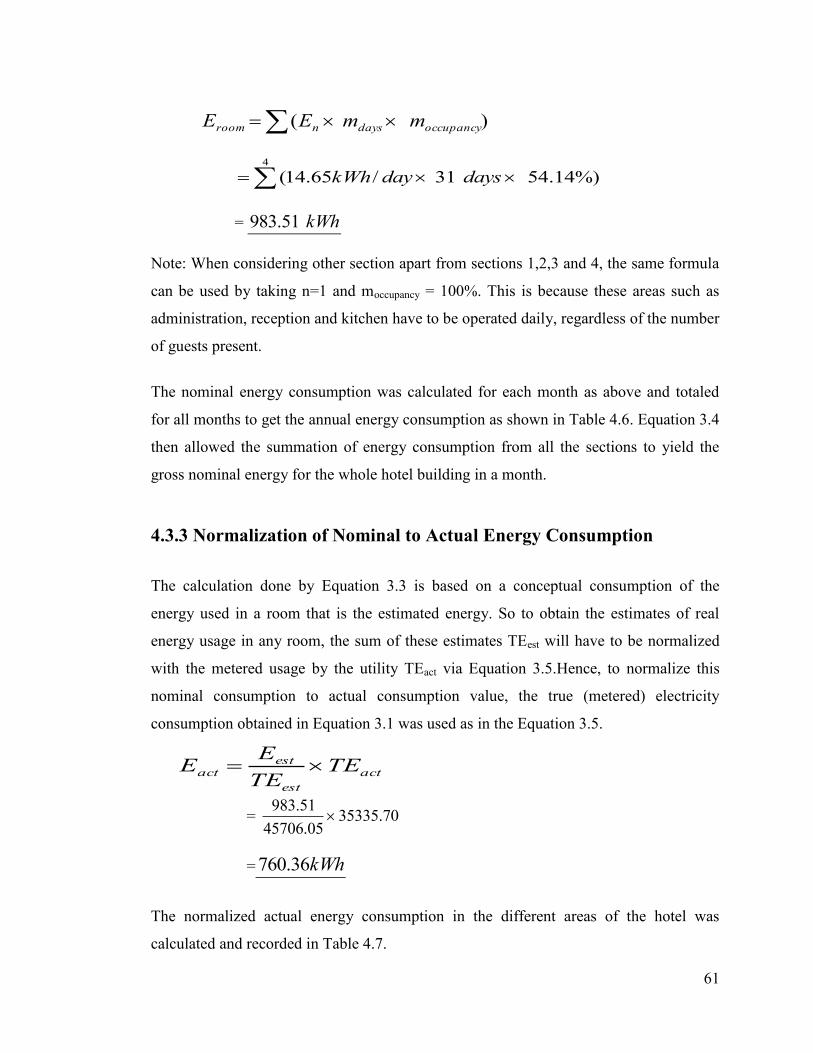
61
)( occupancydaysnroom mmEE
%)14.5431/65.14(4
daysdaykWh
= kWh51.983
Note: When considering other section apart from sections 1,2,3 and 4, the same formula
can be used by taking n=1 and moccupancy = 100%. This is because these areas such as
administration, reception and kitchen have to be operated daily, regardless of the number
of guests present.
The nominal energy consumption was calculated for each month as above and totaled
for all months to get the annual energy consumption as shown in Table 4.6. Equation 3.4
then allowed the summation of energy consumption from all the sections to yield the
gross nominal energy for the whole hotel building in a month.
4.3.3 Normalization of Nominal to Actual Energy Consumption
The calculation done by Equation 3.3 is based on a conceptual consumption of the
energy used in a room that is the estimated energy. So to obtain the estimates of real
energy usage in any room, the sum of these estimates TEest will have to be normalized
with the metered usage by the utility TEact via Equation 3.5.Hence, to normalize this
nominal consumption to actual consumption value, the true (metered) electricity
consumption obtained in Equation 3.1 was used as in the Equation 3.5.
act
est
estact TE
TE
EE
= 70.3533505.45706
51.983
= kWh36.760
The normalized actual energy consumption in the different areas of the hotel was
calculated and recorded in Table 4.7.
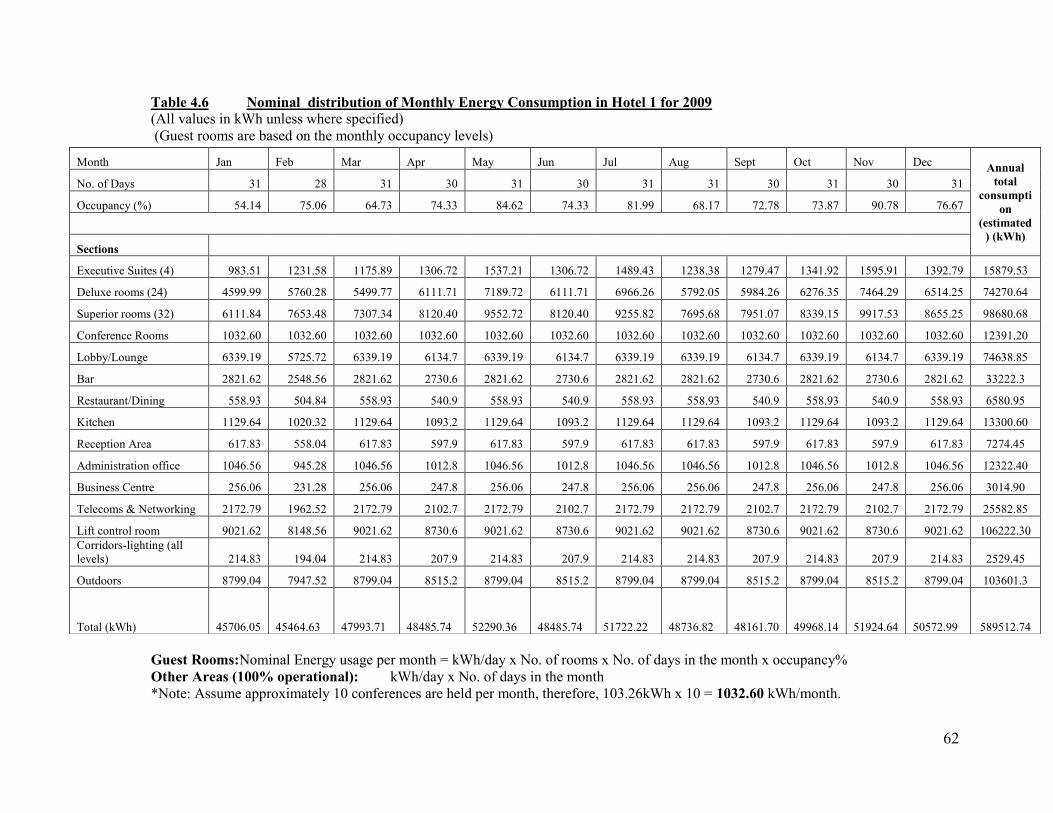
62
Table 4.6 Nominal distribution of Monthly Energy Consumption in Hotel 1 for 2009
(All values in kWh unless where specified)
(Guest rooms are based on the monthly occupancy levels)
Guest Rooms:Nominal Energy usage per month = kWh/day x No. of rooms x No. of days in the month x occupancy%
Other Areas (100% operational): kWh/day x No. of days in the month
*Note: Assume approximately 10 conferences are held per month, therefore, 103.26kWh x 10 = 1032.60 kWh/month.
Month Jan Feb Mar Apr May Jun Jul Aug Sept Oct Nov Dec Annual
total
consumpti
on
(estimated
) (kWh)
No. of Days 31 28 31 30 31 30 31 31 30 31 30 31
Occupancy (%) 54.14 75.06 64.73 74.33 84.62 74.33 81.99 68.17 72.78 73.87 90.78 76.67
Sections
Executive Suites (4) 983.51 1231.58 1175.89 1306.72 1537.21 1306.72 1489.43 1238.38 1279.47 1341.92 1595.91 1392.79 15879.53
Deluxe rooms (24) 4599.99 5760.28 5499.77 6111.71 7189.72 6111.71 6966.26 5792.05 5984.26 6276.35 7464.29 6514.25 74270.64
Superior rooms (32) 6111.84 7653.48 7307.34 8120.40 9552.72 8120.40 9255.82 7695.68 7951.07 8339.15 9917.53 8655.25 98680.68
Conference Rooms 1032.60 1032.60 1032.60 1032.60 1032.60 1032.60 1032.60 1032.60 1032.60 1032.60 1032.60 1032.60 12391.20
Lobby/Lounge 6339.19 5725.72 6339.19 6134.7 6339.19 6134.7 6339.19 6339.19 6134.7 6339.19 6134.7 6339.19 74638.85
Bar 2821.62 2548.56 2821.62 2730.6 2821.62 2730.6 2821.62 2821.62 2730.6 2821.62 2730.6 2821.62 33222.3
Restaurant/Dining 558.93 504.84 558.93 540.9 558.93 540.9 558.93 558.93 540.9 558.93 540.9 558.93 6580.95
Kitchen 1129.64 1020.32 1129.64 1093.2 1129.64 1093.2 1129.64 1129.64 1093.2 1129.64 1093.2 1129.64 13300.60
Reception Area 617.83 558.04 617.83 597.9 617.83 597.9 617.83 617.83 597.9 617.83 597.9 617.83 7274.45
Administration office 1046.56 945.28 1046.56 1012.8 1046.56 1012.8 1046.56 1046.56 1012.8 1046.56 1012.8 1046.56 12322.40
Business Centre 256.06 231.28 256.06 247.8 256.06 247.8 256.06 256.06 247.8 256.06 247.8 256.06 3014.90
Telecoms & Networking 2172.79 1962.52 2172.79 2102.7 2172.79 2102.7 2172.79 2172.79 2102.7 2172.79 2102.7 2172.79 25582.85
Lift control room 9021.62 8148.56 9021.62 8730.6 9021.62 8730.6 9021.62 9021.62 8730.6 9021.62 8730.6 9021.62 106222.30
Corridors-lighting (all
levels) 214.83 194.04 214.83 207.9 214.83 207.9 214.83 214.83 207.9 214.83 207.9 214.83 2529.45
Outdoors 8799.04 7947.52 8799.04 8515.2 8799.04 8515.2 8799.04 8799.04 8515.2 8799.04 8515.2 8799.04 103601.3
Total (kWh) 45706.05 45464.63 47993.71 48485.74 52290.36 48485.74 51722.22 48736.82 48161.70 49968.14 51924.64 50572.99 589512.74
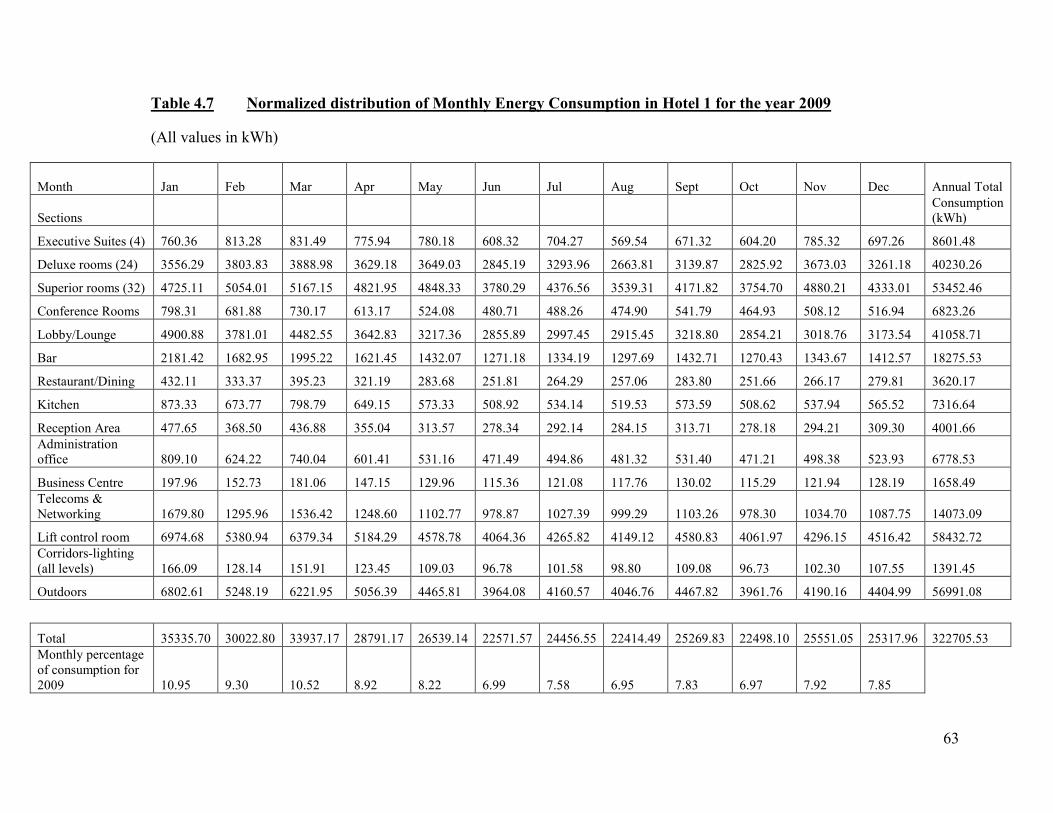
63
Table 4.7 Normalized distribution of Monthly Energy Consumption in Hotel 1 for the year 2009
(All values in kWh)
Month Jan Feb Mar Apr May Jun Jul Aug Sept Oct Nov Dec Annual Total
Sections
Consumption
(kWh)
Executive Suites (4) 760.36 813.28 831.49 775.94 780.18 608.32 704.27 569.54 671.32 604.20 785.32 697.26 8601.48
Deluxe rooms (24) 3556.29 3803.83 3888.98 3629.18 3649.03 2845.19 3293.96 2663.81 3139.87 2825.92 3673.03 3261.18 40230.26
Superior rooms (32) 4725.11 5054.01 5167.15 4821.95 4848.33 3780.29 4376.56 3539.31 4171.82 3754.70 4880.21 4333.01 53452.46
Conference Rooms 798.31 681.88 730.17 613.17 524.08 480.71 488.26 474.90 541.79 464.93 508.12 516.94 6823.26
Lobby/Lounge 4900.88 3781.01 4482.55 3642.83 3217.36 2855.89 2997.45 2915.45 3218.80 2854.21 3018.76 3173.54 41058.71
Bar 2181.42 1682.95 1995.22 1621.45 1432.07 1271.18 1334.19 1297.69 1432.71 1270.43 1343.67 1412.57 18275.53
Restaurant/Dining 432.11 333.37 395.23 321.19 283.68 251.81 264.29 257.06 283.80 251.66 266.17 279.81 3620.17
Kitchen 873.33 673.77 798.79 649.15 573.33 508.92 534.14 519.53 573.59 508.62 537.94 565.52 7316.64
Reception Area 477.65 368.50 436.88 355.04 313.57 278.34 292.14 284.15 313.71 278.18 294.21 309.30 4001.66
Administration
office 809.10 624.22 740.04 601.41 531.16 471.49 494.86 481.32 531.40 471.21 498.38 523.93 6778.53
Business Centre 197.96 152.73 181.06 147.15 129.96 115.36 121.08 117.76 130.02 115.29 121.94 128.19 1658.49
Telecoms &
Networking 1679.80 1295.96 1536.42 1248.60 1102.77 978.87 1027.39 999.29 1103.26 978.30 1034.70 1087.75 14073.09
Lift control room 6974.68 5380.94 6379.34 5184.29 4578.78 4064.36 4265.82 4149.12 4580.83 4061.97 4296.15 4516.42 58432.72
Corridors-lighting
(all levels) 166.09 128.14 151.91 123.45 109.03 96.78 101.58 98.80 109.08 96.73 102.30 107.55 1391.45
Outdoors 6802.61 5248.19 6221.95 5056.39 4465.81 3964.08 4160.57 4046.76 4467.82 3961.76 4190.16 4404.99 56991.08
Total 35335.70 30022.80 33937.17 28791.17 26539.14 22571.57 24456.55 22414.49 25269.83 22498.10 25551.05 25317.96 322705.53
Monthly percentage
of consumption for
2009 10.95 9.30 10.52 8.92 8.22 6.99 7.58 6.95 7.83 6.97 7.92 7.85
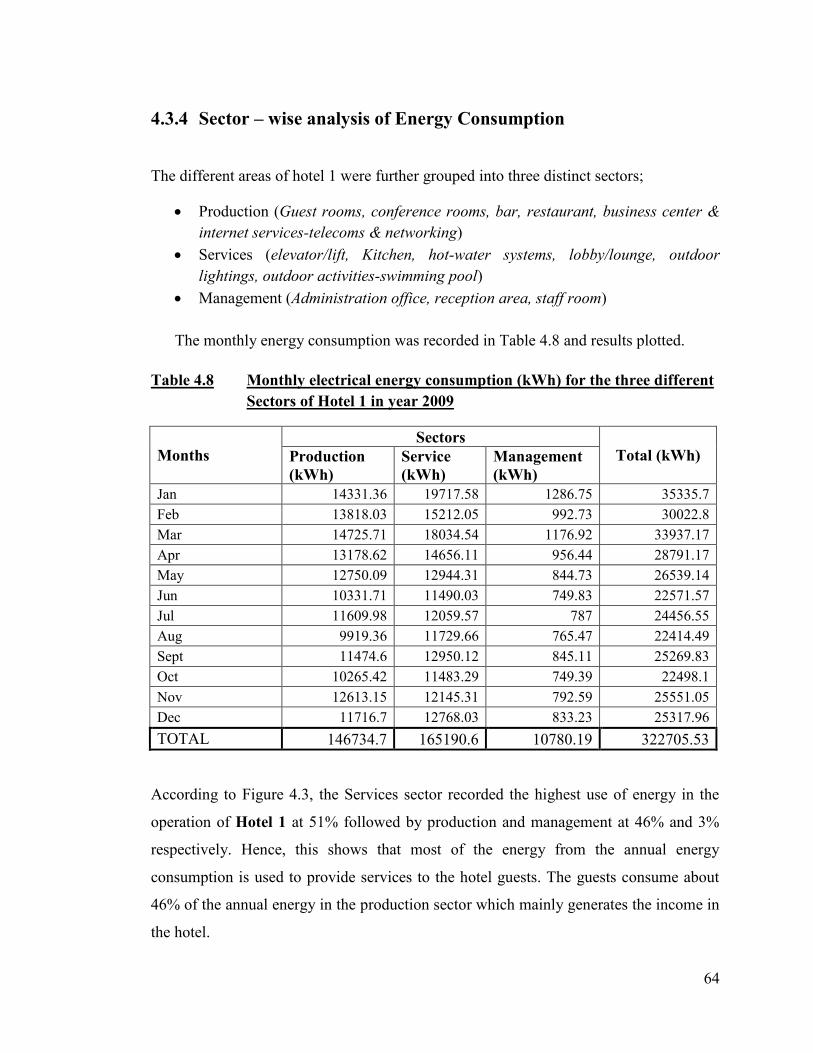
64
4.3.4 Sector – wise analysis of Energy Consumption
The different areas of hotel 1 were further grouped into three distinct sectors;
Production (Guest rooms, conference rooms, bar, restaurant, business center &
internet services-telecoms & networking)
Services (elevator/lift, Kitchen, hot-water systems, lobby/lounge, outdoor
lightings, outdoor activities-swimming pool)
Management (Administration office, reception area, staff room)
The monthly energy consumption was recorded in Table 4.8 and results plotted.
Table 4.8 Monthly electrical energy consumption (kWh) for the three different
Sectors of Hotel 1 in year 2009
Months
Sectors
Total (kWh) Production
(kWh)
Service
(kWh)
Management
(kWh)
Jan 14331.36 19717.58 1286.75 35335.7
Feb 13818.03 15212.05 992.73 30022.8
Mar 14725.71 18034.54 1176.92 33937.17
Apr 13178.62 14656.11 956.44 28791.17
May 12750.09 12944.31 844.73 26539.14
Jun 10331.71 11490.03 749.83 22571.57
Jul 11609.98 12059.57 787 24456.55
Aug 9919.36 11729.66 765.47 22414.49
Sept 11474.6 12950.12 845.11 25269.83
Oct 10265.42 11483.29 749.39 22498.1
Nov 12613.15 12145.31 792.59 25551.05
Dec 11716.7 12768.03 833.23 25317.96
TOTAL 146734.7 165190.6 10780.19 322705.53
According to Figure 4.3, the Services sector recorded the highest use of energy in the
operation of Hotel 1 at 51% followed by production and management at 46% and 3%
respectively. Hence, this shows that most of the energy from the annual energy
consumption is used to provide services to the hotel guests. The guests consume about
46% of the annual energy in the production sector which mainly generates the income in
the hotel.
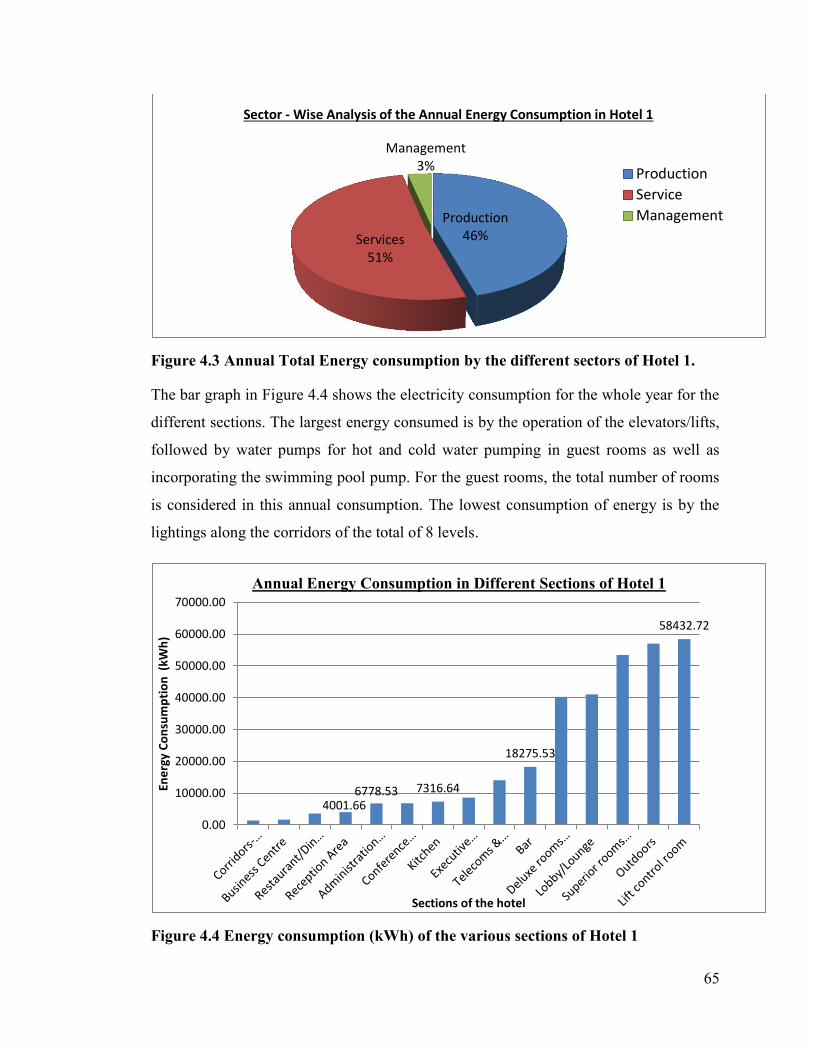
65
Figure 4.3 Annual Total Energy consumption by the different sectors of Hotel 1.
The bar graph in Figure 4.4 shows the electricity consumption for the whole year for the
different sections. The largest energy consumed is by the operation of the elevators/lifts,
followed by water pumps for hot and cold water pumping in guest rooms as well as
incorporating the swimming pool pump. For the guest rooms, the total number of rooms
is considered in this annual consumption. The lowest consumption of energy is by the
lightings along the corridors of the total of 8 levels.
Figure 4.4 Energy consumption (kWh) of the various sections of Hotel 1
Production 46% Services
51%
Management 3%
Sector - Wise Analysis of the Annual Energy Consumption in Hotel 1
Production
Service
Management
4001.66 6778.53 7316.64
18275.53
58432.72
0.00
10000.00
20000.00
30000.00
40000.00
50000.00
60000.00
70000.00
Ene
rgy
Co
nsu
mp
tio
n (
kWh
)
Sections of the hotel
Annual Energy Consumption in Different Sections of Hotel 1
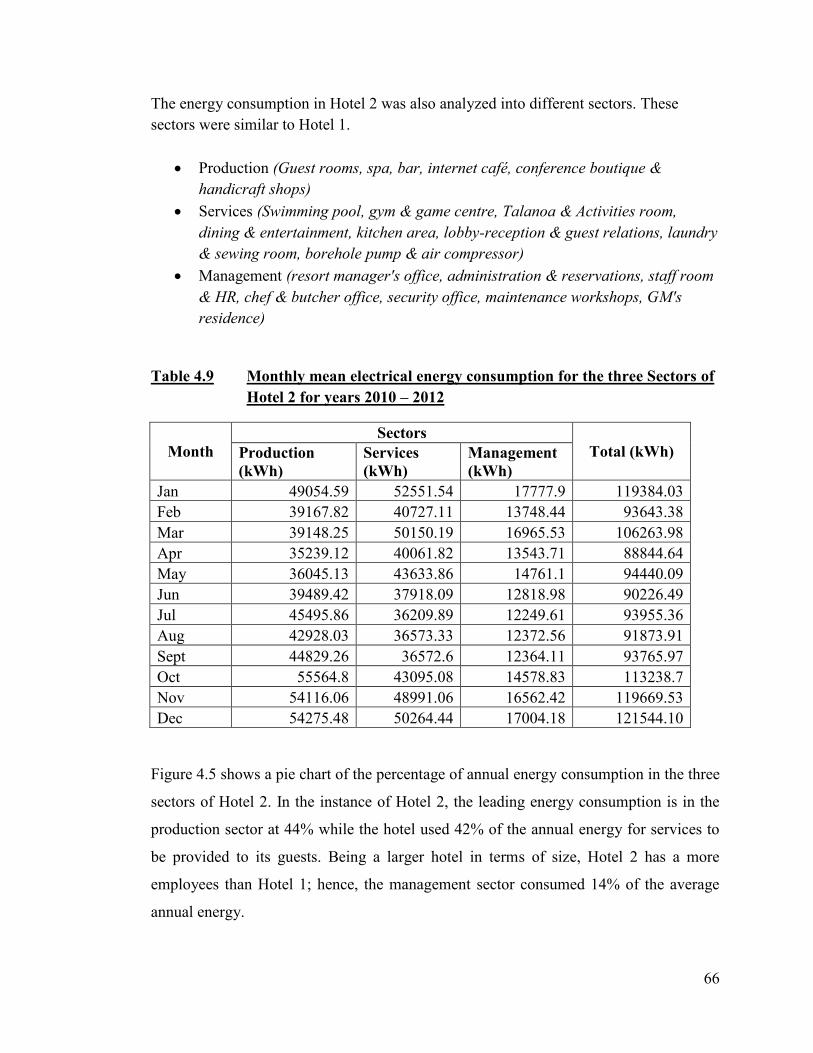
66
The energy consumption in Hotel 2 was also analyzed into different sectors. These
sectors were similar to Hotel 1.
Production (Guest rooms, spa, bar, internet café, conference boutique &
handicraft shops)
Services (Swimming pool, gym & game centre, Talanoa & Activities room,
dining & entertainment, kitchen area, lobby-reception & guest relations, laundry
& sewing room, borehole pump & air compressor)
Management (resort manager's office, administration & reservations, staff room
& HR, chef & butcher office, security office, maintenance workshops, GM's
residence)
Table 4.9 Monthly mean electrical energy consumption for the three Sectors of
Hotel 2 for years 2010 – 2012
Month
Sectors
Total (kWh) Production
(kWh)
Services
(kWh)
Management
(kWh)
Jan 49054.59 52551.54 17777.9 119384.03
Feb 39167.82 40727.11 13748.44 93643.38
Mar 39148.25 50150.19 16965.53 106263.98
Apr 35239.12 40061.82 13543.71 88844.64
May 36045.13 43633.86 14761.1 94440.09
Jun 39489.42 37918.09 12818.98 90226.49
Jul 45495.86 36209.89 12249.61 93955.36
Aug 42928.03 36573.33 12372.56 91873.91
Sept 44829.26 36572.6 12364.11 93765.97
Oct 55564.8 43095.08 14578.83 113238.7
Nov 54116.06 48991.06 16562.42 119669.53
Dec 54275.48 50264.44 17004.18 121544.10
Figure 4.5 shows a pie chart of the percentage of annual energy consumption in the three
sectors of Hotel 2. In the instance of Hotel 2, the leading energy consumption is in the
production sector at 44% while the hotel used 42% of the annual energy for services to
be provided to its guests. Being a larger hotel in terms of size, Hotel 2 has a more
employees than Hotel 1; hence, the management sector consumed 14% of the average
annual energy.
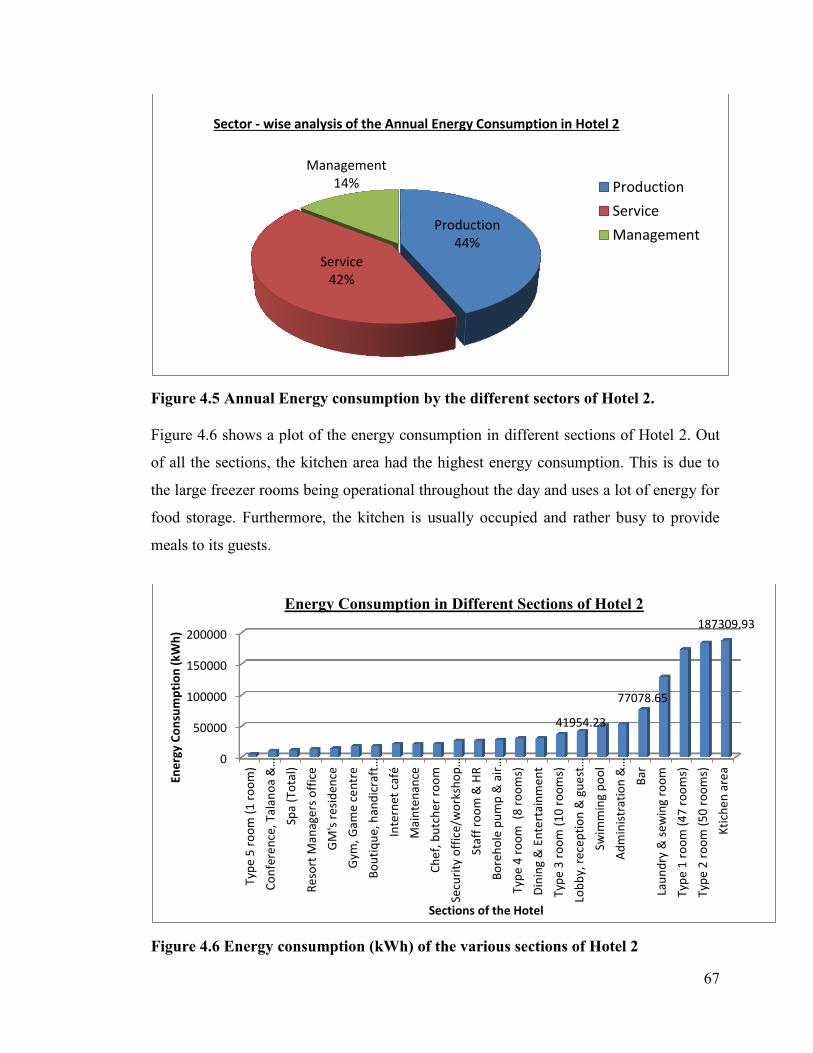
67
Figure 4.5 Annual Energy consumption by the different sectors of Hotel 2.
Figure 4.6 shows a plot of the energy consumption in different sections of Hotel 2. Out
of all the sections, the kitchen area had the highest energy consumption. This is due to
the large freezer rooms being operational throughout the day and uses a lot of energy for
food storage. Furthermore, the kitchen is usually occupied and rather busy to provide
meals to its guests.
Figure 4.6 Energy consumption (kWh) of the various sections of Hotel 2
Production 44%
Service 42%
Management 14%
Sector - wise analysis of the Annual Energy Consumption in Hotel 2
Production
Service
Management
0
50000
100000
150000
200000
Typ
e 5
ro
om
(1
ro
om
)
Co
nfe
ren
ce, T
alan
oa
&…
Spa
(To
tal)
Re
sort
Man
age
rs o
ffic
e
GM
's r
esid
ence
Gym
, Gam
e ce
ntr
e
Bo
uti
qu
e, h
and
icra
ft…
Inte
rnet
caf
é
Mai
nte
nan
ce
Ch
ef,
bu
tch
er
roo
m
Secu
rity
off
ice/
wo
rksh
op
…
Staf
f ro
om
& H
R
Bo
reh
ole
pu
mp
& a
ir…
Typ
e 4
ro
om
(8
ro
om
s)
Din
ing
& E
nte
rtai
nm
en
t
Typ
e 3
ro
om
(1
0 r
oo
ms)
Lob
by,
rec
epti
on
& g
ue
st…
Swim
min
g p
oo
l
Ad
min
istr
atio
n &
…
Bar
Lau
nd
ry &
se
win
g ro
om
Typ
e 1
ro
om
(4
7 r
oo
ms)
Typ
e 2
ro
om
(5
0 r
oo
ms)
Kti
che
n a
rea
41954.23
77078.65
187309.93
Ene
rgy
Co
nsu
mp
tio
n (
kWh
)
Sections of the Hotel
Energy Consumption in Different Sections of Hotel 2
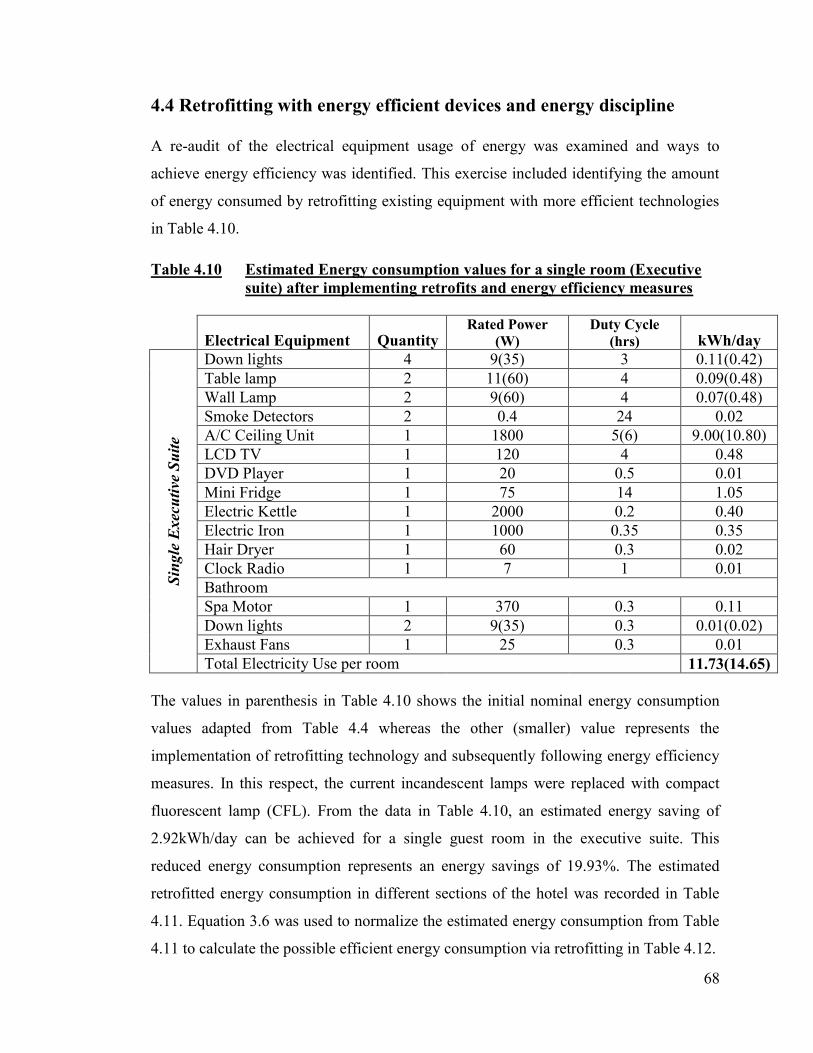
68
4.4 Retrofitting with energy efficient devices and energy discipline
A re-audit of the electrical equipment usage of energy was examined and ways to
achieve energy efficiency was identified. This exercise included identifying the amount
of energy consumed by retrofitting existing equipment with more efficient technologies
in Table 4.10.
Table 4.10 Estimated Energy consumption values for a single room (Executive
suite) after implementing retrofits and energy efficiency measures
Electrical Equipment Quantity Rated Power
(W)
Duty Cycle
(hrs) kWh/day
Sin
gle
Exec
uti
ve S
uit
e
Down lights 4 9(35) 3 0.11(0.42)
Table lamp 2 11(60) 4 0.09(0.48)
Wall Lamp 2 9(60) 4 0.07(0.48)
Smoke Detectors 2 0.4 24 0.02
A/C Ceiling Unit 1 1800 5(6) 9.00(10.80)
LCD TV 1 120 4 0.48
DVD Player 1 20 0.5 0.01
Mini Fridge 1 75 14 1.05
Electric Kettle 1 2000 0.2 0.40
Electric Iron 1 1000 0.35 0.35
Hair Dryer 1 60 0.3 0.02
Clock Radio 1 7 1 0.01
Bathroom
Spa Motor 1 370 0.3 0.11
Down lights 2 9(35) 0.3 0.01(0.02)
Exhaust Fans 1 25 0.3 0.01
Total Electricity Use per room 11.73(14.65)
The values in parenthesis in Table 4.10 shows the initial nominal energy consumption
values adapted from Table 4.4 whereas the other (smaller) value represents the
implementation of retrofitting technology and subsequently following energy efficiency
measures. In this respect, the current incandescent lamps were replaced with compact
fluorescent lamp (CFL). From the data in Table 4.10, an estimated energy saving of
2.92kWh/day can be achieved for a single guest room in the executive suite. This
reduced energy consumption represents an energy savings of 19.93%. The estimated
retrofitted energy consumption in different sections of the hotel was recorded in Table
4.11. Equation 3.6 was used to normalize the estimated energy consumption from Table
4.11 to calculate the possible efficient energy consumption via retrofitting in Table 4.12.
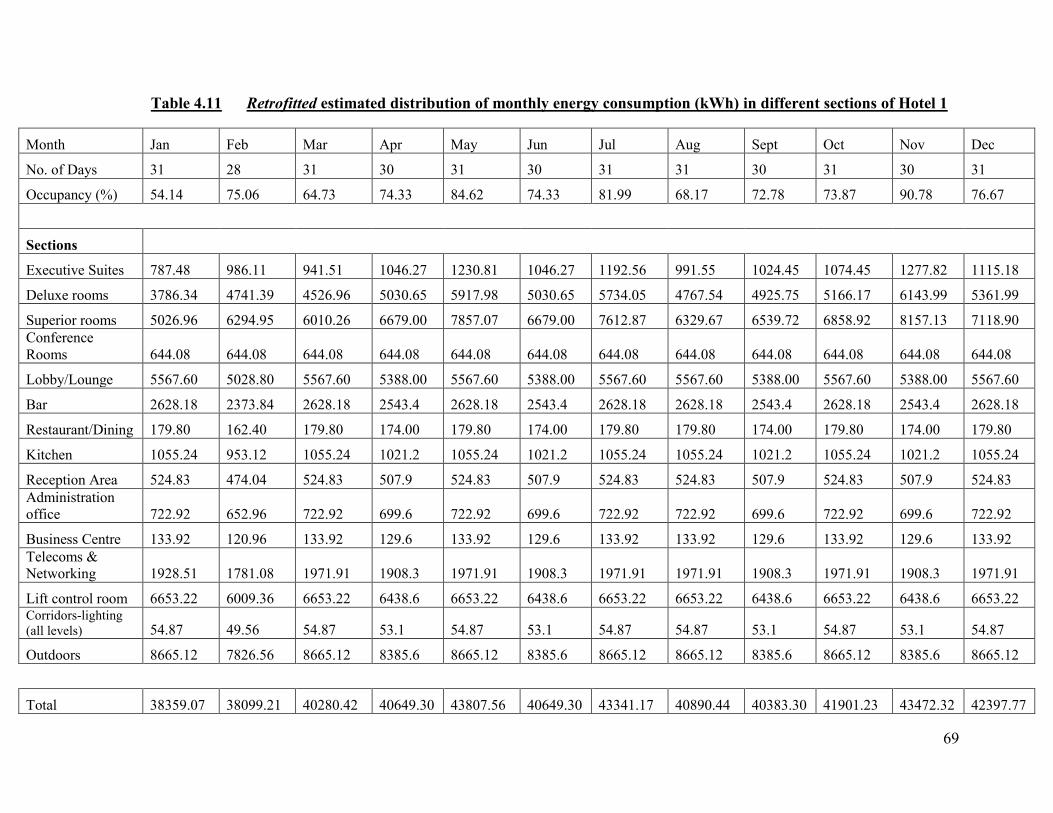
69
Table 4.11 Retrofitted estimated distribution of monthly energy consumption (kWh) in different sections of Hotel 1
Month Jan Feb Mar Apr May Jun Jul Aug Sept Oct Nov Dec
No. of Days 31 28 31 30 31 30 31 31 30 31 30 31
Occupancy (%) 54.14 75.06 64.73 74.33 84.62 74.33 81.99 68.17 72.78 73.87 90.78 76.67
Sections
Executive Suites 787.48 986.11 941.51 1046.27 1230.81 1046.27 1192.56 991.55 1024.45 1074.45 1277.82 1115.18
Deluxe rooms 3786.34 4741.39 4526.96 5030.65 5917.98 5030.65 5734.05 4767.54 4925.75 5166.17 6143.99 5361.99
Superior rooms 5026.96 6294.95 6010.26 6679.00 7857.07 6679.00 7612.87 6329.67 6539.72 6858.92 8157.13 7118.90
Conference
Rooms 644.08 644.08 644.08 644.08 644.08 644.08 644.08 644.08 644.08 644.08 644.08 644.08
Lobby/Lounge 5567.60 5028.80 5567.60 5388.00 5567.60 5388.00 5567.60 5567.60 5388.00 5567.60 5388.00 5567.60
Bar 2628.18 2373.84 2628.18 2543.4 2628.18 2543.4 2628.18 2628.18 2543.4 2628.18 2543.4 2628.18
Restaurant/Dining 179.80 162.40 179.80 174.00 179.80 174.00 179.80 179.80 174.00 179.80 174.00 179.80
Kitchen 1055.24 953.12 1055.24 1021.2 1055.24 1021.2 1055.24 1055.24 1021.2 1055.24 1021.2 1055.24
Reception Area 524.83 474.04 524.83 507.9 524.83 507.9 524.83 524.83 507.9 524.83 507.9 524.83
Administration
office 722.92 652.96 722.92 699.6 722.92 699.6 722.92 722.92 699.6 722.92 699.6 722.92
Business Centre 133.92 120.96 133.92 129.6 133.92 129.6 133.92 133.92 129.6 133.92 129.6 133.92
Telecoms &
Networking 1928.51 1781.08 1971.91 1908.3 1971.91 1908.3 1971.91 1971.91 1908.3 1971.91 1908.3 1971.91
Lift control room 6653.22 6009.36 6653.22 6438.6 6653.22 6438.6 6653.22 6653.22 6438.6 6653.22 6438.6 6653.22 Corridors-lighting
(all levels) 54.87 49.56 54.87 53.1 54.87 53.1 54.87 54.87 53.1 54.87 53.1 54.87
Outdoors 8665.12 7826.56 8665.12 8385.6 8665.12 8385.6 8665.12 8665.12 8385.6 8665.12 8385.6 8665.12
Total 38359.07 38099.21 40280.42 40649.30 43807.56 40649.30 43341.17 40890.44 40383.30 41901.23 43472.32 42397.77
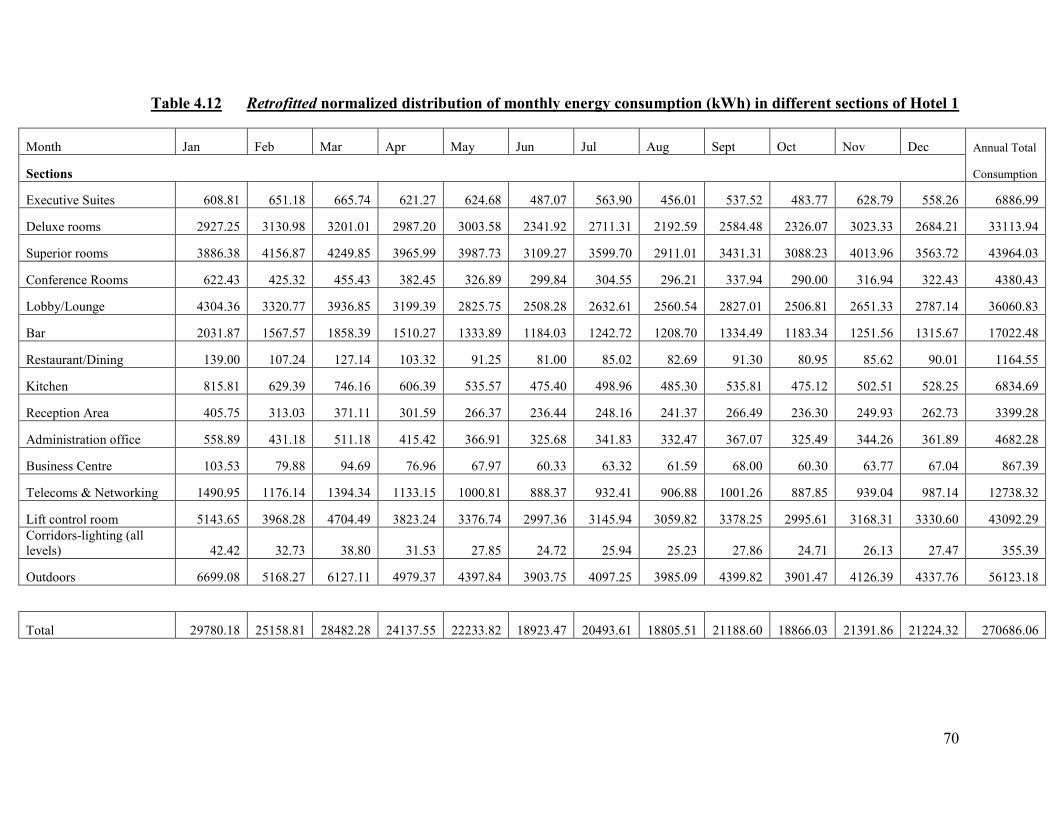
70
Table 4.12 Retrofitted normalized distribution of monthly energy consumption (kWh) in different sections of Hotel 1
Month Jan Feb Mar Apr May Jun Jul Aug Sept Oct Nov Dec Annual Total
Sections
Consumption
Executive Suites 608.81 651.18 665.74 621.27 624.68 487.07 563.90 456.01 537.52 483.77 628.79 558.26 6886.99
Deluxe rooms 2927.25 3130.98 3201.01 2987.20 3003.58 2341.92 2711.31 2192.59 2584.48 2326.07 3023.33 2684.21 33113.94
Superior rooms 3886.38 4156.87 4249.85 3965.99 3987.73 3109.27 3599.70 2911.01 3431.31 3088.23 4013.96 3563.72 43964.03
Conference Rooms 622.43 425.32 455.43 382.45 326.89 299.84 304.55 296.21 337.94 290.00 316.94 322.43 4380.43
Lobby/Lounge 4304.36 3320.77 3936.85 3199.39 2825.75 2508.28 2632.61 2560.54 2827.01 2506.81 2651.33 2787.14 36060.83
Bar 2031.87 1567.57 1858.39 1510.27 1333.89 1184.03 1242.72 1208.70 1334.49 1183.34 1251.56 1315.67 17022.48
Restaurant/Dining 139.00 107.24 127.14 103.32 91.25 81.00 85.02 82.69 91.30 80.95 85.62 90.01 1164.55
Kitchen 815.81 629.39 746.16 606.39 535.57 475.40 498.96 485.30 535.81 475.12 502.51 528.25 6834.69
Reception Area 405.75 313.03 371.11 301.59 266.37 236.44 248.16 241.37 266.49 236.30 249.93 262.73 3399.28
Administration office 558.89 431.18 511.18 415.42 366.91 325.68 341.83 332.47 367.07 325.49 344.26 361.89 4682.28
Business Centre 103.53 79.88 94.69 76.96 67.97 60.33 63.32 61.59 68.00 60.30 63.77 67.04 867.39
Telecoms & Networking 1490.95 1176.14 1394.34 1133.15 1000.81 888.37 932.41 906.88 1001.26 887.85 939.04 987.14 12738.32
Lift control room 5143.65 3968.28 4704.49 3823.24 3376.74 2997.36 3145.94 3059.82 3378.25 2995.61 3168.31 3330.60 43092.29
Corridors-lighting (all
levels) 42.42 32.73 38.80 31.53 27.85 24.72 25.94 25.23 27.86 24.71 26.13 27.47 355.39
Outdoors 6699.08 5168.27 6127.11 4979.37 4397.84 3903.75 4097.25 3985.09 4399.82 3901.47 4126.39 4337.76 56123.18
Total 29780.18 25158.81 28482.28 24137.55 22233.82 18923.47 20493.61 18805.51 21188.60 18866.03 21391.86 21224.32 270686.06
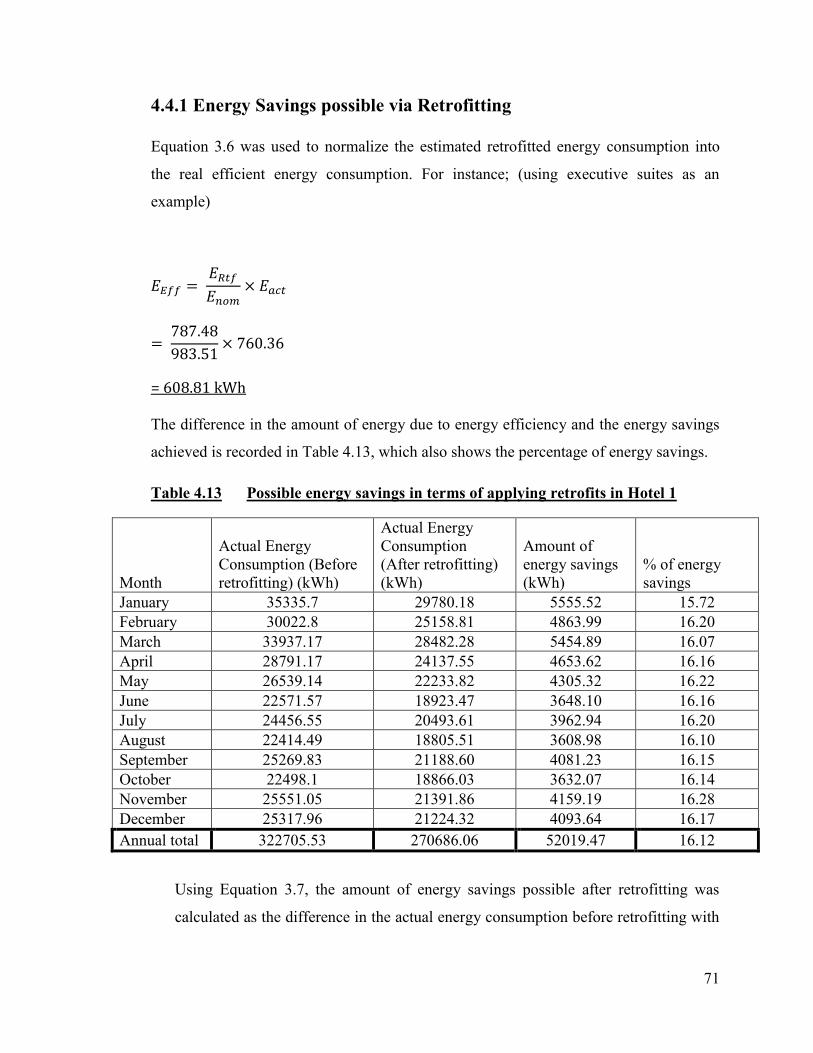
71
4.4.1 Energy Savings possible via Retrofitting
Equation 3.6 was used to normalize the estimated retrofitted energy consumption into
the real efficient energy consumption. For instance; (using executive suites as an
example)
= 608.81 kWh
The difference in the amount of energy due to energy efficiency and the energy savings
achieved is recorded in Table 4.13, which also shows the percentage of energy savings.
Table 4.13 Possible energy savings in terms of applying retrofits in Hotel 1
Month
Actual Energy
Consumption (Before
retrofitting) (kWh)
Actual Energy
Consumption
(After retrofitting)
(kWh)
Amount of
energy savings
(kWh)
% of energy
savings
January 35335.7 29780.18 5555.52 15.72
February 30022.8 25158.81 4863.99 16.20
March 33937.17 28482.28 5454.89 16.07
April 28791.17 24137.55 4653.62 16.16
May 26539.14 22233.82 4305.32 16.22
June 22571.57 18923.47 3648.10 16.16
July 24456.55 20493.61 3962.94 16.20
August 22414.49 18805.51 3608.98 16.10
September 25269.83 21188.60 4081.23 16.15
October 22498.1 18866.03 3632.07 16.14
November 25551.05 21391.86 4159.19 16.28
December 25317.96 21224.32 4093.64 16.17
Annual total 322705.53 270686.06 52019.47 16.12
Using Equation 3.7, the amount of energy savings possible after retrofitting was
calculated as the difference in the actual energy consumption before retrofitting with
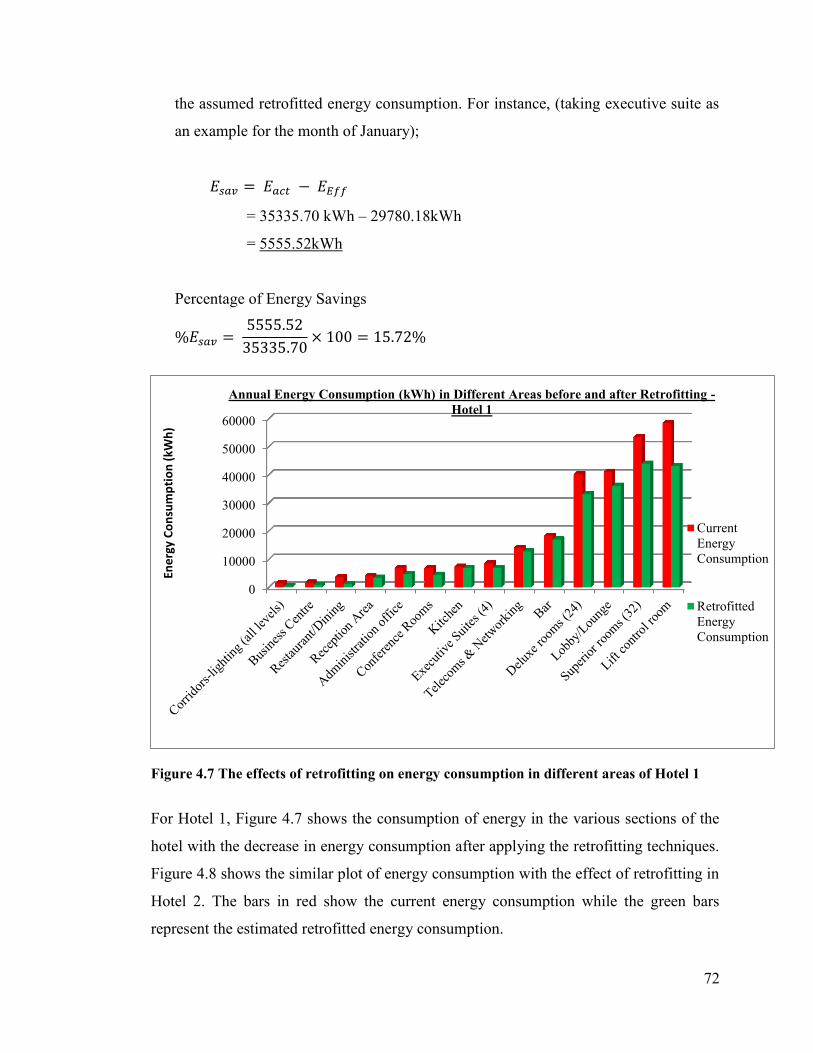
72
the assumed retrofitted energy consumption. For instance, (taking executive suite as
an example for the month of January);
= 35335.70 kWh – 29780.18kWh
= 5555.52kWh
Percentage of Energy Savings
Figure 4.7 The effects of retrofitting on energy consumption in different areas of Hotel 1
For Hotel 1, Figure 4.7 shows the consumption of energy in the various sections of the
hotel with the decrease in energy consumption after applying the retrofitting techniques.
Figure 4.8 shows the similar plot of energy consumption with the effect of retrofitting in
Hotel 2. The bars in red show the current energy consumption while the green bars
represent the estimated retrofitted energy consumption.
0
10000
20000
30000
40000
50000
60000
Ene
rgy
Co
nsu
mp
tio
n (
kWh
)
Annual Energy Consumption (kWh) in Different Areas before and after Retrofitting -
Hotel 1
Current
Energy
Consumption
Retrofitted
Energy
Consumption
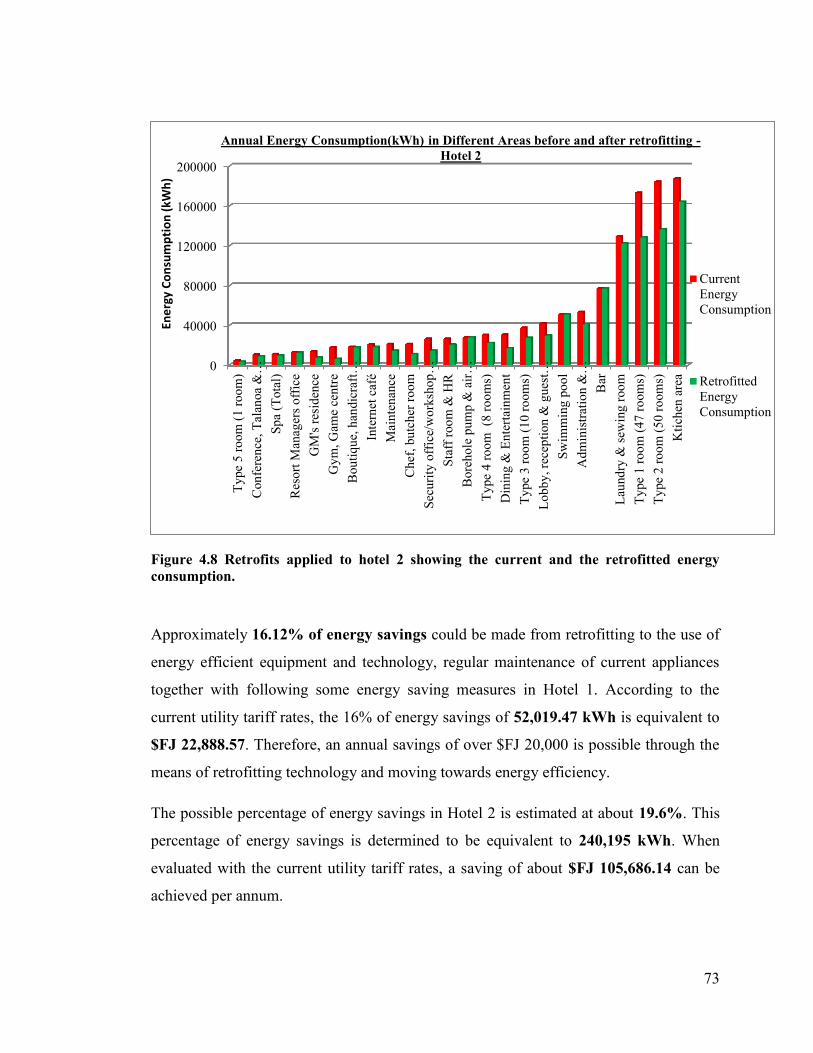
73
Figure 4.8 Retrofits applied to hotel 2 showing the current and the retrofitted energy
consumption.
Approximately 16.12% of energy savings could be made from retrofitting to the use of
energy efficient equipment and technology, regular maintenance of current appliances
together with following some energy saving measures in Hotel 1. According to the
current utility tariff rates, the 16% of energy savings of 52,019.47 kWh is equivalent to
$FJ 22,888.57. Therefore, an annual savings of over $FJ 20,000 is possible through the
means of retrofitting technology and moving towards energy efficiency.
The possible percentage of energy savings in Hotel 2 is estimated at about 19.6%. This
percentage of energy savings is determined to be equivalent to 240,195 kWh. When
evaluated with the current utility tariff rates, a saving of about $FJ 105,686.14 can be
achieved per annum.
0
40000
80000
120000
160000
200000
Ty
pe
5 r
oo
m (
1 r
oo
m)
Con
fere
nce
, T
alan
oa
&…
Sp
a (T
ota
l)
Res
ort
Man
ager
s o
ffic
e
GM
's r
esid
ence
Gy
m, G
ame
cen
tre
Bou
tiq
ue,
han
dic
raft
…
Inte
rnet
caf
é
Mai
nte
nan
ce
Chef
, bu
tch
er r
oo
m
Sec
uri
ty o
ffic
e/w
ork
sho
p…
Sta
ff r
oo
m &
HR
Bore
hole
pu
mp &
air
…
Ty
pe
4 r
oo
m (8
ro
om
s)
Din
ing
& E
nte
rtai
nm
ent
Ty
pe
3 r
oo
m (
10 r
oom
s)
Lo
bb
y, re
cep
tio
n &
gues
t…
Sw
imm
ing
po
ol
Ad
min
istr
atio
n &
…
Bar
Lau
nd
ry &
sew
ing
roo
m
Ty
pe
1 r
oo
m (
47 r
oom
s)
Ty
pe
2 r
oo
m (
50 r
oom
s)
Kti
chen
are
a
Ene
rgy
Co
nsu
mp
tio
n (
kWh
)
Annual Energy Consumption(kWh) in Different Areas before and after retrofitting -
Hotel 2
Current
Energy
Consumption
Retrofitted
Energy
Consumption
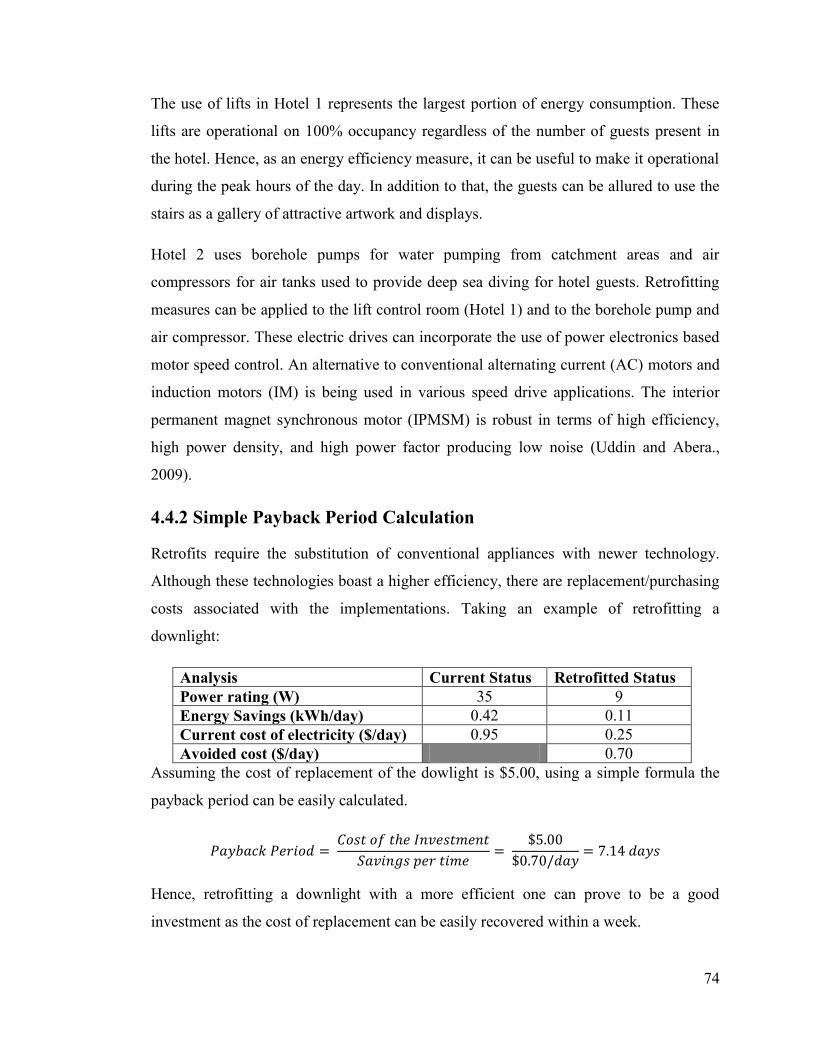
74
The use of lifts in Hotel 1 represents the largest portion of energy consumption. These
lifts are operational on 100% occupancy regardless of the number of guests present in
the hotel. Hence, as an energy efficiency measure, it can be useful to make it operational
during the peak hours of the day. In addition to that, the guests can be allured to use the
stairs as a gallery of attractive artwork and displays.
Hotel 2 uses borehole pumps for water pumping from catchment areas and air
compressors for air tanks used to provide deep sea diving for hotel guests. Retrofitting
measures can be applied to the lift control room (Hotel 1) and to the borehole pump and
air compressor. These electric drives can incorporate the use of power electronics based
motor speed control. An alternative to conventional alternating current (AC) motors and
induction motors (IM) is being used in various speed drive applications. The interior
permanent magnet synchronous motor (IPMSM) is robust in terms of high efficiency,
high power density, and high power factor producing low noise (Uddin and Abera.,
2009).
4.4.2 Simple Payback Period Calculation
Retrofits require the substitution of conventional appliances with newer technology.
Although these technologies boast a higher efficiency, there are replacement/purchasing
costs associated with the implementations. Taking an example of retrofitting a
downlight:
Analysis Current Status Retrofitted Status
Power rating (W) 35 9
Energy Savings (kWh/day) 0.42 0.11
Current cost of electricity ($/day) 0.95 0.25
Avoided cost ($/day) 0.70
Assuming the cost of replacement of the dowlight is $5.00, using a simple formula the
payback period can be easily calculated.
Hence, retrofitting a downlight with a more efficient one can prove to be a good
investment as the cost of replacement can be easily recovered within a week.
75
4.5 Fuel Savings and Carbon Emission reduction
There are significant benefits of applying energy efficiency techniques in energy
consuming devices. These energy performance strategies benefit the organization by
reducing its energy bill. Since the energy consumption is reduced by the organization,
this in turns allows for lower fuel consumption by the utility company (The Fiji
Electricity Authority) to meet the energy demands of its consumers. With the decrease in
fuel consumption, there are reductions in carbon and other GHG emissions.
4.5.1 Estimated Fuel (Diesel) savings
The energy saved in kWh can be converted to Mega Joules. The calorific value for
diesel is accepted as 38 MJ/L. Using this figure, the ideal volume of diesel saved as a
result of energy saved can be calculated using equation 3.9.
The volume of diesel saved also depends on the operational efficiency of the diesel
generators. If the efficiency of the generators is known, a more accurate value of the
diesel savings can be calculated. After determining the volume of the diesel, the
equivalent mass of diesel can be calculated using the density as 0.832kg/L.
For instance;
In the case of Hotel 1, from Table 4.13, the energy saved per annum after retrofitting is
52,019.47 kWh which equates to 187,270.092 MJ. Therefore, using the calorific value of
diesel as 38 MJ/l, the volume of diesel in liters consumed can be calculated. Hence,
4928.16 litres of diesel can be ideally saved. Additionally, there are always some losses
in the diesel generator system since the generators have an efficiency rating. Thus, the
power input to a system is always greater than the useful power output. Assuming, the
generator is operating at an efficiency of 55 – 75%, thus the total volume of diesel saved
is approximately between 7638.65L to 8624.28L.Similarly, taking the same efficiency
level for Hotel 2, the volume of diesel saved is between 35270.85L to 39821.93L.
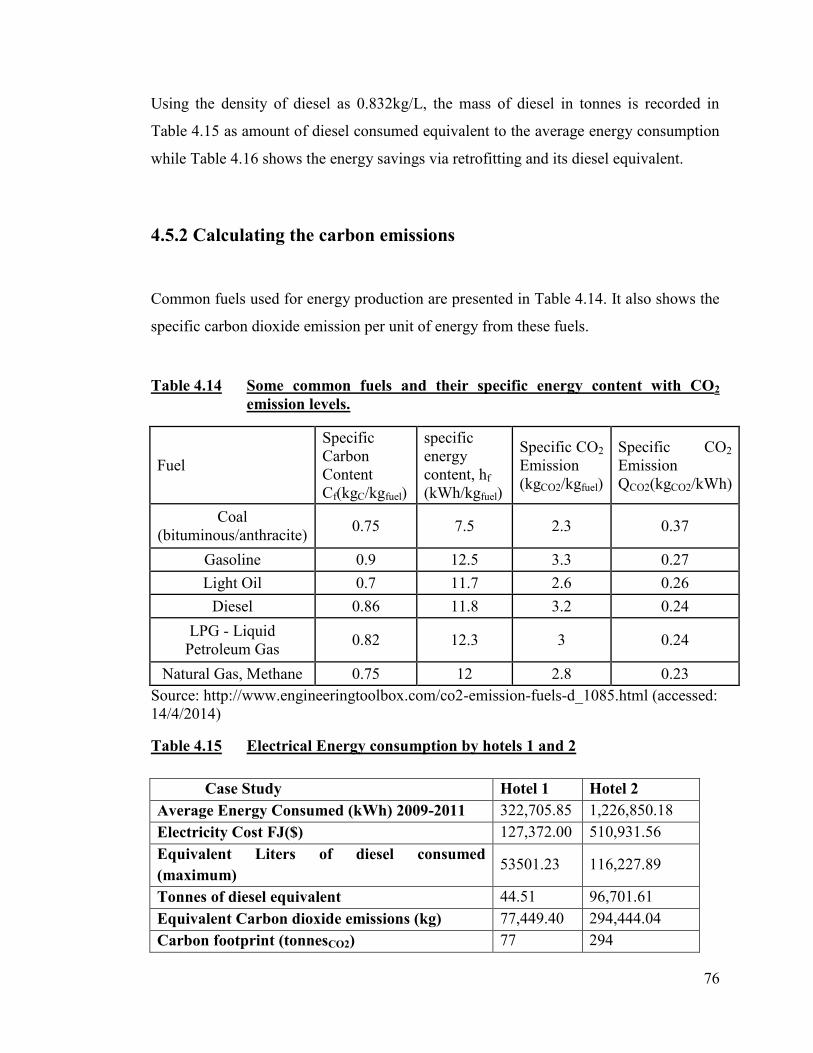
76
Using the density of diesel as 0.832kg/L, the mass of diesel in tonnes is recorded in
Table 4.15 as amount of diesel consumed equivalent to the average energy consumption
while Table 4.16 shows the energy savings via retrofitting and its diesel equivalent.
4.5.2 Calculating the carbon emissions
Common fuels used for energy production are presented in Table 4.14. It also shows the
specific carbon dioxide emission per unit of energy from these fuels.
Table 4.14 Some common fuels and their specific energy content with CO2
emission levels.
Fuel
Specific
Carbon
Content
Cf(kgC/kgfuel)
specific
energy
content, hf
(kWh/kgfuel)
Specific CO2
Emission
(kgCO2/kgfuel)
Specific CO2
Emission
QCO2(kgCO2/kWh)
Coal
(bituminous/anthracite) 0.75 7.5 2.3 0.37
Gasoline 0.9 12.5 3.3 0.27
Light Oil 0.7 11.7 2.6 0.26
Diesel 0.86 11.8 3.2 0.24
LPG - Liquid
Petroleum Gas 0.82 12.3 3 0.24
Natural Gas, Methane 0.75 12 2.8 0.23
Source: http://www.engineeringtoolbox.com/co2-emission-fuels-d_1085.html (accessed:
14/4/2014)
Table 4.15 Electrical Energy consumption by hotels 1 and 2
Case Study Hotel 1 Hotel 2
Average Energy Consumed (kWh) 2009-2011 322,705.85 1,226,850.18
Electricity Cost FJ($) 127,372.00 510,931.56
Equivalent Liters of diesel consumed
(maximum) 53501.23 116,227.89
Tonnes of diesel equivalent 44.51 96,701.61
Equivalent Carbon dioxide emissions (kg) 77,449.40 294,444.04
Carbon footprint (tonnesCO2) 77 294
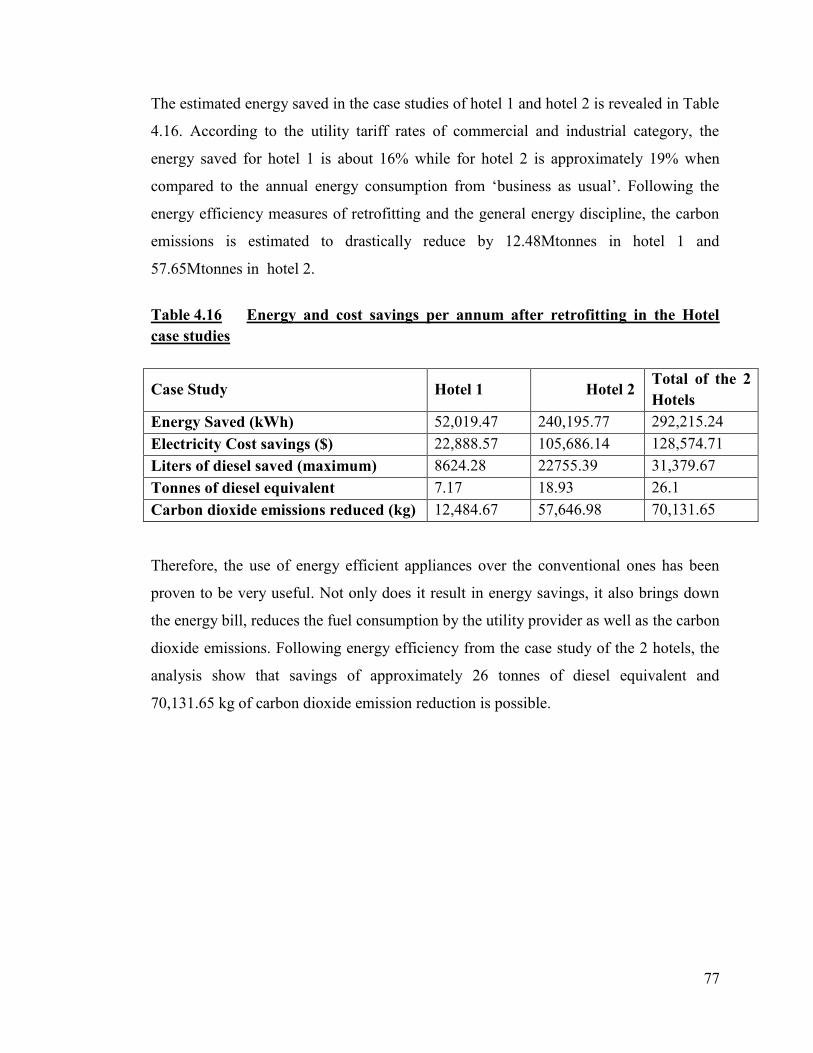
77
The estimated energy saved in the case studies of hotel 1 and hotel 2 is revealed in Table
4.16. According to the utility tariff rates of commercial and industrial category, the
energy saved for hotel 1 is about 16% while for hotel 2 is approximately 19% when
compared to the annual energy consumption from ‗business as usual‘. Following the
energy efficiency measures of retrofitting and the general energy discipline, the carbon
emissions is estimated to drastically reduce by 12.48Mtonnes in hotel 1 and
57.65Mtonnes in hotel 2.
Table 4.16 Energy and cost savings per annum after retrofitting in the Hotel
case studies
Case Study Hotel 1 Hotel 2 Total of the 2
Hotels
Energy Saved (kWh) 52,019.47 240,195.77 292,215.24
Electricity Cost savings ($) 22,888.57 105,686.14 128,574.71
Liters of diesel saved (maximum) 8624.28 22755.39 31,379.67
Tonnes of diesel equivalent 7.17 18.93 26.1
Carbon dioxide emissions reduced (kg) 12,484.67 57,646.98 70,131.65
Therefore, the use of energy efficient appliances over the conventional ones has been
proven to be very useful. Not only does it result in energy savings, it also brings down
the energy bill, reduces the fuel consumption by the utility provider as well as the carbon
dioxide emissions. Following energy efficiency from the case study of the 2 hotels, the
analysis show that savings of approximately 26 tonnes of diesel equivalent and
70,131.65 kg of carbon dioxide emission reduction is possible.
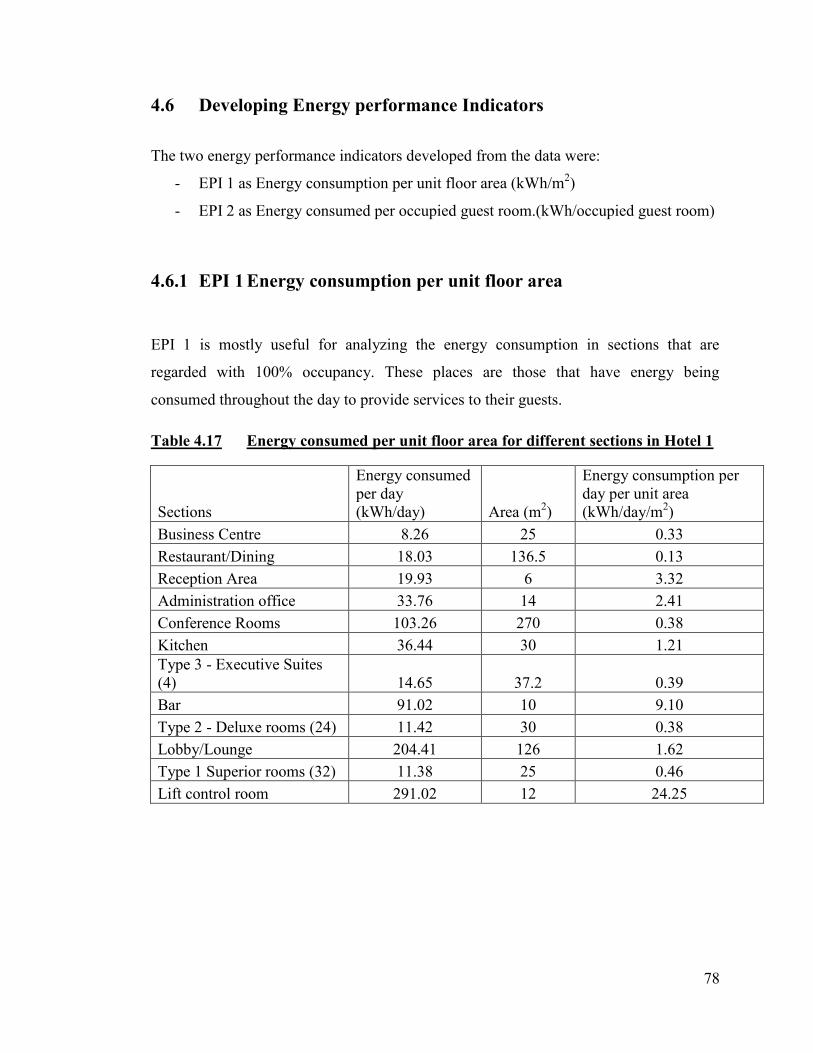
78
4.6 Developing Energy performance Indicators
The two energy performance indicators developed from the data were:
- EPI 1 as Energy consumption per unit floor area (kWh/m2)
- EPI 2 as Energy consumed per occupied guest room.(kWh/occupied guest room)
4.6.1 EPI 1 Energy consumption per unit floor area
EPI 1 is mostly useful for analyzing the energy consumption in sections that are
regarded with 100% occupancy. These places are those that have energy being
consumed throughout the day to provide services to their guests.
Table 4.17 Energy consumed per unit floor area for different sections in Hotel 1
Sections
Energy consumed
per day
(kWh/day) Area (m2)
Energy consumption per
day per unit area
(kWh/day/m2)
Business Centre 8.26 25 0.33
Restaurant/Dining 18.03 136.5 0.13
Reception Area 19.93 6 3.32
Administration office 33.76 14 2.41
Conference Rooms 103.26 270 0.38
Kitchen 36.44 30 1.21
Type 3 - Executive Suites
(4) 14.65 37.2 0.39
Bar 91.02 10 9.10
Type 2 - Deluxe rooms (24) 11.42 30 0.38
Lobby/Lounge 204.41 126 1.62
Type 1 Superior rooms (32) 11.38 25 0.46
Lift control room 291.02 12 24.25
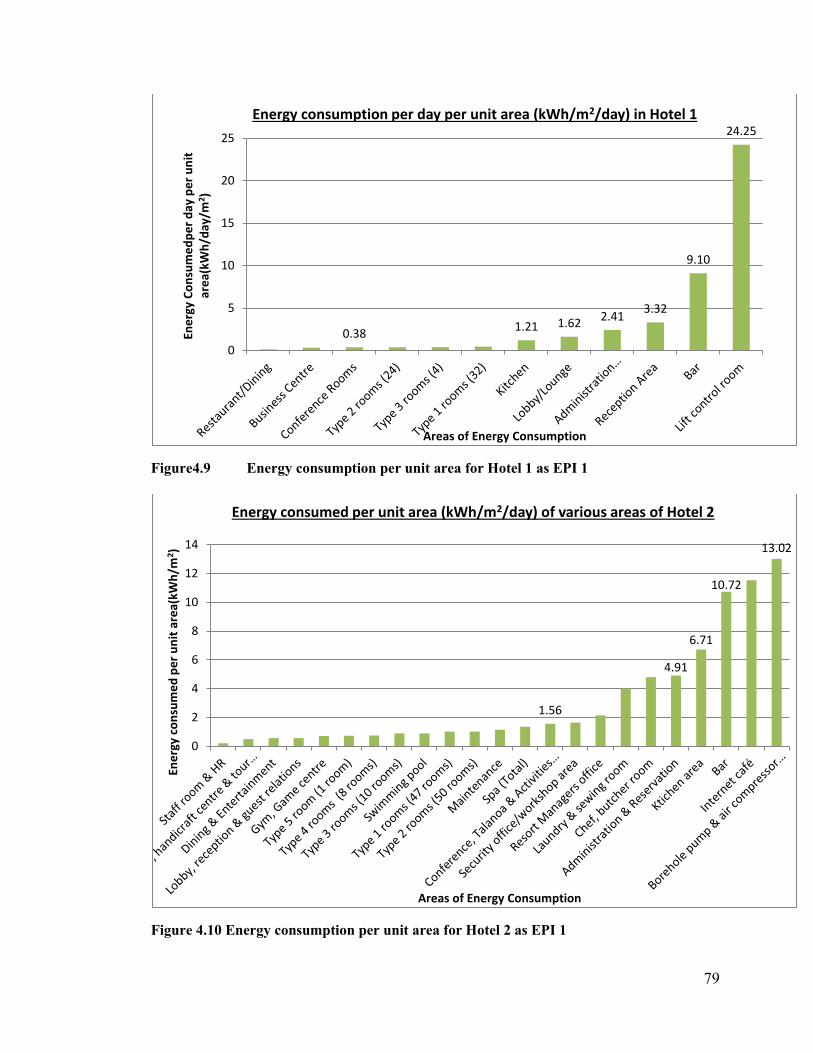
79
Figure4.9 Energy consumption per unit area for Hotel 1 as EPI 1
Figure 4.10 Energy consumption per unit area for Hotel 2 as EPI 1
0.38 1.21 1.62
2.41 3.32
9.10
24.25
0
5
10
15
20
25
Ene
rgy
Co
nsu
me
dp
er
day
pe
r u
nit
ar
ea(
kWh
/day
/m2 )
Areas of Energy Consumption
Energy consumption per day per unit area (kWh/m2/day) in Hotel 1
1.56
4.91
6.71
10.72
13.02
0
2
4
6
8
10
12
14
Ene
rgy
con
sum
ed
pe
r u
nit
are
a(kW
h/m
2 )
Areas of Energy Consumption
Energy consumed per unit area (kWh/m2/day) of various areas of Hotel 2
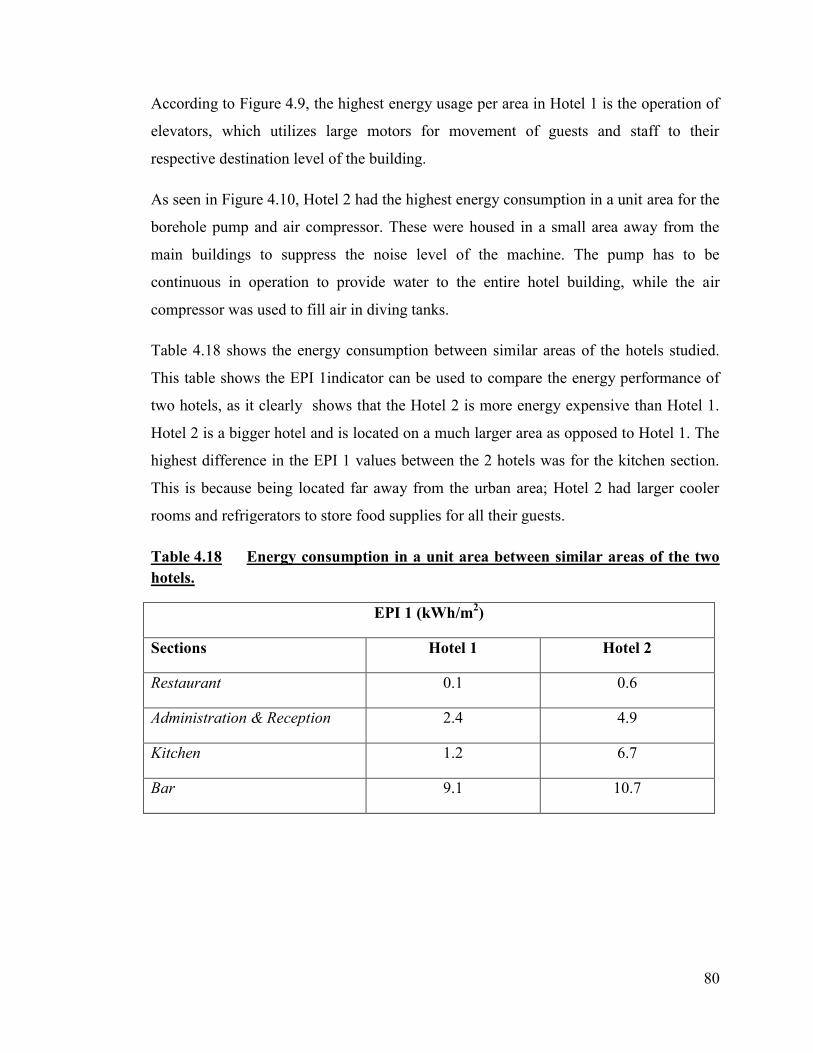
80
According to Figure 4.9, the highest energy usage per area in Hotel 1 is the operation of
elevators, which utilizes large motors for movement of guests and staff to their
respective destination level of the building.
As seen in Figure 4.10, Hotel 2 had the highest energy consumption in a unit area for the
borehole pump and air compressor. These were housed in a small area away from the
main buildings to suppress the noise level of the machine. The pump has to be
continuous in operation to provide water to the entire hotel building, while the air
compressor was used to fill air in diving tanks.
Table 4.18 shows the energy consumption between similar areas of the hotels studied.
This table shows the EPI 1indicator can be used to compare the energy performance of
two hotels, as it clearly shows that the Hotel 2 is more energy expensive than Hotel 1.
Hotel 2 is a bigger hotel and is located on a much larger area as opposed to Hotel 1. The
highest difference in the EPI 1 values between the 2 hotels was for the kitchen section.
This is because being located far away from the urban area; Hotel 2 had larger cooler
rooms and refrigerators to store food supplies for all their guests.
Table 4.18 Energy consumption in a unit area between similar areas of the two
hotels.
EPI 1 (kWh/m2)
Sections Hotel 1 Hotel 2
Restaurant 0.1 0.6
Administration & Reception 2.4 4.9
Kitchen 1.2 6.7
Bar 9.1 10.7
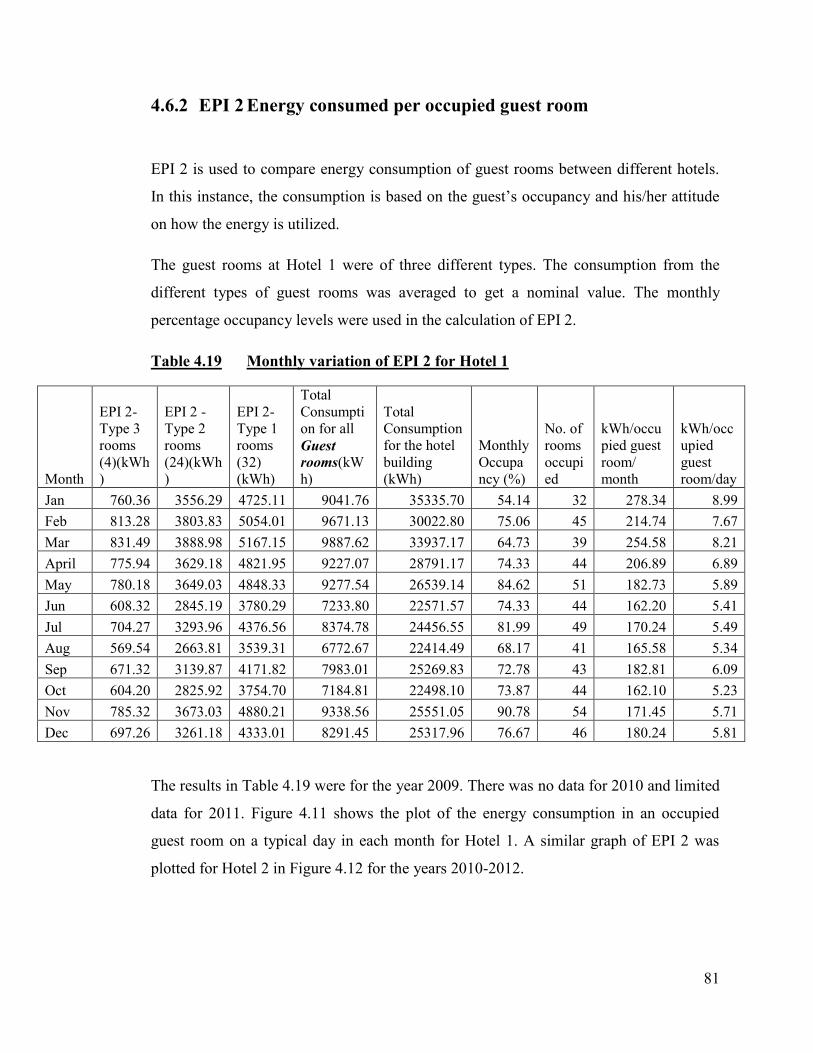
81
4.6.2 EPI 2 Energy consumed per occupied guest room
EPI 2 is used to compare energy consumption of guest rooms between different hotels.
In this instance, the consumption is based on the guest‘s occupancy and his/her attitude
on how the energy is utilized.
The guest rooms at Hotel 1 were of three different types. The consumption from the
different types of guest rooms was averaged to get a nominal value. The monthly
percentage occupancy levels were used in the calculation of EPI 2.
Table 4.19 Monthly variation of EPI 2 for Hotel 1
Month
EPI 2-
Type 3
rooms
(4)(kWh
)
EPI 2 -
Type 2
rooms
(24)(kWh
)
EPI 2-
Type 1
rooms
(32)
(kWh)
Total
Consumpti
on for all
Guest
rooms(kW
h)
Total
Consumption
for the hotel
building
(kWh)
Monthly
Occupa
ncy (%)
No. of
rooms
occupi
ed
kWh/occu
pied guest
room/
month
kWh/occ
upied
guest
room/day
Jan 760.36 3556.29 4725.11 9041.76 35335.70 54.14 32 278.34 8.99
Feb 813.28 3803.83 5054.01 9671.13 30022.80 75.06 45 214.74 7.67
Mar 831.49 3888.98 5167.15 9887.62 33937.17 64.73 39 254.58 8.21
April 775.94 3629.18 4821.95 9227.07 28791.17 74.33 44 206.89 6.89
May 780.18 3649.03 4848.33 9277.54 26539.14 84.62 51 182.73 5.89
Jun 608.32 2845.19 3780.29 7233.80 22571.57 74.33 44 162.20 5.41
Jul 704.27 3293.96 4376.56 8374.78 24456.55 81.99 49 170.24 5.49
Aug 569.54 2663.81 3539.31 6772.67 22414.49 68.17 41 165.58 5.34
Sep 671.32 3139.87 4171.82 7983.01 25269.83 72.78 43 182.81 6.09
Oct 604.20 2825.92 3754.70 7184.81 22498.10 73.87 44 162.10 5.23
Nov 785.32 3673.03 4880.21 9338.56 25551.05 90.78 54 171.45 5.71
Dec 697.26 3261.18 4333.01 8291.45 25317.96 76.67 46 180.24 5.81
The results in Table 4.19 were for the year 2009. There was no data for 2010 and limited
data for 2011. Figure 4.11 shows the plot of the energy consumption in an occupied
guest room on a typical day in each month for Hotel 1. A similar graph of EPI 2 was
plotted for Hotel 2 in Figure 4.12 for the years 2010-2012.
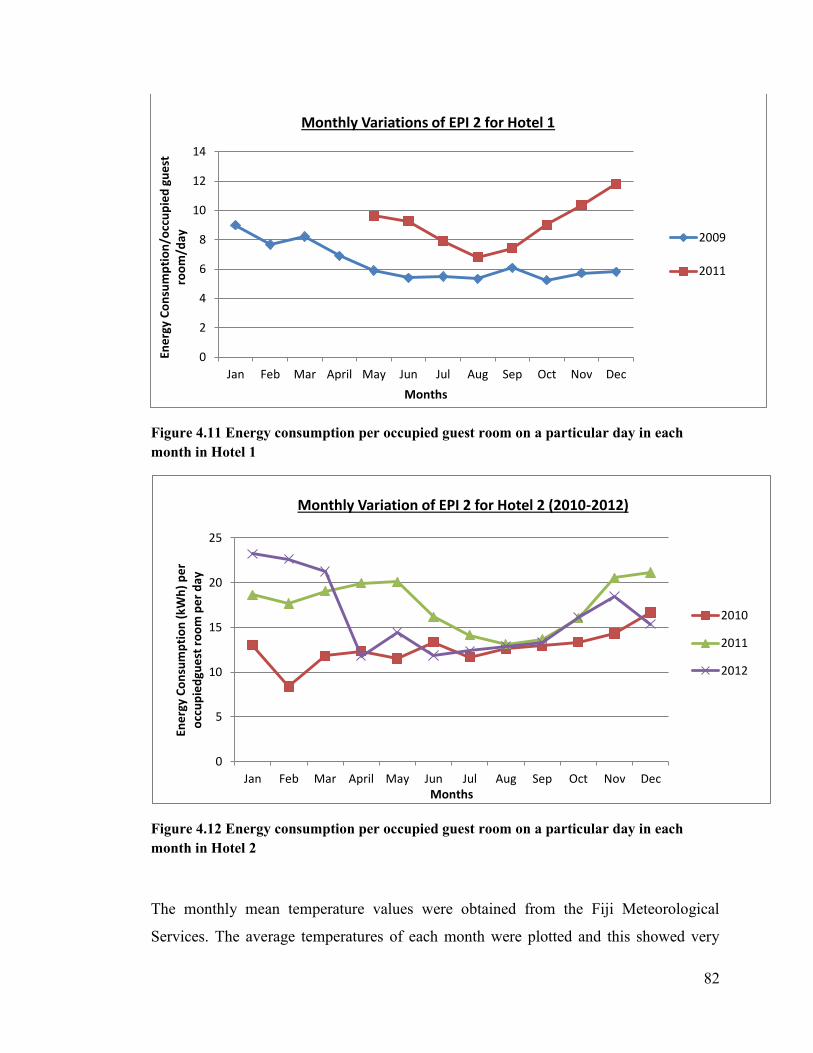
82
Figure 4.11 Energy consumption per occupied guest room on a particular day in each
month in Hotel 1
Figure 4.12 Energy consumption per occupied guest room on a particular day in each
month in Hotel 2
The monthly mean temperature values were obtained from the Fiji Meteorological
Services. The average temperatures of each month were plotted and this showed very
0
2
4
6
8
10
12
14
Jan Feb Mar April May Jun Jul Aug Sep Oct Nov Dec
Ene
rgy
Co
nsu
mp
tio
n/o
ccu
pie
d g
ue
st
roo
m/d
ay
Months
Monthly Variations of EPI 2 for Hotel 1
2009
2011
0
5
10
15
20
25
Jan Feb Mar April May Jun Jul Aug Sep Oct Nov Dec
Ene
rgy
Co
nsu
mp
tio
n (
kWh
) p
er
occ
up
ied
gue
st r
oo
m p
er
day
Months
Monthly Variation of EPI 2 for Hotel 2 (2010-2012)
2010
2011
2012
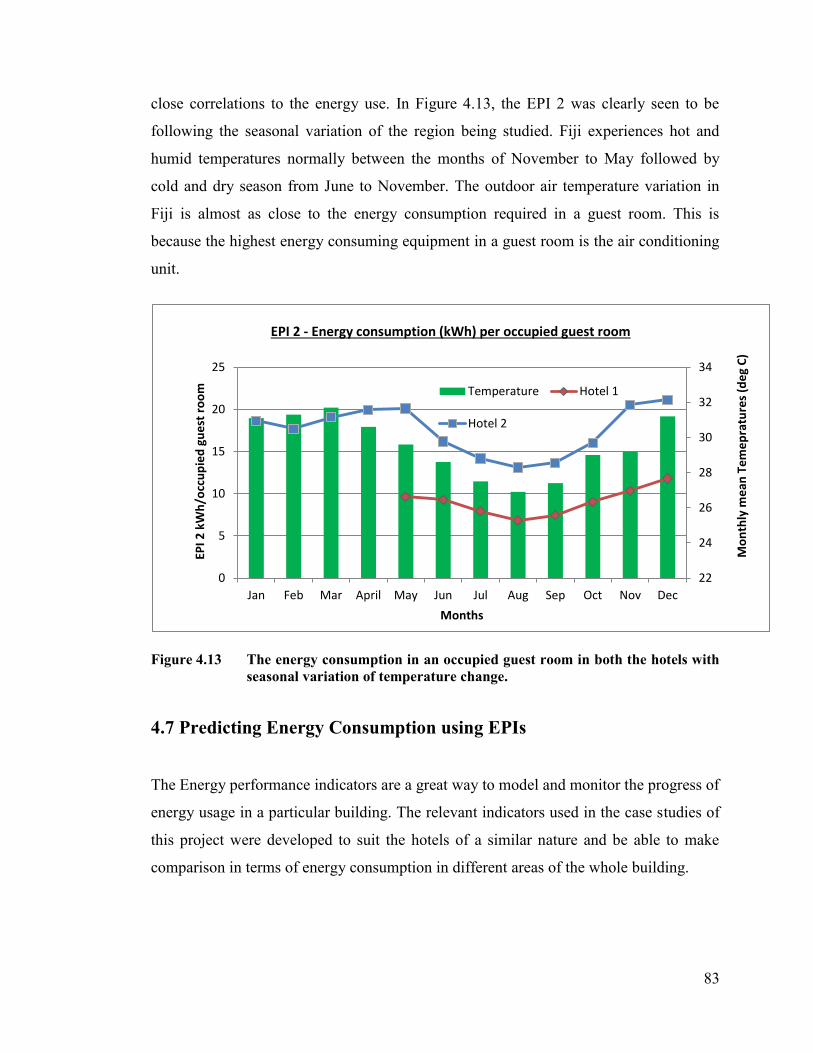
83
close correlations to the energy use. In Figure 4.13, the EPI 2 was clearly seen to be
following the seasonal variation of the region being studied. Fiji experiences hot and
humid temperatures normally between the months of November to May followed by
cold and dry season from June to November. The outdoor air temperature variation in
Fiji is almost as close to the energy consumption required in a guest room. This is
because the highest energy consuming equipment in a guest room is the air conditioning
unit.
Figure 4.13 The energy consumption in an occupied guest room in both the hotels with
seasonal variation of temperature change.
4.7 Predicting Energy Consumption using EPIs
The Energy performance indicators are a great way to model and monitor the progress of
energy usage in a particular building. The relevant indicators used in the case studies of
this project were developed to suit the hotels of a similar nature and be able to make
comparison in terms of energy consumption in different areas of the whole building.
22
24
26
28
30
32
34
0
5
10
15
20
25
Jan Feb Mar April May Jun Jul Aug Sep Oct Nov Dec
Mo
nth
ly m
ean
Te
me
pra
ture
s (d
eg
C)
EP
I 2
kW
h/o
ccu
pie
d g
ue
st r
oo
m
Months
EPI 2 - Energy consumption (kWh) per occupied guest room
Temperature Hotel 1
Hotel 2
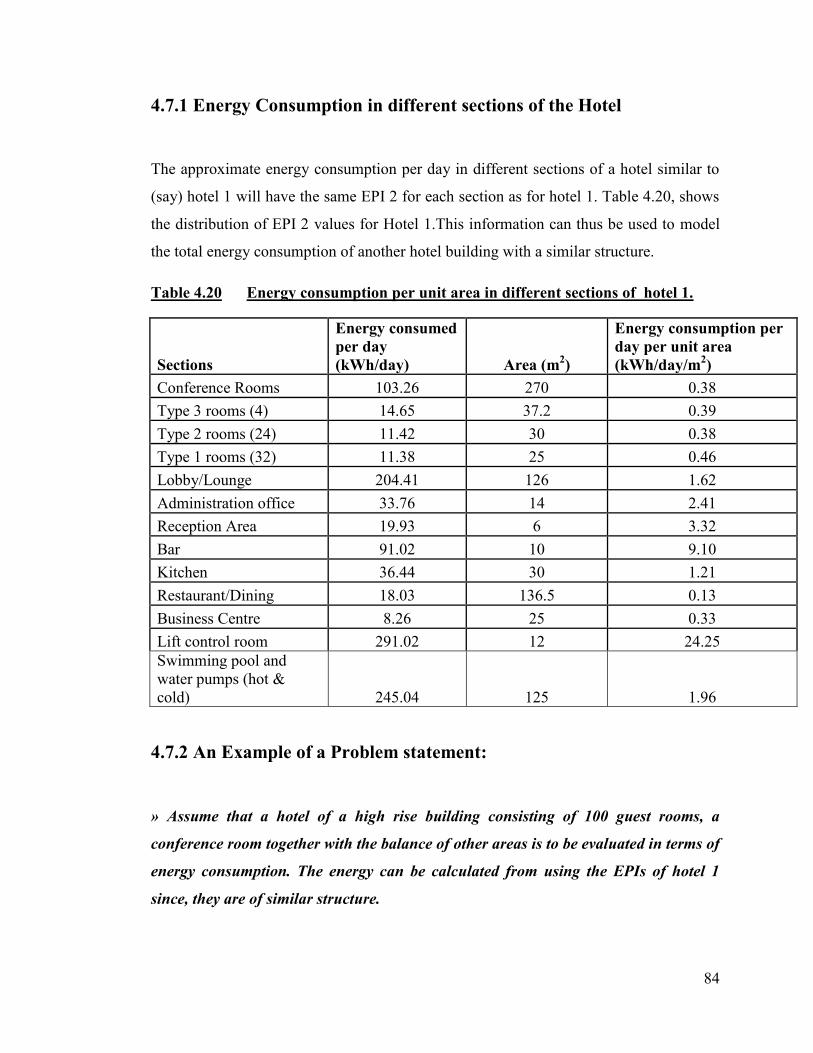
84
4.7.1 Energy Consumption in different sections of the Hotel
The approximate energy consumption per day in different sections of a hotel similar to
(say) hotel 1 will have the same EPI 2 for each section as for hotel 1. Table 4.20, shows
the distribution of EPI 2 values for Hotel 1.This information can thus be used to model
the total energy consumption of another hotel building with a similar structure.
Table 4.20 Energy consumption per unit area in different sections of hotel 1.
Sections
Energy consumed
per day
(kWh/day) Area (m2)
Energy consumption per
day per unit area
(kWh/day/m2)
Conference Rooms 103.26 270 0.38
Type 3 rooms (4) 14.65 37.2 0.39
Type 2 rooms (24) 11.42 30 0.38
Type 1 rooms (32) 11.38 25 0.46
Lobby/Lounge 204.41 126 1.62
Administration office 33.76 14 2.41
Reception Area 19.93 6 3.32
Bar 91.02 10 9.10
Kitchen 36.44 30 1.21
Restaurant/Dining 18.03 136.5 0.13
Business Centre 8.26 25 0.33
Lift control room 291.02 12 24.25
Swimming pool and
water pumps (hot &
cold) 245.04 125 1.96
4.7.2 An Example of a Problem statement:
» Assume that a hotel of a high rise building consisting of 100 guest rooms, a
conference room together with the balance of other areas is to be evaluated in terms of
energy consumption. The energy can be calculated from using the EPIs of hotel 1
since, they are of similar structure.
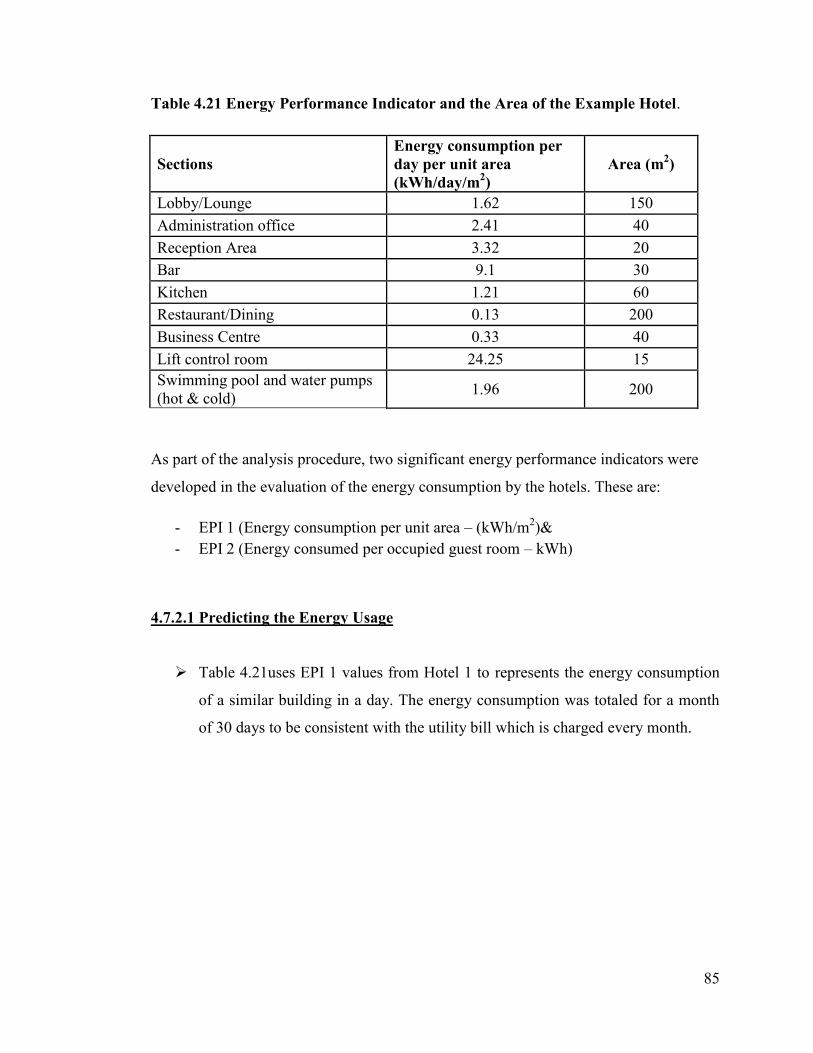
85
Table 4.21 Energy Performance Indicator and the Area of the Example Hotel.
Sections
Energy consumption per
day per unit area
(kWh/day/m2)
Area (m2)
Lobby/Lounge 1.62 150
Administration office 2.41 40
Reception Area 3.32 20
Bar 9.1 30
Kitchen 1.21 60
Restaurant/Dining 0.13 200
Business Centre 0.33 40
Lift control room 24.25 15
Swimming pool and water pumps
(hot & cold) 1.96 200
As part of the analysis procedure, two significant energy performance indicators were
developed in the evaluation of the energy consumption by the hotels. These are:
- EPI 1 (Energy consumption per unit area – (kWh/m2)&
- EPI 2 (Energy consumed per occupied guest room – kWh)
4.7.2.1 Predicting the Energy Usage
Table 4.21uses EPI 1 values from Hotel 1 to represents the energy consumption
of a similar building in a day. The energy consumption was totaled for a month
of 30 days to be consistent with the utility bill which is charged every month.
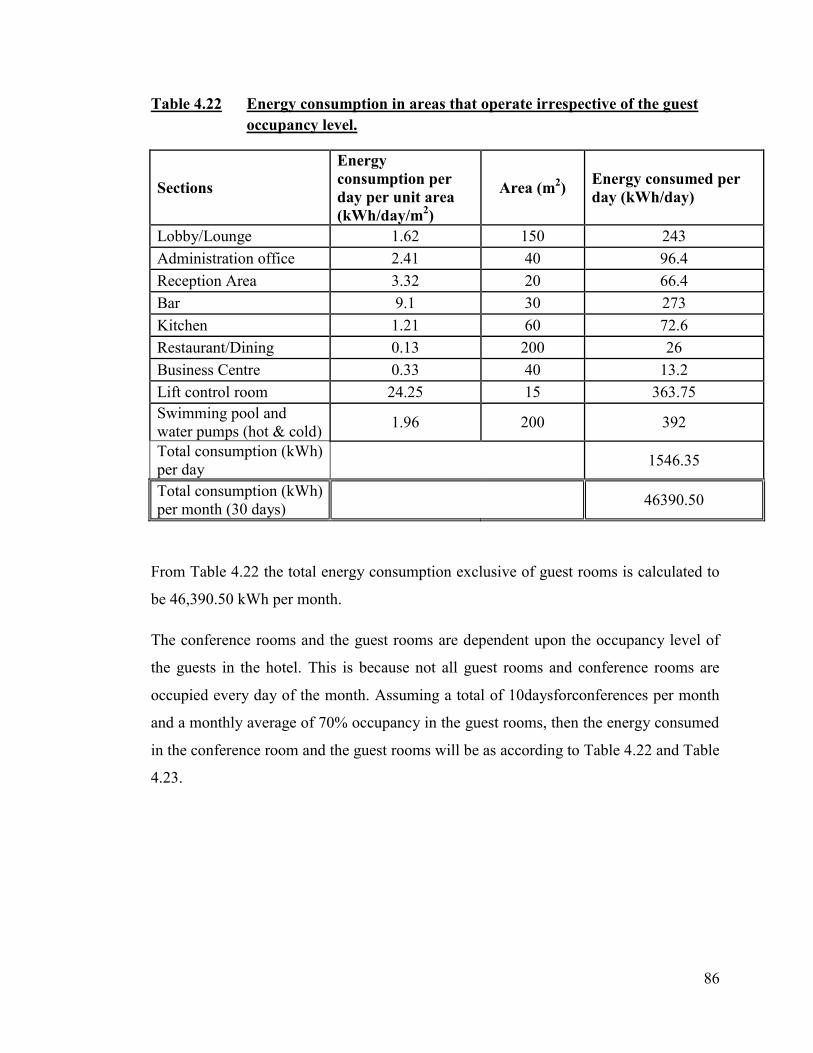
86
Table 4.22 Energy consumption in areas that operate irrespective of the guest
occupancy level.
Sections
Energy
consumption per
day per unit area
(kWh/day/m2)
Area (m2)
Energy consumed per
day (kWh/day)
Lobby/Lounge 1.62 150 243
Administration office 2.41 40 96.4
Reception Area 3.32 20 66.4
Bar 9.1 30 273
Kitchen 1.21 60 72.6
Restaurant/Dining 0.13 200 26
Business Centre 0.33 40 13.2
Lift control room 24.25 15 363.75
Swimming pool and
water pumps (hot & cold) 1.96 200 392
Total consumption (kWh)
per day
1546.35
Total consumption (kWh)
per month (30 days) 46390.50
From Table 4.22 the total energy consumption exclusive of guest rooms is calculated to
be 46,390.50 kWh per month.
The conference rooms and the guest rooms are dependent upon the occupancy level of
the guests in the hotel. This is because not all guest rooms and conference rooms are
occupied every day of the month. Assuming a total of 10daysforconferences per month
and a monthly average of 70% occupancy in the guest rooms, then the energy consumed
in the conference room and the guest rooms will be as according to Table 4.22 and Table
4.23.
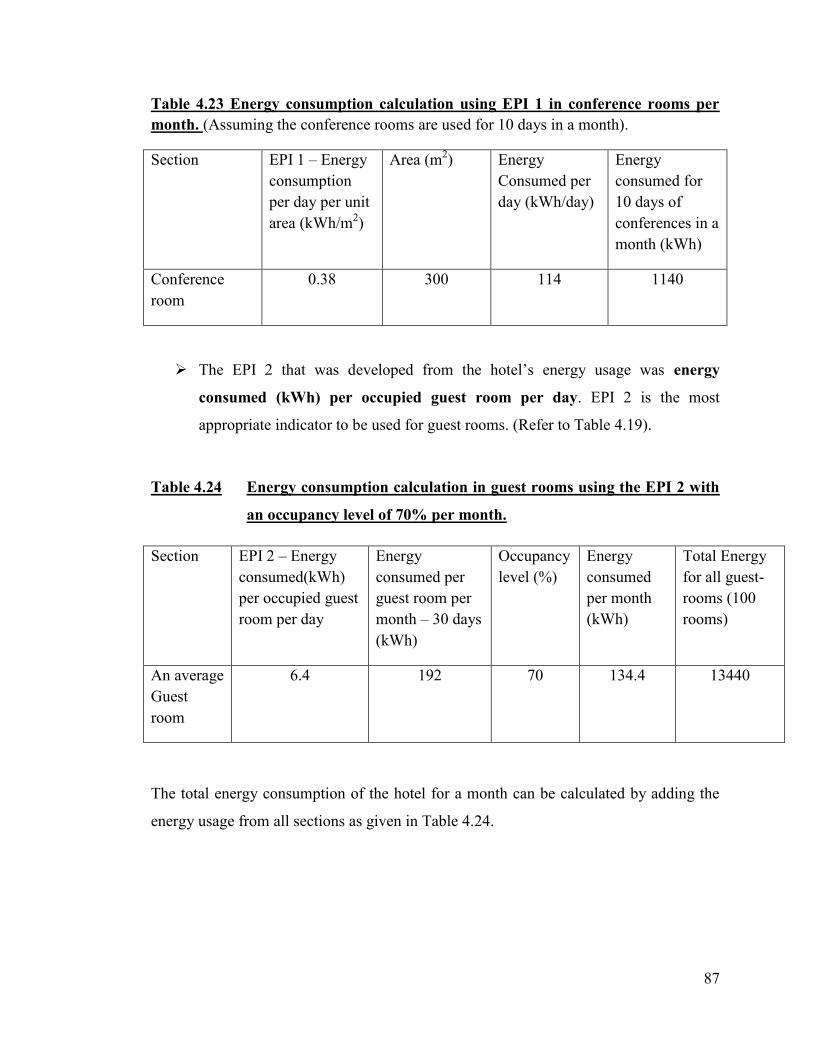
87
Table 4.23 Energy consumption calculation using EPI 1 in conference rooms per
month. (Assuming the conference rooms are used for 10 days in a month).
Section EPI 1 – Energy
consumption
per day per unit
area (kWh/m2)
Area (m2) Energy
Consumed per
day (kWh/day)
Energy
consumed for
10 days of
conferences in a
month (kWh)
Conference
room
0.38 300 114 1140
The EPI 2 that was developed from the hotel‘s energy usage was energy
consumed (kWh) per occupied guest room per day. EPI 2 is the most
appropriate indicator to be used for guest rooms. (Refer to Table 4.19).
Table 4.24 Energy consumption calculation in guest rooms using the EPI 2 with
an occupancy level of 70% per month.
Section EPI 2 – Energy
consumed(kWh)
per occupied guest
room per day
Energy
consumed per
guest room per
month – 30 days
(kWh)
Occupancy
level (%)
Energy
consumed
per month
(kWh)
Total Energy
for all guest-
rooms (100
rooms)
An average
Guest
room
6.4 192 70 134.4 13440
The total energy consumption of the hotel for a month can be calculated by adding the
energy usage from all sections as given in Table 4.24.
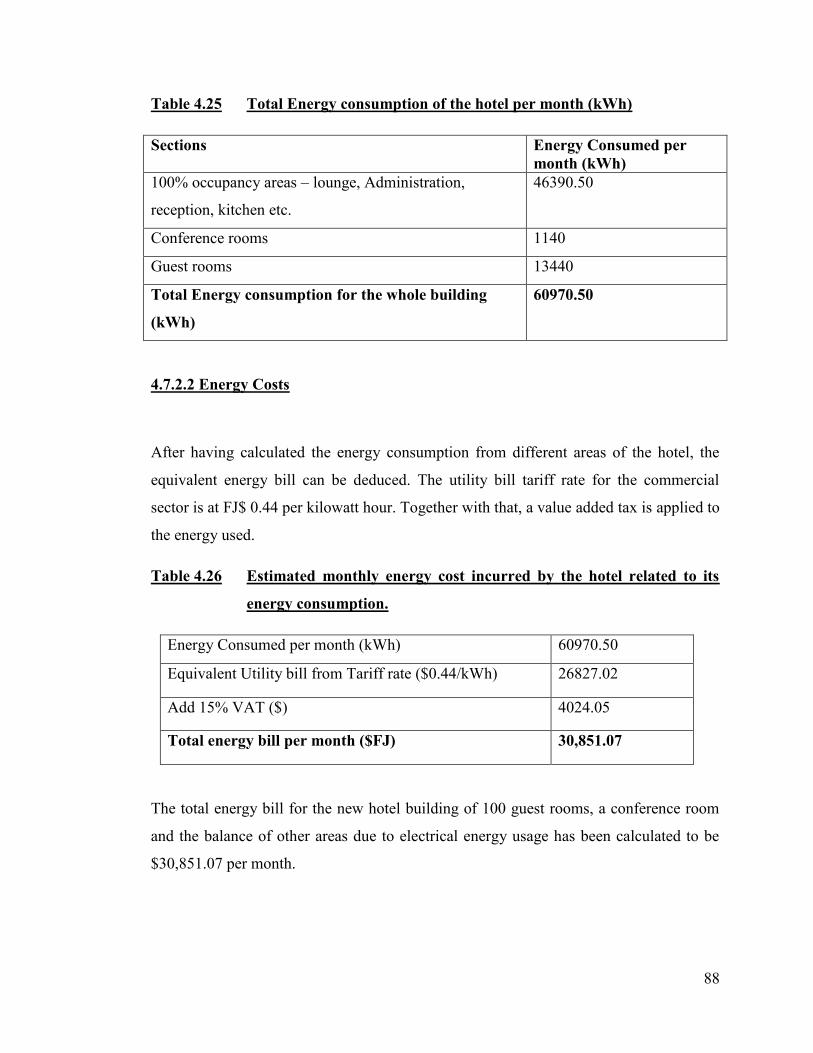
88
Table 4.25 Total Energy consumption of the hotel per month (kWh)
Sections Energy Consumed per
month (kWh)
100% occupancy areas – lounge, Administration,
reception, kitchen etc.
46390.50
Conference rooms 1140
Guest rooms 13440
Total Energy consumption for the whole building
(kWh)
60970.50
4.7.2.2 Energy Costs
After having calculated the energy consumption from different areas of the hotel, the
equivalent energy bill can be deduced. The utility bill tariff rate for the commercial
sector is at FJ$ 0.44 per kilowatt hour. Together with that, a value added tax is applied to
the energy used.
Table 4.26 Estimated monthly energy cost incurred by the hotel related to its
energy consumption.
Energy Consumed per month (kWh) 60970.50
Equivalent Utility bill from Tariff rate ($0.44/kWh) 26827.02
Add 15% VAT ($) 4024.05
Total energy bill per month ($FJ) 30,851.07
The total energy bill for the new hotel building of 100 guest rooms, a conference room
and the balance of other areas due to electrical energy usage has been calculated to be
$30,851.07 per month.
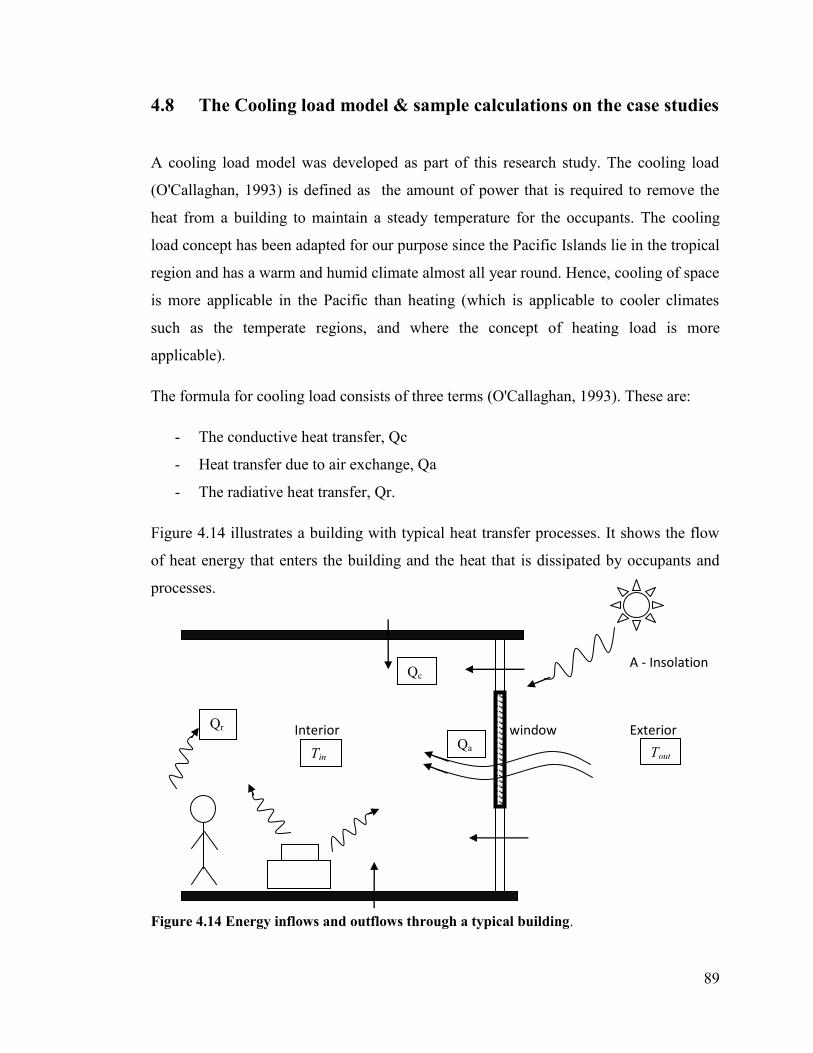
89
Qc
Qa
Qr
4.8 The Cooling load model & sample calculations on the case studies
A cooling load model was developed as part of this research study. The cooling load
(O'Callaghan, 1993) is defined as the amount of power that is required to remove the
heat from a building to maintain a steady temperature for the occupants. The cooling
load concept has been adapted for our purpose since the Pacific Islands lie in the tropical
region and has a warm and humid climate almost all year round. Hence, cooling of space
is more applicable in the Pacific than heating (which is applicable to cooler climates
such as the temperate regions, and where the concept of heating load is more
applicable).
The formula for cooling load consists of three terms (O'Callaghan, 1993). These are:
- The conductive heat transfer, Qc
- Heat transfer due to air exchange, Qa
- The radiative heat transfer, Qr.
Figure 4.14 illustrates a building with typical heat transfer processes. It shows the flow
of heat energy that enters the building and the heat that is dissipated by occupants and
processes.
A - Insolation
Interior window Exterior
Figure 4.14 Energy inflows and outflows through a typical building.
Tin Tout
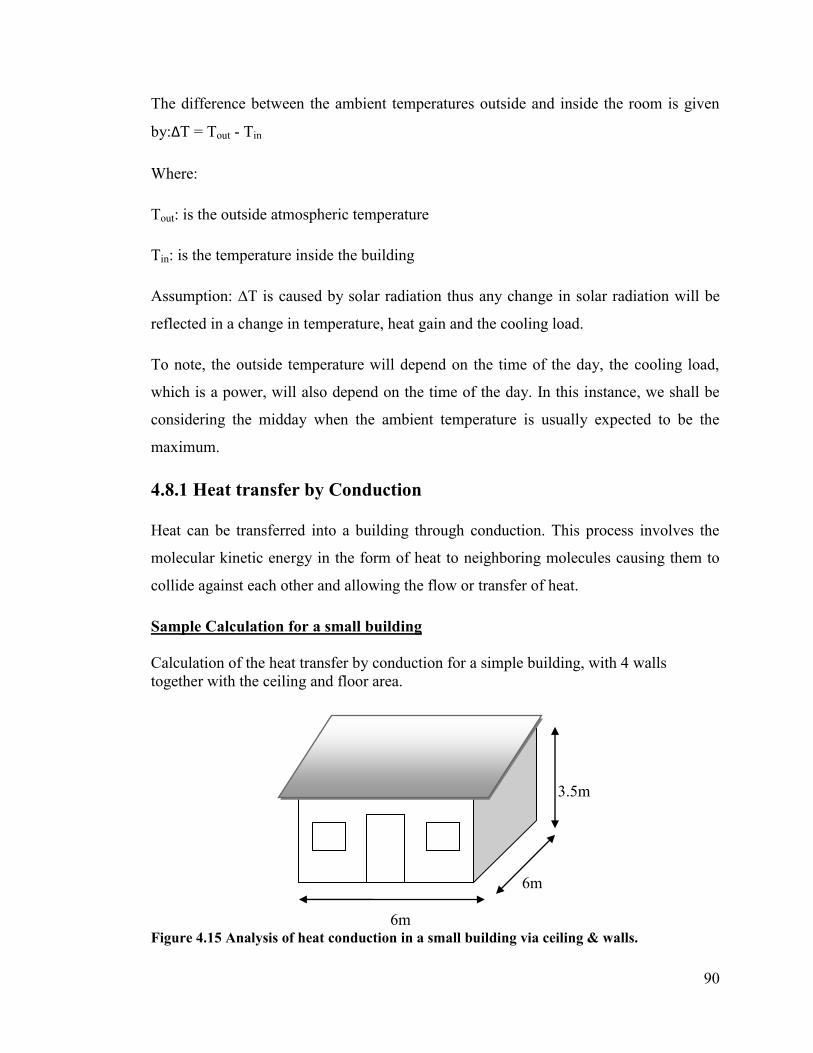
90
The difference between the ambient temperatures outside and inside the room is given
by:ΔT = Tout - Tin
Where:
Tout: is the outside atmospheric temperature
Tin: is the temperature inside the building
Assumption: ∆T is caused by solar radiation thus any change in solar radiation will be
reflected in a change in temperature, heat gain and the cooling load.
To note, the outside temperature will depend on the time of the day, the cooling load,
which is a power, will also depend on the time of the day. In this instance, we shall be
considering the midday when the ambient temperature is usually expected to be the
maximum.
4.8.1 Heat transfer by Conduction
Heat can be transferred into a building through conduction. This process involves the
molecular kinetic energy in the form of heat to neighboring molecules causing them to
collide against each other and allowing the flow or transfer of heat.
Sample Calculation for a small building
Calculation of the heat transfer by conduction for a simple building, with 4 walls
together with the ceiling and floor area.
3.5m
6m
6m Figure 4.15 Analysis of heat conduction in a small building via ceiling & walls.
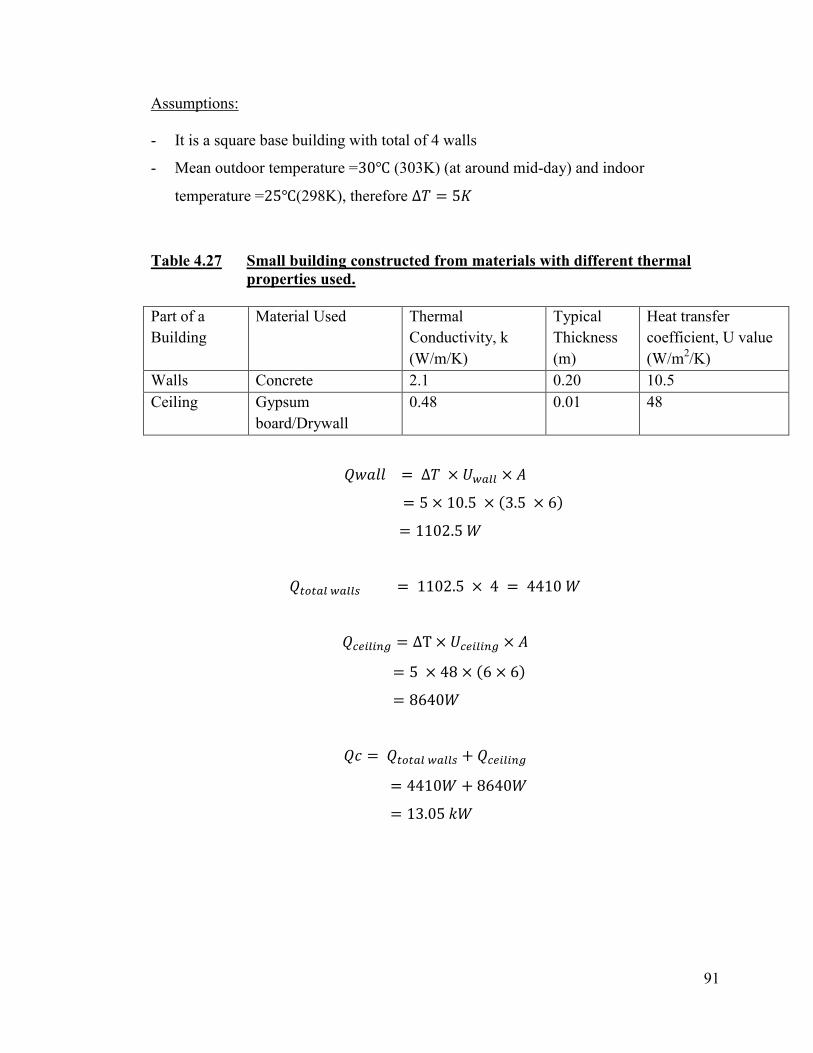
91
Assumptions:
- It is a square base building with total of 4 walls
- Mean outdoor temperature = (303K) (at around mid-day) and indoor
temperature = (298K), therefore
Table 4.27 Small building constructed from materials with different thermal
properties used.
Part of a
Building
Material Used Thermal
Conductivity, k
(W/m/K)
Typical
Thickness
(m)
Heat transfer
coefficient, U value
(W/m2/K)
Walls Concrete 2.1 0.20 10.5
Ceiling Gypsum
board/Drywall
0.48 0.01 48
92
4.8.2 Heat transfer by air exchange method (Convection)
Fv is the volumetric flow rate in m3/s. An average velocity of air as 4 m/s and the total
area of openings such as windows (3 x 1.5 x 1m) and doors (2 x 2.5m x 1m) as 9.5m2,
the average Fv can be calculated by:
For instance, taking the average outdoor temperature as and the
indoor temperature as density of air as 1.1839 kg/m3 and the
specific heat capacity of air as 1006J/(Kg.K), the Qa can be calculated
(O'Callaghan, 1993)from equation as:
4.8.3 Internal Radiative Heat
All materials emit radiation according to different temperatures. This process of
radiation allows energy to be converted into electromagnetic waves. Electromagnetic
waves travel in free space at the speed of light (c = 2.997925 x 10⁸ m/s) and are able to
transmit energy without the use of any medium.
Blackbody radiation emitted by a human:
A human body has an emissivity ratio of 0.9 and a typical surface area of 1.8m2. The
surface temperature of the human is normally while the ambient temperature can
be taken as . The person can be modeled as a blackbody radiator and the heat gain
by the human can be calculated from equation 3.16 as;
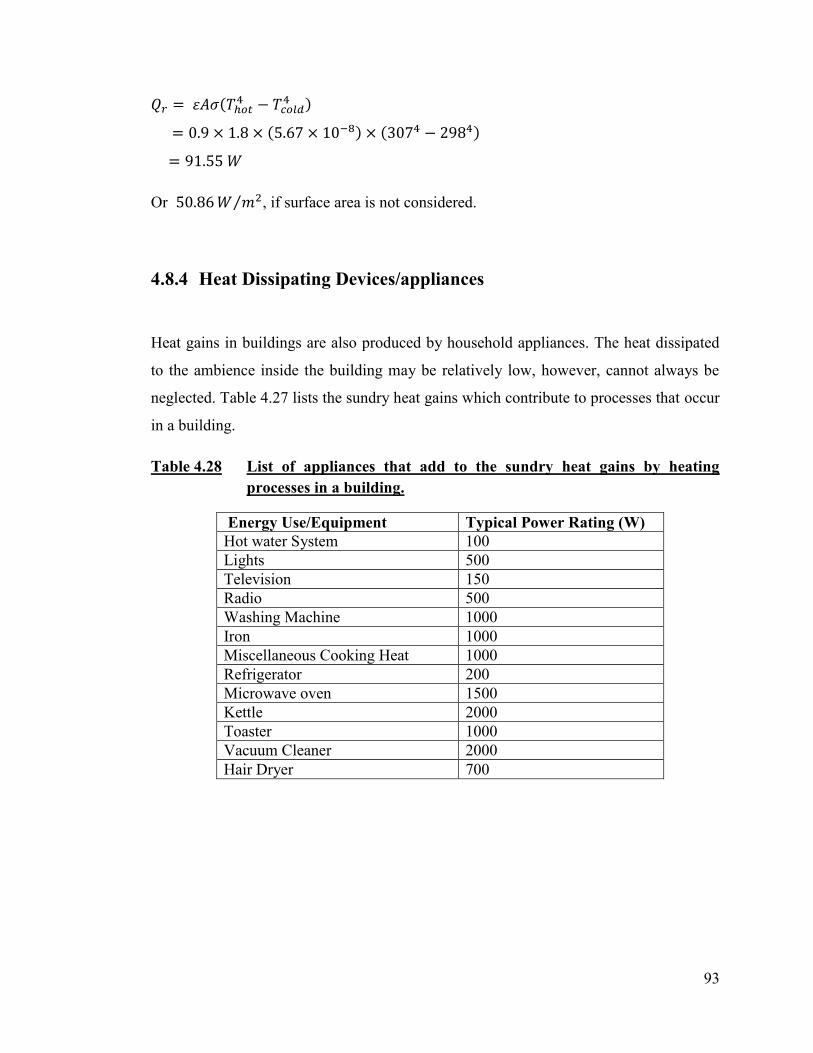
93
Or ⁄ , if surface area is not considered.
4.8.4 Heat Dissipating Devices/appliances
Heat gains in buildings are also produced by household appliances. The heat dissipated
to the ambience inside the building may be relatively low, however, cannot always be
neglected. Table 4.27 lists the sundry heat gains which contribute to processes that occur
in a building.
Table 4.28 List of appliances that add to the sundry heat gains by heating
processes in a building.
Energy Use/Equipment Typical Power Rating (W)
Hot water System 100
Lights 500
Television 150
Radio 500
Washing Machine 1000
Iron 1000
Miscellaneous Cooking Heat 1000
Refrigerator 200
Microwave oven 1500
Kettle 2000
Toaster 1000
Vacuum Cleaner 2000
Hair Dryer 700
94
The total cooling load is the sum of conductive heat transfer together with heat gain due
to air exchange and the radiation heat transfer (including the heat dissipated by devices).
Following the cooling load parameters from the previous sections, a small building
under normal conditions will follow the cooling load equation as;
Therefore, it can be estimated that approximately 120.33 kW of power is required in
cooling a building with a person inside. This assumption of the cooling load is such
when the ambient temperature is at and is to be brought down to
It can be noted that the ambient temperature usually drops in the absence
of sunlight during the night. This decrease in temperature will cause a decrease in the
cooling load of the building. This value will increase if the sundry gains are high, that is,
if more appliances are used simultaneously. Energy efficient measures will reduce this
figure significantly.
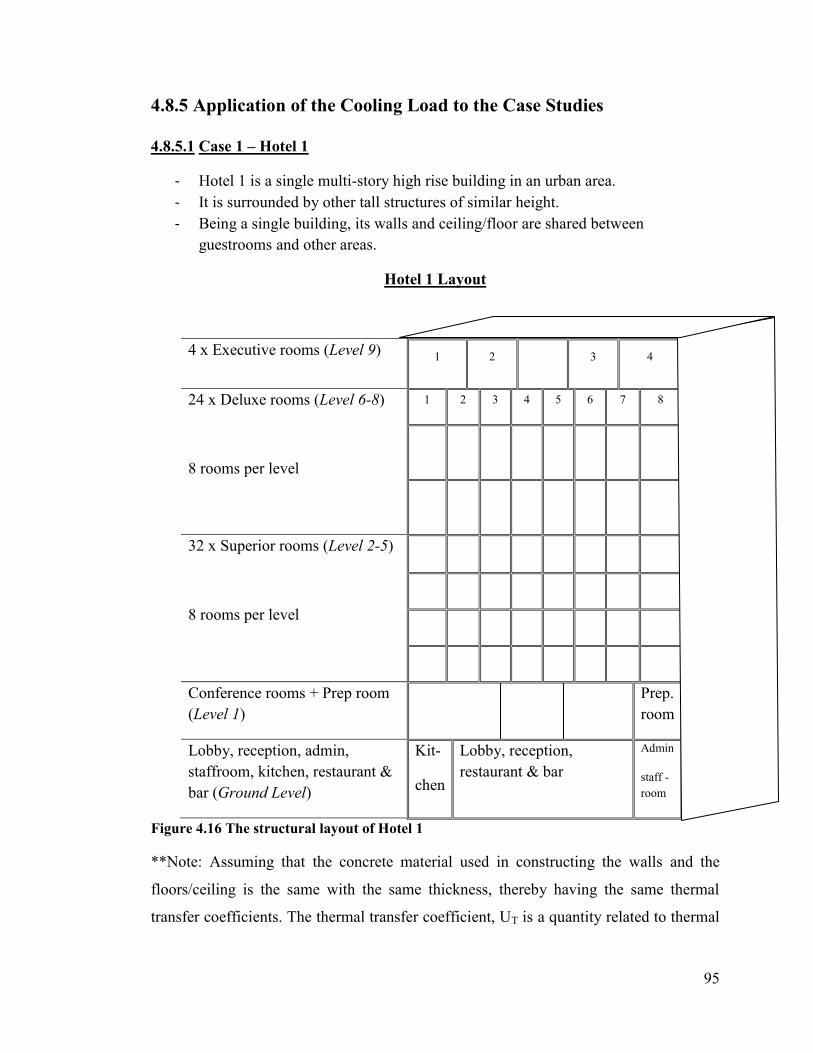
95
4.8.5 Application of the Cooling Load to the Case Studies
4.8.5.1 Case 1 – Hotel 1
- Hotel 1 is a single multi-story high rise building in an urban area.
- It is surrounded by other tall structures of similar height.
- Being a single building, its walls and ceiling/floor are shared between
guestrooms and other areas.
Hotel 1 Layout
4 x Executive rooms (Level 9) 1 2
3 4
24 x Deluxe rooms (Level 6-8)
8 rooms per level
1 2 3 4 5 6 7 8
32 x Superior rooms (Level 2-5)
8 rooms per level
Conference rooms + Prep room
(Level 1)
Prep.
room
Lobby, reception, admin,
staffroom, kitchen, restaurant &
bar (Ground Level)
Kit-
chen
Lobby, reception,
restaurant & bar
Admin
staff -
room
Figure 4.16 The structural layout of Hotel 1
**Note: Assuming that the concrete material used in constructing the walls and the
floors/ceiling is the same with the same thickness, thereby having the same thermal
transfer coefficients. The thermal transfer coefficient, UT is a quantity related to thermal
96
conductivity, kT. Also assuming the thickness of all walls and the heights of each level is
the same as well.
UT (W/m2/K) = kT (W/m/K) ÷ thickness of the wall (m)
UT = 2.1 ÷ 0.2 = 10.5 W/m2/K
(Source: L. D. Danny Harvey, A handbook on low energy buildings and district energy
systems)(Harvey, 2006).
4.8.5.1.1 Conductive Heat transfer, Qc
For level 9, there are 4 executive (large) guest rooms, comprising of 6 walls 2.5m x
6.2m, 8 walls of 2.5m x 6m and 4 ceilings of 6m x 6.2m.
= 5 x 10.5 x [(5 x 2.5 x 6.2) + (8 x 2.5 x 6) + (4 x 6 x 6.2)]
= 18.18kW
nw – is the no. of walls Aw – is the area of the walls
nc – is the no. of ceilings Ac – is the area of the ceilings
Consider levels 2-8, consisting of 8 guest rooms, with shared walls and the floor forms
the ceiling of the adjacent level.
Level (2-8)= (9 walls + 8 ceilings/floors) x 7 levels
= 5 x 10.5 x [(9 x 2.5 x 6) + (16 x 2.5 x 5) + (8 x 5 x 6)] x 7
= 211.31 kW
On level 1, there are 3 conference rooms (separated by partitions) and a prep. room
which is used to cater for the conference guests and also sometimes being used by the
kitchen staff as well to prepare certain dishes.
97
= 5 x 10.5 x ((3 x 2.5 x 14) + (2.5 x 82.5) + (270 + 32.5))
= 22.50 kW
The ground level, the kitchen and the administration staff area are enclosed areas with
walls while the reception, lobby restaurant and bar are in open space. The ceiling of the
ground floor forms the floor for level 1 and is relatively equal. Finally, the floor area of
the ground level is equal to the ceiling of the ground floor.
= 5 x 10.5 x ((4 x 3 x 14) + (302.5 x 2)
= 40.58 kW
Therefore, the total conductive heat transfer within the hotel building can be calculated
by summing up all the conductive heat values from the walls of different areas.
∑
= 18.18 + 211.31 + 22.50 + 40.58
= 204.50 kW
4.8.5.1.2 Heat transfer by air exchange, Qa
Air exchange occurs from the interior of the building with the outside atmosphere
through windows, doors and other small apertures. In this case we can assume that at
least 35% of the windows are open. One can also assume that the velocity of air flow
will be quite low since the hotel building is obstructed by the neighboring tall structures
in the urban environment.
= 2m/s x 35/100 x (60 rooms x 1.25m x 2.5m x 2)
= 262 m3/s
Assume the outside air temperature as 30°C and the indoor temperature being 25°C.
98
= 1.1839 x 1006 x 262 x (303-298)
= 1560.21 kW
4.8.5.1.3 Radiative Heat transfer (Blackbody radiation), Qr
Assume 65% occupancy in the total of 60 rooms = 39 guests. Assume 20 staff employed
at the hotel, thus the total number of occupants = 59 people.
= 0.9 x 1.8 x 5.67 x 10-8
x (3074 – 298
4) x 59
= 2.30 kW
Miscellaneous heating by appliances constitute about 750W
Total Qr = 2.30 + 0.75 = 3.05 kW
Therefore the total cooling load for the whole building is the sum of the conductive heat
transfer with heat transfer due to air exchange and the radiative heat transfer.
CL = Qc + Qa + Qr
= 204.50 + 1560.21 + 3.05
= 1767.76 kW
4.8.5.2 Case study 2 – Hotel 2
Hotel 2 has a different architecture than hotel 1. Hotel 2 is located near the coastal
region away from the urban environment. It is a villa type hotel with guest rooms and
other facilities over a large area. It has a total of 116 guest rooms.
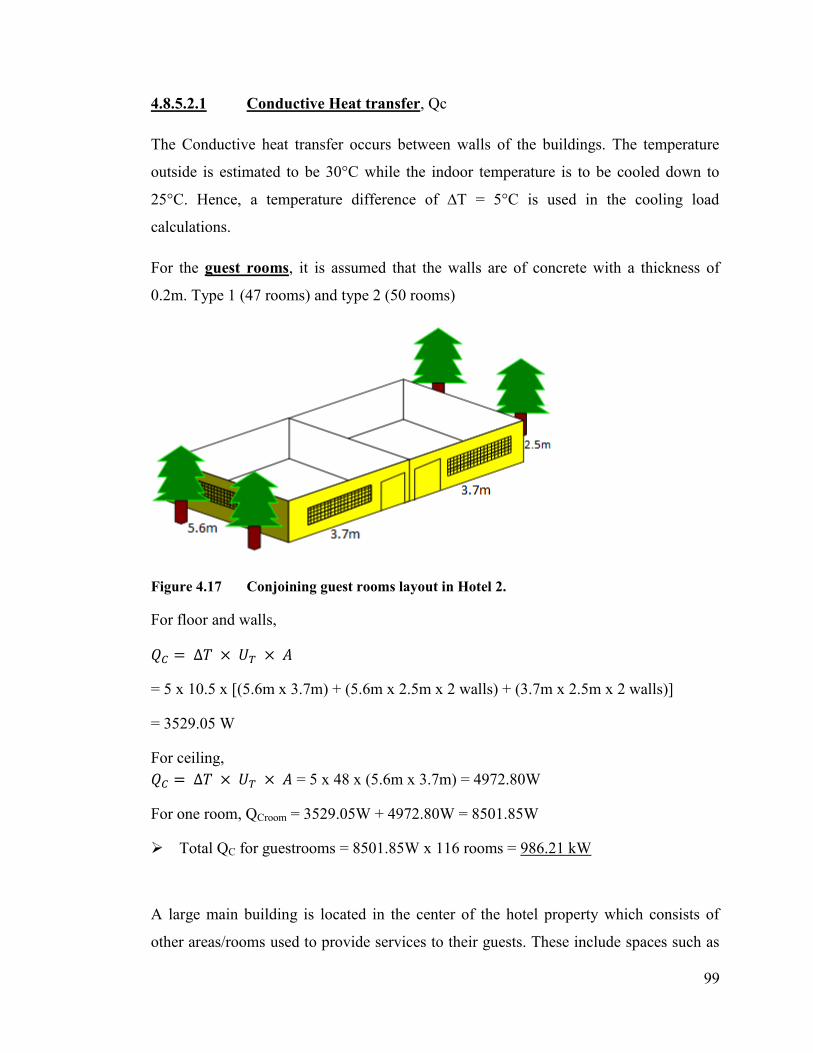
99
4.8.5.2.1 Conductive Heat transfer, Qc
The Conductive heat transfer occurs between walls of the buildings. The temperature
outside is estimated to be 30°C while the indoor temperature is to be cooled down to
25°C. Hence, a temperature difference of ∆T = 5°C is used in the cooling load
calculations.
For the guest rooms, it is assumed that the walls are of concrete with a thickness of
0.2m. Type 1 (47 rooms) and type 2 (50 rooms)
Figure 4.17 Conjoining guest rooms layout in Hotel 2.
For floor and walls,
= 5 x 10.5 x [(5.6m x 3.7m) + (5.6m x 2.5m x 2 walls) + (3.7m x 2.5m x 2 walls)]
= 3529.05 W
For ceiling,
= 5 x 48 x (5.6m x 3.7m) = 4972.80W
For one room, QCroom = 3529.05W + 4972.80W = 8501.85W
Total QC for guestrooms = 8501.85W x 116 rooms = 986.21 kW
A large main building is located in the center of the hotel property which consists of
other areas/rooms used to provide services to their guests. These include spaces such as
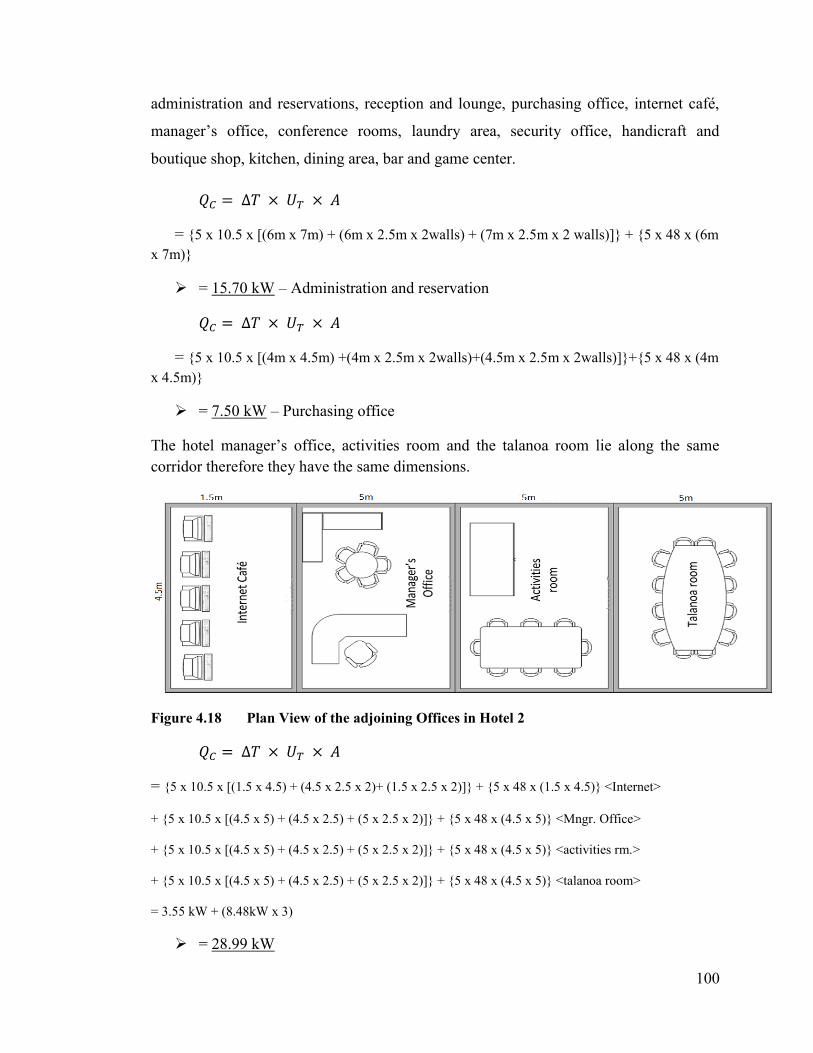
100
administration and reservations, reception and lounge, purchasing office, internet café,
manager‘s office, conference rooms, laundry area, security office, handicraft and
boutique shop, kitchen, dining area, bar and game center.
= {5 x 10.5 x [(6m x 7m) + (6m x 2.5m x 2walls) + (7m x 2.5m x 2 walls)]} + {5 x 48 x (6m
x 7m)}
= 15.70 kW – Administration and reservation
= {5 x 10.5 x [(4m x 4.5m) +(4m x 2.5m x 2walls)+(4.5m x 2.5m x 2walls)]}+{5 x 48 x (4m
x 4.5m)}
= 7.50 kW – Purchasing office
The hotel manager‘s office, activities room and the talanoa room lie along the same
corridor therefore they have the same dimensions.
Figure 4.18 Plan View of the adjoining Offices in Hotel 2
= {5 x 10.5 x [(1.5 x 4.5) + (4.5 x 2.5 x 2)+ (1.5 x 2.5 x 2)]} + {5 x 48 x (1.5 x 4.5)} <Internet>
+ {5 x 10.5 x [(4.5 x 5) + (4.5 x 2.5) + (5 x 2.5 x 2)]} + {5 x 48 x (4.5 x 5)} <Mngr. Office>
+ {5 x 10.5 x [(4.5 x 5) + (4.5 x 2.5) + (5 x 2.5 x 2)]} + {5 x 48 x (4.5 x 5)} <activities rm.>
+ {5 x 10.5 x [(4.5 x 5) + (4.5 x 2.5) + (5 x 2.5 x 2)]} + {5 x 48 x (4.5 x 5)} <talanoa room>
= 3.55 kW + (8.48kW x 3)
= 28.99 kW

101
Table 4.29 Conductive Heat transfer in the building structure of Hotel 2
Hotel section/Area Conductive heat transfer (kW)
Guest rooms (total of 116 rooms) 986.21
Administration & reservation 15.70
Purchasing office 7.50
Internet café 3.55
Manager‘s office 8.48
Activities room 8.48
Talanoa room 8.48
Conference room 31.57
Laundry 22.46
Spa 11.91
Handicraft & boutique shop 38.73
Kitchen 20.53
Dining 18.91
Gym 19.69
Staff Dining lounge and locker room 90.69
Maintenance workshop 41.14
Total Heat Transfer (kW) 1334.03
The sum of conductive heat transfer in hotel 2 is: ∑ 1334.03 kW
4.8.5.2.2 Heat transfer by air exchange, Qa
Assuming:
- The 116 guest rooms have 2 window openings of area 1.25m x 2.5m.
- 45% of the guest rooms have their windows open to the free flowing air.
- Since the hotel is located in a coastal area, it experiences cool sea breeze of the
velocity of air being 3.5 m/s.
- The outside air temperature as 30°C and the indoor temperature being 25°C.
= 3.5 m/s x {(45/100 x 116 rooms x 1.25m x 2.5m x 2) + (1.25m x 2.5m x 10)}
= 1251.25 m3/s
102
= 1.1839 x 1006 x 1251.25 x (303-298)
= 7451.21 kW
4.8.5.2.3 Radiative Heat transfer (Blackbody radiation), Qr
Assume 65% occupancy in the total of 116 rooms = 76 guests. Assume 36 staff
employed at the hotel, thus the total number of occupants = 112 people.
= 0.9 x 1.8 x 5.67 x 10-8
x (3074 – 298
4) x 112
= 10.25 kW
Miscellaneous heating by appliances constitute about 2 kW
Total Qr = 10.25 + 2 = 12.25 kW
Therefore the total cooling load for the whole building is the sum of the conductive heat
transfer with heat transfer due to air exchange and the radiative heat transfer.
CL = Qc + Qa + Qr
= 1334.03 + 7451.21 + 12.25
= 8797.49 kW
4.9 Comparison of Hotels from other regions
A list of literature in Table 4.29 shows the energy performance indicators used in hotels
from different climatic zones of the world. EPI 1 is a simple measure of energy
consumption and has been used by many authors to indicate the performance of energy
in hotels. These values represent EPI 1, that is, the energy consumed per unit floor area
(kWh/m2) annually. Similarly, the energy performance of Hotels 1 & 2 from the case
studies had similar correlation to the hotels studied by other authors.
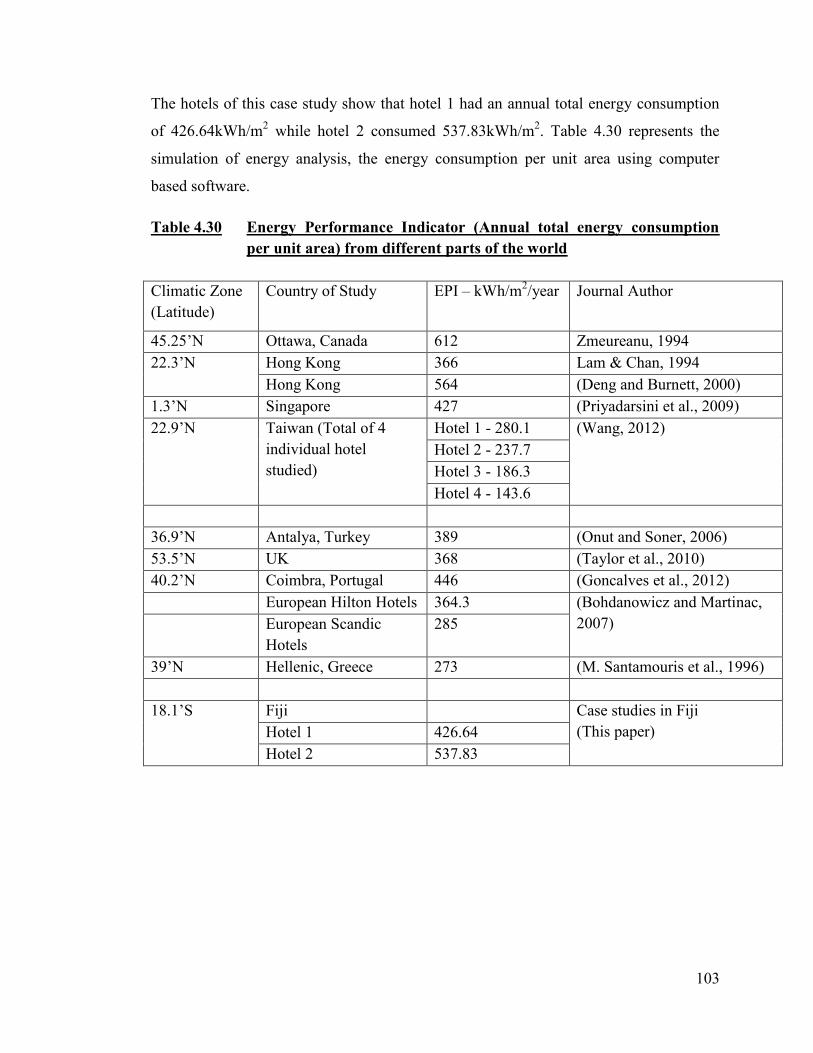
103
The hotels of this case study show that hotel 1 had an annual total energy consumption
of 426.64kWh/m2 while hotel 2 consumed 537.83kWh/m
2. Table 4.30 represents the
simulation of energy analysis, the energy consumption per unit area using computer
based software.
Table 4.30 Energy Performance Indicator (Annual total energy consumption
per unit area) from different parts of the world
Climatic Zone
(Latitude)
Country of Study EPI – kWh/m2/year Journal Author
45.25‘N Ottawa, Canada 612 Zmeureanu, 1994
22.3‘N Hong Kong 366 Lam & Chan, 1994
Hong Kong 564 (Deng and Burnett, 2000)
1.3‘N Singapore 427 (Priyadarsini et al., 2009)
22.9‘N Taiwan (Total of 4
individual hotel
studied)
Hotel 1 - 280.1 (Wang, 2012)
Hotel 2 - 237.7
Hotel 3 - 186.3
Hotel 4 - 143.6
36.9‘N Antalya, Turkey 389 (Onut and Soner, 2006)
53.5‘N UK 368 (Taylor et al., 2010)
40.2‘N Coimbra, Portugal 446 (Goncalves et al., 2012)
European Hilton Hotels 364.3 (Bohdanowicz and Martinac,
2007) European Scandic
Hotels
285
39‘N Hellenic, Greece 273 (M. Santamouris et al., 1996)
18.1‘S Fiji Case studies in Fiji
(This paper) Hotel 1 426.64
Hotel 2 537.83
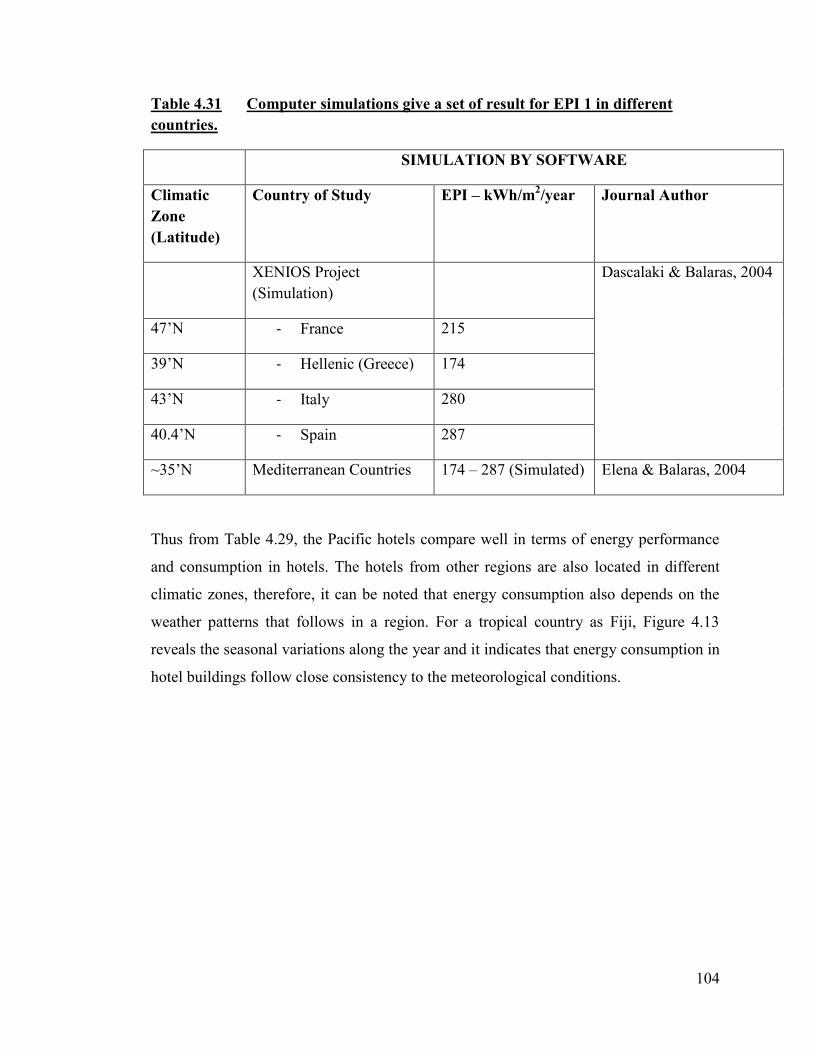
104
Table 4.31 Computer simulations give a set of result for EPI 1 in different
countries.
SIMULATION BY SOFTWARE
Climatic
Zone
(Latitude)
Country of Study EPI – kWh/m2/year Journal Author
XENIOS Project
(Simulation)
Dascalaki & Balaras, 2004
47‘N - France 215
39‘N - Hellenic (Greece) 174
43‘N - Italy 280
40.4‘N - Spain 287
~35‘N Mediterranean Countries 174 – 287 (Simulated) Elena & Balaras, 2004
Thus from Table 4.29, the Pacific hotels compare well in terms of energy performance
and consumption in hotels. The hotels from other regions are also located in different
climatic zones, therefore, it can be noted that energy consumption also depends on the
weather patterns that follows in a region. For a tropical country as Fiji, Figure 4.13
reveals the seasonal variations along the year and it indicates that energy consumption in
hotel buildings follow close consistency to the meteorological conditions.
105
Chapter 5 Summary and Conclusions
5.1 Summary of Work
An extensive amount of work was carried out on the two hotels chosen as case studies in
this research project. Both the hotels were different in geographical location and the
building type. Hotel 1 was a high rise building located in an urban area while Hotel 2
was a villa type hotel spread across the coastal area. The number of guest rooms in Hotel
2 was higher than in Hotel 1. Being a bigger hotel, Hotel 2 generally had larger energy
consumption.
Firstly, an energy audit was carried out to estimate the energy consumption in different
sections of the hotel. Estimated duty cycles with the power rating of all energy
consuming devices in all the sections were noted according to Table 4.6. The hotels
monthly guest occupancy was used to determine the energy consumption in the guest
rooms. Following that, the nominal energy consumption had to be normalized to actual
value to match the true energy consumption as per the utility bill using Equation 3.5.
Table 4.7 shows the total energy consumption distributed in all the sections according to
the estimates of energy use.
From these sectional distributions, a sector wise analysis of energy consumption was
achieved. A total of 3 sectors, namely production, services and management were
formed from the different sections of the hotel. Energy efficient devices were assumed
to be retrofitted with the current technologies to foster energy savings and hence reduced
utility costs.
It was assumed that the hotels were retrofitted with more energy efficient equipment and
the analysis was carried out with a re-audit of the hotel. The guest comfort is of
paramount importance to the hotels outlook, thus not all the devices can be
compromised to be replaced. After the re-audit, the energy consumption was again
normalized via Equation 3.6 to yield the energy savings possible via retrofits in Table
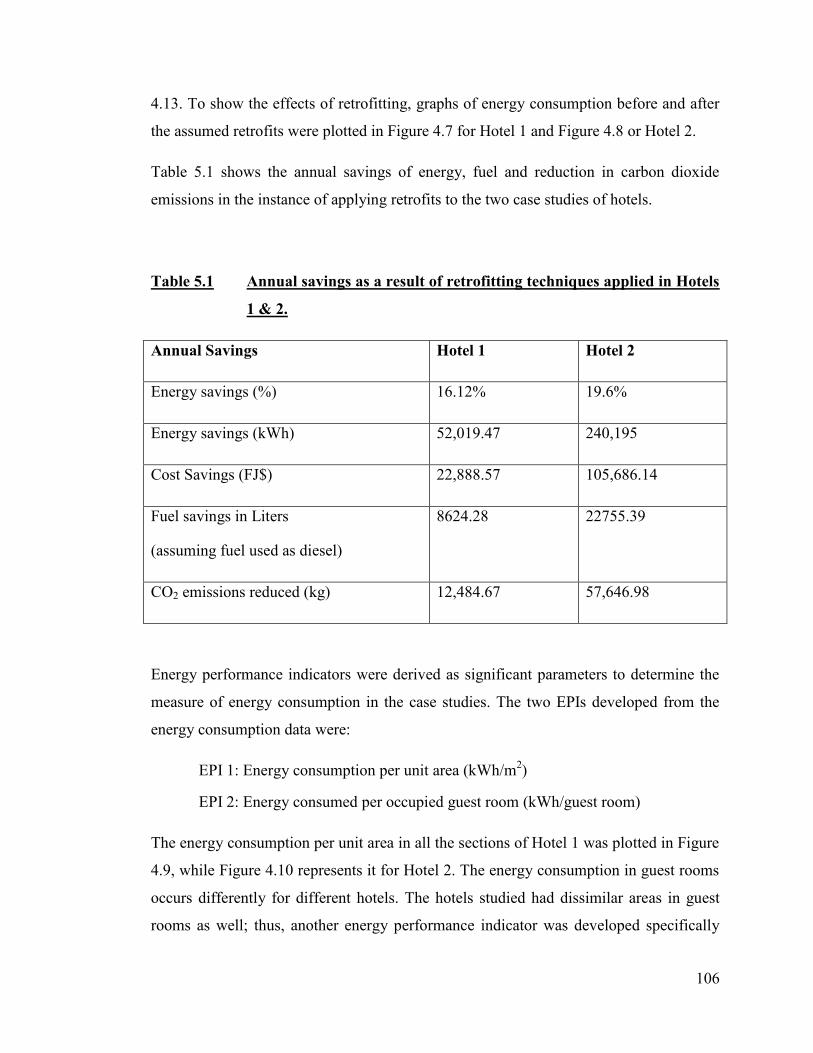
106
4.13. To show the effects of retrofitting, graphs of energy consumption before and after
the assumed retrofits were plotted in Figure 4.7 for Hotel 1 and Figure 4.8 or Hotel 2.
Table 5.1 shows the annual savings of energy, fuel and reduction in carbon dioxide
emissions in the instance of applying retrofits to the two case studies of hotels.
Table 5.1 Annual savings as a result of retrofitting techniques applied in Hotels
1 & 2.
Annual Savings Hotel 1 Hotel 2
Energy savings (%) 16.12% 19.6%
Energy savings (kWh) 52,019.47 240,195
Cost Savings (FJ$) 22,888.57 105,686.14
Fuel savings in Liters
(assuming fuel used as diesel)
8624.28 22755.39
CO2 emissions reduced (kg) 12,484.67 57,646.98
Energy performance indicators were derived as significant parameters to determine the
measure of energy consumption in the case studies. The two EPIs developed from the
energy consumption data were:
EPI 1: Energy consumption per unit area (kWh/m2)
EPI 2: Energy consumed per occupied guest room (kWh/guest room)
The energy consumption per unit area in all the sections of Hotel 1 was plotted in Figure
4.9, while Figure 4.10 represents it for Hotel 2. The energy consumption in guest rooms
occurs differently for different hotels. The hotels studied had dissimilar areas in guest
rooms as well; thus, another energy performance indicator was developed specifically
107
for the guest rooms as EPI 2. An interesting feature to note in the plot of EPI 2 values
was that both hotels 1 and 2 showed similar correlations to the seasonal ambient
temperature variations as revealed in Figure 4.13. This phenomenon is possibly due to
the air conditioning unit being the highest energy consuming device in the guest room..
This is direct evidence that in the tropical climate of Fiji, space cooling is more
important than any space heating requirement. Thus the cooler season in Fiji shows
lower energy consumption in an occupied guest room, as evidenced by the dip in the
respective curves of Fig 4.13 during the winter months..
The usefulness of the technique of EPIs is discussed in chapter 4, section 4.6. Energy
performance indicators can be used to predict energy consumption in an arbitrary hotel
with a similar structure as that of the case study. An example in the form of a problem
statement was looked at, calculating the estimated energy consumption and the energy
bill if connected to the national grid.
A cooling load model provided a mathematical expression to evaluate the power
required to reduce the heat energy in cooling a building to a desired temperature for the
occupants. The components of the cooling load were discussed with sample calculations
in Section 4.7 of chapter 4. This model was applied to the two hotels studied and the
cooling loads were calculated for each.
A literature survey to show the energy consumption values in hotels from different parts
of the world was tabulated. This was used to compare the energy consumption with
respect to the two Pacific hotels from Fiji.
5.2 Conclusion
This research was designed to study the energy consumption of hotels in the PICs with a
view to implementing energy efficiency measures to lower the energy use. We intended
to do this by carrying out an energy audit and develop an energy consumption model in
terms of Energy Performance Indicators (EPIs). We have been successful in carrying out
this objective and this shows that retrofitting shows a significant amount of energy
savings. We have demonstrated the use of this model by estimating the energy
108
consumption of a hotel with a similar building envelope of a number of hotel guest
rooms.
Using the analysis of the case studies, this modeling exercise has shown that villa type
hotel is more energy expensive than the high rise building. From this limited set of data,
it is too early to make a general presumption. A more extensive research of data
collection needs to be carried out so that we have a larger sample of hotels with similar
building envelopes such as villa – type and high rise buildings which will enable us to
make a general conclusion. The implementation of retrofitting and exercising general
energy discipline is a key towards energy conservation and energy economy. This
research shows that energy modeling is a very useful technique that provides us with the
energy consumption and the estimated energy savings.
It should be noted that this research was based on preliminary outcomes of energy audits
carried out on two hotels in Fiji. This data, while highly informative, is insufficient for
the purpose of drawing general conclusions for the whole of the Pacific region. There is
a need to extend this study to other hotels and perhaps to other PICs to obtain a better
picture of how hotels in these countries use energy, and how energy savings can be
made. This is especially important since the demand for the imported fossil fuels has
been growing over the years.
The use of energy oriented software such as EQuest and EnergyPlus can also be
employed to get a better image of energy consumption in buildings. In addition, a need
exists to consider the energy policies that are usually promulgated by countries in their
effort to combat issues of rising energy consumption, carbon dioxide emissions and
climate change.
Pacific Island Countries in the tropical zone possess good renewable energy resources.
The use of renewable energy will promote significant economic growth in these
developing island states in reducing the imported fossil fuels. A greater effort should be
put to realize the importance of renewable energy resources in providing the energy
needs of Pacific hotels as well as the rest of the Pacific economies. Thus, the
incorporation of renewable energy technologies in the current energy generation mix

109
needs to be taken more seriously. This will not only improve the sustainability of the
nation‘s economy but also improve the carbon footprint by the reduction in carbon
dioxide emissions. In Fiji, hydropower contributes the highest amount of energy (about
63%) from renewable sources. However, there are significant potentials to use solar and
wind energy as well. More research and feasibility studies are needed to evaluate the
role of these other renewable energy sources in increasing the ratio of RE in the
generation mix of the country. As hotels are major users of energy, any such change is
very likely to have a positive impact on the sustainable development of this industry as a
whole.
110
Bibliography
Aldawoud, A. 2013. Conventional fixed shading devices in comparison to an
electrochromic glazing system in hot, dry climate. Energy and Buildings, 59, 104-110.
Beatriz Rossello´-Batle, Moia, A., Cladera, A. & Martı´nez, V. C. 2010. Energy use,
CO2 emissions and waste throughout the life cycle of a sample of hotels in the Balearic
Islands. Energy and Buildings, 42, 547-558.
Bohdanowicz, P. & Martinac, I. 2007. Determinants and benchmarking of resource
consumption in hotels—Case study of Hilton International and Scandic in Europe.
Energy and Buildings, 39, 82-95.
Boyd, G., Dutrow, E. & Tunnessen, W. 2008. The evolution of the ENERGY STAR
energy performance indicator for benchmarking industrial plant manufacturing energy
use. Journal of Cleaner Production, 16, 709-715.
Causone, F., Corgnati, S. P., Filippi, M. & Olesen, B. W. 2010. Solar Radiation and
cooling load calculation for radiant systems: Defintion and evaluation of the Direct Solar
Load. Energy and Buildings, 42, 305-314.
Chandra, P. 2013. Fiji Imported over $1.13b worth of mineral fuel. [Accessed
14/10/2013].
Chua, K. J. & S.K.Chou 2010. Energy performance of residential buildings in
Singapore. Energy, 35, 667-678.
Deng, S.-M. & Burnett, J. 2000. A study of energy performance of hotel buildings in
Hong Kong. Energy and Buildings, 31, 7-12.
Diakaki, C., Grigorous, E., Kabelis, N., Kolokotsa, D., Kalaitzakis, K. & Stavrakakis, G.
2010. A multi-objective decision model for the improvement of energy efficiency in
buildings. Energy, 35, 5483-5496.
Dinola, R., Britt, M. & Makela, E. 2014. Incorporation of the Energy Efficiency into the
National Building Code, Phase 1 Status Report and Recommendations. New Buildings
Institute.
Duperyrat, P., Menezo, C. & Fortuin, S. 2014. Study of the thermal and electrical
performances of PVT solar hot water system. Energy and Buildings, 68, 751-755.
Edwards, E. E., Iyare, O. S. & Moseley, L. L. 2012. Energy consumption in typical
Caribbean office buildings: A potential short term solution to energy concerns.
Renewable Energy, 39, 154-161.
111
Emeka Efe Osaji, John Hudson & Chynoweth, P. 2007. Exploration of the Energy
Efficiency of the Greater London Authority Building (GLA Building/City Hall). Journal
of Applied Sciences and Environmental Management, 11, 53-56.
Escudero, C., Martin, K., Erkoreka, A., Flores, I. & Sala, J. M. 2013. Experimental
thermal characterization of radiant barriers for building insulation. Energy and
Buildings, 59, 62-72.
Evarts, J. C. & Swan, L. G. 2013. Domestic hot water consumption estimates for solar
thermal system sizing. Energy and Buildings, 58, 58-65.
FEA 2012. Annual Report 2012. Fiji Electricity Authority.
Goncalves, P., Gaspar, A. R. & Silva, M. G. D. 2012. Energy and Exergy based
indicators for the energy performance assessment of a hotel building. Energy and
Buildings, 52, 181-188.
Gossling, S., Peeters, P., Ceron, J.-P., Dubois, G., Patterson, T. & Richardson, R. B.
2005. The eco-efficiency of tourism. Ecological Economics, 54, 417-434.
H.J.Han, Y.I.Jeon, S.H.Lim, W.W.Kim & K.Chen. 2010. New developments in
illumination, heating and cooling technologies for energy-efficient buildings. Energy,
35, 2647-2653.
Halkos, G. E. & Tzeremes, N. G. 2011. Oil consumption and economic efficiency: A
comparative analysis of advanced, developing and emerging economies. Ecological
Economics, 70, 1354-1362.
Hansen, J., Sato, M., Kharecha, P., Beerling, D., Berner, R., Masson-Delmotte, V.,
Pagani, M., Raymo, M., Royer, D. L. & Zachos, J. C. 2008. Target Atmospheric CO2:
Where Should Humanity Aim? Available:
http://arxiv.org/ftp/arxiv/papers/0804/0804.1126.pdf.
Harvey, L. D. D. 2006. A Handbook on Low-Energy Buildings and District-Energy
Systems, London, UK, Earthscan.
Harvey, L. D. D. 2010. Energy Efficiency and the Demand for Energy Services, London,
UK, Earthscan.
Herzog, P. 1997. Energy-Efficient Operation of Commercial Buildings, McGraw Hill
Companies, Inc.
Hunter, C. 2002. Sustainable tourism and the touristic ecological footprint. Environment,
Development and Sustainability, 4, 7-20.
112
II, I. W. G. 2014a. IPCC Assessment Report 5 Volume II: Global and Sectoral Aspects.
Chapter 5 Coastal Systems and Low-Lying Areas Available: http://ipcc-
wg2.gov/AR5/images/uploads/WGIIAR5-Chap5_FGDall.pdf.
II, I. W. G. 2014b. IPCC Assessment Report 5 Volume II: Regional Aspects. Chapter 29
Small Islands. Available: http://ipcc-wg2.gov/AR5/images/uploads/WGIIAR5-
Chap29_FGDall.pdf.
IPCC 2014. IPCC Fifth Assessment Synthesis Report.
J. Buck & Young, D. 2007. The Potential for energy efficiency gains in the Canadian
commercial building sector: A stochastic frontier study. Energy, 32, 1769-1780.
Johnston, P. 2012. Pacific Perspectives on the Challenges to Energy Security and the
Sustainable Use of Energy.
Kharrufa, S. N. & Adil, Y. 2012. Upgrading the building envelope to reduce cooling
loads. Energy and Buildings, 55, 389-396.
Kolokotroni, M., Gowreesunker, B. L. & Giridharan, R. 2013. Cool Roof Technology:
An Experimental and modelling study. Energy and Buildings, 67, 658-667.
M. Santamouris, C.A. Balaras, E. Dascalaki, A. Argiriou & Gaglia, A. 1996. Energy
conservation and retrofitting potential in Hellenic hotels. Energy and Buildings, 24, 65-
75.
Manish, S., Pillai, I. R. & Banerjee, R. 2006. Sustainability analysis of renewable for
climate change mitigation. Energy for Sustainable Development, X, 25-36.
Marco Beccali, Maria La Gennusa, Leornardo Lo Coco & Rizzo, G. 2009. An Empirical
approach for ranking enviromental and energy saving measures in the hotel sector.
Renewable Energy, 34, 82-90.
Mcgoon, G. 2013. Fiji's Petroleum Imports grows. Available:
www.fijivillage.com/?mod=story&id=0304132f7abd008ce33cf8bda7af9 [Accessed
3/4/2013].
Meckler, M. 1984. Retrofitting of Commercial, Institutional and Industrial Buildings for
Energy Conservation, New York, Van Nostrand Reinhold Company Inc.
Mingotti, N., Chenvidyakrn, T. & Woods, A. W. 2013. Combined impacts of climate
and wall insulation on the energy benefit of an extra layer of glazing in the facade.
Energy and Buildings, 58, 237-249.
Mofor, L., Isaka, M., Wade, H. & Soakai, A. 2013. Pacific Lighthouses Renewable
Energy Roadmapping for Islands. IRENA.
113
NATIONS, U. 2003. A Guide to Efficient Energy Management in the Tourism Sector,
New York, United Nations.
Nave, R. 2014. Available: http://hyperphysics.phy-
astr.gsu.edu/hbase/thermo/carnot.html#c1 [Accessed 7/1/2014.
Niles, K. & Lloyd, B. 2013. Small Island Developing States (SIDS) & Energy Aid:
Impacts on the energy sector in the Caribbean and the Pacific. Energy for Sustainable
Development, 17, 521-530.
O'Callaghan, P. 1993. Energy Management, McGraw Hill International Ltd.
Onut, S. & Soner, S. 2006. Energy efficiency assessment for the Antalya Region hotels
in Turkey. Energy and Buildings, 38, 964-971.
Priyadarsini, R., Xuchao, W. & Eang, L. S. 2009. A study on energy performance of
htoel buildings in Singapore. Energy and Buildings, 41, 1319-1324.
Ramesh, T., Prakash, R. & Shukla, K. K. 2012. Life cycle energy analysis of a
residential building with different envelopes and climates in Indian context. Applied
Energy, 89, 193-202.
REN21 2013. REN21 Renewable 2013 Global Status Report.
S.Chirarattananon, P.Chaiwiwatworakul, V.D.Hien, P.Rakkwamsuk & K.Kubaha 2010.
Assessment of energy from the revised building energy code of Thailand. Energy, 35,
1741-1753.
S.E.Chidiac, E.J.Catania, E.Morofsky & S.Foo 2011. Effectiveness of single and
multiple energy retrofit measures on the energy consumption of office buildings.
Energy, 36, 5037-5052.
Schleich, J. 2009. Barriers to energy efficiency: A comparison across the German
commercial and services sector. Ecological Economics, 68, 2150-2159.
SECRETARIAT, I. 2011. Renewable Energy Country Profiles Pacific.
Singh, A. 2011. Renewable energy in the Pacific Island countries: resources, policies
and issues. Management of Environmental Quality: An International Journal, 23, 254-
263.
Sorrell, S. 2007. The Rebound Effect: an assessment of the evidence for economy-wide
energy savings from improved energy efficiency. Sussex Energy Group.
Sozer, H. 2010. Improving energy efficiency through the design of the building
envelope. Buildings and Environment, 45, 2581-2593.
114
SPC 2011. Towards an Energy Secure Pacific, A Framework for Action on Energy
Security in the Pacific. Secretariat of the Pacific Community.
Statistics, F. B. O. 2012a. Fiji Tourism and Migration Report 2007-2010. Suva, Fiji: Fiji
Bureau of Statistics.
Statistics, F. B. O. 2012b. Key Statistics. Suva, Fiji: Fiji Bureau of Statistics.
Susanne Becken, Chris Frampton & Simmons, D. 2001. Energy consumption patterns in
the accommodation sector-the New Zealand case. Ecological Economics, 39, 371-386.
Taylor, S., Peacock, A., Bansfill, P. & Shao, L. 2010. Reduction of greenhouse gas
emissions from UK Hotels in 2030. Buildings and Environment, 45, 1389-1400.
Uddin, M.N. & Abera, F. 2009 Efficiency optimisation based speed control of IPMSM
drive, Int. J. Industrial Electronics and Drives, Vol 1, No. 1 pp. 34 - 41.
W.Mungwititkul & Mohanty, B. 1997. Energy efficiency of office equipment in
commercial buildings: The case of Thailand. Energy, 22, 673-680.
Wang, J. C. 2012. A study on the energy perfromance of hotel buildings in Taiwan.
Energy and Buildings, 49, 268-275.
Wong, S. L., Wan, K. K. W., Li, D. H. W. & Lam, J. C. 2010. Impacts of climate change
on residential building envelope cooling loads in subtropical climates. Energy and
Buildings, 42, 2098-2103.
World Tourism ORGANIZATION, 2003. A Guide to Efficient Energy Management in
the Tourism Sector, New York, United Nations.
Wyett, K. 2014. Escaping a Rising Tide: Sea Level Rise and Migration in Kiribati. Asia
& the Pacific Policy Studies, 1, 171 - 185.
Xydis, G., Koroneos, C. & Polyzakis, A. 2009. Energy and Exergy analysis of the Greek
hotel sector: An Application. Energy and Buildings, 41, 402-406.
Yajuan Xin, Shilei Lu, Neng Zhu & Wu, W. 2012. Energy consumption quota of four
and five star luxury hotel buildings in Hainan province, China. Energy and Buildings,
42, 250-256.
Yu, F. W. & Chan, K. T. 2010. Economic benefits of optimal control for water-cooled
chiller systems serving hotels in a subtropical climate. Energy and Buildings, 42, 203-
209.
Yu, X. & Taplin, R. 1997. A Survey: International aid for renewable energy in the
Pacific Islands since the 1970s. Energy Policy, 25, 501-516.
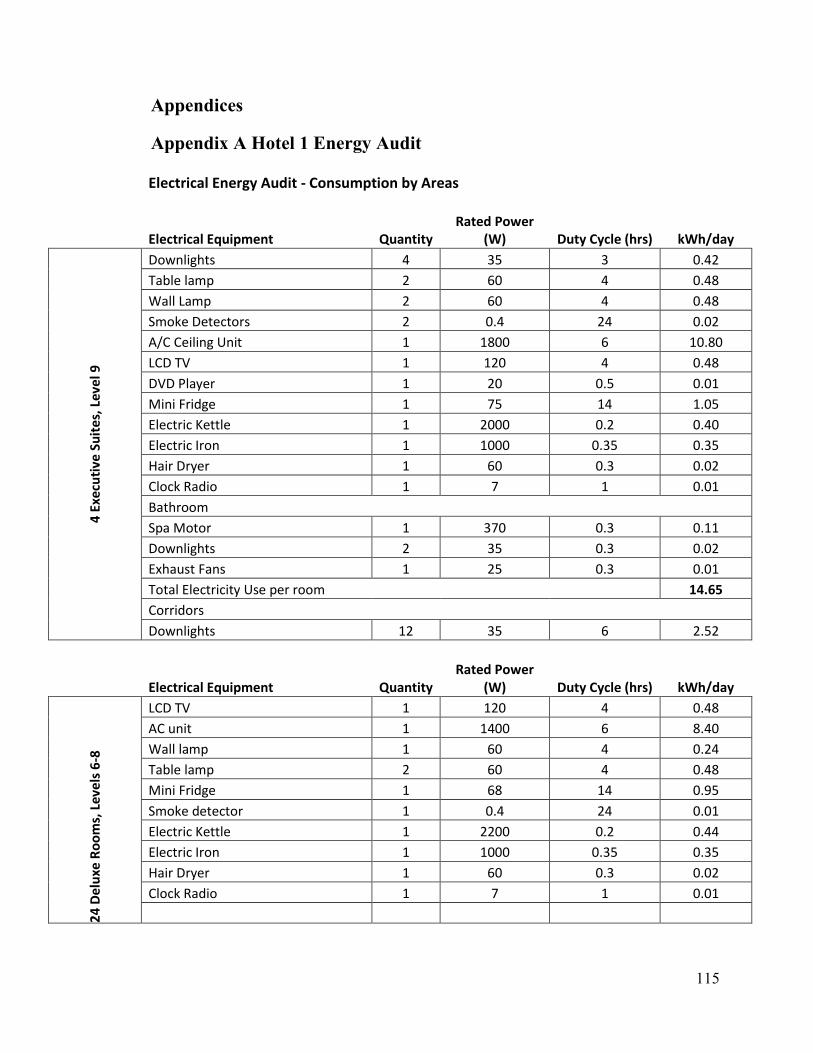
115
Appendices
Appendix A Hotel 1 Energy Audit
Electrical Energy Audit - Consumption by Areas
Electrical Equipment Quantity Rated Power
(W) Duty Cycle (hrs) kWh/day
4 E
xecu
tive
Su
ite
s, L
eve
l 9
Downlights 4 35 3 0.42
Table lamp 2 60 4 0.48
Wall Lamp 2 60 4 0.48
Smoke Detectors 2 0.4 24 0.02
A/C Ceiling Unit 1 1800 6 10.80
LCD TV 1 120 4 0.48
DVD Player 1 20 0.5 0.01
Mini Fridge 1 75 14 1.05
Electric Kettle 1 2000 0.2 0.40
Electric Iron 1 1000 0.35 0.35
Hair Dryer 1 60 0.3 0.02
Clock Radio 1 7 1 0.01
Bathroom
Spa Motor 1 370 0.3 0.11
Downlights 2 35 0.3 0.02
Exhaust Fans 1 25 0.3 0.01
Total Electricity Use per room 14.65
Corridors
Downlights 12 35 6 2.52
Electrical Equipment Quantity Rated Power
(W) Duty Cycle (hrs) kWh/day
24
De
luxe
Ro
om
s, L
evel
s 6
-8
LCD TV 1 120 4 0.48
AC unit 1 1400 6 8.40
Wall lamp 1 60 4 0.24
Table lamp 2 60 4 0.48
Mini Fridge 1 68 14 0.95
Smoke detector 1 0.4 24 0.01
Electric Kettle 1 2200 0.2 0.44
Electric Iron 1 1000 0.35 0.35
Hair Dryer 1 60 0.3 0.02
Clock Radio 1 7 1 0.01
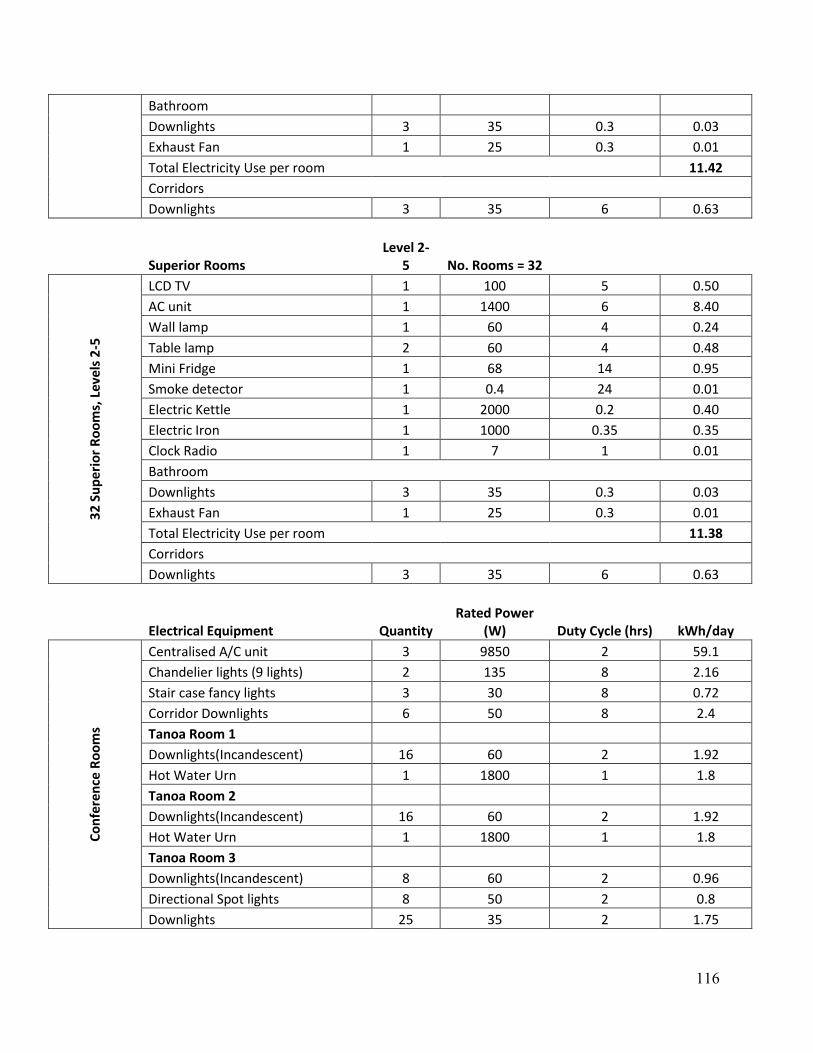
116
Bathroom
Downlights 3 35 0.3 0.03
Exhaust Fan 1 25 0.3 0.01
Total Electricity Use per room 11.42
Corridors
Downlights 3 35 6 0.63
Superior Rooms Level 2-
5 No. Rooms = 32
32
Su
pe
rio
r R
oo
ms,
Lev
els
2-5
LCD TV 1 100 5 0.50
AC unit 1 1400 6 8.40
Wall lamp 1 60 4 0.24
Table lamp 2 60 4 0.48
Mini Fridge 1 68 14 0.95
Smoke detector 1 0.4 24 0.01
Electric Kettle 1 2000 0.2 0.40
Electric Iron 1 1000 0.35 0.35
Clock Radio 1 7 1 0.01
Bathroom
Downlights 3 35 0.3 0.03
Exhaust Fan 1 25 0.3 0.01
Total Electricity Use per room 11.38
Corridors
Downlights 3 35 6 0.63
Electrical Equipment Quantity Rated Power
(W) Duty Cycle (hrs) kWh/day
Co
nfe
ren
ce R
oo
ms
Centralised A/C unit 3 9850 2 59.1
Chandelier lights (9 lights) 2 135 8 2.16
Stair case fancy lights 3 30 8 0.72
Corridor Downlights 6 50 8 2.4
Tanoa Room 1
Downlights(Incandescent) 16 60 2 1.92
Hot Water Urn 1 1800 1 1.8
Tanoa Room 2
Downlights(Incandescent) 16 60 2 1.92
Hot Water Urn 1 1800 1 1.8
Tanoa Room 3
Downlights(Incandescent) 8 60 2 0.96
Directional Spot lights 8 50 2 0.8
Downlights 25 35 2 1.75
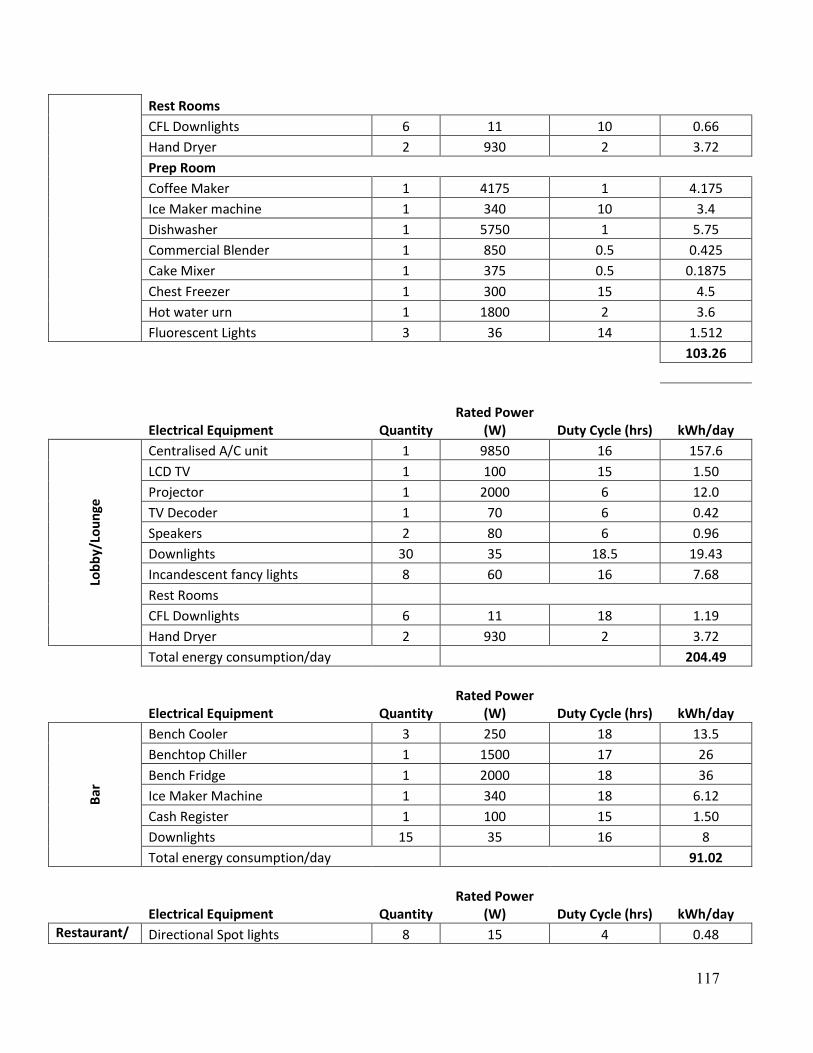
117
Rest Rooms
CFL Downlights 6 11 10 0.66
Hand Dryer 2 930 2 3.72
Prep Room
Coffee Maker 1 4175 1 4.175
Ice Maker machine 1 340 10 3.4
Dishwasher 1 5750 1 5.75
Commercial Blender 1 850 0.5 0.425
Cake Mixer 1 375 0.5 0.1875
Chest Freezer 1 300 15 4.5
Hot water urn 1 1800 2 3.6
Fluorescent Lights 3 36 14 1.512
103.26
Electrical Equipment Quantity Rated Power
(W) Duty Cycle (hrs) kWh/day
Lob
by/
Lou
nge
Centralised A/C unit 1 9850 16 157.6
LCD TV 1 100 15 1.50
Projector 1 2000 6 12.0
TV Decoder 1 70 6 0.42
Speakers 2 80 6 0.96
Downlights 30 35 18.5 19.43
Incandescent fancy lights 8 60 16 7.68
Rest Rooms
CFL Downlights 6 11 18 1.19
Hand Dryer 2 930 2 3.72
Total energy consumption/day 204.49
Electrical Equipment Quantity Rated Power
(W) Duty Cycle (hrs) kWh/day
Bar
Bench Cooler 3 250 18 13.5
Benchtop Chiller 1 1500 17 26
Bench Fridge 1 2000 18 36
Ice Maker Machine 1 340 18 6.12
Cash Register 1 100 15 1.50
Downlights 15 35 16 8
Total energy consumption/day 91.02
Electrical Equipment Quantity Rated Power
(W) Duty Cycle (hrs) kWh/day
Restaurant/Dining Area
Directional Spot lights 8 15 4 0.48
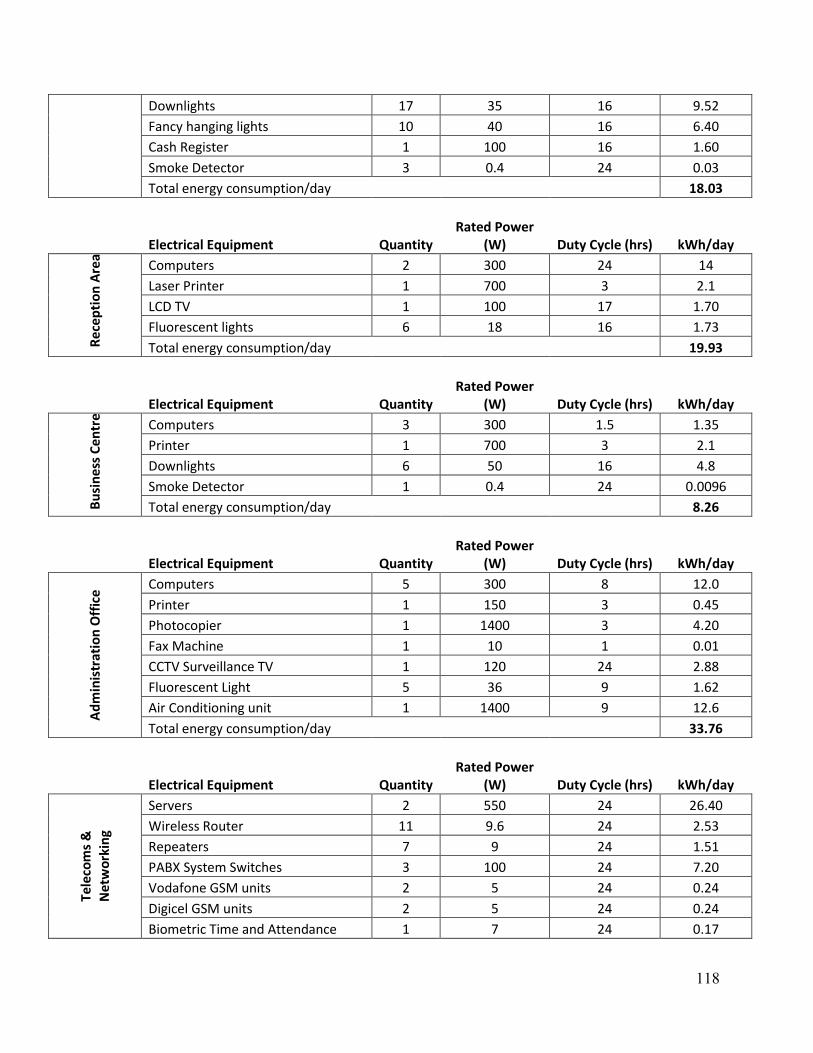
118
Downlights 17 35 16 9.52
Fancy hanging lights 10 40 16 6.40
Cash Register 1 100 16 1.60
Smoke Detector 3 0.4 24 0.03
Total energy consumption/day 18.03
Electrical Equipment Quantity Rated Power
(W) Duty Cycle (hrs) kWh/day
Re
cep
tio
n A
rea
Computers 2 300 24 14
Laser Printer 1 700 3 2.1
LCD TV 1 100 17 1.70
Fluorescent lights 6 18 16 1.73
Total energy consumption/day 19.93
Electrical Equipment Quantity Rated Power
(W) Duty Cycle (hrs) kWh/day
Bu
sin
ess
Ce
ntr
e
Computers 3 300 1.5 1.35
Printer 1 700 3 2.1
Downlights 6 50 16 4.8
Smoke Detector 1 0.4 24 0.0096
Total energy consumption/day 8.26
Electrical Equipment Quantity Rated Power
(W) Duty Cycle (hrs) kWh/day
Ad
min
istr
atio
n O
ffic
e
Computers 5 300 8 12.0
Printer 1 150 3 0.45
Photocopier 1 1400 3 4.20
Fax Machine 1 10 1 0.01
CCTV Surveillance TV 1 120 24 2.88
Fluorescent Light 5 36 9 1.62
Air Conditioning unit 1 1400 9 12.6
Total energy consumption/day 33.76
Electrical Equipment Quantity Rated Power
(W) Duty Cycle (hrs) kWh/day
Tele
com
s &
Net
wo
rkin
g
Servers 2 550 24 26.40
Wireless Router 11 9.6 24 2.53
Repeaters 7 9 24 1.51
PABX System Switches 3 100 24 7.20
Vodafone GSM units 2 5 24 0.24
Digicel GSM units 2 5 24 0.24
Biometric Time and Attendance 1 7 24 0.17
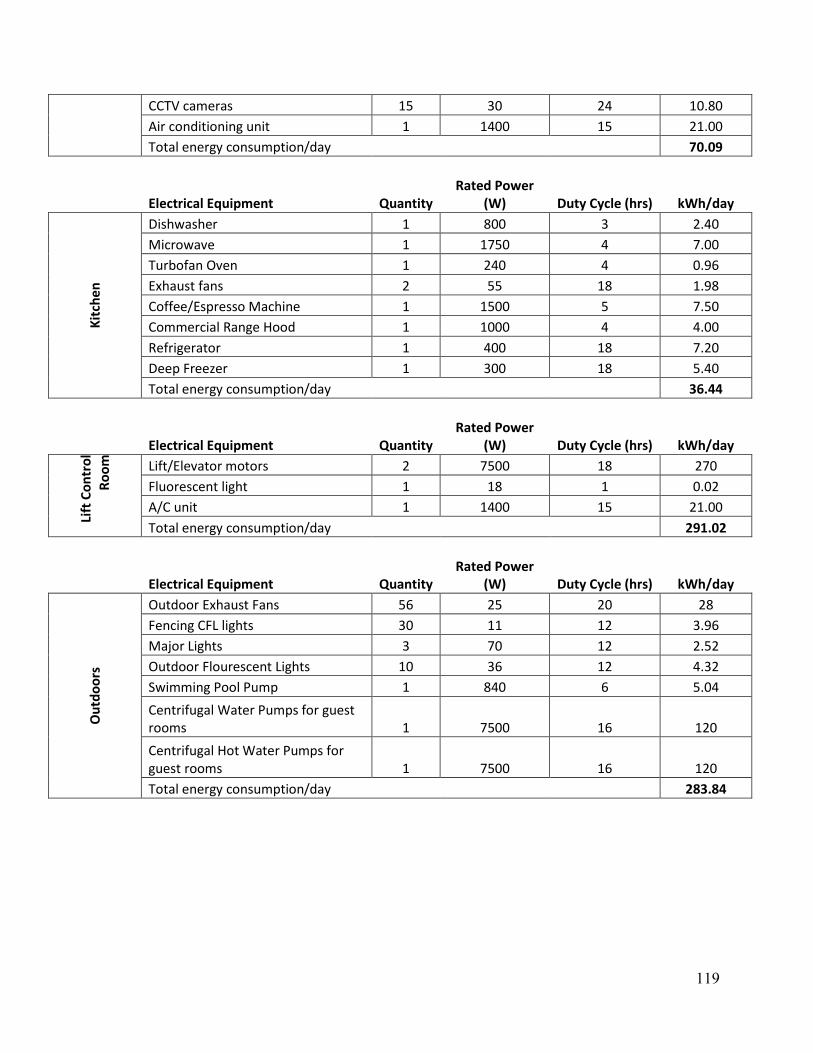
119
CCTV cameras 15 30 24 10.80
Air conditioning unit 1 1400 15 21.00
Total energy consumption/day 70.09
Electrical Equipment Quantity Rated Power
(W) Duty Cycle (hrs) kWh/day
Kit
chen
Dishwasher 1 800 3 2.40
Microwave 1 1750 4 7.00
Turbofan Oven 1 240 4 0.96
Exhaust fans 2 55 18 1.98
Coffee/Espresso Machine 1 1500 5 7.50
Commercial Range Hood 1 1000 4 4.00
Refrigerator 1 400 18 7.20
Deep Freezer 1 300 18 5.40
Total energy consumption/day 36.44
Electrical Equipment Quantity Rated Power
(W) Duty Cycle (hrs) kWh/day
Lift
Co
ntr
ol
Ro
om
Lift/Elevator motors 2 7500 18 270
Fluorescent light 1 18 1 0.02
A/C unit 1 1400 15 21.00
Total energy consumption/day 291.02
Electrical Equipment Quantity Rated Power
(W) Duty Cycle (hrs) kWh/day
Ou
tdo
ors
Outdoor Exhaust Fans 56 25 20 28
Fencing CFL lights 30 11 12 3.96
Major Lights 3 70 12 2.52
Outdoor Flourescent Lights 10 36 12 4.32
Swimming Pool Pump 1 840 6 5.04
Centrifugal Water Pumps for guest rooms 1 7500 16 120
Centrifugal Hot Water Pumps for guest rooms 1 7500 16 120
Total energy consumption/day 283.84
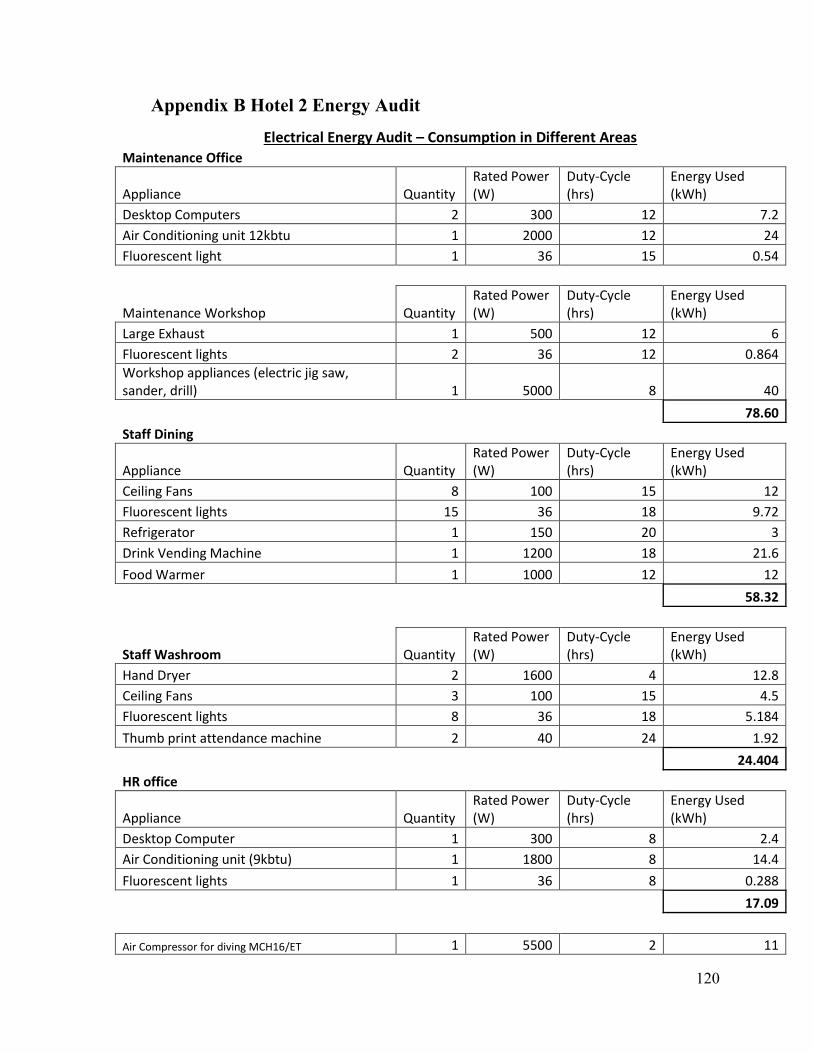
120
Appendix B Hotel 2 Energy Audit
Electrical Energy Audit – Consumption in Different Areas Maintenance Office
Appliance Quantity Rated Power (W)
Duty-Cycle (hrs)
Energy Used (kWh)
Desktop Computers 2 300 12 7.2
Air Conditioning unit 12kbtu 1 2000 12 24
Fluorescent light 1 36 15 0.54
Maintenance Workshop Quantity Rated Power (W)
Duty-Cycle (hrs)
Energy Used (kWh)
Large Exhaust 1 500 12 6
Fluorescent lights 2 36 12 0.864
Workshop appliances (electric jig saw, sander, drill) 1 5000 8 40
78.60
Staff Dining
Appliance Quantity Rated Power (W)
Duty-Cycle (hrs)
Energy Used (kWh)
Ceiling Fans 8 100 15 12
Fluorescent lights 15 36 18 9.72
Refrigerator 1 150 20 3
Drink Vending Machine 1 1200 18 21.6
Food Warmer 1 1000 12 12
58.32
Staff Washroom Quantity Rated Power (W)
Duty-Cycle (hrs)
Energy Used (kWh)
Hand Dryer 2 1600 4 12.8
Ceiling Fans 3 100 15 4.5
Fluorescent lights 8 36 18 5.184
Thumb print attendance machine 2 40 24 1.92
24.404
HR office
Appliance Quantity Rated Power (W)
Duty-Cycle (hrs)
Energy Used (kWh)
Desktop Computer 1 300 8 2.4
Air Conditioning unit (9kbtu) 1 1800 8 14.4
Fluorescent lights 1 36 8 0.288
17.09
Air Compressor for diving MCH16/ET 1 5500 2 11
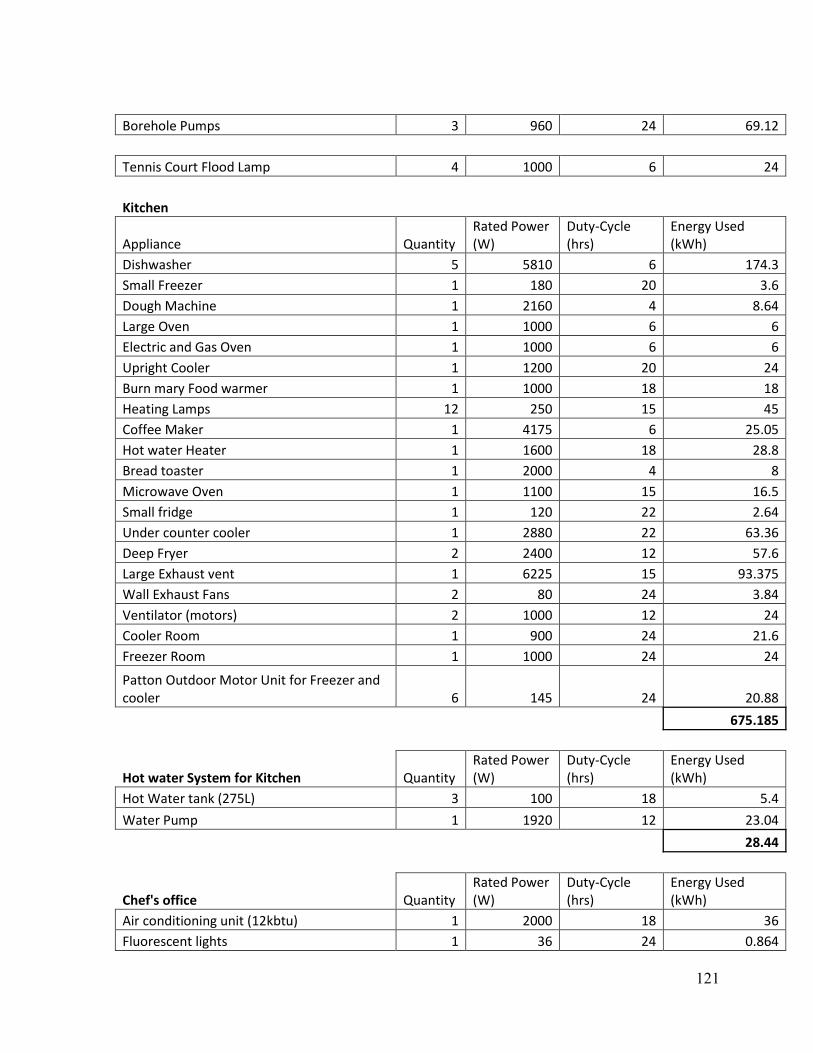
121
Borehole Pumps 3 960 24 69.12
Tennis Court Flood Lamp 4 1000 6 24
Kitchen
Appliance Quantity Rated Power (W)
Duty-Cycle (hrs)
Energy Used (kWh)
Dishwasher 5 5810 6 174.3
Small Freezer 1 180 20 3.6
Dough Machine 1 2160 4 8.64
Large Oven 1 1000 6 6
Electric and Gas Oven 1 1000 6 6
Upright Cooler 1 1200 20 24
Burn mary Food warmer 1 1000 18 18
Heating Lamps 12 250 15 45
Coffee Maker 1 4175 6 25.05
Hot water Heater 1 1600 18 28.8
Bread toaster 1 2000 4 8
Microwave Oven 1 1100 15 16.5
Small fridge 1 120 22 2.64
Under counter cooler 1 2880 22 63.36
Deep Fryer 2 2400 12 57.6
Large Exhaust vent 1 6225 15 93.375
Wall Exhaust Fans 2 80 24 3.84
Ventilator (motors) 2 1000 12 24
Cooler Room 1 900 24 21.6
Freezer Room 1 1000 24 24
Patton Outdoor Motor Unit for Freezer and cooler 6 145 24 20.88
675.185
Hot water System for Kitchen Quantity Rated Power (W)
Duty-Cycle (hrs)
Energy Used (kWh)
Hot Water tank (275L) 3 100 18 5.4
Water Pump 1 1920 12 23.04
28.44
Chef's office Quantity Rated Power (W)
Duty-Cycle (hrs)
Energy Used (kWh)
Air conditioning unit (12kbtu) 1 2000 18 36
Fluorescent lights 1 36 24 0.864
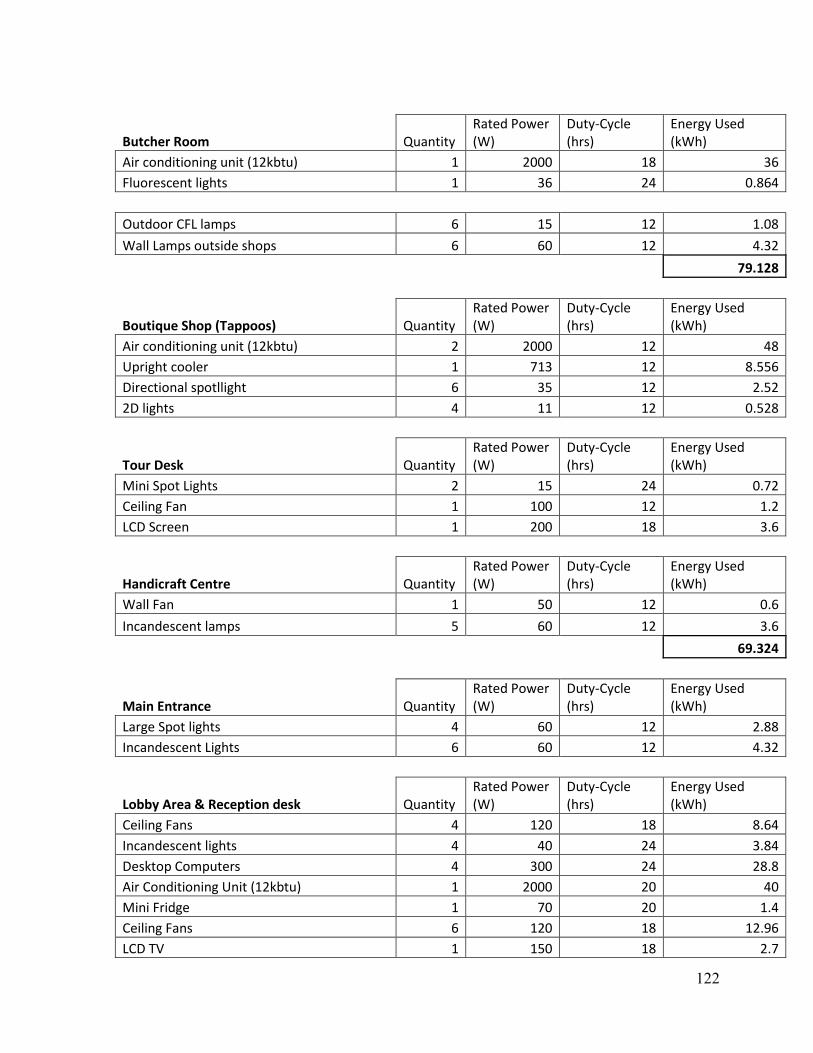
122
Butcher Room Quantity Rated Power (W)
Duty-Cycle (hrs)
Energy Used (kWh)
Air conditioning unit (12kbtu) 1 2000 18 36
Fluorescent lights 1 36 24 0.864
Outdoor CFL lamps 6 15 12 1.08
Wall Lamps outside shops 6 60 12 4.32
79.128
Boutique Shop (Tappoos) Quantity Rated Power (W)
Duty-Cycle (hrs)
Energy Used (kWh)
Air conditioning unit (12kbtu) 2 2000 12 48
Upright cooler 1 713 12 8.556
Directional spotllight 6 35 12 2.52
2D lights 4 11 12 0.528
Tour Desk Quantity Rated Power (W)
Duty-Cycle (hrs)
Energy Used (kWh)
Mini Spot Lights 2 15 24 0.72
Ceiling Fan 1 100 12 1.2
LCD Screen 1 200 18 3.6
Handicraft Centre Quantity Rated Power (W)
Duty-Cycle (hrs)
Energy Used (kWh)
Wall Fan 1 50 12 0.6
Incandescent lamps 5 60 12 3.6
69.324
Main Entrance Quantity Rated Power (W)
Duty-Cycle (hrs)
Energy Used (kWh)
Large Spot lights 4 60 12 2.88
Incandescent Lights 6 60 12 4.32
Lobby Area & Reception desk Quantity Rated Power (W)
Duty-Cycle (hrs)
Energy Used (kWh)
Ceiling Fans 4 120 18 8.64
Incandescent lights 4 40 24 3.84
Desktop Computers 4 300 24 28.8
Air Conditioning Unit (12kbtu) 1 2000 20 40
Mini Fridge 1 70 20 1.4
Ceiling Fans 6 120 18 12.96
LCD TV 1 150 18 2.7
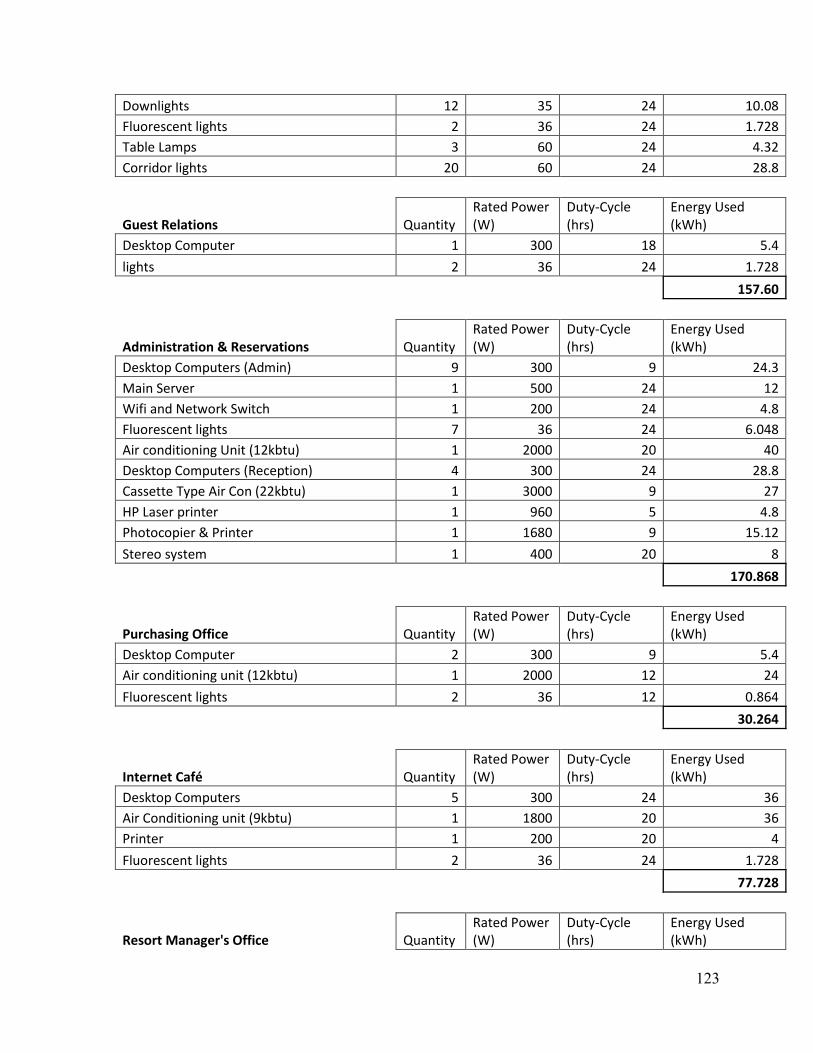
123
Downlights 12 35 24 10.08
Fluorescent lights 2 36 24 1.728
Table Lamps 3 60 24 4.32
Corridor lights 20 60 24 28.8
Guest Relations Quantity Rated Power (W)
Duty-Cycle (hrs)
Energy Used (kWh)
Desktop Computer 1 300 18 5.4
lights 2 36 24 1.728
157.60
Administration & Reservations Quantity Rated Power (W)
Duty-Cycle (hrs)
Energy Used (kWh)
Desktop Computers (Admin) 9 300 9 24.3
Main Server 1 500 24 12
Wifi and Network Switch 1 200 24 4.8
Fluorescent lights 7 36 24 6.048
Air conditioning Unit (12kbtu) 1 2000 20 40
Desktop Computers (Reception) 4 300 24 28.8
Cassette Type Air Con (22kbtu) 1 3000 9 27
HP Laser printer 1 960 5 4.8
Photocopier & Printer 1 1680 9 15.12
Stereo system 1 400 20 8
170.868
Purchasing Office Quantity Rated Power (W)
Duty-Cycle (hrs)
Energy Used (kWh)
Desktop Computer 2 300 9 5.4
Air conditioning unit (12kbtu) 1 2000 12 24
Fluorescent lights 2 36 12 0.864
30.264
Internet Café Quantity Rated Power (W)
Duty-Cycle (hrs)
Energy Used (kWh)
Desktop Computers 5 300 24 36
Air Conditioning unit (9kbtu) 1 1800 20 36
Printer 1 200 20 4
Fluorescent lights 2 36 24 1.728
77.728
Resort Manager's Office Quantity Rated Power (W)
Duty-Cycle (hrs)
Energy Used (kWh)
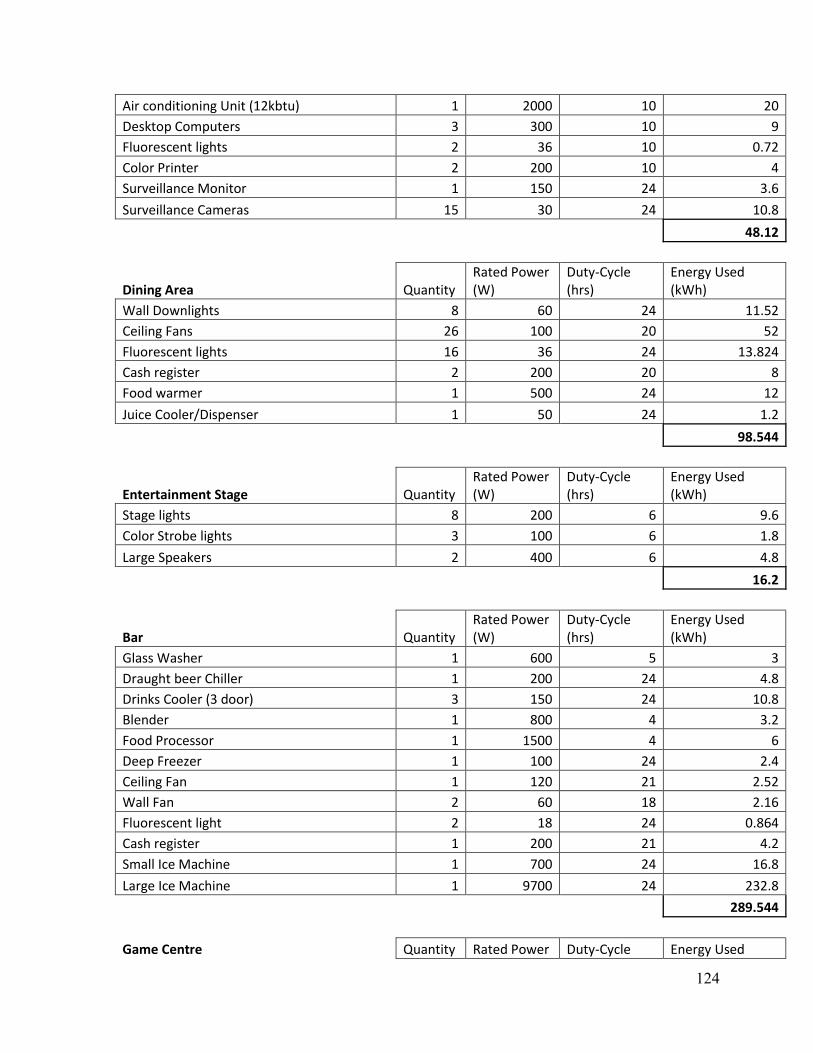
124
Air conditioning Unit (12kbtu) 1 2000 10 20
Desktop Computers 3 300 10 9
Fluorescent lights 2 36 10 0.72
Color Printer 2 200 10 4
Surveillance Monitor 1 150 24 3.6
Surveillance Cameras 15 30 24 10.8
48.12
Dining Area Quantity Rated Power (W)
Duty-Cycle (hrs)
Energy Used (kWh)
Wall Downlights 8 60 24 11.52
Ceiling Fans 26 100 20 52
Fluorescent lights 16 36 24 13.824
Cash register 2 200 20 8
Food warmer 1 500 24 12
Juice Cooler/Dispenser 1 50 24 1.2
98.544
Entertainment Stage Quantity Rated Power (W)
Duty-Cycle (hrs)
Energy Used (kWh)
Stage lights 8 200 6 9.6
Color Strobe lights 3 100 6 1.8
Large Speakers 2 400 6 4.8
16.2
Bar Quantity Rated Power (W)
Duty-Cycle (hrs)
Energy Used (kWh)
Glass Washer 1 600 5 3
Draught beer Chiller 1 200 24 4.8
Drinks Cooler (3 door) 3 150 24 10.8
Blender 1 800 4 3.2
Food Processor 1 1500 4 6
Deep Freezer 1 100 24 2.4
Ceiling Fan 1 120 21 2.52
Wall Fan 2 60 18 2.16
Fluorescent light 2 18 24 0.864
Cash register 1 200 21 4.2
Small Ice Machine 1 700 24 16.8
Large Ice Machine 1 9700 24 232.8
289.544
Game Centre Quantity Rated Power Duty-Cycle Energy Used
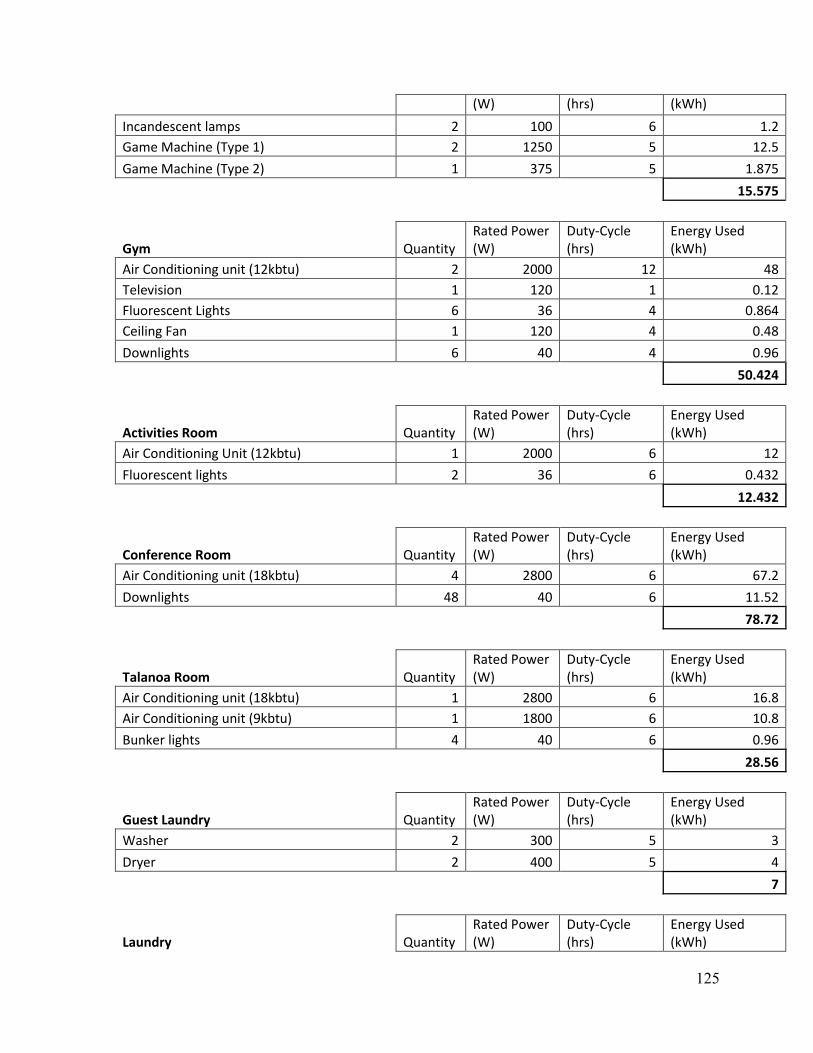
125
(W) (hrs) (kWh)
Incandescent lamps 2 100 6 1.2
Game Machine (Type 1) 2 1250 5 12.5
Game Machine (Type 2) 1 375 5 1.875
15.575
Gym Quantity Rated Power (W)
Duty-Cycle (hrs)
Energy Used (kWh)
Air Conditioning unit (12kbtu) 2 2000 12 48
Television 1 120 1 0.12
Fluorescent Lights 6 36 4 0.864
Ceiling Fan 1 120 4 0.48
Downlights 6 40 4 0.96
50.424
Activities Room Quantity Rated Power (W)
Duty-Cycle (hrs)
Energy Used (kWh)
Air Conditioning Unit (12kbtu) 1 2000 6 12
Fluorescent lights 2 36 6 0.432
12.432
Conference Room Quantity Rated Power (W)
Duty-Cycle (hrs)
Energy Used (kWh)
Air Conditioning unit (18kbtu) 4 2800 6 67.2
Downlights 48 40 6 11.52
78.72
Talanoa Room Quantity Rated Power (W)
Duty-Cycle (hrs)
Energy Used (kWh)
Air Conditioning unit (18kbtu) 1 2800 6 16.8
Air Conditioning unit (9kbtu) 1 1800 6 10.8
Bunker lights 4 40 6 0.96
28.56
Guest Laundry Quantity Rated Power (W)
Duty-Cycle (hrs)
Energy Used (kWh)
Washer 2 300 5 3
Dryer 2 400 5 4
7
Laundry Quantity Rated Power (W)
Duty-Cycle (hrs)
Energy Used (kWh)
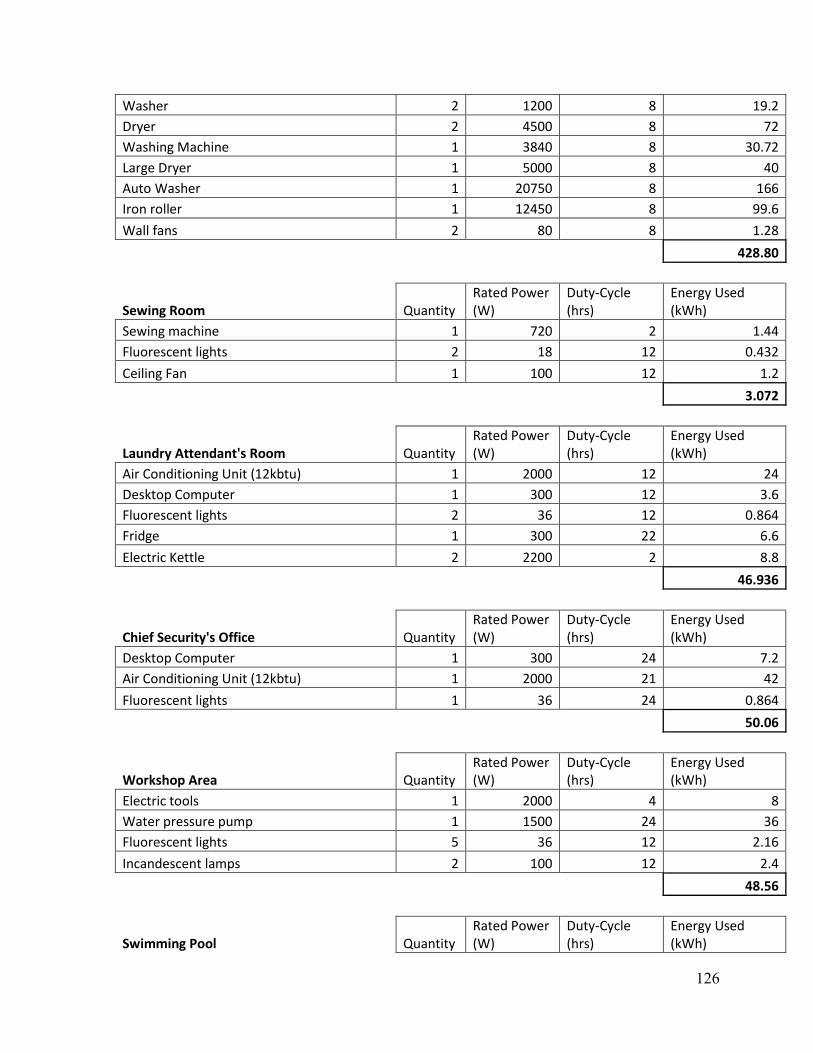
126
Washer 2 1200 8 19.2
Dryer 2 4500 8 72
Washing Machine 1 3840 8 30.72
Large Dryer 1 5000 8 40
Auto Washer 1 20750 8 166
Iron roller 1 12450 8 99.6
Wall fans 2 80 8 1.28
428.80
Sewing Room Quantity Rated Power (W)
Duty-Cycle (hrs)
Energy Used (kWh)
Sewing machine 1 720 2 1.44
Fluorescent lights 2 18 12 0.432
Ceiling Fan 1 100 12 1.2
3.072
Laundry Attendant's Room Quantity Rated Power (W)
Duty-Cycle (hrs)
Energy Used (kWh)
Air Conditioning Unit (12kbtu) 1 2000 12 24
Desktop Computer 1 300 12 3.6
Fluorescent lights 2 36 12 0.864
Fridge 1 300 22 6.6
Electric Kettle 2 2200 2 8.8
46.936
Chief Security's Office Quantity Rated Power (W)
Duty-Cycle (hrs)
Energy Used (kWh)
Desktop Computer 1 300 24 7.2
Air Conditioning Unit (12kbtu) 1 2000 21 42
Fluorescent lights 1 36 24 0.864
50.06
Workshop Area Quantity Rated Power (W)
Duty-Cycle (hrs)
Energy Used (kWh)
Electric tools 1 2000 4 8
Water pressure pump 1 1500 24 36
Fluorescent lights 5 36 12 2.16
Incandescent lamps 2 100 12 2.4
48.56
Swimming Pool Quantity Rated Power (W)
Duty-Cycle (hrs)
Energy Used (kWh)
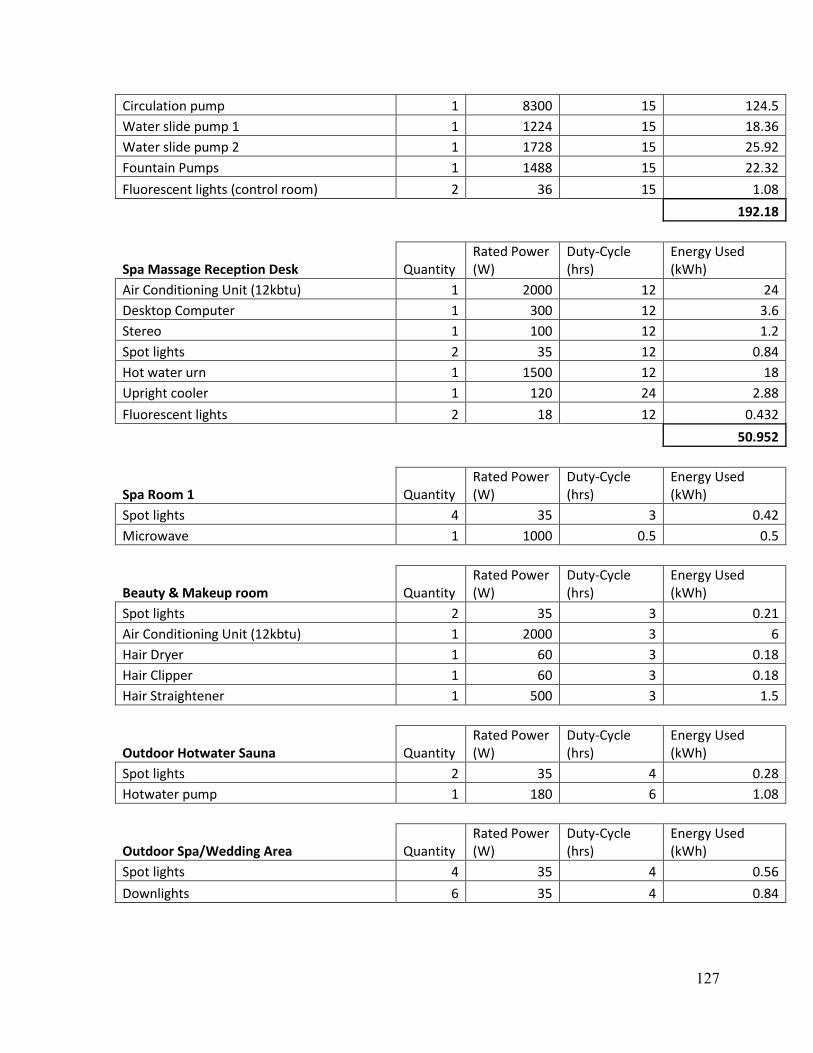
127
Circulation pump 1 8300 15 124.5
Water slide pump 1 1 1224 15 18.36
Water slide pump 2 1 1728 15 25.92
Fountain Pumps 1 1488 15 22.32
Fluorescent lights (control room) 2 36 15 1.08
192.18
Spa Massage Reception Desk Quantity Rated Power (W)
Duty-Cycle (hrs)
Energy Used (kWh)
Air Conditioning Unit (12kbtu) 1 2000 12 24
Desktop Computer 1 300 12 3.6
Stereo 1 100 12 1.2
Spot lights 2 35 12 0.84
Hot water urn 1 1500 12 18
Upright cooler 1 120 24 2.88
Fluorescent lights 2 18 12 0.432
50.952
Spa Room 1 Quantity Rated Power (W)
Duty-Cycle (hrs)
Energy Used (kWh)
Spot lights 4 35 3 0.42
Microwave 1 1000 0.5 0.5
Beauty & Makeup room Quantity Rated Power (W)
Duty-Cycle (hrs)
Energy Used (kWh)
Spot lights 2 35 3 0.21
Air Conditioning Unit (12kbtu) 1 2000 3 6
Hair Dryer 1 60 3 0.18
Hair Clipper 1 60 3 0.18
Hair Straightener 1 500 3 1.5
Outdoor Hotwater Sauna Quantity Rated Power (W)
Duty-Cycle (hrs)
Energy Used (kWh)
Spot lights 2 35 4 0.28
Hotwater pump 1 180 6 1.08
Outdoor Spa/Wedding Area Quantity Rated Power (W)
Duty-Cycle (hrs)
Energy Used (kWh)
Spot lights 4 35 4 0.56
Downlights 6 35 4 0.84
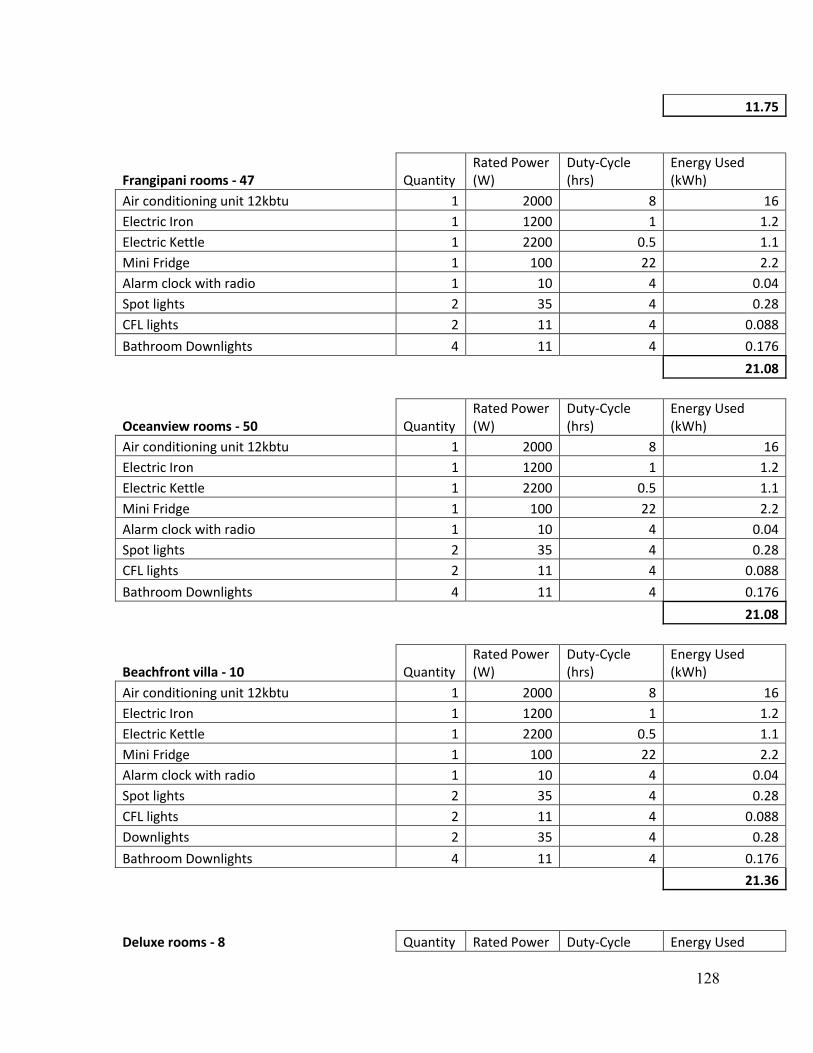
128
11.75
Frangipani rooms - 47 Quantity Rated Power (W)
Duty-Cycle (hrs)
Energy Used (kWh)
Air conditioning unit 12kbtu 1 2000 8 16
Electric Iron 1 1200 1 1.2
Electric Kettle 1 2200 0.5 1.1
Mini Fridge 1 100 22 2.2
Alarm clock with radio 1 10 4 0.04
Spot lights 2 35 4 0.28
CFL lights 2 11 4 0.088
Bathroom Downlights 4 11 4 0.176
21.08
Oceanview rooms - 50 Quantity Rated Power (W)
Duty-Cycle (hrs)
Energy Used (kWh)
Air conditioning unit 12kbtu 1 2000 8 16
Electric Iron 1 1200 1 1.2
Electric Kettle 1 2200 0.5 1.1
Mini Fridge 1 100 22 2.2
Alarm clock with radio 1 10 4 0.04
Spot lights 2 35 4 0.28
CFL lights 2 11 4 0.088
Bathroom Downlights 4 11 4 0.176
21.08
Beachfront villa - 10 Quantity Rated Power (W)
Duty-Cycle (hrs)
Energy Used (kWh)
Air conditioning unit 12kbtu 1 2000 8 16
Electric Iron 1 1200 1 1.2
Electric Kettle 1 2200 0.5 1.1
Mini Fridge 1 100 22 2.2
Alarm clock with radio 1 10 4 0.04
Spot lights 2 35 4 0.28
CFL lights 2 11 4 0.088
Downlights 2 35 4 0.28
Bathroom Downlights 4 11 4 0.176
21.36
Deluxe rooms - 8 Quantity Rated Power Duty-Cycle Energy Used
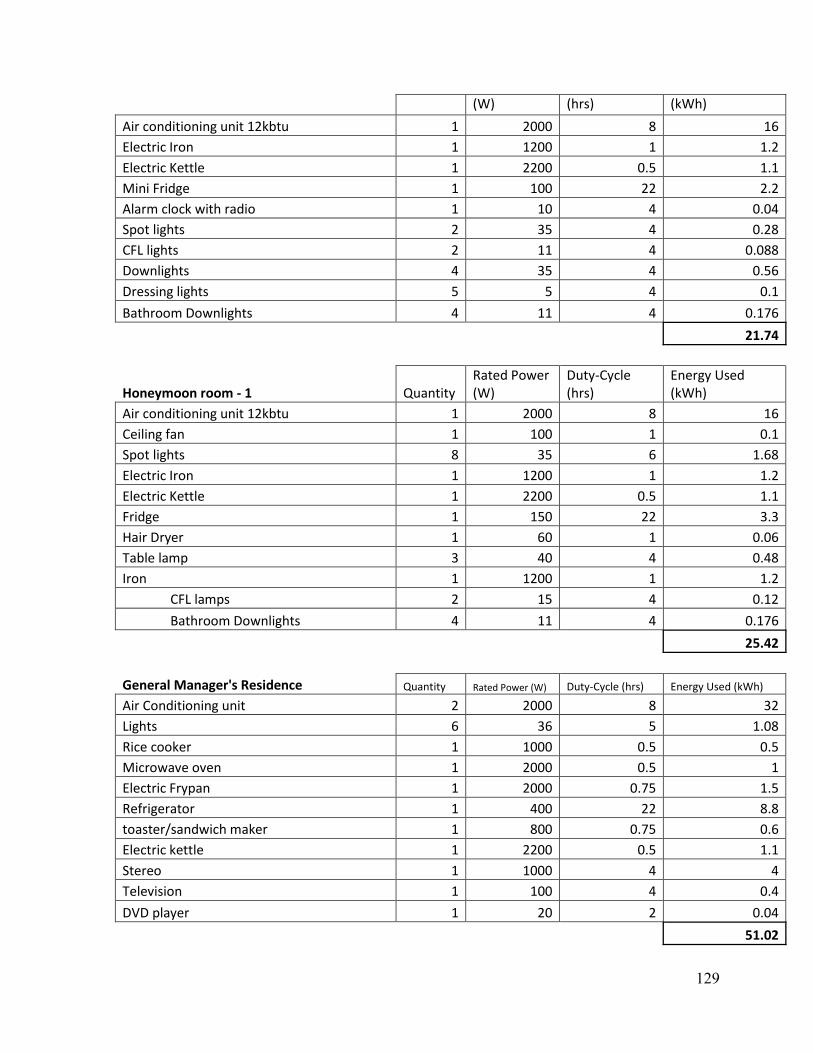
129
(W) (hrs) (kWh)
Air conditioning unit 12kbtu 1 2000 8 16
Electric Iron 1 1200 1 1.2
Electric Kettle 1 2200 0.5 1.1
Mini Fridge 1 100 22 2.2
Alarm clock with radio 1 10 4 0.04
Spot lights 2 35 4 0.28
CFL lights 2 11 4 0.088
Downlights 4 35 4 0.56
Dressing lights 5 5 4 0.1
Bathroom Downlights 4 11 4 0.176
21.74
Honeymoon room - 1 Quantity Rated Power (W)
Duty-Cycle (hrs)
Energy Used (kWh)
Air conditioning unit 12kbtu 1 2000 8 16
Ceiling fan 1 100 1 0.1
Spot lights 8 35 6 1.68
Electric Iron 1 1200 1 1.2
Electric Kettle 1 2200 0.5 1.1
Fridge 1 150 22 3.3
Hair Dryer 1 60 1 0.06
Table lamp 3 40 4 0.48
Iron 1 1200 1 1.2
CFL lamps 2 15 4 0.12
Bathroom Downlights 4 11 4 0.176
25.42
General Manager's Residence Quantity Rated Power (W) Duty-Cycle (hrs) Energy Used (kWh)
Air Conditioning unit 2 2000 8 32
Lights 6 36 5 1.08
Rice cooker 1 1000 0.5 0.5
Microwave oven 1 2000 0.5 1
Electric Frypan 1 2000 0.75 1.5
Refrigerator 1 400 22 8.8
toaster/sandwich maker 1 800 0.75 0.6
Electric kettle 1 2200 0.5 1.1
Stereo 1 1000 4 4
Television 1 100 4 0.4
DVD player 1 20 2 0.04
51.02
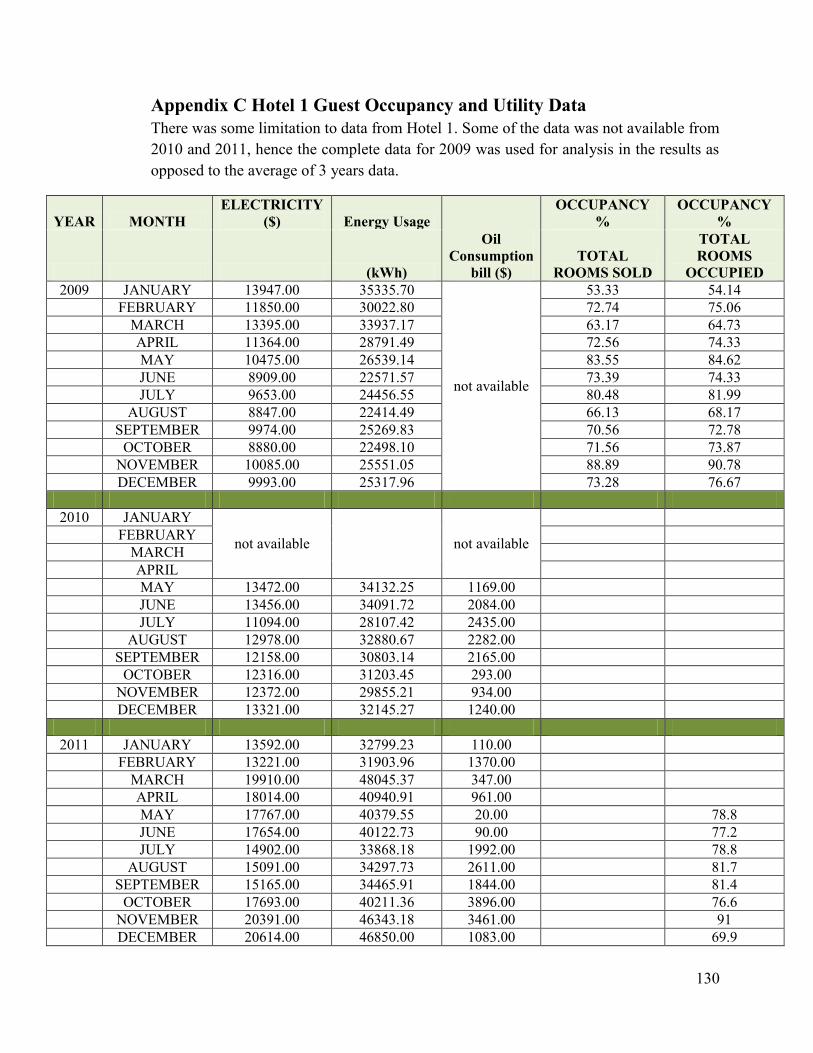
130
Appendix C Hotel 1 Guest Occupancy and Utility Data
There was some limitation to data from Hotel 1. Some of the data was not available from
2010 and 2011, hence the complete data for 2009 was used for analysis in the results as
opposed to the average of 3 years data.
YEAR MONTH
ELECTRICITY
($) Energy Usage
Oil
Consumption
bill ($)
OCCUPANCY
%
OCCUPANCY
%
(kWh)
TOTAL
ROOMS SOLD
TOTAL
ROOMS
OCCUPIED
2009 JANUARY 13947.00 35335.70
not available
53.33 54.14
FEBRUARY 11850.00 30022.80 72.74 75.06
MARCH 13395.00 33937.17 63.17 64.73
APRIL 11364.00 28791.49 72.56 74.33
MAY 10475.00 26539.14 83.55 84.62
JUNE 8909.00 22571.57 73.39 74.33
JULY 9653.00 24456.55 80.48 81.99
AUGUST 8847.00 22414.49 66.13 68.17
SEPTEMBER 9974.00 25269.83 70.56 72.78
OCTOBER 8880.00 22498.10 71.56 73.87
NOVEMBER 10085.00 25551.05 88.89 90.78
DECEMBER 9993.00 25317.96 73.28 76.67
2010 JANUARY
not available
not available
FEBRUARY
MARCH
APRIL
MAY 13472.00 34132.25 1169.00
JUNE 13456.00 34091.72 2084.00
JULY 11094.00 28107.42 2435.00
AUGUST 12978.00 32880.67 2282.00
SEPTEMBER 12158.00 30803.14 2165.00
OCTOBER 12316.00 31203.45 293.00
NOVEMBER 12372.00 29855.21 934.00
DECEMBER 13321.00 32145.27 1240.00
2011 JANUARY 13592.00 32799.23 110.00
FEBRUARY 13221.00 31903.96 1370.00
MARCH 19910.00 48045.37 347.00
APRIL 18014.00 40940.91 961.00
MAY 17767.00 40379.55 20.00 78.8
JUNE 17654.00 40122.73 90.00 77.2
JULY 14902.00 33868.18 1992.00 78.8
AUGUST 15091.00 34297.73 2611.00 81.7
SEPTEMBER 15165.00 34465.91 1844.00 81.4
OCTOBER 17693.00 40211.36 3896.00 76.6
NOVEMBER 20391.00 46343.18 3461.00 91
DECEMBER 20614.00 46850.00 1083.00 69.9
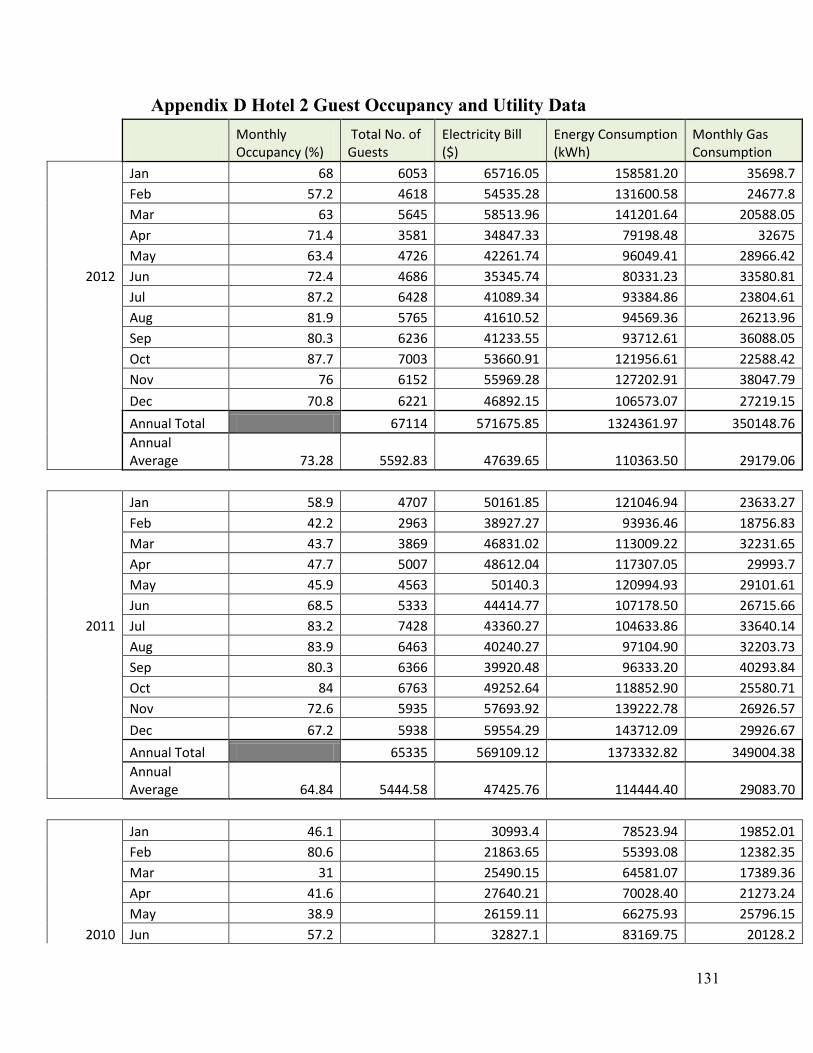
131
Appendix D Hotel 2 Guest Occupancy and Utility Data
Monthly Occupancy (%)
Total No. of Guests
Electricity Bill ($)
Energy Consumption (kWh)
Monthly Gas Consumption
Jan 68 6053 65716.05 158581.20 35698.7
Feb 57.2 4618 54535.28 131600.58 24677.8
Mar 63 5645 58513.96 141201.64 20588.05
Apr 71.4 3581 34847.33 79198.48 32675
May 63.4 4726 42261.74 96049.41 28966.42
2012 Jun 72.4 4686 35345.74 80331.23 33580.81
Jul 87.2 6428 41089.34 93384.86 23804.61
Aug 81.9 5765 41610.52 94569.36 26213.96
Sep 80.3 6236 41233.55 93712.61 36088.05
Oct 87.7 7003 53660.91 121956.61 22588.42
Nov 76 6152 55969.28 127202.91 38047.79
Dec 70.8 6221 46892.15 106573.07 27219.15
Annual Total 67114 571675.85 1324361.97 350148.76
Annual Average 73.28 5592.83 47639.65 110363.50 29179.06
Jan 58.9 4707 50161.85 121046.94 23633.27
Feb 42.2 2963 38927.27 93936.46 18756.83
Mar 43.7 3869 46831.02 113009.22 32231.65
Apr 47.7 5007 48612.04 117307.05 29993.7
May 45.9 4563 50140.3 120994.93 29101.61
Jun 68.5 5333 44414.77 107178.50 26715.66
2011 Jul 83.2 7428 43360.27 104633.86 33640.14
Aug 83.9 6463 40240.27 97104.90 32203.73
Sep 80.3 6366 39920.48 96333.20 40293.84
Oct 84 6763 49252.64 118852.90 25580.71
Nov 72.6 5935 57693.92 139222.78 26926.57
Dec 67.2 5938 59554.29 143712.09 29926.67
Annual Total 65335 569109.12 1373332.82 349004.38
Annual Average 64.84 5444.58 47425.76 114444.40 29083.70
Jan 46.1 30993.4 78523.94 19852.01
Feb 80.6 21863.65 55393.08 12382.35
Mar 31 25490.15 64581.07 17389.36
Apr 41.6 27640.21 70028.40 21273.24
May 38.9 26159.11 66275.93 25796.15
2010 Jun 57.2 32827.1 83169.75 20128.2
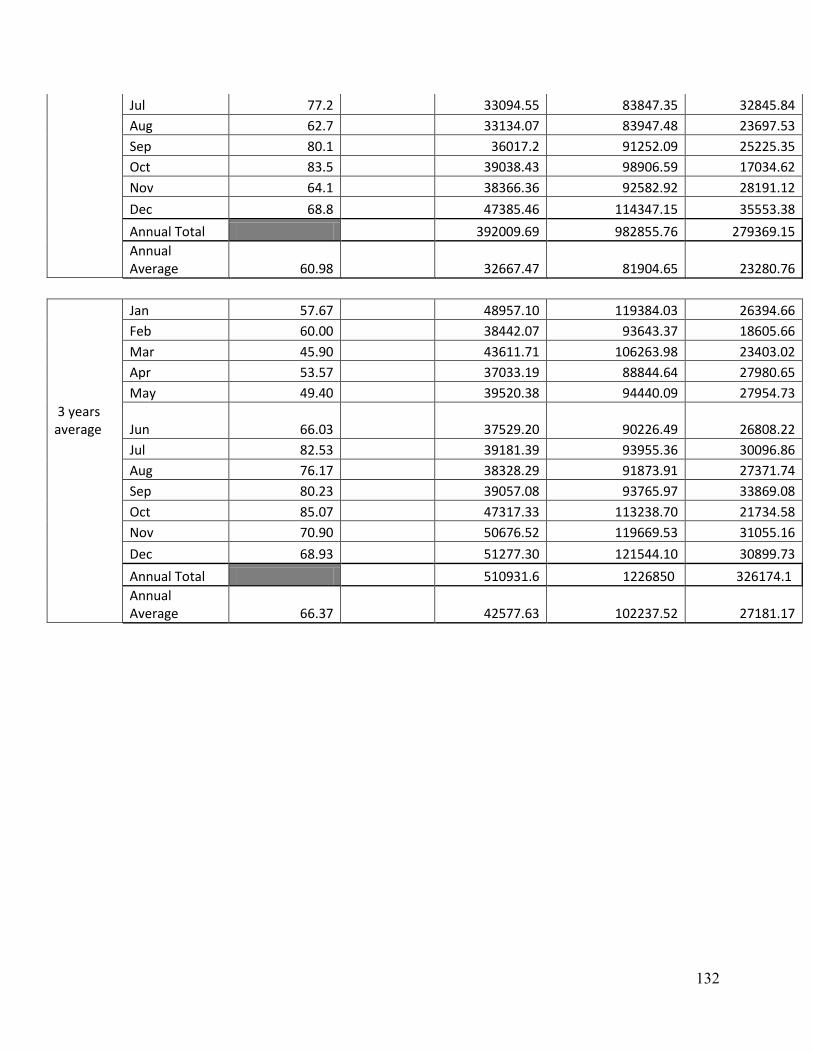
132
Jul 77.2 33094.55 83847.35 32845.84
Aug 62.7 33134.07 83947.48 23697.53
Sep 80.1 36017.2 91252.09 25225.35
Oct 83.5 39038.43 98906.59 17034.62
Nov 64.1 38366.36 92582.92 28191.12
Dec 68.8 47385.46 114347.15 35553.38
Annual Total 392009.69 982855.76 279369.15
Annual Average 60.98 32667.47 81904.65 23280.76
Jan 57.67
48957.10 119384.03 26394.66
Feb 60.00 38442.07 93643.37 18605.66
Mar 45.90 43611.71 106263.98 23403.02
Apr 53.57 37033.19 88844.64 27980.65
May 49.40 39520.38 94440.09 27954.73
3 years average Jun 66.03 37529.20 90226.49 26808.22
Jul 82.53 39181.39 93955.36 30096.86
Aug 76.17 38328.29 91873.91 27371.74
Sep 80.23 39057.08 93765.97 33869.08
Oct 85.07 47317.33 113238.70 21734.58
Nov 70.90 50676.52 119669.53 31055.16
Dec 68.93 51277.30 121544.10 30899.73
Annual Total 510931.6 1226850 326174.1
Annual Average 66.37
42577.63 102237.52 27181.17