an engineering study for improving safety and …...an engineering study for improving safety and...
TRANSCRIPT

An Engineering Study for Improving Safety and
Reliability of Bamboo Scaffoldings
Final Report
Submitted to
Occupational Safety & Health Council
Prepared by
Dr. Chih-Chen Chang
Department of Civil Engineering
The Hong Kong University of Science & Technology
Prof. Tong-Xi Yu
Department of Mechanical Engineering
The Hong Kong University of Science & Technology
14th
June 2002
Tables of contents
i
Tables of contents
CHAPTER 1: INTRODUCTION .................................................................................... 1
1.1 USE OF BAMBOO SCAFFOLDING IN HK ................................................................. 1
1.2 ADVANTAGES AND DISADVANTAGES OF BAMBOO SCAFFOLDING ........................ 1
1.3 ENGINEERING PROBLEMS ...................................................................................... 4
1.4 RESEARCH PLAN AND METHODOLOGY .................................................................. 4
CHAPTER 2: MATERIAL PROPERTIES OF BAMBOO ......................................... 7
2.1 NORMAL COMPRESSIVE TESTS .............................................................................. 7
2.2 COMPRESSIVE TESTS UNDER DIFFERENT HUMIDITY ............................................... 9
2.3 COMPRESSIVE TEST UNDER AGING EFFECT .......................................................... 10
2.3.1 Indoor aging condition .............................................................................. 10
2.3.2 Outdoor aging condition ........................................................................... 11
2.4 THREE-POINT LOADING TEST ............................................................................... 12
2.5 BUCKLING TEST .................................................................................................. 13
CHAPTER 3: MATERIAL PROPERTIES OF THE FASTENING TIE AND
SCAFFOLD INTERSECTION .......................................................... 25
3.1 TENSILE TESTS FOR THE FASTENING TIE .............................................................. 25
3.2 CREEP EFFECT OF THE FASTENING TIE ................................................................. 26
3.3 TENSILE TESTS FOR THE FASTENING TIE DURING FIXING THE JOINT ..................... 27
3.4 SCAFFOLD INTERSECTION TESTS ......................................................................... 28
CHAPTER 4: EXPERIMENT ON THE FULL-SCALE SCAFFOLDING .............. 32
4.1 AIM OF THE FULL-SCALE SCAFFOLDING EXPERIMENT ......................................... 32
4.2 DESCRIPTION OF THE FULL-SCALE SCAFFOLDING ................................................ 32
4.3 TEST EQUIPMENT ................................................................................................ 32
4.4 UNIFORM DISTRIBUTED LOAD TESTS ................................................................... 33
4.4.1 Test setup .................................................................................................. 33
4.4.2 Results of uniform distributed load tests .................................................. 34
Tables of contents
ii
4.5 DROP TESTS ........................................................................................................ 35
4.5.1 Test setup .................................................................................................. 35
4.5.2 Results of the drop tests ............................................................................ 36
CHAPTER 5: COMPARISON OF THE EXPERIMENT AND THE FINITE
ELEMENT MODELING .................................................................... 56
5.1 DESCRIPTION OF THE FINITE ELEMENT MODELING OF SCAFFOLDING ................... 56
5.2 COMPARISON OF THE RESULTS BETWEEN THE EXPERIMENT AND THE FINITE
ELEMENT MODEL ................................................................................................. 57
5.2.1 Comparison of the uniform distributed load tests ..................................... 57
5.2.2 Comparison of the drop tests .................................................................... 57
5.3 RELIABILITY ANALYSIS OF THE FULL-SCALE SCAFFOLDING ................................ 59
5.3.1 Analysis of the uniform distributed load .................................................. 59
5.3.2 Analysis of the drop load .......................................................................... 61
CHAPTER 6: COMPUTER ANALYSIS ON SOME TYPICAL BAMBOO
SCAFFOLDINGS ................................................................................ 70
6.1 BAMBOO SCAFFOLDING AT CONSTRUCTION SITES ............................................... 70
6.1.1 Analysis of the uniform distributed load .................................................. 70
6.1.2 Analysis of the drop load .......................................................................... 71
6.2 BAMBOO SCAFFOLDING USED FOR MAINTENANCE WORK .................................... 74
6.2.1 Analysis of the uniform distributed load .................................................. 74
6.1.2 Analysis of the drop load .......................................................................... 75
CHAPTER 7: CONCLUSIONS AND RECOMMENDATIONS ............................... 84
REFERENCES ........................................................................................................... 86

Lists of tables
iii
Lists of tables
TABLE 2.1: TEST CASES FOR THE COMPRESSIVE STRENGTH OF BP AND PP ........................ 14
TABLE 2.2: MECHANICAL PROPERTIES FOR BP UNDER NORMAL COMPRESSIVE TEST ......... 14
TABLE 2.3: MECHANICAL PROPERTIES FOR PP UNDER NORMAL COMPRESSIVE TEST ......... 14
TABLE 2.4: MECHANICAL PROPERTIES FOR FIR UNDER NORMAL COMPRESSIVE TEST ........ 14
TABLE 2.5: TEST CASES FOR THE COMPRESSIVE STRENGTHS OF BAMBOO UNDER 4
DIFFERENT HUMIDITY LEVELS .......................................................................... 14
TABLE 2.6(A): MECHANICAL PROPERTIES UNDER HUMIDITY LEVEL 60% .......................... 15
TABLE 2.6(B): MECHANICAL PROPERTIES UNDER HUMIDITY LEVEL 75% ........................... 15
TABLE 2.6(C): MECHANICAL PROPERTIES UNDER HUMIDITY LEVEL 90% ........................... 15
TABLE 2.6(D): MECHANICAL PROPERTIES UNDER HUMIDITY LEVEL 98% .......................... 15
TABLE 2.7: PROCEDURES OF ASTM D1037-96 AND GB13124-91 .................................... 15
TABLE 2.8: SUMMARY OF COMPRESSIVE TESTS RESULT UNDER INDOOR AGING EFFECT ..... 16
TABLE 2.9: MECHANICAL PROPERTIES OF SPECIMENS UNDER THREE POINTS LOADING TEST
......................................................................................................................... 16
TABLE 2.10: RESULTS OF THE BUCKLING TESTS ................................................................. 16
TABLE 3.1: SUMMARY OF TENSILE TEST FOR FASTENING TIE ............................................. 29
TABLE 3.2: SUMMARY OF THE INTERSECTION TESTS .......................................................... 29
TABLE 4.1(A): RESULTS OF THE TESTS UNDER 5 KN LOAD ACT AT THE BOTTOM PLATFORM
................................................................................................................... 37
TABLE 4.1(B): RESULTS OF THE TESTS UNDER 10 KN LOAD ACT AT THE BOTTOM PLATFORM
................................................................................................................... 37
TABLE 4.1(C): RESULTS OF THE TESTS UNDER 15 KN LOAD ACT AT THE BOTTOM PLATFORM
................................................................................................................... 38
TABLE 4.1(D): RESULTS OF THE TESTS UNDER 5 KN LOAD ACT AT THE UPPER PLATFORM
................................................................................................................ 38
TABLE 4.1(E): RESULTS OF THE TESTS UNDER 10 KN LOAD ACT AT THE UPPER PLATFORM
................................................................................................................ 39
TABLE 4.1(F): RESULTS OF THE TESTS UNDER 5 KN LOADS ACT AT BOTH PLATFORMS ....... 39
TABLE 4.1(G): RESULTS OF THE TESTS UNDER 10 KN LOADS ACT AT BOTH PLATFORMS .... 40
Lists of tables
iv
TABLE 4.2: NUMBER OF TESTS AT EACH LOCATION ............................................................ 40
TABLE 4.3(A): BENDING STRAIN (X10-6
) UNDER THE IMPACT OF THE 20 KG SAND BAG
WITHOUT UDL ........................................................................................... 41
TABLE 4.3(B): BENDING STRESS (N/MM2) UNDER THE IMPACT OF THE 20 KG SAND BAG
WITHOUT UDL ........................................................................................... 41
TABLE 4.4(A): BENDING STRAIN (X10-6
) UNDER THE IMPACT OF THE 20 KG SAND BAG WITH
UDL OF 3 KN/M2 ....................................................................................... 42
TABLE 4.4(B): BENDING STRESS (N/MM2) UNDER THE IMPACT OF THE 20 KG SAND BAG
WITH UDL OF 3 KN/M2 .............................................................................. 42
TABLE 5.1: COMPARISON BETWEEN THE FINITE ELEMENT AND THE EXPERIMENT RESULTS
(UDL = 8.02 KN/M2) ........................................................................................ 64
TABLE 5.2: MAXIMUM DROP FORCE DUE TO FREE FALL OF SAND BAGS .............................. 64
TABLE 5.3(A): RESULTS OF THE DROP TEST AT LOCATION 3 ............................................... 64
TABLE 5.3(B): RESULTS OF THE DROP TEST AT LOCATION 4 ............................................... 64
TABLE 5.4: RELIABILITY OF THE TRANSOM UNDER UDL ................................................... 65
TABLE 5.5: LOADING OF THE STANDARD UNDER A UDL 3 KN/M2 APPLIED AT THE BOTTOM
PLATFORM ........................................................................................................ 65
TABLE 5.6: RELIABILITY OF THE LEDGER UNDER DROP FORCE (SIMPLY SUPPORT) ............. 65
TABLE 5.7: RELIABILITY OF THE LEDGER UNDER DROP FORCE (CLAMPED SUPPORT) .......... 65
TABLE 5.8: RELIABILITY OF THE STANDARD UNDER 60 KG FREE DROP AT LOCATION 10 .... 66
TABLE 6.1: RELIABILITY OF THE TRANSOM UNDER UDL ................................................... 77
TABLE 6.2: LOADING AT THE STANDARDS UNDER A UDL 3 KN/M2 APPLIED AT THE BOTTOM
PLATFORM FOR THE CONSTRUCTION SITE MODEL ............................................. 77
TABLE 6.3: RELIABILITY OF THE STANDARD UNDER A 5 KN DROP FORCE FOR THE
CONSTRUCTION SITE MODEL............................................................................. 77
TABLE 6.4: LOADING OF THE STANDARD UNDER A UDL 3 KN/M2 APPLIED AT THE BOTTOM
PLATFORM FOR THE MAINTENANCE MODEL ...................................................... 77
TABLE 6.5: RELIABILITY OF THE STANDARD UNDER A 5 KN DROP FORCE FOR THE
MAINTENANCE SITE MODEL .............................................................................. 78
Lists of figures
v
Lists of figures
FIGURE 2.1(A): RELATIONSHIP BETWEEN MECHANICAL PROPERTIES AND AREA OF BP ...... 17
FIGURE 2.1(B): RELATIONSHIP BETWEEN MECHANICAL PROPERTIES AND DIAMETER OF BP
................................................................................................................ 17
FIGURE 2.1(C): RELATIONSHIP BETWEEN AREA AND DIAMETER OF BP .............................. 18
FIGURE 2.1(D): RELATIONSHIP BETWEEN YOUNG’S MODULUS AND DIAMETER OF BP ........ 18
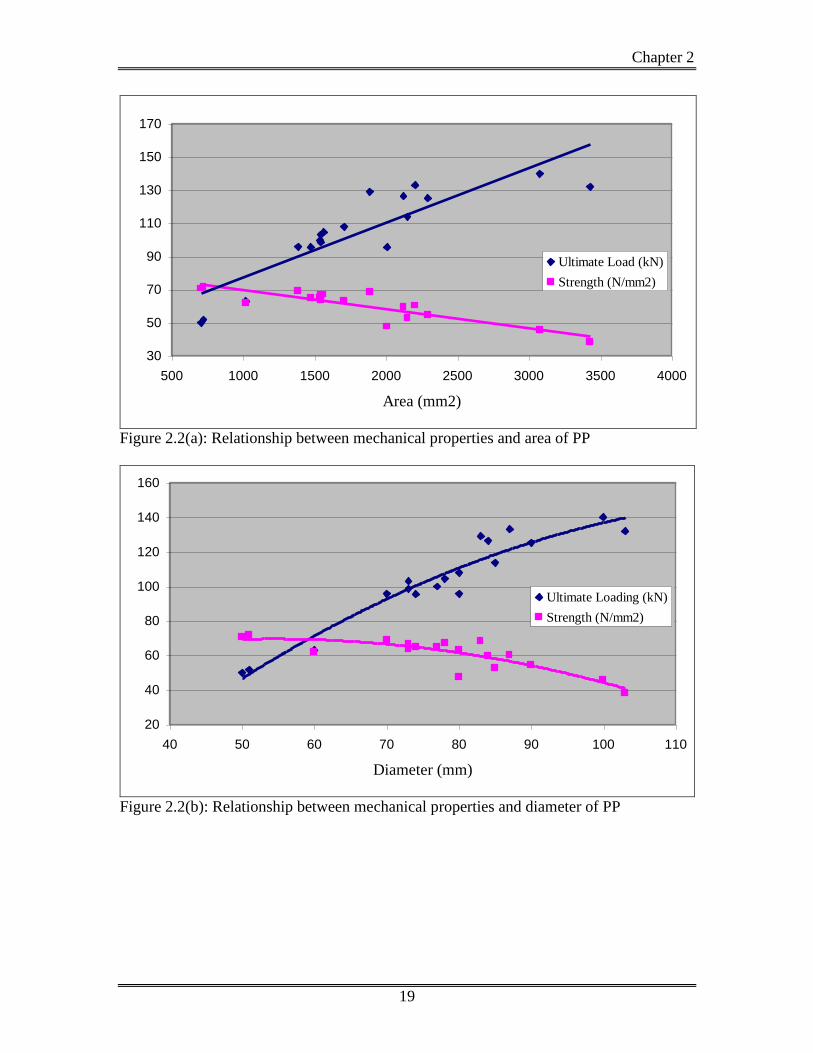
FIGURE 2.2(A): RELATIONSHIP BETWEEN MECHANICAL PROPERTIES AND AREA OF PP ...... 19
FIGURE 2.2(B): RELATIONSHIP BETWEEN MECHANICAL PROPERTIES AND DIAMETER OF PP 19
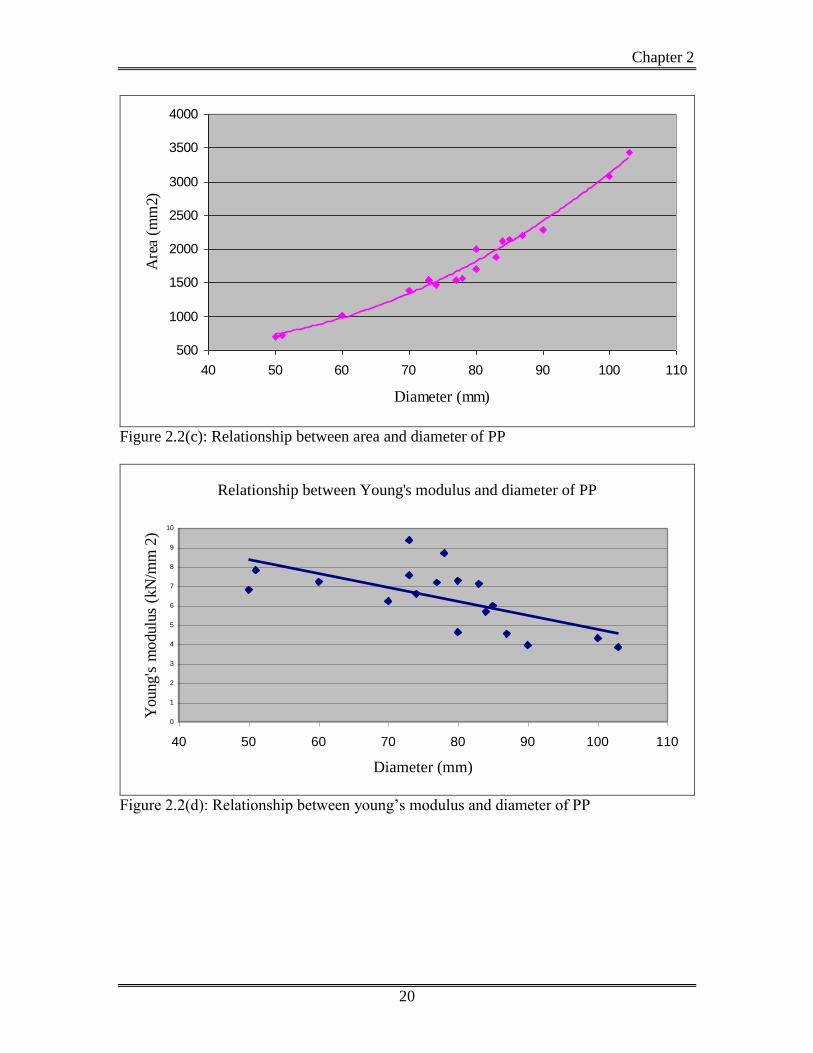
FIGURE 2.2(C): RELATIONSHIP BETWEEN AREA AND DIAMETER OF PP ............................... 20
FIGURE 2.2(D): RELATIONSHIP BETWEEN YOUNG’S MODULUS AND DIAMETER OF PP ........ 20
FIGURE 2.3(A): STRENGTH OF BAMBOOS UNDER DIFFERENT RELATIVE HUMIDITY LEVELS 21
FIGURE 2.3(B): YOUNG’S MODULUS OF BAMBOOS UNDER DIFFERENT RELATIVE HUMIDITY
LEVELS ....................................................................................................... 21
FIGURE 2.4(A): REDUCTION OF STRENGTH OF PP DURING THE AGING PROCESS ................. 22
FIGURE 2.4(B): REDUCTION OF STRENGTH OF BP DURING THE AGING PROCESS ................. 22
FIGURE 2.5: SET UP FOR THE FLEXURE TEST ...................................................................... 23
FIGURE 2.6(A): SET UP FOR THE BUCKLING TEST ................................................................ 23
FIGURE 2.6(B): SPECIMEN DURING LOADING ...................................................................... 23
FIGURE 2.6(C): END CONDITION BEFORE TESTING .............................................................. 24
FIGURE 2.6(D): END CONDITION AFTER TESTING ................................................................ 24
FIGURE 3.1: RESULTS OF THE CREEP EFFECT OF THE FASTENING TIE .................................. 30
FIGURE 3.2: SINGLE CHANNEL PORTABLE DATA LOGGER ................................................... 30
FIGURE 3.3: SET-UP OF INTERSECTION TESTS ..................................................................... 31
FIGURE 3.4: DETERMINING IMPENDING FRICTION FORCE OF A BP-BP JOINT ...................... 31
FIGURE 4.1: FRONT VIEW OF THE SCAFFOLD ...................................................................... 43
FIGURE 4.2: SIDE VIEW OF THE SCAFFOLD .......................................................................... 43
FIGURE 4.3: DIMENSIONS OF THE SCAFFOLD ...................................................................... 44
FIGURE 4.4(A): STRAIN GAUGE .......................................................................................... 44
FIGURE 4.4(B): TENSILE JACKS .......................................................................................... 44
FIGURE 4.4(C): DATA LOGGER AND COMPUTER ................................................................. 45
Lists of figures
vi
FIGURE 4.4(D): LOAD CELL ................................................................................................ 45
FIGURE 4.5: STRAIN GAUGE ATTACH ON PP ....................................................................... 45
FIGURE 4.6(A): LOCATIONS OF STRAIN GAUGES ATTACHED ON THE STANDARD AT THE
FRONT SIDE ................................................................................................ 46
FIGURE 4.6(B): THE LOCATION OF SENSORS ATTACHED ON THE STANDARD AT THE BACK
SIDE ........................................................................................................... 47
FIGURE 4.7(A): FRONT VIEW OF THE LOADING SETUP ......................................................... 48
FIGURE 4.7(B): SIDE VIEW OF LOADING SETUP ................................................................... 48
FIGURE 4.7(C): THE LOADING SETUP ................................................................................. 48
FIGURE 4.8: LOADING THE TENSILE JACK DURING THE TESTS............................................. 49
FIGURE 4.9: RESULTS OF UNIFORM DISTRIBUTED LOAD TESTS ........................................... 49
FIGURE 4.10: MEMBER FORCES OF THE CENTER MEMBER AT THE FRONT FACE UNDER UDL
................................................................................................................... 50
FIGURE 4.11: DROP TEST LOCATIONS ................................................................................. 50
FIGURE 4.12: BEFORE THE SAND BAG DROPPED ................................................................. 51
FIGURE 4.13: RECORDED STRAINS OF THE DROP TEST ........................................................ 51
FIGURE 4.14: BEFORE THE DROP OF THE 40 KG SAND BAG ................................................. 52
FIGURE 4.15: AFTER THE DROP OF THE 40 KG SAND BAG ................................................... 52
FIGURE 4.16: JOINT CONDITION OF LOCATION 9 BEFORE THE DROP OF 40 KG SAND BAG AT
CENTER ...................................................................................................... 53
FIGURE 4.17: JOINT CONDITION OF LOCATION 9 AFTER THE DROP OF 40 KG SAND BAG AT
CENTER ...................................................................................................... 53
FIGURE 4.18: THE MEMBER WAS FAILED AT THE LOCATION 9 ............................................ 54
FIGURE 4.19: ANOTHER VIEW TO SEE THE FAILURE AT THE LOCATION 9 ............................ 54
FIGURE 4.20: THE SAFETY BELT FIX AT THE LOCATION 10 ................................................. 55
FIGURE 4.21: MEMBER FAILURE DURING THE DROP OF 60 KG SAND BAG AT LOCATION 10 55
FIGURE 5.1: FEM MODEL OF THE SCAFFOLD ...................................................................... 67
FIGURE 5.2: LOADING OF THE UDL TESTING ..................................................................... 67
FIGURE 5.3(A): SETUP OF THE FREE DROP TESTS ................................................................ 68
FIGURE 5.3(B): THE FREE DROP TESTS ................................................................................ 68
FIGURE 5.4: THE RESULTING DROP FORCE OF DIFFERENT DROP WEIGHT ............................ 69
Lists of figures
vii
FIGURE 5.5: A SIMPLE MODEL TO SIMULATE A TRANSOM UNDER UDL .............................. 69
FIGURE 5.6: A SIMPLE MODEL TO SIMULATE A LEDGER UNDER DROP FORCE ...................... 69
FIGURE 6.1: BAMBOO SCAFFOLDING AT SHAM TSENG ....................................................... 79
FIGURE 6.2: THE CATCH FAN WITH STRUCTURAL SUPPORTS ............................................... 79
FIGURE 6.3: CLOSE SHOT OF THE SCAFFOLDING ................................................................. 80
FIGURE 6.4: THE FEM MODEL OF THE SCAFFOLDING AT SHAM TSENG .............................. 80
FIGURE 6.5: LOADING AT THE BOTTOM PLATFORM ............................................................ 81
FIGURE 6.6: LOADING AT EACH PLATFORM ........................................................................ 81
FIGURE 6.7: SCAFFOLDING FOR MAINTENANCE WORK AT HKUST .................................... 82
FIGURE 6.8: BOTTOM OF THE SCAFFOLDING AT HKUST ................................................... 82
FIGURE 6.9: CLOSE SHOT OF THE SCAFFOLDING AT HKUST .............................................. 83
FIGURE 6.10: THE FEM MODEL OF THE SCAFFOLDING AT HKUST .................................... 83

Chapter 1
1
Chapter 1: Introduction
1.1 Use of Bamboo Scaffolding in HK
Bamboo scaffolding is a popular temporary structure for supporting working platforms in
Hong Kong. It is used widely in building construction, building facade and wall repairs,
decoration and sign erection, slope maintenance, etc. Fu [1] concluded in 1993 that over
two-thirds of bamboo scaffoldings are for building construction. The market share of the
bamboo scaffolding in Hong Kong was first summarized and documented by So and
Wong [2]. They concluded that the bamboo scaffolding has 100% and 95% of the market
share for the construction work in the private section in the 1980s and in the 1990s,
respectively. Also for the public sector, the bamboo scaffolding grasps 100% of the
market share in the work issued by the Housing Society and in the new building work
issued by the Building Authority.
1.2 Advantages and Disadvantages of Bamboo Scaffolding
The reasons why the bamboo scaffolding prevails in Hong Kong can be attributed to the
following factors:
1) Economy
So and Wong [2] reported that the average cost of a piece of 6 m long bamboo was
about HK$ 10 in 1998, while the cost of a 6 m, 48mm steel tube was about HK$ 80
and that of a 2 m aluminum ally tube was about HK$ 250. Although the usable life of
metal tubes is about 15 to 20 years, which is far superior to that of bamboo which
normally can not be re-used, the storage of these metal tubes makes them even less
appearing to the industry in Hong Kong due to extremely high storage cost.
2) Efficiency
Erecting and dismantling bamboo scaffolding are relatively easy and can be very fast.
The weight of a typical bamboo is about 1.1 to 1.3 kg/m [3]. Constructing and
dismantling bamboo scaffolding do not require special tools. On the average, a skilled
Chapter 1
2
bamboo scaffold worker can erect about 600 to 700 m2 or dismantle 2,000 m
2 per day.
As a comparison, a skilled metal scaffold worker can erect about 300 to 400 m2 or
dismantle 500 to 600 m2 per day.
3) Flexibility
Bamboo scaffolding can be very flexible and adaptable to different construction
requirements in terms of shape, height, and working space. Bamboo can be cut,
without significant adverse effect to its mechanical properties, to suit the shape of a
building with special shapes, contours, or corners.
However, the bamboo scaffolding does not come without disadvantages, some of which
can be severe and result in potential hazards to the workers. These disadvantages include:
1) Variation in Mechanical Properties
Bamboo is a natural material that does not possess uniform mechanical properties. Its
mechanical properties depend on species, years and locations of growth, and moisture
contents. To make the condition even more complicate, even for one piece of bamboo,
its cross sectional areas, moisture contents, rigidities and strengths all vary from
location to location. Zhou [4] reported some properties of 61 species of bamboo,
including volume weight, percentage of swelling, density of vascular bundle,
compressive and tensile strengths, etc. A total of 9,000 samples of 311 culms were
collected from 26 districts in 11 provinces of China from 1963 to 1978. Jansseu [5]
collected and summarized reports on the properties of bamboo in 1991. Bamboo’s
properties varying with its thermal expansion, moisture content, elasticity, bending,
compression, shear and torsion were reported. Bamboo also corrodes and degrades
easily under normal weather variation. It cracks when the humidity is low and its
strength reduces when the humidity is high. Under Hong Kong’s warm and humid
environment, the bamboo’s life span is expected to be less than one year [4].
2) Quality Control and Human Dependency
Erecting and dismantling of bamboo scaffolding depend highly on the skill and the
experience of workers. In the Construction Sites (Safety) Regulations, Regulation
38E states “This regulation requires that only trained workmen with adequate
Chapter 1
3
experience and under the supervision of a competent person shall erect, alter or
dismantle scaffolds”. A competent person is referred to who has completed
satisfactorily a formal training in bamboo scaffolding work such as the 3-year
Bamboo Scaffolder Apprenticeship Scheme operated by the Vocational Training
Council, the 1-year full-time training course in Bamboo Scaffolding of the
Construction Industry training Authority (CITA), other similar bamboo scaffolding
training courses/programs, or has satisfactorily passed the Trade Test on Bamboo
Scaffolding of the CITA; and who has passed an experience of 10 years or more in
bamboo scaffolding work. A trained workman is referred to a scaffolder who has
satisfactorily completed a formal training in bamboo scaffolding work equivalent to
any of those mentioned for a competent person and possessed at least 3 years of
experience in bamboo scaffolding work. The relatively stringent training requirement
for the bamboo scaffolders is a good measure to ensure the quality and the safety of
the bamboo scaffolding. The requirement is also a good indication on how the skill
and the experience of the scaffolders affect the quality of the bamboo scaffolding.
3) Maintenance and management
Regular inspection of bamboo scaffolding is absolutely necessary due to at least the
following reasons:
(i) The significant variation and the environmental degradability of bamboo’s
mechanical properties;
(ii) The potential creep and fatigue behavior of the nylon strips used as joint
fixture for bamboos;
(iii) The ease of accidental damage and dismantlement by other workers.
In the Construction Sites (Safety) Regulations, Regulation 38F states “A scaffold shall
not be used unless it (a) has been inspected by a competent person before being taken into
use for the first time; (b) has been inspected by a competent person after any substantial
addition, partial dismantling or other alteration; (c) has been inspected by a competent
person after any exposure to weather conditions likely to have affected its strength or
stability or to have displaced any part; (d) has been inspected by a competent person at
regular intervals not exceeding 14 days immediately preceding each use of the scaffold”.
Chapter 1
4
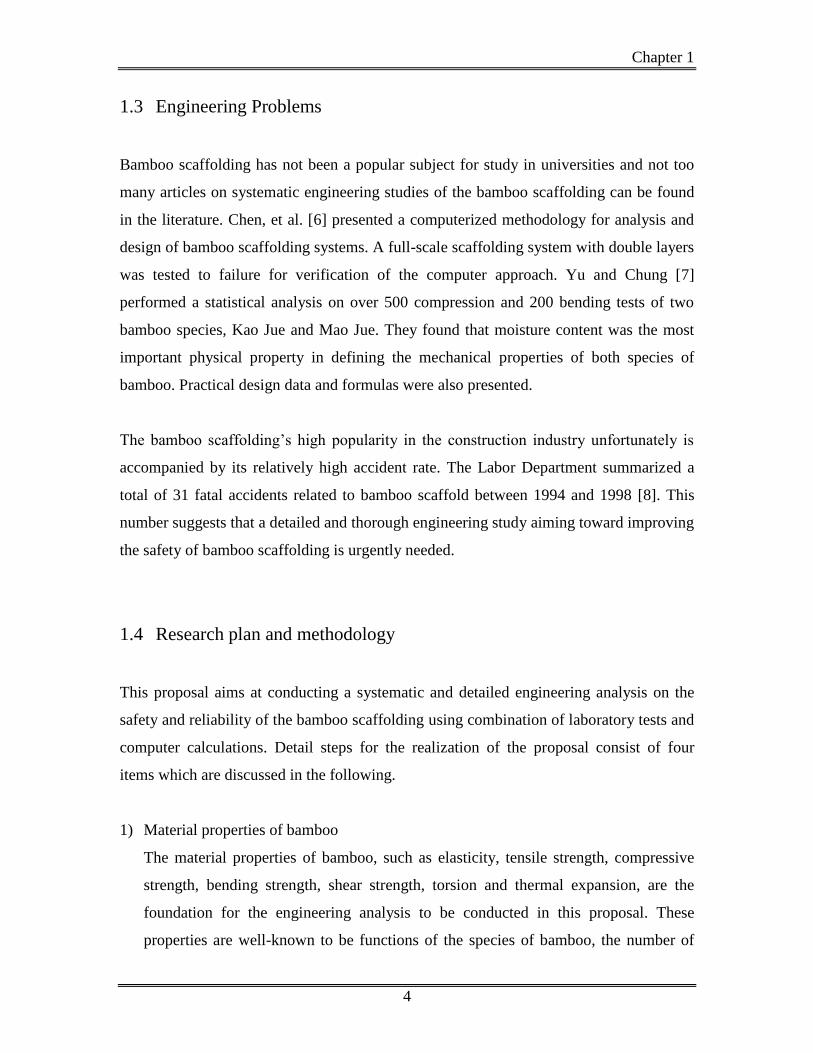
1.3 Engineering Problems
Bamboo scaffolding has not been a popular subject for study in universities and not too
many articles on systematic engineering studies of the bamboo scaffolding can be found
in the literature. Chen, et al. [6] presented a computerized methodology for analysis and
design of bamboo scaffolding systems. A full-scale scaffolding system with double layers
was tested to failure for verification of the computer approach. Yu and Chung [7]
performed a statistical analysis on over 500 compression and 200 bending tests of two
bamboo species, Kao Jue and Mao Jue. They found that moisture content was the most
important physical property in defining the mechanical properties of both species of
bamboo. Practical design data and formulas were also presented.
The bamboo scaffolding’s high popularity in the construction industry unfortunately is
accompanied by its relatively high accident rate. The Labor Department summarized a
total of 31 fatal accidents related to bamboo scaffold between 1994 and 1998 [8]. This
number suggests that a detailed and thorough engineering study aiming toward improving
the safety of bamboo scaffolding is urgently needed.
1.4 Research plan and methodology
This proposal aims at conducting a systematic and detailed engineering analysis on the
safety and reliability of the bamboo scaffolding using combination of laboratory tests and
computer calculations. Detail steps for the realization of the proposal consist of four
items which are discussed in the following.
1) Material properties of bamboo
The material properties of bamboo, such as elasticity, tensile strength, compressive
strength, bending strength, shear strength, torsion and thermal expansion, are the
foundation for the engineering analysis to be conducted in this proposal. These
properties are well-known to be functions of the species of bamboo, the number of
Chapter 1
5
nodes, the moisture content, the weather condition, the inherent defects, etc. These
properties will be obtained from a series of laboratory tests under a well-controlled
environment using some typical bamboo members.
2) Material properties of fastening tie and scaffold intersection
The bamboo components are joined together using nylon strip lashings, the properties
and the strength of typical lashing fixtures (or bamboo scaffold intersections) should
be experimentally determined before incorporated into the analysis. The test would
include the effects of the fastening method of bamboo members, the type and
mechanical properties of nylon strips, the method of installation of ties, and the
number and the overlapping length of bamboo members.
3) Computer modeling and analysis
After determining the mechanical properties of the bamboo and the intersection, we
will then develop finite element models to analyze some typical scaffolding
configurations, such as single-row bamboo scaffolding system, double-row bamboo
scaffolding system, truss-out bamboo scaffolding system, cantilever type bamboo
scaffolding system, and scaffolding system for slope works. These bamboo
scaffolding systems will be designed following the Code of Practice for Bamboo
Scaffolding Safety published by the Labour Department in 2001 [9]. The material
properties obtained in the previous stages will be used to establish the finite element
models. Specifically, the following studies will be conducted:
(a) Maximum stresses and deformations at some critical locations of the
scaffoldings under different combinations of dead and live loads. These load
combinations should emulate various stages of working condition.
(b) Maximum stresses and deformations at some critical locations of the
scaffoldings under different combinations of dead and live loads plus an impact
load applied at some intersections. The impact load is to emulate the accidental
fall of a person from the scaffoldings.
(c) The ultimate load-carry capacity of the scaffoldings under different
combinations of dead loads, live loads and impact loads.
Chapter 1
6
4) Full-scale tests
A typical bamboo scaffolding will be built and used as a test bed to verify some of the
analysis results obtained. The bamboo scaffolding should conform to the technical
requirements outlined in Section 4 of the Code of Practice for Bamboo Scaffolding
Safety [9]. The methodology used for testing should follow as close as possible some
recognized international standards. Some strain gauges and accelerometers will be
attached at some critical locations of the scaffolding to measure deformation and
acceleration under various load combinations that emulate different working
scenarios. The scaffold intersections or the nylon lashings should be carefully
inspected and documented for each test.
Chapter 2
7
Chapter 2: Material properties of bamboo
Three types of materials are usually used in the bamboo scaffolding in Hong Kong. They
are Bambusa Pervariabius Grade A (BP, 篙竹 or Kao Jue), Phyllostachys Pubescens (PP,
毛竹 or Mao Jue) and Fir (木杉). Their material properties are obtained through the
following experiments.
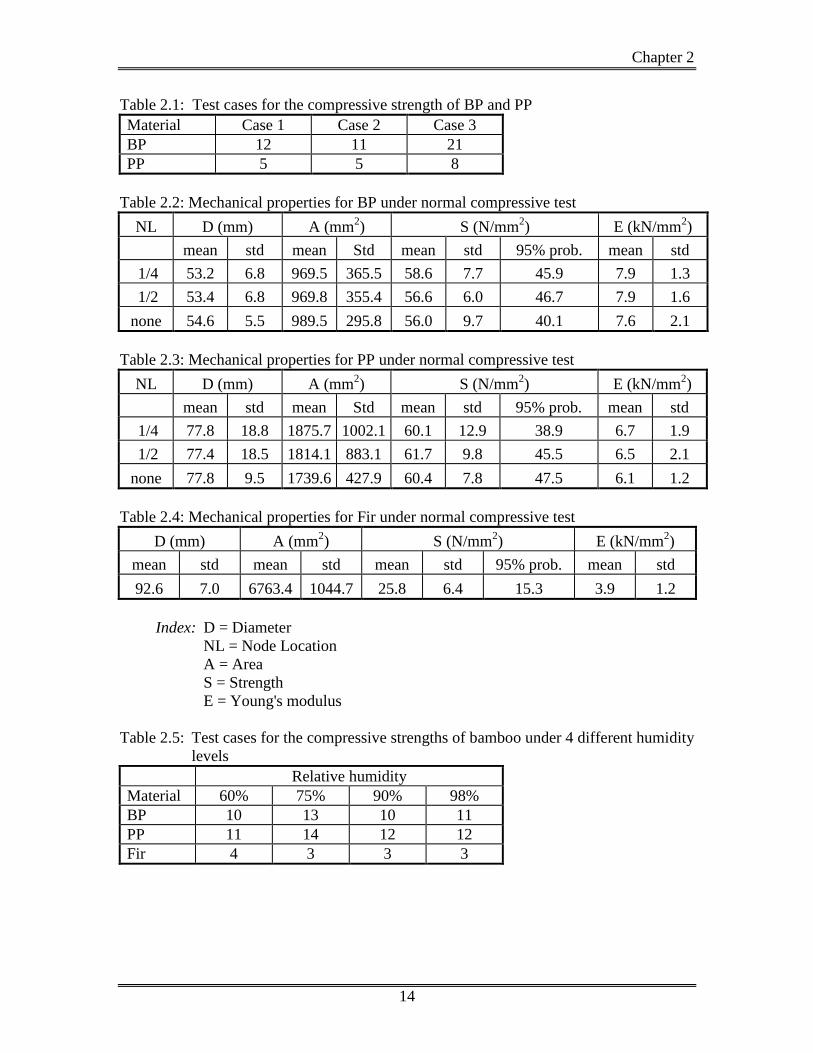
2.1 Normal compressive tests
The aim of these tests is to measure the compressive strength and the young’s modulus of
the specimens under the normal laboratory condition. A total of 44 BP specimens, 18 PP
specimens and 10 Fir specimens were tested under normal condition.
The specimens of BP and PP were divided into three cases. For case one, the specimens
had a node near their quarter locations. For case two, the specimens had a node near their
middle locations. For case three, the specimens had no node. Table 2.1 shows the number
of specimens in each case for BP and PP. The reason for having three different cases is to
found out the effect of node on the material properties.
The length for all specimens was 200 mm. This length was used to prevent buckling
effect of the specimens during the tests. The test equipment 815 MTS was used to carry
out the experiment.
Table 2.2-2.4 show the means and the standard deviation (std) of the diameter (D), the
cross section area (A), the compressive strength (S) and the Young’s modulus (E) for the
three types of bamboo tested. The strength was obtained from dividing the recorded
ultimate load by the measured cross section area. Also shown in the tables is the lower
bound of strength with 95% probability of occurrence. The following observations can be
concluded from these tables:
Chapter 2
8
(1) For the same type of material (BP and PP), the presence and the location of node
do not significantly affect both the strength and the Young’s modulus.
(2) While the strengths of BP and PP are about the same, the Young’s modulus of BP
is higher than that of PP.
(3) The compressive strengths and the Young’s moduli of Fir are significantly lower
than those of BP and PP.
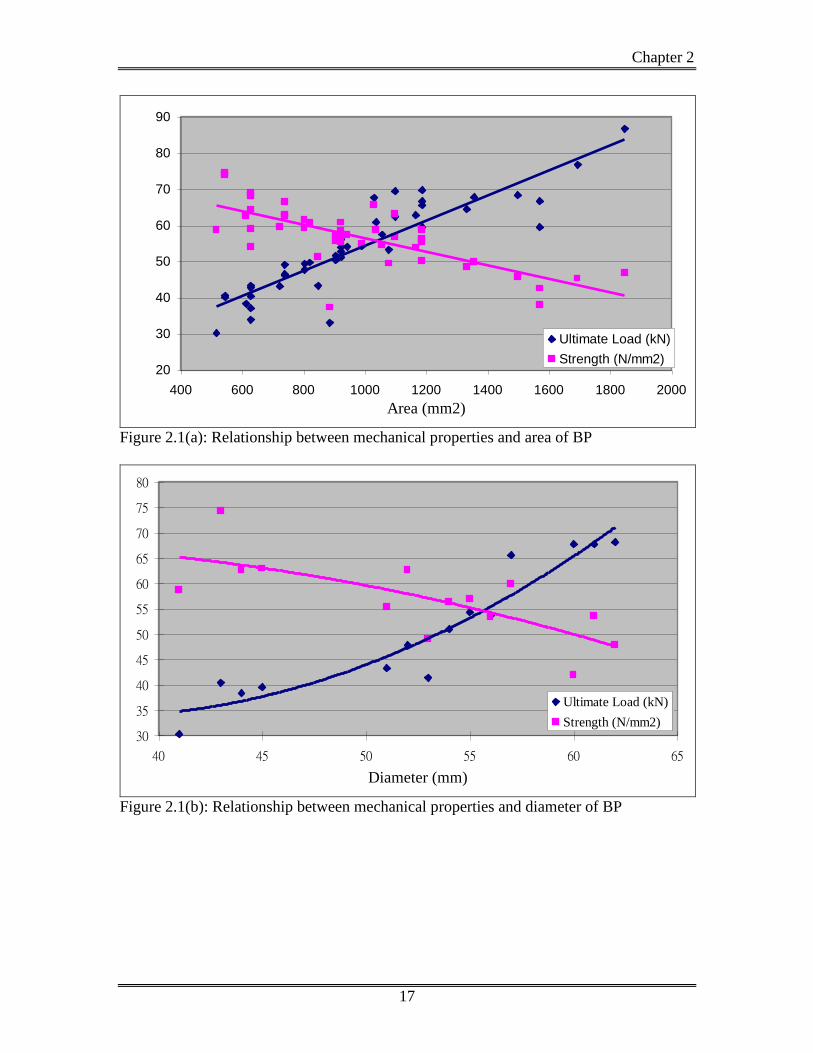
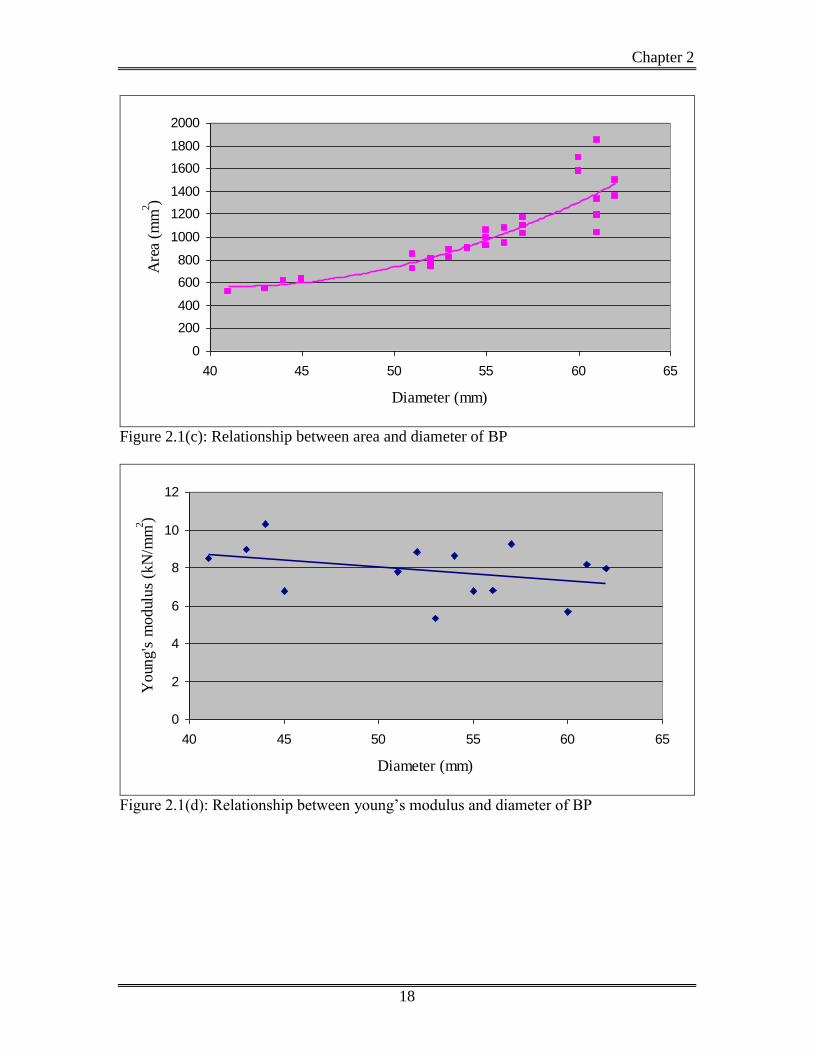
Detailed analyses on the test results of BP and presented in Figure 2.1. Some
observations are summarized as follows:
(1) The strength of BP decreases linearly and quadratically as the area and the
diameter increases, respectively.
(2) The ultimate load of BP increases linearly and quadratically as the area and the
diameter increases, respectively.
(3) The young’s modulus of BP in general decreases as the diameter increases.
Detailed analyses on the test results of PP area presented in Figure 2.2. It is noted that the
properties of PP have a similar behavior as those of BP.
Chapter 2
9
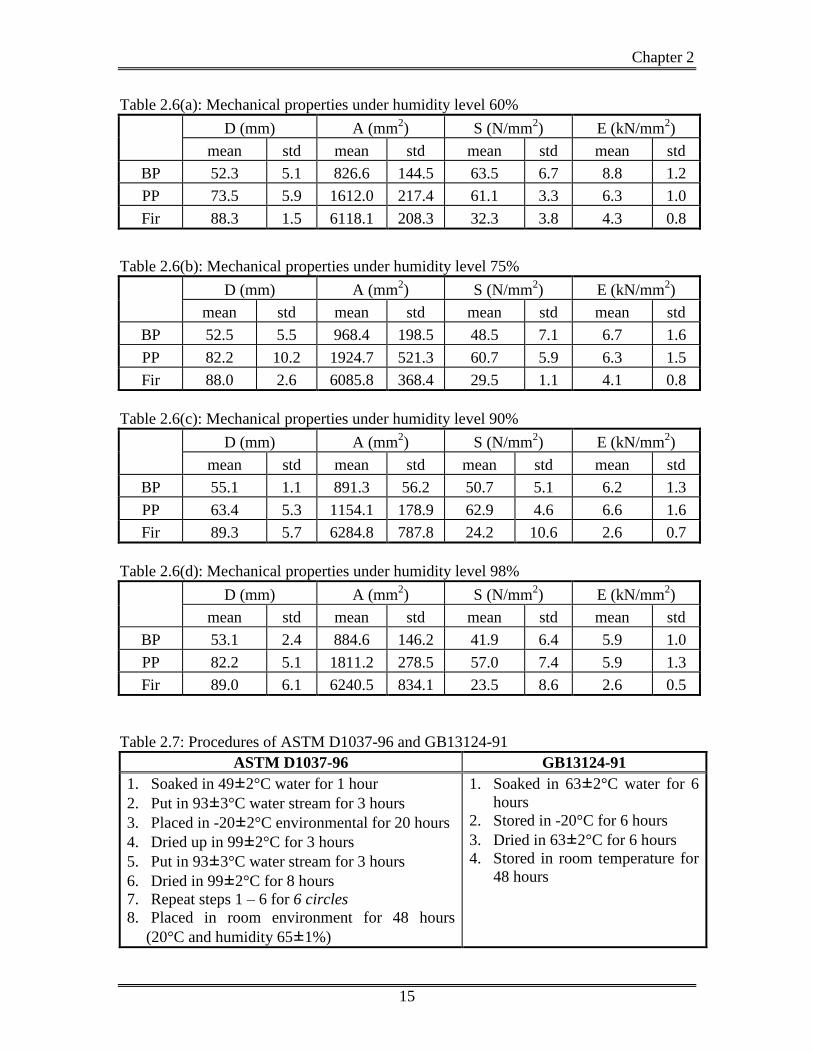
2.2 Compressive tests under different humidity
The aim of these tests is to measure the compressive strength and the young’s modulus of
the specimens under four different relative humidity, 60%, 75%, 90% and 98%,
respectively. A total of 44 BP specimens, 49 PP specimens and 12 Fir specimens were
tested under the four humidity levels. The specimens were placed in the environmental
chamber for two days with temperature kept constant at 26C. After two days, the
specimens were tested using the MTS 815 and the displacement and the loading were
recorded during the tests.
At each humidity level, a few samples were selected from the same bamboo component.
An additional sample was also selected from the same component and tested at the room
condition. This additional sample was used as a reference to quantity the humidity effect
on bamboo. The test results indicated that both the ultimate strengths and young’s
modulus of BP, PP and Fir all decrease as the relative humidity level increases. It is
because specimens with different moisture contents have different failure modes. When
the moisture content in the specimens is high, the failure mode is end bearing while the
moisture content in the specimens is low, the failure mode become splitting. A similar
result was shown in [5] and [8].
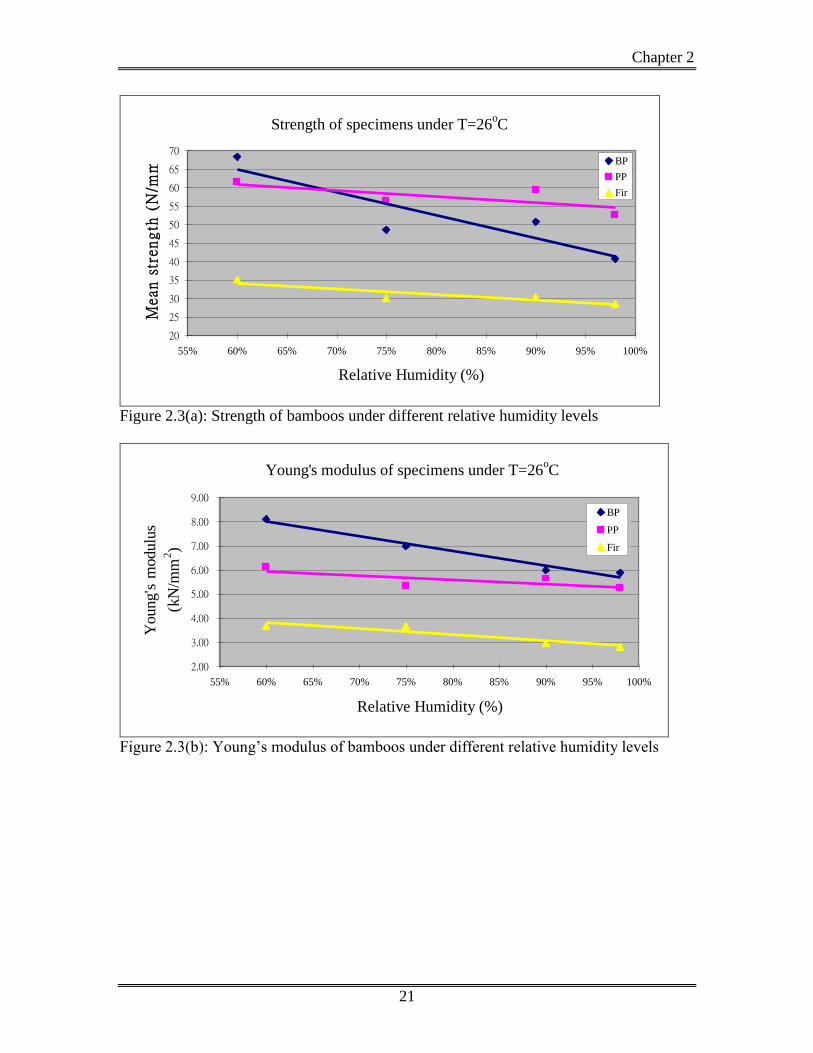
Figure 2.3 (a) & (b) showed this decreasing trend graphically. It showed that PP and Fir
had similar decreasing rate with the increasing relative humidity. BP was influenced by
the relative humidity in a greater amount. As BP’s wall thickness is thinner than the
others’, the moisture is easier to get into the whole cross section. So, the moisture content
in BP is higher than that in the other materials and BP showed a greatest decreasing trend
than the other two materials.
Chapter 2
10
2.3 Compressive test under aging effect
The compressive test under aging effect divided into two sections, one is under indoor
aging condition and the other is under outdoor aging condition.
2.3.1 Indoor aging condition
For the indoor aging condition, the procedures outlined in the ASTM D1037-96 and
GB13124-91 were followed. ASTM D1037-96 is the standard test methods for evaluating
properties of wood base and particle panel materials and GB13124-91 is the methods of
testing bamboo-mat plywood. These procedures were summarized in Table 2.7.
Table 2.8 summarizes the test results under the indoor aging condition. The asterisks “*”
in the table indicate cases that significant cracks were seen in the bamboo specimens such
that compressive tests could not be performed.
Based on these test results, the following conclusions can be made:
(1) The compressive strengths of all three types of bamboo all reduce to the
neighborhoods their respective lower 95% probability of occurrence values as
shown in Tables 2.2 to 2.4 under the ASTM D1037-96 procedure.
(2) Similar trends can be observed for the compressive strengths under the
GB13124-91 procedure.
Chapter 2
11
2.3.2 Outdoor aging condition
The specimens were placed outdoors and water was sprayed on the specimens once a day
to accelerate the aging process. Compressive tests of at least two specimens were carried
out every week for 12 weeks to investigate the change of the material properties.
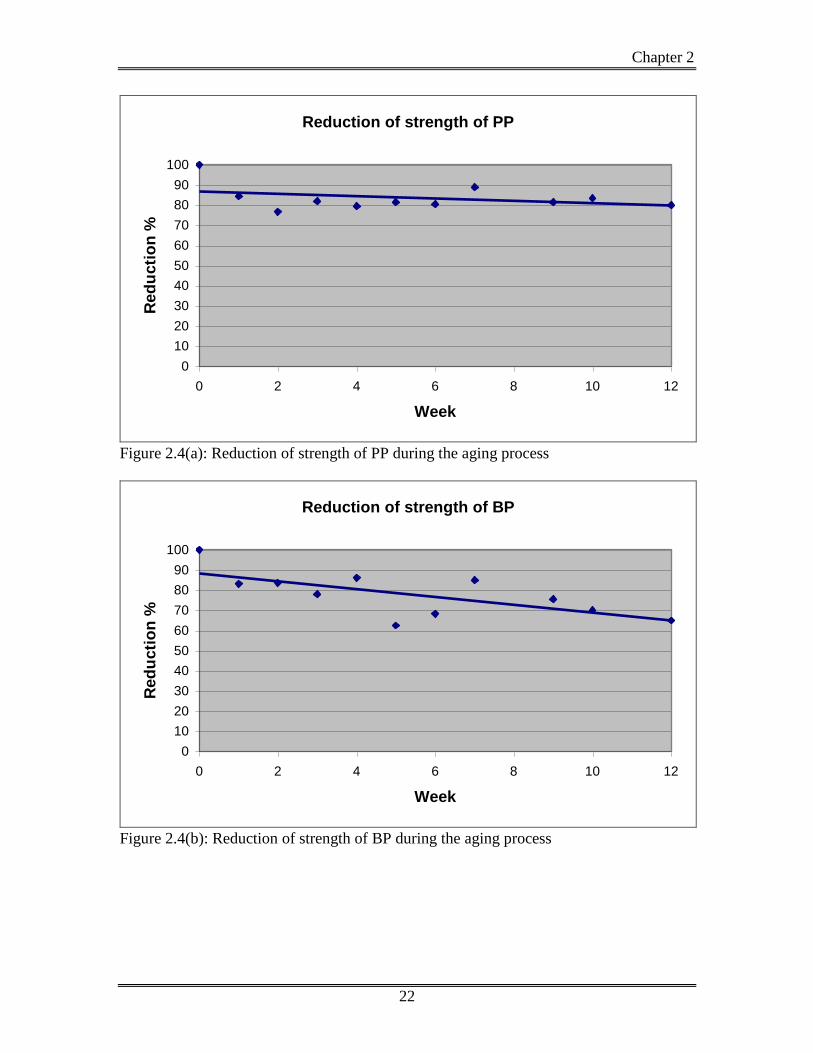
The compressive strengths of similar sizes of bamboo specimens without any aging effect
obtained in section 2.1 were used as a reference for comparison. Figure 2.4 show the
reduction of the compressive strengths of PP and BP as a function of times in weeks for
the outdoor aging effect. Although the data are quite fluctuating, it is seen that the
bamboo compressive strengths become smaller under outdoor aging condition by about
20% as compared to these similar sizes of bamboo specimens without subjecting to any
aging effect.

Chapter 2
12
2.4 Three-point loading test
Three-point loading tests are used to evaluate the flexure modulus of the bamboo
specimens. Specimens were placed in the Dartec loading machine with round pin
supports at both ends and the loading was added at the middle of the specimens (see
Figure 2.5). Loading and the displacement at the loading location were recorded to find
out the flexure properties of the specimens.
The ultimate strengths found in the three-point loading test are higher than those found in
the compressive test. It can be concluded that the flexural failure might not be a dominant
factor for the bamboo failure.

Chapter 2
13
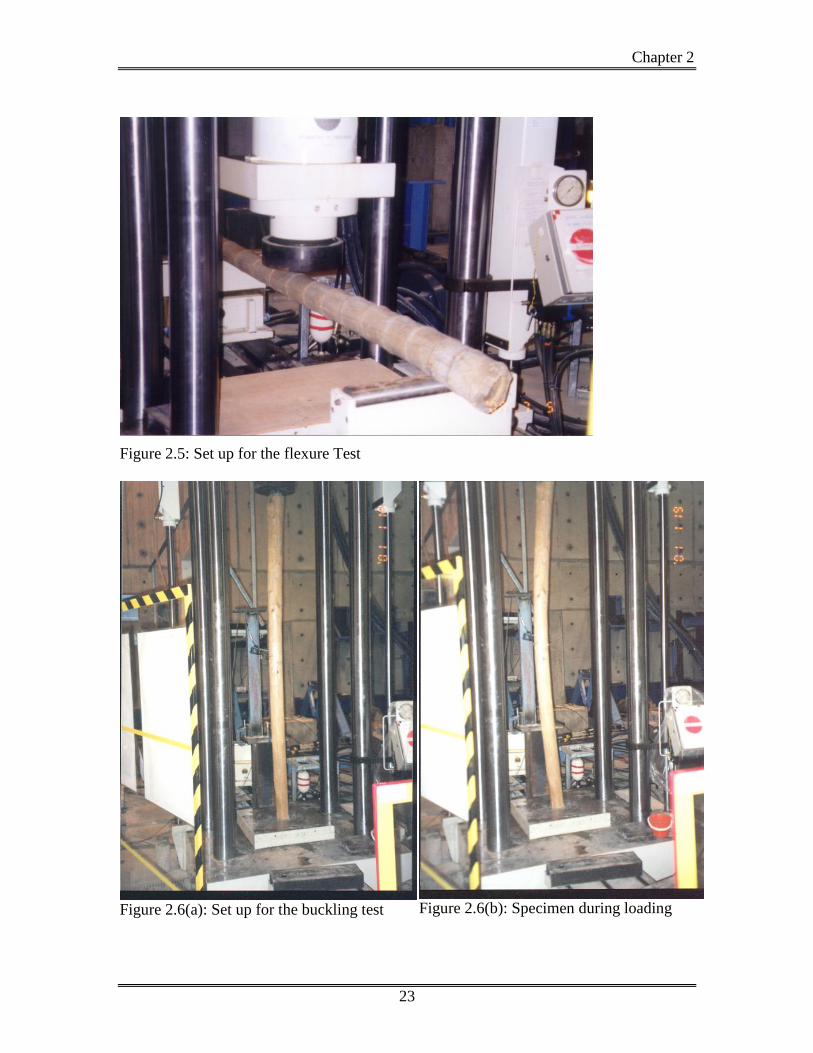
2.5 Buckling test
The buckling tests are to evaluate the buckling strength of long bamboo members.
Typical length of the specimens was 2500 mm. Figure 2.6(a) shows the set-up of the
buckling tests.
Table 2.10 show the experimental buckling loads obtained from the tests. For comparison,
the theoretical buckling loads for simple-simple support and for clamp-clamp support
condition are also shown in the table. It can be see that the experimental buckling loads
pretty much fall between these two theoretical buckling loads. This is reasonable since
the end conditions for the specimens were not simple support nor clamp support. In fact,
when the initial curvature is small, the end condition behaves more like a clamp support
and when the initial curvature is large, the end condition behaves more like a simple
support. The results show that using the clamp-clamp condition to determine the buckling
load of a long bamboo leads to a higher estimate which is non-conservative and unsafe.
On the other hand, the simply-simply support condition with curvature provides lower
bound estimates of the buckling loads of long bamboos. In the case that no obvious
curving is seen, the buckling loads of the simply-simply support condition without
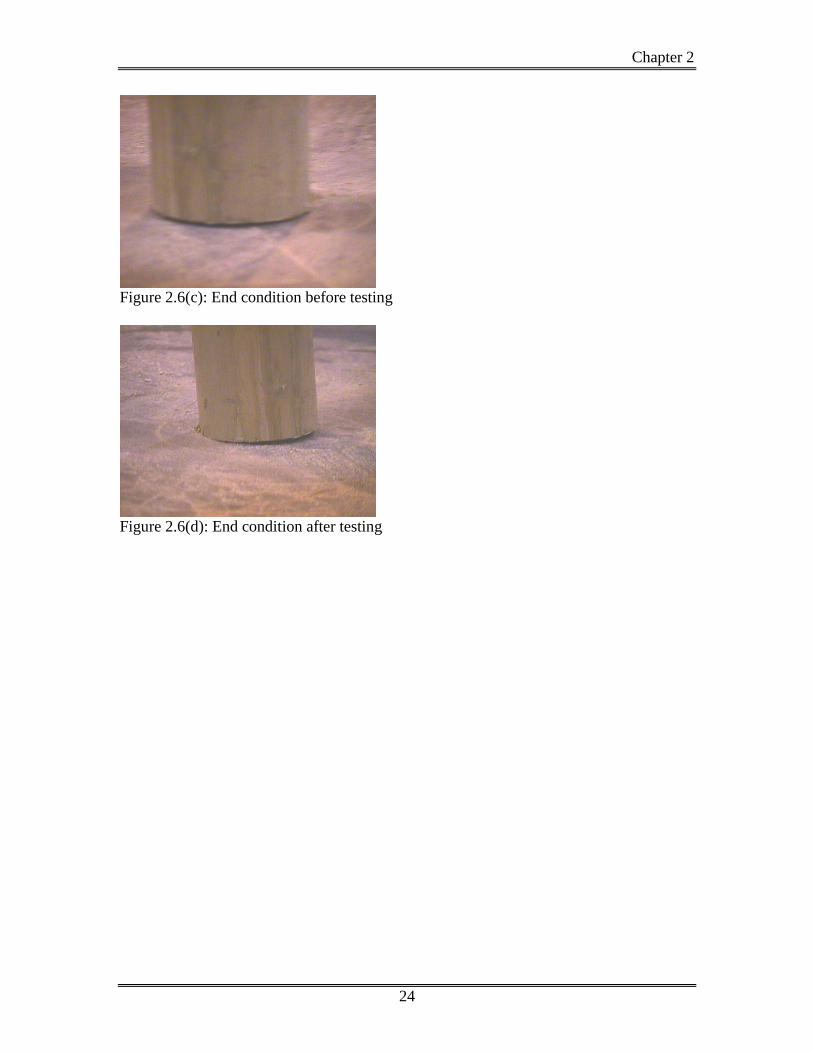
curvature can be used. Figure 2.6(c) and (d) show the end conditions before and after
testing for one of the specimens.
Chapter 2
14
Table 2.1: Test cases for the compressive strength of BP and PP
Material Case 1 Case 2 Case 3
BP 12 11 21
PP 5 5 8
Table 2.2: Mechanical properties for BP under normal compressive test
NL D (mm) A (mm2) S (N/mm
2) E (kN/mm
2)
mean std mean Std mean std 95% prob. mean std
1/4 53.2 6.8 969.5 365.5 58.6 7.7 45.9 7.9 1.3
1/2 53.4 6.8 969.8 355.4 56.6 6.0 46.7 7.9 1.6
none 54.6 5.5 989.5 295.8 56.0 9.7 40.1 7.6 2.1
Table 2.3: Mechanical properties for PP under normal compressive test
NL D (mm) A (mm2) S (N/mm
2) E (kN/mm
2)
mean std mean Std mean std 95% prob. mean std
1/4 77.8 18.8 1875.7 1002.1 60.1 12.9 38.9 6.7 1.9
1/2 77.4 18.5 1814.1 883.1 61.7 9.8 45.5 6.5 2.1
none 77.8 9.5 1739.6 427.9 60.4 7.8 47.5 6.1 1.2
Table 2.4: Mechanical properties for Fir under normal compressive test
D (mm) A (mm2) S (N/mm
2) E (kN/mm
2)
mean std mean std mean std 95% prob. mean std
92.6 7.0 6763.4 1044.7 25.8 6.4 15.3 3.9 1.2
Index: D = Diameter
NL = Node Location
A = Area
S = Strength
E = Young's modulus
Table 2.5: Test cases for the compressive strengths of bamboo under 4 different humidity
levels
Relative humidity
Material 60% 75% 90% 98%
BP 10 13 10 11
PP 11 14 12 12
Fir 4 3 3 3
Chapter 2
15
Table 2.6(a): Mechanical properties under humidity level 60%
D (mm) A (mm2) S (N/mm
2) E (kN/mm
2)
mean std mean std mean std mean std
BP 52.3 5.1 826.6 144.5 63.5 6.7 8.8 1.2
PP 73.5 5.9 1612.0 217.4 61.1 3.3 6.3 1.0
Fir 88.3 1.5 6118.1 208.3 32.3 3.8 4.3 0.8
Table 2.6(b): Mechanical properties under humidity level 75%
D (mm) A (mm2) S (N/mm
2) E (kN/mm
2)
mean std mean std mean std mean std
BP 52.5 5.5 968.4 198.5 48.5 7.1 6.7 1.6
PP 82.2 10.2 1924.7 521.3 60.7 5.9 6.3 1.5
Fir 88.0 2.6 6085.8 368.4 29.5 1.1 4.1 0.8
Table 2.6(c): Mechanical properties under humidity level 90%
D (mm) A (mm2) S (N/mm
2) E (kN/mm
2)
mean std mean std mean std mean std
BP 55.1 1.1 891.3 56.2 50.7 5.1 6.2 1.3
PP 63.4 5.3 1154.1 178.9 62.9 4.6 6.6 1.6
Fir 89.3 5.7 6284.8 787.8 24.2 10.6 2.6 0.7
Table 2.6(d): Mechanical properties under humidity level 98%
D (mm) A (mm2) S (N/mm
2) E (kN/mm
2)
mean std mean std mean std mean std
BP 53.1 2.4 884.6 146.2 41.9 6.4 5.9 1.0
PP 82.2 5.1 1811.2 278.5 57.0 7.4 5.9 1.3
Fir 89.0 6.1 6240.5 834.1 23.5 8.6 2.6 0.5
Table 2.7: Procedures of ASTM D1037-96 and GB13124-91
ASTM D1037-96 GB13124-91
1. Soaked in 49± 2°C water for 1 hour
2. Put in 93± 3°C water stream for 3 hours
3. Placed in -20± 2°C environmental for 20 hours
4. Dried up in 99± 2°C for 3 hours
5. Put in 93± 3°C water stream for 3 hours
6. Dried in 99± 2°C for 8 hours
7. Repeat steps 1 – 6 for 6 circles
8. Placed in room environment for 48 hours
(20°C and humidity 65± 1%)
1. Soaked in 63± 2°C water for 6
hours
2. Stored in -20°C for 6 hours
3. Dried in 63± 2°C for 6 hours
4. Stored in room temperature for
48 hours

Chapter 2
16
Table 2.8: Summary of compressive tests result under indoor aging effect
Condition Material Node location S (N/mm2) E (kN/mm
2)
ASTM D1037-
96
BP ¼ 44.2 9.2
BP ½ * *
BP None 42.2 5.1
PP ¼ 46.8 7.2
PP ½ * *
PP None * *
Fir None 16.7 0.8
GB13124-91
BP ¼ 50.4 11.3
BP ½ 40.7 6.9
BP None * *
PP ¼ 54.8 6.2
PP ½ 50.4 6.9
PP None 55.7 12.5
Fir None 14.8 0.8
*: Specimens failed during the aging process
Table 2.9: Mechanical properties of specimens under three points loading test
Material E (kN/mm2) S (N/mm
2)
Fir 6.3 44.6
PP 11.8 78.7
BP 20.0 80.7
Table 2.10: Results of the buckling tests
Sample
number Type
Initial
curvature
(x10-6
mm-1
)
Buckling
loading
(kN)
Theoretical buckling load (kN)
Simple - simple
support with
curvature
Simple - simple
support without
curvature
Clamp - clamp
support without
curvature
1 BP 5.3 11.4 3.6 3.9 15.4
2 BP 19 7.8 3.9 5 20.1
3 BP 20 15.6 5.3 6.3 25.4
4 BP 27 5.4 4.2 5.7 23
5 BP 46 9.4 5.7 8.8 35.1
6 BP 48 4.9 2.6 4.3 17
7 PP 24 36.7 12.6 17.3 69.2
8 PP 40 29.8 20.6 34.9 139.7
9 Fir 1.6 69.7 36.4 37 147.9
10 Fir 11 59.3 54.7 62.7 250.9
Chapter 2
17
20
30
40
50
60
70
80
90
400 600 800 1000 1200 1400 1600 1800 2000
Area (mm2)
Ultimate Load (kN)
Strength (N/mm2)
Figure 2.1(a): Relationship between mechanical properties and area of BP
30
35
40
45
50
55
60
65
70
75
80
40 45 50 55 60 65
Diameter (mm)
Ultimate Load (kN)
Strength (N/mm2)
Figure 2.1(b): Relationship between mechanical properties and diameter of BP
Chapter 2
18
0
200
400
600
800
1000
1200
1400
1600
1800
2000
40 45 50 55 60 65
Diameter (mm)
Are
a (m
m2)
Figure 2.1(c): Relationship between area and diameter of BP
0
2
4
6
8
10
12
40 45 50 55 60 65
Diameter (mm)
Youn
g's
modul
us
(kN
/mm
2)
Figure 2.1(d): Relationship between young’s modulus and diameter of BP
Chapter 2
19
30
50
70
90
110
130
150
170
500 1000 1500 2000 2500 3000 3500 4000
Area (mm2)
Ultimate Load (kN)
Strength (N/mm2)
Figure 2.2(a): Relationship between mechanical properties and area of PP
20
40
60
80
100
120
140
160
40 50 60 70 80 90 100 110
Diameter (mm)
Ultimate Loading (kN)
Strength (N/mm2)
Figure 2.2(b): Relationship between mechanical properties and diameter of PP
Chapter 2
20
500
1000
1500
2000
2500
3000
3500
4000
40 50 60 70 80 90 100 110
Diameter (mm)
Are
a (m
m2)
Figure 2.2(c): Relationship between area and diameter of PP
Relationship between Young's modulus and diameter of PP
0
1
2
3
4
5
6
7
8
9
10
40 50 60 70 80 90 100 110
Diameter (mm)
Young's
modulu
s (k
N/m
m 2
)
Figure 2.2(d): Relationship between young’s modulus and diameter of PP
Chapter 2
21
Strength of specimens under T=26oC
20
25
30
35
40
45
50
55
60
65
70
55% 60% 65% 70% 75% 80% 85% 90% 95% 100%
Relative Humidity (%)
Mea
n s
tren
gth
(N
/mm
2)
BP
PP
Fir
Figure 2.3(a): Strength of bamboos under different relative humidity levels
Young's modulus of specimens under T=26oC
2.00
3.00
4.00
5.00
6.00
7.00
8.00
9.00
55% 60% 65% 70% 75% 80% 85% 90% 95% 100%
Relative Humidity (%)
Young's
modulu
s
(kN
/mm
2)
BP
PP
Fir
Figure 2.3(b): Young’s modulus of bamboos under different relative humidity levels
Chapter 2
22
Reduction of strength of PP
0
10
20
30
40
50
60
70
80
90
100
0 2 4 6 8 10 12
Week
Red
ucti
on
%
Figure 2.4(a): Reduction of strength of PP during the aging process
Reduction of strength of BP
0
10
20
30
40
50
60
70
80
90
100
0 2 4 6 8 10 12
Week
Red
ucti
on
%
Figure 2.4(b): Reduction of strength of BP during the aging process
Chapter 2
23
Figure 2.5: Set up for the flexure Test
Figure 2.6(a): Set up for the buckling test
Figure 2.6(b): Specimen during loading
Chapter 2
24
Figure 2.6(c): End condition before testing
Figure 2.6(d): End condition after testing
Chapter 3
25
Chapter 3: Material properties of the fastening tie and scaffold intersection
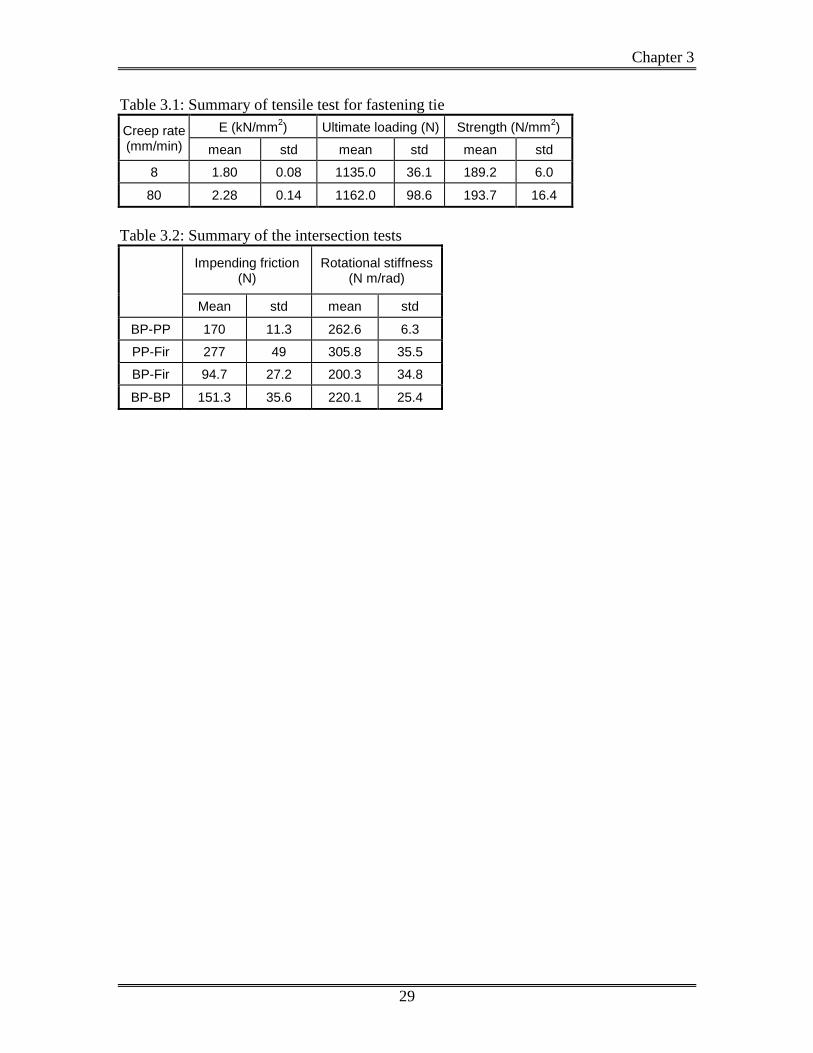
3.1 Tensile tests for the fastening tie
The tensile strength of the fastening tie was tested using the MTS Universal Testing
machine 858. The most common type of lashings was used for the tests. The dimension
of the specimens was width = 6 mm, thickness = 1 mm and length = 100 mm. Two
pulling rates 8 mm/min and 80 mm/min were tested. Six specimens were tested for each
pulling rate to determine the Young’s modulus, the ultimate load and the strength of the
fastening tie. The test results are shown in Table 3.1. It is seen that a higher loading rate
tends to produce higher values for all properties. It is note that the strength of the
fastening tie is about three times of that of that of the bamboo, while its Young’s modulus
is about one third of that of the bamboo.
Chapter 3
26
3.2 Creep effect of the fastening tie
This experiment was to determine the creeping effect on the fastening tie. The machine
applied a load (50 N or 100 N) to the fastening tie within 5 sec and then kept the load
constant. The extension of the specimens was recorded to evaluate the creeping effect of
the fastening tie. Each test was carried out for a time duration of 30 hours to observe the
behavior of the fastening tie under tensile loading condition.
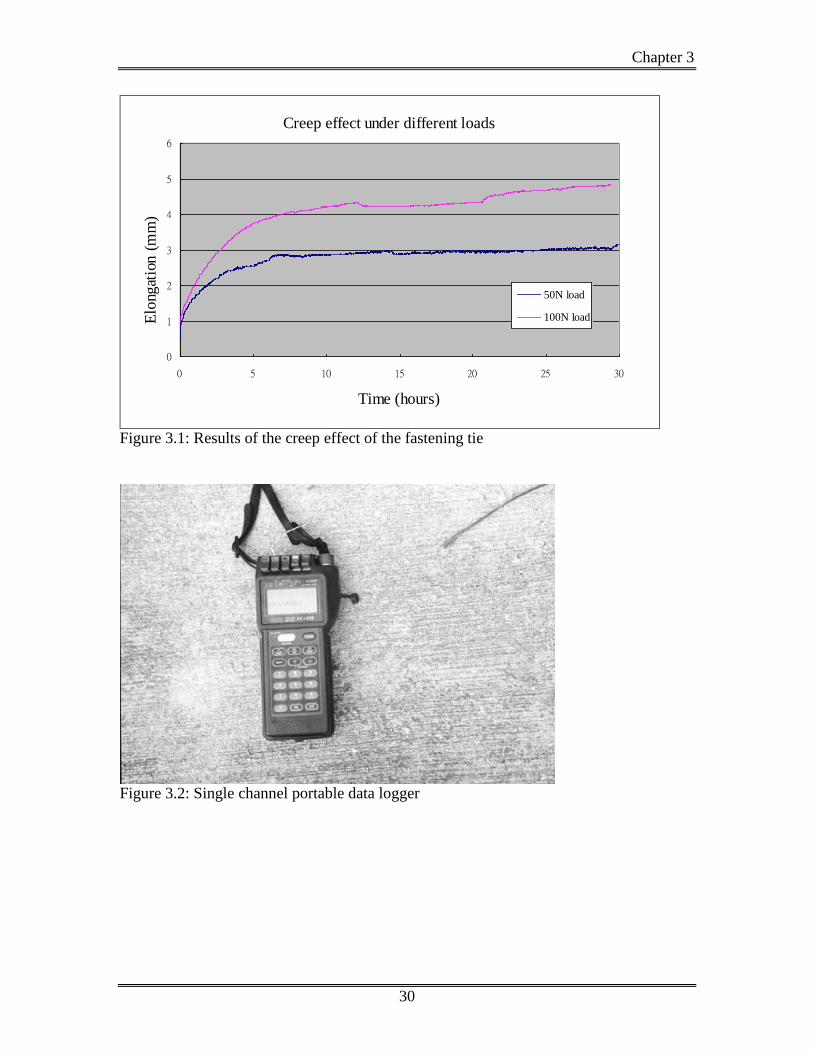
The results were shown in Figure 3.1. For a constant tensile load of 50 N applied on the
fastening tie, the initial elongation of the fastening tie is about 0.5 mm and steadily
reaches 3 mm after 15 hours. The creep strain induced by the 50 N load is about 3%. On
the other hand, for a constant tensile load of 100 N, the initial elongation is about 1 mm
and steadily reaches 4.7 mm after 25 hours. The creep strain induced by the 100 N load is
about 5%.

Chapter 3
27
3.3 Tensile tests for the fastening tie during fixing the joint
This test was to evaluate the tensile force inside the fastening tie during fixing the joints.
Strain gauge was attached to the tie before fixing the joint and the single channel portal
data logger took the reading before and after fixing the joint. The tensile force can be
obtained by multiply the strain with the axial rigidity (EA). A few tests were conducted
and the strains incurred due to the fastening were recorded.
It is found that the mean tensile force in the fastening tie during fixing the joints is about
23 N. This force is much less than the ultimate tensile force of 1135 N obtained in section
3.1, which indicates that fracture of fastening tie during fixing the joint is not likely. The
mean tensile force developed in the fastening tie however is expected to induce the creep
behavior with a creep strain between to be about 2 %. This creep strain is expected to
loosen the bamboo joint as time progresses.

Chapter 3
28
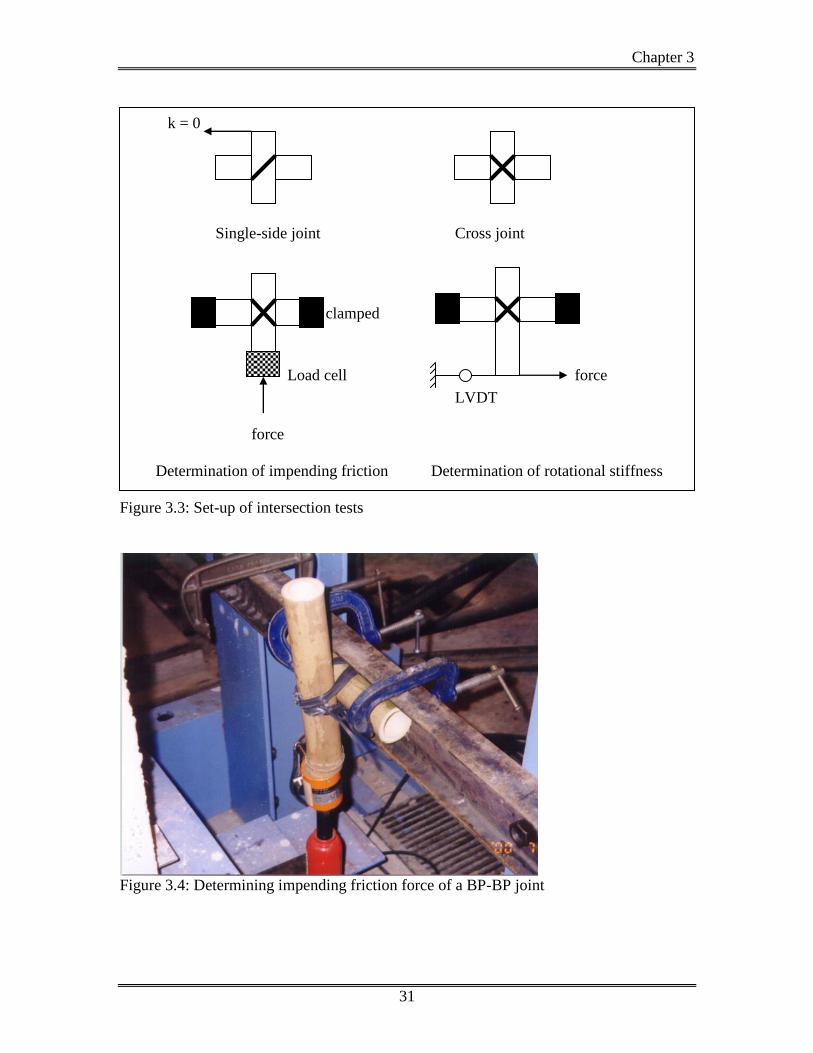
3.4 Scaffold intersection tests
The objective of the scaffold intersection tests was to obtain the impending friction
between the two bamboo components of a joint. The impending friction is defined as the
maximum friction before the two components slide relative to each other. This impending
friction will be used as an indicator for local instability/failure of a scaffold intersection.
Also obtained from the tests are the relative rotational stiffness for the two components of
the joint. This rotational stiffness will be used in the numerical finite element analysis
presented in Chapter 5. The most common type of joint is a single-side joint (see Figure
3.3). This type of joint possesses zero rotational stiffness if the two components rotate
toward the direction which is perpendicular to the direction of the fastening tie. Due to
this zero rotational stiffness, it is difficult to perform the intersection tests. It was decided
to use a cross type of joint as shown in Figure 3.3 for the test. The set-up to the two types
of test are shown in Figure 3.3. The impending friction forces obtained were divided by
two to approximate the impending friction forces of single-side joints. A total of four
types of intersection were tested: BP-PP, PP-Fir, BP-Fir and BP-BP. Four tests were
conducted for each type of intersection.
Table 3.2 summarizes the results of these intersection tests. It is seen that the impending
friction forces for these four types of intersection are in the order of 100 – 200 N and the
rotational stiffness are in the order of 200 – 300 N-m/rad. These results would be useful
in the safety analysis of the bamboo scaffoldings.
Chapter 3
29
Table 3.1: Summary of tensile test for fastening tie
Creep rate (mm/min)
E (kN/mm2) Ultimate loading (N) Strength (N/mm
2)
mean std mean std mean std
8 1.80 0.08 1135.0 36.1 189.2 6.0
80 2.28 0.14 1162.0 98.6 193.7 16.4
Table 3.2: Summary of the intersection tests
Impending friction (N)
Rotational stiffness (N m/rad)
Mean std mean std
BP-PP 170 11.3 262.6 6.3
PP-Fir 277 49 305.8 35.5
BP-Fir 94.7 27.2 200.3 34.8
BP-BP 151.3 35.6 220.1 25.4
Chapter 3
30
Creep effect under different loads
0
1
2
3
4
5
6
0 5 10 15 20 25 30
Time (hours)
Elo
ngat
ion (
mm
)
.
50N load
100N load
Figure 3.1: Results of the creep effect of the fastening tie
Figure 3.2: Single channel portable data logger
Chapter 3
31
k = 0
Single-side joint Cross joint
clamped
Load cell force
LVDT
force
Determination of impending friction Determination of rotational stiffness
Figure 3.3: Set-up of intersection tests
Figure 3.4: Determining impending friction force of a BP-BP joint
Chapter 4
32
Chapter 4: Experiment on the full-scale scaffolding
4.1 Aim of the full-scale scaffolding experiment
The objective of the full-scale scaffolding tests is to experimentally validate the safety of
scaffoldings under uniform distributed loads and drop loads.
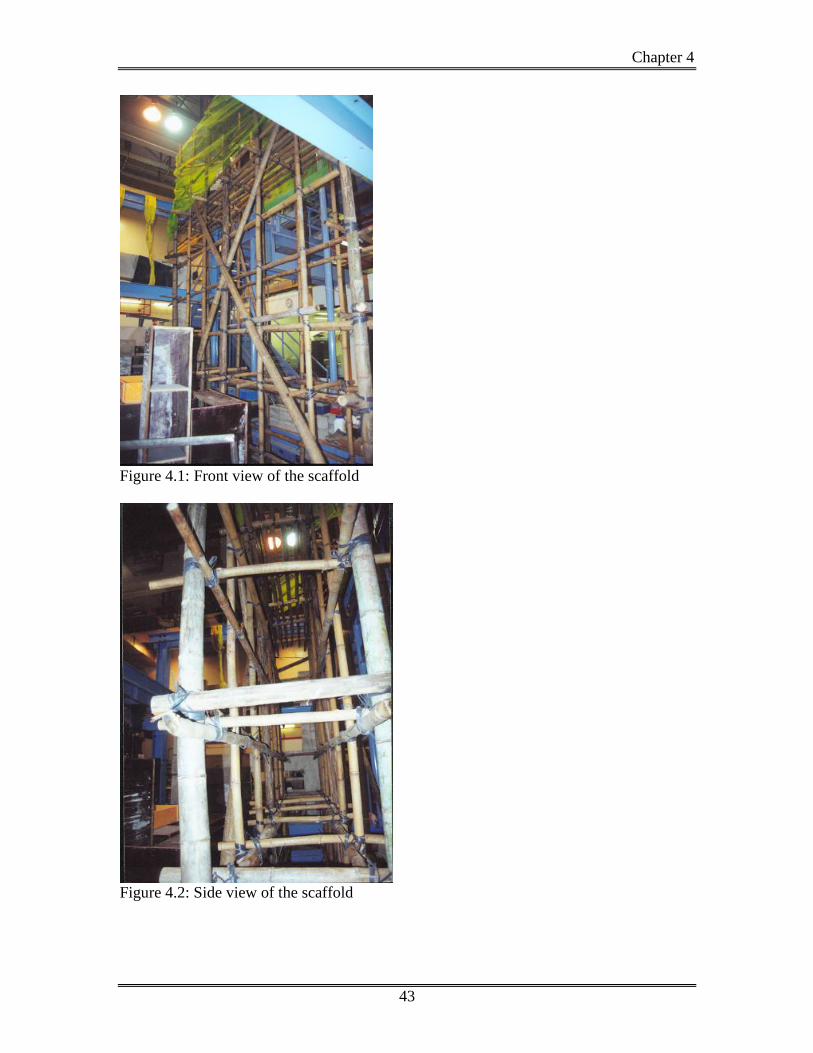
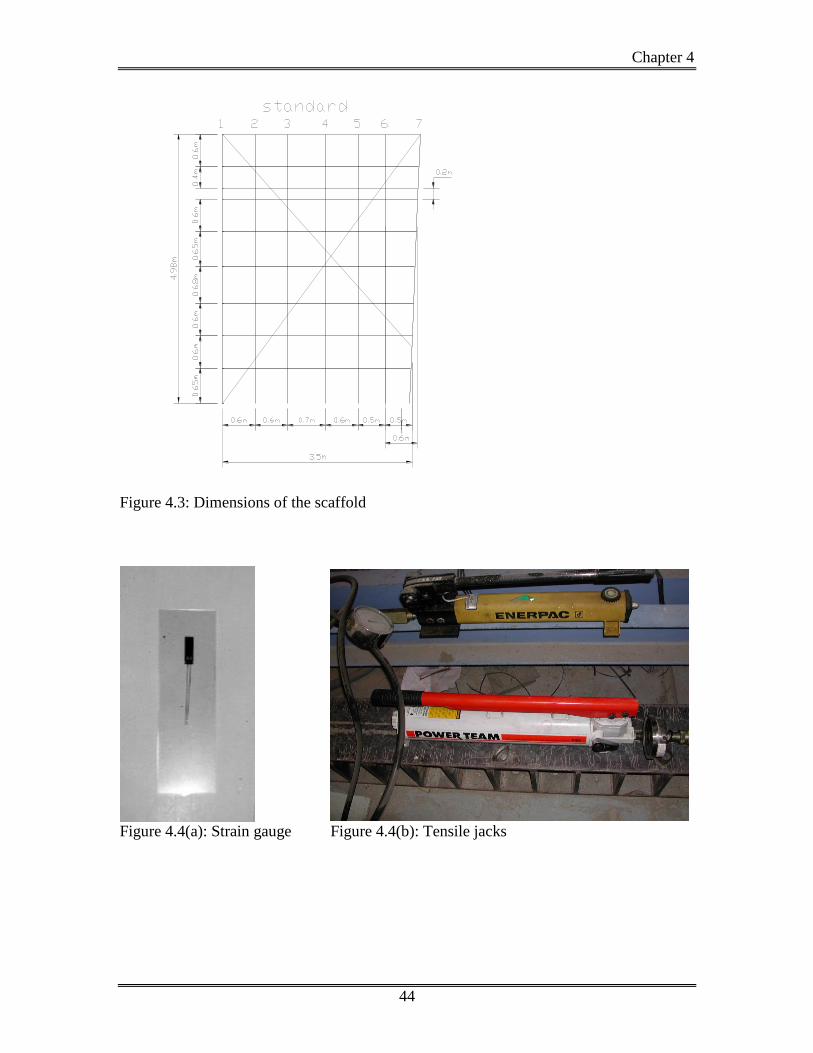
4.2 Description of the full-scale scaffolding
The scaffolding that was used for testing was a double-layer scaffolding with dimensions
4.98 m x 3.6 m x 0.6 m (height x length x width). Each layer had seven standards, two of
which at the outmost were PP, the middle standard was Fir and the remaining four
standards were BP. The scaffolding had two board platforms at the height of 1.3 m and 4
m, respectively. It was X-braced by two PP bamboos at the back side and two BP
bamboos at the front sides and connected to a rigid steel frame at one side. Photos
showing the scaffolding can be found in Figure 4.1-4.3. This scaffolding was constructed
by Mr. B.Y. Poon who has over 25 years experience in bamboo construction and is a
certified bamboo scaffolding worker.
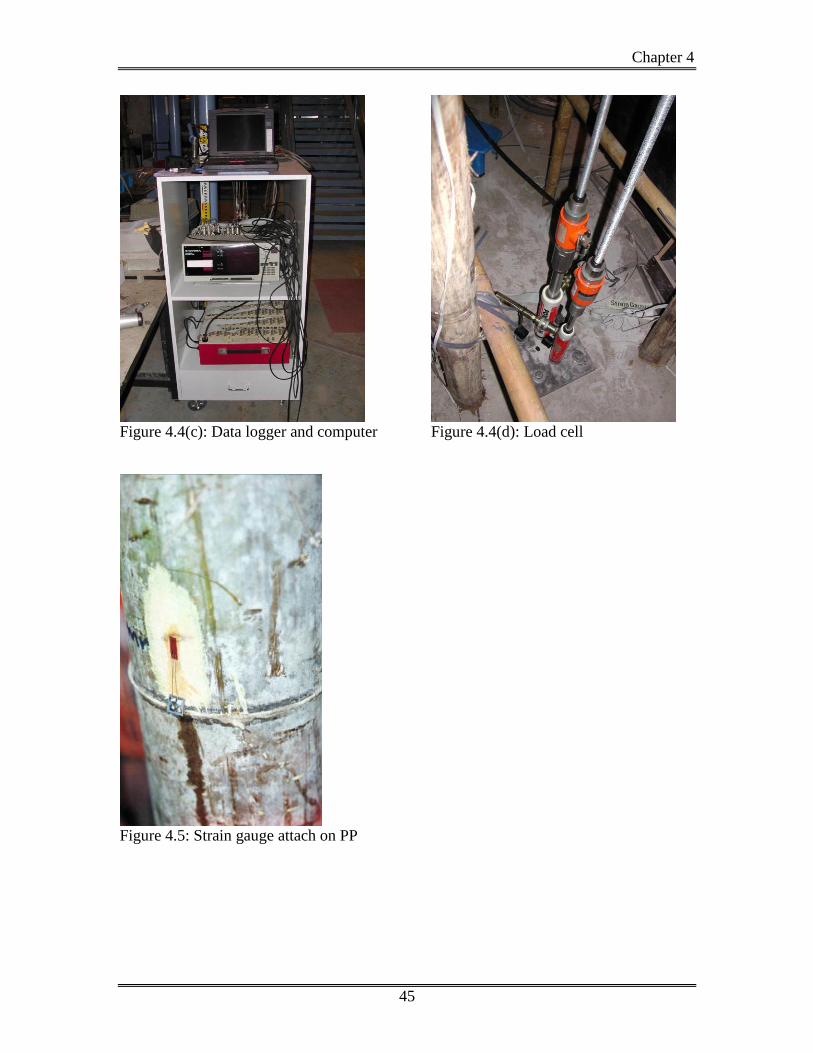
4.3 Test equipment
The equipment used in the tests included strain gauges (see Figure 4.4(a)), tensile jack
(see Figure 4.4(b)), data logger and computer (see Figure 4.4(c)) and load cell (Figure
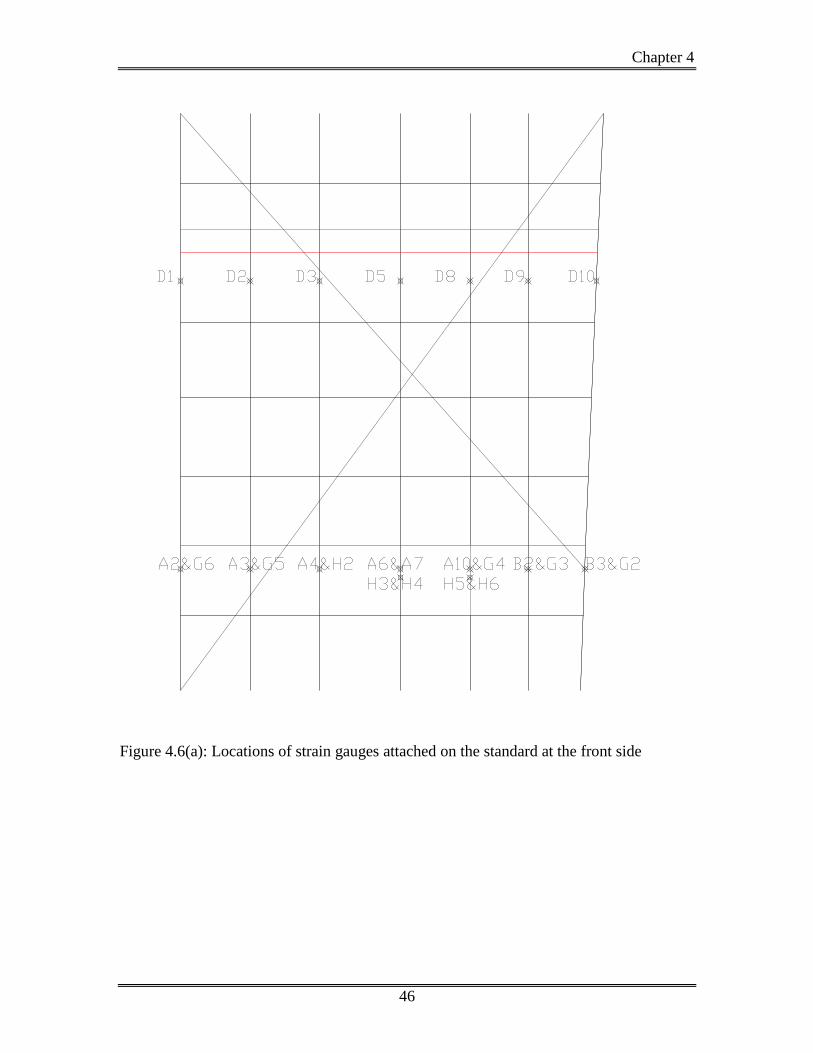
4.4(d)). A total of 49 strain gauges were installed at various locations of the standards as
shown in Figure 4.5 and 4.6(a)-(b).

Chapter 4
33
4.4 Uniform distributed load tests
4.4.1 Test setup
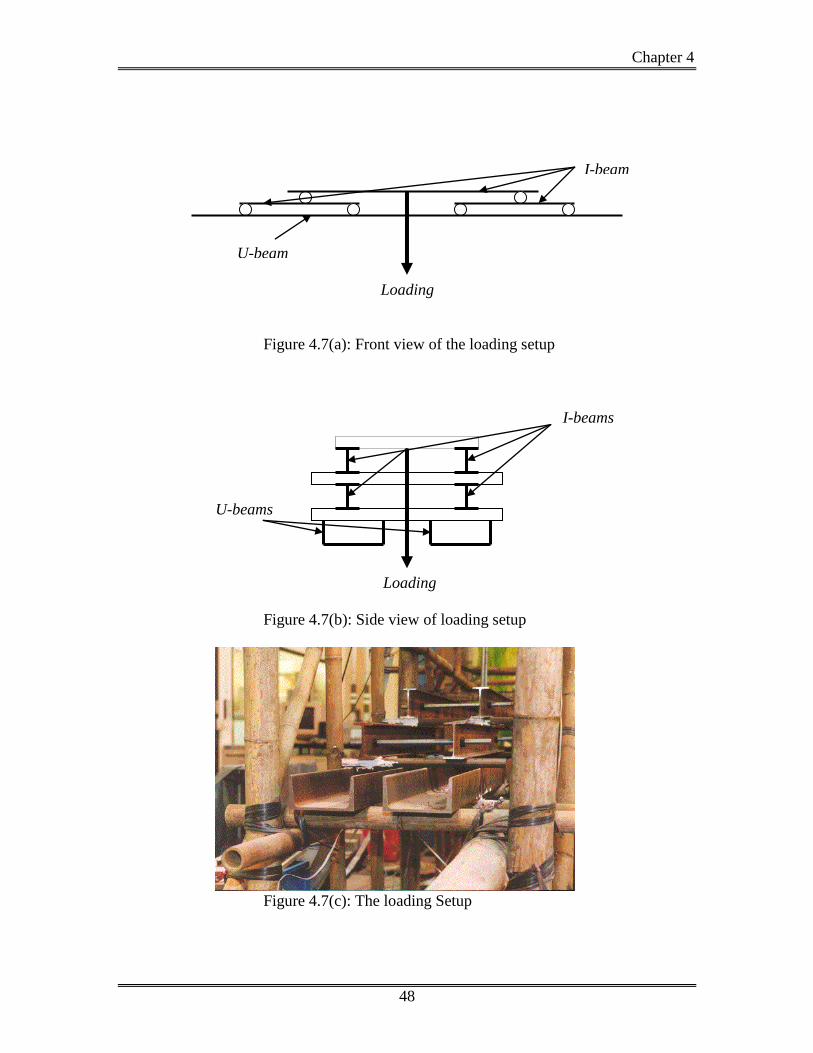
In the Code of Practice for Bamboo Scaffolding Safety issued by the Labour Department,
bamboo scaffolding should be designed to withstand a uniform distributed load (UDL) of
3 kN/m2 in masonry or special duty. To create the UDL condition in the laboratory, a
loading setup as shown in Figure 4.6 was used. The load generated by the tensile jack
was applied on two I-beams which were roller-supported on four I-beams. Two rigid U
beams were placed underneath these four I-beams and transmitted the force to the
platform of scaffolding. The tests were separated into the following seven cases:
(1) Loads applied at the bottom platform
a. 5 kN jack force (UDL = 2.67 kN/m2)
b. 10 kN jack force (UDL = 5.35 kN/m2)
c. 15 kN jack force (UDL = 8.02 kN/m2)
(2) Loads applied at the upper platform
a. 5 kN jack force (UDL = 2.67 kN/m2)
b. 10 kN jack force (UDL = 5.35 kN/m2)
(3) Loads applied at both platforms
a. 5 kN jack force (UDL = 2.67 kN/m2)
b. 10 kN jack force (UDL = 5.35 kN/m2)
For each case, at least 5 independent tests were conducted. The mean values and the
standard deviations of the column strains close to the bottom platform were computed
based on the measured strains. The mean values and the standard deviations of the
standard forces were then calculated by multiplying the strain valves with the averaged
bamboo cross sectional rigidities obtained in Chapter 2.
Chapter 4
34
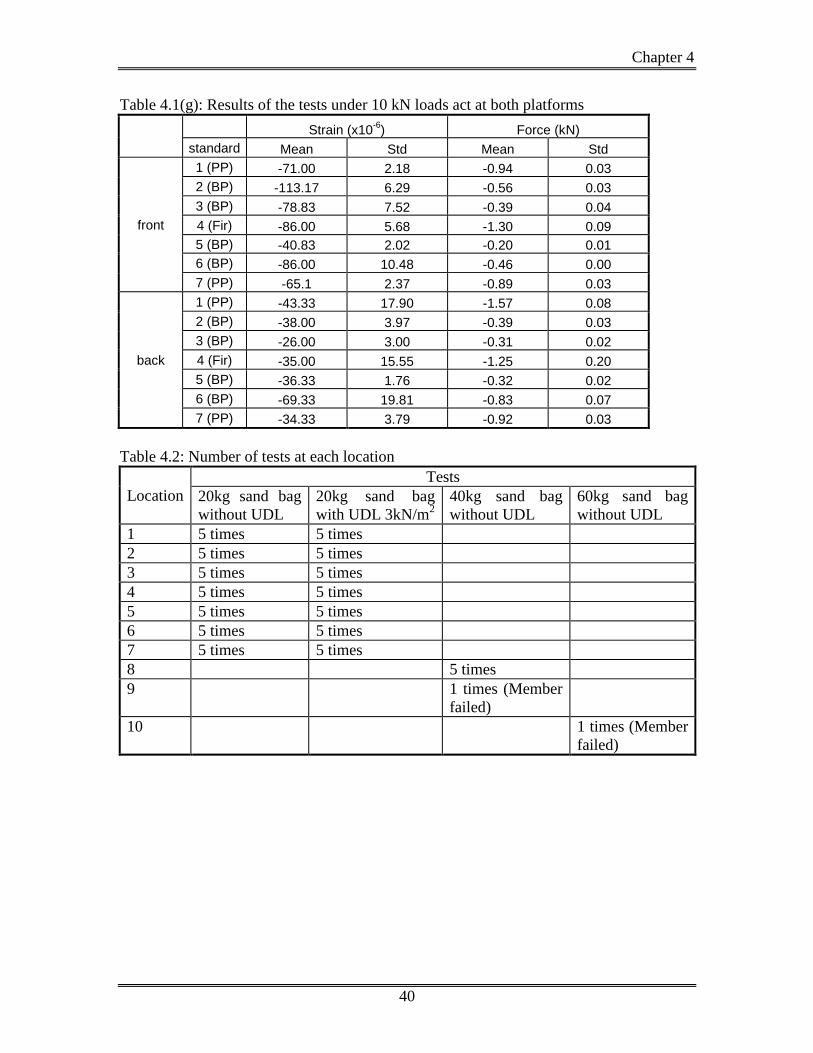
4.4.2 Results of uniform distributed load tests
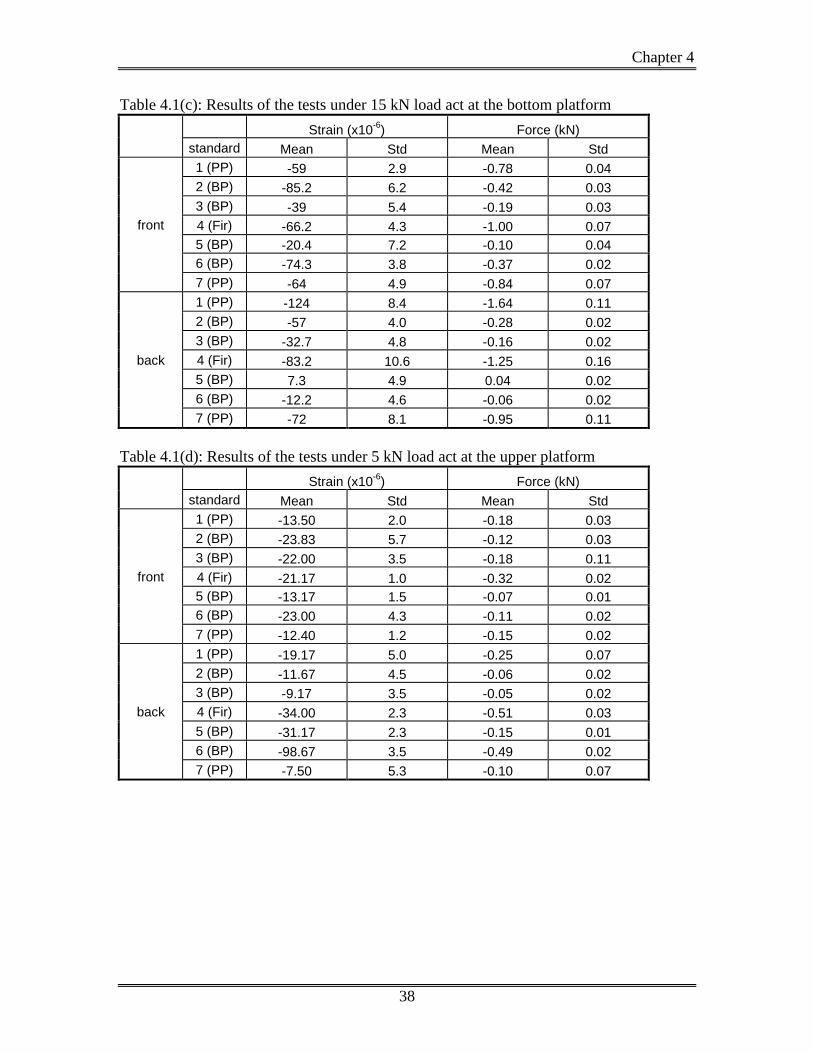
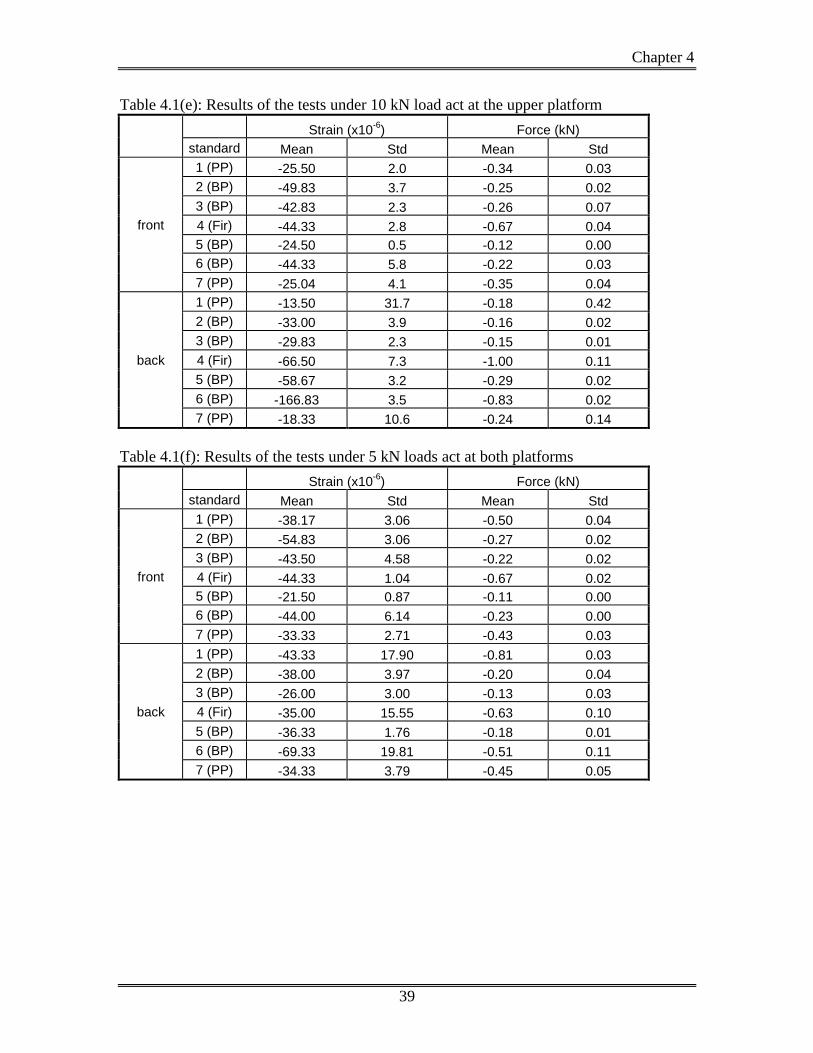
Table 4.1(a)-(g) show the results of these UDL tests, where the results of UDL acting at
the bottom platform, upper platform and both platforms are shown in Table 4.1(a)-(c),
4.1(d)-(e) and 4.1(f)-(g), respectively. From these results, the following observations can
be seen.
(1) The forces carried by the PP (standards 1 and 7) and the Fir (standard 4) are
larger than those carried by the BP (standards 2,3,5 and 6).
(2) For the UDL acting at the same platform, the standard forces are
approximately linearly proportional to the magnitudes of the UDL.
(3) For the UDL acting at both platforms, the standard forces are approximately
equal to the superposition of the standard forces obtained from the UDL acting
at the bottom and at the upper platform respectively.
(4) The standard deviations of the measured strain are quite small which suggests
that the test results are quite consistent.
(5) There does not appear to be any notable deformation nor any sign of damage in
any part of the scaffolding for UDL up to 5.35 kN/m2 (or jack force up to 10
kN). When the 15 kN jack force (or UDL = 8.02 kN/m2) was applied at the
bottom platform, some noises were heard from the scaffolding which however
did not produce any notable deformation nor damage once the force was
released.
(6) The compressive stress caused by the standard forces is much less than the
compressive strength found in Section 2.1. It indicated that the member would
not fail in compressive failure under this loading.
(7) The simple-simple support condition of a long member provided a lower
bound value of the buckling load which has shown in Section 2.5. The
calculated buckling load for a PP bamboo with 0.6 m long is 241 kN which is
much greater than the force carried by the standards.

Chapter 4
35
4.5 Drop tests
4.5.1 Test setup
The tests were divided into two parts: 1) Drop without any load on the scaffold and 2)
Drop with an UDL of 3 kN/m2 on each of the two platforms. Table 4.2 summarizes the
number and the location of tests conducted.
1) Drop without any other load on the scaffold
A sand bag was used to simulate a person falling from a height. The test procedure
followed the BS EN 364:1993 standard [10]. The sand bag was attached to a safety belt
with length of 1.2 m. The other end of the safety belt was attached to several locations on
the scaffoldings (see Figure 4.11). At each location, five drop tests were performed in
order to obtain the mean and the standard deviation of the standard forces. During the
tests, the sand bag was lifted up by a rope to 1.2 m above the test location before released.
The maximum clearance between the sand bag and the scaffold is 300 mm. The record
rate of the data logger was set to be 50 Hz to ensure the sudden change of strain due to
the drop could be recorded. Two sand bags with weight of 20 kg and 40 kg respectively
were used for the tests.
2) Drop with an UDL of 3 kN/m2 on each of the two platforms.
The test procedure was similar to the previous one except that an UDL of 3 kN/m2 was
applied on each of the two platforms. It was used to simulate the worse situation that a
person fell from a height when the scaffold was under the design load. A sand bag with
weight of 20kg was used for the tests.
Chapter 4
36
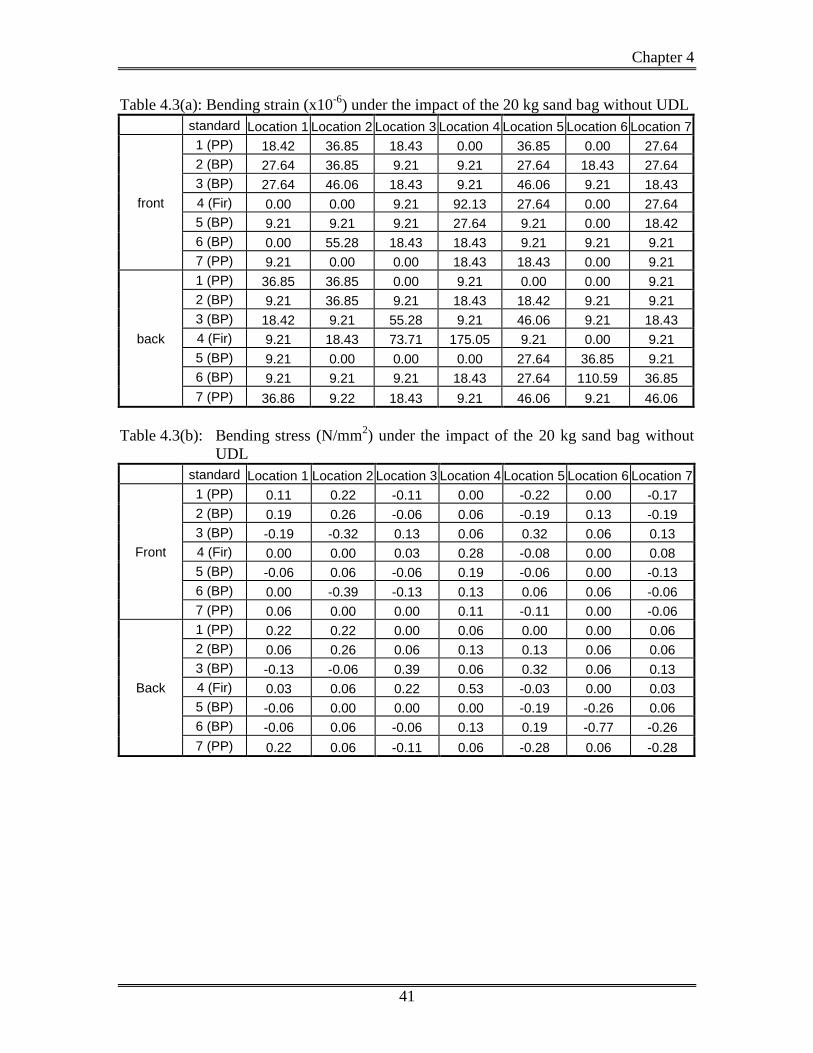
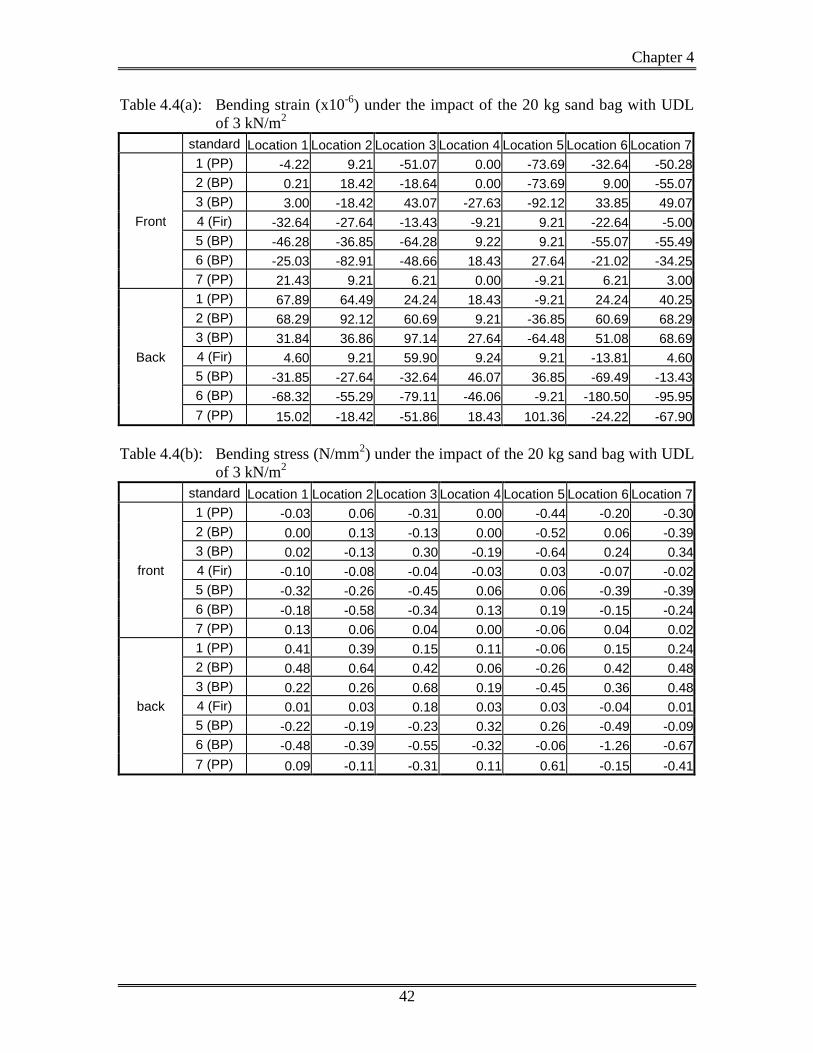
4.5.2 Results of the drop tests
Table 4.3-4.4 show the results of these drop tests, where the results of drop tests of 20 kg
sand bag without UDL is shown in Table 4.3(a)-(b) and the results of drop tests of 20 kg
sand bag with UDL of 3 kN/m2 is shown in Table 4.4(a)-(b). From these results, the
following observations can be seen.
(1) The bending stresses of all the bamboos are much lower than the flexural
strength found in Section 2.4. The flexural strength is nearly a hundred times
larger than the bending stresses found in the drop tests.
(2) The axial forces of the standard in the drop tests are not significant. Most of
the standard are carried almost zero axial forces.
(3) In Table 4.3(b), it can be seen that the bending stress are usually concentrated
at the dropped location and the neighborhood locations in the drop tests
without UDL. The dropped location was usually occurred the highest bending
stress.
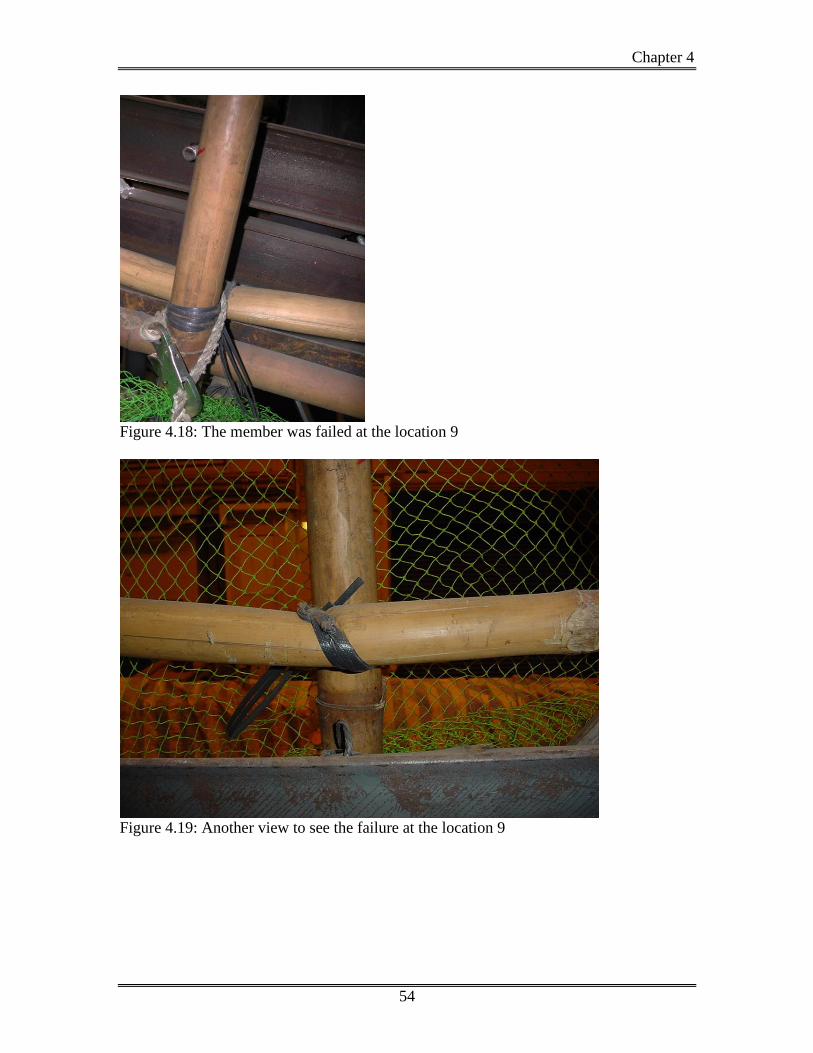
(4) The drop of the 40 kg sand bag at the location 8 causes a great deflection at the
joint. Figure 4.14 and 4.15 showed the difference of the joint allocation before
and after one drop. The displacement before and after the drop is nearly 25 mm.
Other than the tied location, the neighborhood joint has recorded displacement.
Figure 4.16 and 4.17 showed the displacement of the joint at location 9. The
difference of the displacement is 20 mm.
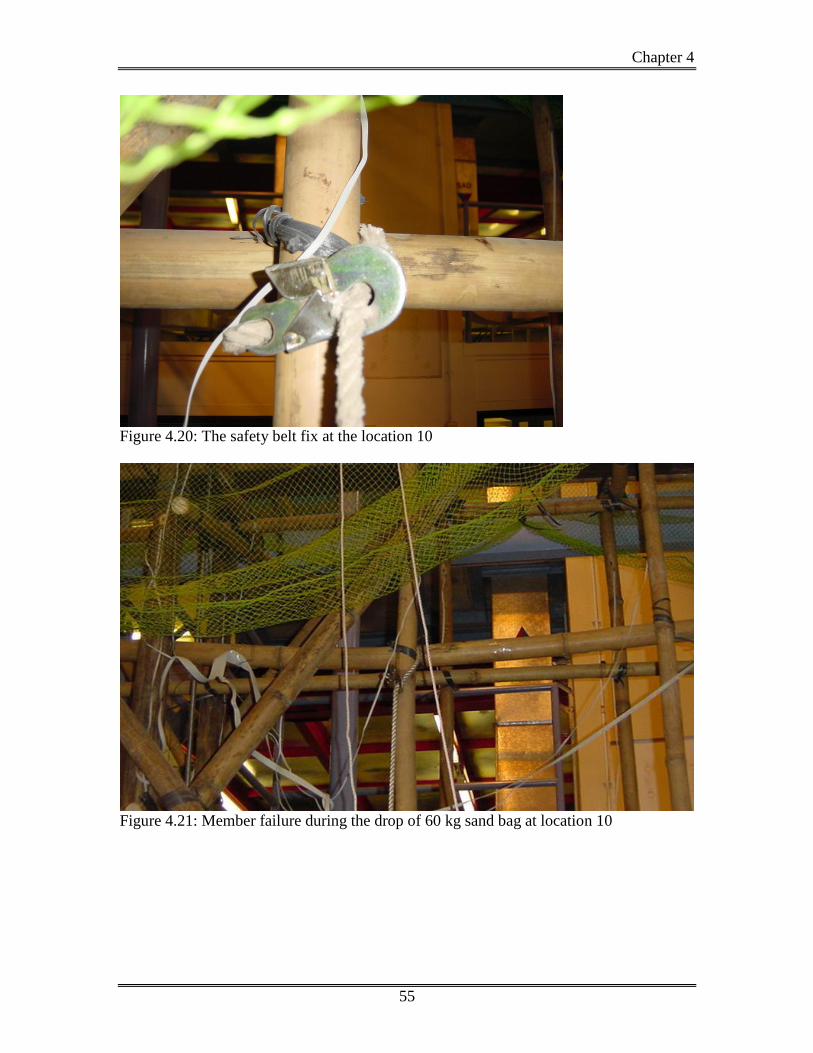
(5) When the 40kg sand bag was dropped at location 9, the ledger was failure near
the joint (see Figure 4.18). It showed that the ledgers are probably cannot
afford such an impact load.
(6) A sand bag with 60 kg was tested. The sand bag was dropped at the location 10.
The member is bent significantly after the drop (see Figure 4.21). It showed
that the ledgers are not suitable for fixing the safety belt.

Chapter 4
37
Table 4.1(a): Results of the tests under 5 kN load act at the bottom platform
Strain (x10-6
) Force (kN)
standard Mean Std Mean Std
front
1 (PP) -19.58 0.38 -0.26 0.01
2 (BP) -24.42 1.28 -0.12 0.01
3 (BP) -16.58 0.80 -0.08 0.00
4 (Fir) -24.67 0.76 -0.37 0.01
5 (BP) -5.08 1.28 -0.03 0.01
6 (BP) -21.50 3.97 -0.11 0.02
7 (PP) -20.00 2.10 -0.31 0.03
back
1 (PP) -46.83 2.02 -0.62 0.03
2 (BP) -17.67 1.15 -0.17 0.15
3 (BP) -11.58 1.01 -0.13 0.12
4 (Fir) -26.42 5.14 -0.17 0.47
5 (BP) 1.92 0.80 0.02 0.01
6 (BP) -5.00 2.65 -0.02 0.01
7 (PP) -28.08 2.18 -0.37 0.03
Table 4.1(b): Results of the tests under 10 kN load act at the bottom platform
Strain (x10-6
) Force (kN)
standard Mean Std Mean Std
front
1 (PP) -36.17 2.25 -0.48 0.03
2 (BP) -58.17 7.77 -0.29 0.04
3 (BP) -35.50 2.78 -0.18 0.01
4 (Fir) -47.83 2.25 -0.72 0.03
5 (BP) -13.33 6.21 -0.07 0.03
6 (BP) -48.67 2.93 -0.24 0.01
7 (PP) -43.00 3.17 -0.57 0.04
back
1 (PP) -86.67 3.51 -1.15 0.05
2 (BP) -37.17 1.04 -0.18 0.01
3 (BP) -21.67 5.48 -0.11 0.03
4 (Fir) -63.00 5.63 -0.95 0.09
5 (BP) 6.83 2.08 0.03 0.01
6 (BP) -10.17 2.57 -0.05 0.01
7 (PP) -47.17 6.45 -0.62 0.09
Chapter 4
38
Table 4.1(c): Results of the tests under 15 kN load act at the bottom platform
Strain (x10-6
) Force (kN)
standard Mean Std Mean Std
front
1 (PP) -59 2.9 -0.78 0.04
2 (BP) -85.2 6.2 -0.42 0.03
3 (BP) -39 5.4 -0.19 0.03
4 (Fir) -66.2 4.3 -1.00 0.07
5 (BP) -20.4 7.2 -0.10 0.04
6 (BP) -74.3 3.8 -0.37 0.02
7 (PP) -64 4.9 -0.84 0.07
back
1 (PP) -124 8.4 -1.64 0.11
2 (BP) -57 4.0 -0.28 0.02
3 (BP) -32.7 4.8 -0.16 0.02
4 (Fir) -83.2 10.6 -1.25 0.16
5 (BP) 7.3 4.9 0.04 0.02
6 (BP) -12.2 4.6 -0.06 0.02
7 (PP) -72 8.1 -0.95 0.11
Table 4.1(d): Results of the tests under 5 kN load act at the upper platform
Strain (x10-6
) Force (kN)
standard Mean Std Mean Std
front
1 (PP) -13.50 2.0 -0.18 0.03
2 (BP) -23.83 5.7 -0.12 0.03
3 (BP) -22.00 3.5 -0.18 0.11
4 (Fir) -21.17 1.0 -0.32 0.02
5 (BP) -13.17 1.5 -0.07 0.01
6 (BP) -23.00 4.3 -0.11 0.02
7 (PP) -12.40 1.2 -0.15 0.02
back
1 (PP) -19.17 5.0 -0.25 0.07
2 (BP) -11.67 4.5 -0.06 0.02
3 (BP) -9.17 3.5 -0.05 0.02
4 (Fir) -34.00 2.3 -0.51 0.03
5 (BP) -31.17 2.3 -0.15 0.01
6 (BP) -98.67 3.5 -0.49 0.02
7 (PP) -7.50 5.3 -0.10 0.07
Chapter 4
39
Table 4.1(e): Results of the tests under 10 kN load act at the upper platform
Strain (x10-6
) Force (kN)
standard Mean Std Mean Std
front
1 (PP) -25.50 2.0 -0.34 0.03
2 (BP) -49.83 3.7 -0.25 0.02
3 (BP) -42.83 2.3 -0.26 0.07
4 (Fir) -44.33 2.8 -0.67 0.04
5 (BP) -24.50 0.5 -0.12 0.00
6 (BP) -44.33 5.8 -0.22 0.03
7 (PP) -25.04 4.1 -0.35 0.04
back
1 (PP) -13.50 31.7 -0.18 0.42
2 (BP) -33.00 3.9 -0.16 0.02
3 (BP) -29.83 2.3 -0.15 0.01
4 (Fir) -66.50 7.3 -1.00 0.11
5 (BP) -58.67 3.2 -0.29 0.02
6 (BP) -166.83 3.5 -0.83 0.02
7 (PP) -18.33 10.6 -0.24 0.14
Table 4.1(f): Results of the tests under 5 kN loads act at both platforms
Strain (x10-6
) Force (kN)
standard Mean Std Mean Std
front
1 (PP) -38.17 3.06 -0.50 0.04
2 (BP) -54.83 3.06 -0.27 0.02
3 (BP) -43.50 4.58 -0.22 0.02
4 (Fir) -44.33 1.04 -0.67 0.02
5 (BP) -21.50 0.87 -0.11 0.00
6 (BP) -44.00 6.14 -0.23 0.00
7 (PP) -33.33 2.71 -0.43 0.03
back
1 (PP) -43.33 17.90 -0.81 0.03
2 (BP) -38.00 3.97 -0.20 0.04
3 (BP) -26.00 3.00 -0.13 0.03
4 (Fir) -35.00 15.55 -0.63 0.10
5 (BP) -36.33 1.76 -0.18 0.01
6 (BP) -69.33 19.81 -0.51 0.11
7 (PP) -34.33 3.79 -0.45 0.05
Chapter 4
40
Table 4.1(g): Results of the tests under 10 kN loads act at both platforms
Strain (x10-6
) Force (kN)
standard Mean Std Mean Std
front
1 (PP) -71.00 2.18 -0.94 0.03
2 (BP) -113.17 6.29 -0.56 0.03
3 (BP) -78.83 7.52 -0.39 0.04
4 (Fir) -86.00 5.68 -1.30 0.09
5 (BP) -40.83 2.02 -0.20 0.01
6 (BP) -86.00 10.48 -0.46 0.00
7 (PP) -65.1 2.37 -0.89 0.03
back
1 (PP) -43.33 17.90 -1.57 0.08
2 (BP) -38.00 3.97 -0.39 0.03
3 (BP) -26.00 3.00 -0.31 0.02
4 (Fir) -35.00 15.55 -1.25 0.20
5 (BP) -36.33 1.76 -0.32 0.02
6 (BP) -69.33 19.81 -0.83 0.07
7 (PP) -34.33 3.79 -0.92 0.03
Table 4.2: Number of tests at each location
Location
Tests
20kg sand bag
without UDL
20kg sand bag
with UDL 3kN/m2
40kg sand bag
without UDL
60kg sand bag
without UDL
1 5 times 5 times
2 5 times 5 times
3 5 times 5 times
4 5 times 5 times
5 5 times 5 times
6 5 times 5 times
7 5 times 5 times
8 5 times
9 1 times (Member
failed)
10 1 times (Member
failed)
Chapter 4
41
Table 4.3(a): Bending strain (x10-6
) under the impact of the 20 kg sand bag without UDL
standard Location 1 Location 2 Location 3 Location 4 Location 5 Location 6 Location 7
front
1 (PP) 18.42 36.85 18.43 0.00 36.85 0.00 27.64
2 (BP) 27.64 36.85 9.21 9.21 27.64 18.43 27.64
3 (BP) 27.64 46.06 18.43 9.21 46.06 9.21 18.43
4 (Fir) 0.00 0.00 9.21 92.13 27.64 0.00 27.64
5 (BP) 9.21 9.21 9.21 27.64 9.21 0.00 18.42
6 (BP) 0.00 55.28 18.43 18.43 9.21 9.21 9.21
7 (PP) 9.21 0.00 0.00 18.43 18.43 0.00 9.21
back
1 (PP) 36.85 36.85 0.00 9.21 0.00 0.00 9.21
2 (BP) 9.21 36.85 9.21 18.43 18.42 9.21 9.21
3 (BP) 18.42 9.21 55.28 9.21 46.06 9.21 18.43
4 (Fir) 9.21 18.43 73.71 175.05 9.21 0.00 9.21
5 (BP) 9.21 0.00 0.00 0.00 27.64 36.85 9.21
6 (BP) 9.21 9.21 9.21 18.43 27.64 110.59 36.85
7 (PP) 36.86 9.22 18.43 9.21 46.06 9.21 46.06
Table 4.3(b): Bending stress (N/mm2) under the impact of the 20 kg sand bag without
UDL
standard Location 1 Location 2 Location 3 Location 4 Location 5 Location 6 Location 7
Front
1 (PP) 0.11 0.22 -0.11 0.00 -0.22 0.00 -0.17
2 (BP) 0.19 0.26 -0.06 0.06 -0.19 0.13 -0.19
3 (BP) -0.19 -0.32 0.13 0.06 0.32 0.06 0.13
4 (Fir) 0.00 0.00 0.03 0.28 -0.08 0.00 0.08
5 (BP) -0.06 0.06 -0.06 0.19 -0.06 0.00 -0.13
6 (BP) 0.00 -0.39 -0.13 0.13 0.06 0.06 -0.06
7 (PP) 0.06 0.00 0.00 0.11 -0.11 0.00 -0.06
Back
1 (PP) 0.22 0.22 0.00 0.06 0.00 0.00 0.06
2 (BP) 0.06 0.26 0.06 0.13 0.13 0.06 0.06
3 (BP) -0.13 -0.06 0.39 0.06 0.32 0.06 0.13
4 (Fir) 0.03 0.06 0.22 0.53 -0.03 0.00 0.03
5 (BP) -0.06 0.00 0.00 0.00 -0.19 -0.26 0.06
6 (BP) -0.06 0.06 -0.06 0.13 0.19 -0.77 -0.26
7 (PP) 0.22 0.06 -0.11 0.06 -0.28 0.06 -0.28
Chapter 4
42
Table 4.4(a): Bending strain (x10-6
) under the impact of the 20 kg sand bag with UDL
of 3 kN/m2
standard Location 1 Location 2 Location 3 Location 4 Location 5 Location 6 Location 7
Front
1 (PP) -4.22 9.21 -51.07 0.00 -73.69 -32.64 -50.28
2 (BP) 0.21 18.42 -18.64 0.00 -73.69 9.00 -55.07
3 (BP) 3.00 -18.42 43.07 -27.63 -92.12 33.85 49.07
4 (Fir) -32.64 -27.64 -13.43 -9.21 9.21 -22.64 -5.00
5 (BP) -46.28 -36.85 -64.28 9.22 9.21 -55.07 -55.49
6 (BP) -25.03 -82.91 -48.66 18.43 27.64 -21.02 -34.25
7 (PP) 21.43 9.21 6.21 0.00 -9.21 6.21 3.00
Back
1 (PP) 67.89 64.49 24.24 18.43 -9.21 24.24 40.25
2 (BP) 68.29 92.12 60.69 9.21 -36.85 60.69 68.29
3 (BP) 31.84 36.86 97.14 27.64 -64.48 51.08 68.69
4 (Fir) 4.60 9.21 59.90 9.24 9.21 -13.81 4.60
5 (BP) -31.85 -27.64 -32.64 46.07 36.85 -69.49 -13.43
6 (BP) -68.32 -55.29 -79.11 -46.06 -9.21 -180.50 -95.95
7 (PP) 15.02 -18.42 -51.86 18.43 101.36 -24.22 -67.90
Table 4.4(b): Bending stress (N/mm2) under the impact of the 20 kg sand bag with UDL
of 3 kN/m2
standard Location 1 Location 2 Location 3 Location 4 Location 5 Location 6 Location 7
front
1 (PP) -0.03 0.06 -0.31 0.00 -0.44 -0.20 -0.30
2 (BP) 0.00 0.13 -0.13 0.00 -0.52 0.06 -0.39
3 (BP) 0.02 -0.13 0.30 -0.19 -0.64 0.24 0.34
4 (Fir) -0.10 -0.08 -0.04 -0.03 0.03 -0.07 -0.02
5 (BP) -0.32 -0.26 -0.45 0.06 0.06 -0.39 -0.39
6 (BP) -0.18 -0.58 -0.34 0.13 0.19 -0.15 -0.24
7 (PP) 0.13 0.06 0.04 0.00 -0.06 0.04 0.02
back
1 (PP) 0.41 0.39 0.15 0.11 -0.06 0.15 0.24
2 (BP) 0.48 0.64 0.42 0.06 -0.26 0.42 0.48
3 (BP) 0.22 0.26 0.68 0.19 -0.45 0.36 0.48
4 (Fir) 0.01 0.03 0.18 0.03 0.03 -0.04 0.01
5 (BP) -0.22 -0.19 -0.23 0.32 0.26 -0.49 -0.09
6 (BP) -0.48 -0.39 -0.55 -0.32 -0.06 -1.26 -0.67
7 (PP) 0.09 -0.11 -0.31 0.11 0.61 -0.15 -0.41
Chapter 4
43
Figure 4.1: Front view of the scaffold
Figure 4.2: Side view of the scaffold
Chapter 4
44
Figure 4.3: Dimensions of the scaffold
Figure 4.4(a): Strain gauge
Figure 4.4(b): Tensile jacks
Chapter 4
45
Figure 4.4(c): Data logger and computer Figure 4.4(d): Load cell
Figure 4.5: Strain gauge attach on PP
Chapter 4
46
Figure 4.6(a): Locations of strain gauges attached on the standard at the front side

Chapter 4
47
Figure 4.6(b): The location of sensors attached on the standard at the back side
Chapter 4
48
Figure 4.7(a): Front view of the loading setup
I-beams
U-beams
Loading
Figure 4.7(b): Side view of loading setup
Figure 4.7(c): The loading Setup
U-beam
I-beam
Loading

Chapter 4
49
Figure 4.8: Loading the tensile jack during the tests
Force distribution of the column under load 15kN
-1.8
-1.6
-1.4
-1.2
-1.0
-0.8
-0.6
-0.4
-0.2
0.0
0.2
1 2 3 4 5 6 7
Column
Forc
e (k
N)
Front layer
Back layer
Figure 4.9: Results of uniform distributed load tests

Chapter 4
50
Force carried by the center member at the front face
-1.8
-1.6
-1.4
-1.2
-1
-0.8
-0.6
-0.4
-0.2
0
0.2
-2 0 2 4 6 8 10 12 14 16
Applied loading (kN)
Me
mb
er
forc
es
(k
N)
Loading at bottom platform
Loading at upper platform
Loading at both platforms
Figure 4.10: Member forces of the center member at the front face under UDL
Figure 4.11: Drop test locations
platform
Chapter 4
51
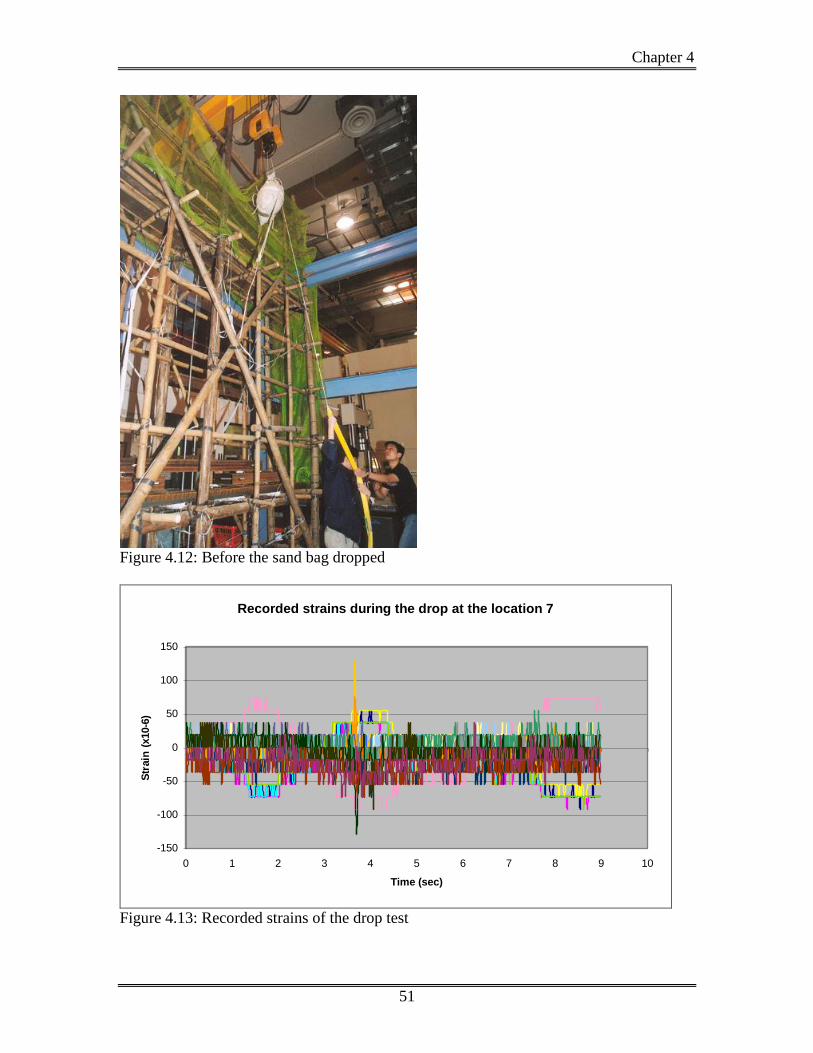
Figure 4.12: Before the sand bag dropped
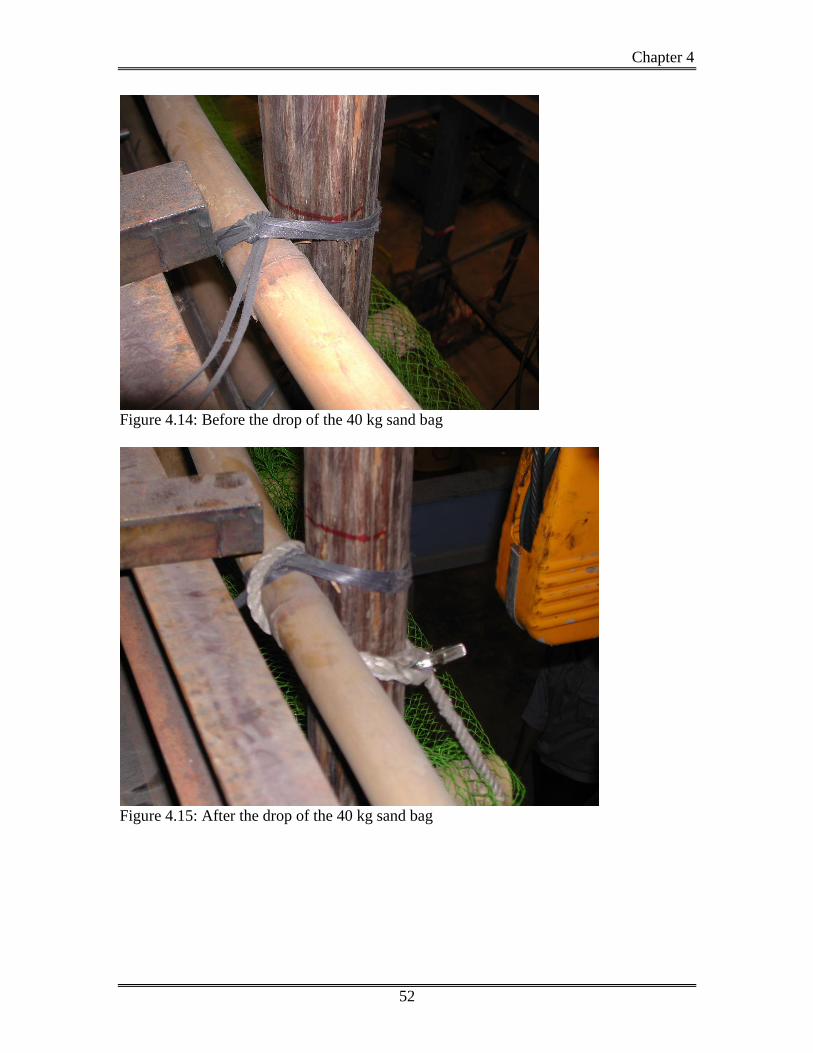
Recorded strains during the drop at the location 7
-150
-100
-50
0
50
100
150
0 1 2 3 4 5 6 7 8 9 10
Time (sec)
Str
ain
(x10-6
)
Figure 4.13: Recorded strains of the drop test
Chapter 4
52
Figure 4.14: Before the drop of the 40 kg sand bag
Figure 4.15: After the drop of the 40 kg sand bag

Chapter 4
53
Figure 4.16: Joint condition of location 9 before the drop of 40 kg sand bag at center
Figure 4.17: Joint condition of location 9 after the drop of 40 kg sand bag at center
Chapter 4
54
Figure 4.18: The member was failed at the location 9
Figure 4.19: Another view to see the failure at the location 9
Chapter 4
55
Figure 4.20: The safety belt fix at the location 10
Figure 4.21: Member failure during the drop of 60 kg sand bag at location 10
Chapter 5
56
Chapter 5: Comparison of the experiment and the finite element modeling
5.1 Description of the finite element modeling of scaffolding
In this section, the finite element program SAP2000 was used to model the structural
behavior of bamboo scaffoldings under the UDL and the drop loads. In the previous
chapter, it was found that the standard forces were approximately linear to the magnitude
of the applied UDL. This is a good indication that the structural behavior of bamboo
scaffolding is approximately linear and thus linear elements can be used to model the
scaffolding. In the analysis, we used linear orthotropic frame elements to model the
bamboo components. Nonlinear hook elements were however used to model the bamboo
intersections due to the apparent bilinear stiffness behavior of the joints. The dimensions
of the finite element model were set to meet as accurately as possible with those
measured from the scaffolding model in the laboratory. The mean material properties that
obtained from Chapter 2 were used in the analysis. The support conditions for all the
standards were assumed to be clamped. The finite element model is illustrated in Figure
5.1.
Chapter 5
57
5.2 Comparison of the results between the experiment and the finite
element model
5.2.1 Comparison of the uniform distributed load tests
Figure 5.2 shows how the UDL are added onto the finite element model. Since the
behavior of scaffolding is approximately linear, so only one loading case is shown here.
The UDL was assumed to act at the bottom platform only with a magnitude of 7.14
kN/m2 (corresponding to a jack force of 15 kN). Table 5.1 shows the standard force
comparison between the finite element analysis results and those obtained from the
measurement. Based on the comparison, the following observations can be made:
(1) Both results indicate that the PP and the Fir carry more loads than the BP.
(2) The force difference between the finite element analysis and the experiment is
smaller for the PP and the Fir. Roughly, the difference ranges between 10 to
20%.
(3) Both results indicate that the standards of the scaffolding would not fail even
when the UDL exceeds two times of the design value.
5.2.2 Comparison of the drop tests
To compare the results of drop tests, the forces produced by the free drop of 20 kg, 40 kg
and 60 kg sand bags were first measured in the laboratory. The safety belt was attached to
an aluminum plate which was attached with two strain gauges for strain measurement
during the free drop. The set up of is shown in Figure 5.3(a). The cable force was then
obtained by multiplying the strain values by axial rigidity of the aluminum plates. Table
5.2 and Figure 5.4 shows the resulting force caused by the free drop of 20 kg, 40 kg and
60 kg sand bag. It is seen that the maximum drop force can reach as high as 6000 N for a
60 kg drop weight. Note that the mean drop force of 2550 N caused by a 20 kg drop
weight is already higher than the impending friction forces obtained in Chapter 3
(between 100 to 300 N). This suggests that slippage of the bamboo joint where the safety
belt attached is almost unavoidable. This explains the joint slippage that we observed
during the drop tests.

Chapter 5
58
In the finite element analysis, the mean drop force found in the free drop tests was
assumed to act on the model in a static fashion. The bending moments at the strain gauge
locations were calculated and compared with these obtained from the experiments. Table
5.3(a) and (b) show two of these comparisons where the 20 kg sand bag would drop from
location 3 and 4, respectively. From these results, the following observations can be seen:
(1) Although differences between the two results are seen, the magnitudes of
bending moments are in the same order.
(2) It is again seen that the moments exerted on the PP and Fir are higher than
those on the BP, except for the BP where the sand bag is directly attached to.
(3) These bending moments do not appear to damage these standards, nor to the
overall integrity of the scaffolding.
(4) The damaging effect due to the free fall of a sand bag appears to be more of a
local nature, which might result in the slippage of joints and/or fracture of
horizon ledger. This ledger fracture was seen in the laboratory when the weight
of the sand bag increases beyond 40 kg.
More detailed analyses on the reliability and safety of scaffolding are carried out in the
next session.
Chapter 5
59
5.3 Reliability analysis of the full-scale scaffolding
In this study, the safety and reliability of a bamboo scaffolding is determined by a
quantitative number called “safety index”. This safety index is defined as,
valueanalyzedor Measured
bamboo of strength sticCharacteri index Safety
When the safety index is smaller than 1, which means the measured or analyzed value
exceeds the characteristic strength of bamboo and hence implies that the scaffolding is
damaged. On the hand, a larger safety index (larger than 1) represents a safer scaffolding.
5.3.1 Analysis of the uniform distributed load
Under a uniform distributed load, the load would first be transferred from the working
platform to the horizontal transoms and ledgers, and finally to the vertical standards. To
analyze the reliability of the scaffolding under a uniform distributed load, two failure
cases were studied. For case one, the scaffold was assumed to fail at one of the transoms.
For case two, the scaffold was assumed to fail at one of the standards.
Case 1 (failure at the transom):
Transoms are connected to the ledgers by the fastening ties. The fastening tie
fixes the position of the transoms relative to the ledgers but could not provide
enough resistance to rotation at the ends of the transoms. As a result, the transom
can be modeled approximately as a simply-supported beam as shown in Figure
5.5.
To study the reliability of the transoms, it is necessary to calculate the loads
carried by these transoms. These loads can be modeled as distributed loads with
magnitudes of the UDL times their corresponding tributary widths. For examples
in Figure 4.3, the transom that carries the maximum load is the one that connected
to the 3rd
standard. The distributed load that acts on their transom is 0.65 x UDL.

Chapter 5
60
The mean flexural strength of transoms (usually BP) is 80.7 N/mm2 and its
standard deviation is 19.3 N/mm2 as obtained in Chapter 2. The lower bound of
the flexural strength with 95% probability of occurrence is computed to be 49
N/mm2 based on the gaussian assumption. Table 5.4 shows the reliability of the
3rd
transom under different magnitudes of UDL. It is seen that under the design
UDL (3 kN/m2), the safety indexes are 7 and 4 if the mean strength and the lower
95% strength are used respectively.
Chapter 5
61
Case 2 (failure at the standard):
Table 5.5 shows the standard forces induced by the design UDL of 3 kN/m2
acting at the lower platform. Two types of failure are possible: buckling failure
and compressive strength failure. The theoretical buckling loads for the BP, PP
and Fir with a length of 0.65 m and under simply support condition without initial
curvature are: 29.6 kN, 154.7 kN and 108.8 kN respectively (from Section 2.5).
The safety indexes for the standards under buckling condition are computed and
listed in Table 5.5. It is seen that the smallest safety index is 68.8 which occurs at
the 2nd
and 3rd
BP standards. On the other hand, the compressive strengths for the
BP, PP and Fir are 57 N/mm2, 61 N/mm
2 and 26 N/mm
2, respectively. The safety
indexes for the standards under compressive strength condition are again
computed and listed in Table 5.5. It is seen that the smallest safety index is 93.7
which again occurs at the 2nd
and the 3rd
BP standards.
5.3.2 Analysis of the drop load
When an object is attached the bamboo joint, the load induced by the free fall of the
object is first carried mostly by the ledger at the joint. The force is then transmitted to the
standards via the fastening ties. To analyze the reliability of the scaffolding under a drop
load, two failure cases were studied. For case one, the scaffold was assumed to fail at the
ledger. For case two, the scaffold was assumed to fail at the standard.
Case 1 (failure at the ledger):
As obtained in Chapter 3, the impending friction forces for the joints range
between 100 to 300 N. These values are much smaller than the maximum drop
force caused by a 20 kg weight (or more). So it can be concluded that slippage of
the fastening tie at the joints would occur. The slippage of the fastening tie would
then provide a kinetic friction force that reduces some amount of drop force
acting on the ledger. As a conservative measure, assume that the kinetic friction
force is ignored in the following analysis. Figure 5.6 shows a simple model to
simulate a ledger under drop force. It is expected that the support conditions of
Chapter 5
62
the ledger would be between simply support and clamped support (but more close
to the clamped support). The mean flexural strength of ledger (usually BP) is 80.7
N/mm2 and its standard deviation is 19.3 N/mm
2 as obtained in Chapter 2. The
lower bound of the flexural strength with 95% probability of occurrence is
computed to be 49 N/mm2 based on the gaussian assumption. The length between
two standards is 0.6 m. Tables 5.6 and 5.7 show the reliability of the ledger under
different drop weights for the simply support and for the clamped support,
respectively. It is seen that the ledger would fail even under the free drop of a 20
kg weight if the boundary condition is simply supported. On the other hand, if the
boundary condition is clamped supported, the ledger would fail on the average
when the drop weight reaches 60 kg. Since the actual boundary condition of the
ledger is closer to the clamped condition, so it can be concluded that the ledger
could fail when the drop weight exceeds 40 kg.
Case 2 (failure at the standard):
For the drop test, the weight is always drops at the backside. Table 5.8 shows the
standard forces induced by free drop of a 60 kg weight (maximum drop force = 5
kN). Two types of failure are possible: buckling failure and compressive strength
failure. The theoretical buckling loads for the BP, PP and Fir with a length of
0.65m and under simply support condition without initial curvature are 29.6 kN,
154.7 kN and 108.8 kN, respectively (from Section 2.5). The safety indexes for
the standards under buckling condition are computed and listed in Table 5.8. It is
seen that the smallest safety index is 27.7 which occurs at the 3rd
BP standard. On
the other hand, the compressive strengths for the BP, PP and Fir are 57 N/mm2, 61
N/mm2 and 26 N/mm
2, respectively. The safety indexes for the standards under
compressive strength condition are again computed and listed in Table 5.8. It is
seen that the smallest safety index is 37.7 which again occurs at the 3rd
BP
standard.
Based on the UDL and the drop load analyses, the following conclusion can be made:
Chapter 5
63
(1) Under the design UDL, both the transoms and standards are not expected to
fail. Their safety indexes are between 4 to 7 for the transoms and between 70
to 90 for the standards.
(2) Under the drop force, the fastening tie, that joints the horizontal ledger to the
vertical standard, is expected to slip even under the free drop of a 20 kg weight.
Also the horizontal ledger is expected to fail under the drop force caused by an
object weights between 40 to 60 kg.
(3) The damage caused by the drop force is quite local. Although the ledger may
fail under the drop force, the standards on the other hand appear to be quite
safe even under a 60 kg free drop.
Chapter 5
64
Table 5.1: Comparison between the finite element and the experiment results (UDL =
8.02 kN/m2)
Back FEM
model (kN)
Experiment (kN)
Difference Front FEM
model (kN)
Experiment (kN)
Difference
1 (PP) -1.23 -1.64 0.41 1 (PP) -0.73 -0.78 0.05
2 (BP) -0.75 -0.28 -0.47 2 (BP) -0.71 -0.42 -0.29
3 (BP) -0.74 -0.16 -0.58 3 (BP) -0.68 -0.19 -0.49
4 (Fir) -1.38 -1.25 -0.13 4 (Fir) -1.22 -1.00 -0.22
5 (BP) -0.57 0.04 -0.61 5 (BP) -0.48 -0.10 -0.38
6 (BP) -0.51 -0.06 -0.45 6 (BP) -0.47 -0.37 -0.1
7 (PP) -0.97 -0.95 -0.02 7 (PP) -1.09 -0.84 -0.25
Table 5.2: Maximum drop force due to free fall of sand bags
Weight (kg) Number of
tests
Drop force (kN)
Mean std
20 11 2.55 0.32
40 7 3.85 0.85
60 9 4.90 0.72
Table 5.3(a): Results of the drop test at location 3
Back FEM
model (N-m)
Experiment (N-m)
Difference Front FEM
model (N-m)
Experiment (N-m)
Difference
1 (PP) 2.32 0.00 2.32 1 (PP) 1.74 3.80 -2.06
2 (BP) 1.41 0.47 0.94 2 (BP) 0.92 0.47 0.45
3 (BP) 5.19 2.80 2.39 3 (BP) 1.11 0.93 0.18
4 (Fir) 10.05 11.12 -1.07 4 (Fir) 4.11 1.39 2.72
5 (BP) 1.05 0.00 1.05 5 (BP) 0.84 0.47 0.37
6 (BP) 0.91 0.47 0.44 6 (BP) 0.73 0.93 -0.20
7 (PP) 1.85 3.80 -1.95 7 (PP) 1.65 0.00 1.65
Table 5.3(b): Results of the drop test at location 4
Back FEM
model (N-m)
Experiment (N-m)
Difference Front FEM
model (N-m)
Experiment (N-m)
Difference
1 (PP) 1.70 1.90 -0.20 1 (PP) 1.50 0.00 1.50
2 (BP) 1.09 0.93 0.16 2 (BP) 0.91 0.47 0.44
3 (BP) 1.20 0.47 0.73 3 (BP) 0.95 0.47 0.48
4 (Fir) 18.30 26.40 -8.10 4 (Fir) 9.21 13.89 -4.68
5 (BP) 1.16 0.00 1.16 5 (BP) 1.04 1.40 -0.36
6 (BP) 1.12 0.93 0.19 6 (BP) 1.05 0.93 0.12
7 (PP) 2.10 1.90 0.20 7 (PP) 1.80 3.80 -2.00
Chapter 5
65
Table 5.4: Reliability of the transom under UDL
UDL (kN/m
2)
Maximum stress in the
transom (N/mm
2)
Mean strength = 80.7N/mm
2
Lower 95% strength = 49N/mm
2
> mean Safety index > 95% Safety index
3 12.1 No 7.0 No 4.0
6 24.2 No 3.5 No 2.0
9 36.3 No 2.3 No 1.3
12 48.4 No 1.8 No 1.0
15 60.6 No 1.4 Yes < 1.0
18 72.7 No 1.2 Yes < 1.0
21 84.8 Yes < 1.0 Yes < 1.0
Table 5.5: Loading of the standard under a UDL 3 kN/m2 applied at the bottom platform
Standard force (kN)
Safety index
Buckling Compressive
strength
Front standard
1 (PP) 0.41 377.3 303.8
2 (BP) 0.41 72.2 98.3
3 (BP) 0.39 75.9 103.3
4 (Fir) 0.70 155.4 162.8
5 (BP) 0.37 80.0 108.9
6 (BP) 0.33 89.7 122.1
7 (PP) 0.63 245.6 197.7
Back standard
1 (PP) 0.70 221.0 177.9
2 (BP) 0.43 68.8 93.7
3 (BP) 0.43 68.8 93.7
4 (Fir) 0.79 137.7 144.3
5 (BP) 0.28 105.7 143.9
6 (BP) 0.27 109.6 149.2
7 (PP) 0.55 281.3 226.5
Table 5.6: Reliability of the ledger under drop force (simply support)
Drop weight
(kg)
Maximum stress in the
ledger (N/mm2)
Mean strength = 80.7 N/mm
2
Lower 95% strength = 49 N/mm
2
> mean Safety index
> 95% Safety index
20 105.6 Yes <1.0 Yes <1.0
40 159.4 Yes <1.0 Yes <1.0
60 202.9 Yes <1.0 Yes <1.0
Table 5.7: Reliability of the ledger under drop force (clamped support)
Drop weight
(kg)
Maximum stress in the
ledger (N/mm2)
Mean strength = 80.7 N/mm
2
Lower 95% strength = 49 N/mm
2
> mean Safety index
> 95% Safety index
20 52.8 No 1.5 Yes <1.0
40 79.7 No 1.0 Yes <1.0
60 101.5 Yes <1.0 Yes <1.0
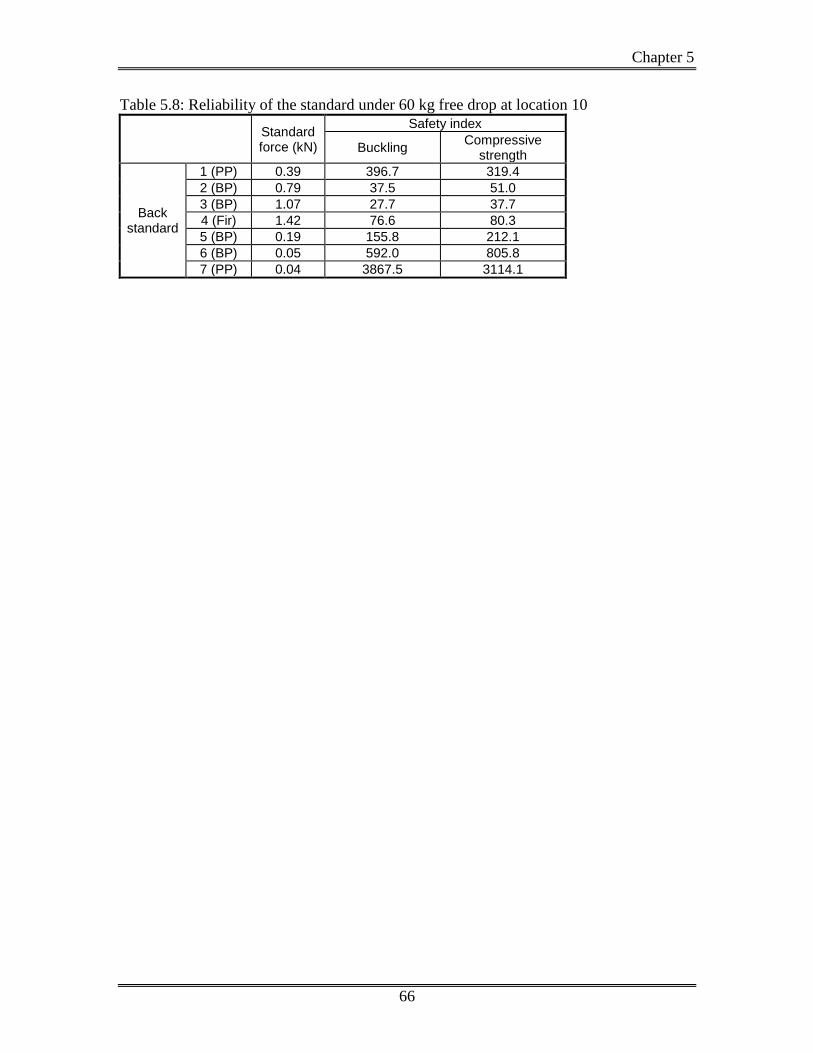
Chapter 5
66
Table 5.8: Reliability of the standard under 60 kg free drop at location 10
Standard force (kN)
Safety index
Buckling Compressive
strength
Back standard
1 (PP) 0.39 396.7 319.4
2 (BP) 0.79 37.5 51.0
3 (BP) 1.07 27.7 37.7
4 (Fir) 1.42 76.6 80.3
5 (BP) 0.19 155.8 212.1
6 (BP) 0.05 592.0 805.8
7 (PP) 0.04 3867.5 3114.1
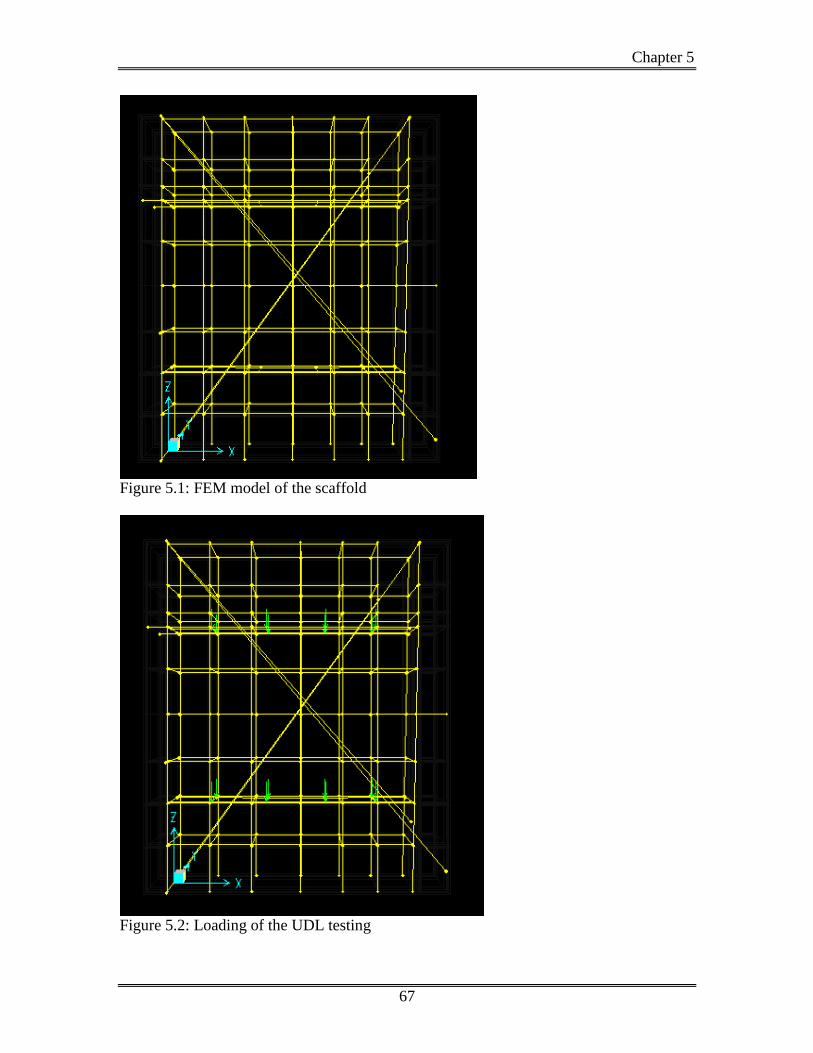
Chapter 5
67
Figure 5.1: FEM model of the scaffold
Figure 5.2: Loading of the UDL testing
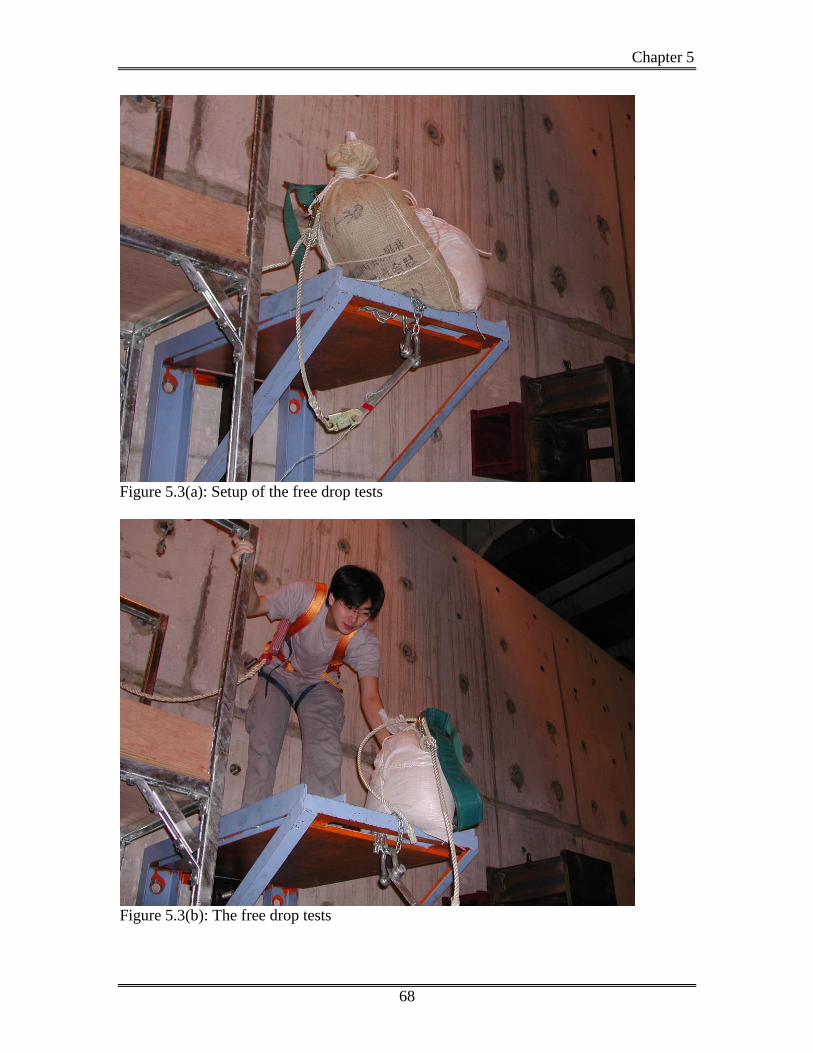
Chapter 5
68
Figure 5.3(a): Setup of the free drop tests
Figure 5.3(b): The free drop tests
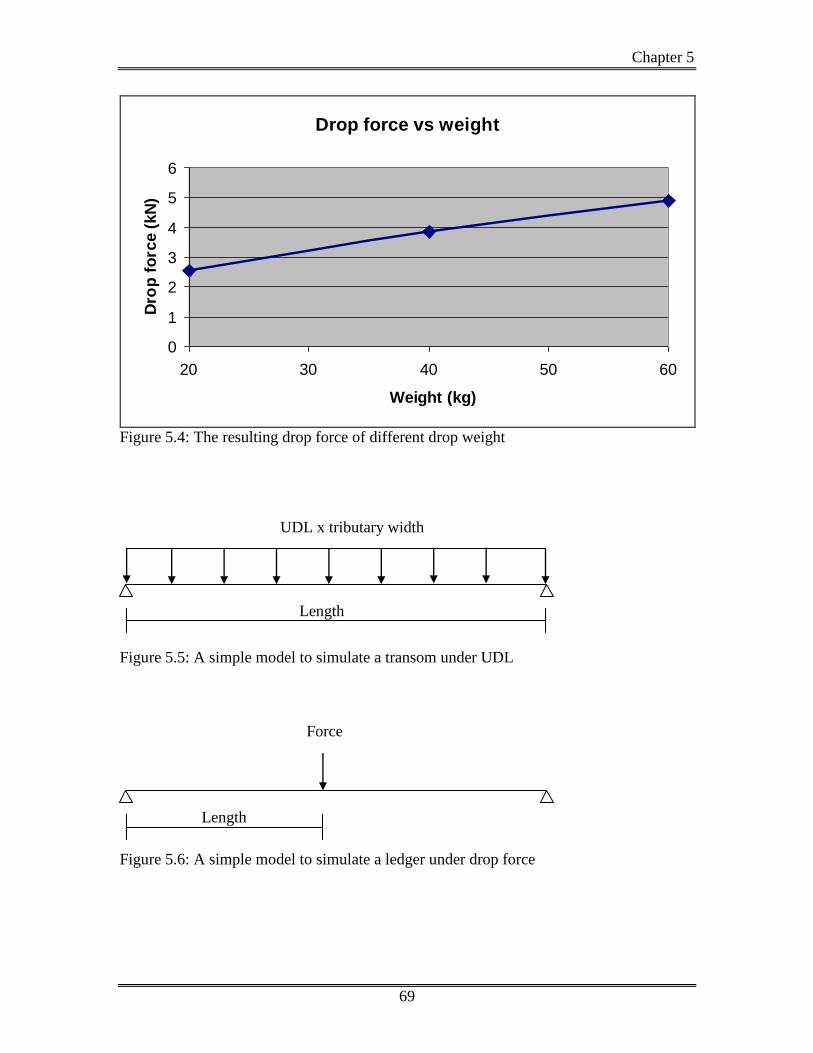
Chapter 5
69
Force
Length
Drop force vs weight
0
1
2
3
4
5
6
20 30 40 50 60
Weight (kg)
Dro
p f
orc
e (
kN
)
Figure 5.4: The resulting drop force of different drop weight
Figure 5.5: A simple model to simulate a transom under UDL
Figure 5.6: A simple model to simulate a ledger under drop force
UDL x tributary width
Length
Chapter 6
70
Chapter 6: Computer analysis on some typical bamboo scaffoldings
6.1 Bamboo scaffolding at construction sites
One of the main functions of the bamboo scaffolding is to provide working platform at
the construction site. The bamboo scaffolding at the construction site is usually very tall.
Normally, there is a catch fan installed with triangular supports every several floor (see
Figure 6.1). The triangular supports are used to transfer the load from the scaffold to the
permanent structure. As a result, it is sufficient to analyze only a typical part of the
scaffolding instead of the whole scaffolding.
The bamboo scaffolding in a construction site near Sham Tseng was investigated in this
study (see Figure 6.2). A part of the scaffolding was simulated using an FEM model. The
scaffolding between two catch fans was chosen as it was assumed that the load above the
catch fan was transferred to the building by the triangular supports. The model was
shown in Figure 6.4. The size of the model is 9.6 m x 12 m x 0.6 m (length x height x
width).
6.1.1 Analysis of the uniform distributed load
Similar to the Section 5.3.1, two failure cases were studied.
Case 1 (failure at the transom):
To study the reliability of the transoms, it is necessary to calculate the loads
carried by these transoms. These loads can be modeled as distributed loads with
magnitudes of the UDL times their corresponding tributary widths. The tributary
width in this model is 0.6 m. The distributed load that acts on their transom is 0.6
x UDL. The mean flexural strength of transoms (usually BP) is 80.7 N/mm2 and
its standard deviation is 19.3 N/mm2 as obtained in Chapter 2. The lower bound of
the flexural strength with 95% probability of occurrence is computed to be 49
Chapter 6
71
N/mm2 based on the gaussian assumption. The reliability of the transom shows in
Table 6.1. It is seen that under the design UDL (3 kN/m2), the safety indexes are
7.2 and 4.4 if the mean strength and the lower 95% strength are used respectively.
Case 2 (failure at the standard):
Table 6.2 shows the backside standard forces induced by the design UDL of 3
kN/m2 acting at the lower platform. Two types of failure are possible: buckling
failure and compressive strength failure. The theoretical buckling loads for the PP
with a length of 1.8 m and under simply support condition without initial
curvature is 21.5 kN (from Section 2.5). The safety indexes for the standards
under buckling condition are computed and listed in Table 6.2. It is seen that the
smallest safety index is 12 which occurs at the 3rd
PP standards. On the other hand,
the compressive strength for the PP is 61 N/mm2 respectively. The safety indexes
for the standards under compressive strength condition are again computed and
listed in Table 6.2. It is seen that the smallest safety index is 69.2 which again
occurs at the 3rd
PP standards. The results show that the overall failure of this
model is dominated by buckling. If the UDL 3 kN/m2 is applied at each floor
(total six floors), the maximum load is also occurred at the 3rd
PP member at the
backside, which is equal to 11.2 kN. The safety index for the buckling failure is
around 1.9.
6.1.2 Analysis of the drop load
Similar to the Section of 5.3.2, tow failure cases were studied.
Case 1 (failure at the ledger):
As obtained in Chapter 3, the impending friction forces for the joints range
between 100 to 300 N. These values are much smaller than the maximum drop
force caused by a 20 kg weight (or more). So it can be concluded that slippage of
the fastening tie at the joints would occur. It is expected that the support
conditions of the ledger would be between simply support and clamped support
(but more close to the clamped support). The mean flexural strength of ledger
Chapter 6
72
(usually BP) is 80.7 N/mm2 and its standard deviation is 19.3 N/mm
2 as obtained
in Chapter 2. The lower bound of the flexural strength with 95% probability of
occurrence is computed to be 49 N/mm2 based on the gaussian assumption. As the
distance between two standards is 0.6 m which is the same as the model in
Section 5, the results in Table 5.6 and 5.7 can be used for this case. A similar
conclusion can be made that the ledger could fail when the drop weight exceeds
40 kg.
Case 2 (failure at the standard):
For the drop test, the weight is always drops at the front side. Table 6.3 shows the
standard forces induced by a drop force equal to 5 kN (which is similar to the
maximum drop force provide by a 60 kg weight) drops at the 7th
standard count
from left of the 1st floor. Two types of failure are studied: buckling failure and
compressive strength failure. The theoretical buckling loads for the BP and PP
with a length of 0.6 m and under simply support condition without initial
curvature are 34.8 kN and 193.7 kN, respectively (from Section 2.5). The safety
indexes for the standards under buckling condition are computed and listed in
Table 6.3. It is seen that the smallest safety index is 26.5 which occurs at the 7th
BP standard. On the other hand, the compressive strengths for the BP and PP are
57 N/mm2 and 61 N/mm
2, respectively. The safety indexes for the standards under
compressive strength condition are again computed and listed in Table 6.3. It is
seen that the smallest safety index is 30.8 which again occurs at the 7th
BP
standard.
Based on the UDL and the drop load analyses, the following conclusion can be made:
(1) Under the design UDL, both the transoms and standards are not expected to
fail. Their safety indexes are between 4.4 to 7.2 for the transoms and between
12 to 69.2 for the standards.
(2) Under the drop force, the fastening tie, that joints the horizontal ledger to the
vertical standard, is expected to slip even under the free drop of a 20 kg weight.

Chapter 6
73
Also the horizontal ledger is expected to fail under the drop force caused by an
object weights between 40 to 60 kg.
(3) The damage caused by the drop force is quite local. Although the ledger may
fail under the drop force, the standards on the other hand appear to be quite
safe even under a 60 kg free drop.
Chapter 6
74
6.2 Bamboo scaffolding used for maintenance work
The bamboo scaffolding is also frequently used for the maintenance works. It may be
used as a working platform for the surface finishing or for the drainage repair outside the
buildings. The shape of these scaffoldings could be quite different, as they need to fit the
shape of the building or the slope.
One bamboo scaffolding at the Hong Kong University of Science and Technology was
chosen for investigation. Figure 6.7 shows the overview of the scaffolding. The distance
from the bottom of its standards to the first ledger was around 2 m (see Figure 6.8).
6.2.1 Analysis of the uniform distributed load
Similar to the Section 5.3.1, two failure cases were studied.
Case 1 (failure at the transom):
To study the reliability of the transoms, it is necessary to calculate the loads
carried by these transoms. These loads can be modeled as distributed loads with
magnitudes of the UDL times their corresponding tributary widths. The tributary
width in this model is 0.6 m. The distributed load that acts on their transom is 0.6
x UDL. The mean flexural strength of transoms (usually BP) is 80.7 N/mm2 and
its standard deviation is 19.3 N/mm2 as obtained in Chapter 2. The lower bound of
the flexural strength with 95% probability of occurrence is computed to be 49
N/mm2 based on the gaussian assumption. The reliability of the transom shows in
Table 6.1. It is seen that under the design UDL (3 kN/m2), the safety indexes are
7.2 and 4.4 if the mean strength and the lower 95% strength are used respectively.
Case 2 (failure at the standard):
Table 6.4 shows the standard forces induced by the design UDL of 3 kN/m2
acting at the lower platform. Two types of failure are studied: buckling failure and
compressive strength failure. The theoretical buckling loads for the PP with a
length of 2 m and under simply support condition without initial curvature is 17.4
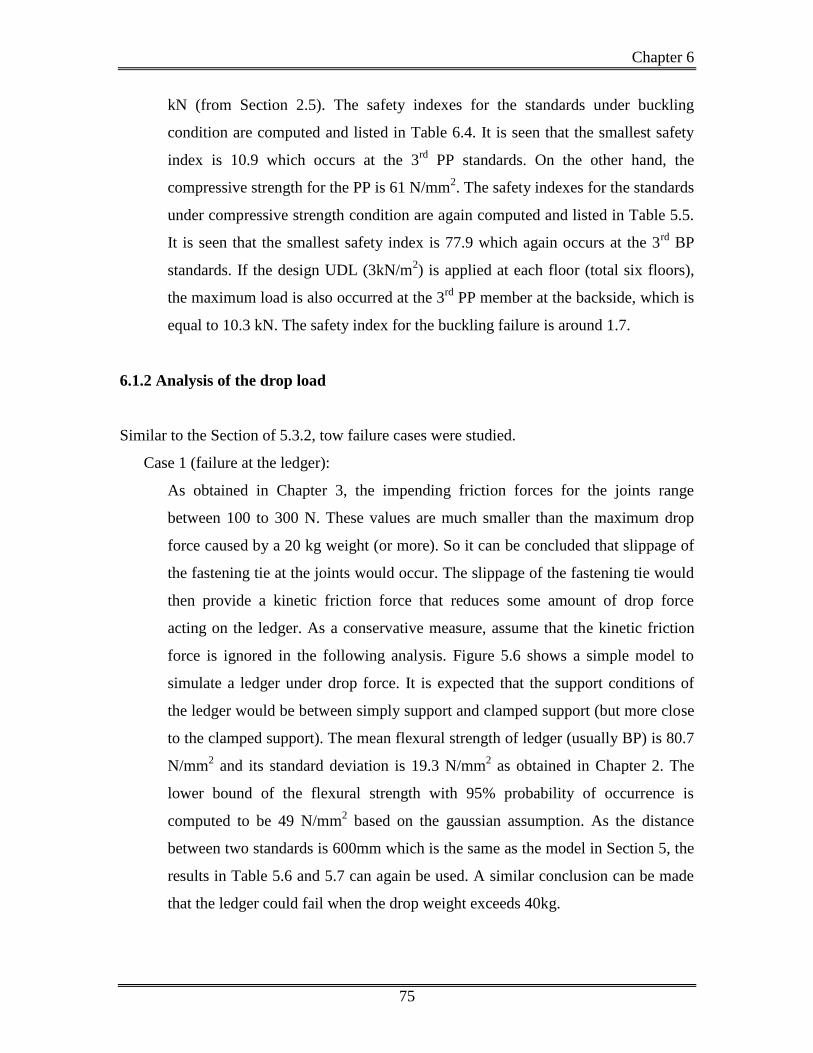
Chapter 6
75
kN (from Section 2.5). The safety indexes for the standards under buckling
condition are computed and listed in Table 6.4. It is seen that the smallest safety
index is 10.9 which occurs at the 3rd
PP standards. On the other hand, the
compressive strength for the PP is 61 N/mm2. The safety indexes for the standards
under compressive strength condition are again computed and listed in Table 5.5.
It is seen that the smallest safety index is 77.9 which again occurs at the 3rd
BP
standards. If the design UDL (3kN/m2) is applied at each floor (total six floors),
the maximum load is also occurred at the 3rd
PP member at the backside, which is
equal to 10.3 kN. The safety index for the buckling failure is around 1.7.
6.1.2 Analysis of the drop load
Similar to the Section of 5.3.2, tow failure cases were studied.
Case 1 (failure at the ledger):
As obtained in Chapter 3, the impending friction forces for the joints range
between 100 to 300 N. These values are much smaller than the maximum drop
force caused by a 20 kg weight (or more). So it can be concluded that slippage of
the fastening tie at the joints would occur. The slippage of the fastening tie would
then provide a kinetic friction force that reduces some amount of drop force
acting on the ledger. As a conservative measure, assume that the kinetic friction
force is ignored in the following analysis. Figure 5.6 shows a simple model to
simulate a ledger under drop force. It is expected that the support conditions of
the ledger would be between simply support and clamped support (but more close
to the clamped support). The mean flexural strength of ledger (usually BP) is 80.7
N/mm2 and its standard deviation is 19.3 N/mm
2 as obtained in Chapter 2. The
lower bound of the flexural strength with 95% probability of occurrence is
computed to be 49 N/mm2 based on the gaussian assumption. As the distance
between two standards is 600mm which is the same as the model in Section 5, the
results in Table 5.6 and 5.7 can again be used. A similar conclusion can be made
that the ledger could fail when the drop weight exceeds 40kg.
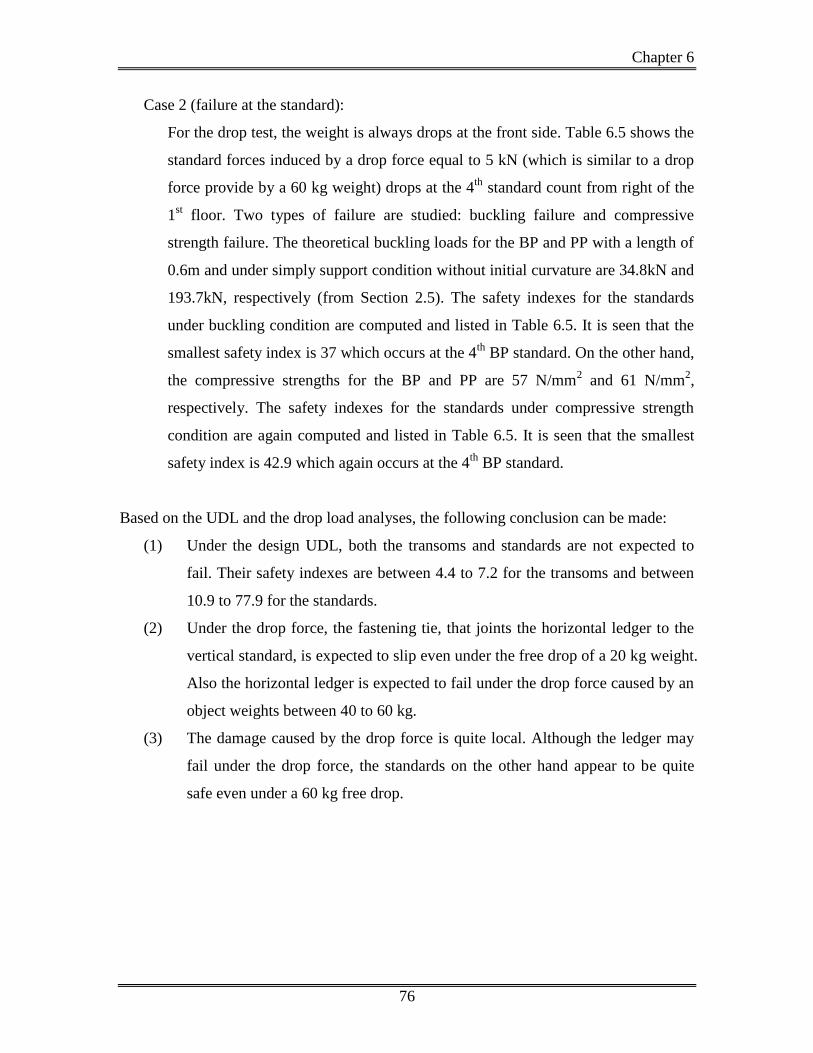
Chapter 6
76
Case 2 (failure at the standard):
For the drop test, the weight is always drops at the front side. Table 6.5 shows the
standard forces induced by a drop force equal to 5 kN (which is similar to a drop
force provide by a 60 kg weight) drops at the 4th
standard count from right of the
1st floor. Two types of failure are studied: buckling failure and compressive
strength failure. The theoretical buckling loads for the BP and PP with a length of
0.6m and under simply support condition without initial curvature are 34.8kN and
193.7kN, respectively (from Section 2.5). The safety indexes for the standards
under buckling condition are computed and listed in Table 6.5. It is seen that the
smallest safety index is 37 which occurs at the 4th
BP standard. On the other hand,
the compressive strengths for the BP and PP are 57 N/mm2 and 61 N/mm
2,
respectively. The safety indexes for the standards under compressive strength
condition are again computed and listed in Table 6.5. It is seen that the smallest
safety index is 42.9 which again occurs at the 4th
BP standard.
Based on the UDL and the drop load analyses, the following conclusion can be made:
(1) Under the design UDL, both the transoms and standards are not expected to
fail. Their safety indexes are between 4.4 to 7.2 for the transoms and between
10.9 to 77.9 for the standards.
(2) Under the drop force, the fastening tie, that joints the horizontal ledger to the
vertical standard, is expected to slip even under the free drop of a 20 kg weight.
Also the horizontal ledger is expected to fail under the drop force caused by an
object weights between 40 to 60 kg.
(3) The damage caused by the drop force is quite local. Although the ledger may
fail under the drop force, the standards on the other hand appear to be quite
safe even under a 60 kg free drop.
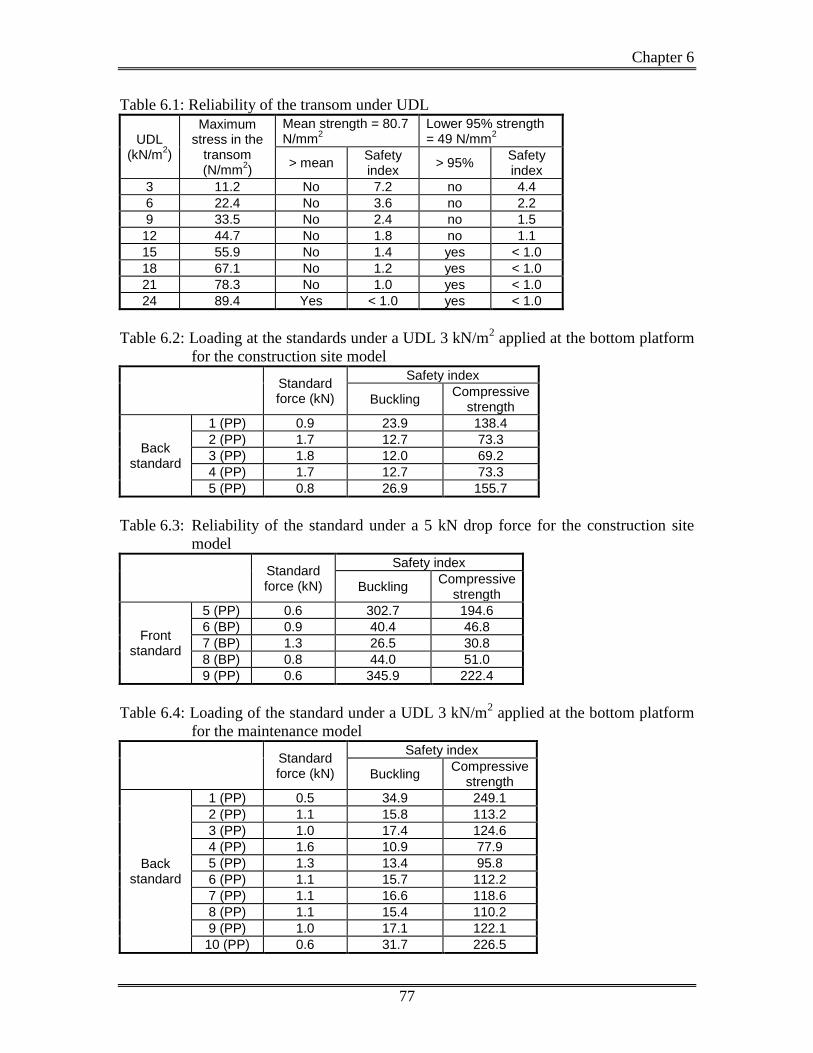
Chapter 6
77
Table 6.1: Reliability of the transom under UDL
UDL (kN/m
2)
Maximum stress in the
transom (N/mm
2)
Mean strength = 80.7 N/mm
2
Lower 95% strength = 49 N/mm
2
> mean Safety index
> 95% Safety index
3 11.2 No 7.2 no 4.4
6 22.4 No 3.6 no 2.2
9 33.5 No 2.4 no 1.5
12 44.7 No 1.8 no 1.1
15 55.9 No 1.4 yes < 1.0
18 67.1 No 1.2 yes < 1.0
21 78.3 No 1.0 yes < 1.0
24 89.4 Yes < 1.0 yes < 1.0
Table 6.2: Loading at the standards under a UDL 3 kN/m2 applied at the bottom platform
for the construction site model
Standard force (kN)
Safety index
Buckling Compressive
strength
Back standard
1 (PP) 0.9 23.9 138.4
2 (PP) 1.7 12.7 73.3
3 (PP) 1.8 12.0 69.2
4 (PP) 1.7 12.7 73.3
5 (PP) 0.8 26.9 155.7
Table 6.3: Reliability of the standard under a 5 kN drop force for the construction site
model
Standard force (kN)
Safety index
Buckling Compressive
strength
Front standard
5 (PP) 0.6 302.7 194.6
6 (BP) 0.9 40.4 46.8
7 (BP) 1.3 26.5 30.8
8 (BP) 0.8 44.0 51.0
9 (PP) 0.6 345.9 222.4
Table 6.4: Loading of the standard under a UDL 3 kN/m2 applied at the bottom platform
for the maintenance model
Standard force (kN)
Safety index
Buckling Compressive
strength
Back standard
1 (PP) 0.5 34.9 249.1
2 (PP) 1.1 15.8 113.2
3 (PP) 1.0 17.4 124.6
4 (PP) 1.6 10.9 77.9
5 (PP) 1.3 13.4 95.8
6 (PP) 1.1 15.7 112.2
7 (PP) 1.1 16.6 118.6
8 (PP) 1.1 15.4 110.2
9 (PP) 1.0 17.1 122.1
10 (PP) 0.6 31.7 226.5
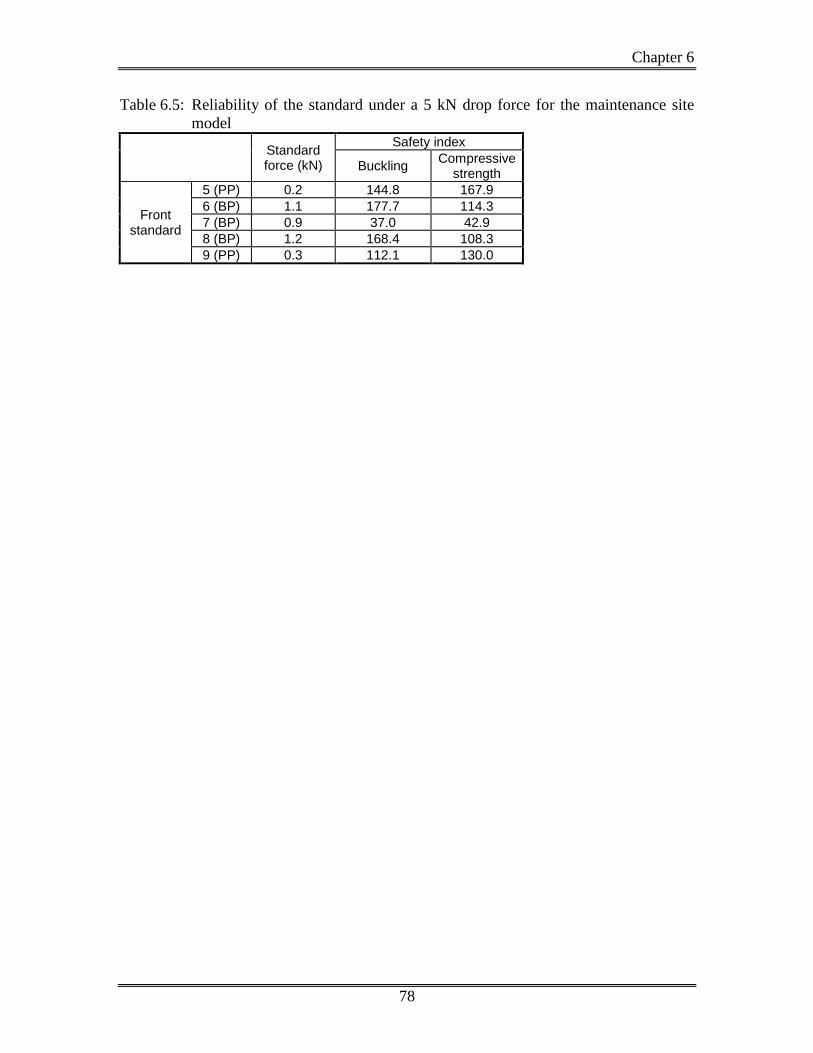
Chapter 6
78
Table 6.5: Reliability of the standard under a 5 kN drop force for the maintenance site
model
Standard force (kN)
Safety index
Buckling Compressive
strength
Front standard
5 (PP) 0.2 144.8 167.9
6 (BP) 1.1 177.7 114.3
7 (BP) 0.9 37.0 42.9
8 (BP) 1.2 168.4 108.3
9 (PP) 0.3 112.1 130.0
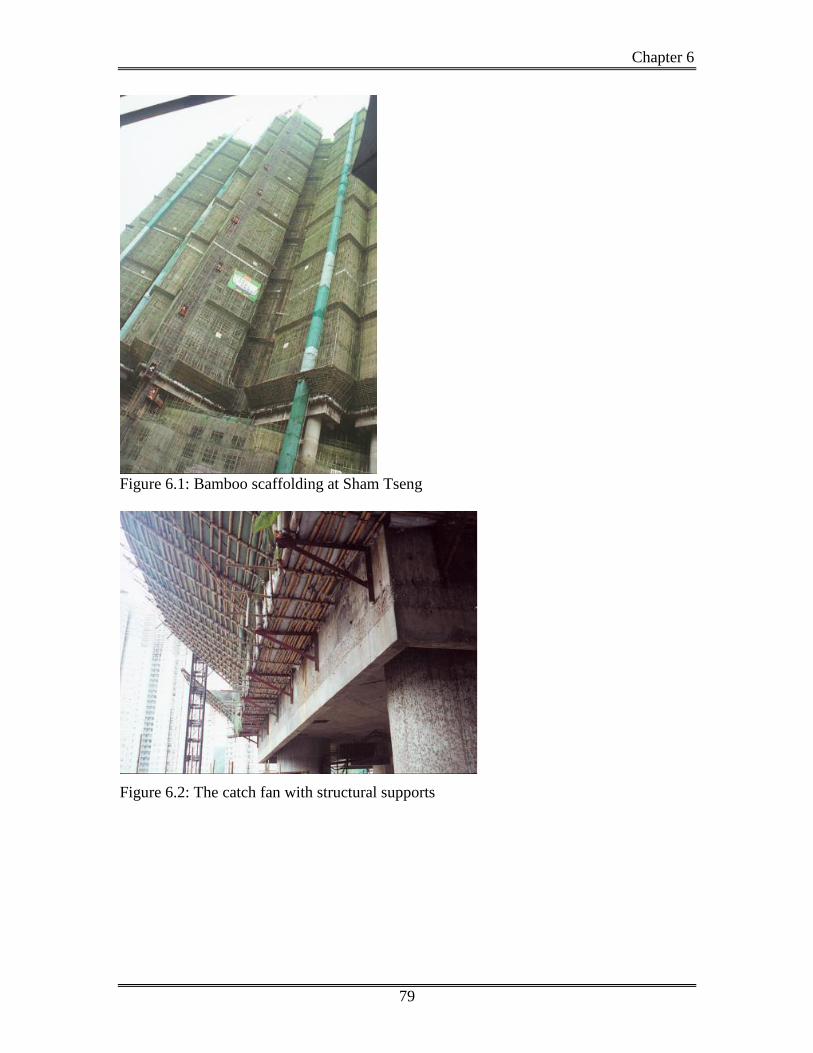
Chapter 6
79
Figure 6.1: Bamboo scaffolding at Sham Tseng
Figure 6.2: The catch fan with structural supports
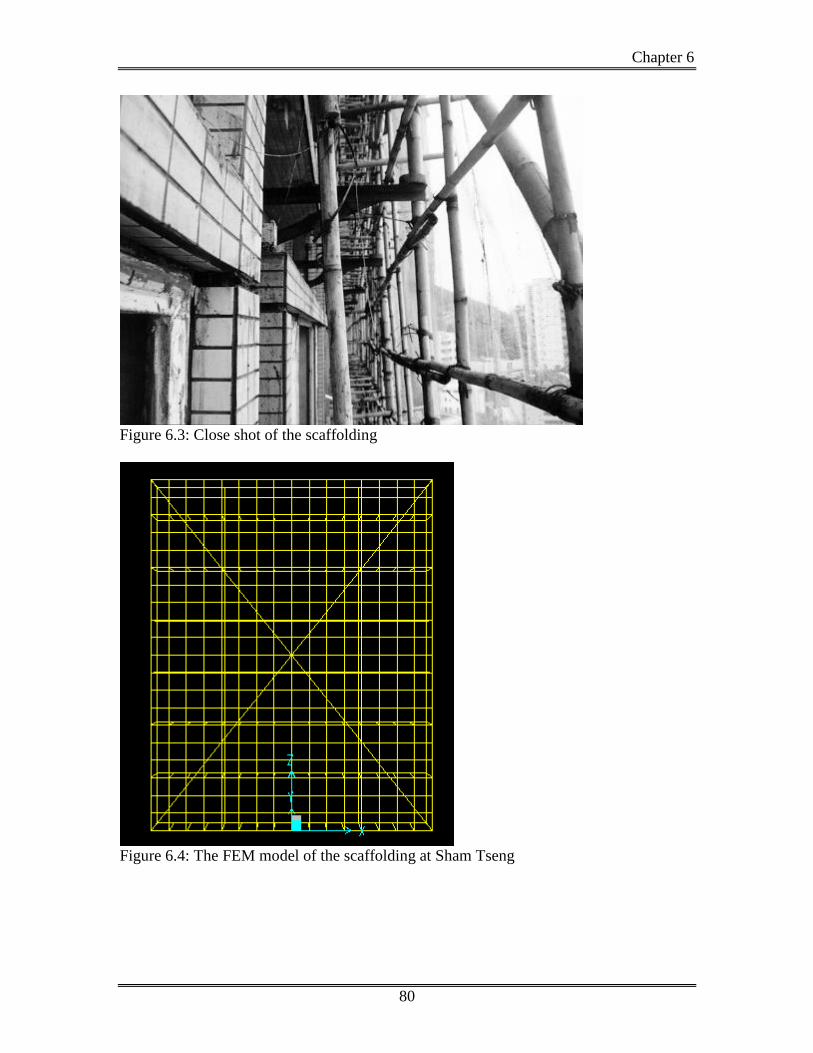
Chapter 6
80
Figure 6.3: Close shot of the scaffolding
Figure 6.4: The FEM model of the scaffolding at Sham Tseng
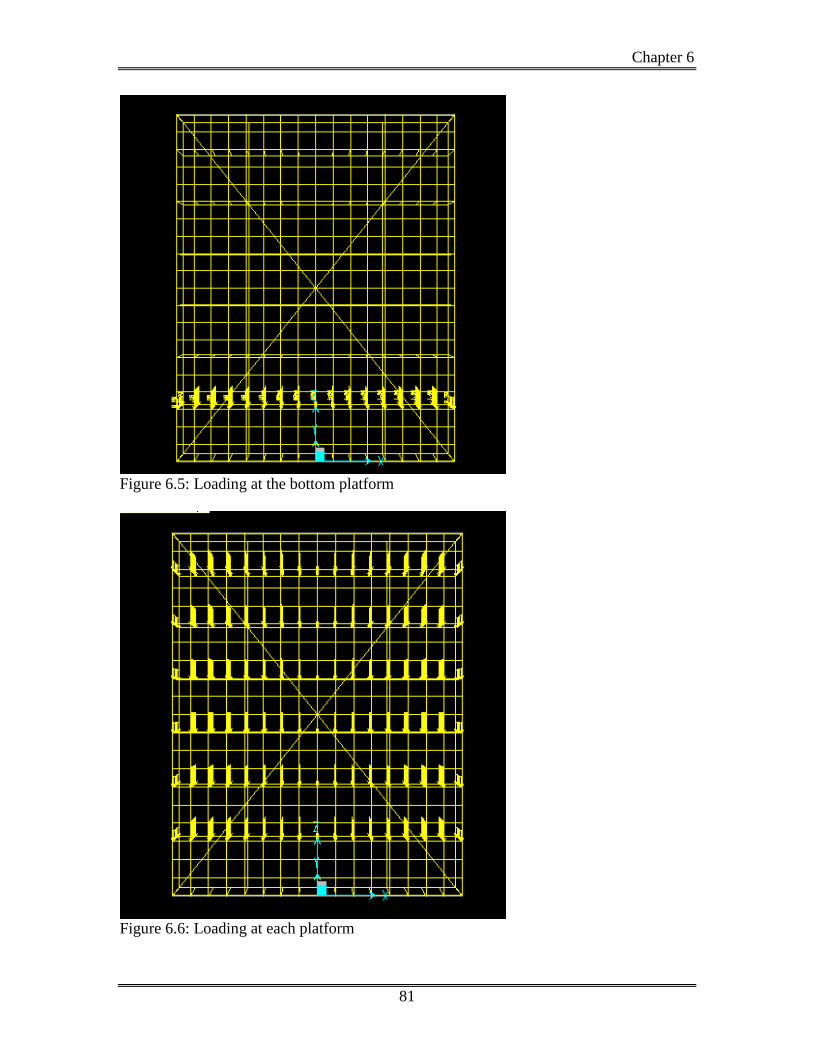
Chapter 6
81
Figure 6.5: Loading at the bottom platform
Figure 6.6: Loading at each platform
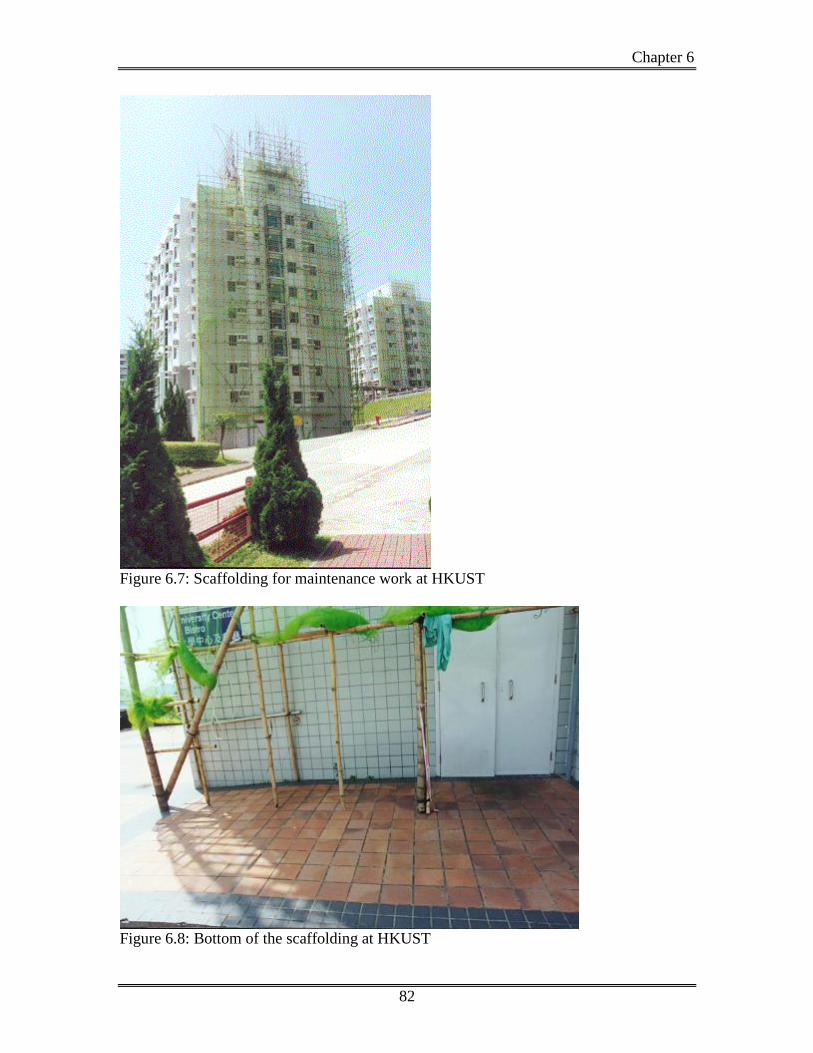
Chapter 6
82
Figure 6.7: Scaffolding for maintenance work at HKUST
Figure 6.8: Bottom of the scaffolding at HKUST
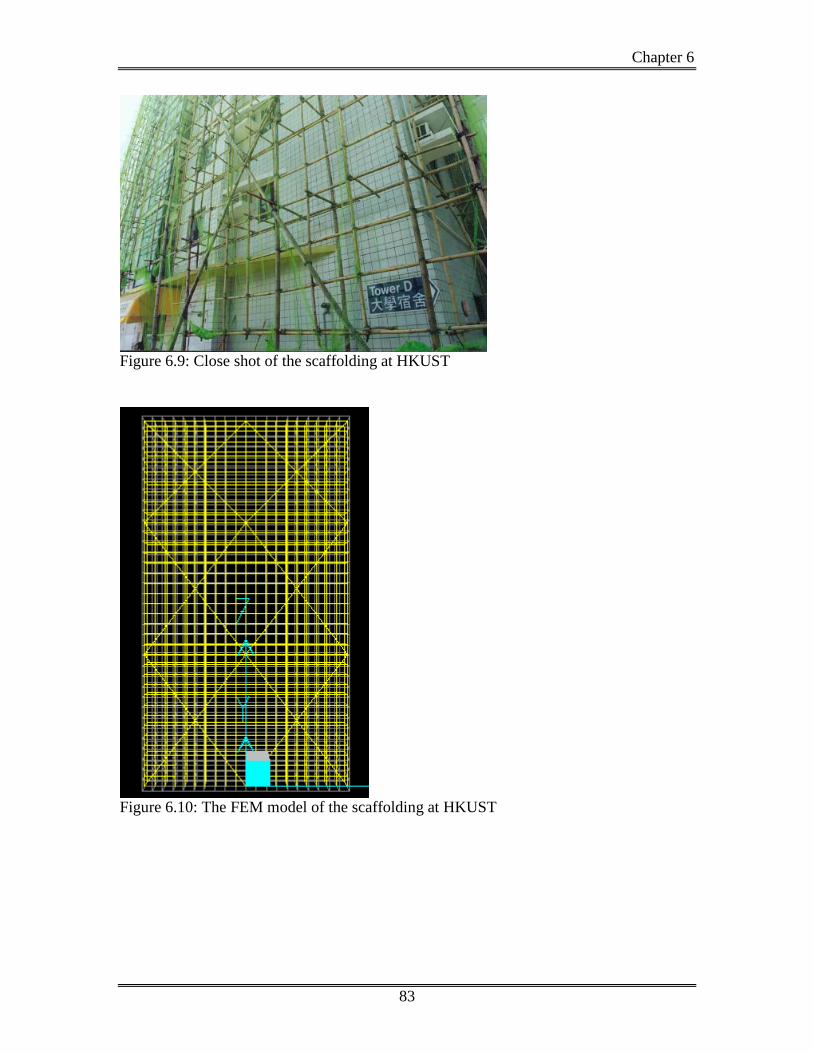
Chapter 6
83
Figure 6.9: Close shot of the scaffolding at HKUST
Figure 6.10: The FEM model of the scaffolding at HKUST
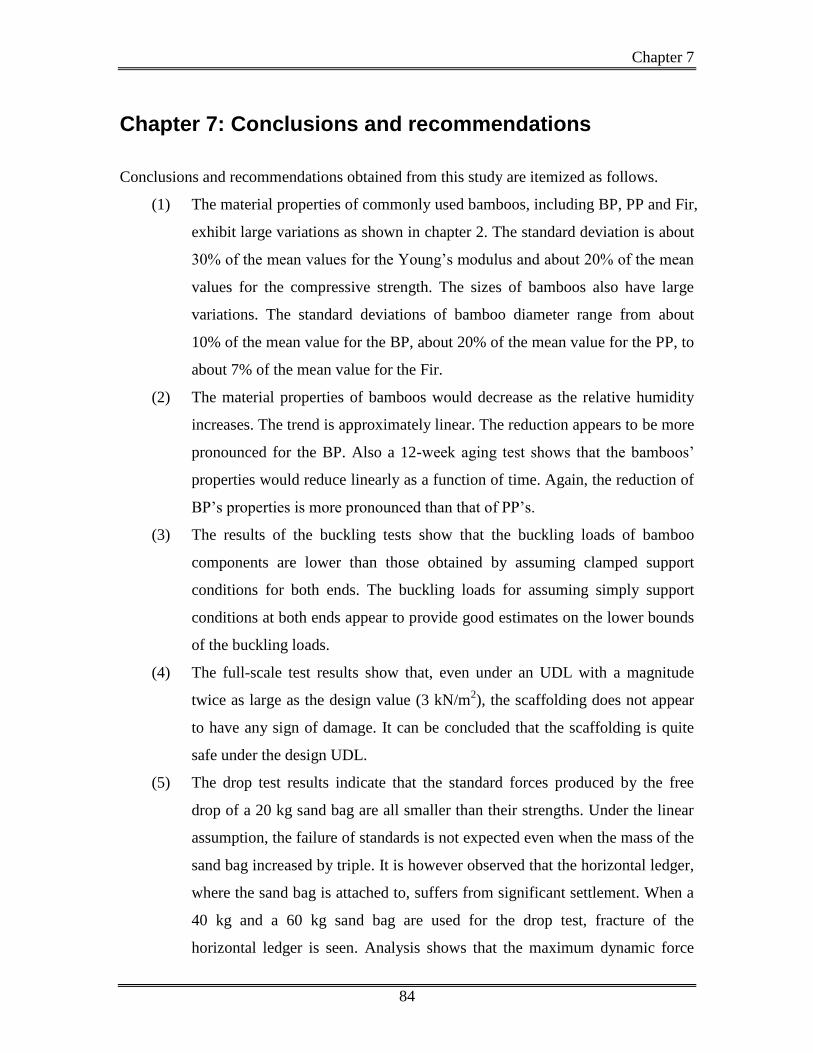
Chapter 7
84
Chapter 7: Conclusions and recommendations
Conclusions and recommendations obtained from this study are itemized as follows.
(1) The material properties of commonly used bamboos, including BP, PP and Fir,
exhibit large variations as shown in chapter 2. The standard deviation is about
30% of the mean values for the Young’s modulus and about 20% of the mean
values for the compressive strength. The sizes of bamboos also have large
variations. The standard deviations of bamboo diameter range from about
10% of the mean value for the BP, about 20% of the mean value for the PP, to
about 7% of the mean value for the Fir.
(2) The material properties of bamboos would decrease as the relative humidity
increases. The trend is approximately linear. The reduction appears to be more
pronounced for the BP. Also a 12-week aging test shows that the bamboos’
properties would reduce linearly as a function of time. Again, the reduction of
BP’s properties is more pronounced than that of PP’s.
(3) The results of the buckling tests show that the buckling loads of bamboo
components are lower than those obtained by assuming clamped support
conditions for both ends. The buckling loads for assuming simply support
conditions at both ends appear to provide good estimates on the lower bounds
of the buckling loads.
(4) The full-scale test results show that, even under an UDL with a magnitude
twice as large as the design value (3 kN/m2), the scaffolding does not appear
to have any sign of damage. It can be concluded that the scaffolding is quite
safe under the design UDL.
(5) The drop test results indicate that the standard forces produced by the free
drop of a 20 kg sand bag are all smaller than their strengths. Under the linear
assumption, the failure of standards is not expected even when the mass of the
sand bag increased by triple. It is however observed that the horizontal ledger,
where the sand bag is attached to, suffers from significant settlement. When a
40 kg and a 60 kg sand bag are used for the drop test, fracture of the
horizontal ledger is seen. Analysis shows that the maximum dynamic force

Chapter 7
85
generated during the free drop of a 20 kg sand bag exceeds the impending
friction forces of the bamboo intersection, which causes slippage of the
horizontal ledger. Also the maximum force exceeds the bending strength of
the bamboos and results in fracture of the ledger. These results conclude that
the bamboo scaffold intersection is not a suitable anchorage for the safety belt
and harness. To ensure the safety of workers, it might be necessary to attach
the safety belt to a more strong and permanent structure or an independent
lifeline.
(6) There are some differences between the experimental results and the FEM
results. However, the differences in the major components that carry most of
the loads are within 30%. So even though the FEM model cannot estimate
accurately all the forces in the scaffolding, it can be used as a preliminary tool
for analyzing the behavior and the safety of the scaffold.
(7) Some typical scaffoldings were simulated in Chapter 6 using the finite
element analysis program. When the design UDL is applied only on one
platform, the safety indexes for the ledger and the standard are larger than 4
and 12, respectively. This means that both ledger and standard would not fail
under this condition. Further analysis indicates that the safety index reduces to
about 2 under the worst possible loading condition when the design UDL is
applied at all platforms. Note that it might be necessary to study how the
variation of bamboo properties, the humidity and the degradation of properties
due to aging would further affect this safety index.
(8) It is commonly known that bamboo scaffoldings can be damaged under strong
wind condition. This phenomenon was not studied in this research. To ensure
the safety and the reliability of scaffoldings under strong wind condition, it is
necessary to have a further detailed study that requires the use of wind tunnel
tests for validation.
References
86
References
1. Fu, W.Y. (1993). “Bamboo scaffolding in Hong Kong,” The Structural Engineer,
71 (11), June 1993, 202-204.
2. So, F.Y.S. and Wong, F.K.W. (1998). “Bamboo scaffolding development in Hong
Kong – a critical review,” Proceedings of the Symposium on Bamboo and Metal
Scaffolding, 23 Oct. 1998, 63-75.
3. Comparative study on safety and application of bamboo and metal scaffolding in
Hong Kong, Report by the (Tsinghua-Gammon) Construction safety Research
Center, 2001.
4. Zhou, F.C. (1981). “Studies on Physical and Mechanical Properties of Bamboo
Woods,” Journal of Nanjing Technological college of Forest Products, Volume 2,
June 1981, 1-32.
5. Janssen, J.J.A. (1991). Mechanical Properties of Bamboo, Kluwer Academic
Publishers.
6. Chan, S.L., Wong, F.K.W., So, F.Y.S. and Poon, S.W. (1998). “Empirical design
and structural performance of bamboo scaffolding,” Proceedings of the
Symposium on Bamboo and Metal Scaffolding, 23 Oct. 1998, 5-21.
7. Yu, W.K. and Chung, K.F. (2001). “ Mechanical properties of bamboo for
scaffolding in building construction,” Proceeding of the International Conference
on Construction, Volume 2, 19-21 June 2001, 266-272.
8. Summary of causes of the 31 total accidents related to bamboo scaffolds in 1994-
1998, Internal summary of the Labor Department.
9. Code of Practice for Bamboo Scaffolding Safety, Occupational Safety and Health
Branch, Labor Department, March 2001.
10. BS EN 364: 1993. Personal protective equipment against falls from a height –
Test methods. British Standard