an exploratory study of manufacturing strategy of packaging product-manufacturing companies in
TRANSCRIPT

International Journal for Quality research
UDK- 378.014.3(497.11)
Short Scientific Paper (1.03)
Vol. 6, No. 3, 2012 233
Pradip P. Patil1)
Dr B. E. Narkhede2)
Dr M. M. Akarte3)
1) Research Scholar, JTI,
Mumbai, India
2) Associate Professor, VJTI,
Mumbai, India
3) Associate Professor, NITIE,
Mumbai, India
AN EXPLORATORY STUDY OF MANUFACTURING
STRATEGY OF PACKAGING PRODUCT-
MANUFACTURING COMPANIES IN INDIA
Abstract: This paper presents finding of a survey on manufacturing
strategy implementation (MSI) adopted by the Indian packaging
product manufacturing companies (IPPMC). Though the companies
differ in terms of product types (shape, method, content and material of
packaging), conversion system, sales volume and sophistication of
machinery used, they share common purpose that are used for
packaging the products. With growth in demand for consumer products,
packaging forms basis of differentiating products from competitors. The
survey shows emphasis on implementation of manufacturing strategy,
key decision areas, identifies competitive priorities, order winners. To
get insight, three companies are selected for detailed case studies.
Keywords: Manufacturing strategy implementation; decision areas;
Competitive priorities; order winners; packaging product
manufacturers
1. INTRODUCTION
Manufacturing is crucial for the robust growth
of the economy, for exports and for generating
substantial relevant employment. But
manufacturing function is ignored by production
group as a strategic function as shown by seminal
article of Skinner (1969). Later on manufacturing
function has passed through dramatic changes. It
is influenced by manufacturing philosophies in the
east like TQM, JIT whereas “World Class
Manufacturing” in the west[2]. In academic
research manufacturing function is studied by
many authors from strategic point of view. Many
authors studied and showed the strategic
importance of manufacturing function (Skinner,
1969, Dangayach and Deshmukh, 2001, Chang et
al. 2003, Rho et al. 2001, Miltenburg 2008).
The manufacturing sector is under
tremendous pressure because of environment and
market forces. Indian manufacturers are facing
competition from new foreign entrants on cost,
quality, flexibility and innovation. International
competitors are continuously working on
improving manufacturing, bringing new products
and making manufacturing more proactive and
responsive (Chandra & Shastri, 1998)[6]. This
competitive environment forces Indian
manufacturers to understand the forces of driving
industry competition stated by Porter (1980)[23].
The level of competition can be assessed by
SWOT analysis of firm in the environment it
operates. This can be source of understanding
trade-off necessary to cope with market need and
operating strength (Platts & Gregory, 1992)[25].
In a manufacturing competence survey, Chandra
P. (2009) highlighted the need for Indian
manufacturers to be competitive on supplier
association, cluster initiative for joint raw material
procurement which reduce cost, product quality,
reduce delivery bottlenecks to reach to their
customers, process enhancement leading to
flexibility, create market innovation, lean practices
enhancing productivity and promote R&D[7].
In order to mitigate competitive forces; firms
need to prioritize the competitive factors-cost,
quality, flexibility, delivery, innovation. In order
to respond to market on competitive factors; firm
needs a strategy. The contribution of Dangayach
and Deshmukh, 2003. [9]; Skinner, 1974.[28]
emphasizes requirement of manufacturing
strategy. The need of manufacturing strategies and
operations are environment fitness, strategic
positioning, and operational efficiency.
It has been pointed out that the many failure
stems from an inability to translate a competitive
234 P. P. Patil, B. E. Narkhede, M. M. Akarte
strategy into specific implementation plan to gain
competitive position (Porter, 1985)[24].
Manufacturing practices like TQM, JIT, and
Continuous improvement yields favorable impact
on the performance of the firm. Dangayach and
Deshmukh (2008) assessed the prevalence of
improvement activities termed as advanced
management system in mutisector analysis. They
found that machinery sector is improving on
adoption of advanced manufacturing system as
well as competitive capabilities[12]. Dangayach
and Deshmukh (2004) found important issues of
strategic planning, alignment of manufacturing
and business strategy, communication of
manufacturing strategy, business excellence. In a
longitudinal study of process industry, they also
found competitive priorities, investment in
improvement activities and order winners of
cement industry. This study proposed to find
existence of MSI and assess the competitive
priorities, order winners, pattern of manufacturing
priorities based on strategic manufacturing groups
in packaging industry[10].
Indian manufacturing firms need to focus on
people issue such as conflict management, and
resistance to change during adoption and
implementation of addition of new machineries.
Also it is required for managers to integrate the
activities of the organization and communicate
with the strategic requirements of the firm to all
stakeholders concerned.
Indian packaging product manufacturing
companies (IPPMC) meet the manufacturing
requirements of a variety of sectors of the
manufacturing industry especially the consumer
product manufacturing companies[13]. The Indian
packaging industry is growing at 14-15% annually
(Indian Packaging Machinery Manufacturers of
India (IPMMI), 2009)[18]. Indian Packaging
industry is $ 14 billion and wide range machinery
is manufactured in India (Indo-Italian chamber of
commerce report, 2008)[17]. Due to lower
manufacturing costs, India is fast becoming a
preferred hub for packaging production. A high
degree of potential exists for almost all user
segments which are expanding appreciably
consisting of processed foods, hard and soft
drinks, fruit and marine products, cosmetics and
personal-care, office stationary and accessories,
fabrics and garments, white goods and other
durables, electrical appliances and equipment,
entertainment and other electronics, shoes and
leather ware, gems and jewellery, toys and sports
goods, chemicals and fertilizers. The market size
of various materials is shown in Table 1. This
formed motivation for understanding
manufacturing strategy of IPPMC.
The specific objectives of this study are to:
• find extent manufacturing strategy
implementation followed by IPPMC
• assess competitive priorities of an
organization,
• identify order winners for IPPMC,
• identify key decision areas of improvements,
• to establish relation between manufacturing
strategy implementation and manufacturing
priorities
In this research, we conducted a survey of
IPPMC to assess emphasis placed on
manufacturing strategy implementation and
mapped as per Thun‟ (2008)[30] three constructs,
key decisions and priorities are mapped as per
Miltenburng‟s (2008) manufacturing levers or
subsystem and output. Miltenburg coined
manufacturing levers or subsystems in terms of
Human resources, Organization structure and
controls, production planning and control,
sourcing, process technology, facilities, and
manufacturing output or priorities in terms of cost,
quality, delivery, performance, flexibility,
innovativeness[19]. However Order winners
differentiate firm from competing firms and are
key criteria for customer preference. In addition to
survey, detailed case study of three firms has been
conducted and relationship between
manufacturing strategy implementation and
manufacturing priorities are established[5].
The paper is structured as follows. Section 2
presents the literature review on manufacturing
strategy. Section 3 describes the research
methodology used. Survey findings are presented
in Section 4. Case study of the three companies is
given in Section 5. Section 6 deals with
relationship between MSI and manufacturing of
the output/priorities. Conclusions and limitations
of the study are given in Section 7.
2. MANUFACTURING STRATEGY
In a path breaking article on missing link in
manufacturing, Skinner (1969) pointed out the

Vol. 6, No. 3, 2012 235
role manufacturing operation, a common
understanding as support activity in company.
Production operations are designed to fulfill
strategic plans and strategic plans are designed
based on production competence. Skinner puts
forward the cause and effect relationship between
manufacturing decisions and corporate strategy
and recognizes the need for looking manufacturing
as strategic function. Skinner stated in 1969:
In a strategic sense, manufacturing’s task was
to maximize output to satisfy large, key
customers[27].
Manufacturing objectives are derived from
strategic plans, and then manufacturing policies
developed to address these objectives.
Manufacturing objectives include; cost, quality,
delivery and flexibility, innovation. Since then, lot
of research has been carried out in the area of
manufacturing strategy. One of the definition
coined by Hayes and Wheelwright (1984) is as: A
manufacturing strategy is defined by a pattern of
decisions, both structural and infrastructural,
which determine the capability of a manufacturing
system and specify how it will operate to meet a
set of manufacturing objectives which are
consistent with overall business objectives and
take into account market needs, competitor
performance, and internal strength and
weaknesses. In their 1984 book, Hayes and
Wheelwright define four stages of progression
toward attainment of a truly competitive
manufacturing strategy. Stage 1 (internally
neutral) is a fire-fighting, reactive form of decision
making where top-management is not concerned
with manufacturing. In stage 2 (externally
neutral), the rationale for manufacturing strategy is
to keep up with industry, in a sense of industry
parity. In stage 3 (internally supportive),
manufacturing is closely linked to the business
strategy of the corporation and becomes a force in
supporting the business. Finally, in stage 4
(externally supportive), all of the functions are
closely linked together, and manufacturing is a
basis for competitive advantage[14].
It is evident that firms implementing
manufacturing strategy improve the infrastructural
and structural subsystems (Skinner, 1969, Hayes
and Wheelwright, 1985). The structural decision
areas include following decisions (Avella et al.,
2001):
a. Capacity; which deals with reconfiguration of
factory layout, factory reconditioning and/or
reorganization, investments in plants,
equipment and R&D, expanding factory
capacity, reducing factory size.
b. Location; which deals with factory location
and relocation.
c. Technology management; which deals with
computer-aided design (CAD), computer-
aided manufacturing (CAM), robots, flexible
manufacturing system (FMS), group
technology.
d. Vertical integration/relation with suppliers;
which deals with subcontracting part of the
current manufacturing process, cooperation
with suppliers, integration of information
system with suppliers.
Infrastructural decisions enables firm to carry
out operations which increase the manufacturing
competitiveness. The infrastructural decisions
include:
a. Workforce management; which deals with job
enlargement/enrichment (increase variety of
tasks to be carried out by workers), workers
empowerment (increase workers‟
responsibility), team work, worker training,
management trains.
b. Quality control and guarantee systems; which
deals with total quality
management(TQM),zero defect programs,
quality circles, statistical quality control,
preventive maintenance, continuous
improvement of the current manufacturing
processes.
c. Production and inventory and control
systems; which deals with definition of
manufacturing strategy, improvement in
production and inventory control system,
reduction in machine set-up time, reduction
in manufacturing lead-time, just in time
purchase management.
d. New product development; which deals with
value analysis and product redesign,
competitive engineering, development of new
products, development of new processes for
new products.
e. Organizational structure; reducing workforce
size, decision decentralization, improving
management-worker relation, improving

236 P. P. Patil, B. E. Narkhede, M. M. Akarte
quality of working condition, interfunctional
team work[3].
Hill (1989) put forth the manufacturing
capability which concern customer in market place
and termed as market qualifying and winning
output. Market qualifying outputs qualify
company for acceptable level for existing
customers. Order winning outputs are the critical
characteristic of particular market. This could lead
to source of manufacturing investment decision.
Hill also pointed out that manufacturing strategy
was function of manufacturing and corporate
decisions. The issues involved in corporate
decision involve-corporate objectives, marketing
strategy, order winner outputs, process choice and
infrastructure and trade-off in these functions
which provide order winning outputs[15].
Miltenburg (2008) has shown the capabilities in
terms of manufacturing output which affected the
measurement of the performance. The
manufacturing output varies as per level of
analysis-entire factory or single production
system. He reduced the outputs in terms of cost,
quality, delivery time and delivery time reliability,
performance, flexibility and innovativeness. The
firm can exploit the capabilities to enhance the
performance and help on strategically to position
firm in market-place (Rosenzweig E.D. et al.,
2003).Boyer & Lewis (2002) found that operating
decision are important while making trade-off
among competitive priorities-cost,
flexibility,delivery,quality[26, 4].
Kim and Lee (1993) provide typology of
manufacturing system and generic manufacturing
strategies. This approach is helpful for identifying
factors influencing strategic choice and
performance (e.g. cost, quality, flexibility).In a
survey of 164 American manufacturing units,
Miller and Roth (1994) classified manufacturing
units into three clusters; caretakers, marketers,
innovators. In classifying, they found differences
among group in terms of action programs to
improve the effectiveness of operations over
following two years. The action programs include;
labor/management relationships, zero defects,
manufacturing lead time reduction, CAD, new
process/product, closing plants, SPS(process),new
product introductions, reducing workforce size.
Arnoud De Mayer (1998) provided trend in
implementation of action programs over 1986-
96.Some of the significant action programs, which
lead to higher competitive priorities for European
manufacturers are giving work to broaden range of
tasks, closing and relocating plants, functional
team work, value analysis, computer aided design,
reconditioning physical plants, developing new
process for existing products, flexible
manufacturing systems, robots, production and
inventory control[1].
Boyer and Lewis (2002) stressed the
importance consistency among plant‟s practices
(e.g. technological investments, human resource
systems, inventory control) to its competitive
priorities to develop operation as a competitive
advantage. Miltenburg (2008) defined
manufacturing subsystems in terms of Human
resources, Organization structure and controls,
production planning and control, sourcing, process
technology, facilities. However, Dangayach and
Deshmukh (2004) found evidence of
manufacturing strategy implementation in process
industry. In longitudinal study they found
competitive priorities and order winners for
cement industry.
It seems that no study has been reported to the
best of our knowledge in packaging product
manufacturing industry. We have administered a
structured questionnaire to these companies spread
all over the country. This work focuses on
assessing extent of implementation of
manufacturing strategy, extent of decisions in
manufacturing levers and competitive priorities in
IPPMC.
3. RESEARCH METHODOLOGY
Research on manufacturing strategy planning
and implementation has received attention all over
the world for manufacturing performance
improvement. In one of the study carried out by
Thun (2008), on general implementation of
manufacturing strategy and its alignment with
resource and market based view of manufacturing
strategy, they found significant difference among
high, medium and low strategy group. The MSI
factors are adopted from Thun (2008) and
Dangayach and Deshmukh (2004).In order to
assess emphasis on key decision areas we
operationalized the subsystem using the literature
(Avella et al., 2001; Miltenburg, 2008; Dangayach
and Deshmukh, 2006). We have adopted the
Vol. 6, No. 3, 2012 237
constructs for assessing existence of
manufacturing strategy among IPPMC. However,
to find detailed explanation of some findings case
study method is adopted[11]. Dangayach and
Deshmukh (2004) adopted case study
methodology along with comprehensive survey of
Machinery industry of India.
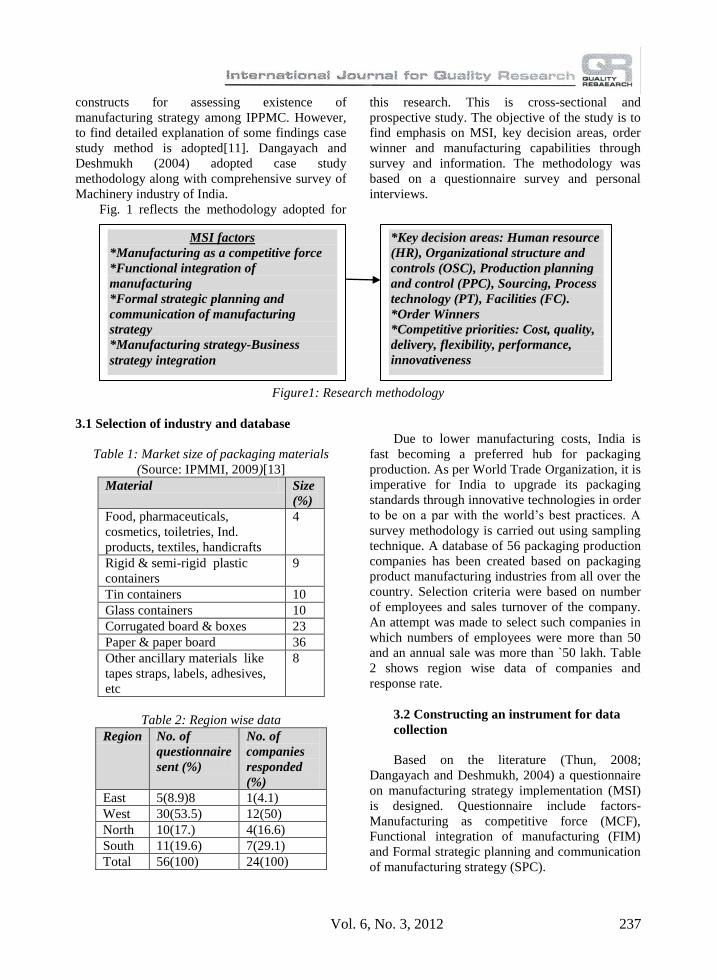
Fig. 1 reflects the methodology adopted for
this research. This is cross-sectional and
prospective study. The objective of the study is to
find emphasis on MSI, key decision areas, order
winner and manufacturing capabilities through
survey and information. The methodology was
based on a questionnaire survey and personal
interviews.
Figure1: Research methodology
3.1 Selection of industry and database
Table 1: Market size of packaging materials
(Source: IPMMI, 2009)[13]
Material Size
(%)
Food, pharmaceuticals,
cosmetics, toiletries, Ind.
products, textiles, handicrafts
4
Rigid & semi-rigid plastic
containers
9
Tin containers 10
Glass containers 10
Corrugated board & boxes 23
Paper & paper board 36
Other ancillary materials like
tapes straps, labels, adhesives,
etc
8
Table 2: Region wise data
Region No. of
questionnaire
sent (%)
No. of
companies
responded
(%)
East 5(8.9)8 1(4.1)
West 30(53.5) 12(50)
North 10(17.) 4(16.6)
South 11(19.6) 7(29.1)
Total 56(100) 24(100)
Due to lower manufacturing costs, India is
fast becoming a preferred hub for packaging
production. As per World Trade Organization, it is
imperative for India to upgrade its packaging
standards through innovative technologies in order
to be on a par with the world‟s best practices. A
survey methodology is carried out using sampling
technique. A database of 56 packaging production
companies has been created based on packaging
product manufacturing industries from all over the
country. Selection criteria were based on number
of employees and sales turnover of the company.
An attempt was made to select such companies in
which numbers of employees were more than 50
and an annual sale was more than `50 lakh. Table
2 shows region wise data of companies and
response rate.
3.2 Constructing an instrument for data
collection
Based on the literature (Thun, 2008;
Dangayach and Deshmukh, 2004) a questionnaire
on manufacturing strategy implementation (MSI)
is designed. Questionnaire include factors-
Manufacturing as competitive force (MCF),
Functional integration of manufacturing (FIM)
and Formal strategic planning and communication
of manufacturing strategy (SPC).
MSI factors
*Manufacturing as a competitive force
*Functional integration of
manufacturing
*Formal strategic planning and
communication of manufacturing
strategy
*Manufacturing strategy-Business
strategy integration
*Key decision areas: Human resource
(HR), Organizational structure and
controls (OSC), Production planning
and control (PPC), Sourcing, Process
technology (PT), Facilities (FC).
*Order Winners
*Competitive priorities: Cost, quality,
delivery, flexibility, performance,
innovativeness
Vol. 6, No. 3, 2012 238
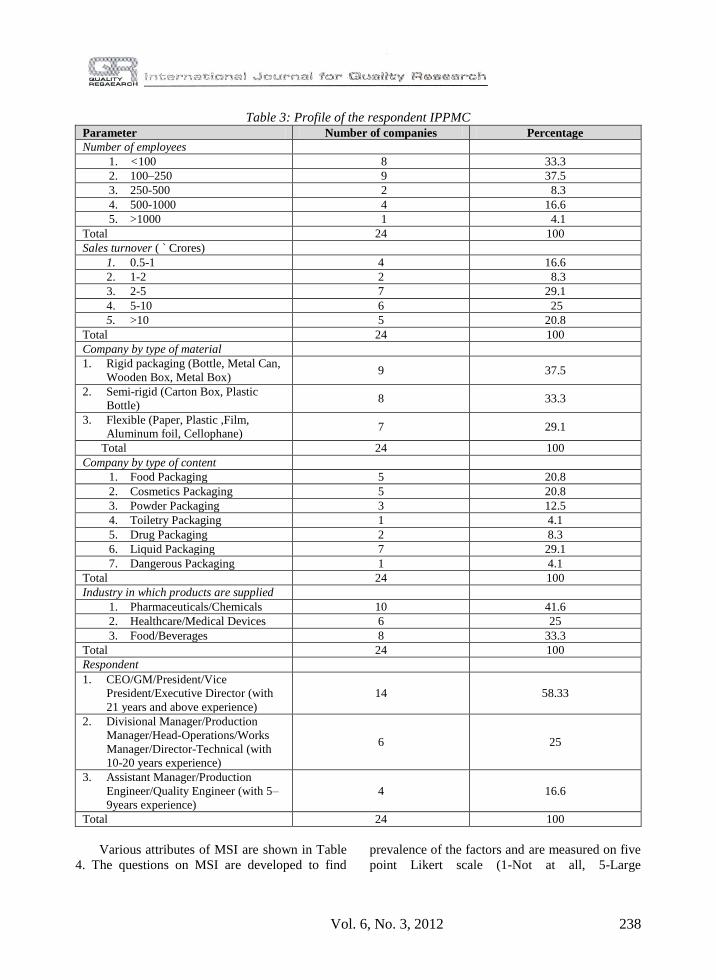
Table 3: Profile of the respondent IPPMC
Parameter Number of companies Percentage
Number of employees
1. <100 8 33.3
2. 100–250 9 37.5
3. 250-500 2 8.3
4. 500-1000 4 16.6
5. >1000 1 4.1
Total 24 100
Sales turnover ( ` Crores)
1. 0.5-1 4 16.6
2. 1-2 2 8.3
3. 2-5 7 29.1
4. 5-10 6 25
5. >10 5 20.8
Total 24 100
Company by type of material
1. Rigid packaging (Bottle, Metal Can,
Wooden Box, Metal Box) 9 37.5
2. Semi-rigid (Carton Box, Plastic
Bottle) 8 33.3
3. Flexible (Paper, Plastic ,Film,
Aluminum foil, Cellophane) 7 29.1
Total 24 100
Company by type of content
1. Food Packaging 5 20.8
2. Cosmetics Packaging 5 20.8
3. Powder Packaging 3 12.5
4. Toiletry Packaging 1 4.1
5. Drug Packaging 2 8.3
6. Liquid Packaging 7 29.1
7. Dangerous Packaging 1 4.1
Total 24 100
Industry in which products are supplied
1. Pharmaceuticals/Chemicals 10 41.6
2. Healthcare/Medical Devices 6 25
3. Food/Beverages 8 33.3
Total 24 100
Respondent
1. CEO/GM/President/Vice
President/Executive Director (with
21 years and above experience)
14 58.33
2. Divisional Manager/Production
Manager/Head-Operations/Works
Manager/Director-Technical (with
10-20 years experience)
6 25
3. Assistant Manager/Production
Engineer/Quality Engineer (with 5–
9years experience)
4 16.6
Total 24 100
Various attributes of MSI are shown in Table
4. The questions on MSI are developed to find
prevalence of the factors and are measured on five
point Likert scale (1-Not at all, 5-Large

Vol. 6, No. 3, 2012 239
extent).Questions related to manufacturing levers
is adopted from (Avella et al., 2001; Miltenburg,
2008; Dangayach and Deshmukh, 2006). The
questions on manufacturing levers are developed
to find emphasis(or investment) in activities in the
last three years and measured on five point Likert
scale(1-Not at all, 5-Large extent). However scale
for manufacturing priorities were adopted
from(Miltenburg , 2008, Swink et al., 2007) and
changes in manufacturing output in last three
years in your plant primary product line are
measured on five point Likert scale (1-Not at all,
5-Large extent). General questions regarding
number of employees, sales turnover, type of
packaging, etc. were framed by authors. It is a
type of closed-ended question that allows
respondents to indicate how closely their feelings
match the question or statement on a rating scale.
The questionnaire contained in three sections
„A‟, „B‟ and „C‟. Section „A‟ contained 14 general
questions pertained to plant.
Section „B‟ contained 12 questions related to
manufacturing strategy implementation (MSI).
The CEO‟s/Directors are targeted to fill response
on MSI. Section „C‟ contained questionnaire on
decision making in manufacturing levers and
manufacturing priorities. Middle management was
targeted to fill section „C‟[29].
To assess content validity a pilot study is
carried out and few questionnaires were
administered to academic and industry experts.
Based on their feedback the present form had been
evolved and final version of the questionnaire was
sent to the CEOs of 56 companies. Out of which,
24 valid responses in the form of filled
questionnaire have been received (response rate
42.8%). Table 3 shows profile of respondent
IPPMC.
After collecting the data, Confirmatory factor
analysis for each construct is carried out and Eigen
values of each factor are found more than 1. The
KMO (Kiser Mayer Oklin) factor for sampling
adequacy is found more than 0.6, adequate for
exploratory work (Hutcheson and Sofroniou,
1999)[16].Cronbach‟s coefficient alpha is
calculated for checking internal consistency and
reliability of scales. Cronbach‟s alpha values are
found more than 0.5, which is adequate for
exploratory work (Nunally JC, 1978)[22].
4. SURVEY FINDINGS AND
OBSERVATIONS
The findings are divided into four sections.
The first subsection describes the emphasis on
MSI. The following sections deal with
manufacturing levers, competitive priorities and
order winners.
4.1. Manufacturing strategy
implementation (MSI)
The objective of manufacturing strategy is to
achieve long–term competitive advantage. This is
achieved by looking into position of firm in terms
of capabilities and articulating the plan to convert
capabilities required in the future. We extended
earlier research on MSI (Dangayach and
Deshmukh, 2004; Thun, 2008). Table 4 depicts
emphasis laid by IPPMC on various strategic
aspects. We propose the analogy to Hayes and
Wheelwright‟s model with the inclusion of
functional integration of manufacturing. Various
attributes of stages I–IV (internally neutral,
externally neutral, internally supportive, and
externally supportive) are included in Table 4.The
emphasis on attribute say,1-2 mean stage I of
Hayes and Wheelwright‟s model and 2-3,3-4,4-5
as stage II,III,IV of Hayes and Wheelwright‟s
model.
It is observed from Table 4 that overall mean
values for IPPMC is 3.31.This shows IPPMC in
stage III of Hayes and Wheelwright‟s model i.e.
internally supportive. It seems that company A
(overall mean=2.47) is in stage II of Hayes and
Wheelwright‟s model i.e. externally neutral and
company B (overall mean=3.29) are in stage III of
Hayes and Wheelwright‟s model i.e. internally
supportive, whereas company C (overall mean =
4.0) is on the verge of moving from stage III to
stage IV i.e. from internally supportive to
externally supportive.
4.2 Manufacturing levers
The competitive priorities are achieved by
properly investing in structural and infrastructural
issues in manufacturing. The emphasis on issues
focuses decision making on processes of choosing,
technology, capacity, manufacturing planning and
control systems, and quality (Skinner, 1969 ,

240 P. P. Patil, B. E. Narkhede, M. M. Akarte
Hayes and Wheelwright 1985, Ward et al 1998).
We extended the choices in manufacturing as
manufacturing levers (Miltenburg, 2008). From
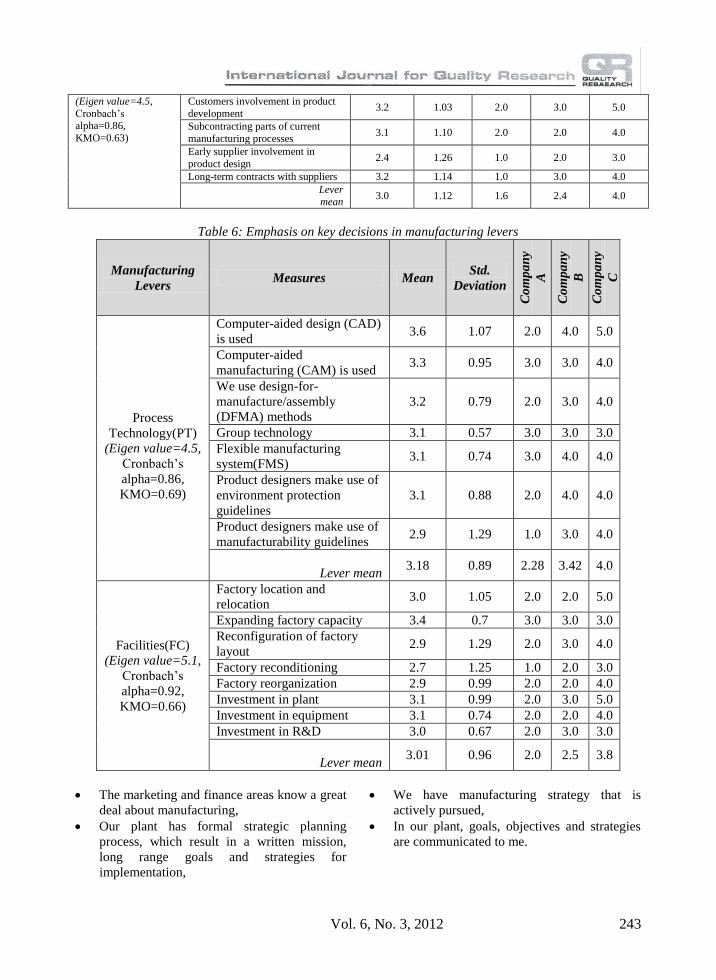
Table 5 and Table 6, we find that main values for
IPPMC are the highest for the process technology
(3.18), followed by organization and control
(3.12), facilities (3.01), Human resource (3.0),
Sourcing (3.0), and production planning and
control (2.95).
Table 4 Emphasis on MSI factors
Factor Mean Std.
Deviation
Company
A
Company
B
Company
C
Manufacturing as a competitive force(MCF) (Eigen value=2.40,Cronbach‟s alpha=0.61,KMO=0.75)
In our company, manufacturing is considered to be a source
of competitive advantage
We have manufacturing strategy that is actively pursued
Decisions about materials, systems and services sourced
from outside our company are screened for consistency
with our manufacturing strategy
Our manufacturing competence is a substantial source of
value added
3.3 1.16 2.0 3.0 4.0
3.5
0.97
3.0
5.0
2.0
3.5 0.95 4.0 4.0 4.0
3.3
1.16
2.0
3.0
4.0
Factor mean 3.4 1.06 2.75 3.75 3.5
Functional integration of manufacturing (FIM)
(Eigen value=2.02,Cronbach‟s alpha=0.58,KMO=0.88)
Our plant‟s functions coordinate their activities
The functions in our plants are well integrated
The functions in our plants work well together
The marketing and finance areas know a great deal about
manufacturing
3.2 1.14 2.0 3.0 3.0
3.3 1.16 2.0 3.0 5.0
3.3 1.16 2.0 3.0 4.0
3.3 1.06 4.0 3.0 4.0
Factor mean 3.27 1.13 2.5 3.0 4.0
Formal strategic planning and communication of manufacturing strategy (SPC)
(Eigen value=2.43,Cronbach‟s alpha=0.68,KMO=0.67)
In our plant, goals, objectives and strategies are communicated to me
I understand the long-run competitive strategy of this plant
Our plant has formal strategic planning process, which result in a written mission, long range goals and strategies
for implementation
Plant management routinely reviews and updates a long
range plan.
3.6 0.97 3.0 4.0 3.0
3.3 1.16 2.0 3.0 4.0
3.7 0.95 4.0 4.0 4.0
3.3
1.16
2.0
3.0
5.0
Factor mean 3.47 1.06 2.75 3.5 4.0
Manufacturing strategy-Business strategy integration (MS-BSI)
(Eigen value=4.1,Cronbach‟s alpha=0.9,KMO=0.849)
Manufacturing strategy is well aligned with business
strategy
Our business strategy is translated into manufacturing terms
Manufacturing management is aware of business strategy
Business strategy at our firm drives manufacturing
decisions
Potential manufacturing investments are screened for
consistency with our business strategy
3.1 0.88 2.0 4.0 4.0
2.9 0.99 2.0 3.0 4.0
3.1 0.88 2.0 3.0 4.0
3.5 1.18 2.0 3.0 5.0
3.2 1.03 2.0 3.0 5.0
Factor mean 3.15 0.99 2.0 3.2 4.4
Overall mean
3.31 1.05 2.47 3.29 4.0

Vol. 6, No. 3, 2012 241
4.3. Competitive priorities
Competitive priorities are the basis of
competition and content of manufacturing strategy
(Dangayach and Deshmukh, 2001).Competitive
priorities denote strategic intent on developing
certain manufacturing capabilities that may
improve competitive position of the plant in
marketplace[8]. Many researchers have stressed
the importance of cost, quality, delivery and
flexibility (Ward et al., 1998, Boyer and Lewis,
2002). Miltenburg (2008) suggests innovativeness
to be required to quickly introduce new products
and to make product design. IPPMC is supplier to
various organizations including high demand
consumer product firms. We have included
innovativeness to keep pace with changing needs
of customers. Table 7 shows mean values of
competitive priorities for IPPMC and case
companies and standard deviation of competitive
priorities for IPPMC. Respondents were asked to
indicate degree of importance on changes in
manufacturing output in last three years in your
plant primary product line are measured on five
point Likert scale.
We have extended the six competitive
priorities identified by researchers (Miltenburg,
2008, Swink et al., 2007) into 19 dimensions.
Table 7 shows that top most competitive priority
for IPPMC is ability of features to do things (3.7),
followed by ability to produce range of products
(3.6), decrease in lead time to introduce new
products (3.6), and delivery speed (3.6). However
overall mean for IPPMC is highest for delivery
(3.43), followed by flexibility (3.37), performance
(3.36), innovation (3.4), quality (3.3) and cost
(3.16).
4.4. Order winners
We have identified 9 criteria as order winners
for packaging product manufacturing sector based
on literature (Hill, 1989). We have selected
manufacturing related criteria to find contribution
of manufacturing levers to enhance order winners.
We have selected 9 criteria, which are relevant to
IPPMC. Order winners include ability of product
features to do things, ability to produce range of
products, delivery speed, decrease in main time to
introduce new products, promptly handle customer
complaints, ability to modify features,
conformance to design specification, product
durability, and reduction in production cost.
Respondents were asked to indicate degree of
agreement on five point Likert scale. Table 8
shows that top most order winner for IPPMC is
ability of product features to do things (3,7),
followed by ability to produce range of products
(3.6), delivery speed (3.6), decrease in Lead time
to introduce new products (3.6), promptly handle
customer complaints (3.5), ability to modify
features (3.46), conformance to design
specification (3.4), product durability (3.4), and
reduction in production cost (3.3).
5. CASE STUDIES
We adopted case study method to analyze and
in-depth study of companies under consideration.
The case study was intended to aid in further
concept development and framework
development. Based on survey, we present cases
of packaging product manufacturing companies
(labeled as A, B, C).Company A is a printed
flexible manufacturer, company B is a multi-layer
flexible film manufacturer, and company C is
coextruded laminated tube manufacturer. Each
plant was visited thrice, once for an understanding
of general operations, second for discussion on
various strategy implementation factors and third
for discussing the exhaustive questionnaire for the
analysis. Data collection consisted of documentary
evidence, observation in the plant, structured
questionnaire and unstructured questioning. The
discussion on strategy implementation is generally
carried out with CEO‟s/Directors of the firm.
Senior managers are interviewed for emphasis on
manufacturing levers and competitive priorities.
We get consent from 4 companies from western
region of India for participation in detailed study.
We have selected two companies (B and C) as
they are geographically located in close proximity
(suburbs of Mumbai i.e. Thane), and third
company (A) located at Silvasa in Gujrat state.
Table 9 shows overview of the companies under
study. We study companies on following points:
challenges and opportunities for company
relative positioning of the companies in
manufacturing strategy implementation
emphasis on manufacturing levers

242 P. P. Patil, B. E. Narkhede, M. M. Akarte
competitive priorities and order winners of the
company.
5.1 Company A
5.1.1 Challenges and opportunities for
company
Company A is manufacturer of printed
flexible laminates and operates in multi-plant
environment with 120 employees. The annual
sales of company is `40 crore. The company is
focusing on improving product development,
customer satisfaction, and capabilities for
providing innovative solutions for continuously
changing market needs. However, company has
developed its core competence in the manufacture
of superior quality and customized flexible
packaging solutions. The Company is empowered
with sophisticated technology and is offering
excellent services.
5.1.2 Relative positioning of the companies
in manufacturing strategy implementation
Based on challenges and opportunities,
company formulates the plan for competitive
advantage. Table 4 shows mean score of emphasis
placed on various aspects of MSI. Company C is
placing more emphasis on the following aspects:
Decisions about materials, systems and services
sourced from outside our company are screened
for consistency with our manufacturing
strategy.
Table 5: Emphasis on key decisions in manufacturing levers Manufacturing
Levers Measures Mean
Std.
Deviation
Company
A
Company
B
Company
C
Human Resource (HR)
(Eigen value=2.40,
Cronbach‟s alpha=0.61,
KMO=0.75)
Job enlargement or
enrichment(increase variety of tasks
to be carried out by employees)
2.9 0.99 2.0 3.0 4.0
Technical skill among employee 3.0 1.05 2.0 4.0 4.0
Organizational skill development
among employee 3.1 0.88 3.0 4.0 4.0
Plant employees are encouraged to
work as a team 3.0 1.15 3.0 2.0 5.0
Lever mean 3.0 1.01 2.5 3.25 4.25
Organizational Structure and Controls
(OSC)
(Eigen value=5.2, Cronbach‟s
alpha=0.93,
KMO=0.68)
OSC allows people to operate as
integrated unit in production system 3.1 1.29 2.0 3.0 5.0
There are robust processes for sharing learning between group of
employees
3.0 0.82 2.0 3.0 4.0
Employees are authorized to make changes in production system where
it is most appropriate
3.1 0.88 2.0 2.0 4.0
Incentives for quality improvement ideas
3.0 0.82 2.0 3.0 4.0
Efforts are made to improve work design
3.4 1.07 1.0 4.0 3.0
Lever mean 3.12 0.97 1.8 3.0 4.0
Production Planning
and Control
(PPC) (Eigen value=6.4,
Cronbach‟s
alpha=0.94, KMO=0.68)
Preventive maintenance 3.0 1.25 2.0 2.0 5.0
Development of new processes for
products 2.9 1.29 1.0 3.0 4.0
Improvement in production and inventory control system
3.2 1.03 2.0 4.0 4.0
Reduction in machine setup time 2.9 0.74 3.0 3.0 4.0
Reduction in manufacturing lead
time 3.0 0.94 3.0 2.0 4.0
Just in time purchase management 2.7 1.16 1.0 3.0 5.0
Lever
mean 2.95 1.06 2.0 2.83 4.33
Sourcing (SR)
We rely on small number of high quality suppliers
3.1 1.10 2.0 2.0 4.0
Vol. 6, No. 3, 2012 243
(Eigen value=4.5,
Cronbach‟s alpha=0.86,
KMO=0.63)
Customers involvement in product
development 3.2 1.03 2.0 3.0 5.0
Subcontracting parts of current
manufacturing processes 3.1 1.10 2.0 2.0 4.0
Early supplier involvement in
product design 2.4 1.26 1.0 2.0 3.0
Long-term contracts with suppliers 3.2 1.14 1.0 3.0 4.0
Lever
mean 3.0 1.12 1.6 2.4 4.0
Table 6: Emphasis on key decisions in manufacturing levers
Manufacturing
Levers Measures Mean
Std.
Deviation
Co
mp
an
y
A
Co
mp
an
y
B
Co
mp
an
y
C
Process
Technology(PT)
(Eigen value=4.5,
Cronbach‟s
alpha=0.86,
KMO=0.69)
Computer-aided design (CAD)
is used 3.6 1.07 2.0 4.0 5.0
Computer-aided
manufacturing (CAM) is used 3.3 0.95 3.0 3.0 4.0
We use design-for-
manufacture/assembly
(DFMA) methods
3.2 0.79 2.0 3.0 4.0
Group technology 3.1 0.57 3.0 3.0 3.0
Flexible manufacturing
system(FMS) 3.1 0.74 3.0 4.0 4.0
Product designers make use of
environment protection
guidelines
3.1 0.88 2.0 4.0 4.0
Product designers make use of
manufacturability guidelines 2.9 1.29 1.0 3.0 4.0
Lever mean 3.18 0.89 2.28 3.42 4.0
Facilities(FC)
(Eigen value=5.1,
Cronbach‟s
alpha=0.92,
KMO=0.66)
Factory location and
relocation 3.0 1.05 2.0 2.0 5.0
Expanding factory capacity 3.4 0.7 3.0 3.0 3.0
Reconfiguration of factory
layout 2.9 1.29 2.0 3.0 4.0
Factory reconditioning 2.7 1.25 1.0 2.0 3.0
Factory reorganization 2.9 0.99 2.0 2.0 4.0
Investment in plant 3.1 0.99 2.0 3.0 5.0
Investment in equipment 3.1 0.74 2.0 2.0 4.0
Investment in R&D 3.0 0.67 2.0 3.0 3.0
Lever mean 3.01 0.96 2.0 2.5 3.8
The marketing and finance areas know a great
deal about manufacturing,
Our plant has formal strategic planning
process, which result in a written mission,
long range goals and strategies for
implementation,
We have manufacturing strategy that is
actively pursued,
In our plant, goals, objectives and strategies
are communicated to me.

244 P. P. Patil, B. E. Narkhede, M. M. Akarte
5.1.3 Emphasis on manufacturing levers
The emphasis on manufacturing levers is
based on competitive priorities required by the
company. Table 5 and Table 6 show main score
for various manufacturing levers for the company.
The main score for emphasis on manufacturing
lever is found more on process technology (2.28),
followed by human resource (2.5), Production
planning and control (2.0), facilities (2.0),
organizational structure and controls (1.8), and
sourcing (1.6). However more emphasis is placed
on following aspects:
Table 7: Competitive priories among IPPMC
Manufacturing outputs Mean Std.
Deviation Company A Company B Company C
Cost
Increased capacity utilization 3.4 1.07 3.0 2.0 4.0
Reduce production costs 3.3 0.95 2.0 3.0 5.0
Increase labor productivity 2.8 1.03 2.0 3.0 4.0
Overall mean 3.16 1.01 2.33 2.66 4.33
Quality
Conformance to design
specification 3.4 0.82 2.0 3.0 4.0
Provide overall quality
performance 3.2 0.79 3.0 2.0 3.0
Product reliability 3.2 0.92 2.0 3.0 4.0
Product durability 3.4 1.07 2.0 3.0 4.0
Overall mean 3.3 0.90 2.25 2.75 3.75
Delivery
Delivery dependability
(delivered on the agreed upon
date)
3.2 0.63 3.0 3.0 4.0
Delivery speed 3.6 0.84 2.0 4.0 4.0
Promptly handle customer
complaints 3.5 0.71 3.0 3.0 4.0
Overall mean 3.43 0.72 2.66 3.33 4.0
Performance
Ability of features to do things 3.7 0.95 3.0 3.0 5.0
Ability to modify features 3.4 0.70 2.0 3.0 4.0
Extent of unique features in our
product 3.0 0.82 3.0 3.0 3.0
Overall mean 3.36 0.82 2.66 3.0 4.0
Flexibility
Ability to customize products 3.2 0.92 3.0 3.0 4.0
Ability to produce range of
products 3.6 0.70 3.0 4.0 4.0
Manufacture broad product mix
within same facilities 3.2 0.79 3.0 2.0 4.0
Rapidly handle custom orders or
engineer-to-order 3.5 0.71 2.0 3.0 4.0
Overall mean 3.37 0.78 2.75 3.0 4.0
Innovation
Decrease in Lead time to
introduce new products 3.6 0.84 3.0 4.0 5.0
New products introduced each
year 3.2
1.03 2.0 3.0 4.0
Overall mean 3.4 0.93 2.5 3.5 4.5

Vol. 6, No. 3, 2012 245
Expanding factory capacity
Flexible manufacturing system
Group technology
Computer aided manufacturing (CAM)
Reduction in lead time
5.1.4 Competitive priorities
The competitive priorities for company A is
shown in Table 7.The order of mean score of
competitive priorities for company A are:
- Flexibility
- Delivery
- Performance
- Innovation
- Cost
- Quality.
5.1.5 Order Winners
Table 8 shows the order winners for company
A. The order winners for company Aare:
- Ability to produce range of products
- Promptly handle customer complaints
- Decrease in Lead time to introduce new
products
- Ability of product features to do things
- Ability to modify features
- Conformance to design specification
- Delivery speed
- Reduction in production cost
- Product durability.
Table 8: Order winning criteria
Criteria Mean
(rank)
Std.
deviation
Company
A
Company
B
Company
C
Ability of product features
to do things 3.7(1) 0.95 3.0(4) 3.0(7) 5.0(2)
Ability to produce range of
products 3.6(2) 0.70 3.0(1) 4.0(1) 4.0(3)
Delivery speed 3.6(3) 0.84 2.0(7) 4.0(2) 4.0(7)
Decrease in Lead time to
introduce new products 3.6(4) 0.84 3.0(3) 4.0(3) 5.0(1)
Promptly handle customer
complaints
3.5(5) 0.71 3.0(2) 3.0(5) 4.0(5)
Ability to modify features 3.4(6) 0.70 2.0(5) 3.0(4) 4.0(4)
Conformance to design
specification 3.4(7) 0.82 2.0(6) 3.0(6) 4.0(6)
Product durability 3.4(8) 1.07 2.0(9) 3.0(9) 4.0(9)
Reduction in production
cost 3.3(9) 0.95 2.0(8) 3.0(8) 5.0(8)
Table 9: Overview of companies
Attribute Company A Company B Company C
Product Coextruded Laminated
tubes
Multi-layer flexible
films
Printed flexible
laminates
Sales turnover
(Crore) 400 150 40
Number of employees 750 250 120
5.2 Company B
5.2.1 Challenges and opportunities
Company B is a leading manufacturer of
multi-layer flexible films located in western region
of India. The company operates in multi-plant
environment with 250 employees. The annual sale
of company is `150 crore. The company is
working on to improve cost competitiveness and
flexibility of production system. The company has
technical collaboration with leading Finland

246 P. P. Patil, B. E. Narkhede, M. M. Akarte
packaging manufacturer.
5.2.2 Relative positioning of the companies
in manufacturing strategy implementation
Table 4 shows means for various strategic
aspects. It is observed that means for company B
is higher for following aspects.
We have manufacturing strategy that is
actively pursued,
Decisions about materials, systems and
services sourced from outside our company
are screened for consistency with our
manufacturing strategy,
In our plant, goals, objectives and strategies
are communicated to me,
Our plant has formal strategic planning
process, which result in a written mission,
long range goals and strategies for
implementation,
Manufacturing strategy is well aligned with
business strategy.
5.2.3 Emphasis on manufacturing levers
Table 5 and Table 6 shows mean score for
various manufacturing levers for the company.
The mean score for emphasis on manufacturing
lever is found more on process technology (3.42),
human resource (3.25), organizational structure
and control (3.0), production planning and control
(2.83), facilities (2.5), sourcing 2.4). However,
more emphasis is laid on following aspects:
Technical skills among employees
Technical skill among employee
Efforts are made to improve work design
Improvement in production and inventory
control system
5.2.4 Competitive priorities
The competitive priorities for company B is
shown in Table 7.The order of mean score of
competitive priorities for company B are:
Innovation,
Delivery,
Flexibility,
Performance,
Quality, and
Cost.
5.2.5 Order winners
Table 8 shows the order winners for company
B. The order winners for company B are:
Ability to produce range of products,
Delivery speed,
Decrease in Lead time to introduce new
products,
Ability to modify features,
Promptly handle customer complaints,
Conformance to design specification,
Ability of product features to do things,
Reduction in production cost
Product durability.
5.3 Company C
5.3.1 Challenges and opportunities for
company
Company C is a leading laminated tube
manufacturer located in western region of India.
The company operates in multi-plant environment
with 750 employees. The annual sale of the
company is `400 core. The company is working on
to improve on cost competitiveness and
relationship with customers. The company is the
largest producer of laminated tube globally and
aggressively expanding packaging solutions to the
value added pharmaceutical and cosmetics
applications where technology and product
innovation are key differentiators.
5.3.2 Relative positioning of the companies
in manufacturing strategy implementation
Table 4 shows means for various strategic
aspects. It is observed that means for company C
is higher for following aspects.
The functions in our plants are well
integrated,
Plant management routinely reviews and
updates long range plans,
Potential manufacturing investments are
screened for consistency with our business
strategy,
Business strategy at our firm drives
manufacturing decisions,
Decisions about materials, systems and
services sourced from outside our company
Vol. 6, No. 3, 2012 247
are screened for consistency with our
manufacturing strategy,
Our plant has formal strategic planning
process, which result in a written mission,
long range goals and strategies for
implementation,
Manufacturing strategy is well aligned with
business strategy.
5.3.3 Emphasis on manufacturing levers
Table 5 and Table 6 shows mean score for
various manufacturing levers for the company.
The mean score for emphasis on manufacturing
lever is found more on Human resource (4.25),
followed by Organization and control (4.0),
Production planning and control (4.33), sourcing
(4.0), Process technology (4.0), facilities (3.8) on
five point Likert scale. However, more emphasis
is laid on following aspects:
Plant employees are encouraged to work as a
team,
Preventive maintenance,
Just in time purchase management,
OSC allows people to operate as
integrated unit in production system[20].
5.3.4 Competitive priorities
The competitive priorities for company C is
shown in Table 7.The order of mean score of
competitive priorities for company C are:
Innovation,
Cost,
Delivery,
Flexibility,
Performance,
Quality.
5.3.5 Order winners
Table 8 shows the order winners for company
C. The order winners for company C are:
Decrease in Lead time to introduce new
products,
Ability of product features to do things,
Ability to produce range of products,
Ability to modify features,
Promptly handle customer complaints,
Conformance to design specification,
Delivery speed,
Reduction in production cost,
Product durability.
6. CONCLUSION
The difference in emphasis on manufacturing
strategy implementation is vivid from the response
from IPPMC. This clearly explains the changes in
the manufacturing priorities over the last three
years. Manufacturing is still in the evolving stage
and more emphasis is required to compete on
various competitive priorities for packaging
product manufacturers. Based on survey and
response on five point Likert scale, the IPPMC
seems to be in stage II or transition from stage to
stage III of Hayes and Wheelwright‟s model.
Company A seems to be in stage II, company B in
stage III and company C is making manufacturing
function more proactive. It seems company C is
moving towards stage IV of Hayes and
Wheelwright‟s model.
The most important competitive priority for
IPPMC is ability of features to do things. This is
possible by properly incorporating
manufacturability guidelines for designing the
product. Still, it is found that few companies are
not emphasizing it. Second priority is to produce
range of products. Companies are investing more
in process technology to enhance the capability of
production system to produce range of products.
To decrease in lead time to introduce new
products, companies are emphasizing
improvement in relations with suppliers and
enhancing the technical and organizational skills
of human resource. Delivery speed is increased by
improving inventory and control system,
developing new processes for products and
accommodating computer aided manufacturing in
production system. However mean score of
quality and cost is least, as companies are compete
on other parameters. It is surprising and contrary
to previous results (Noble MS, 1995; Vickery S et
al., 1993) where quality forms solid foundation at
bottom of sand cone. This is because IPPMC is
suppliers to large size consumer and
pharmaceutical industry[21, 31]. The quality and
cost became the price for product selection and
companies yield to bargaining the power of buyers
(Porter, 1980).Innovation is the top most priority

248 P. P. Patil, B. E. Narkhede, M. M. Akarte
for case companies. Aesthetic and creative
package attracts customers. Packaging product
manufacturer has to design and manufacture
products as per demand of the customers.
This study tried to assess manufacturing strategy
aspects in IPPMC. We have adopted mono-
respondent approach in administration of
questionnaire. This approach brings in bias with
the same issue. Multi-respondent approaches incur
high cost, but reduce the bias in response. This
limitation could be considered in the future
research. More sample size and more respondents
at various levels in the company could be
considered for future study to get more insight into
manufacturing levers and priorities.
REFERENCES:
[1] Arnoud De Mayer, (1998) „Manufacturing Operations in Europe: Where do We Go Next’,
European Management Journal, vol. 16, no. 3, pp. 262-271.
[2] Arsovski, S., Đokić, I.& Đokić-Pešić, S. 2011, "Quality in world class manufacturing",
International Journal for Quality Research, vol. 5, no. 4, pp. 309-316.
[3] Avella Lucia, Fernandez Esteban, Vazquez Camilo J., (2001) „Analysis of manufacturing
strategy as an explanatory factor of competitiveness in the large Spanish industrial firm’,
International Journal Production Economics, vol. 72, no. 2, pp. 139-157.
[4] Boyer, K.K., Lewis, M.W., (2002) „Competitive priorities: Investigating the need for trade-offs
in operations strategy‟, Production and Operations Management vol. 11, no. 1, pp. 9–20.
[5] Chang, S., Yang C., Cheng H., Sheu C., (2003) „Manufacturing flexibility and business strategy:
an empirical study of small and medium sized firms’, International Journal of Production
Economics vol. 83, no. 1, pp. 13–26.
[6] Chandra, P. & Sastry, T., (1998) „Competitiveness of Indian Manufacturing’, Vikalpa vol.23, no.
3, pp. 25-36.
[7] Chandra Pankaj, (2009) „Competitiveness of Indian manufacturing. Findings of the Third
National Manufacturing Survey‟ 13th Annual Conference of Society of Operations Management,
New Delhi, pp. 59-89
[8] Dangayach G.S., Deshmukh S.G., (2001) „Manufacturing strategy: Experience from select
Indian organizations’, Journal of Manufacturing systems, vol. 19, no. 2, pp. 134-148.
[9] Dangayach G.S., Deshmukh S.G., (2003) „Evidence of manufacturing strategies in Indian
industry: A survey’,,International Journal of Production Economics, vol 83, no. 3, pp. 279-298.
[10] Dangayach G.S., Deshmukh S.G.(2004) „Linkages between manufacturing strategy, business
strategy and business excellence: A longitudinal study’, International Journal of Industrial
Engineering, vol. 11, no. 3, pp. 297-306.
[11] Dangayach G.S., Deshmukh S.G., (2006) „An exploratory study of manufacturing strategy
practices of machinery manufacturing companies in India‟ Omega, 34, no. 3, pp. 254 – 273
[12] Dangayach G.S., Deshmukh S.G., (2008) „Implementation of manufacturing strategy: a
multisector study of the Indian manufacturing industry‟ International Journal of Services and
Operations management, vol.4, no. 1, pp. 1-33
[13] Directory of packaging machinery manufacturers of India, (2009), Indian Institute of Packaging
(IIP), Mumbai, India 2009.
[14] Hayes R.H., Wheelwright S.C., (1984) Restoring our competitive Edge: Competing through
manufacturing. Wiley, New York 1984.
[15] Hill T.J. (1989) Manufacturing strategy: Text and cases. Irwin, Homewood, IL 1989.
[16] Hutcheson, Graeme, Nick Sofroniou, 1999. The multivariate social scientist: Introductory
statistics using generalized linear models. Thousand Oaks, CA: Sage Publications 1999.
[17] Indo-Italian Chamber of Commerce and Industry, (2008), Report on Packaging Industry in
India. Mumbai, India 2008.
[18] Institute of packaging machinery manufacturers of India (IPMMI), (2009), Report on packaging
machinery manufacturers in India. Mumbai, India 2009.

Vol. 6, No. 3, 2012 249
[19] Miltenburg J., (2008), „Setting manufacturing strategy for a factory-within-factory’, International
Journal Production Economics, vol. 113, no. 1, pp. 307-323.
[20] Mojtahedzadeh, R.& Arumugam, C.V. 2011, "A structural relationship between knowledge
management, innovation, and performance of Iranian industries: A theoretical approach",
International Journal for Quality Research, vol. 5, no. 3, pp. 231-235.
[21] Noble M.A., (1995) „Manufacturing strategy: testing the cumulative model in multiple country
context’,Decision Sciences, September-October: vol. 26, no. 5, pp. 693-721.
[22] Nunally JC. Psychometric methods. New York: McGraw-Hill 1978;
[23] Porter, M. E., (1980) Competitive strategy: Techniques for analyzing industries and competitors.
Free Press, New York 1980.
[24] Porter, M.E., (1985) Competitive Advantage: Creating and Sustaining Superior Performance.
Free Press, New York 1985.
[25] Platts K.W., Gregory M.J., 1992. Manufacturing strategy: Process and Content. Chapman and
Hall, London 1992.
[26] Rosenzweig E.D., Roth A.V., James W., Dean Jr., (2003) „The influence of an integration
strategy on competitive capabilities and business performance: An exploratory study of
consumer product manufacturer’, Journal of Operations Management, vol. 21, no. 4, pp. 437-
456.
[27] Skinner, W., (1969) ‘Manufacturing-Missing Link in Corporate Strategy’, Harvard Business
Review, vol. 47, no. 3, pp. 136–145.
[28] Skinner, W., (1974) „ The focused factory’, Harvard Business Review, vol. 52, no. 3, pp. 113–
121.
[29] Swink Morgan, Narasimhan Ram, Wang Cynthia, (2007) „Managing beyond the factory walls:
Effects of four types of strategic integration on manufacturing plant performance’, Journal of
Operations Management, vol. 25,no. 1, pp. 148–164.
[30] Thun Jorn-Henrik, (2008), „.Empirical analysis of manufacturing strategy implementation’
International Journal Production Economics, vol. 113, no.1, pp. 370-382.
[31] Vickery S., Dorge C., Markland R.E., (1993) „Production competence and business strategy: do
they affect business performance, Decision Sciences, vol. 24, no. 2, pp. 435-56.