an object-oriented classification of impact … · although obia is increasingly used in...
TRANSCRIPT

AN OBJECT-ORIENTED CLASSIFICATION OF IMPACT CRATERS USING LUNAR RECONNAISSANCE ORBITER DATA
A thesis submitted to the faculty of San Francisco State University
In partial fulfillment of the requirements for
the Degree
Master of Science
In
Geographic Information Science
by
Allison Haley Barnes
San Francisco, California
January 2016

CERTIFICATION OF APPROVAL
I certify that I have read An Object-Oriented Classification of Impact Craters Using
Lunar Reconnaissance Orbiter Data by Allison Haley Barnes, and that in my opinion this
work meets the criteria for approving a thesis submitted in partial fulfillment of the
requirement for the degree Master of Science in Geographic Information Science at San
Francisco State University.
Leonhard Blesius, Ph.D. Associate Professor of Geography
Jerry Davis, Ph.D. Professor of Geography

AN OBJECT-ORIENTED CLASSIFICATION OF IMPACT CRATERS USING LUNAR RECONNAISSANCE ORBITER DATA
Allison Haley Barnes San Francisco, California
2016
Object-based image analysis is used to perform crater detection. High-resolution Lunar
Reconnaissance Orbiter Narrow Angle Camera images are used with a resolution of one
meter per pixel. This CDA detects craters ranging from one meter to one kilometer in
radius. The algorithm is implemented in eCognition, ArcMap, and Python, using
segmentation and object-oriented classification procedures iterating over the scale
parameter and focusing on different levels of brightness. The segmentation uses high
values for the shape and compactness parameters, resulting in a preference for the nearly
circular shapes associated with impact craters. A three-tiered classification scheme is
used which takes advantage of paired patterns of light and shadow. Although many areas
in the image are determined to be illuminated or shadowed, the pairing process filters out
those most likely to be craters. A quality rate of 60.11%, true detection rate of 68.88%,
and false detection rate of 17.48% are achieved.
I certify that the Abstract is a correct representation of the content of this thesis.
Chair, Thesis Committee Date

TABLE OF CONTENTS
List of Tables .......................................................................................................................v
List of Figures .................................................................................................................... vi
Introduction ..........................................................................................................................1
Study Area ...........................................................................................................................7
Methods................................................................................................................................9
Data ..........................................................................................................................9
Pre-Processing........................................................................................................10
Crater Detection Algorithm ...................................................................................11
Results ................................................................................................................................20
Conclusion .........................................................................................................................22
References ..........................................................................................................................23
iv

LIST OF TABLES
Tables Page
1. Literature Comparison...................................................................................................5
2. Class Description.........................................................................................................13
3. Distance Scaling ..........................................................................................................15
4. Scale Coefficient ..........................................................................................................16
5. Accuracy Assessment Count .......................................................................................21
6. Accuracy Assessment Metrics.....................................................................................21
v

LIST OF FIGURES
Figures Page
1. Segmentation…............................................................................................................12
2. Classification at Level One, Two, and Three..............................................................14
3. Algorithm Schematic...................................................................................................17
4. Selected Results...........................................................................................................18
5. Accuracy Assessment Results......................................................................................19
vi

1
1. Introduction
The objective of this research is to detect impact craters on the Moon from Lunar
Reconnaissance Orbiter (LRO) data using object-based image analysis (OBIA). Many
methods have been employed to automatically detect impact craters. Although OBIA is
increasingly used in terrestrial remote sensing applications, it is quite underrepresented in
the crater detection algorithm (CDA) literature. Therefore, this research presents a
unique opportunity to explore the applicability of OBIA to crater detection.
The Earth remains the primary focus of remote sensing. However, data collection
is not limited to Earth. Many extraterrestrial bodies, such as the Moon and Mars, are
subject to an increasing amount of scientific inquiry. As the number of missions
exploring the Solar System continues to grow, the volume of data returned from these
missions has grown astronomically, such that manual data analysis is no longer feasible
(1, 10, 9, 40, 7). If limited to manual analysis, the remote sensing community would only
be able to utilize a minute proportion of the available data (10). As a result, the
development of automatic procedures for analyzing such data is crucial (35, 10, 9, 40, 7).
Mission-acquired data can include panchromatic, multispectral, or hyperspectral imagery,
laser altimetry, and synthetic aperture radar (28, 6). The analysis of mission-acquired
data involves the transformation of raw data into knowledge, usually in the form of a
thematic map (10). This is achieved through classification, which constitutes a
significant field of study within lunar and planetary science (28). Closely related is the
detection of a particular feature of interest, which includes both recognition in the form of
localization and dimensionality and classification as either feature of interest or non-
feature of interest (1, 20).
Collisions between meteoroids, asteroids, or comets with lunar or planetary
surfaces occur despite the astronomical distances that characterize the Solar System (8,
3). These collisions create impact craters, which are concave bowl-shaped topographic
depressions (42, 1, 37, 8, 2, 17). Craters can be classified, from smallest to largest, as
microcraters/pits, small/simple craters, large/complex craters, and multiring basins (42,

2
28, 8, 31, 40). Microcraters/pits, which are sub-centimeter in scale, are formed by
impacts of micrometeoroids or cosmic dust grains (8). Small/simple craters, which tend
to have diameters up to several kilometers, display the well-known bowl shape and
represent the most common type of observed craters (42, 1, 8, 2, 30, 40, 7). In imagery,
these craters tend to display a characteristic pair of highlight and shadow crescents,
resulting from the angle of solar illumination, elevated rims, and inner depression (42, 1,
38, 2). Large/complex craters, which tend to have diameters of tens to hundreds of
kilometers, display flat floors, central peaks, and terraced rims (42, 35, 8, 2, 30,
7). Multiring basins, which are significantly larger than large/complex craters, display
concentric rings (42, 8, 30).
Crater density, quantity, distribution, morphology, and degradation often present
the only viable method for remote estimation of surface age. Craters also reveal
information about historical impact rate, surface geology, stratigraphy, weathering, and
other processes (15, 35, 1, 26, 27, 22, 37, 38, 11, 28, 6, 8, 9, 13, 2, 31, 23, 40, 7, 12,
32). Each of these investigations requires large amounts of data, and thus the manual
detection of craters proves impractical (35, 1, 38, 9, 2, 23, 12). Therefore, automation is
needed to achieve statistically meaningful results (38, 26, 9, 2). Due to their relative
abundance, small craters are natural targets for such approaches, and the automation of
their detection is the focus of this study.
Automated CDAs are a subject of intensive study within lunar and planetary
science, but research has faced a variety of challenges (35, 1, 38, 23, 7, 32, 28, 9,
29). The range of observed crater sizes spans multiple orders of magnitude, so CDAs
must be capable of analyzing imagery or DEMs at multiple scales (4, 20, 9,
2). Additionally, crater morphology increases in complexity with increasing diameter
(42, 35). Rims, the most prominent features of craters, experience erosion
(42). Therefore, CDAs must be capable of detecting crater rims ranging from fresh and
sharp to old and blurry (42, 20, 11, 28, 9, 2, 31, 40, 7, 12). Craters frequently overlap,
which increases the analytical demand on CDAs (11, 9, 2). Lunar and planetary surfaces

3
display heterogeneous morphology, which further complicates the separation of craters
from their background (9, 40, 12). Imagery is obtained at varying spatial resolution and
under varying solar illumination, which can result in the same crater appearing differently
in separate images (42, 20, 9, 2, 40, 12). Creating a CDA capable of serving all
applications is complicated by the varying quality that each necessitates (29).
No currently existing CDA is capable of generating results of sufficient quality to
be utilized for all applications on all lunar or planetary surfaces (1, 20, 2, 30). Despite
the wide range of techniques, all CDAs inherently rely on pattern recognition and some
form of classification (7). As of 2014, 140 CDA articles had been published. Of these
140 articles, 59% are imagery-based; 28% are DEM-based; 11% are both imagery- and
DEM-based; and 2% are based on other data types (31, 32). Edge detection, Hough
transform, and machine learning represent the most common techniques utilized in CDAs
(31). The following paragraphs will discuss a technique rarely applied to CDAs in more
detail, because it will be used in this research.
The last decade and a half witnessed the development of satellite systems capable
of producing very high-resolution imagery (39), with spatial resolutions less than or equal
to one meter (33). While pixel-based classification is effective on small- and medium-
resolution imagery, it is less effective on high-resolution imagery (10, 14, 39, 19, 33, 45),
which presents an overabundance of details. This increases intra-class and decreases
inter-class spectral heterogeneity and reduces the utility of spectral information to
independently distinguish among classes, necessitating the additional use of ancillary
data to perform effective classification (39, 5, 33, 24, 25). Whereas pixel-based
classification only utilizes spectral characteristics of individual pixels, object-based
classification utilizes various characteristics of individual objects (39, 33, 34, 24, 45).
Performing image analysis with objects instead of pixels allows for the utilization of
more data characteristics and more complicated procedures. Object-based image analysis
allows the analyst to easily adjust parameters and repeat the analysis in order to optimize
the result (39). Therefore, the recent technological advancement in satellite systems
4
instigated a transformation of the basic entity of image analysis from pixels to objects and
an expansion of the generally utilized data beyond solely spectral information. Even
though spectral information is the most frequently utilized data in image classification,
the addition of ancillary data improves classification performance (5). Whereas pixel-
based classification can produce results plagued by the salt-and-pepper effect, object-
based classification can reduce the noise that frequently characterizes high spatial
resolution data (33). The result of an object-based classification more closely resembles
that of visual interpretation, mimicking the human recognition process (18, 39, 33, 34,
45).
The procedure of OBIA involves pre-processing, segmentation, object-based
classification, post-classification, and accuracy assessment (14, 39, 24). Pre-processing
can include radiometric, geometric, and atmospheric corrections, as well as registration,
orthorectification, and lidar interpolation (39). Segmentation partitions the image into
non-overlapping objects, or groups of spatially adjacent and homogeneous pixels, and
determines the spectral, geometric, contextual, textural, conceptual, morphologic, and
temporal attributes of the objects (14, 18, 39, 5, 3, 21, 24). Segmentation relies on certain
parameters, including weight, scale, shape, and compactness. Since segmentation quality
depends on parameter selection, some researchers use trial-and-error while others use
machine learning to optimize these parameters. Object-based classification then groups
the objects into classes based on these attributes (14, 39, 3, 24). Segmentation and
object-based classification are closely related, in that the quality of the latter directly
depends on the quality of the former (14, 39, 44). OBIA can produce results in the form
of raster or vector data, specifically polygons, which allows for the utilization of GIS
operations and simplifies post-processing (39, 33). Post-classification can involve
manual confirmation of results and elimination of errors, field inspection, or reference
source comparison, while accuracy assessment quantifies the quality of the result (39).
Table 1 presents the only four instances of object-based classification that have
occurred in the CDA literature (4, 43, 10, 41). The first study utilizes a DEM derived

5
from data acquired by the Mars Orbiter Laser Altimeter on the Mars Global Surveyor
spacecraft, which has an approximate resolution of 500 meters per pixel. This study
achieves a quality rate of 61% and a true detection rate of 74% (4). The second study
utilizes lunar imagery obtained by the Ultraviolet/Visible Camera on the Clementine
satellite, which has an approximate resolution of 100 meters per pixel. Although this
study does not report a quality rate or true detection rate, it validates its results through
the use of a formula that determines surface age from the number of craters and then
comparison of this formula-derived age with a reference age (43). The third study
utilizes a DEM derived from data acquired by the Mars Orbiter Laser Altimeter on the
Mars Global Surveyor spacecraft, which has an approximate resolution of 500 meters per
pixel. This study achieves overall accuracies ranging from 40% to 90%, depending on
the test area and classifier utilized (10). The fourth study utilizes a DEM derived from
lunar data acquired by the CCD stereo camera on the Chang’E-1 satellite, which has an
approximate resolution of 500 meters per pixel. This study achieves overall accuracies
ranging from 65% to 78%, depending on the test area and classifier utilized (41).
Table 1: Literature Comparison. Instances and characteristics of OBIA in CDA
literature.

6
The resolution of the data utilized by the CDA determines the minimum crater
size identified. While the resolution of the data utilized in the above four studies ranges
from 100 to 500 meters per pixel, the resolution of the data utilized in this CDA is one
meter per pixel. Whereas the minimum crater size detected by the above four studies is
approximately one kilometer in radius, the minimum crater size detected by this CDA is
approximately one meter in radius.

7
2. Study Area
The study area for this project is on the Moon. Although this CDA could be
applied to any LROC NAC image, the area used for the accuracy assessment is a subset
of the image with product name M114227172LC and is located at -11.1 degrees latitude
and 318.4 degrees longitude. The area is 5.7 kilometers by 4.4 kilometers, which
constitutes a total area of 25 square kilometers. This particular area was selected over
other possible areas because it contains a wide range of crater sizes.
The lunar and planetary science community theorizes that the Moon was formed
approximately 4.5 billion years ago as a result of a collision between a Mars-sized
impactor and Earth. With a radius of approximately 1,737 kilometers, the Moon displays
the following average values: albedo (0.113), crustal density (2.85 grams per cubic
centimeter), surface temperature (277 Kelvin), and surface pressure (3*10-15 bars). The
Moon’s atmosphere, which consists of helium, argon, sodium, and potassium, is so
tenuous that it resembles a vacuum and was partially formed by the continual
bombardment of impactors over billions of years. Although volcanism and tectonics
acted on the Moon, most activity ceased approximately 3 billion years ago. The only
active processes affecting the Moon are impact cratering and tidally- and thermally-
induced moonquakes.
The lunar surface can be classified into two groups: the bright highlands (covering
80% of the surface) and the dark maria (covering 16% of the surface). The acquisition of
382 kilograms of lunar rock samples by the Apollo and Luna missions allowed scientists
to determine absolute ages via radioisotope dating. While the highlands are
approximately 4.4 billion years old, the maria are approximately 3.5 billion years old.
The regolith, which was created by the continual bombardment of impactors over billions
of years, is approximately fifteen meters deep in the highlands and approximately two to
eight meters deep in the maria. The maria are younger than the highlands because they
constitute subsurface material subsequently brought to the surface via volcanism.
Although volcanic features (e.g., basins and mountains) and tectonic features (e.g.,

8
grabens and horsts) are visible on the surface, impact craters represent the most dominant
feature on the surface (42, 11, 8).
The lunar surface is nearly saturated with craters; however, the highlands are
more heavily cratered (8, 17). Considering that the highlands were determined to be
significantly older via radioisotope dating (8), this evidence supports the theory that
crater density and surface age display a direct relationship. The historic cratering rate can
be determined from the radioisotope-dated samples and the crater size-frequency
distribution (8). The historic cratering rate indicates that the Moon experienced two
periods of heightened cratering rates, referred to as the early bombardment era
(approximately 4.4 billion years ago) and the late heavy bombardment era (approximately
3.8 to 3.9 billion years ago) (11, 8). Lunar impact craters range in size from micrometers
to hundreds of kilometers, with a transition size between simple and complex craters of
approximately twelve kilometers (42, 8). Large craters tend to concentrate in the
highlands, and small craters tend to concentrate in the maria (17).

9
3. Methods
3.1. Data
The data utilized in this project were acquired by the Lunar Reconnaissance
Orbiter Camera (LROC) and are available to the public for free. The LRO spacecraft is
currently in a polar orbit around the Moon at altitudes ranging from 50 to 200
kilometers. Its mission objectives include assessment of potential landing sites and the
creation of accurate, high-resolution thematic maps, both of which are assisted by
CDAs. LROC contains two Narrow Angle Cameras (NACs). They are narrow-angle
push-broom imaging cameras that capture panchromatic imagery (400 to 750
nanometers) at an approximate resolution of 0.5 meters per pixel over a 5-kilometer
swath (36, 16).

10
3.2. Pre-Processing
To transform the raw data into a format appropriate for use in the eCognition-
based CDA, georeferencing and standardization are performed in
ArcMap. Georeferencing applies a coordinate system to the data so that accuracy
assessment can be reliably performed and output data can be used in other
applications. Standardization is necessary to account for the variety of factors that can
influence the appearance of the image. These include the differing reflectivity of varying
soil types and the changing angle and intensity of the sun from image to image.
Images are georeferenced to the Geographic Coordinate System
GCS_Moon_2000 with Datum D_Moon_2000 within ArcMap. The four vertices of the
coverage shapefiles (which are already georeferenced to the specified coordinate system)
are used as control points in the georeferencing process for the calibrated imagery. Once
the four control points are generated, the image is rectified using nearest neighbor and a
first-order polynomial transformation.
Due to the vast coverage of each LROC NAC image, a single image is determined
sufficient to be the input for this CDA. Multiple images could be mosaicked together,
and the algorithm applied to the result. However, this would introduce additional
complexity and could obscure the results of the novel methods.
Standardization of the data is performed so that the inputs to the CDA are
consistent regardless of the source image. Therefore, identical classification thresholds
can be used. The standardization step operates under the assumption that the radiance
values of the LROC NAC images follow a normal distribution. This step transforms the
normal distribution into a standardized normal distribution with a mean of 0 and a
standard deviation of 100 by using Map Algebra. These values are used instead of the
standard normal, mean of 0 and standard deviation of 1, because the eCognition
segmentation algorithm functions differently for different standard deviations.

11
3.3. Crater Detection Algorithm
The small/simple crater class is distinguished from non-craters in an image by a
distinctive pattern of dark and light crescents. Figure 1a shows an example of a small
crater featuring this pattern. These crescents occur from oblique illumination by the sun
across a well-defined crater ridge. The side of the crater further from the sun is
illuminated more brightly than the surrounding soil due to a more direct angle, while the
other side sits in the shadow. This specific brightness profile can be exploited by object-
based image analysis for crater detection.
Segmentation is applied to the image in eCognition. This splits the image into a
collection of objects, the borders of which delineate different clusters of pixels with
similar properties. In this instance, the standardized brightness is used as the defining
property. Shape and compactness parameters, which in eCognition denote the preference
for roundness over homogeneity of segments, are both set to maximum since the shapes
this CDA aims to detect are near circular. This includes craters resulting from oblique
impacts, which are somewhat elliptical. Because the segmentation process relies on a
relative weighting scheme between shape and homogeneity, it is robust to these
irregularities, and such craters do not pose an issue. The scale parameter can vary the
average size of these segments, which can adjust the result to be more appropriate for
different sizes of craters. To make the CDA applicable to a large range of crater sizes,
iteration is performed over different values of this parameter. Because of the rotational
symmetry of segmentation in eCognition, this CDA is independent of solar illumination
angle. However, because of this symmetry a near circular peak can theoretically be
detected as a crater in this CDA. Such features are relatively rare on the Moon, and the
study area did not include them, but this could be a source of error in other areas. Figure
1b shows the result of segmentation at a single scale on the example area.

12
Figure 1: Segmentation. A crater is taken through the processing steps in order to
demonstrate the detection process in eCognition.
(a) One crater is visible and surrounded by noise.
(b) The area from (a) is segmented, with each side of the crater constituting one segment.
For every segmentation, each of which corresponds to a particular scale
parameter, a three-step classification scheme determines which segments depict a
crater. On the first level of classification, segments are catalogued as Light, Medium, or
Dark. Medium encompasses objects with standardized brightness values within one
standard deviation from the mean. Light and Dark denote objects with standardized
brightness values at least one standard deviation greater than or less than the mean,
respectively. Figure 2a shows the example area classified at level one. The actual crater
is identified as Light and Dark, but there are also Dark regions that do not correspond to
craters.

13
Light or Dark segments are further analyzed in level two. If a Light segment is
within a specified distance from a Dark segment, then that segment is labeled as Light
Crater. An analogous process classifies Dark Crater. This parity of Light and Dark
segments is the key distinguishing characteristic of a crater and lends the CDA much of
its efficacy. Figure 2b shows the example area classified in level two. The non-crater
Dark segments of level one have been eliminated, as they are too distant from the Light
segment. However, the crater remains classified as two separate classes.
In the classification of level three, Light Crater and Dark Crater segments are
combined into Crater, while all other segments are combined into No Crater. Table 2
shows the rules used in eCognition to define these classes. Figure 2c shows the example
area classified in level three. The crater is effectively identified and unified.
Table 2: Class Description.
14
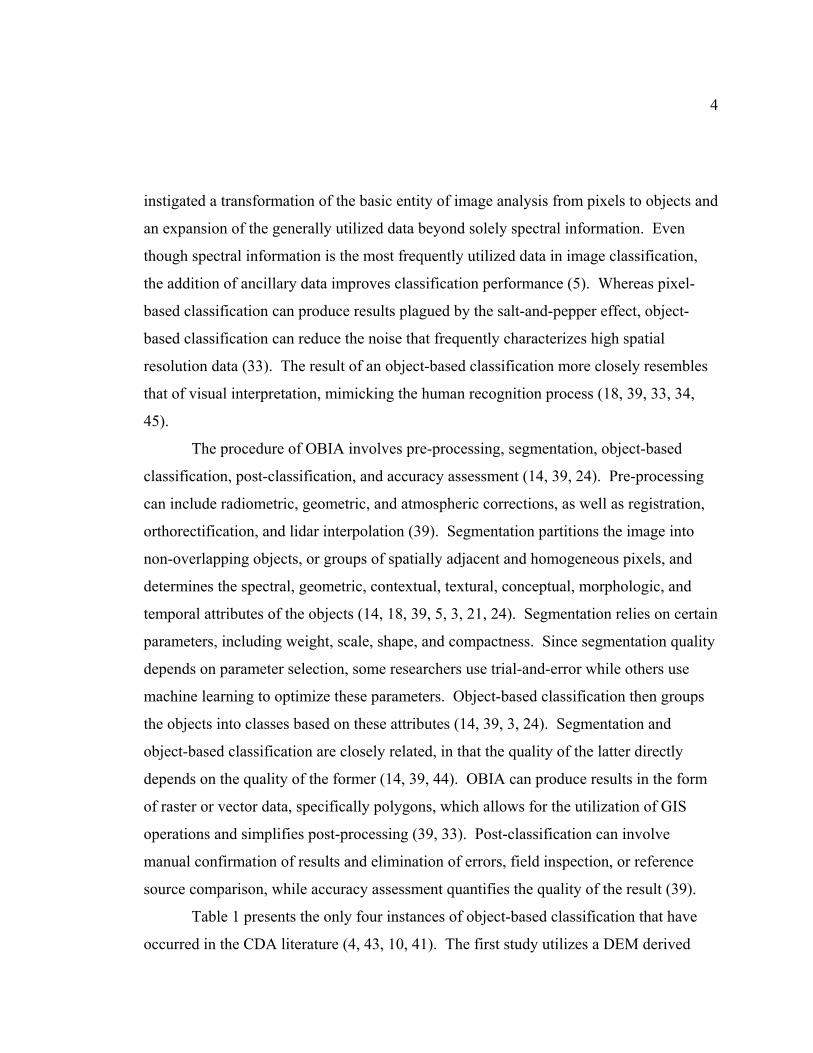
Figure 2: Classification at Level One, Two, and Three.
(a) Level 1. The crater is classified as Dark or Light, while most of the area is classified
as Medium. However, there are areas classified as Dark that are not craters.
(b) Level 2. The light and dark sides of the crater are classified as Light Crater and
Dark Crater, respectively. The segments previously classified as Dark are now
Unclassified, due to the distance scaling (Table 3).
(c) Level 3. The final classification result for the example crater. Segments classified as
No Crater or Crater are merged to produce this final result.
15
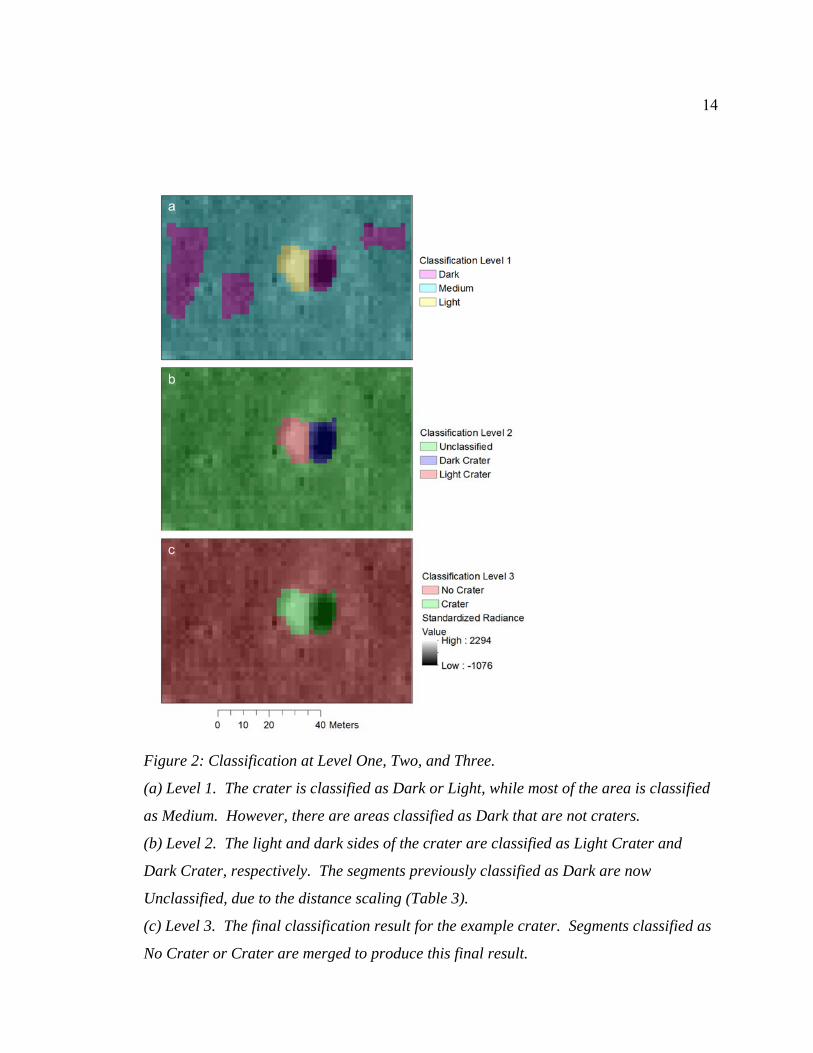
At level two, a particular distance is used as a threshold. This value determines
how close Light and Dark segments need to be to each other in order to be classified as
Light Crater or Dark Crater. In eCognition, the distance between two objects is a
centroid distance. Since iteration is performed over the scale parameter, the distance
between adjacent objects will vary throughout the process. Therefore, this threshold
distance needs to vary along with the scale parameter throughout the iteration. The
distances between segments constituting actual craters of various sizes are measured
manually. Appropriate threshold values are determined to maximize true positives while
minimizing false negatives. Table 3 shows the value pairs used.
Table 3: Distance Scaling. Distance between segments at each scale parameter.

16
The OBIA algorithm in eCognition is shown in Figure 3. Using this algorithm,
eCognition produces one output map for each scale parameter. These maps are each
exported as color-coded TIFF files. Then, a python script performs a weighted overlay
process in ArcMap combining the 100 layers into a single result. Different weights are
used for outputs produced using different scale parameters due to the relative importance
of small craters, which are only detected with lower scale parameters. These weights are
manually optimized in order to produce similar crater detection performance over the
whole range of crater sizes this CDA aims to detect. Table 4 shows the weights used for
each scale parameter.
Table 4: Scale Coefficient. Coefficient assigned to the result of each scale parameter in
weighted overlay process.

17
Figure 3: Algorithm Schematic. The steps taken in eCognition to produce 100
classification results that are later input into the weighted overlay process.
18
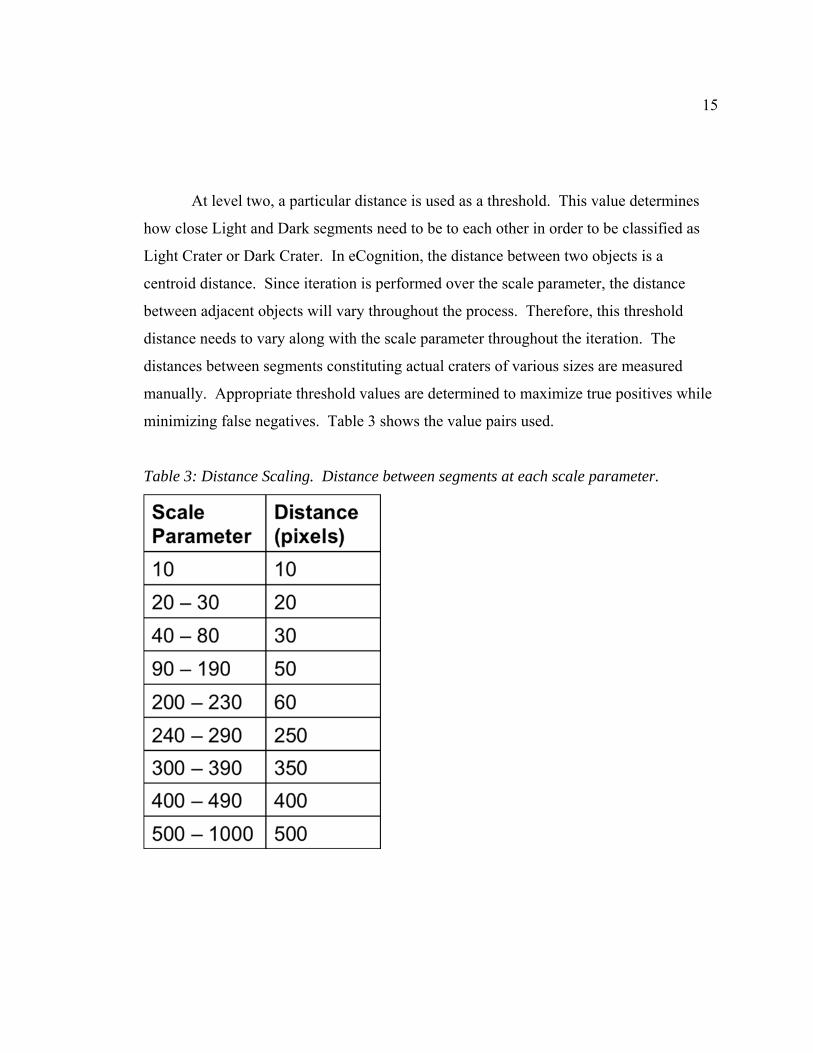
The final result of this algorithm is a single raster map, which assigns a value to
each pixel corresponding to the likelihood that pixel is part of a crater. Figures 4 and 5
show these results at differing levels of zoom. Figure 5 is the full output of the algorithm
on the entire study area and is the foundation of the accuracy assessment to follow.
Figure 4: Selected Results. While Figure 2c presents the final result for one scale
parameter value, the process depicted in Figure 3 outputs 100 classification results, with
one at each scale parameter. This map provides a close-up of the result of the weighted
overlay process, which outputs a raster referred to as Crater Score, which indicates the
likelihood of a pixel being a crater.

19
Figure 5: Accuracy Assessment Results.

20
4. Results
Although the CDA community lacks a standard method of assessing the quality of
results (23), certain metrics frequently occur in the literature. In order to assess the
quality of results, ground truth is necessary (1, 4, 28). Although some researchers utilize
existing crater catalogs as ground truth, others create their own ground truth by manually
identifying craters within their study area (4, 20, 37, 28). True detection rate (TDR) and
false detection rate (FDR) are frequently used and can be calculated using true positive
(TP), false negative (FN), and false positive (FP) as TDR=TP/(TP+FN) and
FDR=FP/(TP+FP) (15, 1, 4, 20, 22, 38, 29, 23, 40). As TDR increases, so does FDR
(20). Another frequently used metric is quality rate (QR), which describes overall
performance and can be calculated as QR=TP/(TP+FP+FN) (15, 4, 38, 29, 40). When
used alone, any of the above metrics can be misleading. Therefore, it is recommended to
provide several accuracy metrics in order to assess multiple aspects of the result
(7). TDR, FDR, and QR are all calculated for this study.
For accuracy assessment, craters with a radius less than 1.5 meters are not
considered, even though the CDA does detect craters smaller than this. The upper bound
in size is determined by the size of the image, since no mosaicking was done. However,
if mosaicking were done, then the CDA would theoretically be capable of detecting larger
craters. Any craters that are not mostly contained within the study area are not
considered in the accuracy assessment. If a detected crater is over 1.5 times the size of
the actual crater, then the excess portion is considered a false positive and the actual
portion is considered a true positive. Each false positive is a contiguous area. While
some false positives are spatially contiguous with true positives, other false positives are
not. Regardless of whether they are the former or the latter case, they are each counted as
one false positive. Any Crater Score above zero indicates a detected crater. If the
majority of a crater is detected, it counts as a true positive. Otherwise, it counts as a false
negative. True negatives are inherently uncountable.

21
Existing crater catalogs do not contain craters as small as the craters this CDA
detects, and no other ground truth exists. Therefore, this study area’s ground truth is
established by manually picking craters in ArcMap (Table 5). All craters in the study
area that conform to the above criteria are used, facilitating the determination of true
positives, false positives, and false negatives. The quality rate is calculated to be
60.11%. The true detection rate is 68.88%, and the false detection rate is 17.48% (Table
6). This is a successful result for a new CDA, and the accuracy is similar to other studies
that utilize DEMs (Table 1). Since the LROC NAC imagery provides information at a
much higher resolution, this CDA is capable of detecting small, previously undetected
craters. Therefore, this is an improvement on previous OBIA CDAs.
Table 5: Accuracy Assessment Count. Number of true positives, false negatives, and
false positives in study area.
Table 6: Accuracy Assessment Metrics. Quality rate, true detection rate, and false
detection rate for study area.
22
5. Conclusion
This study uses object-based image analysis in ArcMap, eCognition, and Python
to create a crater detection algorithm applied to the Moon. A novel technique is
developed, utilizing the distinctive appearance of adjacent light and dark crescents to
identify craters. The iteration of this technique over multiple scale parameters facilitates
the detection of a range of crater sizes from roughly one meter to one kilometer. The
quality rating of 60.11% is comparable to other results in the literature (Table 1), but this
project makes a significant step forward by pioneering this method for high-resolution
imagery.
Future work could focus on optimizing the weights associated with each scale
parameter used in the weighted overlay step. It could also utilize mosaicking to extend
the algorithm to detect craters larger than the size of the input images. More localized
image standardization would eliminate many of the false positives present due to soil
heterogeneity. Each of these refinements would improve the performance of this
CDA. As high-resolution imagery becomes available on other lunar and planetary
bodies, this technique could be applied. With these refinements to performance and
additional applications, a further step could be taken towards achieving a universal CDA.

23
6. References
1. Bandeira, L., J. Saraiva, and P. Pina, 2007: Impact Crater Recognition on Mars Based
on a Probability Volume Created by Template Matching. IEEE Transactions on
Geoscience and Remote Sensing, 45(12), 4008-4015.
2. Bandeira, L., W. Ding, and T. F. Stepinski, 2012: Detection of sub-kilometer craters in
high resolution planetary images using shape and texture features. Advances in
Space Research, 49, 64-74.
3. Bertani, T. C., D. F. Rossetti, and P. C. G. Albuquerque, 2013: Object-based
classification of vegetation and terrain topography in Southwestern Amazonia
(Brazil) as a tool for detecting ancient fluvial geomorphic features. Computers
and Geosciences, 60, 41-50.
4. Bue, B. D. and T. F. Stepinski, 2007: Machine Detection of Martian Impact Craters
From Digital Topography Data. IEEE Transactions on Geoscience and Remote
Sensing, 45(1), 265-274.
5. Bujan, S., E. Gonzalez-Ferreiro, F. Reyes-Bueno, L. Barreiro-Fernandez, R. Crecente,
and D. Miranda, 2012: Land Use Classification from Lidar Data and Ortho-
Images in a Rural Area. The Photogrammetric Record, 27(140), 401-422.
6. Burl, M. C. and P. G. Wetzler, 2011: Onboard object recognition for planetary
exploration. Machine Learning, 84, 341-367.
7. Cohen, J. P. and W. Ding, 2014: Crater detection via genetic search methods to reduce
image features. Advances in Space Research, 53, 1768-1782.
8. De Pater, I. and J. J. Lissauer, 2011: Planetary Sciences. Cambridge University Press,
Second Edition.
9. Ding, W., T. F. Stepinski, Y. Mu, L. Bandeira, R. Ricardo, Y. Wu, Z. Lu, T. Cao, and
X. Wu, 2011: Subkilometer Crater Discovery with Boosting and Transfer
Learning. ACM Transactions on Intelligent Systems and Technology, 2(4), 1-22.

24
10. Ghosh, S., T. F. Stepinski, and R. Vilalta, 2010: Automatic Annotation of Planetary
Surfaces With Geomorphic Labels. IEEE Transactions on Geoscience and
Remote Sensing, 48(1), 175-185.
11. Head, J. W., C. I. Fassett, S. J. Kadish, D. E. Smith, M. T. Zuber, G. A. Neumann,
and E. Mazarico, 2010: Global Distribution of Large Lunar Craters: Implications
for Resurfacing and Impactor Populations. Science, 329, 1504-1507.
12. Jin, S. and T. Zhang, 2014: Automatic detection of impact craters on Mars using a
modified adaboosting method. Planetary and Space Science, 99, 112-117.
13. Kadish, S. J., C. I. Fassett, J. W. Head, D. E. Smith, M. T. Zuber, G. A. Neumann,
and E. Mazarico, 2011: A Global Catalog of Large Lunar Craters (≥20 km) from
the Lunar Orbiter Laser Altimeter. 42nd Lunar and Planetary Science
Conference, 1006-1007.
14. Ke, Y., L. J. Quackenbush, and J. Im, 2010: Synergistic use of QuickBird
multispectral imagery and LIDAR data for object-based forest species
classification. Remote Sensing of Environment, 114, 1141-1154.
15. Kim, J. R., J. P. Muller, S. V. Gasselt, J. G. Morley, and G. Neukum, 2005:
Automated Crater Detection, A New Tool for Mars Cartography and Chronology.
Photogrammetric Engineering and Remote Sensing, 71(10), 1205-1217.
16. “Lunar Reconnaissance Orbiter.” National Aeronautics and Space Administration –
Goddard Space Flight Center. http://lro.gsfc.nasa.gov/index.html. (accessed
December 10, 2014).
17. Luo, L., L. Mu, X. Wang, C. Li, W. Ji, J. Zhao, and H. Cai, 2013: Global detection of
large lunar craters based on the CE-1 digital elevation model. Frontiers in Earth
Science, 7(4), 456-464.
18. Martha, T. R., N. Kerle, V. Jetten, C. J. V. Westen, and K. V. Kumar, 2010:
Characterizing spectral, spatial and morphometric properties of landslides for
semi-automatic detection using object-oriented methods. Geomorphology, 116,
24-36.

25
19. Martha, T. R., N. Kerle, C. J. V. Westen, V. Jetten, and K. V. Kumar, 2012: Object-
oriented analysis of multi-temporal panchromatic images for creation of historical
landslide inventories. ISPRS Journal of Photogrammetry and Remote Sensing,
67, 105-119.
20. Martins, R., P. Pina, J. S. Marques, and M. Silveira, 2009: Crater Detection by a
Boosting Approach. IEEE Geoscience and Remote Sensing Letters, 6(1), 127-
131.
21. Mehta, A., O. Dikshit, and K. Venkataramani, 2014: Integration of high-resolution
imagery and LiDAR data for object-based classification of urban area. Geocarto
International, 29(4), 418-432.
22. Meng, D., C. Yunfeng, and W. Qingxian, 2009: Method of Passive Image Based
Crater Autonomous Detection. Chinese Journal of Aeronautics, 22, 301-306.
23. Meng, D., C. Yunfeng, and W. Qingxian, 2013: Novel approach of crater detection
by crater candidate region selection and matrix-pattern-oriented least squares
support vector machine. Chinese Journal of Aeronautics, 26(2), 385-393.
24. Mullerova, J., J. Pergl, and P. Pysek, 2013: Remote sensing as a tool for monitoring
plant invasions: Testing the effects of data resolution and image classification
approach on the detection of a model plant species Heracleum mantegazzianum
(giant hogweed). International Journal of Applied Earth Observation and
Geoinformation, 25, 55-65.
25. Rosa, M. F. and D. A. Stow, 2014: Mapping fuels at the wildland-urban interface
using color ortho-images and LiDAR data. Geocarto International, 29(5), 570-
588.
26. Salamuniccar, G. and S. Loncaric, 2008: Open framework for objective evaluation of
crater detection algorithms with first test-field subsystem based on MOLA data.
Advances in Space Research, 42, 6-19.

26
27. Salamuniccar, G. and S. Loncaric, 2008: GT-57633 catalogue of Martian impact
craters developed for evaluation of crater detection algorithms. Planetary and
Space Science, 56, 1992-2008.
28. Salamuniccar, G. and S. Loncaric, 2010: Method for Crater Detection From Martian
Digital Topography Data Using Gradient Value/Orientation, Morphometry, Vote
Analysis, Slip Tuning, and Calibration. IEEE Transactions on Geoscience and
Remote Sensing, 48(5), 2317-2329.
29. Salamuniccar, G., S. Loncaric, P. Pina, L. Bandeira, and J. Saraiva, 2011:
MA130301GT catalogue of Martian impact craters and advanced evaluation of
crater detection algorithms using diverse topography and image datasets.
Planetary and Space Science, 59, 111-131.
30. Salamuniccar, G., S. Loncaric, D. Vinkovic, D. Vucina, M. Gomercic, I. Pehnec, M.
Vojkovic, and T. Hercigonja, 2012: Test-field for evaluation of laboratory craters
using a Crater Shape-based interpolation crater detection algorithm and
comparison with Martian and Lunar impact craters. Planetary and Space Science,
71, 106-118.
31. Salamuniccar, G. and S. Loncaric, 2012: Crater detection algorithms: a survey of the
first decade of intensive research. Horizons in Earth Science Research, 8, 93-123.
32. Salamuniccar, G., S. Loncaric, A. Grumpe, and C. Wohler, 2014: Hybrid method for
crater detection based on topography reconstruction from optical images and the
new LU78287GT catalogue of Lunar impact craters. Advances in Space
Research, 53, 1783-1797.
33. Salehi, B., Y. Zhang, M. Zhong, and V. Dey, 2012: Object-Based Classification of
Urban Areas Using VHR Imagery and Height Points Ancillary Data. Remote
Sensing, 4, 2256-2276.

27
34. Sasaki, T., J. Imanishi, K. Ioki, Y. Morimoto, and K. Kitada, 2012: Object-based
classification of land cover and tree species by integrating airborne LiDAR and
high spatial resolution imagery data. Landscape and Ecological Engineering, 8,
157-171.
35. Sawabe, Y., T. Matsunaga, and S. Rokugawa, 2006: Automated detection and
classification of lunar craters using multiple approaches. Advances in Space
Research, 37, 21-27.
36. Smith, D. E., M. T. Zuber, G. A. Neumann, F. G. Lemoine, E. Mazarico, M. H.
Torrence, J. F. McGarry, D. D. Rowlands, J. W. Head, T. H. Duxbury, O.
Aharonson, P. G. Lucey, M. S. Robinson, O. S. Barnouin, J. F. Cavanaugh, X.
Sun, P. Liiva, D. Mao, J. C. Smith, and A. E. Bartels, 2010: Initial observations
from the Lunar Orbiter Laser Altimeter (LOLA). Geophysical Research Letters,
37, 18204-18209.
37. Stepinski, T. F., M. P. Mendenhall, and B. D. Bue, 2009: Machine cataloging of
impact craters on Mars. Icarus, 203, 77-87.
38. Urbach, E. R. and T. F. Stepinski, 2009: Automatic detection of sub-km craters in
high resolution planetary images. Planetary and Space Science, 57, 880-887.
39. Veljanovski, T., U. Kanjir, and K. Ostir, 2011: Object-Based Image Analysis of
Remote Sensing Data. Geodetski vestnik, 55(4), 665-688.
40. Vijayan, S., K. Vani, and S. Sanjeevi, 2013: Crater detection, classification and
contextual information extraction in lunar images using a novel algorithm.
Icarus, 226, 798-815.
41. Wan, C., W. M. Cheng, Z. P. Zhou, S. M. Zhao, and Y. Xia, 2012: Automatic
extraction of lunar impact craters from Chang’E-1 satellite photographs. Science
China – Physics, Mechanics and Astronomy, 55(1), 162-169.
42. Westfall, J. E., 2000: Atlas of the Lunar Terminator. Cambridge University Press,
30-43.

28
43. Yue, Z. Y, J. Z. Liu, and G. G. Wu, 2008: Automated detection of lunar craters based
on object-oriented approach. Chinese Science Bulletin, 53(23), 3699-3704.
44. Zhang, D., C. Zhang, R. Cromley, D. Travis, and D. Civco, 2012: An Object-Based
Method for Contrail Detection in AVHRR Satellite Images. GIScience and
Remote Sensing, 49(3), 412-427.
45. Ziaei, Z., B. Pradhan, and S. B. Mansor, 2013: A rule-based parameter aided with
object-based classification approach for extraction of building and roads from
WorldView-2 images. Geocarto International, 29(5), 554-569.