an overview of india's urbanization, urban economic growth and urban equity
TRANSCRIPT

MPRAMunich Personal RePEc Archive
An overview of India’s Urbanization,Urban Economic Growth and UrbanEquity
Sabyasachi Tripathi
Institute for Social and Economic Change
March 2013
Online at http://mpra.ub.uni-muenchen.de/45537/MPRA Paper No. 45537, posted 26. March 2013 10:42 UTC

1
An overview of India’s Urbanization, Urban Economic
Growth and Urban Equity
Sabyasachi Tripathi
Ph.D. Scholar in Economics at Centre for Economics Studies and Policy
Institute for Social and Economic Change
Bangalore -560072, India
Email: [email protected]
Abstract:
The main objective of this paper is to analyze the recent past trends and patterns of urbanization,
urban economic growth, and urban equity measured by urban poverty and inequality in India. In
addition, it reviews the different urban development policies and programmes which are
undertaken in different Plan Periods in India. The analysis shows that higher rate of urbanization
is associated with higher economic growth, lower level of poverty and higher extent of inequality
in urban India. Finally, the study suggests that Indian government needs to speed up the
urbanization rate as it contributes higher share of national GDP by reducing urban poverty and
inequality.
Key Words: Urbanization, Economic Growth, Inequality, Poverty, Urban India
JEL Classification: R11, R12, R58
Acknowledgement:
This paper is the part of my Doctoral Dissertation. I would like to thank my Ph.D., thesis
supervisor Prof. M.R.Narayana for his constant guidance, inspiration, valuable comments and
suggestions.

2
1. Introduction
One of the most recent phenomena observed in India is the formation of urban
agglomerations, which is defined as geographic concentration of urban population and economic
activities. This implies that urban agglomeration includes but not equal to urbanization. Urban
India has been experiencing a steady increase in the share of its urban population, emergence of
new cities or towns, sizeable contribution to the country’s national income, reduction of poverty,
increasing inequality, and lower level of inclusive growth. Urban population expansion is due to
natural growth of population (accounted 59.4 percent in 1991-01); emergence of new cities
(accounted 6.2 percent in 1991-01); rural to urban migration (accounted 21 percent in 1991-01);
and reclassification of rural areas as urban (accounted 13 percent in 1991-01) [Kundu, 2006].
The main focus of this paper is to describe the recent past trends and patterns of India’s
urbanization from 1961 to 2011 and urban economic growth from 1970-71 to 2004-05. In
addition, nature and extent of level of urban poverty and inequality have been described at all
India level. Finally, a critical review of the urban policies and programmes are described as they
are related to promotion of urban agglomeration, urban economic growth and urban equity in
India. These descriptions are intended to provide an overview of India’s urbanization, urban
economic growth and urban equity.
We describe urbanization trends from Census period 1961 to 2011. Urban economic growth is
described from 1971 to latest available years. To measure urban equity in terms of urban poverty
and inequality, the year 2009-10 is specifically chosen for the availability of latest 66th Round of
National Sample Survey Organisation’s (NSSO) Household Consumer Expenditure Survey in
India for that year. The consideration of study periods is mainly based on following reasons:
First, the availability of full information for the various urban indicators used in this paper.
Second, as for the first time 1961 Census has adopted the uniform and rigid definition of urban
areas. Third, to present the recent past scenarios of urbanization for the relevant policy
implications.
The rest of the paper is organized as follows. Section 2 and 3 present the trends and pattern of
urbanization and economic growth in urban India over the different decades, respectively.
Section 4 discusses about urban equity by measuring the poverty and inequality in urban India.

3
Section 5 critically reviews the major government policies for promotion of urban
agglomeration, urban economic growth and urban equity in India in different Plan Periods.
Section 6 summarizes the major conclusions of this paper.
2. Trends and patterns of urbanization in India
Urbanization is measured by two ways: First, level and growth of urban share of total
population and its distribution by size classes of cities and towns. This is called demographic
approach. Second, changes in number and growth of urban centers and an expansion of
geographical boundaries of existing urban areas. This is called geographical approach.
2.1 Demographic approach
Table 1 shows that the annual exponential growth rate of urban population has increased
from 3.23 percent during 1961-71 to 3.79 percent during 1971-81, but declined to 2.75 percent
during 1991-2001. The decline in growth rate was slightly reversed back during 2001-2011.
During the same period, the share of urban population in the total increased from 17.97 percent
in 1961 to 31.16 percent in 2011. This indicates that an increasing trend of India’s urbanization
over the decades.
Table 1: Trends in India’s urbanization: 1961-2011
Census
Year
Urban population (in
million)
Percentage urban Annual exponential growth
rate (%)
1961 78.94 17.97 -
1971 209.11 19.91 3.23
1981 159.46 23.34 3.79
1991 217.18 25.72 3.09
2001 286.12 27.86 2.75
2011 377.10 31.16 2.76 Note: As the 1981 Census was not conducted in Assam, and the 1991 Census was not held in Jammu and
Kashmir, the population of India includes projected figures for these states in those periods.
Source: Bhagat (2011).
As per the World Urbanization Prospects: 2011 Revision, the percentage of total urban
population in India is 30.9 in 2010, which is lower than the developed countries like the United
States of America (82.1 per cent) and Japan (90.5 percent) during the same year. It is also lower

4
than in other fast growing developing countries, such as, China (49.2 per cent), Brazil (84.3), and
Russian Federation (73.7 per cent) in 2010.
Figure 1 illustrates that India’s urban population is mainly concentrated in and around class I
cities. The percentage share of urban population in class I cities has increased from 51.42 in 1961
to 68.7 in 2001. On the other hand, classes II to VI cities have registered a decreasing rate of
urban population growth (percentage). For instance, the percentage share of urban population in
class IV cities decreased from 12.77 in 1961 to 6.84 in 2001.
Figure 1: Distribution of urban population by size class of cities and towns
Notes: Based on population size Census classifies urban centres in to following six categories.
Class I (100,000 or more), Class II (from 50,000 to 99,999), Class III (from 20,000 to 49,999)
Class IV (from 10,000 to 19,999), Class V (from 5000 to 9999), and Class VI (below 5000).
Source: Author’s estimation based on Indian Census data of various years.
Due to lack of Census population data in 2005, the study also considers city population data
projected by the United Nations, World Urbanization Prospects (WUP, 2009 revision). It
provides population figures for 59 large agglomerations with 750,000 or more inhabitants from
1950 to 2025 with five years interval. Figure 2 illustrates that the compound annual growth rate
(CAGR) is highest for Surat (5.68 per cent) and lowest for Thiruvananthapuram (0.93 per cent)
during the time-span 2000 to 2005. The average CAGR is about 2.93 percent. Among the six

5
mega cities (with population over five million), Delhi (4.38 per cent) ranked at the top of five
high population growth cities while Chennai (1.72 per cent) ranked lowest among the five
population growth cities. The results explain an increasing growth rate of city population from
2000 to 2005.
Figure 2: CAGR of city population from 2000 to 2005
Source: Author’s estimation based on data from the United Nations (2009).
2.2 Geographic approach
Table 2 shows that the number of Census towns increased from 1362 in 2001 to 3894 in 2011 –
an increase of about 186 percent. On the other hand, the number of statutory towns registered a
marginal increase of about 6.37 percent during 2001-2011. The number of urban agglomerations
has increased from 384 in 2001 to 475 in 2011, an increase of about 23.7 percent. The results
indicate an increasing trend of number of urban agglomerations (UAs) /towns and out growths
(OGs) from 2001 to 2011.

6
Table 2: Number of UAs/Towns and out growths
Sr.
No.
Type of Towns 2001
Census
2011
Census Percentage change
1 Statutory Towns 3799 4041 6.37
2 Census Towns 1362 3894 185.9
3 Urban Agglomerations 384 475 23.7
4 Out Growths 962 981 1.98 Notes: The following definitions are based on Census of India 2011.
1. All places within a municipality, corporation, cantonment board or notified town area committee, etc. are
reckoned as Statutory Towns).
2. All other places which satisfied the following criteria (known as Census Town):
2.1 A minimum population of 5,000
2.2 At least 75 per cent of the male main workers engaged in non-agricultural
pursuits; and
2.3 A density of population of at least 400 per sq. km.
3. An urban agglomeration is a continuous urban spread constituting a town and its adjoining outgrowths
(OGs), or two or more physically contiguous towns together with or without outgrowths of such towns.
4. An Out Growth is a viable unit such as a village or a hamlet or an enumeration block made up of such
village or hamlet and clearly identifiable in terms of its boundaries and location.
Source: Author’s estimation based on data from Census of India, 2011, (GOI, 2011)
Table 3 shows that the total area of All Classes of cities and towns increased from 38509.28
square kilometers in 1961 to 78199.66 square kilometers in 2001. On the other hand, total area of
Class I cities increased from 8174.29 square kilometers in 1961 to 30984.69 square kilometers in
2001. The table also highlights some interesting trends of CAGR of urban area, and shows that
the total area of cities and towns of All Classes increased from 1.19 percent during 1961-1971 to
2.05 percent during 1991-2001. On the contrary, though CAGR of total area of Class I cities
increased from 3.64 percent during 1961-71 to 3.92 percent during 1971-81, it declined to 2.58
percent during 1991-2001. The results show an increasing trend of India’s urban growth over the
decades.
Table 3: Expansion of geographic boundary of urban area
Census Years Area (in square kilometers) CAGR (in %)
No. of
towns/UAs
All Classes
(394 UAs and
3994 Towns)
Class I (240
UAs and 154
Towns)
All Classes
(394 UAs and
3994 Towns)
Class I (240
UAs and
154 Towns)
1961 38509.28 8174.29 - - 2657
1971 43336.77 11689.53 1.19 3.64 3081
1981 52380.58 17176.50 1.91 3.92 3891
1991 63836.01 24021.97 2.00 3.41 4615
2001 78199.66 30984.69 2.05 2.58 5161
2011 - - - - 7935 Source: Author’s estimation based on Indian Census data of various years

7
Figure 3 illustrates that, according to 2001 census, the net addition was 546 new towns i.e., an
increase of 11.83 percent during 1991-2001. The highest increase is evident in class III towns,
where the number of towns increased from 517 to 1387 during 1961-2001. The number of cities
(or class I towns) has risen from 105 in 1961 to 441 in 2001. The number of towns in class I to
class V has been steadily rising since 1961. The total number of metropolitan cities (population 1
million and above) in India has increased from 23 in 1991 to 35 in 2001 and on to 53 by 2011.
In addition, the number of towns has increased from 2657 in 1961 to 7935 in 2011. The results
indicate an increasing trend in the addition of new cities/ towns in India.1
Figure 3: Growth in number of cities and towns in India: 1961-2001
Notes: Based on population size Census classifies urban centres into six categories.
Source: Author’s estimation based on Indian Census data of various years.
On the whole, the descriptions above clearly indicate an increasing growth of India’s
urbanization by the demographic as well as geographic approach. Thus, issues relating to India’s
urbanization process are relevant at present and in future. These issues include economic growth
and equity as described below.
3. Urban economic growth
Urban economic growth is measured by the growth rate of urban GDP. Net domestic product
(NDP) estimated at factor cost and its rural and urban break-up at national level are available
only for the years 1970-71, 1980-81,1993-94, 1999-2000 and 2004-05. Thus, urban economic
growth is measured and described at the national level.
1 Data on number of cities and towns are not adjusted for definitional changes in urban areas, especially, prior to
1961 Census.

8
3.1. Size and composition of urban GDP
Table 4 presents the total urban NDP by broad sectors (i.e., agriculture, industry and services) at
current prices and constant (1999-2000) prices for these five different periods. At current prices,
the total urban NDP at factor cost is seen to have grown approximately by 9840 per cent during
the period, from Rs. 138.5 billion in 1970-71 to Rs.13766.5 billion in 2004-05, while at constant
(1999-2000) prices the jump is by about 661 per cent. The increasing volume of urban NDP has
consequently raised its contribution to national NDP from 37.65 per cent in 1970-71 to 52.02 per
cent in 2004-05. The per capita urban NDP at constant (1999-00) prices for the year 2004-05 is
Rs. 37245 as against Rs. 14142 for 1970-71, i.e., an increase of 163 per cent in per capita urban
NDP, accounting for about 3 per cent growth rate during the same period. Most importantly, the
service sector became the dominant sector of the economy by increasing its share steeply from
55.7 per cent in 1970-71 to 71.9 per cent in 2004-05 at constant (1999-00) prices. On the
contrary, the share of agriculture and industry decreased from 4.9 per cent to 2.4 per cent and
39.4 per cent to 25.6 per cent, respectively, during the same period. These results show that there
is an increasing trend of share of urban NDP in national NDP in the different periods of time and
contribution from service sector in urban NDP is much higher than other two sectors (industry
and agriculture).
Table 4: Size of total NDP by sectors and per capita NDP
Year
Urban
as %
of
total NDP
Values at Current prices Values at Constant (1999-00) prices
(Rs. in billion) (in Rs.) (Rs. in billion) (in Rs.)
Agricu-
lture
Indus-
try Service
Total
NDP
Per
capita
NDP
Agric
u-
lture
Indus-try Service Total
NDP
Per
capita
NDP
1970
-71 37.65
6.5
(4.7)
51.74
(37.4)
80.26
(57.9)
138.5
(100) 1294
74.34
(4.9)
594.2
(39.4)
839.8
(55.7)
1508.3
(100) 14142
1980
-81 41.09
22.5
(5.0)
170.9
(37.7)
259.9
(57.3)
453.4
(100) 2888
114.8
(5.4)
801
(37.4)
1225.7
(57.2)
2141.6
(100) 13951
1993
-94 45.73
139.4
(4.4)
1046.9
(32.8)
2005.7
(62.8)
3192
(100) 13525
222.4
(4.6)
1583.9
(32.5)
3069.7
(63.0))
4875.9
(100) 20997
1999
-00 51.7
291.4
(3.5)
2097.9
(25.3)
5911.1
(71.2)
8300.4
(100) 30183
291.4
(3.5)
2097.9
(25.3)
5911
(71.2)
8300.4
(100) 30183
2004
-05 52.02
308.7
(2.2)
3649.7
(26.5)
9808.2
(71.2)
13766.5
(100) 44223
279.7
(2.4)
2942.1
(25.6)
8258.3
(71.9)
11480
(100) 37245
Note: Figures in the parenthesis are shares in percent.
Source: Author’s calculation by using data from National Accounts Statistics of various years.
The national level NDP at real prices, the annual average share of agriculture (or industry or
service) sector is about 31.01 (or 26.27 or 42.02) percent from 1970-71 to 2004-05. On the other,

9
the annual average share of agriculture (or industry or service) in urban NDP at real prices, is
about 4.16 (or 32.4 or 64) percent during the same period of time. This indicates that, as
compared to national level NDP, the industrial and service sector’s contribution are much higher
than the agriculture sector in urban NDP. Thus, description of composition of non-agricultural
urban NDP is focused below.
In addition, Table 5 highlights the changes in sectoral compositions of urban NDP over the
period 1970-71 to 2004-05. Though the percentage share of manufacturing in industrial sector
has declined at constant (1999-00) prices from 64.6 per cent in 1970-71 to 55 per cent 2004-05,
it still towers over construction, mining and quarrying and electricity, gas and water supply.
Within the manufacturing sector, the average contribution of registered manufacturing sector is
about 59 per cent, which is higher than unregistered manufacturing sector (i.e., 41 per cent) in all
these five different time-periods. The contribution of unregistered manufacturing sector
increased from 37.7 per cent in 1993-94 to 41 per cent in 2004-05, while registered
manufacturing sector’s contribution declined from 62.3 per cent in 1993-94 to 59 per cent in
Note: R indicates registered manufacture and UR indicates unregistered manufacture.
Source: Author’s calculation by using data from National Accounts Statistics of various years.
2004-05. On the other hand, the percentage share of construction (or mining and quarrying)
increased from 29.1 (or 3.7) per cent in 1970-71 to 34.3 (or 4.8) per cent in 2004-05, while that
of electricity, gas and water supply increased from 2.6 to 5.9 during the same period at constant
(1999-00) prices. The analysis shows that electricity, gas and water supply (or construction or
Table 5: Compositions of non-agricultural urban NDP by industry and service sector
Sectors % Share at constant (1999-00) prices
1970-71 1980-81 1993-94 1999-00 2004-05
Ind
ustry
Mining and Quarrying 3.7 4.8 4.9 9.1 4.8
Manufacturing
64.6 64.1 65.7 57.0 55.0
R UR R UR R UR R UR R UR
51.7 48.3 58.6 41.4 62.3 37.7 64.5 35.5 59 41
Electricity, gas and water supply 2.6 3.1 5.1 6.3 5.9
Construction 29.1 28.0 24.3 27.6 34.3
Serv
ice
Trade, hotels and restaurant 44.6 39.0 32.1 30.6 26.8
Transport, storage and
communication 14.1 17.5 12.3 12.7 17.9
Financing, insurance, real estate
and business services 12.5 14.4 28.6 27.5 27.6
Community, social and personal
services 28.7 29.1 27.0 29.3 27.6
Total 100 100 100 100 100

10
unorganized manufacturing sector) has an increasing share in industrial sector of urban NDP
over the different periods of time.
It is also observed that the average of contribution of service sector in the five different time-
periods, (about 64 per cent) is the highest among ‘others’ and mainly comes from trade, hotels
and restaurants, followed by community, social and personal services. But the percentage share
of trade, hotels and restaurants declined from 44.6 per cent in 1970-71 to 26.8 in 2004-05, while
the percentage share of community, social and personal services declined a bit from 28.75 per
cent to 27.6 per cent during this period. However, the contribution from transport, storage and
communication (or financing, percentage share from insurance, real estate and business services)
increased from 14.1 (or 12.5) per cent in 1970-71 to 17.9 (or 27.6) per cent in 2004-05. This
indicates that financing, insurance, real estate, and business services have the highest
contribution in the growing services sector in the urban GDP.
Overall, the analysis indicates that the declining trend of industrial sector in urban NDP is
mainly because of decline in the share of manufacturing sector. On the other hand, the growing
service sector in urban NDP mainly comes from financing, insurance, real estate and business
services (or transport, storage and communication services).
3.2. Urban economic growth
Table 6 presents the compound annual growth rate (CAGR) of urban NDP by different sectors of
the economy in different periods of time, and reveals that the highest (or lowest) growth rate, i.e.,
7 (or -0.8) per cent was in industrial (or agriculture) sector from 1999-00 to 2004-05, while the
service sector experienced the highest growth rate (11.5 per cent) from 1993-94 to 1999-00 in
constant (1999-00) prices. Strangely, it is also clear that the increasing growth rate of total urban
NDP is associated with declining growth rate in agricultural sector. However, the highest growth
rate in total urban NDP is seen from 1993-94 to 1999-00; it declined in the years1999-00 to
2004-05 from 9.3 percent to 6.7 percent at constant (1999-00) prices.

11
Table 6: CAGR (%) of urban NDP at constant (1999-00) prices
1970-71 to
1980-81
1980-81 to
1993-94
1993-94 to
1999-00
1999-00 to
2004-05 1970-71 to 2004-05
Agriculture 4.4 5.2 4.6 -0.8 4.0
Industry
3.0
5.4 4.8 7.0 4.8
Mining and quarrying 5.6
Manufacturing 4.3
Electricity, gas and
water supply 7.4
Construction 5.3
Service 3.9 7.3 11.5 6.9 7.0
Trade, hotels and
restaurant 5.4
Transport, storage and
communication 7.7
Financial, insurance,
real estate and business
services
9.5
Community, social and
personal services 6.8
Total NDP 3.6 6.5 9.3 6.7 6.2 Source: Author’s estimation using data from National Accounts Statistics of various years.
In addition, Table 6 shows that the high growth rate of service sector (7 per cent) from 1970-71
to 2004-05 was achieved due to high growth in financial sector (9.5 per cent), transport, storage
and communication (7.7 per cent) at constant (1999-00) prices. On the other hand, within
industrial sector the highest contribution (7.4 per cent) came from electricity, gas and water
supply and construction, followed by mining and quarrying (5.6 per cent), at constant (1999-00)
prices. It is also seen that agricultural sector growth (4 per cent) was the lowest among the three
sectors. Nonetheless, growth rate of urban NDP from 1970-71 to 2004-05 is high (6.2 per cent)
at 1999-00 prices. The results indicate that service sector growth rate is higher than the growth
rate of over all urban GDP in different periods of time.
Table 6 also shows some interesting findings as compared to growth rate of GDP at national
level. While the CAGR of overall NDP in real prices is about 4.87 per cent from 1970-71 to
2004-05, the CAGR of urban NDP is about 6.2 percent during the same periods of time. Within
national NDP (or urban NDP) the CAGR (in percent) in real prices of electricity, gas and water
supply is 7.07 (or 7.4), construction is 4.89 (or 5.3), community, social and personal services is
5.43 (or 6.8), trade hotels, transport, and communication is 6.55 (or 7.7). Most importantly,
urban per capita income is about Rs. 37, 245 which is much higher than all India per capita
income is Rs. 19,331 at 1999-00 prices in 2004-05. Thus, the results indicate that overall urban

12
economic growth (or growth rate of different components of industrial and service sector in
urban NDP) has been high and higher as compared to national level economic growth (or growth
rate of different components of industrial and service sector in national NDP) in the different
periods of time.
4. Measurement of poverty and inequality for urban India
The key purpose of this analysis is to understand whether increasing trend of urbanization and
urban economic growth is accompanied by a higher level poverty and inequality or not.
Kundu and Sarangi (2005) estimate the level of poverty across different size class of cities/towns
by considering the price variation across different size class of cities/towns, using Deaton’s
methodology [Deaton 2003]. Table 7 shows the different levels of poverty across different
categories of towns/ cities. In 1999-2000, the poverty level for million plus cities and medium
category cities (population between 50,000 and one million) were 14 per cent and 20 per cent,
respectively. Small towns (population 50,000 or less) show a little higher level of poverty (i.e.,
24 per cent) in 1999-2000. Metropolitan cities had the lowest poverty level (about 23 percent),
which is lower than the poverty level (32 per cent) of medium cities/towns in 1993-94. The
highest level of poverty (i.e., 36 per cent) is evident in ‘small towns’ in 1993-94. Overall, all-
India urban level poverty shows a declining trend from 31.4 per cent in 1993-94 to 19.9 per cent
1999-2000.
Table 7: Percentage of poor of population in different size class of towns
1993-1994 Poor
Large towns/cities 22.6
Medium cities/towns 32.2
Small towns 36.2
Urban areas 31.4
1999-2000
Large towns/cities 14.2
Medium cities/towns 20.4
Small towns 24.2
Urban areas 19.9 Note: ‘Large towns/cities’ refer to those having ‘10 lakh or above’ population; ‘medium cities/towns’ are those
having ‘50,000 to less than 10 Lakh’ population, and ‘small towns’ are those having ‘less than 50,000’ population.
Source: Kundu and Sarangi (2005).

13
Table 8: Household consumption inequality trends in urban India Year Gini Coefficient Share in consumption expenditure (%)
Bottom 30%
population
Top 30%
population
1972-73 0.341 13.9 54.3
1977-78 0.345 13.5 54.9
1983 0.330 13.9 53.7
1987-88 0.352 13.4 55.3
1993-94 0.340 13.6 54.7
1999-00 0.343 13.4 54.7
Source: Government of India (2007).
Table 8 highlights a marginal increase in consumption inequality in urban India from 34.1
percent in 1972-73 to 34.3 per cent in 1999-2000. The relative share of consumption expenditure
of the bottom and top 30% urban population groups indicates that the share has remained almost
same during the period of 1973-2000. The estimates also show that marginally the poor were
getting poorer and rich getting richer during the same period. To gain insights into the recent
trends of poverty and inequality, unit level data of NSS 2004-05 and NSS 2009-10 on consumer
expenditure has been used to estimate the poverty and inequality level differentiated across the
class of cities and by the social groups.
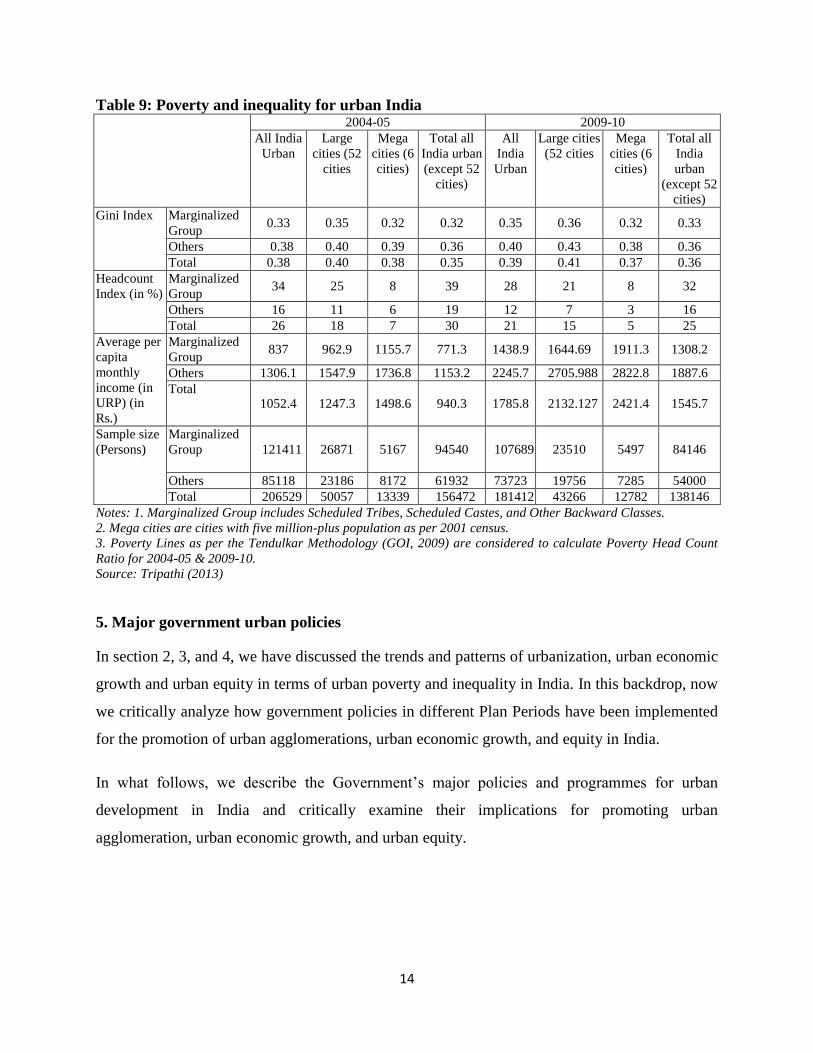
Table 9 shows that all India urban inequality as measured by Gini index has marginally increased
from 0.38 in 2004-05 to 0.39 in 2009-10. During the same periods of time, inequality level for
mega city districts marginally declined from 0.38 to 0.37 while inequality level in respect of 52
large cities in ‘other group’ increased from 0.40 to 0.43. The ‘Marginalized’ group has the lowest
level of inequality when compared to the other two groups (i.e., ‘Others’ and the ‘total group’)
across all categories of cities. On the other hand, all India urban poverty, as measured by head
count ratio, has fallen from 26 per cent in 2004-05 to 21 per cent in 2009-10. Most noticeably,
the number of mega city districts show the lowest level of urban poverty which decreased from 7
per cent to 5 per cent during this period. In particular, poverty among ‘other groups’ in the mega
city districts has fallen sharply from 6 per cent to 3 per cent during this period. However, poverty
rate of ‘marginalized group’ is higher than ‘other groups’ in comparison to size of cities. Table 9
also shows that the mean per capita monthly consumption expenditure as measured by uniform
recall price (URP) is lower among the ‘marginalized’ group than ‘others’ group.
Overall, the estimates indicate that in the process of increasing urban economic growth and the
level of urban poverty have declined but urban inequality has widened in India.
14
Table 9: Poverty and inequality for urban India 2004-05 2009-10
All India
Urban
Large
cities (52
cities
Mega
cities (6
cities)
Total all
India urban
(except 52
cities)
All
India
Urban
Large cities
(52 cities
Mega
cities (6
cities)
Total all
India
urban
(except 52
cities)
Gini Index Marginalized
Group 0.33 0.35 0.32 0.32 0.35 0.36 0.32 0.33
Others 0.38 0.40 0.39 0.36 0.40 0.43 0.38 0.36
Total 0.38 0.40 0.38 0.35 0.39 0.41 0.37 0.36
Headcount
Index (in %)
Marginalized
Group 34 25 8 39 28 21 8 32
Others 16 11 6 19 12 7 3 16
Total 26 18 7 30 21 15 5 25
Average per
capita
monthly
income (in
URP) (in
Rs.)
Marginalized
Group 837 962.9 1155.7 771.3 1438.9 1644.69 1911.3 1308.2
Others 1306.1 1547.9 1736.8 1153.2 2245.7 2705.988 2822.8 1887.6
Total 1052.4 1247.3 1498.6 940.3 1785.8 2132.127 2421.4 1545.7
Sample size
(Persons)
Marginalized
Group
121411
26871 5167 94540 107689 23510 5497 84146
Others 85118 23186 8172 61932 73723 19756 7285 54000
Total 206529 50057 13339 156472 181412 43266 12782 138146
Notes: 1. Marginalized Group includes Scheduled Tribes, Scheduled Castes, and Other Backward Classes.
2. Mega cities are cities with five million-plus population as per 2001 census.
3. Poverty Lines as per the Tendulkar Methodology (GOI, 2009) are considered to calculate Poverty Head Count
Ratio for 2004-05 & 2009-10.
Source: Tripathi (2013)
5. Major government urban policies
In section 2, 3, and 4, we have discussed the trends and patterns of urbanization, urban economic
growth and urban equity in terms of urban poverty and inequality in India. In this backdrop, now
we critically analyze how government policies in different Plan Periods have been implemented
for the promotion of urban agglomerations, urban economic growth, and equity in India.
In what follows, we describe the Government’s major policies and programmes for urban
development in India and critically examine their implications for promoting urban
agglomeration, urban economic growth, and urban equity.

15
Table 10: Major policy measures for urban development under India’s Five Year Plans
Plan period Major urban development programmes
First Five
Year Plan (1951-56)
Main importance was given for construction of institution building, houses for
government employees and weaker section of the people under the Centre subsidized
scheme.
Second
Plan (1956-
61)
1. Industrial Housing Scheme was broadened to include all workers.
2. Preparation of Master Plans (e.g., Delhi Development Authority (DDA)) for important
towns by setting up the Town & Country Planning Legislations.
Third Plan (1961-66)
1. Through urban planning and land policy measures (such as, the control of urban land
values through public acquisition) imbalance and asymmetry were sought to be
removed in the development of large, medium, and small industries, and between
rural and urban areas.
2. The State capitals of Gandhi Nagar and Bhubaneswar were developed and Master
Plans for important cities were prepared.
Fourth Plan
(1969-74)
1. To provide fund for housing and urban development programs, Housing & Urban
Development Corporation (HUDCO) was established.
2. The creation of smaller towns and plan for the spatial location of economic activity
were envisaged for decongestion of population in the large cities.
3. To provide a minimum level of services, like, water supply, drainage, sewerage, street
pavements in 11 cities with a population of 8 lakhs, an environmental or urban slum
improvement scheme was commenced in the Central Sector.
Fifth Plan (1974-79)
1. To prevent concentration of urban land holding and to use them for construction of
houses for the middle and low income group, the Urban Land (Ceiling & Regulation)
Act was set up and was passed in 1976.
2. In order to ease the increasing pressure on urbanization a Task Force was set up by
giving particular emphasis on a comprehensive and regional approach by considering
the problem in metropolitan cities.
Sixth Plan (1980-85)
1. To encourage setting up the new industries, commercial and professional
establishments in small, medium and intermediate towns, positive inducements were
suggested.
2. The major importance was on integrated provision of basic services for the poor. The
Integrated Development of Small and Medium Towns (IDSMT) was launched in
towns with population below one lakh for provision of roads, pavements, minor civic
works, markets, shopping complex, bus stands, etc.
Seventh Plan
(1985-90)
1. To expand the base of housing finance, the National Housing Bank was set up
2. To promote commercial production of innovative building materials, Building Material
Technology Promotion Council (BMTPC) and a network of Building Centres were set
up.
3. For the first time, this Plan also considered the problem of the urban poor and Urban
Basic Services for the Poor (UBSP), Global Shelter Strategy (GSS), and National
Housing Policy (NHP) were announced in 1988.

16
Table 10 (Continued): Major policy measures for urban development under
India’s Five Year Plans
Eighth Plan
(1992-97)
1. The Constitution (74th) Amendment Act, 1992 was made with a view to improve
governance at the grass roots by stressing upon decentralization and creation of
democratic governance structure; devolution of funds and responsibilities was
ensured for fulfilling the needs and aspirations of urban residents.
2. For the first time, this Plan identified the role and importance of urban sector for the
national economy and recognized the significance of the following issues:
i. Poor suffered due to huge gap between demand and supply of infrastructural
services.
ii. Housing shortage caused by the unabated growth of urbanization.
iii. Higher level of incidence of urban poverty and marginal employment.
Ninth Five-
Year Plan
(1997–2002)
1. The Swarna Jayanti Shahari Rozgar Yojana (SJSRY) to provide gainful employment
to the urban unemployed or underemployed poor by encouraging the setting up of
self-employment ventures or provision of wage employment.
2. The Urban Self Employment Programme (USEP). The Urban Wage Employment
Programme (UWEP).
3. Nehru Rozgar Yojana (NRY) to provide employment to the urban unemployed and
underemployed poor.
4. Urban Basic Services for the Poor (UBSP) to achieve the social sector goals.
5. Prime Minister's Integrated Urban Poverty Eradication Programme (PM IUPEP) for
Class II urban agglomerations development of urban poor.
6. Other basic service provision included Urban Water Supply and Sanitation.
Tenth Five
Year Plan
2002-07
1. Strengthening urban governance by judicious devolution of functions and funds to
the elected bodies and ULBs.
2. Land Policy and Housing: The repeal of the Urban Land (Ceiling and Regulation)
Act, 1976 was a significant step towards reform in the urban land market.
3. Mapping, urban indicators and data from the urban sector: Town and Country
Planning Organisation (TCPO) was established for urban mapping based on aerial
photography.
4. Extending Plan Assistance for infrastructure through various programmes, such as,
Accelerated Urban Water Supply Programme (AUWSP), IDSMT, Mega city
Scheme, etc.
5. Urban poverty alleviation and slum improvement.
6. Improvement of civic amenities in urban areas through improvement in urban water
supply, urban sanitation, and urban transport.

17
Table 10 (Continued): Major policy measures for urban development under India’s
Five Year Plans
Eleventh Five
Year Plan
(2007-2012)
1. Jawaharlal Nehru National Urban Renewal Mission (JNNURM).
2. Urban Reform Incentive Fund (URIF)
3. Mega city scheme Integrated Development of Small and Medium towns (IDSMT)
4. Pooled Finance Development Fund (PFDF)
5. Development of satellite cities/counter Magnet cities
6. E-governance in municipalities National Urban Information System (NUIS).
7. National Capital Region Planning Board (NCRPB).
8. Strengthening urban local bodies through capacity building and better financial
management.
9. Increasing the efficiency and productivity of cities by deregulation and development
of land.
10. Dismantling public sector monopoly over urban infrastructure and creating
conducive atmosphere for the private sector to invest.
11. Establishing autonomous regulatory framework to oversee the functioning of the
public and private sector. Using technology and innovation in a big way.
12. Swarna Jayanti Shahri Rozgar Yojana (SJSRY).
13. Reducing incidence of poverty.
14. Accelerated Urban Water Supply Programme (AUWSP).
15. Improvement of urban basic services which includes water supply and solid waste
management, others.
Approach to
the Twelefth
Five Year
Plan
(2012-17)
1. Rapid Mass Transport (RMT) for better transportation system.
2. Reform of the urban water sector.
3. Efficient use of urban land.
4. Long term strategic urban planning with the overall regional planning perspective.
5. The environmental sustainability of urban development.
6. Investment in new urban infrastructure assets and maintenance of assets.
7. Need to strengthen urban governance
8. To strengthen the ‘soft infrastructure’
9. Improvements of urban utilities such as water and sewerage NUHM (National Urban
Health Mission) for better urban public health.
10. Need to fulfill the basic needs of the urban poor.
Source: Author’s compilation based on Shaw (1996) and various Five-Year Plans, Government of India,
Planning Commission, New Delhi.
Table 10 shows that various urban development policies and programmes executed under
different Plan Periods for the fulfillment of the following objectives. First, promotion of urban
agglomeration and urban economic growth (e.g., JNNURM have a strong impact on
infrastructural development in the cities, which increases the level of investment and increases
the urban economic growth and the urban population agglomeration); Second, to deliver the
basic services (e.g., water, road, and sanitation etc.) to the city dwellers (mostly for urban poor)
which is aimed at enhancement of the basic utilities; Third, to reduce the inequality of uneven
distribution of urban population across different classes of cities; Fourth, to increase the urban

18
land area for accommodating more urban population either by increasing the size of the existing
cities or by creating new cities, and recently, to ascertain whether recent urban policies have
been conducive to inclusive urban growth.
The increase in the pace of urban economic growth is due to higher productivity in the cities and
due to the increasing share of industrial and services activities operating in the cities to fulfill the
higher demand. Lower level of poverty is because of higher level of income of the city dwellers
and availability of more job opportunities. Higher level of inequality is mainly because of the
lower wage or level of opportunities for the unskilled worker, as also ineffectiveness of
redistribution policies designed by the urban government. Finally, lower level of inclusiveness is
due to many reasons, such as higher inequality, poor redistribution policies, and over
concentration of population in the large cities.
6. Conclusions and policy implications
This paper describes the recent past trends in urbanization, urban economic growth, urban
poverty, and urban inequality and draws implications on them by highlighting various urban
development policies and programmes of various Five Year Plans in India. The study period
mainly covers from 1961 to 2011.
The descriptive analysis shows the following:
(a) Increasing trend of India’s urbanization and growth rate of city population, and
concentration of urban population in and around class I cities.
(b) Increasing trend of number of new urban agglomerations (UAs)/ towns and an expansion
of boundaries of existing urban centres (i.e., out growths) over the decades.
(c) An increasing trend of share of urban NDP at national level NDP with higher share of
service sector has the highest contribution than other two sectors (i.e., industry and
agriculture sector). With urban service sector financing, insurance, real estate, and
business service are the major contribution of urban NDP. The declining share of urban
industrial sector is due to the declining contribution from urban manufacturing sector.

19
(d) Growth rate of urban GDP (or urban per capita income) in real prices has remained
higher than the growth rate of national level GDP (or per capita national income). Overall
urban economic growth has been high and higher as compare to national level economic
growth over the different periods of time.
(e) The relative share of consumption expenditure of the bottom and top 30 percent urban
population group has almost remained the same during the period of 1973-2000. Overall,
estimates show that in the process of increasing urban economic growth, the level of
poverty has declined and inequality has increased. Mega city districts show the lowest
level of urban poverty than other cities. The ‘Marginalized group’ has the lowest extent
of urban inequality and highest level of urban poverty compared to other two groups (i.e.,
‘Others’ and ‘Total group’).
(f) The different urban development policies and programmes (e.g., JNNURM) undertaken
in various Plan Periods have important implication to promote urban agglomeration,
urban economic growth, and urban equity trough high urban infrastructural development.
In terms of relevant policy implications the study argues that Indian government needs to speed
up the urban urbanization rate as: First, larger share of national GDP mainly comes from urban
India. Second, India’s urbanization rate much lower than in other fast growing developing
countries.
The study also finds an increasing trend of GDP and inequality in urban India. In this
perspective, it would be very appropriate to compare it with the "East Asian miracle" which is all
about the remarkable success achieved by the economies of the eight East Asian countries (i.e.,
Hong Kong, Indonesia, Japan, the Republic of Korea, Malaysia, Singapore, Taiwan (China), and
Thailand). One of the most important factors behind this success was that the benefits of higher
economic growth were spread widely among the population. The government policies that
promoted greater degree of equality were accompanied by years of higher economic growth.
Though the "East Asian miracle" was all about national economic growth, its experiences are
important for strong government policies to combat the higher level of inequality in urban India
as urban India contributes a larger fraction to national GDP. For instance, education is one the

20
main factor behind higher urban economic growth in long run. Thus, promotion of human capital
accumulation may be to be given priority in government policies for urban development in India
for higher urban economic growth and reduction of inequality and poverty in urban India.
References
Bhagat, R. B. 2011. Emerging pattern of urbanisation in India. Economic and Political Weekly
46, 10-12.
Deaton, A., 2003. Prices and poverty in India, 1987-2000. Economic and Political Weekly 38,
362-368.
Government of India, Planning Commission, New Delhi:
First Five-Year Plan 1951-56,
Second Five-Year Plan 1956-61,
Third Five-Year Plan 1961- 66,
Fourth Five-Year Plan 1969-74,
Fifth-Five-Year Plan 1974-79,
Sixth Five-Year Plan 1980-85,
Seventh Five-Year Plan 1985-90,
Eighth Five-Year Plan 1992-97,
Ninth Five-Year Plan 1997- 2002,
Tenth Five-Year Plan 2002-07,
Eleventh Five Year Plan 2007-12,
Approach to Twelfth Five Year Plan 2012-17.
Government of India, 2007. National Seminar on NSS 61st Round Survey Results’, National
Sample Survey Organization, Ministry of Statistics and Programme Implementation, New
Delhi.
Government of India, 2011. Provisional population totals: urban agglomerations and cities.
Planning Commission of India.
Kundu, A., 2006. Urbanisation and urban governance: search for a perspective beyond neo-
liberalism, in: Shaw, A. (Eds.), Indian Cities in Transition, Orient Longman, Hyderabad.
Kundu, A., Sarangi., N., 2005. Issue of urban exclusion. Economic and political weekly 40,
3642- 3646.
Shaw, A., 1996. Urban policy in post-independent India-an appraisal. Economic and Political
Weekly 31, 224-228.
Tripathi, S., 2013. Is urban economic growth inclusive in India? MPRA Working Paper 43617,
University Library of Munich, Germany.
United Nations, 2009. World Urbanization Prospects: The 2009 Revisions, New York: United
Nations, Population Database, Population Division, Department of Economic and Social
Affairs.
United Nations, 2011. World Urbanization Prospects: The 2011 Revisions, New York: United
Nations, Population Database, Population Division, Department of Economic and Social
Affairs.