analysis and testing of a new prototype power transmission
TRANSCRIPT
Graduate Theses and Dissertations Iowa State University Capstones, Theses andDissertations
2010
Analysis and testing of a new prototype powertransmission structure and an alternative designapproach for longitudinal loadsCasey Vaughn FaberIowa State University
Follow this and additional works at: https://lib.dr.iastate.edu/etd
Part of the Civil and Environmental Engineering Commons
This Thesis is brought to you for free and open access by the Iowa State University Capstones, Theses and Dissertations at Iowa State University DigitalRepository. It has been accepted for inclusion in Graduate Theses and Dissertations by an authorized administrator of Iowa State University DigitalRepository. For more information, please contact [email protected].
Recommended CitationFaber, Casey Vaughn, "Analysis and testing of a new prototype power transmission structure and an alternative design approach forlongitudinal loads" (2010). Graduate Theses and Dissertations. 11745.https://lib.dr.iastate.edu/etd/11745
Analysis and testing of a new prototype power transmission structure and an alternative design
approach for longitudinal loads
by
Casey Vaughn Faber
A thesis submitted to the graduate faculty
in partial fulfillment of the requirements for the degree of
MASTER OF SCIENCE
Major: Civil Engineering
Program of Study Committee:
Jon Matthews Rouse, Major Professor
Fouad S. Fanous
Loren W. Zachary
Iowa State University
Ames, Iowa
2010
Copyright © Casey Vaughn Faber, 2010. All rights reserved.
ii
TABLE OF CONTENTS
LIST OF FIGURES ............................................................................................................................... iii
LIST OF TABLES ................................................................................................................................ iv
ABSTRACT ........................................................................................................................................... v
1. INTRODUCTION .............................................................................................................................. 1
2. BACKGROUND ................................................................................................................................ 3
Historical Perspective on Transmission Line Design ......................................................................... 3
Current Design Practice ...................................................................................................................... 3
3. PROTOTYPE SPECIMEN ................................................................................................................ 7
Prototype Background ........................................................................................................................ 7
Prototype Design ................................................................................................................................ 9
Test Setup ......................................................................................................................................... 11
4. RESULTS AND DISCUSSION....................................................................................................... 13
Test 1 Results ................................................................................................................................... 13
Test 2 Results ................................................................................................................................... 15
Test 3 Results ................................................................................................................................... 17
Suggestions for Improvement ........................................................................................................... 18
5. ALTERNATIVE ANALYSIS METHODS ..................................................................................... 19
Finite Element Analysis ................................................................................................................... 19
Simplified Analytical Method .......................................................................................................... 20
6. MULTIPLE STRUCTURE INTERACTION .................................................................................. 25
Load vs. Deflection Response .......................................................................................................... 25
Example Problem ............................................................................................................................. 30
7. CONCLUSIONS .............................................................................................................................. 33
REFERENCES ..................................................................................................................................... 35
ACKNOWLEDGEMENTS ................................................................................................................. 36

iii
LIST OF FIGURES
Figure 1 Connection of two main HSS segments using a pin and structural fuses .............................. 10
Figure 2 Schematic of prototype specimen highlighting post tensioning, fuses, and pin connection .. 11
Figure 3 Schematic of test specimen and maximum deflection of laboratory test with buckled
structural fuse plate .............................................................................................................................. 12
Figure 4 Load versus top displacement graphs for both sets of fuse plates in test 1 ............................ 13
Figure 5 Post-test buckled structural fuse plates with fracture of tension fuse plate highlighted ........ 14
Figure 6 Redesigned structural fuse plate attached to specimen .......................................................... 15
Figure 7 Load versus top displacement graphs for both sets of fuse plates in test 2 ............................ 16
Figure 8 Redesigned structural fuse plate highlighting fracture of the plate and welds ....................... 17
Figure 9 Finite element model .............................................................................................................. 19
Figure 10 Load versus displacement relationship of test 1 set 2, analytical bilinear relationship, and
FEM ...................................................................................................................................................... 20
Figure 11 Free body diagram of full structure and of a cross section at the hinge ............................... 23
Figure 12 Bilinear approximations of full-scale prototype moment versus rotation behavior ............. 26
Figure 13 Free body diagrams of the first, second, and last pole affected by a line breakage ............. 27

iv
LIST OF TABLES
Table 1 Parameters for the wires in multiple structure interaction analysis ......................................... 30
Table 2 Multiple structure interaction results ....................................................................................... 30
Table 3 Multiple structure interaction results with 2.54 cm radial ice ................................................. 31
v
ABSTRACT
As the power transmission infrastructure is expanded, structures that can be rapidly constructed and
are cost efficient, reliable, and sustainable will be needed. A prototype power transmission structure
designed to address the issue of cascading collapse, be efficiently constructed, and be easily repaired
in the event of a catastrophic load such as a transmission line break was investigated. This structure
utilizes post-tensioning and a joint to allow for large deflections. The specially designed joint isolates
inelastic deformation to structural fuses that are inexpensive and easy to replace. The structure’s high
deflection capacity could isolate damage from extreme loads to a few structures near the origin of the
load and prevent a cascading collapse. A scale model was constructed and tested in the laboratory.
The test procedure and structural behavior are discussed and compared to predictions from alternative
methods of analysis. The prototype satisfied primary design objectives for behavior and could offer
significant advantages relative to current design practice for power transmission structures. Currently,
many resources exist to help designers accurately define and apply transverse loads to power
transmission structures. However, there is less guidance available for longitudinal loads such as those
applied by broken conductors. Current practice focuses on mitigating the effects of cascade events
rather than stopping them altogether. An alternative approach for considering longitudinal loading is
discussed that could prevent cascades through the use of the prototype structure that can sustain high
loads while undergoing large longitudinal deflections. Such an approach could increase system
reliability and security while reducing both initial and life-cycle costs of the power transmission
infrastructure.

1
1. INTRODUCTION
The American Society of Civil Engineers (ASCE) regularly provides grades for different sectors of
the United States infrastructure. The energy category received a D+ in 2009 (ASCE 2009). The
Department of Energy reports that the United States operates about 157,000 miles of high-voltage
electric transmission lines and more than seven thousand miles of new lines are planned for
construction by 2013 (Department Of Energy 2006). The investment needed to upgrade the energy
sector of American the infrastructure is predicted to be as much $2 trillion by 2030. The massive
investment is needed to provide for growing demand and solve the current shortcomings of the
system. Designing and constructing adequate transmission infrastructure and continuing to research
areas related to enhancing the nation’s transmission infrastructure are listed as parts of the solution to
improving the grade given by the ASCE (ASCE 2009).
One major deficiency is the fact that overhead power transmission systems as currently designed are
susceptible to progressive or cascading collapse because failure of one structure or system component
may well result in failure of successive structures through a lack of redundancy. Current codes and
guidelines recognize this susceptibility and adopt empirical rules to mitigate the risk of such
occurrences. The primary means of mitigating this risk is through the use of intermittent, expensive
deadend structures to limit the magnitude of a cascade, thus leaving the lighter structures between
deadends vulnerable. Furthermore, because progressive collapse is often the result of secondary loads
triggered by an initial component failure, this vulnerability is particularly difficult to quantify.
The extreme loads that initiate a progressive collapse can be due to a number of events. High winds
coupled with extreme radial ice buildup is one common cause. If conductors or shieldwires break
under the extreme load, the support structures adjacent to the breakage experience a large unbalanced
load. If this load is greater than the capacity of the structure as is often the case, failure results and
sets off a chain reaction of structural failures down the line. Other natural disasters such as hurricanes,
tornados, and landslides can also cause failures that can trigger a cascade. Another threat that must be
considered as concern over terrorism mounts worldwide is sabotage. If a cascade can be initiated by
an attack on an isolated component the entire system is highly vulnerable to an engineered attack that
could have disastrous consequences. Outages resulting from cascading collapse can cost utilities
hundreds of millions of dollars and customers several billion dollars (Peters, et al. 2007).
2
The vulnerability of the current system is recognized by the industry but there have not been
significant changes to the design codes to address this issue. Professional organizations such as the
ASCE and its affiliated Structural Engineering Institute (SEI) have promoted reliability-based design
as an alternative to current design practice (Aichinger, et al. 2002). Reliability-based design seeks to
improve design by providing consistent design method. The reliability-based design approach assigns
load factors to different loads in load combinations based on statistical probability of the occurrence
of the load in conjunction with other loads. Strength reduction factors are also assigned to different
materials and failure limit states to account for material variability. The combination of these factors
provides a factor of safety to ensure the strength of the structure to withstand the applied loading.
However, because the catastrophic loads that can cause these failures are difficult to characterize
statistically, even reliability-based design has limitations.
An alternative strategy to addressing the system’s vulnerability is to design support structures that
have high deflection capacity to introduce structural redundancy and are also highly repairable to
reduce the costs stemming from extreme load events. A reduced-scale prototype structure has been
designed and tested in the laboratory. This prototype sustains a high lateral load parallel to the line
even at large deflections. The larger deflection capacity allows the system to distribute unbalanced
loading over multiple structures. The prototype will be discussed in more detail presently.

3
2. BACKGROUND
Historical Perspective on Transmission Line Design
This prototype design is not the first attempt at solving the problem of cascading with structures
capable of large deflections. Peabody and McClure discuss the development of longitudinal load
design philosophy throughout history. Shortly after the establishment of the electric transmission
system at the beginning of the 20th century, deadend structures were proposed to resist loads resulting
from accidental wire breaks. Two years later in 1910 it was postulated that structures that were rigid
in the transverse direction but flexible in the longitudinal direction could be effective in preventing
cascades. It was believed that the ability of each tower to deflect could redistribute the unbalanced
load among intact wires and prevent each tower from collapsing in succession. The emphasis on
flexibility led designers to omit deadend structures altogether, which soon led to catastrophic
cascading failures. The structures were not flexible enough to reach deflections that would decrease
the unbalanced load to a level that the structure could resist without collapse. (Peabody and McClure
2002).
In 1921 the 3rd
edition of the National Electric Safety Code (NESC) contained a suggestion for
including anchor towers, similar to deadends, at intervals not more than 10 spans to contain cascades.
In 1941, however, the 5th edition of the NESC removed this suggestion without explanation. It was
believed that conductors and fittings were so reliable that longitudinal load design for broken
conductors was not necessary, and flexible towers were again proposed for protection against
cascades. This assumption was proved untrue. Major transmission line failures in 1975 led to the
inclusion of recommendations for including deadends in the following edition of the NESC (1977).
The clause remains in the current edition of the NESC (2007). Since the 1970’s flexible structures
have been constructed with the inclusion of cascade limiting deadend structures, which have
contained cascades, but not eliminated them (Peabody and McClure 2002). The construction of
flexible poles is complicated by the iterative conductor tensioning procedure required to keep poles
plumb (Lynch 2007).
Current Design Practice
The NESC is the standard for designing power transmission structures in the United States. Section
25 provides loading requirements for power transmission structures. Rule 250B provides the original
combined ice and wind load combination. Wind loading is applied to the structure and attached
conductors, while ice loading is only applied to the conductors. This rule uses the archaic district

4
loading map. This map separates the country into three divisions (light, medium, and heavy). Each
division has a design value for wind pressure, radial ice thickness, and temperature. The divisions
have little technical basis and follow state borders and other political boundaries. Rule 250C provides
the load combination for extreme wind loading on structures and conductors. This rule applies to
structures exceeding 18 m which encompasses most transmission structures. Rule 250C utilizes wind
speed maps published by ASCE in Minimum Design Loads for Buildings and Other Structures, ASCE
7-05. These maps are the result of significant research and empirical evidence and more accurately
predict the wind load a structure could actually experience. Rule 250D was added in the 2007 edition
of the NESC to supplement Rule 250B. It is an extreme ice combined with wind load combination
and also applies only to structures over 18 m. The radial thickness of ice and wind speed is
determined from ASCE 7-05 maps (NESC 2006).
Rule 252 describes how to apply the loads determined from Rules 250B-250D to the structure.
Vertical and transverse loads are precisely specified. Rule 252C addresses longitudinal loading of
structures. Longitudinal loads resulting from changes in grade or unequal spans can be calculated and
must be accounted for in design because they will be applied to structures every day. Also special
longitudinal loading requirements are specified for certain circumstances such as special crossings
and stringing loads. The NESC specifies that deadend structures should be designed to resist the
longitudinal load equal to the tensions of all conductors and shieldwires. The code recommends that
“structures having a longitudinal strength capability (i.e. deadends) be provided at reasonable
intervals along the line,” with no definition of a “reasonable interval” (NESC 2006).
The NESC only provides minimum requirements for design, so other organizations have published
supplemental design guidelines and recommendations. The “ASCE Manuals and Reports on
Engineering Practice Number 74, Guidelines for Electrical Transmission Line Structural Loading”
(ASCE 74) provides additional failure containment guidance. The manual reports that when structures
are designed to carry the unbalanced longitudinal load of one broken conductor cascading is often
prevented if no wind or ice is present. In anticipation of failure, ASCE 74 calls for successful failure
containment by designing all structures or intermittent special resistance structures (i.e. deadends)
with the sufficient longitudinal strength to limit cascading.
The ASCE reports that the energy from a catastrophic load that could initiate a cascading failure will
likely be dissipated by the third structure from the source. This implies that only static loads are
applied to the third structure. These static loads are close to the full tension force of all wires attached

5
to the structure. A cascade is prevented if this structure can resist the unbalanced static loads (ASCE
1991). Deadend structures designed with this resistance, however, are typically spaced at five to ten
mile increments sacrificing thirty or more typical structures in between. ASCE 74 suggests designing
all structures for the unbalanced or residual static load (RSL) as a possible means of cascade
prevention. It is suggested that the RSL be based on 60–70 percent of every day tension for
conductors and 100 percent of every day tension for ground wires. These loads again neglect any ice
conditions. ASCE 74 proposes applying RSLs in one direction to one-third of the conductor support
points or to one or both ground wire support points. This approach would not prevent a cascade in the
event of all wires breaking. ASCE 74 also reports that, “some of the longest cascades of high-voltage
lines in the world have resulted from an initial failure that did not include any broken wires.” (ASCE
1991) Structural failure due to sabotage could create longitudinal loads at a level that will cause
cascading.
The Rural Utilities Service (RUS) Bulletin 1724E-200 (USDA 2009) also gives detailed suggestions
for longitudinal load design. Bulletin 1724E-200 refers to NESC for determination of loads. RUS
recommends that extreme wind loading be applied to all transmission structures not just those over 18
m tall. Three methods are described to expand on the recommendations provided in ASCE 74.
Method one suggests installing “stop” structures at specified intervals. This is the same
recommendation as provided by the NESC to install deadends at reasonable intervals, and as in the
NESC, no guideline for defining reasonable intervals is provided. The second method incorporates
the use of release mechanisms to minimize unbalanced loads. Slip or release clamps could be
installed to limit the longitudinal loads applied by broken wires. The RUS warns that this is not a
viable solution where heavy ice buildup is likely to occur because the increased longitudinal load due
to ice buildup could result in unexpected failures of the release mechanisms. Method three is to
design all structures for broken wire loads. This recommendation is similar to the RSL design from
ASCE 74. A blend of method two and three is discussed in which the main portion of a structure
would be designed for larger longitudinal loads, but the support arms would be sacrificial elements.
Under significant longitudinal load these elements would fail, but the main body of the structure
would be protected from collapse. This approach only produces a cascade on a smaller scale. Rather
than several poles being damaged, numerous arms would break away (USDA 2009).
ASCE 74 states, “The infrequent failure of a few structures or components must be accepted as a
result of building transmission lines.” This might be acceptable if the cost of failure were low, which
is not the case for cascading failures. The cascading problem has been described as “a major concern

6
and embarrassment to the industry.” (Miller, Wong and White 2002)The resources discussed above as
well as textbooks and handbooks on the subject fail to provide an economical solution or design
philosophy to prevent cascading collapse but rather provide suggestions on mitigating the costs when
they do occur.
7
3. PROTOTYPE SPECIMEN
Prototype Background
As an alternative to the current practice of using deadend structures to contain cascading collapses,
the prototype power transmission structure discussed here is designed to achieve several objectives to
prevent cascades at the point of origin. The primary objective is a high deflection capacity. Target
behavior in this regard involves reaching 15–20% drift while sustaining at least 70% of peak lateral
load resistance. This deflection capacity is required to allow adjacent structures along the line to share
extreme loads. Secondary design objectives for structure behavior are high initial stiffness,
constructability, and reparability. Another desirable, but less important, objective is the ability of the
structure to provide self-restoring forces once the extreme loads are removed. The prototype structure
envisioned is a modified monopole that can achieve these objectives through three important features:
a hinge, structural fuses, and high-strength elastic post-tensioning tendons.
The prototype is designed to maintain a high lateral load resistance over a much larger deflection
parallel to the lines than typical structures currently in use. Rotation about the hinge allows this large
deflection capacity parallel to the wires enabling the system to distribute large unbalanced
longitudinal loading from the lines over multiple structures and introducing redundancy. As the first
pole beyond the origin of a catastrophic load deflects due to the unbalanced longitudinal loads, the
lines attached in the other direction will sag, reducing the tension forces applied to the pole. This will
cause a lesser unbalanced loading at the next pole, which will deflect as well, thus helping to share
the original unbalanced load. This behavior will propagate down the line until the original unbalanced
load has been redistributed throughout the system and equilibrium is achieved. Multiple poles could
share the unbalanced load rather than a single pole being forced to resist it alone, reducing the need
for deadend structures and the occurrence of cascades.
Presently there is no specific guide for deflection limits of structures leaving it up to the local utilities
or design companies. For this reason, structures are designed with a broad range of stiffness values.
There are significant construction issues associated with current flexible pole designs such as the
complexity of the iterative conductor tensioning procedure required. This method of tensioning is
complex because the camber of the pole must be calculated, and each conductor must be tensioned to
a different value. As the conductors in the first span are tensioned the pole will deflect and the lines
that have been tightened previously will decrease in tension. As the conductors are tensioned in the

8
next span, the pole should be plumb and all lines should have the same tension. However, to achieve
this the tension in conductors in both spans must often be adjusted (Lynch 2007).
The prototype structure is designed to exploit the advantages of both stiff and flexible structures,
having a high initial stiffness and a high deflection capacity. The prototype employs post-tensioning
and structural fuses to achieve this behavior. The post-tensioning system consists of high-strength
elastic tendons. These tendons increase lateral stiffness and deflection capacity and provide a self-
centering force to help right the pole when the unbalanced load is removed. The concept of structural
fuses is not new. From investigations of reliability-based design, the use of load-limiting devices such
as mechanical fuses has been suggested to help contain cascading failures (Aichinger, et al. 2002).
The configuration and function of the structural fuses as applied to these prototype structures is new.
The structural fuses in this case are inexpensive, replaceable plates designed to allow a plastic hinge
to form under sufficient longitudinal load. This implies that the structure will not deflect significantly
under low loads and will not experience the same problems as flexible poles. The structural fuses
serve to concentrate any damage caused by high longitudinal loads in the fuse elements while
shielding the rest of the structure from inelastic damage. Thus, when the unbalanced load is removed
repairs can be made quickly and easily by simply replacing the structural fuse plates.
By slightly modifying current monopole designs to accommodate the tendons, fuses, and hinge, the
incremental cost increase per pole could be limited and offset because frequent deadend structures
would not be necessary at currently accepted intervals or possibly at all. The cost associated with
replacing the structural fuse plates is significantly less than the costs required to replace entire
structures. There would certainly be increased costs of fabrication to incorporate these features, but
these costs could be offset because much of the structure (i.e. the segment above the hinge) could be
made lighter due to lower strength demand in the longitudinal direction. The hinge near the base of
the pole where the fuses are located can also be detailed to permit efficient construction with less
expensive equipment. Traditional monopole designs require a crane with high lifting capacity to raise
the sections of the monopole into place. The prototype design could largely be assembled on the
ground and, once the hinge is connected, raised into place by rotating it about the hinge. Equipment
with small lifting capacity or a winch would be required but not a crane. Once the pole is upright, the
post-tensioning strands would be tightened, the structural fuses would be bolted in place, and
structure would be ready for conductors to be strung. Altogether, the structural system could be
widely applicable providing a more sustainable and reliable option for power transmission systems
with competitive initial and life-cycle costs.
9
Prototype Design
The monopole design example found in ASCE Manual Number 72 (ASCE 1990) was used as a
baseline to scale the prototype test structure. A square steel hollow structural section (HSS)
203.2x203.2x6.4 (HSS 8x8x1/4) was selected with a height of 5.79 meters. The section is a 1:5 scale
of the ASCE monopole example based on depth of section at the base. The conductor loads were
computed from the monopole example in ASCE’s 1984 edition of “Guidelines for Transmission Line
Structural Loading” (ASCE 1984). The loads were scaled, and an equivalent base moment and single
loading point were calculated to help select the section. Loading at the calculated height of 5.61
meters was not feasible with the available laboratory equipment, so a lateral load height of 3.99
meters was used.
A square section is not suggested for full-scale designs, but the materials were readily available and
more economical than fabricating a scaled, tapered pole. A rectangular section could be used for full-
scale structures because such a section could provide adequate strength in the transverse direction,
and utilize simple joint details to maintain high displacement capacity in the direction parallel to the
line. A typical dodecagonal section could also be fit with these features to achieve similar behavior.
As shown in Figure 1 the HSS 203.2x203.2 (HSS 8x8) is connected with a pin to a larger base
segment and reinforced to resist high local stresses and improve fit. The HSS 254x254x12.7 (HSS
10x10x1/2) base segment was rigidly connected to two other HSS segments and post-tensioned to the
laboratory floor to simulate base fixity. A full-scale structure would typically be connected to a pier
foundation or possibly directly embedded in the ground. Steel plates connect the two HSS segments
on either side of the specimen in the direction of loading and act as the structural fuses where the
plastic deformation occurs. As the upper HSS segment rotates about the hinge these structural fuse
plates eventually yield and buckle. Rotation is limited only by the ultimate elongation of the tension
side structural fuse plate and imparts large lateral displacement capacity to the structure.

10
Figure 1 Connection of two main HSS segments using a pin and structural fuses
The structural fuses were 305x190.5x6.4 (12x7-1/2x1/4), A36 steel plates. The lower yield strength of
these plates relative to the HSS (A500 Grade B) helps to ensure that the plastic deformation is
confined to the structural fuse plates. The connection of the fuses to the HSS segments was designed
as a slip-resistant, bolted connection to allow easy removal and replacement of the plates. This
connection was intended to allow the fuses to develop gross section yield strength rather than yielding
through the net section which would reduce strength and ultimate deflection.
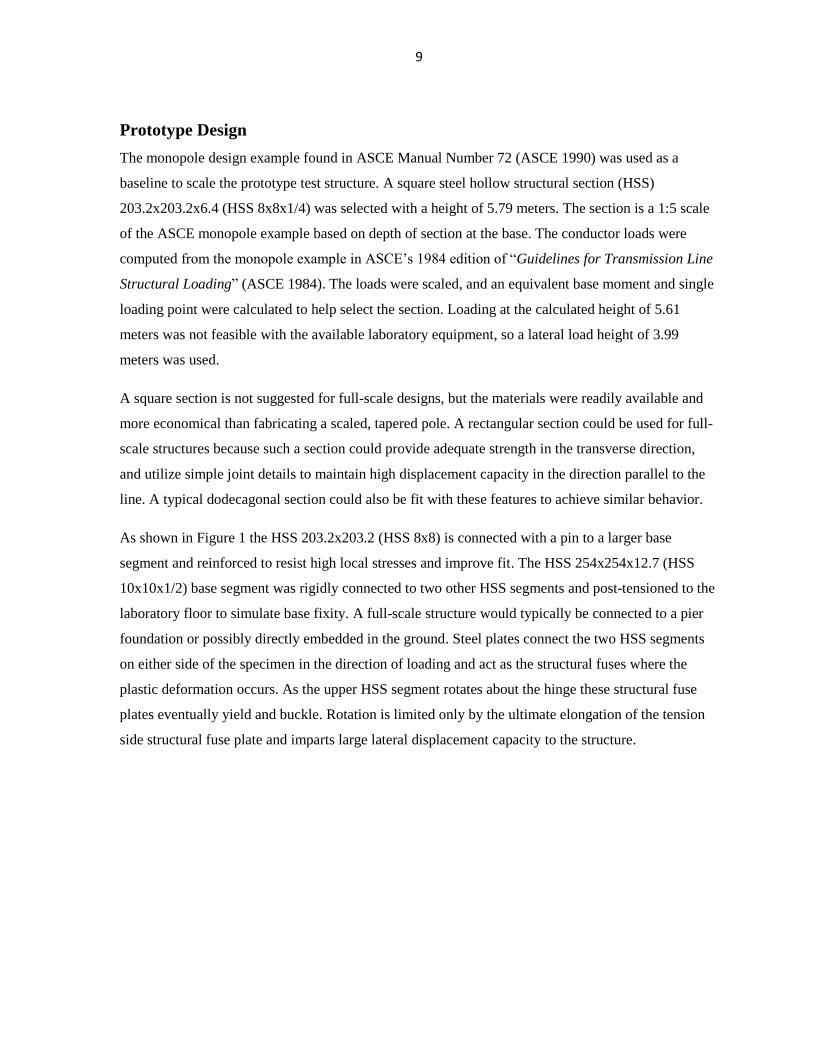
Both high-strength threaded rods and high-strength cables were considered for use as the post-
tensioning (PT) tendons for the structure. The tendons were anchored at the top of the specimen and
into blocks in the base HSS as shown in Figure 2. High strength threaded rods were selected because
the rods could be tensioned from ground level simply by tightening nuts. High-strength cable could
also be tensioned at the base of a full scale structure if carefully detailed to provide sufficient
clearance for jacking and anchor chucks. Figure 2 also illustrates how the HSS members were coped
to allow significant rotation capacity and access to the post-tension anchor blocks.
Pin
Structural Fuse
Plate
Longitudinal Axis
Load Direction Transverse Axis
11
Figure 2 Schematic of prototype specimen highlighting post tensioning, fuses, and pin connection
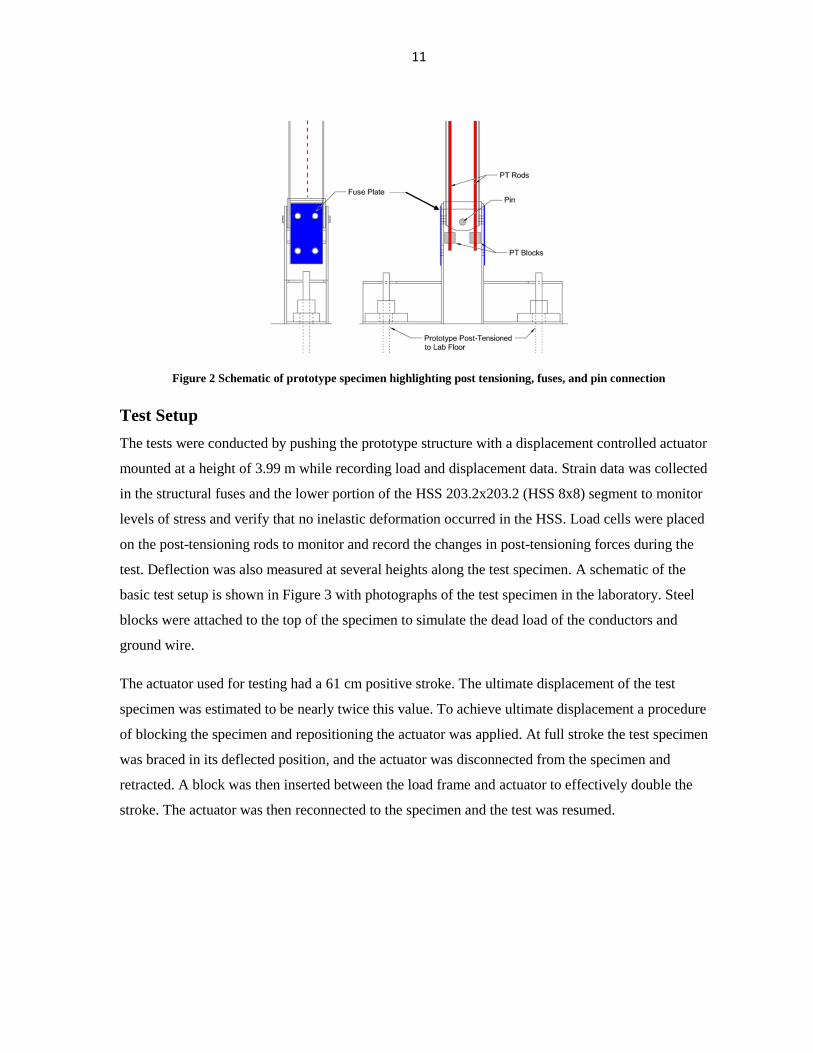
Test Setup
The tests were conducted by pushing the prototype structure with a displacement controlled actuator
mounted at a height of 3.99 m while recording load and displacement data. Strain data was collected
in the structural fuses and the lower portion of the HSS 203.2x203.2 (HSS 8x8) segment to monitor
levels of stress and verify that no inelastic deformation occurred in the HSS. Load cells were placed
on the post-tensioning rods to monitor and record the changes in post-tensioning forces during the
test. Deflection was also measured at several heights along the test specimen. A schematic of the
basic test setup is shown in Figure 3 with photographs of the test specimen in the laboratory. Steel
blocks were attached to the top of the specimen to simulate the dead load of the conductors and
ground wire.
The actuator used for testing had a 61 cm positive stroke. The ultimate displacement of the test
specimen was estimated to be nearly twice this value. To achieve ultimate displacement a procedure
of blocking the specimen and repositioning the actuator was applied. At full stroke the test specimen
was braced in its deflected position, and the actuator was disconnected from the specimen and
retracted. A block was then inserted between the load frame and actuator to effectively double the
stroke. The actuator was then reconnected to the specimen and the test was resumed.

12
Figure 3 Schematic of test specimen and maximum deflection of laboratory test with buckled structural fuse plate
Load
Dead
Weights
Pin
Buckled Fuse
Plate
Yielded Fuse
Plate

13
4. RESULTS AND DISCUSSION
Test 1 Results
Two tests were performed on separate sets of structural fuse plates to verify reparability. The first set
of plates was tested to full displacement of the actuator (61 cm or 13.8% drift). The structure was then
repaired by replacing the structural fuse plates. The repaired structure with this second set of plates
was then tested to ultimate failure (i.e. rupture of the tension side fuse plate). This required
repositioning the actuator as described earlier to increase the deflection. Figure 4 shows the lateral
load versus top displacement behavior of the structure with both sets of fuse plates.
Figure 4 Load versus top displacement graphs for both sets of fuse plates in test 1
The peak load of the repaired pole with the second set of plates was 22.0 kN while the ultimate load
was 15.93 kN at a displacement of 126.4 cm. This correlates to an ultimate drift of 21.8% at 72.5% of
the peak load. The primary objective of the prototype structure was achieved. Figure 4 shows that,
while both sets of plates produced different peak loads at different displacements, the test specimen
maintained the lateral load well throughout the range of displacement. It was observed following the
tests that the post-tensioning rods had yielded locally at the anchorage to the post-tension blocks. This
lowered the stiffness and lateral resistance of the structure and caused the difference in peak loads
-15
-10
-5
0
5
10
15
20
25
30
-10 0 10 20 30 40 50 60 70 80 90 100 110 120 130
Late
ral L
oad
(kN
)
Top Displacement (cm)
Set 1
Set 2

14
between the sets of plates. The immediate decrease in load after reaching a peak was due to the
buckling of the compression side fuse plate. The lateral load capacity of the test specimen began to
gradually decrease at large deflections (≈ 50 cm or 8.5% drift). This decline was due to eventual
slippage at the fuse plate connections leading to bearing of the bolts on the holes of the fuse plate and
the increasing P-Δ moment.
Yielding of the fuse plate initially occurred across the gross section, but then began to occur on the
net section through the bolt holes as the connection began to slip, reducing the force in the plate and
the ultimate load capacity of the structure. Figure 5 shows the deformed structural fuse plates after
testing. The bolt holes deformed significantly before the plate fractured.
Figure 5 Post-test buckled structural fuse plates with fracture of tension fuse plate highlighted
The prototype specimen achieved the objective of having a high initial stiffness. The initial stiffness
of the specimen was roughly half that of a continuous, prismatic HSS 203.2x203.2x6.4 (HSS
8x8x1/4) cantilever. This ratio would be higher if compared to a tapered pole as commonly used in
practice. The test results show that the specimen has sufficient stiffness to resist the full load of one
broken conductor without reaching a displacement that would cause nonlinear damage to the
structural fuse plates. The capacity of the specimen at yield of the structural fuse plate is 1.7 times the
demand required by a single broken conductor. Also, this level of stiffness can be adjusted by
modifying the design of the fuse plates and post-tensioning system. It is important to note that the
fuse plates will not undergo plastic deformation unless a substantial load, such as a breakage of
multiple conductors occurs due to the structure’s high initial stiffness.
The objective of having a repairable, reusable structure was also achieved. After the first test was
completed, the fuse plates were removed and new fuse plates were attached. The strain gage data
from both tests verified that the HSS segments did not undergo any inelastic damage so they could be
Buckled Tension
Fuse Plate
Fracture Through
Bolt Hole

15
reused. The second test also verified that the repaired specimen could achieve the primary objective
of high displacement ductility.
Figure 4 also shows significant residual forces indicating that the post tensioning system was not
sufficient to re-center the structure. Residual forces are the forces that exist after the structure has
returned to zero displacement. This effect was due to local yielding of the high strength rod at the
lower anchorage due to bending. The restoring force required must not only overcome the P-Δ
moment of the displaced structure, but also must buckle the elongated tension fuse plate and
straighten the buckled compression fuse plate as the structure returns to zero displacement.
To investigate the minor deficiencies discussed more tests were performed to try to address them. The
results of these tests are described below. It should be noted, however, that test 1 produced
satisfactory results overall. The results from test 1 are used for comparison to the analytical results as
well as for the use in the multiple structure interaction procedure outlined below.
Test 2 Results
In an effort to improve the behavior of the test specimen the structural fuse plates were redesigned to
address the problem of yielding and ultimate failure through the net section. The net section of the
plate was increased by welding a second 6.4 mm thick plate at the top and bottom of the original fuse
plate. This was done to force gross section yielding throughout the duration of the test. Yielding
through the gross section would result in higher ultimate deflections and better maintenance of lateral
load through ultimate deflection. The redesigned plates can be seen in Figure 6.
Figure 6 Redesigned structural fuse plate attached to specimen
Thickened portion of
redesigned fuse plate

16
The second test also utilized high-strength prestressing strands for the post-tensioning tendons. The
strands were used to prevent local yielding and the post-tensioning losses that were seen in the first
test with the use of threaded rods. This would help the specimen to maintain the lateral load capacity
more steadily. The prestressing strands were also capable of achieving higher forces which could
have improved the self-centering capability of the specimen. The prestressing strands were anchored
at the base and had to be tensioned from the top because jacking equipment could not fit in the base.
It should be noted that prestressing strands could be used for full scale structures which would have
enough space at the base to allow tensioning from the bottom of the structure. Test 2 consisted of the
same test procedure as test 1. Two sets of the redesigned plates were tested. The lateral load versus
top deflection data of both sets of plates in test 2 is shown in Figure 7.
Figure 7 Load versus top displacement graphs for both sets of fuse plates in test 2
Figure 7 shows that the peak load and initial stiffness of the specimens with redesigned plates was
similar to the results of test 1. As in test 1 the load capacity of the specimen plateaus after the peak
load correlating to the buckling of the compression side fuse plate. The load plateau is maintained
better in test 2 because yielding occurs through the gross section through larger lateral deflections.
-25
-20
-15
-10
-5
0
5
10
15
20
25
30
-10 0 10 20 30 40 50 60 70 80 90 100
Late
ral L
oad
(kN
)
Top Displacement (cm)
Set 1
Set 2

17
The load capacity of the first set of plates exhibits a noticeable increase at approximately 60 cm. This
is because the fuse plate buckled inwardly and began to bear on the post-tensioning block.
The redesigned plates were not successful in forcing gross section yielding throughout the test
although the lateral load capacity showed a more level plateau. The many sharp changes in lateral
load capacity are due to the welds fracturing during the test. Eventually, when enough welds had
fractured, the connection began to slip the fuse plate began to yield through the net section again. The
welded plates also forced small radius bends at the interface between the fuse plates and the upper
HSS segment. These bends caused the plate to fracture at a lower deflection than in test 1. The plate
fractured through the bolt holes at a deflection of 94 cm (16% drift). Figure 8 shows the fractured
fuse plate and the fuse plate after the test, highlighting the broken welds.
Figure 8 Redesigned structural fuse plate highlighting fracture of the plate and welds
The specimen was again repairable, and no inelastic strains were measured in the HSS segments. The
same specimen was used to test the redesigned plates as the original plates. The first set of plates were
removed and specimen was used to test the second set of redesigned plates. Figure 7 shows high
residual stresses again. The post-tensioning was again ineffective in self-centering the test specimen.
The residual forces for test 2 were larger than test 1 because the higher force required to straighten the
more sharply buckled compression fuse plate.
Test 3 Results
A third test with no fuse plates was performed to investigate the lateral load capacity (and self-
righting capability) of the post tensioning tendons. Only 0.36 kN of lateral load resistance was
Broken welds
Fracture
of plate

18
provided by the tendons with no fuse plates. This shows the ineffectiveness of the designed system,
and need for redesign for full-scale testing. The tendons used were too long to have a significant
enough increase in force to provide an adequate restoring force.
Suggestions for Improvement
The ability of the specimen to maintain lateral load could be enhanced by improving the behavior of
the structural fuse plates. One possible alteration to address this effect would be to thicken or
reinforce the original structural fuse in the area of the bolt holes to increase the net area. This is
similar to the approach attempted by the redesigned fuse plates investigated in test 2.This would
ensure yielding of the gross section even after slippage and would likely result in a higher deflection
and more stable maintenance of the lateral load. Another option would be to reduce the width at the
gross section giving the fuse a dog-bone shape. Either of these options could be implemented for a
full-scale structure where there would be significantly more space to detail the connection.
In order to self-right the structure after the unbalanced lateral loads are removed, a higher restoring
force is required. A higher restoring force could be provided by the post-tensioning system if the
initial post-tensioning forces were increased or by using shorter tendons. Shorter tendons would
achieve higher loads by distributing the same elongation over a shorter length which would result in
higher post-tensioning forces.

19
5. ALTERNATIVE ANALYSIS METHODS
Finite Element Analysis
The laboratory test data was compared to a finite element model created with the commercial
software program ANSYS. A three dimensional wireframe model created in AutoCAD was meshed
in ANSYS. A three dimensional solid element was used to mesh the HSS 254x254 (HSS 10x10) and
built up portion of the HSS 203.2x203.2 (HSS 8x8) where the two tubes are connected by the fuse
plates and pin. Three dimensional shell elements were used to model the fuse plates and upper portion
of the HSS 203.2x203.2 (HSS 8x8). Tension-only elements were used to model the post-tensioning
tendons and given appropriate initial strains. The two portions (the lower built up solid element
portion and the upper shell element portion) of the HSS 203.2x203.2 (HSS 8x8) were connected with
rigid contact elements. Rather than modeling the pin as a solid element, a joint element was used and
nodes from both HSS members were constrained to the joint element to allow relative rotation.
Because the connections of the fuses to the HSS members were designed to prevent slip, the nodes
located at the bolt holes of the fuse plates and HSS segments were coupled to prevent relative
movement. This approach allows effective prediction of the initial response of the specimen (to 30.5
cm actuator displacement or 8.5% drift) before the connection began to slip. Gap elements were used
to prevent penetration of the fuse plates and HSS members during the analysis. The model is
illustrated in Figure 9.
Figure 9 Finite element model
Displacement was applied to the model at the same height as the actuator in the laboratory. Vertical
dead load was applied to the model as in the test as well. Figure 10 shows the predicted load versus
displacement behavior of the model. The model only predicted results of the laboratory tests
Fuse Plate
Direction of Loading
Upper Shell Element Portion
Lower, Built Up Solid
Element Portion
Hinge
Base Segment

20
reasonably well until slippage of the fuse plate connection began to occur. The FEM continues to
predict load increase as displacement increases because connection slippage was prevented in the
model. For this reason the model was only run to a displacement of 30.5 cm. The finite element
results exhibit similar peak and plateau of lateral load as observed in the test data. The stiffness of the
model is slightly higher than that of the actual prototype specimen. This is expected and due the fact
that a model is perfect geometrically and materially.
Figure 10 Load versus displacement relationship of test 1 set 2, analytical bilinear relationship, and FEM
Simplified Analytical Method
A simplified analytical approach was also performed to predict the behavior of the test specimen.
This simplified analytical approach provided a bilinear approximation of the behavior. Two points
were calculated to develop the bilinear relationship. The first point corresponds to the peak load at the
point of buckling of the compression side fuse plate using Euler buckling theory. The compression
side fuse was predicted to buckle at 19.30 kN lateral load based on the simplified analysis. This value
was obtained using the Euler buckling equation shown below.
𝑃 =𝜋2𝐸𝐴
𝐾𝐿
𝑟
2Equation (1)
0
5
10
15
20
25
0 10 20 30 40 50 60 70 80 90 100 110 120 130 140 150
Late
ral L
oad
(kN
)
Top Displacement (cm)
Testing
Analytical
FEM

21
Where P is the force in the plate, E is the modulus of elasticity, A is the cross sectional area of the plate, K
is the effective length factor, L is the length of the plate between supports, and r is the radius of gyration.
The value of K was assumed to be 0.875 because the support conditions are bounded by the fixed-
fixed support condition (K=0.5) and pinned-pinned support condition (K=1). There is also a
component of sway, which increase the value of K. The plate provides resistance to rotation as do the
bolts, but this does not completely restrain the plate from rotation. As the upper segment of the pole
rotates about the hinge, rotation and translation are induced in the top of the plate, which is why a
larger value of K was selected. A higher value of K is produces a lower force in the plate which
results in a conservative (lower) later load resistance in the analysis. The length L was conservatively
taken to be the spacing between the bolts. To verify the use of K used in the analysis, a value was
back calculated from the results of test 1, set 2 using the equations discussed below. The value of K at
peak load was found to be 0.818, showing the value used was conservative. It should also be noted
that the peak load predicted by calculations of 19.30 kN is conservative compared to the peak test
load of 22.0 kN.
To be more conservative the first point could be very conservatively take to be the point at which the
tension side fuse plate yields, ignoring the force in the compression fuse plate altogether. The overall
behavior is not defined by the peak load capacity so much as the ultimate deflection capacity. The
deflection capacity is what allows the structure to share loads with others in the system. The
compression plate was considered in the case of this analysis because it more realistically represents
the behavior of the structure.
The second point corresponds to the ultimate load and deflection based on fracture of the tension side
fuse plate. The ultimate load and deflection were based on net section properties of the fuse plate. The
predicted ultimate load was 16.92 kN at a displacement of 143.5 cm. This corresponds to a 24.8%
drift at 87.8% of the peak load.
These calculations were based on the geometry and material properties of the test specimen, the
moment equilibrium equation about the joint at the pin connecting the HSS segments, and equations
for the sum of elastic deformation of the HSS and the plastic deformation of the fuse plates. The use
of elastic deformations was validated by the strain data that confirmed that the HSS remained below
the yielding threshold. Equations 2 through Equation 4 shown below are the equations of deflection,
rotation, and moment equilibrium respectively. These three equations are used to solve for the three

22
unknowns; lateral load capacity, Q, lateral displacement, Δ, and rotation at the top, θ. Figure 11 gives
a visual description of these variables.
Equation 2 consists of 4 terms. The first term is the elastic deflection due to the applied horizontal
load, from the actuator in this case. The second term is the elastic deflection due to the horizontal
force component of the post-tensioning. The third term is the elastic deflection due to the moment
caused by the vertical component of the post-tensioning and the dead load. Because the base segment
is short relative to the upper segment the prototype is treated as being prismatic for the entire height.
The fourth term accounts for rotation at the hinge. δLfuse is computed based on the strain in the fuse
plate. At the first point, the strain is computed using the Euler buckling load in the compression side
fuse plate. At the second point, the strain is the ultimate strain of the fuse material distributed across
the bolt holes. The total post-tensioning force (i.e. the sum of the post-tensioning forces), PT, is
constant until the compression side tendon reaches zero force (i.e. goes slack). This relationship is
based on symmetry - the value of the tension side tendon increases in force by the same amount that
the compression side tendon decreases in force. The increase and decrease in post-tensioning are
calculated from the value δLfuse. Once the compression side tendon has gone slack, the tension side
tendon continues to increase in force and the value of PT increases.
𝛥 =𝑄ℎ𝑄
2
6𝐸𝐼 3ℎ𝑇 − ℎ𝑄 −
𝑃𝑇 𝑠𝑖𝑛 𝜃ℎ𝑇3
3𝐸𝐼+
𝐷𝐿+𝑃𝑇 𝑐𝑜𝑠 𝜃 𝛥ℎ𝑇2
2𝐸𝐼+ ℎ𝑇 − ℎ𝑗
𝛿𝐿𝑓𝑢𝑠𝑒
𝑏 2
Equation (2)
Where Δ is lateral displacement, Q is lateral load, hj is the joint height, hQ is the load height, hT is the top
height, E is the modulus of elasticity, I is the moment of inertia, DL is the dead load from attached wires,
PT is the total post-tensioning force in both tendons, θ is the rotation at the top, b is the depth of section,
and δLfuse is the elongation of the fuse plate.
Equation 3 consists of 4 terms. The first term is the elastic rotation due to the applied horizontal load
from the actuator in this case. The second term is the elastic rotation due to the horizontal force
component of the post-tensioning. The third term is the elastic rotation due to the moment caused by
the vertical component of the post-tensioning and the dead load. The fourth term accounts for rotation
at the hinge.
𝜃 =𝑄ℎ𝑄
2
2𝐸𝐼−
𝑃𝑇 sin 𝜃ℎ𝑇2
2𝐸𝐼+
𝐷𝐿+𝑃𝑇 cos 𝜃 𝛥ℎ𝑇
𝐸𝐼+ tan−1
𝛿𝐿𝑓𝑢𝑠𝑒
𝑏 2
Equation (3)
Where θ is the rotation at the top, Δ is lateral displacement, Q is lateral load, hQ is the load height, hT is the
top height, E is the modulus of elasticity, I is the moment of inertia, DL is the dead load from attached
wires, PT is the total post-tensioning force in both tendons, b is the depth of section, and δLfuse is the
elongation of the fuse plate.

23
Equation 4 is the equation for moment equilibrium about the pin. Once the compression fuse plate has
buckled, the force in the plate, Cfuse, is assumed to be zero in the moment equation. The force δPT is
equal to twice the change in the post-tensioning force of the individual tendons until the compression
side tendon goes slack. At this point the tension side tendon is twice its original value based on
symmetry and continued to increase in load. This approach is based on the assumption that both post-
tensioning tendons have the same initial load and are equidistant from the pin. The strain in the post-
tensioning tendons is related to the strain in the fuse plate by the ratio of distance from the centerline
of the cross section. The equation also assumes that the height ht is constant which is not true. The
assumption does not have a large effect on the results because the horizontal component of the post-
tensioning force is small.
𝑇𝑓𝑢𝑠𝑒 + 𝐶𝑓𝑢𝑠𝑒 𝑏
2+ 𝑃𝑇 𝑠𝑖𝑛 𝜃 ℎ𝑇 − ℎ𝑗 + 𝛿𝑃𝑇
𝑏𝑃𝑇
2− 𝐷𝐿 + 𝑃𝑇 𝑐𝑜𝑠 𝜃 𝛥 − 𝑄 ℎ𝑄 − ℎ𝑗 = 0
Equation (4)
Where Tfuse is the force in the tension fuse plate, Cfuse is the force in the compression fuse plate, Δ
is lateral displacement, Q is lateral load, hj is the joint height, hQ is the load height, hT is the top height, DL
is the dead load from attached wires, PT is the total post-tensioning force in both tendons, θ is the rotation
at the top, b is the depth of section, bPT is the spacing between post-tensioning tendons, and δPT
incorporates the change in the post-tensioning force.
Figure 11 Free body diagram of full structure and of a cross section at the hinge
The load versus deflection behavior predicted by this simplified approach is shown in Figure 10 for
comparison with test data and finite element analysis predictions. The analytical bilinear

24
approximation exhibits reasonably good correlation to the test results. The ultimate load and
deflection are both slightly high because the predicted post-tensioning force was higher than the
tested value due to the local yielding of the high-strength rods during the test. This simplified
analytical approach demonstrates that system behavior can be predicted reasonably well using well
known, traditional techniques in lieu of non-linear finite element analysis.

25
6. MULTIPLE STRUCTURE INTERACTION
Load vs. Deflection Response
It should be noted that the prototype structure should not be considered a flexible pole. The large
deflection capacity is controlled by the hinge, structural fuses, and post-tensioning system. The
deflection capacity is significantly greater than that of a typical flexible pole due to the plastic hinge.
Also the prototype exhibits a relatively stiff initial response, having a stiffness of roughly 50% that of
a continuous HSS cantilever. The stiffness can be tuned to a wide range of values by adjusting the
details of the structural fuse plates and post-tensioning system. The large deflection capacity allows
transmission line structures of this type to be designed with flexible pole theory. The theory suggests
that structures capable of large deflections could dissipate unbalanced loads by increasing the sag and
decreasing the tension in the attached conductors, rather than rigidly resisting the RSL.
Using the lateral load versus deflection data shown in Figure 4 an empirical bilinear approximation
was developed. A simplified analytical bilinear relation of lateral load versus deflection was also
derived. These approximate relationships were converted to moment versus rotation relationships to
be used in a multiple structure analysis to illustrate how the unbalanced loads are distributed between
structures. This assumes that the deflection of the structures is a function of the base moment. The
difference between the deflection of a structure under multiple small loads distributed at the end of a
cantilever and one large concentrated load applied to a cantilever is small. The empirical
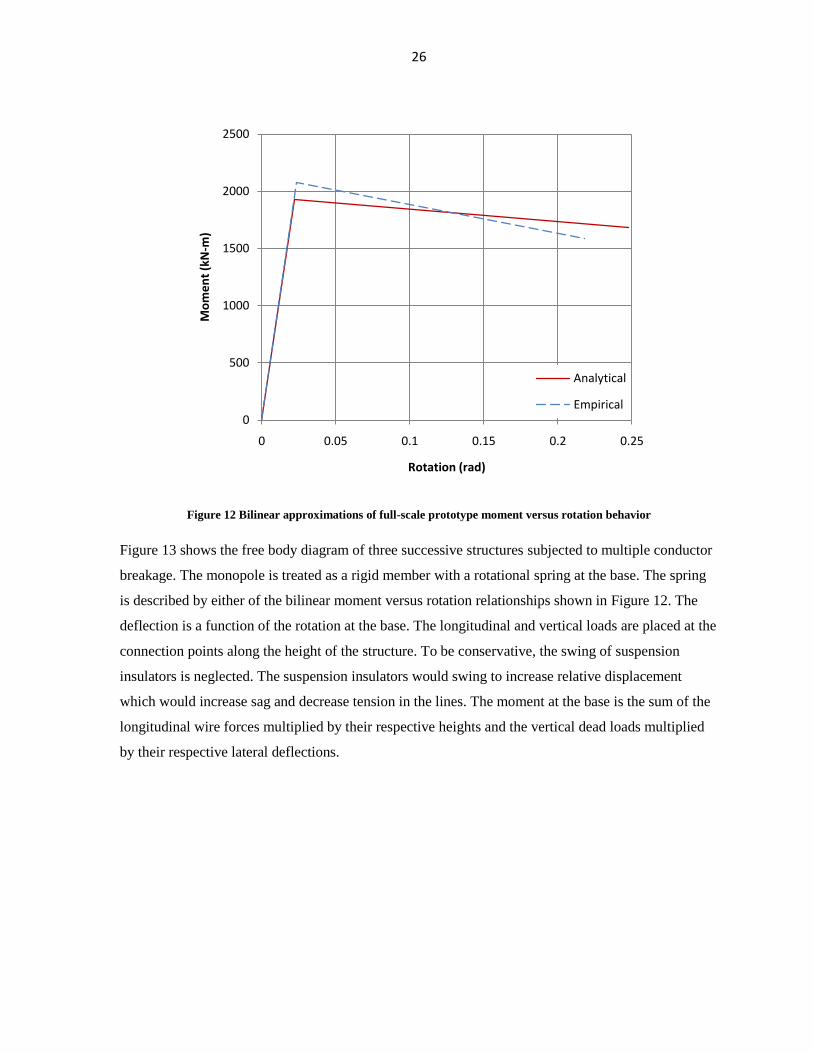
approximation was scaled up for analysis of full-scale structures. Figure 12 shows these relationships.
26
Figure 12 Bilinear approximations of full-scale prototype moment versus rotation behavior
Figure 13 shows the free body diagram of three successive structures subjected to multiple conductor
breakage. The monopole is treated as a rigid member with a rotational spring at the base. The spring
is described by either of the bilinear moment versus rotation relationships shown in Figure 12. The
deflection is a function of the rotation at the base. The longitudinal and vertical loads are placed at the
connection points along the height of the structure. To be conservative, the swing of suspension
insulators is neglected. The suspension insulators would swing to increase relative displacement
which would increase sag and decrease tension in the lines. The moment at the base is the sum of the
longitudinal wire forces multiplied by their respective heights and the vertical dead loads multiplied
by their respective lateral deflections.
0
500
1000
1500
2000
2500
0 0.05 0.1 0.15 0.2 0.25
Mo
me
nt
(kN
-m)
Rotation (rad)
Analytical
Empirical

27
Figure 13 Free body diagrams of the first, second, and last pole affected by a line breakage
The longitudinal force in the conductors and shieldwire is a function of span length, sag, wire length,
and weight per unit length. These forces are calculated assuming the wires follow a parabolic
deflected shape. The parabolic assumption is a reasonable approximation for the true catenary
relationship and is used here for simplicity. The original sag and length of conductor are defined in
Equations 5 and 6 respectively. Equation 5 is derived from the static equilibrium of the conductor.
The weight is multiplied by the length of span not the length of the conductor. This assumption is
acceptable because of the small difference between the values.
𝑠𝑚 =𝑤𝑚 𝑙𝑜
2
8𝐻𝑚𝑜
Equation (5)
sm is the sag of the wire, wm is the weight per unit length of the wire, lo is the span length and Hmo is the
horizontal force component of the wire. The subscript m refers to the shieldwire or conductor attached to
the structure.
λm = lo +8sm
2
3lo
Equation (6)
28
λm is the length of the wire along the parabolic curve, lo is the span length, and sm is the sag of the wire. The
subscript m refers to the shieldwire or conductor attached to the structure.
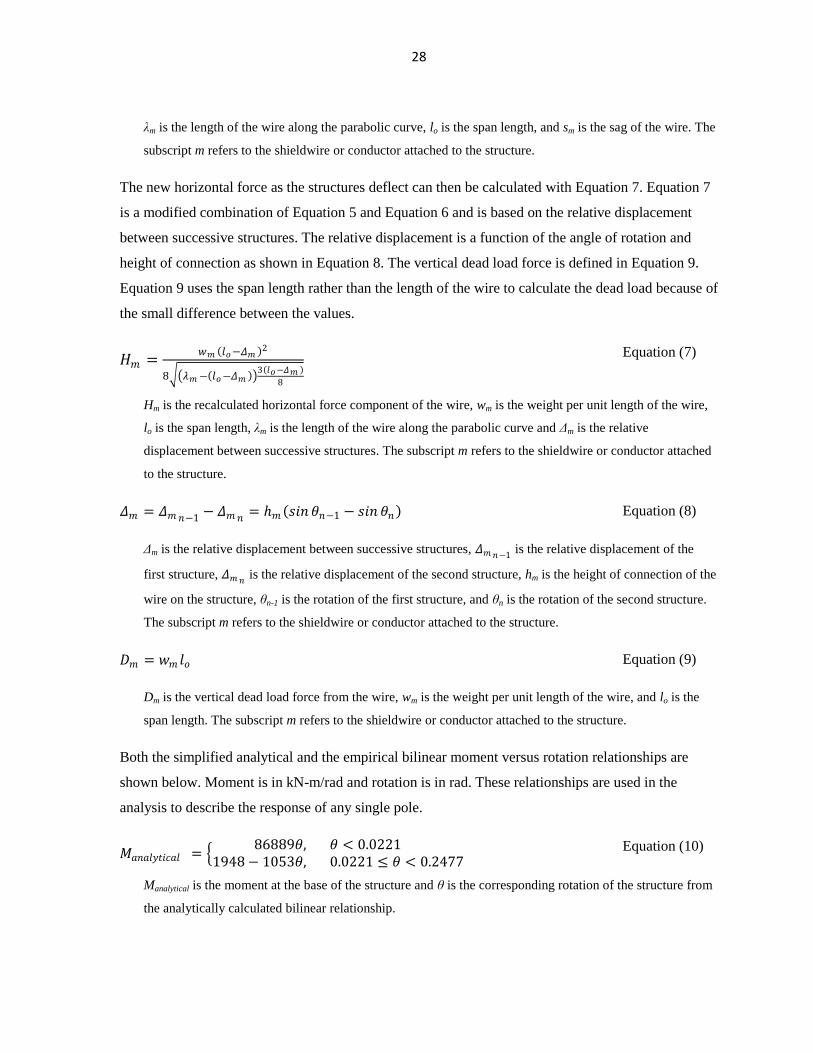
The new horizontal force as the structures deflect can then be calculated with Equation 7. Equation 7
is a modified combination of Equation 5 and Equation 6 and is based on the relative displacement
between successive structures. The relative displacement is a function of the angle of rotation and
height of connection as shown in Equation 8. The vertical dead load force is defined in Equation 9.
Equation 9 uses the span length rather than the length of the wire to calculate the dead load because of
the small difference between the values.
𝐻𝑚 =𝑤𝑚 𝑙𝑜−𝛥𝑚 2
8 𝜆𝑚− 𝑙𝑜−𝛥𝑚 3 𝑙𝑜−𝛥𝑚
8
Equation (7)
Hm is the recalculated horizontal force component of the wire, wm is the weight per unit length of the wire,
lo is the span length, λm is the length of the wire along the parabolic curve and Δm is the relative
displacement between successive structures. The subscript m refers to the shieldwire or conductor attached
to the structure.
𝛥𝑚 = 𝛥𝑚𝑛−1− 𝛥𝑚𝑛
= ℎ𝑚 𝑠𝑖𝑛 𝜃𝑛−1 − 𝑠𝑖𝑛 𝜃𝑛 Equation (8)
Δm is the relative displacement between successive structures, 𝛥𝑚𝑛−1 is the relative displacement of the
first structure, 𝛥𝑚𝑛 is the relative displacement of the second structure, hm is the height of connection of the
wire on the structure, θn-1 is the rotation of the first structure, and θn is the rotation of the second structure.
The subscript m refers to the shieldwire or conductor attached to the structure.
𝐷𝑚 = 𝑤𝑚 𝑙𝑜 Equation (9)
Dm is the vertical dead load force from the wire, wm is the weight per unit length of the wire, and lo is the
span length. The subscript m refers to the shieldwire or conductor attached to the structure.
Both the simplified analytical and the empirical bilinear moment versus rotation relationships are
shown below. Moment is in kN-m/rad and rotation is in rad. These relationships are used in the
analysis to describe the response of any single pole.
𝑀𝑎𝑛𝑎𝑙𝑦𝑡𝑖𝑐𝑎𝑙 = 86889𝜃, 𝜃 < 0.0221
1948 − 1053𝜃, 0.0221 ≤ 𝜃 < 0.2477 Equation (10)
Manalytical is the moment at the base of the structure and θ is the corresponding rotation of the structure from
the analytically calculated bilinear relationship.

29
𝑀𝑒𝑚𝑝𝑖𝑟𝑖𝑐𝑎𝑙 = 88356𝜃, 𝜃 < 0.0236
2141 − 2537𝜃, 0.0236 ≤ 𝜃 < 0.2181 Equation (11)
Mempirical is the moment at the base of the structure and θ is the corresponding rotation of the structure from
the empirical bilinear relationship estimated from test results.
The moment equilibrium equation for the first structure, M1, and for any other structure, Mn, in the
system are shown in Equations 12 and 13 respectively. These equations neglect the vertical
component of the wire tension because as lateral deflection increases, the values of wire tension
decrease dramatically.
𝑀1 = 𝐻𝑚ℎ𝑚
𝑑
𝑚=𝑎
𝑐𝑜𝑠 𝜃1 + 𝐷𝑚ℎ𝑚
𝑑
𝑚=𝑎
𝑠𝑖𝑛 𝜃1
Equation (12)
M1 is the moment at the base of the first structure, Hm is the recalculated horizontal force component of the
wire, hm is the height of connection of the wire on the structure, Dm is the vertical dead load force from the
wire, and θ1 is the rotation of the first structure. The subscript m refers to the shieldwire or conductor
attached to the structure, while a and d are the first and last wires connected to the structure.
𝑀𝑛 = 𝐻𝑚𝑛− 𝐻𝑚𝑛−1
ℎ𝑚
𝑑
𝑚=𝑎
𝑐𝑜𝑠 𝜃𝑛 + 𝐷𝑚ℎ𝑚
𝑑
𝑚=𝑎
𝑠𝑖𝑛 𝜃𝑛
Equation (13)
Mn is the moment at the base of the nth
structure, 𝐻𝑚𝑛 is the recalculated horizontal force component of the
wire attached to the nth
structure, 𝐻𝑚𝑛is the recalculated horizontal force component of the wire at the
previous structure (n-1), hm is the height of connection of the wire on the structure, Dm is the vertical dead
load force from the wire, and θn is the rotation of the nth
structure. The subscript m refers to the shieldwire
or conductor attached to the structure, while a and d are the first and last wires connected to the structure.
The analytical and empirical moment versus rotation relationships were used to calculate the
deflections and new longitudinal tension forces acting on the poles. A system of equations was
created to find an equilibrium solution for the power transmission line after a catastrophic load is
introduced. The system of equations includes an equation for moment equilibrium taken about the
base for each structure designed to share the unbalanced load. Equation 12 is used for the first
structure and Equation 13 is used for all other structures. These moment equations incorporate the
reduced longitudinal forces and the deflections based on the bilinear moment versus rotation
relationship. Either the simplified analytical or the empirical relationship may be used for all
structures. This system of simultaneous equations can be solved numerically by a number of methods.
30
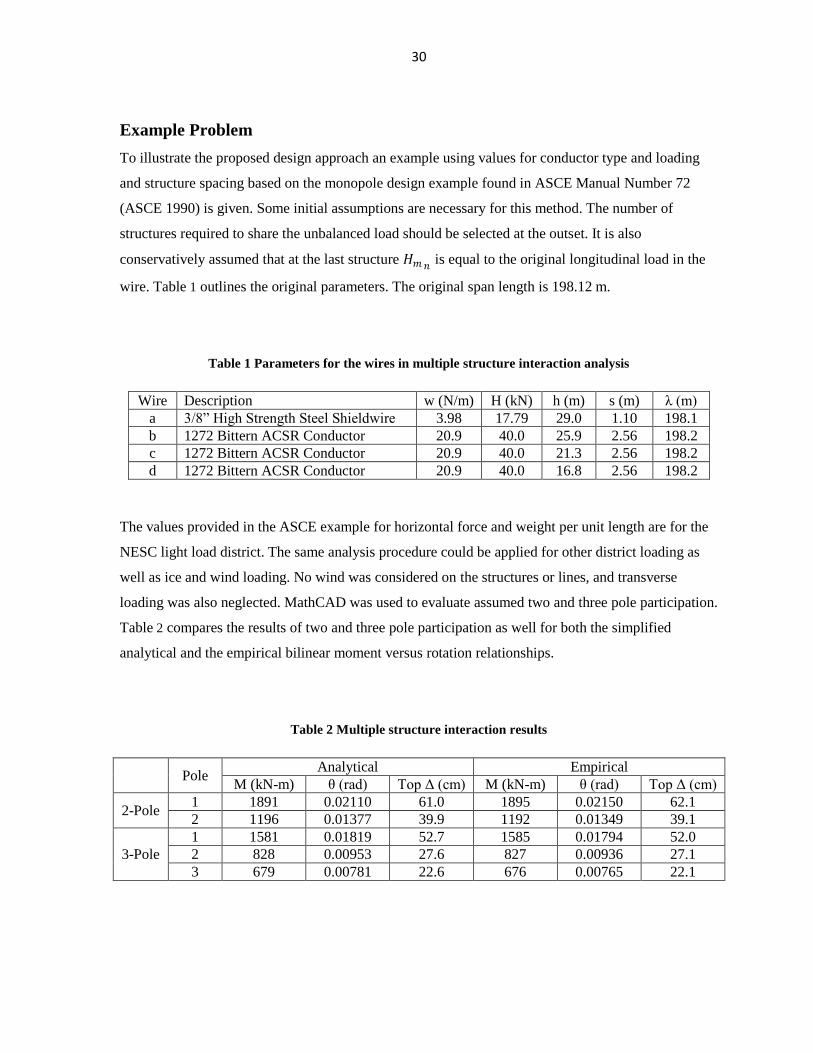
Example Problem
To illustrate the proposed design approach an example using values for conductor type and loading
and structure spacing based on the monopole design example found in ASCE Manual Number 72
(ASCE 1990) is given. Some initial assumptions are necessary for this method. The number of
structures required to share the unbalanced load should be selected at the outset. It is also
conservatively assumed that at the last structure 𝐻𝑚𝑛 is equal to the original longitudinal load in the
wire. Table 1 outlines the original parameters. The original span length is 198.12 m.
Table 1 Parameters for the wires in multiple structure interaction analysis
Wire Description w (N/m) H (kN) h (m) s (m) λ (m)
a 3/8” High Strength Steel Shieldwire 3.98 17.79 29.0 1.10 198.1
b 1272 Bittern ACSR Conductor 20.9 40.0 25.9 2.56 198.2
c 1272 Bittern ACSR Conductor 20.9 40.0 21.3 2.56 198.2
d 1272 Bittern ACSR Conductor 20.9 40.0 16.8 2.56 198.2
The values provided in the ASCE example for horizontal force and weight per unit length are for the
NESC light load district. The same analysis procedure could be applied for other district loading as
well as ice and wind loading. No wind was considered on the structures or lines, and transverse
loading was also neglected. MathCAD was used to evaluate assumed two and three pole participation.
Table 2 compares the results of two and three pole participation as well for both the simplified
analytical and the empirical bilinear moment versus rotation relationships.
Table 2 Multiple structure interaction results
Pole
Analytical Empirical
M (kN-m) θ (rad) Top Δ (cm) M (kN-m) θ (rad) Top Δ (cm)
2-Pole 1 1891 0.02110 61.0 1895 0.02150 62.1
2 1196 0.01377 39.9 1192 0.01349 39.1
3-Pole
1 1581 0.01819 52.7 1585 0.01794 52.0
2 828 0.00953 27.6 827 0.00936 27.1
3 679 0.00781 22.6 676 0.00765 22.1

31
The results in Table 2 show that the initial stiffness of the poles is high so that deflection is low. The
system of structures is able to share the unbalanced load from all conductors breaking with the first
structure experiencing less than 65 cm deflection. It is important to note that small loads will not
cause large deflection of the structures. It can also be seen from Table 2 that as the number of poles
included for participation in resisting the unbalanced load in the analysis increases, the moment and
deflection demand decreases for all poles in the analysis. Thus by designing the structures so that
more participate in sharing the unbalanced load, individual poles may be designed with lower strength
in the parallel direction and thus be lighter. The drawback of including many poles to share an
unbalanced load is the cost of repairing more structures. The load sharing capability of the prototype
structure is demonstrated in this example as well as the ability of the system to reach equilibrium. The
simplified analytical bilinear moment versus rotation relationship predicts very similar moments and
deflections to the empirical bilinear relationship derived from laboratory testing of the small-scale
prototype structure. It should be noted the deflections are far below the predicted maximum deflection
capability of the prototype structure, which exceeds 600 cm (22% drift). The system is stiff initially
and has available capacity for larger deflection and for higher tension loads arising from ice on the
lines. This reserve capacity could also be utilized by structures that support more conductors.
A second analysis was run to incorporate the effects of ice loading. The unit weight of the shieldwire
and conductors from the previous example was increased to 28.67 N/m and 63.49 N/m, respectively,
to incorporate the effects of 2.54 cm radial ice on the lines. The results of the analysis are shown in
Table 3. Wind on the structure and lines was again neglected in this analysis.
Table 3 Multiple structure interaction results with 2.54 cm radial ice
Pole
Analytical Empirical
M (kN-m) θ (rad) Top Δ (cm) M (kN-m) θ (rad) Top Δ (cm)
2-Pole 1 1861 0.08230 238 1967 0.06860 198.4
2 1305 0.01502 43.5 1186 0.01342 38.9
3-Pole
1 1865 0.07910 229 1975 0.06530 188.9
2 995 0.01146 33.2 900 0.01019 29.5
3 303 0.00349 10.10 274 0.00310 8.98
Table 3 shows that the deflection demand increases significantly at the first pole when including the
ice load condition. The moment and deflection at subsequent poles, however, do not change
substantially. Note that the first pole is still far from the ultimate deflection capacity of the prototype.

32
The structure in this example only had three conductors attached. This reserve capacity would be
necessary for structures supporting more conductors. In the three-pole analysis, the third pole actually
decreases in both moment and deflection. This is because of the increased initial sag due to the ice on
the lines. As the sag increases, the load decreases at a faster rate. The prototype structure has enough
lateral load capacity and deflection capacity to allow it to deflect sufficiently to eliminate RSLs
without collapsing, even under heavy ice loading.
The detailing of the structural fuse plates and post-tensioning tendons give the designer control of the
initial stiffness, peak load capacity, ultimate load capacity, and deflection capacity. Utilizing
structures that can be designed with the prescribed behavior could reduce the need for heavy,
expensive dead end structures while increasing the overall reliability and security of the system.
33
7. CONCLUSIONS
The prototype structure tested in the laboratory satisfied all of the primary and secondary design
objectives of high deflection capacity, reparability, high stiffness, and constructability. A fifth and
less important objective of self-centering was not achieved, but improvements in detailing were
identified to address not only this issue but enhance performance relative to the other objectives as
well. Based on the test results for the prototype structure, the following conclusions have been drawn.
The prototype structure demonstrated large deflection capacity while sustaining high lateral
loads. The specimen, after being repaired by replacement of structural fuse plates, achieved
an ultimate drift of 21.8% while sustaining 72.5% of the peak lateral load in the direction
parallel to the wires.
The initial stiffness of the specimen was roughly 50% that of an HSS 203.2x203.2x6.4 (HSS
8x8x1/4) cantilever. This is sufficient to prevent large displacements at low longitudinal
loads.
Test results indicated that the prototype experienced no inelastic damage other than at the
structural fuse plates. The prototype still satisfied the primary design objective after
undergoing repair.
The prototype could be easily constructed by connecting the two segments of the prototype at
the hinge, rotating the upper segment into place, and then connecting the post-tensioning and
fuse plates. The base segment was detailed to allow post-tensioning to be performed from
ground level.
Both finite element analysis and simplified analytical calculations were able to predict
behavior with reasonable accuracy. The ability of simplified analytical approach to predict
behavior through ultimate failure of the structure implies that successful design could be
accomplished without non-linear finite element analysis.
The prototype structure described here provides an alternative to current design practice that could
potentially eliminate cascading collapse, increase system reliability and security, and reduce both
construction and life-cycle costs. The prototype structure exhibits load-deflection behavior that would
allow multiple structures to share unbalanced longitudinal loads. Current design codes and guidelines
do not provide economical strategies for prevention of cascades, but rather suggestions for mitigating
the costs of such events. The design approach discussed here could provide an alternative to current
practice with many potential benefits:

34
Full-scale structures could be developed to exhibit large deflection capacity similar to the
behavior of the prototype tested in the laboratory.
The structural fuse plates and post-tensioning system effectively allow the designer to control
the initial stiffness, peak lateral load, and ultimate load and deflection capacity.
Designing transmission lines as a system of structures with carefully prescribed behavior,
such as large deflection capacity, can introduce redundancy and thereby increase reliability.
A transmission line constructed with the proposed prototype poles could save initial
construction costs by reducing the spacing of or eliminating deadend structures, allowing
lighter structure designs, and providing rapid, efficient means of construction. Significant
savings could also be realized in the event of an extreme load because structures could be
repaired quickly and economically rather than requiring replacement. Such a solution could
be more sustainable in the long-term.
Because testing has only been done on reduced scale structures, full-scale testing is needed to
develop details, verify behavior, and quantify actual costs of implementation of this proposed
design approach.

35
REFERENCES
Aichinger, R., et al. "Structural Reliability-Based Design of Utility Poles." Electrical Transmission in a
New Age. Omaha: American Society of Civil Engineers, 2002. 74-135.
ASCE. "2009 Infrastructure Fact Sheet." American Society of Civil Engineers. 2009.
http://www.infrastructurereportcard.org/report-cards (accessed December 28, 2009).
ASCE. ASCE Manuals and Reports on Engineering Practice No. 72, Design of Steel Transmission Pole
Structures Second Edition . New York: American Society of Civil Engineers, 1990.
ASCE. ASCE Manuals and Reports on Engineering Practice No. 74, Guidelines for Transmission Line
Structural Loading. New York: ASCE, 1991.
ASCE. Guidelines for Transmission Line Structural Loading. New York: American Society of Civil
Engineers, 1984.
Department Of Energy. "The Electricity Delivery System." US Department of Energy. February 2006.
http://sites.energetics.com/gridworks/pdfs/factsheet.pdf (accessed December 28, 2009).
Lynch, Otto J. "Structure Deflections and Dynamic Stringing Charts." Electrical Transmission Line and
Substation Structures: Structural Reliability in a Changing World. Reston: American Society of Civil
Engineers, 2007. 1-11.
Miller, Mike, C. Jerry Wong, and H. Brian White. "Update of ASCE Manuals and Reports on
Engineering Practice no. 74, Guidelines for Electrical Transmission Line Structural Loads." Electrical
Transmission in a New Age. Omaha: American Society of Civil Engineers, 2002. 57-58.
NESC. "National Electric Safety Code C2-2007." New York: Institute of Electrical and Electronics
Engineers, Inc., 2006.
Peabody, Alan B, and Ghyslaine McClure. "Longitudinal Design Loads: A Historical Perspective."
Electrical Transmission in a New Age. Omaha: ASCE, 2002. 48-56.
Peters, Gibson, A. M. Digioria, Chris Hendrickson, and Jay Apt. "Transmission Line Reliability: Climate
Change and Extreme Weather." Electrical Transmission Line and Substation Structures: Structural
Reliability in a Changing World: State of the Practice Proceedings of the 2006 Electrical Transmission
Conference. Birmingham: American Society of Engineers, 2007. 12-26.
USDA. RUS Bulletin 1724E-200, Design Manual for High Voltage Transmission Lines. Washington, DC:
US Department of Agriculture, 2009.

36
ACKNOWLEDGEMENTS
I would like to thank the EPRC without whose funding and support this would have been possible. I
am also grateful to my major professor, Dr. Matt Rouse, for his insight, advice, and support
throughout my time at ISU. I would also like to express my gratitude to the other professors on my
committee, Dr. Fouad Fanous and Dr. Loren Zachary, for their support. Dr. Fanous was instrumental
to the success of the finite element analysis. I would like to recognize Doug Wood and the ISU CCEE
Structures Laboratory for providing support and assistance during the testing phase of this research.
The test material donations of IPC and Precision Sure-Lock are greatly appreciated. I would also like
to thank Mike Siedsma for assistance with analysis and Owen Berg, Tom Lewin, Mitch Pohlkamp,
and Blake Rubino for helping with laboratory testing. Finally, I want to express my deepest gratitude
to my wife Anna for her patience, understanding, and support.