analysis of airport access mode choice: a case study in - easts
TRANSCRIPT

ANALYSIS OF AIRPORT ACCESS MODE CHOICE: A CASE STUDY IN HONG KONG
Mei Ling TAM PhD Student Department of Civil and Structural Engineering The Hong Kong Polytechnic University Hung Hom, Kowloon Hong Kong Tel: +852-2766-4485 Fax: +852-2334-6389 E-mail: [email protected]
Mei Lam TAM Research Associate Department of Civil and Structural Engineering The Hong Kong Polytechnic University Hung Hom, Kowloon Hong Kong Tel: +852-2766-4473 Fax: +852-2334-6389 E-mail: [email protected]
William H.K. LAM Chair Professor Department of Civil and Structural Engineering The Hong Kong Polytechnic University Hung Hom, Kowloon Hong Kong Tel: +852-2766-6045 Fax: +852-2334-6389 E-mail: [email protected]
Abstract: The increasing demand on air traffic has resulted in a growing concern in ground access to the Hong Kong International Airport by the Airport Authority Hong Kong together with various types of transport operators. In this study, the ground access mode choices to the airport are examined with the objectives of categorising the service performance both expected and received by passengers. Focus is on air passengers departing Hong Kong, exclude arriving and transfer/transit passengers. In an attempt to understand their access mode choices, interview surveys have been conducted. A structural equation model has been calibrated to determine how various personal and trip characteristics affect departing air passengers’ modal choices. Latent variables regarding departing air passengers’ expectation and perception on selected service attributes of the modal choices are considered in the analysis. The gap between passengers’ service expectations and the actual service perceived to be happening were examined, while importance-performance analysis was used to construct evaluation maps to identify those service attributes necessitating improvement. The results provide source information for various types of transport operators in their quest to improve their individual services and increase their share of the airport ground access market. Key Words: airport ground access mode choice, gap analysis, importance-performance analysis, structural equation modeling 1. INTRODUCTION Hong Kong is situated on the Pearl River Delta in the southern part of Mainland China. It is a major international and regional trans-shipment center, passenger hub and gateway to cities in Mainland China, with a per capita gross domestic product (GDP) reaching US$25,800 in 2003
Journal of the Eastern Asia Society for Transportation Studies, Vol. 6, pp. 708 - 723, 2005
708

(at constant (2000) market price). The old Hong Kong airport at Kai Tak was a city airport and situated next to a populated residential area, it had a finite capacity due to the physical constraints of the site. Thus to provide sufficient capacity to support the increasing air traffic demand, this airport was relocated to Lantau Island. The new Hong Kong International Airport (HKIA), which started its operations in 1998, is one of the busiest airports in the world. Operating 24 hours a day with an annual handling capacity of 45 million air passengers (include departing, arriving, and transfer/transit passengers). During the financial year 2002/2003, HKIA handled a total of 34.20 million passengers, representing an increase of 3.32 percent on the previous financial year. Of the total 34.20 million passengers, 32.86 percent were departing passengers originating from HKIA and 33.78 percent were transfer/transit passengers. To further increase travel efficiency, the Lantau Link and the Airport Express Line (AEL) were built to provide a high-speed access and egress link for passengers and airport users. However, limited studies on determining air passengers’ behaviour and their ground access mode choices to HKIA have been carried out for evaluating the efficiency of HKIA transport system. In view of this, interview surveys have been conducted to analyze airport ground access mode choice. Departing air passengers face greater pressure regarding airport arrival time, thus these passengers have been chosen as the target of the interview surveys. Passengers’ expectations and perceptions on their selected mode were evaluated by gap analysis and importance-performance analysis (IPA). Structural equation modeling (SEM) was used to simultaneously relate personal characteristics, trip characteristics, passengers’ expectations and perceptions on their ground access mode choices. The data gained provided useful information for various types of transport operators to enable improvement of services and an increase in ground access availability. 2. LITERATURE REVIEW Previous studies have investigated the market share of public transport in the airport ground access market. In Hong Kong public transport is the dominant mode whereas a strong contrast was found in North America. When comparing modal splits at Kai Tak Airport, JF Kennedy Airport, and Newark International Airport, Clark and Lam (1990) found the private car to be the major airport access mode. Foote et al. (1997) found that in Chicago, the private car was a major mode for access to O’Hare and Midway airports, with percentage of 50 and 57 respectively. Less than 8 percent of the departing air passengers accessed the two airports by bus or train. The Bay Area Metropolitan Transportation Commission (MTC) conducted surveys regularly at San Francisco International Airport (SFO), Norman Y Mineta San Jose International Airport (SJC), and Oakland International Airport (OAK). The aim of the MTC surveys was to collect necessary data for understanding and planning passengers’ airport ground access mode choices. According to the MTC surveys conducted in 1995, 2001 and 2002 (MTC, 1995; 2003), it was found that private cars had the largest market share and accounted for over 45 percent of SFO, SJC and OAK ground access market. It was noted that the use of public transport had increased over the past few years, which is possibly explained by the provision of the railway link connecting to the airports. Mandle et al. (2000) summarized that at airports in the United States, the maximum market share of public transport (included rail, buses and shared-ride vans) appeared to be 10 to 15 percent. In contrast, in Asian countries public transport dominate the airport ground access market and accounts for over 60 percent.
Journal of the Eastern Asia Society for Transportation Studies, Vol. 6, pp. 708 - 723, 2005
709

Some researchers developed statistical models to determine significant factors affecting the airport ground access mode choice. Harvey (1986) and Pels et al. (2001, 2003) found that travel time and travel cost are significant explanatory variables in airport access mode choice. The model results further revealed that business travelers are more sensitive to travel time than non-business travelers. Other potential factors influencing the mode choice for accessing airports included the number of pieces of baggage carried by a traveler (Harvey, 1986), trip purpose, party size and residential area (Clark and Lam, 1990). The travel distance also plays an important role in determining the market share for an access service. Psaraki and Abacoumkin (2002) stated that although private cars and taxis are the major mode for accessing the Athens International Airport, the use of the latter decreased in relation to increasing distance between trip origin and the airport due to the higher cost involved. This contention was supported when comparing the surveys results of Clark and Lam (1990) conducted at Kai Tak Airport and Airport Authority Hong Kong (AAHK) (1999) conducted at Hong Kong International Airport (HKIA). Owing to the relocation of the Hong Kong airport from the city center to an outlying island, the traveling distance almost tripled, and resulted in a dramatic decrease in the use of private cars and taxis showing a shift to buses and rail. Owing to the limited studies on airport ground access mode choices, particularly for the airports in Hong Kong and other Asian countries with a high share of public transport for their air passengers, there is a need for investigating passenger ground access mode choices originating from HKIA. 3. HONG KONG INTERNATIONAL AIRPORT TRANSPORT SYSTEM The new Hong Kong International Airport (HKIA) located at Lantau Island, significantly is approximately 28 km from the Central Business District (CBD) that comprises Central and Tsim Sha Tsui (Figure 1). In order to ensure the efficiency of travelling to and from HKIA, the Lantau Link and the Airport Express Line (AEL) were built.
Figure 1. Map of Hong Kong
Journal of the Eastern Asia Society for Transportation Studies, Vol. 6, pp. 708 - 723, 2005
710

The Lantau Link, consists of the Tsing Ma Bridge, the Kap Shui Mun Bridge and the Man Wan Viaduct, provides the railway and road access to Lantau Island and the airport from urban Kowloon and Hong Kong. The Crossing carries six traffic lanes (three in each direction) on the upper deck and two railway tracks on the enclosed lower deck. In addition, two traffic lanes are also provided on the lower deck for emergency use, such as in severe weather conditions. In this study, four major types of access mode including franchised buses, AEL, taxis, and private cars were identified, while airport shuttle buses and limousine services provided by hotels or travel agencies are grouped into “other”. Both franchised buses and AEL are scheduled public transport and charge a predetermined fare. Usually there are two to three franchised bus routes serving the same region/district. The AEL, operated by the Mass Transit Railway Corporation (MTRC), is a fast-dedicated railway linking the airport with Central (i.e. Hong Kong Station), with two intermediate stops at Kowloon and Tsing Yi. Taxi provides a convenient personalized point-to-point transport service; however the fares are typically calculated according to trip length by a taximeter and according to rates established by the government. In addition to fuel cost, private car users have to pay the toll fee for Lantau Link (HK$30) and other tunnels being used. To attract private car users, the Airport Authority Hong Kong offered them 30 minutes free parking at HKIA, while each additional hour charged HK$16. Airport shuttle bus services offer by hotels and travel agencies are available to transport passengers between HKIA and many hotels directly. Passengers can purchase the tickets through their travel agencies or at the hotels. Some hotels also provide limousine services which cost more than HK$500 per trip. Table 1 summarized the characteristics of different access mode for HKIA. For easier comparison, the figures presented are based on travelling between Central and HKIA.
Table 1. Characteristics of Different Access Modes
Mode Travel Cost (HK$)
Travel Time 1 (minutes)
Headway (minutes) Opening Hours
Franchised Bus 21-45 75-95 15-20 05:20 to 24:00 AEL 100 23 12 05:50 to 01:15 Taxi 330 30 - - Private Car 150-170 2 30 - - Other 140 40 30 06:00 to 24:00 1 Travel time required is estimated by the franchised bus operators, MTRC and Hong Kong Transport Department (TD). 2 This include the toll fee for Lantau Link ($30), the toll frees of cross harbor tunnels (ranged from $20 to $40) and the estimated fuel cost ($100). 4. DATA COLLECTION Face-to-face interview surveys were specifically designed to understand departing air passengers’ travel behaviour regarding ground access to the HKIA. The interview surveys targeted departing passengers whose air journey origin was HKIA. Such passengers face greater arrival time pressures, owing to the necessity to meet scheduled flight times and the uncertainty of travel time for accessing the airport.
Journal of the Eastern Asia Society for Transportation Studies, Vol. 6, pp. 708 - 723, 2005
711

The surveys were carried out at the Departures Hall of the HKIA from 30 June 2004 (Wednesday) to 2 July 2004 (Friday). To ensure a selection from a variety of air passengers departing from the HKIA, flights departing for different countries were chosen. A total of 91 flights were selected in the 3-day survey period. Departing air passengers waiting to board the aircraft were invited for interview. Because the questionnaire is comprehensive requiring on average 10 minutes for completion, seated air passengers were selected to ensure the greater likelihood of a considered and reasonable response. A systemic approach was used to select the respondents. The first person (from left to right) sitting in each row of seats next to their boarding gate were interviewed. Since air passengers should be at the boarding gate at least 30 minutes before the flight departure time, they should have sufficient time to complete the questionnaire. Air passengers arriving at the boarding gate just before the closing time were not interviewed. These passengers account for only a small proportion of the target. A total of 891 air passengers were invited to complete the questionnaire. The successful response rate was 56% (i.e. 496 air passengers). The survey questions were divided into five groups. Questions in the first group requested information about the ground access trip to the HKIA, including trip origin, mode choices, travel time, travel cost, and trip purpose. In the second group, respondents were asked to select their preferred mode from two alternatives, bearing in mind the respective travel cost, travel time and probability of delay of the alternatives. Questions in the third group related to air passengers’ expectations and perceptions on various service attributes of their selected modes. Group four asked for demographic information, such as gender, age and residence. Questions in the fifth group requested information about visitors’ (i.e. non Hong Kong residents) last egress trip from the HKIA. In this paper, the results of the data analysis obtained from groups one, three and four are presented. 5. SURVEY FINDINGS Of the total 496 samples, 50 percent were male and 50 percent were female. Around 55 percent of the respondents were aged between 16 and 35. Hong Kong residents accounted for two-thirds of the samples, while the remaining one-third were visitors from various countries. The majority (85 percent) of the respondents were travelling for non-business purposes, such as a vacation or visiting friends or relatives. The remaining 15 percent were business travellers. A quarter of the respondents were air passengers taking long haul flights (i.e. air journey time more than 6 hours). It was noted that 10 percent of the respondents had no check-in baggage, while 55 percent had one check-in bag. On average, each respondent carried 1.3 pieces of check-in baggage. In this paper, the access mode refers to the final mode used by a respondent, as this mode directly relates to the design and improvement of the existing HKIA transport system. Table 2 shows the modal splits at HKIA. In general, public modes (including franchised buses and Airport Express Line (AEL)) dominate HKIA ground access market. Franchised buses have a large proportion (47 percent) with AEL having 23 percent. The primary reason attracting air passengers to use the franchised buses is the lower travel cost. “Shortest time required” is the main reason for those who used AEL. Hong Kong Transport Department (TD) statistics show that only 5 percent of the population in Hong Kong owns a private car (TD, 2004). Owing to this comparatively low car ownership rate, the use of the private car as the ground access mode to the HKIA is limited, and only accounts for 7 percent of the total sample.
Journal of the Eastern Asia Society for Transportation Studies, Vol. 6, pp. 708 - 723, 2005
712

Table 2. Shares of Different Access Modes by Residence and Trip Purpose
Public Modes (%) Non-Public Modes (%) Franchised
Bus AEL Taxi Private car Other
No. of Samples
Business 44.44 33.33 20.00 2.22 0.00 45 Non-business 56.49 21.75 12.28 9.12 0.35 285
Hong Kong Residents
Total 54.85 23.33 13.33 8.18 0.30 330 Business 32.00 56.00 4.00 4.00 4.00 25 Non-business 32.62 17.73 13.48 6.38 29.79 141 Visitors
Total 32.53 23.49 12.05 6.02 25.90 166 Business 40.00 41.43 14.29 2.86 1.43 70 Non-business 48.59 20.42 12.68 8.22 10.09 426 All
Total 47.38 23.39 12.90 7.46 8.87 496 A greater proportion of business air passengers (41 percent) than non-business air passengers (20 percent) accessed the HKIA by AEL. This is because business air passengers have a greater awareness of time cost than non-business air passengers. AEL offers higher travel time reliability. Non-business air passengers are more sensitive to travel cost than business air passengers (Harvey, 1986; Pels et al., 2001; 2003), and this resulted in a greater proportion (49 percent) travelling by franchised buses. Residential position also affects respondents’ mode choices. Most Hong Kong residents are familiar with the local public transport system and hence used public modes (55 percent franchised buses and 23 percent AEL). Among the total number of visitors interviewed, a quarter of them travelled by transportation offered by hotels and travel agencies (i.e. “other”). A comparison of the survey results obtained from Clark and Lam (1990) revealed that travel distance significantly affected the airport ground access modal split. Taxis accounted for over 50 percent of the ground access market at Kai Tak Airport because of its proximity to the urban area (i.e. about 10 km from the CBD). However, the new HKIA is much further away from the CBD, thus access by taxi incurs a much higher cost, thus forcing a dramatic drop in taxi travel with most passengers shifting to franchised buses and AEL. It is believed that the significant changes in the ground access modal split are mainly due to the longer travel distance and higher travel cost incurred. Based on these findings, it is concluded that trip purpose, country of residence, travel distance and travel cost are all potential factors affecting the airport ground access modal choice to the HKIA. Thus, these factors are considered in the structural equation modeling (SEM) for further analysis. 6. SERVICE QUALITY OF THE GROUND ACCESS MODES For service providers, understanding exactly what customers expect is the most important step in defining and delivering quality service (Zeithaml et al., 1990). Previous studies support the
Journal of the Eastern Asia Society for Transportation Studies, Vol. 6, pp. 708 - 723, 2005
713

notion that perceived service quality is interpreted as the direction and degree of difference between what the customer receives and what he excepts (Parasuraman et al., 1985; 1988). In order to investigate passengers’ received quality on the airport access mode choices, five service attributes (included walking distance to/from the stations, waiting time, in-vehicle travel time, travel time reliability, and travel cost) were tested. During the interview surveys, the respondents were asked to rate their expectations on the five selected service attributes using a five-point scale (1 represents the least expected, and 5 represents the most highly expected). The perceptions of the received quality were expressed in terms of the level of the respondents’ satisfaction with each attribute through a five-point scale (1 represents very dissatisfied, and 5 represents very satisfied). Table 3 shows the summary of expectation and perception rating on the five service attributes by mode.
Table 3. Summary of Expectation and Perception Rating on Service Attributes by Mode Service Attribute Expectation (E) Perception (P) Gap (P)-(E)
Franchised Bus Walking distance 4.30 (2) 4.01 (2) -0.30*** Waiting time 4.19 (3) 3.65 (5) -0.55*** In-vehicle time 4.03 (4) 3.80 (4) -0.23*** Travel Time reliability 4.39 (1) 4.08 (1) -0.31*** Travel cost 4.01 (5) 3.87 (3) -0.14* AEL Walking distance 4.33 (3) 3.79 (4) -0.54*** Waiting time 4.39 (2) 3.95 (3) -0.44*** In-vehicle time 4.17 (4) 4.11 (2) -0.06 Travel Time reliability 4.43 (1) 4.30 (1) -0.14 Travel cost 4.00 (5) 3.19 (5) -0.81*** Taxi Walking distance 4.30 (2) 4.28 (3) -0.02 Waiting time 4.42 (1) 4.34 (2) -0.08 In-vehicle time 4.23 (3) 4.13 (4) -0.11 Travel Time reliability 4.42 (1) 4.39 (1) -0.03 Travel cost 4.17 (4) 3.50 (5) -0.67*** Private Car Walking distance 4.14 (3) 3.59 (5) -0.54*** Waiting time 3.95 (4) 4.22 (2) -0.27 In-vehicle time 4.35 (1) 4.14 (3) -0.22 Travel Time reliability 4.35 (1) 4.27 (1) -0.08 Travel cost 4.32 (2) 3.62 (4) -0.70*** Other Walking distance 4.27 (3) 4.20 (2) -0.07 Waiting time 4.32 (2) 3.82 (4) -0.50** In-vehicle time 4.20 (4) 4.09 (3) -0.11 Travel Time reliability 4.36 (1) 4.39 (1) -0.02 Travel cost 4.00 (5) 3.57 (5) -0.43** * p<0.10. ** p<0.05. *** p<0.01. Number in the parenthesis represents the ranking of service attributes.
Journal of the Eastern Asia Society for Transportation Studies, Vol. 6, pp. 708 - 723, 2005
714

As shown in Table 3, the departing air passengers have high expectation on all the five service attributes, for every mode choice (a 3.95 to 4.43 range). Respondents have the highest expectations concerning travel time reliability, but low expectations regarding affordable travel cost. The higher expectation ratings demonstrated the significance of the service attributes in respondents’ airport ground access evaluation. The perception ratings for the service attributes ranged from 3.19 to 4.39. Over 90 percent of the respondents reported that they had not encountered any traffic congestion on their journey to the HKIA. This explained the relatively high satisfaction on travel time reliability among the five attributes. Waiting time is the least satisfactory attribute for franchised bus users, while users of AEL and non-public modes are least satisfied with the travel cost. The low perception ratings on taxi and private car reinforce the opinion that the relocation of the HKIA has reduced the taxi and private car market share. Cost is suggested as the prime factor. 6.1 Gap Analysis Gap analysis is applied, in this study, for identifying service attributes necessitating improvement. The gap is the difference between departing air passengers’ service expectations and perceptions regarding the service attributes. From the P-P plot, which tests whether the data are normally distributed, it is found that both the expectation and perception ratings cluster around a straight line. Thus, it is assumed that the data are normally distributed, and paired sample student’s t-tests were used to test whether such a gap existed. The results of the gap analysis are shown in Table 3. According to the results of the gap analysis, franchised bus users’ perceived levels of satisfaction are lower than their expectations of all attributes. The differences shown are statistically significant. The largest gap existed in waiting time, followed by travel time reliability and walking distance. In contrast, the gap associated with travel cost was comparably small. For AEL, the largest gap is reflected in travel cost. On the basis of survey results (Lo et al., 2002), one percent reduction in AEL fares resulted in higher utilization and a 1.36 percent increase in its revenue. This reveals that there is room for AEL to reduce its travel cost so as to increase both its utilization and revenue. As the travel time on AEL is short and the travel time reliability of AEL is high, these two gaps were found to be small and statistically insignificant. As the HKIA is far away from the CBD and residential areas, taxi costs are high. Driving to the airport also incurs high fuel and tunnel toll costs. The result is low passenger satisfaction, as revealed by the large gap in travel costs between these two modes. A large gap exists in waiting time for mode choices grouped in “other” category. This may be due to passengers travelling on these shuttle buses have to wait for the arrival of other users, before taking off. Some hotels provide limousine service for transporting the visitors to the airport. However the service charge is high, which is above HK$500 per trip, resulting in low satisfaction and a large travel cost gap. 6.2 Importance-Performance Analysis In addition to gap analysis, the importance-performance analysis (IPA) technique developed by Martilla and James (1977) is used to construct evaluation maps for identifying the priorities of those service attributes requiring improvement. The IPA technique is widely used
Journal of the Eastern Asia Society for Transportation Studies, Vol. 6, pp. 708 - 723, 2005
715

by researchers in various areas including transportation services (Foote and Stuart, 1998; Carreno et al., 2002). The expectation and perception ratings are plotted graphically on a two-dimensional grid. For easier comparisons, in this study, the grand mean for the expectation and perception ratings of all mode choices were used as the cross-hairs of the grids. The resulting four quadrants are entitled: “Concentrate Here”, “Keep Up the Good Work”, “Low Priority”, and “Possible Overkill”. In the Concentrate Here quadrant, the service attributes have highly expectations by the passengers, but the actual service qualities are seen as below average. This implies that improvement efforts should be concentrated here. Attributes in the Keep Up the Good Work quadrant have high expectations by the passengers and the current situation is found to be satisfactory. Conversely, the Low Priority quadrant contains attributes which passengers have low expectations of, and cannot meet the expected service quality. Limited resources should be expended on the attributes belonging to this quadrant because the passengers have low expectations in this regard. The Possible Overkill quadrant contains attributes with which passengers are satisfied but in fact have low expectations, thus effort focused here should be reduced. The IPA grids for each mode were plotted and are shown in Figure 2. However each mode has different characteristics, thus in the following, the service attributes of each mode which require remedial improvement would be discussed. It is noted in Figure 2a that, for franchised buses, none of the service attributes falls in the Concentrate Here quadrant. However, as passengers wait for the franchised buses in outdoor areas with limited weather protection, passengers may perceived the waiting time to be longer than the actual one. As a result, waiting time becomes the least satisfactory service attribute, and occupies a marginal position between the Concentrate Here quadrant and the Low Priority quadrant. Although free scheduled Airport Express Shuttle Bus services are offered to transport AEL passengers to and from major hotels, walking distance to and from AEL stations locates in the Concentrate Here quadrant (Figure 2b). This suggests that the existing shuttle bus services between AEL stations are inadequate, particular for non-hotel users whom cannot enjoy these services. Thus better connecting services to AEL stations should be provided so as to reduce passengers walking, especially when transfers are required. Although the overall performance of taxi service is satisfactory (Figure 2c), the use of taxi for accessing HKIA is limited. This is mainly due to the high travel cost of a taxi trip, while cost is the prime factor affecting most passengers’ mode choice decision. In order to increase its competitiveness, the related operators may propose a new fare schedule particular for travelling to and from the HKIA. In addition to the low rate of car ownership in Hong Kong, the high travel cost is found to be a key factor affecting the use of use private car for accessing HKIA (Figure 2d). It is also interesting to note that respondents were not satisfied with the walking distance to and from the car parks (i.e. locates in the Low Priority quadrant). However, the Airport Authority Hong Kong (AAHK) may have difficulty in solving this problem owing to the arrangement of the departure curbs and parking locations. Hence little improvement can be expected. As mentioned, the airport shuttle bus users have to wait for the arrival of other users before taking off, thus waiting time is considered to be the attribute that prioritize for improvements (Figure 2e). Based on the results of the gap analysis and IPA, it is noted that all the five selected service attributes significantly affected passengers’ airport ground access mode choices. Thus they are listed as indicators of latent variables and employed in the SEM for further investigating their effects on passengers’ mode choice selection.
Journal of the Eastern Asia Society for Transportation Studies, Vol. 6, pp. 708 - 723, 2005
716
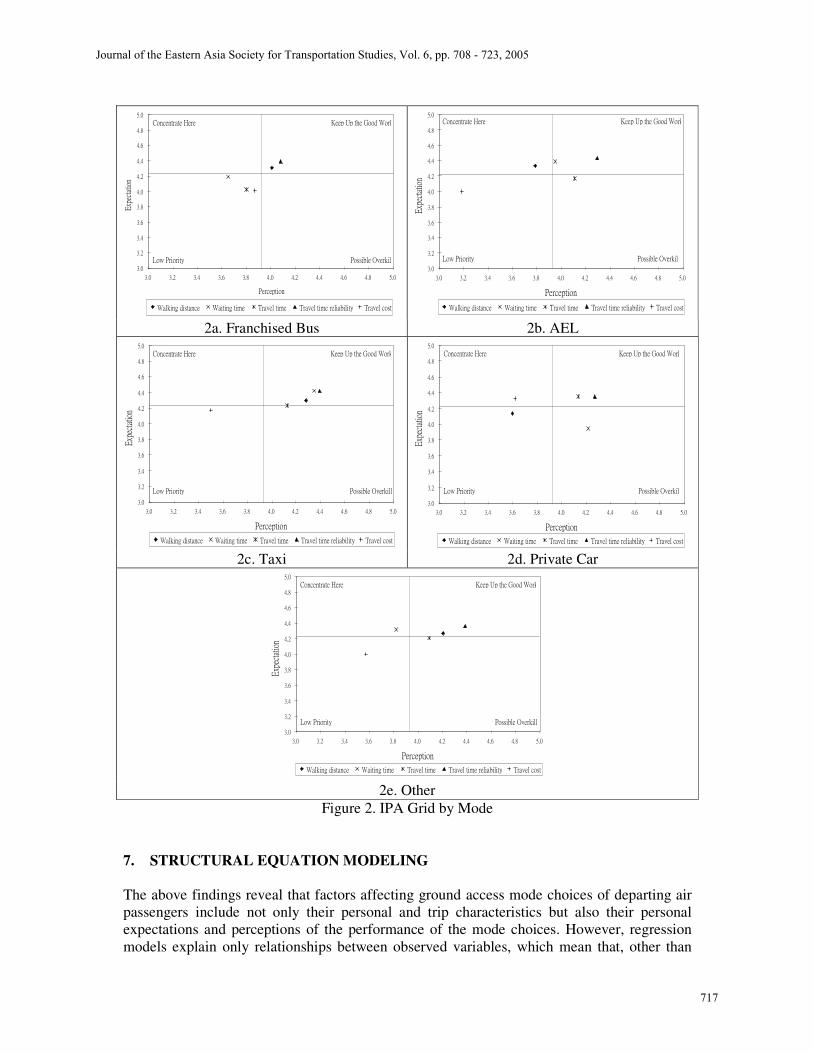
2a. Franchised Bus 2b. AEL
2c. Taxi 2d. Private Car
2e. Other
Figure 2. IPA Grid by Mode 7. STRUCTURAL EQUATION MODELING The above findings reveal that factors affecting ground access mode choices of departing air passengers include not only their personal and trip characteristics but also their personal expectations and perceptions of the performance of the mode choices. However, regression models explain only relationships between observed variables, which mean that, other than
Journal of the Eastern Asia Society for Transportation Studies, Vol. 6, pp. 708 - 723, 2005
717

errors, all the variables are measurable. Structural equation modeling (SEM) is a popular statistical method which simultaneously captures and describes hypothetically the causal effect between observed variables and latent variables. Thus, in this paper, SEM has been used for analyzing the relationships among airport ground access mode choices, personal characteristics, trip characteristics, air passengers’ expectations and perceptions. The conceptual measurement relation among observed variables and latent variables are shown in Equations 1 and 2, while the structural relation among latent variables can be represented by Equation 3.
x = �x�+� (1) y = �y�+� (2) � = ��+��+� (3)
where x and y are the observed exogenous and endogenous variables, � and � are the vector of exogenous and endogenous latent variables. �x and �y are the regression matrices of loadings, which relate the latent variables to their observed variables. � and � are the vectors of error terms. � and � are the matrices of coefficient parameter for the latent variables, and � is a vector of error terms. The estimated values for all parameters established by the model represent the effects that one variable has on others, typically the direct, indirect, and total effects are calculated. The direct effects are those influences unmediated by any other variable, which are given by the elements of the matrixes �, �, �x and �y presented in the structural relations and measurement relations. The indirect effects are those mediated by other variables and can be obtained as the difference between the total and the direct effects. The total effects (direct and indirect) of the exogenous latent variables on the endogenous latent variables are usually defined as reduced form relations, which represented by Equation 4.
� = (1-�)-1��+(1-B)-1
� = B*
�+ �* (4)
where B* is the total effect of the exogenous latent variable, �. In this study, twelve personal and trip characteristics were used to form an exogenous latent variable Personal/Trip Characteristics (�1). The five selected service attributes, including walking distance to/from the stations, waiting time, in-vehicle travel time, travel time reliability, and travel cost, are listed as indicators of the latent variables Expectation (�2) and Perception (�1). Two characteristics of the final mode used by the air passengers are listed as indicators of the latent variable Mode Utility (�2). The two characteristics are (1) public mode (coded as “1”) vs. non-public mode (coded as “0”); and (2) road-based mode (coded as “1”) vs. rail-based mode (coded as “0”). LISREL, a structural equation modeling software, was employed for the analysis in this study. As the observed variables are of mixed scale types, estimates of polychoric and polyserial correlations have been computed and the matrix of such correlations has been analyzed by the Weighted Least Squares method. In order to eliminate the estimation errors raised by the sampling biases, weighted observations were used to calibrate the model. The weighting factors included: daily number of departing air passengers of the survey period, residence (Hong Kong residents vs. visitors), trip purpose (business vs. non-business) and car park utilization rate. Table 4 shows the model
Journal of the Eastern Asia Society for Transportation Studies, Vol. 6, pp. 708 - 723, 2005
718

results gained in this study. One rule of thumb for a model good fit is that the chi-square should be less than two times its degree of freedom (Ullman, 1996). The Root Mean Square Error of Approximation (RMSEA) value of less than 0.05 is regarded as a good fit. Standardized Root Mean Square Residual (RMR) should be less than 0.05, and Adjusted Goodness of Fit Index (AGFI) needs to be greater than 0.90 (Byrne, 1998; Golob, 2003). The goodness of fit statistics showed that the model fits well. In addition, most of the variables are statistically significant at 5 percent level.
Table 4. Parameter Estimates for the Model Measurement Relations Estimate t-value Male � Personal/Trip Characteristics (�1) 0.29 5.47 Age � Personal/Trip Characteristics (�1) 0.11 2.24 Education level � Personal/Trip Characteristics (�1) 0.28 6.35 Taking long haul flight � Personal/Trip Characteristics (�1) 0.14 2.15 No. of transfers � Personal/Trip Characteristics (�1) -0.25 -3.74 Travel cost � Personal/Trip Characteristics (�1) 0.19 2.48 D1 (Resident, Non-business) � Personal/Trip Characteristics (�1) -1.22 -28.09 D2 (Visitor, Business) � Personal/Trip Characteristics (�1) 0.83 22.31 D3 (Short haul flight, No baggage) � Personal/Trip Characteristics (�1) -0.12 -2.00 D4 (Resident, visit HKIA>2 times) � Personal/Trip Characteristics (�1) -0.66 -17.35 D5 (Visitor, 1st time at HKIA) � Personal/Trip Characteristics (�1) 0.38 11.87 D6 (Visitor, visit HKIA<=2 times) � Personal/Trip Characteristics (�1) 0.63 15.73 Expectation on walking distance � Expectation (�2) 0.57 11.35 Expectation on waiting time � Expectation (�2) 0.55 9.20 Expectation on in-vehicle travel time � Expectation (�2) 0.56 10.15 Expectation on travel time reliability � Expectation (�2) 0.66 13.11 Expectation on travel cost � Expectation (�2) 0.46 8.42 Perception on walking distance � Perception (�1) 0.44 --- Perception on waiting time � Perception (�1) 0.46 5.44 Perception on in-vehicle travel time � Perception (�1) 0.68 6.87 Perception on travel time reliability � Perception (�1) 0.84 7.22 Perception on travel cost � Perception (�1) 0.23 3.84 Road-based mode � Mode Utility (�2) 1.00 --- Public mode � Mode Utility (�2) 1.60 1.24 Structural Relations Estimate t-value Perception (�1) � Personal/Trip Characteristics (�1) 0.08 1.39 Perception (�1) � Expectation (�2) 0.66 6.21 Mode Utility (�2) � Perception (�1) -0.12 -1.60 Reduced Form Relations Estimate t-value Perception (�1) � Personal/Trip Characteristics (�1) 0.08 1.39 Perception (�1) � Expectation (�2) 0.66 6.21 Mode Utility (�2) � Personal/Trip Characteristics (�1) -0.01 -1.09 Mode Utility (�2) � Expectation (�2) -0.08 -1.66 Goodness of Fit Statistics Chi-Square Likelihood Ratio Test (DF=248) 35.61 (p=1.00) Root Mean Square Error of Approximation (RMSEA) 90% Confidence Interval in parentheses
0.082 (0.077~0.087)
Standardized Root Mean Square Residual (RMR) 0.015 Adjusted Goodness of Fit Index (AGFI) 0.99 The measurement model giving air passenger expectations on the five service attributes and the latent variable Expectation shows that air passengers consider being on-time (or having
Journal of the Eastern Asia Society for Transportation Studies, Vol. 6, pp. 708 - 723, 2005
719

high travel time reliability) more important than having a lower travel cost. Walking distance, waiting time and in-vehicle travel time have a similar importance impact on Expectation. According to the estimates of the five service attributes on Perception, it is found that air passengers are most satisfied with travel time reliability, followed by in-vehicle travel time. Among the five service attributes, travel cost is the least satisfactory one. These findings are similar to those revealed from the gap analysis and IPA. As the IPA results show travel time reliability located in the Keep Up the Good Work quadrant, while travel cost is the least satisfactory attribute for most of the mode choices. These results imply that the SEM models the data well, and also reinforced the concept that the five service attributes included in this study are critical indicators of Expectation and Perception, and significantly affect passengers’ mode choice decision. The relations among latent variables are shown in Figure 3. Perception has negative impact on Mode Utility, which indicates that air passengers accessed to the HKIA by public modes are less satisfied with the services provided. This can be easily explained, as public transport users are constrained by the pre-determined schedules and locations of the public transport stations, which may not fit the particular needs of each individual air passenger. As a result, the satisfaction on public modes is usually lower than that on non-public modes.
Figure 3. Estimated Relations among Latent Variables According to the reduced form relations, it is noted that Personal/Trip Characteristics is negatively related to Mode Utility. This implies that a negative sign should be added to the estimate of both personal and trip characteristic so as to demonstrate the true relation with Mode Utility. Man, the elderly and those with higher education attainments are less likely to use public transport. In addition, departing air passengers who take long haul flights have a higher penalty cost for missed flights. Thus they are less likely to access to HKIA by public transport, especially franchised buses, as it is less reliable in terms of travel time. Air passengers who access to the HKIA by public modes are required to make more transfers than those who accessed by non-public modes, which results in a positive relation between “number of transfers” and Mode Utility. Under the current service performance, an increase in the travel cost of public transport would decrease its utilization, and air passengers would shift
+
+
-
-
-
Personal/Trip Characteristics
(�1)
Structural Relation Reduced Form Relation
Expectation (�2)
Perception (� 1)
Mode Utility (� 2)
Journal of the Eastern Asia Society for Transportation Studies, Vol. 6, pp. 708 - 723, 2005
720

to non-public modes. Harvey (1986) also found that travel cost is negatively related to the use of public transport as the airport ground access mode. Hong Kong residents, who travel for non-business purposes are likely to use public transport as they are familiar with the public transport system, whereas other travellers will use non-public modes (e.g. taxis, airport shuttle buses, hotel limousine services, etc.) which offer them more comfortable and point-to-point service. Another user of the latter mode is the tour party traveller. The latter two passenger categories are less sensitive to travel cost, the business traveller will have his costs reimbursed by his company or organization, while visitors who are members of a tour party usually have “transport to the airport” included in the tour cost. This trend is shown in Table 2. The SEM results suggested that air passengers who took short haul flights and carried no (or few) baggage have higher tendency to access to the airport by public and/or road-based modes. The interaction effects of residence and number of visits to the HKIA significantly affect the airport ground access mode choices. Hong Kong residents who have more visits to the HKIA are more likely to use public modes. Visitors who visit the HKIA for their first time or who visit the HKIA fewer than three times tend to use non-public modes. This is because non-public modes offer direct access to the airport, thus reducing air passengers’ anxiety. 8. CONCLUSIONS Owing to the greater pressure, regarding airport arrival time, on departing air passengers, this study explored only the airport access mode choices to Hong Kong International Airport (HKIA). Structural relations between passengers’ personal characteristics, trip characteristics, expectations, perceptions and airport access mode choices have been investigated. Unlike previous studies which only included personal and trip characteristics in their models, this study includes the effects of two latent variables, Expectation and Perception, of the service attributes of the airport ground access mode choices. Five service attributes are considered in this study. Walking distance to/from the stations, waiting time, in-vehicle travel time, travel time reliability, and travel cost, are listed as the indicators of the latent variables. Based on the structural equation modeling (SEM) results, it is noted that personal and trip characteristics including gender, age, education level, flight length, and travel cost all negatively impact the use of public transport modes for airport ground access. Visitors (i.e. non Hong Kong residents) who travel for business or visit the HKIA less frequently also have a lower tendency to select public transport as their airport ground access mode choice. The model results suggest that visitors and business air passengers are potential users of the car park at the HKIA, thus the Airport Authority Hong Kong (AAHK) should put effort on attracting these group of air passengers to access to the airport by private cars. In order to provide more information on how to improve the service of various transport modes, gap analysis and importance-performance analysis (IPA) were performed. The gaps in relation to the departing air passengers’ service expectations and perceptions of their airport access mode choices have been investigated. The results of gap analysis indicate that respondents’ perceived levels of satisfaction are lower than their expectations on the five selected service attributes. According to the results of IPA, it was found that travel time reliability is the most satisfactory service attribute. However, waiting time of franchised buses, walking distance to and from Airport Express Line (AEL) stations, travel cost for taxi and private car travel, and waiting time for airport shuttle buses offered by hotels and travel
Journal of the Eastern Asia Society for Transportation Studies, Vol. 6, pp. 708 - 723, 2005
721

agencies all have a high priority for improvement. The above findings indicate that service attributes require more attention from various types of transport operators and AAHK, thus they should modify their service accordingly in order to increase competitiveness and hence utilization. An interesting further study on airport ground access mode choices would be an analysis of the data by different statistical modeling techniques, such as a multinomial logit model, to further confirm the results obtained from this paper. The collection of another set of data so as to determine the seasonal effects on airport ground access mode choices is also advisable. The inclusion of more service attributes in the latent variables Expectation and Perception could provide more information for the transport operators in the effort to improve their services.
ACKNOWLEDGEMENTS
The authors wish to thank Dr. Stephen W.K. Lam, Manager (Land Transport and Communications Division) of the Airport Authority Hong Kong, and his team for their assistance, advice and resources supplied for this study. The work described in this paper was supported by a grant from the Hong Kong Research Grants Council of the Hong Kong Special Administrative Region to the Hong Kong Polytechnic University (N_PolyU 515/01), and a research studentship from the Hong Kong Polytechnic University.
REFERENCES Airport Authority Hong Kong (AAHK). (1999) 1999 Airport Modal Split Survey for Hong Kong International Airport, Airport Authority Hong Kong, Hong Kong. Byrne, B. (1998) Structural Equation Modeling with LISREL, PRELIS, and SIMPLIS: Basic Concepts, Applications, and Programming. Lawrence Erlbaum Associates, New Jersey. Carreno, M., Willis, A. and Stradling, S. (2002) Quality of service for pedestrians: closing the gaps in knowledge. Traffic and Transportation Studies: Proceedings of ICTTS 2002, American Society of Civil Engineers (ASCE), Guilin, People's Republic of China, 23-25, July 2002. Clark, M.C. and Lam, W.H.K. (1990) Airport ground access considerations. Airports into the 21st Century, Hong Kong Institution of Engineers, Hong Kong, 5-7, February 1990. Foote, P.J., LaBelle, S.J. and Stuart, D.G. (1997) Increasing rail transit access to airports in Chicago. Transportation Research Record 1600, 1-9. Foote, P.J. and Stuart, D.G. (1998) Customer satisfaction contrasts: express versus local bus service in Chicago’s North Corridor. Transportation Research Record 1618, 143-152. Golob, T.F. (2003) Structural equation modeling for travel behavior research. Transportation Research Part B, Vol. 37, No. 1, 1-25.
Journal of the Eastern Asia Society for Transportation Studies, Vol. 6, pp. 708 - 723, 2005
722

Harvey, G. (1986) Study of airport access mode choice. Journal of Transportation Engineering – ASCE, Vol. 112, No. 5, 525-545. Hong Kong Transport Department (TD). (2004) Monthly Traffic and Transport Digest. May 2004, Hong Kong. Lo, H.K., Wan, Q.K.H. and Yip, C.W. (2002) Multimodal transit services with heterogeneous travelers. Transportation Research Record 1799, 26-34. Mandle, P.B., Mansel, D.M. and Coogan, M.A. (2000) Use of public transportation by airport passengers. Transportation Research Record 1703, 83-89. Martilla, J.A. and James, J.C. (1977) Importance-performance analysis. Journal of Marketing, Vol. 41, No. 1, 77-79. Metropolitan Transportation Commission (MTC). (1995) 1995 Metropolitan Transportation Commission Airline Passenger Survey. Metropolitan Transportation Commission, California. Metropolitan Transportation Commission (MTC). (2003) Air Passengers from the Bay Area’s Airports, 2001 and 2002, Volume 1: Overview and Methods. Metropolitan Transportation Commission, California. Parasuraman, A., Zeithaml, A.V. and Berry, L.L. (1985) A conceptual model of service quality and its implications for future research. Journal of Marketing, Vol. 49, No. 4, 41-50. Parasuraman, A., Zeithaml, A.V. and Berry, L.L. (1988) SERVQUAL: a multiple-items scale for measuring consumer perceptions of service quality. Journal of Retailing, Vol. 64, No. 5, 12-50. Pels, E., Nijkamp, P. and Rietveld, P. (2001) Airport and airline choice in a multiple airport region: an empirical analysis for the San Francisco Bay Area. Regional Studies, Vol. 35, No. 1, 1-9. Pels, E., Nijkamp, P. and Rietveld, P. (2003) Access to and competition between airports: a case study for the San Francisco Bay Area. Transportation Research Part A, Vol. 37, No. 1, 71-83. Psaraki, V. and Abacoumkin, C. (2002) Access mode choice for relocated airports: the new Athens International Airport. Journal of Air Transport Management, Vol. 8, No. 2, 89-98. Ullman, J.B. (1996) Structural equation modeling. In B.G. Tabachnick and L.S. Fidell (eds.), Using Multivariate Statistics. Harper Collins College Publishers, New York. Zeithaml, A.V., Parasuraman, A. and Berry, L.L. (1990) Delivering Quality Service: Balancing Customer Perceptions and Expectations. The Free Press, New York.
Journal of the Eastern Asia Society for Transportation Studies, Vol. 6, pp. 708 - 723, 2005
723