dynamic modelling using panel data with travel - easts
TRANSCRIPT
r285
DYNAMIC MODELLING USING PANEL DATA WITIITRAVEL INFORMATION ON MULTI_ROUTE
Moon NAMGUNGAssistant ProfessorWonKwng University344-2 Shin Young DongIl<sm ChunBrk Secrul I(oreaPhone 653-50-6722Fax 653-857-7204E-Mail ngmoon@Wonnms.
wonkwang.ac.kr
Soo Lyeon SUNGFull time LecturerSeoNam University720 Kwang Chi Dongf.Iarnq,on ChunB:k Seoul I(oreaPhone 671-620-0236Fax [email protected]
Seung Hwan SEOEngineerNaeKyung Engineering5-1 Yang Jae DongSeocho-ku &rrul Kcmya
Phone 2-579-2748Fax 2-574-4958
abstract : This shrdy analyzed commuters' route choices among th.ree main routestowards their downtown workplaces on a Stated Preference Survey. After stating theirinitial preference, information about routes that would take less time to ffaverse appearedto greatly influence drivers' choices, often provoking them to choose the faster route. Iras[experiences, including the number of times a route had been chosen, prior preferences an(lthe positive or negative results of previous route choices also exerted a sfong inlluence ondrivers' decisions.
1. INTRODUCTION
lntelligent Transport Systems (ITS) are a group of rapidly developing high-tethnologyapplications combining innovations in electronics, informalion science, and conlnunications toreduce Eaffic-associated problems such as faffic jams, accidents zrrd air poliution. Oncof the key componenls of ITS technoiogy is the Advanced 'l'raveler Intbrmation System(ATIS), which enables information exchange between or among automobiles on roads anrltrafflc control centers, thus minimizing traffic congestion, enhancing road safety, an(ienabling an efficient use of the road network.
For ATIS technology to be effective, it has to present the driver with that informationmost likely to be utilized in route decision choices, hence ttle rationale for this study. Thesubjects of our research were commuters in the city of of Chunju who drove toworkplaces in the downtown core. This was chosen as the sample population becar-rse: (i)business functions in Chunju are concentrated in the downtown area which lies at t:hc.
heart of commuting faffic, (ii) the amount of time spent while driving to downtorvnworkplaces is more significant than for other areas in the city, and (iii) the downtown aretris most crowded because commuting traft'ic concentrates on the area in a shclrter lime, anrlmore heavily than traffic outside the main commuting hours. In order bo anah.zecommuting drivers' choices between three main routes[o tire dowtown core, we conducte<l aStated Preference Survey while varying the subjects' access to travel information, an{analyzrd which factors most influenced route choice.
Our analysis was based on the Diszrggregate Behavioral Model (DBM), a model in which
Joumal of the Eastem Asia Society for Transpoftation Studies, Vol. 2, No. 4, Autumn, 1997
1286 Moon NAMGUNG, Soo Lyeon SUNG and Seung Hwan SEO
Lhe behavior of the individual units of analysis, in this case communters, is preserved inthe final representation. In analyses based on the Aggregate Model, by'contrast, thebehavior of individual commuters would disappear from the representation of group choices,making the Disaggregate Model more suitable for this study from both theoretical anclpractical viewpoints. In order to work with the DBM, we tirst had to study the itrs
theoretical background. Then we established a model for Lhe analysis of rcute choosingbehavior over three main routes to the downl<)wn core using the Logit Model, which isvery adaptable to praclical situalions due to its ease ol' calctrlation and quick coefficrientestimation Next, we estimated the model of the route choosing behavior ol downtownroad users in lhe morning rush hours based on lhe data collected lhrough lhe sul'vey.Finally, we analyzed influential factors and their degr-ees of influence on route choosingbehavior.
2. SURVEY OUTLINE
There are many factors which could possibly intluence a clriver's choice oI route: eg.,
travel time, expense, detour distance, past experiences with a xrute, the amount of trafficinibrmaLion drivers have access 0o, and the crowdedness of the route the driver is cun'en[lyon. Since some of these factors are determined by spatial, social and circumstantial factorswhich are dificult to manipulate, we chose kavcl tinre infbrnration about the tluc.e mainroutes as the comparative data, and we exanrine<l the route choosing behaviors ol' drivcrrsas that information varied. When this on-route infonnation was given, driverc wourld
re-evaluate and often change their rrcute choices, integrating Lhe given Lravel tir-rtc:
information with fieir past road experiences and cun-ent tr-affic circums[ances.
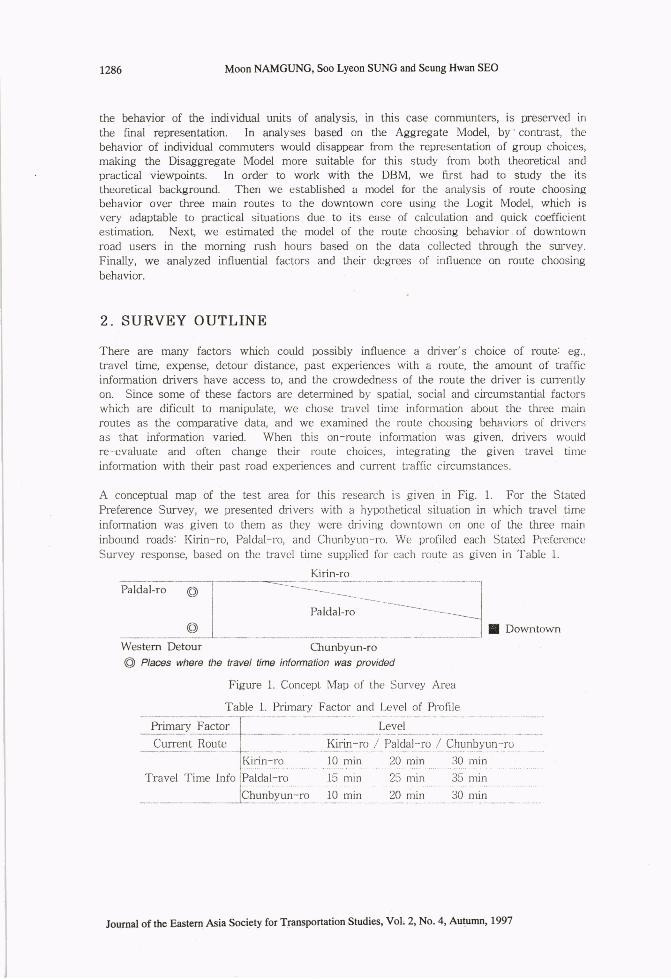
A conceptual map of the test area for this resean:h is given in Fig. 1. For the Stal,ed
Preference Survey, we presented drivers with a hypothetical situation in which travel limeinformation was given to them as they werc driving downtown on one of lhe lhee maininbound roads: Kirin-ro, Paldal-rro, and Chunbyun-ro. We profiled each Stated PrefercnceSurvey response, based on the Lravt:l time supplicxl tbr each route as given in Table l.
Kirin-ro
P"Ld"L- -_
@'t
W"""* D"t"* Chunbyun-ro
@ P/aoes where the travel time information was provided
Figure 1. Concept Nilap of the SLrrvey Area
Table 1. Primary Factor ancl l-evel of Profile
_Prg!-y_lggt fCurrenf Route
'I'ravcl 'lime Infb Paldal-ro
[-evel
|<lt,l_ .ll,{ fql{a! r'o / Chunbl'yn-1g
10 mfn 20 nrin 30 nrin
L5 rrrin 2rl nrin ll5 nrin
,n-.o 10 min 20 min :fO ;ri,
Joumal of the Eastem Asia Society for Transportation Studies, Vol. 2, No. 4' Autumn, 1997
Dynamic Modelling using Panel Data with Travel Information on Multi-Route
We presented our subjects with only 9 travel time conditions, using ttre Ie(31) array t-rl'
cross-relationship to present 4 factors in 9 exlrriments, by showing 9 cards with tripduration information on them to each individual respondent. The Stat€d Pret'erence Sur-vcyfilled out voluntarily by workers in the downtown offices visitecl by the examiner colle<tecldata on the items liste<i in Table 2 (demographic information, normal commuling route inthe morning, preferred route, number of times per week other specific non-prefbrrd routeswere chosen, and estimated travel time). Out of 1,100 questionnaires distributed, 464 wereretumed, giving a 42.18% rate of return.
Survey Subjects hdnju workers who drive to downtown worksites
Demographic information, normal comnruting route in the
Survey Itemsing, preferred route, number of times per weekspecif,c non*preferred routes were chosen,
travel time, SP questions
Survey Method Visitation
3. COMPARISON OF PREFBRRED ROUTES AND ROUTECHOOSING BEHAVIOR
We investigated drivers'likelihood of deviating from their preferred l'oute based on thcprovision of traffic information. Before seeing ttre traffic information, drivers made guesses
about approximate lravel time based on their previous driving exprriences. Once they gotinformation about kavel tinres that differed from their expectations, they tended Lo r-evisctheir initial choices. We also examined how persistent the initial route preference \ ras,
after information about fansit times on other routes was given.
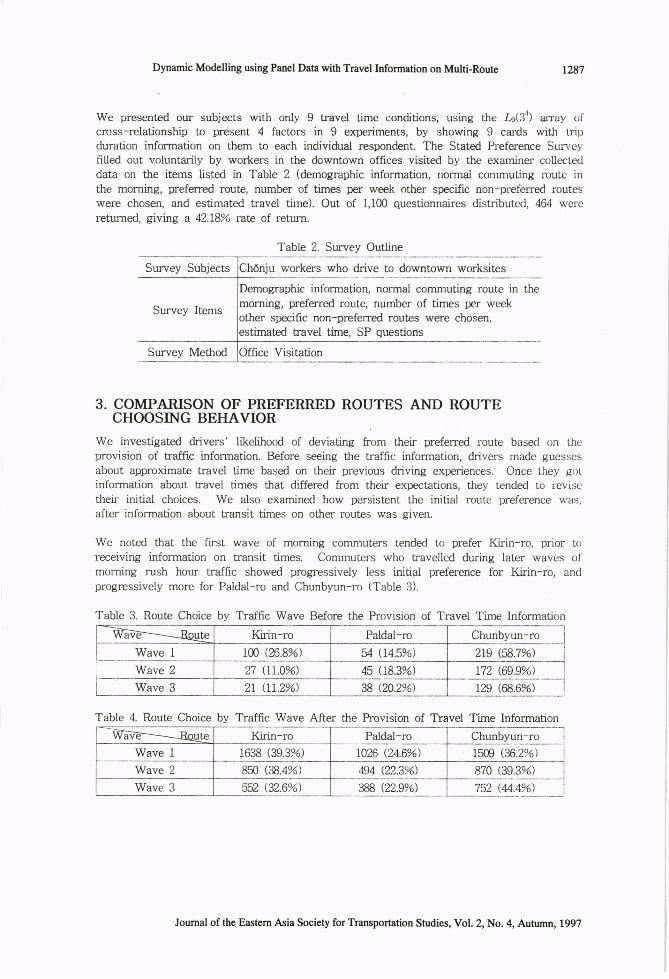
We noted that the fi:'st wave of morning comn'ruters tended to prefer Kirin-ro, prior t<r
receiving information on transit times. Conrmuters who travellet during later waves ofmorning rush hour traffic showed progl'essively less initial preference for Kirin-ro, andprogressively more for Paldal-ro and Chunbyun-ro (Table ll).
Table 3. Route Choice by Trafflc Wave Before the Provision of Travel Time Informarion
Paldal-ro !i,.q_uygn_l" _lWave I A nqs%i 2t9 (ffi.7%\
Wave 2 45 Q8.396)
Wave 3 B (20.2%)
Kirin-ro1638 (39.3%)
8fi @.i%\ 494 (n3%)
552 (n.6%) :w (22.996\
1287
Table 2. Survey Outline
LW (%.8%)
27 {]t0%)2L (l'1.2%)
Tabte 4. Route Choice by Trafflc Wave After the Provision of Travel Time Informafion
rffi (rc.z%) |
870 (q9.3%) __lWave 3
Joumal of the Eastem Asia Society for Transportation Studies, Vol. 2, No. 4, Autumn, L997
Kirin-ro
172 (69.9%)
ln (8.6%)
Wao-e____..-Aourc Paldal-ro Chunbyun-roWave 1 1026 ('u.6%)
Wave 2
1288 Moon NAMGUNG, Soo Lyeon SUNG and Seung Hwan SEO
After the provision of travel time information, choices were more evenly distributed across
Kirin-ro, Paldal-ro and Chunbyun-ro, showing thal drivers responded to the given traveltime information (Table 4).
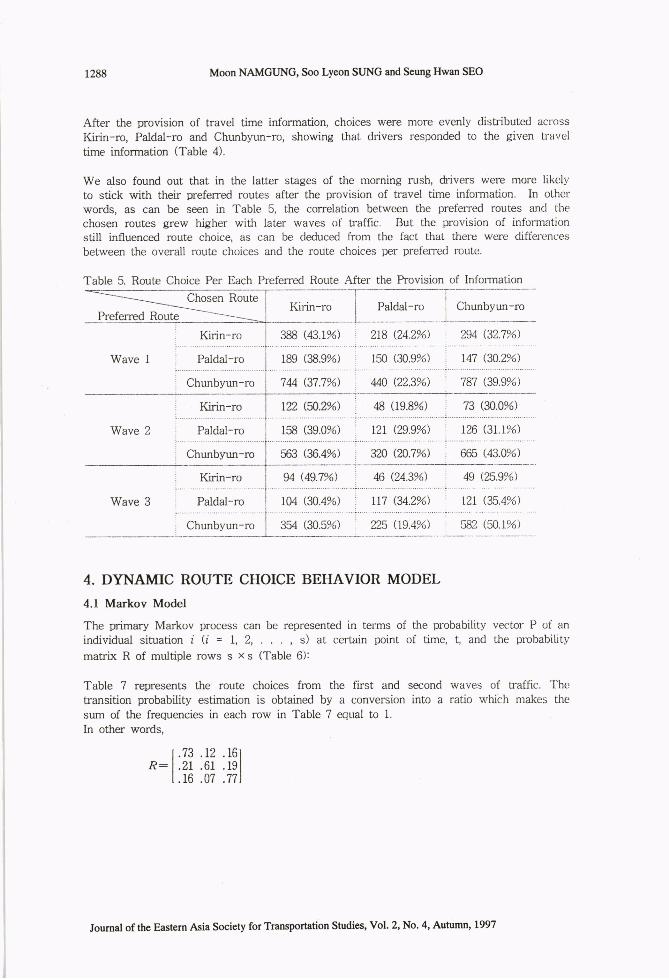
We also found out that in the latter stages of rhe morning rush, drivers were more likelyto stick with their preferred routes after the provision of travel time informati<.rn. In oLher
words, as can be seen in Table 5, lhe correlation between the preferred routes ancl [l.re
chosen routes grew hieher with later waves of Eaffic. But the provision of informationstill influenced route choice, as can be cleducecl from the fact that there were dift'erences
between the overall route choices and the route choices per prefer:'ed route.
Table 5. Route Choice Per Each Preferred Route After the Provision of Infomation
- ** Chosen RouteKirin-r<r
Preferred Route
388 (43.1%) i 218 Q4.2.oA | 294 $2.7,o/o)' . i-
189 (38.9%) : 150 (30.99l,) i 147 e0.2%)ii
744 $71%) | 440 Q2.3%) | 787 $9.994)
r22 (fl.z%) , 48 (r9.8%) 73 ( ,00%)
Wave 1
Wave 2
r Kirin-rot"."'."' ''-." '
, Paldal-ro
i Chunbyun-ro
Kirin;ro
Paldal-roii
158 (39.0%) 1 l2L (29.9.06 | 126 (31.196)
Chunbyun-ro ffi3 (%A%) : 320 (20.7o/d : 665 (43.096)
Kirin-1o
Pu191l-T
Chunbyun-ro
94 Q9.7%) 46 (24.3%\ 4e tzs:e:e4)
t2t (35,494)Wave 3 t04 €,0.40/) 1 \7 (34.2%)
4. DYNAMIC ROUTE CHOICE BEHAVIOR MODEL
4.1 Markov Model
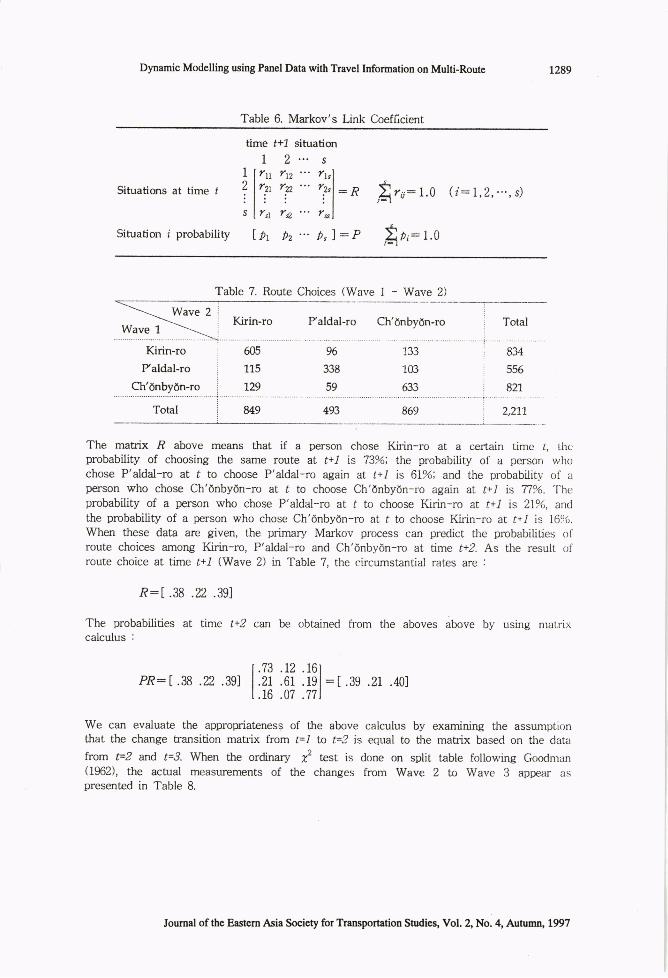
The primary Markov process can be represented in terms of the probability veclor P ol an
individual situation i (r = 1, 2, . . . , s) at certain point of time, t, and Lbe probabiliqr
matrix R of multiple rows s x s (Table 6):
Table 7 represents the route choices fiom the ftst and second waves of traffic. I'heEansition probability estimation is obtained by a conversion into a ralio which makes thesum of the frequencies in each row in Table 7 equal to 1.
In other words,
Ioumal of the Eastem Asia Society for Transportation Studies, Vol. 2, No. 4, Autumn, 1997
Paldal-r'o
r.73 .12 .161R:l .zL .61 .191
[.ro .oz .zzl
Dynamic Modelling using Panel Data with Travel Information on Multi-Route
Table 6. Markov's Link Coefficient
t289
time f+1 situation
I 2...sI lrv rp "' ,'r"l
situations at time , 'rl'l:'f "' 'fl:o !16:r.0 (i:1,2,...,s)
s lrn ,o "' ,'*l
Situation i probabiliry [ 0r bz ... b, ] : P ,l r,: t.O
Table 7. Route Choices (Wave I - Wave 2)
Kirin-ro
Paldal-ro
c_-o*tIl--Total
605
115
12e
u9
133
103
631 .
869
, Total:''i.': 834
r 556
: 82'1,' '' ;
| 2,21L
96
338
59
493
The matrix R above means that if a person chose Kirin-ro at a certain time l, thcprobability of choosing the same route at t+l is 73,uo; the probabil.ity of a person wl'r<>
chose P'aldal-ro at f to choose P'aldal-ro again at t+l is 6l%u; and the probability oI aperson who chose Ch'6nbydn-ro at t tD choose Ch'6nbydn-ro again at t+l is Tl.oto.'l-heprobability of a person who chose P'aldal-ro at , to choose Kirin-ro at t+l is 219lo, anci
the probability of a person who chose Ch'dnby6n-ro at f to choose Kirin-ro at t+l is 169('.
When these data are given, ihe prirnary Markov process can predic! the probabilifies olroute choices among Kirin-ro, P'aldal-ro and Ch'6nbydn-ro at time f+2. As the result oIroute choice at time t+-1 (Wave 2) in Table 7, the circumstantial rates are :
R:[.38 .n .39]
The probabilities at time t+2 can be obtainedcalculus :
tiom the aboves above by using nrat.rix
r.73 .12 .161PR:[.38 .zz .3il l.zt .or .r9l:[.89 .zt .40]
|.rc .ot .nl
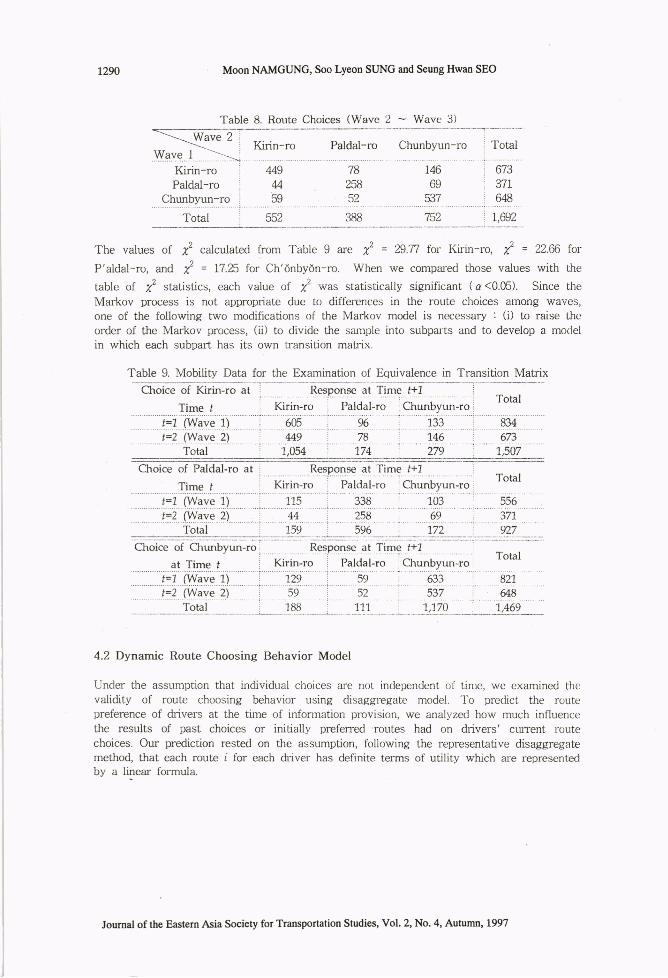
We can evalua0e the approgiateness of tle above calculus by examining the assumptionttrat the change transition matrix from t=l ta t=2 is equal to the matrix based on the data
from t=2 and t=3. When the ordinary x2 test is done on split table following Goxtntan(1962), the actual measurements of the changes from Wave 2 to Wave 3 appear aspresented in Table 8.
Joumal of the Eastem Asia Society for Transportation Studies, Vol. 2, No. 4, Auturnn, 1997
Kirin-roWave 1
r290 Moon NAMGUNG, Soo Lyeon SUNG and Seung Hwan SEO
Table 8. Route Choices (Wave 2 - Wave 3)-1-- wave 2__r\
I
W_qye=. 1 >:-.*Kirin-ro
i
Paldal-ro i
...c-.1,*!yul:tg i
Total i
Kirin-ro Paldal-ro Chunbyun-ro r Total
146
69537
752
ug zauzffi
..5e 5:2
552 388
| 673J/I
:&8i'i 1,692
'lhe values of 12 calculated from Table 9 are Xz = 29.77 for I(irin-ro, x2 = 22.ffi tor
P'aldal-ro, utd x2 = 17.'b for Ch'6nbydn-ro. When we compared those values with lietable of 72 statistics, each value c,f 12 was statistically significant ( a <0.05). Since the
Markov process is not appropriate due to dift'erences in lhe route choices among waves,one of the following two modifications of the Markov model is nec'clssary : (i) to raise theorder of the Markov process, (ii) to divide the sample into subpar-ts and to develop a modelin which each subpart has its own transition mahix.
Isi9=::_,14ry:E!!SChoice of Kirin-ro at i . Rggponse 3! T!n1e_ 1+1 TotalKirin-ro r Paldal-ro Chunbyun-roTime i
Fi lw;"; ill=l ff-avg z1
Total
Ctroice of Paldal-ro at
ri*g I .
r66..96449 ', 78
i: i!l-_.I- ridi -
133 ,; 834
746 : 673
Ki;i;-;" ' patdat-ro :ch;Jy""-Io, too'
f1 (Wgve J) ; .115 ; 338 , 103 s56
E? (W_ur" 2) | 44 i as& : 69 i 371.
Ig!qL__ _ :__ 4?_-_*__-re6,_,- _ y? ____ __e27 __ct.i* "r ct".ur""{.- - Berpo.lts.e- a-t 1i;gl+1_-_l ;;;;...... ......e!. J!r'e ..!. .. .. 1. rilinllo j
. Paldal;r9
, chulpy-un1o;.
__ rotal __ i 18g ,-_ _!!_ ____!.1_0 ____.1,!P__
4.2 Dyn:anic Route Choosing Behavior Model
Under the assumption that individual choices are not inclependent of tinre, we examined thevalidity of route choosing behavior using disaggregalc model. 'lo prcclic[ the routepreference of drivers at the time of information provision, we analyzed how much influencethe results of past choices or initially preferred routes had on drivers' current routechoices. Our prediction rested on the assumption, following the representative disaggregatemethod, that each route i for each &iver has definite terms of utility which are representedby a lilear formula.
Joumal of the Eastem Asia Society for Transportation Studies, Vol. 2, No. 4, Autumn, 1997
Dynamic Modelling using Panel Data with Travel Information on Multi-Route l2gl
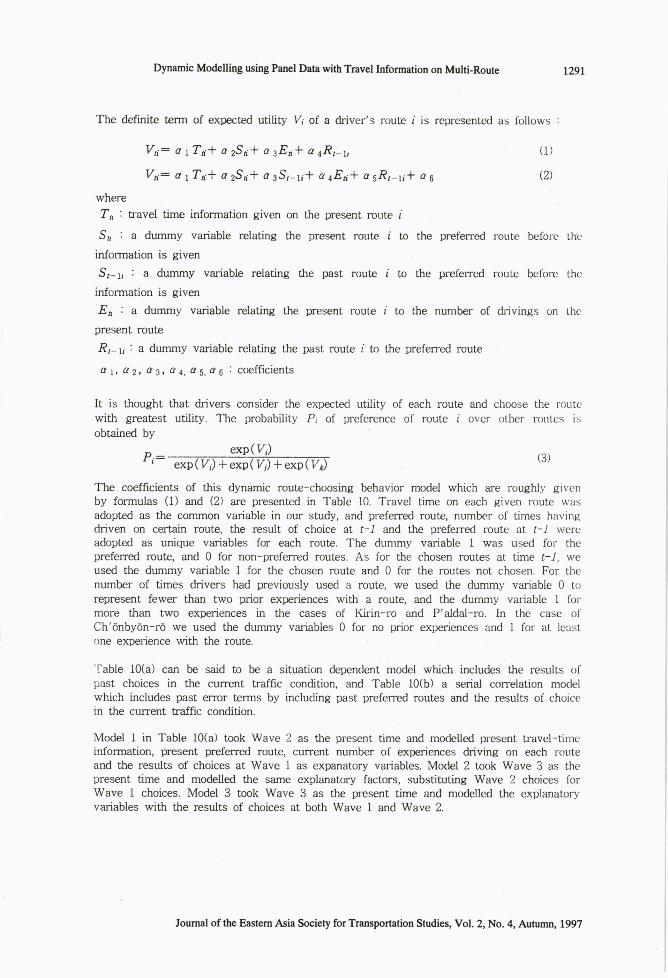
'Ihe definite term of expected utility 7l of a driver's rouLe i is represented as lbllows :
Vt: o 176.1 a2S6t a sE6* a aRp1,
Vt;: a 176.* a2Sa* arSr-ria o a06l a 5R1-y* o 6
where
?r : travel tirne inJormation given on the present route iS, : a dummy variable relating the present route i &o the preferred route belbrc the
information is given
Sr-r, : a dummy variable relating ttre past route i to the preferred r<lube before thcr
information is given
E,i : a dummy variable relating the resent route i to the nunrber of drivings on Lhc
present route
R,-u: a dummy variable relating the past route i to the preferred route
o t, o 2, a S, a t, a g.d 6 i coefficients
It is thought that drivers consider the expected utility of each route and choose the routcwith grea0est utiliW. The probability Pt of preference of route i over other rcutes isobtained by
exp(7)P- ffiThe coefficients of this dynamic route-choosing behavior model which are roughly givr:nby formulas (1) and (2) are presented in Table 10. Travel lime on each given route rvasadopted as the common variable in our study, and prefered route, ntrmber of [imes havingdriven on certain route, the result of choice at t'l and the preferred routr) at f-.1 r/ercadopted as unique variables for each route. The dunrmy variable I was used for thepreferred route, and 0 tbr non-preferred routes. As for the chosen routes at time l--1, weused the dummy variable I for the chosen route and 0 for ttre routes not chosen. For thcnumber of times drivers had previously used a route, we used lhe dummy variabie 0 torepresent fewer than two prior experiences with a route, and the dummy vzriable I ftlr-
more than two experiences in the cases of Kirin-ro and P'aldal-ro. In the case ol'Ch'6nbydn-rd we used the dummy variables 0 for no prior experiences and I for at lcastone experience with the route.
'table 10(a) can be said to be a situation dependent n'rodel which includes the results ofpast choices in the current traffic condition, and 'lable 10(b) a serial correlation modelwhich includes past error terms by including past preferred routes and the results of choicein the current traffic condition.
Model 1 in Table 10(a) took Wave 2 as the presenl tinre and modelled present travel-tinreinformation, present preferred route, current number of experiences driving on each r-orrte
and the results of choices at Wave 1 as expanatory variables. Model 2 took Wave 3 as thepresent time and modelled the same explanatory factors, substituting Wave 2 choices forWave I choices. Model 3 took Wave 3 as the prEsent time and modelled the explanatoryvariables with the results of choices at both Wave 1 and Wave 2.
(1)
tr\
(3)
Joumal of the Eastem Asia Society for Transportation Studies, Vol. 2, No. 4, Autumn, 1997
t292 Moon NAMGUNG, Soo Lyeon SUNG and Seung Hwan SEO
When it came to the code condition of the overall model coefficients, the travel-timeinforma[ion coefficient was of negative value, [he prefered-route coefficient was of posilive
value, the number of past roule experiences coefficients wel'e of positive value, and ail
coefficients were valid. In lerms of significance, for Model I the travel time information
coefficient, preferred-routes coefficient (Paldal-ro and Chunbyun-ro), the number of dr-iving
experiences coefficient (Kirin-ro) and chosen-ror.rte coefficient at time f-.1 were significanl.
at l%o. For Model 2 as well, the travel-time information coefficient, preferred-routes
coefficient (Kirin-ro, Paldal-ro and Chunbyun-ro), the number of driving experiences
coefficient (Kirin-ro, Paldal-ro and Chunbyun-ro) and the chosen-route coefficient at timef-J (Kirin-ro, Paldal-ro and Chunbyun-ro) were significant at 194. Again in Moclel 3, the
travel-time information coefficient, the preferred-routes coefficient (Kirin-ro, Paldal-ro ancl
Chunbyun-ro), the number of driving experiences coefficient (Kirin-ro, Paidal-ro and
Chunbyun-ro), and the chosen-roule coefficients at lime f-.1 (Kirin-ro) and at ttn'p t-2(Kirin-ro, Paldal-ro and Chunbyun-ro) were signiJicant aL l%o. ln Model 3, the value forthe chosen route at time f-l had a bigger influence on time t than that al tinrc t-2. 'lheprediction accuracy rate and log-likelihood ratio for each coefficient was considerable, Thisindicates that not only the current traffic environment but also the driver's route-choicehistory affects immediate route choices. Iloking at the prediction accuracy rates by route,predictions were most accurate for Chunbyun-ro, which explains drivers' preference f<.rr
that route over others.
Modet 4 in Table 10(b) took Wave 2 as the present time and modelled the same set ofexplanatory variables (present travel-time information, present preferred route, cunen[number of experiences driving on each route, and the preferred route), and the results ofchoices at Wave 1. Model 5 took Wave 3 as the present time and modelled the exltlanatorl,variables pius the results of choices at Wave 2. Model 6 look Wave 3 as the present timeand modelled the variables plus the preferred route and results of choices at both Wave I
and Wave 2.
When it came to the code condition of the overall model coefficients, the h-avel timeinformation coefficient was of negative value, preferred route coefficient was of positivevalue, the number of drivings coefficients on each route were of positive value and lhe-v-
were all valid. When it came to the significance of coefficients, in Model 4, the travel-timeinformation coefficient, preferred-rorrtes coefficient (Paldal-ro and Chunbyun-rc), number ot'
drivings coefficient (Kirin-ro and Paldal-ro) and chosen route coefficien! at tinre f-J wet'e
significant at Lo/o. Again for Model 5, the travel-time information coefficient, pref'errerl-routes coefficient (Paldat-r<.r and Chunbyun-ro), number of drivings coefficient (Kirin-ro ancl
Chunbyun-ro), preferred-route coefficient at time t-1 (Chunbyun-ro). chosen-roulecoetTicient at time r-1 (Kirin-ro, Paldal-rrc and Chunbyun-ro), and Lhe constant-tt:rmcoefficient of Paldal-ro were significant at l%o. ln the case of Model 6, the travel-tintcinformation coefficient, preferred-routes coefficient (Kirin-ro and Chtrnbyun-ro), number ofdrivings coefficient (Kirin-ro), and both the preferred-route coefficient (Chunbyun-ro) and
the chosen-route coefficient (Paldal-ro and Chunbyun-ro) at tin're if-l, as well as drtrpreferred-route coefficient (Chunbyun-ro) and chosen-route coefficient (Kirin-ro) at timet-2 were signilicant at 194. ln Model 6, the resr.rlt of chosen route at time f-.1 had a biggerinlluence at time t than that at time f-2. This indicates that not only the current [ra[[icenvironment conditions but also recent route choices and prcferred routes influenceimmediate route choosing behavior. Flit-rates and log-likelihood rates were considerably tbrall variables. When it came to the hit-rates for each route, Chunbyun-ro showed thehighest hit-rates, well explaining preference of Chunbyun-ro in drivers' route choosingbehavior.
Ioumal of the Eastem Asia Society for Transpofiation Studies, vol. 2, No. 4, Autumn, 1997
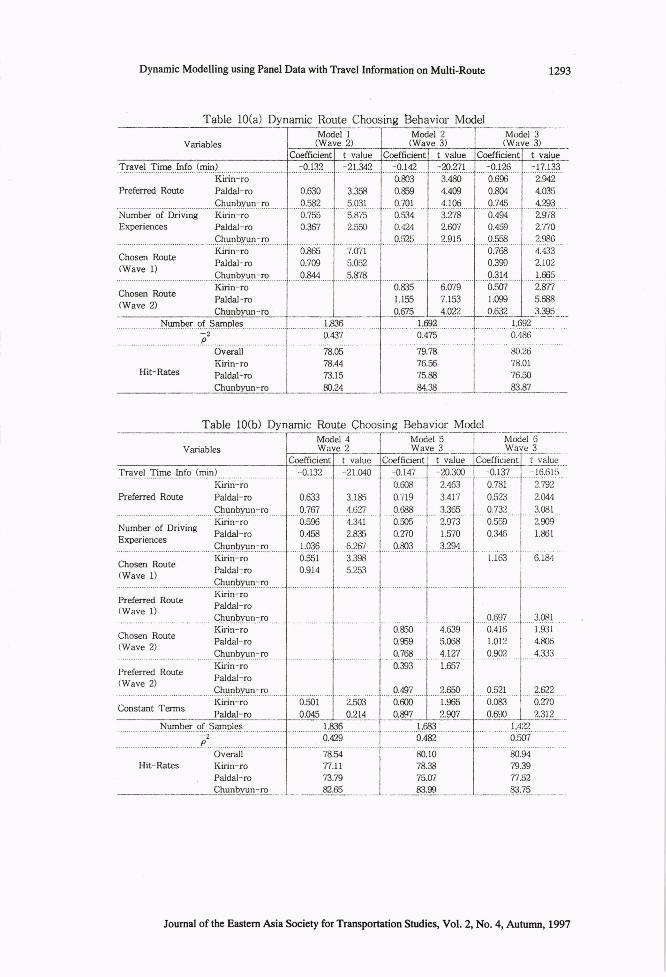
Table lO(a) Dynamic Route Choosing Behavior Model
VariablesModel I(Wave 2)
Courfl"i*tT t *rru"
Model(Wave
c-;n;ilT--Mr.del 3(Wave 3)
Trayg.l rt$e In{C (r,!l). ...Kirin-ro
Preferred Route Paldal-ro
.......... .Qtnn_b.yq$ rp.Number of Driving Kirin-roExperiences Paldal-ro
thcgb,yqr,:'..q- Kirin-roChosm ttoutE(wave 1) l1*]-'o
Uhunbwn-ro
- - Iii;":ioChos lloute
(wave 2) I19-*Uhunbvun-ro
.. ?!,4?.
3.358
s.qql5.875
2.550
i.wr5.052
......q,q7p..
-0.t42 -n.271 -0.126 I -1?-133
o.os6 I z.%i0.804 I a.ogs
0.74s I +zsso.asr I zra0.459 i 2.n0o,sss. I ?fq60.768 I 4.433
0.3s0 | 2.102
9,q11 I 1.66I0.str/ I z.mt.ooe I rms0.632 I r.e95
0.630
0-s2.0.755
0.367
osos0.709
0.&14
0.803
0.869
. o.lql0.534
0.424
9.*.?
0s3s1.r55
0.675
3.4t)0
4.409
-4.,1-06.3.2782.N7
?.91q
oozs7.r534.022
....... .... ....Nshs ef .-qer!pL*.-2....9. .............. . ..
OverallKirin-ro
Hit-Rat€s paldal-ro
Chunbwn-ro
. l{qq .
0.437
,8n578.44
73.r5n.24
..1..@?. .
0.475
ig.ie76.56
75.88
84.38
. r..9q.2 ..0.486
ur.zo78.01
76.50
_aq!z_
Dynamic Modelling using Panel Data with Travel Information on Multi-Route
Table 10(b) Dynamic Route Choosing Behavior ModelModel 4 Model 5
Wave 3Variables Wave 2
!eLv4cr-T pyet figp_ tnlg (nill
.
3.i85
!.6114.341
2.835q,?6'i
3.398
5.253
2.503
0.2r4
-4,9m2.463
3.4r7
i.1652.973
r.570
.?.?e4
i"osg5.068
!.971.657
.?,6501.965
2.gJ7
---0.1_sl0.781
0.523
913.2.0.559
0.346
i.rm
o:697
0.416
r.012
0.902
q,q?1
0.0&i
9.6i! _
1,293
:2-..q?0.n0, ?1.)
-!-r4!9"..:!q,61!i2.n22.W
..i,c-l8l .
2.W1.86I
o.isa
3.081
r.931
4.806,1.333
Prefared Route
Number of DrivingExperiences
Chosen Route(Wave 1)
Pref€red Route(Wave 1)
Chosen Route
1':l:-:lPreferred Route
l'"'."-'lConstant Terrns
Hit-Rates
.Nenbs .-o.f . Q,a+p.!e. sp
Kirin-roPaldal-ro
Qlt-u.1.b...y91,. .oKirin-roPaldal-ro
Q-hy.lF.ygr,-lq.Kirin-roPaldal-ro
_Chgt]-b..yU._r:!-o
Kirin-roPaldal-ro
Qh'+b[l!:rpKirin-roPaldal-ro
9.!rr:tF,tnl:rpKirin-roPaldal-ro
Qhgl-u,tur,-rpKirin-roPaldal-ro
.1,ffi0.48,,
I.83q0.429
80.10
78.38
75.n
1.4:n
0.507
e0.gi79.39
n.52
OverallKirin-roPai&l-ro
---c!l,ILYvsrg--
78ilTI,LI73.19
__4.65_
Journal of thc Eastem Asia Society for Transportation Studies, Vol. 2, No. 4, Autumn, 1997
0.633glft..0.596
0.458
l.g?q0.55r
0.914
0s0i
0.719
..o,qqg0.505
0.n00.803
0.gr00.959
t294 Moon NAMGUNG, Soo Lyeon SUNG and Seung Hwan SEO
5. CONCLUSION
This study carrietl out a panel survey of preferred roules between ttu'ee alternative inbound
routes, and analyz*d the route preferences of drivers before and afger the provision of
traffic information. To summarize :
6) The reason for the big differences between the preferred route betbre the provision of
information and the chosen route after the provision of infornraticln is thought to be due to
the imprtance of travel-time information on route choosing behavitlr,
(2) We drscovered regular ditTerences in initial route preference (beiore the provision <-r1
traffic information) depending on the gender of drivers and the number of experiences
driving on the preferred routes. A-fter the provision of information, the route-choosing
behavior was most affected by age, used route, prefCrred route and the number of
experiences driving on the route.
(3) In ow dynamic route-choice behavior model, travcl time information, preferred route,
number of experiences driving per route, previous pret'erences and the results of route
choices influenced the dynamic route choosing behavior, indicating that a driver-'s
route-choice history still influences immediate route choosing behavior.
Based on these results, we find that drivers choose routes based not only on the crtrrenl
traffic information but also on past experiences and preferred routes,
REFERENCE
Ben-Akiva, M et al (19898) Analysis of the reliabilily of stated preference data in
estinrating modal choice models, WCTR89.
Bonsall P. (1992) I)rivers' acceptance of rouie guidance advice : an international comparision,
conference Record of Papers vehicle Navigation & inlbrmation Systems, 617-625.
Department of Transportation (1993) Intelligent Vehicle l-Iighway Systems Projects, 49-5ll'
DRIVE 91 (1991) Research and Development in Advanced Road Transport Telematics in
Europe, 39-70.
Golob, T. F. (f990) Structural equation nrodeling of travel choicc' dynamics, Devel<lpment in
dynamic and activity-based approach to travel analysis, 343-370.
Goodwin, P. B. Kitamura, R. Meurs, H. (1990) Some principles of dynamic analysis of favel
behavior, Developments in dynamic and activity-based approach 0o travel analysis, 56-72.
Goodwin, P. B. (1990) Family changes and public transporL use 1984-1987; I)ynaraic
analysis using panel data, Transportation 16, 121-L54.
Hensher, D. A. & Smit, N. C. (1990) Estimating automobile utilization with panel data : An
investigation of alternative assumption and eror covariance, 'l'ransportation Ilesearch-A'
Vol. ZA, No.6, 417-4?.6i.
Joumal of the Eastem Asia Society for Transportation Studies, Vol. 2, No. 4, Autumn, 1997
Dynamic Modelling using Paoel Data with Travel Ioformation on Multi-Route l29S
Hensher, D. A. & Wrigley, N. (1986) Statistical modelling of discrete time with panel data,Behavioral Research for Transportation Policy, 97-1i6,
Hensher, D. A. (1987) Issues in the pre-analysis of panel data, Transportation Research.-A,Vol. 21A, No,4/5, ff,5.'zffi.
Khattak, A. J. Schofer, J. L. and Koppelman, F. S. (19S8) Commuters' enroute diversionand return decisions :Analysis and implications for advanced traveler information systems,Transportation Res-A, Yol 27A, No. 2, 101-112.
Kitamura, R. (f988) An evaluation of activity-based travel analysis, Transpofiation, Vol. ,l5.
No. 1-2,9-M.
Kitamw4 R, (1987) A panel analysis of household car ownership and mobility, InfrastructurePlanning and Management B-n.Kitamura, R. (1990) Panel analysis in transportation planning i an overview, TransportationResearch-A, ZA, No. 6, 401-415.
Markus, G. B. (1979) Analyzing Panel Data, SAGE Rrblications, 1-87.
Mews, H. Wissen, L. V. Visser, J. (1990) Measurement biases in panel data, TransFrtation16,275-2W.
Meurs, H. (1990) Dynamic analysis of Eip generation, Transporlation Research-A, Vol. 24A,No.6, A7'442.
Moshe Ben-Akiv4 Steven R. Lerman (1987) Discrete Choice Analysis, 'lhe MIT Press,Secone printing.
Pas, E. I. & Koppelrnan, F. S. (1987) An examination of determinants of day-to-dayvariability in individuals' urban travel behavior, Transportation 14, 3-20.
Pas, E. (1990) Is Travel Demand Analysis and Modelling in the Doldrums?, Devekrpment-sin dynamic and activiW-based approach to travel analysis, 3-27.
Shiroishi, F. (1988) Analysis of the Reliability of Stated Preference Data in EstimatingModels of Travel Mode Choice, Master's Thesis in M.l.T.
Joumal of the Eastem Asia Society for Transportation Studies, Vol. 2, No. 4, Autumn, 1997