analysis of alternative electricity supply for tanga fresh...
TRANSCRIPT

1
INRT
OD
UCT
ION
analysis of alternative electricity supply for tanga fresh ltd
SUSTaINable eNeRgy PlaNNINg aND MaNageMeNTaalbORg UNIveRSITy
Group SEpM7-3p7- 2010


33
abstract
aalborg university - Sustainable energy Planning
and Management, 7th Semester
p7 - project
theme: Sustainable energy Planning and Manage-
ment in a Company perspective
title: Analysis of alternative electricity supply for
Tanga Fresh ltd
projectperiod: . 21. september 2009 - 5. january
2010
projectgroup: SEpM7-3
groupmembers:
__________________________________________
Jannis Klonk
__________________________________________
Florin Bujac
__________________________________________
Friedrich Wochinger
__________________________________________
Rasmus Munch Sørensen
__________________________________________
Steinunn Skúladóttir
supervisors: Anders N. Andersen and ole Busck
number of printed copies: 7
pages: 76
pictures on front page: from Tanga Fresh ltd
In this report, alternative elec-tricity supply for Tanga Fresh Ltd., a diary plant located in Tanzania, is studied. Criteria for a sustainable electricity supply are formed, and an analysis of the inside and outside factors that could have an influence on the future electricity supply of the company is performed. A demand analysis that inclu-des the provision and proces-sing of the data, the seasonal and daily electricity demand fluctuations is performed. Va-rious renewable technologies are studied and the most ap-plicable due to the sustainabi-lity criteria are selected. The chosen technologies: biogas plant and PV installation are described, technically ana-lyzed and modelled. At the end of the report conclusions and future recommendations are presented and the biogas plant is presented as the most economically, environmentally and socially sustainable alter-native for the company.

4

5
foreword
This report “Analysis of alternative electricity supply for Tanga Fresh Ltd.” is written as a seventh semester pro-ject at the master program “Sustainable Energy planning and Management”, at Aalborg university, Denmark. The theme of the semester is “Sustainable Energy planning and Management in a Company perspective”, which is reflected in the research subject.
The project group is an international group with members from several different countries: one member from rumania, one from Iceland, one from Denmark, and two from Germany. The project period lasted from the 21.st of September and to the 5.th of January.
The report is made in cooperation with the Tanzanian dairy company Tanga Fresh Limited, which sought out students to research the possibility of a new alternative electricity supply for the company.
The national electricity grid in Tanzania is rather unstable and suffers from frequent electricity rationings, which results in the company having to use their backup generator significantly more than intended. The pro-jects focal point is therefore to find a more stable long term solution for supplying electricity to the company during grid outages.
The report is divided into five parts. The first part (the two first chapters) serves to describe the problem, the problem formulation and its sub questions as well as to demonstrate how the report is structured. The second part (chapter 3) formulates the context the project research is based on; the context of sustainability. Thereaf-ter (in chapter 4) possible alternative electricity technologies are analysed, and in particular how they fit into the context of the company as well as how sustainable they are in a local context. The fourth part (chapter 5, 6 and 7) details the electricity demand of the company to get an overview of where the main obstacles lie and where the improvements will account the most, as well as analysis of the technologies that are most suited for covering this demand. Lastly, a critical discussion of the results and their applicability for TFL is given, followed by a conclusion.
The project group would like to thank the following persons/companies for their assistance in the project work:
Tanga Fresh Ltd.: Michael Karata, Bertie Jeanlouis, Adam Gamba, Donatus Ndauka, omari Mayonga and Lut Zylstra
D.o.B: Toine Huijbers
bernd Runge

6
1. Introduction ………………………………………………………………………….............………………...………........….........…………8
1.1 Tanga Fresh limited 9
1.2 research question 10
1.3 Limitations 11
2. Methodology..…......................................................………………………..............………………...……..............……….12
2.1 The structure of the report 12
2.2 Choice of Methods 12
2.2.1 literature studies and document analysis 13
2.2.2 Semi-structured interviews 14
2.2.3 Method applied for analysing TFL in its local context 14
2.2.4 Software tools 15
.2.5 Investment Analysis 16
3. Criteria for a sustainable electricity supply...............................………….....………............................………………20
4. TFL in a renewable electricity context................………………………………………….….............................…….………22
4.1 Internal analysis of TFL 22
4.1.1. TFL’s stakeholders and relations 22
4.1.2 Financial condition of TFL 23
4.2 Context analysis and external factor 23
4.2.1 politics and Economy 23
4.2.2. renewable energy resources 24
4.2.3. Technologies – availability and sustainability 26
4.3 Conclusion based on the analysis of TFL in its context 28
5. Electricity demand analysis................………..……………………………………………………..............................…………..30
5.1 Data and information provided; and primary data processing 30
5.2 Data processing 32
5.3 Daily fluctuations 36
5.4 Divergent electricity demand scenarios 37
6. Analysis of biogas and pVs for TFl………………………………………………………………………..............................……….40
6.1 photovoltaic 40
6.1.1 Different pV designs 40
6.1.2 resource conditions 41
6.1.3 Selection of technology 41
6.1.4 Choosing a model 41

7
6.1.5 Expected costs 41
6.1.6 required Data for Energypro 42
6.2 Anaerobic digestion 42
6.2.1 Short technical description 43
6.2.3 Important factors to maintain the biological process and an optimal output 43
6.2.4 Selection of technology for anaerobic digestion at TFL 45
6.2.5 required changes for the planned plant design 46
6.2.6 Available resources for biogas production 48
6.2.7 Environmental considerations 49
6.2.8 Social considerations 50
6.2.9 Economical considerations 51
6.2.10 Further analysis needed (Energypro) 51
7. supply analysis.........................………………………………………………………………….……..…………..............…….......…52
7.1 Supply analysis of photovoltaics for TFL 52
7.2 Supply analysis of biogas for TFL 56
7.3 Conclusion on economic viability of Biogas as alternative electricity supply for TFL 62
8 Discussion and conclusion .............................................................................................................................64
8.1 project approach 64
8.2 results 64
8.3 Critical discussion of results 65
8.3.1 Additional options for TFL 67
8.4 Conclusion 68
references List……………………………………………………………………………………….……………….……..............................…70
IAppENDIX A pre-feasibility study (CD-rom)
AppENDIX B ENErGY DEMAND proJECT (recieved on 13.10.2009) (CD-rom)
AppENDIX C Questions regarding TFL energy (recieved on 04.12.2009) (CD-rom)
AppENDIX D Questions IV _ Tanga Fresh (recieved on 07.12.2009) (CD-rom)
AppENDIX E Electric meter card readings (recieved on 03.10.2009) (CD rom)
AppENDIX F Questionaire 10th december(CD rom)
AppENDIX G Transcription of Interview with Bernd runge (CD rom)
AppENDIX H Questionaire_dob (CD rom)
AppENDIX I ID-450_ generator (CD rom)

8
warming is not the biggest contributor to the melting of the snow-cap, but rather deforestation in the sur-roundings of the mountain due to natives using wood as their primary energy source (National Geographic 2003).
No matter what is causing it, the snow-cap is melting and predictions are that it will be entirely vanished by 2020, which in turn reduces the flow of melt water for hydropower to Tanzania (Handwerk 2004).
The organisation for Economic Co-operation and Development has made a study on climate impacts in Tanzania predicting that the stream flow in the rivers ruvu and pangani is likely to decline due to global warming. This will have a remarkable effect on the local water cycle, which affects ecology and humans. Apart from reduced water resources for consumption a main problem is the reduction of hydro-electricity production for society and economy (oECD 2003, 17).
While only a small fraction of the country’s population has direct access to the electricity grid (roughly 11%) but main parts of the industry are depending on electricity. A large share (approximately 65%) of the country’s electricity production is made by hydropower in the country’s numerous mountainous areas, with the remainder being produced mainly by privately owned thermal generation plants. However, reduced amounts of rainfall in the last years have caused the hydropower plants to produce significantly less electricity than previously. (Tanesco B n.d.)
Besides grid-failures which have happened regularly due to technical instability, the reduction in hydropower electricity has forced the national government to frequently implement nationwide electricity rationing in the last years, with additional severe consequences for the country’s growing industry. (Tanesco B n.d.)
This report deals with a Tanzanian dairy company that is already today severely struck by climate change and the consequences in the region. Because of the national electricity grid problems the company is struggling with its electricity supply. Focus of this report is therefore on uncovering viable and local alternatives for their energy supply to ensure its continued production of dairy products for the Tanzanian population.
”Climate Change has come to be recognized as one of the most critical challenges ever to face human-kind.” (uNFCCC 2007, 5)
Although anthropogenic climate change affects all countries, the impacts are not evenly spread throughout the world. While some developed countries may be affected severely, they also have the adaptive capacity needed to protect their way of life. That is not necessarily the case for a number of developing countries. When it comes to impacts of climate change, the poorest continent Africa is, according to the International panel on Climate Change, also the most vulnerable one (IpCC 2007, 435).
The East African country Tanzania is among the poorest countries in the world, with nearly half of its population below the uN poverty line. Agriculture and industry of agriculture products and light consumer goods, account for the biggest part of the country’s income (oECD 2003, 10). The climate has a considerable influence on the economy of Africa (IpCC 2007, 436), which makes the already poor country particularly vulnerable towards climate change.
Tanzania is located on the coast of East Africa. With its surface area of 945,087 square km it is the larg-est country in the region (National Geographic n.d.). Semi deserts cover half of its area while the other half consists of savannah and bushes (World Travel Guide n.d.). Tanzania homes the highest mountain in Africa, the dormant volcano, Mount Kilimanjaro, which is located in the northern part of the country. Kiliman-jaro is 5.895 meter high and is snow covered all year. The retreat of Kilimanjaro’s snow-cap is immense and has become a symbol of global climate change as the melting is linked to global warming (oECD 2003, 29). However there are scientists who argue that global
1. introduction
figure 1.1: picture of Kidatu Hydro power plant, which with its 200 MW production capacity represents 36% of the currently in-stalled hydro power in Tanzania. (Tanesco A n.d.)
9
INRT
OD
UCT
ION
However, the new dairy factory has already encountered numerous problems with their production. The two most severe are reduced milk production due to extended periods of drought in the dairy’s catchment area (DoB Foundation 2009) and the nationwide electricity rationing, as well as power failures, described in the previous section.
the problems with energy supply to tfl.
While the new factory of TFL was designed with a backup diesel generator to accommodate for frequent breakdowns of the electricity grid, the high operation costs make it infeasible to cover a share of the plants electricity consumption as big as it is at the moment.
Adam Gamba et al. from the processing and Technical Department of TFL describe the factory’s current situation thus:
“Due to high costs of electricity in our factory especially on Generator because of instability in power supply I think alternative energy supply will be the only solution to restore the plant” (Gamba et al. 2009).
as adam gamba points out the cost of their electricity demand is immense significant problem, requiring that they seek other solutions. When the grid is offline, the diesel generator, that was only supposed to be a backup unit, is now used as a primary energy source for the company. As mentioned earlier, the high costs
1.1 tanga fresh limited
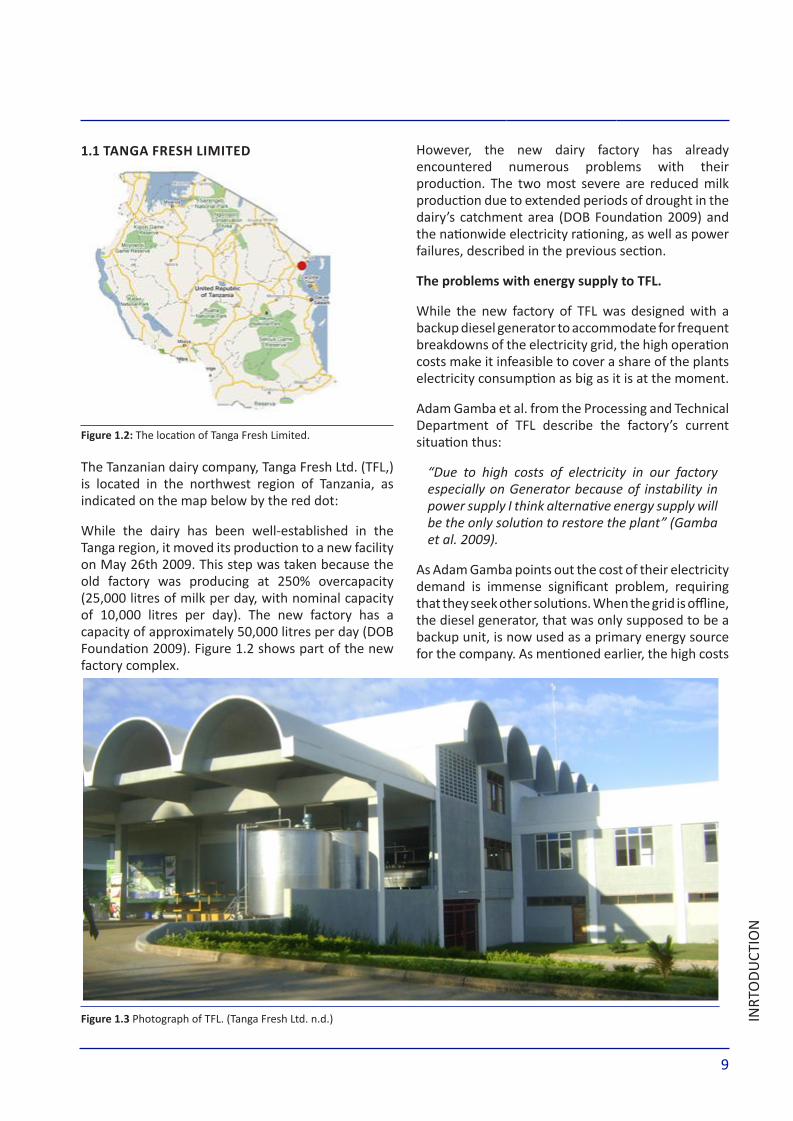
The Tanzanian dairy company, Tanga Fresh Ltd. (TFL,) is located in the northwest region of Tanzania, as indicated on the map below by the red dot:
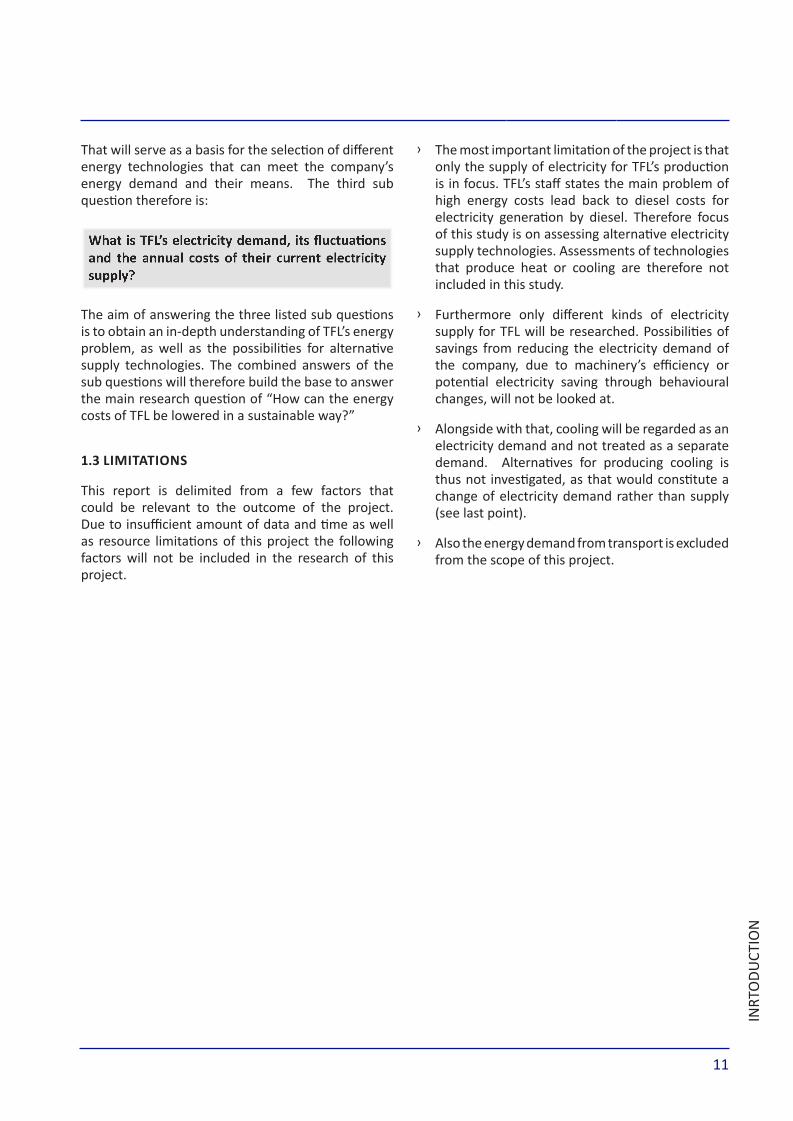
While the dairy has been well-established in the Tanga region, it moved its production to a new facility on May 26th 2009. This step was taken because the old factory was producing at 250% overcapacity (25,000 litres of milk per day, with nominal capacity of 10,000 litres per day). The new factory has a capacity of approximately 50,000 litres per day (DoB Foundation 2009). Figure 1.2 shows part of the new factory complex.
figure 1.3 photograph of TFL. (Tanga Fresh Ltd. n.d.)
figure 1.2: The location of Tanga Fresh Limited.

10
of electricity produced by the diesel generator make it an economically infeasible option for being relied upon for extended operation..
Any new energy supply technologies employed locally at TFL must, at least, be economically favourable to the current situation. In this case, two additional categories of criteria are applied: Social acceptability meaning benefit for the local community, as well as environmental compatibility. These three categories comprise the structure of a commonly used definition of the term sustainability, as depicted in figure 1.4. The three limiting factors shown below will be applied within the context. Those pre-set goals results in defining clearly what social, environmental and economic constraints mean in the context of the company, the region, the country and the local energy sector. This fitting of sustainability will be done in chapter 3.
While the need for an alternative, sustainable energy supply to TFL is urgent, careful considerations have to be made in an effort to minimize the risk of erroneous investment that could possibly put the struggling company in an even worse situation than their current.
With this in mind, the following research question outlines the purpose of this report.
1.2 research question
The research question for this report is the following:
As a specific answer to this question shall contain a direct recommendation for one or more energy technologies to be implemented by TFl, a preliminary analysis of the company and its context is necessary. To this end, the following three sub questions will be answered in order to support the approach towards the overall research question.
Sub question 1:
To be able to plan for a sustainable solution for TFL is it important to get a clear idea of what the new energy supply should entail to be sustainable in this given case. That is, which sustainable aspects should be taken into consideration when planning and implementing a sustainable energy solution for TFL? These questions will be answered by answering sub question 1:
Sub question 2:
Understanding of the company and its surroundings is essential to give a realistic picture on which technologies are practicable and which constraints will have to be addressed in planning for a new sustainable electricity supply for the company. on bases of that knowledge the different technologies can be put into perspective and analysed to see how eligible they are to cover TFL´s demand. These concerns will be addressed in answering of sub question 2:
Sub question 3:
To answer the research question is it necessary to gather information on the company´s current energy supply and the expenses related to that demand.
figure 1.4 The three aspects of sustainability; economic, social and environment.
How can TFL’s costs for electricity supply be lowered in a sustainable way?
What are the criteria for a sustainable electricity supply of TFL?
What constraints and possibilities exist for TFL to meet its demand in a sustainable way? And which technologies meet those preconditions?
11
INRT
OD
UCT
ION
The most important limitation of the project is that ͧonly the supply of electricity for TFL’s production is in focus. TFL’s staff states the main problem of high energy costs lead back to diesel costs for electricity generation by diesel. Therefore focus of this study is on assessing alternative electricity supply technologies. Assessments of technologies that produce heat or cooling are therefore not included in this study.
Furthermore only different kinds of electricity ͧsupply for TFL will be researched. possibilities of savings from reducing the electricity demand of the company, due to machinery’s efficiency or potential electricity saving through behavioural changes, will not be looked at.
Alongside with that, cooling will be regarded as an ͧelectricity demand and not treated as a separate demand. Alternatives for producing cooling is thus not investigated, as that would constitute a change of electricity demand rather than supply (see last point).
Also the energy demand from transport is excluded ͧfrom the scope of this project.
That will serve as a basis for the selection of different energy technologies that can meet the company’s energy demand and their means. The third sub question therefore is:
The aim of answering the three listed sub questions is to obtain an in-depth understanding of TFL’s energy problem, as well as the possibilities for alternative supply technologies. The combined answers of the sub questions will therefore build the base to answer the main research question of “How can the energy costs of TFL be lowered in a sustainable way?”
1.3 limitations
This report is delimited from a few factors that could be relevant to the outcome of the project. Due to insufficient amount of data and time as well as resource limitations of this project the following factors will not be included in the research of this project.
What is TFL’s electricity demand, its fluctuations and the annual costs of their current electricity supply?
12
the methodology chapter describes the methods used to fulfil the tasks of each section of the report.
chapter 3 presents the sustainability criteria for an alternative electricity supply for the company, con-cerning environment, society and economy.
chapter 4 examines the company and its context. It analyses inside and outside factors that could possi-bly and will most certainly influence the future en-ergy supply of the company. In the second part of this chapter the results of this analysis are concluded and the most applicable technologies due to the sustain-ability criteria of the earlier chapter are chosen.
in chapter 5, an electricity demand analysis for TFl is made that includes the provision and processing of the data as well as the seasonal and daily electricity demand fluctuations.
in chapter 6 a detailed analysis of the chosen tech-nologies of chapter 4 is performed. The analysis con-tains a technical description and a detailed resource description, related to the concept of sustainability.
Afterwards in chapter 7 the two selected technolo-gies are analysed and modelled with the help of the software tool energypro.
In the last chapter (chapter 8) a set of conclusions and recommendations will be presented and the most sustainable alternative electricity supply is de-scribed, along with recommended further actions to be taken by TFL in this matter.
2.2 choice of methods
As presented in the introduction, three more con-stricted sub questions were defined to detail the vari-ous aspects that need to be outlined to answer the research question. The combined answers of the sub questions will therefore give the background knowl-edge needed to approach the main research ques-tion.
Different kinds of methods and programs are applied throughout different analyses in the project. There are both separate as well as combined applications of those programs and methods. They are used to es-tablish the necessary knowledge needed to build the foundation for the project as well as to contribute to an accurate assessment of the feasibility of the differ-ent technologies.
This chapter will account for the methodology that is used to answer the research question and its sub questions, on an alternative and renewable electric-ity supply for Tanga Fresh Ltd. It will start with a short description of the structure of the report, where after the choice of methods are highlighted and the differ-ent methods are presented in detail and are analysed. The methods will be described in the order they ap-pear in the report.
2.1 the structure of the report
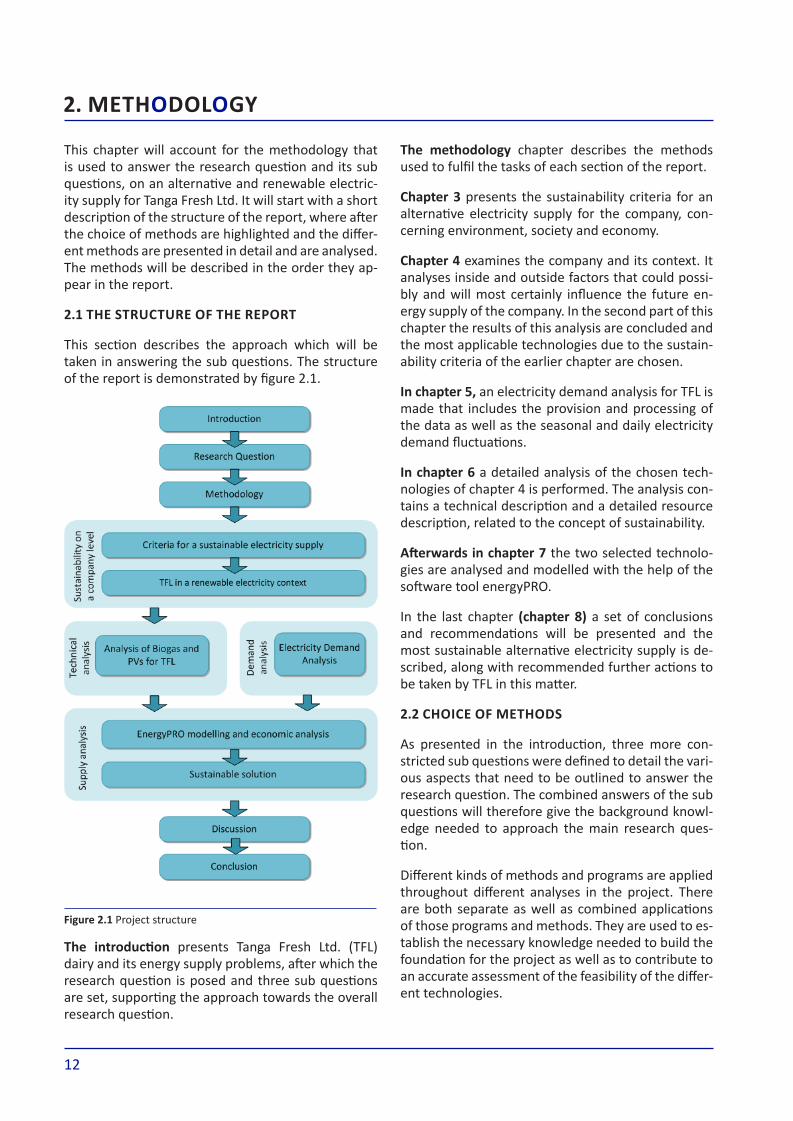
This section describes the approach which will be taken in answering the sub questions. The structure of the report is demonstrated by figure 2.1.
The introduction presents Tanga Fresh Ltd. (TFL) dairy and its energy supply problems, after which the research question is posed and three sub questions are set, supporting the approach towards the overall research question.
2. methodology
figure 2.1 project structure
13
MET
Ho
Do
LoG
Y
Communication with TFL and its stakeholders can im-prove the outcome of the project vastly, as the stake-holders have the needed insight into the prospects and barriers that face the company. Heavily relying on data from the interested party of the project can however, in some cases have quite negative conse-quences and in severe cases even totally ruin the project (Andersen, 2005, p. 150).
2.2.1 literature studies and document analysis
Literature studies is used in the project as a tool to get an impression of the company and its location, knowledge on renewable energy technologies, as well as getting a fundamental understanding on the theory of sustainable development and its means in the energy sector in general.
As TFL is located in Tanzania and as the company only got established relatively recently, a limited amount of literature could be made available on the company from the project groups work location in Denmark.
The main literature applied in the report is books on renewable technologies. Documents and studies from internet sources are used as supplementary lit-erature to the more theoretical and technical litera-ture from the aforementioned books. There is a fair deal of documents and studies available on estab-lishing renewable energy technologies in Tanzania, and even in the Tanga region where the company is located. The main problem is that those obtainable documents and studies are mainly on technologies
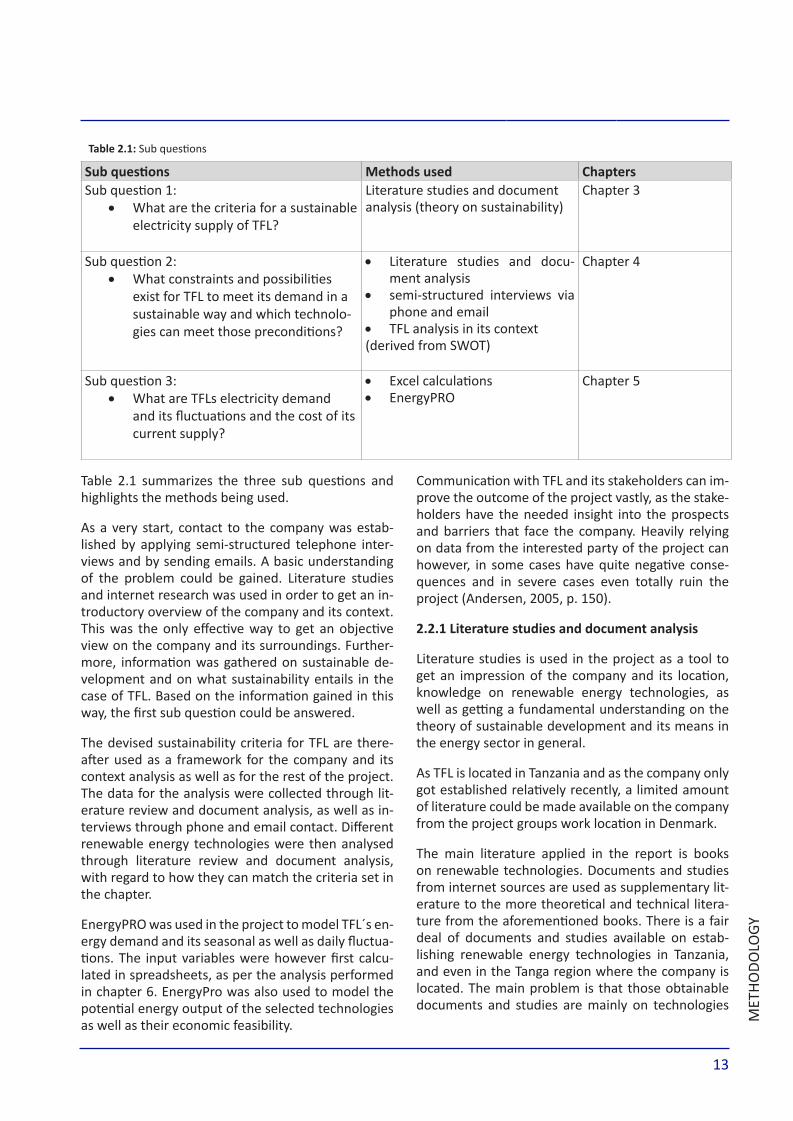
Table 2.1 summarizes the three sub questions and highlights the methods being used.
As a very start, contact to the company was estab-lished by applying semi-structured telephone inter-views and by sending emails. A basic understanding of the problem could be gained. Literature studies and internet research was used in order to get an in-troductory overview of the company and its context. This was the only effective way to get an objective view on the company and its surroundings. Further-more, information was gathered on sustainable de-velopment and on what sustainability entails in the case of TFL. Based on the information gained in this way, the first sub question could be answered.
The devised sustainability criteria for TFL are there-after used as a framework for the company and its context analysis as well as for the rest of the project. The data for the analysis were collected through lit-erature review and document analysis, as well as in-terviews through phone and email contact. Different renewable energy technologies were then analysed through literature review and document analysis, with regard to how they can match the criteria set in the chapter.
Energypro was used in the project to model TFL´s en-ergy demand and its seasonal as well as daily fluctua-tions. The input variables were however first calcu-lated in spreadsheets, as per the analysis performed in chapter 6. Energypro was also used to model the potential energy output of the selected technologies as well as their economic feasibility.
Sub questions methods used chapters Sub question 1:
What are the criteria for a sustainable •electricity supply of TFL?
literature studies and document analysis (theory on sustainability)
Chapter 3
Sub question 2:What constraints and possibilities •exist for TFL to meet its demand in a sustainable way and which technolo-gies can meet those preconditions?
literature studies and docu-•ment analysis semi-structured interviews via •phone and emailTFL analysis in its context•
(derived from SWoT)
Chapter 4
Sub question 3:What are TFls electricity demand •and its fluctuations and the cost of its current supply?
Excel calculations •energyPRO•
Chapter 5
table 2.1: Sub questions
14
open to give the respondents the option of elaborat-ing on the questions and to leave the possibility of dialog on the subjects open. This method turned out to be particularly time-consuming as it took a long time for the respondents to answer each time; in addition to that most of the answers to the “email-interviews” lead to even more questions that needed to be answered. The closer it drew to the projects deadline the more detailed and structured the “email interviews” became, to make sure the needed data were provided.
As the interviews were conducted via email no one of the project group could be present to clarify or elaborate on the questions when the respondents were having difficulties with answering them. The result was that many of the questions sent to the re-spondents were misunderstood, resulting in partially contradicting answers, or were even left unanswered completely. Another factor that could have played a role in the difficulty of getting relevant response could be that the respondents may have lacked knowledge or understanding of the topic of the project, although emphasis was put on the questions to be held as easy to understand as possible. Due to this difficulty more assumptions had to be made, especially on the exact demand and resources available in the local area.
The empirical tools, which were explained in the section above, were also used within the analysis of the company and its context, which forms the base of delivering a strategy for further decisions.
2.2.3 method applied for analysing tfl in its local context
In order to develop planning, one-criterion ap-proaches were used by planners in the past. Those approaches were based on demand forecasts or the search of an efficient low-cost supply. Accord-ing to Terrados, Almonacid and Hontoria (2007), in the early 1980s however, planning processes in re-lation to energy planning started to consider social and environmental issues and have therefore lead to the use of multi-criteria decision techniques like SWoT. The SWoT analysis originates from manage-ment and strategy planning theory. The technique is widely used to analyse key or critical success fac-tors of a company’s venture or any project in general. The company and its context analysis in this project has been energy focused and will be based on SWoT (strengths, weaknesses, opportunities and threats).
that cover energy demands on small scale for private households or the national level. Because of this dif-ference in scale, much of the existing literature was not applicable for the present project. The attempt of finding info on medium scale projects within devel-opment aid organisations like Danida shows poor re-sults as most of the projects chosen are handed over to consultant companies, which are likely to keep their recipes of success for themselves. Available and obtainable literature on renewable technologies on company scale mainly deal with projects established in the developed parts of the world. For this reason they could only be used with caution, to get an over-view about the pros and cons of each technology and are presented with the main differences expected in TFL’s context.
Throughout the project document analysis had to be done, as it turned out that in some cases a lot of literature on the subject exist with different sources having contradicting information. Mainly the date of the source, but also its origin were chosen as the de-termining factors for the selection of the most reli-able sources.
2.2.2 semi-structured interviews
“...typically refers to a context in which the interview-er has a series of questions that are in the general form of an interview scheduled but is able to vary the sequence of questions. The questions are frequently somewhat more general in their frame of reference from that typically found in a structured interview schedule. Also the interviewer usually has some lati-tude to ask further questions in response to what are seen as significant replies.” (Bryman 2008, 196)
Semi structured phone interviews were conducted in order to get in contact with parties and persons that were expected to hold important information. This way was expected to be a fast and uncomplicated way of communication in the data acquisition proc-ess. However, due to the fact that the phone connec-tion between Denmark and Tanzania turned out to be generally poor and since the contact persons were often not reachable by phone, it was decided to rely on email in order to get contact with the different parties.
Gathering information, via email, from the company and its stakeholders was done in a similar way. At the beginning there was a series of general questions sent out to the company. The questions were relatively
15
MET
Ho
Do
LoG
Y
positive and negative factors at the same time.
Alongside the SWoT methodology positive and nega-tive factors will be concluded by an evaluation. This conclusion represents the strategy building that would generally follow a SWoT analysis. This way fur-ther decisions for the project are projected and the path for further analysis is drawn. The main objective is to choose the most viable technologies of the ones evaluated.
2.2.4 Software tools
In order to get an in depth understanding of the electricity demand of TFL, and of possible solutions to meet it in a sustainable way, not only average de-mand values have to be gained. rather, those values need to be interpreted, and daily as well as seasonal fluctuations have to be found out about, and need to be modelled. This has to be done in a manner so that the expected future electricity demand is mod-elled on (at least) an hourly basis for a year, as the fluctuations in consumption can play a decisive factor for the economic feasibility of the analysed electricity supply technologies.
The two software tools Microsoft Excel and energy-pro were used for the specific demand and supply calculations and modelling. Energypro was devel-oped for commercial application by EMD Interna-tional A/S. It is a software tool which allows consist-ent and comparative evaluation of energy projects, combining technical and economical analysis into one tool. The main idea behind the software pack-age was the creation of a combination of technical and economical analysis tool for multi dimensional energy projects – with the original idea to optimise and evaluate combined heat and power (CHp) plants (Blarke 2007,475). It is especifically useful because varying system constraints and control strategies can be considered.
The energypro user can input a wide range of data such as different energy plant types and operating strategies, tariffs, investments, operation and mainte-nance costs, finance arrangements and plant depre-ciation and taxation models. With its ability to con-nect complex interrelations between the demand, the resource availability, the environment and the economy, it is able to calculate the costs as well as to determine the overlap of electricity demand and the hours in which electricity can be made available, as well as environmental pollution levels.
The analysis’ aim is to determine these concerns ac-cording to the company’s goal. Those four aspects are structured as internal (strengths and weakness-es) and external factors (opportunities and threats) that affect the venture of focus. Taking its core from the technique of a SWoT analysis, the analysis of TFL and its context is established to leverage strengths and capitalize on opportunities as well as to work on weaknesses and to mitigate threats when devel-oping a strategy for future action (Harvard Business School Essential 2005, 2-28). To understand why the SWoT technique was not directly applied within this project but still forms a reasonable baseline for fur-ther progress the SWoT technique’s main objectives are presented below.
In the methodological theory of SWOT, Michael Por-ter focuses on a five forces model in order to analyse the general competitiveness of a company.
(1) “The threat of entry by potential competitors; (2) bargaining power of suppliers; (3) bargaining power of buyers; (4) the threat of substitute products and (5) the rivalry among established firms”.(Bernroider n.d, 564)
However, authors [e.g. Houben, Lenie and Vanhoof (1999), Bernroider (2002)] agree on the fact that it is not possible to determine a universal list of aspects for all companies and that single factors have to be specified in the projects context.
regarding the present issue of developing an alterna-tive and sustainable energy supply for TFL, porter’s model can hardly be used, as other competitors are not of essential importance; it is neither the influence on their product market but rather all influences on the political, socio-economic and environmental lev-els, which have to be analyzed in depth, in order to get a good knowledge of the possible strategies for the company. So it is the researchers’ duty to decide which of the aspects are of interest to the analysis.
Another problem occurring during the working proc-ess was that it turned out to be problematic to merge all strengths, all weaknesses, all opportunities and all threats together in a chapter each. The reason is that in this project single topics like a technology or a re-source hold advantages and disadvantages that are closely linked with each other. Therefore it was de-cided to structure this part not by SWOT factors but by single fields in the topic and present each topics

16
and design to obtain a possibly feasible solution in order to minimize the actual diesel consumption.
While energypro was developed as a perfect plan-ning tool – if all outside factors are known – it is not capable to deal with unpredictable situations like the one at hand. Wrong graphical representations oc-curred, leading to further necessary interpretations of the real electricity supply. However the overall de-mand and supply amounts are correct and only need to be explained in a bit further detail for it to be im-mediately understandable by the reader.
2.2.5 investment analysis
To establish the feasibility of the different technolo-gies, simple payback time calculation on the alterna-tives as well a net present value calculation, will be done. This section will describe the calculations and how they intend to be applied in this study.
simple payback time
A “Simple payback Time” calculation is done on the different investment opportunities, simultaneously, to see how many years it will take for the diesel and electricity savings from the investment to mount up to the initial investment amount, as the formula be-low demonstrates.
Initial investment costs Yearly incomes from the investment = payback time
This method does however have its flaws as:
“it doesn’t take account of interest;•
it doesn’t take account of the in-payments •payable after the payback time;
there is no objective measure of how short the •payback time has to be to consider the investment as profitable.” (Lund 2003, 8)
Therefore, the payback time calculation is only made to get a general idea of how the different invest-ment opportunities compare to each other and to get a glimpse on which technical solutions might be economically feasible and which might not. More complex calculation will be needed to establish the feasibility of the different investment opportunities, where interest rate is included into the calculation as well as the scrap value. This will be done by calculat-ing the “Net present Value” of each investment op-
The two applied software tools go hand in hand in every step. While the calculations were mainly done with Excel, energypro was used to get the full picture and graphical representations, as well as accurate de-scriptions of how the demand variations could be met by the analysed technologies. To start off, Microsoft Excel was applied in order to determine an expected electricity demand for the coming years. Some few data were provided by TFL, however, for reasons de-scribed in chapter five, those values showed huge data gaps. Through Excel spreadsheets, general as-sumptions were arrived at, and with that general as-sumptions for TFLs electricity demand could be de-rived.
While the seasonal demand variations were derived on the basis of those determined assumptions and preconditions, daily and hourly fluctuations were modelled as well, on the basis of spreadsheet cal-culations. Knowing the overall monthly electricity demand, as well as the peak load consumption, the hourly demand could be modelled through energy-pro. In order for the program to do that, the electric-ity market has to be defined – in the present case, the electricity market equals to the hours when the grid is on.
After the demand has been determined, in a second step, the determination of the suitable electricity sup-ply source took place. Besides the current electricity supply of the grid and the diesel generator, the best technologies to fit to the social and environmental sustainability criteria of chapter 3, as found through chapters 4 and 6, were modelled into energypro.
Energypro helped to find out how well the elected technologies fit the demand, and how much savings they will provide TFL compared to their costs and op-eration. The amount of potential biogas production and the environmental conditions, ambient tempera-ture and solar irradiation, for the photovoltaics were added to the program. Energypro was then able to determine the electric output for the Pvs, and model the additional electricity produced by the biogas and add up the missing MWhs with the grid – if on – and the diesel engine – if still needed.
The economic analysis was focused on the optimal size of a gas storage, and the best size of a photo-voltaic installation. Here the focus was, as stated be-fore, an economic one, for this part of the analysis. Through Energypro the right measures were deter-mined, and it was decided on a specific technology
17
MET
Ho
Do
LoG
Y
project period (n) and scrap value (s)
The project period used for the NpV is often the lifetime of the investment, which in the case of this project would be the lifetime of the alternative elec-tricity technologies. But predicting incomes, from a given project, estimated far into the future can be risky and unreliable. Therefore, in this report, there will be used a project period of 10 years, in all cases, even though the technical lifetime of the investment can be longer. To accommodate for this shortened project period time, the scrap value of the investment will be taken into account, as the invest-ment does have an economic value at the end of the project period.
As the scrap value is a future value it also has to be calculated into a present value. To do that the future value is multiplied with the discount factor as the for-mula below demonstrates (Lund 2003, 4)
present value = Future value × (1 + i)^(-n)
net present value
Net present Value (NpV) calculations are made to compare the value of money today to the same amount of money earned in the future, taking dis-count rate and returns into account. The purpose is to try to maximize the profit from an investment and/or to choose the right investment from a range of investment opportunities. A positive NpV means that the investment is profitable and therefore fea-sible but a negative NpV makes the investment un-profitable and most likely not worth making. (Lund 2003, 5) The discount rate and the project period of the investment do however influence the NVp, and
portunity.
discount rate (i)
To do a Net present value (NpV) calculation on an in-vestment, a discount rate has to be decided on. The rate is established by considering what interest the yield capital, for a project, would provide given that it would be used in another way. This rate is “defined as the interest/discount the investor uses in his invest-ment calculations when the amount has to be con-verted on time.” (Lund 2003, 2) As Lund points out, the discount rate is used to convert the predicted in-come from a given investment project to the current market value.
The higher the discount rate is set, the less the future income from the investment is valued in the calcula-tion. That is, if the discount rate is relatively high, the investment has to be very lucrative to be competitive with a zero scenario (business as usual).
The discount rate varies depending on the country, the investment possibilities and the consolidation of the project invested in.
The discount rate from the Central Bank of Tanzania is set at 15.99% (numbers from 31 December 2008) (CIA 2009) which is extremely high compared to western countries standards, due to the economic instability in the country. For example a discount rate of 3.5% is used in Denmark (CIA 2009)
TFL and the d.o.b. foundation have expressed that there is a possibility for TFL of getting a loan with 8% interest rate and the NpV calculations will therefore be made with the discount rate of 8% as well as with 16% as a sensitivity analysis.
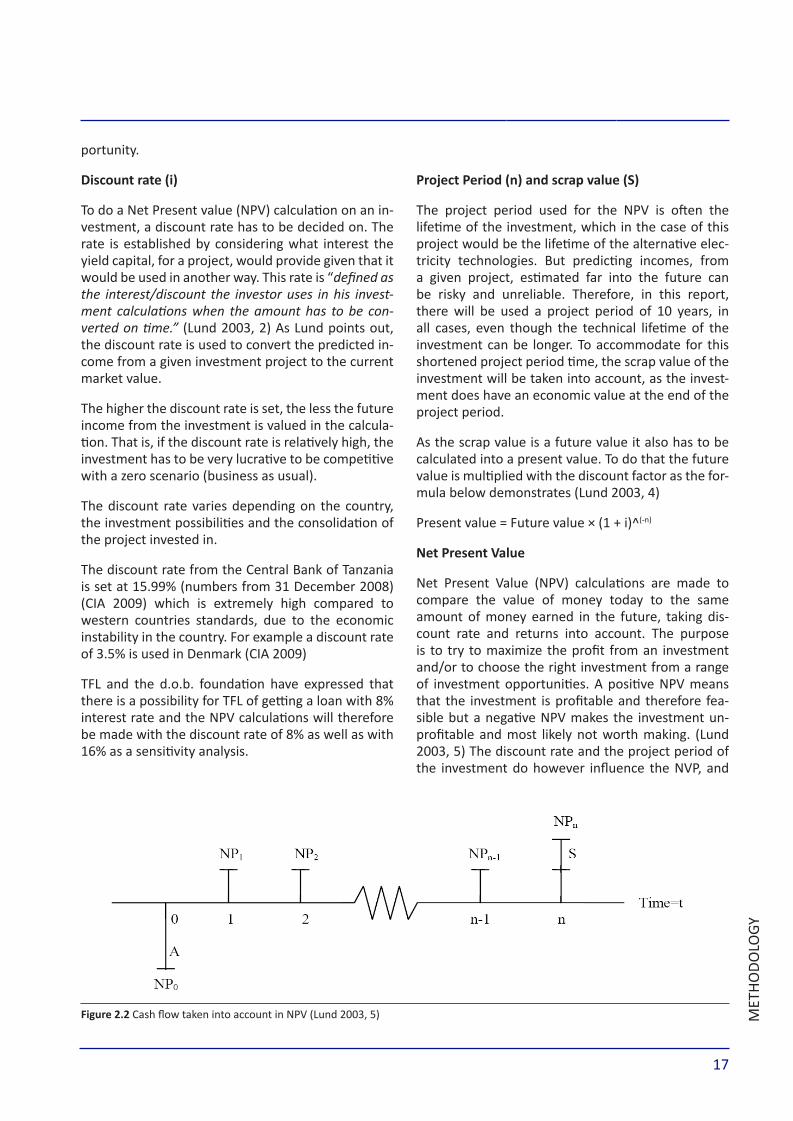
figure 2.2 Cash flow taken into account in NpV (Lund 2003, 5)

18
The formula used for making the NpV calculations in this project is:
NpV = Investment - S + Np x (1 - (1 + i)- n) / i
In order to find the most feasible investment oppor-tunity for TFL, NpV calculations will be done on “busi-ness as usual”, where the NpV of 10 years continued use of the current supply methods is calculated. This NpV will then be subtracted from NpV of a number of alternative investment opportunities, which can give two results: Negative values, which indicate the alternative investment is not economically feasible for TFL given the set conditions; or positive values, which will indicate a net surplus from investment in the analysed alternative investment.
In case of multiple positive NpV’s on alternative in-vestments (for example if different photovoltaic in-stallations are all economically feasible), the specific investment with the highest positive NpV will be re-garded as the most profitable alternative investment solution.
After the presentation of methodology used to an-swer the research question and its sub questions the next chapter will analyse the sustainability criteria, which form the baseline of further decisions within the project.
by achieving a better discount rate or a longer project period, a negative NpV calculation could become positive.
Figure 2.2 shows a possible cash flow of an invest-ment. Where
NP• 0= Initial investment amount
Np= Net payment (incomes from the •investment)
n= project period •
S= Scrap value of the investment at the end •of the project period (n).
The first line facing down (Np0) on figure 2.2 repre-sents the initial investment amount, in the case of this project the price of the new technology and its instal-lation. The smaller lines facing upwards (Np1-n-1) indi-cates the savings from the investment. That is, how much will the company save each year by investing in the alternative technology. The last line also includes the scrap value of the investment. The annual saving is calculated by subtracting the costs that might arise from the new technology, from the savings earned by lowering the diesel consumption and the use of elec-tricity from the national grid.

19
MET
Ho
Do
LoG
Y
20
for sustainable development” (FAo 1995), built on the Brundlandt report.
Several chapters in the Brundtland report, like chapter four – “changing the consumption patterns”, promot-ing renewable energy sources, chapter seven – “pro-moting sustainable human settlement development”, focusing on the use of alternative energy sources, in order to limit negative effects of energy production on the environment and human health, and chapter nine – “protection of the atmosphere”, dealing with the effects of energy provision on air quality and cli-mate change, and calling for programmes to enhance the usage of economically feasible, environmentally friendly energy conversion technologies (FAo 1995). However when taking the example of the company, it gets obvious that still a lot needs to be done. In fact many governments worldwide, as well as institutions and companies have long missed the chance to fol-low the path of a sustainable development.
framework for sustainable electricity supply for tfl
As stated by the Brundtland Commission (1987 b), the sustainability concept can have a different focus ac-cording to the context. “Interpretations will vary, but must share certain general features and must flow from a consensus on the basic concept of sustainable development and on a broad strategic framework for achieving it”.
The Brundtland report starts off with chapter one – a threatened future – and includes the topics of poverty, growth, survival and the economic crisis (Brundtland Commission 1987 a). Most of those is-sues contributed to the dilemma the company has to face today, still the main issue for Tanga Fresh Ltd. today is an economic one. According to the sustain-ability concept the chance has to be taken, to inte-grate environmental and social sustainability in order to leave the track of ignoring the impacts on others, while striving “for survival and prosperity” (Brundt-land Commission 1987 b).
While planning a sustainable electricity supply the vulnerability of the new system has to be minimized. With the current supply it can be seen that, while the grid, which depends heavily on hydro power, is se-verely vulnerable to climate change, the diesel engine is vulnerable to market fluctuations of the fossil fuel prices. While lowering that vulnerability it has to be considered, that ”economic and social development can and should be mutually reinforcing” (Brundtland Commission 1987 b). When opening the closed sys-tem of the company this could hold true, if the new electricity supply creates knowledge and wealth in
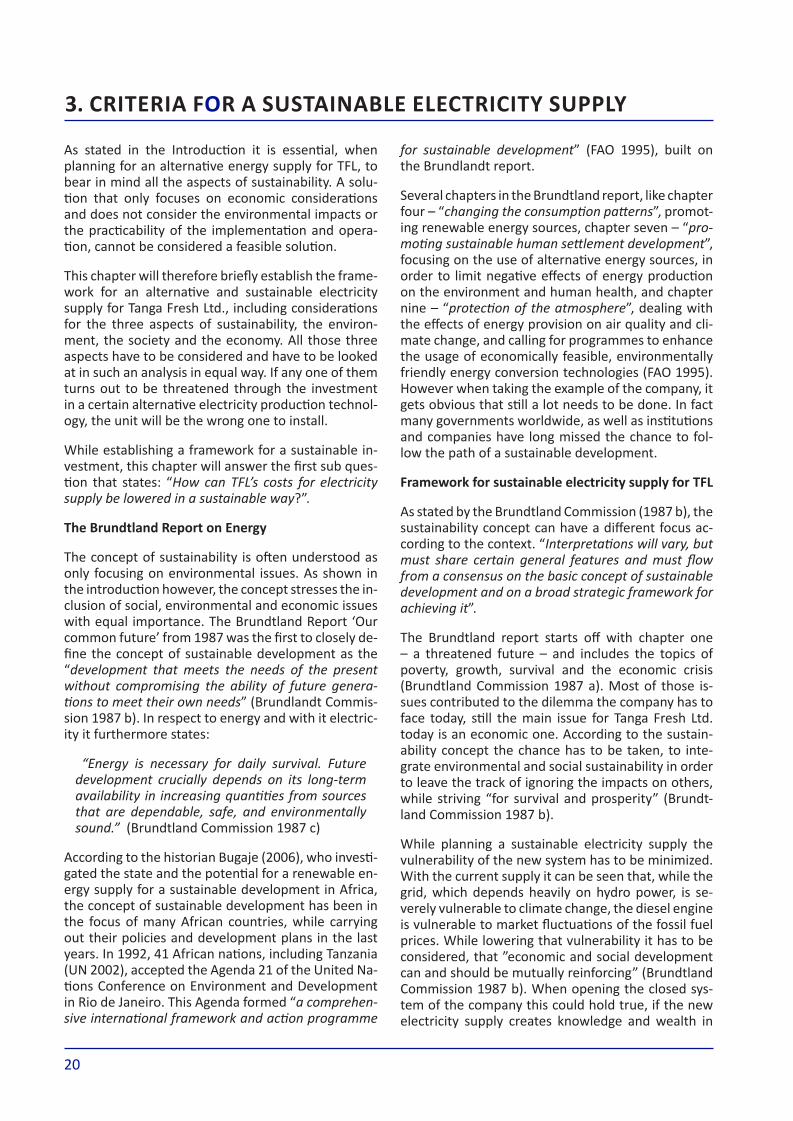
As stated in the Introduction it is essential, when planning for an alternative energy supply for TFL, to bear in mind all the aspects of sustainability. A solu-tion that only focuses on economic considerations and does not consider the environmental impacts or the practicability of the implementation and opera-tion, cannot be considered a feasible solution.
This chapter will therefore briefly establish the frame-work for an alternative and sustainable electricity supply for Tanga Fresh Ltd., including considerations for the three aspects of sustainability, the environ-ment, the society and the economy. All those three aspects have to be considered and have to be looked at in such an analysis in equal way. If any one of them turns out to be threatened through the investment in a certain alternative electricity production technol-ogy, the unit will be the wrong one to install.
While establishing a framework for a sustainable in-vestment, this chapter will answer the first sub ques-tion that states: “How can TFL’s costs for electricity supply be lowered in a sustainable way?”.
the brundtland report on energy
The concept of sustainability is often understood as only focusing on environmental issues. As shown in the introduction however, the concept stresses the in-clusion of social, environmental and economic issues with equal importance. The Brundtland report ‘our common future’ from 1987 was the first to closely de-fine the concept of sustainable development as the “development that meets the needs of the present without compromising the ability of future genera-tions to meet their own needs” (Brundlandt Commis-sion 1987 b). In respect to energy and with it electric-ity it furthermore states:
“Energy is necessary for daily survival. Future development crucially depends on its long-term availability in increasing quantities from sources that are dependable, safe, and environmentally sound.” (Brundtland Commission 1987 c)
According to the historian Bugaje (2006), who investi-gated the state and the potential for a renewable en-ergy supply for a sustainable development in Africa, the concept of sustainable development has been in the focus of many African countries, while carrying out their policies and development plans in the last years. In 1992, 41 African nations, including Tanzania (uN 2002), accepted the Agenda 21 of the united Na-tions Conference on Environment and Development in rio de Janeiro. This Agenda formed “a comprehen-sive international framework and action programme
3. criteria for a sustainable electricity supply

21
crit
eria
fo
r a
su
sta
ina
ble
ele
ctr
icit
y su
pply
very important, it should be easy to integrate into the operations of the company. This can be achieved by the appliance of simple technologies, which can be constructed, operated and maintained by the com-pany itself or by companies situated in the region, preferably in the direct vicinity. Health issues are also of concern and negative effects on the workers and the surrounding population due to emissions and any other form of pollution should be avoided.
on the economic side a first consideration should be that the technology can follow daily and seasonal fluctuations, as well as fluctuations over the years. It is furthermore very important to keep in mind that resource provision has to be guaranteed, in order to provide a stable electricity supply (concept of vulner-ability) and that the investment has to be sustainable. As highlighted by D.o.B. this means, that the invest-ment has to be profitable in the long run. obviously it has to be competitive with the current sources within a relatively short pay back time of 5 – 7 years (D.o.B. 2009).
Table (3.1) again gives an overview of all the sustain-ability criteria mentioned above.
Keeping that framework for a sustainable energy sup-ply for the company in mind, it could act as a role model for future development in the country.
the region, through job creation. It also has to be kept in mind that “economic and ecological concerns are not necessarily in opposition“ (Brundtland Com-mission 1987 c), a combination of those are rather regarded as being able to limit the systems vulner-ability.
Concerning the environmental perspective it has to be guaranteed, that resource consumption has to be limited to the renewable availability of such, and that they are locally available. With that the global and local ecological impacts shall be kept on a minimal level. This holds true for the resource extraction. De-sertification, acidification, toxic emissions as well as the emission of greenhouse gases, should be avoided, and with that the biosphere shall be protected. In or-der to achieve all that, not only the resource extrac-tion, but also the effects of the transport have to be considered. regarding the energy conversion tech-nology, atmospheric pollutants should be avoided and primary energy resources should not be wasted. This can be achieved through efficient energy conver-sion technologies, as well as through the appliance of storage technologies.
In order to be socially sustainable, a new electric-ity supply, besides potential positive effects for the neighbouring community, should also protect impor-tant grounds for food production for example and,
Social economical EnvironmentalShould be easy to integrate - into the operations of the company
Local knowledge for opera-- tion and maintenance and, if possible, technology is needed
The technology should be - simple
Negative effects on work-- ers and population should be minimized (e.g. health issues or occupation of important grounds for food production)
Low vulnerability to market price - fluctuations of fuels
reliable technology which can - guarantee a stable electricity sup-ply
access to resources has to be - guaranteed
Flexible energy supply (daily, sea-- son wise and on the long run)
Low operation and maintenance - costs
Competitive with old electricity - sources
Investment has to be profitable in - the long run
Short payback time (5 – 7 years)-
Low vulnerability to environ-- mental changes
Minimum global and local - ecological impacts in resource extraction, transportation of fuel and energy conversion
Desertification, acidification, - toxic emissions and emission of greenhouse gases should be avoided
Consumption has to be limited - to the renewable availability
Minimum waste of primary - energy resources
appliance of storage technolo-- gies
table 3.1: Sustainability criteria for a sustainable electricity provision for Tanga Fresh Ldt.

22
is described as Venture philanthropy (philantrophic Foundations Canada 2009).
“In 2002, a distribution depot was opened in [400 kilometres distant] Dar Es Salaam. This led to a breakthrough in the market. Now Tanga Fresh is the market leader in the fresh milk sector. Many competitors have come and gone, among other reasons, because they could not guarantee the quality and supply of the milk they produced” (d.o.b foundation 2009b). Due to the expansion investments in a new production site were needed (see also chapter 1.1). This resulted in 2006 in the d.o.b foundation overtaking the shares previously held by FriZania to make further investments.
The d.o.b foundation (2009b) states on its webpage to
“continue the project on the same basis established by Frisania - i.e. in a business-oriented manner with respect to operations at Tanga Fresh, which is necessary for the sustainability of the project. The interest on loans was set under gentle conditions. No dividend will be paid out and everything is aimed at achieving a guarantee of income for the 3,000 farmers and Tanga Fresh staff. The goal is to migrate towards 100 % Tanzanian ownership (TDCU) over 10 years”.
The shareholders of TFL are d.o.b foundation and the farmers aligned in the TDCu. Both investors in TFL have a main interest in further existence and profit-able operation of TFL. The same holds true for the farmers, who also have additional interest and expec-tations towards TFL as they are in daily cooperation and trading with the company. TFL’s incentive to store fodder, which shall be sold in times of drought to the farmers (d.o.b foundation 2009c) illustrates the ad-ditional benefit towards the farmers and other stake-holders. The dependency on seasons is also decreas-ing for consumers and employees. Similar incentives connected with the future energy demand are pos-sible. For example TFL could buy biomass or manure from the farmers in order to utilise it for their energy production and sell fertilizers back to the farmers.
Additional effects from a sustainable energy supply of TFL can be expected for the local population. De-pending on the choice of technologies different so-cial effects and changing environmental impacts will affect the local population. Those impacts are men-tioned in chapter 4.2 and will be summed up in the conclusions of this chapter in point 4.3.
As mentioned in the methodology this chapter will provide an overview of the internal factors of the company and external factors in its surrounding that most probably influence potential solutions for the problem. The internal factors are presented first including an overview of the company’s history to give a better understanding of certain preconditions. The external factors, influencing a possible electricity supply solution, are presented subsequently. As argued in chapter 2 the chosen structure focuses on subject areas instead of a structure divided in strengths and weaknesses as well as opportunities and threats.
In this chapter, like it is done in a SWOT analysis, the facts are presented as objective as possible. This prepares for a weighing of the different factors in a later step, in which the focus lies on the development of a strategy. The underlying basis of deciding which attributes to look at and deciding whether they are to be valued positive or negative is the concept of sustainability, with equal focus on all its three pillars, which were identified and applied to the local circumstances in chapter 3.
4.1 internal analysis of tfl
To start off, and in order to give the reader an understanding of the background of TFl, a short historical overview, and with that a description of TFL’s relation and its various shareholders is given here, followed by a description of the financial condition of TFL.
4.1.1. TFL’s stakeholders and relations
The company’s existence bases on the effort of the Dutch cattle-breeding expert Lút Zijlstra in between 1985 and 1996. Small-scale dairy farming was made possible by crossbreeding between the local zebu cow and a black spotted Holstein-Frisian bull. Tanzanian farmers organized themselves in sales cooperatives to guarantee a regular income and at the same time to guarantee a regular milk flow to TFL. The cooperatives of farmers are unified within the Tanga Dairy Cooperative union (TDCu), which gradually grew over the years and represented around 3000 farmers in 2009.
In 1996 a cooperation formed by Dutch farmers (FriZania) and the TDCu invested and built a modest dairy factory, TFL (d.o.b foundation 2009a). Already in 2000 the investors agreed on not paying out dividends and that all profits should be reinvested. Furthermore most of the decisions should be left up to the company. This strategy follows an investment philosophy, which
4. tfl in a renewable electricity context
23
TFl
IN a
ReN
eWa
ble
eleC
TRIC
ITy
CON
TeXT
ter resources in the past. However, as pointed out in the introduction, the situation is changing. With de-creasing water resources the supporting leg (genera-tion from natural gas and diesel) is growing (TANESCo (C) n.d.) and with it the high dependency of the coun-try’s economy and households on imported energy resources. In 2007 an estimated amount of 200 mil-lion kWh of electricity was imported from neighbour-ing countries. This corresponds to less than 1% of the country’s own generation. Contrary to electricity, oil is imported to an extensive amount. The estimated daily oil consumption of 32.000 bbl (5.9 million litres) in 2008 was imported to 100% (Central Intelligence Agency 2009). Those current sources of energy make the country as well as TFL highly vulnerable to fluctu-ating oil prices and climate change.
When talking about Tanzania’s dependency of im-ported fossil fuels it is worth mentioning that the country holds a fair amount of natural gas (about 6.513 billion m3), which so far has remained almost untouched (Central Intelligence Agency 2009). From the company’s perspective, also the country’s own natural gas resources, in case they are exploited in the future, can be accounted as a vulnerable factor as its price would be coupled with the world market.
Although information on existing possibilities to feed electricity into the national grid was found (Ensol Tanzania Limited 2009), no profound knowledge on the details of feed-in tariffs could be gained despite of many attempts. As the severe problem of grid in-stability also influences a potential feed-in option TFL cannot rely on this as a constantly functioning source of income. Hence, in further remarks a feed-in option will be assumed as not existing.
Looking for potential subsidies for certain renewable energy technologies the same problem was faced as with the feed-in option. reference on existing subsi-dies was found (Ensol Tanzania Limited 2009) without any detailed information about a regulatory frame-work or detailed premises that are required to obtain governmental support. This results in the assumption that subsidies cannot be obtained.
regarding the future development of the Tanzanian electricity grid forecasts in either direction are diffi-cult to make and rely on assumptions (explained in chapter 5). plans for stabilising the grid (TANESCo (B) n.d.) and expanding the overall capacities (TANESCo (A) n.d.) do exist, however it seems unpredictable if or when they will be implemented. The situation
4.1.2 Financial condition of TFLGathering as much information on the financial limit-ing factors was considered as crucial to get an idea about possible investments which are available to TFL to renew its energy supply. The sources used are personal contacts to employees of TFL and d.o.b foundation, being responsible for finance. However the information obtained was sparse (appendix D and H).
When asked about the type of investment Michael Karata from TFl stated that currently there are no funds set aside for investment in an alternative ener-gy supply of TFL. According to him the investment has to be financed by a loan. The possible maximum size of a loan available could not be found out. Though for a pre-feasibility study done on biogas for heat the sum estimated was 122,000 Euro. The expected in-terest rate will be 8% and the payback time should lie in between 3,5 and 7 years.
4.2 context analysis and external factorsregarding the external factors, they are subdivided in general preconditions of the politics and Economy, renewable energy resources and in availability and sustainability of certain technologies.
4.2.1 Politics and Economy
research on the Tanzanian energy sector and its mar-ket provided only few data. As the information found was partially contradictory and fragmented, assump-tions had to be made on certain topics.
investment climate in tanzania
“Despite Tanzania’s past record of political stability, an unattractive investment climate has discouraged foreign investment”(u.S. Department of State 2009). Although some basic failures in Tanzania’s national system, like a high level of corruption (Transperency International 2009), the national framework seems stable enough for planning investments at a com-pany-level. The described development has general impact on possible promises for loans available. In many developing countries this results in short pay-back times and high interest rates as already shown in sub-chapter 4.1.2.
the tanzanian energy sector
In terms of electricity generation Tanzania used to benefit from its mountainous topography and its wa-

24
voltaic Geographical Information System (pVGIS) pro-vided by the Joint research Centre of the European Commission (2009). To give an idea about the values, Tanga receives a yearly radiation of 2190 kWh/m2 while Aalborg, Denmark only receives about 1110 kWh/m2 each year. Apart from higher insolation a very important factor is the more evenly spread year-ly irradiation in equatorial regions, leading to smaller seasonal variations of possibly harnessed solar ener-gy throughout the year. But daily variations of solar energy can be big and also have a tremendous influ-ence on the fluctuation of electricity production as the resource cannot be stored and storage of elec-tricity is very expensive.
wind energy
Due to its climatic conditions and geographical fea-tures East Africa experiences wind speeds, which are suitable for the electricity generation with wind turbines. Suitable wind resources are located along the Tanzanian coastline, in the regions of the high-land plateau of the rift valley and in the surrounding plains of the Great Lakes (otieno and Awange 2006, 60). However hardly any accurate wind assessments have been carried out throughout most parts of the African continent. A great lack, especially concerning local information, like maps and site assessments can be noticed (Wisse and Stigter 2007, 912). Also it shall be stated that wind as a resource for electricity pro-duction is characterised as intermittent as storage of wind is not possible.
could possibly even worsen but also for this no con-clusive evidence can be presented. The unpredict-ability of the development of the national grid, as well as of the oil price variations in the future imply a great uncertainty and threat not only to TFL’s fu-ture development but also to the choice of a possible alternative energy supply. When for example expect-ing an improvement of the situation concerning the national grid, then there is the chance that calcula-tions mislead if reality does not follow the assumed development.
4.2.2. renewable energy resourcesWhen thinking about an alternative energy supply for the company, while following the concept of sus-tainability the most important questions to be asked are: Which renewable energy resources are available for TFL in its vicinity? And: Is the resource connected to any kind of dependency or vulnerability in supply (also including daily and seasonal variations if appli-cable)? Those questions shall be focused at in the fol-lowing.
solar energy
From a first glimpse, the most obvious energy re-source in Africa seems to be the sun. When looking at world maps (figure 4.1) for solar irradiation it can clearly be seen that the average irradiation in the area is about double the amount of the value in Northern Jutland, Denmark. This is confirmed by the photo-
figur 4.1. Diffrense in average solar radiation around the world (EIA n.d.)
25
TFl
IN a
ReN
eWa
ble
eleC
TRIC
ITy
CON
TeXT
hydropower
Although hydropower is highly responsible for the current instability of the national electricity grid many authors still perceive it as a renewable energy resource with high potential in Tanzania (e.g. Bartle 2002, 1233). As climate change is proceeding and the ice cap on Mount Kilimanjaro is melting persistent-ly, investing in power generation from this resource might pose a threat to a secure future development. Additionally the Tanga region and its surroundings are comparably flat and the only big river close by is the pangani river, which is one of the most affected of the increasing water scarcity as it is fed by Mount Kilimanjaro and other near by mountain ridges (pan-gan Basin Water office 2005).
biomass and biogas
Biomass is defined as stored energy of the sun in form of organic matter, which is available on a renewable basis. Wood and wood wastes of forests, fast-growing trees and plants, mill residues, agricultural crops and wastes, livestock residues as well as aquatic plants are considered as biomass. It is regarded as an en-ergy source that is relatively cheap, easy to transport and to store as well as a resource with few environ-mental concerns [Mukhopadhyay (2007: 105)]. Dry biomass currently contributes to 90% of Tanzania’s primary energy supply.
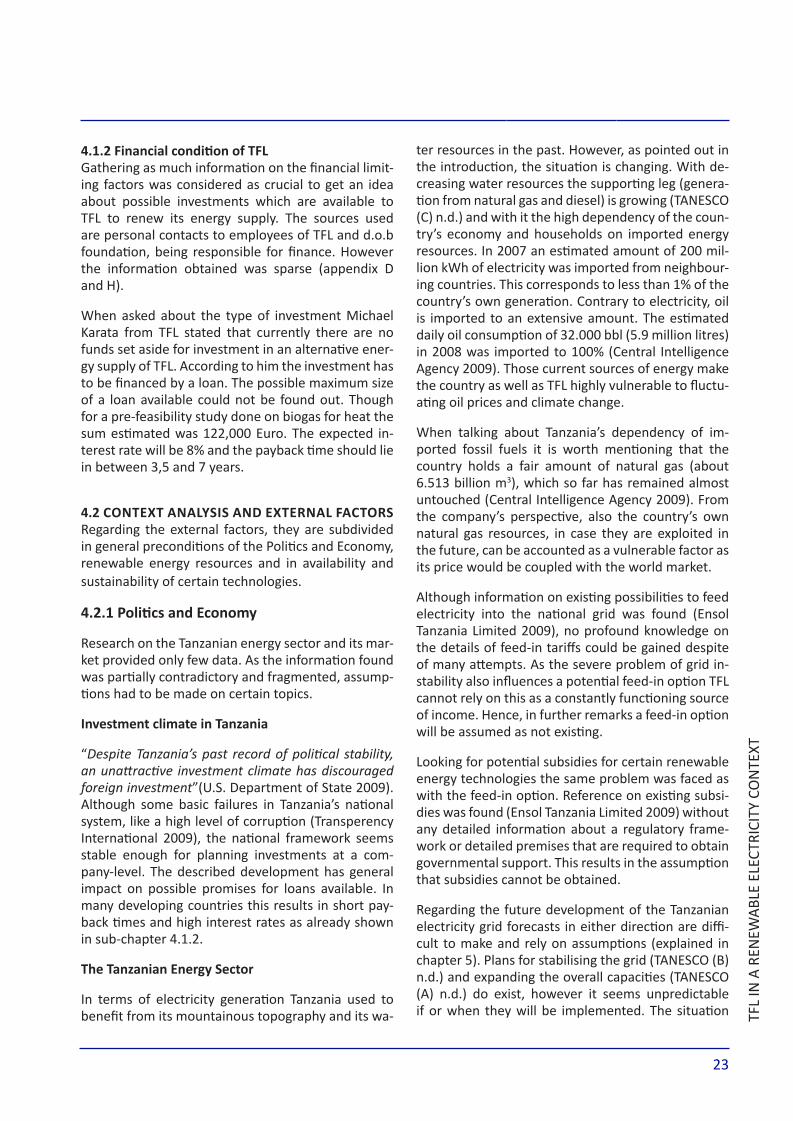
geothermal energy
geothermal resources in east africa can be found along the Great East African rift System (se figure 4.2).
Hochstein, Temu and Moshy ( 2000, 1233) state that “In N Tanzania, at the S end of the Gregory rift, a few advective, low temperature systems can be found which have little development potential, despite the large heat output (at least 50 MW) of one, the Lake Natron system”.
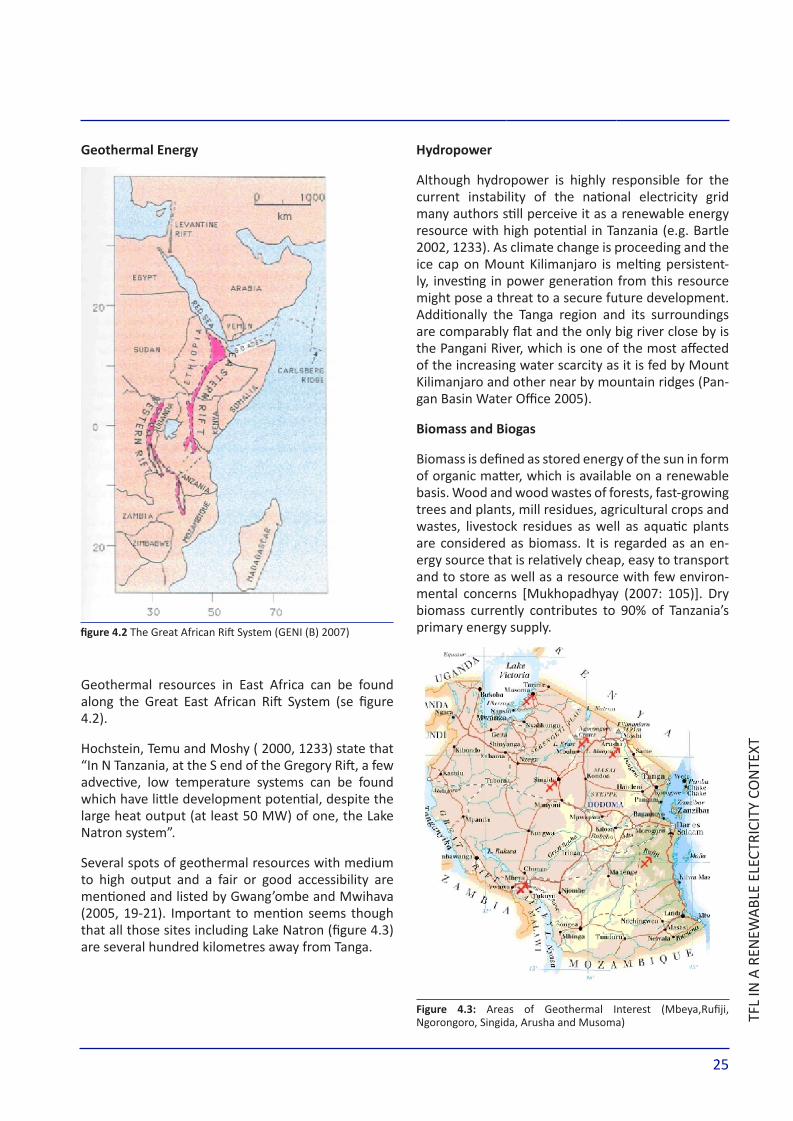
Several spots of geothermal resources with medium to high output and a fair or good accessibility are mentioned and listed by Gwang’ombe and Mwihava (2005, 19-21). Important to mention seems though that all those sites including Lake Natron (figure 4.3) are several hundred kilometres away from Tanga.
figure 4.2 The Great African rift System (GENI (B) 2007)
figure 4.3: Areas of Geothermal Interest (Mbeya,rufiji, Ngorongoro, Singida, Arusha and Musoma)

26
inside the digester (appendix A)Another candidate feed is brewers cake, a by-•product of beer production, which seems to become available for a very low price in the mid-term future (appendix A)
4.2.3. technologies – availability and sustainability
in this section it will be described to which extent, certain technologies can be applied and for which technologies knowledge concerning construction, maintenance and operation is available. Also potential social and environmental impacts of the single technologies are mentioned.
photovoltaic
To produce electricity from the sun two technologies are available: photovoltaics (pV) and Concentrating Solar power (CSp). CSp will be excluded at this stage, as this technology is only applicable for large-scale systems (Stoddard, Abiecunas and o’Connell 2006).
photovoltaic has some general advantages and disadvantages, which are listed below:Advantages:
Pv are using no fuels in order to produce electricity
There are no emissions from electricity gen-eration
They have a long lifetime (30 years or more)
pV modules contain no moving parts and are easy to install and operate
Disadvantages
pV has high initial investment costs
The output is directly proportional with the solar radiation and is not controllable
They utilize a relatively high land area per kWh produced
(Danish Energy Authority 2005)
Pv modules are generally produced in highly tech-nological processes in big factories in industrialized countries. If the technology will be used in Tanzania it has to be imported, but local companies can under-take the installation and maintenance of the prefabri-
Among the different sources wood has by far the high-est share (Brendes, 2006: VII) and has to be evaluated fairly critical in a country with deforestation rates 10 times higher than the recovery rate (FAo, 2005, 190). Tanzania is ranked as number six of the countries with the highest annual net loss in forest area, with the Tanga region having a 36% high deficit in wood resources (Drigo, 2005, 77).
When regarding biomass resources in form of agricul-tural wastes however, they are vast in Tanzania. Ac-cording to Virchow and von Braun (2001: 159) there have been 8 million tons of agricultural wastes each year, coming from cashew nuts, coffee husks and sug-ar residues. The highest portion comes from cotton and maize residues. However it could not be clarified, if they are also available in the vicinity of TFL.
Because many different biomass materials can be used for electricity production, the materials avail-able in an easily accessible radius of 5 to 20 kilome-tres around TFL are listed here; including the amount available. The sources of the data below are a pre-feasibility study on biogas for TFL (appendix A) and information gained through email contact with TFL employee.
A TDCu barn, housing 200 dairy cows in the vicinity of the new factory in a so called ‘HollandseStal’ (Dutch Barn) in which collection of manure is highly efficient. The yearly amount excreted is expected to be 4500 kg of manure at 20% dry solids per day for 200 cows, according to local research in Tanga (appendix A).
”Furthermore a fish processing factory also located in Tanga is able to deliver 140 kg of fish waste (mainly octopus waste) to Tanga Fresh Dairy on a daily basis potentially providing 145 kWh heat per day” (appen-dix A).
The resources presented above state a big amount of energy available very close to TFL. To limit vulnerabili-ty through dependence on few sources it is important to know about possible other available sources in the area, being listed bellow:
Sisal waste forms a potential source of biogas. •40.000 tons equivalent to 45MW available in the whole country (Tanzania Invest 2009)allanblackia oil is being pressed in Tanga from •Allanblackiastuhlmannii seeds. The oily cake is currently not used. The only restriction is the presence of tannins in the cake. Tannins possibly have toxic effects on the bacteria consortium

27
TFl
IN a
ReN
eWa
ble
eleC
TRIC
ITy
CON
TeXT
local research would be necessary to be done, which goes beyond the scope of this analysis.
Geothermal utilization
“Field experience in geothermal energy development is still in its infancy in Tanzania. There is thus no proven ability to manufacture and/or assemble geothermal power plant system components” (Gwang’ombe and Mwihava 2005, 24). As the process is highly technical and the technology not yet available in the country, a lack of professional workers/operators is to complain as well as very high investment costs (Gwang’ombe and Mwihava 2005, 3).
regarding the environmental impact it is to be said that geothermal power generation can result in sur-face disturbances like changed patterns of hot spring activities including disappearance. Also noise, heat and steam as well as chemical discharge into the air, ground and surface water are consequences to be considered. While all those impacts can be reduced by the right choice of technology, a matter which is impossible to avoid, is the optical impact geothermal appliances have on very rare landscapes (ÁrMANNS-SoN and KrISTMANNSDÓTTIr 1992, 869-875).
hydro-electric plants
Hydropower is spread throughout the country. No evidence of Tanzanian engineering products such as turbines and control electronics could be found. Though it seems reasonable to assume that local staff operates the existing plants. Neither a proof of this, nor information on local construction companies could be found through an online research. Addition-al benefits, apart from the actual electricity provision for the local society cannot be proven. rather than benefits it was often observed in the past all over the planet that the construction of hydro plants has in-cremented environmental and social threats in the areas being flooded as people are removed and is biodiversity reduced.
biomass
Biomass is a resource, which is very easy to store and flexible in use, permitting operation at various scales and with no natural fluctuation in power supply (pro-vided that the resource supply is managed in a proper way). Installations allow electricity generation for de-centralized applications at domestic or at village level as well as for national grids [Mukhopadhyay (2007: 105)].
cated parts (Ensol Tanzania Limited 2009). The choice of the right installing company seems important as in the past improper installation and insufficient main-tenance have led to pV systems not functioning as they should (TASEA 2005).
Looking at the environmental impact of harnessing the sun by pV, no emissions are to complain, how-ever some models of pV cells such as Copper Indium Selenide , Cadmium Teluride (CIS, CdTe) contain toxic chemicals like Cadmium, which can be released into the environment in case of fire (Boyle 2004, 95). As environmental friendly recycling methods are not standard in the area it is the operator’s duty keeping sustainability premises in mind when deconstructing the plant. Although the mentioned environmental threats are assured, Boyle (2004, 95) states that „the environmental impact of pV is probably lower than that of any other renewable […] electricity generat-ing system.“
Social impact of pV plants in Tanzania is an issue as in the past problems like vandalism and theft of pV modules occurred (TASEA 2005, 19). In poor coun-tries like Tanzania expensive installations like pV sys-tems create social contrast and therefore state a so-cial problem. If installation is considered protection like fences or security guards have to be taken into account.
wind turbines
According to (Gwang’ombe and Mwihava 2005, 3) there were 129 windmills installed in 1996. However 40% were not working properly. All of the existing wind turbines have been imported by private inves-tors, and have shown bad performance success even in regions having good wind regimes. The reasons presented are that the installations are expensive or poorly designed prototypes and that there is no local knowledge on maintenance available. Also the lack of spare parts present a problem. Although the pre-vented information is more than a decade old, not much seems to have changed so far. Neither informa-tion about active producers nor on installers in Tanza-nia can be gained, which indicates that locals would not benefit a lot from imported turbines (otieno and Awange 2006, 61).
As wind turbines do not emit polluting gases. Envi-ronmental impacts from wind turbines are limited to noise pollution and optical inconveniences. This can influence local wildlife, but also evoke resistance within the local community. To evaluate this in detail
28
There are various challenges in running a biogas in-stallation. Factors like temperature, acidity, nutrient ratio, dry solid content, etc. have to be guaranteed to be on a constant level. Through literature studies it is quite difficult to find ready installed biogas instal-lations on the desired scale, hovever as stated by Ka-rata (Appendix XX), there is local available expertise in Biogas if needed.
as biogas plants not only guarantee an electrical out-put, but also deliver high quality fertilizer, as their secondary output, and can be build and run within the local conditions, it can be considered as a valu-able electricity source.
4.3 conclusion based on the analysis of tfl in its context
After pointing out dangers and prospects towards certain technologies for an alternative energy supply for TFl the conclusions for a further strategy of this project will be drawn in this subchapter.Concluding on the facts know from the Tanzanian en-ergy sector it seems unpredictable where the devel-opment is going. The general guideline should be to reach independency of the national electricity grid as high as possible.
photovoltaics
Regarding resources and technologies Pv is a technol-ogy that has some good advantages and will therefore be considered for further analysis. Its independence on system scale, positive local employment effects, and good resource situation are important facts sup-porting its application. Furthermore it will be possi-ble for the operator to avoid the negative sides like uncontrolled recycling, vandalism and theft. It is of major importance to address these issues to TFL so that security fences, services and insurance can be taken into account in case the economical analysis shows that the investment provides benefits, and the technology can therefore be chosen as a good alter-native to the current electricity supply.
wind
Although large parts of the country have high wind energy potential (Kainkwa 2000, 290) in the long term, there are too many obstacles to be overcome for this project. Major reasons are: unavailability of precise data and imported technology without posi-
Concerning dry organic matter there are basically two technologies, for converting it into energy forms which could be of concern for Tanga Fresh Ldt. It is possible to either use it directly or convert it into ga-ses. Direct combustion (burning) of biomass is the oldest and least sophisticated technique, often ap-plied in African countries on several scales.
Biomass can be burned in a boiler. The produced high pressure gas is then led into a steam turbine. In Tan-zania there are several plants, producing electricity (and heat). The efficiency of many of those instal-lations is, according to Gwang’ombe and Mwihava (2005: 9) very low.
Mechanical gasification occurs in an air tight, oxygen depleted chamber. Wood reacts with carbon dioxide and steam to produce hydrogen and carbon monox-ide, the mixture of which called syngas or wood gas. This gas can be more efficiently converted into elec-tricity than with direct combustion. Another benefit is that there are no ash elements in production. The waste biomass from the gasifier can be used as ferti-lizer with a high value [Morán, J.C. et al. (2007: 35)]. Mechanical gasification however is a chemical reac-tion which requires several thermo-chemical proc-esses, and is therefore more difficult to apply.
Like with fossil fuels the processing of biomass also produces Co2, however only as much as it absorbed while growing. For this reason it can be considered as a Co2 neutral energy source as long as managed in a sustainable way and plants are replenished.
biogas
Like biomass gasification, biogas installations based on manure, have the advantage to be easily storable, and therefore have no natural fluctuations. Biogas can be produced from manure and other agricultur-al as well as industrial waste material in a biological process called fermentation, which happens under anaerobic conditions. Bacteria form a gas mixture which consists of methane and carbon dioxide. The process can occur under three different tempera-ture scales, namely phychrofilic, mesophilic and ter-mophilic – out of which the mesophilic one, having a temperature range of 15 to 45°C would be the right one to apply in the present context. It guarantees a rather high biogas output and is not as vulnerable to temperature changes as the more efficient ther-mophilic application.
29
TFl
IN a
ReN
eWa
ble
eleC
TRIC
ITy
CON
TeXT
biomass
As stated, Tanzania has a very high deforestation rate. Even though the uNEp (2005) lists plans of the Tanza-nian government to enhance tree planting campaigns and the support of modern biomass combustion and gasification techniques, it does not seem that under the present conditions fuel wood can be considered as a renewable, sustainable energy source.
Dry biomass in general will not be considered as an option in the study, as it could not be clarified, if TFL has the capacity of getting resources in the region – therefore supply of resources cannot be guaranteed.
biogas
Generating electricity by a biogas engine seems like a long-term perspective as the resources as well as the technologies are available. In the context of environ-mental and social sustainability, a biogas installation seems to be a good choice.
tive long-term effects for the local population. Most important seems the danger of incapability to main-tain the appliance.
geothermal energy
The main criterion for disapproving this technology is the large distance between the resource and TFL. Also high investments and low local knowledge are reasons to set this technology aside.
hydropower
Apparently there is a contradiction to be pointed out between the statement of some scientists and lob-byist on the good availability of the resource in the country and the technology being blamed for major power rationing in the country. It seems more likely though that the resource is getting sparser in the fu-ture. But when looking closer at TFL there seem to be no major rivers that could easily be exploited in TFL’s neighbourhood. As accurate data cannot be obtained within the reach of the project’s resources, this tech-nology is dismissed for further study in this report.
30
extend conflicting, or at least not fully compatible. Furthermore, as the dairy only started its operation at the end of May this year, data could neither be provided as statistical average data of several years, nor for one full year. Various preconditions had to be defined resulting in assumptions, which were applied in order to derive a theoretical electricity demand for the future years; over the full course of a year.
In order to understand what the difficulties in the in-terpretation of the data was, the following example will be given, before going deeper into the analysis:
The initial data provided, only consisted of the state-ment that TFL’s daily electricity demand corresponds to a total of 3.5 MWh (Appendix B). This would im-ply a total monthly electricity demand of 105 MWh. However, newer more detailed numbers (Appendix C and E) from TFL on their consumption from the grid and the diesel generator are far off these 105 MWh per month.
data on the grid
Data for the electricity supply of the grid was given in form of a scanned electric meter card of the Tan-zania Electric Supply Company Ltd. only data from between June and November could be gained. The values represent an average supply of 62 MWh per month. As mentioned above, Tanzania suffers from grid failures and power rationing. The data provided seem to be heavily influenced by at least one severe power rationing in June this year. only 40% of the av-erage power provided for the months July to Novem-ber could be supplied in this month.
data on the diesel generator
Concerning the diesel generator data was gained for the period May to November. They were given in hours of diesel generator operation as well as in litres, which are hourly consumed (40l). The calcula-tion for the resulting electrical output will be given in subchapter (5.2). From May to August however, the hours were summarized to one value; this value be-ing much higher than the data provided for the other three months. As a first step values were distributed over the months, orientated on the gained MWhs of the grid. The aim was to model a more or less even total electricity consumption each month, with the result that June, the month with lowest electricity provision, turned out to be the month with the high-est diesel consumption.
This chapter describes the electricity demand of TFl on the basis of data provided by the company. First, the data provided from TFL will be presented, high-lighting the gaps and discrepancies between them. This is followed by a primary data analysis in which the data are interpreted, with the intent of filling the gaps and lowering the discrepancies, based on vari-ous assumptions.
The reason for varying provided information could be that single provided values were only represented for a very short timeframe, like a day or a week. Combin-ing the different values Leads to the assumption, that there are fluctuations in demand – daily as well as seasonal. For simplicity, but also in order to present a more realistic average electricity demand for the coming years, it will mainly be focused on seasonal fluctuations in the following. Heavy and short time fluctuations, due to very irregular major grid failures, are not going to be taken into account.
In a next step a final analysis of the data takes place; based on conclusions derived from the primary anal-ysis including calculations on the costs of the com-pany’s electricity supply, if not changing their current supply.
Seasonal demand variations were derived with an excel spread sheet and later applied in Energypro in order to describe the daily and hourly fluctuations.
After the presentation of a reasonable electricity de-mand, with different shares of grid supply and the need for the diesel generator in varying seasons for the coming years, based on argued assumptions, oth-er scenarios will be presented. In those scenarios, the overall electricity demand will vary slightly; the major change however, will be the share of the grid. Dur-ing the analysis it will get clear, why the consideration of different scenarios is important, and what con-sequences for the electricity cost of TFL they would have.
It has to be pointed out, that the demand analysis is based on data of the current electricity supply, which will be transformed to a theoretical future demand.
5.1 data and information provided; and primary data processing
While accurate values for the electricity demand would be preferable, the data provided by TFL has been of mixed quality – accuracy and completeness. As will be described, provided data were to some
5. electricity demand analysis

31
elec
tric
ity
dem
an
d a
na
lysi
s
The filling of the data gaps was done in order to get an idea of the total demanded electricity and the share of the grid in the varying seasons, in order to be able to do a more even prediction of the electric-ity demand of the future.
Table 1 gives an overview of the limited amount of provided data (black numbers), and shows the values which had to be assumed on the basis of statistical calculations, keeping in mind fluctuations caused by the seasons (orange numbers). Directly calculated values derived out of the provided data are highlight-ed in blue, while the ones derived out of the assumed values are written in violet. The fields coloured yel-low highlight the data which deviate the most from the expected values, which would be assumed for the respective season. For example the high amount of diesel for the four months from May to august, as well as the very low amount of consumed MWh for June from the grid, are far off from statistical means. Also the high overall electricity share for August and September do not correspond to values, which would be expected for the dry season.
data gaps
In a next step data gaps were filled on the basis that power rationing, if it happens, takes place during the dry season, as droughts cause the water levels in the reservoirs to drop to levels where it is not possible to produce sufficient electricity.
The climatic seasons in Tanzania can be classified into four categories: hot dry (December to February), short rain (March and october to November), heavy rain (April and May) and cool dry (June to September) (Lonely planet 2009). Even though there are obvious-ly changes over the years, which might even get more drastic due to climate change in the future, a stable classifacation needs to be applied in order to be able to apply the same criteria over the considered time-frame. In the dry seasons the share of produced elec-tricity of the grid is lower than in the rainy seasons. Another factor influenced by the yearly seasons, and influencing the assumed electricity demand data, is the amount of production of the factory itself. Caused by the droughts there is less milk available during the dry season; as this is directly linked to the monthly total power consumption, the electricity demand of the dry season in relation to the rainy season is ex-pected to be lower.
table 5.1: Electricity data provided by TFL (in black), and their derivations in blue as well as assumed values in orange and their calcu-lations in violet. The yellow fields show data which deviate the most from the expected values.
monthdiesel (working hours)
diesel generator (mwh)
electricity from grid (mwh)
calculated mwh total
share diesel gene-rator
share grid
electricity con-sumption in regard to mean monthly values
season
January 80 12 45 57 22% 78% 83% hot dry
February 80 12 45 57 22% 78% 83% hot dry
March 30 5 60 65 7% 93% 93% short rain
april 10 2 75 77 2% 98% 110% heavy rain
May 392 40 6 75 81 8% 92% 119% heavy rain
June 392 230 36 29 65 55% 45% 84% cool dry
July 392 70 11 51 62 18% 82% 88% cool dry
august 392 30 5 69 73 6% 94% 108% cool dry
Septem-ber
43.5 7 70 77 9% 91% 111% cool dry
October 40.6 6 75 81 8% 92% 117% short rain
November 20 3 77 80 4% 96% 116% short rain
December 80 12 45 57 22% 78% 83% hot dry
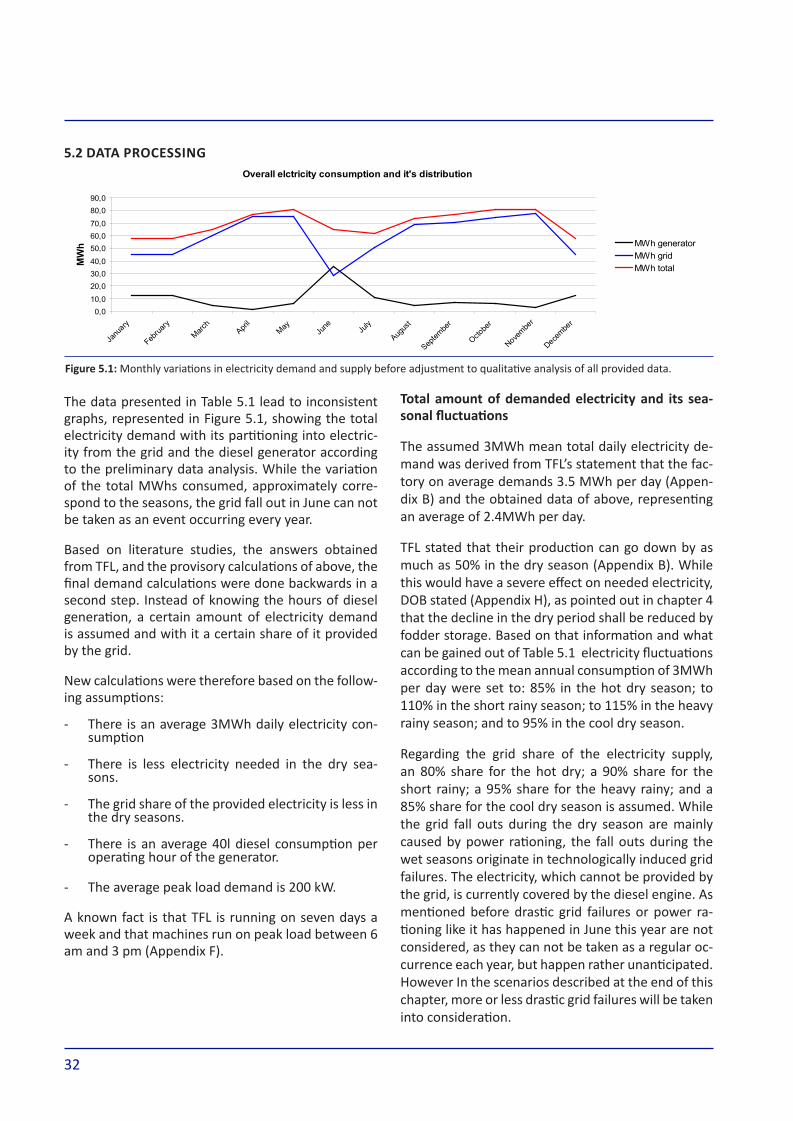
32
total amount of demanded electricity and its sea-sonal fluctuations
The assumed 3MWh mean total daily electricity de-mand was derived from TFL’s statement that the fac-tory on average demands 3.5 MWh per day (Appen-dix B) and the obtained data of above, representing an average of 2.4MWh per day.
TFL stated that their production can go down by as much as 50% in the dry season (Appendix B). While this would have a severe effect on needed electricity, DoB stated (Appendix H), as pointed out in chapter 4 that the decline in the dry period shall be reduced by fodder storage. Based on that information and what can be gained out of Table 5.1 electricity fluctuations according to the mean annual consumption of 3MWh per day were set to: 85% in the hot dry season; to 110% in the short rainy season; to 115% in the heavy rainy season; and to 95% in the cool dry season.
Regarding the grid share of the electricity supply, an 80% share for the hot dry; a 90% share for the short rainy; a 95% share for the heavy rainy; and a 85% share for the cool dry season is assumed. While the grid fall outs during the dry season are mainly caused by power rationing, the fall outs during the wet seasons originate in technologically induced grid failures. The electricity, which cannot be provided by the grid, is currently covered by the diesel engine. As mentioned before drastic grid failures or power ra-tioning like it has happened in June this year are not considered, as they can not be taken as a regular oc-currence each year, but happen rather unanticipated. However In the scenarios described at the end of this chapter, more or less drastic grid failures will be taken into consideration.
5.2 data processing
The data presented in Table 5.1 lead to inconsistent graphs, represented in Figure 5.1, showing the total electricity demand with its partitioning into electric-ity from the grid and the diesel generator according to the preliminary data analysis. While the variation of the total MWhs consumed, approximately corre-spond to the seasons, the grid fall out in June can not be taken as an event occurring every year.
Based on literature studies, the answers obtained from TFL, and the provisory calculations of above, the final demand calculations were done backwards in a second step. Instead of knowing the hours of diesel generation, a certain amount of electricity demand is assumed and with it a certain share of it provided by the grid.
New calculations were therefore based on the follow-ing assumptions:
There is an average 3MWh daily electricity con-- sumption
There is less electricity needed in the dry sea-- sons.
The grid share of the provided electricity is less in - the dry seasons.
There is an average 40l diesel consumption per - operating hour of the generator.
The avera- ge peak load demand is 200 kW.
A known fact is that TFL is running on seven days a week and that machines run on peak load between 6 am and 3 pm (Appendix F).
Overall elctricity consumption and it's distribution
0,010,0
20,030,040,0
50,060,070,0
80,090,0
Janu
ary
Februa
ryMarc
hApri
lMay Ju
ne July
Augus
t
Septem
ber
Octobe
r
Novembe
r
Decembe
r
MW
h MWh generatorMWh gridMWh total
figure 5.1: Monthly variations in electricity demand and supply before adjustment to qualitative analysis of all provided data.

33
elec
tric
ity
dem
an
d a
na
lysi
s
Table 5.2 summarizes those assumptions on the sea-sonal variability and also shows the calculated total monthly electricity demand in MWh and the peak de-mand load in kW, based on data provided by TFL be-ing 200kW on average, related to the same monthly variations as taken for the electricity consumption.
The electricity consumption, divided into the shares of the grid and the diesel generator, as well as the to-tal electricity demand is illustrated in Figure 5.2. The new seasonally fluctuations of the two sources can be seen very well.
The rather slight variations in the MWhs produced on the diesel engine originate in the correlation of en-ergy production by hydropower and TFL’s consump-
tion. Both drop in the months of drought and rise in the months of rainfall to different extend.
diesel share
Knowing the needed electricity production of the diesel engine and applying the calorific value of die-sel, which is 35.87 MJ/l, as well as the efficiency of the generator the amount of needed litres is deter-mined.
The efficiency of TFLs generator, having a potential power output of 391 kW, a consumption of 99.5 litres at full load and a resulting net power output of 991 kW was determined to be 39%. (The data were pro-vided in a data sheet about the generator by its man-ufacturer inmesol (Appendix I).)
MonthSeasonal type
Fluctuations accord-ing to mean annual demand and the peak demand load
grid share
Diesel generator share
Demand MWh total/month
Peak de-mand load (kW)
Januaryhot dry 85% 80% 20%
79170
February 71
March short rain 110% 90% 10% 102 220
aprilheavy rain 115% 95% 5%
104230
May 107
June
cool dry 95% 85% 15%
86
190July 88
august 88
September 86
Octobershort rain 110% 90% 10%
102220
November 99
December hot dry 85% 80% 20% 79 170
table 5.2: Energy demand dependent on seasonal fluctuations in overall consumption and power of the grid.
Electricity demand of TFL
0,0
20,0
40,0
60,0
80,0
100,0
120,0
Janu
ary
Februa
ryMarc
hApri
lMay
June Ju
ly
Augus
t
Septem
ber
Octobe
r
Novem
ber
Decem
ber
MW
h
MWh generator
MWh grid
MWh total
figure 5.2: Expected electricity demand (in MWh) and the expected supply shares of the diesel generator and the grid.

34
ity gained from the grid. one can imagine that the financial situation gets worse in case of more severe power rationing. Table 5.3 presents total costs of both electricity providing units, as well as for the required power capacity (peak load), according to the monthly energy demand (also illustrated in Figure 5.4). Also the cost per MWh according to each electricity source is presented here. It has to be made clear, that the presented costs for the diesel are purely fuel costs and do not include any operation and maintenance costs at that stage.
electricity costs
While the demanded electricity produced on the die-sel engine has a rather low share, TFLs problem gets obvious when pointing out the shares of electricity costs.
While the costs for the kVA (equal to the peak load) is on a rather constant low level over the whole year, the electricity costs for the grid and the diesel engine, fluctuate dramatically. In the dry months, despite of its low maximum share of 20%, the costs for the die-sel generator can exceed the costs for the electric-
MonthDemand from grid (MWh)
Demand form generator
(MWh)
kVA (peak load)
Cost grid Cost dieselCost kva
(peak load)
January 63.2 15.8 170 2688 2848 795
February 57.1 14.3 170 2428 2573 795
March 92.1 10.2 220 3913 1843 1029
april 98.3 5.2 230 4179 932 1075
May 101.6 5.3 230 4318 963 1075
June 72.7 12.8 190 3089 2310 888
July 75.1 13.3 190 3192 2387 888
august 75.1 13.3 190 3192 2387 888
September 72.7 12.8 190 3089 2310 888
October 92.1 10.2 220 3913 1843 1029
November 89.1 9.9 220 3787 1783 1029
December 63.2 15.8 170 2688 2848 795
total: 952.3 138.9 2390 40473 25029 11173
1 MWh from the grid 42.5 Euro
1 MWh produced on diesel (+ o&M) 180.1 (+ 7.5 Euros – not yet included)
1 kva 4.7 Euro
table 5.3: Absolute figures for electricity demand from the grid and the diesel engine and the costs for the generator, the grid, and the peak load

35
elec
tric
ity
dem
an
d a
na
lysi
s
power. While the demand for the diesel generator in the heavy rainy season is at about 5%, the share in its cost lies at 18%. When the demand goes up to 20% in the hot dry season, the cost even rises to a share of 51%. This highlights the vulnerability of TFL towards power rationing, as the costs in those times rise enor-mously.
With Figure 5.4 it becomes apparent that the fl uctua-igure 5.4 it becomes apparent that the fl uctua-it becomes apparent that the fluctua-tion in the cost for the diesel is, due to its more than four times higher cost per MWh, very much higher than the fluctuation in the demand for it. The rea-son for the overall cost not to increase that much in the period where a lot of diesel is consumed is that the overall consumption goes down. Still the share of the cost is much higher than the share of delivered
Different electricity costs per month
0
1000
2000
3000
4000
5000
6000
7000
8000
Janu
ary
Febru
aryMarc
hApri
lMay
June Ju
ly
Augus
t
Septem
ber
Octobe
r
Novem
ber
Decem
ber
Euro Cost kVA
Cost grid
Cost diesel
Shares of electricity supply and the costs of the grid and the diesel generator
0,0%10,0%20,0%30,0%40,0%50,0%60,0%70,0%80,0%90,0%
100,0%
Janu
ary
Februa
ryMarc
hApri
lMay Ju
ne July
Augus
t
Septem
ber
Octobe
r
Novembe
r
Decembe
r
Shar
e of
ele
ctric
ity c
onsu
mpt
ion
and
cost
(by
sour
ce)
Share gird of electricity supply
Share diesel of electricity supply
Share diesel cost
Share grid cost
figure 5.3: Electricity costs of various sources
figure 5.4: Expected shares of electricity supply and the costs of the grid and the diesel generator
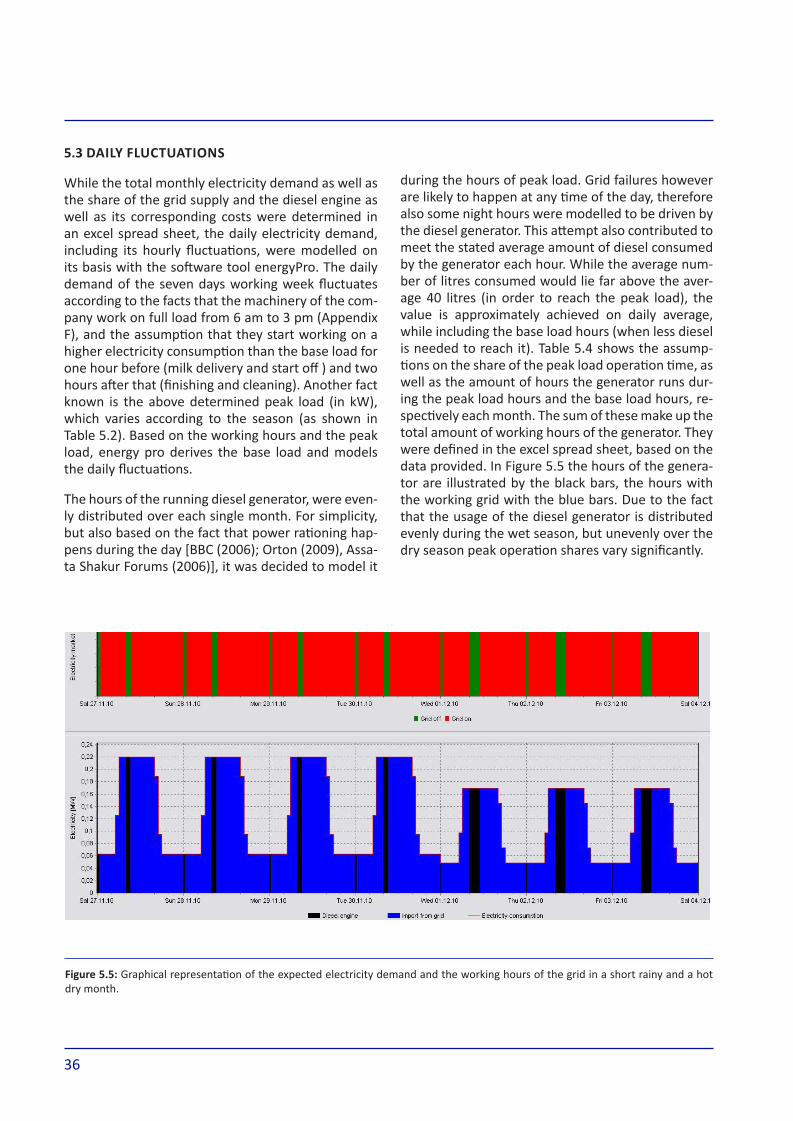
36
during the hours of peak load. Grid failures however are likely to happen at any time of the day, therefore also some night hours were modelled to be driven by the diesel generator. This attempt also contributed to meet the stated average amount of diesel consumed by the generator each hour. While the average num-ber of litres consumed would lie far above the aver-age 40 litres (in order to reach the peak load), the value is approximately achieved on daily average, while including the base load hours (when less diesel is needed to reach it). Table 5.4 shows the assump-tions on the share of the peak load operation time, as well as the amount of hours the generator runs dur-ing the peak load hours and the base load hours, re-spectively each month. The sum of these make up the total amount of working hours of the generator. They were defined in the excel spread sheet, based on the data provided. In Figure 5.5 the hours of the genera-tor are illustrated by the black bars, the hours with the working grid with the blue bars. Due to the fact that the usage of the diesel generator is distributed evenly during the wet season, but unevenly over the dry season peak operation shares vary significantly.
5.3 daily fluctuations
While the total monthly electricity demand as well as the share of the grid supply and the diesel engine as well as its corresponding costs were determined in an excel spread sheet, the daily electricity demand, including its hourly fluctuations, were modelled on its basis with the software tool energypro. The daily demand of the seven days working week fluctuates according to the facts that the machinery of the com-pany work on full load from 6 am to 3 pm (Appendix F), and the assumption that they start working on a higher electricity consumption than the base load for one hour before (milk delivery and start off ) and two hours after that (finishing and cleaning). Another fact known is the above determined peak load (in kW), which varies according to the season (as shown in Table 5.2). Based on the working hours and the peak load, energy pro derives the base load and models the daily fluctuations.
The hours of the running diesel generator, were even-ly distributed over each single month. For simplicity, but also based on the fact that power rationing hap-pens during the day [BBC (2006); orton (2009), Assa-ta Shakur Forums (2006)], it was decided to model it
figure 5.5: Graphical representation of the expected electricity demand and the working hours of the grid in a short rainy and a hot dry month.

37
elec
tric
ity
dem
an
d a
na
lysi
s
Heavy power rationing
In this scenario it is assumed that the grid hardly de-livers electricity during the days of the dry seasons.
When providing data, TFL stated that in some weeks up to 7000 litres of diesel are needed in order to cov-er the demand. Supported by a statement found in online research (Assata Shakur Forums: 2006), which states that power rationings used to cover the whole day at times in the past, a very high amount of die-sel consumption of up to 15 000 litres per month (the amount needed to cover approximately each day’s working hours) was assumed in that scenario. The grid would only be able to provide 20% of the electricity in the hot dry; 70% in the short rainy; a 95% share for the heavy rainy; and 40% in the cool dry season. It is assumed that the electricity supply during the heavy rainy season is, like in the first sce-nario, only influenced due to technological failures, which sum up to 5%, and not due to power rationing. Therefore this share stays constant through all listed scenarios.
5.4 divergent electricity demand scenar-
ios
As stated in the first part of this chapter, the over-all electricity demand is dependent on the seasons. However it is assumed, that the share of electricity supply of the grid is far more vulnerable than the production output of the company and therefore its overall need of electricity. As the above derived future demand for electricity is based on various ar-gued assumptions, it presents a reasonable scenario, however reality could be different.
It could be that the stability of the grid, as it has been in June is developing to be very unstable, due to less rainfall and therefore less electricity from the hydro-power plants. It could however also be that TANESCo achieves its goal to stabilize the grid, through the installation of more hydropower plants and gas tur-bines (as pointed out in chapter 4).
In the following three diverging scenarios will be pre-sented:
Monthamount of diesel kWh each day
Peak demand load (kW)
base demand load (kW)
amount of hours the diesel gener. runs each day (peak load)
amount of hours the diesel gener. runs each day (base load)
January 510 170 50 2.9 0.3February 510 170 50 2.9 0.3March 330 210 60 1.3 0.6april 173 220 60 0.6 0.6May 173 220 60 0.6 0.6June 428 180 50 2.1 0.5July 428 180 50 2.1 0.5august 428 180 50 2.1 0.5September 428 180 50 2.1 0.5October 330 210 60 1.3 0.6November 330 210 60 1.3 0.6December 510 170 50 2.9 0.3
table 5.4: Total amount of the daily needed electricity of the diesel generator as well as its working hours during the day and the night

38
Light power rationing
Here it will be assumed that there will hardly be any power rationing, with the result that the grid can provide 90% of the power during the hot dry period; 95% during the heavy rainy season, as well as 95% during the short rainy season; and 93% in the cool dry period.
Figure 5.7 and 5.8 give an overview of all scenari-os, summarizing the shares of the two dry and the wet periods and stating the total grid share of each scenario, as well as the total costs for the electricity supply in each scenario. It gets obvious that the grid share has a great influence on the total electricity costs, taking into consideration the grid costs as well as the very high costs for the generator.
The graphical distribution of the grid supply for this scenario is shown in Figure 5.6.
regarding the above listed costs per MWh supplied by the grid or the generator, it gets clear that this sce-nario poses a much higher risk to TFL.
The different grid shares and costs according to the listed scenarios are shown at the end of this sub-chapter.
Medium power rationing
This scenario shall give an overview of what happens if the grid is off in the dry season between the ex-pected scenario and the heavy power rationing.
The grid would only be able to provide 50% of the electricity in the hot dry; 80% in the short rainy; 95% for the heavy rainy; and 65% in the cool dry season.
figure 5.6: Graphical representation of the electricity demand in the heavy rationing scenario and the corresponding working hours of the grid in a short rainy and a hot dry month.
figure 5.7 and 5.8: overview of the different electricity supply by source in four different power rationing scenarios, and its correspond-ing costs.

39
elec
tric
ity
dem
an
d a
na
lysi
s

40
as the source of fuel for the Pv cells are sunrays, Pv modules generate electricity during sun insolation. Consequently in times when clouds cover the sky and hence decrease the radiation or during night when there is no radiation the electricity production de-creases or hits zero. (Boyle, renewable Energy, 2004, pp. 68-71)
The properties of intermittent energy resources, pV being one of them lead to problems in the reliability of supply. This topic will be further discussed below but before that a small introduction in the different technologies of pV is presented.
6.1.1 Different PV designs
Different types of pV modules exist, which differ in production, efficiency and investment costs; also they use different spectrums of light to produce elec-tricity. In this report only crystalline (first generation) and thin-film (second generation) modules will be considered as 3rd and 4th generation pV technologies are not developed as far to be seriously compatible and competitive (3i 207).
Mono- and poly-crystalline modules have a higher efficiency than thin-film modules and they are more expensive. Thin-film modules not only have a lower efficiency and lower costs, but also need more than 99% less silicon metal for the production process and therefore consume less energy. A remarkable differ-ence in electricity generation though is that crystal-
This chapter analyzes photovoltaics and anaerobic di-gestion in a local context of TFL. The objective of this is two-fold: Firstly, the aim is to present an introduc-tion of the two technologies in relation to the local conditions in Tanga. Secondly, a specification of tech-nology design is to be made so the chosen specific technology and its related costs and production can be analysed according to the demand in chapter 7.
The two technologies will be analysed separately in this chapter, starting with photovoltaic.
6.1 photovoltaic
photovoltaic (pV) installations can harnesses one of the greatest energy sources on earth – the sun. It is a technology that utilizes the sun’s energy to generate direct current (DC), which is changed into alternating current (AC) by inverters before it is used in custom appliances.
photovoltaic cells consist of thin layers of positive and negative type semiconductors, which are typi-cally made of silicon. The particles in the material of the negative semiconductors are made to contain a surplus of free electrons while the particles in the ma-terial of the positive semiconductors contain a deficit of free electrons. Layering these different type semi-conductors together creates an electric field that can transform the energy harnessed from the sunlight into electrical power.
6. analysis of biogas and pvs for tfl
figure 6.1 (Vandasye n.d.)

41
an
aly
sis
of
bio
ga
s a
nd
pv
s fo
r t
fl
of interview_berndrunge). The costs per installed ca-pacity will roughly be the same for 1st and 2nd genera-tion photovoltaics. This means that the decision can be made depending on the following factors.
In environmental terms thin-film technology has the advantage that it consumes less energy and resourc-es during production. This does not affect TFL, Tanga and the surroundings with direct impacts and there-fore will be weighted little.
The most important issue when choosing pV tech-nologies is the sensitivity to diffuse light. As already stated above the negative correlation in between peak of electricity production through pV and peak of TFL’s seasonal production is a disadvantage of pV in general which has to be eliminated as far as pos-sible. This is only possible through thin-film modules, as they are not as strongly affected by indirect radia-tion and will produce more electricity in critical times of cloudy and rainy weather in the rain seasons.
6.1.4 choosing a model
As Bernd runge with whom an interview was lead (see appendix) has experience in the highly interna-tionalized pV market in the following part his recom-mendations are followed concerning the choice of pV modules being used for the modelling. The model recommended by him is FS-275 by the u.S. American company First Solar.
6.1.5 expected costs
The recent costs for such open land thin-film in-stallations in Europe lie at the moment at around 2750€ per kWp. This number is most certainly
Definition kWp:
PV modules are rated by their total power output. The peak power is the amount of power output a PV module produces at Standard Test Conditions (STC).
STC aredefined as:
operating temperature of 25° Celsius•
full sunshine (irradiance) of 1 000 Watts per squa-•re meter
air mass 1.5 solar spectrum•
(IEA Photovoltaic Power Systems Programme n.d., )
line models produce electricity mainly during direct sun insolation and loose most of their capacity when only exposed to indirect sunlight e.g. at times of cloudiness, rain or during sunrise and sunset. under cloudy or misty conditions of indirect insolation thin-film cells only loose a small portion of their capacity, which makes them less affected by short time varia-tions (Dupont 2009, Thin Film Today 2009).
6.1.2 Resource conditions
Tanga Fresh Ltd. is fortunately located for pV-electric-ity generation due to local irradiation rates. The av-erage irradiation in the area is about 2190 kWh/m2/year. Compared to Denmark (1110 kWh/m2/year) this is nearly the double received energy per area. The data was calculated by the photovoltaic Geographical Information System (pVGIS) provided by the Joint re-search Centre of the European Commission (2008). The prints of the calculations can be found in the ap-endix (called ‘pVdata_Aalborg’ and ‘pVdata_Tanga).
As already mentioned in chapter 4 seasonal variations are more evenly spread around the equator than in the northern and southern hemisphere. This can be seen when comparing the month with maximum and the month with minimum average daily radiations. In Tanzania the lowest month in the average daily sum of global irradiation per square meter received is as high as 76.24% of the highest month. In Denmark during the lowest month only 10.65%of radiation reaches the ground compared to the highest month in an average year (see appendix).
The weather conditions during the rainy seasons are logically characterized by higher frequency of rain and clouding but at the same time they represent the time of higher biomass production like pastures with which the cows are feed, which again results in a higher milk production and higher electricity de-mand. Here it can be seen that possible low solar power production and the company’s peak season correlate negatively.
After having presented the viable options a short evaluation follows from which the choice of pV tech-nology is derived.
6.1.3 Selection of technology
The argument of efficiencies of the single technolo-gies does not really account for TFl as there is a lot of space available and if further capacity is needed it can just be added by using more space (see transcription

42
a pV module when operating under 800 w/m2 irra-diance, 20°C ambient temperature and wind speed of 1 meter per second”(Sandia National Labratories (2002)]. For the chosen solar module it is 45°C (icaro-srl.eu).
The temperature coefficient of power in %/°C defines the amount of output difference if the temperature changes by 1°C and is -0.25 °C (icaro-srl.eu).
The aggregated losses from module to grid happen, in the assumed island grid (without feed in options), through losses inside the system; due to the inverter and the interconnections between the individual pV modules. It is not included in the efficiency of one module. The chosen system has a loss of 10% (Ap-pendix G)
As no cost for the installation in Tanzania could be found it is assumed that the costs are the same as in Europe. The assumption is probable to be true as the market is highly internationalized and labour costs which make about 10% of such installation are even lower in the area. The price estimated by Mr. Bernd runge for the middle of the year will be about 2200 Euros per kWp. Aboutone per cent of the installation cost is to be accounted for the operation and mainte-nance costs, namely 22 Euros per kW.
6.2 anaerobic digestion
Anaerobic digestion is a naturally occurring process, in which the dry content of organic matter is broken down to various other components, mainly methane (CH4) and carbon-dioxide (Co2). Due to the produc-tion of methane, which has good fuel qualities, there is potential for harnessing this biological process to accommodate various human energy needs.
The process itself only occurs in the absence of oxy-gen (o2) (anaerobic). The decomposition of organic matter is especially interesting for organic waste that is otherwise not a good source for energy produc-tion, e.g. manure from livestock, municipal sewage sludge, and various other industrial and commercial wastes. Besides the production of biogas, a useful ef-fect is, that the decomposition of the organic waste improves the matters use as a pathogen-free stabi-lized manure, namely as high value fertilizer. As high-lighted by the Food and Agricultural organization of the uN (FAo (1997)), a biogas plant can be consid-ered a “cost effective production of energy and soil nutrients”.
going to decrease in the next months and a kW of installed peak capacity will cost around 2200€ according to Mr runge’s predictions. Concerning the operation and maintenance costs the inter-viewee stated that they lie at a maximum of 1% of the investment costs per year.All financial data, which derived from the interview and other sources refers to the European market. This is due to severe problems when trying to gather data about costs in the area. None of the replies in-cluded information or estimations on investment or o&M costs in Tanzania. The average lifetime of 1st and 2nd generation pV modules can be expected to be 30 years and more (Danish Energy Authority 2005, 80).
6.1.6 required data for energypro
In order to model photovoltaic technology in Energy-pro in an accurate way hourly data are needed. This data needs to be uploaded into energypro. EMD was able to provide hourly values for sun radiation as well as temperatures for Zanzibar, which is an island ly-ing just about 35 km off the North-Tanzanian coast. It lies at 39° degrees east of longitude and 6 degrees latitude south of the equator, while Tanga lies at 5 degrees south (Nieminen, Jukka (2008, p.4) Zanzi-bar Multipurpose Cadestre – GIS pilot in Africa. CTA, SMoLE, Tanzania). For the proximity, it was decided to accept them as the best data possible to get.
The provided values are statistical mean values for climatic timeframe of several years. As it could not be clarified for what timeframe, data were checked for validity. When putting in a random theoretical installed capacity of 100 kWp for photovoltaic in energypro and then comparing the resulting output with the stated monthly electricity production of pVGIS(European Commission 2009), which accesses climatic data from all over the world, values are in the same range, which assures the correctness of the data set used.
In order to be able to model and calculate the real output of a solar panel energypro needs several oth-er input data, which define the geographical position and features of the solar panel. The optimal installa-tion angle was also provided by the pVGIS and is four degrees towards north.
Further data is needed for modelling photovoltaic are the NoCT – the working Nominal operating Cell Temperature – which is the operating temperature of the photovoltaic cell at an “estimated temperature of

43
an
aly
sis
of
bio
ga
s a
nd
pv
s fo
r t
fl
tions of various digestives ( (Tanga Fresh Ltd. 2008), FAo 1997). This is because, being a living organism, the bacteria prefer certain conditions and are there-fore sensitive to changes in their living environment. An overview of average biogas outputs according to different feedstock is given in Table (6.1).
6.2.3 important factors to maintain the biological process and an optimal output
As anaerobic digestion of organic material is a quite complex biological process, it needs to be kept under stable conditions in order to maximize the methane output in as short a time as possible. The digestion process takes place during three stages of decompo-sition: Hydrolysis, acidification and methanogenesis. The different bacteria from each digestion phase are dependent on the other bacteria for completing the digestion, i.e. the waste products from one type of bacteria is the substrate for the next type etc. There-fore, it is vital to ensure that all three parts of the digestion are optimized, as problems in one stage will affect the whole process. (Jørgensen 2009, 8-11)
Factors, like temperature, acidity, ratio of the nutri-ents, dry solids content, retention time, load rate etc., that directly influence the choice of technology will be described briefly in the following.
6.2.1 Short technical description
Methanogenic bacteria produce a gas mixture, while degrading biodegradable material under anaerobic conditions. The digestion takes place in several inde-pendent, sequential and parallel complex biological reactions, resulting in the transformation of parts of the dry content of the digested biomass into several gasses [Mshandete and parawira (2009: 116)].
Some input materials have a better output than oth-ers and can differ in terms of economic and techno-logical feasibility. The composition of biogas depends on the organic material but typically contain 50 – 70 % methane, 30 – 40 % carbon dioxide and a low share of other gasses, such as hydrogen, nitrogen, water vapor and trace elements like hydrogen sulphide. Be-ing about 20 % lighter than air, biogas has an ignition temperature of about 650 – 750 °C. The gas is odor- and colorless and has a colorific value of approxi-mately 20 MJ/m3 (FAo 1997). However, the calorific value of biogas varies depending on the gas composi-tion, namely the methane and carbon dioxide share. In this analysis, a share of 65% methane is assumed, resulting in 23 MJ/m3, which is the value used by the Danish energy agency (Energistyrelsen 2006).
The variation in the gas composition is due to the dif-ferent bio chemical characteristics. The actual output can be enhanced a lot by mixing various composi-
feedstock Gas production (m3 biogas/ton bio-mass)
equivalent to (litres of diesel/ton biomass)
Cattle 22 14
pigs 22 14
poultry 50-100 33-65
Intestinal waste from slaughterhouses
40-60 26-39
Fatty wastes from slaugh-terhouses
>100 <65
fish waste 100-1000 65-650
table 6.1 – Biogas potential of various types of biomass (Stenkjær 2008). Notice that the numbers are average numbers based on Danish conditions, and are highly dependent on the gasification technology employed and local variations, i.e. livestock feed, stable design etc.
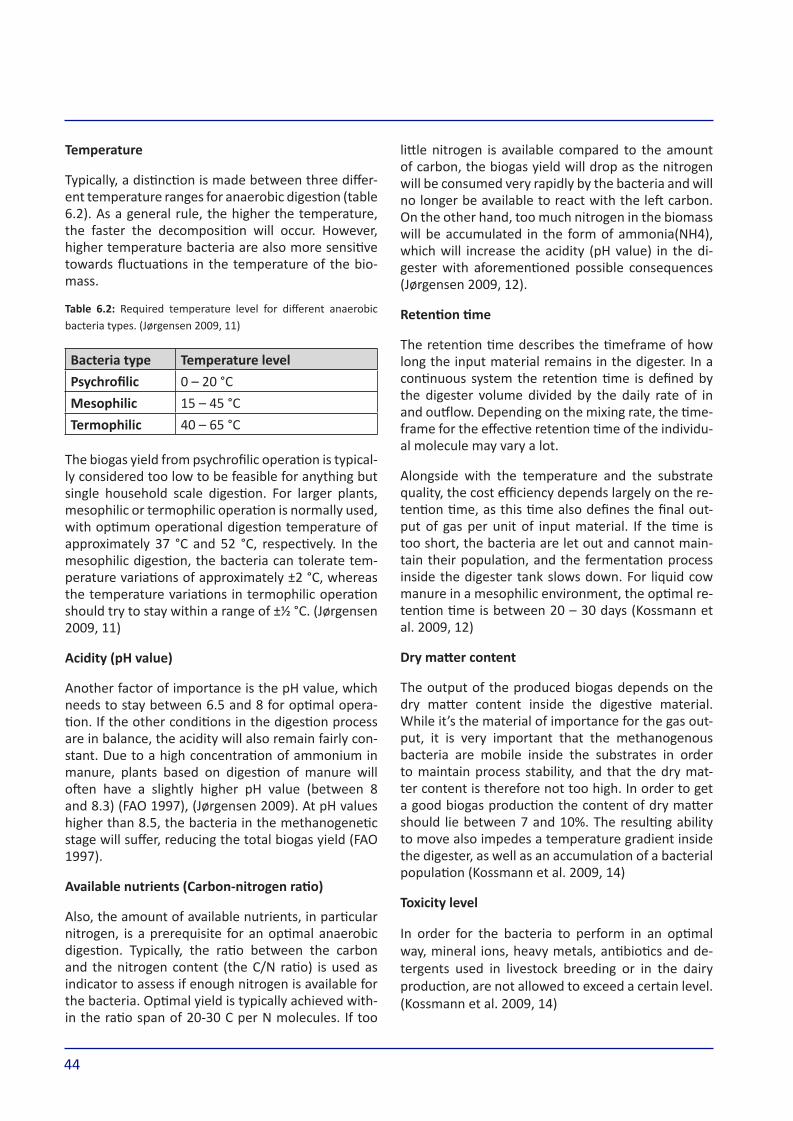
44
little nitrogen is available compared to the amount of carbon, the biogas yield will drop as the nitrogen will be consumed very rapidly by the bacteria and will no longer be available to react with the left carbon. On the other hand, too much nitrogen in the biomass will be accumulated in the form of ammonia(NH4), which will increase the acidity (pH value) in the di-gester with aforementioned possible consequences (Jørgensen 2009, 12).
Retention time
The retention time describes the timeframe of how long the input material remains in the digester. In a continuous system the retention time is defined by the digester volume divided by the daily rate of in and outflow. Depending on the mixing rate, the time-frame for the effective retention time of the individu-al molecule may vary a lot.
Alongside with the temperature and the substrate quality, the cost efficiency depends largely on the re-tention time, as this time also defines the final out-put of gas per unit of input material. If the time is too short, the bacteria are let out and cannot main-tain their population, and the fermentation process inside the digester tank slows down. For liquid cow manure in a mesophilic environment, the optimal re-tention time is between 20 – 30 days (Kossmann et al. 2009, 12)
Dry matter content
The output of the produced biogas depends on the dry matter content inside the digestive material. While it’s the material of importance for the gas out-put, it is very important that the methanogenous bacteria are mobile inside the substrates in order to maintain process stability, and that the dry mat-ter content is therefore not too high. In order to get a good biogas production the content of dry matter should lie between 7 and 10%. The resulting ability to move also impedes a temperature gradient inside the digester, as well as an accumulation of a bacterial population (Kossmann et al. 2009, 14)
toxicity level
In order for the bacteria to perform in an optimal way, mineral ions, heavy metals, antibiotics and de-tergents used in livestock breeding or in the dairy production, are not allowed to exceed a certain level. (Kossmann et al. 2009, 14)
temperature
Typically, a distinction is made between three differ-ent temperature ranges for anaerobic digestion (table 6.2). As a general rule, the higher the temperature, the faster the decomposition will occur. However, higher temperature bacteria are also more sensitive towards fluctuations in the temperature of the bio-mass.
table 6.2: required temperature level for different anaerobic bacteria types. (Jørgensen 2009, 11)
bacteria type temperature level
Psychrofilic 0 – 20 °C
mesophilic 15 – 45 °C
termophilic 40 – 65 °C
The biogas yield from psychrofilic operation is typical-ly considered too low to be feasible for anything but single household scale digestion. For larger plants, mesophilic or termophilic operation is normally used, with optimum operational digestion temperature of approximately 37 °C and 52 °C, respectively. In the mesophilic digestion, the bacteria can tolerate tem-perature variations of approximately ±2 °C, whereas the temperature variations in termophilic operation should try to stay within a range of ±½ °C. (Jørgensen 2009, 11)
acidity (ph value)
Another factor of importance is the pH value, which needs to stay between 6.5 and 8 for optimal opera-tion. If the other conditions in the digestion process are in balance, the acidity will also remain fairly con-stant. Due to a high concentration of ammonium in manure, plants based on digestion of manure will often have a slightly higher pH value (between 8 and 8.3) (FAo 1997), (Jørgensen 2009). At pH values higher than 8.5, the bacteria in the methanogenetic stage will suffer, reducing the total biogas yield (FAo 1997).
Available nutrients (Carbon-nitrogen ratio)
Also, the amount of available nutrients, in particular nitrogen, is a prerequisite for an optimal anaerobic digestion. Typically, the ratio between the carbon and the nitrogen content (the C/N ratio) is used as indicator to assess if enough nitrogen is available for the bacteria. optimal yield is typically achieved with-in the ratio span of 20-30 C per N molecules. If too

45
an
aly
sis
of
bio
ga
s a
nd
pv
s fo
r t
fl
A fixed amount of available slurry and industrial 2. waste is assumed, thus indirectly defining the li-mit for biogas production given the chosen tech-nology
The calculations performed in the pre-feasibility 3. study are presented in annexes which have not been disclosed to the authors of this study
The pre-feasibility study was not conducted with 4. the same emphasis on all three aspects of su-stainability as this study
Due to these reasons, only the overall considerations made in the pre-feasibility study will be challenged in order to verify if the findings will also be valid for electricity production. Furthermore, the results of the economic calculations will be compared to similar biogas studies. Finally, any changes that may be necessary to ensure that the final biogas design meets the criteria for a sustainable technology choice employed in this report will be presented.
Figure (6.2) illustrates the design of the proposed bio gas plant. Necessary changes to that will be discussed in the following.
figure 6.2 original biogas plant design for heat production for TFl
table 6.3. Kossmann et al. 2009, 15. Inhibiti ng substances’ con-Inhibiting substances’ con-centration limit in the input biomass
substance Concentration limit (mg/l)
Copper 10-250
Calcium 8000
Sodium 8000
Magnesium 3000
Nickel 100-1000
Zinc 350-1000
Chromium 200-2000
Sulfide (as sulfur) 200
Cyanide 2
Table (6.3) gives an overview of some of the most common and potent inhibitors on the biogas pro-duction. If any of these substances are expected to appear in significant quantities in either of the bio-masses applied in TFL, it would be advisable to either exclude this biomass if a substitute can be found, or avoid the original pollution of the biomass.
6.2.4 Selection of technology for anaerobic diges-tion at TFL
as described, the process of controlled anaerobic digestion of organic matter can be classified accord-ing to a number of variables.Before the new dairy was taken into operation, the company owners were looking into a possible alternative heat supply of the dairy. This was done through a pre-feasibility study (Tanga Fresh Ltd. 2008) that assessed the feasibility of utilising biogas for heat production. As biogas is a technology that is very dependent on local agricul-tural resources as well as locally available know-how, the results from the local study are assumed more accurate than any study that can be conducted from outside the country. Therefore the proposals of this pre-feasibility study were considered in order to de-termine the feasibility of the design for electricity production, and were analyzed according to the sus-tainability criteria emphasized in chapter 3. However, the recommendations from the study cannot be em-ployed uncritically due to a number of reasons:
The pre-feasibility study was made with the in-1. tention of finding an alternative heat supply, not electricity
Manure digester 2
Manure Dairy waste Octupus waste
Manure digester 1 Mixed digester
Slurry storage 1
Slurry storage 2
Pumping , heating and mixing of slurry
Pumping , heating and mixing of slurry
BiomassBiogasHeat
Legend:
Boiler
Manure digester 2
Manure Dairy waste Octupus waste
Manure digester 1 Mixed digester
Slurry storage 1
Slurry storage 2
Pumping , heating and mixing of slurry
Pumping , heating and mixing of slurry
BiomassBiogasHeat
Legend:
Boiler
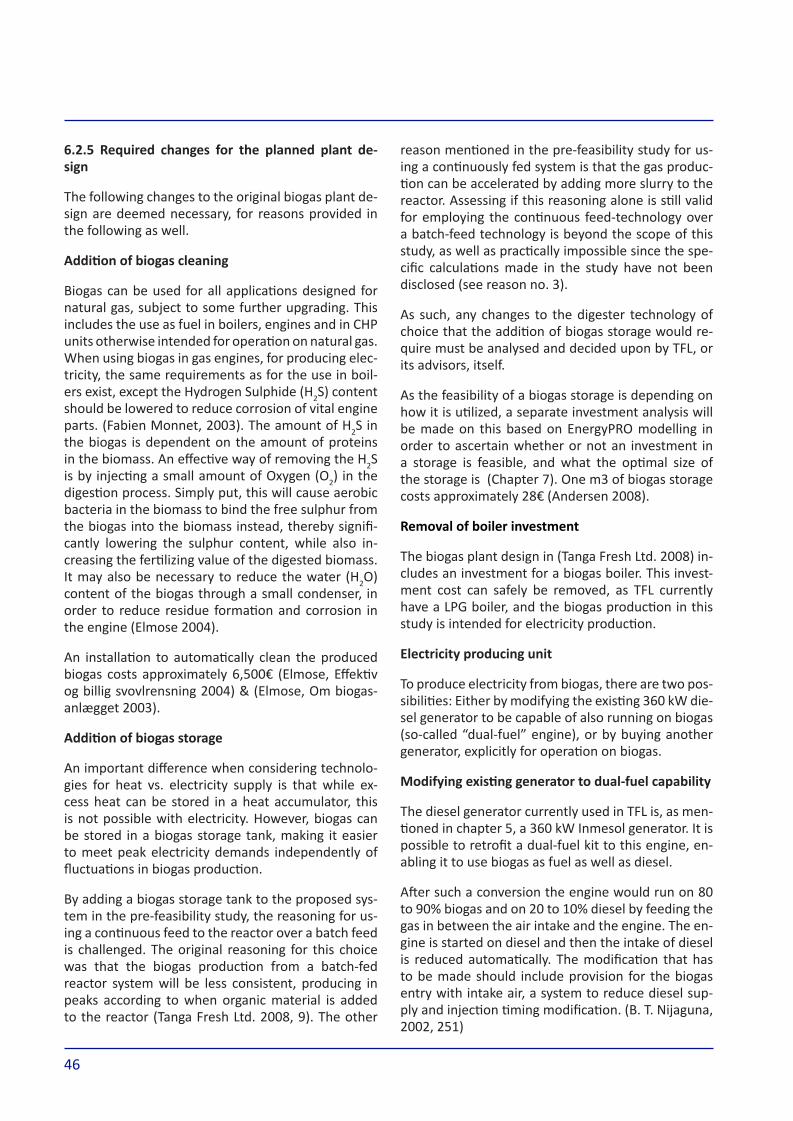
46
reason mentioned in the pre-feasibility study for us-ing a continuously fed system is that the gas produc-tion can be accelerated by adding more slurry to the reactor. Assessing if this reasoning alone is still valid for employing the continuous feed-technology over a batch-feed technology is beyond the scope of this study, as well as practically impossible since the spe-cific calculations made in the study have not been disclosed (see reason no. 3).
as such, any changes to the digester technology of choice that the addition of biogas storage would re-quire must be analysed and decided upon by TFL, or its advisors, itself.
as the feasibility of a biogas storage is depending on how it is utilized, a separate investment analysis will be made on this based on energyPRO modelling in order to ascertain whether or not an investment in a storage is feasible, and what the optimal size of the storage is (Chapter 7). one m3 of biogas storage costs approximately 28€ (Andersen 2008).
removal of boiler investment
The biogas plant design in (Tanga Fresh Ltd. 2008) in-cludes an investment for a biogas boiler. This invest-ment cost can safely be removed, as TFL currently have a LpG boiler, and the biogas production in this study is intended for electricity production.
electricity producing unit
To produce electricity from biogas, there are two pos-sibilities: Either by modifying the existing 360 kW die-sel generator to be capable of also running on biogas (so-called “dual-fuel” engine), or by buying another generator, explicitly for operation on biogas.
Modifying existing generator to dual-fuel capability
The diesel generator currently used in TFl is, as men-tioned in chapter 5, a 360 kW Inmesol generator. It is possible to retrofit a dual-fuel kit to this engine, en-abling it to use biogas as fuel as well as diesel.
After such a conversion the engine would run on 80 to 90% biogas and on 20 to 10% diesel by feeding the gas in between the air intake and the engine. The en-gine is started on diesel and then the intake of diesel is reduced automatically. The modification that has to be made should include provision for the biogas entry with intake air, a system to reduce diesel sup-ply and injection timing modification. (B. T. Nijaguna, 2002, 251)
6.2.5 required changes for the planned plant de-sign
The following changes to the original biogas plant de-sign are deemed necessary, for reasons provided in the following as well.
Addition of biogas cleaning
Biogas can be used for all applications designed for natural gas, subject to some further upgrading. This includes the use as fuel in boilers, engines and in CHp units otherwise intended for operation on natural gas. When using biogas in gas engines, for producing elec-tricity, the same requirements as for the use in boil-ers exist, except the Hydrogen Sulphide (H2S) content should be lowered to reduce corrosion of vital engine parts. (Fabien Monnet, 2003). The amount of H2S in the biogas is dependent on the amount of proteins in the biomass. An effective way of removing the H2S is by injecting a small amount of oxygen (o2) in the digestion process. Simply put, this will cause aerobic bacteria in the biomass to bind the free sulphur from the biogas into the biomass instead, thereby signifi-cantly lowering the sulphur content, while also in-creasing the fertilizing value of the digested biomass. It may also be necessary to reduce the water (H2o) content of the biogas through a small condenser, in order to reduce residue formation and corrosion in the engine (Elmose 2004).
An installation to automatically clean the produced biogas costs approximately 6,500€ (Elmose, Effektiv og billig svovlrensning 2004) & (Elmose, om biogas-anlægget 2003).
Addition of biogas storage
An important difference when considering technolo-gies for heat vs. electricity supply is that while ex-cess heat can be stored in a heat accumulator, this is not possible with electricity. However, biogas can be stored in a biogas storage tank, making it easier to meet peak electricity demands independently of fluctuations in biogas production.
by adding a biogas storage tank to the proposed sys-tem in the pre-feasibility study, the reasoning for us-ing a continuous feed to the reactor over a batch feed is challenged. The original reasoning for this choice was that the biogas production from a batch-fed reactor system will be less consistent, producing in peaks according to when organic material is added to the reactor (Tanga Fresh Ltd. 2008, 9). The other

47
an
aly
sis
of
bio
ga
s a
nd
pv
s fo
r t
fl
is no production of heat from biogas included in the electricity producing biogas plant design.
based on the locally conducted pre-feasibility study and the analysis of above, which compared the find-ings of said study with the criteria used in this report, the following final overall technological design will be proposed – illustrated in Figure (6.3). (Appendix A)
figure 6.3. Original biogas plant design for TFl, including the sug-gested changes; mainly to accommodate electricity production from the biogas.
The biogas is produced in three separate 100 m3 mesophilic digester cylindrical plug-flow digesters. As the original design was intended for heat production, the proposed changes for electricity production, or possibly combined heat and power (CHp), are high-lighted in another colour.
The key operational parameters mentioned, can be summarised for mesophilic biogas production ac-cording to omer and Fadalla (2003: 503):
Diesel engines can be modified easily in order to op-erate on a mix between biogas and diesel. The modi-fication itself is relatively simple, and is typically only a matter of purchasing and installing a pre-fabricated kit. It is assumed that this modification can be under-taken by local mechanics.
The engine speed limiter is not requested if major changes in the flow of biogas can be avoided. The modified engine performance is satisfactory at shafts speed below 2000 rpm, and taking into consideration that the diesel generator used by TFL has a shaft speed of 1500 rpm, it is estimated that operation on dual-fuel should be possible without further signifi-cant changes.
running in overload mode and at maximum speed has to be avoided in dual fuel operation because it could have a negative impact on the engine over time. (NIIr Board, 2004)
It has not been possible to obtain the exact costs for modifying the existing diesel generator to dual-fuel capability as the manufacturer, Inmesol, does not have any direct experience in such modification of this generator type, and generally suggests not to make changes to the engine design. However, they did agree that such modification is possible by apply-ing a standard modification kit. Such a kit typically costs in the range of 2000-4000€, and so a total price of 5000€ for the modification is assumed, including installation.
Investing in a new generator for biogas operation only
A new biogas generator of a similar capacity to the existing diesel generator would cost approximately 330,000 euro which, compared to the required in-vestment for the rest of the biogas plant, and the modification to dual-fuel option, is an exceedingly high cost. This possibility is therefore dismissed for future analysis.
change of heat supply for biomass
In the original design, a small part of the heat pro-duced on the boiler was to be used in the digester system. The pre-feasibility study also mentions how-ever that alternatively, it would be possible to utilize some of the excess hot water from the dairy produc-tion to heat the biomass before entering the digest-ers. This alternative is applied for this study, as there

48
for TFL. This was needed in order to assess the ex-pected energy output of the proposed technology and resources; data which will prove vital in the fol-lowing feasibility analyses.
In the pre-feasibility study, 200 dairy cows are as-sumed to be present at a barn “in the vicinity of the new factory” (Tanga Fresh Ltd. 2008, 5), producing 4500 kg of slurry at 20% dry solids per day. This rep-resents a potential daily heat energy output of 990 kWh (or 3564 MJ), which, assuming methane content of 65% in the biogas, and thus a calorific value of 23 MJ/m3 biogas, would equal a biogas output of ap-proximately 34 m3 per ton excreted slurry.
A nearby fish processing factory is able to deliver 140 kg of fish waste daily, providing a gross biogas energy addition of 145 kWh (Tanga Fresh Ltd. 2008, 6). This indicates that the energy content of the fish waste is approximately 162 m3/tons.
Finally, 3300 kg of milk waste water from the dairy’s production is used to dilute the slurry and octopus waste. The waste water contains 2% dry matter, which accounts for an additional 625 kWh gross bio-gas energy.
These numbers are presented in the table below, with the provided data from the pre-feasibility study shown in black numbers, and the extrapolated num-bers given a calorific value of biogas of 23 MJ/m3 shown in blue:
Tab 6.4 Optimum conditions for biogas production ac-cording to omer and fadalla (2003: 503)
parameter optimum value
Temperature °C 30 – 35
pH 6.8 – 7.5
Carbon / nitrogen ratio 20 – 30
Solid content (%) 7 – 9
retention time (days) 20 – 40
The numbers correspond well to the choices for the design made in the pre-feasibility study, namely 25 days retention time, and dilution of manure to reach approximately 10% solid content, a target pH of 7.2. only deviation is the target temperature of 37 degrees Celsius opposed to the 30-35 suggested by omer and Fadalla. However, Jørgensen, 2009 states 37 degree C to be the optimal temperature for mesophilic opera-tion, which verifies it to be a prudent choice of tem-perature.
6.2.6 Available resources for biogas production
as stated in the pre-feasibility study, there are a num-ber of available biomass resources for anaerobic wet digestion in the area around TFL (Tanga Fresh Ltd. 2008). As the calculations behind the presented num-bers have not been disclosed, some assumptions had to be made to get an idea of the resources’ energy content for gasification using the chosen technology
biogas energy resources
amount (tonne per day)
dry solids share gross energy content/day
biogas yield per tonne feed
biogas yield/day
slurry 4.50 20% 990 kWh 34 m3 155 m3
fish waste 0.14 n/a 145 kWh 162 m3 23 m3
milk waste water
3.30 2% 625 kWh 30 m3 98 m3
total 7.94 - 1760 kWh - 276 m3
table: 6.5

49
an
aly
sis
of
bio
ga
s a
nd
pv
s fo
r t
fl
duce more milk, increasing electricity consumption, but they will also produce more manure, potentially increasing biogas supply. The correlation between biogas supply and electricity consumption is there-fore optimal.
As a side-note, one could argue, that the fluctuation in biogas production is only relevant for the manure based biogas, as the fish waste and wastewater from dairy production is expected to be unaffected by cli-mate variations. However, the limitation for adding wastewater to the digesters is directly dependent on the manure, as it is the manure’s amount of dry sol-ids that allows for the addition of wastewater. Thus, when the amount of manure available is reduced, so is the amount of wastewater that can be added to it, thereby being directly proportional to the amount of biogas produced (except for the 23m3 of fish waste produced biogas, which is assumed to be indepen-dent of the addition of wastewater and manure).
6.2.7 Environmental considerations
In the pre-feasibility study, the authors mention two main environmental impacts of biogas production at TFL (Tanga Fresh Ltd. 2008, 13):
The farmer(s) contributing slurry to the digesti-1. on process will receive higher-quality fertilizing slurry after it has been digested in the reactor tanks. This is a valid point, as digested slurry is known to have increased fertilizing properties, which can reduce the need for adding artificial fertilizer, as well as minimize nutrient flushing to local streams and groundwater (Løbner, et al. 2008, 27).
An estimated annual reduction of 145 tonnes 2. Co2-equivalents is expected in the pre-feasibility study, due to controlled digestion of the slurry as opposed to natural open digestion on agricultu-ral fields.
Average biogas yield per ton of these three resources is 35 m3, which is slightly lower than the average out-put from the centralised plants in Denmark in 2002, which was 41 m3 biogas per tonne of biomass.
However, the Danish centralised biogas plants use relatively more industrial waste, and the most com-mon reactor digestion is termophilic (Løbner 2008) compared to the lower-yielding mesophilic choice of technology in the pre-feasibility study.
on the other hand, a relatively long retention time for the biomass is chosen for TFL (25 days vs. 10-12 days typically on Danish termophilic plants), which should increase the biogas yield substantially (Tanga Fresh Ltd. 2008), Løbner 2008).
All in all, the 35 m3 biogas per tonne seems like a fair estimate, and no further reservations are taken for applying this number. However, as the biogas yield is directly proportionate with the electricity production and thus the final results of further studies, sensitiv-ity analyses on the biogas yield will be made.
A number of additional potential resources are men-tioned in the pre-feasibility study, but none of these are quantified or described in great detail. As such, it may be possible that additional biomass can be add-ed to the reactor tanks in the future, in which case a larger dimensioning of the reactor tanks may be ad-visable. otherwise, the only option for adding more biomass to the digestion will be to reduce the overall retention time correspondingly.
Resource fluctuations
The determining factor for the biogas plants output is the amount of biomass added. of the three known available resources, only one is expected to fluctuate predictably with the climate seasons; the amount of manure produced by the 200 cows at TFL. The rea-soning for this is identical to the reasoning for the fluctuation in milk production and thus electricity de-mand for production: During dry seasons, the cows have less available fodder, and thus produce less milk and manure. The assumed monthly production (based on an average daily biogas production of 276 m3) can be seen on figure 6.4
As biogas production and energy demand is both dependent on cow production, which again varies with seasonal fluctuations, it is no surprise that the pattern of fluctuation is also identical. or, in other words: When there is a lot of rain, the cattle will pro-
figure 6.4: Expected seasonal fluctuations in biogas production.

50
Odour leakages may occur from handling the 2. organic matter for digestion, especially during maintenance operations on the digester or sto-rage tanks.
By applying the relatively simple technology 3. of choice in the pre-feasibility study, only basic education and training should be required for some of the current workers at TFL to be able to operate and do most of the maintaining of the biogas plant.
Tanzanian companies are available in Dar-es-4. Salaam to install the plant, as well as assist with knowledge and practical help on special mainte-nance or operation problems (Appendix H)
Increased knowledge in the Tanga region of using 5. biogas in a larger scale than domestic plants will help clear the way for building additional larger-than-domestic scale plants in the future.
Additionally, there are some requirements for those responsible for the daily operation of the biogas plant. Even in Denmark, where biogas is a well-proven tech-nology with research being done on various elements of the technology, economically successful operation of a plant depends largely on the proficiency of the staff operating it. This dependency can largely be ex-plained by the fact that the anaerobic digestion pro-cess is complex, and thus requires an operator who understands this. (Løbner, et al. 2008)
As such, it’s important that the operator is capable of recognising indicators of problems before they occur. For example, if the acidity in the digester increases, adding more wastewater might prevent inadvertently losing bacteria and thus inhibiting the overall diges-tion. In this example, some experience could possibly also be gained – for example that the rise in acidity was caused by the addition of a specific biomass, or by a too rapid increase in manure input. It is there-fore recommended that a person with a good abil-ity to learn and think independently is chosen for the daily operation of the biogas plant. It is possible that the biogas plant would be operating with poor results if a large number of different people are involved in its operation, unless specific effort is put into infor-mation sharing between the operators.
While the two environmental impacts mentioned in the pre-feasibility study are significant, there are ad-ditional environmental impacts from biogas produc-tion that should be considered to ensure an environ-mentally sustainable production.
unlike most other environmentally sustainable ener-gy technologies, biogas has the potential of emitting large quantities of greenhouse gasses if any biogas leakages occur. Therefore, ensuring that biogas leaks are as negligible as possible must be a prerequisite for categorizing biogas as a Co2-neutral technology (Løbner, et al. 2008, 26-27). This concern should be included into the overall technology of the TFL biogas plant design, especially including the suggested bio-gas storage tank.
Another potential environmental impact that can oc-cur from biogas production on slurry is an increased risk of ammonia evaporation from slurry tanks, in particular the storage tanks for the digested matter. Also, continued anaerobic digestion of the dry solids can occur in the slurry storage, leading to methane emissions to the atmosphere unless the storage tanks are covered. These emissions can especially become a problem when dealing with slurry that has been di-gested in a biogas reactor, because un-digested slurry has a higher dry solids content share which enables it to form a floating top layer in the slurry tank, sig-nificantly limiting the emissions from the slurry un-derneath. Digested slurry, with its reduced dry solids content, cannot form such a layer to the same extent. For this reason, in Denmark, an artificial cover (for ex-ample chopped straw or a concrete ceiling) on stor-age tanks holding digested slurry is compulsory. This should also be included in the slurry tanks at TFl in order to reduce emissions. (Løbner, et al. 2008, 27)
6.2.8 Social considerations
No social benefits that can be said to apply only to the use of biogas over any other reliable alternative energy supply are mentioned in the pre-feasibility study. Still, a few impacts are to be expected from biogas production though:
The odour nuisance from the digested slurry 1. being spread on the fields will be significantly lo-wered, benefiting any neighbours of the fields.

51
an
aly
sis
of
bio
ga
s a
nd
pv
s fo
r t
fl
As such, the annual o&M costs are expected to be approximately 10,872€. Also 9% of investment costs for biogas storage should be included in the invest-ment calculations of this.
6.2.10 further analysis needed (energypro)
For further analysis, the following questions need an-swering:
Is a biogas plant of this size and production a fe-- asible investment for TFL?
Does the addition of a biogas storage change o this? If so, what is the optimal size of a sto-rage?
How can the biogas production meet the o electricity demand? Are there any specific requirements for the daily operation?
6.2.9 Economical considerations
The original investment costs from the pre-feasibility study for a biogas plant intended for heat supply is summarized in the table above.
The investment costs of the additional components described in section 6.2.5 must be added to the above prices. Also, it is necessary to subtract the in-vestment cost for a biogas boiler as this investment is no longer required.
Operation and Maintenance costs
In the pre-feasibility study, annual operation and maintenance (o&M) costs of the biogas plant has been assessed to be approximately 8900, equivalent to 7.24% of the investment costs. Due to the extra installations required for the plant design applied in this study (mainly gas cleaner, dual-fuel operation and, possibly, biogas storage), this share is assumed increased to 9.0%.
plant component expected costs (euro)
Digester materials 32,000
Holding tanks materials 4,800
pricing cow barn floor 20,580
Manure pumps and piping 7,800
gas piping and boiler 20,190
Slurry Feed Heat exchanger and electrical control mechanisms 12,500
Engineering and installation biogas plant 25,000
Additional components
biogas cleaner 6,500
Modification of generator to dual-fuel capability 5,000
Boiler (removal) -13.500
Biogas storage 28€/m3 capacity
total 120,870
table 6.6. Expected investment costs for biogas plant design (including installation), excluding costs of possible biogas storage which will be analyzed independently.

52
Argumentations for applying these values and condi-tions have been presented in chapters 2 and 5.
7.1 supply analysis of photovoltaics for tfl
Data for the photovoltaic modules selected in chap-ter 6 along with the acquired data for sun radiation in the Tanga area (as described in chapter 6), is used for modelling the electricity production in Energypro.
The photovoltaics are set to produce electricity whenever they can, (i.e. there is sufficient sun ra-diation), and independently of whether or not the electricity grid is able to supply the demand. This op-eration strategy is chosen since the cost for produc-ing one unit of electrical energy once the pV’s are in operation is zero, and thus cheaper than both exist-ing alternative electricity supply technologies (diesel generator and grid).
Figure 7.1 shows the production of a week in April (heavy rainy season), with a 100 kWp pV installation.
Like in the demand analysis (chapter 5) it has to be noted that the top graph, even though it is labelled “Electricity Market”, does not describe sales to the electricity grid in Tanzania, but merely the time re-straints of when TFL is able to purchase electricity from the grid, and when they are not. The bottom graph shows the share of the different energy supply “units” – when the electricity grid is available, it is included as the preferred supply unit after the pV’s in Energypro.
Through this chapter, an analysis of how TFL’s elec-tricity demand can be met by either photovoltaics or biogas is carried out. To this end, two tools are em-ployed in unison: Energypro modelling of demand as well as the expected supply of each technology, combined with investment analyses. The investment analysis is carried out in order to ascertain the opti-mal investment of biogas storage and pV cells, based on the modelled electricity production from Energy-pro.
Note that the projections demonstrated by graphs and figures in this chapter, from Energypro, are based on estimates, due to the intermittent nature of pV’s and the supply of electricity from the national grid in Tanzania.
The following general conditions were applied for the investment analyses of both pV’s and biogas:
project period of 10 years-
Discount rate of 8%-
o&M on diesel engine: 7.5 Euro/MWh produced-
Diesel cost: 0.7 Euro/litre-
Electricity cost from grid: 42.5 Euro/MWh-
Annual cost for grid capacity (average of 200 kVA - per month): 11,233 Euro
Linearly declining scrap value (from investment - cost to 0 Euro at end of installations expected lifetime), intersected when project period (which is set to 10 years) ends.
7. supply analysis
figure 7.1: Estimated production of 100 kWp pV for a week in April.
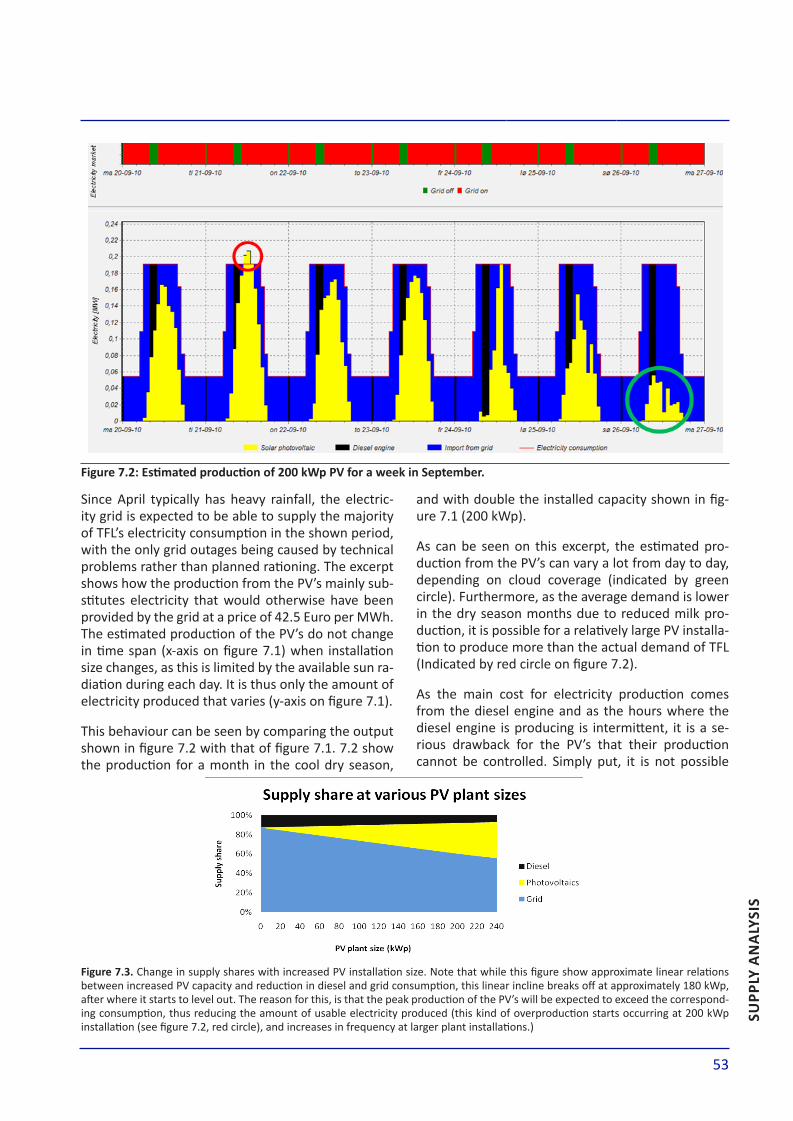
53
supp
ly a
na
lysi
s
and with double the installed capacity shown in fig-ure 7.1 (200 kWp).
As can be seen on this excerpt, the estimated pro-duction from the pV’s can vary a lot from day to day, depending on cloud coverage (indicated by green circle). Furthermore, as the average demand is lower in the dry season months due to reduced milk pro-duction, it is possible for a relatively large pV installa-tion to produce more than the actual demand of TFL (Indicated by red circle on figure 7.2).
As the main cost for electricity production comes from the diesel engine and as the hours where the diesel engine is producing is intermittent, it is a se-rious drawback for the pV’s that their production cannot be controlled. Simply put, it is not possible
Since April typically has heavy rainfall, the electric-ity grid is expected to be able to supply the majority of TFL’s electricity consumption in the shown period, with the only grid outages being caused by technical problems rather than planned rationing. The excerpt shows how the production from the pV’s mainly sub-stitutes electricity that would otherwise have been provided by the grid at a price of 42.5 Euro per MWh. The estimated production of the pV’s do not change in time span (x-axis on figure 7.1) when installation size changes, as this is limited by the available sun ra-diation during each day. It is thus only the amount of electricity produced that varies (y-axis on figure 7.1).
This behaviour can be seen by comparing the output shown in figure 7.2 with that of figure 7.1. 7.2 show the production for a month in the cool dry season,
Figure 7.2: Estimated production of 200 kWp PV for a week in September.
figure 7.3. Change in supply shares with increased pV installation size. Note that while this figure show approximate linear relations between increased pV capacity and reduction in diesel and grid consumption, this linear incline breaks off at approximately 180 kWp, after where it starts to level out. The reason for this, is that the peak production of the pV’s will be expected to exceed the correspond-ing consumption, thus reducing the amount of usable electricity produced (this kind of overproduction starts occurring at 200 kWp installation (see figure 7.2, red circle), and increases in frequency at larger plant installations.)
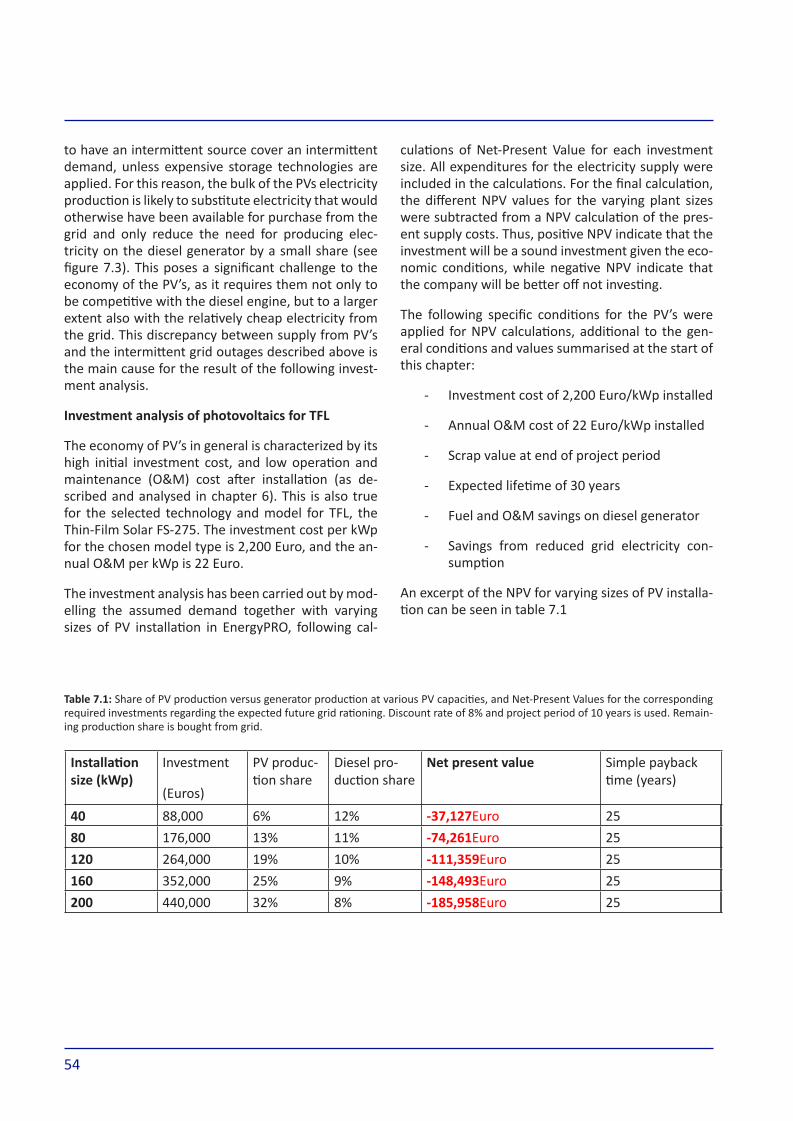
54
culations of Net-present Value for each investment size. All expenditures for the electricity supply were included in the calculations. For the final calculation, the different NpV values for the varying plant sizes were subtracted from a NpV calculation of the pres-ent supply costs. Thus, positive NpV indicate that the investment will be a sound investment given the eco-nomic conditions, while negative NpV indicate that the company will be better off not investing.
The following specific conditions for the pV’s were applied for NpV calculations, additional to the gen-eral conditions and values summarised at the start of this chapter:
Investment cost of 2,200 Euro/kWp installed -
Annual o&M cost of 22 Euro/kWp installed-
Scrap value at end of project period-
Expected lifetime of 30 years-
Fuel and o&M savings on diesel generator-
Savings from reduced grid electricity con-- sumption
An excerpt of the NpV for varying sizes of pV installa-tion can be seen in table 7.1
to have an intermittent source cover an intermittent demand, unless expensive storage technologies are applied. For this reason, the bulk of the pVs electricity production is likely to substitute electricity that would otherwise have been available for purchase from the grid and only reduce the need for producing elec-tricity on the diesel generator by a small share (see figure 7.3). This poses a significant challenge to the economy of the pV’s, as it requires them not only to be competitive with the diesel engine, but to a larger extent also with the relatively cheap electricity from the grid. This discrepancy between supply from pV’s and the intermittent grid outages described above is the main cause for the result of the following invest-ment analysis.
investment analysis of photovoltaics for tfl
The economy of pV’s in general is characterized by its high initial investment cost, and low operation and maintenance (o&M) cost after installation (as de-scribed and analysed in chapter 6). This is also true for the selected technology and model for TFl, the Thin-Film Solar FS-275. The investment cost per kWp for the chosen model type is 2,200 Euro, and the an-nual o&M per kWp is 22 Euro.
The investment analysis has been carried out by mod-elling the assumed demand together with varying sizes of pV installation in Energypro, following cal-
Installation size (kwp)
Investment
(Euros)
Pv produc-tion share
Diesel pro-duction share
net present value Simple payback time (years)
40 88,000 6% 12% -37,127euro 25
80 176,000 13% 11% -74,261euro 25
120 264,000 19% 10% -111,359euro 25
160 352,000 25% 9% -148,493euro 25
200 440,000 32% 8% -185,958euro 25
table 7.1: Share of pV production versus generator production at various pV capacities, and Net-present Values for the corresponding required investments regarding the expected future grid rationing. Discount rate of 8% and project period of 10 years is used. remain-ing production share is bought from grid.

55
supp
ly a
na
lysi
s
regarding the economic conditions for TFL, the results from the NpV calculations show, that no investment in pVs would be profitable, as all the Net present Val-ues are negative. As shown by figure 7.3, this is true even if substantially more grid rationing should occur in the future. Various theoretical electricity supply scenarios, like light, medium and heavy grid ration-ing scenarios, have been introduced and described in chapter 5. For all those scenarios the NpV is negative within a 10 year project period, independent of the size of the pV installation.
For the expected rationing, the NpV is only positive at discount rates below 0.8%, which means that the In-
ternal rate of return (Irr) is 0.8%. This is true for all modelled installation sizes. An excerpt showing NpV for three different pV installations at varying discount rates can be seen in figure 7.4
The Irr for pV installations in the two increased grid rationing scenario is 5.5% (medium rationing) and 7% (heavy rationing). In these scenarios, the NpV is 0 for an installation of 160 kWp, which indicates that this installation size is economically optimal, given more severe rationing in the future.
This shows that the feasibility of the pV’s increases corresponding to the increased duration of the work-ing diesel generator during days. However, even with the substantial (and unlikely) amount of grid rationing modelled in the heavy rationing scenario, the pV’s do not become feasible with the (after Tanzanian condi-tions) relatively low interest rate of 8%. The reason for this is that while electricity produced from pVs would be cheaper than operating the diesel engine, it is not possible to ensure that their production sub-stitutes the expensive diesel consumption instead of the cheap electricity purchased from the grid. As a result, pV’s cannot be expected to become feasible for TFL unless substantial investment subsidies are granted, along with increased national grid rationing in the dry seasons.
conclusion on economic viability of photovoltaic as alternative electricity supply for TFL
Due to the unpredictable nature of the electricity grid outages in Tanzania, combined with the intermit-tent electricity production from pV’s, the electricity
figure 7.3: NpV for different pV plant sizes in each future grid rationing scenario.
figure 7.4: NpV for three different pV installation sizes, at various discount rates (With expected grid rationing and project period of 10 years).

56
rare property among renewable energy is the main advantage, and is vital for the economic feasibility for using biogas at TFL, as will be shown in the follow-ing.
as the amount of biogas produced is assumed to be limited by the available amount of manure and fish waste, the following questions are to be answered by the economical analysis:
Is it feasible to operate a biogas plant without - the use of a biogas storage?
Is it feasible to operate a biogas plant with the - use of a biogas storage?
If so, what size of storage would be op-o timal?
The analysis required to answer the abovementioned questions is subject to the proposed biogas plant de-sign and size of chapter 6, and the assumed demand fluctuations of chapter 5.
Analysis of biogas operation without the use of a biogas storage
The biogas plant design that was considered in the pre-feasibility study was intended to supply biogas to a boiler to cover the heat demand of TFL. As has been described in chapter 6, the difference between sup-plying electricity and heat is that while heat can be stored as hot water, electricity cannot be stored with current commercially available technology. The elec-tricity must be produced at the instant the demand requires it. This restriction affects the economic fea-sibility for investing in biogas to produce electricity at
demand during grid outages cannot be relied upon to be met by the pV’s fluctuating production.
This directly affects the feasibility of investing in a pV installation, as the production from the expensive diesel generator will not be decreased enough to jus-tify the investment economically.
While scenario testing for substantially increased grid rationing in the dry periods shows that the feasibility of pV’s increase, they remain at a disadvantage given the 10 year project period and 8% discount rate and higher. This is further underlined by the simple pay-back time of 25 years, which almost equals the ex-pected lifetime of the pV cells of 30 years.
While the immediate conclusion is that Pvs are not a feasible investment for TFL given current conditions, it can also be concluded from the analysis that Pvs are currently unable to compete economically with the electricity grid in Tanzania, despite the abundance of solar energy in the country.
Should it be possible for TFl to obtain subsidies for the investment in photovoltaics (for example through CDM-project funding or similar), a subsidy share of at least 61% of the investment costs would be required to make the pV installation feasible.
7.2 supply analysis of biogas for tfl
A vital part of the biogas economic feasibility is the daily operation of both the biogas plant itself, but in particular also how and when the biogas is burnt in the dual-fuel generator. The reason for this is that in comparison to electricity produced by Pvs, biogas can be stored, and used when the need is greatest. This
figure 7.5: Expected electricity supplied from biogas production without storage for a week in August.
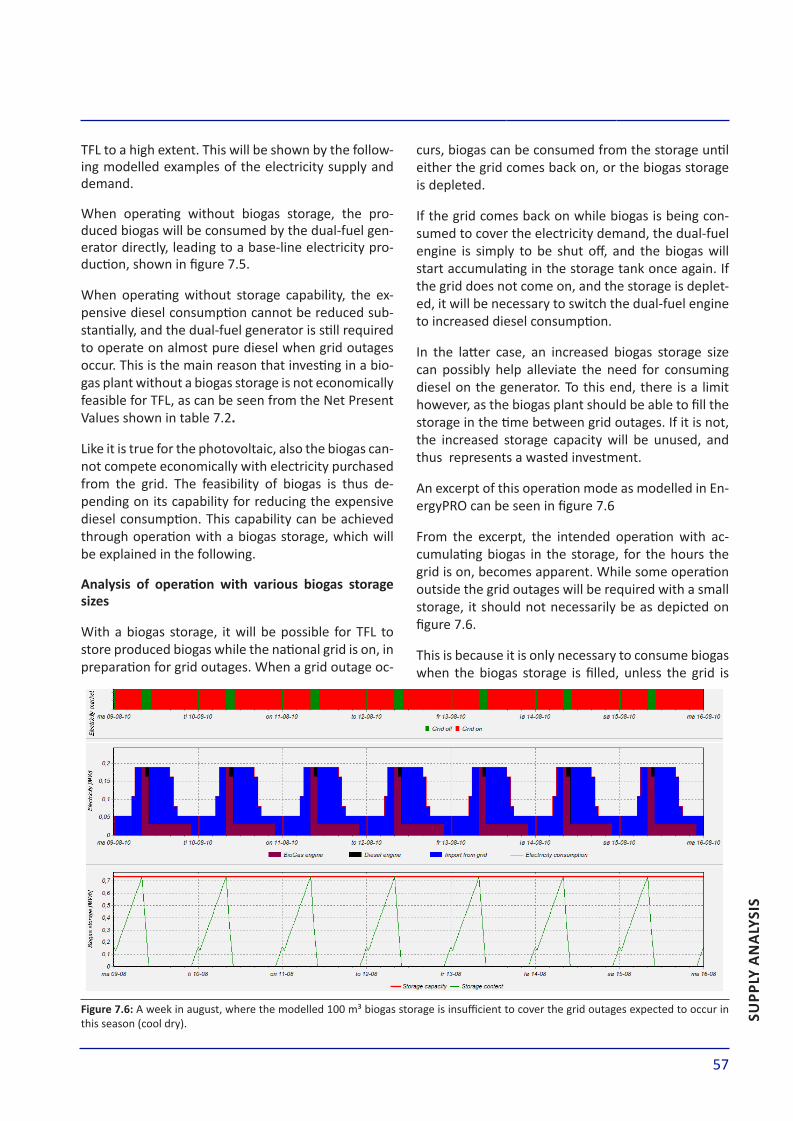
57
supp
ly a
na
lysi
s
curs, biogas can be consumed from the storage until either the grid comes back on, or the biogas storage is depleted.
If the grid comes back on while biogas is being con-sumed to cover the electricity demand, the dual-fuel engine is simply to be shut off, and the biogas will start accumulating in the storage tank once again. If the grid does not come on, and the storage is deplet-ed, it will be necessary to switch the dual-fuel engine to increased diesel consumption.
In the latter case, an increased biogas storage size can possibly help alleviate the need for consuming diesel on the generator. To this end, there is a limit however, as the biogas plant should be able to fill the storage in the time between grid outages. If it is not, the increased storage capacity will be unused, and thus represents a wasted investment.
An excerpt of this operation mode as modelled in En-ergypro can be seen in figure 7.6
From the excerpt, the intended operation with ac-cumulating biogas in the storage, for the hours the grid is on, becomes apparent. While some operation outside the grid outages will be required with a small storage, it should not necessarily be as depicted on figure 7.6.
This is because it is only necessary to consume biogas when the biogas storage is filled, unless the grid is
TFL to a high extent. This will be shown by the follow-ing modelled examples of the electricity supply and demand.
When operating without biogas storage, the pro-duced biogas will be consumed by the dual-fuel gen-erator directly, leading to a base-line electricity pro-duction, shown in figure 7.5.
When operating without storage capability, the ex-pensive diesel consumption cannot be reduced sub-stantially, and the dual-fuel generator is still required to operate on almost pure diesel when grid outages occur. This is the main reason that investing in a bio-gas plant without a biogas storage is not economically feasible for TFl, as can be seen from the Net Present Values shown in table 7.2.
Like it is true for the photovoltaic, also the biogas can-not compete economically with electricity purchased from the grid. The feasibility of biogas is thus de-pending on its capability for reducing the expensive diesel consumption. This capability can be achieved through operation with a biogas storage, which will be explained in the following.
Analysis of operation with various biogas storage sizes
With a biogas storage, it will be possible for TFL to store produced biogas while the national grid is on, in preparation for grid outages. When a grid outage oc-
figure 7.6: A week in august, where the modelled 100 m³ biogas storage is insufficient to cover the grid outages expected to occur in this season (cool dry).

58
substituted will be identical. The main point is, that the biogas storage must act as a backup unit (simi-lar to the current function of the diesel generator), capable of covering both expected and unexpected grid outages.
Figure 7.7 shows the proportional supply share changes with increased storage sizes. It is apparent from the graph, that at approximately 150 m³ storage size, a minimum of diesel consumption is achieved (the last remnant of diesel still consumed is the amount needed for co-combustion with the biogas in the dual-fuel engine).
It is likewise apparent from figure 7.7, that while the share of electricity demand, which is met by biogas, does not change (it stays constant at 26% since both demand and biogas production is fixed), the share of grid electricity increases along with increased biogas storage size.
The bottom graph in figure 7.8 shows how the biogas storage goes from almost full to empty in the span of each daily grid outage in December.
offline. However, some capacity in the biogas storage for backup in case of unexpected grid outages should still be left. on the other hand, in order to obtain maximum efficiency on the dual-fuel engine, it should be operated to consume enough biogas to cover the current electricity demand for the intended period. As such, the modelling in Energypro is reverse, as the program attempts to accumulate biogas in prepara-tion for grid outages that the intelligent design of the program expects. In reality, these grid outages would occur more randomly and thus less predictably for the operators. optimum operation for reducing the need for diesel operation will therefore be to attempt to have a full storage at all times; ready for use if the electricity grid goes offline.
Fortunately, this reverse biogas consumption strategy does not affect the overall result, as an expected fixed amount of produced biogas needs to be consumed (average of 276 m³ per day (see chapter 6.2)). If the storage is able to cover the grid outages completely, the remaining electricity produced from biogas will substitute electricity otherwise purchased from the grid. The exact time and amount substituted at any time is not crucial, as the total amount of electricity
figure 7.7: Supply share at expected grid rationing with varying biogas storage sizes.

59
supp
ly a
na
lysi
s
Expected lifetime of the biogas plant is 15 years-
Investment cost for the biogas plant is 120,870 €, - and 28 € per m³ of biogas storage added
Annual o&M costs for biogas plant is 9% of in-- vestment costs, which is 10,872 €, plus 2,5 € per m³ biogas storage added
o&M costs for combustion of biogas on the die-- sel generator is 7.5 € per MWh, totalling 2,182 € per year
Amount of diesel for combusting the biogas in - the dual-fuel generator is expected to be 15% of the biogas amount; which equals to 857 litres of diesel per year (at a cost of 0.7 € per litre).
Additional to these specific biogas factors are the general factors, which are described on page XX (First page of this chapter), of which the most important is the use of 8% discount rate and a project period of 10 years, unless otherwise specified in the following.
Figure 7.9 shows how crucial the addition of a biogas storage of sufficient size is for the economic viability of investment in a biogas plant for TFL.
Given such operation, the following economic results can be expected to be achieved.
investment analysis of biogas
unlike with photovoltaics, significant annual opera-tion and Maintenance costs are to be expected with a biogas installation, as a trade-off for the cheaper investment costs per energy unit. As has been de-scribed in the previous section, biogas does hold one significant advantage over most other renewable technologies (including photovoltaics), as it, to some extent, can be operated in a non-intermittent man-ner; effectively capable of directly replacing fossil fuel systems.
This mode of operation is only possible with a biogas storage, of which the economic benefits are evident, as can be seen with figure 7.8.
To re-iterate from chapters 2, 4, and 6, the following figures are used for the economic analysis of invest-ment in biogas plant, unless otherwise specified:
Daily production of biogas is, on average, 276 - m³, but expected to be fluctuating with climate seasons (see chapter 6.2).
figure 7.8: operation with a 150 m³ biogas storage for 7 days between November and December (“short rain month” and “hot dry” month).
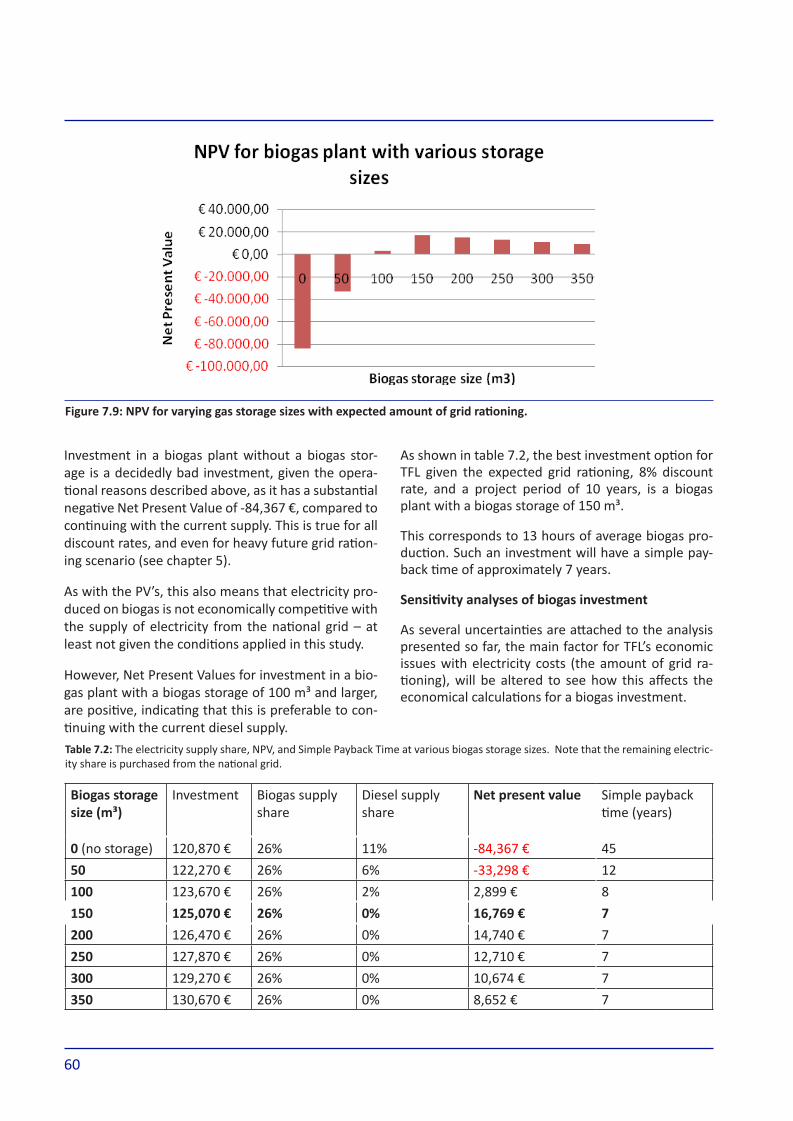
60
As shown in table 7.2, the best investment option for TFL given the expected grid rationing, 8% discount rate, and a project period of 10 years, is a biogas plant with a biogas storage of 150 m³.
This corresponds to 13 hours of average biogas pro-duction. Such an investment will have a simple pay-back time of approximately 7 years.
Sensitivity analyses of biogas investment
As several uncertainties are attached to the analysis presented so far, the main factor for TFL’s economic issues with electricity costs (the amount of grid ra-tioning), will be altered to see how this affects the economical calculations for a biogas investment.
Investment in a biogas plant without a biogas stor-age is a decidedly bad investment, given the opera-tional reasons described above, as it has a substantial negative Net present Value of -84,367 €, compared to continuing with the current supply. This is true for all discount rates, and even for heavy future grid ration-ing scenario (see chapter 5).
As with the pV’s, this also means that electricity pro-duced on biogas is not economically competitive with the supply of electricity from the national grid – at least not given the conditions applied in this study.
However, Net present Values for investment in a bio-gas plant with a biogas storage of 100 m³ and larger, are positive, indicating that this is preferable to con-tinuing with the current diesel supply.
Figure 7.9: NPV for varying gas storage sizes with expected amount of grid rationing.
biogas storage size (m³)
Investment biogas supply share
Diesel supply share
net present value Simple payback time (years)
0 (no storage) 120,870 € 26% 11% -84,367 € 45
50 122,270 € 26% 6% -33,298 € 12
100 123,670 € 26% 2% 2,899 € 8
150 125,070 € 26% 0% 16,769 € 7
200 126,470 € 26% 0% 14,740 € 7
250 127,870 € 26% 0% 12,710 € 7
300 129,270 € 26% 0% 10,674 € 7
350 130,670 € 26% 0% 8,652 € 7
table 7.2: The electricity supply share, NpV, and Simple payback Time at various biogas storage sizes. Note that the remaining electric-ity share is purchased from the national grid.

61
supp
ly a
na
lysi
s
will not be profitable. As described in chapter 5, the amount of grid rationing described by “expected grid rationing scenario”, or more, is most likely to occur within the project period.
Figure 7.10 shows another interesting aspect, how-ever, as in both increased grid rationing scenarios, the 200 m³ biogas storage gives the highest Net pres-ent Value. This can be explained by the supply shares shown in figure 7.11.
Figure 7.10 shows NpV calculations similar to that presented in figure 7.9, but here the NpV’s are com-pared to the alternative grid rationing scenarios, as described in chapter 5.
As shown in figure 7.10, increased grid rationing makes biogas an even better economic investment than with the expected amount of future grid ration-ing. However, should there be almost no grid ration-ing at all (indicated by the “light rationing scenario”) in the project period of 10 years, the investment
Figure 7.10: NPV of investment in biogas plant and various biogas storage sizes, in each of the four different grid rationing scenarios.
figure 7.11: Supply shares for heavy grid rationing at various biogas storage sizes.
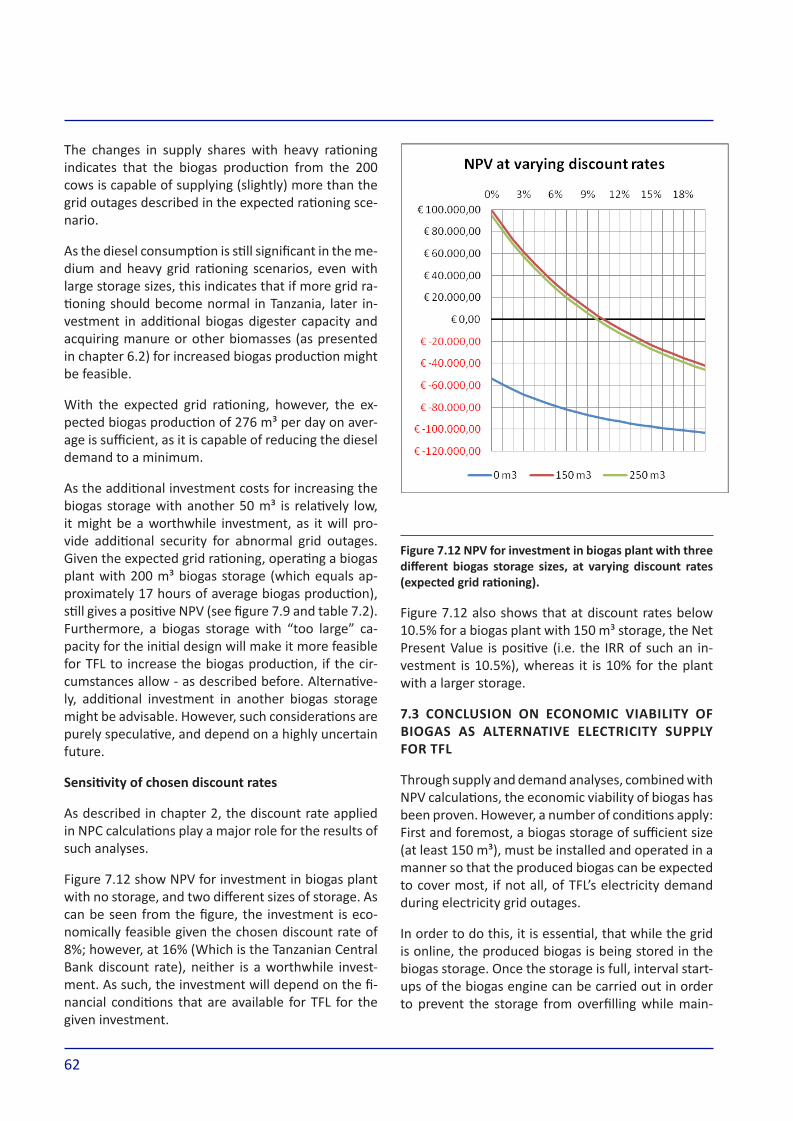
62
figure 7.12 npv for investment in biogas plant with three different biogas storage sizes, at varying discount rates (expected grid rationing).
Figure 7.12 also shows that at discount rates below 10.5% for a biogas plant with 150 m³ storage, the Net present Value is positive (i.e. the Irr of such an in-vestment is 10.5%), whereas it is 10% for the plant with a larger storage.
7.3 conclusion on economic viability of biogas as alternative electricity supply for tfl
Through supply and demand analyses, combined with NpV calculations, the economic viability of biogas has been proven. However, a number of conditions apply: First and foremost, a biogas storage of sufficient size (at least 150 m³), must be installed and operated in a manner so that the produced biogas can be expected to cover most, if not all, of TFL’s electricity demand during electricity grid outages.
In order to do this, it is essential, that while the grid is online, the produced biogas is being stored in the biogas storage. once the storage is full, interval start-ups of the biogas engine can be carried out in order to prevent the storage from overfilling while main-
The changes in supply shares with heavy rationing indicates that the biogas production from the 200 cows is capable of supplying (slightly) more than the grid outages described in the expected rationing sce-nario.
As the diesel consumption is still significant in the me-dium and heavy grid rationing scenarios, even with large storage sizes, this indicates that if more grid ra-tioning should become normal in Tanzania, later in-vestment in additional biogas digester capacity and acquiring manure or other biomasses (as presented in chapter 6.2) for increased biogas production might be feasible.
With the expected grid rationing, however, the ex-pected biogas production of 276 m³ per day on aver-age is sufficient, as it is capable of reducing the diesel demand to a minimum.
As the additional investment costs for increasing the biogas storage with another 50 m³ is relatively low, it might be a worthwhile investment, as it will pro-vide additional security for abnormal grid outages. Given the expected grid rationing, operating a biogas plant with 200 m³ biogas storage (which equals ap-proximately 17 hours of average biogas production), still gives a positive NpV (see figure 7.9 and table 7.2). Furthermore, a biogas storage with “too large” ca-pacity for the initial design will make it more feasible for TFL to increase the biogas production, if the cir-cumstances allow - as described before. Alternative-ly, additional investment in another biogas storage might be advisable. However, such considerations are purely speculative, and depend on a highly uncertain future.
Sensitivity of chosen discount rates
As described in chapter 2, the discount rate applied in NpC calculations play a major role for the results of such analyses.
Figure 7.12 show NpV for investment in biogas plant with no storage, and two different sizes of storage. As can be seen from the figure, the investment is eco-nomically feasible given the chosen discount rate of 8%; however, at 16% (Which is the Tanzanian Central Bank discount rate), neither is a worthwhile invest-ment. As such, the investment will depend on the fi-nancial conditions that are available for TFL for the given investment.

63
supp
ly a
na
lysi
s
of 7 years. For this calculation, a discount rate of 8% is used, a project period of 10 years, and an expected biogas plant lifetime of 15 years.
Given the expected amount of grid rationing in the future, the current obtainable biogas production of 276 m³ per day on average is sufficient for covering the grid outages. However, should more grid ration-ing become the norm, additional investments to increase biogas production might be advisable, but should of course be subject to analysis given those changed conditions. The design of the biogas plant and the operation strategy however supports such expansion possibilities.
taining a high output on the generator to achieve a generating efficiency as high as possible. However, the storage should always be kept as full as possible, in the event of unexpected grid outages.
As the majority of the grid outages occur due to grid rationing, especially in the dry seasons, preparations should be made to meet the rationing caused grid outages with a full biogas storage.
Given such operation, the investment in a biogas plant with a 150 m³ storage , has a net-present value of 16,769 Euro, compared to business-as-usual (only diesel backup generator), and a Simple payback Time
64
Based on the analysis of the renewable electricity context of TFL, the sustainability criteria, as well as the demand analysis, a biogas plant and a photo-voltaic (pV) plant were determined to be potential options to lower the overall electricity costs of TFL. Those two technologies were afterwards described in detail, together with economic considerations and insight to the resource availability in the region.
During the latter part of the analysis, emphasis was on economic analysis on an installation of pVs with different installed capacities, as well as on a biogas plant, with various storage sizes. The latter focus was chosen, because the installation size of the biogas plant was already defined by the amount of biomass for digestion determined in a pre-feasibility study by TFL and only the economy of different operation strategies, which related directly to the use of a stor-age or not, was the main variable that required spe-cific analysis. This analysis was carried out through modelling in the computer tool Energypro, where the demand of TFL was compared to the supply of both pV and biogas plant. Net present Value calcula-tions of each of these different supplies were then compared with similar calculations for “business as usual”, to see if an investment in either pV or a biogas plant would be economically feasible.
8.2 results
based on the sustainability criteria, the analysis of the context of TFL and the available renewable resources and technologies, pVs and biogas installations turned out to be possible options to lower the electricity costs of TFL. This at least holds true for the social and environmental sustainability criteria. The economic side was analysed with the help of Net-present-Value calculations in a further step.
The economic calculations for the pVs were focused on various installation sizes between 20 and 240 kWp. While the investment costs were assumed to be 2,200 Euro per installed kWp the operation and maintenance costs were set to be 1% of such. Despite of the good resource availability, with a project period of 10 years and a resulting rather high scrap value (as the expected lifetime is 30 years), the usage of an 8% discount rate, still lead to an infeasible investment for all installation sizes. Through the analysis it is appar-ent that the investment in pVs can only be feasible under the present conditions if significant subsidies can be obtained for the investment.
In this chapter, the research question of the study, as well as the approach chosen to answer this, is pre-sented. Next, the results are briefly presented and discussed, followed by a presentation of how said re-sults and findings of this study can be used by Tanga Fresh Ltd. (TFL). Finally, a conclusion that seeks to an-swer the primary research question is presented.
8.1 project approach
The aim of the project was to undertake studies on the feasibility of an alternative electricity supply for a dairy farm in the Tanga region in Tanzania.
The research question:
“How can TFL’s costs for electricity supply be lowered in a sustainable way?”
has been sought answered through several steps, in-volving various methods.
First, as much information as possible about TFL’s conditions were gathered and analysed. This was done for the sake of getting an understanding of the context of the project.
After knowing about the approximate context, a number of criteria for a sustainable electricity sup-ply was established. Those criteria were based on the foundation of the Brundlandt report of 1987, which highlights the three pillars of social stability, economy and the environment, which all have to be considered in equal manner.
After having established those criteria, a more con-cise context analysis was carried out, in order to find out about technologies which can possibly meet those defined sustainability criteria. This analysis took place considering influenceable inside factors like TFLs stakeholder relations and financial possibilities, as well as outside factors, like the energy sector in Tanzania, and the situation about various renewable energy resources as well as about the corresponding electricity conversion technologies.
Next step involved analysing the electricity demand for TFL. processing of the few provided data showed, that due to the incompleteness and randomness of the data, they would be difficult to evaluate. They could only be regarded as approximations for a future expectation. Various assumptions, which were based on the climatic seasons, had to be made in order to get an expected electricity demand for TFL.
8 discussion and conclusion
65
dis
cuss
ion
an
d c
on
clu
sio
n
the Co2 emissions from diesel (which amounts to as much as 24 tons per year), but also by contributing to increased fertilizer value for the farmers using the manure, along with several other local environmen-tal advantages.
Socially, the investment can be expected to create in-creased knowledge of biogas in the area, and might contribute to an expansion of decentralised electric-ity production in a country where the central produc-tion is struggling to meet the demand. Furthermore it can produce other valuable products like solid and liquid fertilizer that can be sold to the surrounding farmers.
8.3 critical discussion of results
This section discusses the findings of the results in this study, while presenting suggestions for how any weaknesses that may exist in the analyses can be identified and, if need be, corrected by Tanga Fresh Ltd before use.
Two main reasons exist for the numerous assumptions that have been presented in this study: Firstly, the dairy in question has only been in operation for 6 months at current time of writing, which severely limits the amount of both accessible data, but also some tainting of the data (compared to how it will stabilise in a few years from now) on electricity consumption etc. must be expected while the new plant is in its start-up phase. Secondly, the geographical distance between the authors (who have been situated in Denmark for the duration of the project) and the company in question has posed some difficulties. Ideally, on-scene interviews and observations would have added significant value to the methodology of the project.
Consequently, some assumptions on critical data and factors have been necessary to make, which justifies this section of the conclusion.
the results and their immediate applicability for tfl
The direct results from the analyses carried out in this study are the following:
As photovoltaics are nowhere near being eco-- nomically viable for investment, they cannot be considered a sustainable alternative to the cur-rent electricity supply of TFl
This is because Pvs rely on the sun as an intermit-tent energy source and can not be used in a flexible way; i.e. at times when the unpredictable grid shuts off. Therefore the pV can not be used as a technol-ogy which covers the hours when the diesel engine is running, but instead it delivers electricity, whenever the sun is shining, regardless of the current need for their production.
However, an investment in a biogas plant was deter-mined to be a feasible option to lower TFLs expendi-tures, provided that the operation strategy supports the technology’s advantage of being a storable en-ergy source. The use of a sufficiently sized storage makes it possible to minimize the diesel consumption to a bare minimum, which is a prerequisite for the economic feasibility of the investment.
The properties of the biogas investment can be sum-marized as follows.
The estimated price for the installation of the - biogas plant and a 200 m3 storage is 126,470 Euro.
The average biogas production is 276 m³ per day-
Given a calorific value of biogas of 23 MJ/m3 this - leads to a gross energy output of 1.76 MWh.
With an efficiency of 39% the electric output pro-- duction would be 0.86 MWh/day.
This output can on average cover 26 % of TFLs - electricity demand.
However, with optimal operation of the biogas stor-age, the produced biogas is expected to be able to reduce the diesel consumption by as much as 98%. This leads to substantial annual savings for diesel oil, which is the reason that an investment in a biogas plant for electricity production is economically fea-sible for TFL given the conditions and assumptions set forth in this study. With a NpV of 14,740€, Simple payback Time of 7 years, and an Irr of 10.5%, the investment is even to be considered economically sound.
Added to the economic advantages, significant posi-tive environmental and social benefits can also be ex-pected from an investment in biogas.
The installation, will lower the negative environmen-tal effects of the diesel generator, partly by reducing

66
corrected in the calculations before proceeding with the results provided in this study.
The amount and frequency of grid rationing
The national grid rationing is what made TFL consider alternative electricity supply. However, an investment in such a technology should not be based on brief his-torical data, unless these can truly be expected to de-scribe the future grid rationing as well. Therefore, a scrutiny of the described grid rationing scenarios and the analyses related to these should be undertaken locally before a decision of investing is made.
If more severe grid rationing is to be expected than what has been argued for in this study, a larger stor-age might be feasible. However, if the period between outages is too big, the storage size would have to be substantial (maybe covering several days of biogas production). At the very least, it has to be guaranteed that the majority of the biogas produced can be used to cover grid outages rather; if not, it will probably not be feasible to invest in biogas as electricity pro-duced on biogas is not able to compete with a well-functioning national grid.
The applied conditions for economic calculations
A discount rate of 8% was chosen for the Net present Value calculations, which is based on the loan rate TFL is able to obtain. Naturally, the economic analyses carried out in this project are not directly applicable for calculating loan options, and as such further eco-nomic analysis should be conducted. In this regard, the applied conditions for the economic calculations in this study should also be checked and edited if found unrealistic compared to actual local conditions – for example, the assumed 15 year lifespan of the biogas plant, the 10 year project period, or the 8% discount rate.
The optimal operation of the biogas plant to ensure the expected biogas production is met
operating a biogas plant can be a quite tasking job, and steps should be taken to ensure that adequate training on the subject can be acquired for the rel-evant people at TFL. Furthermore, it is advisable if contact to operators of other biogas plants of simi-lar size or larger can be obtained. Such assistance is especially likely to be appreciated during the startup phase of the biogas plant, but it should also prove highly valuable if (or when) extraordinary operational problems arise in the future.
A biogas plant with a 150 m3 biogas storage - represents a sound economical investment, and likewise meets the social and environmen-tal criteria for being a sustainable alternative, although the economic feasibility is heavily con-strained by a number of conditions
pV is thus excluded in the following, as not only slight improvements would have to be made to make it a feasible option. pV can only be seen as a solution if special subsidies, feed-in tariffs or used modules for a very low price would become available.
The most viable alternative for a sustainable electric-ity supply for TFL was found to be a biogas plant, but the robustness of this economically sound investment relies heavily on a number of variables; the most im-portant and unsecure of these being the following:
The specific costs applied for the economical calcu-lations
Although it has been strived to use various costs and prices that are as close as possible to the reality in Tanga, the investment costs as well as operation & Maintenance costs applied in this study should be verified, in order to ensure that they are not far off from what can be expected locally.
The electricity demand and its fluctuations
It has to be kept in mind, that the results of this report are based on various assumptions, which were established in chapter 5, where an expected future electricity demand of TFL was determined. Before investing in a biogas installation, those assumptions need to be checked carefully, as all calculations and results are based on them. It has to be analysed how realistic the modelled future grid rationings are. Here the distribution and the frequency need to be focused on. During the whole project and during the demand analysis not many sources were available to validate it.
Also data for the overall electricity demand is rather vague. Fragmentary data on the grid supply and the diesel consumption were gained. Seasonal variations were assumed on the basis of correspondence with TFL employees and literature studies, but overall, the data acquired for the demand are largely based on assumptions, and should be checked and possibly
67
dis
cuss
ion
an
d c
on
clu
sio
n
A different approach of making the investment more lucrative is lowering the investment costs, which could be achieved in different ways. Though all of them include asking for outside help. The cost could be decreased by getting services like planning tasks, construction work or material, machinery or the help of skilled workers cheaper or for free. potential do-nors of such are likely to be governmental develop-ment agency like Danida and GTZ, but also private businesses that engage in supporting entrepreneurs in developing countries.
A third way of making the investment even more ap-pealing for investors, is by generating income through the biogas plant additional to the savings that are be-ing made by reducing the diesel costs. Therefore it seems interesting to look into a tool called ‘clean de-velopment mechanism’ (CDM). It is part of the Kyoto-protocol and allows international trade of emissions between developed and developing countries. Dif-ferent ways of accreditation are possible. upfront monetary investment support is possible; this way the saved emissions will directly be credited for the external investor. Also for newly invested appliances saved emissions can be traded within the CDM proc-ess. It has to be mentioned that the accreditation of a project within the CDM concept requires a lot of time and is complicated to establish.
using excess heat from the generator
A second direction of helping the biogas option being even more lucrative is by making use of the genera-tor’s excess heat that is currently unused.
The easiest way to do this is to disconnect the radia-tor, which usually blows off heat and that way con-trols the engines temperature. Connecting the pipes of the engine’s cooling system to the warm water sys-tem of the company is the aim That way the warmed up cooling water that leaves the engine can e.g. be used to pre-heat the water that is used in the gas boiler and that way save some of the expensive LpG currently used in TFL’s gas boiler. The concept could also be applied by more sophisticated technology that makes use off the heat being blown off through the exhaust gases. Technical kits to upgrade a simple generator to CHp-unit are available on the market and are not expected to outweigh the potential economic gains that could be achieved by such an installation.
The option of just using warmed water that is pro-duced anyway to cool down the engine seems like a
Additionally to this, some data scrutinising should be carried out locally to ensure that the applied data from the locally conducted Pre-Feasibility Study is still applicable. Should there be discrepancies be-tween the assumed available biomass in this study and what is available locally, this will have to be taken into careful consideration, as the biogas production is strictly tied to the economy of investment in any biogas plant.
The operation of the generator in conjunction with biogas storage, so that optimal operation for mini-mizing the storage is achieved
As with the operation of the biogas plant itself, prop-er use of the accumulated biogas must be achieved if the investment is to prove sound. If the grid outages prove to be completely unpredictable, the goal for the operator(s) must always be to have as close to a full storage as possible while the grid is on, in order to be prepared for any severe outages. This is especially true during peak load consumption, where grid out-ages will require the most biogas from the storage. If it is possible for the operator(s) to predict some of the outages, then it should become significantly eas-ier to ensure optimal operation, in order to reduce the need for diesel consumption.
8.3.1 Additional options for TFL
A number of possibilities exist that have been beyond the scope of this study for various reasons (see chap-ter 1). These will however briefly be discussed in the following.
Alternative or additional investment funding
The most obvious option for further increasing the economic feasibility of the proposed investment in a biogas plant is to change the conditions for funding. possibly other or additional ways of attracting capital are available. Looking for a better loan with a longer payback period or/and a lower interest rate is one probably quite unreliable option as TFL and d.o.b. seem to be quite experienced in this field and the limits stated in the interviews seem hard to step be-yond. one option to get a friendlier loan or even mon-etary donations would be attracting governmental or non-governmental development aid. An example of non-governmental monetary support is the internet-platform ‘kiva’ (kiva 2009) where either the farm it-self or the farmers of TDCu could present themselves as innovative entrepreneurs and attract private loans from private investors around the world.
68
After having specified what “a sustainable way” ref-ered to in the context of this project, the answer to the question has been sought through an analysis of TFL and the local energy resources available to it, as well as a comprehensive analysis of the demand and current supply situation of the company. These analyses lead to two technologies being considered for further analysis: photovoltaics and anaerobic di-gestion of wet matter (more commonly known just as “biogas”).
Detailed supply versus demand analysis of both tech-nologies, coupled with Net present Value calculations, lead to the conclusion that photovoltaics were not an economically advisable investment for TFL, and as this was defined as being one of the main criteria for a sustainable technology, photovoltaics could not be considered as a solution for lowering TFL’s costs for electricity supply.
Biogas, on the other hand, proved more economical-ly interesting, as it, with the use of a 150 m3 biogas storage, proved to be an economically feasible alter-native to the current diesel consumption.
However, biogas, like the photovoltaics, cannot com-pete economically with the cheap electricity avail-able through the grid. As such, there is no need for TFL to invest in a biogas installation that is able to produce more electricity than the diesel generator would otherwise have to supply. This is rather fortu-nate, however, as the amount of biogas that can be produced at TFl is limited by the amount of nearby cattle and fish waste.
As such, some conditions present itself in order for the biogas to meet the sustainability criteria pertain-ing to the economic aspect:
A biogas storage of at least 150 m3 capacity must - be added to the plant
An operation strategy that seeks to utilise the bi-- ogas when grid outages occur must be adapted
There must be some extent of national grid ra-- tioning (Approximately 10% or more of TFL’s an-nual electricity consumption must be from grid outages)
The time span between grid outages cannot con-- sistently be more than what the biogas storage can cover
reliable and easy option to apply. Depending on the engine’s produced amount of excess heat with every portion of fired biogas and diesel some of the LpG from could be saved and that way is expected to re-duce the company’s expenses for heat production significantly.
In case the generator’s excess heat can supply all the heat demand of TFL by the rest-excess heat could be used to produce cooling by a technology called absorption cooling. The technology is highly recom-mended to use waste heat because the main energy resource that is used is heat. only very little electric-ity has to be used for the operation. Different tech-nologies and combination of processes make it easy adaptable to the needed scale and efficiency (Energy Solutions Center 2004).
It should be noted that if the generator is modified for CHp operation, this might change the economical conditions for the investment in such a way that in-creased biogas production might be desirable, as well as increased storage capacity to accommodate for the heat demand. New combined energy supply cal-culations would thus be advisable, in order to make the most feasible investment for these conditions.
8.4 conclusion
An interesting, although serious, problem exists for the recently initiated dairy, Tanga Fresh Ltd., in Tan-zania. unpredictably, and out of influence from the stakeholders of TFL, the national electricity grid has proven much more unreliable in the short period that TFL has been in operation, than expected.
TFL was otherwise prepared for the brief grid outages that occur due to technical errors in the national grid by having procured a large diesel generator, capa-ble of supplying all the electricity the dairy requires. However, this solution was not intended for the much longer lasting grid outages that started occurring due to national electricity rationing. While the company has been technically capable of dealing with these severe grid outages, the consequently significantly increased consumption of diesel oil is proving quite expensive for the new dairy.
This lead to the main research question of this study:
“How can TFL’s costs for electricity supply be lowered in a sustainable way?”

69
dis
cuss
ion
an
d c
on
clu
sio
n
ly and socially sustainable technology as long as gas and liquid leaks are minimized from the plant, and local knowledge and workers are sought employed with the construction and operation of the plant
Insofar as these conditions are met, an investment in biogas supply is feasible (see section 8.3 for point-ers on the requirements for meeting said conditions), and will therefore reduce the overall electricity sup-ply costs for TFL. Furthermore, it is an environmental-

70
references list
3i. 3i. 2007. http://www.3i.com/publicationsandevents/hotter-than-the-sun.html (accessed December 16, 2009).
Andersen, Anders N. “Biogas store is winning over thermal store.” review, 2008.
Ármannsson, Halldor, and Hrefna Kristmannsdottir. “Geothermal Enviromantal Impact.” Geothermics (perga-mon press), 1992: 869-880.
Assata Shakur Forums (2006). TANZANIA: Continued drought means power rationing, says Kikwete.http://www.assatashakur.org/forum/afrikan-world-news/14824-tanzania-continued-drought-means-power-rationing-says-kikwete.html (accessed December 14, 2009)
B. T. Nijaguna, Biogas Technology, published by New Age International, 2002
Bartle, Alison. “Hydropower potential and development activities.” Energy policy (Elsevier) 30, no. 14 (2002): 1231-1239.
Boyle, Godfrey. renewable Energy. power For A Sustainable Future. oxford: oxford university press, 2004.
Blarke, Morten Boje. “Interactivity in planning: Frameworking Tools.” In Tools for Sustainable Development, by L Kornov, M Thrane, A remmen and H Lund, 463-478. Aalborg: Aalborg university press, 2007.
British Broadcasting Corporation(BBC) (2006 2 February). Tanzania cuts power after drought. http://news.bbc.co.uk/2/hi/africa/4673130.stm (accessed December 9, 2009)
Brundtland Commission (1987 a). our common Future: report of the World Commission on Environment and Development, Chapter 1: A Threatened Future. uN Documents.http://www.un-documents.net/ocf-01.htm (accessed November 19, 2009)
Brundtland Commission (1987 b). our common Future: report of the World Commission on Environment and Development, Chapter 2: Towards Sustainable Development. uN Documents.http://www.un-documents.net/ocf-02.htm (accessed November 19, 2009)
Brundtland Commission (1987 c). our common Future: report of the World Commission on Environment and Development, Chapter 7: Energy: Choices for Environment and Development. uN Documents http://www.un-documents.net/ocf-07.htm (accessed November 20, 2009)
Bugaje, I.M. (2006). renewable energy for sustainable development in Africa: a review. renewable and Sus-tainable Energy reviews. Vol. 10. 603 – 612
CIA. The World Factbook. 24. November 2009. https://www.cia.gov/library/publications/the-world-factbook/geos/tz.html (accesed December 21, 2009 ).
CIA. The World Factbook. 27. November 2009. https://www.cia.gov/library/publications/the-world-factbook/geos/da.html (accesed December 21, 2009).
Danish Energy Authority. Technology Data for Electricity and Heat Generating plants. Copenhagen: Danish Energy Authority, 2005.
Dupont. photovoltaic Solutions. 11 17, 2009. http://www2.dupont.com/photovoltaics/en_uS/news_events/
71
article20091117.html (accessed December 16, 2009).
d.o.b foundation. 2009a. www.dobfoundation.com/eng/deeds/projects/tanga_fresh/tanga_fresh2 (accessed November 11, 2009).
d.o.b foundation. 2009b. http://www.dobfoundation.com/eng/deeds/projects/tanga_fresh/press_release_frisania (accessed November 11, 2009).
d.o.b foundation. 2009c. http://www.dobfoundation.com/eng/news/907/tanga_fresh_new_factory (ac-cessed November 11, 2009).
Elmose, ole. “Effektiv og billig svovlrensning.” Dansk BioEnergi, 2004: 20-21.
EIA. Solar Explained - Where Solar Is Found. http://tonto.eia.doe.gov/energyexplained/images/charts/world-solar-large.gif (accessed December 14,2009).
EMD International A/S official websitehttp://www.emd.dk/files/energypro/energyproHlpEng-master.pdf
user’s Guide energypro by EMD International A/S, Aalborg, Denmark, 2008 (accessed December 09, 2009)
EMD International A/S official website http://emd.dk/energypro/Introduction/, (accessed December 10, 2009)
Energistyrelsen. Grunddata 2006. Energistyrelsen, 2006.
Ensol Tanzania Limited. Home » questions about solar » How much it will cost. 2009. http://www.ensol.co.tz/question.php?subcat=41 (accessed December 02, 2009).
European Commission. photovoltaic Geographical Information System (pVGIS). 2009. http://re.jrc.ec.europa.eu/pvgis/(accessed December 16, 2009)
FAo (1995). Energy for Sustainable Agriculture and rural Development and Food Security in Africa. In: Future energy requirements for Africa’s agriculture. FAo. rome, Italy. http://www.fao.org/docrep/v9766E/v9766e03.htm (accessed octomber 16, 2009)
FAo – Sustainable Development Department (SD) (1997).SD dimensions - A system approach to biogas tech-nology. http://www.fao.org/sd/Egdirect/EGre0022.htm (accessed November 25, 2009)
Global Energy Network Institute (GENI) official website http://www.geni.org/globalenergy/library/renew-able-energy-resources/africa/Geothermal/geo-east-africa.png (accessed November 15, 2009)
Gwang’ombe, Florance, and Ngosi Mwihava. “AFrEprEN/FWD.” AFrEprEN/FWD. 2005. http://www.afre-pren.org/adb_finesse/Task%203/Background%20Material/AFrEprEN%20opaper%2027.pdf (accessed December 6, 2009).
Handwerk, Brian. »Global Warming Fast Facts.« National Geographic News. 6. December 2004 http://www.bioweb.uncc.edu/BIoL1110/lecture/Somerville/Global%20Warming%20Fast%20Facts%20-%20National%20

72
Geographic.pdf (accesed December 3, 2009). Hochstein, M.p., E.p. Temu, and C.M.A. Moshy. “GEoTHErMAL rESourCES oF TANZANIA.” World Geother-mal Congress 2000.Kyushu - Tohoku: proceedings World Geothermal Congress 2000, 2000. 1233-1238.
IpCC. Climate Change 2007: Impacts, Adaptation and Vulnerability. Assessment report , Cambridge: Cam-bridge university press, 2007.
Jørgensen, peter Jacob. Biogas - grøn energi. Aarhus: Det Jordbrugsvidenskabelige Fakultet, Aarhus univer-sity, 2009.
Kainkwa, r.M.r. “Wind speed pattern and available wind power at Basotu, Tanzania.” renewable Energy, 2000: 289-295.
Kaya, Hassan o. “Electoral Violence, political Stability and the union in Tanzania.” African Journal on Conflict resolution 4, no. 2 (2004): 145-169.
Kiisheweko, orton. (2009, November 24th). power rationing over, says Tanesco. Dailynews. http://dailynews.co.tz/home/?n=5607&cat=home (accessed December 11, 2009)
Kossmann et al. (2009). Biogas Digest, Volume I, Biogas Basics. GTZ, Germany. http://www.gtz.de/de/doku-mente/en-biogas-volume1.pdf (accessed November 24, 2009)
Lonely planet (2009). Tanzania – Weather. http://www.lonelyplanet.com/tanzania/weather (accessed Decem-ber 9, 2009)
Løbner, Kristian, Anders odgaard, Freja rasmussen, Nynne Nørup, and rasmus Sørensen. “Biogas - udarbe-jdelse af en national strategi.” 4.th Semester study project, Aalborg, 2008.
Lund, Henrik. Fundamental Investment Theory. Course-material, Aalborg: Aalborg university, 2003.
Mukhopadhyay, Kakali (2007). A review of the socio-economic and environmenalbevefitsbenefits of biomass gasification based on power plant: Lessons learnt from India. In: Warnmer, Steven F. (2007). progress in Bio-mass and Bioenergyresearch.Nova Science publishers. New York
National Geographic. Mount Kilimanjaro’s Glacier Is Crumbling. 23. September 2003. http://news.national-geographic.com/news/2003/09/0923_030923_kilimanjaroglaciers.html (accesed December 3, 2009).
National Geographic . Tanzania. http://travel.nationalgeographic.com/places/countries/country_tanzania.html (accessed December 3, 2009).
National Institute of Industrial research Board, Handbook on Bio Gas And Its Applications, published by Na-tional Institute of Industrial research, 2004
Nordbakken. om biogas-anlægget. 2003. http://www.nordbakken.dk/index.php?id=27 (accessed December 9, 2009).
oECD (organisation for Economic Co-operation and Development) Developmnet and climate change in Tan-zania: FoCuS oN MouNT KILIMANJAro. paris: oECD, 2003.

73
omer, A. M.; Fadalla, Y. (2003). Technical note - Biogas energy technology in Sudan. renewable Energy. Vol. 28., 499 - 507
otieno, Herick o., and Joseph L. Awange. Energy resources in East Africa: oportunities and Challenges. Ber-lin; Heidelberg: Springer, 2006.
pangan Basin Water office. Welcome. 2005. http://www.panganibasin.com/(accessed December 06, 2009).philantrophic Foundations Canada. philantrophic Foundations Canada. 2009. http://www.pfc.ca/cms_en/page1112.cfm (accessed November 11, 2009).
Stenkjær, Nicolaj. Nordisk Folkecenter for Vedvarende Energi. March 2008. http://www.folkecenter.net/dk/rd/biogas/intro/ (accessed December 5, 2009).
Stoddard, L., J. Abiecunas, and r. o’Connell. Economic, Energy, and Environmental Benefits of Concentrating Solar power in California. Los Angeles: National renewable Energy Laboratory, 2006.
Tanesco A. http://www.tanesco.co.tz/index.php?option=com_content&view=article&id=79&Itemid=235 (ac-cessed November 12, 2009).
Tanesco B. http://www.tanesco.co.tz/index.php?option=com_content&view=article&id=70&Itemid=158 (ac-cessed November 14, 2009).
TANESCo (A). Masterplan. n.d. http://www.tanesco.com/master.html(accessed December 02, 2009)
TANESCo (B). Inter Conections. n.d. http://www.tanesco.com/intercon.html(accessed December 02, 2009).
TANESCo (C). Generation. n.d. http://www.tanesco.com/generation.html(accessed December 03, 2009)
Tanga Fresh Ltd. pre-Feasibility Study on renewable Heat for Tanga Fresh Dairy Ltd. pre-feasibility Study, Tanga: Tanga Fresh Ltd., 2008.
Tanzania Invest. Tanzania Invest. 28.08. 2009. http://www.tanzaniainvest.com/tanzania-energy-and-mining/news/64-news/343-tanzania-electricity-explores-sisal-power-potential (accessed December 10, 2009)
TASEA. “solarmwanza.” January 2005. http://www.solarmwanza.org/downloadables/tasea.pdf (accessed 24 November, 2009).
Taylor, Lester D. (1975). The demand for electricity: a survey. The Bell Journal of Economics. Vol. 6. 74 – 110
Thin Film Today. Thin Film Today. 2009. http://social.thinfilmtoday.com/news/depth-%E2%80%9Csilicon-based-thin-film-technology-has-right-degree-maturity%E2%80%9D (accessed December 16, 2009).
Transperency International. Corruption perception Index 2009. 2009. http://media.transparency.org/imaps/cpi2009/ (accessed December 02, 2009).

74
u.S. Department of State. Background Note: Tanzania. 01 August 2009. http://www.state.gov/r/pa/ei/bgn/2843.htm (accessed December 02, 2009).
uNESCo Institute for Statistics. Global rankings. 2009. http://stats.uis.unesco.org/unesco/TableViewer/docu-ment.aspx?reportId=125&IF_Language=eng&Br_Fact=LTrAT&Br_region=4054(accessed December 03, 2009)
uNFCCC. “uNITING oN CLIMATE.” November 2007. http://unfccc.int/resource/docs/publications/unitingon-climate_eng.pdf (accessed December 3, 2009).
Wisse, Jacob A., and Kees Stigter. “Wind engineering in Africa.” Journal of Wind Engineering and Industrial Aerodynamics 95 (2007): 908-927.
World Travel Guide. Tanzania Key Facts. http://www.worldtravelguide.net/country/275/general_information/Africa/Tanzania.html (accessed December 3, 2009).

75

PRE-FEASIBILITY STUDY ON RENEWABLE HEAT
FOR
TANGA FRESH DAIRY LTD
**
Tanzania, Tanga, February 2008


Pre-Feasibility Study on Renewable Heat for Tanga Fresh Dairy Ltd.
1
TABLE OF CONTENT
Very simplified microbiology of biogas ................................................................ 4
Dairy Cattle Manure ......................................................................................... 5
Octopus Vulgaris .............................................................................................. 6
Tanga Fresh Dairy Ltd. Dairy Wastewater ............................................................ 6
Potential vs. Net-heat produced ......................................................................... 6
Other biodigester feeds in Tanga region .............................................................. 6
The Digester Plant Configuration and Process ...................................................... 7
Dimensioning digester reasoning ....................................................................... 8
Yearly Revenues .............................................................................................12
Initial Costs Buildup ........................................................................................12
Running Costs ................................................................................................13
Financial feasibility ..........................................................................................13

Pre-Feasibility Study on Renewable Heat for Tanga Fresh Dairy Ltd.
2
INTRODUCTION AND GOAL OF STUDY
A first introduction to Tanga Fresh Dairy Ltd
Tanga Fresh Dairy Ltd has turn-key plans to start implementation to replace the current
production facility of dairy products to a more modern facility with higher production
capacity. The current dairy factory processes 18,000 litres of raw milk into mainly
pasteurized milk and mtindi (February 2008). The new factory will process a maximum of
50,000 litres of milk; the first capacity will be 30,000 litres. The dairy cattle and micro-
credit services targeting smallholder dairy livestock farmers continue to be a great
success in terms of securing the supply of the milk to the factory and in providing a
constant source of income to the more than 2300 farmers. These services are primarily
the task of one of the investors in Tanga Fresh ltd.: TDCU - the Tanga Cooperative Dairy
Union - and of her partners in Tanzania and in the Netherlands.
The Setting of this Study
Pasteurisation of dairy products and cleaning of milk holding tanks have a substantial
demand of heat transfer. Based on current first planned production of the new factory
(30,000 litres per day) this amounts to almost 2800 kWh heat per day representing more
than 50,000 Euro on electrical heating a year (1 Euro = 1650 TSH) (see annex II).
Goal of this pre-feasibility study is to make a technical and financial assessment of the
heat energy alternatives available to Tanga Fresh for heating purposes in the new dairy
factory.
Tanga Fresh Dairy Ltd is committed to invest in renewable heating solutions for several
processes in the new factory because of potential cost savings and in order to reduce the
environmental footprint of its industrial activity.
The renewable alternative heating options other than electrical for the Tanga area are
two:
a) Biogas as a product of microbial digestion of cow manure and other agricultural
and agro-industrial waste streams
b) Solar heat absorbed from direct and indirect solar irradiation (IS OMMITED FROM
THIS VERSION)
Wind power is not even technically possible seen the low wind speeds and variability.
Moreover the focus of this pre-feasibility study is direct renewable generation of heat or
fuels that will generate heat, both at high cost-efficiency. Burning of biomass pellets
made of agricultural waste was also considered for a fraction of a second - this was
canceled out of the list of options as there is no substantial or organized supply of
biomass pellets in the Tanga region.

Pre-Feasibility Study on Renewable Heat for Tanga Fresh Dairy Ltd.
3
METHODOLOGY
First, the technological alternatives present for both solar and biogas solutions are
presented and the choices for preferred technology are justified based on technological
and financial performance of the technologies. This is done for both technologies
separately.
Second, we consider biogas and solar heating solutions in terms of technical output and
in terms of its financial durability over a 20 years period. The main measure for financial
durability is the Internal Rate of Return (IRR) as derived from the Net Present Value
zero-value- threshold over these 20 years (see annex I for description of this widely used
methodology). This again is done for both technologies separately.
Thirdly, non-renewable heating technologies will also be assessed in terms of financial
durability as compared to the electrical heating and to the two renewable options
mentioned above, namely propane and kerosene boilers. First reason for their
consideration is the low initial costs as compared to the renewable technologies.
Secondly, a non-renewable technology must serve as a back-up in the incidence of
system failure of both the renewable heat technologies and the electrical boiler (the latter
due to electrical power interruptions).
Fourth, the environmental benefits in terms of reduction of CO2-equivalent will be
assessed shortly, including methane reductions. Other positive and negative
environmental effects will also be mentioned, but the key issue to be dealt now is climate
change related to greenhouse gasses.
Finally all findings are set against each other in order to set a conclusion and
recommendation on whether to invest in renewable heating and on the choice of
technology and financing methods to contain investment risks.
The whole calculative process is described numerically in the Excel document attached to
this document (annex II); the logic of this calculus document will be provided in this
report. Risk analysis allows us to introduce variability and uncertainty in the modeling of
the financial feasibility of both the solar and biogas alternatives. The programme used for
this purpose is @Risk, an excel macro extension allowing statistical risk analysis based on
Monte Carlo and other useful numerical statistical methods (annex III and IV).
References to the sources of figures named in this document can be found in annex II,
the excel document holding the calculus.

Pre-Feasibility Study on Renewable Heat for Tanga Fresh Dairy Ltd.
4
HEAT FROM BIOGAS
First introduction to the biogas technology
Very simplified microbiology of biogas
A short and very simple introduction is given on the technology. The assumption is that
the reader already understands the underlying basics of biogas production from organic
material. However, this short introduction to the technology should also allow others to
interpret the benefits of this technology to Tanga Fresh Dairy Ltd.
Bacteria present in the gastro-intestinal tract of cows are excreted along with the
manure. Both inside and outside the cow this consortium of three main groups of
bacteria is responsible for the breakdown of organic material within the manure into
biogas- a mixture of methane gas (CH4: the fuel of interest), carbondioxide (CO2) and
other minor gaseous components under anaerobic conditions (the lack of oxygen). The
methane content of the biogas from manure varies between 60% and 65 % of the biogas
at optimal bacterial temperatures and other optimal conditions (see below).
The potential maximum methane (or biogas) production of a feed (manure or any other
material containing organic components) within a biodigester containing both the
bacteria consortium and the feed is expressed as cubic metres of methane per kg feed
(m3 methane per kg feed) or as cubic metres per kg total solids (the dry component of
the feed). It can also be expressed as cubic metres per volatile solids (the organic solids
of the feed) or as cubic metres per volatile solids digested by the bacteria consortium.
As mentioned above there are several conditions that are optimal for the maximum
production of methane by the bacteria consortium. The most important are listed below:
Acidity (measured as pH)
Anaerobic biodigestion will occur best within a pH range of 6.8 to 8.0. More acidic or
basic mixtures will ferment at a lower speed. The introduction of raw material will often
lower the pH (make the mixture more acidic). Digestion will stop or slow dramatically
until the bacteria have absorbed the acids. A high pH will encourage the production of
acidic carbon dioxide to neutralise the mixture again. The optimum is at a pH of 7.2.
Carbon-Nitrogen ratio
The bacteria responsible for the anaerobic process require both elements (C and N), as
do all living organisms, but they consume carbon roughly 30 times faster than nitrogen.
Assuming all other conditions are favorable for biogas production, a carbon - nitrogen
ratio of about 30 - 1 is ideal for the raw material fed into a biogas plant. A higher ratio
will leave carbon still available after the nitrogen has been consumed, starving some of
the bacteria of this element. These will in turn die, returning nitrogen to the mixture, but
slowing the process. Too much nitrogen will cause this to be left over at the end of
digestion (which stops when the carbon has been consumed) and reduce the quality of
Pre-Feasibility Study on Renewable Heat for Tanga Fresh Dairy Ltd.
5
the fertiliser produced by the biogas plant. The correct ratio of carbon to nitrogen will
prevent loss of either fertiliser quality or methane content of the biogas.
Temperature
Anaerobic breakdown of organic materials occurs at temperatures lying between 0°C and
69°C, but the action of the digesting bacteria will decrease sharply below 16°C.
Production of gas is most rapid between 29°C and 41°C or between 49°C and 60°C. This
is due to the fact that two different types of bacteria multiply best in these two different
ranges, but the high temperature bacteria are much more sensitive to ambient
influences. A temperature between 32°C and 37°C has proven most efficient for stable
and continuous production of methane. Biogas produced outside this range will have a
higher percentage of carbon dioxide and other gases than within this range.
Percentage of Solids
Anaerobic digestion of organics will proceed best if the input material consists of roughly
7-10 % solids, depending on the digester type used. In the case of fresh cow manure,
this is the equivalent of dilution with roughly an equal quantity of water.
HRT
The hydraulic retention time (HRT) is the average time the total mix of biodigester feed
and the bacteria consortium remain in a closed anaerobic environment (the biodigester).
The optimal HRT is around 25 days for a plug flow reactor under optimum temperature,
as more than 90% of the potential methane output is produced during this HRT, the
remaining 10% require up to 60 days HRT. A higher HRT translates into a larger and
more expensive biodigester, assuming that the biodigeester feeds are fed at a constant
rate.
For a more extensive overview of the principles of biogas production, a good place to
start is Wikipedia on the Internet; there are also numeral books on this matter (see
literature list which formed the basis of this study on annex V).
The renewable energy available in Tanga (bio-digester feeds) to
be converted into methane for heat
Many agricultural and agro-industrial waste streams are basic feeds for digesters as there
are many suitable digester feeds that will produce high amounts of methane if left to
decompose under anaerobic conditions. However, only the following digester feeds have
been identified and secured based on their year long availability, almost zero cost and
small distance to the Tanga Fresh factory (less than 5 km).
Dairy Cattle Manure
About four percent of the initial 30,000 litres daily milk supply will be secured from a
TDCU barn housing 200 dairy cows in the vicinity of the new factory (based on average 6
litres per cow per day). The cows are kept in a so called ‘Hollandse Stal’ (Dutch Barn) in
which collection of manure is highly (and most) efficient - almost all of the excreted
manure can be collected. The yearly amount excreted is expected to be 4500 kg of

Pre-Feasibility Study on Renewable Heat for Tanga Fresh Dairy Ltd.
6
manure at 20% dry solids per day for 200 cows, according to local research in Tanga
(Tanga Livestock Research Centre, 2005). This amounts to an equivalent of potential
daily heat energy from this renewable source of 990 kWh for manure alone.
Cow feed composition does add some variability to the composition and quantity of
manure but no dramatic changes are expected away from the current cow feed menu. If
any changes in the future occur, these will only be enrichment of the cow feeds yielding
possible higher biogas yields per kg manure because of the higher quality of the manure
in terms of digestible VS per kg manure. These however are not taken into account as of
now. If any increase of manure quantities occurs due to a modified diet of the 200 cows,
then the expansion of the biogas plant is easily done according to the biogas plant
system proposed below and more money is saved on energy bills.
Octopus Vulgaris
A fish processing factory also located in Tanga is able to deliver 140 kg of fish waste
(mainly octopus waste) to Tanga Fresh Dairy on a daily basis potentially providing 145
kWh heat per day.
Tanga Fresh Dairy Ltd. Dairy Wastewater
Around 3300 per day 2% TS diluted milk waste water is required to dilute the manure
and octopus waste. The 2% TS account for an extra 625 kWh heat potential per day.
Potential vs. Net-heat produced
Please notice that these kWh heat values are potential heat. Heat recirculation within the
system described above (namely to keep the manure at the desired 37 degrees Celsius)
and efficiency losses reduce the potential heat to the NET heat production- that what is
transferred to the heat exchanger in the factory. Therefore the NET daily heat total heat
is not 1805 (990+145+625) kWh heat but 1496 kWh NET heat.
Other biodigester feeds in Tanga region
Sisal waste forms a potential source of biogas. Bacterial and chemical pre-treatment of
the highly (hemi) lingo-cellulosic material is under development. Semi-industrial scale is
already in test phase in Tanga at Katani Ltd. Cooperation with Katani in the future, as
technology becomes available, is possible.
Molasses form an important candidate-feed for the digesters. Whenever available in the
Tanga region it will be directly secured by Tanga Fresh, as this feed has a high yield of
methane in a digester per total solids.
Allanblackia oil is been pressed in Tanga from Allanblackia stuhlmannii seeds. The oily
cake is currently not used. The only restriction is the presence of tannins in the cake.
Tannins possibly have toxic effects on the bacteria consortium inside the digester

Pre-Feasibility Study on Renewable Heat for Tanga Fresh Dairy Ltd.
7
Another candidate feed is brewers cake, a by-product of beer production, which seems to
become available for a very low price in the mid-term future. In the worksheet “Other
Feeds” of Annex II an example calculation is provided for substitution of manure by
brewer’s cake. The gas yield is higher per total solids added to the digester and the
financial durability is considerably better.
The above mentioned are the most likely feed additions to a digester in the mid-long
term if they become available; they are not taken into account in the design of our
biodigester. All of these feeds are available in principle on a large scale
In general co-digestion of manure slurry (diluted manure 1:1) and agricultural or food
industry wastes is mixed on a 2:1 basis (slurry/agro-waste) for maximum yields in a
plug-flow biodigester.
Overview of technologies currently available
A plug-flow reactor is a long tank through which manure moves during processing. The
manure is mechanically and/or manually removed from the barn into the digester daily
(or twice daily); the same amount leaves the digester on the other end through an
overflow pipe system. A plug-flow digester has in principle no mixing. However, some
variations of plug-flow reactors do mix intermittently at low speed. To prevent leakage
into soil and groundwater, the tank is usually constructed of concrete.
In a Completely Stirred Tank Reactor (CSTR) biomass and substrate are completely
mixed. The mixed reactor is usually the most expensive model to install and operate.
This design, which looks like a squat tower silo, blends manure to reach a homogenous
concentration.
For an extensive overview of the available technologies please find several references in
the literature list.
The technology of choice
The Digester Plant Configuration and Process
The digester of choice is a 3 parallel plug-flow reactor constructed of fortified concrete
and bricks. This is basically one construction housing 3 parallel plug-flow reactors. The
two first get only manure and dairy wastewater, the third is fed by a mixture of manure
and fish waste and dairy wastewater. It is in this third compartment that other feeds
secured by Tanga Fresh Dairy Ltd in the future can be fed to the digester.
The manure will be mechanically and manually led through the gutters of the elevated
barn (3 meters above biogas installation) into the manure holding tank before entering
the digester (concrete and bricks). A second and a third holding tank will receive the
dairy wastewater and the octopus waste.

Pre-Feasibility Study on Renewable Heat for Tanga Fresh Dairy Ltd.
8
The mixing of the three feeds (manure, dairy wastewater and octopus waste) according
to the slurry-recipe of the three compartments is facilitated by a ‘dompel’ mixer. The
motion of fluids is facilitated by gravity and by ‘verdringer’-pumps into the digester. The
manure-dairy wastewater-mix and manure-octopus-dairy wastewater-mix are preheated
to 37 °C a meter before entering the digester through heat exchangers powered by a
small fraction of the biogas.
A third of the daily outflow of the each compartment of the reactor is re-circulated into
the digester. This increases the concentration of the bacteria consortium in the digester
compartments, in particular that of the methanogenic bacteria thereby increasing the
biogas yield.
The daily slurry outflow of the digester will consequently be stored in a large holder tank.
The gas is led through stainless steel pipes to the biogas burner in the factory. This
process is seen in a schematic overview here:
PHM= Pumping and Heating and Mixing of Slurry
Dimensioning digester reasoning
• First two compartments of the digester (manure only) sizing:
Based on a daily feed rate of 1500 kg of manure per digester (20% total solids
content w/w) diluted with a daily 1836 kg of wastewater (2% milk solids), a retention
time of 25 days and an additional 10 % volume for recirculation of activated slurry
and another 10 % for gas holding space in the reactor, the total volume then
amounts to almost 100 m3 per compartment.
Digester Mixed Compartment
Digester Manure Compartment II
Digester Manure Compartment I
ManureManureManureManure
Octopus Waste
DairyDairyDairyDairy
WasteWasteWasteWaste
DigestateDigestateDigestateDigestate
PH
M
PH
M
Mixed Mixed Mixed Mixed
DigestateDigestateDigestateDigestate
BIO
GAS
Pre-Feasibility Study on Renewable Heat for Tanga Fresh Dairy Ltd.
9
• Third compartment digester (manure/ octopus waste) sizing:
Based on a daily feed of 140 kg of octopus waste (16% TS w/w) mixed with 1500 kg
dry manure (20% TS w/w) and 1719 kg waste water (2% TS w/w), a retention time
of 25 days and an additional 10 % digester volume for recirculation of activated slurry
and another 10 % for gas holding space in the reactor, the total volume then
amounts to around 100 m3.
The concrete structure forming the digester is to be built in bricks and fortified concrete,
the latter being a mixture of cement and other components of concrete being coarse
sand, chipped stone aggregates, water proofing cement additive, sulfate gas proofing
cement additive and water.
The height of the internal wall of the digester is designed at 2 meters, and the width at
4.40 meters (including two internal walls separating the three compartments), setting
the length at around 35 meters for a 300 m3 digester. The concrete wall thickness is
0.40 meters. Surrounding this wall is a layer of 0.30 m of isolating material. This greatly
decreases heat loss to the environment. Based on these dimensions the costs of
materials have been deduced with locally used materials and other costs.
The top layer of the digester will be covered with absorbent material to attract the
highest possible rate of heat absorption by the digester in order to maintain the desired
optimum of 35-37 Celsius of the slurry (House, 1948).
For more specific technical data and financial build-up of this digester please see annex
II. For a 3-Dimensional impression of the plug-flow biogas plant please refer to Annex VII
Justification of technological choice
a) Continuous Feeding preferred over batch
• Batch reactors produce biogas in a peak while continuously fed reactors produce
evenly throughout time. This is a must for a factory requiring heat 24 hours 7
days a week.
• Gas production can be accelerated and made more consistent by feeding the
digester with slurry once or twice daily. This is caused by the natural aversion of
the bacteria consortium to constant changes in their environment, including feed
composition.
b) Plug-flow preferred over CSTR
The plug-flow is the technology of choice for a couple of reasons:
• Cheaper to build and maintain
• Does not require continuous mixing and consequent investment and operational
costs and maintenance.
• Allows higher concentration of slurry solids in the reactor (total solids) and higher
viscosity of the slurry.
Pre-Feasibility Study on Renewable Heat for Tanga Fresh Dairy Ltd.
10
• Solar irradiation on surface reactor is larger per volume area for a plug-flow
digester (long-shaped) than for a CSTR digester tank allowing better natural
heating by solar irradiation.
• In general slow rate systems as the plug flow yield more biogas per TS digested,
allowing for getting the maximum biogas yield out of the 200 cows.
• Higher removal of pathogens from slurry (safer for use as fertiliser)
c) Long Hydraulic Retention Time preferred above high rate mixed systems
• 90% of the potential methane methane gas yield is produced within 25-30 days of
Hydraulic Retention Time. (House,1948). Seen the fact that no more than 200
dairy cows can be kept at the factory location we want to maximise the methane
production from the manure of these cows. Therefore a retention time of 25 days
is chosen.
d) Mesofilic preferred above thermophilic or cold digestion
• Thermophilic temperatures (55-65 ) yield higher methane yields per VS. In fact, a
larger proportion of the VS are degraded thus leading to the higher methane
yields. However extra energy input is required to reach the higher temperatures,
the system is more unstable and the control systems more sophisticated and
expensive. Cold digestion need not be considered as it yields low methane
production.
e) Feeding the digester and slurry recirculation system of the digester
• Manure is mechanically/manually removed from the barn into the manure storage
tank. The barn will be kept clean of dust and sand. Sand in particular is deadly for
the long term stability of the digester gas production, as it reduces the volume
and thus the retention time of the manure.
• Pumping manure from the manure storage tank to the digester will require a
positive displacement pump (‘displacement pump’) and piping (again butyl rubber
or other synthetic materials are preferred above corrosive metal pipes to prevent
corrosion). The displacement pump allows high solids contents and is not
susceptible to blockages. The use of this pump also allows the use of new digester
feeds with higher TS.
• Untreated organic wastewater (2% milk solids w/w) is added into the manure pipe
as soon as the dry manure leaves the manure storage tank as to decrease the
total solids content from 20% to 10%.
• It is relatively simple to keep the digester at the ideal temperature of 35-37 if hot
water (just below 60 to avoid film (dried up manure) formation in the manure
pipes), regulated with a thermostat, is circulated through the system feed input
pipes through an internal heat exchanger. Naturally, the biogas produced by the
digester can be used for this purpose. The small quantity of gas "wasted" on
heating the digester will be more than compensated for by the greatly increased
biogas production. The warm water rest-heat (<50°C) from the factory will be
used if necessary.
f) Biogas for heating of feed input

Pre-Feasibility Study on Renewable Heat for Tanga Fresh Dairy Ltd.
11
• Biogas from the digester will be used for pre-heating of the slurry at the desired
optimum temperature of 35-37. Shading of the reactor is also required to avoid
overheating of some parts of the digester during very hot and shiny days.
h) Specialized Portland Cement preferred for digester and holding tanks above
(stainless) steel tanks or plastic or ethyl -rubber or other synthetic material
• Concrete is preferred as the construction material because of its durability (less
corrosion in a fortified-cement formula) and for affordability at large scale.
Maintenance is much simpler for systems built above ground. Building below
ground is also ruled out because temperatures under ground will be well below
the constant air temperature of 25-35 Celsius in the Tanga region and therefore
cooling of the digester far below the 35-37 optimum will be difficult to prevent,
specially in the rainy season.
• A concrete digester is preferred above a stainless steel container mainly because
it is cheaper to build and very resistant against corrosion and oxidation. However
on the long term concrete may also be corroded by H2S in the biogas. Therefore
addition of a sulfate ion-salt (SO3-) on a 7.4 % w/w to the cement mix prior to
mixing will minimize corrosion effects. Addition of carbonate ion (CO3 2-) on 10-
20 ppm will prevent corrosion by mild acids in particular those of dissolved CO2.
(House, 1948).
• The cost per unit volume digester is lowest for plastic or butyl rubber. The lifetime
is questionable however due to exposure to light and other natural elements
abundant in the tropics (birds, rodents). Also there is less extensive experience on
the use of these materials as is with the cement structures. Anti -corrosive metal
containers are much more expensive.
• Another good reason for using cement is the ample expertise available in Tanzania
from the three cement factories (one of them in Tanga) and that of the
contractors building biogas and large septic tanks (for sewage treatment) in the
country. Servicing eventual leakages that may occur will be more practical and
cheaper. This will also facilitate the modular expansion of the digester if other
digester feeds become available in constant quantities in the long term. Finally the
concrete has a high resistance against heat transfer as opposed to metal. This will
help to isolate the digester and keep the manure from cooling down.
• Instead of a single digester a digester with three separate parallel digester-
concrete compartments is to be built below one roof. This allows for continuation
of biogas production in the case of digester failure or decreased gas production in
one of the three compartments. The third tank will be filled with a mix of manure
with the octopus waste (88/12 w/w based on undiluted weights).
h) Slow intermittent mixing preferred above no mixing
• Some method of slow intermittent stirring the slurry in a digester is always
advantageous, if not essential. If not stirred, the slurry will tend to dry out on top
and form a hard scum layer on the top surface of the slurry, which in effect will
decrease the operational volume and thus decrease the digester retention time of
the slurry.
• The problem of scum formation is much greater with vegetable waste than with
manure, which will tend to remain in suspension and have better contact with the
bacteria as a result. Continuous feeding causes less problems in this direction,

Pre-Feasibility Study on Renewable Heat for Tanga Fresh Dairy Ltd.
12
since the new charge will break up the surface and provide a rudimentary stirring
action.
• Slow vertical mixing with intermittent 15 minutes intervals has proven to optimize
methane production even further. Slow mixing prevents formation of scum layer
and helps distribute the methane and acid forming bacteria more evenly
throughout the reactor and also allows more even distribution of the heat in the
reactor.
• In Germany the horizontal mixing shaft has proven successful in preventing scum
layer formation (WUR Lens 2004).
i) Gas piping and boiler
• The expected efficiency of the boiler is 85% of the potential energy of the
methane in the biogas.
• Parallel thin stainless steel pipes (20mm, 15 piece) will direct gas from the
digester compartments to the biogas boiler. These parallel structures reduce the
chance of total fallout of the biogas plant in case of leakage of gas in the gas
pipes. In case of leakage of one of the 15 parallel pipes, only one needs to be
disconnected, and thereby allowing further continuation of biogas plant operation.
Financial calculations
All model inputs described in annex II were described in terms of their expected value;
some inputs were also given ranges of expected variability, therefore the financial
outputs listed below show an expected value, a worst case scenario and a best case
scenario. For the interested reader the results of this numerical-statistical risk analysis
underlying these scenarios are presented in annex IV. The statistical methodology (Monte
Carlo Simulations) is explained in annex III.
Yearly Revenues
The revenues are the offset (saved) costs for electrical heating over the expected
minimal lifetime of the concrete biodigester and all other components the biogas
installation - being 20 years. Per year an offset of between 20,000 and 35,000 Euro with
an expected offset of 25,000.
Initial Costs Buildup
The expected value total is around 118,000 Euro, with a range from 115,000 to 122,000.
Please notice that the costs of materials for the digester, the holding tanks materials and
the engineering and installation costs are budgeted based on Tanzanian local prices. All
other initial costs are based on prices found in Europe, as they will probably have to be
imported. An overview of the price build-up is given in the table below:
COST COMPONENT EURO EXPECTED VALUE
Digester materials 32000

Pre-Feasibility Study on Renewable Heat for Tanga Fresh Dairy Ltd.
13
Running Costs
The running costs of the biogas installation have an expected value of around 8,900
Euro, with a range from 7,000 to 12,500 Euro per year. This yearly value includes:
pumps electrical demand for pumping, maintenance (2% depreciation per year),
operation costs (mainly salary personnel) and costs for 10 days daily productivity loss of
the digester per year. All running costs are based on local Tanzanian prices.
Financial feasibility
The main measure for financial durability is the Internal Rate of Return (IRR) as derived
from the Net Present Value zero-value- threshold over 20 years (see annex I for
description of this widely used methodology).
For the Biogas Installation, with a 6% Euro loan and an annual repayment of 15,000
Euro, the IRR has an expected value of 15%, while the worst case scenario has an IRR of
8%. The best case scenario is at 25 %.
The IRR of an investment is mostly compared to a threshold value to which this IRR is
compared. The money invested in this biogas project can alternatively be put in a long
term securities fund, yielding an IRR of 10% (the threshold value), which is quite an
impressive portfolio performance. If this investment in biogas shows a worst case of IRR
at 8% and an expected value at 15%, it is worth investing the money in this biogas
installation because all IRR case scenarios show higher values than the luxurious 10%
threshold.
Environmental, social and other effects
The expansion of the production capacity will create more jobs overall in the dairy
products supply and marketing chain.
The dairy cooperative TDCU managing the 200 cow’s barn will benefit from the benefits
an improved quality fertilizer. One of the main advantages of the use of digested
manure above fresh undigested manure is that it attracts less flies, has much less
undesired odors and contains much less pathogens.
The environment will benefit with a yearly approximate of 145 tonnes CO2-equivalent
emission reduction as compared to the situation where the manure will not be digested
under anaerobic conditions in a biogas installation and would be directly applied to the
soil as fertilizer.
Holding tanks materials 4800
Pricing cow barn floor 20580
Manure pumps and piping 7800
Gas piping & boiler 20190
Slurry Feed Heat exchanger and electrical control mechanisms 12500
Engineering and installation biogas plant 25000

Pre-Feasibility Study on Renewable Heat for Tanga Fresh Dairy Ltd.
14
The use of renewable energy in general reduces the reliance on energy imports.
This biogas implementation for heating contributes to decentralized, distributed power
systems thereby putting the end-user more in control of the security of energy delivery.
By switching from electrical heating to biogas heating, the company also contributes to
the solution of the national problem of scarcity, high price and unreliability of supply of
electricity.
CONCLUSIONS AND RECOMMENDATIONS
Based on this pre-feasibility study the biogas solution with a plug-flow reactor (HRT 25
days, temperature 37 degrees Celsius, pH 7.2, 300 m3 working volume, housing three
Pre-Feasibility Study on Renewable Heat for Tanga Fresh Dairy Ltd.
15
compartments, two WITH manure diluted with dairy wastewater and 1 manure-octopus
mix diluted with dairy wastewater (2% solids)) is much more economical for meeting the
required 2800 kWh of daily heat demand for pasteurization and tank cleaning as
compared to solar water heating systems or propane and kerosene boilers. This is
underlined by a statistical risk analysis yielding a minimum internal rate of return (IRR)
of 8 % and an expected value of more than 15 % IRR. Based on a daily 900 kg total
solids from manure (200 cows), 23 kg total solids from octopus waste and 107 kg total
solids per day from dairy wastewater a net heat output of around 1496 kWh per day to
the factory cleaning and pasteurizing processes is expected on average, representing
more than 1/2 of the 2800 kWh demand for heat processes in the factory (based on
30,000 litres milk processing per day).
A solar stand-alone medium temperature collectors (70-200 °C) solution for heating at
the current prices of solar collectors is not economical on the long run- best case scenario
IRR is 4%. Main reason for this low IRR is the high price per square meter of medium
temperature solar collectors. However, development of technology is accelerating,
production is taking up and prices may drop due to increased demand within 5 years.
Also high and steadily increasing fossil energy prices make this alternative more feasible
in the mid-term future. A reduction of the medium temperature collector’s price by a
factor 3 or 4 would make them interesting for unsibsidised implementation for industrial
heating at Tanga Fresh Dairy Ltd as described above. The solar system will always rely
on other heat sources, in particular electrical heat, as to overcome weeks of rainy
weather and will also heavily rely on hot water storage systems or chemical heat storage
systems for overnight heat storage. For now it is not an economically viable solution for
Tanga Fresh Dairy Ltd.
In order to ensure continuity of energy provision both for heat and electricity purpose a
CHP - unit running on kerosene seems the most economical solution but only as an
emergency backup because of its high cost of fuel.
A pilot scale biogas installation (1/5 th of volume) must be built at locations where more
than 30 cows are kept in the TDCU locations in order to test the potential biogas yield of
the actual manure and of other agricultural wastes and food industry by-products. It is
highly recommended to start the first year with only manure as the main basis feed of
the digester for stability of operation of the plant and to get accustomed to the operation
of the plant. Before construction of the initial biogas plant and during the first year of
operation the first pilot tests with other feeds can be done to in order to assure that an
extension of the biogas plant will indeed produce more biogas on a yearly basis.
As the biogas facility is easily expandable, new digester feeds must always be searched
for. In particular industrial waste streams containing high amounts of oil and fat
substances have a high methane yield per total solids introduced into the digester and
are easy to collect. Already the following candidate feeds have been identified as possible
sources of fats, oils, proteins and carbohydrate which are easily digestible and yield high
methane quantities per total solids: allanblackia cake from oil industry in Tanga, brewer’s
cake from beer industry, molasses from several sugar estates and fish and meat
slaughterhouse wastes. Addition of such feeds up to 30% v/v to manure will drastically
Pre-Feasibility Study on Renewable Heat for Tanga Fresh Dairy Ltd.
16
increase the methane production, at least by a factor 150% thereby significantly further
increasing the IRR of the biogas plant.
The financial feasibility of treating wastewater in high rate systems bioreactors should be
investigated as less than 10% of the wastewater is used in the digester for manure
dilution. Examples of such high rate systems are: up-flow sludge blanket digesters,
complete mix digesters and thin film digesters. The potential of producing significant
amounts of biogas is there (based on 1% TS of estimated 60,000 liters of wastewater
based on processing of 30,000 liters raw milk per day), being 293 cubic meters per day
biogas as compared to the daily 175 cubic meters per day of the manure-milkwaste-
fishwaste-based biodigester. However, one should note that the initial investment and
the running costs for (electrical) mixing are much higher than with as plug-flow digester.

Pre-Feasibility Study on Renewable Heat for Tanga Fresh Dairy Ltd.
17
Literature
Hobson, 1981, Methane production from agricultural and domestic wastes
Rijsbergen, C.P. van, 1984, Energie uit mest, 's-Hertogenbosch : P.N.E.M.
N.A.S, 1977, Methane generation from human, animal, and agricultural
wastes,
National Academy of Sciences (Washington) Board on Science and Technology
for International Development. Advisory Comm. on Techn. Innovation
House, 1981, Biogas Handbook, Culver City, Calif. : Peace Press
Jewell, W.J., 1981, Long-term operational comparison of two full scale
dairy manure digesters, Ithaca : Cornell University
Kluin, K, 2006, De boerderij als energiebron : een onderzoek naar het
opstarten van een biogasinstallatie
Dohne, E., 1982, Biogas production from organic agricultural wastes, New
York: United Nations
Bruins, W.J., 1984, Biogas from cattle dung : three years of testing with
the Propstroom biogas installation on the Waiboerhoeve Experimental
Farm, Lelystad : Proefstation voor de Rundveehouderij, Schapenhouderij en
Paardenhouderij
Homan, E., 1980, Biogas from manure, University Park : Pennsylvania State
University
Mac Donald, R.D., 1982, Methane production from livestock manure,
[Toronto] : Ministry of Agriculture and Food, Ontario
http://www.aee-intec.at/0uploads/dateien86.pdf
Medium Temperature Collectors
Other references can be found in the Excel document under Annex II

Pre-Feasibility Study on Renewable Heat for Tanga Fresh Dairy Ltd.
18
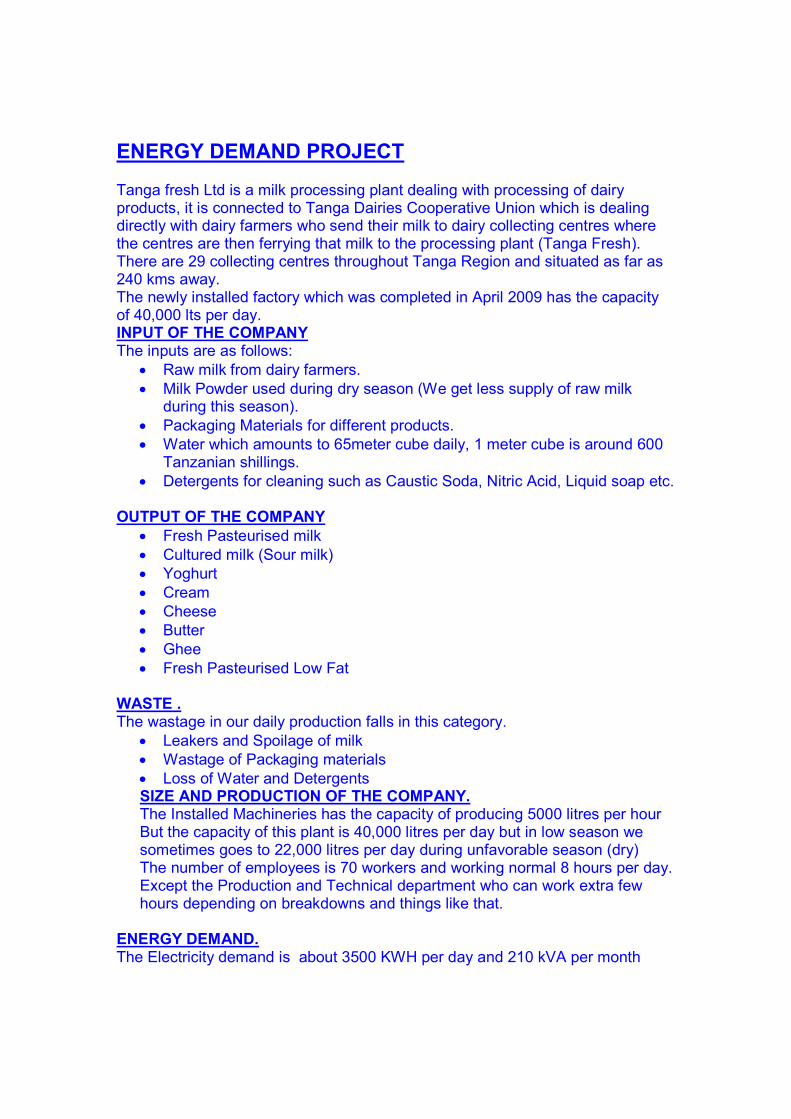
ENERGY DEMAND PROJECT
Tanga fresh Ltd is a milk processing plant dealing with processing of dairy products, it is connected to Tanga Dairies Cooperative Union which is dealing directly with dairy farmers who send their milk to dairy collecting centres where the centres are then ferrying that milk to the processing plant (Tanga Fresh). There are 29 collecting centres throughout Tanga Region and situated as far as 240 kms away. The newly installed factory which was completed in April 2009 has the capacity of 40,000 lts per day. INPUT OF THE COMPANY
The inputs are as follows: • Raw milk from dairy farmers. • Milk Powder used during dry season (We get less supply of raw milk
during this season). • Packaging Materials for different products. • Water which amounts to 65meter cube daily, 1 meter cube is around 600
Tanzanian shillings. • Detergents for cleaning such as Caustic Soda, Nitric Acid, Liquid soap etc.
OUTPUT OF THE COMPANY
• Fresh Pasteurised milk • Cultured milk (Sour milk) • Yoghurt • Cream • Cheese • Butter • Ghee • Fresh Pasteurised Low Fat
WASTE .
The wastage in our daily production falls in this category. • Leakers and Spoilage of milk • Wastage of Packaging materials • Loss of Water and Detergents SIZE AND PRODUCTION OF THE COMPANY.
The Installed Machineries has the capacity of producing 5000 litres per hour But the capacity of this plant is 40,000 litres per day but in low season we sometimes goes to 22,000 litres per day during unfavorable season (dry) The number of employees is 70 workers and working normal 8 hours per day. Except the Production and Technical department who can work extra few hours depending on breakdowns and things like that.
ENERGY DEMAND.
The Electricity demand is about 3500 KWH per day and 210 kVA per month
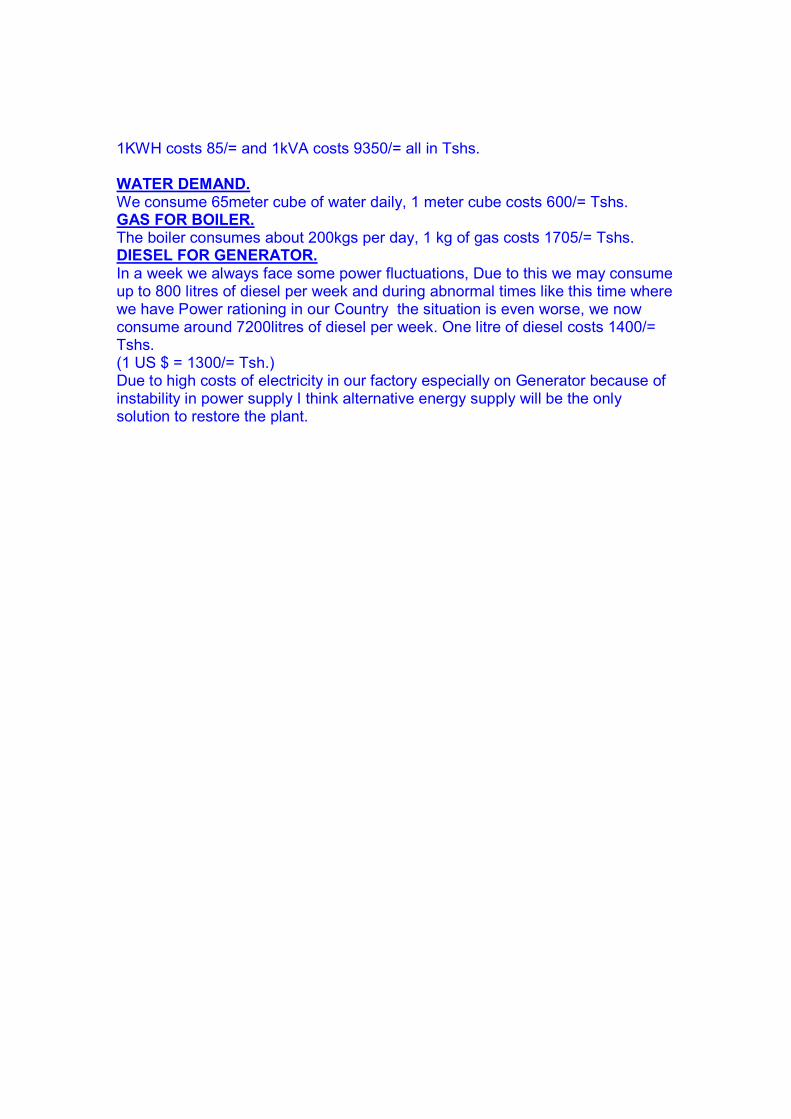
1KWH costs 85/= and 1kVA costs 9350/= all in Tshs. WATER DEMAND.
We consume 65meter cube of water daily, 1 meter cube costs 600/= Tshs. GAS FOR BOILER.
The boiler consumes about 200kgs per day, 1 kg of gas costs 1705/= Tshs. DIESEL FOR GENERATOR.
In a week we always face some power fluctuations, Due to this we may consume up to 800 litres of diesel per week and during abnormal times like this time where we have Power rationing in our Country the situation is even worse, we now consume around 7200litres of diesel per week. One litre of diesel costs 1400/= Tshs. (1 US $ = 1300/= Tsh.) Due to high costs of electricity in our factory especially on Generator because of instability in power supply I think alternative energy supply will be the only solution to restore the plant.

Kindly look through the following questions and answer as many of them as accurately as you can. The more
detailed information we receive from you, the more useful and accurate will our final recommendations and
calculations for your company also be.
Please ask us if there is anything we did not clarify enough, and you would like us to specify.
Questions regarding your energy consumption
Electricity
If you have any statistics or data on your changes in electricity consumption, please send them to us. If not,
please try to answer the following three questions as detailed as possible.
- You said you use 3500 kWh electricity per day. Is that average over the year, or is it your highest
demand for example during rain seasons?
- You said your demand is about 210 kVA per month. Is that always the maximal effect you consume, or
does it vary from month to month? If it does, please describe which months it is more and which it is
less.
- How does your electricity consumption vary over the week? I.e. do you also use 3500 kWh/day in the
weekends, or is it only 2000 kWh/day or what is it?
- How does your electricity consumption vary during a day? I.e. how much more do you use during day
hours compared to nighttime?
- In which hours are you able to buy electricity from the national grid now?
- Do you expect these hours to change soon? If yes, to what?
- How many kWh do you buy from the grid now (per day, week or month, please).
- How many kWh would you buy from the grid during “normal” times per day, week or month (i.e. with
no electricity rationing?)
Heat
If you have any statistics or data on your changes in heat consumption, please send them to us. If not, please try
to answer the following three questions as detailed as possible:
- How does your heat consumption vary from month to month?
- How does your heat consumption vary during a week?
- How does your heat consumption vary during a day? If possible, please say how much more you think
you use in certain hours, for example “twice as much from 8-16 as rest of the day”
- You mentioned in your last response that you use 2 kWh for heating (plus the boiler). Is that 2kWh/day,
week or month? And what is it used for?
Cooling
- You said your energy consumption for cooling was 100 kWh, but is that per day, week, month or?
- What do you use the cooling for?
For cooling milk
- What is the required cooling temperature in Celsius?
The required cooling temperature is about 1 to 2 degrees celsius
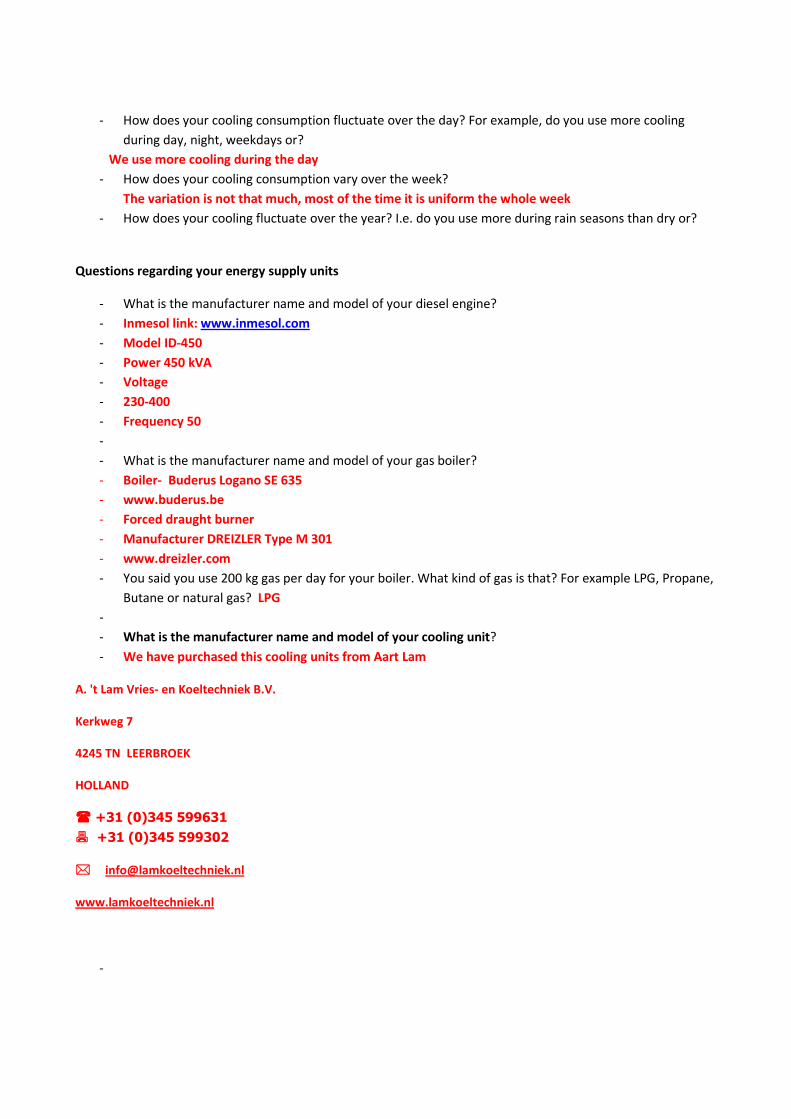
- How does your cooling consumption fluctuate over the day? For example, do you use more cooling
during day, night, weekdays or?
We use more cooling during the day
- How does your cooling consumption vary over the week?
The variation is not that much, most of the time it is uniform the whole week
- How does your cooling fluctuate over the year? I.e. do you use more during rain seasons than dry or?
Questions regarding your energy supply units
- What is the manufacturer name and model of your diesel engine?
- Inmesol link: www.inmesol.com
- Model ID-450
- Power 450 kVA
- Voltage
- 230-400
- Frequency 50
-
- What is the manufacturer name and model of your gas boiler?
- Boiler- Buderus Logano SE 635
- www.buderus.be
- Forced draught burner
- Manufacturer DREIZLER Type M 301
- www.dreizler.com
- You said you use 200 kg gas per day for your boiler. What kind of gas is that? For example LPG, Propane,
Butane or natural gas? LPG
-
- What is the manufacturer name and model of your cooling unit?
- We have purchased this cooling units from Aart Lam
A. 't Lam Vries- en Koeltechniek B.V.
Kerkweg 7
4245 TN LEERBROEK
HOLLAND
���� +31 (0)345 599631
���� +31 (0)345 599302
���� [email protected]
www.lamkoeltechniek.nl
-

General questions
- We read on the DOB Foundations homepage that the new Tanga Fresh Ltd. Dairy is designed after the
Cradle to Cradle concept. Is that true? If yes, please elaborate on how this affects your production and
energy consumption/supply?
- Are there any large farms with livestock located within 20-30 kilometer range of your company?
o If yes, how far away are the closest farms?
YES, the closest farm is around 20 kms away from here
o Do you know how much livestock (cows, pigs) they have, and if it would be possible to “borrow”
their manure for biogas production at your company?
Around 400 cows, borrow manure we are not sure if we can borrow probably buying?
- You said your production can vary from 40,000l/day to 22,000l/day, depending on wet/dry seasons. We
found the following graph, showing average milk production on farms near Dar-Es Salaam. Do you think
this also roughly represents the fluctuations in your production during the year?
o If yes, how accurately tied do you think that is to the fluctuations in your energy consumption?
LPG IN LITRES
24th
May to 31st
May ----- 224
1st
June to 30th
June ----- 203
1st
July 31st
July ------- 233
1st
August to 31st
August ----- 206
1st
September to 30th
September 197
1st
October to 31st
October ----- 166
1st
November to 30th
November ---- 181
DIESEL
(May, June, July and August) ---- 392 hrs
September-------------------- 43 hrs 33min
October-------------------- 40 hrs 38 min
November---------------- 20 hrs 04min
Diesel Consumption 40 litres per hour, cost of diesel is around Tshs 1400/= per litre.
Ice bank volume of water 10,000 litres
Ice bank has two cooling units, each unit has Compressor Electric Motor Power = 18.5KW

Compressor Volume = 126.8m 3 per hour
Cold store
Have two cooling units each unit
Compressor Electric Motor Power = 15KW
Compressor Volume 84.5m 3 per hour
Freezer
Compressor Electric Motor Power = 15 KW
Compressor Volume= 40.52 m 3
per hour
Again, please ask us if there is anything in these questions we did not clarify enough, and you would like us to
specify.
Thank you very much.

Please find reply on the below Questions in Red.
Economic situation:
• You wrote us, that the current investment done is Euro 3.25 million, subdivided into
factory purchase and milk machinery purchase.
Can you please provide us with any information on current available equity capital of
TFL for a possible investment in an alternative energy supply?Currently we have no
funds set aside for investment in Alternative energy source for this Factory, When
need be we have to source financing from Outside in Form In Loan.
What has the company’s idea of maximum investment been, when considering the
change to an alternative energy supply?According to the Biogas study we had (sent to
You By Mr Lut) maximum investment proposaed was Euro 122,000
• What payback time for the investment in an alternative energy supply would we have
to consider?Payback time Range 3.5 to 5 years And do you think an 8% interest rate,
like it has been taken for the investment in the factory, would make sense?8% interest
is still within the range, will not affect its taken into account
• Even though we know the current energy costs of Tanga Fresh Ltd. We’d like to know
what are the energy costs within the company today, in comparison to the total
expenses of the company? The current power cost per month is Euro 13,000 (Includes
Boiler Gas , Generator Diesel & National Grid power) which 4.5 % of total cost
General questions:
• Is there any reason why a probable worsening of the available grid supply was not
considered in the planning of the current energy supply?We considered probable
worsening of Grid supply ,we have Diesel Generator of 450 Kva which can run the
whole factory in case of power problem
• You answered that you don’t have experience in technologies, like photovoltaic, solar
collectors, biomass, biogas, etc. We were still wondering, if you knew experts in these
fields, either working within Tanga Fresh Ltd. or in the Tanga region, like companies
or craftsmen, who could install and / or maintain such technologies?Theres local
available expertise in Biogas if needed ,although for big installations we have to
consult big companies from our commercial city Dar es Salaam
Regards
Michael Karata

EI.ECTRIC IUETER CARD.Nlght$eru|ca
METER No. :8 y ; , " i i , , , ( )x l ,
AQ@U,I{Ttlo":
TARRIF No. :
krspecbr'slnltlals.
T t Y tF'r"!'(
it, '
{-n_a
117 -1 -1

Hello Adam
I shortly wanted to ask if the company actually runs on 5 or 6
days a week.
The company runs seven (7) days a week
And what are the working hours each day including the
approximate timeframe (each day) / hours when the machines run
on highest power?
On highest power the machines runs from 0600hrs to 1500hrs
plus or minus one hour
Best regards,
Jannis
With kindest regards,
Adam Gamba

Transcription of Interview with Bernd Runge:
Date: 15.12.2009 Time: 19:50 duration: 10 minutes
Fritz: Sehr geehrter Herr Runge ich möchte Sie bitten kurz Ihre Firma vorzustellen.
B.R.: Die Firma Runge Haustechnik ist breit aufgestellt und ist vor allem in den
Breichen Sanitär und Energie aktiv.
F.: Könnten Sie uns bitte kurz Ihre Position in der Firma schildern.
B.R.: Ich bin Geschäftsführer und Inhaber zugleich.
F.: Ihre Firma plant und installiert regelmäßig PV-Anlagen. Zu diesem Thema
möchten wir Ihnen einige Fragen stellen.
Wie hoch sind die momentanen kWp-Preise für Freilandanlagen mit
Dünnschichttechnologie?
B.R.: Für eine Anlage mit einer Größe von 30kWp würde ich, je nach Hersteller und
Einspeisemöglichkeiten sagen, dass man mit ca. 2600-2750 Euro pro kWp
rechnen muss.
F.: In den letzten Jahren hat sind die Preise dramatisch gesunken. Erwarten Sie
weitere Preissenkungen? Wie viel denken Sie wird ein kWp Mitte des Jahres 2010
kosten?
B.R.: Ich vermute, dass die Preise etwa bei 2200 Euro pro kWp liegen werden. Für
Anlagen über 100kWp dürfte dieser Wert sogar noch um einiges darunter liegen.
F.: Wie unterscheiden sich kristalline Module von Dünnschichtmodulen in Bezug auf
Einsatzgebiete?
B.R.: Dünnschichtmodule werden immer eingesetzt, wenn keine optimalen
Einstrahlungswerte erreicht werden können. Zum Beispiel durch abweichende
Südausrichtung oder durch häufige diffuse Sonneneinstrahlung. Ein weiteres
Argument ist die zur Verfügung stehende Fläche. Ist sie stark begrenzt machen
kristalline oder sogar mono-kristalline Produkte Sinn, ist die Fläche aber beliebig
groß, bzw. entstehen keine kosten pro Fläche, so sind oftmals
Dünnschichtmodule besser.
F.: Heißt dass, das der Preis pro kWp bei Dünnschicht und kristallinen Modulen
gleich ist?
B.R.: Leicht vereinfacht kann man das so sagen. Die Modulkosten sind bei
Dünnschichtmodulen sogar etwas geringer, wobei die restlichen Systemkosten
etwas größer sind. Insgesamt gleicht sich das jedoch aus!
F.: Wie groß ist schätzen der Anteil der Arbeitskraft von Installationskosten ein?
B.R.: Meinen Sie die Montage inklusive Material oder die reinen Kosten für
Arbeitskräfte?

F.: Zweiteres.
B.R.: Für Freilandanlagen beträgt der Wert ungefähr 10%.
F.: Für wie hoch schätzen Sie die Betriebs- und Wartungskosten pro Jahr ein?
B.R.: Sie sollten ca. 1% der Investitionskosten jährlich rechnen.
F.: Können Sie uns ein bis 2 Modelle, je für Dünnschicht und kristalline Module
empfehlen, die auf dem internationalen Markt Bestand haben und zur
Mittelklasse in Qualität und Effizienz gehören?
B.R.: Was Dünnschicht anbelangt würde ich das Modell FS-275 von First Solar, einem
amerikanischen Hersteller oder Modelle von Schottsolar empfehlen. Bei
kristallinen Modellen würde ich Modelle der deutschen Firma Aleo empfehlen.
Für Wechselrichter empfehle ich SMA Produkte.
F.: Wie hoch ist der System-interne Verlust einer solchen von Ihnen eben
angedeuteten Anlage?
B.R.: Es sollte versucht werden, einen Verlust von maximal 10% zu erreichen, damit
wären unnötige Verluste ausgeschlossen.
F.: Vielen herzlichen Dank Herr Runge. Wir danken vielmals für das Gespräch, wenn
Sie keine weiteren Anmerkungen haben ist das interview damit beendet.
B.R.: Ich danke auch und wünsche noch einen schönen Abend.
Data or information needed:
- What are reasonable payback times and interest rates, when planning an alternative energy
supply for TFL?
� That depends on the investor who will finance this. I expect with 5-7 years we should be
able to attract financing.
- What is the equity capital of TFL available for an alternative energy solution? What would a
possible investment in an alternative energy supply look like?
� We have to attract financing
- What would be requirements to be fulfilled by the project in order to get financial support /
outside capital (if needed)? Would D.O.B. be able / willing to support a project like that under
the precondition, that it is a sustainable investment and can prevent the company of becoming
bankrupt?
� I don't understand your question why will the company becoming bankrupt?
- Besides D.O.B. - are there any other shareholders involved in TFL, which might have
influence on investments? People and / or institutions, depending on the survival of the
company?
� I expect other financers will become available if the investment is profitable.
- On your homepage we read that there has been an initiative to grow fodder to sell to the
farmers during the dry season in order to overcome the seasonal lack in milk production.
Concerning the analysis of an alternative energy supply, possibly on the basis of biomass we
were wondering if you have any information on the possibilities to grow it on company level.
� No, that initiative has to be build from scratch
- Who were the responsible persons for the fodder initiative? Who knows about company's
land resources, possible contracts with farmers, biomass initiatives in Tanzania / Tanga, etc.?
� Lut Zijlstra and Michael Karata(copied in this mail) are the persons who can give you this
information.
- Why was a probable worsening of the available grid supply not considered in the planning
of the current energy supply?
- Who planned the company / the company's energy supply?
� I think it was planned, that the Generator can take over if necessary.
� Alnoor Hussein and Cees Schelle discussed this with the suppliers of the machinery
- On d.o.b's homepage is written that you are considering a sustainable energy supply for the
factory. What requirements would be needed to fulfil such solution? Why did you not include
a sustainable energy supply within the construction of the new factory?
� The requirement is that it should be a sustainable investment. In the long run it should be
profitable.

� There was a pre-feasibility on solar and bio-mass but we did not want it to slow down the
new factory.
� We are still thinking about alternative energy supply but a feasibility has to be done. After
that we can look for investors.
- Do you have any examples or contacts to studies / institutions on renewable energies in a
similar scale from Tanzania or other comparable environment?
� We have contacts with E&Co but they are an investor. There are a lot of possible partners
in the Netherlands. We know a producer of bio-mass installations in Ghana.
� I assume you got the pre feasibility study from Lut, or else you can ask him. I think
Michael can give you current volumes of used energy.

SOUNDPROOFED GEN SETS WITH DEUTZ ENGINE
1500 RPM 400/230 V 50 Hz Type ID-450 450/360 Kva/KW (PRP) 495/396 Kva/KW (LTP)
Engine: BF8M1015C2Alternator: ECO40-2S/4
Scope of Supply:The engine and the alternator are mounted together forming a rigid monoblock, the shafts are connected by a flexibledisc connection.The monoblock is mounted via silent blocks inside a steel plate soundproofed canopy including a built infuel tank. The canopy is painted with powder paint and covered with noise insulator material .Starting is electric and itincludes a battery. The genset monitoring system consist of a control module.
GEN SET POWER
Voltage Hz Phase Cos Ø PRP* Kva/KW LTP** Kva/KW Amp.415/240 50 3 0,8 450/360 495/396 689,5400/230 50 3 0,8 450/360 495/396 715,3380/220 50 3 0,8 450/360 495/396 753,0240/120 50 3 0,8 450/360 495/396 1192,2230/115 50 3 0,8 450/360 495/396 1244,0220/110 50 3 0,8 450/360 495/396 1300,6
PRP* Kva/KW:
Available electrical power (at a variable load) with a medium of 80% of the indicated maximum power. A 10% overload capability is available
LTP** Kva/KW:
Available electrical load (at a variable load) during a maximum of 500 hours per year. No overload capability is available.
Control Cubicle AlternativesManual/Remote Control Cubicle:: STANDARD MCP SAM 712 / OPTIONAL MCP DSE 5320 Automatic Control Cubicle: STANDARD ACP DSE 5320
Options::Please see the price list
Teléfono +34 968 380 300 Export Fax +34 968 380 400 National Fax +34 968 380 504 E-Mail: [email protected] / [email protected] Specifications and design liable to modifications without prior notice
Página 1/3

TECHNICAL DATA
Engine AlternatorEngine type: BF8M1015C2 Alternator Type: ECO40-2S/4
Eng. Power kW COP: - Nº of poles: 4
Eng. Power kW PRP: 391 Eff. At 3/4 %: 94
Eng. Power kW LTP: 450 Eff. At 4/4 %: 93,7
Nº Cylinders: 8 Alt. rating PRP kVA III Kw II: 450
Displacement cm3: 15900 Alt. rating LTP kVA III kW II: 495
Bore/stroke (mm/mm): 132/145 Output Power PRP kVA III kW II: 456,0
Compression ratio: 16,5 Output Power LTP kVA III kW II: 527,1
Cooling: WATER Current Amp PRP: 658
Injection: DIRECT Current Amp LTP: 756,9
Aspiration: TURBO/ INTERCOOLER Standard Circuit Breaker (Amp): 800,0
Standard governor: ELECTRONIC Xd (%): 345,6
Governing control quality: G2 X'd (%): 27,2
Speed droop mech gov. (%): 0 X: 16,9
Exhaust gases temperature (ºC): 510 Nº of wires: 12
Exhaust gases flow (m3/h): 4765 Insulation: H
Max Exh. Back pres. (mbar): 50 Regulator AVR: UVR6
Coolant capcity (lit.): 99 Protection: IP21
Cooling air flow (m3/h): 24120 DIMENSIONSMax allow. Intake dep. (mbar): 50 Height: 2450 mm
Combustion air flow (m3/h): 2092 Width: 2000 mm
Oil cap. (Litres): 45 Lenght: 4800 mm
Oil cons. (kg/hr or % of fuel cons): 0,30%
Min oil press warning (bar): 2,7 Weight: 6290 kgs
Fuel cons. 25% lit/h: 26,2
Fuel cons. 50% lit/h: 48,8 Tank: 550 lit
Fuel cons. 75% lit/h: 73,3
Fuel cons. 100% lit/h: 99,5
Electric system VDC: 24V
Type: Neg to ground
Battery (Ah): 2 X 180
Starting motor (kW): 5,4
Flywheel Housing: SAE1/14
Technical information available in download section.:Engine technical data Alternator Technical data Gen Set Drawing Instalation drawing Control cubicle descr.
Engine manual Alternator Manual Gen Set Manual Gen Set Condensed Man. Controler manual
Teléfono +34 968 380 300 Export Fax +34 968 380 400 National Fax +34 968 380 504 E-Mail: [email protected] / [email protected] Specifications and design liable to modifications without prior notice
Página 2/3

Control Cubicles
AUTOMATIC/MANUAL CONTROL MODULE: ACP-MCP DSE 5320DSE 5320 CONTROLLER•The Model 5320 is an Automatic Mains Failure Control Module. The module isused to monitor a mains supply and automatically start a standby generator set..•Operation of the module is via pushbutton controls with STOP/RESET,MANUAL, TEST, AUTO and START •The controller has a J 1939 CANBus interface for connection to modern engineECU’s. This enables engine protection and instrumentation without requiringadditional sensors. Engine diagnostic information removes the need for bothservice equipment and cryptic diagnostic •Comprehensive remote communication via RS232 port connecting via modem orPC.It is also possible to monitor and control the system via PC up to 100metres(111 yards) from the controller•Standard IV poles circuit breaker (until 85 Kva.)
MANUAL -REMOTE START CONTROL MODULE: MCP SAM 712SAM 712 CONTROLLER•Manual or Automatic remote start controller, Selector switch for Off, Man andAuto with key. Complete engine protection functions with alarms visualised viaLEDs in the front. The controller is set up via 6 DIP switches in the rear of thecase.•Standard circuit breaker.and diferential relay.
Teléfono +34 968 380 300 Export Fax +34 968 380 400 National Fax +34 968 380 504 E-Mail: [email protected] / [email protected] Specifications and design liable to modifications without prior notice
Página 3/3