analysis of an ieee 802.11 network activity during a small workshop zhe zhou, mark claypool, and...
Post on 19-Dec-2015
214 views
TRANSCRIPT

Analysis of an IEEE 802.11 Network Activity during a Small Workshop
Zhe Zhou, Mark Claypool, and Robert KinickiComputer Science, Worcester Polytechnic Institute

2
Introduction

3
Related Work• Tang and Baker [7] trace collected at Stanford on campus
– Analyzed user behavior of the network, overall network traffic and load characteristics• Henderson et al. [2] trace collected at Dartmouth on campus
– Characterized user behavior in terms of application use and found residential traffic– Showed that some wireless cards roamed excessively, being unable to settle down with
one AP• Saroiu and Gummadi [6] trace collected at University of Washington on campus
– Observed that outbound p2p traffic dominated. – Observed the diminishing dominance of Web traffic.
• Jardosh et al. [3], trace collected at the 62nd IETF meeting in hotel– Found rate adaptation implementations rarely used the 2 Mbps and 5.5 Mbps data rates,
and that lower rates are detrimental to network performance during congestion.• Rodrig et al.[5] trace collected at SIGCOMM’04 in hotel
– Concluded that 802.11 overhead is high and retransmissions are common.– Found that clients switched data rates more often than not, and most transmission times
spent sending at 1 Mbps.

4
Goals
• Previous wireless measurement studies– Focused on large gatherings– Looked at traces now more than several years old– Provided a detailed study only off IEEE 802.11b
• Traces analyzed in this paper – Collected from a recent small workshop
• NetGames’08 with 35 participants and 20+ wireless users
– Contains IEEE 802.11 a/b/g traffic• Seek to understand
– Classification, frequency and duration of wireless usage– Application usage and comparative trends– Factors that impact network usage

5
Outline
• Introduction
•Methodology• Analysis• Conclusions

6
Methodology
Figure 1 NetGames 2008 Floor Plan

7
Methodology
Figure 2 Network Topology and Trace Collecting Scheme

8
Trace Summary Statistics
Attribute Values Number of Channels 24
Total bytes transmitted 2.7 GBytes Total hours of trace 7Average Throughput 857 kbps
Peak number of users 18Peak throughput 8.4 Mbps
Table I Trace Statistics (Second Day)

9
Outline
• Introduction• Methodology
• Analysis• Conclusion

10
Comparative Analysis
Attrib Stanford SIGCOMM Dartmouth NetGames
Users 74 195 7134 20
APs 12 4 566 1
Length 12 weeks 52 hours 17 weeks 7 hours
Bytes 46 GBytes 4.6 GBytes 4.6 TBytes 2.7 GBytes
Avg. bytes 308 KBytes 440 KBytes 226 KBytes 19.3 MBytes
Top 5
Apps
Web
session
FTP
netbios
X-term
Web (46%)
session
icp
p2p
email (6%)
Web (29%)
file backup
netbios
p2p
FTP
Web (73%)
p2p
session
email (1%)
netbios
Year 1999 2001 2003/4 2008
Table VI Application Comparison Across Traces

11
Analysis – Physical Layer FramesChannel Number of Frames Volume (bytes) Average Size (bytes)
60 6073329 1803797183 525
11 4712465 887727516 393
Figure 4 CDF of Frame Sizes

12
Analysis – Physical Layer RSSI
Figure 3 RSSI Variations over Time

13
Analysis – Data Link LayerType Count Frac. Volume Frac. Size
Data 1809004 0.38 810593393 0.91 448
Ack 1831248 0.39 18312480 0.02 10
Beacon 204668 0.04 36840692 0.04 180
RTS 249 <0.01 3984 <0.01 16
CTS 690403 <0.01 6904030 0.15 10
Probe rqst 112062 0.02 8887496 0.01 79
Probe rspns 32227 <0.01 5381909 <0.01 167
Null data 31841 <0.01 764184 <0.01 24
Assoc rqst 143 <0.01 14433 <0.01 100
Assoc rspns 141 <0.01 6486 <0.01 46
Disassoc 13 <0.01 338 <0.01 26
Authentcte 311 <0.01 9330 <0.01 30
Deauthentcte 43 <0.01 1118 <0.01 26
Action 107 <0.01 7276 <0.01 68
Table III Frame Distribution (Channel 11)

14
Analysis – Transport Layer
Type Count Volume Fraction
TCP 3215156 2002254869 0.79
UDP 1192505 510813319 0.2
GRE 28849 14670242 0.01
IGMP 3888 258310 <0.01
ICMP 3366 306671 <0.01
IPv6 125 28221 <0.01
Table IV Transport Layer Data Distribution

15
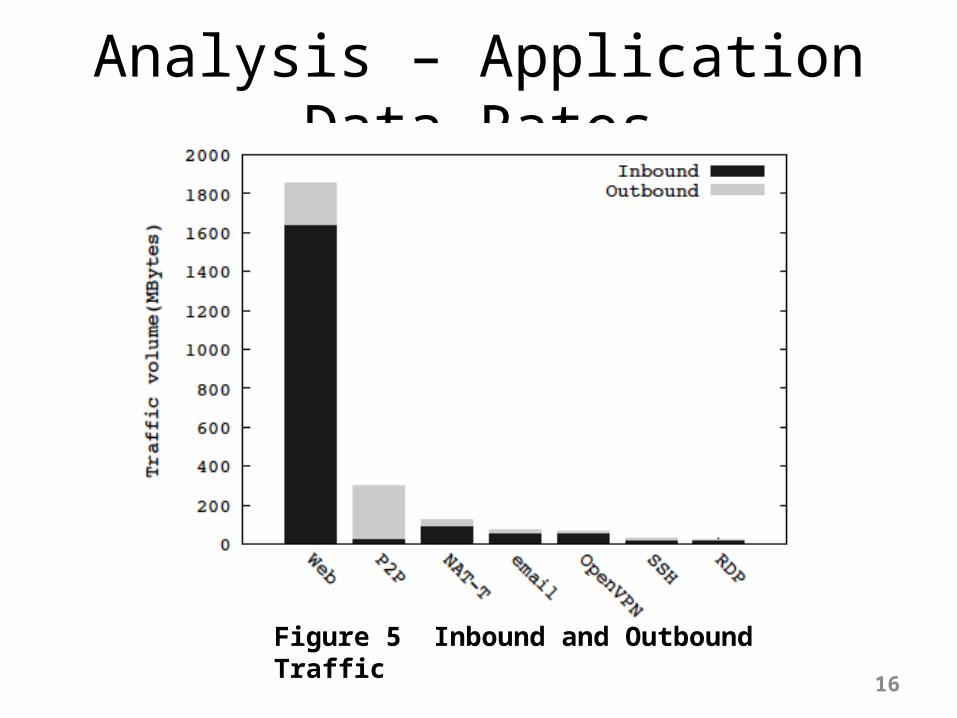
Analysis – Applications ObservedAppl. Port Count Volume Frac. Avg.
http 80 2494223 1745068155 0.69 700
p2p 14900 721916 300657230 0.12 416
https 443 312781 109974470 0.04 352
nat-t 4500 235282 124695364 0.05 529
ssh 22 146601 28036250 0.01 191
imap4 993 102204 37451476 0.01 366
openvpn 1194 99302 63994068 0.03 644
netbios 137 60383 7628494 <0.01 126
rdp 3389 53970 20612017 0.01 382
pop3 995 43347 33558788 0.01 774
Other n/a 105973 57408001 0.02 542
Table V Application Classification
16
Analysis – Application Data Rates
Figure 5 Inbound and Outbound Traffic

17
Analysis – Application Data Rates vs Time
9:00 - 10:30 Morning session (3 speakers)10:30 - 11:00 Break 11:00 - 12:00 Panel session 12:00 - 13:30 Lunch break13:30 - 15:00 Afternoon session (3 speakers)
9:00 10:30 11:00 12:00 13:30
Figure 7 Application Throughput

18
Analysis – Application Rate Variability
App. Min Max Median Mean stddev CoV
http 0.001 8.621 0.194 0.875 1.655 1.892
email 0.001 5.368 0.017 0.075 0.223 2.952
vpn 0.001 5.549 0.007 0.09 0.448 4.994
nat-t 0.001 4.35 0.045 0.114 0.218 1.917
ssh 0.001 4.116 0.003 0.021 0.118 5.608
rdp 0.001 0.098 0.058 0.056 0.14 2.491
p2p 0.001 0.01 0.262 0.172 0.118 0.686
Figure 6 Applications Statistics in Mbps

19
Analysis – Clients vs Time
13 users
7 users
4 users
Figure 8 Clients over Time
20
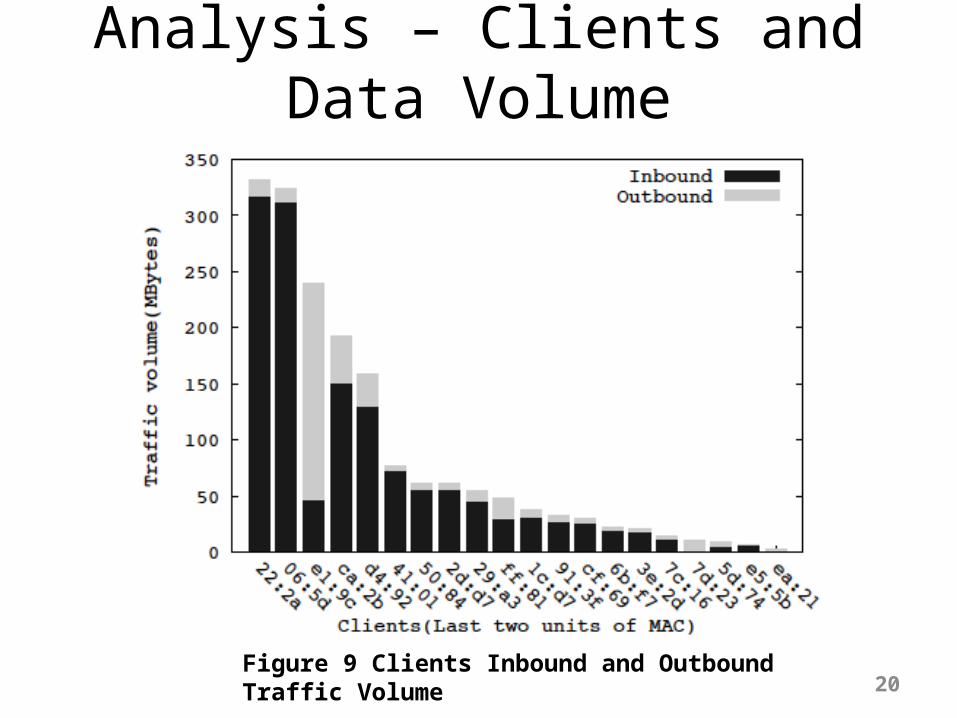
Analysis – Clients and Data Volume
Figure 9 Clients Inbound and Outbound Traffic Volume

21
Analysis – Clients and Data Volume
Figure 10 CCDF of Traffic In and Out

22
Outline
• Introduction• Methodology• Analysis
• Conclusion
23
Conclusion
• IEEE 802.11a and IEEE 802.11g are heavily used• About two-thirds of the participants werr active• Peak throughput of 8.73Mbps (large, but not at capacity)• Web remains dominant, may be increasing after a brief
decline• Emerging use of p2p and vpn as top applications• Wireless use directly influenced by workshop organization• People using wireless in vicinity of access point affect
signal strength

24
Future Work
• Analyze Web traffic in depth to understand the applications it carries – E.g. Email, IM, videos …
• Analyze application performance (e.g. video streaming supported by http) in wireless networks

25
Questions?

26
References[1] A. Balachandran, G. Voelker, P. Bahl, and V. Rangan. Characterizing User Behavior and Network Performance in a Public Wireless LAN. In Proceedings of ACM SIGMETRICS, Marina del Rey, CA, USA, 2002.[2] T. Henderson, D. Kotz, and I. Abyzov. The Changing Usage of a Mature Campus-wide Wireless Network. In Proceedings of MobiCom, Philadelphia, PA, USA, 2004.[3] Amit P. Jardosh, Krishna N. Ramachandran, Kevin C. Almeroth, and Elizabeth M. Belding-Royer. Understanding Congestion in IEEE 802.11b Wireless Networks. In Proceedings of SIGCOMM IMC, Berkeley, CA, USA, October 2005.[4] R. Mahajan, M. Rodrig, D. Wetherall, and J. Zahorjan. Analyzing the MAC-Level Behavior of Wireless Networks in the Wild. In Proceedings of ACM SIGCOMM, Pisa, Italy, September 2004.[5] M. Rodrig, C. Reis, R. Mahajan, D. Wetherall, and J. Zahorjan. Meas- based Characterization of 802.11 in a Hotspot Setting. In Proceedings of ACM SIGCOMM E-WIND, Phil., PA, USA, August 2005.[6] S. Saroiu, P. Gummadi, and S. Gribble. Measuring and Analyzing the Characteristics of Napster and Gnutella Hosts. Multimedia Systems Journal, 9(2):170 – 184, August 2003.[7] D. Tang and M. Baker. Analysis of a Local-Area Wireless Network. In Proceedings of MobiCom, Boston, MA, USA, August 2000.