analysis of fleet replacement lifecycle · within commercial fleets, ... office of inspector...
TRANSCRIPT
Analysis of Fleet Replacement Lifecycle
Project #12-14
Prepared by Office of the Inspector General
J. Timothy Beirnes, CPA, Inspector General


Office of Inspector General Page i Analysis of Fleet Replacement Lifecycle
TABLE OF CONTENTS BACKGROUND ..................................................................................................... 1
OBJECTIVE, SCOPE, AND METHODOLOGY ............................................... 2
EXECUTIVE SUMMARY .................................................................................... 2
TRENDS IN VEHICLE USEFUL LIFE .............................................................. 4
REPLACEMENT CYCLE METHODS ............................................................... 6
Replace at Established Intervals ...................................................................... 6
Replace When Repairing Exceeds Value ........................................................ 6
Lifecycle Costing ................................................................................................ 7
Depreciation .......................................................................................... 8
Cost of Money ..................................................................................... 10
Insurance ............................................................................................. 11
Fuel ..................................................................................................... 11
Maintenance and Repairs .................................................................... 12
Other Replacement Considerations .............................................................. 13
Obsolescence Costs ............................................................................. 13
Downtime Costs .................................................................................. 13
Market Conditions .............................................................................. 14
Other Factors ....................................................................................... 14
Applying Lifecycle Costing ............................................................................. 14
CONSIDERATIONS ..................................................................................... 16

Office of Inspector General Page 1 Analysis of Fleet Replacement Lifecycle
BACKGROUND In accordance with the Office of Inspector General’s Fiscal Year 2012 Audit Plan,
we conducted an analysis of the District’s fleet replacement lifecycle guidelines. District
vehicles are tools used to carry out the District’s mission. Thus, the primary goals are
that the vehicles are safe, reliable, and provide the necessary functionality at an
economical cost. The District’s current guidelines target vehicle replacement at
approximately 12 years or 180,000 miles. The Field Operations Bureau, under the
Operations, Maintenance, and Construction Division, oversees vehicle and equipment
replacement. The District owns the following vehicles and equipment:
Number* Vehicle Type 2010 20031
Sedans 27 24Light Trucks 477 516Medium & Heavy Trucks 92 69Tractors 20 20Heavy Equipment 74 81Boats 120 140Trailers 193 253 Total Vehicles 1,003 1,103
*Fleet operations also maintain approximately 150 other pieces of equipment that are not included in the above table; such as, all terrain vehicles, mobile pumps, compressors, and other miscellaneous equipment.
The above table also includes the number of vehicles in the District’s fleet in
2003. This comparison reveals that the District manages to fulfill its mission with 100
(9%) fewer vehicles and equipment pieces than in 2003.
1 Data from the Audit of the District’s Fleet Operations, Report No. 04-08, issued by the District Office of Inspector General issued February 18, 2005.

Office of Inspector General Page 2 Analysis of Fleet Replacement Lifecycle
OBJECTIVE, SCOPE, AND METHODOLOGY
Our objectives focused on comparing the District’s equipment replacement
criteria and practices to current industry standards and practices. We also focused on
determining the point at which it is more cost efficient to replace vehicles and equipment
rather than repairing.
Our methodology entailed researching available public information regarding how
companies manage their fleets and the average life at time of replacement. We also
researched current trends in fleet lifecycles.
EXECUTIVE SUMMARY
Vehicle manufacturers’ improved engineering, technological advancements, and
improved workmanship have led to increased vehicle quality and longer useful lives.
Consequently, individuals and companies are keeping vehicles longer. The average age
of passenger vehicles on the road has increased approximately 2 years over the last
decade to 10.8 years in 2011.
Three options are typically used in determining a vehicle’s replacement point:
1) Replacement is determined based on established intervals of age and mileage.
This method is simple to implement but may not result in the most economical
cost because it does not consider variability among vehicles.
2) Replacement is made when repairing exceeds the value of the vehicle. This
method is often referred to as the “drive it till it dies” approach, which typically
occurs when a major component fails, such as a transmission or engine. Major
components tend to start failing on vehicles in the 150,000 to 200,000 miles
range.
3) Replacement is based on lifecycle costing analysis. This method considers the
point in the vehicle or equipment’s life when the sum of all ownership and
operating costs reaches a minimum. Typical parameters included in these
analyses are depreciation, cost of money, insurance, fuel, and maintenance and
repairs.
Among the three methods, the lifecycle costing method is preferred because it
results in the most economical cost. However, the method is also the most complex to

Office of Inspector General Page 3 Analysis of Fleet Replacement Lifecycle
implement and is often as much an art as science. One major assumption implicit in the
lifecycle approach is that future maintenance and repair costs can be forecasted with
reasonable certainty based on historical maintenance and repair costs. Therefore,
judgment is needed in interpreting the results and sensitivity analyses should be made to
evaluate the impact of changes in assumptions. The optimal replacement time is rarely a
precise moment, but more closely resembles a window.
The two costs that change the most over a vehicle’s life are depreciation and
repairs. Depreciation cost is very high over the early years of a vehicle’s life, losing
about half its value in the first three years alone. Repair costs are usually covered under
factory warranties for the first three years or more; however, repair costs increase with
vehicle age and tend to rise dramatically after 150,000 miles.
One study2concluded that the optimum life cycle results in the range of 9 to 12
years based on various simulation models; however, the tendency was in the 10 to 11
year range. The study also showed that total annual costs tend to decline only marginally
after 9 years. Based on the results of this study, extending the District’s target life
beyond 9 years may only provide marginal cost savings. Vehicle life cycle tends to
follow the economic concept of marginal utility. Such minimal saving should be
weighed against the many “soft cost” factors such as obsolescence, downtime cost, and
employee morale.
We made several suggestions for management’s consideration at the end of this
report.
2 University of Minnesota, Center for Transportation Studies

Office of Inspector General Page 4 Analysis of Fleet Replacement Lifecycle
TRENDS IN VEHICLE USEFUL LIFE The average light vehicle lasts about 13 years and 145,000 miles when it is taken
out of service and scrapped. However, this includes accident vehicles taken out of
service prematurely. According to Consumers Report, the average vehicle will last about
150,000 miles; however, a properly maintained vehicle can last until 200,000 miles.
Historically reliable models may last even longer.
Americans are keeping cars and
light trucks longer. The average age of
passenger vehicles on the road has
increased approximately 2 years over the
last decade, from 8.9 years in 2001 to 10.8
years in 2011 as shown in Table 1. This
trend is due to manufacturers’ continuously
increasing vehicle quality through improved
engineering, technological advances, and
improved workmanship. The trend has also
been influenced by economic conditions as
individuals and businesses stretch budget
dollars for their transportation needs.
However, as shown in Table 1, the trend for keeping vehicles on the road longer was well
established before the economic challenges
triggered by the financial crisis of 2008.
Americans have also managed to find ways
to provide their transportation needs with fewer
vehicles. The number of vehicles in operation in
2011 is slightly less than five years ago although
the country’s population has grown by
approximately 12 million people, or 4.1%, over the
same period (per U.S. Census Bureau data), as
shown in Table 2.
Table 1
Table 2

Office of Inspector General Page 5 Analysis of Fleet Replacement Lifecycle
As companies continue to find ways to get the most out of their fleet vehicles and
technology continues to evolve, replacement cycles are increasingly extended. Budget
constraints have encouraged more fleets to be creative with cost-cutting strategies. Some
companies have adopted a wait-and-see strategy where individual vehicles are replaced
only when necessary or when safety concerns arise. Some companies are also
streamlining their fleets by having drivers share vehicles or redefining employee job
functions. The table on page 1 shows that the District’s trend has also been to reduce its
fleet size in recent years.
Within commercial fleets, the long-term trend in vehicle life cycling has been a
gradual increase in the service life of vehicles since 2007. However, more recent
industry data has shown significant lengthening of cycles. Improved quality and vehicle
dependability have reduced the risk of extending the replacement cycle.
Another industry trend is right sizing vehicles for the job. Employee job
functions are being reassessed to determine if a smaller more fuel efficient vehicle
provides sufficient utility to perform the job junction. Vehicle utilization is also being
evaluated and whether certain vehicles can be shared, or more fully shared, with other
employees. Also, older vehicles are considered for possible secondary uses.

Office of Inspector General Page 6 Analysis of Fleet Replacement Lifecycle
REPLACEMENT CYCLE METHODS Following are three options that may be used in determining when to replace a vehicle:
Replace at established intervals based on age and mileage.
Replace when the cost to repair exceeds the vehicle’s value.
Determine the optimum replacement point that results in the lowest total cost over
the vehicle’s life.
These three options are discussed in the following sections.
Replace at Established Intervals
Established interval replacement is based on establishing guidelines by vehicle
class based on age or mileage. Under this method a vehicle is replaced when it reaches
its target age or mileage. Currently, the District uses the established interval approach
with a target guideline of 12 years or 180,000 miles. Individual vehicle’s maintenance
and repair costs are also monitored to identify those that that begin to significantly exceed
the average cost within its vehicle category.
The advantage of the interval replacement method is its simplicity of
implementation as it removes subjectivity and judgment from the replacement decision
process. The disadvantage is that it may not result in the most economical cost because it
does not consider variability of conditions among vehicles; for example, some models are
historically more reliable and durable and can usually be driven longer without incurring
major repairs compared to less reliable models. Consequently, some less reliable
vehicles may be kept in service longer than they should thereby incurring costly repairs
while others may be removed from service although they may have several years of
functional service life left without incurring major repairs.
Replace When Repairing Exceeds Value
Replacing when repairing exceeds value approach keeps the vehicle in operation
until it requires a major repair that exceeds the value of the vehicle. Typically, this
occurs when a major component fails such as a transmission or engine. Transmissions
typically cost between $2,000 and $4,000 and the cost of an engine often exceeds $5,000.

Office of Inspector General Page 7 Analysis of Fleet Replacement Lifecycle
Once a major component fails, the vehicle usually has little resale value as they are often
sold for salvage. Selling the vehicle “as is” is generally preferable to repairing because
the cost of the repair is usually not completely recoverable when selling the vehicle. If
the major repair is performed, the investment is best realized through keeping the vehicle
in service and extending its replacement target.
Repair costs tend to start increasing dramatically at about 150,000 miles. The
best time to sell a unit is just before a major breakdown; however, the challenge lies in
pinpointing when it will occur and is the major disadvantage to the replace when
repairing exceeds value approach.
Life Cycle Costing
One of the most important considerations in developing a fleet replacement
program is understanding the concept of lifecycle costs. As vehicles age certain costs
such as maintenance and repairs tend to increase while other costs such as depreciation
tend to decrease. When the sum of these and all other ownership and operating costs
reaches a minimum, the economic life is reached. Quantifying and analyzing these costs
is known as economic lifecycle analysis.
Lifecycle analysis can be applied in three ways as a management tool. First, the
analysis can be used to develop guidelines by vehicle class based on age or mileage
replacement criteria before vehicles go into service. Second, the analysis can be used to
assess individual vehicles after they have been in service to determine whether they
should continue in service for another year or be replaced. Third, the analysis can be
applied to evaluate the economics of major rebuilding programs for larger trucks and
equipment units to assess whether it is more cost effective to rebuild the unit and extend
its life or replace it with a new one. The typical parameters included in these analyses are
the following:
Depreciation
Cost of Money
Insurance
Fuel
Maintenance and Repairs

Office of Inspector General Page 8 Analysis of Fleet Replacement Lifecycle
In determining the optimum point in time to replace a vehicle, total cost of
ownership is divided into two groups: 1) ownership costs tied to the vehicle purchase,
and 2) operating costs associated with ongoing driving expenses. Ownership costs are
those relatively fixed cost due to purchasing and owning a vehicle; such as, age
depreciation, and insurance. Operating costs are associated with the ongoing driving
expenses including fuel, maintenance, repairs, and mileage depreciation. Ownership
costs diminish significantly over time while operating costs rise slightly, primarily due to
increasing maintenance and repair costs as illustrated in the following graph:
Still, on average, operating costs are less than carrying costs until a vehicle is about five
years old. Depreciation is the biggest reason cars cost so much to own during the first
few years. It makes up almost 60% of the cost in the first year alone. Insurance cost is
relatively fixed over the vehicle life but tends to be slightly higher for a new vehicle and
declines slightly over time as the value of the vehicle declines. Fuel is directly correlated
to the amount of miles the vehicle is driven. These cost categories are more fully
discussed in the following sections.
Depreciation
Depreciation cost over the ownership period of a vehicle is the price paid for the
vehicle, plus any acquisition costs to place it in service, minus the resale value (net of

Office of Inspector General Page 9 Analysis of Fleet Replacement Lifecycle
any selling expenses). Depreciation comprises two components; utility and prestige
value. The utility component (the usefulness of the vehicle) is based entirely on
mileage – a vehicle loses utility value with every mile driven. The other component,
new-vehicle prestige, drops dramatically at delivery. Prestige value continues to drop
quickly throughout the first two years, and by years four and five virtually no prestige
value remains. For the balance of the vehicle life, depreciation is based solely on the
amount of utility left in the vehicle.
Depreciation is the largest cost of owning a vehicle during the first six years of
ownership. Vehicles typically lose about 70% of their original value over the first six
years of life but will lose only about 20% over the following six years (years 7
through 12). This trend is illustrated in the following graph:
Thus, the depreciation expense over the first six years for a $30,000 vehicle is about
$21,000 and about $6,000 over years 7 through 12. While maintenance and repair
costs will increase over the second six year period they typically are less than the
difference in the depreciation between the two periods (i.e. $15,000).
Another way to look at depreciation is the average annual depreciation cost of
owning a vehicle over a certain number of years; for example; the depreciation cost

Office of Inspector General Page 10 Analysis of Fleet Replacement Lifecycle
for replacing a vehicle every year is about 30% (30% ÷ 1), whereas replacing the
vehicle after six years the average drops to about 11.67% (70% ÷ 6). The average
drops to 7.6% over a 12-year ownership period. This is illustrated in the following
graph for a vehicle with an original cost of $30,000:
As shown in the above graph, although the straight line depreciation rate continues to
decline each year, in the latter years there is a diminishing rate of saving for each year
the vehicle is kept in service. Since the cost of a new vehicle will usually be higher
than the original cost of the vehicle to be replaced, replacement decisions should be
based on the projected depreciation cost of the new vehicle and not the original cost
of the vehicle to be replaced.
Cost of Money
The cost of money is the interest rate that would be paid if capital were
borrowed to acquire the asset. If the investor’s own funds are used to acquire the
asset the cost of money is the interest that could be earned if the amount invested in
an asset was instead invested in a risk-free security such as U.S. Treasury Bills. This

Office of Inspector General Page 11 Analysis of Fleet Replacement Lifecycle
is also referred to as opportunity cost since it is the opportunity forgone as a result of
using the funds to purchase the asset. The District usually purchases vehicles with its
own funds. Currently, the risk-free rate of return is very low - less than 1%;
therefore, under current conditions the Cost of Money factor in a life cycle analysis
will have minimal affect on the results; for example, the July 2012 30-day average
yield was 0.31% for participants in the State Board of Administration of Florida
Local Government Investment Pool. This is one of the investment options used for
investing District cash.
Insurance
Insurance is a relatively fixed cost; however, the cost of insuring a new vehicle
is generally slightly higher during the first few years of ownership. The reason for
this is that a new vehicle carries a higher value making it a greater risk in the event of
an accident. However, reduced liability due to added safety features in new vehicles,
are tending to offset much of the increased collision risk. Safety features are
increasingly included even in basic trim models. Thus, the difference in insurance
cost is not that significant to the decision making process. It should be noted that the
District self insures its fleet.
Fuel
Fuel cost is a variable operating expense as it is directly related to the number of
miles driven. However, fuel expense can vary significantly due to wide fluctuations
in fuel prices, which are unpredictable. However, fuel costs can be estimates based
on averages over time and price trends. Fuel costs factors should include assumptions
that the average price will continue to increase over time.
Vehicle replacement decisions should also factor in the improvements in fuel
economy provided in new vehicles. Manufacturers continue to incorporate
technological advancements into new vehicle that have improved fuel efficiency
while maintaining or increasing horsepower. The high cost of fuel has made
increasing fuel economy a high priority for vehicle manufacturers. Federal standards
also mandate that manufacturers achieve certain average minimum miles per gallon
Office of Inspector General Page 12 Analysis of Fleet Replacement Lifecycle
benchmarks in future years. According to Bureau of Transportation statistics the
average fuel efficiency of U.S. Light Duty Trucks (i.e. < 8,500 lbs GVWR) increased
about 3 mpg over the past decade, which equates to about a 15% improvement. (A
significant portion of the District fleet is Light Duty Trucks.) A 3 MPG improvement
in fuel economy saves about $600 to $700 per year (assuming 15,000 miles per year
and current gas prices of about $3.75 per gallon). Additionally, a vehicle’s fuel
efficiency tends to decline slightly for older vehicles due to engine ware.
Maintenance and Repairs
Preventive maintenance is critical to maximizing a vehicle’s useful life.
Missing even one oil change can shorten an engine’s life span. The District’s fleet
operation uses a computerized information management system (SAP) to monitor and
document the preventive maintenance and repairs of its fleet. Maintenance costs
typically include fluids, filters, belts, hoses, batteries, brakes, sparkplugs, and other
components that are not intended to last the life of the vehicle. Repairs, on the other
hand, are those components that fail prematurely, such as alternators, air compressors,
transmissions, and other components that are intended to last the life of the vehicle.
Vehicle repair costs are generally covered under manufacturers warranties for the first
few years of ownership (typically 3 to 5 years). Repair costs tend to increase as a
vehicle ages and begins to offset some of the depreciation savings from keeping a
vehicle longer. Repair costs are generally manageable until a major component fails,
such as a transmission or engine. Major components begin failing between 150,000
and 200,000 miles. Vehicles have minimal resale value once a major component fails
as the cost often exceeds the vehicle’s value. Such vehicles are often removed from
service and sold for salvage. Vehicle condition is the most significant factor that
affects resale value in older higher mileage vehicles.
One strategy used to reduce repair cost over the life of the vehicle is to purchase
vehicles that have historically proven to be reliable. Vehicles with better reliability
reputations tend to last longer and provide lower total operating cost. Reliability can
significantly affect the cost of maintenance and repairs over the vehicle’s life,
Office of Inspector General Page 13 Analysis of Fleet Replacement Lifecycle
especially during the latter years. Thus, maintenance and repair costs can vary widely
among fleet vehicles.
Other Replacement Considerations
Obsolescence Cost
Technological advancement should also be considered in vehicle
replacement decisions. Manufacturers continue to add technological advancements to
vehicles that improve fuel economy, improved emissions, added safety equipment,
and reduced maintenance requirements. Safety features, such as traction and stability
control, ABS brakes, tire pressure indicators, and side airbags, are increasingly
becoming standard equipment even on base models. Safety features reduce accidents
and protect occupants. Additionally, manufacturers are providing longer warranties
on some models as they continue to improve reliability. Quantifying obsolescence is
not easy but can be the deciding factor on how long to keep vehicles. Quantifying
obsolescence requires judgment and can involve age and experience factors,
manufacturers input, and safety factors.
Downtime Costs
As a vehicle ages, breakdowns will increase. In addition to the cost of
repairing the vehicle there may be other costs such as towing expense and possible
vehicle rental cost (or mileage allowance for use of personal vehicle) while the
repairs are performed. In addition there is the cost of lost staff productivity, which is
not reflected in fleet management costs. Productive time may be lost due to:
Waiting to be towed.
Arranging for temporary use of another vehicle.
Administrative time arranging for the repairs.
Returning to the shop to pick up the vehicle after repairs are complete.
Downtime cost parameters should be included in a life cycle cost analysis. Downtime
cost generally includes the loaded rate of the work crew and the cost of a spare
vehicle. Towing cost may also be incurred for broken down vehicles.

Office of Inspector General Page 14 Analysis of Fleet Replacement Lifecycle
Market Conditions
Market values of used vehicles also fluctuate based on changes in supply and
demand. When the demand for used vehicles is high it may make economic sense to
replace a vehicle sooner. Additionally, available manufacturer price incentives
should be considered in the replacement decision (i.e., rebates, etc.). Values of used
vehicles tend to be higher during periods of economic distress. The most generous
manufacturer price incentives are also generally widely available during such
economic periods. Also, in the fall, when the new models are introduced, incentives
are usually widely available on prior year model closeouts.
Other Factors
Following are other factors that should be considered in vehicle replacement
decisions.
Replacement must also factor in the cost of removing District emblems from
old vehicles and adding them to new vehicles.
Right sizing the fleet size and vehicle sizes to met organizational needs
Potential impact on the District’s image should also be considered if vehicles
begin to look unsightly.
Employee morale and satisfaction may be affected since employees tend to
have less initiative to care for older vehicles.
Applying Lifecycle Costing
The total cost curve tends to become asymptotic, or flattened as a vehicle ages.
Stated otherwise, total cost of ownership declines each year of operation but the amount
of decline decreases with each year until it nearly resembles a straight line, and then
begins sloping gradually upward. One study we found determined that the lowest cost of
ownership results from keeping a vehicle for 17 years. However, the study also showed
that total ownership cost declines very little after 9 or 10 years (assuming 12,000 miles
per year). Another study; performed by the University of Minnesota, Center for
Transportation Studies, concluded that the optimum life cycle results in the range of 9 to
12 years based on various simulation models, with the tendency to be in the 10 to 11 year
Office of Inspector General Page 15 Analysis of Fleet Replacement Lifecycle
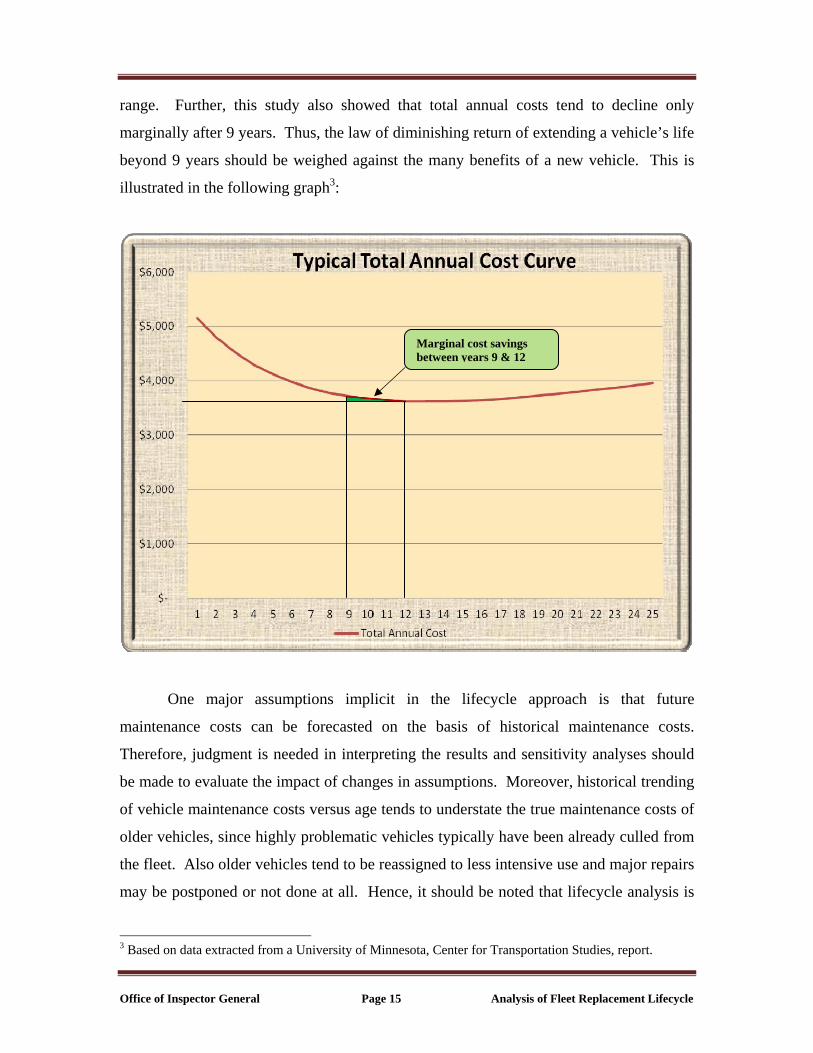
range. Further, this study also showed that total annual costs tend to decline only
marginally after 9 years. Thus, the law of diminishing return of extending a vehicle’s life
beyond 9 years should be weighed against the many benefits of a new vehicle. This is
illustrated in the following graph3:
One major assumptions implicit in the lifecycle approach is that future
maintenance costs can be forecasted on the basis of historical maintenance costs.
Therefore, judgment is needed in interpreting the results and sensitivity analyses should
be made to evaluate the impact of changes in assumptions. Moreover, historical trending
of vehicle maintenance costs versus age tends to understate the true maintenance costs of
older vehicles, since highly problematic vehicles typically have been already culled from
the fleet. Also older vehicles tend to be reassigned to less intensive use and major repairs
may be postponed or not done at all. Hence, it should be noted that lifecycle analysis is
3 Based on data extracted from a University of Minnesota, Center for Transportation Studies, report.
Marginal cost savings between years 9 & 12
Office of Inspector General Page 16 Analysis of Fleet Replacement Lifecycle
as much of an art as it is a science. The optimal replacement time is rarely a precise
moment, but more closely resembles a window. Where that optimal window falls in a
vehicle service life can vary throughout the District due to varying demands placed on
vehicles; for example, off-road use is more stressful on vehicles than on-road driving.
A lifecycle cost approach also requires a procurement process other than lowest
bid because the vehicles with the lowest lifecycle cost may not be the vehicle with the
lowest purchase price.
CONSIDERATIONS
1. Consider implementing a lifecycle costing approach to determining the most
economical replacement point for vehicles and heavy equipment.
2. If the District continues to use the age and and mileage target method with target
guidelines of 12 years and 180,000 miles, we recommend performing an annual
physical condition assessment of vehicles at least 10 years or older, or exceed
150,000 miles. These can be performed when the vehicle is brought in for routine
maintenance
3. Consider the feasibility of purchasing used vehicles 1 to 3 years old to reduce the
new vehicle prestige depreciation cost.
4. Consider incorporating historical vehicle reliability into the vehicle procurement
process.
5. When possible reassign older vehicles to less intensive uses, which can help
extend the replacement cycle.