analyst presentationppt+q1fy19.pdf · (no. of demat & on-line trading accounts opened) 46101...
TRANSCRIPT

Quarterly Results Q1FY19
Analyst Presentation
10.08.2018
Safe Harbor
Certain statements in these slides are forward-
looking statements. These statements are based on
Management's current expectations and are subject
to uncertainty and changes in circumstances. Actual
outcomes may differ materially from those included
in these statements due to a variety of factors.
2

3
Contents
Financial Performance
Digital Banking
Financial Inclusion
Subsidiaries
Balance Sheet
4
Financial Performance

Operating Performance
Rs. in Crores
5
Quarter ended Growth (%)Quarter
EndedGrowth (%)
Q1FY19 Q1FY18
Q1FY19
over
Q1FY18
Q4FY18
Q1FY19
over
Q4FY18
Interest Income 58,813 54,905 7.12 55,941 5.13
Other Income 6,679 8,006 -16.57 12,495 -46.54
Total Income 65,493 62,911 4.10 68,436 -4.30
Interest Expenses 37,015 37,299 -0.76 35,967 2.91
Net Interest Income 21,798 17,606 23.81 19,974 9.13
Operating Expenses 16,505 13,738 20.14 16,586 -0.49
Operating Profit 11,973 11,874 0.83 15,883 -24.62

Provisions and Net Result
Rs. in Crores
6
Quarter ended Growth (%)Quarter
EndedGrowth (%)
Q1FY19 Q1FY18
Q1FY19
over
Q1FY18
Q4FY18
Q1FY19
over
Q4FY18
Operating Profit 11,973 11,874 0.83 15,883 -24.62
Total Provisions 16,849 9,869 70.73 23,601 -28.61
Loan Loss 13,038 12,125 7.53 24,080 -45.86
of which:
Movement from Standard Provision-631 -1806 -1754
Standard Assets -919 -2,039 -852
Investment Depreciation 7,098 -755 4,761 49.08
Other Provisions 11 -402 102.80 107 -89.46
Income Tax -2,379 939 -353.37 -4,495 47.06
Net Profit -4,876 2,006 -343.12 -7,718 36.83

Interest Income / Expenses
Rs. in Crores
7
Quarter ended Growth (%)Quarter
EndedGrowth (%)
Q1FY19 Q1FY18Q1FY19 over
Q1FY18Q4FY18
Q1FY19 over
Q4FY18
Interest on Loans 38,865 36,142 7.54 34,235 13.53
Interest on Resources 18,832 17,543 7.35 18,534 1.61
Other Interest income 1,116 1,220 -8.58 3,172 -64.83
Total Interest Income 58,813 54,905 7.12 55,941 5.13
Interest on Deposits 34,258 34,990 -2.09 33,206 3.17
Interest on Borrowings 1,706 1,018 67.46 1,694 0.70
Other Interest paid 1,051 1,291 -18.58 1,067 -1.49
Total Interest Expenses 37,015 37,299 -0.76 35,967 2.91
Net Interest Income 21,798 17,606 23.81 19,974 9.13
Non-Interest Income
Rs. in Crores
8
Quarter ended Growth (%)Quarter
EndedGrowth (%)
Q1FY19 Q1FY18
Q1FY19
over
Q1FY18
Q4FY18
Q1FY19
over
Q4FY18
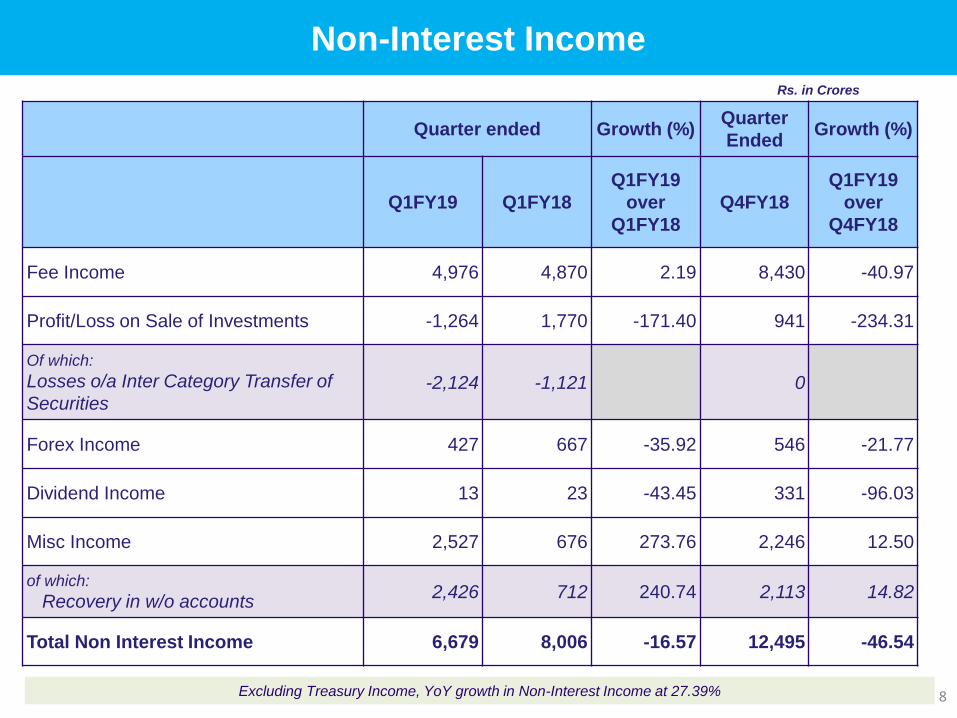
Fee Income 4,976 4,870 2.19 8,430 -40.97
Profit/Loss on Sale of Investments -1,264 1,770 -171.40 941 -234.31
Of which:
Losses o/a Inter Category Transfer of
Securities-2,124 -1,121 0
Forex Income 427 667 -35.92 546 -21.77
Dividend Income 13 23 -43.45 331 -96.03
Misc Income 2,527 676 273.76 2,246 12.50
of which:
Recovery in w/o accounts 2,426 712 240.74 2,113 14.82
Total Non Interest Income 6,679 8,006 -16.57 12,495 -46.54
Excluding Treasury Income, YoY growth in Non-Interest Income at 27.39%
Stable Fee Income
Rs. in Crores
9
Quarter ended Growth (%)Quarter
EndedGrowth (%)
Q1FY19 Q1FY18
Q1FY19
over
Q1FY18
Q4FY18
Q1FY19
over
Q4FY18
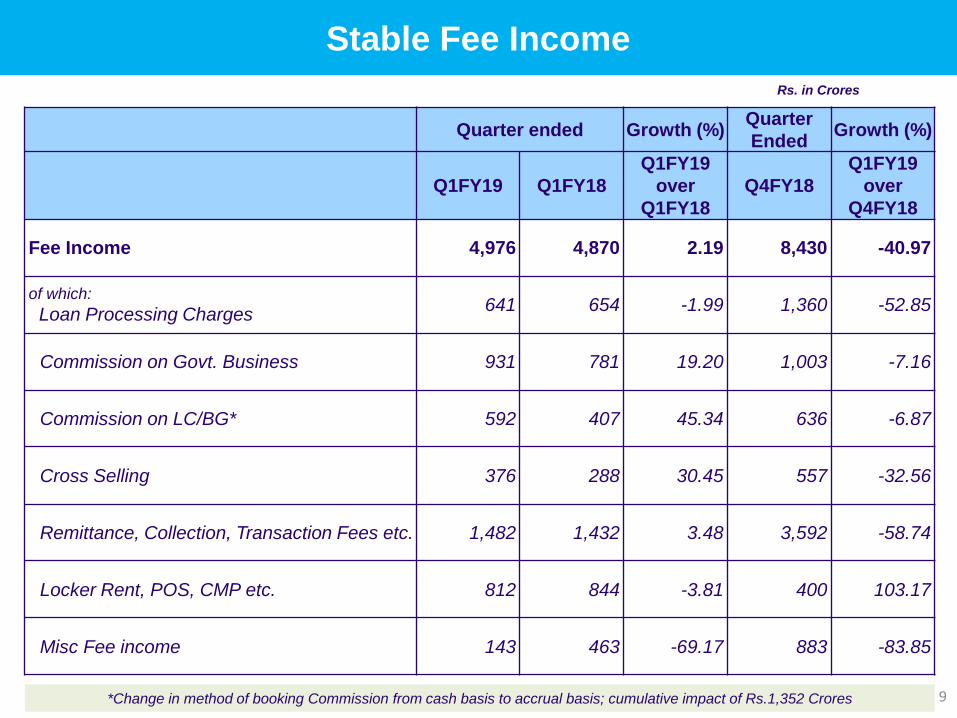
Fee Income 4,976 4,870 2.19 8,430 -40.97
of which:
Loan Processing Charges 641 654 -1.99 1,360 -52.85
Commission on Govt. Business 931 781 19.20 1,003 -7.16
Commission on LC/BG* 592 407 45.34 636 -6.87
Cross Selling 376 288 30.45 557 -32.56
Remittance, Collection, Transaction Fees etc. 1,482 1,432 3.48 3,592 -58.74
Locker Rent, POS, CMP etc. 812 844 -3.81 400 103.17
Misc Fee income 143 463 -69.17 883 -83.85
*Change in method of booking Commission from cash basis to accrual basis; cumulative impact of Rs.1,352 Crores

10
Cross Selling
Total Business Mobilized through BANCA Channel
Q1FY19 Q1FY18 FY18YoY Growth
(%)
SBI Life Premium mobilized: 2338 1649 12821 41.76
- New Business 1018 758 5334 34.33
- Renewal Business 1319 891 7486 48.08
MF-Gross mobilization 33346 21493 80968 55.15
General Insurance 317 306 1580 3.53
- New Business 231 234 1335 -1.23
- Renewal Business 85 72 244 19.01
SBI Cards (No. of cards sourced) – (In Lakhs) 3 1 12
SBI Cap Securities Ltd.
(No. of demat & on-line trading accounts opened)46101 42854 241695 7.58
• Sale through process digitisation, Data Analytics for business leads
• Project CRM - to leverage data analytics for increasing Wallet share
• 97% of Branches earned cross selling income in Q1FY19; Enhancing synergy between
SBI and JVs.
• 48,715 employees qualified to sell products of SBI Life; 19,968 AMFI qualified for selling
products of Mutual Fund.
• 49% Business of SBI Life and 31% of SBI General mobilised through Banca Channel.
• Mutual Fund Distribution- Ranked 3rd (FY18) in gross commission with highest growth of
203% YoY in FY18 among the top 10 distributors
Rs. In crores
Operating Expenses (1/2)
Rs. in Crores
11
Staff Expenses
Quarter ended Growth (%)Quarter
EndedGrowth (%)
Q1FY19 Q1FY18
Q1FY19
over
Q1FY18
Q4FY18
Q1FY19
over
Q4FY18
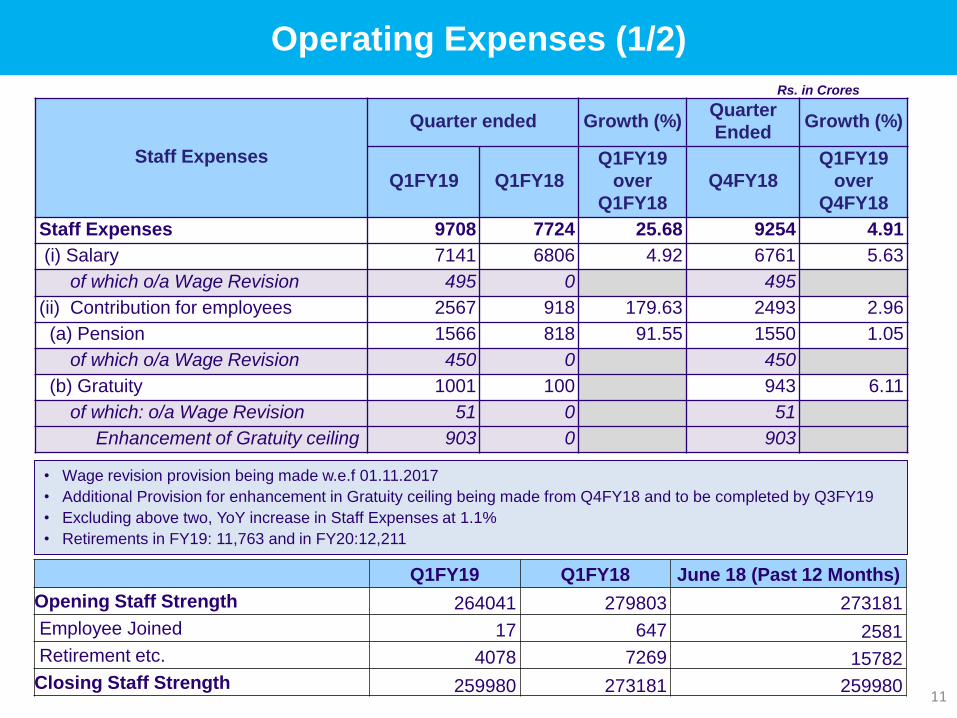
Staff Expenses 9708 7724 25.68 9254 4.91
(i) Salary 7141 6806 4.92 6761 5.63
of which o/a Wage Revision 495 0 495
(ii) Contribution for employees 2567 918 179.63 2493 2.96
(a) Pension 1566 818 91.55 1550 1.05
of which o/a Wage Revision 450 0 450
(b) Gratuity 1001 100 943 6.11
of which: o/a Wage Revision 51 0 51
Enhancement of Gratuity ceiling 903 0 903
Q1FY19 Q1FY18 June 18 (Past 12 Months)
Opening Staff Strength 264041 279803 273181
Employee Joined 17 647 2581
Retirement etc. 4078 7269 15782
Closing Staff Strength 259980 273181 259980
• Wage revision provision being made w.e.f 01.11.2017
• Additional Provision for enhancement in Gratuity ceiling being made from Q4FY18 and to be completed by Q3FY19
• Excluding above two, YoY increase in Staff Expenses at 1.1%
• Retirements in FY19: 11,763 and in FY20:12,211

Operating Expenses (2/2)Rs. in Crores
12221 Branches planned to be opened during FY19; Plan to rationalise / convert 600-700 branches into BC/CSP outlets during FY 19
Overhead Expenses
Quarter ended Growth (%)Quarter
EndedGrowth (%)
Q1FY19 Q1FY18
Q1FY19
over
Q1FY18
Q4FY18
Q1FY19
over
Q4FY18
Overheads 6,796 6,013 13.02 7,332 -7.30
Of which:
Rent, Taxes and Lighting1,173 1,198 -2.03 1,415 -17.07
Depreciation 798 778 2.45 852 -6.35
Insurance 712 732 -2.66 690 3.25
Travelling & Halting 254 230 10.22 361 -29.72
Repairs and Maintenance to Bank's Property 196 182 8.00 239 -17.74
Printing and Stationery 103 102 1.44 184 -43.97
Postage & Telecommunications 85 161 -47.22 205 -58.53
Business Acquisitions & Development Expenses 443 344 28.69 558 -20.54
ATM /CDM/POS/Debit Card /Other Tech Expenses 1,807 1,457 24.00 1,914 -5.61
GST / Service Tax* 629 260 141.90 243 158.99
Misc. Expenses 596 569 4.66 672 -11.36
Operating Expenses 16,505 13,738 20.14 16,586 -0.49
Cost to Income ratio (%) 57.96 53.64 432 bps 51.08 688 bps
June 18 June 17
YoY
Rationalisation / Net
of Opening
Branches 22,428 24,017 1589
Admin Offices 1,396 1,634 238
Currency Chest 2,343 2,632 289
*due to increase in scope / rate and time lag in Input Tax Credit

Net Interest Margin (%)
13
Key Performance Indicators : Performance Ratios
Yield & Costs (%)
8.49 8.46 8.38 8.288.57
7.38 7.33 7.31 7.31 7.27
5.635.50 5.42 5.38
5.185.54 5.42 5.34 5.30
5.11
Jun 17 Sep 17 Dec 17 Mar 18 June 18
Yield on Advances Yield on Investments
Cost of Funds Cost of Deposits
2.502.59 2.61
2.67
2.95
2.362.43 2.45 2.50
2.80
1.16 1.17 1.16 1.14
1.47
Jun 17 Sep 17 Dec 17 Mar 18 June 18
Domestic Whole Bank Foreign

Sustained CASA growth driving liability franchise
Rs. in Crores
Domestic
SB
Foreign Offices
CA
TD
Total Deposits
-1.34
0.35
5.78
8.99
4.46
5.58
CASA 7.43
CASA Ratio 69 bps
27,47,813
93,842
26,53,971
14,57,775
1,66,155
10,30,040
11,96,195
45.07%
Jun 18 YoY Growth (%)
26,02,534
93,517
25,09,018
13,95,563
1,68,414
9,45,040
11,13,455
44.38%
Jun 17
14
• Market Share of Saving Bank and Current Account Deposits as on 31.03.2018 was 26.55% and 16.83% respectively.
• Average CASA Ratio: 44.84%
• Total Number of Deposit Customers; 41.78 Crores.
Current Account
Savings Bank
5.78
8.7710,08,419
1,67,519
9,27,094
1,58,370
Average
Diversified Asset Portfolio
Rs. in Crores
15
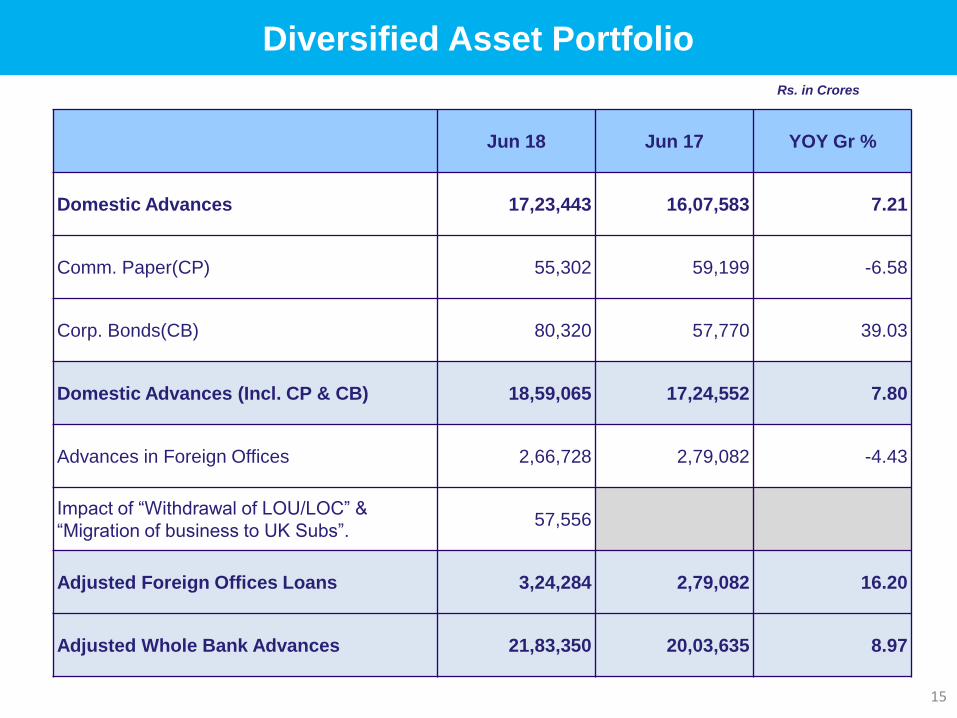
Jun 18 Jun 17 YOY Gr %
Domestic Advances 17,23,443 16,07,583 7.21
Comm. Paper(CP) 55,302 59,199 -6.58
Corp. Bonds(CB) 80,320 57,770 39.03
Domestic Advances (Incl. CP & CB) 18,59,065 17,24,552 7.80
Advances in Foreign Offices 2,66,728 2,79,082 -4.43
Impact of “Withdrawal of LOU/LOC” &
“Migration of business to UK Subs”.57,556
Adjusted Foreign Offices Loans 3,24,284 2,79,082 16.20
Adjusted Whole Bank Advances 21,83,350 20,03,635 8.97

Diversified Loan Portfolio
Rs. in Crores
16
Domestic
SME
Foreign Offices
Corporate Client Group
Large Corporate
Total Advances
-4.43
7.21
5.49
Jun 18
YoY Growth (%)
June 18 over
June 17
AGRI -0.52
Per Segment 14.11
19,90,172
2,66,728
17,23,443
1,88,110
5,59,134
18,86,666
Jun 17
2,79,082
16,07,583
9,28,479
1,89,100
4,90,005
5.14
YoY Growth (%)
June 17 over
June 16
3.22
1.16
1.46
1.69
13.31
-4.35
2,88,160
4,12,970
2,75,069
9,76,199
Diversified Industry PortfolioDomestic Fund Based Outstanding
Rs. in Crores
17
Jun 18 Mar 18 Jun 17 Jun 18
Level % Share Level % Share Level % Share YOY Gr %
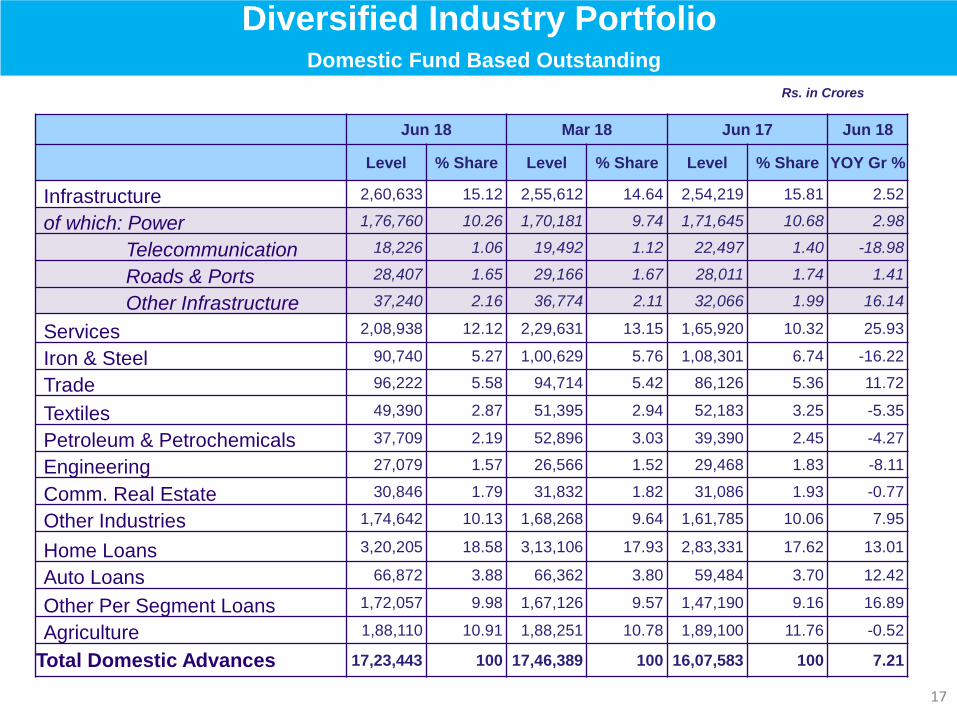
Infrastructure 2,60,633 15.12 2,55,612 14.64 2,54,219 15.81 2.52
of which: Power 1,76,760 10.26 1,70,181 9.74 1,71,645 10.68 2.98
Telecommunication 18,226 1.06 19,492 1.12 22,497 1.40 -18.98
Roads & Ports 28,407 1.65 29,166 1.67 28,011 1.74 1.41
Other Infrastructure 37,240 2.16 36,774 2.11 32,066 1.99 16.14
Services 2,08,938 12.12 2,29,631 13.15 1,65,920 10.32 25.93
Iron & Steel 90,740 5.27 1,00,629 5.76 1,08,301 6.74 -16.22
Trade 96,222 5.58 94,714 5.42 86,126 5.36 11.72
Textiles 49,390 2.87 51,395 2.94 52,183 3.25 -5.35
Petroleum & Petrochemicals 37,709 2.19 52,896 3.03 39,390 2.45 -4.27
Engineering 27,079 1.57 26,566 1.52 29,468 1.83 -8.11
Comm. Real Estate 30,846 1.79 31,832 1.82 31,086 1.93 -0.77
Other Industries 1,74,642 10.13 1,68,268 9.64 1,61,785 10.06 7.95
Home Loans 3,20,205 18.58 3,13,106 17.93 2,83,331 17.62 13.01
Auto Loans 66,872 3.88 66,362 3.80 59,484 3.70 12.42
Other Per Segment Loans 1,72,057 9.98 1,67,126 9.57 1,47,190 9.16 16.89
Agriculture 1,88,110 10.91 1,88,251 10.78 1,89,100 11.76 -0.52
Total Domestic Advances 17,23,443 100 17,46,389 100 16,07,583 100 7.21
Personal Segment Continues to drive Loan GrowthRs. In Crores
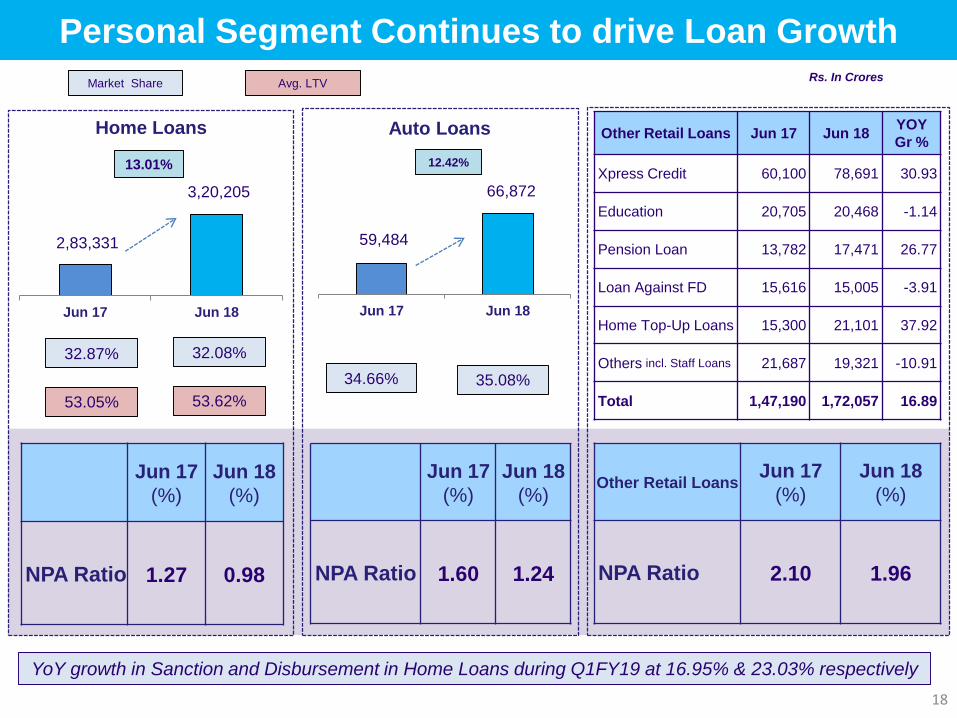
59,484
66,872
Jun 17 Jun 18
12.42%
2,83,331
3,20,205
Jun 17 Jun 18
Home Loans Auto Loans
13.01%
35.08%
Jun 17
(%)
Jun 18
(%)
NPA Ratio 1.27 0.98
Jun 17
(%)
Jun 18
(%)
NPA Ratio 1.60 1.24
Market Share
18
Avg. LTV
34.66%
32.87% 32.08%
53.62%53.05%
YoY growth in Sanction and Disbursement in Home Loans during Q1FY19 at 16.95% & 23.03% respectively
Other Retail Loans Jun 17
(%)
Jun 18
(%)
NPA Ratio 2.10 1.96
Other Retail Loans Jun 17 Jun 18YOY
Gr %
Xpress Credit 60,100 78,691 30.93
Education 20,705 20,468 -1.14
Pension Loan 13,782 17,471 26.77
Loan Against FD 15,616 15,005 -3.91
Home Top-Up Loans 15,300 21,101 37.92
Others incl. Staff Loans 21,687 19,321 -10.91
Total 1,47,190 1,72,057 16.89

Wealth Management & Transaction BankingLevers for Sustainable Fee Income
19
AUM and # of customers Expected to double by FY19.
Rolled out at 13 Centres with 77 Wealth Hubs and 3
e-Wealth Centres .
Acquiring and mapping NRI clients to e-Wealth
centres
Doubling RM workforce in FY19
• SBI rated as The Best Transaction Bank in India by ‘The Asian Banker’ consecutively for two years
in 2017 & 2018
• Fee income up by 38.98% and Turnover up by 48.03% YoY.
• Technology driven platform for bulk transaction processing; serving 4,825 clients across segments.
• Dominant player in Government sector, with a market share of 67.65% in Central Govt. business.
Offer Primary and Secondary Market Bonds & other
Alternative Investment Products.
6,850 4,682
24,168
14,284
27,882
16,380
No. of Customers onboarded
AUM(Rs in Crores)
AUM & Customers
Jun 17 Mar 18 Jun 18
Wealth Management Business
Transaction Banking

International Banking : Optimising Operations
• Overseas operation contribute 13.40% of total advances portfolio of Bank.
• Rationalization of Overseas Operations (from 207 offices in 35 countries currently); UK operations spun off into
a subsidiary; 10 offices to be closed
• NIM improved to 1.47%, higher share of long term loans and lower trade finance to have a positive impact
• Strategy to focus on Investment grade companies and issuers
• Advances at Overseas Offices expected to remain at around 13% of the total advances by FY19
• Gross and Net NPA down by 109 bps and 102 bps respectively at 1.42% & 0.46% as on June 2018
20
June 18% Share in
TotalJune 17
% Share in
TotalYOY Gr%
ECBs 104991 39.36 77080 27.62 36.21
Local Loans (Overseas Corporate
Credit) 93652 35.11 88007 31.53 6.41
Retail 9730 3.65 10798 3.87 -9.89
Total Long Term loans 208373 78.12 175885 63.02 18.47
Buyers’ Credit 13132 4.92 67218 24.09 -80.46
Bill Discounting 45223 16.95 35979 12.89 25.69
Total Short Term loans 58355 21.88 103197 36.98 -43.45
Total Advances 266728 100.00 279082 100.00 -4.43
Rs. In crores
21
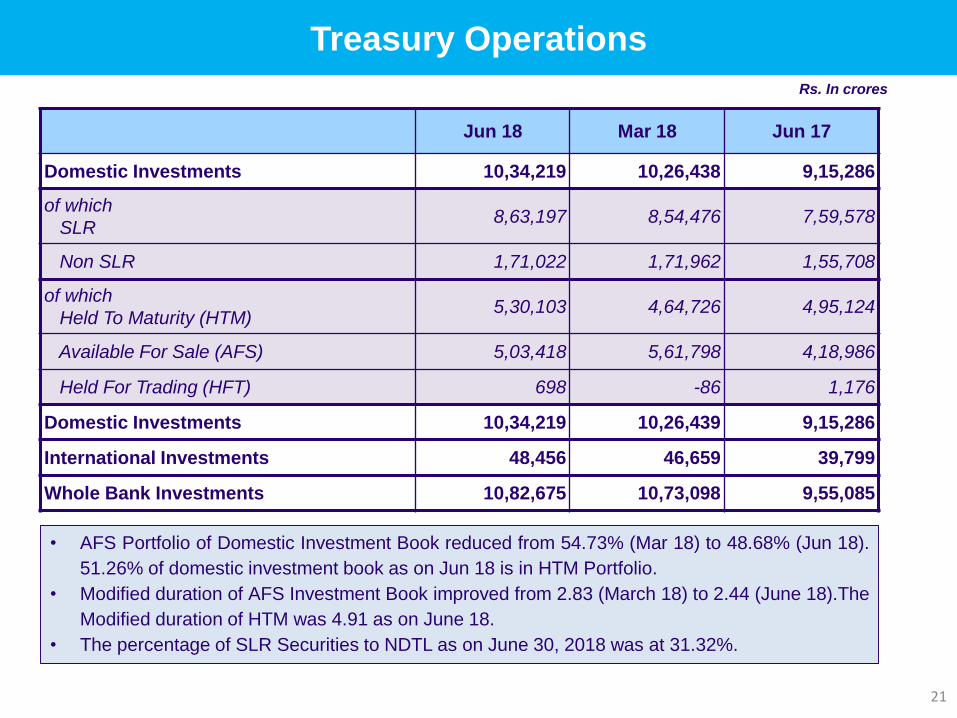
Treasury Operations
Jun 18 Mar 18 Jun 17
Domestic Investments 10,34,219 10,26,438 9,15,286
of which
SLR8,63,197 8,54,476 7,59,578
Non SLR 1,71,022 1,71,962 1,55,708
of which
Held To Maturity (HTM)5,30,103 4,64,726 4,95,124
Available For Sale (AFS) 5,03,418 5,61,798 4,18,986
Held For Trading (HFT) 698 -86 1,176
Domestic Investments 10,34,219 10,26,439 9,15,286
International Investments 48,456 46,659 39,799
Whole Bank Investments 10,82,675 10,73,098 9,55,085
• AFS Portfolio of Domestic Investment Book reduced from 54.73% (Mar 18) to 48.68% (Jun 18).
51.26% of domestic investment book as on Jun 18 is in HTM Portfolio.
• Modified duration of AFS Investment Book improved from 2.83 (March 18) to 2.44 (June 18).The
Modified duration of HTM was 4.91 as on June 18.
• The percentage of SLR Securities to NDTL as on June 30, 2018 was at 31.32%.
Rs. In crores
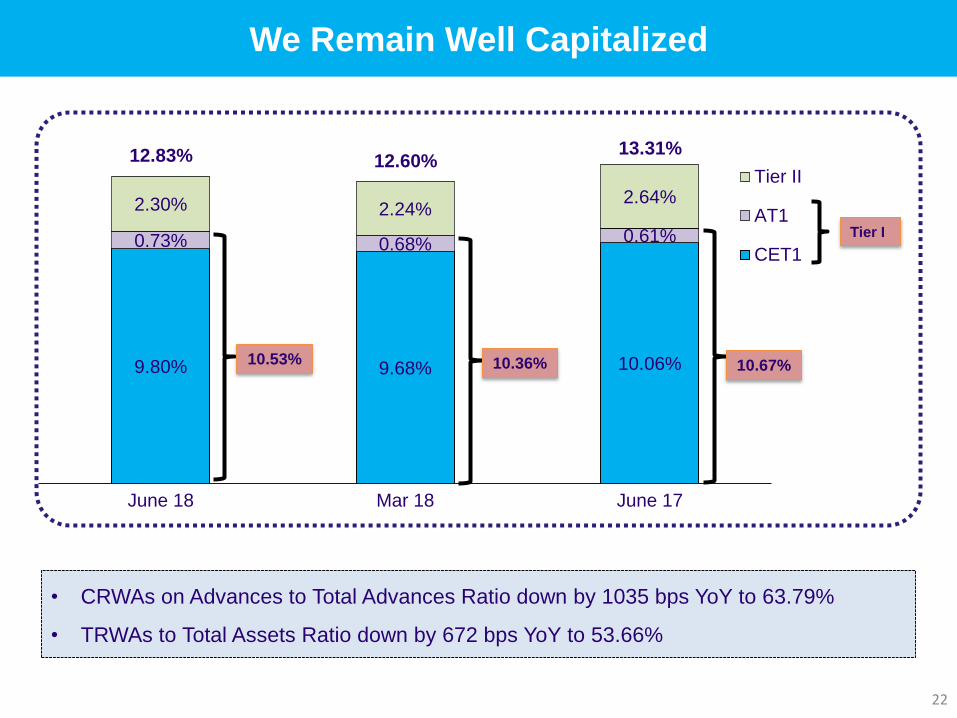
9.80% 9.68% 10.06%
0.73% 0.68% 0.61%
2.30% 2.24%2.64%
12.83% 12.60%13.31%
June 18 Mar 18 June 17
Tier II
AT1
CET1
We Remain Well Capitalized
22
10.36% 10.67%
Tier I
10.53%
• CRWAs on Advances to Total Advances Ratio down by 1035 bps YoY to 63.79%
• TRWAs to Total Assets Ratio down by 672 bps YoY to 53.66%

Asset Quality : Gross NPAs - Segment wise (1/5)
23
Rs. in Crores
Sector
Jun 18 Mar 18 Jun 17
NPA Ratio % NPA Ratio % NPA Ratio %
Agri 21830 11.60 21169 11.25 17988 9.51
Per Segment 7345 1.31 6735 1.23 7632 1.56
SME 25059 9.11 25719 9.53 30426 11.86
Large Corporate 75010 26.03
162605 21.92 125014 18.61
Corporate Client Group 79818 19.33
International 3778 1.42 7199 2.38 7009 2.51
Total 212840 10.69 223427 10.91 188069 9.97

24
Asset Quality : Movement of NPAs (2/5)
Q1FY19 FY18 Q4FY18 Q3FY18 Q2FY18 Q1FY18
Opening Level of Gross NPAs 223427 177866 199141 186115 188068 177866
Total Reductions 24936 54726 8535 13754 12581 19856
Of which: Recovery + Upgradation 14856 14530 85 4442 3323 6680
Increase in O/s 4365 5506 -849 944 1601 3810
Fresh Slippages 9984 94781 33670 25836 9026 26249
Gross Addition
(Increase in O/s + Slippages)14349 100287 32821 26780 10627 30059
Net Increase -10587 45561 24286 13026 -1954 10202
Closing Level of Gross NPAs 212840 223427 223427 199141 186115 188068
Slippage Ratio (%) 1.95 4.85 6.90 5.29 1.85 5.38
Credit cost (%) 2.55 3.62 4.93 3.64 3.42 2.48
Rs. in Crores
Recovery in AUCA 2426 5333 2113 1351 1158 712
Rs.1,930 Crores recovered by way of Interest Income
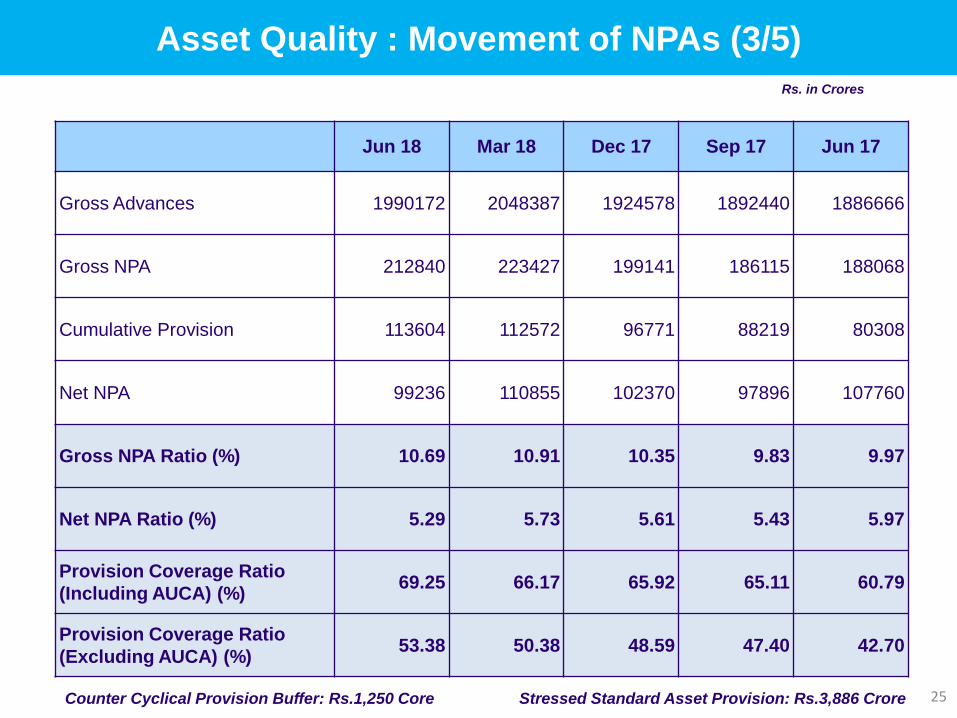
25
Asset Quality : Movement of NPAs (3/5)
Jun 18 Mar 18 Dec 17 Sep 17 Jun 17
Gross Advances 1990172 2048387 1924578 1892440 1886666
Gross NPA 212840 223427 199141 186115 188068
Cumulative Provision 113604 112572 96771 88219 80308
Net NPA 99236 110855 102370 97896 107760
Gross NPA Ratio (%) 10.69 10.91 10.35 9.83 9.97
Net NPA Ratio (%) 5.29 5.73 5.61 5.43 5.97
Provision Coverage Ratio
(Including AUCA) (%)69.25 66.17 65.92 65.11 60.79
Provision Coverage Ratio
(Excluding AUCA) (%)53.38 50.38 48.59 47.40 42.70
Rs. in Crores
Counter Cyclical Provision Buffer: Rs.1,250 Core Stressed Standard Asset Provision: Rs.3,886 Crore

10,575 10,081
4,3904,094
3,4543,428
2,662
547
4,721
4,138
3,187
2,344
As on March 2018 As on June 2018
Watchlist and SMA 1 & 2 outside Watchlist
Power Roads & EPC Iron & Steel Textile Others SMA 1 & 2 outside watchlist
492
288 29
2,015
880
Total Corporate Slippages
Sectorwise Break-up
3,704
3,386
318
Total Slippages
Corporate Slippages Break-up
Watchlist Others
3,704
Asset Quality- 91% of Corporate slippages from Watchlist (4/5)
Rs. in Crores
26
25,802
22,289
% of Advances
Watchlist
1.42% 1.24%
SMA 1 & 2
outside watchlist
24,633
28,989
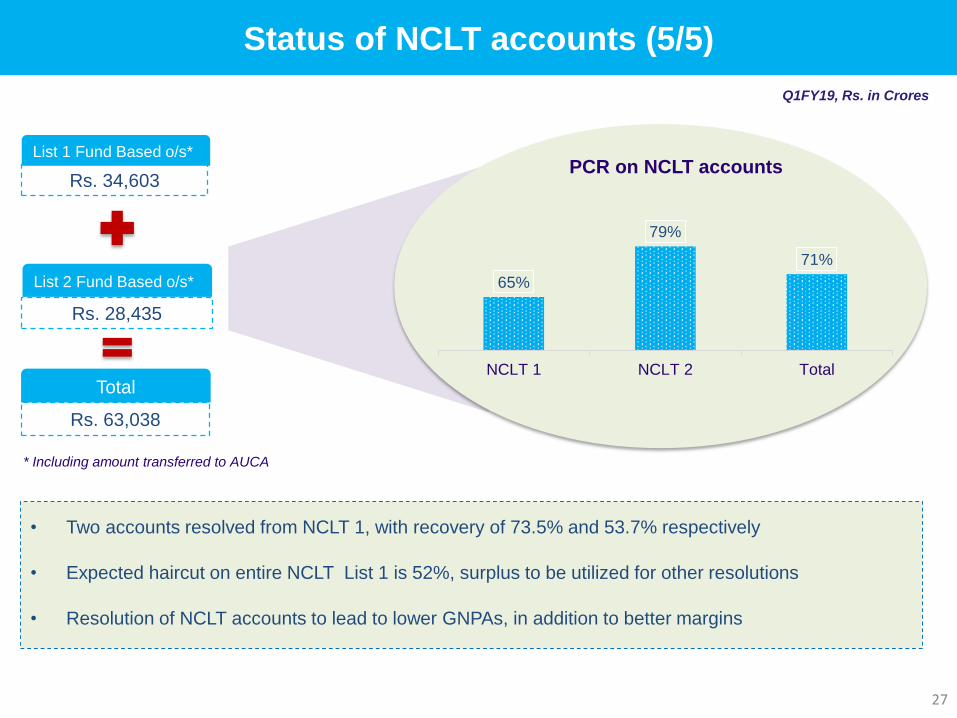
Status of NCLT accounts (5/5)
Rs. 34,603
List 1 Fund Based o/s*
Rs. 28,435
List 2 Fund Based o/s* 65%
79%
71%
NCLT 1 NCLT 2 Total
PCR on NCLT accounts
• Two accounts resolved from NCLT 1, with recovery of 73.5% and 53.7% respectively
• Expected haircut on entire NCLT List 1 is 52%, surplus to be utilized for other resolutions
• Resolution of NCLT accounts to lead to lower GNPAs, in addition to better margins
Q1FY19, Rs. in Crores
Rs. 63,038
Total
* Including amount transferred to AUCA
27

28
Digital Banking

Channel and Digital Strategy
29
• Customer Experience Excellence Program (CEEP): implemented in 5,426 branches; process changes, tech –
enablement and reduced wait time for enhanced customer experience.
• No. of ATMs: 59,783; Market share in Debit Card spends is 30.51%
• Top acquirer in the country with 6.23 lakh PoS terminals; Market share at 19.05%
Share of Transactions (%)
ATM / CDM
Branch
Jun 18
Mobile Banking
Internet Banking 21
2
33
18
POS 16
82
Jun 17
20
2
33
23
1339
77
35
BC channel 10 9

Digital & e-Commerce
30
• Financial Super Store – SBI Life, SBI Cards, SBI MF, SBI Cap Sec and SBI General Insurance live on
YONO
• Online Market Place – 84 partners live on YONO in 19 categories
*Collaboration with Jio for pre loaded YONO to accelerate digital adoption
59,783
58,163
22,428
Customer Touch Points
No. of ATM/ CDMs No. of BC outlets
No. of Branches
1,13,000
2,32,191
5,26,873
6,23,1136,47,000
BHIM Merchants Bharat QR BHIM-Aadhaar-SBI SBI POS SBI Pay
21.4 lakh Merchant Payment Acceptance Touch Points
5,08,74,000
1,17,20,000
No. of InternetBanking users
No. of MobileBanking users
As on Jun 18
• Gaining Momentum:
• Downloads – 83.3 lakhs;
• Logins – more than 2.50 lakhs per day
• No. of Trxns – 24.91 lakhs; Value of Trxns – 9552.12 Cr since launch
• SB Accounts opened since launch crossed 1 Million mark.
• No of A/cs opened per day crossed 27K
• Pre-approved Personal Loans – >10k Loans of Rs.65.6 Cr disbursed
• Yono has already won three prestigious awards
1,40,374

Accolades & Social Media Leadership
31
Platform Status Rank Comments
165 Lakh
1Highest number of followers across all banks in
the world 34 Lakh
1963 Lakh Views
1.40 Lakh Subscribers2
Second highest views across all banks in the
world
7.29 Lakh
1Highest number of followers across All Indian
Banks4200
8300
5.40 Lakhs 2Second Highest number of followers across all
Indian banks
Brand Finance, UK ranks SBI as the 2nd Most Reputable Banking Brand in the world
Awards for YONO :
• Asian Banking & Finance Retail Banking Awards: ‘Mobile Initiative of the year’
• Indian Express Award 2018 for ‘Enterprise Mobility’
• ET-Now BFSI Award 2018: ‘Bank with Best Customer Orientation’
The Best Transaction Bank in India by The Asian Banker for the year 2017-18
32
Financial Inclusion
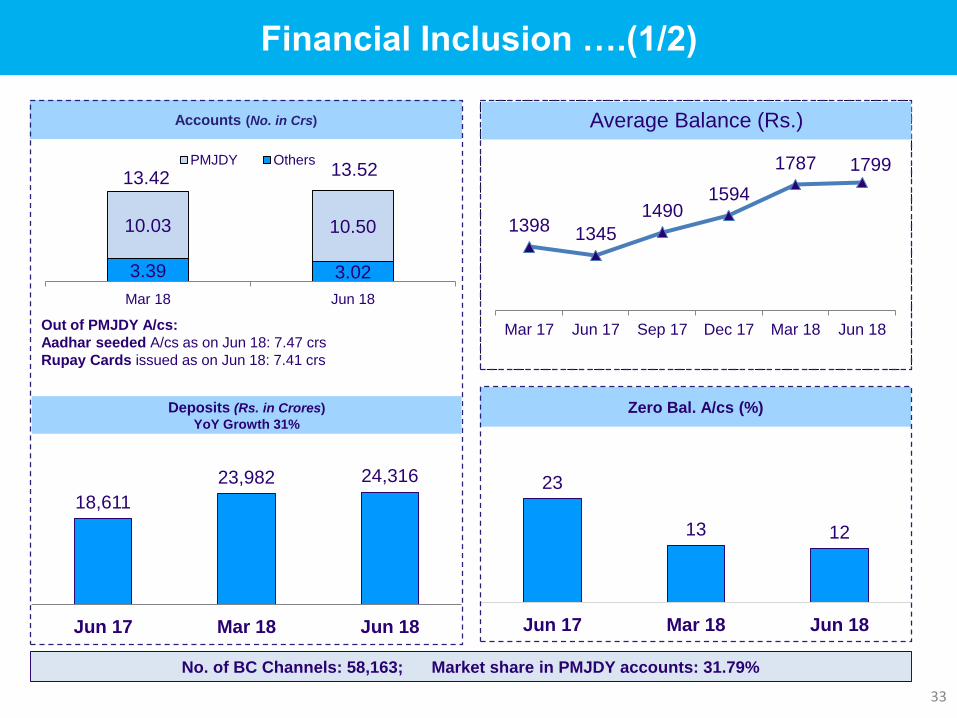
Financial Inclusion ….(1/2)
3.39 3.02
10.03 10.50
Mar 18 Jun 18
PMJDY Others
Accounts (No. in Crs)
13.42
18,611
23,982 24,316
Jun 17 Mar 18 Jun 18
Out of PMJDY A/cs:
Aadhar seeded A/cs as on Jun 18: 7.47 crs
Rupay Cards issued as on Jun 18: 7.41 crs
Deposits (Rs. in Crores)
YoY Growth 31%
33
1398 1345
14901594
1787 1799
Mar 17 Jun 17 Sep 17 Dec 17 Mar 18 Jun 18
23
13 12
Jun 17 Mar 18 Jun 18
Zero Bal. A/cs (%)
No. of BC Channels: 58,163; Market share in PMJDY accounts: 31.79%
13.52
Average Balance (Rs.)

Financial Inclusion ….(2/2)
Social Security Schemes
No. of Beneficiary (In Lakhs)
Pradhan Mantri Suraksha Bima
Yojana157.64
Pradhan Mantri Jeevan Jyoti Bima
Yojana39.78
Atal Pension Yojana 13.64
OD facility for PMJDY accounts - Eligible accounts 20.46 lakh; Sanctioned 10.27 lakh accounts (50.20%)
34
29,963
39,061
Q1FY18 Q1FY19
Transactions Amount (Rs. in Crores)
Financial Literacy
Rural Self Employment Training
Institute RSETIs
(Total Numbers: 151)
Cumulative
(Since 2011)
No of Training Programmes held 23,780
No of Youth trained 6,34,172
Number of Youth Settled 4,26,703
Financial Literacy Centers (FLC)
(Total numbers: 336)
No of Out door activities 84,823
No of Persons provided FLC
Services 60,04,423
30.36%

35
Subsidiaries
36
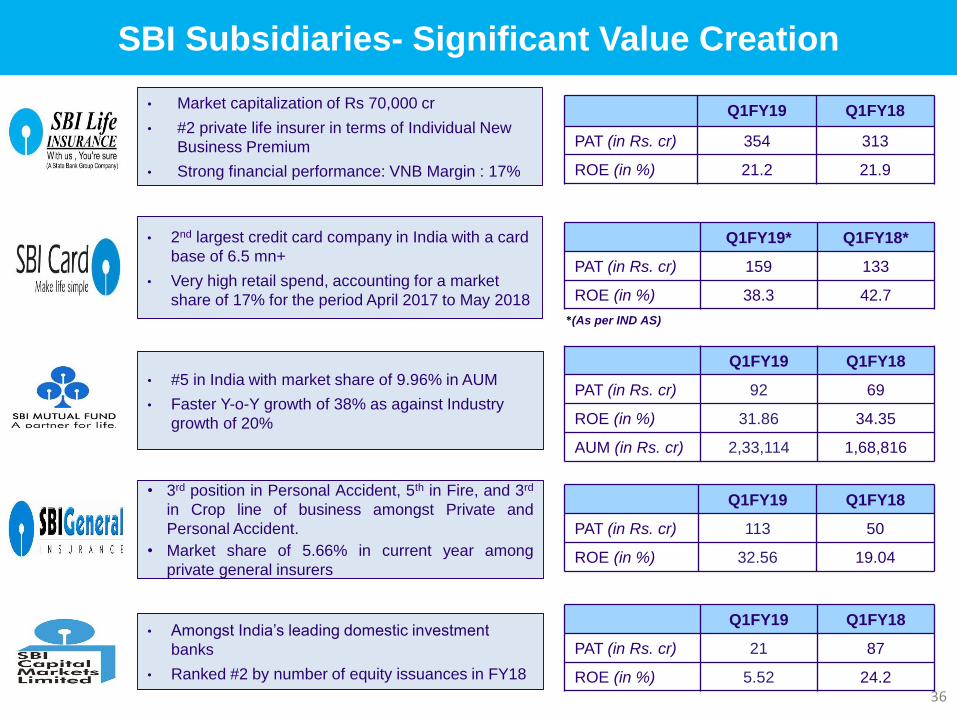
SBI Subsidiaries- Significant Value Creation
Q1FY19 Q1FY18
PAT (in Rs. cr) 354 313
ROE (in %) 21.2 21.9
Q1FY19* Q1FY18*
PAT (in Rs. cr) 159 133
ROE (in %) 38.3 42.7
• 2nd largest credit card company in India with a card
base of 6.5 mn+
• Very high retail spend, accounting for a market
share of 17% for the period April 2017 to May 2018
Q1FY19 Q1FY18
PAT (in Rs. cr) 92 69
ROE (in %) 31.86 34.35
AUM (in Rs. cr) 2,33,114 1,68,816
• #5 in India with market share of 9.96% in AUM
• Faster Y-o-Y growth of 38% as against Industry
growth of 20%
• Market capitalization of Rs 70,000 cr
• #2 private life insurer in terms of Individual New
Business Premium
• Strong financial performance: VNB Margin : 17%
• 3rd position in Personal Accident, 5th in Fire, and 3rd
in Crop line of business amongst Private and
Personal Accident.
• Market share of 5.66% in current year among
private general insurers
• Amongst India’s leading domestic investment
banks
• Ranked #2 by number of equity issuances in FY18
Q1FY19 Q1FY18
PAT (in Rs. cr) 113 50
ROE (in %) 32.56 19.04
Q1FY19 Q1FY18
PAT (in Rs. cr) 21 87
ROE (in %) 5.52 24.2
*(As per IND AS)

37
Balance Sheet
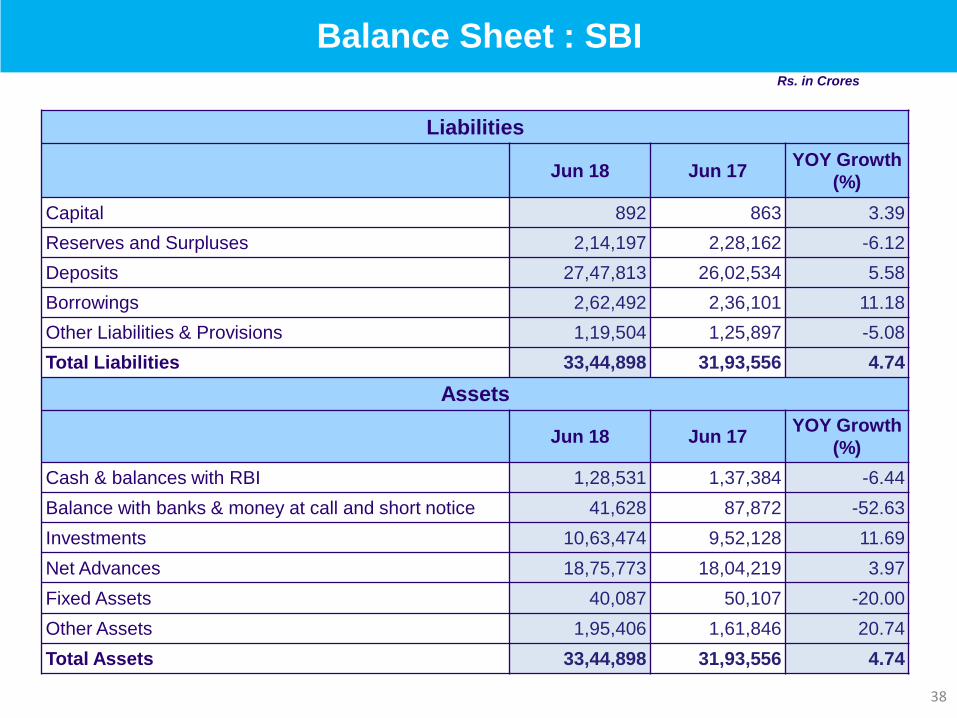
Balance Sheet : SBIRs. in Crores
38
Liabilities
Jun 18 Jun 17YOY Growth
(%)
Capital 892 863 3.39
Reserves and Surpluses 2,14,197 2,28,162 -6.12
Deposits 27,47,813 26,02,534 5.58
Borrowings 2,62,492 2,36,101 11.18
Other Liabilities & Provisions 1,19,504 1,25,897 -5.08
Total Liabilities 33,44,898 31,93,556 4.74
Assets
Jun 18 Jun 17YOY Growth
(%)
Cash & balances with RBI 1,28,531 1,37,384 -6.44
Balance with banks & money at call and short notice 41,628 87,872 -52.63
Investments 10,63,474 9,52,128 11.69
Net Advances 18,75,773 18,04,219 3.97
Fixed Assets 40,087 50,107 -20.00
Other Assets 1,95,406 1,61,846 20.74
Total Assets 33,44,898 31,93,556 4.74

Balance Sheet : SBI Consolidated
Liabilities
Jun 18 Jun 17YOY Growth
(%)
Capital 892 863 3.39
Reserves and Surplus 2,25,913 2,38,539 -5.29
Minority Interest 4,842 3,767 28.53
Deposits 27,77,893 26,18,464 6.09
Borrowings 2,71,145 2,42,688 11.73
Other Liabilities & Provisions 2,44,529 2,30,392 6.14
Total Liabilities 35,25,214 33,34,713 5.71
Assets
Jun 18 Jun 17YOY Growth
(%)
Cash & balances with RBI 1,28,770 1,37,598 -6.42
Balance with Banks & Money at Call and Short Notice 44,494 90,176 -50.66
Investments 11,94,317 10,52,897 13.43
Net Advances 19,12,596 18,34,700 4.25
Fixed Assets 41,394 51,183 -19.12
Other Assets 2,03,642 1,68,158 21.10
Total Assets 35,25,214 33,34,713 5.71
Rs. in Crores
39

40
Rs. In crores
Rs. In crores
SBI Group Financials – Q1FY19
Year Ended Growth (%)
Q1FY19 Q1FY18 YoY
Interest Earned 61,201 56,819 7.71
Non-Interest Income 13,793 13,958 -1.18
Total Income 74,993 70,777 5.96
Interest Expended 37,272 37,495 -0.60
Operating Expenses(i+ii) 24,287 19,864 22.26
(i) Employee Cost 10,346 8,217 25.91
(ii) Other Operating Expenses 13,940 11,647 19.69
Total Expenditure 61,559 57,359 7.32
Operating Profit 13,434 13,417 0.13
Provisions (other than Tax) 19,499 9,051 115.43
--of which Loan loss provisions 13,215 12,228 8.07
Add: Share profit of associates 83 87 -4.65
Less: Minority Interest 257 160
Tax Expenses -2,008 1,261
Net Profit after Minority Interest -4,230 3,032
41
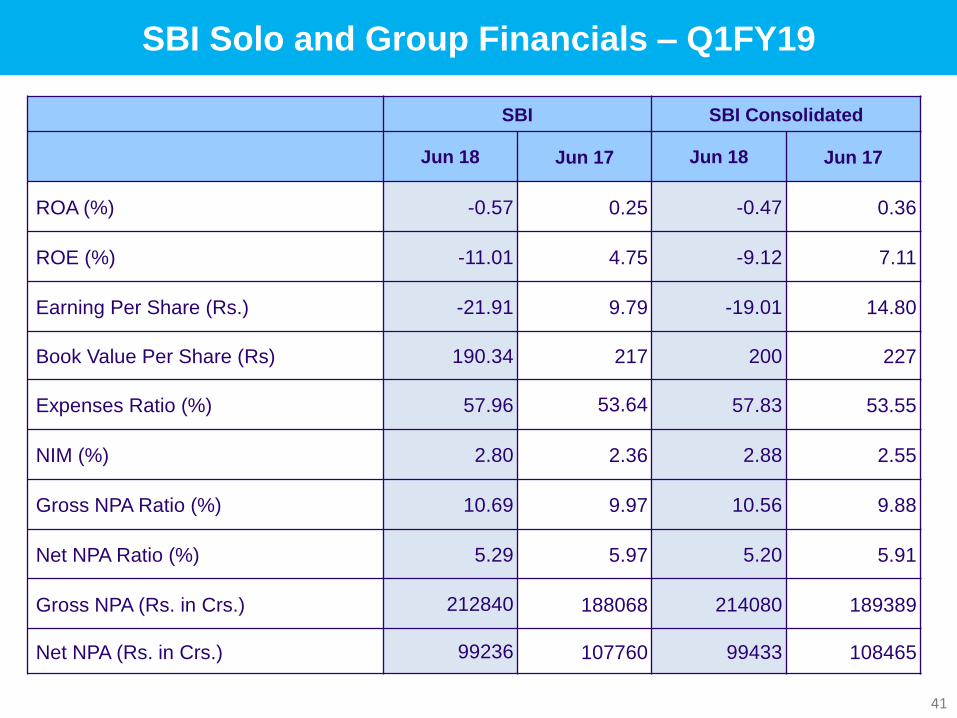
SBI SBI Consolidated
Jun 18 Jun 17 Jun 18 Jun 17
ROA (%) -0.57 0.25 -0.47 0.36
ROE (%) -11.01 4.75 -9.12 7.11
Earning Per Share (Rs.) -21.91 9.79 -19.01 14.80
Book Value Per Share (Rs) 190.34 217 200 227
Expenses Ratio (%) 57.96 53.64 57.83 53.55
NIM (%) 2.80 2.36 2.88 2.55
Gross NPA Ratio (%) 10.69 9.97 10.56 9.88
Net NPA Ratio (%) 5.29 5.97 5.20 5.91
Gross NPA (Rs. in Crs.) 212840 188068 214080 189389
Net NPA (Rs. in Crs.) 99236 107760 99433 108465
SBI Solo and Group Financials – Q1FY19

Thank You