angola towards an energy strategy
TRANSCRIPT

ANGOLA Towards
an EnergyStrategy
I N T E R N A T I O N A L E N E R G Y A G E N C Y
Warning: Please note that this PDF is subject to specific restrictions that
limit its use and distribution. The terms and conditions are available online at
www.iea.org/w/bookshop/pricing.html
INTERNATIONAL ENERGY AGENCY
The International Energy Agency (IEA) is an autonomous body which was established inNovember 1974 within the framework of the Organisation for Economic Co-operation andDevelopment (OECD) to implement an international energy programme.
It carries out a comprehensive programme of energy co-operation among twenty-six of theOECD’s thirty member countries. The basic aims of the IEA are:
• To maintain and improve systems for coping with oil supply disruptions.• To promote rational energy policies in a global context through co-operative relations with
non-member countries, industry and international organisations.• To operate a permanent information system on the international oil market.• To improve the world’s energy supply and demand structure by developing alternative
energy sources and increasing the efficiency of energy use.• To assist in the integration of environmental and energy policies.
The IEA member countries are: Australia, Austria, Belgium, Canada, the Czech Republic,Denmark, Finland, France, Germany, Greece, Hungary, Ireland, Italy, Japan, the Republic ofKorea, Luxembourg, the Netherlands, New Zealand, Norway, Portugal, Spain, Sweden,Switzerland, Turkey, the United Kingdom and the United States. The European Commissiontakes part in the work of the IEA.
ORGANISATION FOR ECONOMIC CO-OPERATION AND DEVELOPMENT
The OECD is a unique forum where the governments of thirty democracies work together toaddress the economic, social and environmental challenges of globalisation. The OECD is alsoat the forefront of efforts to understand and to help governments respond to new developmentsand concerns, such as corporate governance, the information economy and the challenges ofan ageing population. The Organisation provides a setting where governments can comparepolicy experiences, seek answers to common problems, identify good practice and work to co-ordinate domestic and international policies.
The OECD member countries are: Australia, Austria, Belgium, Canada, the Czech Republic,Denmark, Finland, France, Germany, Greece, Hungary, Iceland, Ireland, Italy, Japan, Korea,Luxembourg, Mexico, the Netherlands, New Zealand, Norway, Poland, Portugal, the SlovakRepublic, Spain, Sweden, Switzerland, Turkey, the United Kingdom and the United States.The European Commission takes part in the work of the OECD.
© OECD/IEA, 2006
No reproduction, copy, transmission or translation of this publication may be madewithout written permission. Applications should be sent to:
International Energy Agency (IEA), Head of Publications Service,9 rue de la Fédération, 75739 Paris Cedex 15, France.
218590_p001-028_debut.indd 2218590_p001-028_debut.indd 2 21/09/06 11:30:3821/09/06 11:30:38
TABLE OF CONTENTS
INTRODUCTION . . . . . . . . . . . . . . . . . . . . . . . . . . . . . . . . . . . . . 11Survey team . . . . . . . . . . . . . . . . . . . . . . . . . . . . . . . . . . . . . . . . . . . 11Stakeholder interviews . . . . . . . . . . . . . . . . . . . . . . . . . . . . . . . . . . . . . 12
EXECUTIVE SUMMARY AND RECOMMENDATIONS . . . . . 15 Introduction and objective . . . . . . . . . . . . . . . . . . . . . . . . . . . . . . . . . . 15Context . . . . . . . . . . . . . . . . . . . . . . . . . . . . . . . . . . . . . . . . . . . . . . 15Overview of energy sub-sectors and cross-cutting issues . . . . . . . . . . . . . . . 17
Electricity . . . . . . . . . . . . . . . . . . . . . . . . . . . . . . . . . . . . . . . . . . 17Upstream oil . . . . . . . . . . . . . . . . . . . . . . . . . . . . . . . . . . . . . . . . 19Downstream oil . . . . . . . . . . . . . . . . . . . . . . . . . . . . . . . . . . . . . . 19Gas . . . . . . . . . . . . . . . . . . . . . . . . . . . . . . . . . . . . . . . . . . . . . . 20Biomass . . . . . . . . . . . . . . . . . . . . . . . . . . . . . . . . . . . . . . . . . . . 20
Priority recommendations . . . . . . . . . . . . . . . . . . . . . . . . . . . . . . . . . . 21Electricity: improve collection before raising tariffs . . . . . . . . . . . . . . . . 21Electricity: improve information and metering systems . . . . . . . . . . . . . 22Upstream oil: continue efforts to fully implement new Petroleum Law . . . 22Upstream oil: continue efforts to improve transparency of oil revenues . . . 22Downstream oil: continue to liberalise product prices . . . . . . . . . . . . . . 23Downstream oil: clarify regulatory framework for competitive oil product distribution . . . . . . . . . . . . . . . . . . . . . . . . . . . . . . . . . . . . . . . . . 23Downstream oil: prioritise investments in transportation and storage infrastructure . . . . . . . . . . . . . . . . . . . . . . . . . . . . . . . . . . . . . . . . 23Gas: clarify gas development strategy and investment framework . . . . . . . 24Gas: continue efforts to reduce fl aring . . . . . . . . . . . . . . . . . . . . . . . . 24Biomass: address biomass within wider framework of household energy needs . . . . . . . . . . . . . . . . . . . . . . . . . . . . . . . . . . . . . . . . . . . . . 24Statistics: improve capability to collect and disseminate relevant energy statistics and other socio-economic data . . . . . . . . . . . . . . . . . . . . . . . 25
Additional recommendations . . . . . . . . . . . . . . . . . . . . . . . . . . . . . . . . 25Electricity . . . . . . . . . . . . . . . . . . . . . . . . . . . . . . . . . . . . . . . . . . 25Upstream oil . . . . . . . . . . . . . . . . . . . . . . . . . . . . . . . . . . . . . . . . 27Downstream oil . . . . . . . . . . . . . . . . . . . . . . . . . . . . . . . . . . . . . . 27Gas . . . . . . . . . . . . . . . . . . . . . . . . . . . . . . . . . . . . . . . . . . . . . . 27Cross-cutting issues . . . . . . . . . . . . . . . . . . . . . . . . . . . . . . . . . . . . 28
TABLE OF CONTENTS - 3
218590_p001-028_debut.indd 3218590_p001-028_debut.indd 3 21/09/06 11:30:3821/09/06 11:30:38
© O
ECD
/IEA
, 200
6

4 - TABLE OF CONTENTS
I. ECONOMIC CONTEXT . . . . . . . . . . . . . . . . . . . . . . . . . . . . . . . 29
Recent economic developments . . . . . . . . . . . . . . . . . . . . . . . . . . . . . . . 30Macroeconomic policies . . . . . . . . . . . . . . . . . . . . . . . . . . . . . . . . . . . . 33
Fiscal and monetary policy . . . . . . . . . . . . . . . . . . . . . . . . . . . . . . . 33External position . . . . . . . . . . . . . . . . . . . . . . . . . . . . . . . . . . . . . . 35
Structural issues . . . . . . . . . . . . . . . . . . . . . . . . . . . . . . . . . . . . . . . . . 37Political and social context . . . . . . . . . . . . . . . . . . . . . . . . . . . . . . . . . . 40
II. ELECTRICITY . . . . . . . . . . . . . . . . . . . . . . . . . . . . . . . . . . . . . . . . 41
Overview of sector . . . . . . . . . . . . . . . . . . . . . . . . . . . . . . . . . . . . . . . 41Main actors . . . . . . . . . . . . . . . . . . . . . . . . . . . . . . . . . . . . . . . . . . . . 43Sector policy . . . . . . . . . . . . . . . . . . . . . . . . . . . . . . . . . . . . . . . . . . . 44
Restructuring plans . . . . . . . . . . . . . . . . . . . . . . . . . . . . . . . . . . . . 45Legal framework . . . . . . . . . . . . . . . . . . . . . . . . . . . . . . . . . . . . . . . . 46Regulation . . . . . . . . . . . . . . . . . . . . . . . . . . . . . . . . . . . . . . . . . . . . 46
Tariff-setting . . . . . . . . . . . . . . . . . . . . . . . . . . . . . . . . . . . . . . . . 47Concessions and licences . . . . . . . . . . . . . . . . . . . . . . . . . . . . . . . . . 48
Generation capacity . . . . . . . . . . . . . . . . . . . . . . . . . . . . . . . . . . . . . . 48Generating capacity connected to the three main grids . . . . . . . . . . . . . 50Generating capacity of the isolated grids . . . . . . . . . . . . . . . . . . . . . . 51Self-generation . . . . . . . . . . . . . . . . . . . . . . . . . . . . . . . . . . . . . . . 52Hydro potential . . . . . . . . . . . . . . . . . . . . . . . . . . . . . . . . . . . . . . 52Solar . . . . . . . . . . . . . . . . . . . . . . . . . . . . . . . . . . . . . . . . . . . . . . 53
Transmission . . . . . . . . . . . . . . . . . . . . . . . . . . . . . . . . . . . . . . . . . . . 54Distribution . . . . . . . . . . . . . . . . . . . . . . . . . . . . . . . . . . . . . . . . . . . 54
Luanda . . . . . . . . . . . . . . . . . . . . . . . . . . . . . . . . . . . . . . . . . . . . 55Outside Luanda. . . . . . . . . . . . . . . . . . . . . . . . . . . . . . . . . . . . . . . 56
Production, consumption and losses . . . . . . . . . . . . . . . . . . . . . . . . . . . . 57Production . . . . . . . . . . . . . . . . . . . . . . . . . . . . . . . . . . . . . . . . . . 57Consumption and losses . . . . . . . . . . . . . . . . . . . . . . . . . . . . . . . . . 58Future production and consumption . . . . . . . . . . . . . . . . . . . . . . . . . 59
Access to electricity . . . . . . . . . . . . . . . . . . . . . . . . . . . . . . . . . . . . . . 60Informal urban and peri-urban networks . . . . . . . . . . . . . . . . . . . . . . 61Rural electrifi cation . . . . . . . . . . . . . . . . . . . . . . . . . . . . . . . . . . . . 62
Billing and collection . . . . . . . . . . . . . . . . . . . . . . . . . . . . . . . . . . . . . 64Tariffs, costs and subsidies . . . . . . . . . . . . . . . . . . . . . . . . . . . . . . . . . . 67
Tariff policy . . . . . . . . . . . . . . . . . . . . . . . . . . . . . . . . . . . . . . . . . 67Setting the tariff . . . . . . . . . . . . . . . . . . . . . . . . . . . . . . . . . . . . . . 67Costs . . . . . . . . . . . . . . . . . . . . . . . . . . . . . . . . . . . . . . . . . . . . . 68Subsidies . . . . . . . . . . . . . . . . . . . . . . . . . . . . . . . . . . . . . . . . . . . 69
Information systems and metering . . . . . . . . . . . . . . . . . . . . . . . . . . . . . 69Sector design and operating practices . . . . . . . . . . . . . . . . . . . . . . . . . . . 70Investment plans . . . . . . . . . . . . . . . . . . . . . . . . . . . . . . . . . . . . . . . . 71Human resources . . . . . . . . . . . . . . . . . . . . . . . . . . . . . . . . . . . . . . . . 73
218590_p001-028_debut.indd 4218590_p001-028_debut.indd 4 21/09/06 11:30:3921/09/06 11:30:39
© O
ECD
/IEA
, 200
6
TABLE OF CONTENTS - 5
Regional interconnections and trade . . . . . . . . . . . . . . . . . . . . . . . . . . . . 76Western Corridor project . . . . . . . . . . . . . . . . . . . . . . . . . . . . . . . . 77Joint hydro-power development with Namibia . . . . . . . . . . . . . . . . . . 78
Energy effi ciency . . . . . . . . . . . . . . . . . . . . . . . . . . . . . . . . . . . . . . . . 78Environment . . . . . . . . . . . . . . . . . . . . . . . . . . . . . . . . . . . . . . . . . . . 79
III. UPSTREAM OIL . . . . . . . . . . . . . . . . . . . . . . . . . . . . . . . . . . . . . . 81
Overview . . . . . . . . . . . . . . . . . . . . . . . . . . . . . . . . . . . . . . . . . . . . . 81Main actors in the sector: industry structure . . . . . . . . . . . . . . . . . . . . . . . 82
The Ministry of Petroleum . . . . . . . . . . . . . . . . . . . . . . . . . . . . . . . 82Sonangol . . . . . . . . . . . . . . . . . . . . . . . . . . . . . . . . . . . . . . . . . . . 82International oil companies . . . . . . . . . . . . . . . . . . . . . . . . . . . . . . . 84Sonangol’s multiple roles. . . . . . . . . . . . . . . . . . . . . . . . . . . . . . . . . 84
Reserves, production and forecasts . . . . . . . . . . . . . . . . . . . . . . . . . . . . . 88Onshore production . . . . . . . . . . . . . . . . . . . . . . . . . . . . . . . . . . . . 89Offshore production . . . . . . . . . . . . . . . . . . . . . . . . . . . . . . . . . . . . 90Offshore exploration . . . . . . . . . . . . . . . . . . . . . . . . . . . . . . . . . . . 92
Technology issues . . . . . . . . . . . . . . . . . . . . . . . . . . . . . . . . . . . . . . . . 94Oil storage and logistics . . . . . . . . . . . . . . . . . . . . . . . . . . . . . . . . . . . 96Oil exports and pricing . . . . . . . . . . . . . . . . . . . . . . . . . . . . . . . . . . . . 97Tax regime . . . . . . . . . . . . . . . . . . . . . . . . . . . . . . . . . . . . . . . . . . . . 100Oil revenues . . . . . . . . . . . . . . . . . . . . . . . . . . . . . . . . . . . . . . . . . . . 101
Legislative and regulatory framework, including main contract provisions . 103 Environment . . . . . . . . . . . . . . . . . . . . . . . . . . . . . . . . . . . . . . . . . . 104Energy data . . . . . . . . . . . . . . . . . . . . . . . . . . . . . . . . . . . . . . . . . . . . 105Oil services industry . . . . . . . . . . . . . . . . . . . . . . . . . . . . . . . . . . . . . . 105Corporate social responsibility . . . . . . . . . . . . . . . . . . . . . . . . . . . . . . . 105Local content: «Angolanisation» . . . . . . . . . . . . . . . . . . . . . . . . . . . . . . 106
IV. DOWNSTREAM OIL . . . . . . . . . . . . . . . . . . . . . . . . . . . . . . . . . . 111
Overview . . . . . . . . . . . . . . . . . . . . . . . . . . . . . . . . . . . . . . . . . . . . . 111Main actors in the sector . . . . . . . . . . . . . . . . . . . . . . . . . . . . . . . . . . . 113Legislative and regulatory base . . . . . . . . . . . . . . . . . . . . . . . . . . . . . . . 113Overview of production, trade and consumption . . . . . . . . . . . . . . . . . . . . 114Refi ning . . . . . . . . . . . . . . . . . . . . . . . . . . . . . . . . . . . . . . . . . . . . . . 115
Luanda refi nery . . . . . . . . . . . . . . . . . . . . . . . . . . . . . . . . . . . . . . 115Proposed refi nery for Lobito . . . . . . . . . . . . . . . . . . . . . . . . . . . . . . . 116Cabinda topping plant . . . . . . . . . . . . . . . . . . . . . . . . . . . . . . . . . . 118Lubricants . . . . . . . . . . . . . . . . . . . . . . . . . . . . . . . . . . . . . . . . . . 118
Trade in refi ned products . . . . . . . . . . . . . . . . . . . . . . . . . . . . . . . . . . . 118Exports . . . . . . . . . . . . . . . . . . . . . . . . . . . . . . . . . . . . . . . . . . . . 118Imports . . . . . . . . . . . . . . . . . . . . . . . . . . . . . . . . . . . . . . . . . . . . 119
Consumption . . . . . . . . . . . . . . . . . . . . . . . . . . . . . . . . . . . . . . . . . . 119
218590_p001-028_debut.indd 5218590_p001-028_debut.indd 5 21/09/06 11:30:3921/09/06 11:30:39
© O
ECD
/IEA
, 200
6

6 - TABLE OF CONTENTS
Prices and subsidies . . . . . . . . . . . . . . . . . . . . . . . . . . . . . . . . . . . . . . 122Product distribution . . . . . . . . . . . . . . . . . . . . . . . . . . . . . . . . . . . . . . 123
Sonangalp . . . . . . . . . . . . . . . . . . . . . . . . . . . . . . . . . . . . . . . . . . 126Liberalisation plans . . . . . . . . . . . . . . . . . . . . . . . . . . . . . . . . . . . . 127
V. GAS . . . . . . . . . . . . . . . . . . . . . . . . . . . . . . . . . . . . . . . . . . . . . . . 129
Overview . . . . . . . . . . . . . . . . . . . . . . . . . . . . . . . . . . . . . . . . . . . . . 129Main actors in the sector . . . . . . . . . . . . . . . . . . . . . . . . . . . . . . . . . . . 129Resource base, current production and use . . . . . . . . . . . . . . . . . . . . . . . . 130
Flaring . . . . . . . . . . . . . . . . . . . . . . . . . . . . . . . . . . . . . . . . . . . . 131Main barriers to the development of a gas industry . . . . . . . . . . . . . . . . . . 133Policy, legislative and regulatory base . . . . . . . . . . . . . . . . . . . . . . . . . . . 134Angola LNG project . . . . . . . . . . . . . . . . . . . . . . . . . . . . . . . . . . . . . . 135Other potential domestic markets for gas . . . . . . . . . . . . . . . . . . . . . . . . . 137
Power sector . . . . . . . . . . . . . . . . . . . . . . . . . . . . . . . . . . . . . . . . . 138Aluminium smelter . . . . . . . . . . . . . . . . . . . . . . . . . . . . . . . . . . . . 138Ammonia/urea plant . . . . . . . . . . . . . . . . . . . . . . . . . . . . . . . . . . . 138Refi nery . . . . . . . . . . . . . . . . . . . . . . . . . . . . . . . . . . . . . . . . . . . 138Cement plant . . . . . . . . . . . . . . . . . . . . . . . . . . . . . . . . . . . . . . . . 138Conclusion on additional markets . . . . . . . . . . . . . . . . . . . . . . . . . . . 139
VI. BIOMASS . . . . . . . . . . . . . . . . . . . . . . . . . . . . . . . . . . . . . . . . . . 141
Overview . . . . . . . . . . . . . . . . . . . . . . . . . . . . . . . . . . . . . . . . . . . . . 141Biomass resources in Angola . . . . . . . . . . . . . . . . . . . . . . . . . . . . . . . . . 142How biomass is used . . . . . . . . . . . . . . . . . . . . . . . . . . . . . . . . . . . . . . 143
Charcoal production . . . . . . . . . . . . . . . . . . . . . . . . . . . . . . . . . . . . 144Demand for biomass . . . . . . . . . . . . . . . . . . . . . . . . . . . . . . . . . . . 146Biomass cookstoves in Angola . . . . . . . . . . . . . . . . . . . . . . . . . . . . . 146Biomass, health and gender . . . . . . . . . . . . . . . . . . . . . . . . . . . . . . . 147The transition to modern fuels . . . . . . . . . . . . . . . . . . . . . . . . . . . . . 148
Government policy and regulation . . . . . . . . . . . . . . . . . . . . . . . . . . . . . 151
VII. CROSS-CUTTING ISSUES . . . . . . . . . . . . . . . . . . . . . . . . . . . . . 155
Overview . . . . . . . . . . . . . . . . . . . . . . . . . . . . . . . . . . . . . . . . . . . . . 155Energy statistics . . . . . . . . . . . . . . . . . . . . . . . . . . . . . . . . . . . . . . 155Energy and the environment . . . . . . . . . . . . . . . . . . . . . . . . . . . . . . 156Government institutions and policies . . . . . . . . . . . . . . . . . . . . . . . . . 156Unsustainable biomass use . . . . . . . . . . . . . . . . . . . . . . . . . . . . . . . 157Flaring . . . . . . . . . . . . . . . . . . . . . . . . . . . . . . . . . . . . . . . . . . . . 157Environmental impact assessments . . . . . . . . . . . . . . . . . . . . . . . . . . 157
Household energy use . . . . . . . . . . . . . . . . . . . . . . . . . . . . . . . . . . . . . 159Overview . . . . . . . . . . . . . . . . . . . . . . . . . . . . . . . . . . . . . . . . . . . 159Household energy demand and supply . . . . . . . . . . . . . . . . . . . . . . . . 159Government policy . . . . . . . . . . . . . . . . . . . . . . . . . . . . . . . . . . . . 162
218590_p001-028_debut.indd 6218590_p001-028_debut.indd 6 21/09/06 11:30:3921/09/06 11:30:39
© O
ECD
/IEA
, 200
6
TABLE OF CONTENTS - 7
ANNEXES
1 Key statistical data . . . . . . . . . . . . . . . . . . . . . . . . . . . . . . . . . . . . . . . 165
2 Glossary and list of abbreviations . . . . . . . . . . . . . . . . . . . . . . . . . . . . . . 167
LIST OF FIGURES
1 Links between energy and poverty . . . . . . . . . . . . . . . . . . . . . . . . . . . . . 17
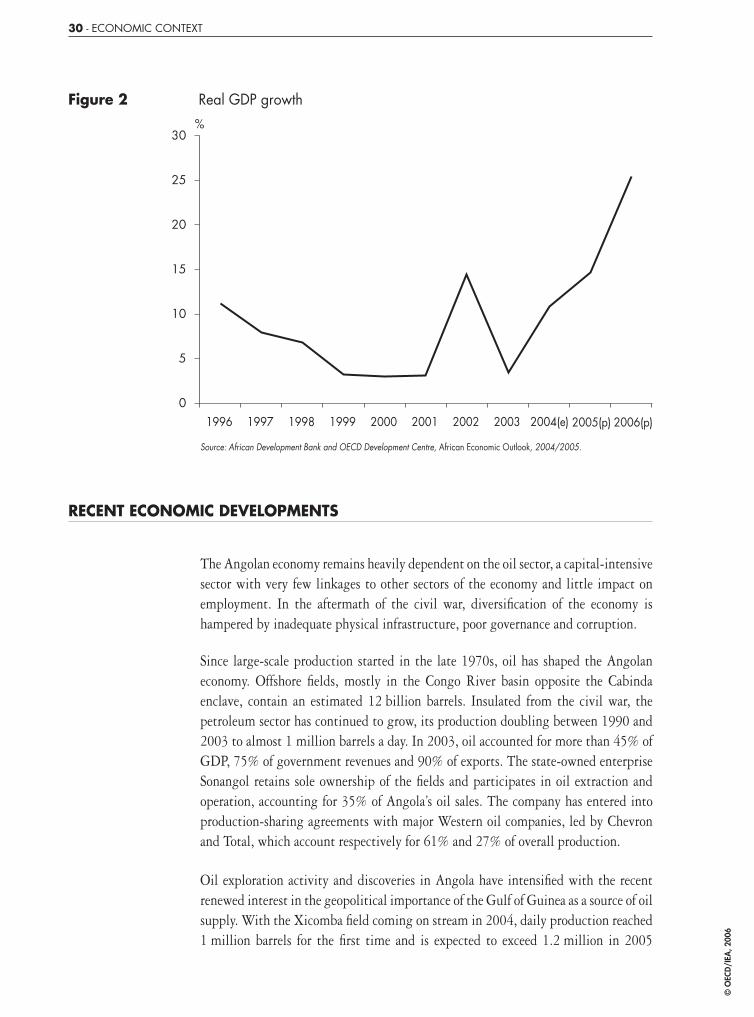
2 Real GDP growth . . . . . . . . . . . . . . . . . . . . . . . . . . . . . . . . . . . . . . . 30
3 GDP per capita in Angola and in Africa (current USD) . . . . . . . . . . . . . . . . 31
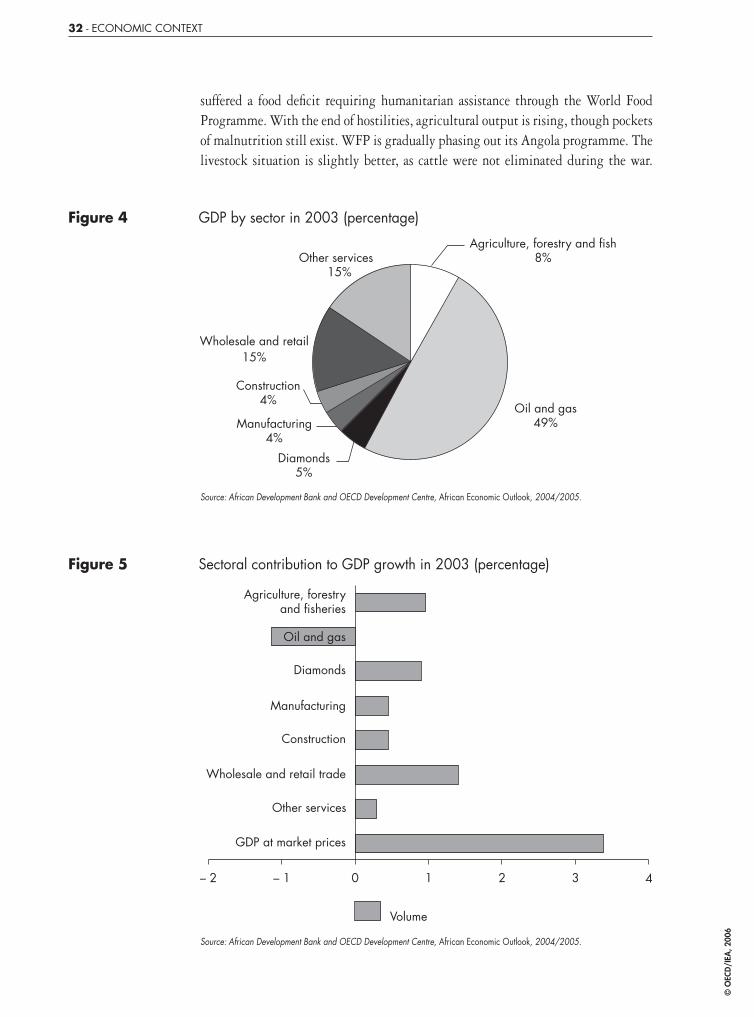
4 GDP by sector in 2003 (percentage) . . . . . . . . . . . . . . . . . . . . . . . . . . . . 33
5 Sectoral contribution to GDP growth in 2003 (percentage) . . . . . . . . . . . . . 33
6 Stock of total external debt (percentage of GNP) . . . . . . . . . . . . . . . . . . . . 37
7 Share of billed electricity consumption by end-user groups (2001) . . . . . . . . 58
8 Production forecast under the 2002 strategy (GWh) . . . . . . . . . . . . . . . . . 59
9 Angola in Sub-Saharan oil production . . . . . . . . . . . . . . . . . . . . . . . . . . . 81
10 Organisational structure of the Ministry of Petroleum . . . . . . . . . . . . . . . . 83
11 Organisational chart of Sonangol . . . . . . . . . . . . . . . . . . . . . . . . . . . . . . 85
12 Proven oil reserves and production . . . . . . . . . . . . . . . . . . . . . . . . . . . . . 88
13 Key technology challenges for deepwater and ultra-deepwater (UDW) . . . . . . 95
14 Spot Angolan crude price compared to Brent . . . . . . . . . . . . . . . . . . . . . . 99
15 EITI process . . . . . . . . . . . . . . . . . . . . . . . . . . . . . . . . . . . . . . . . . . . 102
16 Oil product consumption by consumer group in 2003 (percentage of total) . . . 120
17 Oil product consumption by Sonangol supply region in 2003 (percentage of total) . . . . . . . . . . . . . . . . . . . . . . . . . . . . . . . . . . . . . . 121
18 Organisational chart of Sonangol Distribuidora . . . . . . . . . . . . . . . . . . . . . 124
19 Radar image of the «charcoal web» in Central African Republic . . . . . . . . . . 144
218590_p001-028_debut.indd 7218590_p001-028_debut.indd 7 21/09/06 11:30:4021/09/06 11:30:40
© O
ECD
/IEA
, 200
6
8 - TABLE OF CONTENTS
20 The link between poverty and share of traditional biomass . . . . . . . . . . . . . 149
21 Household fuel transition . . . . . . . . . . . . . . . . . . . . . . . . . . . . . . . . . . . 150
LIST OF TABLES
1 Demand composition (percentage of GDP) . . . . . . . . . . . . . . . . . . . . . . . 33
2 Public fi nances (percentage of GDP) . . . . . . . . . . . . . . . . . . . . . . . . . . . . 35
3 Current account (percentage of GDP) . . . . . . . . . . . . . . . . . . . . . . . . . . . 36
4 Generation operated by ENE in 2002 + Capanda (MW) . . . . . . . . . . . . . . . 49
5 Generation serving isolated grids operated by ENE in 2002 . . . . . . . . . . . . . 51
6 Hydropower potential of Angola’s major river basins . . . . . . . . . . . . . . . . . 53
7 Transmission lines installed and available in 2003 (km) . . . . . . . . . . . . . . . 55
8 ENE electricity production 2001-2004 (MWh) . . . . . . . . . . . . . . . . . . . . 57
9 Forecast of peak production 2006-2016 . . . . . . . . . . . . . . . . . . . . . . . . . . 60
10 ENE collection rate and numbers of customers 2002-2004 . . . . . . . . . . . . . 65
11 Evolution of EDEL billing and collection rates (millions of kwanzas) . . . . . . . 65
12 ENE tariffs as of May 2004 . . . . . . . . . . . . . . . . . . . . . . . . . . . . . . . . . . 68
13 Average tariffs and real supply costs in late 2004 (Kz/KWh) . . . . . . . . . . . . 68
14 Estimated costs for electricity projects in MINEA’s investment portfolio . . . . . 72
15 Comparison of investment priorities in 2002 strategy and 2004 portfolio . . . . 72
16 ENE workforce . . . . . . . . . . . . . . . . . . . . . . . . . . . . . . . . . . . . . . . . . 73
17 EDEL workforce . . . . . . . . . . . . . . . . . . . . . . . . . . . . . . . . . . . . . . . . 74
18 Production of crude oil by block . . . . . . . . . . . . . . . . . . . . . . . . . . . . . . 89
19 Ownership rights of onshore operating blocks . . . . . . . . . . . . . . . . . . . . . . 90
20 Ownership rights of offshore producing oil blocks . . . . . . . . . . . . . . . . . . . 91
218590_p001-028_debut.indd 8218590_p001-028_debut.indd 8 21/09/06 11:30:4021/09/06 11:30:40
© O
ECD
/IEA
, 200
6
21 Ownership rights of offshore non-producing exploration blocks . . . . . . . . . . 93
22 Angolan oil production forecast 2005-2010 . . . . . . . . . . . . . . . . . . . . . . . 94
23 Angolan crude oil tanker ports . . . . . . . . . . . . . . . . . . . . . . . . . . . . . . . 97
24 Angolan crude oil exports to the OECD . . . . . . . . . . . . . . . . . . . . . . . . . 98
25 Angolan crude price differentials to Brent, 2004 . . . . . . . . . . . . . . . . . . . . 99
26 Government oil revenue (million USD) . . . . . . . . . . . . . . . . . . . . . . . . . . 100
27 Angola’s signature bonuses in 1982 and 1996-2001 . . . . . . . . . . . . . . . . . . 101
28 Production, trade and consumption of selected products in 2003 (thousand tonnes) . . . . . . . . . . . . . . . . . . . . . . . . . . . . . . . . . . . . . . . . 115
29 Luanda refi nery production 1999-2003 (thousand tonnes) . . . . . . . . . . . . . . 116
30 Imports of oil products in 2003 . . . . . . . . . . . . . . . . . . . . . . . . . . . . . . . 119
31 Sales of oil products on the domestic market 1999-2003 . . . . . . . . . . . . . . 120
32 Profi le of Sonangol service stations in the Luanda area . . . . . . . . . . . . . . . . 125
33 Oil product storage capacity in 2000 . . . . . . . . . . . . . . . . . . . . . . . . . . . 126
34 Licenses for exploitation of forestry resources . . . . . . . . . . . . . . . . . . . . . . 152
35 Share of energy expenditures in income . . . . . . . . . . . . . . . . . . . . . . . . . . 161
36 Cost of using charcoal vs. LPG in an Angolan household . . . . . . . . . . . . . . . 161
LIST OF MAPS
1 Map of Angola and key facts . . . . . . . . . . . . . . . . . . . . . . . . . . . . . . . . . 14
2 Electricity grid . . . . . . . . . . . . . . . . . . . . . . . . . . . . . . . . . . . . . . . . . 42
3 Crude oil blocks and concessions . . . . . . . . . . . . . . . . . . . . . . . . . . . . . . 87
4 Downstream oil infrastructure . . . . . . . . . . . . . . . . . . . . . . . . . . . . . . . . 112
TABLE OF CONTENTS - 9
218590_p001-028_debut.indd 9218590_p001-028_debut.indd 9 21/09/06 11:30:4021/09/06 11:30:40
© O
ECD
/IEA
, 200
6

218590_p001-028_debut.indd 10218590_p001-028_debut.indd 10 21/09/06 11:30:4021/09/06 11:30:40
© O
ECD
/IEA
, 200
6
INTRODUCTION
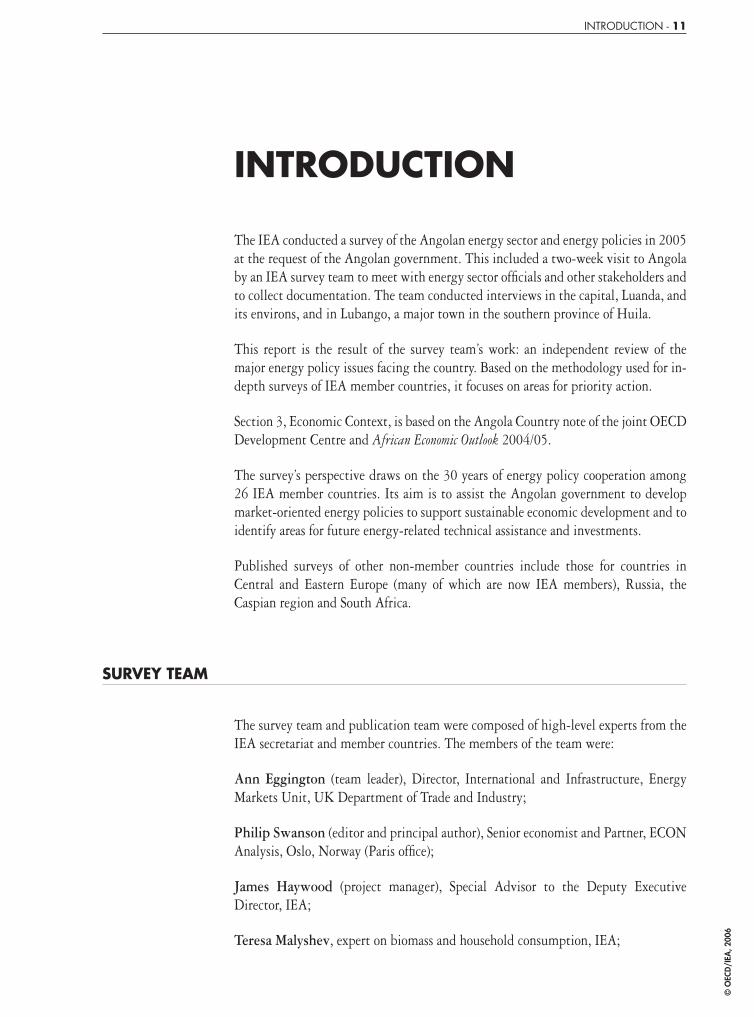
The IEA conducted a survey of the Angolan energy sector and energy policies in 2005 at the request of the Angolan government. This included a two-week visit to Angola by an IEA survey team to meet with energy sector offi cials and other stakeholders and to collect documentation. The team conducted interviews in the capital, Luanda, and its environs, and in Lubango, a major town in the southern province of Huila.
This report is the result of the survey team’s work: an independent review of the major energy policy issues facing the country. Based on the methodology used for in-depth surveys of IEA member countries, it focuses on areas for priority action.
Section 3, Economic Context, is based on the Angola Country note of the joint OECD Development Centre and African Economic Outlook 2004/05.
The survey’s perspective draws on the 30 years of energy policy cooperation among 26 IEA member countries. Its aim is to assist the Angolan government to develop market-oriented energy policies to support sustainable economic development and to identify areas for future energy-related technical assistance and investments.
Published surveys of other non-member countries include those for countries in Central and Eastern Europe (many of which are now IEA members), Russia, the Caspian region and South Africa.
SURVEY TEAM
The survey team and publication team were composed of high-level experts from the IEA secretariat and member countries. The members of the team were:
Ann Eggington (team leader), Director, International and Infrastructure, Energy Markets Unit, UK Department of Trade and Industry;
Philip Swanson (editor and principal author), Senior economist and Partner, ECON Analysis, Oslo, Norway (Paris offi ce);
James Haywood (project manager), Special Advisor to the Deputy Executive Director, IEA;
Teresa Malyshev, expert on biomass and household consumption, IEA;
INTRODUCTION - 11
218590_p001-028_debut.indd 11218590_p001-028_debut.indd 11 21/09/06 11:30:4121/09/06 11:30:41
© O
ECD
/IEA
, 200
6
Charles Moseley, independent consultant, international development and electricity;
George Person, Director Middle East and Africa, Offi ce of Policy and International Affairs, U.S. Department of Energy;
Bento de Morais Sarmento, Deputy Director General, Portuguese General Directorate for Geology and Energy.
Publication team
Amanda Watters (principal manager), Division for Asia/Pacifi c, Latin America and Sub-Saharan Africa, IEA;
Ghislaine Kieffer, Project Manager for Latin America, IEA;
Natalie Campbell, translator for the Portuguese version of this review;
Bertrand Sadin, responsible for creating the maps and graphs;
Corinne Hayworth, responsible for the cover design.
STAKEHOLDER INTERVIEWS
IEA energy sector surveys are supported by interviews with key experts and stakeholders. In preparing this report, the IEA survey team interviewed representatives from the following organizations:
Government departments
Ministry of Agriculture & Rural Development
Ministry of Energy and Water
Ministry of Finance
Ministry of Industry
Ministry of Petroleum
Ministry of Planning
Ministry of Transport
Offi ce of the Deputy Prime Minister
Provincial Directorate of Energy, Water, Geology and Mines, Huila Province
National Direction of Environment and Natural Resources
12 - INTRODUCTION
218590_p001-028_debut.indd 12218590_p001-028_debut.indd 12 21/09/06 11:30:4121/09/06 11:30:41
© O
ECD
/IEA
, 200
6
Domestic energy companies
ENE – National Electricity Company
ENE Southern Regional Directorate
EDEL – Company for the Distribution of Electricity (Luanda)
ENCEL (electrical construction company)
Sonangol Holdings
Sonangol Distribution
Sonangol Distribution, Lubango regional offi ce
Sonangalp
International oil companies
BP
Chevron
Total
Large domestic energy users
ENDIAMA (diamond company)
Nova Cimangola (cement company)
International and local assistance community
World Bank
United Nations Development Program (UNDP)
US Agency for International Development (USAID)
UK Department for International Development (DID)
Embassies of several IEA Member Countries
Various national and international NGOs and civil society groups
Various independent experts
OECD Development Centre
INTRODUCTION - 13
218590_p001-028_debut.indd 13218590_p001-028_debut.indd 13 21/09/06 11:30:4121/09/06 11:30:41
© O
ECD
/IEA
, 200
6
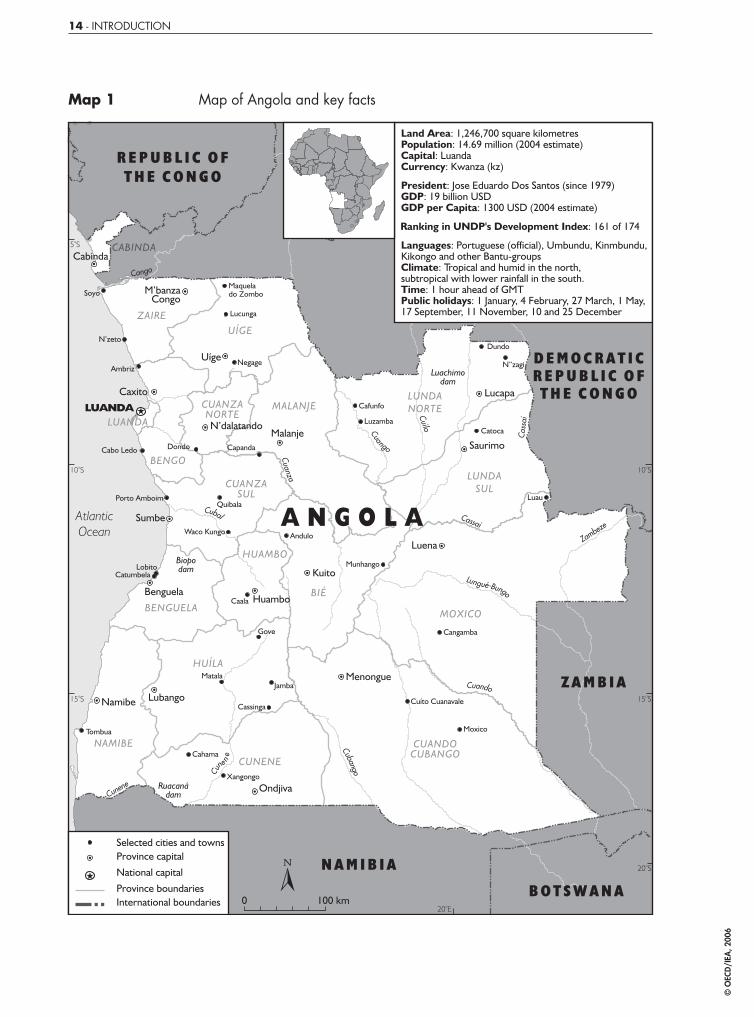
Map 1 Map of Angola and key facts
14 - INTRODUCTION
218590_p001-028_debut.indd 14218590_p001-028_debut.indd 14 21/09/06 11:30:4121/09/06 11:30:41
© O
ECD
/IEA
, 200
6
EXECUTIVE SUMMARY AND RECOMMENDATIONS
INTRODUCTION AND OBJECTIVE
The Angolan government invited the International Energy Agency (IEA) to conduct an in-depth review of its energy sector, based on the peer review mechanism for IEA member countries. The objective was to assist the government in its efforts to develop energy policies consistent with international best practice.
The IEA sent a review team to Angola in May 2005 to collect information and to conduct interviews with senior energy offi cials and other stakeholders. The present report, which includes recommendations for priority action, is the result of the review team’s work.
CONTEXT
In 2002 Angola emerged from almost three decades of civil war that left much of its infrastructure destroyed or damaged and a large part of its population displaced. Largely as a consequence, Angola currently ranks low among African countries in many human development indicators. Increasing access to modern energy sources in a sustainable manner could help improve livelihoods directly, as well as indirectly through the promotion of economic development.
The focus of this report is on those energy sub-sectors likely to play the largest role in meeting domestic demand for modern energy services; notably electricity and oil products. Given the extremely large role biomass currently plays in meeting the bulk of most households’ energy needs, this sub-sector is also featured, with emphasis on improving the sustainability of its use.
The important upstream oil sub-sector is also covered, but is not meant to be a focus. Most benefi ts to the country from oil production, which is almost entirely
EXECUTIVE SUMMARY AND RECOMMENDATIONS - 15
218590_p001-028_debut.indd 15218590_p001-028_debut.indd 15 21/09/06 11:30:4221/09/06 11:30:42
© O
ECD
/IEA
, 200
6

offshore, accrue in the form of export revenues. These are currently critical to the Angolan economy, representing over 80% of the government’s budget and 52% of GDP in 2004. (The government’s share of oil revenues that year was approximately USD 5.7 billion or about 45%.) A well-formulated upstream oil development policy can help improve the sustainability of these revenue fl ows. However, the main bottleneck in the fl ow of benefi ts from this sub-sector to the population in Angola’s case does not appear to be the size or sustainability of such revenues – already large and expected to increase signifi cantly. Rather, as for many other oil-producing countries, the main bottlenecks appear to be related to government revenue management and budgeting, issues beyond the realm of energy policy and not the focus of this report. Nonetheless, Angola has made progress in revenue management and transparency in recent years, e.g., by publishing the critical diagnostic of its oil revenues performed by consulting fi rm KPMG, identifying most oil revenue fl ows and creating a unifi ed budget that incorporates spending that was previously off-budget.
While Angola is potentially rich in terms of oil export revenues, we have made our recommendations based on the assumption that signifi cant funds from this source may not be available for investment in other energy sub-sectors and in the general economy for the next 4-6 years. This is due in part to the government’s past policy of relying on oil-backed loans, which effectively mortgaged a large portion of oil revenue fl ows. Furthermore, revenue streams from many new projects will take several years to begin accruing to the government, since the oil companies will fi rst need to recover their investment costs, which have been relatively high in Angola’s deep and ultra-deep offshore regions. So far the international community has proven reluctant to fi ll the fi nancing gap in the absence of what it generally has considered to be insuffi cient progress by the government in coming to agreement with the International Monetary Fund (IMF) on needed fi nancial reforms. Finally, any investment of government funds in the energy sector will need to compete with other pressing social needs, e.g., in health and education.
The report therefore takes as its point of departure that government investment resources available to the energy sector could be scarce in the short-to-medium term, that such funds will need to be carefully prioritised, and that emphasis should be on attracting private investment through improved transparency of oil revenue management and also more generally. In a broader perspective, there is a strong need to diversify economic activity in order to ensure more sustainable growth and employment.
Another important contextual issue is the poor state of statistics in Angola, both in terms of availability and quality. This hinders analysis of the economy, the establishment of priorities among competing investment needs, and the eventual development and execution of appropriate policies.
16 - EXECUTIVE SUMMARY AND RECOMMENDATIONS
218590_p001-028_debut.indd 16218590_p001-028_debut.indd 16 21/09/06 11:30:4221/09/06 11:30:42
© O
ECD
/IEA
, 200
6

Figure 1 Links between energy and poverty
• Fighting hunger• Promoting education• Improving sanitary conditions• Gender equality
Improving the qualityand quantityof human capital
Raising people’sstandards of living
Bettertargetingof policies
Improvingpeople’sparticipationin governance
Improvementof the businessenvironment
Formalisationof the economy
• Improvement of the productive environment (transport, communications)• Improvement of factor productivity• Extension of working hours• Diversification of the economy• Increased employment
• Improvement of information exchange• Improvement of the socio-economic environment and regional stability• Reinforcement of democracy• Rationalisation of public expenditure
Energy contributesto improving people’s lives
Energy contributesto the developmentof economic activity
Energy contributesto the efficiency
of public intervention
Source: African Development Bank and OECD Development Centre, African Economic Outlook, 2003/04.
OVERVIEW OF ENERGY SUB-SECTORS AND CROSS-CUTTING ISSUES
This section provides an overview of the main energy sub-sectors, including brief descriptions of infrastructure, institutions and main issues. It helps set the context for the recommendations that follow.
Electricity Most existing infrastructure in the electricity sector was built well before independence, which occurred in 1975. Much was damaged during the civil war or has not received routine maintenance, in part due to war-related access problems. Only a small percentage of the population has access to electricity, and service is
EXECUTIVE SUMMARY AND RECOMMENDATIONS - 17
218590_p001-028_debut.indd 17218590_p001-028_debut.indd 17 21/09/06 11:30:4321/09/06 11:30:43
© O
ECD
/IEA
, 200
6
generally unreliable. Improving access to electricity services is critical to Angola’s economic and human development.
State-owned ENE has 900 MW of installed capacity on three non-interconnected networks and several smaller isolated grids. Only about 70% is operational, though this is an improvement over the civil war period. Hydro accounts for a little over 60% of installed capacity, while the rest is primarily diesel-fi red thermal.
Generation in the Northern grid contains signifi cant overcapacity, though major outages occur in all three networks due in large part to signifi cant problems in transmission and distribution. The Central and Southern grids are often supply-constrained. A major goal of the government and ENE is to interconnect the three main systems to exploit the North’s over-capacity. There are hopes that a proposed power transit project from the Democratic Republic of Congo to South Africa could link Angola’s three major grids along the way.
State-owned EDEL is responsible for distribution in the capital, Luanda, which accounts for over 65% of the country’s consumption.
There are also a number of small grids, some of which were once part of larger systems but now isolated due to damage to the transmission network. Many municipal authorities in large towns also run their own isolated generation and supply services. In addition, most industries and many households have their own backup generation to compensate for frequent outages of grid supplies, leading to very high electricity costs for many consumers in practice, despite low tariffs.
Almost all isolated and backup systems run on diesel. Extremely poor conditions on road and rail networks make fuel supply to these isolated systems diffi cult.
The Ministry of Finance sets electricity tariffs that are uniform throughout the country. These currently are at levels that do not cover costs. There are plans to raise tariffs to cover long-run costs to ensure suffi cient investment income for rehabilitation and expansion. However, low bill collection rates may be a more serious problem.
Estimates for the share of population with access to electricity vary from 8% to 20%. This wide range is due primarily to uncertainties regarding the size and number of isolated municipal grids and household generating sets, the number of illegal connections, and even uncertainty about the size of the country’s total population.1
As of mid-2006 the government had yet to decide ENE’s fi nal structure. According to MINEA and ENE, the main option currently being considered is to break the utility into a number of separate generation companies that eventually could be privatised, leaving ENE to focus primarily on transmission. There is no plan yet regarding how the eventual electricity market will look, including how independent generating companies and possible new private entrants would sell their power.
1. Estimates vary by source as widely as 12-19 million, though most fall between 14-17 million.
18 - EXECUTIVE SUMMARY AND RECOMMENDATIONS
218590_p001-028_debut.indd 18218590_p001-028_debut.indd 18 21/09/06 11:30:4321/09/06 11:30:43
© O
ECD
/IEA
, 200
6
Although Angola is a member of both the Southern African Power Pool (SAPP) and Energy Pool of Central Africa (PEAC), it currently does not have any interconnections with its neighbours, apart from isolated lines serving several towns on the country’s southern border with Namibia.
Upstream oil Crude oil has been commercially exploited in Angola since its discovery onshore in 1955. Commencement of production offshore the coastal enclave of Cabinda followed shortly afterwards. The sector has grown rapidly since then, and especially after 1980, facilitated by the successful attraction of large foreign investments and technological expertise from the major international oil companies. Angola is now sub-Saharan Africa’s second largest oil producer after Nigeria, producing approximately 1.46 million barrels per day in 2006. Production is expected to come increasingly from deep-water offshore fi elds, with higher production costs and more challenging technological requirements, as shallower, more mature fi elds closer to shore gradually decline.
Angola’s upstream potential is likely to remain promising throughout the next decade, due to its favourable geology and reserve base, recent exploration successes, and relatively attractive fi scal terms, as well as recent and anticipated advances in deep-water production technology. Along with a heightened competition for scarce hydrocarbon resources internationally, these factors have helped renew interest in the Gulf of Guinea as a major oil supply source, and are likely to ensure that Angola becomes an increasingly important exporter to international markets, particularly the United States and China. Based on oil companies’ investment plans, production capacity is expected to double by 2010.
The capital-intensive oil sector continues to dominate Angola’s economy. Record high crude oil prices have led to a huge government tax windfall (USD 1.71 billion in 2004 according to the Ministry of Finance). Oil revenues now represent approximately 80% of the government’s budget and 45% of its gross domestic product. Angola’s economic development will depend heavily on how it manages and uses these revenues. The government’s record to date has been mixed, due in large part, it notes, to the situation created by the long civil war.
In 2004, a new petroleum law came into force that seeks to standardise future production sharing agreements and further clarify the roles of the Ministry of Petroleum, Sonangol and the operating companies, in an effort to attract more private and foreign investment.
Downstream oil
The downstream oil sector in Angola covers refi ning, trade, distribution and sale of petroleum products.
Until recently, Angola’s one refi nery covered most of the country’s domestic consumption. Since the 2002 cease-fi re, both consumption and imports of key products such as gasoline, diesel and jet fuel have increased substantially. While Angola is nominally a net exporter of oil products, this is mostly due to exports of fuel oil.
EXECUTIVE SUMMARY AND RECOMMENDATIONS - 19
218590_p001-028_debut.indd 19218590_p001-028_debut.indd 19 21/09/06 11:30:4321/09/06 11:30:43
© O
ECD
/IEA
, 200
6
Use of LPG by households for cooking is widespread in larger cities and suburban areas, but heavily subsidised. Although the country produces some LPG in its refi nery and offshore, the latter is mostly exported, while most LPG used domestically is imported.
Most domestic oil product prices in Angola are subsidised. Over the past few years the government has been raising prices gradually in an effort to eventually eliminate subsidies, but has had to contend with dramatically rising world oil prices that move the “goalposts”.
Prices that are fi xed below cost and uniform throughout the country give few incentives to private companies to engage in distribution and sales of oil products, especially outside Luanda, and can also be seen as a cause of cross-border smuggling of oil products. The few exceptions benefi t from subsidised wholesale prices from Sonangol. The government plans to create a competitive distribution market within the next few years, include unbundling Sonangol logistics and storage from its service stations, but has yet to fully clarify the details and regulatory framework. Effi cient distribution is also severely hindered by the poor conditions of roads and railroads.
Angola’s one refi nery, located near Luanda, is ineffi cient and its output subsidised. Sonangol plans to build a new export-oriented refi nery in Lobito to process the deep-water sour crudes that are forming an increasing share of the country’s oil output, though has yet to fi nd a strategic partner.
Gas Almost all gas reserves and production in Angola are associated with oil. Approximately 70-80% of associated gas is fl ared. The government has declared that all new fi elds must be zero-fl are and that routine fl aring should cease at existing fi elds by 2010. Flaring reduction plans generally have focused on re-injection and a proposed project to build an onshore liquefaction plant in Soyo for LNG exports.
There is currently no gas infrastructure or gas use, with the exception of LPG for cooking (see, Downstream oil). Projects to use gas domestically could be developed as spinoffs to the LNG scheme, but likely would be limited to the area around Soyo, some 300 km away from the main potential demand centre of Luanda. Other barriers to an eventual gas industry include lack of a clear government strategy and regulatory framework for onshore gas transportation and marketing, as well as lack of ownership rights to the gas by the oil companies that produce it.
Biomass Some 80% of Angolans rely on biomass for most of their energy needs. Wood fuel is mostly used in rural regions, while charcoal is preferred in peri-urban areas, due to its lower transport weight. Most of the unsustainable use of biomass appears to come from cutting trees for making charcoal to supply peri-urban areas.
Angola’s biomass resources are substantial. Due in part to the long-running civil war, such resources have been left relatively undisturbed in many parts of the country. However, severe local deforestation has occurred around most large cities, e.g., extending for a radius of 200-300 km around Luanda. Such deforested zones are
20 - EXECUTIVE SUMMARY AND RECOMMENDATIONS
218590_p001-028_debut.indd 20218590_p001-028_debut.indd 20 21/09/06 11:30:4321/09/06 11:30:43
© O
ECD
/IEA
, 200
6

growing yearly, in turn raising the transport costs of charcoal, which make up the largest part of the price.
The ineffi cient use of biomass in Angola can lead to serious health damage from indoor smoke pollution. Smoke from ineffi cient cookstoves contains thousands of health-damaging substances, which provoke respiratory diseases, such as asthma and acute respiratory infections; obstetrical problems, such as stillbirth and low birth-weight; blindness; and heart disease.
Important issues for the government to address in order to ensure sustainability of biomass use include effi ciency of the charcoal production process (e.g., more effi cient kilns), effi ciency and safety of end-use (e.g., more effi cient and safer stoves), and addressing the lack of energy alternatives.
Given that biomass use is primarily a function of poverty and lack of energy alternatives, biomass policy ideally should be set in a coordinated way that deals with the full supply chain. While the Ministry of Forestry monitors biomass resources and issues licenses for charcoal production and trading, no government department covers the policy issues that infl uence the demand for biomass. Moreover, the forestry ministry’s resources appear to be inadequate to its limited tasks, as the bulk of biomass production and trade reportedly is unlicensed.
PRIORITY RECOMMENDATIONS
This section presents priority recommendations, keeping in mind current limitations on fi nancial and administrative resources. These priorities could form the basis of an eventual energy strategy. The priority recommendations are followed by a list of additional recommendations.
Electricity: improve collection before raising tariffs
The electricity sector requires signifi cant investments but is not able to generate suffi cient funds for a number of reasons. These include not only tariffs that do not cover costs, but low collection rates. Simply raising tariffs may in fact increase the non-payment problem if not accompanied by efforts to improve billing and collection.
While raising tariffs to cover costs and investments will be necessary, the government, after consultation with the utilities, should focus immediate attention on fi nding ways to encourage increased collection of existing tariffs. This could include the government imposing more rigid budget constraints on the utilities.
EXECUTIVE SUMMARY AND RECOMMENDATIONS - 21
218590_p001-028_debut.indd 21218590_p001-028_debut.indd 21 21/09/06 11:30:4421/09/06 11:30:44
© O
ECD
/IEA
, 200
6

Electricity: improve information and metering systems
It is diffi cult to make informed policy and prioritise investments without adequate statistics and the information systems to produce them. Most electricity sector statistics are incomplete and/or outdated. Virtually no statistics are available concerning self-generation in major urban areas, or generation, transmission and distribution by provincial and municipal governments. Comprehensive and reliable information concerning the demand, generation and use of electricity and its fl ow throughout the system, from each generating unit to each end-user, is important to all electricity sector activities, including sector governance, planning, fi nance, tariff design, control of losses, billing, collections, operations and maintenance. In order to greatly enable performance improvements in the sector, it is important to make such information readily available to managers.
The government and utilities should prioritise and authorise adequate funding for the design and implementation of a modern information management and performance monitoring system for the entire electricity sector, including the implementation of a comprehensive and reliable metering system to support it.
Upstream oil: continue efforts to fully implement new Petroleum Law
The upstream oil sector has been Angola’s most vibrant industry, operating successfully and attracting foreign investment for decades. Oil revenue continues to account for a signifi cant portion of GDP and government revenues. In 2004, the government passed a new petroleum law, which seeks to standardise future agreements and to strengthen and clarify roles, including for the Ministry of Petroleum. Attracting foreign investment and technical expertise will be increasingly important as exploration and production move into deeper waters. The government should be complimented in its intention and efforts to fully implement the Petroleum Law of 2004.
In order to fully implement the Petroleum Law of 2004 the government should strengthen necessary resources in the Ministry of Petroleum and other relevant agencies so that they are able to carry out their increased duties. It should also ensure that the regulatory framework provides suffi cient stability for existing contracts and for continued attraction of foreign investment.
Upstream oil: continue efforts to improve transparency of oil revenues
Angola’s economic development will depend to an important extent on how it manages and uses its oil revenues. Increasing the transparency of such fl ows will be key to such management. While the government’s record to date has been mixed, it has made some signifi cant progress in recent years.
22 - EXECUTIVE SUMMARY AND RECOMMENDATIONS
218590_p001-028_debut.indd 22218590_p001-028_debut.indd 22 21/09/06 11:30:4421/09/06 11:30:44
© O
ECD
/IEA
, 200
6
Building on recent progress, the government should enhance coordination between the Ministries of Finance and Petroleum, Central Bank and other fi nancial, governmental and international institutions in its efforts to improve transparency in the management of oil revenues.
Downstream oil: continue to liberalise product prices
The reliable supply of oil products will be important for facilitating economic growth. The country currently suffers from unreliable supply, especially in areas away from the coast. Although the government is raising oil prices towards world levels, oil products are still sold below the cost of production (taking into account the rising world market price of crude oil), and the government is obliged to subsidise the difference. The situation becomes more complicated the farther one gets from supply depots on the coast, since fi nal prices are uniform throughout the country. The subsidy Sonangol receives does not appear to be clearly related to location but a subsidy to cover its costs of supply generally.
The government should continue its efforts to liberalise product prices, which ideally should refl ect the cost of transportation. However, if the government feels incentives are necessary to encourage service to certain regions (e.g., remote areas), it should make any aid transparent and available to all distribution companies. In such cases, care should be taken to avoid creating incentives for smuggling, which effectively subsidises consumption in neighbouring countries.
Downstream oil: clarify regulatory framework for competitive oil product distribution
The government plans to liberalise oil product distribution in order to encourage private investment and has produced an outline of its plans. However, the future regulatory framework remains to be worked out. In the meantime, Sonangol maintains an effective monopoly and remains heavily subsidised. (Although a second distributor operates in the Luanda region, it is a joint venture involving Sonangol and has a fi xed margin.)
Further clarifying the regulatory framework affecting private companies in the downstream oil sector will help reduce barriers to entry, thereby increasing competition and increasing effi ciency in distribution to the consumer.
Downstream oil: prioritise investments in transportation and storage infrastructure
Two major infrastructure bottlenecks in the product distribution system appear to be the extremely poor condition of roads used to transport products and the lack of operating storage capacity around the country.
EXECUTIVE SUMMARY AND RECOMMENDATIONS - 23
218590_p001-028_debut.indd 23218590_p001-028_debut.indd 23 21/09/06 11:30:4421/09/06 11:30:44
© O
ECD
/IEA
, 200
6
The government should continue its efforts to improve transport infrastructure (both road and rail), required both for effi cient and equitable distribution of petroleum products and for economic development more generally. It should also encourage investments to increase storage capacity.
Gas: clarify gas development strategy and investment framework
Because of the various risks involved in starting a gas industry from scratch, investors may be reluctant to invest the large sums necessary unless they see that the government has a clear gas development strategy that is backed by a regulatory framework to help diminish the risks – as well as a favourable investment climate more generally. Incentives may be further reduced by the fact that the oil companies usually do not own the gas they produce: According to the concession regime, all gas not used by the oil companies in their own operations (e.g., to enhance oil recovery) belongs to Sonangol.
In order to encourage companies to develop the country’s gas reserves and projects to use such gas, the government should clarify its gas strategy and investment framework. The government’s consultation of potential users and investors as a fi rst step should be commended.
Gas: continue efforts to reduce fl aring
Up to now, a high portion of associated gas has been fl ared or vented. The government of Angola is moving towards implementing a zero-fl are policy, including through greater enforcement of existing legislation, stronger environmental protection measures, and development of a liquefi ed natural gas (LNG) project.
The government should be encouraged in its efforts to reduce fl aring of associated gas, including more stringent application of existing legislation.
Biomass: address biomass within wider framework of household energy needs
A high portion of Angola’s fi nal energy consumption is biomass, particularly wood fuel in rural areas and charcoal in peri-urban areas. Production of charcoal appears to contribute most to deforestation, especially around urban centres. The government has responded to the deforestation problem by banning the cutting of trees, although it is not able to enforce this in much of the country, due to a number of factors, including manpower shortages. Charcoal use is largely a response to lack of alternative energy sources (e.g., LPG and kerosene) in some areas, as well as inability to afford suffi cient supplies of these alternatives in others. Addressing the deforestation problem will require a coordinated policy approach that takes into account demand-side factors.
24 - EXECUTIVE SUMMARY AND RECOMMENDATIONS
218590_p001-028_debut.indd 24218590_p001-028_debut.indd 24 21/09/06 11:30:4521/09/06 11:30:45
© O
ECD
/IEA
, 200
6

The government should consider allocating more funds to the current programme for sustainable management of forestry resources. More importantly, however, it should seek to address the deforestation problem in a more integrated way that incorporates the demand side, including recognition of charcoal use as a response to lack of energy alternatives. This may require closer coordination between the Ministries of Energy and Water, Agriculture (Forestry Department), Urbanisation and Environment, Finance, and Petroleum.
Statistics: improve capability to collect and disseminate relevant energy statistics and other socio-economic data
Reliable statistics are an important requirement for making sound government policy, including in the energy sector. Among energy statistics, those for upstream oil appear to be of reasonable quality, but elsewhere quality and coverage need improvement. Policy development in the energy sector requires not only energy statistics, but also a wide range of socio-economic data.
The government should improve its capability to collect and disseminate relevant statistics in the energy and other sectors, and improve coordination and data sharing between government departments. It may wish to seek the assistance of international institutions, e.g., the United Nations and the International Energy Agency in this regard.
ADDITIONAL RECOMMENDATIONS
Electricity
Transfer tariff-setting powers from government to an independent regulator: in order to ensure adequate investment funds in the sector and reassure potential investors, the government should consider transferring tariff-setting powers to an independent regulator.
Clarify licensing and regulatory procedures for small systems: in order to promote electrifi cation, the government should ensure a light-handed regulatory approach that removes barriers and clarifi es and simplifi es procedures for setting up small electricity generation and distribution projects.
Consider formalising informal urban and peri-urban distribution networks: the utilities should be encouraged in their consideration of ways to formalise and encourage electricity distribution networks operated by entrepreneurs as one way to increase access to electricity. This should involve eventual licensing by the regulator and inspections to ensure consumer safety. Tariff regulation is also desirable, but may not need to be an initial priority.
EXECUTIVE SUMMARY AND RECOMMENDATIONS - 25
218590_p001-028_debut.indd 25218590_p001-028_debut.indd 25 21/09/06 11:30:4521/09/06 11:30:45
© O
ECD
/IEA
, 200
6
Publish grid expansion plans: to remove uncertainties for rural electrifi cation entrepreneurs, the government should provide an expansion plan for the grid that is updated regularly (as called for in para. 176 of the 2002 Strategy), or at a minimum indicate areas that it will defi nitely not expand into for a set period of time.
Promote rural electrifi cation by removing barriers: while the government is probably correct to focus immediate resources and attention on rehabilitation of existing infrastructure, it should not miss opportunities to promote entrepreneurial approaches to rural electrifi cation by ensuring removal of administrative barriers while maintaining minimum safety standards through “light-handed” regulation. Success of such a programme could be enhanced by operation of a rural electrifi cation fund to lower the fi nancial hurdle of initial connection charges, as well as by creating or encouraging the establishment of entities to provide technical and institutional support to entrepreneurs.
Make any subsidies transparent and available to all suppliers in a particular area: as recognised by the 2002 Strategy, tariffs should refl ect the cost of supply to different geographic locations and customer types. If some element of subsidy or cross-subsidy is considered desirable in particular areas, it should be transparent and made available to all suppliers in that area, including eventual private sector ones. Otherwise, private sector suppliers may face diffi culties charging cost-covering rates to potential clients who can point to lower rates nearby.
Review and update electricity sector design and operating procedures: in order to ensure that large new investments and subsequent system operations are cost-effi cient, the government (ideally through the regulator) should review international best practice and require modern national standards and norms to be established to guide the design, construction, and performance of the electricity sector. In establishing these important standards and norms, the views and inputs of all important electricity sector stakeholders should be sought, including representatives of existing and potential new electricity customers.
Adopt an appropriate internationally acceptable set of environmental standards to guide the expansion of the electricity sector: a lot of time and expense is required for a country to develop its own environmental study and compliance requirements. This has led many developing countries to adopt the environmental requirements of the World Bank or some other internationally recognized institution, at least on an interim basis. It is recommended that Angola examine the actions of other countries at or near their level of economic development and adopt an appropriate internationally acceptable set of environmental standards and rules to guide the study, approval, and implementation of its electricity sector and other major infrastructure projects.
Ensure adequate share of electricity investment to distribution: since the poor shape of distribution networks appears to be one of the most important bottlenecks in electricity supply, ENE and EDEL should ensure that a suffi cient portion of scarce investment funds is directed to distribution. The planned refocus of short-term investment needs under the 2004 “Investment Portfolio” appears to represent an improvement over planned allocations in the 2002 Strategy in this regard.
26 - EXECUTIVE SUMMARY AND RECOMMENDATIONS
218590_p001-028_debut.indd 26218590_p001-028_debut.indd 26 21/09/06 11:30:4521/09/06 11:30:45
© O
ECD
/IEA
, 200
6
Assess and prioritise human resource development needs for the electricity sector: given the critical importance of skilled manpower in the development of the electricity sector, and the importance of this sector to the development of the country, the government and the utilities should undertake a comprehensive assessment of short, medium and long-term human resource needs in the sector and implement a sector-wide human resources development plan.
Consider solar energy for autonomous rural energy services and for niche urban markets: the government should continue to look for autonomous options, like stand-alone PV, for meeting energy needs of rural population, including for hospitals, schools and telecommunications, with specifi c attention to local conditions and should develop a clearer strategy.
Upstream oil
Transfer of Sonangol’s concessionnaire/regulatory roles: accelerate the re-organisation of Sonangol with a view to divesting its government functions.
Downstream oil
Improve incentives for Luanda refi nery effi ciencies: the government should be encouraged in its plans to re-negotiate the terms of the protocol regulating the prices of refi ned products that Sonangol purchases from the Luanda refi nery. This should be aimed at improving incentives to increase operating effi ciencies, decreasing the need for government subsidies.
Government is right not to invest own funds in new refi nery: given the pressing need for increased social investments in the country and the risk of refi nery investments, the government is probably correct in its decision not to directly invest its own money in the proposed new refi nery but to treat this as a commercial decision by Sonangol.
Limit protection of Sonangol Distribuidora: any protection measures intended to help allow Sonangol Distribuidora to adapt to new competition conditions should not become barriers that undermine private-sector opportunities to increase the availability of petroleum products to the public on an economically sustainable basis.
Gas
Consider options for promoting development of an internal gas market: in evaluating uses for gas brought to shore, the government should ensure that it fully considers options for promoting development of an internal gas market.
EXECUTIVE SUMMARY AND RECOMMENDATIONS- 27
218590_p001-028_debut.indd 27218590_p001-028_debut.indd 27 21/09/06 11:30:4521/09/06 11:30:45
© O
ECD
/IEA
, 200
6

Cross-cutting issues
Increase human and institutional capacity to review and monitor environmental regulations and EIAs: the government’s capacity to review and monitor environmental regulations and Environmental Impact Assessments (EIAs) is low. The government should ensure adequate fi nancing to boost such capacity. As part of such efforts, it should consider research exchange programmes with international institutions, including regional ones.
Target LPG subsidies at the initial purchase price of stoves and cylinders: in order to increase the number of people that are able to use LPG, as well as the amount of LPG Sonangol is able to bring to the market, the government should consider reducing subsidies for LPG and instead target them at the initial purchase of stoves and cylinders required for LPG use.
Invest in human capital and infrastructure as part of a strategy to help households climb the “energy ladder”: the government should increase investment expenditures on human capital and basic infrastructure (e.g., health and education, clean water, sanitation and roads), in order to increase income levels. This in turn will increase the ability of households to move up the “energy ladder”. Investments in human capital will also help the country to address substantial skills shortages, including in the energy sector.
28 - EXECUTIVE SUMMARY AND RECOMMENDATIONS
218590_p001-028_debut.indd 28218590_p001-028_debut.indd 28 21/09/06 11:30:4621/09/06 11:30:46
© O
ECD
/IEA
, 200
6

ECONOMIC CONTEXT - 29
I. ECONOMIC CONTEXT2
Angola has been largely at peace since a cease-fi re between the armed forces and the rebels was signed in April 2002, putting an end to more than 25 years of almost uninterrupted civil war. The country now faces the daunting task of channelling its huge resource endowment into reconstruction of its infrastructure and into poverty reduction activities. Diamonds and, especially, offshore oil dominate the national economy, their combined resources accounting for almost the entirety of hard currency and fi scal revenues. These sectors, however, create very few linkages to the rest of the economy. Agriculture and manufacturing are still suffering from the legacy of the civil war; wrecked infrastructure, lack of physical and fi nancial capital, poor governance, the pervasive presence of land mines in some regions, and the need to resettle 4 million people displaced by the fi ghting.
Despite rising international oil prices, real GDP growth in 2003 was disappointing at about 3.5%, owing to declining production of mature oil fi elds3. Growth gained momentum in 2004, reaching 11%, as new oil fi elds came on stream. The continued rise in oil production is expected to raise growth to about 15% in 2005 and about 25% in 2006. In past episodes of oil-boosted growth, the authorities showed some complacency in their policy stance at the expense of macroeconomic stabilisation and better governance, as shown by the abandonment of two IMF staff-monitored programmes (SMPs). This time around, however, the policy stance is tighter, with the fi ght against infl ation taking a prominent role as Angola strives to reach agreement with the IMF on the terms of a third SMP, which at the end of 2005 still wasn’t concluded. Infl ation fell below 35% in 2004, for the fi rst time in several decades, and the local currency, the kwanza, has remained relatively stable against the dollar.4
As in other post-confl ict environments, the challenges ahead are enormous and require a strong commitment from the government that can be supported by the international community. The latter is mainly concerned by the lack of transparency in oil revenue management, recourse to extra-budgetary expenses and oil-backed commercial loans, and the resulting external debt burden. The effort to reduce infl ation, while necessary, has a considerable social cost, in view of the lack of offi cial safety nets and the disintegration of the social fabric caused by the civil war. In this context, the fi nalisation of the Poverty Reduction Strategy launched in 2000 is expected to provide much-needed clear policy goals and a macroeconomic framework consistent with their achievement.
2. This chapter has been adapted from the Angola section of the African Economic Outlook, 2004/05, published in 2005 by the OECD Development Centre and the African Development Bank and appears with permission.
3. Statistics in Angola are generally very poor in terms of both availability and quality, which hinders proper analysis of the economy, the establishment of priorities among competing needs and the implementation of appropriate measures.
4. Unless otherwise indicated, the exchange rate used in this report is 75 kz/USD, which was the rate in early 2005.
218590_p029-040_chap01.indd 29218590_p029-040_chap01.indd 29 21/09/06 11:31:1021/09/06 11:31:10
© O
ECD
/IEA
, 200
6
30 - ECONOMIC CONTEXT
Figure 2 Real GDP growth
5
0
10
15
20
25
30%
1996 1997 1998 1999 2000 2001 2002 2003 2004(e) 2005(p) 2006(p)
Source: African Development Bank and OECD Development Centre, African Economic Outlook, 2004/2005.
RECENT ECONOMIC DEVELOPMENTS
The Angolan economy remains heavily dependent on the oil sector, a capital-intensive sector with very few linkages to other sectors of the economy and little impact on employment. In the aftermath of the civil war, diversifi cation of the economy is hampered by inadequate physical infrastructure, poor governance and corruption.
Since large-scale production started in the late 1970s, oil has shaped the Angolan economy. Offshore fi elds, mostly in the Congo River basin opposite the Cabinda enclave, contain an estimated 12 billion barrels. Insulated from the civil war, the petroleum sector has continued to grow, its production doubling between 1990 and 2003 to almost 1 million barrels a day. In 2003, oil accounted for more than 45% of GDP, 75% of government revenues and 90% of exports. The state-owned enterprise Sonangol retains sole ownership of the fi elds and participates in oil extraction and operation, accounting for 35% of Angola’s oil sales. The company has entered into production-sharing agreements with major Western oil companies, led by Chevron and Total, which account respectively for 61% and 27% of overall production.
Oil exploration activity and discoveries in Angola have intensifi ed with the recent renewed interest in the geopolitical importance of the Gulf of Guinea as a source of oil supply. With the Xicomba fi eld coming on stream in 2004, daily production reached 1 million barrels for the fi rst time and is expected to exceed 1.2 million in 2005
218590_p029-040_chap01.indd 30218590_p029-040_chap01.indd 30 21/09/06 11:31:1021/09/06 11:31:10
© O
ECD
/IEA
, 200
6

ECONOMIC CONTEXT - 31
Figure 3 GDP per capita in Angola and in Africa (current USD)
0
200
400
600
800
1 000
1 200
1 400
1 600
1990 1991 1992 1993 1994 1995 1996 1997 1998 1999 2000 2001 2002 2003 2004
Africa Angola
Source: African Development Bank and OECD Development Centre, African Economic Outlook, 2004/2005.
and 1.5 million in 2006. In this context, the role of Sonangol as franchisee and operator has raised concern over economic ineffi ciencies and confl icts of interest. The oil sector analysis released in May 2004 revealed the opacity still surrounding the company s fi nancial statements and its management of state subsidies.
Diamond mining is the second-largest source of export revenues (about 10% of total exports). As in other countries, offi cial data on the diamond trade are very imprecise because of smuggling. Moreover, most reserves were located in provinces under the control of the National Union for the Total Independence of Angola (UNITA) and hence were not accounted for in government statistics. The country’s only remaining kimberlite mine is the Catoca mine in Lunda Sul province, the world’s fourth-largest diamond mine, a joint venture between Endiama, the Russian fi rm Alrosa, the Brazilian company Odebrecht and Israeli-Russian businessman Lev Leviev. There are also extensive alluvial projects, both formal and informal.
The domestic non-mining economy has recorded sluggish growth and only recently recovered the level prevailing in the early 1990s. Land under cultivation amounts to roughly 3% of total arable land, which ample rainfall makes ideally suited for export crops such as coffee (of which Angola was once the world’s fourth-largest producer), sisal, tobacco, cotton, palm, sugar, citrus fruits and sesame. Agriculture was severely affected by the critical security situation, as farmers found it increasingly diffi cult to buy seeds, fertilisers and other inputs and to market their output to urban consumers. Farming has also been constrained by the presence of mines throughout much of the country, a major hindrance that has been removed only partially since the end of the hostilities. Once self-suffi cient in major staple crops (maize, cassava, sorghum), Angola
218590_p029-040_chap01.indd 31218590_p029-040_chap01.indd 31 21/09/06 11:31:1121/09/06 11:31:11
© O
ECD
/IEA
, 200
6
32 - ECONOMIC CONTEXT
suffered a food defi cit requiring humanitarian assistance through the World Food Programme. With the end of hostilities, agricultural output is rising, though pockets of malnutrition still exist. WFP is gradually phasing out its Angola programme. The livestock situation is slightly better, as cattle were not eliminated during the war.
Figure 4 GDP by sector in 2003 (percentage)
Agriculture, forestry and fish8%
Oil and gas49%
Diamonds5%
Manufacturing4%
Construction4%
Wholesale and retail15%
Other services15%
Source: African Development Bank and OECD Development Centre, African Economic Outlook, 2004/2005.
Figure 5 Sectoral contribution to GDP growth in 2003 (percentage)
– 2 – 1 0 1 2 3 4
GDP at market prices
Other services
Construction
Diamonds
Agriculture, forestryand fisheries
Volume
Oil and gas
Manufacturing
Wholesale and retail trade
Source: African Development Bank and OECD Development Centre, African Economic Outlook, 2004/2005.
218590_p029-040_chap01.indd 32218590_p029-040_chap01.indd 32 21/09/06 11:31:1121/09/06 11:31:11
© O
ECD
/IEA
, 200
6
ECONOMIC CONTEXT - 33
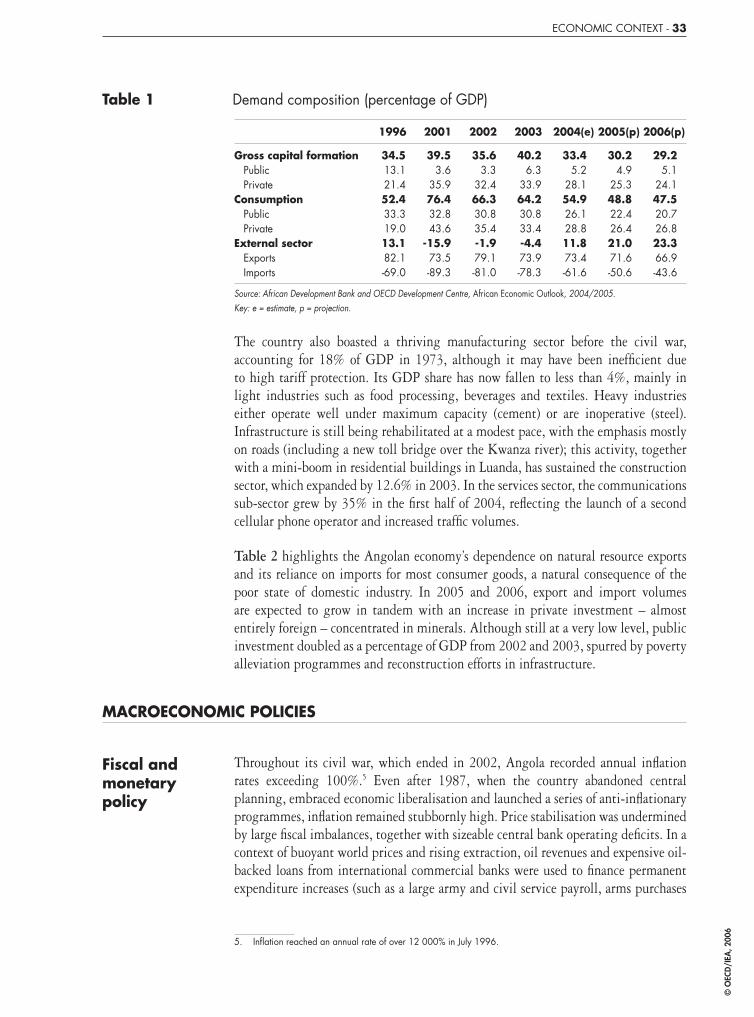
Table 1 Demand composition (percentage of GDP)
1996 2001 2002 2003 2004(e) 2005(p) 2006(p)
Gross capital formation Public PrivateConsumption Public PrivateExternal sector Exports Imports
34.513.121.452.433.319.013.182.1-69.0
39.53.6
35.976.432.843.6
-15.973.5-89.3
35.63.3
32.466.330.835.4-1.979.1-81.0
40.26.3
33.964.230.833.4-4.473.9-78.3
33.45.2
28.154.926.128.811.873.4-61.6
30.24.9
25.348.822.426.421.071.6-50.6
29.25.1
24.147.520.726.823.366.9-43.6
Source: African Development Bank and OECD Development Centre, African Economic Outlook, 2004/2005.Key: e = estimate, p = projection.
The country also boasted a thriving manufacturing sector before the civil war, accounting for 18% of GDP in 1973, although it may have been ineffi cient due to high tariff protection. Its GDP share has now fallen to less than 4%, mainly in light industries such as food processing, beverages and textiles. Heavy industries either operate well under maximum capacity (cement) or are inoperative (steel). Infrastructure is still being rehabilitated at a modest pace, with the emphasis mostly on roads (including a new toll bridge over the Kwanza river); this activity, together with a mini-boom in residential buildings in Luanda, has sustained the construction sector, which expanded by 12.6% in 2003. In the services sector, the communications sub-sector grew by 35% in the fi rst half of 2004, refl ecting the launch of a second cellular phone operator and increased traffi c volumes.
Table 2 highlights the Angolan economy’s dependence on natural resource exports and its reliance on imports for most consumer goods, a natural consequence of the poor state of domestic industry. In 2005 and 2006, export and import volumes are expected to grow in tandem with an increase in private investment – almost entirely foreign – concentrated in minerals. Although still at a very low level, public investment doubled as a percentage of GDP from 2002 and 2003, spurred by poverty alleviation programmes and reconstruction efforts in infrastructure.
MACROECONOMIC POLICIES
Fiscal and monetary policy
Throughout its civil war, which ended in 2002, Angola recorded annual infl ation rates exceeding 100%.5 Even after 1987, when the country abandoned central planning, embraced economic liberalisation and launched a series of anti-infl ationary programmes, infl ation remained stubbornly high. Price stabilisation was undermined by large fi scal imbalances, together with sizeable central bank operating defi cits. In a context of buoyant world prices and rising extraction, oil revenues and expensive oil-backed loans from international commercial banks were used to fi nance permanent expenditure increases (such as a large army and civil service payroll, arms purchases
5. Infl ation reached an annual rate of over 12 000% in July 1996.
218590_p029-040_chap01.indd 33218590_p029-040_chap01.indd 33 21/09/06 11:31:1121/09/06 11:31:11
© O
ECD
/IEA
, 200
6
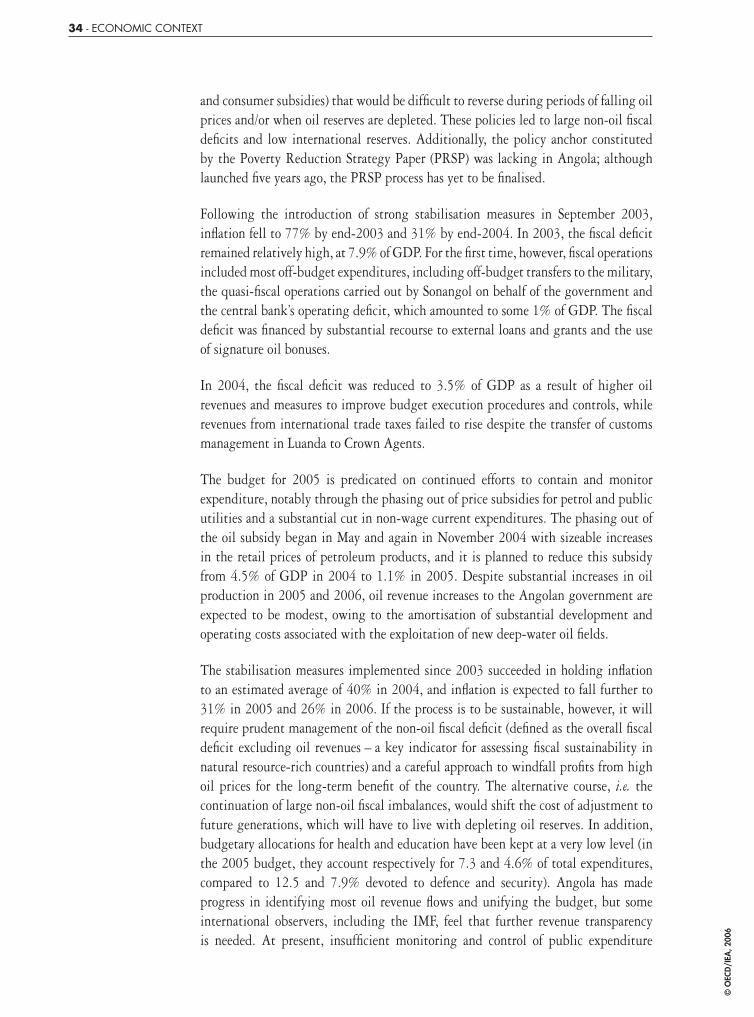
34 - ECONOMIC CONTEXT
and consumer subsidies) that would be diffi cult to reverse during periods of falling oil prices and/or when oil reserves are depleted. These policies led to large non-oil fi scal defi cits and low international reserves. Additionally, the policy anchor constituted by the Poverty Reduction Strategy Paper (PRSP) was lacking in Angola; although launched fi ve years ago, the PRSP process has yet to be fi nalised.
Following the introduction of strong stabilisation measures in September 2003, infl ation fell to 77% by end-2003 and 31% by end-2004. In 2003, the fi scal defi cit remained relatively high, at 7.9% of GDP. For the fi rst time, however, fi scal operations included most off-budget expenditures, including off-budget transfers to the military, the quasi-fi scal operations carried out by Sonangol on behalf of the government and the central bank’s operating defi cit, which amounted to some 1% of GDP. The fi scal defi cit was fi nanced by substantial recourse to external loans and grants and the use of signature oil bonuses.
In 2004, the fi scal defi cit was reduced to 3.5% of GDP as a result of higher oil revenues and measures to improve budget execution procedures and controls, while revenues from international trade taxes failed to rise despite the transfer of customs management in Luanda to Crown Agents.
The budget for 2005 is predicated on continued efforts to contain and monitor expenditure, notably through the phasing out of price subsidies for petrol and public utilities and a substantial cut in non-wage current expenditures. The phasing out of the oil subsidy began in May and again in November 2004 with sizeable increases in the retail prices of petroleum products, and it is planned to reduce this subsidy from 4.5% of GDP in 2004 to 1.1% in 2005. Despite substantial increases in oil production in 2005 and 2006, oil revenue increases to the Angolan government are expected to be modest, owing to the amortisation of substantial development and operating costs associated with the exploitation of new deep-water oil fi elds.
The stabilisation measures implemented since 2003 succeeded in holding infl ation to an estimated average of 40% in 2004, and infl ation is expected to fall further to 31% in 2005 and 26% in 2006. If the process is to be sustainable, however, it will require prudent management of the non-oil fi scal defi cit (defi ned as the overall fi scal defi cit excluding oil revenues – a key indicator for assessing fi scal sustainability in natural resource-rich countries) and a careful approach to windfall profi ts from high oil prices for the long-term benefi t of the country. The alternative course, i.e. the continuation of large non-oil fi scal imbalances, would shift the cost of adjustment to future generations, which will have to live with depleting oil reserves. In addition, budgetary allocations for health and education have been kept at a very low level (in the 2005 budget, they account respectively for 7.3 and 4.6% of total expenditures, compared to 12.5 and 7.9% devoted to defence and security). Angola has made progress in identifying most oil revenue fl ows and unifying the budget, but some international observers, including the IMF, feel that further revenue transparency is needed. At present, insuffi cient monitoring and control of public expenditure
218590_p029-040_chap01.indd 34218590_p029-040_chap01.indd 34 21/09/06 11:31:1221/09/06 11:31:12
© O
ECD
/IEA
, 200
6
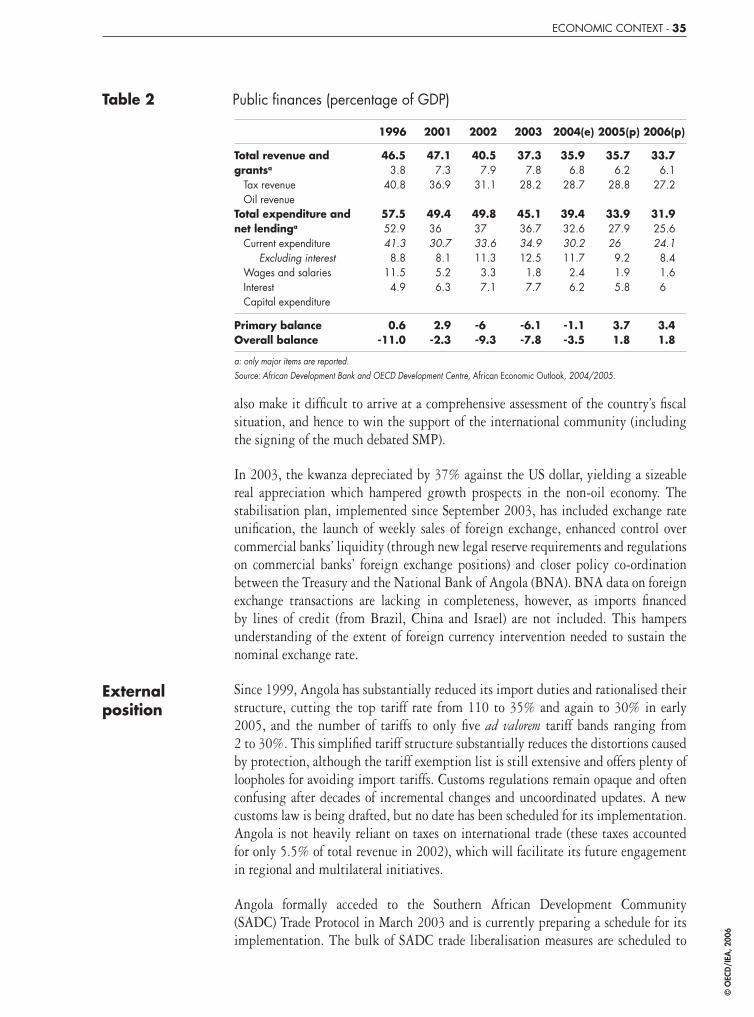
ECONOMIC CONTEXT - 35
Table 2 Public fi nances (percentage of GDP)
1996 2001 2002 2003 2004(e) 2005(p) 2006(p)
Total revenue and grantsa
Tax revenue Oil revenueTotal expenditure and net lendinga
Current expenditure Excluding interest Wages and salaries Interest Capital expenditure
46.53.8
40.8
57.552.941.38.8
11.54.9
47.17.3
36.9
49.436.030.78.15.26.3
40.57.9
31.1
49.837.033.611.3
3.37.1
37.37.8
28.2
45.136.734.912.5
1.87.7
35.96.8
28.7
39.432.630.211.72.46.2
35.76.2
28.8
33.927.926.0
9.21.95.8
33.76.1
27.2
31.925.624.1
8.41.66.0
Primary balanceOverall balance
0.6-11.0
2.9-2.3
-6.0-9.3
-6.1-7.8
-1.1-3.5
3.71.8
3.41.8
a: only major items are reported.Source: African Development Bank and OECD Development Centre, African Economic Outlook, 2004/2005.
also make it diffi cult to arrive at a comprehensive assessment of the country’s fi scal situation, and hence to win the support of the international community (including the signing of the much debated SMP).
In 2003, the kwanza depreciated by 37% against the US dollar, yielding a sizeable real appreciation which hampered growth prospects in the non-oil economy. The stabilisation plan, implemented since September 2003, has included exchange rate unifi cation, the launch of weekly sales of foreign exchange, enhanced control over commercial banks’ liquidity (through new legal reserve requirements and regulations on commercial banks’ foreign exchange positions) and closer policy co-ordination between the Treasury and the National Bank of Angola (BNA). BNA data on foreign exchange transactions are lacking in completeness, however, as imports fi nanced by lines of credit (from Brazil, China and Israel) are not included. This hampers understanding of the extent of foreign currency intervention needed to sustain the nominal exchange rate.
External position
Since 1999, Angola has substantially reduced its import duties and rationalised their structure, cutting the top tariff rate from 110 to 35% and again to 30% in early 2005, and the number of tariffs to only fi ve ad valorem tariff bands ranging from 2 to 30%. This simplifi ed tariff structure substantially reduces the distortions caused by protection, although the tariff exemption list is still extensive and offers plenty of loopholes for avoiding import tariffs. Customs regulations remain opaque and often confusing after decades of incremental changes and uncoordinated updates. A new customs law is being drafted, but no date has been scheduled for its implementation. Angola is not heavily reliant on taxes on international trade (these taxes accounted for only 5.5% of total revenue in 2002), which will facilitate its future engagement in regional and multilateral initiatives.
Angola formally acceded to the Southern African Development Community (SADC) Trade Protocol in March 2003 and is currently preparing a schedule for its implementation. The bulk of SADC trade liberalisation measures are scheduled to
218590_p029-040_chap01.indd 35218590_p029-040_chap01.indd 35 21/09/06 11:31:1221/09/06 11:31:12
© O
ECD
/IEA
, 200
6
36 - ECONOMIC CONTEXT
be introduced by 2008, and member states are carrying out a mid-term review of the Trade Protocol to that effect, a process in which Angola is expected to play an important role as a member of the steering committee.
Angola became eligible to benefi t from the United States’ African Growth and Opportunity Act (AGOA) only in December 2003, but it has been the leading benefi ciary of the Generalised System of Preferences (GSP) since 1999. Over 93% of Angolan products eligible for GSP, predominantly oil and petroleum products enter duty-free under the programme.
Oil exploitation strongly infl uences the trade balance. Oil exports have accounted for 90% of total exports over the past fi ve years and are estimated to have risen by 40% in 2004. A second product recording strong export growth is diamonds.
The United States is the largest export destination (more than 40% of exports over the past fi ve years), followed by China. European Union countries are the single largest source of imports, accounting for roughly half of Angola’s external purchases. Processed and fresh food products, in particular, are mostly imported from Portugal and South Africa respectively, while equipment and machinery are the main import item from the United States.
High oil prices coupled with increased oil production boosted exports in 2004, resulting in a large trade surplus. Continuing growth in crude oil production is expected to enhance export volumes further in 2005 and 2006. This will lead in turn to an increase in imports of capital goods.
Three related phenomena – the discovery of new oil fi elds, the increasing cost-effectiveness of deep-water exploration in a context of high oil prices and the strategic interest of American business in the energy potential of the South Atlantic – are driving foreign direct investment (FDI) activity. Chevron, in particular, has earmarked USD 11 billion for investment over the next fi ve years. Despite their positive contribution to GDP and exports, oil projects have very high import intensity and very few linkages with local business. Although the number of backward and forward linkages has started to grow – foreign companies have ad hoc programmes to increase local content – the integration between domestic and foreign businesses remains limited to very low-skilled activities such as catering and cleaning services.
Table 3 Current account (percentage of GDP)
1996 2001 2002 2003 2004(e) 2005(p) 2006(p)
Trade balance Exports of goods (f.o.b.) Imports of goods (f.o.b.)ServicesFactor incomeCurrent transfers
46.677.5-31.0-33.7-20.8
3.4
37.573.1-35.6-37.1-17.5
1.0
42.377.2-34.9-28.9-15.1
0.3
29.268.8-39.6-22.6-12.5
0.7
38.670.0-31.4
43.369.2-25.9
42.965.1-22.2
Current account balance -4.4 -16.0 -1.4 -5.2
Source: African Development Bank and OECD Development Centre, African Economic Outlook, 2004/2005.
218590_p029-040_chap01.indd 36218590_p029-040_chap01.indd 36 21/09/06 11:31:1221/09/06 11:31:12
© O
ECD
/IEA
, 200
6
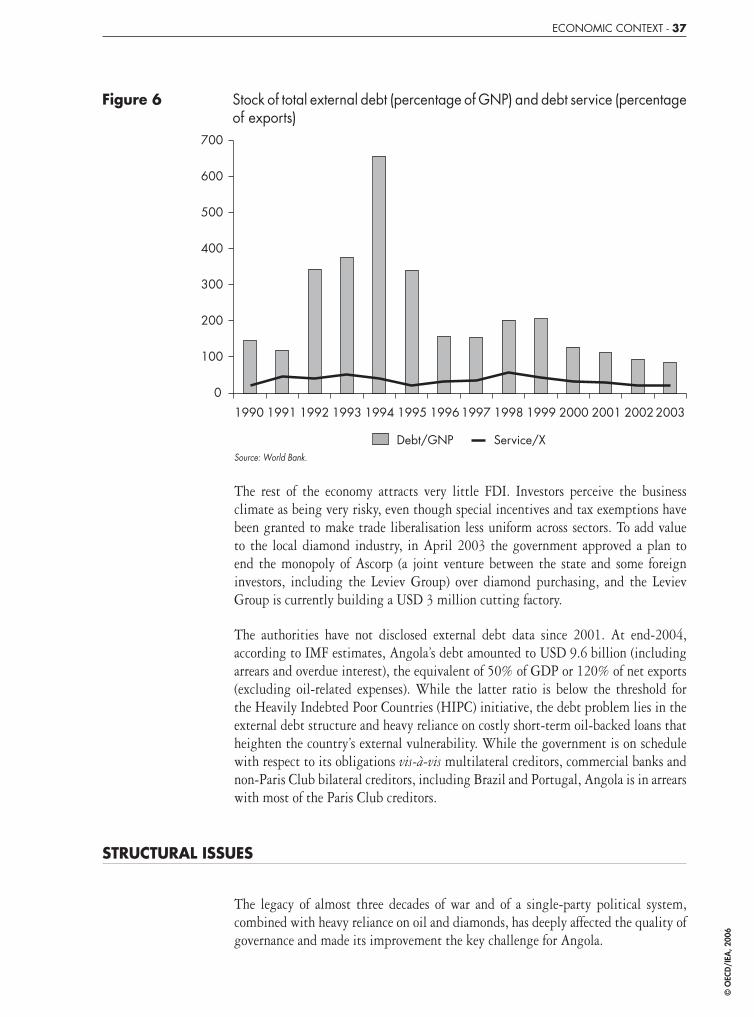
ECONOMIC CONTEXT - 37
Figure 6 Stock of total external debt (percentage of GNP) and debt service (percentage of exports)
0
100
200
300
400
500
600
700
1990 1991 1992 1993 1994 1995 19961997 1998 1999 2000 2001 20022003
Debt/GNP Service/XSource: World Bank.
The rest of the economy attracts very little FDI. Investors perceive the business climate as being very risky, even though special incentives and tax exemptions have been granted to make trade liberalisation less uniform across sectors. To add value to the local diamond industry, in April 2003 the government approved a plan to end the monopoly of Ascorp (a joint venture between the state and some foreign investors, including the Leviev Group) over diamond purchasing, and the Leviev Group is currently building a USD 3 million cutting factory.
The authorities have not disclosed external debt data since 2001. At end-2004, according to IMF estimates, Angola’s debt amounted to USD 9.6 billion (including arrears and overdue interest), the equivalent of 50% of GDP or 120% of net exports (excluding oil-related expenses). While the latter ratio is below the threshold for the Heavily Indebted Poor Countries (HIPC) initiative, the debt problem lies in the external debt structure and heavy reliance on costly short-term oil-backed loans that heighten the country’s external vulnerability. While the government is on schedule with respect to its obligations vis-à-vis multilateral creditors, commercial banks and non-Paris Club bilateral creditors, including Brazil and Portugal, Angola is in arrears with most of the Paris Club creditors.
STRUCTURAL ISSUES
The legacy of almost three decades of war and of a single-party political system, combined with heavy reliance on oil and diamonds, has deeply affected the quality of governance and made its improvement the key challenge for Angola.
218590_p029-040_chap01.indd 37218590_p029-040_chap01.indd 37 21/09/06 11:31:1221/09/06 11:31:12
© O
ECD
/IEA
, 200
6

38 - ECONOMIC CONTEXT
Since 1988, new laws have been issued to regulate economic activities; organise the activities of the fi nancial markets, mining and fi sheries; formalise the fi rst wave of privatisations; and introduce incentives for foreign investment in the non-oil sectors. Nonetheless, with mixed results from privatisation and limited progress in addressing the vulnerability of the fi nancial system, these measures have not succeeded in giving investors the right incentives to engage in risk-taking and job-creating activities. In particular, many investors have found it diffi cult to compete with the empresarios de confi ança.
In tandem with efforts to stabilise the macroeconomic environment, new initiatives have been launched to foster private sector development. These include a new investment law that provides equal treatment to foreign and Angolan fi rms (with few exceptions); the new commercial code enacted in early 2004 to replace the 1888 commercial code and the 1901 law on limited-liability companies; and the establishment of the National Private Investment Agency (ANIP), a one-stop registration offi ce for companies. Additional provisions will be required, however, before the commercial code can be effectively implemented, and the investment law is vague on profi ts repatriation and fails to provide strong legal safeguards to protect foreign investors. A Land Tenure Law was passed in 2004 with the aim of clarifying property rights and customary tenure. Major problems remain, however, since in many cases colonial registries have been destroyed and registration of transfers of ownership, occupation and concessions is in disarray as ministerial jurisdictions often overlap.
Investments in the petroleum, diamond and fi nancial sectors continue to be governed by specifi c legislation. In the case of oil, a controversial draft law was presented to foreign investors in mid-2004. The law would require international oil companies to channel their export receipts through the domestic banking system. Foreign investors claim that national banks are unprepared to accommodate massive foreign currency fl ows effi ciently. Moreover, they argue that specifi c provisions regulating employment of Angolan nationals and profi ts repatriation amount to a breach of contractual obligations. The draft law has not yet been transmitted to Parliament.
State-owned enterprises play an important role in the economy, and the privatisation process was suspended in 2001, following concerns regarding the status and success of the process. Many state industrial and manufacturing enterprises record substantial losses, which have in many cases depleted working capital. Under the burden of a destitute population that fl ed the civil war, provision of basic public services (electricity and water in particular) is very defi cient: network connectivity does not exceed 20% of the population and cuts are extremely frequent. Although hydropower potential is large, generation technology is outdated and little investment has been made since the early 1990s to maintain power plants and the transmission and distribution networks. Some fi rms, such as Angola Telecom, the railways and the national airline TAAG, have engaged in corporate restructuring with a view to attracting foreign interest. In Luanda, selected public services, such as urban transport and waste management, are already operating under concession. A second
218590_p029-040_chap01.indd 38218590_p029-040_chap01.indd 38 21/09/06 11:31:1321/09/06 11:31:13
© O
ECD
/IEA
, 200
6
ECONOMIC CONTEXT - 39
mobile service provider has been operational since mid-2003, its market share now approaching 55%. Progress in attracting private investment is hampered, however, by the lack of judicial safeguards, including independent regulators.
According to the 2002 census carried out by the National Institute of Statistics, the non-farm private sector comprises some 19 000 enterprises and provides employment to 341 000 people. The majority of these fi rms are located in the Luanda area and are active in trade and personal services. These fi gures underestimate the size of the private sector, as a substantial share of economic activity is undertaken in the informal sector, for which no reliable estimate exists. In an environment long characterised by the fragility of successive peace agreements, high infl ation, a volatile exchange rate and low returns on kwanza deposits, over 70% of deposits and 70% of loans are denominated in foreign currency. This limits access to credit, for smaller fi rms especially. Collateral requirements are stringent but proper land titling is almost non-existent. Ownership remains a prerogative of the state, and user rights, being uncertain, cannot be used as collateral, which seriously limits lending to agriculture. Commercial banks show a marked preference for large fi rms having relatively long track records and strong connections to the establishment.
In 2000, the authorities set up a credit institution (Fundo de Desenvolvimento Economico e Social – FDES) to channel part of the country’s large oil revenues to support investment in the private sector. FDES targets mostly small and medium-sized enterprises with loans ranging from USD 10 000 to USD 500 000, channelled through commercial banks. According to the original plan, FDES was supposed to receive USD 150 million from oil “bonuses” in 2000, but as of mid-2004, only USD 30 million had been disbursed. FDES has fi nanced 170 projects, mainly in transport and fi shing, with an average size of about USD 20 000, generating more than 4 500 jobs. Its activity has been hindered by scarcity of fi nancial resources and the weaknesses of the fi nancial system through which it operates. The intermediating banks did not provide adequate monitoring of the projects fi nanced, owing to poor credit information and analysis. Loans were secured by mortgages on fi xed assets and collateral.
Other initiatives to satisfy the pent-up demand for fi nancial services have been developed only recently, as the political situation has stabilised. These include creating the proper regulatory framework for micro-credit, building the necessary human competencies, setting up credit bureaux and business development services to reduce informational gaps, developing fi nancial instruments that are more attuned to the needs of the Angolan business community, and reaching hitherto poorly serviced parts of the country. Implementation is in the hands of a variety of public and private partners, including government agencies, donors and international organisations, and oil companies, which are contractually required to devote part of their profi ts emergence of an independent press and active civil society movement.
218590_p029-040_chap01.indd 39218590_p029-040_chap01.indd 39 21/09/06 11:31:1321/09/06 11:31:13
© O
ECD
/IEA
, 200
6
40 - ECONOMIC CONTEXT
POLITICAL AND SOCIAL CONTEXT
Angola entered a new era on 4 April 2002, six weeks after the death of UNITA leader Jonas Savimbi, when a cease-fi re was signed between the armed forces and the rebels. The authorities have nonetheless been faced with considerable challenges, and progress has been uneven. On the one hand there has been the emergence of an independent press and active civil society movement. On the other, more than 300 000 people are estimated to be still living outside of their area of origin, and between 5 and 7 million mines may remain to be removed.
Elections are expected in 2006 (the fi rst in 12 years), although it was not known at the time of writing whether they would include presidential elections as well as legislative. A package of electoral laws was passed in mid-2005 and a National Electoral Commission was established in August 2005.
According to the 2005 Human Development Report, Angola ranks 160th out of 177 countries with an estimated 68% of the population living below the poverty line of USD 1.7 per day. Indeed, despite the oil boom, the majority of Angolans live in extreme poverty. (Estimates of the total population vary by source as widely as 12-19 million, though most fall in between 14-17 million.) The incidence of poverty is higher in rural areas, where it affects 94% of the population, compared to 57% in urban areas, as a result of the diffi culty for farmers of gaining access to fertile land and markets, the deterioration of road infrastructure and rural dwellers’ fl ight to urban centres, which were less affected by the armed confl ict than rural areas. The latest household survey (2001) showed that 40% of household heads were jobless, while urban unemployment stood at 46%. It indicated that one-fi fth of all children aged 5 to 14 years perform various jobs and 42% of children of poor families are engaged in household work.
Efforts are being made to increase availability of health services, but only 30% of the population has access to basic health services within 5 km from their place of residence. According to UNICEF, Angola has the world’s third highest child mortality rate, while its maternal mortality rate is also one of the highest. On the other hand, Angola’s HIV/AIDS prevalence rate, at an estimated 4.1% in 2003, was relatively low by the dramatic standards of southern Africa. Angola has an estimated literacy rate of 58% (compared with a 38 per-cent average for Africa), and its educational indicators rank among the lowest in the world. A fi nal version of Angola’s poverty reduction strategy is due to be issued in late 2005.
Major human development indicators such as food security and access to health and education services, deteriorated sharply during the war and are still at very low levels. In the 1990s, the international community was deeply involved in alleviating the Angolan humanitarian crisis and the country received considerable assistance, including food support. Donors’ current strategy is to move from emergency interventions to a development approach, focusing their initiatives on infrastructure, the social sectors, good governance and transparency. On the latter, donors are pressing the authorities to step up the fi ght against corruption and allocate increasing oil revenues to poverty reduction.
218590_p029-040_chap01.indd 40218590_p029-040_chap01.indd 40 21/09/06 11:31:1321/09/06 11:31:13
© O
ECD
/IEA
, 200
6
ELECTRICITY - 41
II. ELECTRICITY
OVERVIEW OF SECTOR
Most existing infrastructure in the electricity sector was built well before independence, which occurred in 1975. Much was damaged during the civil war or has not received routine maintenance, in part due to war-related access problems. Only a small percentage of the population has access to electricity, and service is generally unreliable.
State-owned ENE has 900 MW of installed capacity on three non-interconnected networks and several smaller isolated grids. Only about 70% is operational, though this is an improvement over the civil war period. Hydro accounts for a little over 60% of installed capacity, while the rest is primarily diesel-fi red thermal.
The Northern grid contains signifi cant overcapacity, though major outages occur in all three networks due in large part to signifi cant problems in transmission and distribution. The Central and Southern grids are often supply-constrained. A major goal of the government and ENE is to interconnect the three main systems to exploit the North’s over-capacity. There are hopes that a proposed power transit project from the Democratic Republic of Congo to South Africa could link Angola’s three major grids along the way.
State-owned EDEL is responsible for distribution in the capital, Luanda, which accounts for over 65% of the country’s consumption.
There are also a number of small grids, some of which were once part of larger systems but now isolated due to damage to the transmission network. Many municipal authorities in large towns also run their own isolated generation and supply services. In addition, most industries and many households have their own backup generation to compensate for frequent outages of grid supplies, leading to very high electricity costs for many consumers in practice, despite low tariffs.
Almost all isolated and backup systems run on diesel. Extremely poor conditions on road and rail networks make fuel supply to isolated systems diffi cult.
The Ministry of Finance sets electricity tariffs that are uniform throughout the country. These currently are at levels that do not cover costs. There are plans to raise tariffs to cover long-run costs to ensure suffi cient investment income for rehabilitation and expansion. However, a more serious problem may be low bill collection rates.
© O
ECD
/IEA
, 200
6
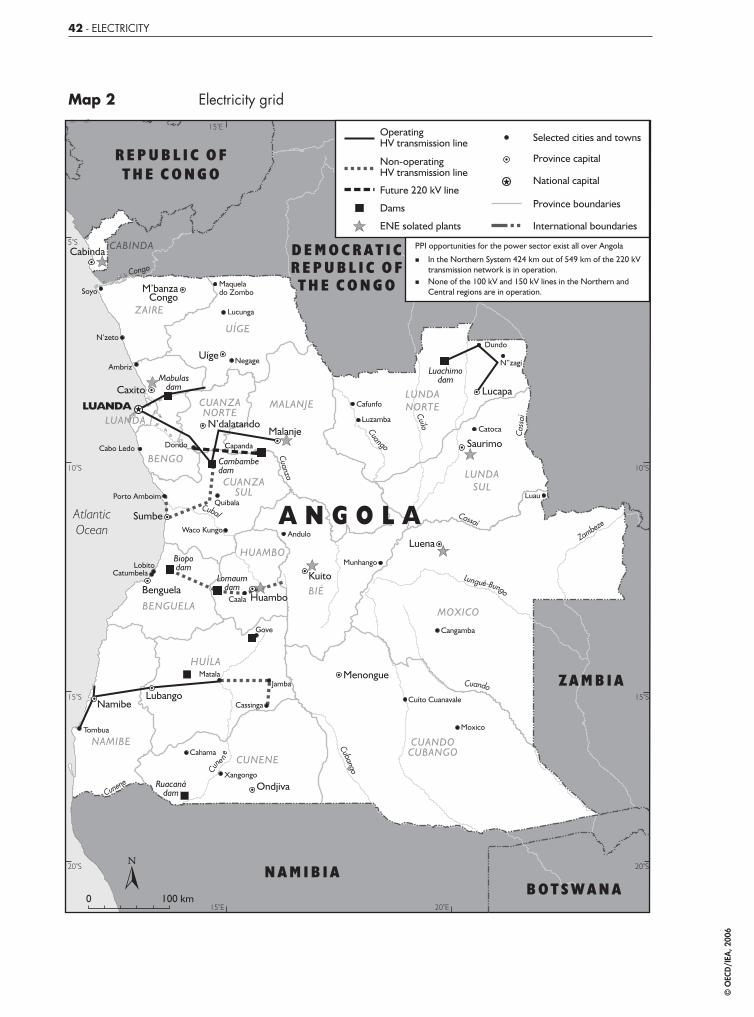
42 - ELECTRICITY
Map 2 Electricity grid
© O
ECD
/IEA
, 200
6
ELECTRICITY - 43
Estimates for the share of population with access to electricity vary from 8% to 20%. This wide range is due primarily to uncertainties regarding the size and number of isolated municipal grids and household generating sets, the number of illegal connections, and even uncertainty about the size of the country’s total population.
As of mid-2005 the government had yet to decide ENE’s fi nal structure. The main option currently being considered is to break the utility into a number of separate generation companies that eventually could be privatised, leaving ENE to focus primarily on transmission. There is no plan yet regarding how the eventual electricity market will look, including how independent generating companies, including possible new private entrants, would sell their power.
Although Angola is a member of both the Southern African Power Pool (SAPP) and Energy Pool of Central Africa (PEAC), it currently does not have any interconnections with its neighbours, apart from isolated lines serving several towns on the country’s southern border with Namibia.
MAIN ACTORS
The main actors in the electricity sector are the following:
■ The Ministry of Energy and Water (Ministério da Energia e Águas – MINEA) is the government’s main policy-making institution in the electricity sector. Its National Directorate for Energy (DNE) is responsible for planning, co-ordination, and supervision of generation, transmission and distribution.
■ The Ministry of Finance sets tariffs and subsidy levels.
■ Empresa Nacional de Electricidade (ENE) is the state-owned utility responsible for generation, transmission and distribution of electricity in Angola’s three main grids and a number of isolated systems, operating in 15 out of Angola’s 18 provinces.6 It was created in 1980 by combining several separate entities. In 1998 ENE was transformed into a “public entity”, giving it a legal status separate from that of the government.
■ Empresa de Distribuição de Electricidade (EDEL) is the state-owned distribution company responsible for electricity supply in the capital city of Luanda. Approximately 80% of its customer base is residential. It purchases all of its electricity from ENE, and like ENE has “public entity” status.
6. It does not operate in the remote Zaire, Cuando Cubango or Lunda Norte provinces, where rudimentary service is provided by a few municipal authorities.
© O
ECD
/IEA
, 200
6
44 - ELECTRICITY
Municipal authorities in some towns run their own isolated electricity generation and distribution services.
Instituto Regulador de Sector Eléctrico (IRSE) is the electricity sector regulator. It was established by decree in 2002, though by mid-2005 was not yet operational.
Hidrochicapa is the country’s fi rst (and so far only) independent power producer. The Russian mining entity Alrosa formed Hidrochicapa with ENE and other partners to build a 16-MW hydro-electric dam to supply its diamond mining operations in Lunda Sul province. About 2 MW will be used to supply a small local network.
SECTOR POLICY
The main policy document for the electricity sector is the “Strategy for the Development of the Electricity Sector of Angola” (Estratégia de desenvolvimento do sector eléctrico de Angola), drafted in mid-2002 by an inter-ministerial working group that included MINEA and the two main utilities.7 It provides an overview of sector problems, a short-term Rehabilitation Plan, and principles for a longer-term Development Strategy.
Although the Strategy continues to represent government policy, it is currently being updated to refl ect developments since 2002, especially regarding investment priorities. Para. 176 calls for the Strategy to be updated annually, though this will be the fi rst update. Signifi cant revision to the investment priorities is already refl ected in the 2004 Investment Portfolio (Carteira de Investimentos) issued by the Ministry of Energy and Water as a guide for foreign investors and donors (see Investment plans, below).
The overall goal during the fi rst, fi ve-year rehabilitation phase (assumed to be 2002-2007, though not specifi ed), is to make priority repairs to infrastructure damaged during the war. The utilities are also to solidify their fi nancial positions during this period by raising tariffs to cover costs and improving billing and collection performance. The utilities are also to conduct training to improve the technical, managerial and commercial skills of staff. Major expansion is expected only after the rehabilitation phase.
Increased access of the population to electricity is one of the government’s strategic objectives, in part because it sees this as a way to improve the quality of life for those who live in the interior, thereby reducing incentives for internal migration. Related to this, the government hopes to reduce regional asymmetries in access.8
7. The version referred to in this report is dated July 2002.8. As an example of such asymmetries, it points out that Luanda, with 30% of the country’s population, consumes over
70% of its electricity. However, it admits that “there does not currently exist solid statistical data to calculate, or indicators that would permit evaluation of, the extent of regional asymmetries”. All quotes from the 2002 Strategy are unoffi cial translations by the IEA from the Portuguese original.
© O
ECD
/IEA
, 200
6
ELECTRICITY - 45
According to the Strategy, the following general principles are to guide policy in the sector in the long run:
■ Promote the development of the electricity supply systems necessary to guarantee economic growth at least cost to society, while adequately protecting the environment.
■ Promote economic effi ciency through a price policy that ensures competition in the sector and refl ects the real cost of supply.
■ Promote exploitation of national resources, particularly through the use of hydropower and natural gas, to satisfy internal demand as well as export opportunities.
■ Promote local initiative and participation of local entities in the development of the electricity sector.
■ Promote the participation of private investment in the development of the electricity sector, including assuring private investors, while safeguarding the public and national interests.
This appears to be a reasonable set of principles to guide the sustainable development of the sector. Concrete actions taken by the government in some of these areas are discussed in the relevant sections below. However, many of the principles have yet to be refl ected in practice.
Restructuring plans
The Strategy calls for sector restructuring to proceed from the following principles, which it notes have already been recognised in the 1996 General Law on Electricity:
■ Unbundling of production, transmission and distribution, allowing new entrants.
■ Open access to the transmission system.
■ Regrouping and regionalisation of distribution, permitting competition between distributors.
■ Transparency regarding the relationship between quality of service and tariffs, and a fair remuneration for the investor.
■ Regulation of the electricity market.
According to the Strategy, ENE is to establish accounting procedures that permit the fi nancial unbundling of its production, transmission and distribution activities, making it possible to analyse the costs of each. This is now reportedly in progress, although there is no timetable for eventual physical unbundling, and as of mid-2005 the government had yet to decide ENE’s fi nal structure.
© O
ECD
/IEA
, 200
6

46 - ELECTRICITY
The Luanda distribution company, EDEL, may also be broken into a number of companies, though it apparently has not been decided whether these would compete or operate exclusive concessions.
LEGAL FRAMEWORK
This section provides a brief overview of some of the main laws and decrees affecting the electricity sector.
■ General Electricity Act No. 14-A/96 of 31 May 1996 is the main law for the electricity sector. Among other provisions, it allows private participation in generation and distribution and envisions competition in these areas. It grants investors the right to obtain suffi cient income to cover costs arising from their operations, as well as a return on their investment. It also gives the Council of Ministers authority to establish a regulator. The Electricity Act notes that the Council of Ministers is responsible for granting “concessions” in cases where capacity is either greater than 1 MW or the relevant supply consists of over 50 000 persons; in other cases a “license” is granted by the relevant local authority. (However, Law 5/02, which apparently supersedes the Electricity Act, effectively requires concessions in all cases, leading to some confusion on this issue.)
■ Decree 20/90 of 1990 gives the Ministry of Finance the authority to set tariffs.
■ Decree 45/01 of 2001 on tariffs requires uniform national tariffs, including for small-scale distribution schemes, although makes allowance for the approval of some differences based on geography and system characteristics.
■ Decree 43/01 of 2001 provides temporary exclusive distribution concessions to ENE and EDEL through 2003. (After the expiration of this decree in 2003, these utilities apparently no longer have de jure exclusive status in their distribution areas.)
■ Decree 4/02 of 2002 establishes the Instituto Regulador de Sector Eléctrico (IRSE) and sets out some of its powers. The powers of the regulator notably do not include granting concessions or licenses, or setting tariffs.
REGULATION
Although the Council of Ministers established the IRSE in 2002, as of mid-2005 the regulator was not yet operational. According to MINEA, the main barrier has been fi nding appropriately qualifi ed senior staff to serve on the commission. A four-person committee was recently appointed to establish a three-person regulatory commission, although there is apparently no fi rm timeframe for this.
© O
ECD
/IEA
, 200
6

ELECTRICITY - 47
According to Decree 4/02, the main role of the regulator will be to ensure fulfi lment of the General Electricity Law. It will also serve as a dispute resolution body between actors in the sector. The regulator will be able to issue fi nes, which companies may appeal.
The regulator is to be fi nanced from the state budget, which could impinge on its independence. Regulators in many IEA countries are fi nanced independently from government via a tax on electricity and/or through fi nes.
Tariff-setting According to Decree 4/02, the regulator will not have the authority to set tariffs, a function that the Ministry of Finance will continue to exercise. Nevertheless, the regulator’s Tariff Council will be able to make recommendations to the government.
Regulators in some IEA countries also do not have powers to set end-use tariffs, though in many cases this is because end-use prices are set by competitive markets. In the case of Angola, investors may not be reassured by direct government control over tariffs, given the government’s long history of maintaining prices below the cost of production. Giving tariff-setting responsibility to a regulator that is politically independent of the government could be an important way to reassure investors that tariffs will cover investment costs and that tariff policy will not be used to satisfy possible short-term political or social welfare goals of the government. This also applies in cases where investors do not receive tariffs directly from end-users but are paid by a state-owned utility, such as ENE or EDEL, since the reliability of the utility’s payments may be questioned if the utility is not allowed to cover its costs.9 According to the Ministry of Finance, the government may be reconsidering its decision not to give tariff-setting powers to the new regulator.
Transfer tariff-setting powers from government to an independent regulator: in order to ensure adequate investment funds in the sector and reassure potential investors, the government should consider transferring tariff-setting powers to an independent regulator.
While price-setting powers and independence for the regulator will be important for reassuring private investors, these conditions will not be suffi cient on their own. For example, potential independent power producers will not be confi dent of getting paid if the utility buying its power has a low billing and collection rate, no matter how high tariffs are. In addition, investors will look for a good track record by the government in upholding contracts and a good investment climate generally. While the IEA would encourage the government to make the regulator operational as soon
9. Subsidy payments by the government to the utility are no compensation for cost-covering tariffs, since it is always possible the government will withdraw such subsidies or withhold their payment during periods of budget diffi culty – a point brought home by the Angolan government’s recent history of not paying agreed subsidies to ENE and EDEL in full.
© O
ECD
/IEA
, 200
6
48 - ELECTRICITY
as possible, and to include tariff-setting among its powers, it may be more important for the government to tackle several other issues fi rst in order to ensure suffi cient investment in the power sector. These notably include improving the climate for foreign investment in general, and improving utilities’ billing and collection rates (see related recommendation on the latter).
Concessions and licences
The new regulator will not have authority to issue concessions/licenses, powers which are reserved for the Council of Ministers and local authorities respectively. According to the 1996 Electricity Act, concessions, which apparently are exclusive, are required in cases where capacity is greater than 1 MW or the relevant town contains over 50 000 inhabitants. In all other cases an (apparently non-exclusive) license from the local authority is required. However, PPIAF and World Bank (2005) point out that Law 5/02, which supposedly supersedes the Electricity Act, effectively requires all electricity distribution schemes – no matter how small – to be operated as a concession. The IEA agrees with the authors of that report that this has the potential to become a cumbersome barrier for implementing small electricity distribution projects, e.g., in small towns and rural areas. At a minimum, it probably requires clarifi cation of the division of authority between the Council of Ministers and local authorities for small systems. (For large ones it is clear that the Council of Ministers must issue a concession.) While one way to clarify this issue could be to give the new regulator the authority to license all actors (as suggested in the PPIAF/World Bank report), the overriding issue is the necessity to clarify procedures and remove barriers for developers of small systems in order to facilitate electrifi cation.
Clarify licensing and regulatory procedures for small systems: in order to promote electrifi cation, the government should ensure a light-handed regulatory approach that removes barriers and clarifi es and simplifi es procedures for setting up small electricity generation and distribution projects.
See also recommendation, Promote rural electrifi cation by removing barriers.
GENERATION CAPACITY
ENE is currently responsible for most generation facilities in the country. The main exceptions are the unknown capacity and number of small generating units operated by some city governments to supply isolated municipal networks, as well as backup generation units operated by most industries and many households.
At the beginning of 2005, ENE reported that total installed generating capacity in its three large grids and fi ve major isolated grids stood at 901.6 MW, of which about 61.1% was hydro and 38% thermal. Some 68.4% of total installed capacity was considered operational. This included two units (2 x 130 MW) of the new Capanda hydroelectric plant that came online in 2004. Capanda’s expected eventual total
© O
ECD
/IEA
, 200
6
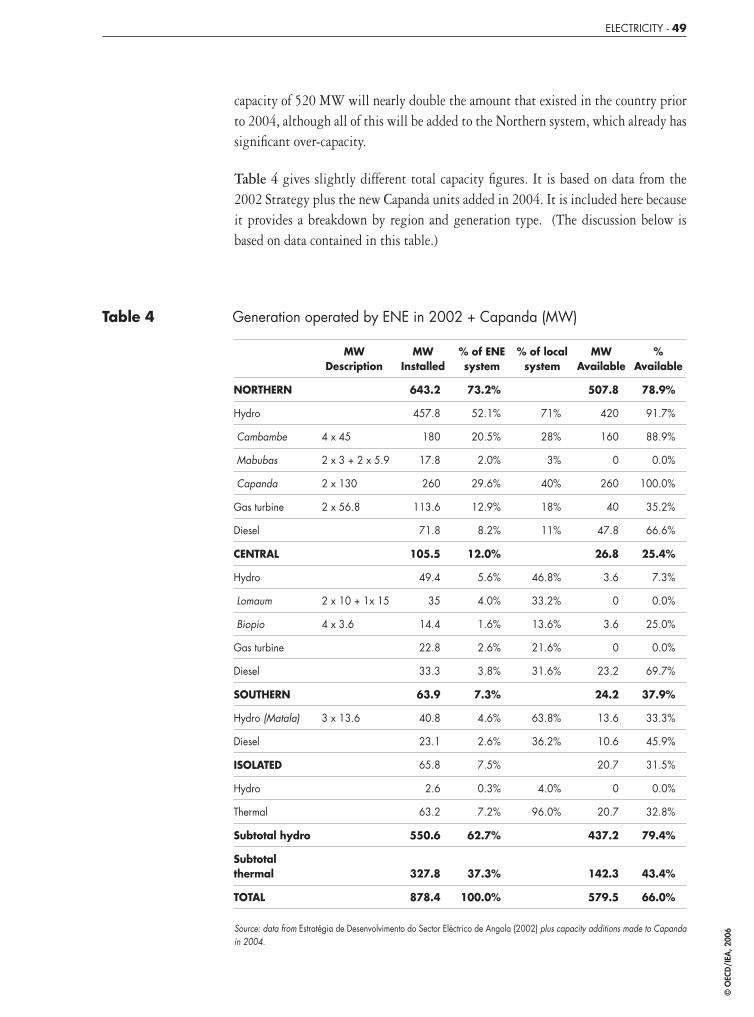
ELECTRICITY - 49
capacity of 520 MW will nearly double the amount that existed in the country prior to 2004, although all of this will be added to the Northern system, which already has signifi cant over-capacity.
Table 4 gives slightly different total capacity fi gures. It is based on data from the 2002 Strategy plus the new Capanda units added in 2004. It is included here because it provides a breakdown by region and generation type. (The discussion below is based on data contained in this table.)
Table 4 Generation operated by ENE in 2002 + Capanda (MW)
MWDescription
MWInstalled
% of ENE system
% of local system
MWAvailable
%Available
NORTHERN 643.2 73.2% 507.8 78.9%
Hydro 457.8 52.1% 71% 420 91.7%
Cambambe 4 x 45 180 20.5% 28% 160 88.9%
Mabubas 2 x 3 + 2 x 5.9 17.8 2.0% 3% 0 0.0%
Capanda 2 x 130 260 29.6% 40% 260 100.0%
Gas turbine 2 x 56.8 113.6 12.9% 18% 40 35.2%
Diesel 71.8 8.2% 11% 47.8 66.6%
CENTRAL 105.5 12.0% 26.8 25.4%
Hydro 49.4 5.6% 46.8% 3.6 7.3%
Lomaum 2 x 10 + 1x 15 35 4.0% 33.2% 0 0.0%
Biopio 4 x 3.6 14.4 1.6% 13.6% 3.6 25.0%
Gas turbine 22.8 2.6% 21.6% 0 0.0%
Diesel 33.3 3.8% 31.6% 23.2 69.7%
SOUTHERN 63.9 7.3% 24.2 37.9%
Hydro (Matala) 3 x 13.6 40.8 4.6% 63.8% 13.6 33.3%
Diesel 23.1 2.6% 36.2% 10.6 45.9%
ISOLATED 65.8 7.5% 20.7 31.5%
Hydro 2.6 0.3% 4.0% 0 0.0%
Thermal 63.2 7.2% 96.0% 20.7 32.8%
Subtotal hydro 550.6 62.7% 437.2 79.4%
Subtotal thermal
327.8 37.3%
142.3 43.4%
TOTAL 878.4 100.0% 579.5 66.0%
Source: data from Estratégia de Desenvolvimento do Sector Eléctrico de Angola (2002) plus capacity additions made to Capanda in 2004.
© O
ECD
/IEA
, 200
6
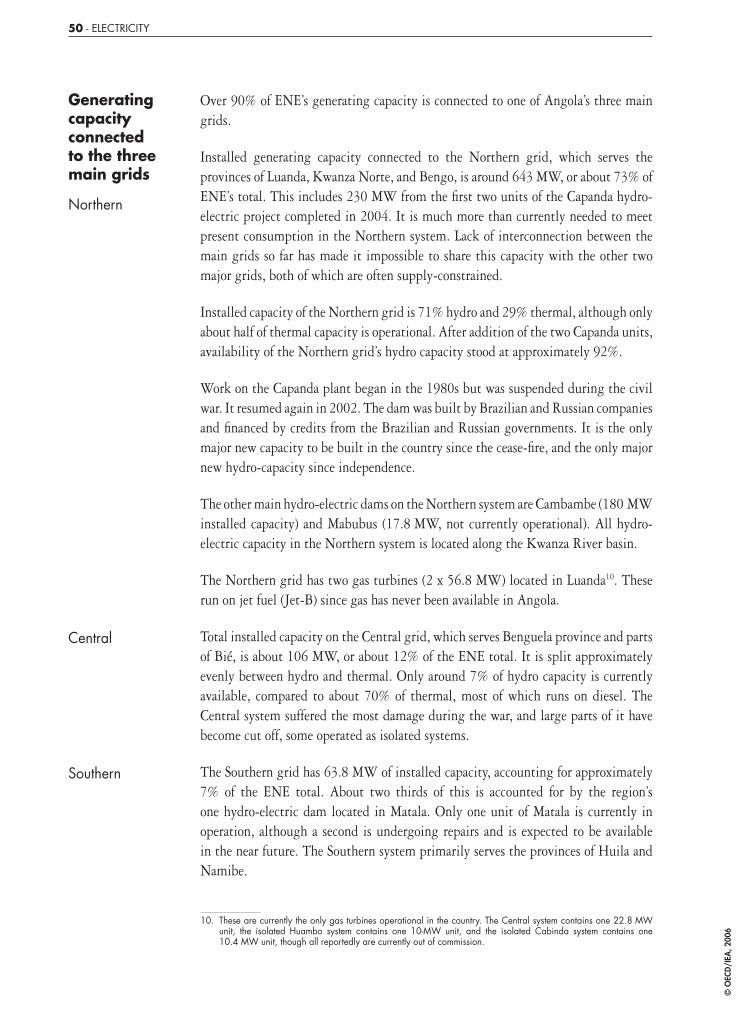
50 - ELECTRICITY
Generating capacity connected to the three main grids
Northern
Over 90% of ENE’s generating capacity is connected to one of Angola’s three main grids.
Installed generating capacity connected to the Northern grid, which serves the provinces of Luanda, Kwanza Norte, and Bengo, is around 643 MW, or about 73% of ENE’s total. This includes 230 MW from the fi rst two units of the Capanda hydro-electric project completed in 2004. It is much more than currently needed to meet present consumption in the Northern system. Lack of interconnection between the main grids so far has made it impossible to share this capacity with the other two major grids, both of which are often supply-constrained.
Installed capacity of the Northern grid is 71% hydro and 29% thermal, although only about half of thermal capacity is operational. After addition of the two Capanda units, availability of the Northern grid’s hydro capacity stood at approximately 92%.
Work on the Capanda plant began in the 1980s but was suspended during the civil war. It resumed again in 2002. The dam was built by Brazilian and Russian companies and fi nanced by credits from the Brazilian and Russian governments. It is the only major new capacity to be built in the country since the cease-fi re, and the only major new hydro-capacity since independence.
The other main hydro-electric dams on the Northern system are Cambambe (180 MW installed capacity) and Mabubus (17.8 MW, not currently operational). All hydro-electric capacity in the Northern system is located along the Kwanza River basin.
The Northern grid has two gas turbines (2 x 56.8 MW) located in Luanda10. These run on jet fuel (Jet-B) since gas has never been available in Angola.
Central Total installed capacity on the Central grid, which serves Benguela province and parts of Bié, is about 106 MW, or about 12% of the ENE total. It is split approximately evenly between hydro and thermal. Only around 7% of hydro capacity is currently available, compared to about 70% of thermal, most of which runs on diesel. The Central system suffered the most damage during the war, and large parts of it have become cut off, some operated as isolated systems.
Southern The Southern grid has 63.8 MW of installed capacity, accounting for approximately 7% of the ENE total. About two thirds of this is accounted for by the region’s one hydro-electric dam located in Matala. Only one unit of Matala is currently in operation, although a second is undergoing repairs and is expected to be available in the near future. The Southern system primarily serves the provinces of Huila and Namibe.
10. These are currently the only gas turbines operational in the country. The Central system contains one 22.8 MW unit, the isolated Huambo system contains one 10-MW unit, and the isolated Cabinda system contains one 10.4 MW unit, though all reportedly are currently out of commission.
© O
ECD
/IEA
, 200
6
ELECTRICITY - 51
Table 5 Generation serving isolated grids operated by ENE in 2002
MWInstalled
MWAvailable
%Available
Cabinda 36.3 12.1 33.3%
Gas turbine 10.4 0 0.0%
Other gas 11 6.6 60.0%
Diesel 14.9 5.5 36.9%
Huambo 15.9 3.9 24.5%
Gas turbine 10 0 0.0%
Diesel 5.9 3.9 66.1%
Uige 3.2 1 31.3%
Hydro (Luquixe) 1 0 0.0%
Diesel 2.2 1 45.5%
Bie 5 1.5 30.0%
Hydro (Cunje) 1.6 0 0.0%
Diesel 3.4 1.5 44.1%
Malange (Diesel) 2 1 50.0%
Moxico (Diesel) 1.1 0 0.0%
Bengo (Diesel) 2.3 1.2 52.2%
TOTAL isolated 65.8 20.7 31.5%
Hydro 2.6 0 0.0%
Thermal 63.2 20.7 32.8%
Source: data from Estratégia de Desenvolvimento do Sector Eléctrico de Angola (2002).
A small isolated system along Cunene province’s border with Namibia is formally considered part of the Southern system, although it is not interconnected with it. It has no generation capacity of its own, receiving all its power from Namibia’s Nampower across the border.
Generating capacity of the isolated grids
ENE also operates seven small isolated grids in the following provinces: Cabinda, Huambo, Uige, Bié, Malange, Moxico, and Bengo. The largest serves the Cabinda enclave, which is home to much of the country s oil industry. Total combined installed capacity on these isolated grids is 65.8 MW, of which only about 30% was operational in 2002. Approximately 96% of installed capacity in the isolated grids is thermal, almost all of which is diesel-fi red. The Uige and Bié grids each contain one small hydro-electric dam (1 MW and 1.6 MW), although neither is currently operational.
ENE also runs a number of smaller isolated systems for several other municipalities. In addition, a large number of municipalities run their own isolated grids. ENE provides technical assistance to some of these. Comprehensive data on the number and capacities of the smaller isolated and municipal systems are not available, but information provided by local ENE offi cials at the headquarters for the Southern grid in Lubango may be indicative. For example, ENE supplies nine municipalities in Huila and Namibe provinces via the grid, while some 16 towns operate their own systems. The isolated municipal systems typically consist of one or two generators
© O
ECD
/IEA
, 200
6
52 - ELECTRICITY
of 250-500 kW each, most of which operate for only 4-5 hours per day, depending on the availability of diesel. At least half of the municipalities connected to ENE’s Southern grid reportedly also have their own small-scale backup generation.
The Russian diamond mining company, Alrosa, is constructing a 16-MW hydro-electric plant on the Chicapa River in Lunda Sul province in the isolated Northeast of the country, an area not served by any grid. The project will mainly serve Alrosa’s own mining operations, although approximately 2 MW will power a small local network around the town of Saurimo. This is so far the only private power scheme in Angola.
Self-generation
Almost all industries reportedly have their own generating capacity to compensate for erratic grid supplies. For example, the Luanda refi nery has 10-12 MW of generating capacity. However, most also take power from the grid when it is available.
None of this self-generation capacity is reportedly fed into ENE or EDEL’s systems, but used exclusively by the owners when grid supplies are out. However, there are reports that some auto-generation is used to power informal networks for surrounding businesses and households.
The total amount of self-generation capacity is unknown, though most estimates are around 20% of the country’s total, implying about 225 MW. However, some estimate that the amount of self-generation capacity could be almost equal to that of grid-based capacity, i.e., around 900 MW.
Virtually all self-generation capacity is diesel-fi red. As much as 35% of all diesel consumption may be used in small backup generators, including those operated by households.
While the number of households possessing generator sets is unknown, informal estimates by government offi cials suggest it may be as high as 75% in some urban areas. IEA discussions with residents in an informal settlement in Casenga suggest that as many as 30% of households may possess small generators in this suburb of Luanda. Offi cials in Huila province in the South of the country similarly estimate that as many as one third of Huila households may possess generating sets, including in rural areas. However, proximity to Namibia may make availability in Huila higher than in most other parts of the country.
According to interviews carried out for a USAID programme in 2002, dealers in Luanda estimated that around 2 000 small generating sets were sold in the capital that year. Generating sets for households are typically 30 kW, ranging up to 1 000 kW for some commercial entities.
Hydro potential
Angola has signifi cant water resources. Some 47 hydrological basins provide an annual fl ow of around 140 cubic km, one of the highest in Southern Africa. The former Portuguese colonial administration made extensive surveys of the country’s water resources. Estimates of economically available hydropower potential vary, but are thought to be around 18 GW, with the possibility for producing some 72 TWh
© O
ECD
/IEA
, 200
6
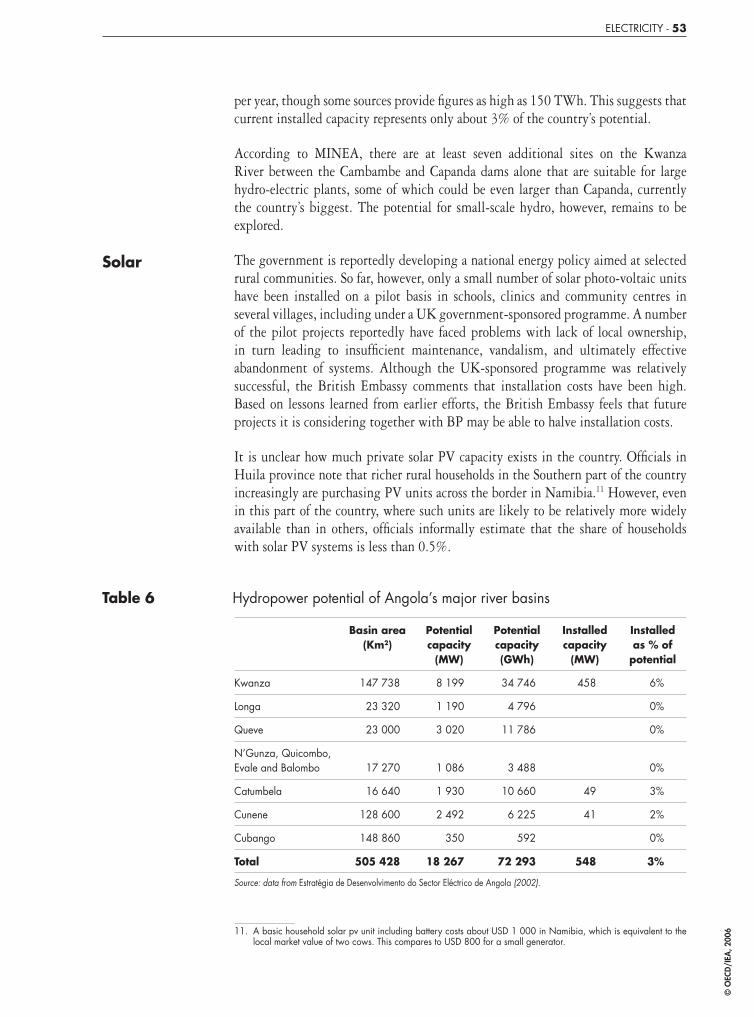
ELECTRICITY - 53
per year, though some sources provide fi gures as high as 150 TWh. This suggests that current installed capacity represents only about 3% of the country’s potential.
According to MINEA, there are at least seven additional sites on the Kwanza River between the Cambambe and Capanda dams alone that are suitable for large hydro-electric plants, some of which could be even larger than Capanda, currently the country’s biggest. The potential for small-scale hydro, however, remains to be explored.
Solar The government is reportedly developing a national energy policy aimed at selected rural communities. So far, however, only a small number of solar photo-voltaic units have been installed on a pilot basis in schools, clinics and community centres in several villages, including under a UK government-sponsored programme. A number of the pilot projects reportedly have faced problems with lack of local ownership, in turn leading to insuffi cient maintenance, vandalism, and ultimately effective abandonment of systems. Although the UK-sponsored programme was relatively successful, the British Embassy comments that installation costs have been high. Based on lessons learned from earlier efforts, the British Embassy feels that future projects it is considering together with BP may be able to halve installation costs.
It is unclear how much private solar PV capacity exists in the country. Offi cials in Huila province note that richer rural households in the Southern part of the country increasingly are purchasing PV units across the border in Namibia.11 However, even in this part of the country, where such units are likely to be relatively more widely available than in others, offi cials informally estimate that the share of households with solar PV systems is less than 0.5%.
Table 6 Hydropower potential of Angola’s major river basins
Basin area(Km2)
Potential capacity
(MW)
Potential capacity(GWh)
Installed capacity
(MW)
Installed as % of
potential
Kwanza 147 738 8 199 34 746 458 6%
Longa 23 320 1 190 4 796 0%
Queve 23 000 3 020 11 786 0%
N’Gunza, Quicombo, Evale and Balombo 17 270 1 086 3 488
0%
Catumbela 16 640 1 930 10 660 49 3%
Cunene 128 600 2 492 6 225 41 2%
Cubango 148 860 350 592 0%
Total 505 428 18 267 72 293 548 3%
Source: data from Estratégia de Desenvolvimento do Sector Eléctrico de Angola (2002).
11. A basic household solar pv unit including battery costs about USD 1 000 in Namibia, which is equivalent to the local market value of two cows. This compares to USD 800 for a small generator.
© O
ECD
/IEA
, 200
6
54 - ELECTRICITY
The government should continue to look for autonomous options, like stand-alone PV, for meeting energy needs of rural population, including for hospitals, schools and telecommunications, with specifi c attention to local conditions and should develop a clearer strategy.
TRANSMISSION
ENE has around 2 000 km of transmission lines above 60 kV, slightly less than half of which were operational in 2003. Voltages in the transmission system are 220, 150, 110, 60 and 30 kV. Estimates of installed and available lines are shown in Table 7.
The main transmission voltage of the Northern grid is 220 kV, and over 75% of this network remains intact. However, much of the Northern system’s 110-kv and 60-kV networks are out of commission. ENE notes that additional high-voltage lines will be needed to ensure supply security to Luanda, including taking full advantage of new generation capacity at Capanda.12
The Central grid was the one most heavily damaged during the civil war, and large sections remain destroyed or isolated.
The area covered by the Southern grid saw comparatively less action during the civil war. As a result, much of this grid remains in operation. The main exception is the 150-kV network, of which only around 60% of installed lines are intact.
A major goal of the Angolan authorities is to connect the Central and Southern grids to the Northern in order to more effectively use the North’s generating capacity. The proposed Western Corridor project to export power from the Democratic Republic of Congo to South Africa via Angola includes a high-voltage transmission line that potentially could accomplish this internal interconnection as a by-product, although the timing of this project discussed in more detail below is currently uncertain.
DISTRIBUTION
EDEL is responsible for electricity distribution in Luanda and accounts for about 65% of all electricity distributed in the country. ENE handles distribution in most other major cities, while some municipalities run their own isolated systems.
12. According to EDEL’s 2003 annual report, power cuts to one or more of Luanda’s fi ve substations totaled around 235 hours in 2003 (108 incidents), up from 115 hours (57 incidents) in 2002, though down from about 238 hours (95 incidents) in 2001.
© O
ECD
/IEA
, 200
6

ELECTRICITY - 55
Table 7 Transmission lines installed and available in 2003 (km)
Northern Central Southern Isolated System total
220 kV 549 549
Available 424 424
% available 77% 77%
150 kV 92 288 380
Available 0 168 168
% available 0% 58% 44%
110 kV 159 159
Available 0 0
% available 0% 0%
60 kV 239 134 320 38 731
Available 15 51 252 38 318
% available 6% 38% 79% 100% 44%
30 kV 22 210 22
Available 22 0 22
% available 100% 0% 100%
Total installed 947 226 630 248 2 051
Total available 439 51 442 38 970
% available 46% 23% 70% 15% 47%
Source: data from Strategy (2002) and ENE 2003 estimates.
Many stakeholders mention the distribution system as an important bottleneck in electricity supply. For example, the Ministry of Industry notes that companies connected to the high-voltage network generally are better off than those connected to the distribution grid, with the result that those connected to ENE are less often forced to rely on expensive backup generation.
Luanda EDEL purchases all of its electricity from ENE and distributes it to the capital city of Luanda and environs.
EDEL operates 57 km of 60-kV high voltage lines connected to fi ve substations with the following capacities:
Cuca substation 2 × 40 MVAMutamba substation 2 × 20 MVAMaianga substation 2 × 20 MVANova Vida substation 2 × 35 MVAGolfe substation 1 × 20 MVA
© O
ECD
/IEA
, 200
6
56 - ELECTRICITY
Substation capacity is an important bottleneck. The company routinely must engage in load-shedding of 15-20 MW between 6-10 PM, rotating blackouts across the system. This practice contributes to equipment wear.
EDEL’s medium-voltage network consists of about 40 km of 15-kV lines that connect 372 public transformer stations and 347 private transformer stations; the latter are for medium-voltage customers that also pay a capacity charge. Transformer capacities are 1 000 kVA, 800 kVA, 630 kVA and 400 kVA.
EDEL’s low-voltage network consists of about 1 850 km of 0.4-kV lines connected to 1 488 distribution boxes.
EDEL has around 110 000 offi cially registered customers, of which over 90% are households. Most of the rest are low-voltage commercial, services or government customers.
The company also has a large but unknown number of illegal connections, contributing to the unreliability of supply. (EDEL estimates the number of illegal customers on its grid is around 32 000.) “Non-technical” losses related to such customers are estimated to be around 20%.
Much of the system is old and has not received adequate routine maintenance, in part due to lack of fi nance from tariffs that do not cover costs. As a result, outages are chronic.
Outside Luanda
ENE is responsible for distribution in 42 of the country’s 163 municipalities. It serves about 30 of these through one of its three major grids, and the rest via isolated systems. In addition, at least 23 municipalities operate their own isolated systems, some with assistance from ENE. There is no data on the country’s remaining municipalities, although it is believed that a large number of these also operate small isolated distribution systems. Small systems reportedly typically consist of fewer than 100 households.
In 2003, ENE had about 110 000 offi cially registered customers throughout the country (almost identical to the number of offi cial EDEL customers). Approximately 4 000 of these were medium or high-voltage customers in the capital region. Similar to EDEL, ENE is faced with a high level of electricity theft from unregistered consumers.
Electricity supply in most distribution systems outside Luanda is reportedly even less reliable than it is in the capital. The government notes in its 2005 portfolio for potential foreign investors that supply to the country’s main urban centres and suburbs “can be rated as precarious in most of the cases”.
© O
ECD
/IEA
, 200
6

ELECTRICITY - 57
PRODUCTION, CONSUMPTION AND LOSSES
Production ENE accounts for most electricity production in the country, including that distributed by EDEL in Luanda. The main exceptions are production in isolated municipal grids, as well as backup production by industries, small businesses and households for their own use.
ENE produced about 2.2 GWh in 2004, nearly two thirds from hydro-power, with most of the rest from diesel-fi red thermal. This represents only a slight increase in the share of thermal since 2001. However, the opening of the fi rst two units of the new Capanda dam is likely to lead to a rise in hydro’s share in coming years.
Generation connected to ENE’s Northern system represented over 80% of the utility’s total 2004 production, compared to about 77% of the total in 2001. The Central and Southern grids represented only 5% and 6% of the 2004 total respectively, both smaller than the combined 8% share of the main isolated grids.
Total production grew by 8% in 2002 and by about 12% the following two years. Growth in the Northern grid as a whole was about 16% in 2004, though MINEA notes that consumption growth in Luanda was about 20%.
Table 8 ENE electricity production 2001-2004 (MWh)
2001 2002 2003 2004
NORTH Thermal 353 944 372 843 505 220 564 192
Hydro 910 338 1 029 285 1 059 162 1 254 104
Sub-Total 1 264 282 1 402 128 1 564 382 1 818 296
CENTRAL Thermal 134 081 112 525 73 203 67 351
Hydro 12 040 29 042 75 963 50 414
Sub-Total 146 120 141 567 149 166 117 765
SOUTH Thermal 30 743 35 538 26 049 14 252
Hydro 94 250 84 911 105 410 117 434
Sub-Total 124 993 120 449 131 459 131 686
ISOLATED Thermal 102 681 103 625 152 624 172 624
Hydro 0 0 0 3 266
Sub-Total 102 681 103 625 152 624 175 890
TOTAL Thermal 621 448 624 531 757 096 818 419
Hydro 1 016 628 1 143 238 1 240 535 1 425 218
Total 1 638 075 1 767 769 1 997 631 2 243 637
Source: data from ENE.
© O
ECD
/IEA
, 200
6
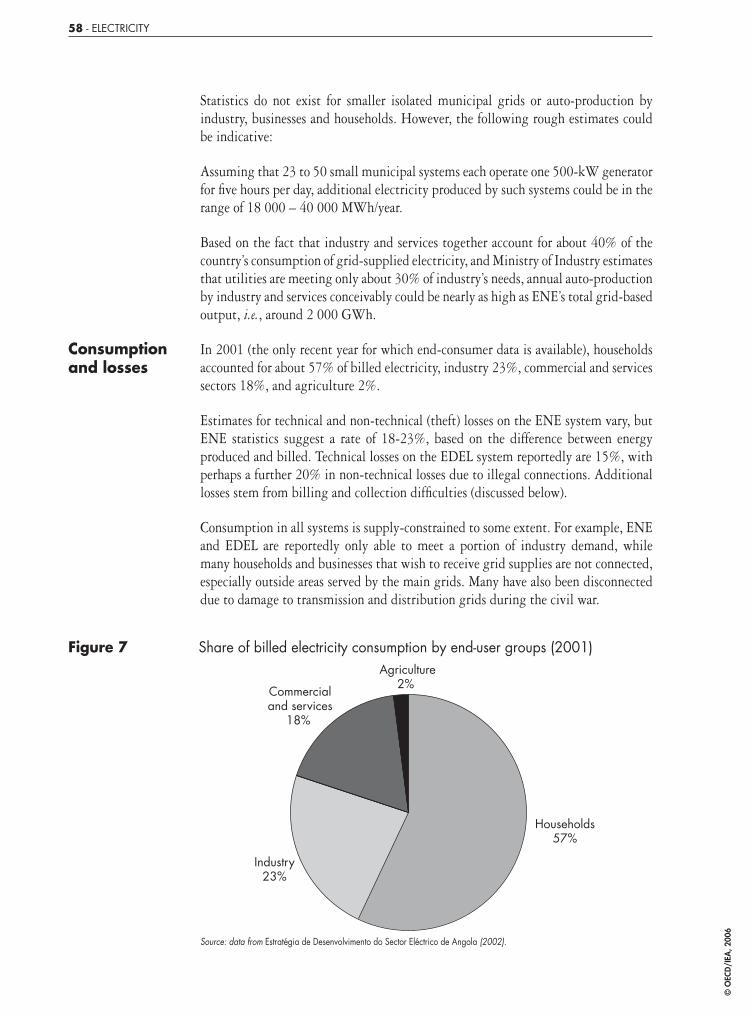
58 - ELECTRICITY
Statistics do not exist for smaller isolated municipal grids or auto-production by industry, businesses and households. However, the following rough estimates could be indicative:
Assuming that 23 to 50 small municipal systems each operate one 500-kW generator for fi ve hours per day, additional electricity produced by such systems could be in the range of 18 000 – 40 000 MWh/year.
Based on the fact that industry and services together account for about 40% of the country’s consumption of grid-supplied electricity, and Ministry of Industry estimates that utilities are meeting only about 30% of industry’s needs, annual auto-production by industry and services conceivably could be nearly as high as ENE’s total grid-based output, i.e., around 2 000 GWh.
Consumption and losses
In 2001 (the only recent year for which end-consumer data is available), households accounted for about 57% of billed electricity, industry 23%, commercial and services sectors 18%, and agriculture 2%.
Estimates for technical and non-technical (theft) losses on the ENE system vary, but ENE statistics suggest a rate of 18-23%, based on the difference between energy produced and billed. Technical losses on the EDEL system reportedly are 15%, with perhaps a further 20% in non-technical losses due to illegal connections. Additional losses stem from billing and collection diffi culties (discussed below).
Consumption in all systems is supply-constrained to some extent. For example, ENE and EDEL are reportedly only able to meet a portion of industry demand, while many households and businesses that wish to receive grid supplies are not connected, especially outside areas served by the main grids. Many have also been disconnected due to damage to transmission and distribution grids during the civil war.
Figure 7 Share of billed electricity consumption by end-user groups (2001)
Commercialand services
18%
Agriculture2%
Households 57%
Industry 23%
Source: data from Estratégia de Desenvolvimento do Sector Eléctrico de Angola (2002).
© O
ECD
/IEA
, 200
6

ELECTRICITY - 59
Figure 8 Production forecast under the 2002 strategy (GWh)
0
1 000
2 000
3 000
4 000
5 000
6 000
2006 2011 2016
Isolated systems Central systemSouthern system Northern system
Source: data from Estratégia de Desenvolvimento do Sector Eléctrico de Angola (2002).
Future production and consumption
The 2002 Strategy calls for grid-based production to nearly double from to 1 638 GWh in 2001 to 2 803 GWh by 2006, implying a yearly increase of 12% over fi ve years. It then calls for production to nearly double again to 5 505 GWh by 2016, an annual growth of 7% over the second period. However, the Strategy does not provide any macro-economic assumptions, so it is not clear what these growth forecasts are based on.
It is currently very diffi cult to forecast future electricity demand, since growth in the non-oil part of the economy is highly uncertain, depending a great deal on the ability of the government to revitalise and open the economy after more than two decades of civil war. Nevertheless, assuming elimination of major supply constraints, including interconnection of the three main grids and other improvements to transmission and distribution networks, these forecast fi gures could prove rather conservative, at least for the later fi gures. This is because much growth in grid-based supply could simply come from industry and services switching from auto-production to grid-based supplies.
As seen from the forecast of system peaks in the 2002 Strategy (Table 9), it is clear that new generating capacity, which could include imports, will be required by 2016 for the system as a whole. However, the Northern grid is expected to retain considerable excess capacity throughout the forecast period.
© O
ECD
/IEA
, 200
6

60 - ELECTRICITY
Table 9 Forecast of peak production 2006-2016
Peak production (MW)2006 2011 2016
Northern system 372.7 526.5 719.0
Central system 71.6 106.5 149.6
Southern system 25.0 33.4 45.5
Isolated systems 20.9 35.2 49.1
Uige 1.9 2.8 3.9
Bie 1.7 2.4 3.2
Cabinda 15.3 26.8 37.6
Other isolated systems 2.0 3.2 4.4
TOTAL 490.2 701.6 963.2
Source: data from Estratégia de Desenvolvimento do Sector Eléctrico de Angola (2002).
ACCESS TO ELECTRICITY
Estimates of current household access to electricity vary widely, due to uncertainties regarding the current number of connections and size of the total population, though most put the rate somewhere between 8-20%.
ENE and EDEL together have approximately 210 000 registered household consumers, including those in ENE’s isolated grids. In addition, there are 23 known isolated municipal grids, each reportedly serving around 100 households. Assuming a population of 14 million and an average of 7 persons per household suggests a formal connection rate of about 11%. If the number of informal (illegal) connections is somewhere between 20-50% the number of formal ones, the total connection rate is likely to be between 13–16%. However, assuming a higher population estimate of 17 million would lower the estimated formal connection rate to 9% and the total rate to 10-13%.
Including household generator sets could raise these fi gures signifi cantly. The 30% generator ownership rate informally estimated by provincial energy offi cials for Huila may be indicative, but is probably higher than the national average, given Huila’s relative wealth and proximity to Namibia. In any case, the fi gure for generator ownership cannot simply be added to that for grid-connected customers, since a large number of generator sets are owned by customers already connected to the grid and used primarily as backup.
The 2002 Strategy calls for increasing the household access rate from an assumed 20% in 2001 to 28% by 2006, 36% by 2011 and 46% by 2016. Although the 2002 Strategy sensibly suggests concentrating on restoring service to provincial capitals and re-connecting other isolated parts of the grid before expanding distribution into rural areas, neither the government nor the utilities have a comprehensive electrifi cation plan per se.
© O
ECD
/IEA
, 200
6
ELECTRICITY - 61
The number of legal low-voltage consumers (including commercial and services) served by ENE grew from 93 277 in 2001 to 107 850 in 2004, an annual growth of 4-5% for the fi rst few years, falling to only 1% in 2004. The total number of EDEL customers (most of which are residential) grew from about 102 000 in 2002 to 110 098 in 2003, indicating an 8% growth in the number of connections in Luanda that year. Given an estimated annual population growth of 3%, however, these rates clearly will not be enough to meet the targets in the 2002 Strategy. Moreover, internal migration to Luanda and other large cities could mean that the share of the (growing) population living in the urban areas served by the major grids is actually falling. Although migrants to large cities served by the grid will ultimately be easier to connect than those remaining in the countryside, such a population distribution may not be desirable from the perspective of the government’s overall development plans.
Informal urban and peri-urban networks
Electrifi cation of informal urban and peri-urban areas is fraught with technical and legal diffi culties in many developing countries. For example, narrow streets, informal housing and unclear land tenure often impose effective barriers that make it diffi cult for formal utilities to operate in such settlements. Nevertheless, electricity in such areas is typically widely available informally; sometimes via direct power theft from the grid by end-users or by intermediaries that run informal networks based on stolen grid power or from their own small generators. Unfortunately, such electricity is usually provided through unsafe wiring that can lead to electrocutions and fi res. Moreover, it is usually available at prices far above those charged by the legal utility – a fact that at least indicates a fairly widespread ability to pay for electricity services.
In the peri-urban areas around Luanda, EDEL notes that an unknown number of medium-voltage customers operate their own informal low-voltage networks to serve local households and small businesses.13 While such networks are technically illegal, EDEL sees them as preferable to similar connections to public transformer poles, because the informal operator in the former case is metered and thus ultimately charged for all electricity consumed.14 EDEL’s main concern regarding such systems is safety, e.g., sub-standard wiring. EDEL notes that one way forward may be to formalise and encourage such arrangements, while providing oversight of technical issues and tariffs.
Similar informal networks also reportedly exist in other parts of the country, feeding off the distribution systems operated by ENE. However, outside Luanda it is also reportedly typical for local industries to supply informal grids through their own auto-production capacity.
13. According to one woman who subscribed to such a network in Casenga, her initial hookup cost in October 2004 was USD 250, although the going rate had risen to USD 350 by the time of the interview (May 2005). She reported that she paid a monthly bill of 1 500 Kz (about USD 18).
14. The current number of informal networks paying EDEL for power consumed is presumably limited by the current number of private power transformers (347). The number of informal networks operating from the 372 public transformers is potentially greater, since several networks could operate off each one. Assuming that the number of informal connections is approximately 20% the number of informal ones leads to an average of about 28 illegal household connections per transformer.
© O
ECD
/IEA
, 200
6
62 - ELECTRICITY
Consider formalising informal urban and peri-urban distribution networks: the utilities should be encouraged in their consideration of ways to formalise and encourage electricity distribution networks operated by entrepreneurs as one way to increase access to electricity. This should involve eventual licensing by the regulator and inspections to ensure consumer safety. Tariff regulation is also desirable, but may not need to be an initial priority.
MINEA and the utilities may wish to review the experiences of other countries in increasing the electrifi cation rate of informal urban and peri-urban areas. A good place to start may be a recent USAID report that reviews case studies in a number of diverse countries. 15 Some key messages from this report are provided in the box.
Box 1 Some lessons learned from successful programmes to electrify informal urban and peri-urban areas in other developing countries
Utilities should work with local groups and intermediaries to help design programmes that conform to the realities of the local community, notably including the design of payment plans.
Utilities and relevant authorities should allow experimentation in service, tariff and payment options.
A common element to many successful programmes has been a community-based service centre to facilitate payment and dispute resolution.
It helps if the government provides an enabling legal environment, particularly regarding land tenure and rights-of-way.
Successful electrifi cation programmes are usually coordinated with related government activities, such as slum upgrading.
Surprisingly, experience shows that illegal network operators usually provide little resistance to legal service providers taking over “their” markets.
Use of pre-payment meters and ready-boards (as pioneered in South Africa) generally has been successful in ensuring high payment rates and can lower the cost of household wiring.
Source: summarized from USAID, 2004. “Innovative Approaches to Slum Electrifi cation”. Washington, D.C.
Rural electrifi cation
ENE notes that there is currently no rural electrifi cation plan. The only rural electrifi cation activities currently taking place are those related to a small rural network importing power from Namibia along the southern border of Cunene province.
15. USAID, 2004. “Innovative Approaches to Slum Electrifi cation”. Washington, D.C.
© O
ECD
/IEA
, 200
6
ELECTRICITY - 63
While the 2002 Strategy for the Development of the Electricity Sector does not include a strategy for rural electrifi cation, it lists a number of principles on which the eventual strategy is to be based, including that it should:
■ Be part of an integrated rural development strategy.
■ Include tariffs that refl ect real costs at a level that allows for viable fi nancing.
■ Feature the right to access but not the right to electricity.
The 2002 Strategy calls for the creation of an Electrifi cation Fund, which is foreseen in the 1996 Electricity Law. The Fund is to be fi nanced by cross-subsidies from urban and peri-urban consumers. However, the Strategy recognises that this will not be enough and that other sources will also need to be tapped.16 A number of stakeholders have mentioned the possibility of oil companies contributing to the Electrifi cation Fund under their CSR activities.
The 2002 Strategy also calls for investigating the potential for different renewable forms of energy for rural electrifi cation, including solar, mini- and micro-hydro, wind, biomass, and hybrid systems such as wind-diesel.
The government and ENE are probably correct in focussing on rehabilitation of existing infrastructure in the short term before promoting a major expansion of access in rural areas. At the same time, however, the government could promote an enabling environment that would allow entrepreneurs to pursue rural electrifi cation on a decentralised basis in a manner that makes minimum demands on the government’s organisational and fi nancial resources. This could also help the government meet its goal (mentioned in the 2002 Strategy, para. 170 iv) of using electricity access in rural areas to discourage migration to the major cities.
A “light-handed” rural electrifi cation programme would focus on removing administrative barriers to entrepreneurs setting up grids, while providing the minimum amount of oversight to ensure safety. An example of one possible administrative barrier is the apparent requirement for all distribution systems to operate under a concession from the Council of Ministers (see earlier recommendation, Clarify licensing and regulatory procedures for small systems).17
Another important barrier in some regions may be uncertainty regarding the government’s eventual expansion plans, since entrepreneurs will be reluctant to invest if they feel the grid could expand into their area.
16. Cross-subsidies certainly will not work if the other consumers do not even pay rates that cover costs.17. A number of countries have successfully promoted rural electrifi cation in tandem with grid-based electrifi cation via
creation of an enabling environment that concentrates on removing administrative barriers. A report by Oslo-based ECON Analysis for the Ugandan electricity regulator provides some insights on the design of such programmes (“Regulatory framework for Rural Electrifi cation in Uganda”, 2001).
© O
ECD
/IEA
, 200
6
64 - ELECTRICITY
Publish grid expansion plans: to remove uncertainties for rural electrifi cation entrepreneurs, the government should provide an expansion plan for the grid that is updated regularly (as called for in para. 176 of the 2002 Strategy), or at a minimum indicate areas that it will defi nitely not expand into for a set period of time.
The success of a light-handed rural electrifi cation programme could be further enhanced by removing some of the initial fi nancial barriers as well, e.g., by providing one-off subsidies to small grid operators for each connection, fi nanced by the Electrifi cation Fund. (Subsidising consumption should not be considered, since it is not sustainable and lack of ability to pay does not usually present a signifi cant barrier, based on experience in other developing countries.) Operation of such a fund would make some administrative demands, although the government could give responsibility for it to an experienced NGO or other entity on a contract basis.
Success could also be enhanced by ensuring provision of technical and institutional support for entrepreneurs, including advice on technical solutions and assistance in processing grants or subsidy applications. An Institute for Rural Electrifi cation already exists and could be strengthened to provide such services. Alternatively or additionally, the government could encourage NGOs to provide such services or could offer another entity a contract to do so, paid from the Electrifi cation Fund.
Promote rural electrifi cation by removing barriers: while the government is probably correct to focus immediate resources and attention on rehabilitation of existing infrastructure, it should not miss opportunities to promote entrepreneurial approaches to rural electrifi cation by ensuring removal of administrative barriers while maintaining minimum safety standards through “light-handed” regulation. Success of such a programme could be enhanced by operation of a rural electrifi cation fund to lower the fi nancial hurdle of initial connection charges, as well as by creating or encouraging the establishment of entities to provide technical and institutional support to entrepreneurs.
BILLING AND COLLECTION
ENE installed a computerised billing system in 2000 and estimates that its billing rate is close to 90% of electricity available (after technical and non-technical losses). However, it collects payment for only about 41% of energy billed.
Low payment rates by EDEL are partly responsible for ENE’s low overall collection average: EDEL, which is the customer for 65% of ENE’s energy deliveries, paid for only 27% of the power it received from the latter in 2004. Nevertheless, this was up from a rate of 22% the year before.
© O
ECD
/IEA
, 200
6
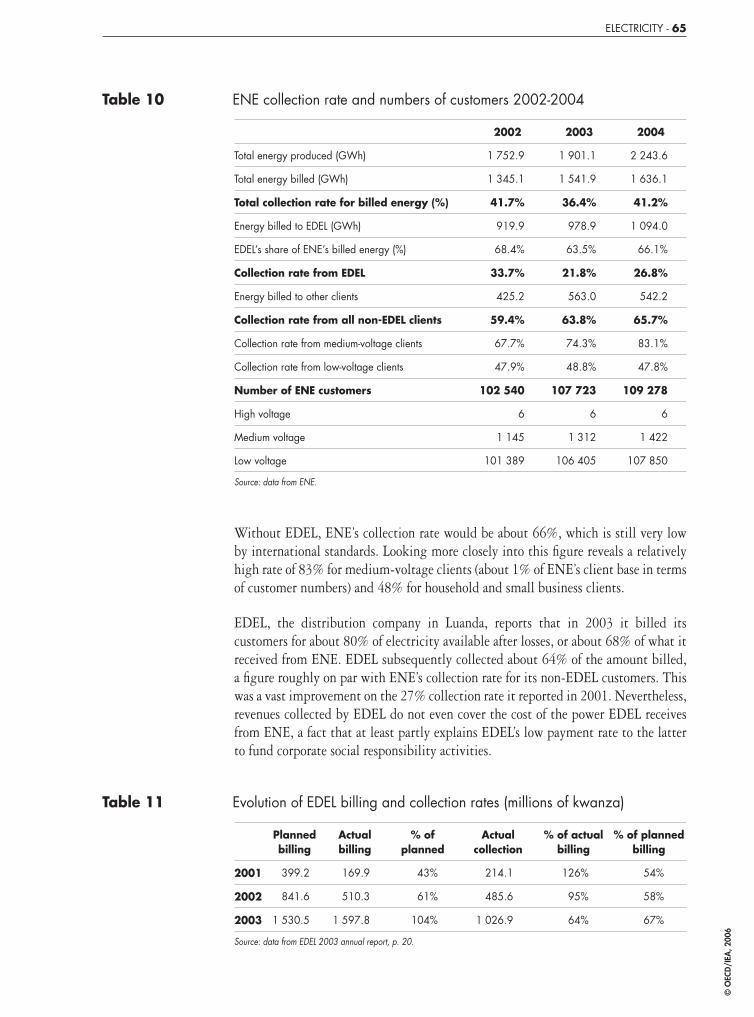
ELECTRICITY - 65
Table 10 ENE collection rate and numbers of customers 2002-2004
2002 2003 2004
Total energy produced (GWh) 1 752.9 1 901.1 2 243.6
Total energy billed (GWh) 1 345.1 1 541.9 1 636.1
Total collection rate for billed energy (%) 41.7% 36.4% 41.2%
Energy billed to EDEL (GWh) 919.9 978.9 1 094.0
EDEL’s share of ENE’s billed energy (%) 68.4% 63.5% 66.1%
Collection rate from EDEL 33.7% 21.8% 26.8%
Energy billed to other clients 425.2 563.0 542.2
Collection rate from all non-EDEL clients 59.4% 63.8% 65.7%
Collection rate from medium-voltage clients 67.7% 74.3% 83.1%
Collection rate from low-voltage clients 47.9% 48.8% 47.8%
Number of ENE customers 102 540 107 723 109 278
High voltage 6 6 6
Medium voltage 1 145 1 312 1 422
Low voltage 101 389 106 405 107 850
Source: data from ENE.
Without EDEL, ENE’s collection rate would be about 66%, which is still very low by international standards. Looking more closely into this fi gure reveals a relatively high rate of 83% for medium-voltage clients (about 1% of ENE’s client base in terms of customer numbers) and 48% for household and small business clients.
EDEL, the distribution company in Luanda, reports that in 2003 it billed its customers for about 80% of electricity available after losses, or about 68% of what it received from ENE. EDEL subsequently collected about 64% of the amount billed, a fi gure roughly on par with ENE’s collection rate for its non-EDEL customers. This was a vast improvement on the 27% collection rate it reported in 2001. Nevertheless, revenues collected by EDEL do not even cover the cost of the power EDEL receives from ENE, a fact that at least partly explains EDEL’s low payment rate to the latter to fund corporate social responsibility activities.
Table 11 Evolution of EDEL billing and collection rates (millions of kwanza)
Planned billing
Actualbilling
% of planned
Actual collection
% of actual billing
% of planned billing
2001 399.2 169.9 43% 214.1 126% 54%
2002 841.6 510.3 61% 485.6 95% 58%
2003 1 530.5 1 597.8 104% 1 026.9 64% 67%
Source: data from EDEL 2003 annual report, p. 20.
© O
ECD
/IEA
, 200
6
66 - ELECTRICITY
Both ENE and EDEL generally mail bills to customers, who then must pay them at designated customer service agencies, though in some areas customers also must obtain their bills at the agency. The limited number of agencies presumably makes payment diffi cult. When this is coupled with low and reportedly rarely enforced penalties (including cut-offs) for late or non-payment, customers appear to have few incentives to pay their bills.
The Ministry of Finance notes that the utilities are reluctant to raise electricity tariffs, since they believe that this could exacerbate the non-payment problem and hence result in even lower overall revenues. This may especially be the case if rate increases come with no improvement in service. This situation suggests a programme to fi rst improve the collection rate of existing tariffs, followed by (but ideally in tandem with) investments to improve electricity supply.
In countries where government substantially subsidises the electricity sector, companies seem to have a tendency to rely on government for a large and increasing portion of their overall revenue. This is because it is usually easier to collect from one revenue source (the treasury) than from many (the customers) – even if the former pays only a portion of the amount of subsidy agreed. This suggests that the government may eventually need to impose more rigid budget constraints on the utilities in order to give them a greater incentive to impose higher collection rates on their customers in turn.
Improve collection before raising tariffs: while raising tariffs to cover costs and investments will be necessary, the Government, after consultation with the utilities, should focus immediate attention on fi nding ways to encourage increased collection of existing tariffs. This could include the Government imposing more rigid constraints on the utilities to give them an incentive to impose higher collection rates on their customers in turn.
To make increased collection rates more palatable to customers, it would be expedient to demonstrate as early as possible a commitment to improve services, for example by ensuring that its investment budget for the electricity sector is focussed on those projects that are likely to have the most impact on improving electricity supply to consumers. The utilities could also consider a communications strategy to inform customers of the plans, investments and actions being taken to improve the electricity service to them, e.g., via leafl ets included with bills.
Given that transmission and distribution appear to be greater bottlenecks than generation at the moment, this could imply a need to shift more funds to transmission and, especially, distribution projects. Even if increased bill collection were delayed, such a prioritisation in investments could be sensible and later may make it easier for the sector to raise tariff and collection rates to levels that would put it on a more sustainable fi nancial basis. In the meantime, however, low tariffs and collection rates can be expected to substantially limit private actors’ interest in working with the utilities or investing in the sector.
See recommendation, Focus of investment programme, below.
© O
ECD
/IEA
, 200
6
ELECTRICITY - 67
TARIFFS, COSTS AND SUBSIDIES
The Ministry of Finance sets tariffs in the electricity sector on behalf of the government. Historically it has set them at levels that are below even marginal costs, presumably for political or social welfare reasons. The Ministry of Finance is obliged to fi nance the difference – though in the last few years the utilities have typically received less than half of their promised subsidy amounts.
Tariff policy
The 2002 Strategy states that the principal objective of the government’s tariff policy is to “guarantee effi cient utilisation of resources and secure the fl ow of resources necessary for rehabilitation and expansion and to guarantee quality of service […and a] return on investment”. It also notes that the 1996 Electricity Law establishes the following tariff principles:
■ Guarantee to all entities suffi cient revenues to cover reasonable operating costs, taxes, amortisation, recovery of investment capital and a reasonable profi t.
■ Consider differences in costs to different destinations and by type of service, geographic location and other relevant characteristics.
■ Ensure minimal cost to consumers, compatible with quality of service supplied.
The Strategy also recognises that tariff policy is a fundamental instrument for attracting the interest of private investors in the sector.
While the legislation and 2002 Strategy provide support for differentiation of tariffs by geographic location, in practice the government has set tariffs for relevant consumer categories that are uniform throughout the country.
Since at least 1998 the government has repeatedly stated a policy of eventually raising electricity tariffs to cost-covering levels, but usually has ended up falling behind in its plans to do so. Recently this presumably has been due at least in part to political pressures related to imminent elections, now set for late 2006. The Ministry of Finance noted to the IEA review team that the most recent timetable for the revision of tariffs to cost-covering levels was now out of date and currently being revised.
Setting the tariff
The Ministry of Finance sets tariffs after considering proposals by MINEA. Although Decree 4/02 does not give the new regulator power to set tariffs, the Ministry of Finance noted to the review team that the government may give these powers to the regulator after all. However, according to MINEA, the government is also considering plans to give MINEA such powers.
Whichever entity ends up with responsibility for setting tariffs, PPIAF and the World Bank (2005) note that, according to Council of Ministers Decree 20/90, tariff adjustments in all systems, no matter how small, currently have to go through the same process. They point out that this could prove cumbersome to eventual entrepreneurs operating small electricity systems. The government may wish to
© O
ECD
/IEA
, 200
6

68 - ELECTRICITY
review this issue, for example under the suggested programme to remove barriers to rural electrifi cation.
See recommendation, Promote rural electrifi cation by removing barriers.
The government is reportedly preparing an interim decree to automatically adjust tariffs to infl ation until the regulator becomes operational.
Costs According to the government’s 2004 electricity sector investment portfolio (Carteira de Investimentos), average supply costs in the ENE system are about 6.42 kwanzas (Kz) per kWh, or about 8-9 US cents (using the then current exchange rate of 75 Kz / USD ). This compares to an average tariff in the ENE system of only 2.66 Kz/kWh.18
The same document notes that the average cost to EDEL, which sources its electricity from ENE, should be 8.45 Kz/kWh, or slightly more than 11 US cents. EDEL’s average tariff is about 4 US cents / kWh.19
Table 12 ENE tariffs as of May 2004
Customer type Kwanzas/kWh Comment
Low voltage
Domestic 3.35
Social rate 1.42 For fi rst 50 kWh
Industrial 3.07
Commercial/service 3.41
Public lighting 2.46
Medium voltage Between 1-30 kV
Indutrial 1.44plus capacity charge of Kz 171.51 per kW
Commerical/service 1.62plus capacity charge of Kz 192.66 per kW
Source: ENE brochure of October 200.
Table 13 Average tariffs and real supply costs in late 2004 (Kz/KWh)
ENE EDEL
Average tariff 2.66 2.99
Estimated real cost 6.42 8.45Source: Carteira de Investimentos, September 2004.
18. It is not clear what this covers. It is assumed that these estimates take into account the real cost of diesel rather than the subsidised price that ENE actually pays.
19. This corresponds with estimates provided in Plano de Actualização das Tarifas de Electricidade em 2002, which states that average tariffs should be around USD 0.11/kWh.
© O
ECD
/IEA
, 200
6
ELECTRICITY - 69
Subsidies The actual cost to EDEL for electricity it buys from ENE is currently lower than the fi gure given in Table 13, due to subsidies provided to ENE. Theoretically, both ENE and EDEL only receive subsidies for distribution operations. However, generation is also effectively subsidised, since ENE benefi ts from the general subsidy to Sonangol on diesel. According to the Ministry of Finance, direct subsidies to ENE and EDEL in 2004 were about USD 200 million, down from about USD 300 million in 2003 (though below the target of USD 30 million originally set for 2004). The Ministry of Finance estimates that subsidies for diesel used by ENE in 2004 were about USD 1 billion.20
Make any subsidies transparent and available to all suppliers in a particular area: as recognised by the 2002 Strategy, tariffs should refl ect the cost of supply to different geographic locations and customer types. If some element of subsidy or cross-subsidy is considered desirable in particular areas, however, it should be transparent and made available to all suppliers in that area, including eventual private sector ones. Otherwise, private sector suppliers may face diffi culties charging cost-covering rates to potential clients who can point to lower rates nearby.
In practice, both ENE and EDEL note that actual subsidy payments by the Ministry of Finance have been chronically lower than amounts agreed. For example, EDEL states in its 2003 annual report that it received only about 37% of agreed subsidies in 2001, 45% in 2002 and around 50% in 2003. Although receipt of promised subsidies is an important factor limiting the ability of the utilities to fi nance investments, a more serious problem is the utilities’ low billing and collection rates, since long-run sustainability of the sector ultimately will depend on the ability of utilities to fi nance themselves.
INFORMATION SYSTEMS AND METERING
It is diffi cult to make informed policy and prioritise investments without adequate statistics and the information systems to produce them. Most electricity sector statistics are incomplete and/or outdated. Virtually no statistics are available concerning self-generation in major urban areas, or generation, transmission and distribution by provincial and municipal governments. Comprehensive and reliable information concerning the demand, generation and use of electricity and its fl ow throughout the system, from each generating unit to each end-user, is important to all electricity sector activities, including sector governance, planning, fi nance, tariff design, control of losses, billing, collections, operations and maintenance. In order to greatly enable performance improvements in the sector, such information must be made readily available to managers.
20. Despite a signifi cant increase in the fi xed price for diesel, the overall subsidy for diesel used by ENE may not have been signifi cantly lower than it was during the previous year, due to rising world oil prices.
© O
ECD
/IEA
, 200
6
70 - ELECTRICITY
Improve information and metering systems: the government and utilities should prioritise and authorise adequate funding for the design and implementation of a modern information management and performance monitoring system for the entire electricity sector, including the implementation of a comprehensive and reliable metering system to support it.
Lack of meters can also lead to a high number of complaints and subsequently low collection rates, since it does not take periods of power outages into account. (Unmetered clients are billed on the basis of 200 kWh per month.) Approximately 73% of EDEL’s clients are metered, while the fi gure is about 60% for ENE clients. Both ENE and EDEL have made increased metering a priority. However, as in other areas, they have faced fi nancing problems in carrying out their policies in practice.21
Box 2 Pre-paid meters in southern Cunene province
ENE has installed pre-paid meters in all of the approximately 1 500 households served by its new isolated grid in southern Cunene province. Customers purchase a code that they key into the meter, which then distributes the amount of electricity that has been paid for. This technology is imported from South Africa, where it has been widely used in that country’s electrifi cation programme. Costs for such meters reportedly are now not signifi cantly higher than those for traditional meters. The use of pre-paid meters in Cunene reportedly has led to payment rates of 100%. ENE and EDEL are now studying the results of this programme for possible use elsewhere in the country.
SECTOR DESIGN AND OPERATING PRACTICES
System voltages and most design and operating practices are based on Portuguese standards, norms, and practices current during the 1970s and earlier. The war conditions that prevailed in the country for most of the last 30 years and did not permit system planners and engineers to adjust those designs and operating practices to refl ect rapidly evolving changes in electricity sector technology, energy economics and environmental requirements.
The result is that outdated system design and operating requirements are now major constraints on the ability of sector planners and engineers to cost-effectively plan, design and implement the very large projects that are urgently required to improve sector performance and increase access to economically and socially required levels.
21. For example, EDEL’s Strategic Plan called for it to install 10 000 customer meters in 2003, while it managed to install only 4 210 (42%), due to a shortage of meters. EDEL installed 3 738 meters in 2002 and 6 515 in 2001, according to its 2003 annual report. As in many other countries, the client purchases the meter as part of its initial connection fee.
© O
ECD
/IEA
, 200
6
ELECTRICITY - 71
Failure to update design and operating practices could cause both investment and subsequent system operation and maintenance costs to be signifi cantly excessive. Realistically, it could take up to two years to develop and establish updated standards and norms, and several more to train staff to use them. This is not to argue that investments should be delayed until updated standards and norms are available, but that commencement of the update process should begin immediately.
Review and update electricity sector design and operating procedures: in order to ensure that large new investments and subsequent system operations are cost-effi cient, the government (perhaps through the regulator) should review international best practice and require modern national standards and norms be established to guide the design, construction, and performance of the electricity sector. In establishing these important standards and norms, the views and inputs of all electricity sector stakeholders should be sought, including representatives of existing and potentially new electricity customers.
INVESTMENT PLANS
In 2002 an inter-ministerial working group developed plans for rehabilitating the country’s generating plants, transmission lines and distribution systems as part of the Strategy for the Development of the Electricity Sector of Angola (Estratégia de Desenvolvimento do Sector Eléctrico de Angola). The total estimated amount of required investment noted in the 2002 Strategy was approximately USD 2 billion, including USD 549 million in the short term.
At least in the short term, the government planned to fi nance such investments through its Public Investment Programme and Emergency Infra-structure Rehabilitation Programme. Noting that it did not expect rehabilitation projects to be commercially attractive to private investors, it apparently counted to a large degree on foreign donations and loans to these programmes. However, the international community up to now has been reluctant to provide much funding to the government, due at least in part to perceived lack of progress in negotiating a programme with the International Monetary Fund. In any case, the government has fallen signifi cantly behind the investment schedule outlined in the 2002 Strategy.
In 2004 MINEA revised and prioritised its short-term (3-5 years) fi nancing needs into a set of “investment portfolios” for the electricity and water sectors (Carteira de Investimentos), with a total value of USD 543.7 for the electricity sector. It notes that more reliable estimates for medium and long term investment priorities will be available after conclusion of a new “Electrical Power Sector Master Rehabilitation and Expansion Master Plan”. The investment needs listed in the 2004 Portfolio are presented in Table 15 by entity (MINEA, ENE, EDEL) and by area (generation, transmission, distribution and commercialisation studies).
© O
ECD
/IEA
, 200
6
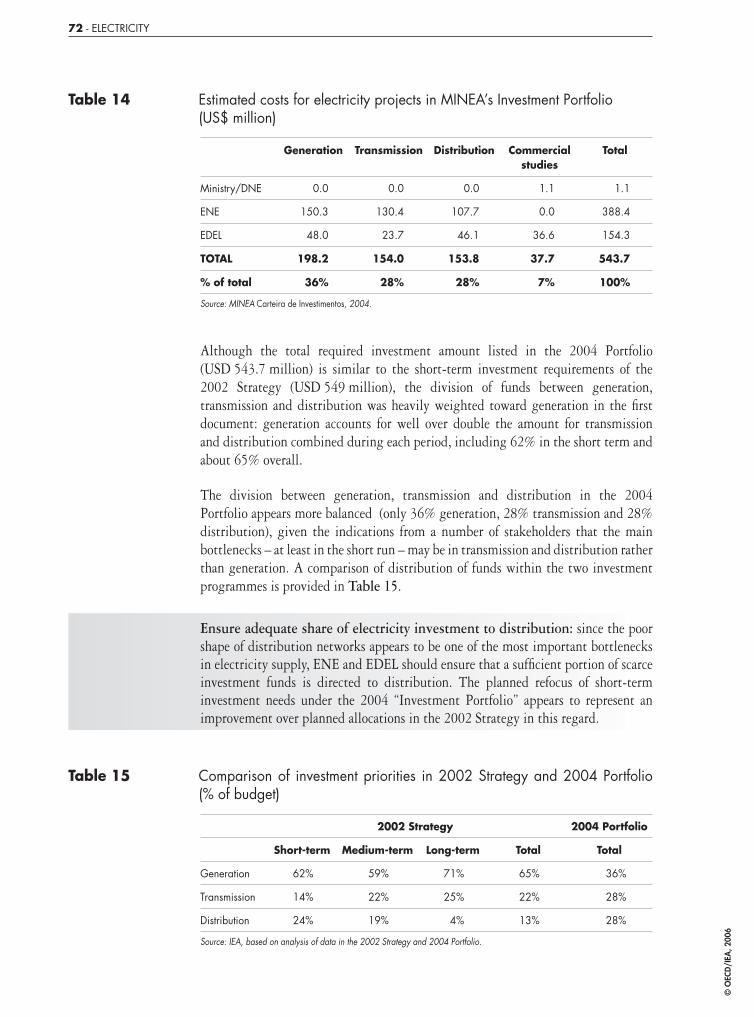
72 - ELECTRICITY
Table 14 Estimated costs for electricity projects in MINEA’s Investment Portfolio (US$ million)
Generation Transmission Distribution Commercial studies
Total
Ministry/DNE 0.0 0.0 0.0 1.1 1.1
ENE 150.3 130.4 107.7 0.0 388.4
EDEL 48.0 23.7 46.1 36.6 154.3
TOTAL 198.2 154.0 153.8 37.7 543.7
% of total 36% 28% 28% 7% 100%
Source: MINEA Carteira de Investimentos, 2004.
Although the total required investment amount listed in the 2004 Portfolio (USD 543.7 million) is similar to the short-term investment requirements of the 2002 Strategy (USD 549 million), the division of funds between generation, transmission and distribution was heavily weighted toward generation in the fi rst document: generation accounts for well over double the amount for transmission and distribution combined during each period, including 62% in the short term and about 65% overall.
The division between generation, transmission and distribution in the 2004 Portfolio appears more balanced (only 36% generation, 28% transmission and 28% distribution), given the indications from a number of stakeholders that the main bottlenecks – at least in the short run – may be in transmission and distribution rather than generation. A comparison of distribution of funds within the two investment programmes is provided in Table 15.
Ensure adequate share of electricity investment to distribution: since the poor shape of distribution networks appears to be one of the most important bottlenecks in electricity supply, ENE and EDEL should ensure that a suffi cient portion of scarce investment funds is directed to distribution. The planned refocus of short-term investment needs under the 2004 “Investment Portfolio” appears to represent an improvement over planned allocations in the 2002 Strategy in this regard.
Table 15 Comparison of investment priorities in 2002 Strategy and 2004 Portfolio (% of budget)
2002 Strategy 2004 Portfolio
Short-term Medium-term Long-term Total Total
Generation 62% 59% 71% 65% 36%
Transmission 14% 22% 25% 22% 28%
Distribution 24% 19% 4% 13% 28%
Source: IEA, based on analysis of data in the 2002 Strategy and 2004 Portfolio.
© O
ECD
/IEA
, 200
6

ELECTRICITY - 73
The 2004 Portfolio does not include investments in several areas mentioned earlier that are likely to be critical for ensuring that large new investments and subsequent systems operation are cost-effi cient, namely:
■ Development of a modern information management and performance monitoring system and a comprehensive and reliable metering system to support it.
■ A programme to modernise technical standards and norms.
See recommendations, Improve information and metering systems, and Review and update electricity sector design and operating procedures.
HUMAN RESOURCES
ENE had a workforce of 4 428 in 2004. Based on generally accepted norms for developing countries and the number and size of power plants, length of transmission and numbers of customers served by ENE, the number of employees appears to exceed real requirements by a considerable amount. More worrisome, however, it the lack of employees with needed technical and commercial skills. Moreover, the number of skilled workers is falling. Although the total workforce fi gure for 2004 represents a 3% drop from the year before, ENE notes that the number of basic technicians fell by 20.4% and the number of “qualifi ed operators” fell by almost 19%. Industry representatives noted that the major problem is the low number of qualifi ed workers trained each year in Angola, while another is that salaries in the electricity sector are not competitive for highly-skilled technical workers such as engineers – especially vis-à-vis salaries in Angola’s oil sector.
Table 16 ENE workforce
2002 2003 2004
Management 549 599 601
Senior technical 77 79 81
Mid-level technical 369 395 442
Other mid-level technical 154 164 169
Basic technical 185 215 171
Qualifi ed operators 1 121 1 197 973
Operators w/out qualifi cations 142 120 96
Admin. Services 494 598 615
Guards and others 669 678 639
Pensioners 631 601 641
Total 4 391 4 646 4 428
Source: ENE.
© O
ECD
/IEA
, 200
6
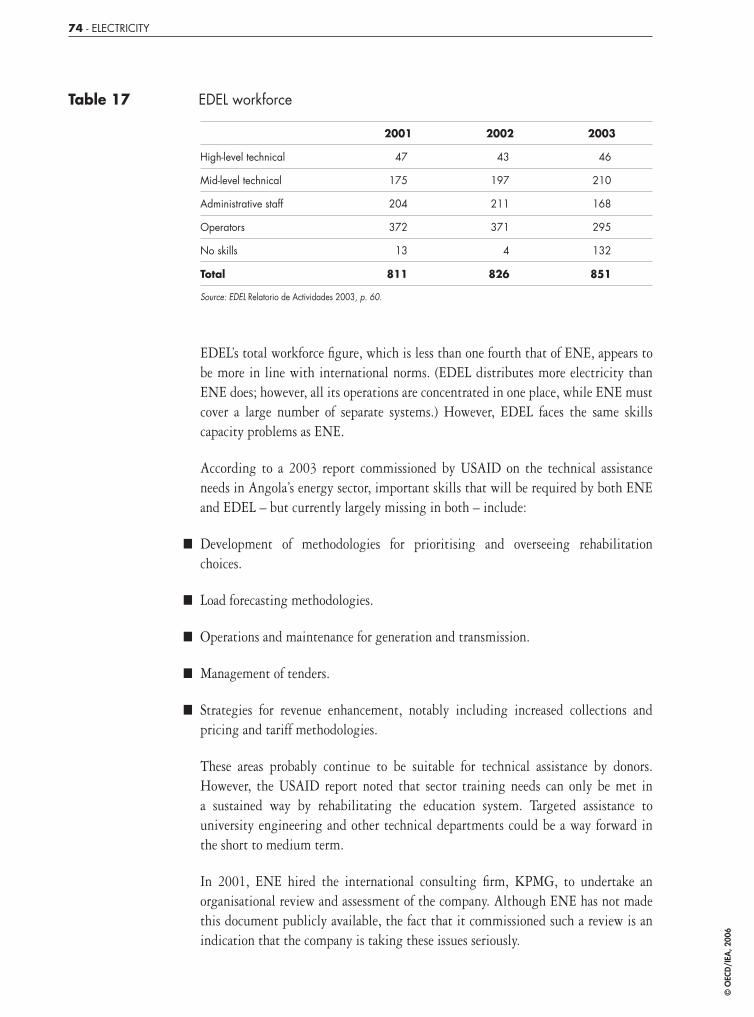
74 - ELECTRICITY
Table 17 EDEL workforce
2001 2002 2003
High-level technical 47 43 46
Mid-level technical 175 197 210
Administrative staff 204 211 168
Operators 372 371 295
No skills 13 4 132
Total 811 826 851
Source: EDEL Relatorio de Actividades 2003, p. 60.
EDEL’s total workforce fi gure, which is less than one fourth that of ENE, appears to be more in line with international norms. (EDEL distributes more electricity than ENE does; however, all its operations are concentrated in one place, while ENE must cover a large number of separate systems.) However, EDEL faces the same skills capacity problems as ENE.
According to a 2003 report commissioned by USAID on the technical assistance needs in Angola’s energy sector, important skills that will be required by both ENE and EDEL – but currently largely missing in both – include:
■ Development of methodologies for prioritising and overseeing rehabilitation choices.
■ Load forecasting methodologies.
■ Operations and maintenance for generation and transmission.
■ Management of tenders.
■ Strategies for revenue enhancement, notably including increased collections and pricing and tariff methodologies.
These areas probably continue to be suitable for technical assistance by donors. However, the USAID report noted that sector training needs can only be met in a sustained way by rehabilitating the education system. Targeted assistance to university engineering and other technical departments could be a way forward in the short to medium term.
In 2001, ENE hired the international consulting fi rm, KPMG, to undertake an organisational review and assessment of the company. Although ENE has not made this document publicly available, the fact that it commissioned such a review is an indication that the company is taking these issues seriously.
© O
ECD
/IEA
, 200
6

ELECTRICITY - 75
Assess and prioritise human resource development needs for the electricity sector: given the critical importance of skilled manpower in the development of the electricity sector, and the importance of this sector in the development of the country, the government and the utilities should undertake a comprehensive assessment of short, medium and long-term human resource needs in the sector and implement a sector-wide human resources development plan.
The plan should compare present human resources and capacity with short, medium and long-term function-based resource needs, irrespective of current or projected future institutional structures. It should be based on Angola’s macro-level electricity sector development plans and draw on the experience of countries with more advanced electricity sectors. A 2003 report carried out by Nexant for the United States Agency for International Development that identifi es priority technical assistance needs for the various actors in the energy sector could serve as an excellent base for the development of such a plan.
Box 3 Training in EDEL
According to EDEL’s 2003 annual report, it held 33 training course for staff that year, with 337 participants and a total budget of USD 127 474. The largest classes by number of participants were:
■ Administration and operation (60 participants).
■ Public service (53).
■ Techniques of service and communication (40).
■ First aid and fi re fi ghting (29).
■ Hygiene and safety at work (24), and
■ Computers (22).
Other courses offered included:
■ Dispatch operation (15).
■ Economic and fi nancial analysis (7).
■ Autocad (7).
■ Statistics (3).
■ Marketing (3), and
■ Advanced project management (1).
Source: EDEL- Relatorio de Actividades 2003.
© O
ECD
/IEA
, 200
6

76 - ELECTRICITY
REGIONAL INTERCONNECTIONS AND TRADE
Angola currently has no interconnections with its neighbours. The minor exception is a small (1.5 MVA) connection with Namibia to import power from that country for an isolated rural electrifi cation scheme in southern Cunene province.
Angola intends to investigate opportunities for further interconnections, including additional isolated connections to import power from the Democratic Republic of Congo to its Northern border regions, and the Western Corridor project (discussed below).
Despite the country’s current lack of international connections, the Angolan government and/or utilities are members of the Southern African Power Pool, the Central African Power Pool, and the Union of Producers, Transporters and Distributors of Electric Power in Africa (see Box 4).
Box 4 Regional associations in the power sector
Angola is a member of the following regional associations:
SAPP
Member states of the Southern African Development Community (SADC) created the Southern African Power Pool (SAPP) in 1995, with the objective of reducing energy costs and providing greater supply stability for the region’s 12 national utilities. Plans call for reinforcing connections between SAPP’s northern (Zimbabwe and Zambia) and southern (South Africa, Botswana and Namibia) regions, as well as with its more isolated members, which include Angola, Malawi, and Tanzania. The SAPP is a driver behind the Western Corridor project (discussed below), and is currently evolving from a cooperative to a competitive pool.
PEAC
The Energy Pool of Central Africa (Pool Energetique de l’Afrique Centrale – PEAC) was formed in 2003 as a specialised organisation of the Economic Community of Central African States (ECCAS). Its main objectives are to reinforce the security of supply, reliability and quality of electricity for its members; increase the rate of access to electricity in order to help reduce poverty in the region; provide a regional forum to discuss common problems; and create a free market for electricity.
UPDEA
Both ENE and EDEL are members of the Union of Producers, Transporters and Distributors of Electric Power in Africa (UPDEA), an organisation that has existed for a number of years and since 2002 has been closely associated with NEPAD (New Partnership for Africa’s Development). UPDEA’s current action plan focuses on: setting up a databank on the African power sector; assisting the creation of power pools in Central and Eastern Africa (e.g., PEAC); establishing a pilot programme
© O
ECD
/IEA
, 200
6
ELECTRICITY - 77
with the African Development Bank on cross-border village electrifi cation; establishing the African Electrotechnical Standards Commission in partnership with the African Union; identifying common problems and setting up relevant working groups; organising meetings between utilities and international donors on project fi nancing; and heightening awareness of the need to reduce environmental impacts of electrical infrastructure.
The 2002 Strategy lists the following priorities regarding international cooperation in the power sector (Art. 48-49):
■ Further development of electricity exchange with Namibia.
■ Work with the Democratic Republic of Congo to supply the Cabinda enclave and frontier areas in Angola’s North.
■ The export of power from the Democratic Republic of Congo to South Africa via Angola (the Western Corridor project).
■ Reinforcement of regional cooperation in the electricity sector with neighbouring countries “when such developments contribute to mutual economic and social benefi ts at the bilateral or sub-regional level”.
Western Corridor project
The Western Corridor (WestCor) is a proposed series of transmission lines to transport power from the Democratic Republic of Congo (DRC) to South Africa via Angola, Namibia and Botswana. A joint initiative of the SADC and the governments and utilities of the relevant countries, WestCor has been discussed in one form or another for over 10 years. However, it seemed to come at least a step closer to realisation in October 2004, when the relevant governments and utilities signed a series of memoranda of understanding.22
The project would draw power from a proposed 4 000-MW hydro-electric dam on the Inga River in the DRC. Smaller dams, built on the Inga in 1972 and 1982, are already exporting modest amounts of power to Southern Africa using transmission lines through Zambia and Zimbabwe. The new project, down the western side of the region, would help create a southern African loop.
Potential benefi ts of the project for Angola include the possibility to use WestCor’s transmission lines to interconnect Angola’s three main grids, currently isolated. The project would also allow Angola to export surplus power from its North, as well as develop new capacity for export. Current plans for WestCor call for a high-voltage 400-500-kV AC line that would run the length of the country via Capanda and Matala, though the timing is still uncertain.
22. Related plans, relatively less advanced, call for a “Western Energy Highway” from Inga to Nigeria, while a “Grand Inga” scheme includes eventual development of some 39 000 MW of generating capacity and a “Northern Energy Highway” to Egypt via the Central African Republic and Sudan.
© O
ECD
/IEA
, 200
6
78 - ELECTRICITY
Joint hydro-power development with Namibia
In April 2000 Angola and Namibia signed a bilateral cooperation agreement under which they have been looking at options to jointly develop hydro-power capacity on the Cunene River to supply both countries. So far, two main sites have been considered for a proposed 360-MW plant: Epupa Falls and Baynes. Due to substantial opposition on the part of environmental groups, development of the Epupa Falls site now looks unlikely. Baynes reportedly has met less opposition on environmental grounds. Another point in favour of the Baynes site is that its development reportedly would help ENE rehabilitate the Gove dam, located nearby on a tributary of the Cunene River. However, plans for both sites appear to be on hold for the time being.
ENERGY EFFICIENCY
An energy effi ciency program for either the electricity sector or an electric utility generally has two main components. The fi rst is internal, designed to address effi ciency issues related to generation, transmission and distribution, including effective monitoring and control of off-take by third parties. The second involves infl uencing the use of energy by customers in a way that optimizes the use of electricity system infrastructure, minimizing system generation, transmission and distribution costs.
Key elements of the internal component generally include economic dispatch of generating plants (operation of most effi cient and lowest cost plants fi rst); use of economic – rather than just physical capacity – criteria for the sizing and loading of wires and cables; optimization of system power factor and placement and use of capacitors and other reactive power devices; extensive metering and analysis of both peak fl ows and demand and energy use; installation of accurate tamper-proof meters; and reliable control and reading of energy fl ow and end-user off-takes of energy.
The second or external component of a comprehensive energy effi ciency program has two important elements; a fully transparent and effective meter reading, billing, and collection system; and cost-driven and tariff-based incentives to encourage end-users to use energy effi ciently and take absolutely required energy during off peak periods when the lowest cost and most effi cient generating plants are operating.
From conversations with senior Angolan offi cials, managers, engineers and other professionals and the review of provided documents and operating data, it appears that MINEA; ENE and EDEL neither have nor recognize the need for a comprehensive and well-coordinated energy effi ciency program. Below-cost electricity tariffs and technical and administrative energy losses in 2004 that exceeded 50% of the electrical energy generated indicate that such a program is badly needed and should be designed and implemented on a fast-track basis.
If a comprehensive energy effi ciency program is well designed, adequately funded and properly managed, it could become the vehicle used at all internal levels and with the rest of the government and the public to promote and improve sector performance
© O
ECD
/IEA
, 200
6
ELECTRICITY - 79
throughout the sector and its institutions. The program should be recognized and accepted by all as a prerequisite and the fi rst stage of a larger program to rapidly expand access to electricity throughout the country.
ENVIRONMENT
Worldwide experience indicates that almost all electricity generation and transmission line projects and many electricity distribution projects have signifi cant potential environmental impacts during construction, operation or both. This is especially true in the case of large hydroelectric projects. Most governments and all multilateral banks now require that potential environmental impacts of such projects be identifi ed and plans developed to reduce them to acceptable levels as part of their project approval process.
Based on the literature made available, it appears that all or most of the projects in Angola’s electricity sector development program are being implemented without detailed environmental study and public reviews.
A lot of time and expense is required for a country to develop its own environmental study and compliance requirements. This has led many developing countries to adopt the environmental requirements of the World Bank or some other internationally recognized institution, at least on an interim basis. It is recommended that Angola examine the actions of other countries at or near their level of economic development and adopt an appropriate internationally acceptable set of environmental standards and rules to guide the study, approval, and implementation of its electricity sector and other major infrastructure projects. This step is important in protecting Angola from potentially serious negative environmental impacts and is an essential requirement for receiving loans and grants of International Financial Institutions and major donors.
© O
ECD
/IEA
, 200
6

© O
ECD
/IEA
, 200
6
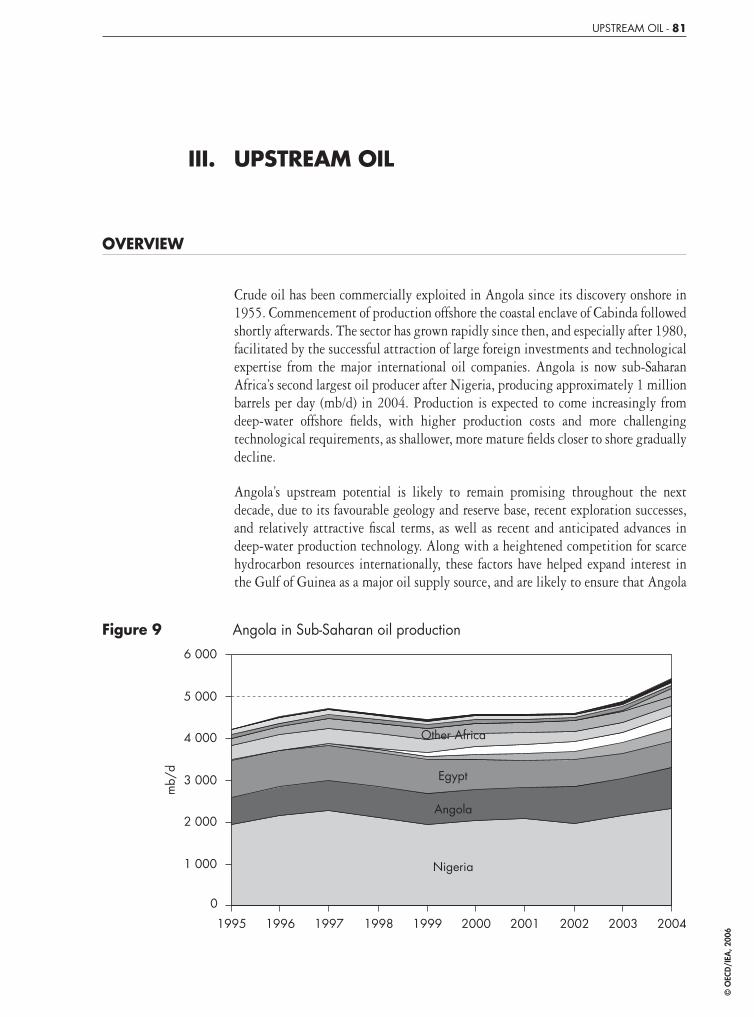
UPSTREAM OIL - 81
III. UPSTREAM OIL
OVERVIEW
Crude oil has been commercially exploited in Angola since its discovery onshore in 1955. Commencement of production offshore the coastal enclave of Cabinda followed shortly afterwards. The sector has grown rapidly since then, and especially after 1980, facilitated by the successful attraction of large foreign investments and technological expertise from the major international oil companies. Angola is now sub-Saharan Africa’s second largest oil producer after Nigeria, producing approximately 1 million barrels per day (mb/d) in 2004. Production is expected to come increasingly from deep-water offshore fi elds, with higher production costs and more challenging technological requirements, as shallower, more mature fi elds closer to shore gradually decline.
Angola’s upstream potential is likely to remain promising throughout the next decade, due to its favourable geology and reserve base, recent exploration successes, and relatively attractive fi scal terms, as well as recent and anticipated advances in deep-water production technology. Along with a heightened competition for scarce hydrocarbon resources internationally, these factors have helped expand interest in the Gulf of Guinea as a major oil supply source, and are likely to ensure that Angola
Figure 9 Angola in Sub-Saharan oil production
0
1 000
2 000
3 000
4 000
5 000
6 000
1995 1996 1997 1998 1999 2000 2001 2002 2003 2004
mb/
d
Nigeria
Other Africa
Angola
Egypt
218590_p081-110_chap03.indd 81218590_p081-110_chap03.indd 81 21/09/06 11:32:1821/09/06 11:32:18
© O
ECD
/IEA
, 200
6
82 - UPSTREAM OIL
becomes an increasingly important exporter to international markets, particularly the United States and China. Based on oil companies’ investment plans, production capacity is expected to double by 2010.
The capital-intensive oil sector continues to dominate Angola’s economy. Record high crude oil prices have led to a huge government tax windfall (approximately USD 1.71 billion in 2004 according to the Ministry of Finance). Oil now represents approximately 80-90 % of the government’s budget and 52% of its gross domestic product. Angola’s economic development will depend heavily on how it manages and uses these revenues. The government’s record to date has been mixed, due in large part, to the situation created by the long civil war.
In 2004, a new petroleum law came into force that seeks to standardize future production sharing agreements and further clarify the roles of the Ministry of Petroleum, Sonangol and the operating companies, in an effort to attract more private and foreign investment.
MAIN ACTORS IN THE SECTOR: INDUSTRY STRUCTURE
The Ministry of Petroleum
The Ministry of Petroleum is responsible for national policy, supervision and control of all petroleum-related activities in Angola. Its roles include setting oil policy and implementing guidelines for industry, approving companies’ development plans, issuing fl are permits, and implementing the “Angolanisation” or local content policy (see below). The Ministry’s main division for the upstream sector is the National Directorate of Petroleum.
According to offi cials, its current top priorities in the upstream sector include:
■ Fully implementing the 2004 Petroleum Law.
■ Improving the transparency of revenue payments from oil companies and strengthening the framework for revenue management.
■ Developing staff capacity.
■ Acquiring modern information technology tools.
Sonangol Sonangol (Sociedade Nacional de Combustíveis de Angola), the state-owned national oil company was created in 1976. The oil law of 1978 made it the sole concessionaire, though in practice it sub-leases to international oil companies via joint ventures and production sharing agreements (PSAs). It is a central player in Angola’s oil sector with roles that include issuing exploration and production permits, participating as a partner in concessions with other companies, and conducting its own exploration and production activities. (These and other roles are discussed in more detail below.)
218590_p081-110_chap03.indd 82218590_p081-110_chap03.indd 82 21/09/06 11:32:1921/09/06 11:32:19
© O
ECD
/IEA
, 200
6

UPSTREAM OIL - 83
Figure 10 Organisational structure of the Ministry of Petroleum (2003-2004)
Source: Ministry of Petroleum http://www.minpet.gv.ao
218590_p081-110_chap03.indd 83218590_p081-110_chap03.indd 83 21/09/06 11:32:1921/09/06 11:32:19
© O
ECD
/IEA
, 200
6

84 - UPSTREAM OIL
Sonangol’s new “Vision to 2010” envisages a fully integrated oil company that will also eventually be active internationally. Sonangol’s self-declared upstream mission is to:
■ “Carry out the technical management of production contracts and association contracts in order to maximize the State and Sonangol’s interests as the concessionaire and investor”;
■ “Collect, validate and keep a record of all petroleum activity data in Angola, as an important patrimony of the country”;
■ “Maximize the economic interests of the State and of Sonangol as concessionaire and investor”; and
■ “Promote and arrange economic and legal coordination of the negotiating process in reference to the production contracts, association contracts and other contracts”.
International oil companies
International oil companies (IOCs) are responsible as operators for virtually all oil production in the country. The most active are Chevron (60% of current output) and Total (36%). Increasingly active companies include ExxonMobil, BP, Statoil and Norsk Hydro (now HydoI). Companies operate either under joint ventures or production sharing agreements, although most contracts since the 1980s have been the latter.
Interviews with the major international oil companies operating in Angola suggest that they will continue to invest heavily in exploration and production, including some USD 17-23 billion between 2003 and 2008.
An independent weekly newspaper, Semanario Angolense, reports that a number of indigenous Angolan Oil companies have recently been granted licenses to operate, notably Majova, Poliedro S.A., Prodoil and Somoil.
Sonangol’s multiple roles
Sonangol has a number of roles, including commercial, regulatory and quasi-fi scal.
Outside its commercial roles (discussed in more detail below), its regulatory tasks include overseeing petroleum operations of foreign companies and managing the development of services to support petroleum operations and the export of crude oil. It recommends areas that should be opened for exploration and conducts the bidding process and negotiations for concessions.
The new Petroleum Law transfers certain monitoring roles from Sonangol to the Ministry of Petroleum and helps clarify the division of responsibility between the two entities. However, according to this law it leaves Sonangol E.P. as the sole concessionaire with large effective powers in determining which companies are awarded contracts. This maintains a potential confl ict of interest, since Sonangol could fi nd itself in situations where its own commercial interests confl ict with the best interests of the government on whose behalf it is taking decisions.
218590_p081-110_chap03.indd 84218590_p081-110_chap03.indd 84 21/09/06 11:32:1921/09/06 11:32:19
© O
ECD
/IEA
, 200
6
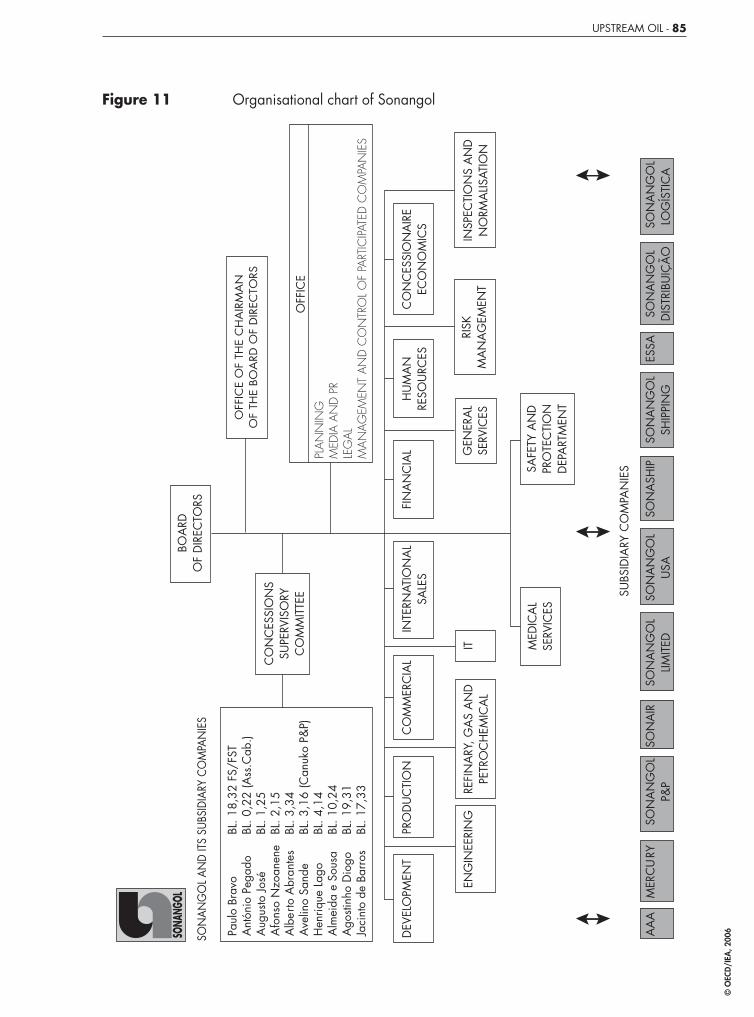
UPSTREAM OIL - 85
Figure 11 Organisational chart of Sonangol
SUBS
IDIA
RY C
OM
PAN
IES
SON
AN
GO
LLIM
ITED
SON
AN
GO
LD
ISTR
IBU
IÇÃ
OA
AA
MER
CU
RYSO
NA
NG
OL
P&P
SON
AIR
SON
AN
GO
LU
SASO
NA
SHIP
SON
AN
GO
LSH
IPPI
NG
ESSA
SON
AN
GO
LLO
GÍS
TIC
A
SON
ANG
OL A
ND
ITS S
UBSI
DIAR
Y CO
MPA
NIE
S
BOA
RDO
F D
IREC
TORS
Paul
o Br
avo
BL
. 18,
32 F
S/FS
T A
ntón
io P
egad
o
BL. 0
,22
(Ass
.Cab
.)A
ugus
to Jo
sé
BL. 1
,25
Afo
nso
Nzo
anen
e B
L. 2
,15
Alb
erto
Abr
ante
s BL
. 3,3
4A
velin
o Sa
nde
BL
. 3,1
6 (C
anuk
o P&
P)H
enriq
ue L
ago
BL
. 4,1
4A
lmei
da e
Sou
sa
BL. 1
0,24
Ago
stinh
o D
iogo
BL
. 19,
31Ja
cint
o de
Bar
ros
BL
. 17,
33
CO
NC
ESSI
ON
SSU
PERV
ISO
RYC
OM
MIT
TEE
OFF
ICE
OF
THE
CH
AIR
MA
NO
F TH
E BO
ARD
OF
DIR
ECTO
RS
PLA
NN
ING
MED
IA A
ND
PR
LEG
AL
MA
NA
GEM
ENT
AN
D C
ON
TRO
L O
F PA
RTIC
IPATE
D C
OM
PAN
IES
CO
MM
ERC
IAL
INSP
ECTI
ON
S A
ND
NO
RMA
LISAT
ION
MED
ICA
LSE
RVIC
ESSA
FETY
AN
DPR
OTE
CTI
ON
DEP
ART
MEN
T
ENG
INEE
RIN
GRE
FIN
ARY
, GA
S A
ND
PETR
OC
HEM
ICA
LIT
GEN
ERA
LSE
RVIC
ES
DEV
ELO
PMEN
TPR
OD
UC
TIO
NC
ON
CES
SIO
NA
IRE
ECO
NO
MIC
SH
UM
AN
RESO
URC
ESFI
NA
NC
IAL
INTE
RNAT
ION
AL
SALE
S
OFF
ICE
RISK
MA
NA
GEM
ENT
218590_p081-110_chap03.indd 85218590_p081-110_chap03.indd 85 21/09/06 11:32:2021/09/06 11:32:20
© O
ECD
/IEA
, 200
6
86 - UPSTREAM OIL
Transfer of Sonangol’s concessionnaire/regulatory roles: accelerate the re-organisation of Sonangol with view to divesting its government functions.
This recommendation should be implemented carefully. An apparent major problem in eventually splitting regulatory and commercial functions is the current lack of regulatory capacity in the Ministry of Petroleum, which furthermore would have diffi culties paying high enough salaries to attract competent Sonangol employees currently engaged in regulatory matters.
Historically, Sonangol has also effectively acted as a parallel treasury under presidential control, separate from the Ministry of Finance. This has largely been due to its handling a signifi cant portion of the government’s revenue from the oil industry. For example, operating as the sole concessionaire, Sonangol is responsible for marketing and remitting the government’s share of total profi t oil, and under production sharing agreements (PSAs), contractors pay signature and other bonuses to Sonangol. In the past, much of the money stayed with Sonangol, which made purchases on behalf of the government without such transactions appearing in the offi cial budget. Sonangol has also used such funds to carry out the government’s policy to subsidise downstream oil prices. Such expenditures have been deducted from Sonangol’s tax bill, though apparently with little oversight by the government in practice. New auditing programmes, technical assistance, and the arrival of a reformist economic team in late 2002 have made the company’s operations somewhat clearer. All revenue fl ows via Sonangol are now supposed to appear in the government budget, even if much of the actual fl ows continue to accrue to the government as deductions to Sonangol’s tax bill.
Another issue is Sonangol’s ownership of oil-fi eld services companies. This could create confl icts of interest in that Sonangol could favour - or infl uence its international partners to favour – the selection of Sonangol-controlled companies, thus creating a potentially non-level playing fi eld for this industry. This could potentially even stifl e the growth of an Angolan oil-fi eld service industry (outside Sonangol), in turn making implementation of local content policies (see below) more diffi cult.
In addition, Sonangol has well over 30 subsidiary companies in areas as diverse as manufacturing, transport, telecommunications, and banking. Sonangol argues that, due to a historic lack of domestic infrastructure and services companies, such horizontal diversifi cation has been necessary to facilitate the operations of its core commercial oil business. This seems reasonable given the country’s war-torn economy, but whether this is still the case is not clear. Moreover, market dominance across a number of sectors, combined with Sonangol’s political infl uence and preferential access to capital, could potentially create barriers to new market entrants in these areas.
218590_p081-110_chap03.indd 86218590_p081-110_chap03.indd 86 21/09/06 11:32:2021/09/06 11:32:20
© O
ECD
/IEA
, 200
6
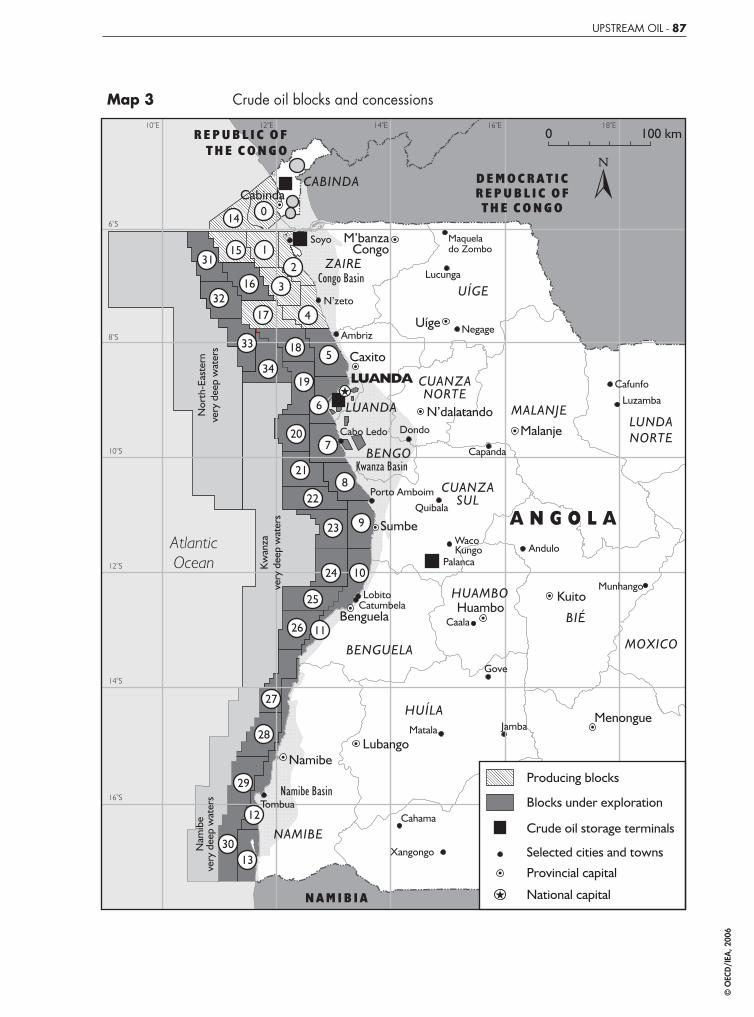
UPSTREAM OIL - 87
Map 3 Crude oil blocks and concessions
218590_p081-110_chap03.indd 87218590_p081-110_chap03.indd 87 21/09/06 11:32:2021/09/06 11:32:20
© O
ECD
/IEA
, 200
6
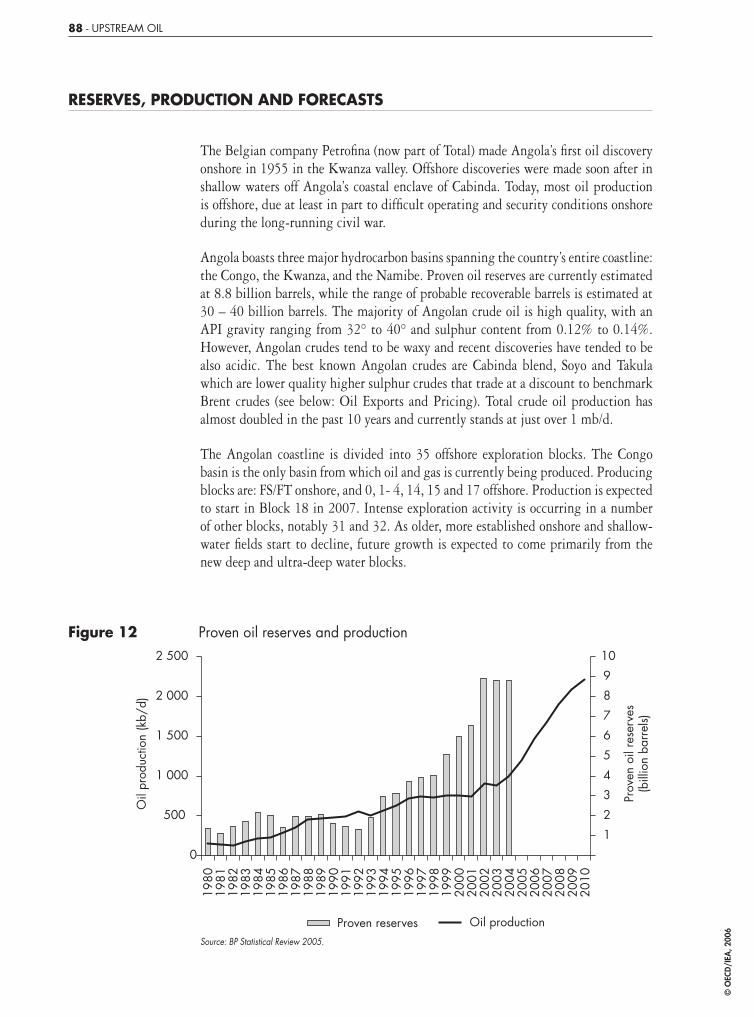
88 - UPSTREAM OIL
RESERVES, PRODUCTION AND FORECASTS
The Belgian company Petrofi na (now part of Total) made Angola’s fi rst oil discovery onshore in 1955 in the Kwanza valley. Offshore discoveries were made soon after in shallow waters off Angola’s coastal enclave of Cabinda. Today, most oil production is offshore, due at least in part to diffi cult operating and security conditions onshore during the long-running civil war.
Angola boasts three major hydrocarbon basins spanning the country’s entire coastline: the Congo, the Kwanza, and the Namibe. Proven oil reserves are currently estimated at 8.8 billion barrels, while the range of probable recoverable barrels is estimated at 30 – 40 billion barrels. The majority of Angolan crude oil is high quality, with an API gravity ranging from 32° to 40° and sulphur content from 0.12% to 0.14%. However, Angolan crudes tend to be waxy and recent discoveries have tended to be also acidic. The best known Angolan crudes are Cabinda blend, Soyo and Takula which are lower quality higher sulphur crudes that trade at a discount to benchmark Brent crudes (see below: Oil Exports and Pricing). Total crude oil production has almost doubled in the past 10 years and currently stands at just over 1 mb/d.
The Angolan coastline is divided into 35 offshore exploration blocks. The Congo basin is the only basin from which oil and gas is currently being produced. Producing blocks are: FS/FT onshore, and 0, 1- 4, 14, 15 and 17 offshore. Production is expected to start in Block 18 in 2007. Intense exploration activity is occurring in a number of other blocks, notably 31 and 32. As older, more established onshore and shallow-water fi elds start to decline, future growth is expected to come primarily from the new deep and ultra-deep water blocks.
Figure 12 Proven oil reserves and production
1980
1981
1982
1983
1984
1985
1986
1987
1988
1989
1990
1991
1992
1993
1994
1995
1996
1997
1998
1999
2000
2001
2002
2003
2004
2005
2006
2007
2008
2009
2010
2 500
2 000
1 500
1 000
500
0
Oil
prod
uctio
n (k
b/d)
Prov
en o
il re
serv
es(b
illio
n ba
rrel
s)
1
2
3
4
5
6
7
8
9
10
Proven reserves Oil productionSource: BP Statistical Review 2005.
218590_p081-110_chap03.indd 88218590_p081-110_chap03.indd 88 21/09/06 11:32:2121/09/06 11:32:21
© O
ECD
/IEA
, 200
6
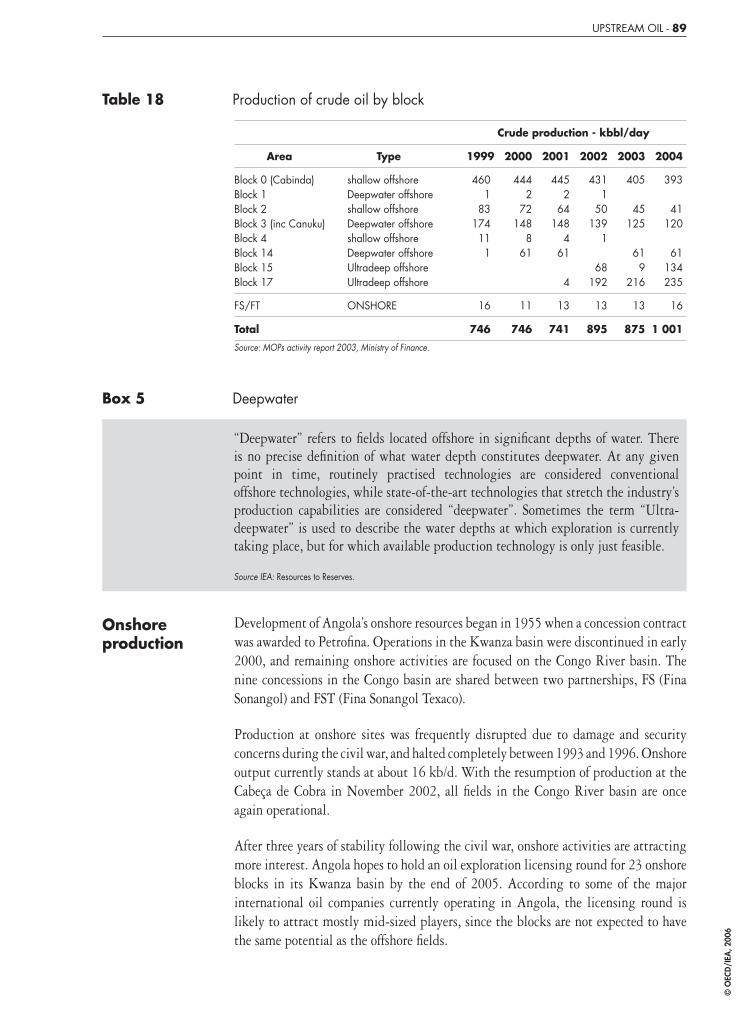
UPSTREAM OIL - 89
Table 18 Production of crude oil by block
Crude production - kbbl/day
Area Type 1999 2000 2001 2002 2003 2004
Block 0 (Cabinda)Block 1Block 2Block 3 (inc Canuku)Block 4Block 14Block 15Block 17
shallow offshoreDeepwater offshoreshallow offshoreDeepwater offshoreshallow offshoreDeepwater offshoreUltradeep offshoreUltradeep offshore
4601
83174111
4442
72148
861
4452
64148
461
4
4311
50139
1
68192
405
45125
619
216
393
41120
61134235
FS/FT ONSHORE 16 11 13 13 13 16
Total 746 746 741 895 875 1 001
Source: MOPs activity report 2003, Ministry of Finance.
Box 5 Deepwater
“Deepwater” refers to fi elds located offshore in signifi cant depths of water. There is no precise defi nition of what water depth constitutes deepwater. At any given point in time, routinely practised technologies are considered conventional offshore technologies, while state-of-the-art technologies that stretch the industry’s production capabilities are considered “deepwater”. Sometimes the term “Ultra-deepwater” is used to describe the water depths at which exploration is currently taking place, but for which available production technology is only just feasible.
Source IEA: Resources to Reserves.
Onshore production
Development of Angola’s onshore resources began in 1955 when a concession contract was awarded to Petrofi na. Operations in the Kwanza basin were discontinued in early 2000, and remaining onshore activities are focused on the Congo River basin. The nine concessions in the Congo basin are shared between two partnerships, FS (Fina Sonangol) and FST (Fina Sonangol Texaco).
Production at onshore sites was frequently disrupted due to damage and security concerns during the civil war, and halted completely between 1993 and 1996. Onshore output currently stands at about 16 kb/d. With the resumption of production at the Cabeça de Cobra in November 2002, all fi elds in the Congo River basin are once again operational.
After three years of stability following the civil war, onshore activities are attracting more interest. Angola hopes to hold an oil exploration licensing round for 23 onshore blocks in its Kwanza basin by the end of 2005. According to some of the major international oil companies currently operating in Angola, the licensing round is likely to attract mostly mid-sized players, since the blocks are not expected to have the same potential as the offshore fi elds.
218590_p081-110_chap03.indd 89218590_p081-110_chap03.indd 89 21/09/06 11:32:2121/09/06 11:32:21
© O
ECD
/IEA
, 200
6
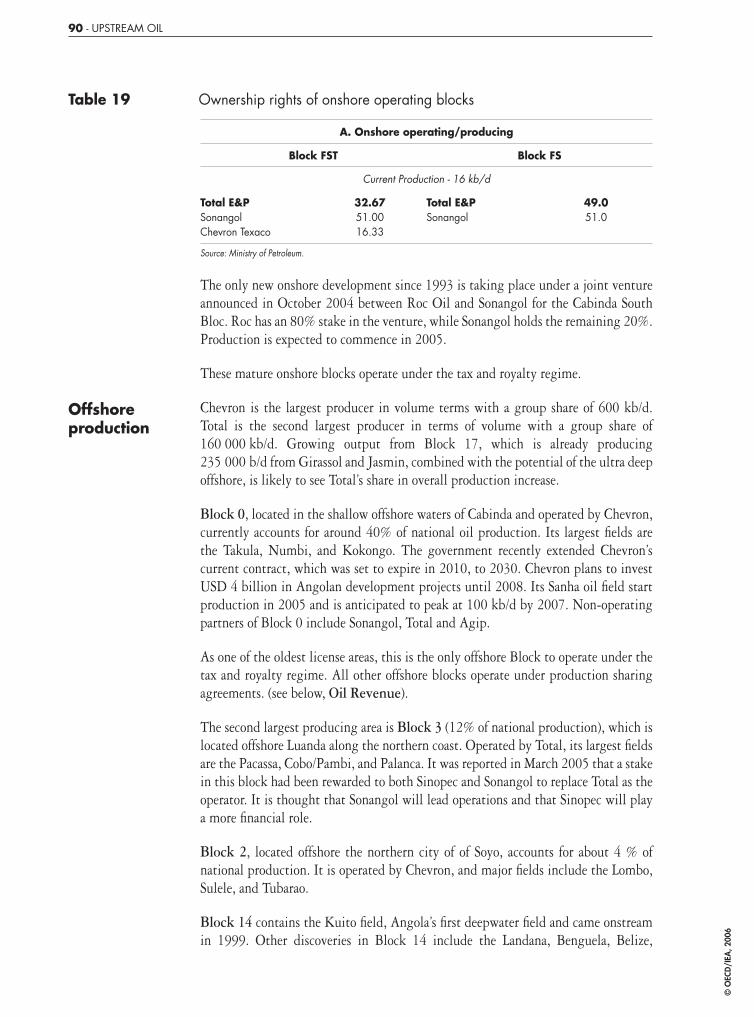
90 - UPSTREAM OIL
Table 19 Ownership rights of onshore operating blocks
A. Onshore operating/producing
Block FST Block FS
Current Production - 16 kb/d
Total E&PSonangolChevron Texaco
32.6751.0016.33
Total E&PSonangol
49.051.0
Source: Ministry of Petroleum.
The only new onshore development since 1993 is taking place under a joint venture announced in October 2004 between Roc Oil and Sonangol for the Cabinda South Bloc. Roc has an 80% stake in the venture, while Sonangol holds the remaining 20%. Production is expected to commence in 2005.
These mature onshore blocks operate under the tax and royalty regime.
Offshore production
Chevron is the largest producer in volume terms with a group share of 600 kb/d. Total is the second largest producer in terms of volume with a group share of 160 000 kb/d. Growing output from Block 17, which is already producing 235 000 b/d from Girassol and Jasmin, combined with the potential of the ultra deep offshore, is likely to see Total’s share in overall production increase.
Block 0, located in the shallow offshore waters of Cabinda and operated by Chevron, currently accounts for around 40% of national oil production. Its largest fi elds are the Takula, Numbi, and Kokongo. The government recently extended Chevron’s current contract, which was set to expire in 2010, to 2030. Chevron plans to invest USD 4 billion in Angolan development projects until 2008. Its Sanha oil fi eld start production in 2005 and is anticipated to peak at 100 kb/d by 2007. Non-operating partners of Block 0 include Sonangol, Total and Agip.
As one of the oldest license areas, this is the only offshore Block to operate under the tax and royalty regime. All other offshore blocks operate under production sharing agreements. (see below, Oil Revenue).
The second largest producing area is Block 3 (12% of national production), which is located offshore Luanda along the northern coast. Operated by Total, its largest fi elds are the Pacassa, Cobo/Pambi, and Palanca. It was reported in March 2005 that a stake in this block had been rewarded to both Sinopec and Sonangol to replace Total as the operator. It is thought that Sonangol will lead operations and that Sinopec will play a more fi nancial role.
Block 2, located offshore the northern city of of Soyo, accounts for about 4 % of national production. It is operated by Chevron, and major fi elds include the Lombo, Sulele, and Tubarao.
Block 14 contains the Kuito fi eld, Angola’s fi rst deepwater fi eld and came onstream in 1999. Other discoveries in Block 14 include the Landana, Benguela, Belize,
218590_p081-110_chap03.indd 90218590_p081-110_chap03.indd 90 21/09/06 11:32:2221/09/06 11:32:22
© O
ECD
/IEA
, 200
6
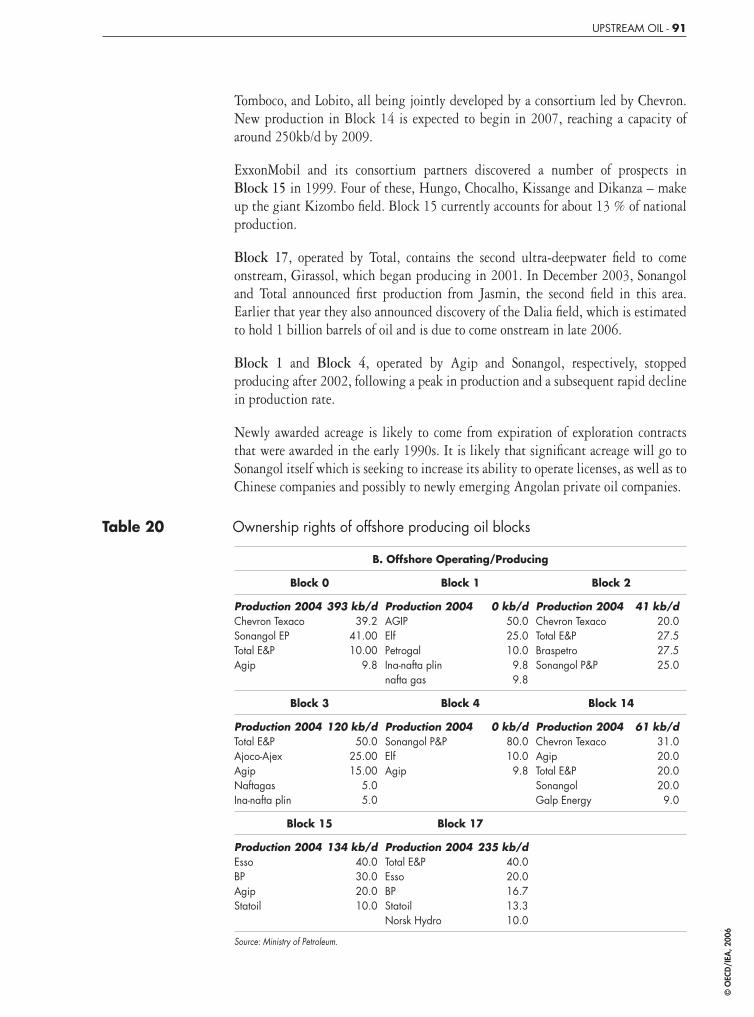
UPSTREAM OIL - 91
Tomboco, and Lobito, all being jointly developed by a consortium led by Chevron. New production in Block 14 is expected to begin in 2007, reaching a capacity of around 250kb/d by 2009.
ExxonMobil and its consortium partners discovered a number of prospects in Block 15 in 1999. Four of these, Hungo, Chocalho, Kissange and Dikanza – make up the giant Kizombo fi eld. Block 15 currently accounts for about 13 % of national production.
Block 17, operated by Total, contains the second ultra-deepwater fi eld to come onstream, Girassol, which began producing in 2001. In December 2003, Sonangol and Total announced fi rst production from Jasmin, the second fi eld in this area. Earlier that year they also announced discovery of the Dalia fi eld, which is estimated to hold 1 billion barrels of oil and is due to come onstream in late 2006.
Block 1 and Block 4, operated by Agip and Sonangol, respectively, stopped producing after 2002, following a peak in production and a subsequent rapid decline in production rate.
Newly awarded acreage is likely to come from expiration of exploration contracts that were awarded in the early 1990s. It is likely that signifi cant acreage will go to Sonangol itself which is seeking to increase its ability to operate licenses, as well as to Chinese companies and possibly to newly emerging Angolan private oil companies.
Table 20 Ownership rights of offshore producing oil blocks
B. Offshore Operating/Producing
Block 0 Block 1 Block 2
Production 2004Chevron TexacoSonangol EPTotal E&PAgip
393 kb/d39.2
41.0010.00
9.8
Production 2004AGIPElfPetrogalIna-nafta plinnafta gas
0 kb/d50.025.010.09.89.8
Production 2004Chevron TexacoTotal E&PBraspetroSonangol P&P
41 kb/d20.027.527.525.0
Block 3 Block 4 Block 14
Production 2004Total E&PAjoco-AjexAgipNaftagasIna-nafta plin
120 kb/d50.0
25.0015.00
5.05.0
Production 2004Sonangol P&PElfAgip
0 kb/d80.010.09.8
Production 2004Chevron TexacoAgipTotal E&PSonangolGalp Energy
61 kb/d31.020.020.020.09.0
Block 15 Block 17
Production 2004EssoBPAgipStatoil
134 kb/d40.030.020.010.0
Production 2004Total E&PEssoBPStatoilNorsk Hydro
235 kb/d40.020.016.713.310.0
Source: Ministry of Petroleum.
218590_p081-110_chap03.indd 91218590_p081-110_chap03.indd 91 21/09/06 11:32:2221/09/06 11:32:22
© O
ECD
/IEA
, 200
6
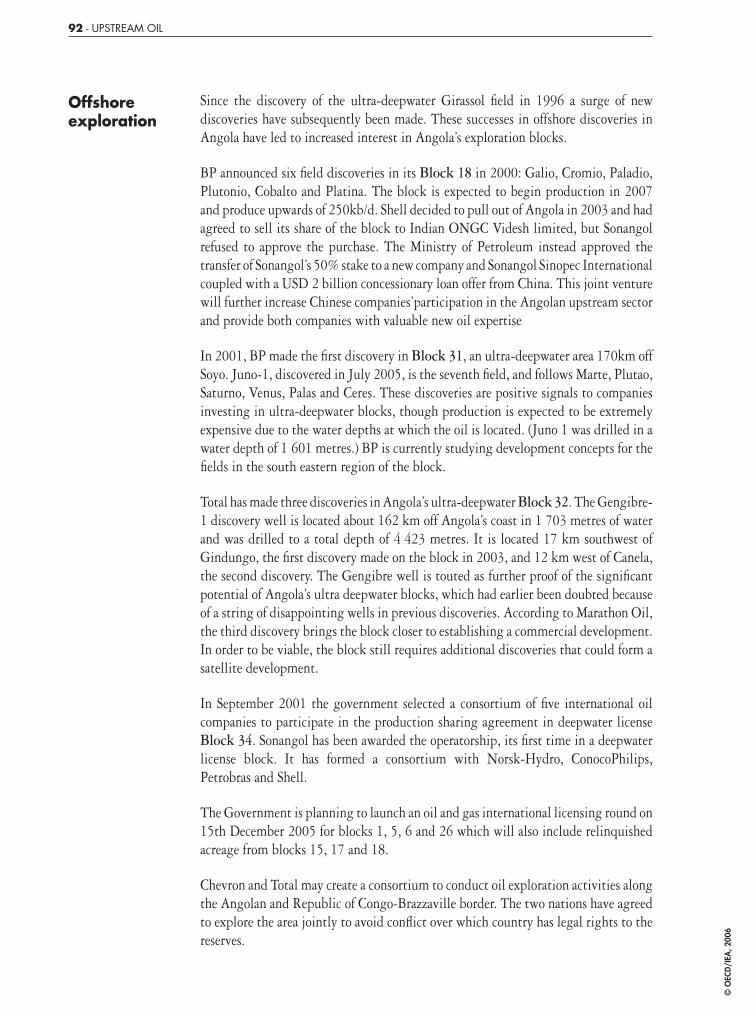
92 - UPSTREAM OIL
Offshore exploration
Since the discovery of the ultra-deepwater Girassol fi eld in 1996 a surge of new discoveries have subsequently been made. These successes in offshore discoveries in Angola have led to increased interest in Angola’s exploration blocks.
BP announced six fi eld discoveries in its Block 18 in 2000: Galio, Cromio, Paladio, Plutonio, Cobalto and Platina. The block is expected to begin production in 2007 and produce upwards of 250kb/d. Shell decided to pull out of Angola in 2003 and had agreed to sell its share of the block to Indian ONGC Videsh limited, but Sonangol refused to approve the purchase. The Ministry of Petroleum instead approved the transfer of Sonangol’s 50% stake to a new company and Sonangol Sinopec International coupled with a USD 2 billion concessionary loan offer from China. This joint venture will further increase Chinese companies’participation in the Angolan upstream sector and provide both companies with valuable new oil expertise
In 2001, BP made the fi rst discovery in Block 31, an ultra-deepwater area 170km off Soyo. Juno-1, discovered in July 2005, is the seventh fi eld, and follows Marte, Plutao, Saturno, Venus, Palas and Ceres. These discoveries are positive signals to companies investing in ultra-deepwater blocks, though production is expected to be extremely expensive due to the water depths at which the oil is located. (Juno 1 was drilled in a water depth of 1 601 metres.) BP is currently studying development concepts for the fi elds in the south eastern region of the block.
Total has made three discoveries in Angola’s ultra-deepwater Block 32. The Gengibre-1 discovery well is located about 162 km off Angola’s coast in 1 703 metres of water and was drilled to a total depth of 4 423 metres. It is located 17 km southwest of Gindungo, the fi rst discovery made on the block in 2003, and 12 km west of Canela, the second discovery. The Gengibre well is touted as further proof of the signifi cant potential of Angola’s ultra deepwater blocks, which had earlier been doubted because of a string of disappointing wells in previous discoveries. According to Marathon Oil, the third discovery brings the block closer to establishing a commercial development. In order to be viable, the block still requires additional discoveries that could form a satellite development.
In September 2001 the government selected a consortium of fi ve international oil companies to participate in the production sharing agreement in deepwater license Block 34. Sonangol has been awarded the operatorship, its fi rst time in a deepwater license block. It has formed a consortium with Norsk-Hydro, ConocoPhilips, Petrobras and Shell.
The Government is planning to launch an oil and gas international licensing round on 15th December 2005 for blocks 1, 5, 6 and 26 which will also include relinquished acreage from blocks 15, 17 and 18.
Chevron and Total may create a consortium to conduct oil exploration activities along the Angolan and Republic of Congo-Brazzaville border. The two nations have agreed to explore the area jointly to avoid confl ict over which country has legal rights to the reserves.
218590_p081-110_chap03.indd 92218590_p081-110_chap03.indd 92 21/09/06 11:32:2221/09/06 11:32:22
© O
ECD
/IEA
, 200
6
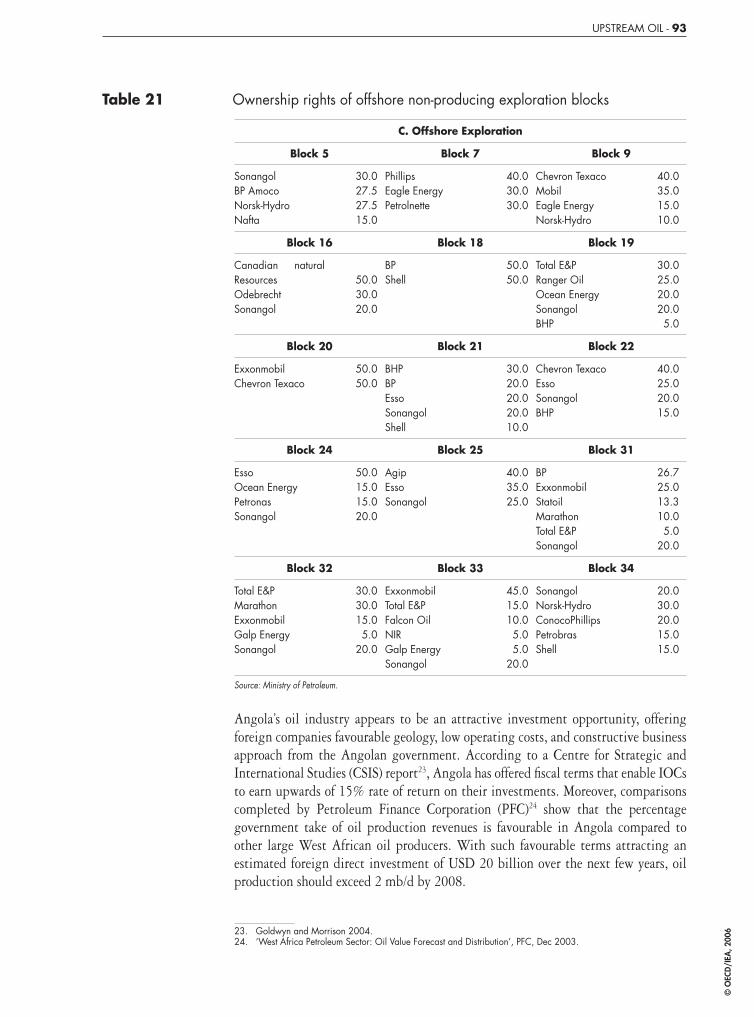
UPSTREAM OIL - 93
Table 21 Ownership rights of offshore non-producing exploration blocks
C. Offshore Exploration
Block 5 Block 7 Block 9
SonangolBP AmocoNorsk-HydroNafta
30.027.527.515.0
PhillipsEagle EnergyPetrolnette
40.030.030.0
Chevron TexacoMobilEagle EnergyNorsk-Hydro
40.035.015.010.0
Block 16 Block 18 Block 19
Canadian natural ResourcesOdebrechtSonangol
50.030.020.0
BPShell
50.050.0
Total E&PRanger OilOcean EnergySonangolBHP
30.025.020.020.05.0
Block 20 Block 21 Block 22
ExxonmobilChevron Texaco
50.050.0
BHPBPEssoSonangolShell
30.020.020.020.010.0
Chevron TexacoEssoSonangolBHP
40.025.020.015.0
Block 24 Block 25 Block 31
EssoOcean EnergyPetronasSonangol
50.015.015.020.0
AgipEssoSonangol
40.035.025.0
BPExxonmobilStatoilMarathonTotal E&PSonangol
26.725.013.310.05.0
20.0
Block 32 Block 33 Block 34
Total E&PMarathonExxonmobilGalp EnergySonangol
30.030.015.05.0
20.0
ExxonmobilTotal E&PFalcon OilNIRGalp EnergySonangol
45.015.010.05.05.0
20.0
SonangolNorsk-HydroConocoPhillipsPetrobrasShell
20.030.020.015.015.0
Source: Ministry of Petroleum.
Angola’s oil industry appears to be an attractive investment opportunity, offering foreign companies favourable geology, low operating costs, and constructive business approach from the Angolan government. According to a Centre for Strategic and International Studies (CSIS) report23, Angola has offered fi scal terms that enable IOCs to earn upwards of 15% rate of return on their investments. Moreover, comparisons completed by Petroleum Finance Corporation (PFC)24 show that the percentage government take of oil production revenues is favourable in Angola compared to other large West African oil producers. With such favourable terms attracting an estimated foreign direct investment of USD 20 billion over the next few years, oil production should exceed 2 mb/d by 2008.
23. Goldwyn and Morrison 2004.24. ‘West Africa Petroleum Sector: Oil Value Forecast and Distribution’, PFC, Dec 2003.
218590_p081-110_chap03.indd 93218590_p081-110_chap03.indd 93 21/09/06 11:32:2321/09/06 11:32:23
© O
ECD
/IEA
, 200
6
94 - UPSTREAM OIL
Table 22 Angolan oil production forecast 2005-2010
kb/d Block 2005 2006 2007 2008 2009 2010
Baseload DeepwaterJasminXicombaSanha cond.Kizomba AKizomba BKizomba CKizomba DDaliaBelize/Benguela/Lobito/Tomboco IBelize/Benguela/Lobito/Tomboco IIGt PlutoniaLandana/TombuaMarimbaMavacolaPlutao/SaturnoRosa/LirioOthers
1715
015151515171414181415153117
250328021
23443
226358048
250238
4262
181506480
250250125
15080
50
145405164
250250200
2259025
150
255025
116324151
200250250
22510050
20050
75100100
93263341
160200250
50225100
75250
75
100140200
Total Deepwater 664 981 1 280 1 590 1 840 2 017
Other production 530 492 394 315 252 202
Total oil production 1 195 1 473 1 674 1 905 2 092 2 219
Source: IEA Oil Markets.
Along with the majors, state-owned national oil companies from a number of developing and emerging market countries, notably including China, are actively vying for positions in the Angolan market. The IEA review team sees some implications in these types of investments for Angola’s successful economic development. Notably, such companies tend to place less pressure on host governments for transparency regarding revenues, in part because they are often under less pressure than the majors from home governments, home publics and customers to do so. This can make such companies less demanding and hence more attractive partners to some host governments, while undermining international attempts to promote more oil revenue transparency, e.g., through the Extractive Industries Transparency Initiative (see below). So far, however, companies from developing and emergent market countries generally have not been able to compete in technology, an important factor in deep-water Angola.
TECHNOLOGY ISSUES
Innovative technologies in upstream exploration and production have played an important part in successfully producing oil at greater depths in Angola. As exploration moves into deepwater areas, technological progress will be vital to ensuring successful development of these new discoveries.
218590_p081-110_chap03.indd 94218590_p081-110_chap03.indd 94 21/09/06 11:32:2321/09/06 11:32:23
© O
ECD
/IEA
, 200
6
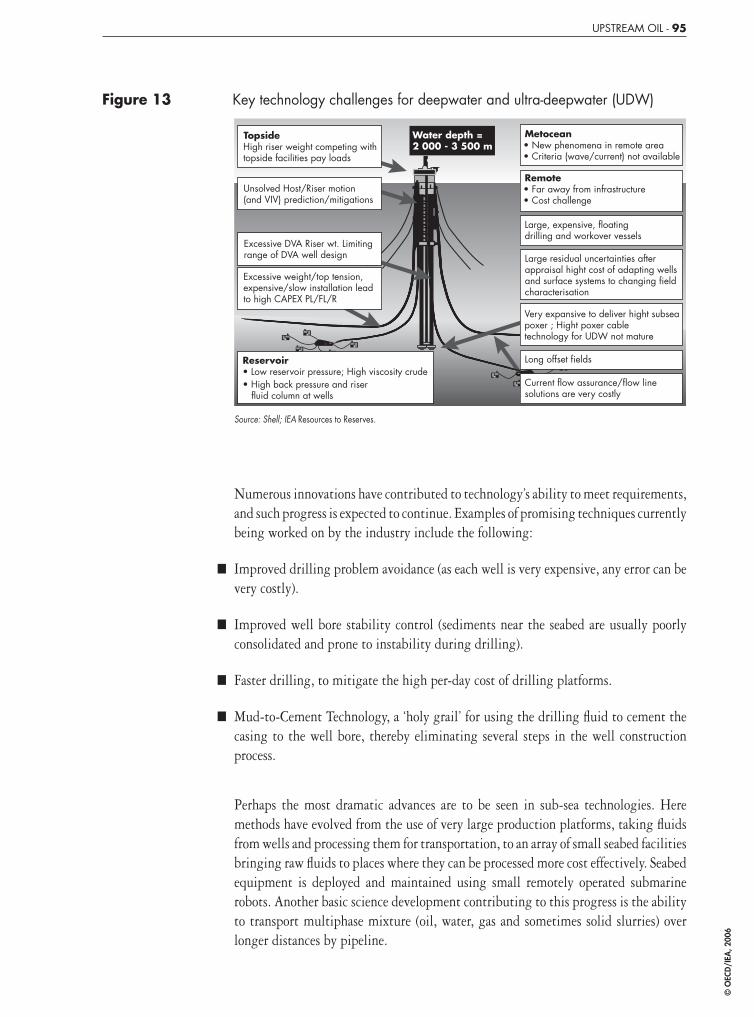
UPSTREAM OIL - 95
Figure 13 Key technology challenges for deepwater and ultra-deepwater (UDW)
Reservoir• Low reservoir pressure; High viscosity crude• High back pressure and riser fluid column at wells
Excessive weight/top tension, expensive/slow installation leadto high CAPEX PL/FL/R
Excessive DVA Riser wt. Limitingrange of DVA well design
Unsolved Host/Riser motion(and VIV) prediction/mitigations
TopsideHigh riser weight competing withtopside facilities pay loads
Metocean• New phenomena in remote area• Criteria (wave/current) not available
Remote• Far away from infrastructure• Cost challenge
Large, expensive, floatingdrilling and workover vessels
Very expansive to deliver hight subseapoxer ; Hight poxer cabletechnology for UDW not mature
Long offset fields
Current flow assurance/flow linesolutions are very costly
Water depth = 2 000 - 3 500 m
Large residual uncertainties afterappraisal hight cost of adapting wellsand surface systems to changing fieldcharacterisation
Source: Shell; IEA Resources to Reserves.
Numerous innovations have contributed to technology’s ability to meet requirements, and such progress is expected to continue. Examples of promising techniques currently being worked on by the industry include the following:
■ Improved drilling problem avoidance (as each well is very expensive, any error can be very costly).
■ Improved well bore stability control (sediments near the seabed are usually poorly consolidated and prone to instability during drilling).
■ Faster drilling, to mitigate the high per-day cost of drilling platforms.
■ Mud-to-Cement Technology, a ‘holy grail’ for using the drilling fl uid to cement the casing to the well bore, thereby eliminating several steps in the well construction process.
Perhaps the most dramatic advances are to be seen in sub-sea technologies. Here methods have evolved from the use of very large production platforms, taking fl uids from wells and processing them for transportation, to an array of small seabed facilities bringing raw fl uids to places where they can be processed more cost effectively. Seabed equipment is deployed and maintained using small remotely operated submarine robots. Another basic science development contributing to this progress is the ability to transport multiphase mixture (oil, water, gas and sometimes solid slurries) over longer distances by pipeline.
218590_p081-110_chap03.indd 95218590_p081-110_chap03.indd 95 21/09/06 11:32:2321/09/06 11:32:23
© O
ECD
/IEA
, 200
6
96 - UPSTREAM OIL
Box 6 The Girassol project
The discovery of Angola’s Girassol fi eld in Block 17 by Total demonstrated that this offshore province contained large hydrocarbon accumulations with excellent production potential, which amounted to a revolution for exploration activity in the gulf of Guinea, causing revisions to exploration activities. Developments in software for imaging, seismic data processing has helped quantify the uncertainties during the geo science studies, and so accelerate the exploration process. The Girassol project went beyond the conventional offshore to demonstrate that the deep offshore contained a large number of prolifi c reservoirs. Girassol will always remain the pioneering deepwater offshore project. In December 2001, this project was the largest development in the world at such great depths (1 400 m), acquiring original solutions and innovative technologies. This fi eld employed an innovative riser concept with heated fl exible integrated pipe bundles bringing oil to the fl oating production storage and offshore loading vessel.
Maximising production of more depleted fi elds is also a challenge. This requires, among other things, localising and quantifying as accurately as possible the remaining reserves, taking into account the mechanical phenomena caused by reservoir depletion.
Angola’s exploration has not yet reached the current world record water depths of 3 000m seen offshore Brazil, so the technological barriers do not yet present constraints to Angola’s immediate increases in oil production. But as exploration in Angola continues to drift towards more costly ultra-deep water blocks 31, 32, 33 and 34, oil fi nds will bring with them even tougher technological challenges to make these deeper-water projects economical. Project teams will be faced with more complex problems, including more heterogeneous reservoirs and heavier, more viscous fuels, which will require next generation technologies to ensure commercial viability.
Experience in IEA member countries has shown that adjusting taxation schemes and other incentives as production costs increase can be instrumental in catalysing the technology need to increase the proven reserves base.
OIL STORAGE AND LOGISTICS
The same companies that produce Angola’s oil also export it to international markets. All oil exports are by sea. Most pass through Angola’s major oil exporting terminals situated in Luanda, Palanca, Kuito and Malango (Cabinda). Details on the most important of these are provided below.
The Malongo Terminal is operated by Chevron and loads both Cabinda and Nemba crude oils. It can accommodate Very Large Crude Carriers (VLCC). The typical cargo size is 950 thousand barrels, but alternate cargo sizes can be arranged with advance
218590_p081-110_chap03.indd 96218590_p081-110_chap03.indd 96 21/09/06 11:32:2421/09/06 11:32:24
© O
ECD
/IEA
, 200
6

UPSTREAM OIL - 97
Table 23 Angolan crude oil tanker ports
Port/Terminal Location OperatorMaxDwt
LoadT/Hr
Essungo SPMGirassol FPSOKiabo Marine TerminalKiame Marine Terminal FPSOKuito Marine Terminal FPSOLombo Terminal FPSOLuanda Terminal SBMMalongo (Cabinda)Namibe (Mocamedes) Palanca SPMTakula Terminal SPM
Quinfuquena - Soyo
Kiabo OffshoreKiame OffshoreKuito OffshoreLombo EsteOffshore LuandaMalongoPorto SacoPalancaTakula
Texaco Panama Inc. AngolaTotalFinaElfSonangol P&PRanger Oil Angola LtdCABGOCTexaco Panama Inc. Angola
CABGOC
Elf Exploration AngolaCABGOC
150 000150 000150 000150 000320 000150 00080 000
325 000165 000320 000300 000
700
1 9004 5004 7504 5003 4005 450
5 1501 700
planning. The minimum cargo size is 600 thousand barrels. The production rate of the contributing fi elds is approximately 140 thousand barrels per day.25
The Palanca Terminal, operated by Total, loads oil for export from fi ve different concessions and can accommodate VLCC loading. The typical cargo size is 985 thousand barrels. The production rate of the contributing fi elds is approximately 140 thousand barrels per day.
Kuito crude oil is exported from the Kuito Floating Production Storage Offl oading (FPSO) Vessel. The Single Point Buoy Mooring (SBM), which is 30 miles from the Cabinda SBM, can accommodate VLCC loading. The typical cargo size is 920 thousand barrels. The FPSO Kuito has a 1.4 million-barrel storage capacity and can process 120 000 barrels of fl uids each day. Similarly, 2004 and 2005 have seen offshore loadings of 950 kb vessels begin for heavy, sweet Hungo and Kissonje. Combined production of the two grades is thought to amount to some 500 kb/d.
There appears to be suffi cient oil storage capacity in Angola to meet future oil production and export growth. However, storage capacity in oil product distribution may present a serious bottleneck for the domestic market (see chapter: Downstream Oil).
OIL EXPORTS AND PRICING
Domestic oil consumption is relatively small in Angola at 1.7 million metric tonnes, but could increase considerably with eventual non-oil economic growth. The Luanda refi nery processes only about 45 kb/d, though a proposed new refi nery could take up to 200 kb/day. Currently, the lion’s share of Angolan crude oil is exported to refi neries on the Atlantic Seaboard of the United States and, increasingly, to China.
25. Cabinda export blend is comprised of approximately 70% Takula and 30% Malongo crudes. It is medium-gravity with low sulphur content. Its high wax content restricts sales destinations to warm seas or ports with heated tankage.
218590_p081-110_chap03.indd 97218590_p081-110_chap03.indd 97 21/09/06 11:32:2421/09/06 11:32:24
© O
ECD
/IEA
, 200
6

98 - UPSTREAM OIL
In 2004, the United States imported more than 320 kb/d of Angolan crude oil, i.e., over one third of Angola’s total exports and 3% of US crude oil imports. France imported 55 kb/d and Spain and Korea imported 11kb/d apiece from Angola over the same period.
Over the past ten years a larger fl ow of Angolan exports has been destined for non-OECD countries, notably China, India, Taiwan, the Philippines and other Asian countries. Trade fi gures suggest that China’s oil imports from Angola have grown rapidly since 1995 to over 300kb/d. China’s demand for Angolan crude is driven in part by its adoption of stricter environmental standards that will place a premium on lower-sulphur West African crudes. However, such policies could restrict its uptake of Angola’s newer, high-sulphur crudes from some of its deep and ultra-deep blocks.
Bearing in mind Angola’s favorable prospects for oil production growth, the country will play an increasingly important role in meeting incremental world oil demand in the coming decade.
Angolan crude oil is normally priced on the international market based on a discount of around USD 5-6 to dated Brent, due to its acidity.26 Aside from oil that is delivered to the downstream systems of the equity producers, most of the remainder is traded on the spot market. Angolan crudes are some of the world’s most actively traded spot barrels after international benchmarks and Nigerian grade crudes.
Table 24 Angolan crude oil exports to the OECD
Exports (kb/d)
1995 1996 1997 1998 1999 2000 2001 2002 2003 2004
AustriaBelgiumFranceGermanyItalyJapanKoreaNetherlandsPortugalSpainSwitzerlandUnited KingdomUnited StatesChina
000
3913
2030
2100
36620
00
1919233
1000
2050
35433
03
29400
2400800
42977
00
211273
2703001
47222
10
1318
22
11000502
37558
06
35920
5236
1300
322173
01
71643
24151313
05
34076
00
772426452448300
339114
00
618
165
2010000
378203
00
55000
1100
1100
322324
Exports to OECDExports to non OECD
443132
453205
496187
545128
527160
447241
494190
549298
489338
399534
Total Exports 575 658 683 673 687 688 684 847 827 933
Source: IEA OMR.
26. Acidity refers to the sulphur content of the crude oil.
218590_p081-110_chap03.indd 98218590_p081-110_chap03.indd 98 21/09/06 11:32:2421/09/06 11:32:24
© O
ECD
/IEA
, 200
6
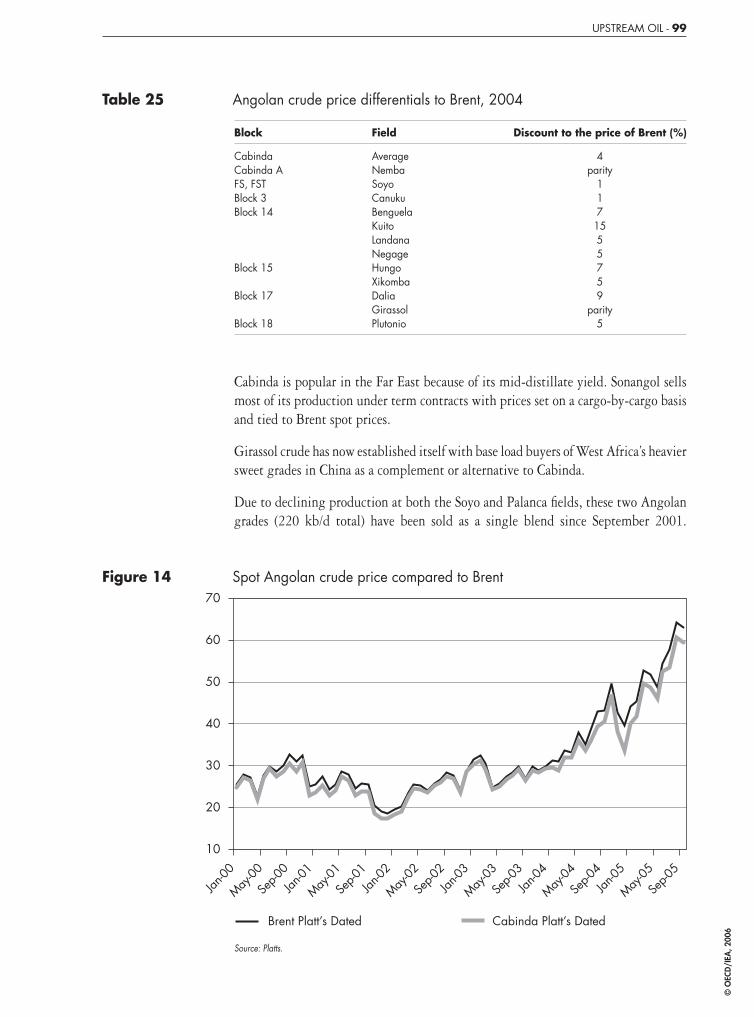
UPSTREAM OIL - 99
Table 25 Angolan crude price differentials to Brent, 2004
Block Field Discount to the price of Brent (%)
CabindaCabinda AFS, FSTBlock 3Block 14
Block 15
Block 17
Block 18
AverageNembaSoyoCanukuBenguelaKuitoLandanaNegageHungoXikombaDaliaGirassolPlutonio
4parity
1171555759
parity5
Cabinda is popular in the Far East because of its mid-distillate yield. Sonangol sells most of its production under term contracts with prices set on a cargo-by-cargo basis and tied to Brent spot prices.
Girassol crude has now established itself with base load buyers of West Africa’s heavier sweet grades in China as a complement or alternative to Cabinda.
Due to declining production at both the Soyo and Palanca fi elds, these two Angolan grades (220 kb/d total) have been sold as a single blend since September 2001.
Figure 14 Spot Angolan crude price compared to Brent
10
20
30
40
50
60
70
Jan-00
May-00
Sep-0
0Jan
-01
May-01
Sep-0
1Jan
-02
May-02
Sep-0
2Jan
-03
May-03
Sep-0
3Jan
-04
May-04
Sep-0
4Jan
-05
May-05
Sep-0
5
Brent Platt’s Dated Cabinda Platt’s Dated
Source: Platts.
218590_p081-110_chap03.indd 99218590_p081-110_chap03.indd 99 21/09/06 11:32:2521/09/06 11:32:25
© O
ECD
/IEA
, 200
6

100 - UPSTREAM OIL
The blend is light and very low sulphur, particularly suitable for motor gasoline production in a complex refi nery, as well as for production of jet fuel and lubestocks. It can also be used for direct burning in power generation plants.
The Soyo/Palanca blend is sold using a dated Brent-related formula, usually with a slight premium to the North Sea benchmark grade. Export volumes fl ow mainly toward the Atlantic Basin but sales have been made increasingly to the Asia-Pacifi c region. Exports are approximately 7 million barrels per month.
Kizomba B stream slightly more acidic than its neighbour Kizomba A, according to an assay released by equity holder statoil, came on stream in July 2005. The new crude is being marketed as Kissanje Blend and is forecast to reach 200 kb/d by the end of 2005. Kissanje has an API of 28.2° and 0.44% sulphur by weight. Fellow block -15 stream Hungo, from the 230 kb/d Kizomba A development, has a slightly lighter API of 28.5° and 0.71% Sulphur.
TAX REGIME
The government raises revenues by two distinct tax regimes on oil production and through signature bonuses on exploration rights.
The two oil tax regimes in Angola are the following:
■ Tax and royalty regimes – applying only to operations in Cabinda and the onshore FS-FST blocks.
■ Production sharing agreements (PSA) – applying to all other blocks.
The tax and royalty regime raises revenue through three taxes; the production tax (royalty), the Petroleum Income Tax (PIT), and the Petroleum Transaction tax.
Companies operating under Production Sharing Agreements function as contractors to Sonangol, through consortiums or individually. Once production starts they recoup their costs by retaining a share of the oil produced (‘cost oil’). The remaining ‘profi t oil’ is shared between the government and the companies in proportions that vary by block and depend on a number of factors, including cumulative production, internal rate of return, and/or the depth of the wells. Companies pay 50% income tax on their share of the profi t oil. PSAs guarantee the government revenue even in the event that extraction is not profi table for the contracted companies.
Table 26 Government oil revenue (million USD)
2000 2001 2002 2003 2004
Value of oil productionTotal government oil revenueImplied government share (%)
7 4143 94553.2
6 1443 194
52
7 7393 30442.7
9 0073 892
43.2
12 6025 69645.2
Source: Ministry of Finance.
218590_p081-110_chap03.indd 100218590_p081-110_chap03.indd 100 21/09/06 11:32:2821/09/06 11:32:28
© O
ECD
/IEA
, 200
6
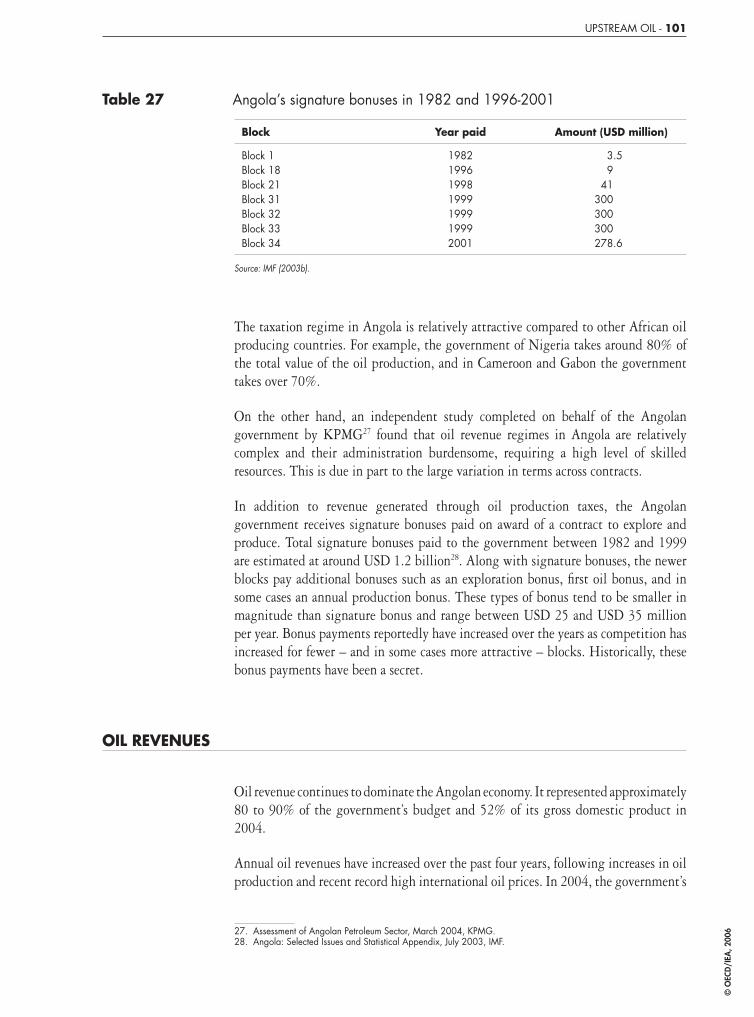
UPSTREAM OIL - 101
Table 27 Angola’s signature bonuses in 1982 and 1996-2001
Block Year paid Amount (USD million)
Block 1Block 18Block 21Block 31Block 32Block 33Block 34
1982199619981999199919992001
3.59.0
41.0300.0300.0300.0278.6
Source: IMF (2003b).
The taxation regime in Angola is relatively attractive compared to other African oil producing countries. For example, the government of Nigeria takes around 80% of the total value of the oil production, and in Cameroon and Gabon the government takes over 70%.
On the other hand, an independent study completed on behalf of the Angolan government by KPMG27 found that oil revenue regimes in Angola are relatively complex and their administration burdensome, requiring a high level of skilled resources. This is due in part to the large variation in terms across contracts.
In addition to revenue generated through oil production taxes, the Angolan government receives signature bonuses paid on award of a contract to explore and produce. Total signature bonuses paid to the government between 1982 and 1999 are estimated at around USD 1.2 billion28. Along with signature bonuses, the newer blocks pay additional bonuses such as an exploration bonus, fi rst oil bonus, and in some cases an annual production bonus. These types of bonus tend to be smaller in magnitude than signature bonus and range between USD 25 and USD 35 million per year. Bonus payments reportedly have increased over the years as competition has increased for fewer – and in some cases more attractive – blocks. Historically, these bonus payments have been a secret.
OIL REVENUES
Oil revenue continues to dominate the Angolan economy. It represented approximately 80 to 90% of the government’s budget and 52% of its gross domestic product in 2004.
Annual oil revenues have increased over the past four years, following increases in oil production and recent record high international oil prices. In 2004, the government’s
27. Assessment of Angolan Petroleum Sector, March 2004, KPMG.28. Angola: Selected Issues and Statistical Appendix, July 2003, IMF.
218590_p081-110_chap03.indd 101218590_p081-110_chap03.indd 101 21/09/06 11:32:2821/09/06 11:32:28
© O
ECD
/IEA
, 200
6
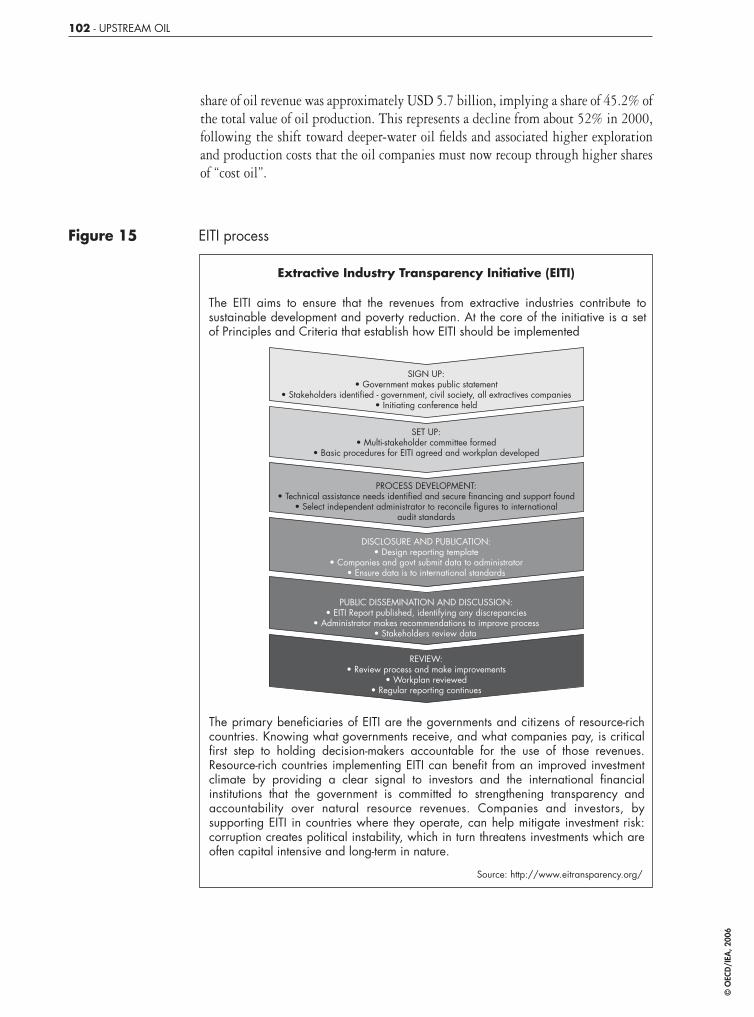
102 - UPSTREAM OIL
share of oil revenue was approximately USD 5.7 billion, implying a share of 45.2% of the total value of oil production. This represents a decline from about 52% in 2000, following the shift toward deeper-water oil fi elds and associated higher exploration and production costs that the oil companies must now recoup through higher shares of “cost oil”.
Figure 15 EITI process
Extractive Industry Transparency Initiative (EITI)
The EITI aims to ensure that the revenues from extractive industries contribute to sustainable development and poverty reduction. At the core of the initiative is a set of Principles and Criteria that establish how EITI should be implemented
The primary beneficiaries of EITI are the governments and citizens of resource-rich countries. Knowing what governments receive, and what companies pay, is critical first step to holding decision-makers accountable for the use of those revenues. Resource-rich countries implementing EITI can benefit from an improved investment climate by providing a clear signal to investors and the international financial institutions that the government is committed to strengthening transparency and accountability over natural resource revenues. Companies and investors, by supporting EITI in countries where they operate, can help mitigate investment risk: corruption creates political instability, which in turn threatens investments which are often capital intensive and long-term in nature.
Source: http://www.eitransparency.org/
SIGN UP:• Government makes public statement
• Stakeholders identified - government, civil society, all extractives companies• Initiating conference held
SET UP:• Multi-stakeholder committee formed
• Basic procedures for EITI agreed and workplan developed
PROCESS DEVELOPMENT:• Technical assistance needs identified and secure financing and support found
• Select independent administrator to reconcile figures to internationalaudit standards
DISCLOSURE AND PUBLICATION:• Design reporting template
• Companies and govt submit data to administrator• Ensure data is to international standards
PUBLIC DISSEMINATION AND DISCUSSION:• EITI Report published, identifying any discrepancies
• Administrator makes recommendations to improve process• Stakeholders review data
REVIEW:• Review process and make improvements
• Workplan reviewed• Regular reporting continues
218590_p081-110_chap03.indd 102218590_p081-110_chap03.indd 102 21/09/06 11:32:2921/09/06 11:32:29
© O
ECD
/IEA
, 200
6
UPSTREAM OIL - 103
The oil diagnostic, a monitoring system promoted by both the International Monetary Fund (IMF) and the World Bank, was set up in 2000 in agreement with the Angolan government as one of the conditions for an eventual programme with the IMF. KPMG was awarded the contract, which included monitoring and assessing the country’s oil revenues. The oil diagnostic raised questions about a portion (USD 4.2 billion) of oil revenues between 1997 and 2002 that could not be accounted for.
The government reportedly has since made progress in addressing transparency in their efforts to restart a Staff Monitored Programme (SMP); a prerequisite for a full IMF programme. In particular, most oil revenue is now reportedly channelled via the Central Bank instead of kept off-budget in the care of Sonangol or the Presidency. Angola is also under increasing pressure to join the Extractive Industry Transparency Initiative (EITI) which aims to ensure that the revenues from extractive industries contribute to sustainable development and poverty reduction. So far, however, the Angolan government has declared itself only an “observer”. The World Bank has expressed readiness to provide technical assistance to set up a revenue management unit within the government.
Angola’s economic development will depend to an important extent on how it manages and uses its oil revenues. Increasing the transparency of such fl ows will be key to such management. While the government’s record to date has been mixed, it has made some signifi cant progress in recent years.
Building on recent progress, the government should enhance coordination between the Ministries of Finance and Petroleum, Central Bank and other fi nancial, governmental and international institutions in its efforts to improve transparency in the management of oil revenues.
Legislative and regulatory framework, including main contract provisions
Law 13/78 of September 13, 1978 was the primary law governing the upstream oil sector until recently. Among other things, it designated Sonangol as the exclusive concessionaire for exploiting sub-surface petroleum resources in Angola.
Decree law 10/90 of October 18, 1996 established the Ministry of Petroleum and gave it overall responsibility for policy making in the petroleum sector.
In 2004, a new Petroleum Activities Law (Law No. 10/04 of November 12, 2004) came into force. It seeks to standardise future production sharing agreements, streamline the licensing process for granting rights to engage in exploration and production activities, and clarify the roles of the Ministry of Petroleum, Sonangol and operating companies. (A summary is provided in the Annex to this chapter.) While most oil company representatives to whom the IEA team talked were generally favourable about the new law, the primary concern of some was that it did not go far enough to reassure investors that the government does not plan to change the terms of existing contracts. This is potentially important, since uncertainty about previous contracts can undermine confi dence in the terms of future ones. While it is any government’s prerogative to make changes to the investment regime, it must of course balance this against its need to reassure investors and to honour sanctity of contract.
218590_p081-110_chap03.indd 103218590_p081-110_chap03.indd 103 21/09/06 11:32:3021/09/06 11:32:30
© O
ECD
/IEA
, 200
6

104 - UPSTREAM OIL
The government should be complimented on its intention and efforts to fully implement the Petroleum Law of 2004.
In order to fully implement the Petroleum Law of 2004 the government should strengthen necessary resources in the Ministry of Petroleum and other relevant agencies so that they are able to carry out their increased duties. It should also ensure that the regulatory framework provides suffi cient stability for existing contracts and for continued attraction of foreign investment.
ENVIRONMENT
The two main environmental issues in Angola’s upstream oil sector are the fl aring of associated natural gas and discharges by oil tankers.
The New Petroleum law specifi es that it is forbidden to fl are associated gas except during exceptionally short periods. Although the previous law also had anti-fl aring provisions, in practice companies were usually given a dispensation to fl are. However, the government has now declared that all new fi elds must be zero-fl are and that routine fl aring should cease by 2010. This stance seems to refl ect efforts to monetize the resource, greater international pressure and also greater environmental awareness on the part of the government. Flaring reduction plans developed by the oil companies in response generally have focused on re-injection and on a proposed joint project to build an onshore liquefaction plant in Soyo for LNG exports (see Gas chapter).
Cabinet decree 39/00 of 10 October 2000 notes that preservation of the environment is a priority objective of the Angolan government, and states that oil companies operating in Angola must have pollution prevention control mechanisms to minimize the ambient impact of their operations, prevent oil spills and minimize waste. In November 1999 the Angolan government drafted a bill to help prevent ecological disasters caused by oil production. The bill stipulates provisions for the creation of institutions to deal with major environmental disasters.
Law 5/98 of 19 June 1998 is the general environmental law to which the government will add regulations for various human activities that directly or indirectly have important potential impacts on the environment. It specifi es the need for environmental impact evaluation and licensing for any projects or activities that by their nature, location or dimension could have important environmental or social impacts; which would include most activities in the oil sector.
The Petroleum Ministry is responsible for environmental impact assessments.
The government of Angola has ratifi ed a number of environmental conventions including the Framework Convention on Climate Change and the Vienna Convention and Montreal Protocol on the Ozone Layer.
218590_p081-110_chap03.indd 104218590_p081-110_chap03.indd 104 21/09/06 11:32:3021/09/06 11:32:30
© O
ECD
/IEA
, 200
6
UPSTREAM OIL - 105
ENERGY DATA
Although most statistics in Angola, including energy statistics, are generally in need of improvement, they are reasonably good in the upstream oil sector. This is perhaps due to the importance of oil revenues to the country, as well as the metering and monitoring practices common in the international oil industry.
OIL SERVICES INDUSTRY
There is little indigenous industry in Angola, including oil related construction activities. Most oil industry equipment is imported. Many of the large international names are present in Angola, including Halliburton, Schlumberger, Daewoo Corporation, Occidental, and Pecten.
Sonangol also owns a number of oilfi eld service companies. As discussed earlier, this could create confl icts of interest and a potentially non-level playing fi eld for this industry.
CORPORATE SOCIAL RESPONSIBILITY
In Angola, most international oil companies are currently involved in many social programs including health, education and development activities such as:
■ Supply of medicines and foodstuffs.
■ Construction and rehabilitation of schools.
■ Building housing.
■ Farm projects.
■ Bridge and infrastructural repairs.
■ Solar power projects.
■ HIV awareness and prevention programmes.
■ Children food aid and health initiative.
Under some contracts the partners in a particular block are obliged to devote a percentage of the block’s revenues to fund such corporate social responsibility (CSR) activities.
Most companies note that they plan their CSR activities in consultation with the Angolan authorities. Some also sub-contract at least a portion of such activities. For
218590_p081-110_chap03.indd 105218590_p081-110_chap03.indd 105 21/09/06 11:32:3021/09/06 11:32:30
© O
ECD
/IEA
, 200
6
106 - UPSTREAM OIL
example, Chevron currently funds a USD 25 million programme by the US Agency for International Development (USAID) to develop a number of projects, including a micro-loan scheme for small businesses.
LOCAL CONTENT: “ANGOLANISATION”
Related to the companies’ corporate social responsibility programs is the drive towards local content. Despite positive contribution to GDP and exports, oil projects in developing countries typically have very high import intensity and very few linkages with local business. The Angolan authorities have expressed a wish to see more local personnel in international oil company activities. Direct references to local content in the new petroleum law include the following:
■ Must acquire Angolan goods and services whenever the quality is similar and the price no more than 10% higher. (Chapter II: Article 27).
■ Support the professional education of Angolans. (Chapter III: Article 86).
■ The companies operating in Angola must include Angolan citizens at every level of staff providing they possess the required expertise: payment and other conditions shall be the same. (Chapter VIII: Article 86 ).
Although the linkages have started to grow, the integration between domestic and foreign business remains limited to very low skilled activities such as catering and cleaning. Due to lack of domestic skilled labour, companies are struggling to meet the local content targets for higher level staff.29
The government has created a taskforce with the Ministry of Petroleum, Sonangol and the international oil companies to evaluate ways to increase the local content in various projects. For example, following negotiations with Sonangol, Hydro has committed itself to a 5-year management training program, under which 40 Angolans will be trained for management positions in Angolan, British and American Universities.
Box 7 BP - CSR and local content
A project initiated by BP aims to improve the capacity and competitiveness of local companies in Angola and to assist the oil industry to develop systems and procedures that will maximise cost-effective local content. The project is in two phases: a 6-month fi rst phase that focuses on market and gap analysis and programme design; and an implementation phase consisting mainly of training and consulting for Angolan Small Medium Enterprises (SMEs) that could provide services to the oil industry . The fi rst phase of the project was completed in 2004.
29. The government of Angola has set targets on local content for oil companies for their hiring of local staff: 100% Angolanisation for unskilled workers; 80% for mid level workers; 70% for higher level staff.
218590_p081-110_chap03.indd 106218590_p081-110_chap03.indd 106 21/09/06 11:32:3021/09/06 11:32:30
© O
ECD
/IEA
, 200
6

UPSTREAM OIL - 107
Box 8 New upstream oil law: unoffi cial summary
Chap I: general dispositions (Art. 1 - 3)
■ This Law relates to the rules to access and exercise of oil activities and operations at surface and subsea areas, in interior waters, territorial waters, exclusive economic zone and continental platform.
■ All oil reservoirs are public domain and so are owned by the state.
Chap II: organization and exercise of petroleum activities (Art. 4 - 27)
■ Sonangol EP remains the sole national concessionaire.
■ Oil operations require a license or a concession.
■ The license is accorded by the Minister and the Concession by the government.
■ The maximum period for a prospecting licence is 3 years (but may be extended).
■ Safety, hygiene and environment protection rules and regulations must be obeyed.
■ The Concessionaire, Licensees and Associates must cooperate with the Government in the promotion of the participation of Angolans in their activities and must acquire Angolan materials, goods and services whenever the quality is similar and the price no more then 10% higher
Chapt III: rights and duties (Art. 28 - 32)
■ Licensee rights include, performing tasks, implementing infrastructures and importing goods needed for licensed works.
■ The National Concessionaire must follow Government instructions and protect national interests. Requires the authorization to build infrastructures, facilitate government controls, make monthly and quarterly reports to the Government, keep all registries and documents, keep records, call for tenders for supplies, treat government offi cials in its facilities as its own personnel.
Chap IV: prospecting license (Art. 33 - 43)
■ In order to better support requirements to oil activities, a prospecting licence may be required.
■ The licence doesn’t grant any exclusivity or preference for future association with the National Concessionaire.
Chap V: oil concessions (Art. 44 - 57)
■ The National Concessionaire may ask a concession for a certain area by itself, or propose a tender call for an Associate.
218590_p081-110_chap03.indd 107218590_p081-110_chap03.indd 107 21/09/06 11:32:3121/09/06 11:32:31
© O
ECD
/IEA
, 200
6
108 - UPSTREAM OIL
■ A direct negotiation for an Associate may take place following an “empty” or inconclusive tender. Anyway, the direct negotiation must be publicised and open to interested parties.
■ For an Associate to become the operator it must have adequate technical expertise.
■ The decree of concession to the National Concessionaire specifi es: its mining rights; the area; the duration of each phase and the operator.
■ When the National Concessionaire has an associate, the decree must also authorize the association, identify the associate and the association contract terms.
■ Any change must be authorized by a decree.
■ A concession may be extinguished by agreement between the State and the National Concessionaire and Associates if they exist.
■ Rescission can occur due to non compliance with the Concession terms.
■ Renunciation by the National Concessionaire (with the agreement of Associates) can occur with one year’s notice providing all obligations have been fulfi lled to that date.
■ A lapse of the period of exploration, except for areas where a discovery occurred, or extension of the period.
■ When the concession is extinguished, all equipment, facilities, data and documentation reverts to the National Concessionaire.
Chap VI: petroleum activities (Art. 58 - 75)
■ Prospecting, exploration and evaluation must have programs approved by the government.
■ During exploration the National Concessionaire must perform prospecting activities.
■ Any discovery of oil or any other mineral, including fresh water, must be reported to the Government. In case of discovery, an evaluation must proceed and be reported.
■ In case of a commercial discovery, an evaluation must proceed and be reported.
■ The Government may authorise prospecting in a contiguous area if required if there is no damage the other stakeholders.
■ A development and exploration general plan must be submitted to the government within 3 months of the declaration of the discovery of oil, or 12 months in the case of gas; the terms of the plan shall be determined by the Government.
■ If a reservoir extends beyond the conceded area, or can only be exploited in conjunction with another in a neighbouring concession, the National Concessionaire must inform the Government, which may determine the joint development of both reservoirs. A plan must be proposed by the involved entities within 6 months, or an independent Consultant may be tasked to so.
218590_p081-110_chap03.indd 108218590_p081-110_chap03.indd 108 21/09/06 11:32:3121/09/06 11:32:31
© O
ECD
/IEA
, 200
6

UPSTREAM OIL - 109
■ Subject to advice from the National Concessionaire, pipelines, gas lines etc, required for production may cross another conceded area, without damage to it. Similarly, facilities and other means of a neighbouring concession may be used, providing due payment, if a greater effi ciency and economy may be achieved.
■ Authorisation is required for commercial production, which must be asked with 90 days notice.
■ The National Concessionaire and its associates must submit to the Ministry an annual production plan, which, as foreseen in Art. 21, must provide alternates, namely re-injection, secondary and tertiary recovery.
■ Production shall be measured each day, and measuring equipment must be certifi ed.
■ Projects for pipelines, etc, must be submitted to the Ministry.
■ Associated gas shall not be fl ared, except for a short period, when needed; exceptions may be small reservoirs; fl aring may be subject to a tax.
■ The fi nal closure of a producing well must be authorised by the Government.
■ Planning and authorisation for abandoning a well and other facilities, including environment recovery, or the continuation of the oil operations.
Chap VII: control of oil activities (Art. 76 - 77)
■ The Ministry will follow and control the activities of licensees, the National Concessionaire and Associates, which must report their activities and facilitate the inspection by Government offi cials or any private entities under Government authority.
■ The government may determine the suspension of the activity, persons or the non-utilisation of any dangerous equipment.
■ Confi dentiality must be guaranteed by the National Concessionaire, Associates and Ministry.
Chap VIII: supplementary dispositions (Art. 78 - 91)
■ The Government may determine, with 90 days notice, that a part of the production of a concession be delivered (to an entity to be defi ned) for Angolan supply requirements. That oil will be paid for in 30 days, valued as per fi scal purposes. That part shall not be higher then 40% of the fi eld production neither higher than the proportion of the fi eld production and the total Angolan production.
■ In an emergency (armed confl ict, catastrophe) the Government may take possession of all the production of the concession, as well as determine the increase of production till the technical maximum; an indemnity shall be paid within 30 days.
■ No other minerals not included in the concession may be produced; but the prospecting or production of other minerals may be authorized in the same area.
■ The Associates are free to choose the destiny of their share oil.
218590_p081-110_chap03.indd 109218590_p081-110_chap03.indd 109 21/09/06 11:32:3121/09/06 11:32:31
© O
ECD
/IEA
, 200
6
110 - UPSTREAM OIL
■ The point of property transfer for the oil produced shall be after the wellhead.
■ The operator must possess an organisation appropriate to perform its functions. The bonus paid to the National Concessionaire will revert to the State Treasury.
■ Funding search by the National Concessionaire or an Associate that may require a sharing contract of the produced oil must be previously authorised by the Government.
■ The companies operating in Angola must include Angolan citizens at every level of staff, providing they possess the required expertise; payment and other conditions shall be the same; the government shall issue a decree defi ning these obligations.
■ The Minister may issue technical norms relating to oil operations and penalties.
■ Any confl ict shall be solved by agreement or by arbitration.
■ Suspension of activities may be determined by the Government if in national interest or safety.
■ Decisions for suspension, rescission and compensation may be opposed.
Chap IX: fi nal dispositions (Art. 92 - 97)
■ There will be recognition of rights deriving from previous legislation; when confl ict with this law arises, re-negotiation may be demanded.
■ Special regimes on taxes, conversion rate and customs, applicable to oil operations, shall be issued by specifi c legislation.
■ The relevant law is the law of Angola.
■ Regulation of this law shall be issued in the next 180 days.
■ Doubts and omissions shall be solved by the Parliament.
■ Notwithstanding Art 92, Law 13/78 from 26 August is revoked.
218590_p081-110_chap03.indd 110218590_p081-110_chap03.indd 110 21/09/06 11:32:3221/09/06 11:32:32
© O
ECD
/IEA
, 200
6
DOWNSTREAM OIL - 111
IV. DOWNSTREAM OIL
OVERVIEW
The downstream oil sector in Angola covers refi ning, trade, distribution and sale of petroleum products.
Until recently, Angola’s one refi nery covered most of the country’s domestic consumption. Since the 2002 cease-fi re, both consumption and imports of key products such as gasoline, diesel and jet fuel have increased substantially. While Angola is nominally a net exporter of oil products, this is mostly due to exports of fuel oil.
Use of LPG by households for cooking is widespread in larger cities and suburban areas, but heavily subsidised. Although the country produces some LPG in its refi nery and offshore, the latter is mostly exported, while most LPG used domestically is imported. This is reportedly because the approximately two-thirds of production that originates offshore Cabinda is not compatible with the country’s LPG distribution infrastructure and appliances, designed to use the LPG mixture produced by the Luanda refi nery.
Most domestic oil product prices in Angola are subsidised. Over the past few years the government has been raising prices gradually in an effort to eventually eliminate subsidies, but has had to contend with dramatically rising world oil prices moving the “goalposts”.
Prices that are fi xed below cost and uniform throughout the country give few incentives to private companies to engage in distribution and sales of oil products, especially outside Luanda. The few exceptions benefi t from subsidised wholesale prices from Sonangol. Government plans to create a competitive distribution market within the next few years include unbundling Sonangol logistics and storage from its service stations, but has yet to fully clarify the details and regulatory framework. Effi cient distribution is also severely hindered by the poor conditions of roads and railroads.
Angola’s one refi nery, located near Luanda, is ineffi cient and its output subsidised. Sonangol plans to build a new export-oriented refi nery in Lobito to process the deep-water sour crudes that are forming an increasing share of the country’s oil output, though has yet to fi nd a strategic partner.
218590_p111-128_chap04.indd 111218590_p111-128_chap04.indd 111 21/09/06 11:33:0121/09/06 11:33:01
© O
ECD
/IEA
, 200
6

112 - DOWNSTREAM OIL
Map 4 Downstream oil infrastructure
218590_p111-128_chap04.indd 112218590_p111-128_chap04.indd 112 21/09/06 11:33:0121/09/06 11:33:01
© O
ECD
/IEA
, 200
6
DOWNSTREAM OIL - 113
MAIN ACTORS IN THE SECTOR
The main actors in Angola’s downstream oil sector are the following:
■ The Ministry of Petroleum sets policy in the sector, authorises product imports and sets the fi scal reference price for the crude oil.
■ The Ministry of Finance sets oil prices and subsidies in the sector.
■ The Luanda refi nery, majority-owned by Total, currently supplies most of the country’s needs. Built in 1958, its production is subsidised.
■ Sonangol Distribuidora is a wholly owned subsidiary of the state-owned oil company, Sonangol. It purchases oil products from the Luanda refi nery and abroad and distributes and sells them on the internal market at controlled prices through its network of service stations. It also produces and sells lubricants and exports some oil products to neighbouring countries.
■ Sonangalp is the only other distribution company operating in Angola. Jointly owned by Sonangol and Portugal’s Galp Energia, it operates 7 service stations in the Luanda region.
■ Private franchises operate many of Sonangol’s service stations in the Luanda region.
■ Private trucking companies transport an increasing portion of Sonangol’s oil products.
LEGISLATIVE AND REGULATORY BASE
The main legislation covering the downstream oil sector is Decree No. 37/00 of the Council of Ministers (6 October 2000). This replaces earlier, colonial-era legislation and creates a framework for private initiative in most downstream activities: storage, distribution, transformation and selling of petroleum products, as well as the blending of lubricants. However, the decree does not cover refi nery activities, which currently are regulated by the joint agreement between Fina (now Total) and the Angolan government. The government is considering a new decree related to refi nery activities. It should be noted that the new oil law of 2004 does not cover downstream petroleum activities.
A primary focus of Decree No. 37/00 is the licensing regime, which is determined by the Ministry of Petroleum (MoP). Operators of retail fi lling stations, storage facilities of 200 m3 or less, and oil product transport activities must be licensed by relevant
218590_p111-128_chap04.indd 113218590_p111-128_chap04.indd 113 21/09/06 11:33:0221/09/06 11:33:02
© O
ECD
/IEA
, 200
6
114 - DOWNSTREAM OIL
provincial governments, while the MoP issues licences for other actors, including large wholesale distributors (Art. 13).
The decree also defi nes a number of obligations, with a focus on those for wholesale distributors. These include a requirement to hold stocks equivalent to three months’ sales of gasoline, diesel, fuel oil, aviation fuels and kerosene (Art. 22).
Decree No. 37/00 makes the Ministry of Petroleum (MoP) responsible for regulating most aspects of the downstream oil industry, though Sonangol continues to be largely self-regulating in practice. The MoP plans to take a more active regulatory role in future. According to Decree 37/00, however, it will hold distribution companies responsible for monitoring retailers’ compliance with certain price and technical regulations (Art. 24).
Many technical regulations, e.g., regarding safety of fuel storage and transportation, harbour discharge and service stations were issued before independence. A list containing most of these is found in Article 34 of Decree 37/00. However, the Southern African Development Community (SADC) now sets technical standards for refi ned products in SADC member countries.
OVERVIEW OF PRODUCTION, TRADE AND CONSUMPTION
Until recently, Angola’s one refi nery has covered most of the country’s domestic consumption, with exports of surplus fuel oil accounting for most of the country’s trade in oil products. Consumption of most oil products appears to be supply-constrained due to lack of adequate distribution infrastructure, including deteriorated rail lines and roads, lack of supply trucks, service stations and back-up storage facilities, as well as the prevalence of land-mines, which hamper access to much of this infrastructure.
Since the 2002 cease-fi re, both consumption and imports of a number of key products have increased substantially. These include gasoline, diesel and jet-A, which together account for around 65% of the domestic market by volume. While Angola is nominally a net exporter of oil products, this is mostly due to continued large exports of fuel oil, which accounted for about 80% of exports by volume in 2003.
Although Angola is a net exporter of LPG, most of that consumed domestically is imported. This is reportedly because the approximately two thirds of production that originates offshore Cabinda is not compatible with the country’s LPG distribution infrastructure and appliances, which are designed to use the LPG mixture produced by the Luanda refi nery.
218590_p111-128_chap04.indd 114218590_p111-128_chap04.indd 114 21/09/06 11:33:0221/09/06 11:33:02
© O
ECD
/IEA
, 200
6
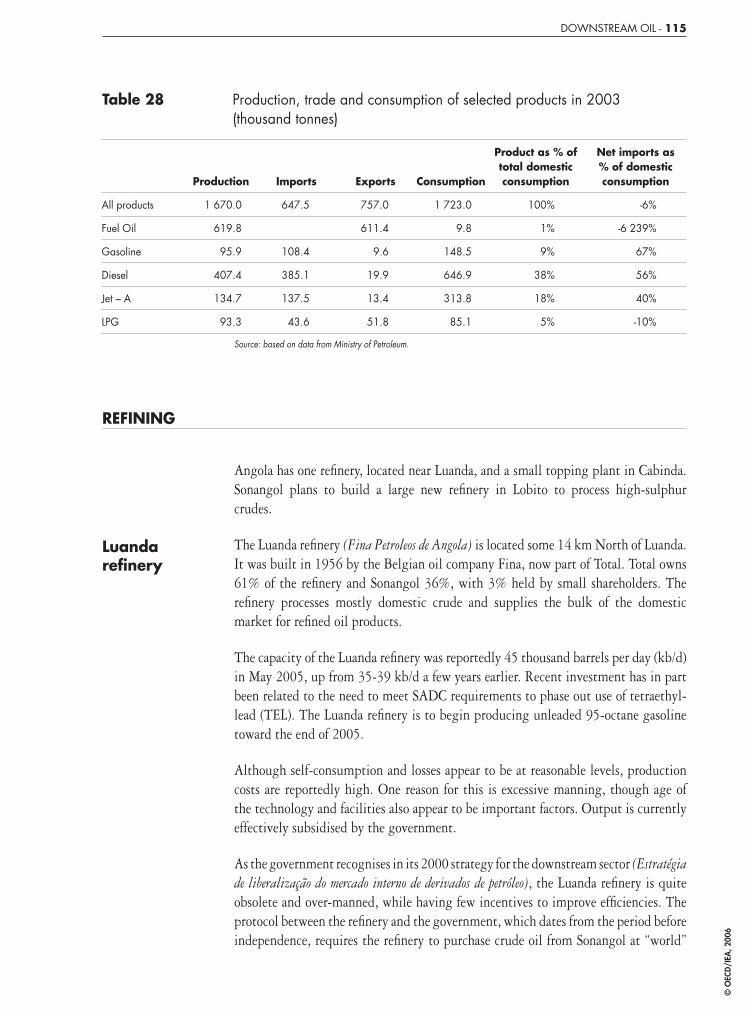
DOWNSTREAM OIL - 115
Table 28 Production, trade and consumption of selected products in 2003 (thousand tonnes)
Product as % of total domestic consumption
Net imports as % of domestic consumptionProduction Imports Exports Consumption
All products 1 670.0 647.5 757.0 1 723.0 100% -6%
Fuel Oil 619.8 611.4 9.8 1% -6 239%
Gasoline 95.9 108.4 9.6 148.5 9% 67%
Diesel 407.4 385.1 19.9 646.9 38% 56%
Jet – A 134.7 137.5 13.4 313.8 18% 40%
LPG 93.3 43.6 51.8 85.1 5% -10%
Source: based on data from Ministry of Petroleum.
REFINING
Angola has one refi nery, located near Luanda, and a small topping plant in Cabinda. Sonangol plans to build a large new refi nery in Lobito to process high-sulphur crudes.
Luanda refi nery
The Luanda refi nery (Fina Petroleos de Angola) is located some 14 km North of Luanda. It was built in 1956 by the Belgian oil company Fina, now part of Total. Total owns 61% of the refi nery and Sonangol 36%, with 3% held by small shareholders. The refi nery processes mostly domestic crude and supplies the bulk of the domestic market for refi ned oil products.
The capacity of the Luanda refi nery was reportedly 45 thousand barrels per day (kb/d) in May 2005, up from 35-39 kb/d a few years earlier. Recent investment has in part been related to the need to meet SADC requirements to phase out use of tetraethyl-lead (TEL). The Luanda refi nery is to begin producing unleaded 95-octane gasoline toward the end of 2005.
Although self-consumption and losses appear to be at reasonable levels, production costs are reportedly high. One reason for this is excessive manning, though age of the technology and facilities also appear to be important factors. Output is currently effectively subsidised by the government.
As the government recognises in its 2000 strategy for the downstream sector (Estratégia de liberalização do mercado interno de derivados de petróleo), the Luanda refi nery is quite obsolete and over-manned, while having few incentives to improve effi ciencies. The protocol between the refi nery and the government, which dates from the period before independence, requires the refi nery to purchase crude oil from Sonangol at “world”
218590_p111-128_chap04.indd 115218590_p111-128_chap04.indd 115 21/09/06 11:33:0321/09/06 11:33:03
© O
ECD
/IEA
, 200
6

116 - DOWNSTREAM OIL
Table 29 Luanda refi nery production 1999-2003 (thousand tonnes)
1999 2000 2001 2002 2003
Total crude processed 1 935.9 1 844.6 1 825.8 1 855.1 1 736.8
Total oil products 1 859.5 1 770.9 1 752.6 1 771.2 1 670.0
Of which
LPG (LPG) 30.5 29.6 31.5 34.3 30.0
Gasoline (gasolina) 128.1 111.4 107.2 104.6 95.9
Jet-B 83.6 90.5 93.7 121.6 190.1
Jet-A1 254.8 230.2 237.2 230.9 134.7
Kerosene (petróleo iluminante) 30.4 30.2 31.2 36.9 43.9
Diesel (gasóleo) 493.0 468.4 501.7 461.0 407.4
Fuel oil for export 646.8 595.3 552.8 590.7 619.8
Own consumption 67.7 63.3 62.7 64.5
Losses 8.7 10.4 10.4 15.5
Source: Ministry of Petroleum (2003 Overview of activities, p. 11).
prices and sell the resulting refi ned products back to Sonangol Distribuidora at prices that incorporate crude and transformation costs plus a 65% tax and a guaranteed net profi t of 5%. This effectively allows the refi nery to pass on its operating ineffi ciencies to Sonangol, which in turn is obligated to sell the products on the internal market at controlled prices that are signifi cantly below its costs. The government reimburses Sonangol Distribuidora for its losses from these arrangements, accounting for a large part of the approximately USD 1 000 million in direct subsidies it provided Sonangol in 2004.
In March 2004 the government initiated a policy of gradually raising retail prices, with an original target to reach to world market levels by May 2005. Even if retail prices were freed, however, the government presumably would still be obligated to subsidise the ineffi ciencies of the Luanda refi nery. Given the pressing social needs of the country, government offi cials recognize there are more constructive ways for it to use its limited budget. To rectify this situation, the government reportedly is considering ways to alter the terms of the refi nery agreement.
Improve incentives for Luanda refi nery effi ciencies: the government should be encouraged in its plans to re-negotiate the terms of the protocol regulating the prices of refi ned products that Sonangol purchases from the Luanda refi nery, introducing incentives with the aim of increasing operating effi ciencies and decreasing the need for government subsidies.
Proposed refi nery for Lobito
There may be some reluctance to make signifi cant investments in the Luanda refi nery due to Sonangol’s plans to build a new 200-kb/d refi nery on the coast near Lobito. Sonangol already has contracted several technical and marketing studies and has
218590_p111-128_chap04.indd 116218590_p111-128_chap04.indd 116 21/09/06 11:33:0321/09/06 11:33:03
© O
ECD
/IEA
, 200
6
DOWNSTREAM OIL - 117
received approval from the government to proceed with the project. Sonangol’s cost estimates for the new refi nery are around USD 3.6 billion.30
Sonangol is now trying to interest a major foreign company to join the project as a strategic fi nancial and marketing partner. The goal is for Sonangol to take a 40% stake in the venture. The government reportedly will not be a direct investor, but may guarantee the loans fi nancing the project.
The proposed refi nery is designed to process the increasingly acidic crude that the country increasingly will be producing from its deep and ultra-deep offshore blocks. Such crudes currently must be sold at a discount of about USD 5-6/barrel off the price for Brent. The goal therefore would be for the new refi nery to help capture more of the value of Angola’s rising sour crude production for the country.
Another reason Sonangol gives for building the new refi nery is that the present one no longer covers domestic demand, which is likely to grow signifi cantly in the coming years. However, it is unlikely that the domestic market would absorb anything near the new refi nery’s expected capacity for quite some time. Sonangol calls for most of the output to be exported, about half to the US East Coast and much of the rest to neighbouring African markets, especially South Africa.
While refi nery margins worldwide have been high since about mid-2003, historically they have been low relative to those of upstream investments. Moreover, it is not clear that the relatively high discount for acidic crude will continue in the long-run, given that a number of other projects reportedly are being considered to handle this type of crude, whose worldwide output is expected to increase in future, especially from Africa and China. These factors could make a large refi nery investment of this sort highly risky, especially for a company with limited experience in exporting oil products.
Sonangol is looking for a strategic partner with signifi cant marketing experience and ability to contribute fi nancially to the project. It also has hired an international investment bank to advise on the project and help raise the needed capital.
An important reason for choosing to locate the proposed new refi nery in Lobito, some 300 km down the coast from Luanda, is the government’s plan to create two new “poles” of economic development in the country. The other proposed pole, Soyo, is a similar distance from the capital to the North, where the government is encouraging oil companies to build a large LNG export facility (see Gas chapter).
Government is right not to invest own funds in new refi nery: given the pressing need for increased social investments in the country and the risk of refi nery investments, the government is probably correct in its decision not to directly invest its own money in the proposed new refi nery but to treat this as a commercial decision by Sonangol.
30. This is roughly equivalent to one year of government oil revenues, or approximately 30% of GDP.
218590_p111-128_chap04.indd 117218590_p111-128_chap04.indd 117 21/09/06 11:33:0321/09/06 11:33:03
© O
ECD
/IEA
, 200
6
118 - DOWNSTREAM OIL
Cabinda topping plant
The Cabinda Gulf Oil Company (CABGOC) runs a small topping plant (Topping Plant de Malongo). Owned by the Cabinda association of concessionnaires, it produces oil products primarily for its members’ own operations. In 2003 the Cabinda topping plant produced 1.48 million barrels, mainly diesel, though also small amounts of LPG, kerosene and jet fuel.
Lubricants Sonangol owns and operates two small blending plants for lubricants in Luanda. Supplies from these are reportedly irregular. In 2003 Sonangol produced 10 630 tonnes of lubricants, which it notes was 12% below plan.
Other lubricants sold on the Angolan market include imported products from Portugal’s Galp Energia, distributed through the Sonangalp services stations operated as a joint venture between Galp Energia and Sonangol.
TRADE IN REFINED PRODUCTS
Exports In 2003 Angola exported 757 000 tonnes of oil products, valued at about USD 152.2 million. Given refi nery ineffi ciencies, it is not clear that such sales brought signifi cant profi ts to the refi nery, but rather helped it cut losses on oversupply of fuel oil, which represents approximately 35% of the refi nery’s output and accounts for approximately 80% of Angola’s product exports by volume.
Exports include LPG, of which Angola exported 51 777 tonnes in 2003 (about USD 15.0 million in value). Most LPG exports come from processing facilities set up relatively recently offshore Cabinda by CABGOC (Chevron), Sonangol, Elf and Agip as part of efforts to reduce fl aring. They are marketed primarily to Brazil. Although LPG export volumes are similar to import volumes – and imports account for approximately half of the country’s LPG consumption – as LPG produced offshore Cabinda is not fractionated into commercial propane and butane, it cannot be sold to inland consumption.
Other product exports include naphtha (51 141 tonnes in 2003), diesel (19 918 tonnes), gasoline (9 558 tonnes) and Jet A1 (13 374 tonnes).
Angola sells most of its oil product exports to São Tome and Principe and to the Democratic Republic of Congo, with some minor exports to Cabo Verde, as well as the aforementioned LPG sales to Brazil. Sonangol is the major supplier of gasoline and diesel to the small São Tome market, and has a signifi cant stake in Cabo Verde’s main distributor.
The government points out that a signifi cant portion of the rise in gasoline and diesel demand in recent years has been due to illegal exports/re-exports of these fuels to some of Angola’s neighbours in order to take advantage of price differentials caused by Angolan subsidies. However, the government has not made available any estimates of such illegal exports.
218590_p111-128_chap04.indd 118218590_p111-128_chap04.indd 118 21/09/06 11:33:0421/09/06 11:33:04
© O
ECD
/IEA
, 200
6

DOWNSTREAM OIL - 119
Table 30 Imports of oil products in 2003 (thousand metric tonnes)
Gross Imports As % of domestic consumption
Net Imports As % of domestic consumption
LPG 43.60 51% -8.2 -10%
Gasoline 118.40 73% 98.8 67%
Jet-A1 155.90 44% 124.1 40%
Diesel 393.11 60% 365.2 56%
Source: Ministry of Petroleum data and IEA calculations.
Imports Until a few years ago, Angola met most of its domestic needs from the Luanda refi nery. Since the 2002 ceasefi re, the country has signifi cantly increased imports, which by mid-2005 accounted for well over 30% of total domestic consumption, and more for some product categories.
In 2003 Angola imported 666 458 tonnes of oil products, with a total estimated world-market value of about USD 190 million. Angolan imports in 2003 mainly came from South Africa, Namibia, Ivory Coast, the UAE, Iran, Russia and Taiwan.
Given the fi xed pricing regime, all imported products are re-sold at a loss on the internal market, with the Ministry of Finance reimbursing Sonangol for the difference. However, such losses apparently are less than those on products sourced from the country’s own refi nery.
According to Article 28 of Decree 37/00 any company seeking to import oil products, including Sonangol, must apply for permission to the Ministry of Petroleum. Although Sonangol does not have a monopoly on imports, the controlled pricing regime presumably means that it is in the interest of most other parties to purchase products from Sonangol rather than import directly.
CONSUMPTION
Domestic consumption for selected refi ned products during the period 1999-2003 is provided in Table 6-5.
Retail sales of gasoline, diesel and kerosene accounted for approximately 35% of consumption in 2003, with a further 5% from LPG sales. Sales to large consumers such as industry and the electricity producer ENE accounted for 36%. A large portion of industry sales was diesel for auto-production of electricity as a backup to erratic supplies from ENE. Aviation consumed 14% of the country’s oil product supplies, while marine bunkers accounted for 10%. Geographically, Luanda accounted for 72.7% of the country’s sales in 2003.
218590_p111-128_chap04.indd 119218590_p111-128_chap04.indd 119 21/09/06 11:33:0421/09/06 11:33:04
© O
ECD
/IEA
, 200
6
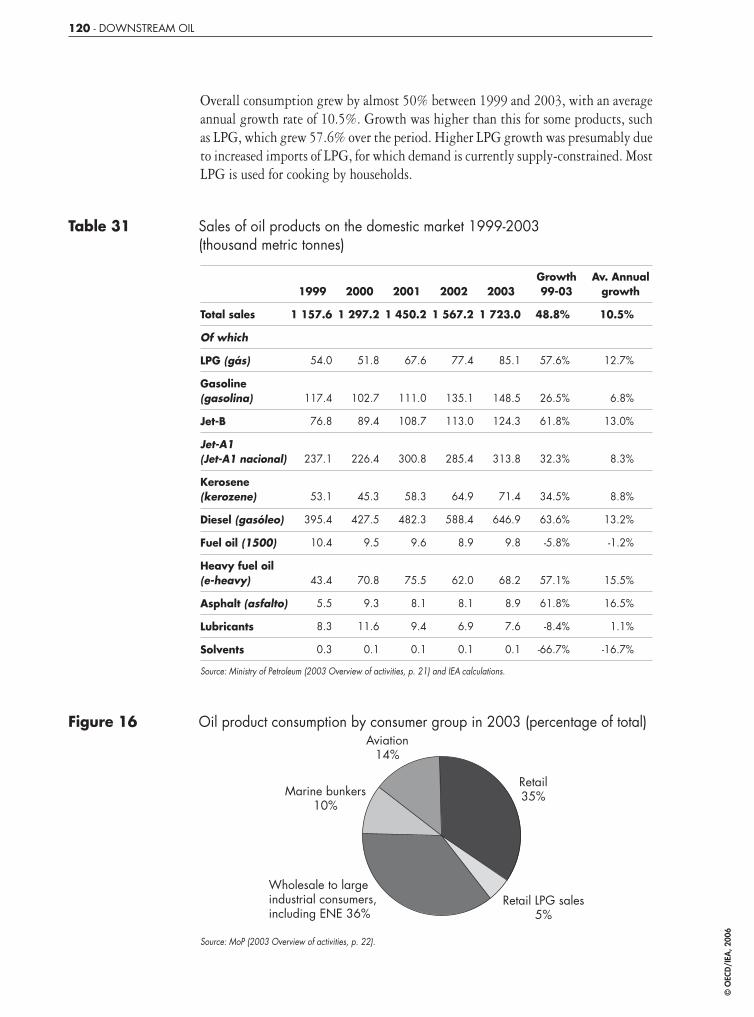
120 - DOWNSTREAM OIL
Overall consumption grew by almost 50% between 1999 and 2003, with an average annual growth rate of 10.5%. Growth was higher than this for some products, such as LPG, which grew 57.6% over the period. Higher LPG growth was presumably due to increased imports of LPG, for which demand is currently supply-constrained. Most LPG is used for cooking by households.
Table 31 Sales of oil products on the domestic market 1999-2003 (thousand metric tonnes)
1999 2000 2001 2002 2003Growth 99-03
Av. Annual growth
Total sales 1 157.6 1 297.2 1 450.2 1 567.2 1 723.0 48.8% 10.5%
Of which
LPG (gás) 54.0 51.8 67.6 77.4 85.1 57.6% 12.7%
Gasoline(gasolina) 117.4 102.7 111.0 135.1 148.5 26.5% 6.8%
Jet-B 76.8 89.4 108.7 113.0 124.3 61.8% 13.0%
Jet-A1 (Jet-A1 nacional) 237.1 226.4 300.8 285.4 313.8 32.3% 8.3%
Kerosene(kerozene) 53.1 45.3 58.3 64.9 71.4 34.5% 8.8%
Diesel (gasóleo) 395.4 427.5 482.3 588.4 646.9 63.6% 13.2%
Fuel oil (1500) 10.4 9.5 9.6 8.9 9.8 -5.8% -1.2%
Heavy fuel oil(e-heavy) 43.4 70.8 75.5 62.0 68.2 57.1% 15.5%
Asphalt (asfalto) 5.5 9.3 8.1 8.1 8.9 61.8% 16.5%
Lubricants 8.3 11.6 9.4 6.9 7.6 -8.4% 1.1%
Solvents 0.3 0.1 0.1 0.1 0.1 -66.7% -16.7%
Source: Ministry of Petroleum (2003 Overview of activities, p. 21) and IEA calculations.
Figure 16 Oil product consumption by consumer group in 2003 (percentage of total)
Wholesale to largeindustrial consumers,including ENE 36%
Marine bunkers10%
Aviation14%
Retail35%
Retail LPG sales5%
Source: MoP (2003 Overview of activities, p. 22).
218590_p111-128_chap04.indd 120218590_p111-128_chap04.indd 120 21/09/06 11:33:0421/09/06 11:33:04
© O
ECD
/IEA
, 200
6
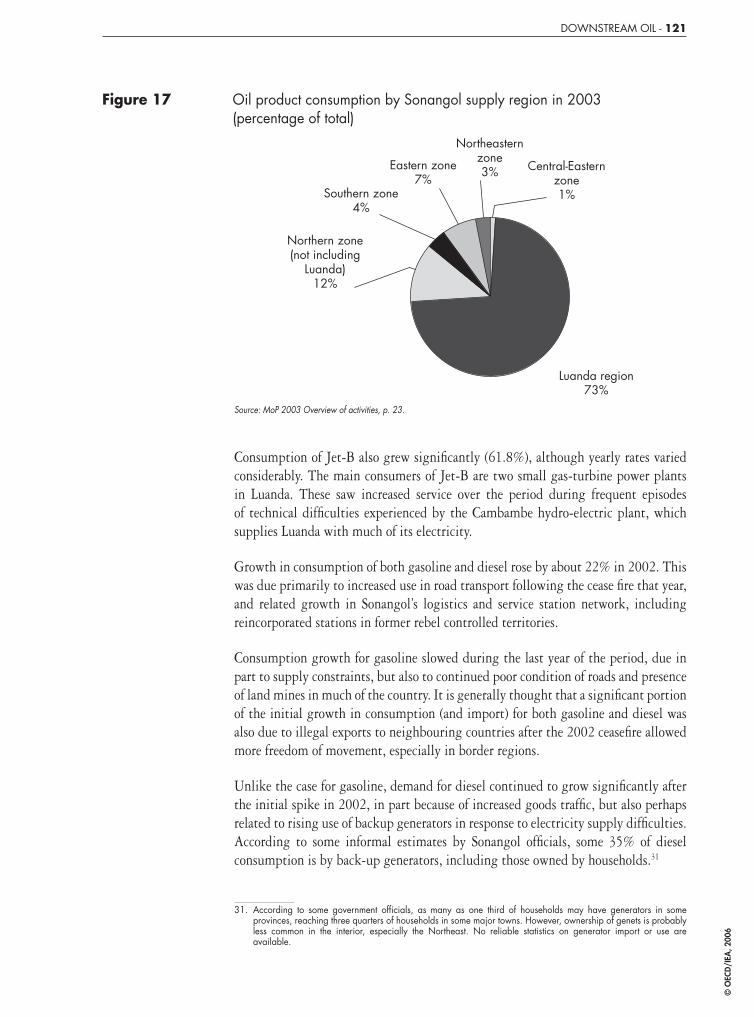
DOWNSTREAM OIL - 121
Figure 17 Oil product consumption by Sonangol supply region in 2003 (percentage of total)
Northeasternzone3%Eastern zone
7%Southern zone
4%
Northern zone(not including
Luanda)12%
Luanda region73%
Central-Easternzone1%
Source: MoP 2003 Overview of activities, p. 23.
Consumption of Jet-B also grew signifi cantly (61.8%), although yearly rates varied considerably. The main consumers of Jet-B are two small gas-turbine power plants in Luanda. These saw increased service over the period during frequent episodes of technical diffi culties experienced by the Cambambe hydro-electric plant, which supplies Luanda with much of its electricity.
Growth in consumption of both gasoline and diesel rose by about 22% in 2002. This was due primarily to increased use in road transport following the cease fi re that year, and related growth in Sonangol’s logistics and service station network, including reincorporated stations in former rebel controlled territories.
Consumption growth for gasoline slowed during the last year of the period, due in part to supply constraints, but also to continued poor condition of roads and presence of land mines in much of the country. It is generally thought that a signifi cant portion of the initial growth in consumption (and import) for both gasoline and diesel was also due to illegal exports to neighbouring countries after the 2002 ceasefi re allowed more freedom of movement, especially in border regions.
Unlike the case for gasoline, demand for diesel continued to grow signifi cantly after the initial spike in 2002, in part because of increased goods traffi c, but also perhaps related to rising use of backup generators in response to electricity supply diffi culties. According to some informal estimates by Sonangol offi cials, some 35% of diesel consumption is by back-up generators, including those owned by households.31
31. According to some government offi cials, as many as one third of households may have generators in some provinces, reaching three quarters of households in some major towns. However, ownership of genets is probably less common in the interior, especially the Northeast. No reliable statistics on generator import or use are available.
218590_p111-128_chap04.indd 121218590_p111-128_chap04.indd 121 21/09/06 11:33:0521/09/06 11:33:05
© O
ECD
/IEA
, 200
6
122 - DOWNSTREAM OIL
Offi cials in Sonangol note that they expect continued annual consumption growth in total refi ned products of about 11% over the next few years. However, the government apparently has made no comprehensive energy demand forecasts. Offi cials point out that it is diffi cult to forecast energy demand due to major uncertainties regarding economic growth. Moreover, as noted elsewhere, there is generally a lack of adequate statistics on the economic indicators that would feed into such forecasts, including reliable data on numbers of imported cars and generator sets. Although some government departments reportedly collect some of these statistics, it appears that such data are not generally shared across government and available to policy makers in the energy sector.
Major factors in oil product demand are likely to be the following, although it is diffi cult to quantify their effects with any certainty:
■ Rising imports of cars and trucks are set to increase demand for transport fuels in Luanda and other coastal regions not affected by land mines.
■ As roads are improved and regions de-mined, demand and supply (since most fuel is delivered by road) for transport fuels is set to increase in other parts of the country as well. However, this trend could be undermined if the government continues its policy of uniform product prices throughout the country, since this would provide little incentive for Sonangol (or other potential operators) to improve the supply situation to remote regions.
■ Eventual improvements in electricity connection rates and reliability should substantially reduce industrial and household demand for diesel for use in backup generators.
■ Growth in LPG is likely to continue to be strong as the supply network increases, although such growth could slow signifi cantly if the government takes away subsidies that currently allow LPG to be sold at about 20% of its cost.
PRICES AND SUBSIDIES
The Ministry of Finance sets all wholesale and retail prices and subsidies for fuels, while prices for lubricants are not controlled. The government heavily subsidised most products until March 2004, when it embarked on a plan to gradually bring retail prices in line with world prices by the end of that year. This deadline was subsequently pushed to June 2005 before being put on hold indefi nitely, in part due to record high world crude prices, which effectively continued to “move the goalposts” for the government. As of June 2005, after a series of prices rises – the latest in February 2005 – the retail price of gasoline stood at about USD 0.40 per litre, up from about USD 0.15 in early 2004. However, the government’s target price, based on the international market price at the time, was about USD 0.75 per litre.
218590_p111-128_chap04.indd 122218590_p111-128_chap04.indd 122 21/09/06 11:33:0521/09/06 11:33:05
© O
ECD
/IEA
, 200
6
DOWNSTREAM OIL - 123
In addition to general fuel subsidies, the government maintains additional subsidies targeted at specifi c sectors. However, most of these have been eliminated, with the exception of special fuel subsidies for agriculture and small fi shing enterprises.
In 2004 the Ministry of Finance paid out approximately USD 1 000 million in fuel subsidies, about USD 800 million of this directly to Sonangol to cover differences between its purchase and selling prices for oil products, as well as its transportation costs, which are not included in its fi xed uniform retail prices.
Continue product price liberalisation: the government should continue its efforts to liberalise product prices, which ideally should incorporate the cost of transportation. However, if the government feels incentives are necessary to encourage service to certain regions (e.g., remote areas), it should make any aid transparent and available to all distribution companies. In such cases, care should be taken to avoid creating incentives for smuggling, which effectively subsidises consumption in neighbouring countries.
Box 9 Selling the price increases
According to observers in the diplomatic community in Luanda, the government appears to have made a good public case for the price rises, noting the need to eliminate subsidies that could be used for more productive purposes and to eliminate smuggling to neighbouring countries. The population largely seems to have accepted the government’s arguments. However, some NGOs to whom the IEA talked suggested that the price rises were mostly related to the government’s short-term fi scal requirements. Nevertheless, these NGOs acknowledged that such price rises displayed political courage in the lead-up to new elections, currently scheduled for late 2006. It could also be expected that the elections will also give the government signifi cant incentives to spend this savings on projects to improve social welfare.
PRODUCT DISTRIBUTION
At independence in 1974 Angola had fi ve distribution companies operating some 450 service stations. By the early 1980s, state-owned Sonangol had obtained de facto monopoly status in the domestic market through nationalisation and acquisition. It cemented this position by exclusive access to subsidies to compensate for a system of uniform prices throughout the country, a system that continues to create an effective barrier to new entrants today.
The main actor in Angola’s downstream oil sector is Sonangol Distribuidora, a wholly-owned subsidiary of state-owned Sonangol. It purchases oil products from the domestic refi nery and abroad, manufactures lubricants, handles oil
218590_p111-128_chap04.indd 123218590_p111-128_chap04.indd 123 21/09/06 11:33:0521/09/06 11:33:05
© O
ECD
/IEA
, 200
6

124 - DOWNSTREAM OIL
Figure 18 Organisational chart of Sonangol Distribuidora
Board ofDirectors Offices
• Legal• Planning• QSSA• Marketing• Processes• Information-technology• Maintenance
Directoratefor
Wholesaleand Marine
Retail SalesDirectorate
SupplyDirectorate
HumanResourcesDirectorate
FinanceDirectorate
CabindaCommercial
Zone
EasternCommercial
Zone
NortheasternCommercial
Zone
Central-EasternCommercial
Zone
SouthernCommercial
Zone
LubricantsManufacturing
Directorate
TransportDirectorate
Directoratefor LPG and
gasappliances
AviationDirectorate
Source: Sonangol http://www.sonangol.co.ao/petrolifi c_p.html.
distribution and transportation, and conducts retail sales and direct sales to large industrial and state customers. It also exports small amounts of products to several neighbouring countries, including São Tome and Principe and the Democratic Republic of Congo, in which it operates small distribution branches.
Sonangol operates a network of approximately 250 fi lling stations throughout the country, serving most of Angola’s 60+ municipalities. Most stations are concentrated in the coastal provinces, and over 60 are located in the Luanda area, which accounts for over 70% of the company’s total sales.
As shown in Table 32, almost all Sonangol stations in the Luanda area are operated as concessions by private companies or by individuals, while 12 are privately owned. Most stations sell gasoline and diesel to both heavy and light vehicles, as well as motor oils and illuminating kerosene. Based on IEA team observations, a large number of stations in Luanda also sell LPG in 12-kg canisters. Most stations in Luanda are relatively modern in appearance, and over half contain a convenience store or small kiosk.
Outside Luanda, the network of Sonangol service stations is thinner, especially as distance from the coast increases, raising logistics costs. Filling stations outside the Luanda area are typically smaller and more basic than those in the capital, while many located in areas formerly held by rebel forces reportedly require signifi cant rehabilitation, including to storage facilities. Nevertheless, most fi lling stations the
218590_p111-128_chap04.indd 124218590_p111-128_chap04.indd 124 21/09/06 11:33:0521/09/06 11:33:05
© O
ECD
/IEA
, 200
6

DOWNSTREAM OIL - 125
team visited in Lubango (a city of some 600 000, about 100 km from the coast in the South) were new or newly renovated.32
Oil products are generally transported by ship from Luanda to supply depots along the coast (Cabinda, Soyo, Porto Amboim, Lobito and Namibe), from which they are transported by rail or truck to secondary distribution points inland. Both rail and road networks are generally in bad repair, slowing distribution. A shortage of trucks and adequate storage capacity, as well as lack of maintenance, also contributes to bottlenecks, causing some inland cities to go days at a time or longer without supplies.
Sonangol is increasingly engaging private trucking companies to transport fuel, although Sonangol continues to handle most of its own transport needs. During the war Sonangol distributed oil products to some cities by air, although reportedly ended this practice after the 2002 ceasefi re, after which road repairs and de-mining became possible, allowing ground access to such cities.
Angola has some 185 595 cubic meters of storage in coastal facilities for various products, though mostly for gasoline, diesel and jet fuel (2000 data). Temporary
Table 32 Profi le of Sonangol service stations in the Luanda area
Number % of total
Total number of stations 63 100%
Operated as concession 51 81%
Privately owned 12 19%
Total providing:
Gasoline 55 87%
Diesel 59 94%
Kerosene 19 30%
Service 59 94%
Manutenção 27 43%
Access for both heavy/light vehicles 52 83%
Convenience store 9 14%
Kiosk 33 52%
24-hour service 16 25%
Payment by debit card 6 10%
Source: IEA, compiled from data on Sonangol website (www.snl-distribuidora.com/postos_pt.shtml).
32. According to the local offi ce of Sonangol, Lubango is relatively well served, with 16 small service stations. This implies Lubango has a ratio of people per service station roughly half that of Luanda though double that of the capital if only Luanda’s formal population is counted. There are 12 additional stations in the rest of surrounding Huila province, which has a total population of around 3 million.
218590_p111-128_chap04.indd 125218590_p111-128_chap04.indd 125 21/09/06 11:33:0621/09/06 11:33:06
© O
ECD
/IEA
, 200
6

126 - DOWNSTREAM OIL
Table 33 Oil product storage capacity in 2000
Location Capacity (m3)
Cabinda 5 600
Soyo 3 900
Luanda 80 229
Porto Amboim 10 200
Lobito 69 400
Namibe 16 266
Total coastal 185 595
Various inland locations 26 795
Total 212 390
Source: Ministry of Petroleum.
storage aboard ship is also employed in Namibe harbour. The country has an additional 26 795 cubic meters of storage capacity at inland locations, the largest of which are located in Huambo and Malange. Total nominal product storage capacity represents roughly 11% of total domestic product sales in 2003, or a little over one month’s supply. Most interior storage is reportedly in poor shape due to the war, either from damage or from lack of maintenance due to accessibility problems.
Two major infrastructure bottlenecks in the product distribution system appear to be the lack of operating storage capacity around the country, especially inland, as well the extremely poor conditions of the roads and rail roads used to transport most products.
Promote investments in transportation and storage infrastructure: the government should continue its efforts to improve transport infrastructure (both road and rail), required both for effi cient and equitable distribution of petroleum products and for economic development more generally. It should also encourage investments to increase storage capacity.
Sonangalp The only other company operating fi lling stations in Angola is Sonangalp, a joint venture between Sonangol (51%) and Portugal’s Galp Energia (49%). Sonangalp was created in 1994 with two fi lling stations in Luanda, though only began expanding after the 2002 ceasefi re. It owned 7 fi lling stations as of May 2005 and planned to open two more later on in the year. It plans to open at least 15 more stations over the next few years.33
All Sonangalp service stations are in the Luanda area, though the company is considering expansion to several locations along the coast in cities close to Sonangol
33. According to Sonangalp, each station requires an investment of approximately USD 1 million.
218590_p111-128_chap04.indd 126218590_p111-128_chap04.indd 126 21/09/06 11:33:0621/09/06 11:33:06
© O
ECD
/IEA
, 200
6

DOWNSTREAM OIL - 127
storage facilities. It notes that inland operations are not currently possible for companies other than Sonangol because of high transportation costs and requirements to sell at fi xed prices that do not refl ect transportation costs.
The Sonangalp joint venture obtains its products wholesale from Sonangol at a discount and resells them at the same fi xed prices charged by Sonangol stations. Company profi t is thus based on a margin.
In addition to retail sales, the company sells directly to some large customers. In 2004 it sold a total of 80 000 cubic metres of oil products, mostly gasoline and diesel, accounting for about 7.5% of total Angolan sales of automobile fuels. Sonangalp service stations also sell imported Galp motor oils.
In 2005 the company will open its own logistics base for its fl eet of 20 trucks, which currently fi ll up at Sonangol facilities.
LIBERALISATION PLANS
The government plans to liberalise the downstream sector in order to encourage private investment. The Ministry of Petroleum devised a liberalisation plan in 2000 (Estratégia de liberalização do mercado interno de derivados de petróleo) to accompany decree 37/00, though implementation has been delayed and the strategy is now being revised. Nevertheless, many market participants to whom the IEA talked, including the Ministry of Petroleum, Sonangol and Sonangalp, expected market liberalisation, including price liberalisation to be completed within the next two years.
The main obstacle to liberalisation has been the fi xed price regime, which so far has kept private activity to the margins of the sector, e.g., in oil product transportation and retail sales in cases where there are opportunities for adequate margins between fi xed wholesale and retail prices.
The government plans to eventually liberalise most aspects of the downstream sector, starting gradually with transportation and retail sales, extending this to distribution, storage and refi ning. According to the 2000 Estratégia, the role of the state is to change from one of supplying oil products as a public service to one of regulating competition, looking out for consumers’ interests, and creating incentives for private investments.
The government’s most recent plans (not yet fi nalized) call for splitting Sonangol Distribuidora into two companies:
■ A 100% state-owned logistics monopoly operating storage terminals (presumably available for use by other companies on a non-discriminatory basis).
218590_p111-128_chap04.indd 127218590_p111-128_chap04.indd 127 21/09/06 11:33:0621/09/06 11:33:06
© O
ECD
/IEA
, 200
6
128 - DOWNSTREAM OIL
■ A strictly commercial distribution company competing with other companies, private and foreign.
■ A separate company covering LPG sales may also be created.
Clarify regulatory framework for oil product distribution: further clarifying the regulatory framework affecting private companies in the downstream oil sector will help reduce barriers to entry, thereby increasing competition and increasing effi ciency in distribution to the consumer.
Current plans are also to introduce obligations for companies operating in lucrative markets such as Luanda to serve designated remote regions in exchange for this privilege. While such a plan is probably workable in principle, the government would have to be careful in designing it so that such obligations do not become overly burdensome and discourage private investments in the most lucrative markets. The most economically effi cient model would be to free prices so that they incorporate the cost of transportation, leaving the market to create price incentives for companies to serve each region. The main practical problem with this is that some remote regions would only be served at very high prices, if at all, causing equity concerns. If it is thought that some sort of subsidy is necessary to serve some regions, the government may wish to consider differentiating subsidies by geographic zone or otherwise underwriting transportation costs, ideally making such subsidies available to all market participants. The 2000 liberalisation plan suggests a study on the re-introduction of the “Compensation Fund”, which existed previously to smooth price fl uctuations for energy and several other commodities.
See recommendation, Continue product price liberalisation.
The 2000 liberalisation plan foresees some measures to protect Sonangol Distribuidora during the transition, including a temporary (3-5-year) quota system for gasoline and diesel and exclusivity for aviation fuel that would limit the sales of new entrants.
Limit protection for Sonangol Distribuidora: any protection measures intended to help allow Sonangol Distribuidora to adapt to new competition conditions should not become barriers that undermine private-sector opportunities to increase the availability of petroleum products to the public on an economically sustainable basis.
218590_p111-128_chap04.indd 128218590_p111-128_chap04.indd 128 21/09/06 11:33:0721/09/06 11:33:07
© O
ECD
/IEA
, 200
6
GAS - 129
V. GAS
OVERVIEW
Almost all gas reserves and production in Angola are associated with oil. Approximately 70-80% of associated gas is fl ared. The government has declared that all new fi elds must be zero-fl are and that routine fl aring should cease at existing fi elds by 2010. Flaring reduction plans generally have focused on re-injection and a proposed project to build an onshore liquefaction plant in Soyo for LNG exports.
There is currently no gas infrastructure or use, besides LPG for cooking (see, Downstream oil). Projects to use gas domestically could be developed as spin offs to the LNG scheme, but may be limited to the area around Soyo, some 300 km away from the main potential demand centre of Luanda. Other barriers to an eventual gas industry include lack of a clear government strategy and regulatory framework for onshore gas transportation and marketing, as well as lack of ownership rights to the gas by the oil companies that produce it.
MAIN ACTORS IN THE SECTOR
Currently there is no gas industry in Angola. However, the following actors are playing, or are epected to play, important roles in its eventual formation and operation:
■ The Ministry of Petroleum leads a joint ministerial committee to examine development of the gas industry, working with the Ministry of Industry and a number of other government entities.
■ The ministries of petroleum and industry are also slated to play a role in an eventual licensing regime for gas distribution, along with local authorities.
■ Sonangol, as the sole concessionaire, owns all gas produced, though in practice allows other oil companies to use as much as necessary to maximize their oil operations.
■ Sonangol and Chevron are leading a consortium to develop an LNG export project based on associated gas that is now mainly fl ared.
■ A number of current and potential industries have been cited as possible gas customers, though none reportedly could justify a gas supply project on its own.
218590_p129-140_chap05.indd 129218590_p129-140_chap05.indd 129 21/09/06 11:33:2821/09/06 11:33:28
© O
ECD
/IEA
, 200
6
130 - GAS
In practice, such potential customers would probably depend on the proposed LNG plant as an anchor.
RESOURCE BASE, CURRENT PRODUCTION AND USE
Various estimates exist for Angola’s gas reserves. The Ministry of Petroleum puts proven plus probable reserves at 10 trillion cubic feet (tcf), with another 26 possible, while the US Energy Information Administration estimates proven reserves at 1.6 tcf with another 9.5-25 tcf possible.
Almost all gas reserves are associated with oil, although this may be due in part to the fact that all exploration activity so far has focused on oil. Only two small gas-only fi elds so far have been discovered offshore.
All gas production is associated with oil production. Since most oil is currently produced in offshore Blocks 0 (near Cabinda) and 3 and 2 (near Soyo), this is also where most gas currently is produced.
Oil production of approximately 1mb/d in 2004 yielded around 1 340 million cubic feet per day (mcf/d) of gas, or about 13.9 bcm/year. This was up from approximately 1 000 Mcf/d in 2000. Historically, each barrel of Angolan crude has been associated with roughly 1 340 cubic feet of gas as a by-product.34 However, gas-to-oil ratios vary by fi eld and over time within the same fi eld. Thus the same ratio will not necessarily apply to the new crudes starting production in Angola’s deep offshore areas. Nevertheless, using this ratio as a rough guide suggests that forecasted oil production for 2009 of about 2 million barrels per day is likely to yield an associated gas output of around 2 680 Mcf/d, or about 27.7 bcm/year.
Currently, about 10% of gas is used in the oil industry’s own operations (e.g., platform power generation) and about 20% is re-injected into reservoirs to enhance oil recovery. Approximately 70-85% is fl ared. In 2000, Angola accounted for an estimated 30% of the gas fl ared on the African continent and around 3% of the world total.
Flaring The world community increasingly has come to see gas fl aring as a problem in terms of wasted resources and contributions to greenhouse gas emissions (see box). Sonangol and the government of Angola have also recognized fl aring as a problem and have declared their intention to eliminate routine fl aring in Angola’s oil industry by 2010. This goal seems realistic, though it will present a challenge for the industry. Major investment will be needed for the infrastructure to gather and re-inject gas, and this may not always be justifi ed economically in terms of enhanced oil recovery (although the economics obviously become better when oil prices are high). Another problem
34. ESMAP, 1989. “Angola: Issues and options in the energy sector”. Washington, D.C. (p. 37).
218590_p129-140_chap05.indd 130218590_p129-140_chap05.indd 130 21/09/06 11:33:2921/09/06 11:33:29
© O
ECD
/IEA
, 200
6
GAS - 131
is the current lack of markets for the gas in Angola or the region. For this reason, the main option being considered for use of associated gas that is not re-injected is an LNG export scheme (see below).
Continue efforts to reduce fl aring: the government should be encouraged in its efforts to reduce fl aring of associated gas, including more stringent application of existing legislation.
In 2002 the World Bank Group, in collaboration with the government of Norway, launched The Global Initiative on the Reduction of Natural Gas Flaring, which aims to support national governments and the petroleum industry in their efforts to reduce fl aring and venting of natural gas associated with the extraction of crude oil. The government of Angola has expressed support for this initiative. (More information may be found at www.worldbank.org.)
Box 9 Why gas fl aring occurs
Associated or solution gas is a blend of different hydrocarbons that is released when crude oil is brought to the surface. The composition and amount of such gases varies between fi elds. Flaring is recognised as a vital safety system: in the event of emergency shutdowns, non-planned maintenance or disruptions in the processing system (e.g., pressure build-up), the gas can be diverted to the fl are and disposed of safely. Hence, there are circumstances under which some non-routine use of fl aring will always be present.
Flaring is preferred to venting, since fl aring transforms most of the methane to CO2,
which has a signifi cantly lower impact on the environment than methane does. Effi cient fl aring is generally thought to reduce methane emissions by 98% compared to venting.
A number of factors rooted in economics, history and geography account for the large volumes of gas currently being fl ared around the world. For example:
■ Many existing production facilities were constructed between the 1960s and early 1980s, subject to the technical standards and (low) environmental awareness prevailing at the time. Little was done at the time to develop an infrastructure for gathering and distributing associated gas.
■ There has generally been minimal domestic demand or other offset-opportunities for gas in typical petroleum producing provinces.
■ The volumes of associated gas produced from a single fi eld are often small and of low pressure, which increases the cost of recovery, treatment and distri bution.
218590_p129-140_chap05.indd 131218590_p129-140_chap05.indd 131 21/09/06 11:33:2921/09/06 11:33:29
© O
ECD
/IEA
, 200
6
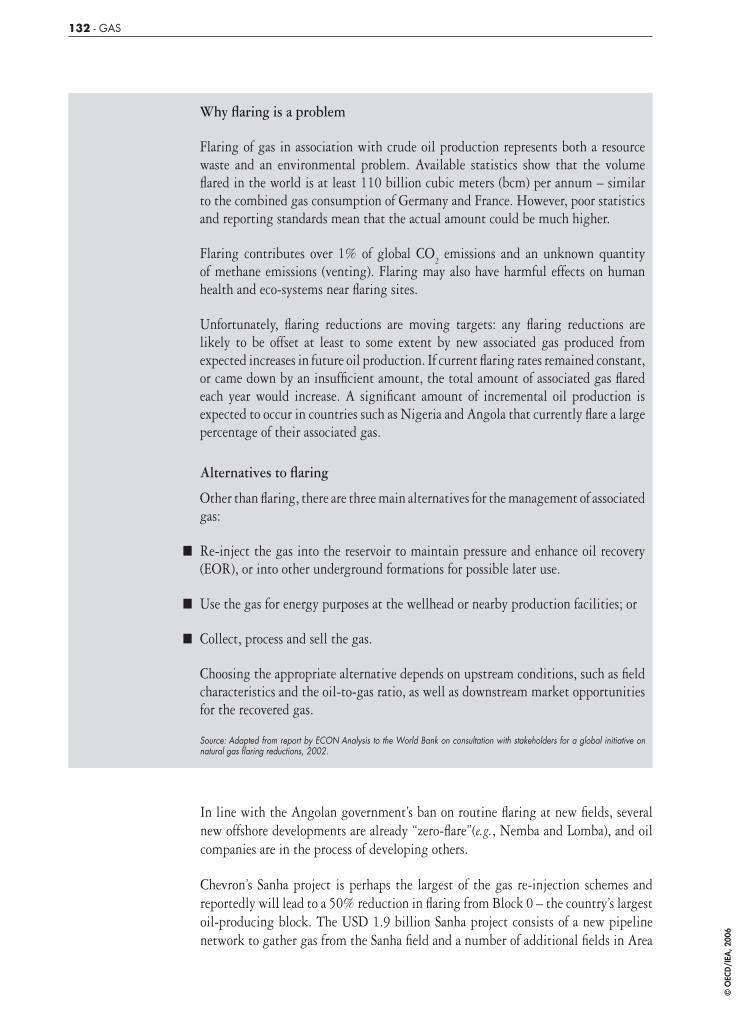
132 - GAS
Why fl aring is a problem
Flaring of gas in association with crude oil production represents both a resource waste and an environmental problem. Available statistics show that the volume fl ared in the world is at least 110 billion cubic meters (bcm) per annum – similar to the combined gas consumption of Germany and France. However, poor statistics and reporting standards mean that the actual amount could be much higher.
Flaring contributes over 1% of global CO2 emissions and an unknown quantity
of methane emissions (venting). Flaring may also have harmful effects on human health and eco-systems near fl aring sites.
Unfortunately, fl aring reductions are moving targets: any fl aring reductions are likely to be offset at least to some extent by new associated gas produced from expected increases in future oil production. If current fl aring rates remained constant, or came down by an insuffi cient amount, the total amount of associated gas fl ared each year would increase. A signifi cant amount of incremental oil production is expected to occur in countries such as Nigeria and Angola that currently fl are a large percentage of their associated gas.
Alternatives to fl aring
Other than fl aring, there are three main alternatives for the management of associated gas:
■ Re-inject the gas into the reservoir to maintain pressure and enhance oil recovery (EOR), or into other underground formations for possible later use.
■ Use the gas for energy purposes at the wellhead or nearby production facilities; or
■ Collect, process and sell the gas.
Choosing the appropriate alternative depends on upstream conditions, such as fi eld characteristics and the oil-to-gas ratio, as well as downstream market opportunities for the recovered gas.
Source: Adapted from report by ECON Analysis to the World Bank on consultation with stakeholders for a global initiative on natural gas fl aring reductions, 2002.
In line with the Angolan government’s ban on routine fl aring at new fi elds, several new offshore developments are already “zero-fl are”(e.g., Nemba and Lomba), and oil companies are in the process of developing others.
Chevron’s Sanha project is perhaps the largest of the gas re-injection schemes and reportedly will lead to a 50% reduction in fl aring from Block 0 – the country’s largest oil-producing block. The USD 1.9 billion Sanha project consists of a new pipeline network to gather gas from the Sanha fi eld and a number of additional fi elds in Area
218590_p129-140_chap05.indd 132218590_p129-140_chap05.indd 132 21/09/06 11:33:3021/09/06 11:33:30
© O
ECD
/IEA
, 200
6

GAS - 133
B of Block 0; a newly built and permanently moored FPSO35 to strip the “wet” gas of propane and butane; and a platform to process, compress and re-inject the “dry” gas into the reservoir. It will send the condensate along with the oil via pipeline to the Malango export terminal in Cabinda.
Gas stripping and the marketing of resulting products is likely to be a major feature of most re-injection schemes, helping increase the economics of such projects.
MAIN BARRIERS TO THE DEVELOPMENT OF A GAS INDUSTRY
One of the main reasons that most gas has been fl ared in Angola is that there is currently no domestic gas industry.
On the demand side, the recently concluded civil war severely curtailed industrial output, in turn limiting demand for energy. Launching a gas industry from scratch generally requires one or more large “anchor” customers to undertake to purchase enough gas to justify the signifi cant investments required to build the requisite pipeline infrastructure. Although the government has made important progress in pulling the economy from its war-induced recession, signifi cant resumption of industrial activity has yet to occur.
On the supply side, the offshore location of Angola’s main gas deposits increases transportation costs, as does the fact that this gas is mainly associated: Since gas output from most individual oil fi elds is relatively small, investors would have to build gathering infrastructure to pool them.
In addition to hampering demand, the civil war discouraged construction of required onshore infrastructure. Although the civil war ended in 2002, some investors may take a wait-and-see attitude for a few more years before gaining enough confi dence to build major onshore infrastructure such as pipelines.
Because of the various risks involved in starting a gas industry from scratch, investors will be reluctant to invest the large sums necessary unless they see that the government has a clear gas development strategy that is backed by a regulatory – as well as a favourable investment climate more generally. So far, Angola has lacked such a clear gas development strategy and regulatory framework.
Given the fact that most gas is associated, the companies producing oil are the most likely parties to develop the gas that is associated with it. However, the return on investments for gas projects is typically only one third that for oil projects. Thus, even if a gas project is profi table, it probably will be even more profi table for the international oil company to invest the same money in an oil project instead, in Angola or elsewhere.
35. Floating production, storage and offl oading (FSPO) vessel: a ship-based refi nery and product storage facility.
218590_p129-140_chap05.indd 133218590_p129-140_chap05.indd 133 21/09/06 11:33:3021/09/06 11:33:30
© O
ECD
/IEA
, 200
6

134 - GAS
Incentives are further reduced by the fact that the oil companies do not even own the gas they produce: according to the concession regime, all gas not used by the oil companies in their own operations, e.g., to enhance oil recovery, belongs to Sonangol. Although Sonangol could be expected to share revenues from any eventual sales with the producers of the gas, such splits would have to be negotiated on a case-by-case basis, adding another element of uncertainty.
Given the barriers mentioned above, development of a gas industry in Angola presumably will require signifi cant progress in most of the following areas:
■ Identifi cation of one or more “anchor” customers to justify initial investment in supply infrastructure.
■ Maintenance of the current, relatively stable security environment onshore.
■ A clear gas development strategy and regulatory framework from the government that helps diminish market and regulatory risks, as well as a favourable investment regime more generally.
■ Ways to clarify oil companies’ rights to benefi t from the gas, in order to overcome their present lack of ownership.
Clarify gas development strategy and investment framework: in order to encourage companies to develop the country’s gas reserves and projects to use such gas, the government should clarify its gas strategy and investment framework. The government’s consultation of potential users and investors as a fi rst step should be commended.
See also recommendation below, Conduct public consultations on gas strategy as a step toward development of a gas regulatory regime.
POLICY, LEGISLATIVE AND REGULATORY BASE
Production and use of gas by the oil companies is governed by the 2004 oil law (No. 10/04), which replaces the 1978 oil law (No. 13/78), as well as by the individual production sharing agreements (PSAs) and other contracts between the international oil companies and Sonangol as the sole offshore concessionaire. In general, however, gas is hardly mentioned by Angolan legislation, largely because it has not been an issue until recently.
Most if not all PSAs state that the surplus gas left after fi eld use by the oil companies is the property of Sonangol or the Angolan state. The new oil law does not change this situation.
218590_p129-140_chap05.indd 134218590_p129-140_chap05.indd 134 21/09/06 11:33:3021/09/06 11:33:30
© O
ECD
/IEA
, 200
6
GAS - 135
The main reference to gas in both the 2004 and 1978 oil laws regards fl aring: both forbid fl aring unless it is specifi cally authorized on a case-by-case basis by the Ministry of Petroleum (Art. 73 in 10/04). While the Ministry routinely gave such permission in the past, it now requires all new fi elds to be “zero-fl are”, and is insisting that most existing fi elds eventually cut back.
The regulatory regime for onshore gas production is less clear, although also appears to be governed primarily by individual contracts. In any case, little onshore gas production currently takes place, though this could conceivably change in future.
There is currently no law or body of regulation covering the development of gas infrastructure or gas marketing activities. This is largely because, so far, no one has pursued such activities in Angola. However, the lack of a clear investment and regulatory regime specifi c to gas increasingly could hinder serious consideration of potential market opportunities, in turn limiting incentives to bring the gas to shore in the fi rst place.
Currently, the most likely anchor project to bring gas to shore is the LNG export scheme pursued by Sonangol, Chevron and others (discussed in more detail below). This may create spinoff opportunities for domestic gas marketing schemes. Conceivably, the government could fi rst deal with the regulatory requirements of this large project on an ad hoc basis, and worry about the requirements of possible domestic projects later, once the landing of gas makes possibilities for such projects more concrete. However, lack of clarity about the prospects for the domestic market and the government’s plans to promote and regulate it could lead the LNG project developers – along with possible investment partners interested in domestic supply schemes – to forego opportunities to make early investments in the LNG project that would promote and hasten the development of a domestic gas industry. More clarity on the government’s intentions for the domestic gas market conceivably could even promote other schemes to bring gas to shore.
Both the Ministry of Petroleum and Sonangol reportedly have undertaken or commissioned several studies over the years on possible domestic uses for natural gas. The government also recently hired a consultant to develop a gas strategy that reportedly covers the domestic market as well as export schemes. So far, however, the government has not made these studies publicly available, although it reportedly intends to seek stakeholder comment. Public consultation with potential gas customers and developers will allow the government to gain further insight from these groups on their needs, while providing valuable information on the government’s intentions that could help potential investors better plan their strategies.
ANGOLA LNG PROJECT
The main prospective use for offshore associated gas is the Angola Liquifi ed Natural Gas export project (ALNG). Sonangol began conducting studies for ALNG in the
218590_p129-140_chap05.indd 135218590_p129-140_chap05.indd 135 21/09/06 11:33:3021/09/06 11:33:30
© O
ECD
/IEA
, 200
6
136 - GAS
late 1990s. It was later joined by Chevron and a number of other oil companies, many of which see it as a way to meet their fl aring reduction targets.
The Council of Ministers approved the project in 2001, authorizing Sonangol to continue discussions with possible partners. A Participation Agreement signed in early 2002 designated Sonangol and Chevron as project leaders. Currently, shares in the project are divided as follows: Chevron 32%, Sonangol 20%, with12% each for BP, ExxonMobil, Norsk Hydro, and Total.
The project will consist of pipelines to gather gas from associated fi elds in production blocks 2, 15, 17 and 18, as well as in non-associated gas fi elds 1 and 2 (currently undeveloped); a pipeline to land the gas at Soyo; and a new liquefaction plant, gas-stripping facilities and harbour berths near the landing site. The partners have not yet decided whether to purchase or rent LNG vessels. The overall investment requirements are expected to be about USD 3-5 billion.
The liquefaction plant will initially have one train to process 5.4 bcm per year, absorbing perhaps an additional 0.6. bcm for its own operation. (This is equivalent to about 43% of Angola’s total associated gas production in 2004.) Total proven plus probable gas reserves for offshore blocks south of the Congo River are estimated to be 8.8 tcf, which should be enough to support the fi rst train for around 40 years. The ALNG reportedly would be the fi rst LNG project in the world based primarily on associated gas.
At least in the initial phase, the partners do not envision using gas produced north of the Congo River, i.e., offshore Cabinda. Although this is currently the country’s largest source of associated gas, transporting the gas from Cabinda to Soyo would require constructing a pipeline across the Congo Trench, reportedly a technically diffi cult undertaking.
The intended market for the LNG is the United States. The main competition for this greenfi eld project is likely to be the existing Nigerian NLNG and Trinidad Atlantic LNG projects, as well as any eventual expansions to these. (LNG expansions are generally much less expensive than building completely new sites.) It is not clear to what extent the ALNG has lined up supply contracts already, although Sonangol reports that it has secured a position in a re-gasifi cation terminal to be built offshore the US state of Mississippi.
The margins for the ALNG project are thought to be low. The main motivations apparently are to reduce fl aring and reap some value from Angola’s currently wasted gas. The stripping and sale of natural gas liquids from the “wet” gas probably will be important to achieving an acceptable return. The project members are also reportedly seeking signifi cant tax breaks, including a 10-year tax holiday, which is more than the eight-year break currently allowed by law.
The project partners have already conducted pre-FEED (front-end engineering design) studies, and in 2005 began FEED studies, which are scheduled to take about 18 months. A fi nal investment decision on the project is not expected before 2007
218590_p129-140_chap05.indd 136218590_p129-140_chap05.indd 136 21/09/06 11:33:3121/09/06 11:33:31
© O
ECD
/IEA
, 200
6

GAS - 137
(delayed from an earlier deadline set for 2005), with the earliest possible completion date sometime in 2008.
The ALNG was originally to be built in Luanda, but later switched to Soyo, some 300 km up the coast. Although Soyo is reasonably convenient to relevant offshore gas fi elds, one reason for the switch was the government’s stated aim of making Soyo one of two new “poles of economic development”, along with Lobito, the government’s favoured location for a proposed new refi nery (see Downstream oil chapter). The main downside to the Soyo location is that it is far from Luanda, currently the main source of potential gas demand. Since an additional pipeline from Soyo to Luanda is likely to be prohibitively expensive for the foreseeable future, opportunities for domestic spinoff schemes may be limited for some time to Soyo and its environs. This could effectively curtail – or at least delay the creation of – a domestic gas market in Angola.
Consider options for promoting development of an internal gas market: in evaluating uses for gas brought to shore, the government should ensure that it fully considers options for promoting development of an internal gas market.
OTHER POTENTIAL DOMESTIC MARKETS FOR GAS
The World Bank and others have conducted a number of studies over the years that have – among other aims – examined possible domestic markets for Angolan gas.36 The Angolan government and Sonangol have also undertaken market studies, though generally have not made these publicly available. The discussion in this section is based on publicly available sources and interviews.
The main potential gas customers examined by most studies (in addition to an LNG export project) include the following:
■ The power sector.
■ A proposed aluminium smelter.
■ A proposed ammonia/urea plant.
■ The existing refi nery and/or a proposed new refi nery.
■ The existing Cimangola cement plant.
Each of these is briefl y discussed below.
36. For example: “Angola: Issues and Options in the Energy Sector”, ESMAP, 1989; “Africa Gas Initiative: Angola”, ESMAP, 2001; and “Private Solutions for Infrastructure in Angola”, World Bank and the Public-Private Infrastructure Advisory Facility, 2005.
218590_p129-140_chap05.indd 137218590_p129-140_chap05.indd 137 21/09/06 11:33:3121/09/06 11:33:31
© O
ECD
/IEA
, 200
6
138 - GAS
Other potential gas customers that have been examined over the years include: a scrap metal plant, a glass manufacturing plant, an auto/truck assembly plant, a bottling plant, the water supply sector, and a greenfi eld petrochemical industry.
Power sector Angola has several small gas turbines used for power generation, although only two are operational, both located in Luanda (2 x 56.8 MW). All units have always been run on other fuels, since gas has never been available in the country. For example, the two turbines in Luanda run on jet fuel (Jet-B). If these two units were converted to gas, they could be expected to consume around 0.25 bcm/year. However, if the gas must be piped 300 km from Soyo, the relative price of gas is likely to be much higher than the continued use of Jet-B.
Another likely barrier to gas-fi red power is the current large over-capacity in the Northern grid. Even if the Northern grid were interconnected with the Central and Southern grids, now supply constrained (though in part due to damaged transmission lines), it would still be some time before new capacity would be needed in the country as a whole. However, this constraint may not immediately be relevant to the Soyo area, since it is located far from the major grids. Potentially, a gas-fi red power station in Soyo could supply a local isolated network, although it would also have to compete with possibly cheaper supply options from the nearby Democratic Republic of Congo.
Aluminium smelter
A study is reportedly ongoing regarding the use of gas to power a CCGT for a proposed greenfi eld aluminium smelter at Soyo. Since the economics of aluminium production generally depend on very inexpensive power, the fact that such a plant is being considered at all could be an indication that the price of gas landed at Soyo is not expected to be high by international standards.
Ammonia/urea plant
The government has been examining possibilities for constructing a plant to produce ammonia-based chemical fertilizers since the early 1980s. The minimum ammonia output of such a plant reportedly would need to be around 1 500 tonnes/day in order to reap required economies of scale. This implies a gas consumption of around 0.4 bcm/year. Given Angola’s current low demand for fertilizers, most output would have to be sold abroad. Unfortunately for such a project, the international fertilizer market is highly competitive and subject to wide price variations. Such a plant would thus require a very low gas price to be economic.
Refi nery The existing refi nery in Luanda potentially could use an estimated 0.04 bcm of gas per year. However, gas would have to compete in price against the surplus fuel oil that the refi nery currently consumes. Powering the proposed new Lobito refi nery with gas appears to be even less of an option, since Lobito is far from existing gas production – and twice as far from Soyo as Luanda – implying large transportation costs under any supply scenario.
Cement plant The existing Cimangola cement plant, recently expanded, could consume perhaps as much as 0.2 bcm per year. Since there is no technical advantage to using gas in cement manufacturing, gas would need to compete with other fuels on price. And like the refi nery, the cement plant currently uses relatively cheap surplus fuel oil.
218590_p129-140_chap05.indd 138218590_p129-140_chap05.indd 138 21/09/06 11:33:3121/09/06 11:33:31
© O
ECD
/IEA
, 200
6

GAS - 139
Conclusion on additional markets
According to the World Bank and PPIAF (2005), total potential gas demand from industry is not expected to exceed 0.5 bcm/year for the foreseeable future, i.e., equivalent to less than 10% of current planned production by the LNG project. This indicates that infrastructure and gas supply plans for the LNG scheme probably could be made to accommodate most potential domestic users without enormous adjustments. However, if the LNG scheme goes ahead and is located in Soyo, as currently planned, Angola’s gas industry may be limited to the Soyo area for the foreseeable future. On the other hand, locating the LNG plant in Luanda presumably would imply greater investments in pipeline infrastructure, raising the cost of the gas. The main problem with this option is that it would not make much economic sense if the bulk of the gas were intended for export.
218590_p129-140_chap05.indd 139218590_p129-140_chap05.indd 139 21/09/06 11:33:3121/09/06 11:33:31
© O
ECD
/IEA
, 200
6

218590_p129-140_chap05.indd 140218590_p129-140_chap05.indd 140 21/09/06 11:33:3221/09/06 11:33:32
© O
ECD
/IEA
, 200
6

BIOMASS - 141
VI. BIOMASS
OVERVIEW
Some 80% of Angolans rely on biomass for most of their energy needs. Wood fuel is mostly used in rural regions, while charcoal is preferred in peri-urban areas, due to its higher heating value and lower transport weight.
Angola’s biomass resources are substantial. Due in part to the long-running civil war, these resources has been left relatively undisturbed in many parts of the country. The major infl ux of people to peri-urban areas at the end of the civil war, however, has put tremendous pressure on Angola’s biomass resources. Severe local deforestation has occurred around most large cities, e.g., extending for a radius of 200-300 km from Luanda. Such deforested zones are growing yearly, in turn affecting transport costs, which make up a large part of charcoal prices. Most of the unsustainable use of biomass appears to come from cutting trees to make charcoal to supply peri-urban areas
Another strain on Angola’s biomass resources is the large number of internally displaced persons. In addition to the lack of access to health services, clean water and agricultural inputs, these people have limited access to modern fuels and rely almost exclusively on traditional biomass resources for cooking and heating.
The combustion of woodfuels using ineffi cient technologies and appliances is deleterious to health and results in wastage of wood resources. The continuous depletion of Angola’s biomass resources can lead in the long term to negative impacts on the environment such as extensive deforestation, declining soil fertility and diminished and polluted water resources.
Peri-urban areas in particular, will come under increasing pressure to meet demands for biomass energy. Biomass scarcity will worsen living conditions in poor neighbourhoods, by forcing residents to spend a higher proportion of their income on cooking fuel. Rising demand for commercially-traded fuelwood in cities will put pressure on supplies in nearby rural areas. As rural supplies become monetised, traditional “free” sources will diminish.
Important demand-side issues for the government to address in order to ensure sustainability of biomass use include the effi ciency of the charcoal production process (e.g., more effi cient kilns), the effi ciency and safety of end-use (e.g., more effi cient stoves) and the lack of energy alternatives. On the supply-side, the government can enhance the sustainability of Angola’s biomass resources through increasing the area of the country with plantations and through monitoring and control of charcoal
218590_p141-154_chap06.indd 141218590_p141-154_chap06.indd 141 21/09/06 11:34:0021/09/06 11:34:00
© O
ECD
/IEA
, 200
6
142 - BIOMASS
production. The government can also promote the use of agricultural and forestry residues for energy production. Much of Angola’s small-scale industry was destroyed in the war, but the potential for using these residues for heat and power generation is considered to be very large.
Given that biomass use is primarily a function of poverty and lack of alternatives, biomass policy ideally should be set in a coordinated way that deals with the full supply chain. While the Institute of Forestry Development monitors forestry resources and issues licenses for charcoal production and sale, no government department covers the policy issues that infl uence the demand for this biomass. Moreover, the forestry institute’s resources appear to be inadequate to its limited tasks, as the bulk of woodfuel production and trade reportedly is unlicensed.
BIOMASS RESOURCES IN ANGOLA
Natural forest is the most signifi cant biomass resource in the country, comprising an estimated 59 million hectares. Closed canopy forests dominate in the North West and in high altitude areas. Tree species include rosewood, ebony, and African sandalwood, as well as mahogany, tola and mulberry. There has not been a forestry inventory, either at the national or regional level, since the 1970s.
The Angolan government reports that plantations occupied 131 000 hectares in 2005. The Institute of Forestry Development within the Ministry of Agriculture and Rural Development is working in cooperation with the United Nations Food and Agricultural Organization (FAO) to increase the number of plantations.37 The FAO estimates that 40% to 50% of existing plantations have been critically degraded by illegal cutting and inadequate management. The amount of residue available from forestry industry operations (e.g., logging, saw mills) is unknown.38
In some areas, the resource base is in relatively good condition, not least since the abandonment of large parts of the country during the civil war allowed substantial recovery. However, in many areas, especially surrounding urban centres, woodfuel resources are under severe pressure, a fact refl ected in increasing prices for charcoal. The area of cleared land around Luanda, for example, extends for a radius of 200-300 km and is increasing yearly. The perimeters of most provincial capitals similarly have been stripped of biomass resources.
In the agricultural sector, Angola produced some 300 000 tonnes of sugar cane in 2002, and the potential for combined heat and power generation from sugarcane
37. The number of trees added per year is expected to reach 150 000 to 200 000, mostly of eucalyptus, cypress and pine. (FAO project TCP/ANG/2902).
38. The forest industry in Angola largely collapsed during the civil war. Most sawmills currently in operation run on obsolete equipment and far below capacity.
218590_p141-154_chap06.indd 142218590_p141-154_chap06.indd 142 21/09/06 11:34:0121/09/06 11:34:01
© O
ECD
/IEA
, 200
6

BIOMASS - 143
residue (bagasse) is estimated to be equivalent to between 20 and 31 GWh.39 However, this is not currently used as an important energy source.
HOW BIOMASS IS USED
Woodfuels will continue to dominate household energy demand in Angola in the foreseeable future. Thus, the development of more effi cient bioenergy technologies is vital for alleviating poverty, creating employment and expanding rural markets. Modern bioenergy technologies compete with conventional technologies in many applications, and there are attractive opportunities to use biomass energy in a more modern, effi cient and environmentally friendly way.40
In addition to use by rural and peri-urban households, rural industry relies heavily on fuelwood for fi sh-smoking, brick-making, tobacco curing, food processing, furniture-making, ceramics manufacturing and baking. These industries employ tens of thousands of people, and the income they produce frees many rural households from poverty. However, enormous potential exists to improve the effi ciency of industrial ovens, dryers and bakeries that run on charcoal and other biomass.
Angola could build on experience in other African countries in using forestry residues for energy production. The privately-owned Tanganyika Wattle Company (TANWAT) has the largest forest plantations in Tanzania, about 15 000 hectares. TANWAT operates a 2 500 kWh biomass fi red power station at its factory site near Njombe town in the Southern Highlands. The station was commissioned in 1995 and generates 13 147 GWh of electricity per year, from 41 687 tons of biomass. TANWAT power station provides suffi cient power to meet various needs of the company, i.e. the wattle factory, sawmill and timber treatment plant, including associated offi ces and housing. In addition, the surplus power produced is made available to a neighbouring tea estate and the rest sold to TANESCO, the electricity supply company. Currently, the maximum power demand supply from TANWAT to TANESCO varies between 1 400 and 2 100 kVA. In 2002, the station supplied 4 349 GWh of electricity to TANESCO.41
The remainder of this section focuses on the use of biomass for energy by households, with a focus on fuelwood and charcoal. As in many sub-Saharan African countries, fuelwood and charcoal account for nearly all energy consumption in rural areas and
39. The sugar industry was adversely affected by the civil war but there is some interest in reviving the sector. For example, South Africa is evaluating the potential for rehabilitating or rebuilding a derelict sugar factory and estate in the Benguela Province. The study also involves working with the Angolan government using this project as a pilot for re-establishing the Angolan sugar industry.
40. See Advancing Bioenergy for Sustainable Development: Guideline for Policymakers and Investors, Volumes I, II and III, Energy Sector Management Assistance Programme, World Bank, 2005.
41. Traditional Biomass Energy – Improving its Use and Moving to Modern Energy Use, Stephen Karekezi, Kusum Lata and Suani Coelho, Thematic Background Paper for the International Conference for Renewable Energies, Bonn, January 2004.
218590_p141-154_chap06.indd 143218590_p141-154_chap06.indd 143 21/09/06 11:34:0121/09/06 11:34:01
© O
ECD
/IEA
, 200
6
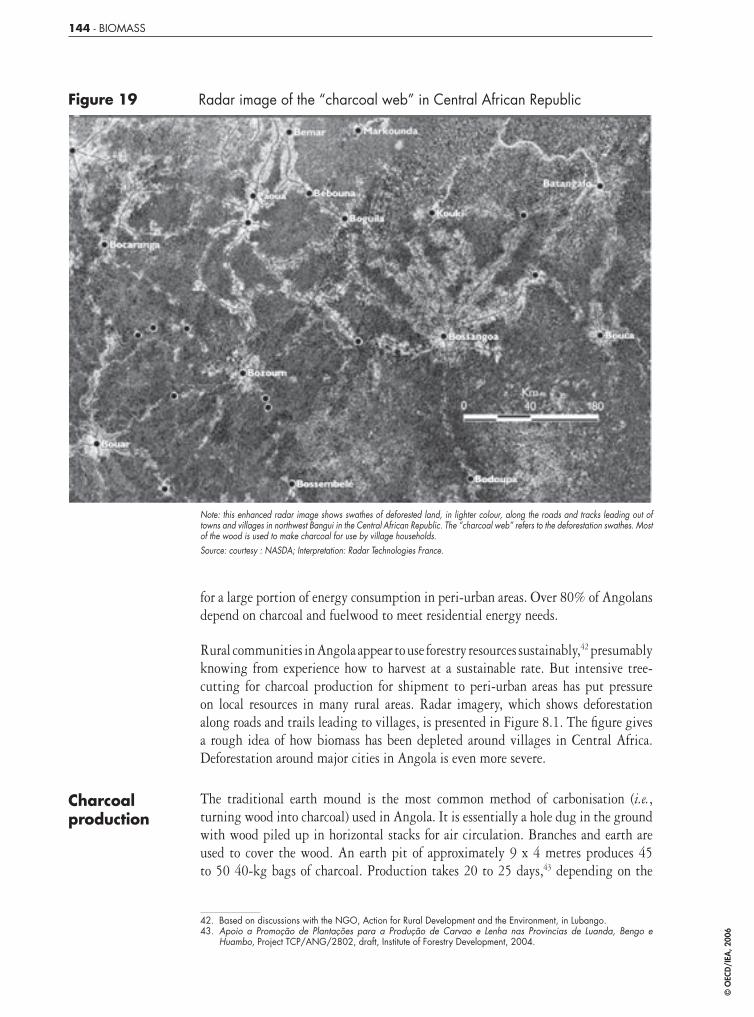
144 - BIOMASS
Figure 19 Radar image of the “charcoal web” in Central African Republic
Note: this enhanced radar image shows swathes of deforested land, in lighter colour, along the roads and tracks leading out of towns and villages in northwest Bangui in the Central African Republic. The “charcoal web” refers to the deforestation swathes. Most of the wood is used to make charcoal for use by village households. Source: courtesy : NASDA; Interpretation: Radar Technologies France.
for a large portion of energy consumption in peri-urban areas. Over 80% of Angolans depend on charcoal and fuelwood to meet residential energy needs.
Rural communities in Angola appear to use forestry resources sustainably,42 presumably knowing from experience how to harvest at a sustainable rate. But intensive tree-cutting for charcoal production for shipment to peri-urban areas has put pressure on local resources in many rural areas. Radar imagery, which shows deforestation along roads and trails leading to villages, is presented in Figure 8.1. The fi gure gives a rough idea of how biomass has been depleted around villages in Central Africa. Deforestation around major cities in Angola is even more severe.
Charcoal production
The traditional earth mound is the most common method of carbonisation (i.e., turning wood into charcoal) used in Angola. It is essentially a hole dug in the ground with wood piled up in horizontal stacks for air circulation. Branches and earth are used to cover the wood. An earth pit of approximately 9 x 4 metres produces 45 to 50 40-kg bags of charcoal. Production takes 20 to 25 days,43 depending on the
42. Based on discussions with the NGO, Action for Rural Development and the Environment, in Lubango.43. Apoio a Promoção de Plantações para a Produção de Carvao e Lenha nas Provincias de Luanda, Bengo e
Huambo, Project TCP/ANG/2802, draft, Institute of Forestry Development, 2004.
218590_p141-154_chap06.indd 144218590_p141-154_chap06.indd 144 21/09/06 11:34:0121/09/06 11:34:01
© O
ECD
/IEA
, 200
6

BIOMASS - 145
moisture content of the wood.44 Annual charcoal production per pit is some 2 tonnes. The government estimates that, in order to produce this quantity of charcoal, some 10-15 wood sticks with a diameter of 25-30 cm are required.45
The effi ciency of charcoal kilns in Angola is estimated to be one-third the effi ciency of kilns in Latin America. Argentine and Brazilian kilns, for example, are built of soft-burned, locally made clay/sand bricks and mud mortar. They are robust and not easily damaged. They cannot be easily harmed by overheating. They can stand unprotected in the sun and rain without corrosion or ill effects and have a useful life of from fi ve to eight years. There is much potential for improving the effi ciency of the carbonisation process in Angola.
Earthen pits and mounds are much less effi cient than brick kilns. Properly constructed and operated brick kilns are one of the most effective methods of charcoal production. They have low capital costs, moderate labour requirements and are capable of giving good yields of quality charcoal suitable for all industrial and domestic uses.
The commercial price of charcoal is a function of production costs (mainly the physical effort of cutting trees and preparing kilns) transportation costs, licensing fees and a profi t margin. While licenses are technically required for charcoal production, in practice most production and trade is unmonitored. The largest constraint for distribution appears to be the state of the roads, especially in the rainy season.
Box 10 Statistics for estimating fuelwood and charcoal consumption in Angola
Population: 14 million.
Estimated population using biomass for heating and cooking (80%): 11.2 million.
Estimated population using charcoal (urban/peri-urban/rural areas): 5 million.
Estimated population using fuelwood (direct combustion): 6.2 million.
Average per capita/per year fuelwood consumption: 0.14 m3.
Average per capita/per year fuelwood consumption (using fuelwood exclusively): 0.32 m3.
Average per capita/per year charcoal consumption: 100 kg.Source: population is from the UN Population Division. Population using biomass is based on IEA estimates. Per capita fuelwood consumption fi gures are from UN FAO; per capita charcoal consumption fi gures are from the Institute of Forestry Development in Angola.
44. Wood consists of three main components: cellulose, lignin and water. The water is adsorbed or held as molecules of water on the cellulose/lignin structure. Air dry wood still contains 12% to 18% of adsorbed water. The water in the wood has to be driven off as vapour before carbonisation can take place. Evaporating water is very energy-intensive so that using the sun to pre-dry the wood before carbonisation greatly improves effi ciency. The water remaining in the wood must be evaporated in the pit by burning some of the wood itself, which otherwise would be converted into useful charcoal.
45. According to the United Nations Food and Agricultural Organisation (FAO), the optimal diameter for wood sticks used in the carbonisation process is about 20 cm. The thickness of wood used in Angola therefore may exacerbate the already ineffi cient carbonisation process as typically practiced in Angola.
218590_p141-154_chap06.indd 145218590_p141-154_chap06.indd 145 21/09/06 11:34:0321/09/06 11:34:03
© O
ECD
/IEA
, 200
6
146 - BIOMASS
Demand for biomass
The UN FAO estimates that fuelwood consumption in Angola is 5 000 000 m3 per year. Most of the wood consumed is not necessarily derived from forests. Fuelwood often includes dead wood, branches, trees outside forests and by-products from land-clearing operations. Gathering data about the consumption of these resources at the village level is very diffi cult.
The UN FAO reports that charcoal consumption is some 7 200 000 m3 per year (or some 750 000 tonnes per year). Charcoal demand in a community is also very site and condition specifi c, but assumptions about fuelwood to charcoal conversion effi ciency and local per capita consumption make estimates a little more straightforward.
The Luanda region, for example, is the main consumer of charcoal. The Angolan government reports that per capita consumption of charcoal in this region is 100 kg per year. Two-thirds of the population in Luanda live in peri-urban areas (2.6 million people).46 The accepted fuelwood to charcoal conversion ratio for Angola is that it takes 9.6 m3 of fuelwood to produce 1 000 kg of charcoal (or 7 tonnes of wood to produce 1 tonne of charcoal). Charcoal for the Luanda region is produced from clearing forests in surrounding areas with a yield of about 20 m3 per hectare.47 With an average kiln size of 9 × 4 metres, the IEA estimates that about 130 000 pits per year are required to meet the yearly charcoal demand in Luanda. The amount of wood needed each year to produce this much charcoal would require the use of roughly 130 000 hectares of forest.
With adequate supervision and support, however, charcoal production could be sustainable even in densely populated areas. This would require adequately managed government planting programs, community woodlots and plantations.
Biomass cookstoves in Angola
Wood and charcoal-burning stoves in Angola are inexpensive, but generally not very effi cient. As in many other developing countries, the use of improved cookstove reduces fuelwood consumption while improving health and reducing the time spent gathering fuelwood.
A programme to manufacture improved cookstoves in Luanda in the 1980s and early 1990s was halted when facilities were destroyed by the war in 1993. In 2003, the Institute of Forestry Development in Angola participated in a regional United Nations FAO programme to review and improve charcoal production and charcoal stoves. New types of stoves were distributed to test performance and acceptability. While some models were found to be acceptable, they were generally found to be too small for the size of the typical Angolan family. The project organisers are now hoping to make larger stoves of the same design and commercialise them, but they lack funds to do so.
46. Over 300 000 households, with an average household size of 7 or more.47. The Angolan government reports an average stocking ratio of 38.6 m3 per hectare for the 59 million hectares of
national forest.
218590_p141-154_chap06.indd 146218590_p141-154_chap06.indd 146 21/09/06 11:34:0321/09/06 11:34:03
© O
ECD
/IEA
, 200
6
BIOMASS - 147
There are currently no national policies looking at improved stove programmes in Angola.48 Such an initiative could build on the vast experience from cookstove programmes in other countries. Three of the largest improved stove dissemination programmes have taken place in China, Kenya and India. Successful programmes in these countries tended to be characterised by the following:
■ They targeted regions with adequate interest, i.e. with fuelwood shortages or high charcoal prices, so that signifi cant government subsidies were not necessary.
■ Key stove components were produced centrally.
■ Women's groups were used for stove dissemination in rural areas.
■ Performance was evaluated through independent testing and monitoring, and designs were tailored to meet local conditions.
■ Small enterprises were utilised to produce and market stoves in areas where users could afford to pay.
Factors that were found to limit the success of improved cookstove programmes include:
■ Absence of adequate training and support services.
■ Lack of market research to determine concerns of the women who would be using the stoves.
■ Lack of research into different cooking habits.
Biomass, health and gender
The ineffi cient use of woodfuels and the inadequate design of cooking equipment in Angola can lead to serious health damage from indoor air pollution. Smoke from ineffi cient cookstoves contains thousands of health-damaging substances. Possible effects include respiratory diseases, such as asthma and acute respiratory infections; obstetrical problems, such as stillbirth and low birth-weight; blindness; and heart disease.
Poor people are constantly exposed to indoor particulate and carbon-monoxide concentrations many times higher than World Health Organisation standards. Traditional stoves using charcoal emit large amounts of CO and other noxious gases. Women and children suffer most, because they are generally exposed for the longest periods of time. Indoor air pollution leads to the premature death of an estimated 1.6 million people in the developing world, more than half of these deaths occur among children under fi ve years. A shift from cooking with charcoal to kerosene has
48. The NGO, Development Workshop, has studied the cooking habits of Angolan households with the aim of improving the effi ciency of cookstoves. Another resource for improved cookstoves is the Programme for Biomass Energy Conservation (ProBEC), currently active in eight SADC countries: Lesotho, Malawi, Mazambique, Namibia, South Africa, Tanzania, Zambia and Zimbabwe. ProBEC aims to enhance sustainable biomass energy management by promoting the adoption of improved cookstoves in its member countries.
218590_p141-154_chap06.indd 147218590_p141-154_chap06.indd 147 21/09/06 11:34:0421/09/06 11:34:04
© O
ECD
/IEA
, 200
6
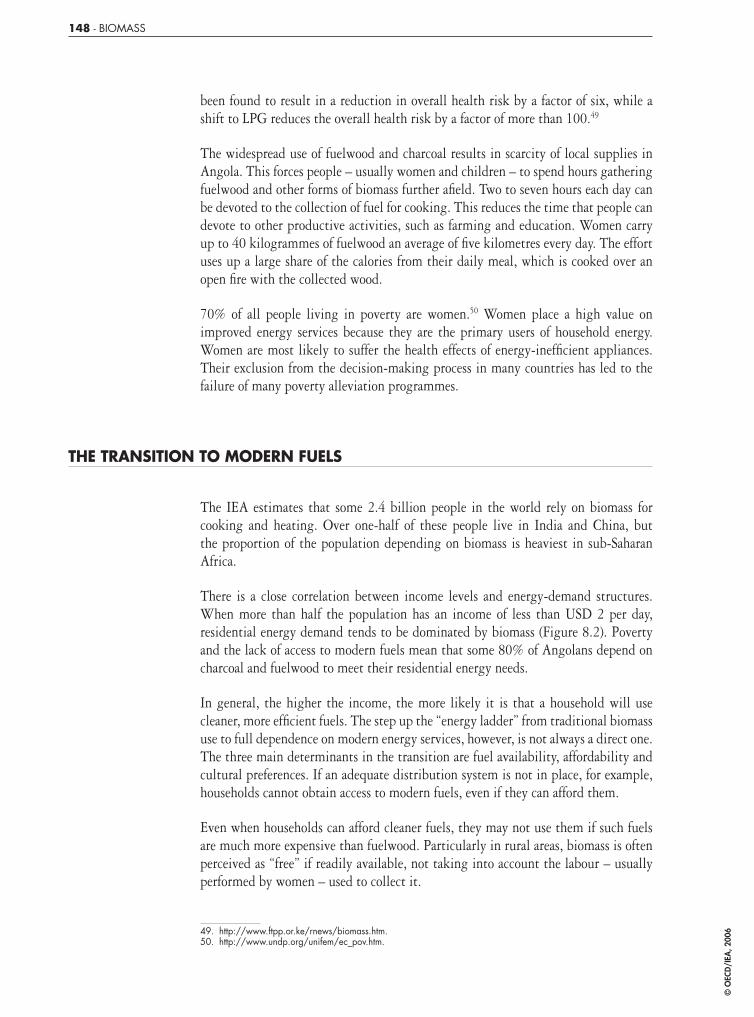
148 - BIOMASS
been found to result in a reduction in overall health risk by a factor of six, while a shift to LPG reduces the overall health risk by a factor of more than 100.49
The widespread use of fuelwood and charcoal results in scarcity of local supplies in Angola. This forces people – usually women and children – to spend hours gathering fuelwood and other forms of biomass further afi eld. Two to seven hours each day can be devoted to the collection of fuel for cooking. This reduces the time that people can devote to other productive activities, such as farming and education. Women carry up to 40 kilogrammes of fuelwood an average of fi ve kilometres every day. The effort uses up a large share of the calories from their daily meal, which is cooked over an open fi re with the collected wood.
70% of all people living in poverty are women.50 Women place a high value on improved energy services because they are the primary users of household energy. Women are most likely to suffer the health effects of energy-ineffi cient appliances. Their exclusion from the decision-making process in many countries has led to the failure of many poverty alleviation programmes.
THE TRANSITION TO MODERN FUELS
The IEA estimates that some 2.4 billion people in the world rely on biomass for cooking and heating. Over one-half of these people live in India and China, but the proportion of the population depending on biomass is heaviest in sub-Saharan Africa.
There is a close correlation between income levels and energy-demand structures. When more than half the population has an income of less than USD 2 per day, residential energy demand tends to be dominated by biomass (Figure 8.2). Poverty and the lack of access to modern fuels mean that some 80% of Angolans depend on charcoal and fuelwood to meet their residential energy needs.
In general, the higher the income, the more likely it is that a household will use cleaner, more effi cient fuels. The step up the “energy ladder” from traditional biomass use to full dependence on modern energy services, however, is not always a direct one. The three main determinants in the transition are fuel availability, affordability and cultural preferences. If an adequate distribution system is not in place, for example, households cannot obtain access to modern fuels, even if they can afford them.
Even when households can afford cleaner fuels, they may not use them if such fuels are much more expensive than fuelwood. Particularly in rural areas, biomass is often perceived as “free” if readily available, not taking into account the labour – usually performed by women – used to collect it.
49. http://www.ftpp.or.ke/rnews/biomass.htm.50. http://www.undp.org/unifem/ec_pov.htm.
218590_p141-154_chap06.indd 148218590_p141-154_chap06.indd 148 21/09/06 11:34:0421/09/06 11:34:04
© O
ECD
/IEA
, 200
6

BIOMASS - 149
Figure 20 The link between poverty and share of traditional biomass in residential energy consumption
Bolivia
El Salvador
Brazil
Poland
% of population below 2 USD a day
Algeria
Colombia
Thailand
SenegalGuatemalaNepal
India
The affordability of energy-using equipment is as important as the affordability of fuels. In Angola, the initial cost of acquiring kerosene and LPG stoves may discourage some people from switching (see discussion of household energy use in Chapter 9). However, in urban areas where cooking fuels usually have to be purchased, the savings generated by switching to a less expensive cooking fuel could amortize the up-front cost of improved kerosene or LPG cookstove, provided consumers have access to some form of microcredit.
In some cases, traditions determine the fuel choice regardless of availability and income. For example, even some well-off households continue to use charcoal for some types of cooking, e.g., grilling fi sh.
Figure 21 represents the typical fuel transition in poor households as income rises. In practice, the transition is typically much more dynamic, however, as nearly all households opt for a combination of fuels. Very poor households typically can hope to satisfy only their most basic needs: heating, cooking and lighting, with fuel choices restricted mainly to different forms of biomass. As income increases, fuel choices widen. The incremental energy needs of the highest-income households, whose use of biomass is minimal, tend to be met by electricity. The share of basic needs in total consumption falls off sharply as families grow more prosperous.
Use of diesel generators among middle and low-income households is thought to be more widespread in Angola than in many other developing countries, due in part to petroleum product subsidies. However, for most low-income Angolan families, woodfuels and candles represent the primary fuels.
Angola-EN_p141-154_chap06.indd 149Angola-EN_p141-154_chap06.indd 149 26/09/06 12:43:0026/09/06 12:43:00
© O
ECD
/IEA
, 200
6
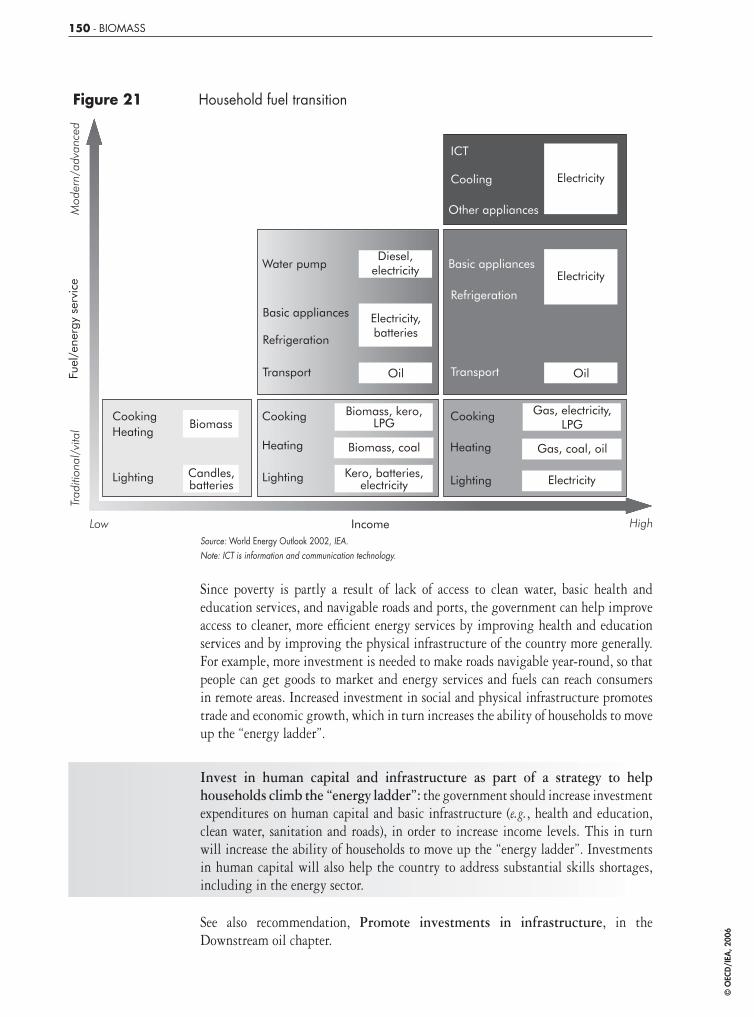
150 - BIOMASS
Figure 21 Household fuel transition
Source: World Energy Outlook 2002, IEA. Note: ICT is information and communication technology.
Since poverty is partly a result of lack of access to clean water, basic health and education services, and navigable roads and ports, the government can help improve access to cleaner, more effi cient energy services by improving health and education services and by improving the physical infrastructure of the country more generally. For example, more investment is needed to make roads navigable year-round, so that people can get goods to market and energy services and fuels can reach consumers in remote areas. Increased investment in social and physical infrastructure promotes trade and economic growth, which in turn increases the ability of households to move up the “energy ladder”.
Invest in human capital and infrastructure as part of a strategy to help households climb the “energy ladder”: the government should increase investment expenditures on human capital and basic infrastructure (e.g., health and education, clean water, sanitation and roads), in order to increase income levels. This in turn will increase the ability of households to move up the “energy ladder”. Investments in human capital will also help the country to address substantial skills shortages, including in the energy sector.
See also recommendation, Promote investments in infrastructure, in the Downstream oil chapter.
218590_p141-154_chap06.indd 150218590_p141-154_chap06.indd 150 21/09/06 11:34:0521/09/06 11:34:05
© O
ECD
/IEA
, 200
6
BIOMASS - 151
GOVERNMENT POLICY AND REGULATION
The main government body dealing with woodfuels is the Institute for Forest Development (IDF, formerly the National Directorate for Nature Conservation), which is responsible for the management of forestry resources in Angola. Created in 1989 and located within the Ministry of Agriculture and Rural Development, the IDF’s responsibilities are to defi ne, monitor and control the sustainable exploitation of forest and animal resources.51 In 2004, IDF had 1 194 employees, of which 30 were senior administrators, and a budget of Kz 462 million. The primary activities of IDF are the collection and distribution of data and information on forestry and animal resources; the estimation of biomass resources; the coordination and participation with the FAO and NEPAD in issues related to protection of national forests and deforestation.
In theory, all charcoal producers except subsistence farmers must be licensed by IDF. The licensing procedure must contain the following elements:
■ A request to the Minister of Agriculture and Rural Development, when the area is greater then one hectare or when the quantity is greater then 1 500 m3 of wood or 71 000 kg of charcoal.
■ An application to the Province Governor when the area is less than one hectare or when the quantities are less than those referred to above.
■ A declaration by the traditional and administrative authorities agreeing on the availability of the land.
■ Proof of bank deposit, or guarantee issued by a bank, in favour of IDF relating to the taxes foreseen in the law.
■ A sketch of the location and description of the project.
■ A declaration by the Provincial IDF authority.
Table 34 shows the number of licenses issued in 2003 and 2004.
Licensees reported that they had produced 60 578 tons of charcoal in 2004 and 26 557 tons of fuelwood. According to the Institute for Forest Development, production of charcoal in Angola increased 242% in 2004 over its 2003 level, despite the fact that fewer licences were issued.52
Assuming that charcoal consumption in Luanda is 100 kg per capita per year, the total amount consumed in one year in the Luanda region alone would be 400 million kg or 400 000 tons. Production that was reported to IDF (all licensed production) is
51. The Ministry of Environment and Urban Affairs has since been given responsibility for animal protection, habitats and national parks.
52. IDF, draft, 2004.
218590_p141-154_chap06.indd 151218590_p141-154_chap06.indd 151 21/09/06 11:34:0521/09/06 11:34:05
© O
ECD
/IEA
, 200
6
152 - BIOMASS
Table 34 Licences for exploitation of forestry resources
2003 2004
Timber 36 80
Charcoal 339 192
Fuelwood 59 132
Other - 26
Source: draft of Relatorio de Balanco das Actividades do Ano de 2004, Institute for Forestry Development, April 2005.
some one-sixth of this, strongly suggesting that most production in the country is outside government control.
Laws are in place against cutting trees, and forestry police go to different zones to stop the cutting.53 However, few people are available to cover some 70 million hectares. Other constraints to effective forestry management are limited funding to develop and implement programs and weak co-operation with other agencies.
While the Ministry of Forestry licenses charcoal manufacture and trade, it does not deal with other aspects of biomass policy, e.g., demand and end-use. Covering both “upstream” and “downstream” together in an integrated way will be important, since sustainable harvesting is intimately linked with demand for biomass as a fuel, the (ineffi cient) modes available for its use, and the lack of alternative energy options for the rural and peri-urban poor.
Address biomass within wider framework of household energy needs: the government should consider allocating more funds to the current programme for sustainable management of biomass resources. More importantly, however, it should seek to address the deforestation problem in a more integrated way that incorporates the demand side, including recognition of charcoal use as a response to lack of energy alternatives. This may require closer coordination between the Ministries of Energy and Water, Agriculture (Forestry Department), Urbanisation and Environment, and Petroleum.
In addition to addressing alternatives to wood and charcoal use, a bioenergy strategy that integrates the demand side should include an analysis of the production and distribution of fuelwood and charcoal to end users, the sustainable production of charcoal (e.g., through dissemination of improved kilns), the effi ciency of biomass use (e.g., improved cook stoves), and measures to diminish health impacts (e.g., also through improved cook stoves). In developing such a strategy, the government could examine the policy experience of other African countries (e.g., see Box 11).
53. In 2004, those police handed out 207 fi nes, and received some Kz1.7 million paid in fees.
218590_p141-154_chap06.indd 152218590_p141-154_chap06.indd 152 21/09/06 11:34:0521/09/06 11:34:05
© O
ECD
/IEA
, 200
6
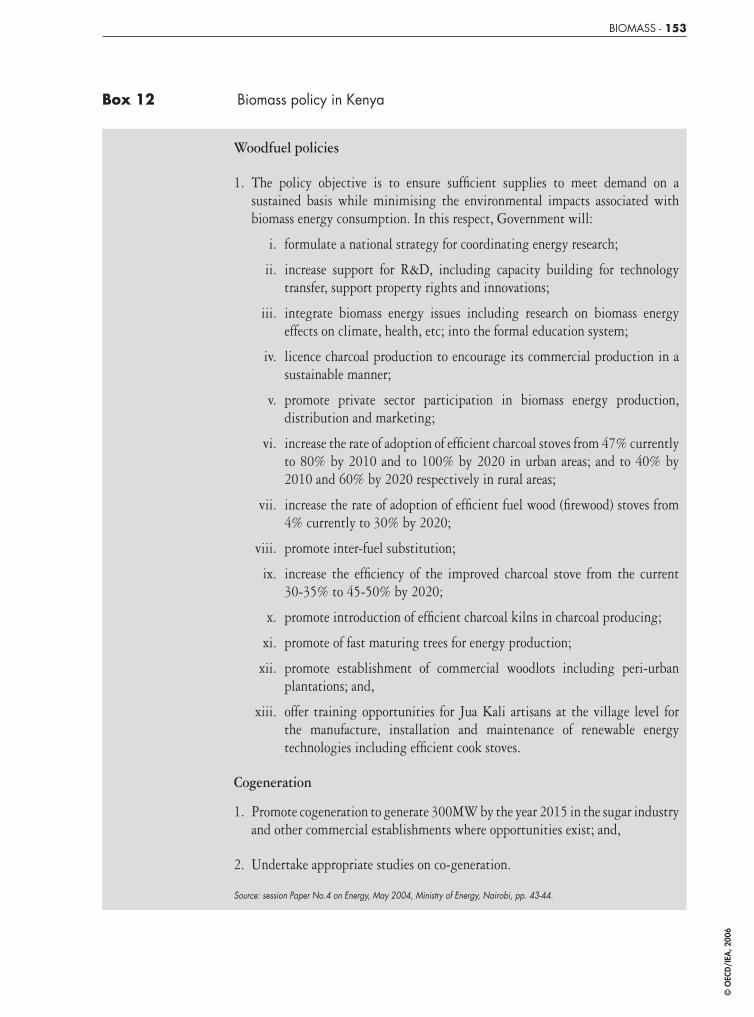
BIOMASS - 153
Box 12 Biomass policy in Kenya
Woodfuel policies
1. The policy objective is to ensure suffi cient supplies to meet demand on a sustained basis while minimising the environmental impacts associated with biomass energy consumption. In this respect, Government will:
i. formulate a national strategy for coordinating energy research;
ii. increase support for R&D, including capacity building for technology transfer, support property rights and innovations;
iii. integrate biomass energy issues including research on biomass energy effects on climate, health, etc; into the formal education system;
iv. licence charcoal production to encourage its commercial production in a sustainable manner;
v. promote private sector participation in biomass energy production, distribution and marketing;
vi. increase the rate of adoption of effi cient charcoal stoves from 47% currently to 80% by 2010 and to 100% by 2020 in urban areas; and to 40% by 2010 and 60% by 2020 respectively in rural areas;
vii. increase the rate of adoption of effi cient fuel wood (fi rewood) stoves from 4% currently to 30% by 2020;
viii. promote inter-fuel substitution;
ix. increase the effi ciency of the improved charcoal stove from the current 30-35% to 45-50% by 2020;
x. promote introduction of effi cient charcoal kilns in charcoal producing;
xi. promote of fast maturing trees for energy production;
xii. promote establishment of commercial woodlots including peri-urban plantations; and,
xiii. offer training opportunities for Jua Kali artisans at the village level for the manufacture, installation and maintenance of renewable energy technologies including effi cient cook stoves.
Cogeneration
1. Promote cogeneration to generate 300MW by the year 2015 in the sugar industry and other commercial establishments where opportunities exist; and,
2. Undertake appropriate studies on co-generation.
Source: session Paper No.4 on Energy, May 2004, Ministry of Energy, Nairobi, pp. 43-44.
218590_p141-154_chap06.indd 153218590_p141-154_chap06.indd 153 21/09/06 11:34:0621/09/06 11:34:06
© O
ECD
/IEA
, 200
6

218590_p141-154_chap06.indd 154218590_p141-154_chap06.indd 154 21/09/06 11:34:0621/09/06 11:34:06
© O
ECD
/IEA
, 200
6

CROSS-CUTTING ISSUES - 155
VII. CROSS-CUTTING ISSUES
OVERVIEW
This chapter covers several important issues that cut across more than one energy sub-sector:
■ Energy statistics.
■ Energy and the environment.
■ Household energy use.
Energy statistics
Reliable statistics are an important requirement for making sound government policy, including in the energy sector. The Ministry of Energy and Water (MINEA) is responsible for collecting and disseminating energy statistics in Angola, including those outside the power sector. The Ministries of Agriculture, Finance and Petroleum pass other relevant energy-related statistics to MINEA, which serves as a clearing house for energy information sent to international bodies.
Among energy statistics in Angola, those for upstream oil are of reasonable quality, but elsewhere quality and coverage appear to require improvement. In the electricity sector, this is in large part due to inadequate metering systems.
There are also important gaps. For example, there is little data on private generating capacity, which is important for estimating pent-up demand for grid supplies.
Gaps in data from other economic sectors may be just as critical. Policy development in the energy sector requires not only energy statistics, but also a wide range of socio-economic data. ENE notes for example that it seldom receives information regarding large new electricity-consuming projects, making it diffi cult to plan for changing demand loads. Similarly, Sonangol offi cials indicate diffi culty estimating demand for liquid fuels, due to lack of statistics concerning vehicle imports.
In some cases, data may be collected but evidently is not widely shared across government departments. In this context, the coordination efforts of MINEA should be encouraged.
218590_p155-164_chap07.indd 155218590_p155-164_chap07.indd 155 21/09/06 11:34:3121/09/06 11:34:31
© O
ECD
/IEA
, 200
6
156 - CROSS-CUTTING ISSUES
Improve capability to collect and disseminate relevant energy statistics and other socio-economic data: the government should improve its capability to collect and disseminate relevant statistics in the energy and other sectors, and improve coordination and data sharing between government departments. It may wish to seek the assistance of international institutions, e.g., the United Nations and the International Energy Agency in this regard.
Energy and the environment
The main energy-related environmental challenges facing Angola include local deforestation and desertifi cation due to heavy dependence on biomass energy; emissions from gas fl aring; and potential oil spills related to petroleum development. An increasingly important issue in the future is likely to be potential environmental impacts from construction of power generation and transmission infrastructure. These issues are discussed further in relevant energy sub-sector chapters. This section focuses on institutional issues.
Government institutions and policies
Before the 1992 Rio Conference, conservation issues were the responsibility of the Ministry of Agriculture. After Rio, the government established a State Secretariat for the Environment. Following the 2002 World Summit on Sustainable Development in Johannesburg, the government transferred the environmental portfolio to a new Ministry of Urban Affairs and Environment. This ministry has two environmental divisions:
■ The Environmental Management division is responsible for the national strategy on sustainable development and the implementation and monitoring of environmental impact assessments (EIAs; see below). It also works with schools, NGOs and other institutions to educate civil society, to train teachers and to raise public awareness of environmental issues.
■ The Conservation of Natural Resources division is responsible for developing a strategy to recover national parks and reserves destroyed during the war. It is also promoting ecotourism and implementing a national strategy on biodiversity.
In 2002 the Ministry of Urban Affairs and Environment developed a long-term vision for sustainable development looking at economic growth, environmental protection and social issues. It was based on the policy framework spelled out in two previous documents: the Progama Nacional de Gestao Ambiental (PNGA) and the Estrategia Nacional do Ambiente (ENA). Since 1993, stakeholders from government and civil society reportedly have been contributing to the PNGA; however, this document still remains in draft form.
The ENA (strategy) is a framework document that aims to identify the main environmental problems in Angola, with a view to addressing them as a means of ensuring sustainable development. Priorities for the ENA include: establishing an environmental fi nancing mechanism, controlling pollution and gas fl aring, and
218590_p155-164_chap07.indd 156218590_p155-164_chap07.indd 156 21/09/06 11:34:3221/09/06 11:34:32
© O
ECD
/IEA
, 200
6
CROSS-CUTTING ISSUES - 157
conducting a survey of the exploitation of natural resources. The strategy also outlines ways to increase the use of renewable energy sources and establishes targets for the development of human and institutional capacity in the environmental sphere.
In the international sphere, Angola is party to the conventions on Biodiversity, Climate Change, Desertifi cation, Law of the Sea, Ozone Layer Protection and Ship Pollution. In addition, the country has ratifi ed the Montreal Protocol and is in the process of ratifying the Basel Convention. The Ministry of Urban Affairs and Environment is preparing its fi rst National Communication for Climate Change.
Unsustainable biomass use
As in many sub-Saharan African countries, fuelwood and charcoal account for nearly all energy consumption in rural areas and for a large portion of energy consumption in peri-urban areas. Over 80% of Angolans depend on charcoal and fuelwood to meet residential energy needs. Deforestation appears to be primarily a result of intensive tree-cutting for charcoal production for shipment to peri-urban areas.
While the Ministry of Forestry licenses charcoal manufacture and trade, most trade that takes place is not licensed. Moreover, this ministry does not deal with other aspects of biomass policy, e.g., demand and end-use. As noted in the Biomass chapter, covering both “upstream” and “downstream” together in an integrated way will be important, since unsustainable harvesting is intimately linked with demand for biomass as a fuel, the (ineffi cient) modes available for its use, and the lack of alternative energy options for the rural and peri-urban poor. (The Biomass chapter covers these issues in more detail.)
Flaring All gas produced in Angola is associated with oil production, and approximately 75-80% of this is fl ared. This is due in large part to lack of local or regional markets for the gas.
The world community increasingly has come to see gas fl aring as a problem in terms of wasted resources and contributions to greenhouse gas emissions. Sonangol and the government of Angola have also recognized fl aring as a problem and have declared their intention to eliminate routine fl aring in Angola’s oil industry by 2010. In line with the Angolan government’s ban on routine fl aring at new fi elds, several new offshore developments are already “zero-fl are”, and oil companies are in the process of developing others.
Major investment will be needed for the infrastructure to gather and re-inject gas, and this may not always be justifi ed economically in terms of enhanced oil recovery. Given the current lack of local and regional markets for the gas, the main option being considered besides re-injection is an LNG export scheme. (Further discussion of the fl aring issue is provided in the Gas chapter.)
Environmental impact assessments
The 2004 Environmental Impact Assessment (EIA) Law, which supplements the 1988 Environmental Framework Act, requires EIAs for all public and private-sector projects that, due to their dimension or location, could have signifi cant environmental or social impacts. The 2000 Oil Activities Decree, which preceded the EIA Law, already specifi cally required EIAs for all offshore and onshore oil development projects. It is
218590_p155-164_chap07.indd 157218590_p155-164_chap07.indd 157 21/09/06 11:34:3221/09/06 11:34:32
© O
ECD
/IEA
, 200
6
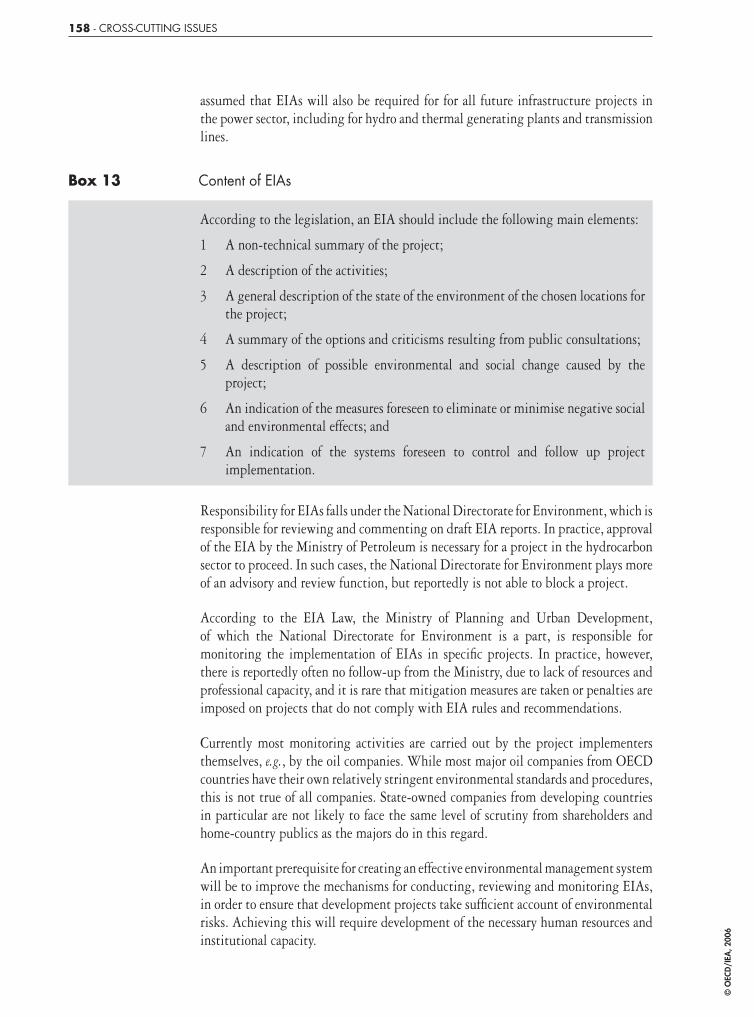
158 - CROSS-CUTTING ISSUES
assumed that EIAs will also be required for for all future infrastructure projects in the power sector, including for hydro and thermal generating plants and transmission lines.
Box 13 Content of EIAs
According to the legislation, an EIA should include the following main elements:
1 A non-technical summary of the project;
2 A description of the activities;
3 A general description of the state of the environment of the chosen locations for the project;
4 A summary of the options and criticisms resulting from public consultations;
5 A description of possible environmental and social change caused by the project;
6 An indication of the measures foreseen to eliminate or minimise negative social and environmental effects; and
7 An indication of the systems foreseen to control and follow up project implementation.
Responsibility for EIAs falls under the National Directorate for Environment, which is responsible for reviewing and commenting on draft EIA reports. In practice, approval of the EIA by the Ministry of Petroleum is necessary for a project in the hydrocarbon sector to proceed. In such cases, the National Directorate for Environment plays more of an advisory and review function, but reportedly is not able to block a project.
According to the EIA Law, the Ministry of Planning and Urban Development, of which the National Directorate for Environment is a part, is responsible for monitoring the implementation of EIAs in specifi c projects. In practice, however, there is reportedly often no follow-up from the Ministry, due to lack of resources and professional capacity, and it is rare that mitigation measures are taken or penalties are imposed on projects that do not comply with EIA rules and recommendations.
Currently most monitoring activities are carried out by the project implementers themselves, e.g., by the oil companies. While most major oil companies from OECD countries have their own relatively stringent environmental standards and procedures, this is not true of all companies. State-owned companies from developing countries in particular are not likely to face the same level of scrutiny from shareholders and home-country publics as the majors do in this regard.
An important prerequisite for creating an effective environmental management system will be to improve the mechanisms for conducting, reviewing and monitoring EIAs, in order to ensure that development projects take suffi cient account of environmental risks. Achieving this will require development of the necessary human resources and institutional capacity.
218590_p155-164_chap07.indd 158218590_p155-164_chap07.indd 158 21/09/06 11:34:3321/09/06 11:34:33
© O
ECD
/IEA
, 200
6

CROSS-CUTTING ISSUES - 159
Increase human and institutional capacity to review and monitor environmental regulations and EIAs: the government’s capacity to review and monitor environmental regulations and Environmental Impact Assessments (EIAs) is low. The government should ensure adequate fi nancing to boost such capacity. As part of such efforts, it should consider research exchange programmes with international institutions, including regional ones.
HOUSEHOLD ENERGY USE
Overview Fuelwood and charcoal represent some 80% of household energy consumption, and in many rural areas the share is probably up to 100%. In most cases, a household consumes these fuels because it cannot afford more modern forms of energy, such as electricity or liquid fuels or the appliances to use them, or because such modern forms of energy are not readily available. Electricity access in the country is estimated to be between 8-20%, though substantially lower than this in rural areas. Because electricity supply is unreliable where it is available, a large percentage of urban families also tend to have a diesel generator as backup.
While penetration of liquid fuels is higher in Angola than in many other African countries, due in part to subsidies on petroleum products, supplies are limited by a poor distribution network.
Household energy demand and supply
Household energy demand differs in urban, peri-urban and rural areas, due to differences in fuel availability and income levels. However, internal migrations as a result of the war have introduced peri-urban energy use patterns to rural regions and vice versa.
Angola’s three largest cities are Luanda (4 million), Benguela (1.5-2 million) and Lubango (250 000-500 000). Some two thirds of Luanda’s population live in the peri-urban musseques that surround the city. Average household size in the country as a whole is estimated to be around seven, though households in rural and peri-urban areas reportedly commonly contain 9-10.
Households typically combine two to three sources of fuel to meet domestic energy needs. Energy requirements for cooking represent about 80% of total household energy consumption, although this differs by income level. The poorest households cook one meal per day, usually beans and a staple (primarily manioc in the north, maize in the centre and millet or sorghum in the south).
LPG stoves are common in major urban centres, especially near the coast. Charcoal stoves are the main appliance for cooking in peri-urban areas, though LPG has made inroads here as well. Three-stone fi res predominate in rural regions. In peri-urban areas, charcoal and fuelwood account for 50% to 75% of domestic energy use, while in many rural areas, they account for up to 100%.
218590_p155-164_chap07.indd 159218590_p155-164_chap07.indd 159 21/09/06 11:34:3321/09/06 11:34:33
© O
ECD
/IEA
, 200
6

160 - CROSS-CUTTING ISSUES
Middle and upper-income households typically cook with LPG, although most temporarily switch to charcoal when supplies of more modern fuels are inadequate. A 12-kg tank of LPG reportedly satisfi es the cooking demands for a household of 6 to 8 people for about a month and costs about 500 Kz at controlled prices (though reportedly up to 3 times this on the informal market).
In the musseques of Luanda, electricity is provided formally in a few areas, but available informally in many others, while as many as 3 in 10 households may have a diesel generator. In the smaller, southern city of Lubango, local offi cials estimate that as much as 75% of the urban population has a generator to supplement unreliable electricity supply. Outside the cities, generators are far less common, though local offi cials in Huila unoffi cially estimate that up to 30% of households in that province may have one.
Around Luanda, solar irradiation levels average some 5 kWh m– 2 day– 1 throughout the year.54 Solar energy can be used to supply electricity to small communities and families in areas with no grid access, e.g., for health clinics (refrigeration of medicines and vaccines), schools (homework and adult education), water supply (pump operation) and telecommunication (satellite radio/TV, wireless phone operations, Internet kiosks). Despite high initial capital costs, an important advantage of PV systems is the lack of fuel requirements, since diesel fuel, while subsidised, is often in short supply in rural areas.
Programmes aimed at promoting household use of PV systems has been limited to a few pilot programmes (see Electricity chapter), while BP has equipped two schools (one in Luanda, one in Viana, just outside Luanda) with solar PV systems, and plans to equip a number of pilot clinics to allow refrigeration of medicines.
Private uptake of PV systems is occurring, but there are no statistics on this. The Ministry of Energy, Water and Minerals in Huila Province reports that PV systems used there are usually purchased in neighbouring Namibia.55 According to informal estimates by ministry offi cials, less than 0.5% of households in this province have PV systems, with a lower share likely in provinces farther from the border.
The Angolan Ministry of the Environment is looking into the possibility of using solar PV for niche applications in urban centres. However, there is no clear government strategy yet on deploying solar technology.
Consider solar for autonomous rural energy services and for niche urban markets: the government should continue to look for autonomous options, like stand-alone PV, for meeting energy needs of rural population, including for hospitals, schools and telecommunications, with specifi c attention to local conditions and should develop a clearer strategy.
54. http://energy.caeds.eng.uml.edu/instructions.htm.55. A typical kit costs USD 1 000 and comes with a 25-year guarantee for the panels and a 5-year guarantee for
batteries.
218590_p155-164_chap07.indd 160218590_p155-164_chap07.indd 160 21/09/06 11:34:3321/09/06 11:34:33
© O
ECD
/IEA
, 200
6
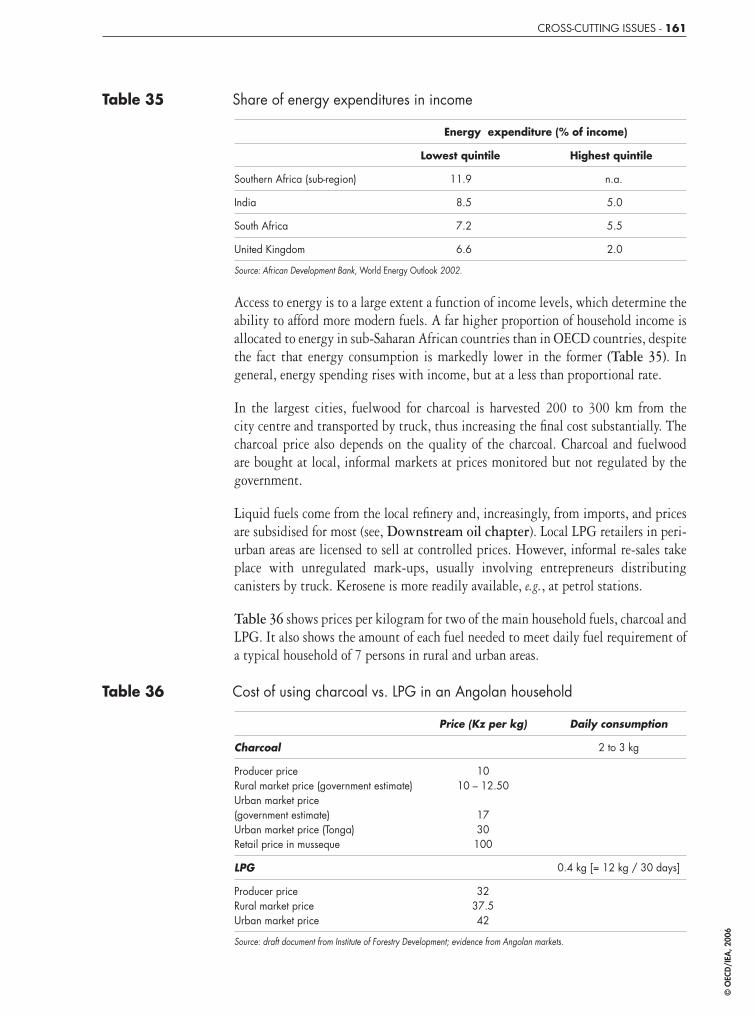
CROSS-CUTTING ISSUES - 161
Table 35 Share of energy expenditures in income
Energy expenditure (% of income)
Lowest quintile Highest quintile
Southern Africa (sub-region) 11.9 n.a.
India 8.5 5.0
South Africa 7.2 5.5
United Kingdom 6.6 2.0
Source: African Development Bank, World Energy Outlook 2002.
Access to energy is to a large extent a function of income levels, which determine the ability to afford more modern fuels. A far higher proportion of household income is allocated to energy in sub-Saharan African countries than in OECD countries, despite the fact that energy consumption is markedly lower in the former (Table 35). In general, energy spending rises with income, but at a less than proportional rate.
In the largest cities, fuelwood for charcoal is harvested 200 to 300 km from the city centre and transported by truck, thus increasing the fi nal cost substantially. The charcoal price also depends on the quality of the charcoal. Charcoal and fuelwood are bought at local, informal markets at prices monitored but not regulated by the government.
Liquid fuels come from the local refi nery and, increasingly, from imports, and prices are subsidised for most (see, Downstream oil chapter). Local LPG retailers in peri-urban areas are licensed to sell at controlled prices. However, informal re-sales take place with unregulated mark-ups, usually involving entrepreneurs distributing canisters by truck. Kerosene is more readily available, e.g., at petrol stations.
Table 36 shows prices per kilogram for two of the main household fuels, charcoal and LPG. It also shows the amount of each fuel needed to meet daily fuel requirement of a typical household of 7 persons in rural and urban areas.
Table 36 Cost of using charcoal vs. LPG in an Angolan household
Price (Kz per kg) Daily consumption
Charcoal 2 to 3 kg
Producer price Rural market price (government estimate)Urban market price (government estimate)Urban market price (Tonga)Retail price in musseque
1010 – 12.50
1730100
LPG 0.4 kg [= 12 kg / 30 days]
Producer priceRural market priceUrban market price
3237.542
Source: draft document from Institute of Forestry Development; evidence from Angolan markets.
218590_p155-164_chap07.indd 161218590_p155-164_chap07.indd 161 21/09/06 11:34:3321/09/06 11:34:33
© O
ECD
/IEA
, 200
6
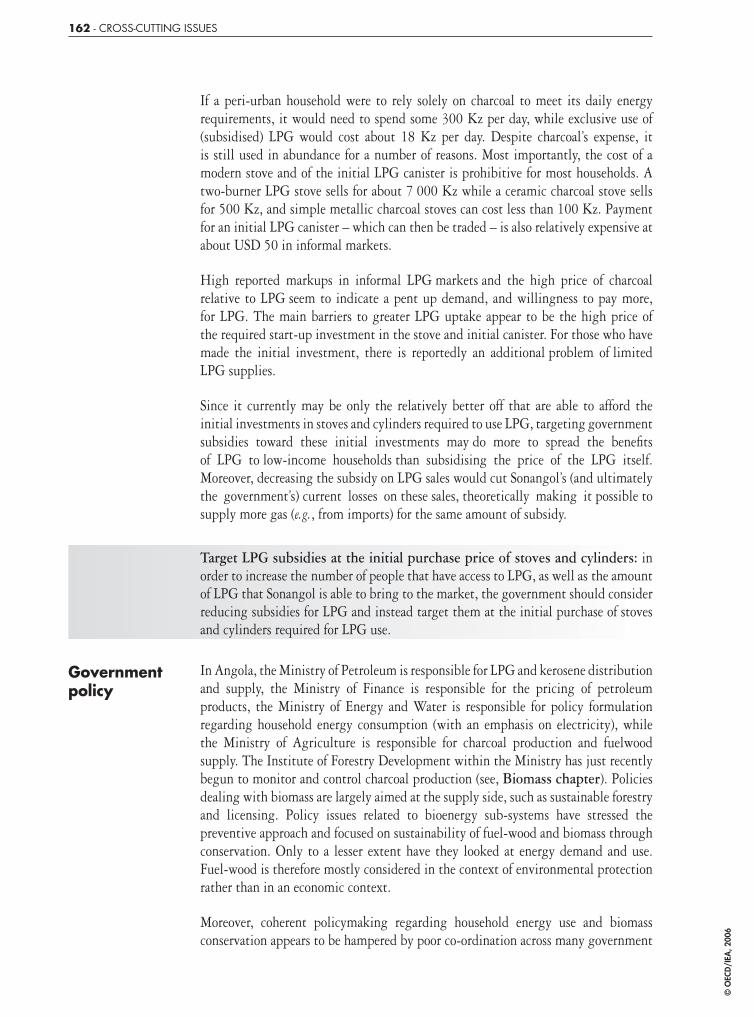
162 - CROSS-CUTTING ISSUES
If a peri-urban household were to rely solely on charcoal to meet its daily energy requirements, it would need to spend some 300 Kz per day, while exclusive use of (subsidised) LPG would cost about 18 Kz per day. Despite charcoal’s expense, it is still used in abundance for a number of reasons. Most importantly, the cost of a modern stove and of the initial LPG canister is prohibitive for most households. A two-burner LPG stove sells for about 7 000 Kz while a ceramic charcoal stove sells for 500 Kz, and simple metallic charcoal stoves can cost less than 100 Kz. Payment for an initial LPG canister – which can then be traded – is also relatively expensive at about USD 50 in informal markets.
High reported markups in informal LPG markets and the high price of charcoal relative to LPG seem to indicate a pent up demand, and willingness to pay more, for LPG. The main barriers to greater LPG uptake appear to be the high price of the required start-up investment in the stove and initial canister. For those who have made the initial investment, there is reportedly an additional problem of limited LPG supplies.
Since it currently may be only the relatively better off that are able to afford the initial investments in stoves and cylinders required to use LPG, targeting government subsidies toward these initial investments may do more to spread the benefi ts of LPG to low-income households than subsidising the price of the LPG itself. Moreover, decreasing the subsidy on LPG sales would cut Sonangol’s (and ultimately the government’s) current losses on these sales, theoretically making it possible to supply more gas (e.g., from imports) for the same amount of subsidy.
Target LPG subsidies at the initial purchase price of stoves and cylinders: in order to increase the number of people that have access to LPG, as well as the amount of LPG that Sonangol is able to bring to the market, the government should consider reducing subsidies for LPG and instead target them at the initial purchase of stoves and cylinders required for LPG use.
Government policy
In Angola, the Ministry of Petroleum is responsible for LPG and kerosene distribution and supply, the Ministry of Finance is responsible for the pricing of petroleum products, the Ministry of Energy and Water is responsible for policy formulation regarding household energy consumption (with an emphasis on electricity), while the Ministry of Agriculture is responsible for charcoal production and fuelwood supply. The Institute of Forestry Development within the Ministry has just recently begun to monitor and control charcoal production (see, Biomass chapter). Policies dealing with biomass are largely aimed at the supply side, such as sustainable forestry and licensing. Policy issues related to bioenergy sub-systems have stressed the preventive approach and focused on sustainability of fuel-wood and biomass through conservation. Only to a lesser extent have they looked at energy demand and use. Fuel-wood is therefore mostly considered in the context of environmental protection rather than in an economic context.
Moreover, coherent policymaking regarding household energy use and biomass conservation appears to be hampered by poor co-ordination across many government
218590_p155-164_chap07.indd 162218590_p155-164_chap07.indd 162 21/09/06 11:34:3421/09/06 11:34:34
© O
ECD
/IEA
, 200
6
CROSS-CUTTING ISSUES - 163
departments that deal with different aspects of the supply chain. In Senegal, Ghana and Burkina Faso, governments have set up National Energy Commissions/Boards to address energy policy and to coordinate different Ministries involved in policy-making for household energy consumption. A similar Board could improve energy policies in Angola.
See recommendation, Addressing biomass within wider framework of household energy needs, in Biomass chapter.
218590_p155-164_chap07.indd 163218590_p155-164_chap07.indd 163 21/09/06 11:34:3421/09/06 11:34:34
© O
ECD
/IEA
, 200
6

218590_p155-164_chap07.indd 164218590_p155-164_chap07.indd 164 21/09/06 11:34:3421/09/06 11:34:34
© O
ECD
/IEA
, 200
6
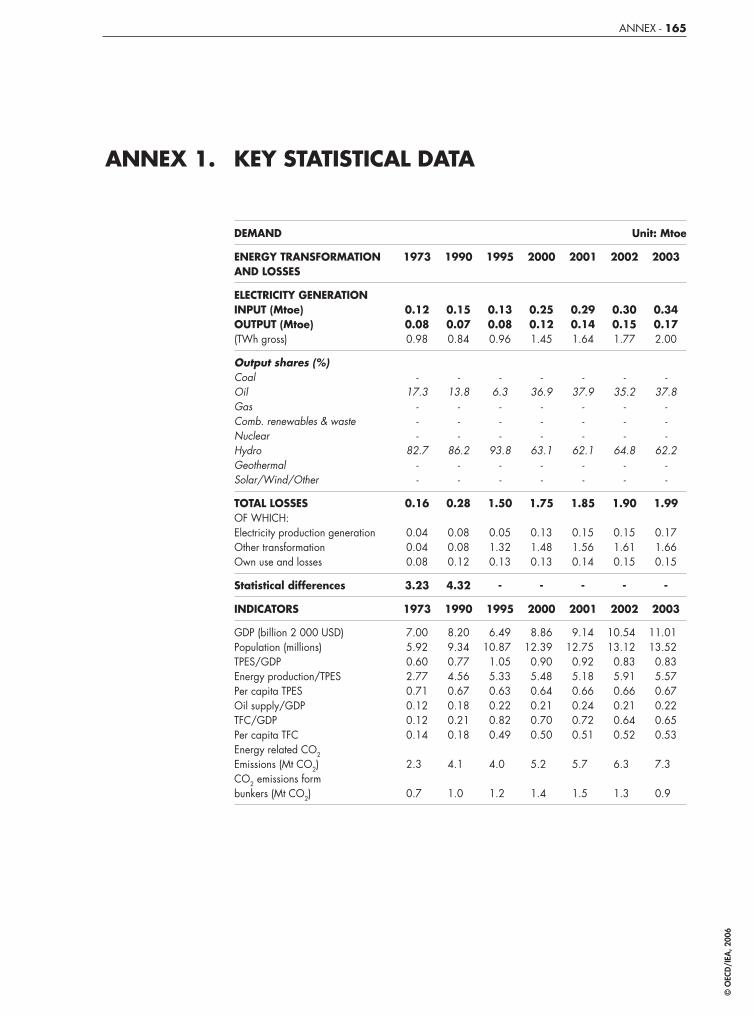
ANNEX 1. KEY STATISTICAL DATA
DEMAND Unit: Mtoe
ENERGY TRANSFORMATION AND LOSSES
1973 1990 1995 2000 2001 2002 2003
ELECTRICITY GENERATIONINPUT (Mtoe)OUTPUT (Mtoe)(TWh gross)
0.120.080.98
0.150.070.84
0.130.080.96
0.250.121.45
0.290.141.64
0.300.151.77
0.340.172.00
Output shares (%)CoalOilGasComb. renewables & wasteNuclearHydroGeothermalSolar/Wind/Other
-17.3
---
82.7--
-13.8
---
86.2--
-6.3
---
93.8--
-36.9
---
63.1--
-37.9
---
62.1--
-35.2
---
64.8--
-37.8
---
62.2--
TOTAL LOSSESOF WHICH:Electricity production generationOther transformationOwn use and losses
0.16
0.040.040.08
0.28
0.080.080.12
1.50
0.051.320.13
1.75
0.131.480.13
1.85
0.151.560.14
1.90
0.151.610.15
1.99
0.171.660.15
Statistical differences 3.23 4.32 - - - - -
INDICATORS 1973 1990 1995 2000 2001 2002 2003
GDP (billion 2 000 USD)Population (millions)TPES/GDPEnergy production/TPESPer capita TPESOil supply/GDPTFC/GDPPer capita TFCEnergy related CO2
Emissions (Mt CO2)CO2 emissions form bunkers (Mt CO2)
7.005.920.602.770.710.120.120.14
2.30
0.70
8.209.340.774.560.670.180.210.18
4.10
1.00
6.4910.870
1.055.330.630.220.820.49
4.00
1.20
8.8612.390
0.905.480.640.210.700.50
5.20
1.40
9.1412.750
0.925.180.660.240.720.51
5.70
1.50
10.54013.1200.835.910.660.210.640.52
6.30
1.30
11.01013.5200.835.570.670.220.650.53
7.30
0.90
ANNEX - 165
218590_p165-172_Fin.indd 165218590_p165-172_Fin.indd 165 21/09/06 11:35:4121/09/06 11:35:41
© O
ECD
/IEA
, 200
6
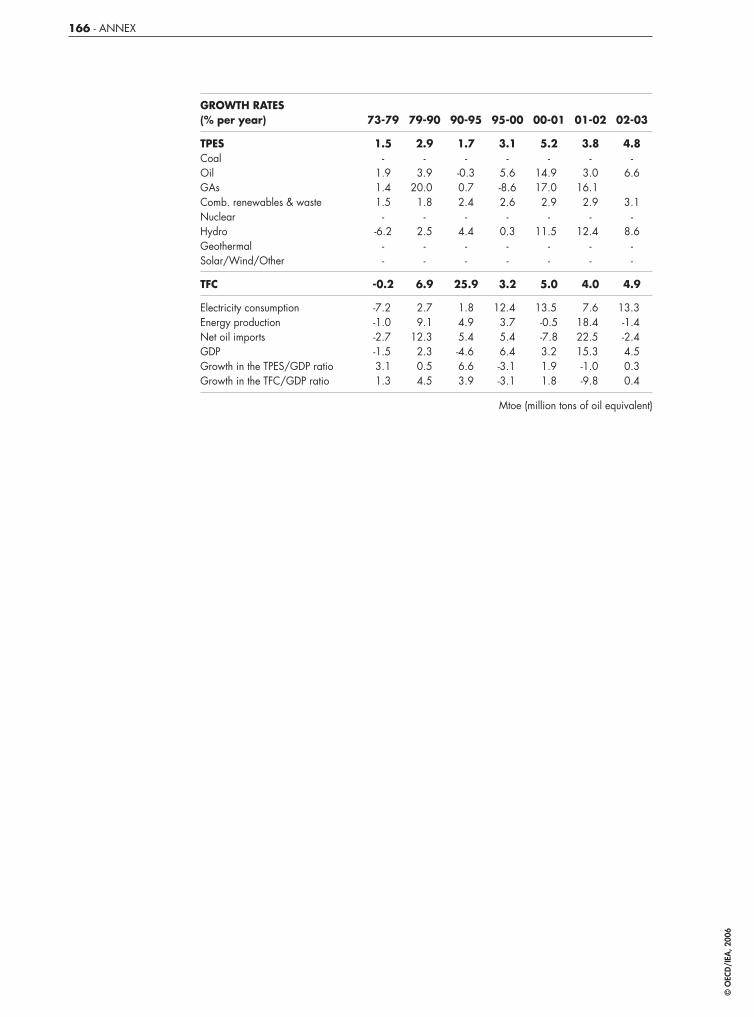
GROWTH RATES (% per year) 73-79 79-90 90-95 95-00 00-01 01-02 02-03
TPESCoalOilGAsComb. renewables & wasteNuclearHydroGeothermalSolar/Wind/Other
1.5-
1.91.41.5
--6.2
--
2.9-
3.920.001.8
-2.5
--
1.7-
-0.30.72.4
-4.4
--
3.1-
5.6-8.62.6
-0.3
--
5.2-
14.9017.00
2.9-
11.50--
3.8-
3.016.102.9
-12.40
--
4.8-
6.6
3.1-
8.6--
TFC -0.2 6.9 25.9 3.2 5.0 4.0 4.9
Electricity consumptionEnergy productionNet oil importsGDPGrowth in the TPES/GDP ratioGrowth in the TFC/GDP ratio
-7.2--1.0--2.7--1.5-3.11.3
2.79.1
12.302.30.54.5
1.84.95.4-4.6-6.63.9
12.403.75.46.4-3.1--3.1-
13.50-0.5-7.83.21.91.8
7.618.4022.5015.30-1.0--9.8-
13.30-1.4--2.4-4.50.30.4
Mtoe (million tons of oil equivalent)
166 - ANNEX
218590_p165-172_Fin.indd 166218590_p165-172_Fin.indd 166 21/09/06 11:35:4221/09/06 11:35:42
© O
ECD
/IEA
, 200
6
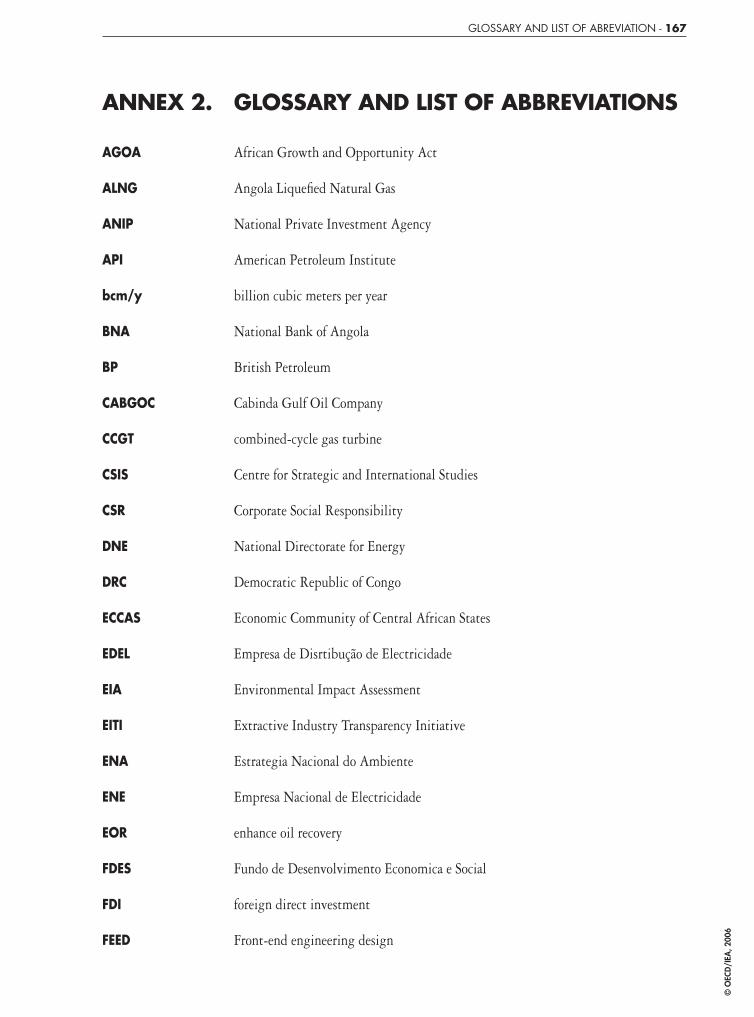
ANNEX 2. GLOSSARY AND LIST OF ABBREVIATIONS
AGOA African Growth and Opportunity Act
ALNG Angola Liquefi ed Natural Gas
ANIP National Private Investment Agency
API American Petroleum Institute
bcm/y billion cubic meters per year
BNA National Bank of Angola
BP British Petroleum
CABGOC Cabinda Gulf Oil Company
CCGT combined-cycle gas turbine
CSIS Centre for Strategic and International Studies
CSR Corporate Social Responsibility
DNE National Directorate for Energy
DRC Democratic Republic of Congo
ECCAS Economic Community of Central African States
EDEL Empresa de Disrtibução de Electricidade
EIA Environmental Impact Assessment
EITI Extractive Industry Transparency Initiative
ENA Estrategia Nacional do Ambiente
ENE Empresa Nacional de Electricidade
EOR enhance oil recovery
FDES Fundo de Desenvolvimento Economica e Social
FDI foreign direct investment
FEED Front-end engineering design
GLOSSARY AND LIST OF ABREVIATION - 167
218590_p165-172_Fin.indd 167218590_p165-172_Fin.indd 167 21/09/06 11:35:4221/09/06 11:35:42
© O
ECD
/IEA
, 200
6

FPSO Floating Production Storage Offl oading
FS Fina Sonangol
FST Fina Sonangol Texaco
GDP gross domestic product
GWh gigawatt-hour
HIPC heavily indebted poor countries
IDF Institute for Forest Development
IEA International Energy Agency
IMF International Monetary Fund
IOC International oil company
IRSE Instituto Regulador de Sector Eléctrico
KPMG International consulting fi rm Klynveld, Peat, Marwick & Goerdeler
kb/d thousand barrels per day
kV kilovolt
kVA kilovolt amps
kWh kilovolt-hour
LNG liquefi ed natural gas
LPG liquefi ed petroleum gas
Mcf/d million cubic feet per day
MINEA Ministry of Energy and Water
MoP Ministry of Petroleum
MVA Manufacturing value added
MW mega-watt
MWh mega-watt-hour
NASDA National Space Development Agency
168 - GLOSSARY AND LIST OF ABREVIATION
218590_p165-172_Fin.indd 168218590_p165-172_Fin.indd 168 21/09/06 11:35:4221/09/06 11:35:42
© O
ECD
/IEA
, 200
6

NePAD New Partnership for African Development
NGO Non-Governmental Organisations
OECD Organisation for Economic Co-operation and Development
PEAC Energy Pool of Central Africa
PFC Petroleum Finance Corporation
PIT Petroleum Income Tax
PNGA Progama Nacional de Gestão Ambiental
PPIAF Public-Private Infrastructure Advisory Facility
PRSP Poverty Reduction Strategy Paper
PSA Production sharing agreement
PV photovoltaic
SADC Southern African Development Community
SAPP Southern African Power Pool
SBM Single Point Buoy Mooring
SMP staff-monitored programmes
TAAG Angola Airlines
TANESCO Tanzania Electric Supply Company
TANWAT Tanganyika Wattle Company
TEL tetraethyl-lead
tcf trillion cubic feet
UN FAO United Nations Food and Agricultural Organisation
UNICEF United Nations Children’s Fund
UNITA National Union for the Total Independence of Angola
UPDEA Union of Producers, Transporters and Distributors of Electric Power
USAID US Agency for International Development
GLOSSARY AND LIST OF ABREVIATION - 169
218590_p165-172_Fin.indd 169218590_p165-172_Fin.indd 169 21/09/06 11:35:4321/09/06 11:35:43
© O
ECD
/IEA
, 200
6
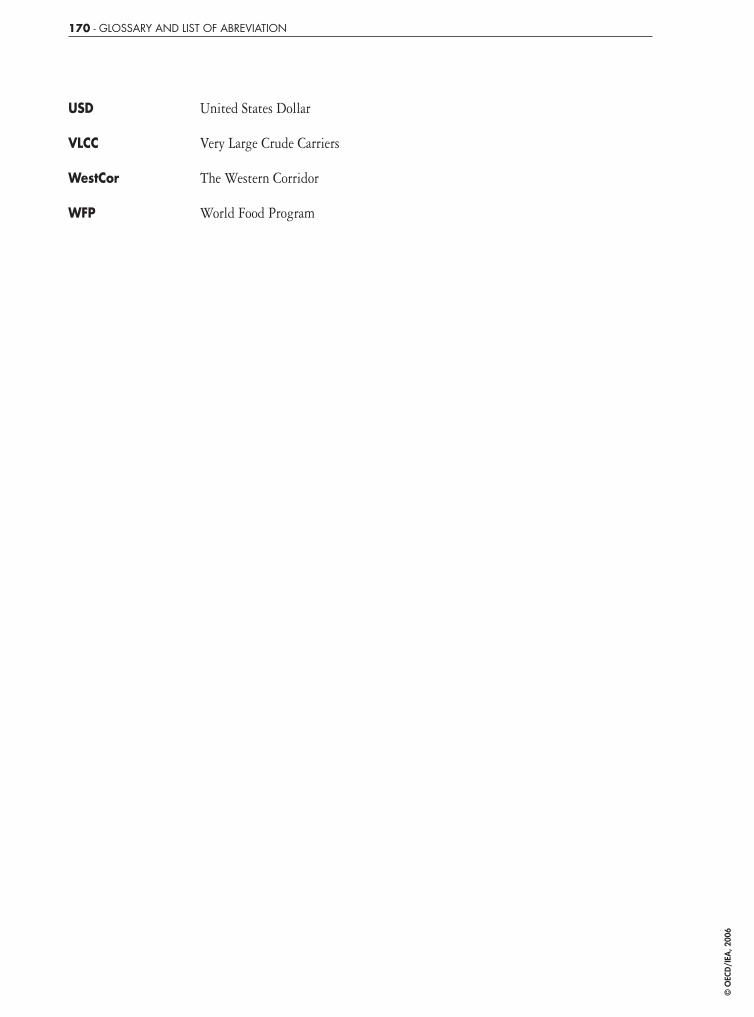
USD United States Dollar
VLCC Very Large Crude Carriers
WestCor The Western Corridor
WFP World Food Program
170 - GLOSSARY AND LIST OF ABREVIATION
218590_p165-172_Fin.indd 170218590_p165-172_Fin.indd 170 21/09/06 11:35:4321/09/06 11:35:43
© O
ECD
/IEA
, 200
6
All IEA publications can be boughtonline on the IEA website:
You can also obtain PDFs ofall IEA books at 20% discount.
Books published before January 2005- with the exception of the statistics publications -
can be downloaded in PDF, free of charge,from the IEA website.
You can also send
your order
to your nearest
OECD sales point
or through
the OECD online
services:
www.oecdbookshop.org
CUSTOMERS INNORTH AMERICA
Turpin DistributionThe Bleachery143 West Street, New MilfordConnecticut 06776, USAToll free: +1 (800) 456 6323Fax: +1 (860) 350 [email protected]
www.turpin-distribution.com
International Energy Agency9, rue de la Fédération75739 Paris Cedex 15, France
www.iea.org/books
The Online BookshopInternational Energy Agency
CUSTOMERS INTHE REST OF THE WORLD
Turpin Distribution Services LtdStratton Business Park,
Pegasus Drive, Biggleswade,Bedfordshire SG18 8QB, UKTel.: +44 (0) 1767 604960Fax: +44 (0) 1767 604640
www.turpin-distribution.com
IEA BOOKSTel: +33 (0)1 40 57 66 90Fax: +33 (0)1 40 57 67 75
E-mail: [email protected]
218590_p165-172_Fin.indd 171218590_p165-172_Fin.indd 171 21/09/06 11:35:4421/09/06 11:35:44
© O
ECD
/IEA
, 200
6

218590_p165-172_Fin.indd 172218590_p165-172_Fin.indd 172 21/09/06 11:35:4421/09/06 11:35:44
© O
ECD
/IEA
, 200
6

IEA PUBLICATIONS, 9, rue de la Fédération, 75739 PARIS CEDEX 15PRINTED IN FRANCE BY JOUVE / 2006
(61 2006 02 1P1) ISBN : 92-64-10967-6
218590_p165-172_Fin.indd 173218590_p165-172_Fin.indd 173 21/09/06 11:35:4421/09/06 11:35:44
© O
ECD
/IEA
, 200
6