annual data and verification tabulation
TRANSCRIPT

r· ,, ~··. '
•·.
! .. • ~
/" .' .. .. · ,:•",
NOAA TECHNICAL MEMORANDUM NWS WR-150
·."""' -~~ 1
_,..·,.... '
· :J'. ANNDAL DATA AND VERIFICATION TABULATION 1 ~EASTERN' AND CENTRAL NORTH PAt::IFIC TROPICAL CYCLONES 1979 ·,. .. , ..
:' . . ... ; '.. . J~.
Emil 8. Gunther and Staff
·' .
·,:·Nat,ion·al Weather''s'ervice Western Region . ·· ~.afl.t ,Lake City, Utah -·~Apdl ,:1980 ,_,..
.· '
,.
noaa
/
/
NATIONAL OCEANIC AND ATMOSPHERIC ADMINISTRATION I National Weather
Service
. --- -~---- -------· -·-----
NOAA Technical Memorandum NW~ WR~l50
ANNUAL DATA AND VERIFICATION TABULATION EASTERN AND CENTRAL NORTH PACIFIC TROPICAL CYCLONES 1979
Emil B. Gunther and Staff
Eastern Pacific Hurricane Center Weather Service Forecast Office San Francisco, California April 1980
UNITED STATES DEPARTMENT OF COMMERCE
Philip M. Klutznick, Secretary
/ NATIONAL OCEANIC AND /
/ ATMOSPHERIC ADMINISTRATION /·'
. Richard A Frank. Adm1mstrator
NatiOnal weather
ServicP. Richard E. Hallgren. Director

This Technical Memorandum has been
reviewed and is approved for
publication by Scientific Services
Division, Western Region.
L. W. Snel lman, Chief Scientific Services Division Western Region Headquarters Salt Lake City, Utah
i i
t_··

CONTENTS
Tables and Figures . . . . '. . . . . . . . . ~
I. Introduction · ·. . . ~ . . . . ~ . . ~ ..
II. Obj€ctive Forecast Techniques . " \' ..
III.
IV ..
v.
Verification
Data Summaries
References
. ~ . .. . . ' ' .; . ~ . . .
• •••• • r •••••
iii
iv
1
1
2
2
TABLES AND FIG~RES
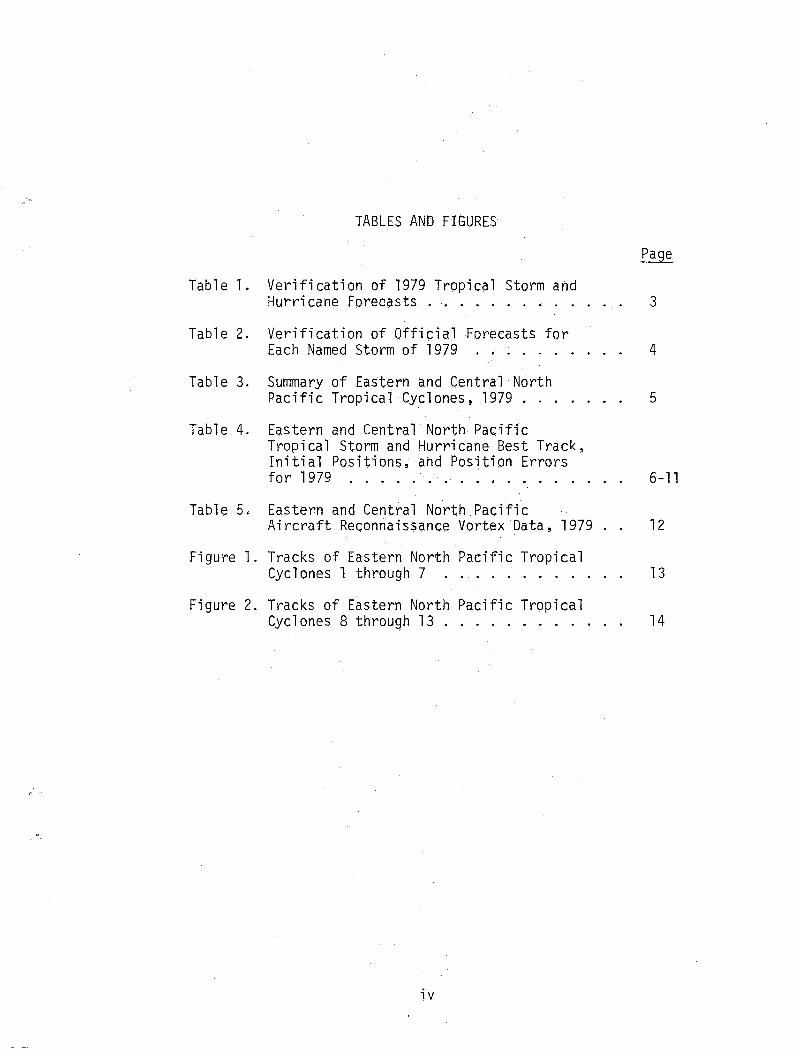
Table 1. Verification of 1979 Trppic9l Storm and Hurricane Forecasts . . . . . . . . . . 3
Table 2. Verification of Official Forecasts for Each Named Storm of 1979 . . . . . . 4
Table 3. Summary of Eastern and Central North Pacific Tropical Cyclones, 1979 . 5
Table 4. Eastern and Central North Pacific Tropical Storm and Hurricane Best Track, Initial Positions, and Position Errors for 1979 . . , , . . . . . . . . . . . . 6-11
Table 5. Eastern and Central North Pacific Aircraft Reconnaissance Vortex Data, 1979 12
Figure l. Tracks of Eastern North Pacific Tropical Cyclones l through 7 . . . 13
Figure 2. Tracks of Eastern North Pacific Tropical Cyclones 8 through 13 . . . . 14
iv

ANNUAL DATA AND VERIFICATION TABULATION EASTERN AND CENTRAL NORTH PACIFIC TROPICAL STORMS AND HURRICANES 1979
Emil B. Gunther and Staff Eastern Pacific Hurricane Center (WSFO) San Francisco, California
I. INTRODUCTION
This is the first of an annual series coverfng eastern and central North Pacific tropical cyclone activity. The data included in this report are limited since the decision to prepare the report was not made until very late in the tropical cyclone season. Issuances in future years will contain additional data including satellite imagery.
Data for this publication were provided by the National Weather Service, the National Environmental Satellite Service Field Station - San Francisco, California, and the Chief, Aerial Reconnaissance Coordination, all Hurricanes (CARCAH), Miami, Florida.
II. OBJECTIVE FORECAST TECHNIQUES
Tropical cyclone prediction models used by Eastern Pacific Hurricane Center (EPHC) forecasters include:
1. EPHC-77 (Leftwich and Neumann: 1977). A Statistical-Synoptic Model.
2. EPCLIPER (Neumann: 1972). A Simulated Analog Model Based on Persis-tence and Climatology.
3. SANBAR (Sanders and Burpee: 1968). A Filtered Barotropic Model.
4. EPANALOG (Jarrell, Mauck, and Renard: 1975). An Analog Model.
5. NMC MFM (Hovermale: 1975). A. Ten-Level Baroclinic Model.
In addition to the above models, Eastern Pacific Hurricane forecasters also make use of NMC analyses and prognoses.
III. VERIFICATION
Verification statistics for the 1979 season are shown in Table 1. The forecast displacement error is the vector d·ifference between the forecast displacement and the actual displacement computed from best-track positions. The initial position error is not subtracted from the forecast error and depression stages of the storm are not verified. Table 2 gives a breakdown of the verification statistics of the official forecasts for each of the named storms. A more detailed verification will be presented in future years.

IV. DATA SUMMARIES
A summary of 1979 eastern and central North Pacific tropical cyclone statistics is given in Table 3. Best track, initial positions, and initial position errors are given in Table 4. Tracks of eastern North Pacific tropical cyclones are shown in Figures 1 and 2. There were no tropical cyclones in the central North Pacific during 1979.
Three reconnaissance flights,.with a total of nine vortex penetrations, were made into eastern North Pacific tropical cyclone activity during the 1979 · season. All of the flights were made by the U. S. Air Force and all were into Hurricane ·Ignacio dff the central Mexican coast. Vortex data .are given in Table 5.
V. REFERENCES
Hovermale, J. B., 1975: First Season Storm Movement Characteristics of the NMC Objective Hurricane Forecast Model. Minutes of the NOAA Hurricane Warning Conference, National Hurricane Center, Coral Gables, Florida.
Jarrell, J. D., C. J. Mauck, and R. J. Renard, 1975: The Navy•s Analog Scheme for Forecasting Tropical Cyclone Motion Over the Northeastern Pacific Ocean. Technical Paper No. 6-75, Environmental Prediction Research Facility, Naval Postgraduate School, Monterey, California, 27pp.
Leftwich, P. W., and C. J. Neumann, 1977: Statistical Guidance on the Prediction of Eastern North Pacific Tropical Cyclone Motion. NOAA Techriical Memorandum NWS WR-125, National Oceanic and Atmospheric Administration, U. S. Dept. of Commerce, National Weather Service Western Region, 15pp.
Neumann, C. J., 1972: An Alternate to the HURRAN Tropical Cyclone Forecast System. NOAA Technical Memorandum NWS SR-62, National Oceanic and Atmospheric Administration, U. S. Dept. of Commerce, National Weather Service Southern Region, 24pp.
-- J. R. Hope, and B. r. ·Miller, 1972: A Statistical Method of Combining Synoptic and Empirical Cyclone Prediction Systems. NOAA Technical Memorandum NWS SR-63, National Oceanic and Atmospheric Administration, U. S. Dept. of Commerce, National Weather Service Southern Region 32pp.
--and M. B. Lawrence, 1973: Statistical-Dynamical Prediction of Tropical Cyclone Motion (NHC-73). NOAA Technical Memorandum NWS SR-69, National Oceanic and Atmospheric Administration, U. S. Dept. of Commerce, National Weather Service Southern Region, 34pp. ·
Sanders, F., and R. W. Burpee, 1968: Experiments in Barotropic Hurricane Track Forecasting. Journal of Applied Meteorology," Vol. 7, No. 3, pp. 313-323.
-2-

TABLE 1
VERIFICATION OF 1979 TROPICAL STORM AND HURRICANE FORECASTS.
METHOD
OFFICIAL
EPANALOG
EPHC-77
EPCLIPER
SAN BAR
FIGURES IN PARENTHESES ARE NUMBER OF CASES.
FORECAST 24 HR
101 ( 119)
95 (109)
94 ( 104)
96 ( 112)
104 (35)
DISPLACEMENT
-3-
48 HR
178 (62)
178 (74)
177 (71)
178 (77)
213 (23)
ERRORS (N.MI.) 72 HR
246 (33)
218 (46)
226 ( 43)
253 ( 47)
368 ( 14)

TABLE 2
VERIFICATION OF OFFICIAL FORECASTS FOR EACH NAMED STORM OF 1979. FIGURES IN PARENTHESES ARE NUMBER OF CASES.
STORM FORECAST DISPLACEMENT ERRORS (N.MI.)
24HR 48HR 72HR
ANDRES 150 206 ( 10) ( 2)
BLANCA 65 90 0 ( 12) (5) ( 1 )
CARLOS 209 (1)
DOLORES 81 211 361 ( 18) ( 12) (8)
ENRIQUE 69 146 199 '"~· . (21) ( 16) ( 12)
FEFA 116 215 357 (11) (6) (2)
GUILLERMO 179 214 203 ( 13) (5) ( 2)
HILDA 51 (3)
IGNACIO 103 184 213 (23) ( 16) (8)
JIMENA 65 (7)
-4-

TABLE 3
Summary of Eastern and Central North Pacific Tropical Cyclones, 1979
~l;i.XH!UM
SUSTAINED u.s. HII\DS DAt'iAGB
NO. NAME CLASS DATl:S (KTS) ($ HILL1CJN) DE.L.'T!:iS
1. ONE TD 31 :t-A.AY - 1 JUNE 25 • * 2. ANDRES H 31 MAY - 4 JUNE 85
3. BLANCA TS 21 - 25 JUNE 45
4. CARLOS TS 14 - 16 JULY 45
5. FIVE TD 16 JULY 30
6. DOLORES H 17 - 23 JULY 105
7. ENRH;!.UE H 17 - 24 AUGUST 125
8. FEFA H 21 - 25 AUGUST 100
9. NINE TD 4 SEPTEMBER 25 10. GUILLERMO H 8 - 13 SI.:PTE~1BER 65 11. HILDA TS 4 - 6 OCTOBER 40
12. IGNACIO H 23 - 30 OCTOBER 125
13. JH1ENA TS 15 - 18 NOVEMBER 55
• There were no reports of damage or deaths durinr; the 1979 easter!1 and central North Pacific tropical cycJone season.
-5-

TABLE 4
Eastern and Central North Pacific Tropical Storm and Hurricane beRt track, initial positions, and position errors for 1979.
Date/Time ( G!'·l'l')
Hurricane
5118 0100 •:)106
0112 01 '18 \),}()()
0~206 (· ') ... ,.\ ,)f.. I, ..
IY;'iQ '..-L ·l •
0 )~l(i cr~c6
03!? o·-~-~ ~ / ..... ()If{!()
()I 1-C( ()1+12
Tropical
21 u(;
2112 2118 2200 2206 2?12 C.\~1 g 2j0C 2506 231.2 2)18 t:'l+; )(} ?1+()6 ?h12 21+ 1 :~~ .?500 ~~ ')()h
2,.i12
Best Track Lat. Long.
Andres 31 ~\ay - 4 ,June
11.0 95.5 11.0 96.2 11.0 96.9 ~1.3 97.6 11.8 98.0 12.3 98.5 12.8 98.8 1).4 99.0 13.9 99.3 14.6 99.5 15.2 99.9 15.9 100.2 16.7 100.7 17.1 :01 • .5 17.5 102.3 '18.2 103.;~
Storm Blanca 21 - 25 June
9.5 102.7 9.3 10l>.,2 9.3 105.7 9 • .5 '10?.0 () c, ,._.. 103.1 9.6 109.1 9.7 110.1
10.0 '!11.1 10.2 112.0 10.3 113.3 10.7 1·: L;
04
11.2 115.6 11.3 1'16.9 A... f..-
~ I • J -; 1f:.z 11.8 11 ~~. 5 12.5 121.0 12.R 122.8 i5.3 12L+.9
-6-
() pe rat. i anal 1.-'osition
Lat. Lonr;.
11.0 95·5 11.0 97.5 11.5 9R.o 12.0 95.0 11.0 99.0 11.0 98.h 12.5 98.3 12.5 97.5 13.7 98 •. 3 1 It.() 9R.C) 14.:) 9~).0
15.5 99.0 16.4 '100.0 17.1 10 ... 5 17.6 102.4 18.0 10').0
!•lean vector Number of
9.5 102.? 9.5 104.5 9.6 105.8 9 c:
·~' 107.2 9.7 107.9 9.6 109.0 9.6 110.1 9.6 111.0 9.8 111.?
10.0 i 15.0 10.5 114 .? ·1o.8 11::,;.2 10.9 ..,.., .• C'
I •he.)
11.5 110.5 11.? 1 ~'"' ,.
:'}•..) 1-:J ~ it: • .? 121.,0 1·~.o 12 z..;:: 13.8 125. :;.
t':ean VP.ctor !JumbPr of
error cases
error CaSAS
.Posi.tion .t:rror
(N.Kl.)
o.o ?6.6 71.3
1 ~;,q._::;
7').9 78.2 34.4
10_5.0 L:q '' .) ... •.'
94 .~3 {.. r"'} ,~ ~-- f • ·.)
r•p ~ I,_;. I
itll • I
D.CJ 8.3
15e6
i)O.I+ 1().()
o.o ?.1 .4 18.9 "\·,. ,., It.:' • '-j
1 {.. ~~ 5.) , . h.U
24.? 2it.? ~ ... t:~ :t.. C ,.,.•e,..;
·16.8 53.C -:<2, ' ' .... • t.. 17.t1 ~5() .J o.o
~~6.)
33.0
.?0.1 .., :.:; r'-I.-~· ••• •

-7-

Table 4 (continued) Operational Position
Date/Time Best Track Position Error (GMT) Lat. Long. Lat. Long. (N.MI.)
Hurricane Enrique 17 - 24 August
1718 11.2 113.8 11.5 113.5 25.2 1800 11.2 114.9 11e7 114.5 38.1 1806 11.7 115.9 11.8 115.4 30.0 1812 12.2 116.9 11.8 116.5 33.6 1818 12.8 117.9 12.3 117.4 41.9 1900 12.8 119.0 12.7 118.8 13.2 1906 12.9 120.0 13.0 120.5 29.8 1912 13.0 121.0 13.1 121.5 29.8 1918 13.1 122.0 13.2 122 .. 2 13.1 2000 13.4 122.9 13.4 123.0 5.8 2006 13.8 123.8 13.6 123.6 16.7 2012 14.2 124.5 14.0 124.5 12.0 2018 14.6 125.0 14.2 125.0 24.0 2100 14.9 125•6 14.8 125.3 18.4 2106 15.4 126.0 15.2 125.5 31.3 2112 15.9 126.4 16.0 126.2 13.0 2117 16.4 126.7 16.2 126.7 12.0 2118 16.5 126.8 16.5 126.8 o.o 2200 17.0 127•5 17.0 127.5 o.o 2206 17.6 128.3 17.6 128.3 o.o 2212 18.2 129,;2 18.2 129.4 11.4 2218 18.9 129.9 19.0 130.0 8.3 2300 19.6 130.7 19.6 130.7 o.o 2306 20.1 131.3 19.9 131.4 13.3 2312 20.4 132,;0 20.8 132.6 41.4 2318 20.8 132.7 20.8 132.7 o.o 2400 21.1 133.5 21.1 133.4 5.6 2406 21.1 134.4 21.1 134.5 5.6 2412 21.2 135.1 21.0 135.5 25.4 2418 21.3 135.8 21.0 136.0 21.2
Mean vector error 17.3 Number of cases 30.0
Hurricane Fefa 21 - 25 August
2100 13.9 101,;8 13.8 101.3 29.7 2106 14.2 103.1 ·14.0 102.5 36.9 2112 14.8 104.5 14.7 104.5 6.0 2118 15.3 106.1 15.2 105.8 18.4 2200 15.6 108.0 15.7 107.8 13.0 2206 15.8 109.6 15.8 109.6 o.o 2212 16.2 111.0 15.9 111.0 18.0 2218 16.7 112.2 16.7 112.2 o.o 2300 16.9 114.0 16.9 114.0 o.o
-8-

Table 4 (continued) Operational Position
Date/Time Best Track Position Error (GMT) Lat. Long. Lat. Long. (N.MI.)
Hurricane Fefa continued.
, ~ 2306 17.5 115.8 17.5 115.8 o.o 2312 17.8 117.8 17.8 117.5 17.1 2318 17.8 119.8 17.8 119.5 17.1 2400 17.9 120.8 17.8 121.1 18.2 2406 18.0 121.4 17.9 124.0 148.5 2412 18.1 122.1 17.5 125.5 197.5 2418 18.2 122.7 18.2 122.7 o.o 2500 18.4 123.3 18.5 123.2 8.3
Mean vector error 31.1 Number of cases 17.0
Hurricane Guillermo 8 - 13 September
0818 16.0 101.0 15.5 99.4 97.1 0900 16.3 102.5 15.0 102.0 83.2 0906 16.8 103.9 15.6 103.0 88.7 0912 17.3 105.2 15.6 103.0 162.6 0918 17.8 106.2 17.0 107.0 66.3 1000 18.3 106.8 19.0 107.0 43.5 1006 18.9 107.4 20.3 110.3 184.2 1012 19.5 108.0 19.5 109.5 84.8 1018 20.1 108.9 20.0 109.0 8.2 1100 20.6 109.7 20.4 109.4 20.7 1106 20.8 109.9 20.7 110.1 12.7 1112 20.9 110.3 21.7 109.9 53.0 1118 21.1 110.5 21.4 110.6 18.8 1200 21.6 110.6 21.4 110.9 20.6 1206 21.6 110.6 21.4 111.2 35.6 1212 21.6 110.6 21.4 111.0 25.3 1218 21.6 110.6 21.5 110.5 8.2 1300 21.6 110.6 21.5 110.5 8.2 1306 21.6 110.6 21.5 110.5 8.2 1312 21.6 110.6 21.7 110.4 12.7
Hean vector error 52.1 Number of cases 20.0
Tropical Storm Hilda 4 - 6 October
0400 13.0 104.0 13.0 103.8 11.7 0406 13.2 105.3 12.9 104.7 39.4 0412 13.5 106.7 13.5 106.1 35.0
~~ ~ 0418 13.8 108.0 13.8 108.5 29.1 0500 14.2 109.2 14.2 109.2 o.o 0506 14.6 110.4 14.7 110.4 6.0
-9-

Table 4 (continued)
Operational Position Date/Time Best Track Position Error
(GMT) Lat. Long. Lat. Long. (N.MI.)
Tropical Storm Hilda continued.
0512 14.8 111.7 14.8 111.0 40.6 0518 15.0 112.9 15.0 111.8 63.8 0600 15.1 114.2 15.1 114.2 o.o 0606 15.3 115.3 15.1 115.1 16.7 0612 15.5 116.7 15.1 116.0 47.1 0618 15.8 118.0 15.'3 117.4 45.9
Mean vector error 27.9 Number of cases 12.0
Hurricane Ignacio 23 - 30 October
2318 11.7 95.3 11.7 95.3 o.o 2400 11.6 96.2 12.3 96.8 54.8 2406 11.6 97.1 12.6 97.5 64.1+ 2412 11~5 97-9 12.4 98.1 55.3 2418 11.5 98.8 11.5 98.8 o.o 2500 11.7 99.7 11.7 99.7 o.o 2506 11.9 100.5 11.7 100.1 26.4 2512 12.5 101.2 12.0 100.4 55.7 2518 13.0 102.0 12.5 101.5 41.9 2600 13.5 102.7 12.7 102.0 63.1 2606 14.2 103.2 13.6 102.7 46.3 2612 14.8 103.7 14.8 103.7 o.o 2618 15.3 104.3 15.3 104.3 o.o 2700 15.9 105.0 15.9 105.0 o.o 2706 16.4 105.7 16.3 105.7 6.0 2712 16.8 106.4 16.8 106.3 5.7 2718 17.0 107.3 17.0 107.3 o.o 2800 17.1 107.6 17.1 107.6 o.o 2806 17.0 108.0 17.0 108.0 o.o 2812 17.4 108.0 16.9 108.1 30.5 2818 17.7 108.1 17.7 108.0 5.7 2900 18.0 107.9 18.0 107.9 o.o 2906 18.0 107.3 17.9 107.9 34.8 2912 18.0 106.6 17.9 107.3 40.4 2918 18.1 105.8 18.0 106.0 12.9 3000 18.1 105.0 18.1 105.2 11.4 3006 18.0 103.8 17.8 104.3 31.0 3012 18.0 102.3 18.0 102.5 11.4
Hean vector error 21.3 Number of cases 28.0
-10-

Table 4 (continued)
Operational ·Position Date/Time Best Track Position Error
(GHT) Lat. Long. Lat. Long. (N.MI.)
Tropical Storm Jimena 15 - 18 November
1506 8.5 88.0 8.5 B8.o o.o 1512 8.5 89.0 8.5 R8.5 29.7 1518 8.5 90.0 8.5 88.9 65 .. 3
.,~ : 1521 8.5 90.5 8.5 91.0 14.8 1600 8.5 91.0 8.5 91.0 o.o 1606 8.7 92.0 8.7 92.0 o.o 1612 9.0 93.0 9.0 93.0 o.o 1618 9.4 94.1 9.4 94.1 o.o 1700 10.2 94.8 10.2 94.8 o.o 1706 '10.8 95.7 10.9 95.5 13 .. 2 1712 10.9 96.7 11.2 96.3 29.6 1718 10.9 97.8' 11.0 97.8 6.0 1800 10.8 98.7 10.8 98.6 5.9 1806 10.8 99.6 10.8 99.8 11.8
Mean vector error 12.6 Humber of cases 14.0
-11-
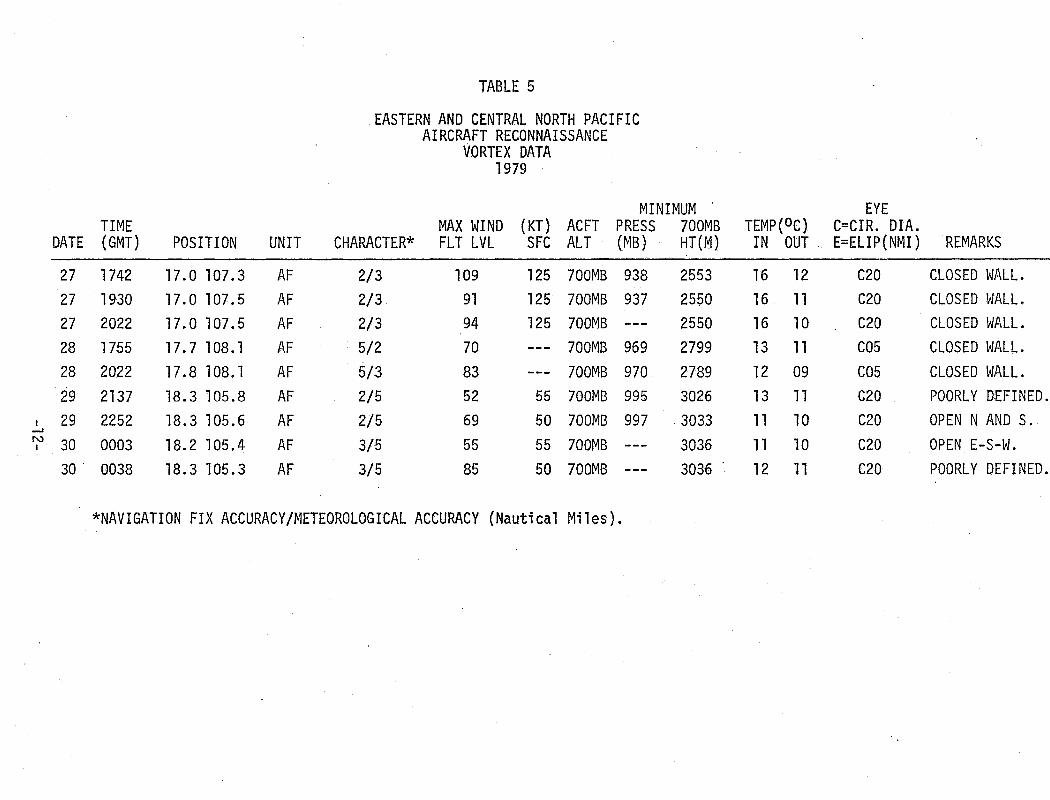
TABLE 5
EASTERN AND CENTRAL NORTH PACIFIC AIRCRAFT RECONNAISSANCE
VORTEX DATA 1979
MINIMUM . EYE TIME MAX WIND (KT) ACFT PRESS 700MB TEMP(°C) C=CIR. DIA.
DATE (GMT) POSITION UNIT CHARACTER* FLT LVL SFC ALT {MB) HT(M) IN OUT E=ELIP(NMI) REMARKS
27 1742 17.0 107.3 AF 2/3 109 125 700MB 938 2553 16 12 C20 CLOSED WALL. 27 1930 17.0 107.5 AF 2/3 91 125 700MB 937 2550 16 11 C20 CLOSED WALL. 27 2022 17.0 107.5 AF 2/3 94 125 700MB --- 2550 16 10 C20 CLOSED WALL. 28 1755 17.7 108.1 AF 5/2 70 --- 700MB 969 2799 13 11 C05 CLOSED WALL. 28 2022 17.8 108.1 AF 5/3 83 --- 700MB 970 2789 12 09 C05 CLOSED WALL. 29 2137 18.3 105.8 AF 2/5 52 55 700MB 995 3026 13 11 C20 POORLY DEFINED.
I 29 2252 18.3 105.6 AF 2/5 69 50 700MB 997 '3033 11 10 C20 OPEN N AND S. _, N 30 0003 18.2 105.4 AF 3/5 55 55 700MB 3036 11 10 C20 OPEN E-S-W. I ---
30 ' 0038 18. 3 105. 3 AF 3/5 85 50 700MB --- 3036 . 12 11 C20 POORLY DEFINED.
*NAVIGATION FIX ACCURACY/METEOROLOGICAL ACCURACY (Nautical Miles).

.... .-~
I
·J' I
I .r
I -I
* + -· t
i· I I I
I.
J
! T 24
.... ~, :\:-23'.
(). ... \
'. " '-
0 - r r o·' t \l ..... S'(" :?: ·~~~~J ·g~:. 0., . . o••! i :?..~ / ' '§, i •·• 'J'''"P,o :?~ '&'/
""- ·'-•< _,;-- ._ ]l : ·J·,· J ' ~':~~-;~l~;-}: 1 '':.t:~.t ' "' .,_ ·. ./ •. ' I • ,. I ' ' '· I . /._" j';- \, ,, .. , . "'\ ··~··: '~>&~:::. 'o'·s_l~~ 'o' I 0 "• ,:; 0 '-; '0 • ' ; Oo i' !, •• 0 *'~i~ ~, ... , .... ,,~.-""'
.. ' k.-.,~_ .. I J "- .. " • ,, .z ! l lJ, 'If.
.. \.. 't.. >--~- " . . ' . .. ... _,. w ' -.:-g. I s .. \. •' ' ·' '\. ,_., l' ,., . -
\ 1-, ' " 1\ , "'- ""' ' • .. C VA·. ' ; '" •• , . " ~ ..... ~ . '1,- ' l . ~ .,-·· ..... , ~''M"., .. u•-•- 1 •-t, .. ""t '0. ' • • • ® ·-""'" . " "'"" 1 '\..j_·· +-l'i h. ~·" '\<. \ I ~ "'-•'~ • ·-·' '.] > \ ' . ' '~"" ,._,.,, -... ,, . ~ . • , L ' C ' ••~"-"'" . -•--•·•- • • I ;, ~ \-- "- .. ~ '" "'"" ,,. " ~' . - . . I . . .
' . - ~- ·- "
y ..
, \.~ ~ 6 ' '•· -·"'., .. "-""' . -:-.~--·~· .. .v • , ' ·.. , "" - - , ~ __ ,,"' ;, "- .... , I ,y-"'--:-·· . • . . r
, \ . .. -" . , ····- ··-- . tcs-:; . - f.-~ i'_ ~1 '"-. IJ.o ' · " 'V oo~ •• '"'~ -' • ·, . · j ''-''-, ~-''""- "'"JJ \•
0 ""'"-~-= ·~·-· "'" oO~ ~~l j 1.~" I \ "\' ' ............ ··= ,_ '"" -~ ' .. ' . --- ' . ; ' - - -- -:::.,_ '"" I .. .. I'! ! , . . . ··~·... .ff.:· ~-~ ' • ' - ,, \ • --- / • ~ 'i . i ·~ I ---- D - 0 ' .,. '·· -·· ~ -- _,..,. • / ' ·' t ·, 5, - . -·· • •. ·----. - - ' ·, ~· l '*~' . • .. ,. .. •J . i -.
'"''"m'1J'_ _ _ · 1s· -,.',:a.~' • ' ' '•-,- ·, ~ -·- <'~;-"" - ;. ·--
\22 ... ~ ...... <) ___
. ·-'-~ .. L ". -~..2 21
........... -~---v ' - ..,.._ ·'· 7 •. - -1· I . ' '":4: --, - ~ -- -- ., ;~ - . - . ;-
., \..:_.. •. ~ - ' " ·k· ~ .,. ·' - '' \ ~ ~.. ;?, /L.....,Ji('" ~ ·. -',, '--' ·< , .- ' . ~· -!\ ,-~ -·-. ' [:' . . ' ,
\• : ~- ! . - . - -
. '\ i I ~ 1 . \ .. ~ 2.L•.~ . . . . I - . . 20 j 0.,
;,. ' .' . ' '1' • ~0 ~ 19 . 19 -~· ......... :·~--::-"...._ - -, ..
25';... '-..__ 18 ~- '-, w _......... -I ·-------~'<,: ..... ·7 --~-:: ·· ...... 6
t 24'..____. __ ....2~<-~·~~3~ .............. : ... 3
FIGURE
"· -- --.... _ ,._ --- . •. _ r"' .. . , _.,.._ .... _ _ . •-----o-- ' . ' . •o,_ /- C·, '~ - ~*-'v, ',,f
~-
' t 1.. . .'1. ,,

l" --
1
. r
L
---~·r-~--~-l·w~~-~T··· ~ --~~.o~ .. :::--.t~:~-~--·":r;· .. -~!~-~. ... T,-~-~·w ·-r--~-~~*· .~-- ..... w··r··.s; 7[-~~To·~a:\J1:-.--c.~.\'l· -·~~-.. f ~---,__~·-1 ·~~;!.~"·~On "~ 01 £ ~ ~, '0' r 'i.-~--.:;.~- : ( .. ! • UOI - .... \ • ,'J!.c:" "0 • "--... :?: ·~· >_.-JOO
j ·"""· · o " o;;o r o ·· 1 o ... 0, ... o .. .~ o .. ... 0 I f 0 -:;;·""~: ( "' " '8 ~ ' ... 0 \ ' 0 l. ':'\ ' -. ] l ~ ~'---~L -!:__ _>: "1:~ ,. i· ~:~ .• t,;·-:-( -- ... ~· ··-·" 'fr g; . \ ;J/ I i . \ . -~~· . L~~' i :;:__; ' ' , ' ~ ; ' \ . I: 'i . ' -l· . I'
t _l __ l +
.~
.... - ;'j o-,.. '"" ... _ ~'" '-, •., 0\ ,'l, 1 i '0 CYCLONE KEY - '" Jf, ;\ -
.l. • ~" ~ \._g. t m ® HURRICANE FEFA 21 - 25' AUGUST ~- ';lf. m "'~::. j ' 1 ., .. , ~ - ®TROPICAL DEPRESSION NINE 4 SEPTEIJ.BER ~t . . . j l ~ 11- S, _ @HURRICANE GUILLERI/0 8- 13 SEPTE!IBER _- -~ }_ ~t• L___' _j_ •----- --·--- -- - ~· i '----~-~ @
1121 TROPICALSTORMHILDA 4-60CTOBER --·---+-----4--w '--+---~.,*-~,_~j?. .~ io
; 1 l ' ~ ~?,eo.. @ HURRICANF IGN~CIO 23 - 30 OCTOBER · "8 £··'0' ~ t 1 r ""'i\ · -3, @TROPICAL STORIA JIMENA 15'. 18 ''ClVE!.'BER C . i!,.. ••
+ f. ~ :" f ~~~g~!riDATED) -;-0
I' ,"b
-t I t 12-13 - - ---TROPICAL STORI! STAGE - ' "' 0 • " t \ -.............. _,~ ·-··· •.• • ·~~.~ ? .fl.~ 8: HURRICANE STAGE ~-t-r-• ""'' .c_ t ~~
I 5 j' -~~ <k' '8' & I \. -.;§;. 9. 1 "' " ___ j_~----------..---------;.-~~-+--- ~~--- ·-~----- - ~_]_ :.. .... ; >'---+~- • .:..~- ---J-----.3·9.- --"0:- ' ~- "' t-- i
I 1 i i ~ '• h _& a: 1 -~ '8 1. I ; , 't t f r ~ .. -._ '-•hh"' oO<OOm"""'t ~-~~~-r~:;, 8,··~~. .. :~~ -~.:A!~- • II: t ~ ·r ·~ ,t. ... 8 '-.· I·~ ·!'[ . :~-~ 3 ~ t 11 + .:--- -. 9 ~ n. - .• "'· j I ~ , . +
t, --............_ ; ~ ·······o... ~~·s ,~3• ·, , I ,... 1 r -....__ 22 ..... @o ... ..- 1:,,.----J- · • +
! .............. 6 - -o- --...... ·· . .,_. L' I ,.. ~
,_i ___ , ___ ,~------ ·•---- -"f"o-=•-=-=-.:.~.5- -··-- -1-.~~--;;·--; ···.,rn\~:r-'"-:e, /..=---~;;-· I + I 'Ck........ , -z···!G'® - ~ ~ ,/ = ·--.. ... ,.../""-· 1 ......... ; 4~ . ··~ t.... I . f"-0\!j; ..........
t t t '!~-- .... - .. ~~·-@ i t ....... o. ! T ·--~~------',17 I . -•o--+---+-1-------.----- -- ......----1--..... - --··- -+--...!..__'.:::::_ .,._ ·-·---------r . -----·. ________ , ___ .,:!J""\", ______ ---
...... _._ 16 - -~
- -<:-·:· .. ·•····: .:g
I
t ____ ,_ ! ... ---l
'
FIGURE 2 ----......~--. _..___
\v ~.,....____

f.' •-\;
NOAA Technica.l Memoranda NWSWR: (Continued) .•. 92 Smoke Management In the Wlllamette Valley. Earl M. Bates, May 1974. · (COM-74-11277/AS) 93 An Operational Evaluation of 500-mb Type Regression Equations. Alexander E. MacDonald, June 1974. CCOM-74-11407/ASl 94 Conditional Probability of VIsibility Less than One-Half Mile In Radiation Fog at Fresno, Cal lfornla. John D. Thomas,
August 1974. (COM-74-1 1555/AS) 96 Map ~ype Precipitation Probabilities for the Western Region. Glenn E. Rasch and Alexander E. MacDonald, February 1975.
( COM-75-1 0428/ AS l . . . . 97 Eastern Pacific Cut-off Low of April 21-28, 1974. WI I I lam J. Alder and George R. Miller, January 1976. (PB-250-71 1/ASl 98 Study on a Significant Precipitation Episode In Western United States. Ira S. Brenner, Aprl I 1976. (COM-75-10719/ASl 99 A Study of Flash Flood Susceptibility--A Bas.ln In Southern Arizona. Gerald Williams, August 1975. (COM-75-11360/ASl
102 A Set of Rules for Forecasting Temperatures In Napa·and Sonoma. Counties. Wesley L. Tuft, October 1975. <PB-246-902/ASl 103 Application of the National Weather Service Flash-Flood Program In the Western Region. Gerald Williams, January 1976.
CPG-253-053/AS) 104 Objective· Aids for Forecasting Minimum Temperatures at Reno, Nevada, During the Summer Months. Christopher. D. HI I I,
January 1976. (PB-252-866/ASl 105 Forecasting the Mono Wind. Charles P. Ruscha, Jr., February .J976, <PB-254-650) ~ 106 Use of MOS Forecast Parameters In Temperature Forecasting. John c. Plankinton, Jr .. , March 1976. CPB-254-649) I 07 Map Types as A Ids In UsIng MOS PoPs In Western UnIted States, Ira S, Brenner, August 1976. ( PB-259-594) 108 Other Kinds of Wind Shear. ·christopher D. HII I, August 1976. <PB-260-437/ASl 109 Forecasting North Winds In the Upper Sacramento Valley and Adjoining Forests. Chi"lstopher E. Fontana, Sept. 1'976.
CPB-273-677/AS) 110 Cool Inflow as a Weakening Influence on· Eastern Pacific .Tropical Cyclones. Will Jam J. Denney, November 1976.
(PB-264-655/ASl I 12 The MAN/MOS Program. Alexander E. MacDonald, February 1977. (PB-265-941/AS) I 13 Winter Season Minimum Temperature Formula for Bakersfield, California, Using Multiple Regression. Michael J. Oard,
February 1977. ( PB-273-694/AS l I 14 Tropical Cyclone Kathleen. James R. Fors, February 1977. (PB-273-676/ASl . I 16 A Study of Wind Gusts on Lake Mead. Bradley Colman, April 1977. <PB-268-847) I 17 The Relative Frequency of Cumulonimbus Clouds at the Nevada Test Site as a Function of K-value. R. F. Quiring,
April 1977. (PB-272-831) I 18 Moisture Distribution Modification by Upward Vertical Motion. Ira S. Brenner, Apr! I 1977. CPB-268-740) 119 Relative Frequency o.f Occurrence of Warm Season Echo Activity as a Function of Stab II ity Indices Comp.uted from the
Yucca Flat, Nevada, Rawinsonde. Darryl Randerson, June 1977. CPB-271-290/AS) 121 Climatological Prediction of Cumulonimbus Clouds In the VIcinity of the Yucca Flat Weather Station. R. F. Quiring,
June 1977. CPB-271-704/ASl 122 A Method for Transforming Temperature Distribution to Normality •. MorrisS. Webb, Jr., June 1977. (PB-271-742/ASl 124 Statistical Guidance for Prediction of Eastern North Pacific Tropical Cyclone Motion - Part 1. Charles J. Neumann
and Preston W. Leftwich, August 1977. CPB-272-661) 125 Statistical Guidance on the Prediction of Eastern North Pacific Tropical Cyclone Motion- Part I 1. Preston W. Leftwich
and Charles J. Neumann, August 1977. CPB-273-155/ASl · . , 127 Development of a Probability Equation for Winter-Type Preclpltatfon Patterns In Great 'Falls, Montana. Kenneth B.
Miel.ke, February 1978, (PB-281-387/ASl 128 Hand Calculator Program to Compute Parcel Thermal Dynamics, Dan Gu~ge·J, April 1978. CPB-283-080/AS) 129 Fire Whirls. David W. Goens, May 1978. (PB-283-866/ASl 130 Flash-Flood Procedure. 'Ralph C. Hatch and Gerald Wi l·lla!lls, May 1978. · (PB-286-014/AS) 131. Automated Fire-Weather Forecasts. Mark A. Mollner and David E. Olsen, September 1978. CPB-289-916/AS) 132 Estimates of the Effects of Terrain Blocking on the Los Angeles WSR-74C Weather Radar. R. G. Pappas, R.· Y. Lee, and
B. W. Finke, October 1978. CPB289767/ASl 133 Spectral Techniques in Ocean Wave Forecasting. John A. Jannuzzi, October 1978. (PB291317/ASl. 134 Solar Radiation. John A. Jannuzzl, November 1978. (PB291 195/ASl 135 Appl !cation of a Spectrum Analyzer In Forecasting Ocean Swell in Southern Caf.ifornla Coastal Waters. Lawrence P.
Kierulff, January 1979. (PB292716/ASl 136 Basic Hydrologic Principles. Thomas L. Dietrich, January 1979. (PB292247/ASl 137 LFM 24-Hour Prediction of Eastern Pacific Cyclones Refined by Sate II ite Images. John R. Zimmerman and Charles P.
Ruscha, Jr., January 1979. CPB294324/ASl 138 A Simple Analysis/Diagnosis System for Real Time Evaluation of Vertical Motion. Scott Heflick and James R. Fors,
February 1979. (PB294216/ASl 139 Aids for Forecasting Minimum Temperature In the Wenatchee Frost District. RobertS. Robinson, Apri I 1979.CPB298339/ASl 140 Influence of Cloudiness on Summertime Temperatures ·Jn the Eastern Washington Fire Weather District. James Holcomb,
Apri I 1979. (PB298674/AS) 141 Comparison of LFM and MFM Precipitation Guidance for Nevada During Doreen. Christopher HI I J, Apri I 1979.(PB298613/ASl 142 The Usefulness of Data from Mountaintop Fire Lookout Stations In Determining Atmospheric Stab! I ity. Jonathan W. Corey,
·Apri I 1979. CPB298899/ASl 143 The Depth of the Marine Layer at San Diego as Related to Subsequent Cool Season Precipitation Episodes in Arizona.
Ira S. Brenner, May 1979. (PB298817/ASl 144 Arizona Cool Season Climatological Surface Wind and Pressure Gradient Study. Ira S. Brenner, May 1979. (PB298900/AS) 145 On the Use of Solar Radiation and Temperature Models to Estimate the Snap Bean Maturity Date in the \vi llamette Valley.
Earl M. Bates, August 1979 146 The BART Experiment. Morris S. Webb, October 1979, 147 Occurrence and Distribution of Flash Floods In the Western Region. Thomas .L. Dietrich December 1979. 148 A Real-Time Radar Interface for AFOS, Mark Mathewson,. January 1980, ' 149 Misinterpretations of Precipitation Probabll ity Forecas-ts. Allan H. Murphy, Sarah Lichtenstein, Baruch Fischhoff, and
Robert L. Winkler, February 1980. ·
/
