annual financial statements - make change happen reports/dbsa... · reliability of the annual...
TRANSCRIPT

Proof 6 August 29, 2017 9:43 AM (Elrise)
2017ANNUAL FINANCIALSTATEMENTS
COMMITTED TO DEVELOPING ECONOMIC AND SOCIAL INFRASTRUCTURE IN SOUTH AFRICA AND THE REST OF AFRICA
DRIVING INVESTMENT IN INFRASTRUCTURE

HOUSING
ICT
EDUCATION
WATER
ENERGY

Development Bank of Southern Africa2017 Annual Financial Statements
1
OUR INDUSTRY SECTORS
TRANSPORT
HEALTH
WWW.DBSA.ORG
The reports and statements set out below comprise the Annual Financial Statements presented to the shareholder:
CONTENTS
01
02
03
04
Reports
Directors’ responsibility for financial reporting 2
Independent auditor's report 3
Directors’ report 7
Statements
Statement of financial position as at 31 March 2017 11
Statement of comprehensive income for the year ended 31 March 2017
12
Statement of other comprehensive income for the year ended 31 March 2017
13
Statement of changes in equity for the year ended 31 March 2017
14
Statement of cash flows for the year ended 31 March 2017 15
Notes to the Annual Financial Statements
Accounting policies 16
Notes to the Annual Financial Statements 29
Reference information
Abbreviations and acronyms 69
Financial definitions 71
General information 71
OUR REPORTING SUITE FOR 2017 CONSISTS OF THREE REPORTS
COMMITTED TO DEVELOPING ECONOMIC AND SOCIAL INFRASTRUCTURE IN SOUTH AFRICA AND THE REST OF AFRICA
2017 INTEGRATED ANNUAL REPORT
DRIVING INVESTMENT IN INFRASTRUCTURE
THE 2017 INTEGRATED ANNUAL REPORT, WHICH IS OUR PRIMARY COMMUNICATION WITH OUR STAKEHOLDERS.
2017ANNUAL FINANCIALSTATEMENTS
COMMITTED TO DEVELOPING ECONOMIC AND SOCIAL INFRASTRUCTURE IN SOUTH AFRICA AND THE REST OF AFRICA
DRIVING INVESTMENT IN INFRASTRUCTURE
THESE 2017 ANNUAL FINANCIAL STATEMENTS, WHICH INCLUDE THE DIRECTORS’ REPORT AND THE INDEPENDENT AUDITOR’S REPORT.
2017 SUSTAINABLEDEVELOPMENT REPORT
DRIVING INVESTMENT IN INFRASTRUCTURE
COMMITTED TO DEVELOPING ECONOMIC AND SOCIAL INFRASTRUCTURE IN SOUTH AFRICA AND THE REST OF AFRICA
THE 2017 SUSTAINABILITY REVIEW, WHICH PROVIDES FURTHER INFORMATION ON OUR SUSTAINABILITY PERFORMANCE.

01 REPORTS
The directors are responsible for the preparation, integrity and objectivity of Annual Financial Statements that fairly present the state of affairs of the Bank.
In preparing the Annual Financial Statements:• The Development Bank of Southern Africa Act, No 13 of 1997 (Amended Act No 41 of 2014) has been adhered to;• The Public Finance Management Act, No 1 of 1999 (PFMA) has been adhered to;• International Financial Reporting Standards have been adhered to; and• Sections 27 to 31 of the Companies Act of South Africa, No 71 of 2008 being the relevant and corresponding sections of those specified in
the Development Bank of Southern Africa Act, have been adhered to.
To enable the directors to meet their financial reporting responsibilities:• Management designed and implemented standards and systems of internal control to provide reasonable assurance as to the integrity and
reliability of the Annual Financial Statements and to safeguard, verify and maintain the accountability of the Bank’s assets;• Appropriate accounting policies, supported by reasonable and prudent judgements and estimates, are applied on a consistent and going-
concern basis; and• The Audit and Risk Committee as well as the internal auditors review the financial and internal control systems, accounting policies, reporting
and disclosure.
Based on the information received from management and internal and external auditors, nothing has come to the attention of the directors to indicate a material breakdown in the systems of internal control during the year under review.
The directors have a reasonable expectation that the Bank has adequate resources to operate in the foreseeable future and have adopted the going-concern basis in preparing the Annual Financial Statements.
The Annual Financial Statements that appear on pages 11 to 68 were approved by the Board of Directors on 22 June 2017 and signed on its behalf by:
Phillip Jabulani Moleketi Patrick Khulekani Dlamini Gugu MtetwaChairman of the Board Chief Executive Officer Chairperson of the Audit and Risk Committee
DIRECTORS’ RESPONSIBILITY FOR FINANCIAL REPORTING FOR THE YEAR ENDED 31 MARCH 2017
Development Bank of Southern Africa2017 Annual Financial Statements
3
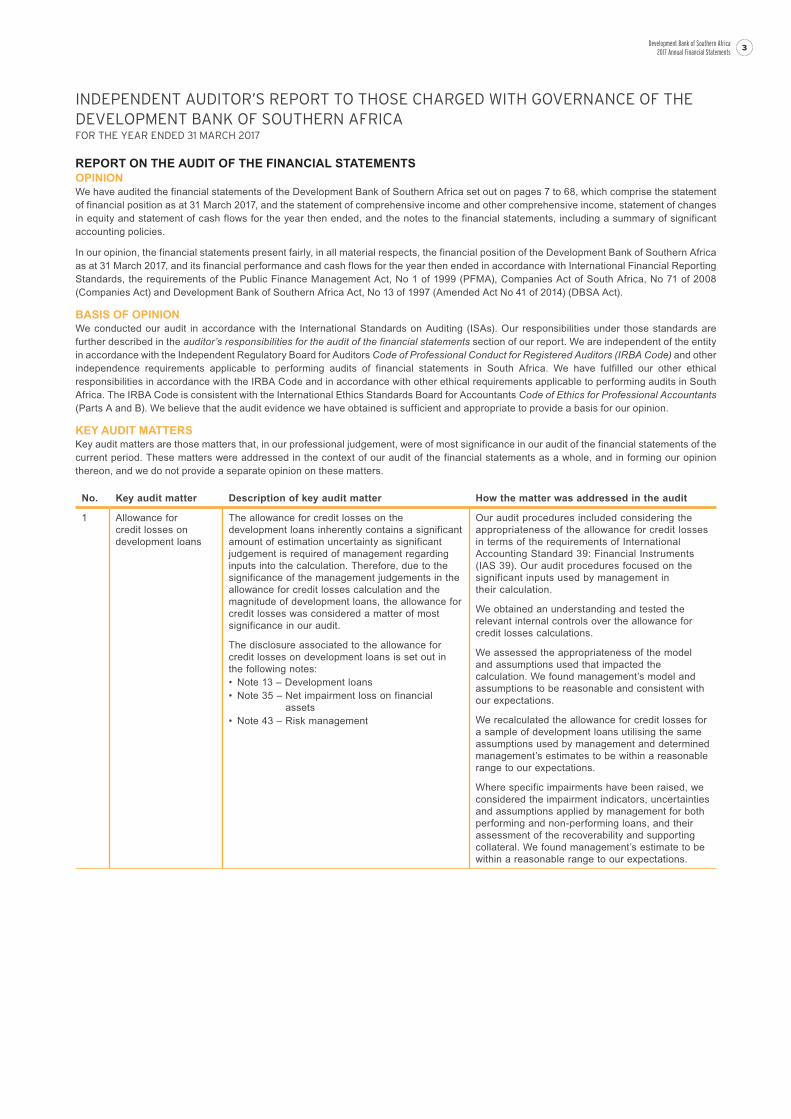
REPORT ON THE AUDIT OF THE FINANCIAL STATEMENTSOPINIONWe have audited the financial statements of the Development Bank of Southern Africa set out on pages 7 to 68, which comprise the statement of financial position as at 31 March 2017, and the statement of comprehensive income and other comprehensive income, statement of changes in equity and statement of cash flows for the year then ended, and the notes to the financial statements, including a summary of significant accounting policies.
In our opinion, the financial statements present fairly, in all material respects, the financial position of the Development Bank of Southern Africa as at 31 March 2017, and its financial performance and cash flows for the year then ended in accordance with International Financial Reporting Standards, the requirements of the Public Finance Management Act, No 1 of 1999 (PFMA), Companies Act of South Africa, No 71 of 2008 (Companies Act) and Development Bank of Southern Africa Act, No 13 of 1997 (Amended Act No 41 of 2014) (DBSA Act).
BASIS OF OPINIONWe conducted our audit in accordance with the International Standards on Auditing (ISAs). Our responsibilities under those standards are further described in the auditor’s responsibilities for the audit of the financial statements section of our report. We are independent of the entity in accordance with the Independent Regulatory Board for Auditors Code of Professional Conduct for Registered Auditors (IRBA Code) and other independence requirements applicable to performing audits of financial statements in South Africa. We have fulfilled our other ethical responsibilities in accordance with the IRBA Code and in accordance with other ethical requirements applicable to performing audits in South Africa. The IRBA Code is consistent with the International Ethics Standards Board for Accountants Code of Ethics for Professional Accountants (Parts A and B). We believe that the audit evidence we have obtained is sufficient and appropriate to provide a basis for our opinion.
KEY AUDIT MATTERSKey audit matters are those matters that, in our professional judgement, were of most significance in our audit of the financial statements of the current period. These matters were addressed in the context of our audit of the financial statements as a whole, and in forming our opinion thereon, and we do not provide a separate opinion on these matters.
No. Key audit matter Description of key audit matter How the matter was addressed in the audit
1 Allowance for credit losses on development loans
The allowance for credit losses on the development loans inherently contains a significant amount of estimation uncertainty as significant judgement is required of management regarding inputs into the calculation. Therefore, due to the significance of the management judgements in the allowance for credit losses calculation and the magnitude of development loans, the allowance for credit losses was considered a matter of most significance in our audit.
The disclosure associated to the allowance for credit losses on development loans is set out in the following notes: • Note 13 – Development loans • Note 35 – Net impairment loss on financial
assets • Note 43 – Risk management
Our audit procedures included considering the appropriateness of the allowance for credit losses in terms of the requirements of International Accounting Standard 39: Financial Instruments (IAS 39). Our audit procedures focused on the significant inputs used by management in their calculation.
We obtained an understanding and tested the relevant internal controls over the allowance for credit losses calculations.
We assessed the appropriateness of the model and assumptions used that impacted the calculation. We found management’s model and assumptions to be reasonable and consistent with our expectations.
We recalculated the allowance for credit losses for a sample of development loans utilising the same assumptions used by management and determined management’s estimates to be within a reasonable range to our expectations.
Where specific impairments have been raised, we considered the impairment indicators, uncertainties and assumptions applied by management for both performing and non-performing loans, and their assessment of the recoverability and supporting collateral. We found management’s estimate to be within a reasonable range to our expectations.
INDEPENDENT AUDITOR’S REPORT TO THOSE CHARGED WITH GOVERNANCE OF THE DEVELOPMENT BANK OF SOUTHERN AFRICA FOR THE YEAR ENDED 31 MARCH 2017

01 REPORTS
No. Key audit matter Description of key audit matter How the matter was addressed in the audit
2 Valuation of complex financial instruments at fair value
The valuation of complex instruments at fair value, such as investment securities, equity investments (both listed equities and unlisted private equity funds), debt securities and derivatives, require judgement and estimation to determine the appropriate value. Judgement is required to determine the appropriate valuation techniques and to source the relevant and reliable input. Therefore, due to the significant management judgements applied, the valuation of complex instruments at fair value is considered a matter of significance in our audit.
The disclosure associated to the complex instruments is set out in the following notes:• Note 7 – Investment securities• Note 8 – Derivative assets and liabilities held
for risk management• Note 10 – Equity Investments• Note 11 – Fair value hierarchy disclosures• Note 19 – Debt securities
Our audit procedures included considering the appropriateness of the valuation techniques utilised in terms of the requirements of International Accounting Standard 39: Financial Instruments (IAS 39).
We assessed the appropriateness of the valuation model with reference to approaches commonly used. We also assessed the judgements and estimates applied by management against our understanding of current market practice and conditions. We also obtained independently sourced inputs where they were available. We found management’s valuation to be within a reasonable range to our expectation.
Where valuation inputs are unobservable, we used our valuation expertise to assess the reasonability of the valuation inputs based on supportable and comparable information and conducted a comparison of these to management's valuation inputs. We accepted management's valuation inputs to be within a reasonable range to our expectations.
3 Valuation of financial instruments at amortised cost
The valuation of financial instruments held at amortised cost, such as development loans, development bonds, debt securities and lines of credit, is significant in the audit. Therefore, due to the magnitude of the financial instruments held at amortised cost, the valuation thereof was considered a matter of significance in our audit.
The disclosure associated to the complex instruments is set out in the following notes:• Note 12 – Development bonds• Note 13 – Development loans• Note 19 – Debt securities• Note 20 – Lines of credit
Our audit procedures included considering the appropriateness of the subsequent measurement basis utilised is in terms of the requirements of International Accounting Standard 39: Financial Instruments (IAS 39).
We assessed contracts entered into for the financial instruments to confirm the appropriate accounting thereof.
Interest was recalculated on a sample basis using the effective interested rate. A sample of disbursements and repayments were confirmed to supporting documents and considered for appropriate accounting.
Majority of the financial instruments were confirmed with third parties at year-end.
Based on the work performed, we consider valuation of financial instruments at amortised cost appropriate.
OTHER INFORMATIONThe accounting authority is responsible for the other information. The other information comprises the information included in the published Annual Financial Statements which includes the Director’s Report as required by section 27 to 31 of the Companies Act of South Africa, No 71 of 2008 (Companies Act), being the relevant and corresponding sections of those specified in the Development Bank of Southern Africa Act, No 13 of 1997 (Amended Act No 41 of 2014) and the Audit and Risk Committee’s Report. The other information does not include the financial statements, the auditor’s report thereon and those selected objectives presented in the annual performance report that have been specifically reported on in the auditor’s report.
Our opinion on the financial statements and findings on the reported performance information and compliance with legislation do not cover the other information and we do not express an audit opinion or any form of assurance conclusion thereon.
In connection with our audit, our responsibility is to read the other information and, in doing so, consider whether the other information is materially inconsistent with the financial statements and the selected objectives presented in the annual performance report, or our knowledge obtained in the audit, or otherwise appears to be materially misstated. If, based on the work we have performed on the other information obtained prior to the date of this auditor’s report, we conclude that there is a material misstatement of this other information, we are required to report that fact. We have nothing to report in this regard.
RESPONSIBILITIES OF ACCOUNTING AUTHORITY FOR THE FINANCIAL STATEMENTS The accounting authority is responsible for the preparation and fair presentation of the financial statements in accordance with International Financial Reporting Standards, the requirements of the Public Finance Management Act, No 1 of 1999, sections 27 to 31 of the Companies Act, being the relevant and corresponding sections of those specified in the Development Bank of Southern Africa Act (DBSA Act), No 13 of 1997 (Amended Act No 41 of 2014) and for such internal control as the accounting authority determines is necessary to enable the preparation of financial statements that are free from material misstatement, whether due to fraud or error.
INDEPENDENT AUDITOR’S REPORT TO THOSE CHARGED WITH GOVERNANCE OF THE DEVELOPMENT BANK OF SOUTHERN AFRICA CONTINUED FOR THE YEAR ENDED 31 MARCH 2017

Development Bank of Southern Africa2017 Annual Financial Statements
5
In preparing the financial statements, the accounting authority is responsible for assessing the entity’s ability to continue as a going concern, disclosing, as applicable, matters related to going concern and using the going concern basis of accounting unless the accounting authority either intends to liquidate the entity or to cease operations, or has no realistic alternative but to do so.
AUDITOR’S RESPONSIBILITIES FOR THE AUDIT OF THE FINANCIAL STATEMENTSOur objectives are to obtain reasonable assurance about whether the financial statements as a whole are free from material misstatement, whether due to fraud or error, and to issue an auditor’s report that includes our opinion. Reasonable assurance is a high level of assurance, but is not a guarantee that an audit conducted in accordance with the International Standards on Auditing will always detect a material misstatement when it exists. Misstatements can arise from fraud or error and are considered material if, individually or in the aggregate, they could reasonably be expected to influence the economic decisions of users taken on the basis of these financial statements.
As part of an audit in accordance with the International Standards on Auditing, we exercise professional judgement and maintain professional scepticism throughout our audit of the financial statements, and the procedures performed on reported performance information for selected objectives and on the Development Bank of Southern Africa’s compliance with respect to the selected subject matters.
In addition to our responsibility for the audit of the financial statements as described in the auditor’s report, we also: • Identify and assess the risks of material misstatement of the financial statements, whether due to fraud or error, design and perform audit
procedures responsive to those risks, and obtain audit evidence that is sufficient and appropriate to provide a basis for our opinion. The risk of not detecting a material misstatement resulting from fraud is higher than for one resulting from error, as fraud may involve collusion, forgery, intentional omissions, misrepresentations, or the override of internal control.
• Obtain an understanding of internal control relevant to the audit to design audit procedures that are appropriate in the circumstances, but not for the purpose of expressing an opinion on the effectiveness of the entity’s internal control.
• Evaluate the appropriateness of accounting policies used and the reasonableness of accounting estimates and related disclosures made by the accounting authority.
• Conclude on the appropriateness of the accounting authority’s use of the going concern basis of accounting and based on the audit evidence obtained, whether a material uncertainty exists related to events or conditions that may cast significant doubt on Development Bank of Southern Africa’s ability to continue as a going concern. If we conclude that a material uncertainty exists, we are required to draw attention in our auditor’s report to the related disclosures in the financial statements about the material uncertainty or, if such disclosures are inadequate, to modify the opinion on the financial statements. Our conclusions are based on the information available to us at the date of the auditor’s report. However, future events or conditions may cause the entity to cease to continue as a going concern.
• Evaluate the overall presentation, structure and content of the financial statements, including the disclosures, and whether the financial statements represent the underlying transactions and events in a manner that achieves fair presentation.
• Obtain sufficient appropriate audit evidence regarding the financial information of the entities or business activities to express an opinion on the financial statements. We are responsible for the direction, supervision and performance of the audit. We remain solely responsible for our audit opinion.
We communicate with the accounting authority regarding, among other matters, the planned scope and timing of the audit and significant audit findings, including any significant deficiencies in internal control that we identify during our audit.
We also provide the accounting authority with a statement that we have complied with relevant ethical requirements regarding independence, and communicate with them all relationships and other matters that may reasonably be thought to bear on our independence and, where applicable, related safeguards.
From the matters communicated with the accounting authority, we determine those matters that were of most significance in the audit of the financial statements of the current period and are therefore the key audit matters. We describe these matters in our auditor’s report unless law or regulation precludes public disclosure about the matter or when, in extremely rare circumstances, we determine that a matter should not be communicated in our report because the adverse consequences of doing so would reasonably be expected to outweigh the public interest benefits of such communication.
REPORT ON THE AUDIT OF THE ANNUAL PERFORMANCE REPORTINTRODUCTION AND SCOPEIn accordance with the Public Audit Act of South Africa, No 25 of 2004 and the general notice issued in terms thereof we have a responsibility to report material findings on the reported performance information against predetermined objectives for selected objectives presented in the annual performance report. We performed procedures to identify findings but not to gather evidence to express assurance.
Our procedures address the reported performance information, which must be based on the approved performance planning documents of the entity. We have not evaluated the completeness and appropriateness of the performance indicators established and included in the planning documents. Our procedures also did not extend to any disclosures or assertions relating to planned performance strategies and information relating to future periods that may be included as part of the reported performance information. Accordingly our findings do not extend to these matters.
We evaluated the usefulness and reliability of the reported performance information in accordance with the criteria developed from the performance management and reporting framework, as defined in the general notice, for the following selected objectives presented in the annual performance report of the entity for the year ended 31 March 2017:
Objectives Pages in the annual performance report
Sustained growth in development impact 8Maintain financial sustainability 8Create and maintain a high performance culture 8

01 REPORTS
We performed procedures to determine whether the reported performance information was properly presented and whether performance was consistent with the approved performance planning documents. We performed further procedures to determine whether the indicators and related targets were measurable and relevant, and assessed the reliability of the reported performance information to determine whether it was valid, accurate and complete.
We did not identify any material findings on the usefulness and reliability of the reported performance information for the following objectives:• Sustained growth in development impact• Maintain financial sustainability• Create and maintain a high performance culture
REPORT ON THE AUDIT OF COMPLIANCE WITH LEGISLATIONINTRODUCTION AND SCOPEIn accordance with the Public Audit Act of South Africa, No 25 of 2004 and the general notice issued in terms thereof, we have a responsibility to report material findings on the compliance of the entity with specific matters in key legislation. We performed procedures to identify findings but not to gather evidence to express assurance.
We did not find any material findings on compliance with applicable legislation.
INTERNAL CONTROL DEFICIENCIESWe considered internal control relevant to our audit of the financial statements, annual performance report and compliance with legislation, however, the objective is not to express any form of assurance thereon. We did not identify any significant deficiencies in internal control.
AUDITOR TENUREIn terms of the IRBA rule published in Government Gazette Number 39475 dated 4 December 2015, we report that Nkonki Inc. has been the auditor of the Development Bank of Southern Africa for five years.
Nkonki Inc.Sangeeta Kallen CA(SA)Executive: AssuranceRegistered Auditor
22 June 2017
1 Simba RoadSunninghillJohannesburg2157
INDEPENDENT AUDITOR’S REPORT TO THOSE CHARGED WITH GOVERNANCE OF THE DEVELOPMENT BANK OF SOUTHERN AFRICA CONTINUED FOR THE YEAR ENDED 31 MARCH 2017

Development Bank of Southern Africa2017 Annual Financial Statements
7
The directors have pleasure in presenting this report on the Annual Financial Statements of the Development Bank of Southern Africa (DBSA) for the year ended 31 March 2017.
1. NATURE OF BUSINESSThe DBSA was reconstituted in terms of the Development Bank of Southern Africa Act, No 13 of 1997 (Amended Act No 41 of 2014) as a development finance institution wholly owned by the South African government. The geographic mandate of the Bank has been extended beyond the Southern African Development Community (SADC) to any country on the African continent and its oceanic islands. The Bank aims to deepen its development impact in South Africa and the rest of the African continent by expanding access to development finance while effectively integrating and implementing sustainable development solutions. Since its founding in 1983, the DBSA has expanded its role to serve as financier, advisor, partner, implementer and integrator to the benefit of its clients.
There have been no material changes to the nature of the company’s business from the prior year.
2. CORPORATE GOVERNANCEThe Directors embrace the principles of the King IV Code and the Companies Act and endeavour to comply with these recommendations insofar as they are not in conflict with the DBSA Act.
3. FINANCIAL RESULTS AND ACTIVITIESThe financial results of the Bank are fully disclosed on pages 11 to 68. The key financial indicators for the year under review are:• Sustainable earnings rose to R3.6 billion (2016: R1.4 billion) on the back of an increase in the net interest income to R3.7 billion
(2016: R3.2 billion), an increase in equity gain realised of R655 million (2016: R44 million) and decrease in impairments charge of R339 million (2016: R1.4 billion).
• Cost-to-Income ratio decreased to 18.8% (2016: 28.7%). The decrease is due to the combination of an increase in net interest income and a decrease in operating expenses.
• DBSA achieved a net profit of R2.8 billion (2016: R2.6 billion).• Development loans, development bonds and equity investments disbursed decreased by 27% to R12.4 billion (2016: R17.1 billion).• Despite the increase of impairment provision of 10% to R4.2 billion, the quality of loan book remains healthy. This is further contributed
by 3.3% of non-performing loans in relation to the entire book. • Debt-to-equity ratio improved to 158.1% (2016: 177.8%).
Summarised information on the financial performance of the Bank is included in the unaudited financial overview section on pages 74 to 82 of the Integrated Annual Report.
4. HIGH-LEVEL PERFORMANCE OVERVIEWThe DBSA’s strategy highlights the importance of achieving development impact while maintaining financial sustainability. The Balanced Scorecard (BSC) methodology is utilised to implement and monitor strategy. To this end, the Board approves the corporate strategic objectives and targets. The table overleaf compares the planned and related actual performance on the high-level corporate strategic objectives for 2017.
The Bank continued to achieve good results for the year under review, meeting more than half of its strategic objectives whilst the targets for the following key performance indicators were not met:• Disbursements to metro and secondary municipalities: The underperformance was largely attributed to municipalities not coming to
the market to seek funding. The ability to convert the approved bridging projects remains a challenge.• Disbursement to fund social and economic infrastructure: The underperformance was largely attributed to the non-materialisation of
various planned infrastructure projects and a strong competition in the market.• Disbursement to the SADC region (excluding South Africa): Infrastructure development and financing in the region is complex and
time-consuming and can take a number of years to reach financial close, thus impacting the ability to disburse. The conversion of approval to disbursements took longer than anticipated. The challenging macro-economic conditions impact the ability to provide cost-effective funding.
• Value of projects prepared and committed by DBSA: The underperformance was mainly as the result of the delay in concluding the Power Purchase Agreements for the IPP programme and delays in procurement of rolling stock for Gautrain Phase 1 extension which will reach financial closure during 2018.
• Value of funds under management: The underperformance was mainly as a result of the delays from government departments in releasing funds of the programmes that the DBSA is managing as per the agreed project schedule.
• Cost-to-income for Infrastructure Delivery Division: The main reason for the underperformance was as a result of expenses remaining high as the Infrastructure Delivery Division struggled to raise sufficient income to cover its costs for the last four months of the financial year.
DIRECTORS’ REPORT FOR THE YEAR ENDED 31 MARCH 2017

PERFORMANCE INFORMATION
Strategic objective Key performance indicator Target Results
Sustained growth in development impact
Integrated infrastructure solutions provider
Total infrastructure financing R16 400 million R12 403 millionSouth Africa R12 800 million R8 683 millionMunicipalities R6 000 million R5 555 million• Metropolitan cities R4 800 million R4 476 million• Secondary municipalities R1 000 million R839 million• Under-resourced municipalities R200 million R240 millionSocial infrastructure R1 200 million R433 millionEconomic infrastructure R5 600 million R2 695 million
Outside South Africa R3 600 million R3 720 millionof which SADC (excluding RSA) R2 500 million R1 853 million
Project preparation• Value of projects prepared and committed R9 000 million R585 million
Value of third party funds catalysed (based on committed) by DBSA• South Africa R2 000 million R7 150 million• Rest of SADC R3 600 million R24 700 millionImplementation and delivery support programmes• Value of funds under management R4 200 million R3 314 million
Client and partnership satisfaction Conduct survey (4 rating out of 5)
Rating of 3.9 out of 5
Maintain financial sustainability
Sustainable earnings R1 092 million R3 564 million
Net interest margin 40.9% 49.8%
Non-interest income R250 million R278 million
Create and maintain a high performance culture
Retention of critical staff members 85% 89%
Reduction in the DBSA’s entropy score 3% improvement from 2015/16 results
5% improvement from 2015/16 results
Continuous improvement of internal systems and processes
Cost-to-income ratio: Financing business 35% 15%
Cost-to-income ratio: Infrastructure Delivery Division 95% 128%
Balance sheet capacity: Capital management Capital managementstrategy/framework
approved
Capital management strategy and framework
has been approved
Innovation Approval of an innovativeconcept/product
Four innovative concepts have been approved
5. DIVIDENDNo dividend has been declared for the current and previous financial years. The DBSA does not have a dividend policy as part of its contract with the shareholder. The benefits of reinvesting in the mandate of the DBSA far outweigh the benefit of a dividend to the shareholder.
6. SHARE CAPITALAuthorised capital amounts to R20.2 billion, which is divided into 2.02 million ordinary shares of R10 000 each. The authority of the Board to increase the share capital (after consultation with the shareholder) is limited to the issued share capital and only the Minister of Finance has authority to adjust the authorised share capital, after consultation with the Board.
7. AUTHORISED CAPITAL2 020 000 ordinary shares (2016: 2 020 000) at par value of R10 000 each.
8. CALLABLE CAPITAL (AUTHORISED BUT UNISSUED SHARE CAPITAL)2 000 000 ordinary shares (2016: 2 000 000) at a par value of R10 000 each.
9. ISSUED CAPITAL20 000 ordinary shares (2016: 20 000) at par value of R10 000 each.
10. GOING CONCERNThe Annual Financial Statements have been prepared using appropriate accounting policies, supported by reasonable judgments and estimates. The directors have reasonable belief that the Bank has adequate resources to continue as a going concern for the foreseeable future, based on forecasts and available cash resources.
DIRECTORS’ REPORT CONTINUEDFOR THE YEAR ENDED 31 MARCH 2017
01 REPORTS

Development Bank of Southern Africa2017 Annual Financial Statements
9
11. BORROWING POWERSAs per Regulation 44 of the Regulations made under section 17 of the DBSA Act, the directors may in their discretion borrow or raise funding for the purposes of the Bank, subject to the leverage ratio not exceeding 2.5 times the permanent capital and accumulated reserves. An annual borrowing programme, based on projections of business activity for the following financial year, is submitted to National Treasury for approval. The current year debt raised was within the approved programme, and the overall borrowings remained within the leverage ratio limit.
12. DIRECTORATE AND SECRETARIATDetails pertaining to the names of Board members and the Secretariat appear on pages 34 to 37 of the Integrated Annual Report.
Non-executive Directors are subject to retirement by rotation. They hold office for a period of three years and are eligible for re-appointment. The Chief Executive Officer may be appointed for a period not exceeding five years and is eligible for re-appointment.
Name Position
Number of terms served (including current term)
Current service contract
From To
CurrentMr PJ Moleketi Independent Non-executive Chairperson 3 1 January 2016 31 December 2018Mr FM Baleni Independent Non-executive Deputy
Chairperson3 1 January 2016 31 December 2018
Mr PK Dlamini Chief Executive Officer and Managing Director
Not applicable 1 September 2012 31 August 2017
Dr L Bhengu-Baloyi2 Independent Non-executive Director 2 1 August 2014 31 July 2017Ms M Janse van Rensburg
Independent Non-executive Director 1 1 January 2016 31 December 2018
Ms B Mabuza2 Independent Non-executive Director 2 1 August 2014 31 July 2017Ms D Marole2 Independent Non-executive Director 2 1 August 2014 31 July 2017Mr A Moloto2 Independent Non-executive Director 1 1 August 2014 31 July 2017Ms G Mtetwa3 Independent Non-executive Director 1 1 August 2014 31 July 2017Ms K Naidoo4 Chief Financial Officer Not applicable 1 January 2013 Until such time
she ceases to hold the office as CFO
Ms M Nqaleni Non-executive Director (shareholder representative)
1 1 January 2016 31 December 2018
Ms A Singh3 Independent Non-executive Director 1 1 August 2014 31 July 2017Prof M Swilling3 Independent Non-executive Director 1 1 August 2014 31 July 2017
During the yearMs T Dingaan1 Independent Non-executive Director 3 1 August 2013 31 May 2016
1. Board term ended with effect from 31 May 2016.2. Board term ended with effect from 31 July 2017.3. Board term renewed with effect from 1 August 2017 until 31 July 2020.4. Resigned with effect from 31 August 2017.
The details of the directors’ interests in related party transactions and directors’ emoluments are set out in notes 42 and 45 respectively of the Annual Financial Statements. The governance structure is detailed on page 33 of the Integrated Annual Report.
13. REMUNERATION POLICYThe Human Resources, Remuneration, Nomination, Social and Ethics Committee ensures that employees are fairly rewarded for their contributions to the performance of the Bank. The provision of performance bonuses is at the sole discretion of the Board.
14. BUSINESS AND REGISTERED ADDRESSThe Bank’s business and registered address details appear on page 71.

15. TAXATION STATUSThe Bank is exempt from normal taxation in terms of section 10(1)(t)(x) of the Income Tax Act, No 58 of 1962, as amended. The Bank is subject to and complies with all other South African taxes, including employees’ tax and value added tax. The DBSA paid VAT amounting to R36.7 million during the 2017 financial period.
16. CHANGES IN ACCOUNTING POLICIESThe accounting policies applied during the year ended 31 March 2017 are in all material respects consistent with those applied in the Annual Financial Statements for the year ended 31 March 2016, as no changes in accounting policies were effected in the 2017 financial year.
17. EVENTS AFTER THE REPORTING PERIODThe directors are not aware of any matters or circumstances arising since the end of the financial year, which will have a significant effect on the operations of the Bank, the results of the operations or the financial position of the Bank, other than that in note 53 of the Annual Financial Statements on page 68.
18. LITIGATIONThe directors are not aware of any litigation against the Bank other than that disclosed under contingent liabilities in note 46 of the Annual Financial Statements on page 65.
19. RELATED PARTY TRANSACTIONSDetails of the DBSA’s related party transactions are set out in note 45 of the Annual Financial Statements on page 64.
20. INFORMATION PRESENTED IN TERMS OF SECTION 55(2)(B) OF THE PFMAi Particulars of material losses through criminal conduct and any irregular expenditure and fruitless and wasteful expenditure that
occurred during the year: There were no instances where the Bank sustained material losses. Refer to note 49 of the Annual Financial Statements on page 66.
ii. Particulars of any criminal or disciplinary steps taken as a consequence of such losses or irregular expenditure or fruitless and wasteful expenditure: There were no instances where the Bank sustained material losses.
iii. Particulars of any losses recovered or written off: No material losses were recovered or written off other than in the ordinary course of business.
iv. Particulars of any financial assistance received from the state and commitments made by the state on behalf of the DBSA: No such financial assistance was received.
DIRECTORS’ REPORT CONTINUEDFOR THE YEAR ENDED 31 MARCH 2017
01 REPORTS

Development Bank of Southern Africa2017 Annual Financial Statements
11
STATEMENT OF FINANCIAL POSITIONAS AT 31 MARCH 2017
in thousands of rands Notes 2017 2016
ASSETSCash and cash equivalents 5 2 299 247 2 084 565Trade and other receivables 6 121 982 138 533Investment securities 7 1 069 085 1 265 218Derivative assets held for risk management 8.1 846 141 1 163 533Post-retirement medical benefit investment 9 45 251 49 978Equity investments 10 5 972 509 6 278 575Development bonds 12 1 290 319 1 290 296Development loans 13 71 505 178 69 494 954Property, plant and equipment 14 415 409 501 202Intangible assets 15 87 958 79 142
Total Assets 83 653 079 82 345 996
EQUITY AND LIABILITIESLiabilitiesTrade and other payables 16 838 591 894 795Provisions 17 126 630 152 533Liability for funeral benefits 18.1 3 226 3 100Post-retirement medical benefit liability 18.2 40 712 239 289Debt securities held at fair value through profit or loss 19 6 336 487 6 188 780Debt securities held at amortised cost 19 30 117 774 29 082 355Funding: Lines of credit 20 14 015 426 16 371 534Derivative liabilities held for risk management 8.2 142 857 148 551
Total Liabilities 51 621 703 53 080 937
EquityShare capital 21 200 000 200 000Retained earnings 17 514 577 14 544 861Permanent government funding 22 11 692 344 11 692 344Revaluation reserve on land and buildings 23 198 322 269 256Cash flow hedge reserve 24 141 680 123 050Reserve for general loan risks 25 2 287 491 2 436 358Available-for-sale reserve 26 (3 038) (810)
Total Equity 32 031 376 29 265 059
Total Equity and Liabilities 83 653 079 82 345 996

02 STATEMENTS
in thousands of rands Notes 2017 2016
Interest income 27 7 373 094 6 541 028Interest expense 28 (3 703 760) (3 355 429)
Net interest income 28 3 669 334 3 185 599
Net fee income 29 318 266 275 914Net foreign exchange (loss)/gain 30 (618 649) 1 002 172Net (loss)/gain from financial assets and financial liabilities 31 (43 354) 442 630Other income 32 734 090 134 355
Other income 390 353 1 855 071
Operating income 4 059 687 5 040 670Project preparation expenditure 33 (24 453) (14 651)Development expenditure 34 (27 181) (43 869)Net impairment on financial assets 35 (339 449) (1 426 159)Personnel expenses 36 (603 608) (730 937)Other expenses 37 (202 180) (213 653)Depreciation and amortisation 38 (31 249) (30 593)
Profit from operations 2 831 567 2 580 808Grants 39 (10 718) (4 129)
Profit for the year 2 820 849 2 576 679
STATEMENT OF COMPREHENSIVE INCOMEFOR THE YEAR ENDED 31 MARCH 2017

Development Bank of Southern Africa2017 Annual Financial Statements
13
STATEMENT OF OTHER COMPREHENSIVE INCOMEFOR THE YEAR ENDED 31 MARCH 2017
in thousands of rands Notes 2017 2016
Profit for the year 2 820 849 2 576 679Items that will not be reclassified to profit and lossLoss on revaluation of land and buildings 23 (70 934) -
Items that may be reclassified subsequently to profit and lossUnrealised gain on cash flow hedges 24 12 846 142 063Gain/(loss) on cash flow hedges reclassified to profit and loss 24 5 784 (135 301)Unrealised loss on available-for-sale financial assets 26 (2 228) (1 067)
16 402 5 695
Other comprehensive (loss)/income (54 532) 5 695
Total comprehensive income for the year 2 766 317 2 582 374

in thousands of randsShare
capital
Cash flow hedge
reserve
Revaluation reserve on
land and buildings
Available-for-sale reserve
Permanent government
funding
Reserve for general loan risks
Retained earnings
Total equity
Balance at 1 April 2015 200 000 116 288 269 256 257 8 692 344 2 143 975 12 260 565 23 682 685Government recapitalisation – – – – 3 000 000 – – 3 000 000Profit for the year – – – – – – 2 576 679 2 576 679Other comprehensive income/(loss)Unrealised gain on cash flow hedges – 142 063 – – – – – 142 063Loss on cash flow hedges reclassified to profit and loss – (135 301) – – – – – (135 301)Unrealised loss on available-for-sale-financial assets – – – (1 067) – – – (1 067)Transfer to reserve for general loan risks – – – – – 292 383 (292 383) –
Total changes – 6 762 – (1 067) 3 000 000 292 383 2 284 296 5 582 374
Balance at 31 March 2016 200 000 123 050 269 256 (810) 11 692 344 2 436 358 14 544 861 29 265 059
Profit for the year – – – – – – 2 820 849 2 820 849Other comprehensive income/(loss)Loss on revaluation of land and buildings – – (70 934) – – – – (70 934)Unrealised gain on cash flow hedges – 12 846 – – – – – 12 846Gain on cash flow hedges reclassified to profit and loss – 5 784 – – – – – 5 784Unrealised loss on available-for- sale financial assets – – – (2 228) – – – (2 228)Transfer from reserve for general loan risks – – – – – (148 867) 148 867 –
Total changes – 18 630 (70 934) (2 228) – (148 867) 2 969 716 2 766 317
Balance at 31 March 2017 200 000 141 680 198 322 (3 038) 11 692 344 2 287 491 17 514 577 32 031 376
Notes 21 24 23 26 22 25
STATEMENT OF CHANGES IN EQUITYFOR THE YEAR 31 MARCH 2017
02 STATEMENTS

Development Bank of Southern Africa2017 Annual Financial Statements
15
STATEMENT OF CASH FLOWSFOR THE YEAR ENDED 31 MARCH 2017
in thousands of rands Notes 2017 2016
Cash flows from operating activitiesNet profit/(loss) adjusted for non-cash items 40 459 125 (137 003)Interest received 6 864 688 6 308 445Interest paid (3 446 294) (3 115 067)Net decrease in working capital 41 (110 897) (31 060)
Net cash generated from operating activities 3 766 622 3 025 315
Cash flows used in development activitiesDevelopment loan disbursements 13 (12 103 967) (16 461 393)Development loan principal repayments 8 572 092 5 549 156Net decrease/(increase) in equity investments 732 770 (368 767)Grants, development expenditure and project preparation expenditure paid (35 171) (18 781)Net repayments from national mandates 2 821 100 357
Net cash used in development activities (2 831 455) (11 199 428)
Cash flows from investing activitiesPurchase of property, plant and equipment 14 (3 987) (15 918)Proceeds from sale of property and equipment 853 207Purchase of intangible assets 15 (21 493) (14 728)(Decrease)/increase in financial market instruments (832 878) 197 871
Net cash (utilised by)/generated from investing activities (857 505) 167 432
Cash flows from financing activitiesReceipts from National Treasury 22 - 3 000 000Financial market liabilities repaid (27 050 711) (20 163 956)Financial market liabilities raised 27 206 684 23 249 923
Net cash generated from financing activities 155 973 6 085 967
Net increase/(decrease) in cash and cash equivalents 233 635 (1 920 714)Effect of exchange rate movements on cash balances 30 (18 953) 103 616
Movement in cash and cash equivalents 214 682 (1 817 098)Cash and cash equivalents at the beginning of the year 2 084 565 3 901 663
Cash and cash equivalents at the end of the year 5 2 299 247 2 084 565

1. STATEMENT OF COMPLIANCEThe Annual Financial Statements have been prepared in accordance with International Financial Reporting Standards (IFRS), as issued by the International Accounting Standards Board (IASB), the requirements of the PFMA and sections 27 to 31 of the Companies Act, being the relevant and corresponding sections of those specified in the DBSA and Treasury Regulations.
As a PFMA Schedule 2 entity, the Bank is applying IFRS for financial reporting purposes.
1.1 BASIS OF PREPARATION1.1.1 BASIS OF MEASUREMENT
The Annual Financial Statements have been prepared on the historical cost basis, except for the following which are measured at fair value:• Land and buildings;• Post-retirement medical benefit;• Financial instruments at fair value through profit or loss;• Available-for-sale financial assets;• Derivative financial instruments; and• Non-current assets held-for-sale
The methods used to measure fair values are detailed in note 1.10.
1.1.2 USE OF ESTIMATES AND JUDGEMENTSThe preparation of Annual Financial Statements requires management to make judgements, estimates and assumptions that affect the application of accounting policies and the reported amounts of assets, liabilities, income and expenses. Actual results may differ from these estimates. Estimates and underlying assumptions are reviewed on an ongoing basis. Revisions to accounting estimates are recognised in the period in which the estimate is revised and in any future periods affected. In particular, information about significant areas of estimation, uncertainty and critical judgments in applying accounting policies that have the most significant effect on the amount recognised in the Annual Financial Statements is given in the following notes:
• Note 1.2.5 – Derivative and hedge accounting: On the date that a derivative contract is designated as a hedging instrument, the Bank designates the derivative as either a hedge of
the fair value of a recognised asset or liability or a firm commitment (fair value hedge) or a hedge of a highly probable future cash flow attributable to a recognised asset or liability or a forecast transaction (cash flow hedge). All derivatives are recognised initially at fair value. Subsequent to initial recognition, they are remeasured at fair value, which includes an estimated component relating to credit risk adjustment.
• Note 1.4.3 and 1.5.3 – Depreciation and amortisation and the useful lives of property and equipment and intangible assets: Depreciation and amortisation is recognised in profit or loss on a straight-line basis over the estimated useful life of each part of an
item of property and equipment and intangibles. Land is not depreciated.
• Notes 7, 10, 13, 14, 18, 19, and 20 – Valuation of financial instruments:
Note 7 – Investment securities Investment securities are designated at fair value through profit or loss upon initial recognition, when they form part of a group of
financial assets managed and evaluated on a fair value basis in accordance with a documented investment strategy.
• Note 10 – Valuation of equity investments: Equity investments are designated as held-to-maturity if they have fixed or determinable payments and fixed maturities that
management has the positive intention and ability to hold to maturity. All other equity investments are designated at fair value through profit and loss which is determined from observable market data in respect of similar financial instruments. Where market observable data is not available, they are estimated based on appropriate assumptions.
• Note 13 – Measurement of the recoverable amounts and impairment of development loans and bonds: Development loans and bonds are carried at amortised cost. However judgements are applied when determining fair value and
assessments of recoverable amounts and impairments calculations.
• Note 14 – Valuation of land and buildings: Land and buildings measured at fair value less accumulated depreciation and impairment losses, in terms of the revaluation model.
• Note 18 – Measurement of funeral benefit obligations and post-retirement medical benefit: Obligations for contributions to defined contribution provident fund plans are recognised as an expense in profit or loss when they
are due.
• Note 19 – Debt securities: Debt securities that are designated at fair value through profit or loss consist of bonds which are listed and unlisted.
Debt securities carried at amortised cost consist of bond issues and money market issuance.
• Note 20 – Lines of credit: Lines of credit are carried at amortised cost. However judgements are applied when determining fair value disclosures.
These disclosures supplement the commentary on financial risk management (refer note 43).
ACCOUNTING POLICIESFOR THE YEAR ENDED 31 MARCH 2017
03 NOTES TO THE ANNUAL FINANCIAL STATEMENTS
Development Bank of Southern Africa2017 Annual Financial Statements
17
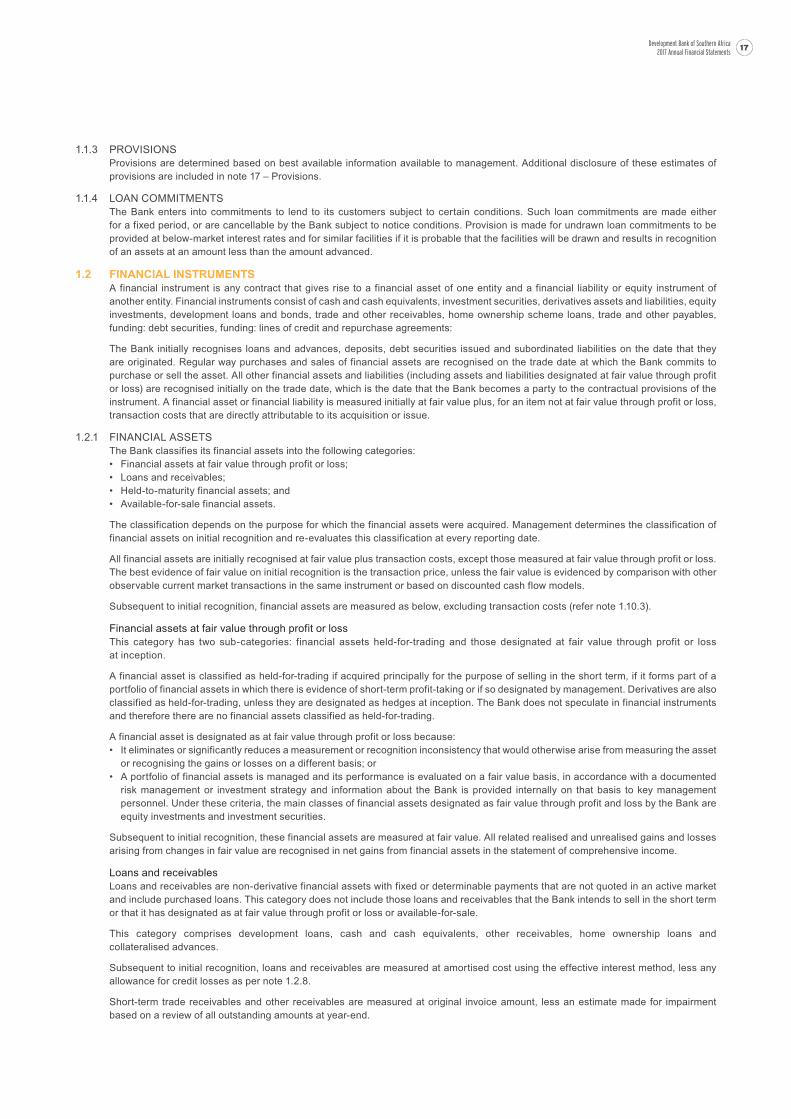
1.1.3 PROVISIONSProvisions are determined based on best available information available to management. Additional disclosure of these estimates of provisions are included in note 17 – Provisions.
1.1.4 LOAN COMMITMENTSThe Bank enters into commitments to lend to its customers subject to certain conditions. Such loan commitments are made either for a fixed period, or are cancellable by the Bank subject to notice conditions. Provision is made for undrawn loan commitments to be provided at below-market interest rates and for similar facilities if it is probable that the facilities will be drawn and results in recognition of an assets at an amount less than the amount advanced.
1.2 FINANCIAL INSTRUMENTSA financial instrument is any contract that gives rise to a financial asset of one entity and a financial liability or equity instrument of another entity. Financial instruments consist of cash and cash equivalents, investment securities, derivatives assets and liabilities, equity investments, development loans and bonds, trade and other receivables, home ownership scheme loans, trade and other payables, funding: debt securities, funding: lines of credit and repurchase agreements:
The Bank initially recognises loans and advances, deposits, debt securities issued and subordinated liabilities on the date that they are originated. Regular way purchases and sales of financial assets are recognised on the trade date at which the Bank commits to purchase or sell the asset. All other financial assets and liabilities (including assets and liabilities designated at fair value through profit or loss) are recognised initially on the trade date, which is the date that the Bank becomes a party to the contractual provisions of the instrument. A financial asset or financial liability is measured initially at fair value plus, for an item not at fair value through profit or loss, transaction costs that are directly attributable to its acquisition or issue.
1.2.1 FINANCIAL ASSETSThe Bank classifies its financial assets into the following categories:• Financial assets at fair value through profit or loss;• Loans and receivables;• Held-to-maturity financial assets; and• Available-for-sale financial assets.
The classification depends on the purpose for which the financial assets were acquired. Management determines the classification of financial assets on initial recognition and re-evaluates this classification at every reporting date.
All financial assets are initially recognised at fair value plus transaction costs, except those measured at fair value through profit or loss. The best evidence of fair value on initial recognition is the transaction price, unless the fair value is evidenced by comparison with other observable current market transactions in the same instrument or based on discounted cash flow models.
Subsequent to initial recognition, financial assets are measured as below, excluding transaction costs (refer note 1.10.3).
Financial assets at fair value through profit or lossThis category has two sub-categories: financial assets held-for-trading and those designated at fair value through profit or loss at inception.
A financial asset is classified as held-for-trading if acquired principally for the purpose of selling in the short term, if it forms part of a portfolio of financial assets in which there is evidence of short-term profit-taking or if so designated by management. Derivatives are also classified as held-for-trading, unless they are designated as hedges at inception. The Bank does not speculate in financial instruments and therefore there are no financial assets classified as held-for-trading.
A financial asset is designated as at fair value through profit or loss because:• It eliminates or significantly reduces a measurement or recognition inconsistency that would otherwise arise from measuring the asset
or recognising the gains or losses on a different basis; or• A portfolio of financial assets is managed and its performance is evaluated on a fair value basis, in accordance with a documented
risk management or investment strategy and information about the Bank is provided internally on that basis to key management personnel. Under these criteria, the main classes of financial assets designated as fair value through profit and loss by the Bank are equity investments and investment securities.
Subsequent to initial recognition, these financial assets are measured at fair value. All related realised and unrealised gains and losses arising from changes in fair value are recognised in net gains from financial assets in the statement of comprehensive income.
Loans and receivablesLoans and receivables are non-derivative financial assets with fixed or determinable payments that are not quoted in an active market and include purchased loans. This category does not include those loans and receivables that the Bank intends to sell in the short term or that it has designated as at fair value through profit or loss or available-for-sale.
This category comprises development loans, cash and cash equivalents, other receivables, home ownership loans and collateralised advances.
Subsequent to initial recognition, loans and receivables are measured at amortised cost using the effective interest method, less any allowance for credit losses as per note 1.2.8.
Short-term trade receivables and other receivables are measured at original invoice amount, less an estimate made for impairment based on a review of all outstanding amounts at year-end.

03 NOTES TO THE ANNUAL FINANCIAL STATEMENTS
ACCOUNTING POLICIES CONTINUEDFOR THE YEAR ENDED 31 MARCH 2017
1. STATEMENT OF COMPLIANCE CONTINUED1.2 FINANCIAL INSTRUMENTS CONTINUED1.2.1 FINANCIAL ASSETS CONTINUED
Held-to-maturity financial assetsHeld-to-maturity financial assets are non-derivative financial assets with fixed or determinable payments and fixed maturities that management has the positive intention and ability to hold to maturity, other than those that meet the definition of loans and receivables. Where the Bank sells more than an insignificant amount of held-to-maturity financial assets in a period, the entire category would be tainted and reclassified as available-for-sale and the difference between amortised cost and fair value would be accounted for in equity.
Financial assets classified as held-to-maturity include preference shares, debentures and investments in municipal and government bonds.
Subsequent to initial recognition, held-to-maturity financial assets are measured at amortised cost using the effective interest method, less any allowance for credit losses.
Available-for-sale financial assetsFinancial assets that are either designated in this category or not classified in any of the other categories are classified as available-for-sale financial assets. The main classes of financial assets classified as available-for-sale are money market placements as well as government and corporate bonds.
Subsequent to initial recognition, available-for-sale financial assets are measured at fair value. Unrealised gains and losses arising from the changes in fair value are recognised in other comprehensive income until the financial asset is derecognised or impaired, at which time the cumulative gain or loss previously recognised in other comprehensive income is recognised in the statement of comprehensive income. Interest and dividend income received on available-for-sale financial assets are recognised in the statement of comprehensive income.
If the asset is subsequently impaired, the amount recorded in equity is reclassified to statement of profit and loss.
1.2.2 FINANCIAL LIABILITIESThe Bank initially recognises financial liabilities on the date at which they are originated. The origination date for regular way purchases are recognised on the trade date at which the Bank commits to the purchase. All other financial liabilities (including liabilities designated at fair value through profit or loss) are initially recognised on the trade date on which the Bank becomes a party to the contractual provisions of the instrument. A financial liability is measured initially at fair value less transaction costs that are directly attributable to its issue.
The Bank accounts for its financial liabilities either as financial liabilities held at fair value through profit or loss or financial liabilities held at amortised cost. Management determines the classification of the financial liabilities on initial recognition and re-evaluates this classification at the reporting date. The basis for designation are discussed under each category below.
Financial liabilities at fair value through profit or lossFinancial liabilities at fair value through profit and loss include debt securities and derivatives held for risk management. The Bank has designated financial liabilities at fair value through profit or loss in the following circumstances:• The liabilities are managed, evaluated and reported internally on a fair value basis; and• The designation eliminates or significantly reduces an accounting mismatch which would otherwise arise.
Subsequent to initial recognition the financial liability held at fair value through profit or loss is measured at fair value, with the changes in fair value recognised in the statement of comprehensive income. Changes in fair value of the derivatives used to hedge the interest rate risk are reported in net interest income in the statement of comprehensive income.
Changes in fair value of liabilities due to changes in the Bank’s own credit risk is recognised in other comprehensive income.
Financial liabilities at amortised costFinancial liabilities at amortised cost includes loans and borrowings, trade and other payables and liability for funeral benefit. All other financial liabilities not designated at fair value through profit or loss are designated as financial liabilities held at amortised cost. These financial liabilities are initially recognised at fair value and subsequently at amortised cost.
The amortised cost of a financial liability is the amount at which the financial asset or liability is measured at initial recognition, minus principal repayments, plus or minus the cumulative amortisation, using the effective interest method, of any difference between the initial amount recognised and the maturity amount.

Development Bank of Southern Africa2017 Annual Financial Statements
19
1.2.3 DERIVATIVE FINANCIAL INSTRUMENTSThe Bank uses derivative financial instruments to hedge its exposure to foreign exchange and interest rate risks arising from operational, financing and investment activities. In accordance with its treasury policies, the Bank does not hold or issue derivative financial instruments for trading purposes. All derivatives are recognised initially at fair value. Subsequent to initial recognition, they are remeasured at fair value which include an estimated component relating to credit risk adjustment. The treatment of changes in their fair value depends on their classification into the following categories:
Qualifying derivativesDerivatives qualifying for hedge accounting are accounted for in terms of hedge accounting (refer note 1.2.5).
Non-qualifying derivativesDerivatives that do not qualify for hedge accounting are accounted for as a component of financial instruments held at fair value through profit or loss with all changes in fair values recognised in profit and loss.
1.2.4 DERECOGNITIONThe Bank derecognises a financial asset when the contractual rights to the cash flows from the asset expire or it transfers the rights to receive the contractual cash flows on the financial asset in a transaction in which substantially all the risks and rewards of ownership of the financial asset are transferred. Any interest in transferred financial assets that is created or retained by the Bank is recognised as a separate asset or liability.
The Bank derecognises a financial liability when its contractual obligations are discharged, cancelled or expire.
The Bank enters into transactions whereby it transfers assets recognised on its statement of financial position, but retains either all risks or rewards of the transferred assets or a portion of them. If all or substantially all risks and rewards are retained, then the transferred assets are not derecognised from the statement of financial position.
In transactions in which the Bank neither retains nor transfers substantially all the risks and rewards of ownership of a financial asset and it retains control over the asset, the Bank continues to recognise the asset to the extent of its continued involvement, determined by the extent to which it is exposed to changes in the value of the transferred asset.
Restructured loansA loan that is restructured is derecognised if the existing agreement is cancelled and a new agreement made on substantially different terms, or if the terms of an existing agreement are modified such that the restructured loan is substantially a different financial asset.
Trade date and settlement date accountingThe trade date is the date that an entity commits itself to purchase or sell an asset and trade date accounting refers to:(a) The recognition of an asset to be received and the liability to pay for it on the trade date, and (b) De-recognition of an asset that is sold, recognition of any gain or loss on disposal and the recognition of a receivable from the buyer
for payment on the trade date.
The settlement date is the date that an asset is delivered to or by an entity and settlement date accounting refers to:(a) The recognition of an asset on the day it is received by the entity, and (b) The de-recognition of an asset and recognition of any gain or loss on disposal on the day that it is delivered by the entity.
Interest does not start to accrue on the asset and corresponding liability from trade date and only starts from settlement date when title passes. The Bank applies settlement date accounting and accounts for any change in the fair value of assets to be received during the period between the trade date and the settlement date in the same way as it accounts for the acquired asset. The change in value between trade date and settlement date is not recognised for assets carried at cost or amortised cost. The change in value is however recognised in profit and loss for assets classified as financial assets at fair value through profit or loss and for available-for-sale assets, the change in fair value is recognised in other comprehensive income.
1.2.5 HEDGE ACCOUNTINGOn the date that a derivative contract is designated as a hedging instrument, the Bank designates the derivative as either:• A hedge of the fair value of a recognised asset or liability (fair value hedge); or• A hedge of a highly probable future cash flow attributable to a recognised asset or liability or a forecast transaction (cash flow hedge).
A hedging relationship exists where:• At the inception of the hedge there is formal documentation of the hedge;• The hedge is expected to be highly effective;• The effectiveness of the hedge can be measured reliably;• The hedge is highly effective throughout the reporting period; and• For hedges of a forecasted transaction, the transaction is highly probable and presents an exposure to variations in cash flows that
could ultimately affect net profit or loss.
Hedge accounting requires that the hedging instrument be measured at fair value.
The fair value of derivative hedging instruments is calculated in the same way as the fair value of instruments held at fair value through profit or loss (refer note 1.10).

03 NOTES TO THE ANNUAL FINANCIAL STATEMENTS
ACCOUNTING POLICIES CONTINUEDFOR THE YEAR ENDED 31 MARCH 2017
1. STATEMENT OF COMPLIANCE CONTINUED1.2 FINANCIAL INSTRUMENTS CONTINUED1.2.5 HEDGE ACCOUNTING CONTINUED
The treatment of any resultant gains and losses is set out below.
The Bank utilises various derivative instruments like cross-currency swaps, interest rate swaps, cross-currency interest rate swaps and credit default swaps as part of its asset and liability management activities to manage exposures to interest rate, foreign currency and credit risks, as well as exposures to variability in cash flows attributable to a particular risk associated with a recognised asset or liability.
The Bank applies either fair value or cash flow hedge accounting to transactions that comply with the hedge accounting criteria and are classified as hedging instruments. The hedging instruments are carried at fair value on the statement of financial position and are reported as either positive or negative fair values.
Fair value hedgeWhen a derivative financial instrument hedges the changes in fair value of a recognised asset or liability or an unrecognised firm commitment, the hedged item is stated at fair value in respect of the risk being hedged. Gains or losses relating to the hedged risk on remeasurement of both the hedging instrument and the hedged item are recognised in profit or loss.
If the hedging derivative expires or is sold, terminated, or exercised, or the hedge no longer meets the criteria for fair value hedge accounting, or the hedge designation is revoked, hedge accounting is discontinued prospectively. Any adjustment up to that point to a hedged item for which the effective interest method is used is amortised to profit or loss as part of the recalculated effective interest rate of the item over its remaining life.
Cash flow hedgeWhen a derivative financial instrument is designated as a hedge to variability in the cash flows of recognised assets or liabilities, or a highly probable forecast transaction, the effective part of any gain or loss on remeasurement of the hedging instrument is recognised directly in other comprehensive income and presented in the hedging reserve in equity. The ineffective part of any gain or loss is recognised in profit or loss.
If a hedge of a forecast transaction subsequently results in the recognition of a financial asset or a financial liability, the associated gains and losses that were recognised directly in equity are reclassified into profit or loss in the same period or periods during which the asset acquired or liability assumed affects profit or loss (i.e. when interest income or expense is recognised).
For cash flow hedges, other than those covered by the preceding two policies, the associated cumulative gain or loss is reclassified from equity and recognised in the statement of comprehensive income in the same period or periods during which the hedged forecast transaction affects profit or loss. The ineffective part of any gain or loss is recognised immediately in the statement of comprehensive income.
When a hedging instrument expires or is sold, terminated or exercised, or the entity revokes designation of the hedge relationship but the hedged forecast transaction is still expected to occur, the cumulative gain or loss at that point remains in equity and is recognised in accordance with the above policy when the transaction occurs. If the hedged transaction is no longer expected to take place, the cumulative unrealised gain or loss recognised in equity is recognised immediately in the statement of comprehensive income.
Hedge of monetary assets and liabilitiesWhere a derivative financial instrument is used economically to hedge the foreign exchange exposure of a recognised monetary asset or liability, no hedge accounting is applied and any gain or loss on the hedging instrument is recognised in the statement of comprehensive income.
1.2.6 REPURCHASE AND RESALE AGREEMENTSWhere the Bank sells investments from its portfolio and agrees to repurchase these at future dates with the risk of ownership remaining with the Bank, the consideration received is treated as a loan, secured by the underlying instrument and included in funding under repurchase agreements.
Conversely, excluded from investments are market instruments purchased under an agreement to resell at future dates with the risk of ownership remaining with the counterparty. The consideration paid is treated as an advance, secured by the underlying instrument and included in investments under resale agreements.
1.2.7 OFFSETTING OF FINANCIAL INSTRUMENTSFinancial assets and financial liabilities are offset and the net amount presented in the statement of financial position when, and only when, the Bank has a legal right to set off the amounts and there is an intention to settle on a net basis, or to realise the financial asset and settle the financial liability simultaneously.
Income and expenses are presented on a net basis only when permitted under IFRS, or for gains and losses arising from a group of similar transactions such as in the Bank’s trading activity.
1.2.8 IMPAIRMENT OF FINANCIAL INSTRUMENTSFinancial assets are reviewed at each reporting date to determine whether there is objective evidence of impairment. A financial asset is considered impaired if objective evidence indicates that one or more events have had a negative effect on the estimated future cash flows of that asset. If any such indication exists, the asset’s recoverable amount is estimated.

Development Bank of Southern Africa2017 Annual Financial Statements
21
Objective evidence that financial assets are impaired includes default or delinquency by a borrower, restructuring of a loan or advance by the Bank on terms that the Bank would not otherwise consider, indications that a borrower or issuer will enter business rescue or liquidation, the disappearance of an active market for a security or other observable data relating to a group of assets, such as adverse changes in the payment status of borrowers or issuers in the group or economic conditions that correlate with defaults in the group.
Available-for-sale financial assetsWhere an available-for-sale financial asset remeasured to fair value through other comprehensive income is impaired and an impairment of the asset was previously recognised directly in other comprehensive income, the impairment is transferred to the statement of comprehensive income and recognised as part of the impairment loss. Where an asset measured to fair value through other comprehensive income is impaired and an increase in the fair value of the asset was previously recognised in equity, the increase in fair value of the asset recognised in other comprehensive income is reversed to the extent that the asset is impaired. Any additional impairment loss is recognised in the statement of comprehensive income.
Loans and advances, receivables and held-to-maturity investmentsAn impairment loss is recognised whenever the carrying amount of an asset exceeds its recoverable amount. Impairment losses are recognised in the statement of comprehensive income.
Calculation of recoverable amountThe recoverable amount of the held-to-maturity investments and loans and receivables carried at amortised cost is calculated as the present value of estimated future cash flows, discounted at the original effective interest rate (i.e. the effective interest rate computed at initial recognition of these financial assets). An impairment loss in respect of an available-for-sale financial asset is calculated by reference to its current fair value. Receivables with a short duration are not discounted, as the effect of discounting is not significant.
Reversals of impairmentAn impairment loss in respect of a held-to-maturity financial asset or loans and receivables measured at amortised cost is reversed through profit or loss if the subsequent increase in recoverable amount can be related objectively to an event occurring after the impairment loss was recognised.
If the fair value of an investment security classified as available-for-sale increases and the increase can be objectively related to an event occurring after the impairment loss was recognised in profit or loss, the impairment loss shall be reversed, with the amount of the reversal recognised in profit or loss to the extent that the impairment was previously recognised in profit or loss.
A reversal of impairment loss on equity investments is recognised in profit and loss.
Impairment of development loansIdentified impairmentNon-performing loans are impaired for losses identified during periodic evaluations. The classification of a loan as non-performing is the loss event that triggers impairment testing on an individual loan basis. The impairment to non-performing loans takes account of past loss experience, adjusted for changes in economic conditions and the nature and level of risk exposure since the recording of the historic loss. The methodology and assumptions used for estimating future cash flows are reviewed regularly to reduce any differences between the loss estimates and actual loss experience. Development loans are considered non-performing on the earlier occurrence of either being 90 (ninety) days in arrears or when two consecutive repayments have not been honoured by the borrower or when there are other indicators that the loan may be impaired.
The non-performing book is split into two classes, namely municipalities and other. This is done because the characteristics of the classes differ. For municipalities, the recovery rate is based on the Municipal Loss Given Default model developed. For the other loans each non-performing borrower is individually assessed to determine its recovery rate.
Unidentified impairmentThe performing book is assessed for impairment in order to provide for latent credit losses in the portfolio that have not yet been individually identified. An impairment for incurred but not reported losses is calculated based on historic loss patterns, estimated emergence periods and the Bank’s internal credit risk rating system.
1.2.9 CASH AND CASH EQUIVALENTSCash and cash equivalents include notes and coins on hand, call deposits and fixed deposits, callable on demand and highly liquid financial assets with original maturities of less than three months, which are subject to insignificant risk of changes in their fair value and are used by the Bank in the management of its short-term commitments.
Cash and cash equivalents are measured at amortised cost in the statement of financial position.
1.2.10 LOANS TO SHAREHOLDERS, DIRECTORS, MANAGERS AND EMPLOYEESThese financial assets are initially recognised at cost plus direct transaction costs.
Subsequently, these loans are measured at amortised cost using the effective interest method, less any impairment loss recognised to reflect irrecoverable amounts.

03 NOTES TO THE ANNUAL FINANCIAL STATEMENTS
ACCOUNTING POLICIES CONTINUEDFOR THE YEAR ENDED 31 MARCH 2017
1. STATEMENT OF COMPLIANCE CONTINUED1.3 IMPAIRMENT OF NON-FINANCIAL ASSETS
The Bank assesses at each reporting date whether there is any indication that an asset may be impaired. If any such indication exists, the Bank estimates the recoverable amount of the asset.
An impairment loss is recognised for the amount by which the carrying amount of an asset exceeds its recoverable amount. The recoverable amount is the higher of the fair value of the asset less costs to sell and value-in-use. Value- in-use is the present value of projected cash flows covering the remaining useful life of the asset.
Intangible assets that have an indefinite useful life and are not subject to amortisation, as well as intangible assets that are not yet available for use, are tested annually for impairment at each reporting date. Assets that are subject to amortisation are reviewed for impairment whenever events or changes in circumstances indicate that the carrying amount may not be recoverable.
A reversal of an impairment loss of assets, measured at cost less accumulated depreciation or amortisation and impairment losses, is recognised immediately in profit or loss. Any reversal of an impairment loss of a revalued asset is treated as a revaluation increase to the extent that it exceeds the amount of impairment previously recognised in profit or loss.
The increased carrying amount of an asset, other than goodwill attributable to a reversal of an impairment loss, does not exceed the carrying amount that would have been determined had no impairment loss been recognised for the asset in prior periods.
1.4 PROPERTY, PLANT AND EQUIPMENT1.4.1 RECOGNITION AND MEASUREMENT
Items of property and equipment are measured at cost less accumulated depreciation and impairment losses, except for land and buildings, which are measured at fair value less accumulated depreciation and impairment losses, in terms of the revaluation model. Land and buildings are revalued every year either by an independent valuator or by management.
After recognition as an asset, an item of property and equipment whose fair value can be measured reliably shall be carried at a revalued amount, being its fair value at the date of the revaluation less any subsequent accumulated depreciation and subsequent accumulated impairment losses. Revaluations shall be made with sufficient regularity to ensure that the carrying amount does not differ materially from that which would be determined using fair value at the end of the reporting period.
Cost includes expenditures that are directly attributable to the acquisition of the asset. Purchased software that is integral to the functionality of the related equipment is capitalised as part of that equipment.
When parts of an item of property and equipment have different useful lives, they are accounted for as separate components of property and equipment and depreciated accordingly.
Gains and losses on disposal of an item of property and equipment are determined by comparing the proceeds from disposal with the carrying amount of property and equipment and are recognised in profit or loss. When revalued land and buildings are sold, the amounts included in the revaluation surplus reserve are transferred to retained earnings.
Freehold land and buildings are subsequently carried at fair value, based on periodic valuations performed either by an independent valuator or management. Changes in fair value are recognised in other comprehensive income and accumulated in the revaluation reserve except to the extent that any decrease in value in excess of the credit balance on the revaluation reserve, or reversal of such a transaction, is recognised in profit or loss.
Leasehold improvements buildings leased are capitalised and are amortised over the lease term.
1.4.2 SUBSEQUENT COSTSSubsequent costs are included in the asset’s carrying amount only when it is probable that future economic benefits associated with the items will flow to the Bank and the cost of the item can be measured reliably. All other repairs and maintenance costs are recognised in profit or loss when incurred.
1.4.3 DEPRECIATIONDepreciation is recognised in profit or loss on a straight-line basis over the estimated useful life of each part of an item of property and equipment. Land is not depreciated.
The estimated useful lives for the current and comparative periods are as follows:
Item Estimated useful life
Buildings 40 yearsLeasehold improvements 3 yearsFurniture and fittings 10 yearsOffice equipment 5 – 10 yearsMotor vehicles 4 – 5 yearsComputer equipment 3 years
The useful lives, depreciation methods and the residual values of assets are reviewed and adjusted annually, if appropriate. Changes resulting from this review are accounted for prospectively as changes in estimates.
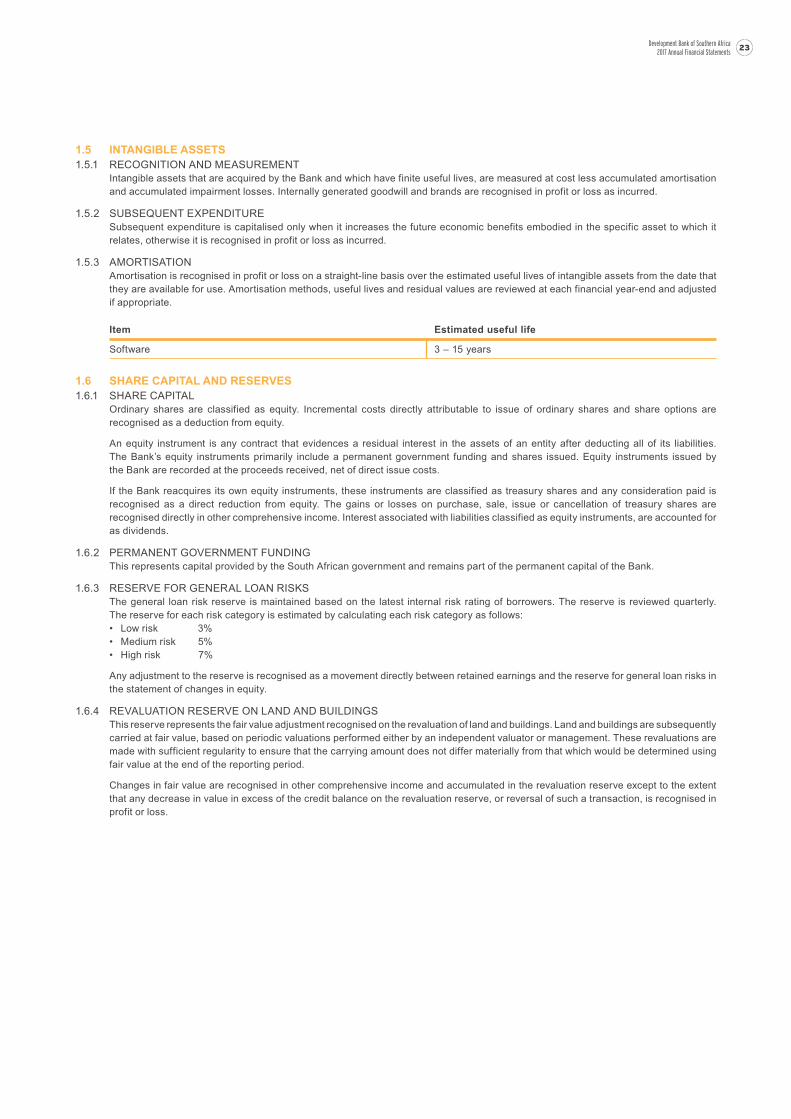
Development Bank of Southern Africa2017 Annual Financial Statements
23
1.5 INTANGIBLE ASSETS1.5.1 RECOGNITION AND MEASUREMENT
Intangible assets that are acquired by the Bank and which have finite useful lives, are measured at cost less accumulated amortisation and accumulated impairment losses. Internally generated goodwill and brands are recognised in profit or loss as incurred.
1.5.2 SUBSEQUENT EXPENDITURESubsequent expenditure is capitalised only when it increases the future economic benefits embodied in the specific asset to which it relates, otherwise it is recognised in profit or loss as incurred.
1.5.3 AMORTISATIONAmortisation is recognised in profit or loss on a straight-line basis over the estimated useful lives of intangible assets from the date that they are available for use. Amortisation methods, useful lives and residual values are reviewed at each financial year-end and adjusted if appropriate.
Item Estimated useful life
Software 3 – 15 years
1.6 SHARE CAPITAL AND RESERVES1.6.1 SHARE CAPITAL
Ordinary shares are classified as equity. Incremental costs directly attributable to issue of ordinary shares and share options are recognised as a deduction from equity.
An equity instrument is any contract that evidences a residual interest in the assets of an entity after deducting all of its liabilities. The Bank’s equity instruments primarily include a permanent government funding and shares issued. Equity instruments issued by the Bank are recorded at the proceeds received, net of direct issue costs.
If the Bank reacquires its own equity instruments, these instruments are classified as treasury shares and any consideration paid is recognised as a direct reduction from equity. The gains or losses on purchase, sale, issue or cancellation of treasury shares are recognised directly in other comprehensive income. Interest associated with liabilities classified as equity instruments, are accounted for as dividends.
1.6.2 PERMANENT GOVERNMENT FUNDINGThis represents capital provided by the South African government and remains part of the permanent capital of the Bank.
1.6.3 RESERVE FOR GENERAL LOAN RISKSThe general loan risk reserve is maintained based on the latest internal risk rating of borrowers. The reserve is reviewed quarterly. The reserve for each risk category is estimated by calculating each risk category as follows:• Low risk 3%• Medium risk 5%• High risk 7%
Any adjustment to the reserve is recognised as a movement directly between retained earnings and the reserve for general loan risks in the statement of changes in equity.
1.6.4 REVALUATION RESERVE ON LAND AND BUILDINGSThis reserve represents the fair value adjustment recognised on the revaluation of land and buildings. Land and buildings are subsequently carried at fair value, based on periodic valuations performed either by an independent valuator or management. These revaluations are made with sufficient regularity to ensure that the carrying amount does not differ materially from that which would be determined using fair value at the end of the reporting period.
Changes in fair value are recognised in other comprehensive income and accumulated in the revaluation reserve except to the extent that any decrease in value in excess of the credit balance on the revaluation reserve, or reversal of such a transaction, is recognised in profit or loss.

03 NOTES TO THE ANNUAL FINANCIAL STATEMENTS
ACCOUNTING POLICIES CONTINUEDFOR THE YEAR ENDED 31 MARCH 2017
1. STATEMENT OF COMPLIANCE CONTINUED1.7 REVENUE
Revenue is derived from the business of development activities and substantially comprises interest income. Revenue is recognised to the extent that it is probable that the economic benefits will flow to the Bank and the revenue can be reliably measured. The following specific recognition criteria must also be met before revenue is recognised.
1.7.1 INTERESTInterest income and expense are recognised in profit or loss using the effective interest method. The effective interest rate is the rate that exactly discounts the estimated future cash payments and receipts through the expected life of the financial asset or liability (or, where appropriate, a shorter period) to the carrying amount of the financial asset or liability. The effective interest rate is established on initial recognition of the financial asset or liability and is not revised subsequently. When calculating the effective interest rate, the Bank estimates future cash flows considering all contractual terms of the financial instrument, but not future credit losses.
The calculation of the effective interest rate includes costs, discounts and premiums paid or received that are an integral part of the effective interest rate. Transaction costs include incremental costs that are directly attributable to the acquisition or issue of a financial asset or liability.
Interest income and expense presented in the statement of comprehensive income include:• Interest on financial assets and financial liabilities, measured at amortised cost calculated on an effective interest basis;• Interest on available-for-sale investment securities calculated on an effective interest basis;• Interest on financial assets and financial liabilities held at fair value through profit or loss, calculated on an effective interest basis; and• The interest portion of the derivatives designated as fair value hedges.
Where non-performing financial assets have been impaired, interest income continues to be recognised to the extent that the asset is not impaired on the original effective interest rate.
1.7.2 FEES AND COMMISSIONOther fee income, including account servicing fees, agency management fees, investment management fees, placement fees and syndication fees, is recognised as the related services are performed. When a loan commitment is not expected to result in the drawdown of a loan, loan commitment fees are recognised on a straight-line basis over the commitment period.
Upfront fees are deferred and recognised over the term of the loan.
Other fees and commission expense relates mainly to transaction and service fees, which are expensed as the services are received.
1.8 FOREIGN CURRENCY TRANSLATIONS FUNCTIONAL AND PRESENTATION CURRENCY
A foreign currency transaction is recorded, on initial recognition in rands, by applying to the foreign currency amount the spot exchange rate between the functional currency and the foreign currency at the date of the transaction.
At each statement of financial position date:• foreign currency monetary items are translated using the closing rate;• non-monetary items that are measured in terms of historical cost in a foreign currency are translated using the exchange rate at the
date of the transaction; and• non-monetary items that are measured at fair value in a foreign currency are translated using the exchange rates at the date when the
fair value was determined.
Items included in the Annual Financial Statements of the Bank are measured using the currency of the primary economic environment in which the entity operates (the “functional currency”). The Bank’s Annual Financial Statements are presented in South African rand, which is the Bank’s functional currency.
1.9 NET INCOME FROM OTHER FINANCIAL INSTRUMENTS AT FAIR VALUENet (loss)/gain from financial assets and liabilities relates to changes in fair values of derivatives held for risk management purposes and financial assets and liabilities designated at fair value through profit or loss.
1.10 DETERMINATION OF FAIR VALUESA number of the Bank’s accounting policies and disclosures require the determination of fair value, for both financial and non-financial assets and liabilities. Fair values have been determined for measurement and/or disclosure purposes based on the following methods. Where applicable, further information about the assumptions made in determining fair values is disclosed in the note specific to that asset or liability.

Development Bank of Southern Africa2017 Annual Financial Statements
25
1.10.1 PROPERTY AND EQUIPMENTThe fair value of land and buildings is based on an annual valuation performed either by an independent valuator or management.
1.10.2 POST-RETIREMENT MEDICAL BENEFITS INVESTMENTThe fair value of the post-retirement medical benefits investment is based on the listed market price.
1.10.3 FINANCIAL INSTRUMENTSSome of the Bank’s financial instruments are measured at fair value, such as those that are designated by management as at fair value through profit and loss, available-for-sale and derivative financial instruments.
The fair value of a financial instrument is the price that will be received to sell an asset or paid to transfer a liability in an orderly transaction between market participants at the measurable date.
The method of determining the fair value of financial instruments can be split into the following categories:(a) Level 1 – Unadjusted quoted prices in active markets where the quoted price is readily available and the price represents actual and
regularly occurring market transactions on an arm’s length basis.(b) Level 2 – Valuation techniques using market observable inputs. Such techniques may include: using recent arm’s-length market
transactions, reference to the current fair value of similar instruments and discounted cash flow analysis, pricing models or other techniques commonly used by market participants.
(c) Level 3 – Valuation techniques, as described in (b) above, for which not all inputs are market observable prices or rates. Such a financial instrument is initially recognised at the transaction price, which is the best indicator of fair value, although the value obtained from the relevant valuation model may differ. The difference between the transaction price and the model value, commonly referred to as day one profit or loss, is either amortised over the life of the transaction, deferred until the instrument’s fair value can be determined using market observable inputs, or realised through settlement.
The valuation techniques in (b) and (c) use as inputs interest rate yield curves, equity prices, commodity and currency prices/yields, volatilities of underlyings and correlations between inputs. The models used in these valuation techniques are calibrated against industry standards, economic models and observable transaction prices where available.
The fair value of financial assets at fair value through profit or loss and available-for-sale financial assets is determined by reference to their quoted bid price at the reporting date.
The following summarises the major methods and assumptions used in estimating the fair values of financial instruments, as reflected in notes 3 and 4.
EQUITY INVESTMENTSAfter initial recognition, the Bank measures equity investments at fair value through profit or loss as follows:
Unquoted equity instruments whose fair values cannot be reliably measured are held at cost. If the market for an equity financial instrument is not active, the Bank uses a valuation technique to establish what the transaction price would be in an arm’s-length transaction motivated by normal business considerations.
The Bank uses valuation techniques in measuring equity instruments, including:• Price of recent investment, if available;• Discounted cash flow analysis based on free cash flows, earnings or dividends using market-related adjusted discount rates;• Price earnings growth (PEG); and• Option pricing models.
The Bank ensures that these valuation techniques:• Make maximum use of market inputs and where applicable rely on entity-specific inputs;• Incorporate all factors that market participants would consider in setting a price; and• Are consistent with accepted economic methodologies for pricing financial instruments.
Equity investments held-to-maturity consist of preference shares and debentures.
1.10.4 INVESTMENT SECURITIESIn the case of instruments for which actively quoted market prices are available, the fair value of financial instruments is based on the quoted market price at reporting date, without any deduction for transaction costs. These market prices are based on capital and interest. Where actively quoted market prices are not available, the fair value is determined through discounted cash flow techniques, using market interest rates taking into account the credit quality and duration of the instrument.

03 NOTES TO THE ANNUAL FINANCIAL STATEMENTS
ACCOUNTING POLICIES CONTINUEDFOR THE YEAR ENDED 31 MARCH 2017
1. STATEMENT OF COMPLIANCE CONTINUED1.10 DETERMINATION OF FAIR VALUES CONTINUED1.10.5 DERIVATIVES
The fair value of forward exchange contracts is determined by discounting the contractual future cash flows at the relevant market curves and netting off at the rand spot exchange rate as at the reporting date.
The fair value of interest rate and cross-currency swaps is the estimated amount that the Bank would receive or pay to terminate the swap at the reporting date, taking into account current interest rates and foreign exchange rates and the creditworthiness of the respective swap counterparties. The fair value of derivatives that are not exchange-traded is estimated using discounted cash flow valuation methods with inputs limited, to the extent possible, to market observable data.
Where discounted cash flow techniques are used, future cash flows are based on contractual cash flows and the discount rate is a market-related rate at the reporting date for an instrument with similar terms and conditions.
Interest-bearing loans and borrowingsThe fair value of interest-bearing loans is determined through discounted cash flow analyses, using market-derived discount rates as at the reporting date. The Bank does not believe that there is a comparable market for its targeted infrastructure programme development loans.
Interest rates used for determining fair valueThe Bank uses market-derived discount curves as at the reporting date. Future cash flows are based on contractual cash flows and, where market observable inputs are not available, management makes use of best estimates to determine the appropriate credit spread to apply.
1.11 PROVISIONS, CONTINGENT LIABILITIES AND CONTINGENT ASSETSProvisions are recognised if, as a result of a past event, the Bank has a present legal or constructive obligation that can be estimated reliably and it is probable that an outflow of economic resources will be required to settle the obligation. When the effect of discounting is material, provisions are discounted using an appropriate discount rate that reflects the current market assessment of the time value of money and, where appropriate, the risks specific to the liability.
Provisions are recognised for onerous contracts when the expected benefits to be derived by the Bank from a contract are less than the unavoidable costs of meeting the obligations under the contract. The provision is measured at the present value of the lower of the expected cost of terminating the contract and the expected net cost of continuing with the contract. Before a provision is established, the Bank recognises any impairment loss on the assets associated with that contract.
Restructuring provisions are recognised when the Bank has developed a detailed formal plan for restructuring and has raised a valid expectation that it will carry out the restructuring by starting to implement the plan or announcing its main features to those affected by it. The measurement of a restructuring provision includes only the direct expenditures arising from the restructuring and is recorded in other operating expenses in profit or loss.
Provisions are reviewed at the end of each financial year and are adjusted to reflect current best estimates.
1.12 FINANCIAL GUARANTEESFinancial guarantees are contracts that require the Bank to make specified payments to reimburse the holder for a loss it incurs because a specified debtor fails to make payment when due in accordance with the terms of a debt instrument.
Financial guarantee liabilities are initially recognised at their fair value and the initial fair value is amortised over the life of the financial guarantee. The guarantee liability is subsequently measured at the higher of the amortised amount and the best estimate in accordance with IAS 37. Financial guarantees are included in other financial liabilities.
1.13 EMPLOYEE BENEFITS1.13.1 DEFINED CONTRIBUTION PLAN
Obligations for contributions to defined contribution provident fund plans are recognised as an expense in profit or loss when they are due.
1.13.2 DEFINED BENEFIT PLANThe Bank contributes to a defined benefit plan for post-retirement medical benefits for eligible employees and pensioners. The Bank currently holds an investment that is used to partly fund the liability for the post-retirement medical benefit. This investment does not meet the definition of a “Plan Asset” and is not offset against the post-retirement obligation.
A defined benefit plan is a post-employment benefit plan other than a defined contribution plan.
The Bank’s net obligation in respect of a defined benefit plan is calculated separately for each plan by estimating the amount of future benefit that employees have earned in return for their service in the current and prior periods; that benefit is discounted to determine its present value. Any unrecognised past service costs and the fair value of any plan assets are deducted. The discount rate is the yield at the reporting date on AA credit-rated bonds that have maturity dates approximating the terms of the Bank’s obligations and that are denominated in the same currency in which the benefits are expected to be paid. The calculation is performed annually by a qualified actuary, using the projected unit credit method.
When the calculation results in a benefit to the Bank, the recognised asset is limited to the net total of any unrecognised past service costs and the present value of any future refunds from the plan or reductions in future contributions to the plan.

Development Bank of Southern Africa2017 Annual Financial Statements
27
When the benefits of a plan are improved, the portion of the increased benefit relating to past service by employees is recognised in profit or loss on a straight-line basis over the average period until the benefits become vested. To the extent that the benefits vest immediately, the expense is recognised immediately in profit or loss.
The Bank recognises all actuarial gains and losses arising from defined benefit plans directly in profit and loss.
1.13.3 TERMINATION BENEFITSTermination benefits are recognised as an expense when the Bank is demonstrably committed, without realistic possibility of withdrawal, to a formal detailed plan to terminate employment before the normal retirement date. Termination benefits for voluntary redundancies are recognised if the Bank has made an offer encouraging voluntary redundancy, it is probable that the offer will be accepted and the number of acceptances can be estimated reliably.
1.13.4 SHORT-TERM EMPLOYEE BENEFITSShort-term employee benefit obligations including annual leave are measured on an undiscounted basis and are expensed as the related service is provided.
A liability is recognised for the amount expected to be paid under short-term cash bonus plans if the Bank has a present legal or constructive obligation to pay this amount as a result of past service provided by the employee and the obligation can be estimated reliably.
1.13.5 HOME OWNERSHIP SCHEMEThe Bank operated a home ownership scheme in terms of which mortgage bonds were provided to the Bank’s employees at reduced interest rates. The loans are measured at amortised cost less any impairment losses.
1.14 CONTINGENT LIABILITIES AND COMMITMENTSTransactions are classified as contingencies when the Bank’s obligations depend on uncertain future events not within the Bank’s control. Items are classified as commitments when the Bank commits itself to future transactions with external parties.
1.15 OTHER OPERATING INCOMEOther fee income is recognised as the related services are performed.
Dividends are recognised when the Bank’s right to receive payment is established, which is typically when the dividend is declared. Dividends are incorporated in other income, which is separately disclosed in the notes to the statement of comprehensive income.
1.16 EVENTS AFTER THE REPORTING PERIODAn event, which could be favourable or unfavourable, that occurs between the end of the reporting period and the date that the Annual Financial Statements are authorised for issue.
Adjusting event: An event after the reporting period that provides further evidence of conditions that existed at the end of the reporting period, including an event that indicates that the going concern assumption in relation to the whole or part of the enterprise is not appropriate.
Non-adjusting event: An event after the reporting period that is indicative of a condition that arose after the end of the reporting period.
1.17 RELATED PARTIESThe Bank operates in an economic environment currently dominated by entities directly or indirectly owned by the South African government. As a result of the constitutional independence of all three spheres of government (national, provincial and local) in South Africa, only parties within the national sphere of government will be considered to be related parties.
Key management is defined as being individuals with the authority and responsibility for planning, directing and controlling activities of the Bank. All individuals from Executive Management up to the Board of Directors are key management individuals in their dealings with the Bank.
Close family members of key management personnel are considered to be those family members who may be expected to influence or be influenced by key management individuals in their dealings with the Bank.
Other related party transactions are also disclosed in terms of the requirements of IAS 24. The objective of the standard and the Annual Financial Statements is to provide relevant and reliable information and therefore materiality is considered in the disclosure of these transactions.
1.18 LEASESA lease is classified as a finance lease if it transfers substantially all the risks and rewards incidental to ownership. A lease is classified as an operating lease if it does not transfer substantially all the risks and rewards incidental to ownership.
Assets held by the Bank under leases which transfer to the Bank substantially all of the risks and rewards of ownership are classified as finance leases. On initial recognition, the leased asset is measured at an amount equal to the lower of its fair value and the present value of the minimum lease payments. Subsequent to initial recognition, the asset is accounted for in accordance with the accounting policy applicable to that asset. Assets held under other leases are classified as operating leases and are not recognised in the Bank’s statement of financial position.
OPERATING LEASES – LESSEEOperating lease payments are recognised as an expense on a straight-line basis over the lease term.

03 NOTES TO THE ANNUAL FINANCIAL STATEMENTS
ACCOUNTING POLICIES CONTINUEDFOR THE YEAR ENDED 31 MARCH 2017
1. STATEMENT OF COMPLIANCE CONTINUED1.19 NON-CURRENT ASSETS HELD-FOR-SALE
Non-current assets and disposal groups are classified as held-for-sale if their carrying amount will be recovered through a sales transaction rather than through continuing use. This condition is regarded as met only when the sale is highly probable and the asset (or disposal group) is available for immediate sale in its present condition. Management must be committed to the sale, which should be expected to qualify for recognition as a completed sale within one year from the date of classification.
Non-current assets held-for-sale (or disposal groups) are measured at the lower of their carrying amount and fair value less costs to sell.
A non-current asset is not depreciated (or amortised) while it is classified as held-for-sale or while it is part of a disposal group classified as held-for-sale.
Interest and other expenses attributable to the liabilities of a disposal group classified as held-for-sale are recognised in profit or loss.
1.20 SEGMENTAL REPORTINGAn operating segment is a distinguishable component of the Bank that engages in business activities from which it may earn revenues and incur expenses, including revenues and expenses that relate to transactions with any of the Bank’s other components, whose operating results are reviewed regularly by the Bank’s Executive Committee (being the chief operating decision-maker) to make decisions about resources allocated to each segment and assess its performance, and for which discrete financial information is available.

Development Bank of Southern Africa2017 Annual Financial Statements
29
NOTES TO THE ANNUAL FINANCIAL STATEMENTSFOR THE YEAR ENDED 31 MARCH 2017
1. NEW STANDARDS AND INTERPRETATIONSThe following new standards and annual improvements have been issued by the IASB and are not yet effective.
IFRS 9: Financial Instruments (Applicable for annual periods beginning on or after 1 January 2018).
The Accounting Standards Board finalised IFRS 9 in June 2015. The new standard replaces IAS 39 and is applicable for periods commencing on or after 1 January 2018.
The first year of implementation for the Bank will be for the financial year ending 31 March 2019 with comparatives for the financial year ended 31 March 2018.
The standard has introduced a new expected loss impairment model that will require impairment losses to be recognised on an expected loss basis. This new model will apply to financial assets measured at either amortised cost or fair value through other comprehensive income, as well as certain off-balance sheet exposure.
With the exception of purchased or originated credit impaired financial assets, expected credit losses are required to be measured through a loss allowance at an amount equal to either 12-month expected credit losses or lifetime expected credit losses.
A loss allowance for full lifetime expected credit losses is required for a financial instrument if the credit risk of that financial instrument has increased significantly since initial recognition. For all other financial instruments, expected credit losses are measured at an amount equal to 12-month expected credit losses.
The Bank initiated an IFRS 9 project aimed at ensuring an effective and smooth transition to the new standard. The process involves conducting a gap analysis of the current methodology, processes, systems and credit models to ensure improvements are made to align with IFRS 9.
The significance of IFRS 9 adoption is expected to be on impairments with the transition from incurred loss model to an expected loss model. The definition of significant increase in credit risk is a significant focus area for the Bank in assessing the classification of loans from Stage 1 to Stage 2. Based on preliminary assessments, it is expected that impairments will increase as a result of adoption of IFRS 9 given the long-dated nature of the DBSA loans. The actual quantum has not been reliably estimated given the improvements needed to align the credit models for IFRS 9 compliance.
The change in fair value of financial liabilities that are designated at fair value through profit and loss due to changes in own credit risk will be required to be to be recognised within other comprehensive income.
The impact of this standard on the Bank has not yet been fully determined.
All other standards and interpretations issued but not yet effective were assessed and are not expected to have a material impact on the Bank.
2. SEGMENTAL INFORMATIONThe Bank has four reportable segments, as listed below, which are the Bank’s strategic business units. These business units are managed separately, based on the Bank’s management and internal reporting structure for each of the strategic business units. The Bank’s Executive Committee reviews internal management reports on at least a quarterly basis.
The following are the Bank’s reportable segments:• South Africa Financing;• International Financing;• Infrastructure Delivery division; and• Treasury.

NOTES TO THE ANNUAL FINANCIAL STATEMENTS CONTINUEDFOR THE YEAR ENDED 31 MARCH 2017
03 NOTES TO THE ANNUAL FINANCIAL STATEMENTS
2. SEGMENTAL INFORMATION CONTINUED OPERATING REPORTABLE SEGMENTS
South Africa Financing International Financing
in thousands of rands March 2017 March 2016 March 2017 March 2016
Interest income on development loans 5 631 636 4 872 911 1 279 756 1 178 603Interest income on development bonds 122 001 122 301 – –Interest income on investments 10 268 6 467 15 704 1 161
Total interest income 5 763 905 5 001 679 1 295 460 1 179 764Interest expense (3 182 602) (2 851 417) (325 719) (312 920)
Net interest income 2 581 303 2 150 262 969 741 866 844Non-interest income 149 406 113 957 737 062 66 804
Net fee income 94 117 69 684 90 299 35 058Dividends 5 855 12 524 9 975 6 271Other operating income 49 434 31 749 636 788 25 475
Operating income 2 730 709 2 264 219 1 706 803 933 648Expenses 117 813 (465 918) (649 914) (1 166 930)
Operating expenses (128 260) (138 362) (62 982) (69 141)Depreciation and amortisation – – – –Net impairment on financial assets 246 073 (327 556) (586 932) (1 097 789)
Development expenditure1 (27 181) (43 869) – –Project preparation expenditure – – – –Revaluation of equity investments2 13 981 (54 963) 67 482 308 135Grants – – – –
Sustainable earnings 2 835 322 1 699 469 1 124 371 74 853Net foreign exchange (loss)/gain3 – – – –Net (loss)/gain from financial assets and liabilities2 – – – –
Retained profit/(loss) 2 835 322 1 699 469 1 124 371 74 853
Capital expenditure – – – –
Development loans 56 459 067 53 240 145 15 046 111 16 254 809Development bonds 1 290 319 1 290 296 – –Equity investments 2 967 188 2 838 140 3 005 321 3 440 435Other assets 361 161 717 1 201
Total assets 60 716 935 57 368 742 18 052 149 19 696 445Total liabilities 38 229 131 37 716 257 9 514 833 12 533 501
Key ratios by segments
Cost-to-income (%) 6 8 4 7 Debt-to-assets ratio (%) 63 66 53 64 Net interest income (%) 45 43 75 73 Return on assets (%) 5 3 6 0.4
* All Other segments include Corporate Services, Risk, CEO, Finance Operations, Strategy and Finance divisions. 1. Development expenditure relates to loan commitments in support of under-resourced municipalities.
3. Treasury is responsible for foreign exchange management across the DBSA and as such all foreign exchange gains and losses have been reallocated to Treasury.

Development Bank of Southern Africa2017 Annual Financial Statements
31
Infrastructure Delivery Treasury *All other Total
March 2017 March 2016 March 2017 March 2016 March 2017 March 2016 March 2017 March 2016
– – – – – – 6 911 392 6 051 514– – – – – – 122 001 122 301– 4 313 729 359 438 – 143 339 701 367 213
– 4 313 729 359 438 – 143 7 373 094 6 541 028(88) – (195 351) (191 065) – (27) (3 703 760) (3 355 429)
(88) 4 118 378 168 373 – 116 3 669 334 3 185 599139 839 194 263 (11 211) (11 417) 37 260 46 662 1 052 356 410 269
112 535 132 511 (11 211) (11 417) 32 526 50 078 318 266 275 914– – – – – – 15 830 18 795
27 304 61 752 – – 4 734 (3 416) 718 260 115 560
139 751 194 267 107 167 156 956 37 260 46 778 4 721 690 3 595 868(179 294) (167 385) (13 255) (9 877) (451 836) (591 232) (1 176 486) (2 401 342)
(177 470) (167 062) (13 255) (9 877) (423 821) (560 148) (805 788) (944 590)(1 824) (1 259) – – (29 425) (29 334) (31 249) (30 593)
– 936 – – 1 410 (1 750) (339 449) (1 426 159)
– – – – – – (27 181) (43 869)– – – – (24 453) (14 651) (24 453) (14 651)– – – – – – 81 463 253 172– – – – (10 718) (4 129) (10 718) (4 129)
(39 543) 26 882 93 912 147 079 (449 747) (563 234) 3 564 315 1 385 049– – (618 649) 1 002 172 – – (618 649) 1 002 172– – (120 090) 199 017 (4 727) (9 559) (124 817) 189 458
(39 543) 26 882 (644 827) 1 348 268 (454 474) (572 793) 2 820 849 2 576 679
– 770 – – 26 372 29 876 26 372 30 646
– – – – – – 71 505 178 69 494 954– – – – – – 1 290 319 1 290 296– – – – – – 5 972 509 6 278 575
107 200 122 597 4 210 258 4 499 231 566 537 658 981 4 885 073 5 282 171
107 200 122 597 4 210 258 4 499 231 566 537 658 981 83 653 079 82 345 99691 735 67 590 711 607 122 157 3 074 397 2 641 432 51 621 703 53 080 937
128 87 12 6 19 29 86 55 17 3 62 64
– – 38 47 50 49 (37) 22 (15) 30 3 3

NOTES TO THE ANNUAL FINANCIAL STATEMENTS CONTINUEDFOR THE YEAR ENDED 31 MARCH 2017
03 NOTES TO THE ANNUAL FINANCIAL STATEMENTS
3. FINANCIAL ASSETS BY CATEGORYThe table below sets out the Bank’s classification of financial assets and their fair values.
in thousands of rands NotesLoans and
receivables
Non-financial
items
Fair value through profit or
lossHeld-to-maturity
Available-for-sale
Total carrying amount
Fair Value
March 2017Cash and cash equivalents 5 2 299 247 – – – – 2 299 247 2 299 247Trade and other receivables 6 61 094 60 888 – – – 121 982 121 982Investment securities 7 – – 853 322 – 215 763 1 069 085 1 069 085Derivative assets held for risk management 8.1 – – 846 141 – – 846 141 846 141Equity investments 10 – – 5 972 509 – – 5 972 509 5 972 509Development loans 13 71 505 178 – – – – 71 505 178 73 892 596Development bonds 12 – – – 1 290 319 – 1 290 319 1 190 131
73 865 519 60 888 7 671 972 1 290 319 215 763 83 104 461 85 391 691
in thousands of randsLevel 1
Category Level 2
CategoryLevel 3
Category Total
Investment securities 1 069 085 – – 1 069 085Derivative assets held for risk management – 846 141 – 846 141Equity investments – 5 438 239 534 270 5 972 509
1 069 085 6 284 380 534 270 7 887 735
in thousands of rands NotesLoans and
receivables
Non-financial
items
Fair value through profit or
lossHeld-to-maturity
Available-for-sale
Total carrying amount
Fair Value
March 2016Cash and cash equivalents 5 2 084 565 – – – – 2 084 565 2 084 565Trade and other receivables 6 68 057 70 476 – – – 138 533 138 533Investment securities 7 – – 1 143 541 33 331 88 346 1 265 218 1 299 993Derivative assets held for risk management 8.1 – – 1 163 533 – – 1 163 533 1 163 533Equity investments 10 – – 6 278 575 – – 6 278 575 6 278 575Development loans 13 69 494 954 – – – – 69 494 954 77 660 023Development bonds 12 – – – 1 290 296 – 1 290 296 1 159 450
71 647 576 70 476 8 585 649 1 323 627 88 346 81 715 674 89 784 672
in thousands of randsLevel 1
Category Level 2
Category Level 3
Category Total
Investment securities 1 299 906 87 – 1 299 993Derivative assets held for risk management – 1 163 533 – 1 163 533Equity investments – 5 358 105 920 470 6 278 575
1 299 906 6 521 725 920 470 8 742 101

Development Bank of Southern Africa2017 Annual Financial Statements
33
4. FINANCIAL LIABILITIES BY CATEGORYThe table below sets out the Bank’s classification of financial liabilities and their fair values.
in thousands of rands Notes At amortised
cost
Designated at fair value
through profit or loss
Total carrying amount Fair Value
March 2017Trade and other payables 16 838 591 – 838 591 838 591Funding: debt securities 19 30 117 774 6 336 487 36 454 261 37 732 166Funding: lines of credit 20 14 015 426 – 14 015 426 13 708 296Derivative liabilities held for risk management 8.2 – 142 857 142 857 142 857
44 971 791 6 479 344 51 451 135 52 421 910
in thousands of randsLevel 1
CategoryLevel 2
CategoryLevel 3
Category Total
Funding: debt securities 37 732 166 – – 37 732 166Funding: lines of credit – 13 708 296 – 13 708 296Derivative liabilities held for risk management – 142 857 – 142 857
37 732 166 13 851 153 – 51 583 319
in thousands of rands NotesAt amortised
cost
Designated at fair value
through profit or loss
Total carrying amount Fair Value
March 2016Trade and other payables 16 894 795 – 894 795 894 795Funding: debt securities 19 29 082 355 6 188 780 35 271 135 36 375 212Funding: lines of credit 20 16 371 534 – 16 371 534 17 065 034Derivative liabilities held for risk management 8.2 – 148 551 148 551 148 551
46 348 684 6 337 331 52 686 015 54 483 592
in thousands of randsLevel 1
CategoryLevel 2
categoryLevel 3
Category Total
Funding: debt securities 36 375 212 – – 36 375 212Funding: lines of credit – 17 065 034 – 17 065 034Derivative liabilities held for risk management – 148 551 – 148 551
36 375 212 17 213 585 – 53 588 797
in thousands of rands 2017 2016
5. CASH AND CASH EQUIVALENTSCash and cash equivalents consist of:Call deposits 2 087 993 1 818 532Cash at bank 211 254 266 033
2 299 247 2 084 565
The average interest rate earned on fixed and call deposits detailed above was 7.29% (March 2016: 6.4%). The Bank’s exposure to interest rate risk and sensitivity analysis for financial assets and financial liabilities is disclosed in note 43.

NOTES TO THE ANNUAL FINANCIAL STATEMENTS CONTINUEDFOR THE YEAR ENDED 31 MARCH 2017
03 NOTES TO THE ANNUAL FINANCIAL STATEMENTS
in thousands of rands 2017 2016
6. TRADE AND OTHER RECEIVABLESTrade and other receivables 63 359 71 170Less: allowance for credit losses on trade and other receivables (2 265) (3 113)
61 094 68 057VAT 743 6 167Prepayments 10 627 13 144Deposits 88 480Staff loans (current employees) 37 21Subsistence and travel 331 1 527Payroll expenses receivable 840 3 900Home ownership scheme loans – 1 765Accrued interest (financial market assets) 48 222 43 472
Balance at the end of the year 121 982 138 533
Allowance for credit losses on trade and other receivables reconciliationBalance at the beginning of the year (3 113) (2 479)Decrease/(increase) in provision for allowance for credit losses on trade and other receivables (refer to note 35) 848 (634)
Balance at the end of the year (2 265) (3 113)
Staff loans are for current employees and are interest free. The interest that should have been payable on this account would have been R3 438 (March 2016: R2 033) at a rate of 9.25%.
Included in trade and other receivables are:African Capacity Building Foundation (ACBF) 103 103African Peer Review Mechanism (APRM) – 585African World Heritage Fund (AWHF) – 9Anglo American Capacity Building Programme 2 786 641Cities Project Preparation Facility (CPPF) – 1Department of Basic Education for Accelerated Infrastructure Schools Programme 8 769 15 229Department of Trade and Industry 2 121 3 296Eastern Cape Department of Education 1 596 18 135Ekurhuleni Metropolitan Municipality 10 221 10 335Elliotdale Rural Human Settlement 2 199 5Ex-employees debtors 1 991 2 306Green Fund 70 86Independent Power Producers (IPP) Office 5 393 4 342Industrial Development Corporation (IDC) – 730Infrastructure Delivery Improvement Programme (IDIP) 57 1 094Infrastructure Investment Programme for South Africa (IIPSA) 1 1Jobs Fund 381 360KFW HIV/VCT 2 Programme 576 1 414KFW SADC Water Fund 1 167 1 366KwaZulu-Natal Department of Education 4 626 375Land and Agricultural Development Bank 228 228Limpopo Department of Education 5 480 –Limpopo Department of Health 453 1 827Limpopo Department of Public Works 844 3 614Municipal Infrastructure Support Agency (MISA) – 180National Department of Health 11 143 3 655National Department of Public Works 733 –National Treasury Cities Support Programme (NTCSP) 605 186National Treasury Municipal Capacitation Fund (NTMCF) – 556Pan African Capacitation Building Platform (PACBP) 1 1Other trade and other receivables 1 815 510
Balance at the end of the year 63 359 71 170

Development Bank of Southern Africa2017 Annual Financial Statements
35
in thousands of rands 2017 2016
7. INVESTMENT SECURITIESInvestment securities consist of the following:Investment securities designated at fair value through profit or lossGovernment bonds 47 115 296 251Municipal bonds 643 821 685 890Corporate bonds 162 386 161 400
853 322 1 143 541
Investment securities are designated at fair value through profit or loss upon initial recognition, when they form part of a group of financial assets managed and evaluated on a fair value basis in accordance with a documented investment strategy. These investments are held as part of a strategic liquidity portfolio and can thus be redeemed at any time depending on the Bank’s liquidity requirements.
Held-to-maturity investment securitiesMunicipal bonds – 33 331
Available-for-sale investment securitiesGovernment bonds 215 763 88 264Money market instruments – 82
215 763 88 346
Total investment securities 1 069 085 1 265 218
8. DERIVATIVE ASSETS AND LIABILITIES HELD FOR RISK MANAGEMENT8.1 DERIVATIVE ASSETS HELD FOR RISK MANAGEMENT
Instrument type:Interest rate derivatives 175 919 46 550Foreign exchange derivatives 670 222 1 116 983
846 141 1 163 533
8.2 DERIVATIVE LIABILITIES HELD FOR RISK MANAGEMENTInstrument type:Interest rate derivatives (26 330) (29 876)Foreign exchange derivatives (116 527) (118 675)
(142 857) (148 551)
8.3 NET DERIVATIVES HELD FOR RISK MANAGEMENTFair value hedges 149 589 16 674Cash flow hedges 116 175 290 587Economic hedges 437 520 707 721
703 284 1 014 982
FAIR VALUE HEDGESThis category consists of interest rate and cross-currency swaps used to hedge the exposure to fair value changes of financial instruments, which are due to changes in market interest and foreign currency exchange rates. This category consists of derivative instruments designated as fair value hedges for hedge accounting purposes.
CASH FLOW HEDGESThis category consist of cross-currency and interest rate swaps used to hedge both the foreign currency and interest rate risks arising from the euro and US dollar financial instruments. All cash flow hedges were effective for the year under review. This category consists of derivative instruments designated as cash flow hedges for hedge accounting purposes.
ECONOMIC HEDGESThis category consists of interest rate swaps, foreign exchange contracts and cross-currency swaps that are not designated for hedge accounting purposes. These derivative instruments are accounted for as held at fair value through profit or loss. Such derivatives are used for managing the exposures to foreign currency and interest rate risks. This category consists of both qualifying and non-qualifying hedges.

NOTES TO THE ANNUAL FINANCIAL STATEMENTS CONTINUEDFOR THE YEAR ENDED 31 MARCH 2017
03 NOTES TO THE ANNUAL FINANCIAL STATEMENTS
in thousands of rands 2017 2016
9. POST-RETIREMENT MEDICAL BENEFITS INVESTMENTFair value of plan assets 45 251 49 978
This asset represents the fair value of the Medipref investment that is used to fund the post-retirement medical benefits for eligible employees and pensioners.Post-retirement medical benefits investmentFair value of plan assetsBalance at the beginning of the year 49 978 59 536Income 2 277 2 849Expenses (398) (342)Contributions paid (6 736) (11 453)Increase/(decrease) in market value 130 (612)
Balance at the end of the year 45 251 49 978
10. EQUITY INVESTMENTSEquity investments consist of the following:Equity investments designated at fair value through profit or loss 5 972 509 6 278 575Equity investments held-to-maturity – –
5 972 509 6 278 575
10.1 EQUITY INVESTMENTS DESIGNATED AT FAIR VALUE THROUGH PROFIT OR LOSSCostBalance at the beginning of the year 5 319 262 4 860 386Acquisitions 298 964 625 473Capital return (1 035 970) (166 597)
Balance at the end of the year 4 582 256 5 319 262
Fair value adjustmentBalance at the beginning of the year (383 682) (682 345)Current year fair value adjustment (refer to note 31) 81 462 254 856Realised capital gain (refer to note 32) 664 495 43 807
Balance at the end of the year 362 275 (383 682)
Foreign exchange adjustmentsBalance at the beginning of the year 1 342 995 822 335Unrealised (loss)/gain (refer to note 30) (317 849) 520 768Realised gain/(loss) (refer to note 30) 2 832 (108)
Balance at the end of the year 1 027 978 1 342 995
Fair value at the end of the year 5 972 509 6 278 575
Equity investments designated at fair value through profit and loss consist of direct equity in ordinary shares and third party managed private equity funds.
Direct equity in ordinary shares:If the market for a financial instrument is not quoted, the Bank uses a valuation technique to establish what the transaction price would be in an arm’s-length exchange motivated by normal business considerations.
The Bank uses valuation techniques that include price of recent investments, if available, discounted cash flow analysis based on free cash flows, earnings or dividends using a market-related adjusted discount rate, long-term valuation (rule of thumb price earnings growth (PEG)), and option pricing models.
The Bank ensures that these valuation techniques optimise the use of market inputs and rely as little as possible on entity-specific inputs, incorporate all factors that market participants would consider in setting a price, and are consistent with accepted economic methodologies for pricing financial instruments.
In accordance with the best investment and valuation practice, a marketability and other discount is applied to direct equity investments. The guidelines provides that marketability and other discount in the range 10% to 30% should be factored into the valuation. Different factors are considered in setting the marketability and other discount and it is possible for the marketability and other discount for a particular instrument to be outside the guideline range.
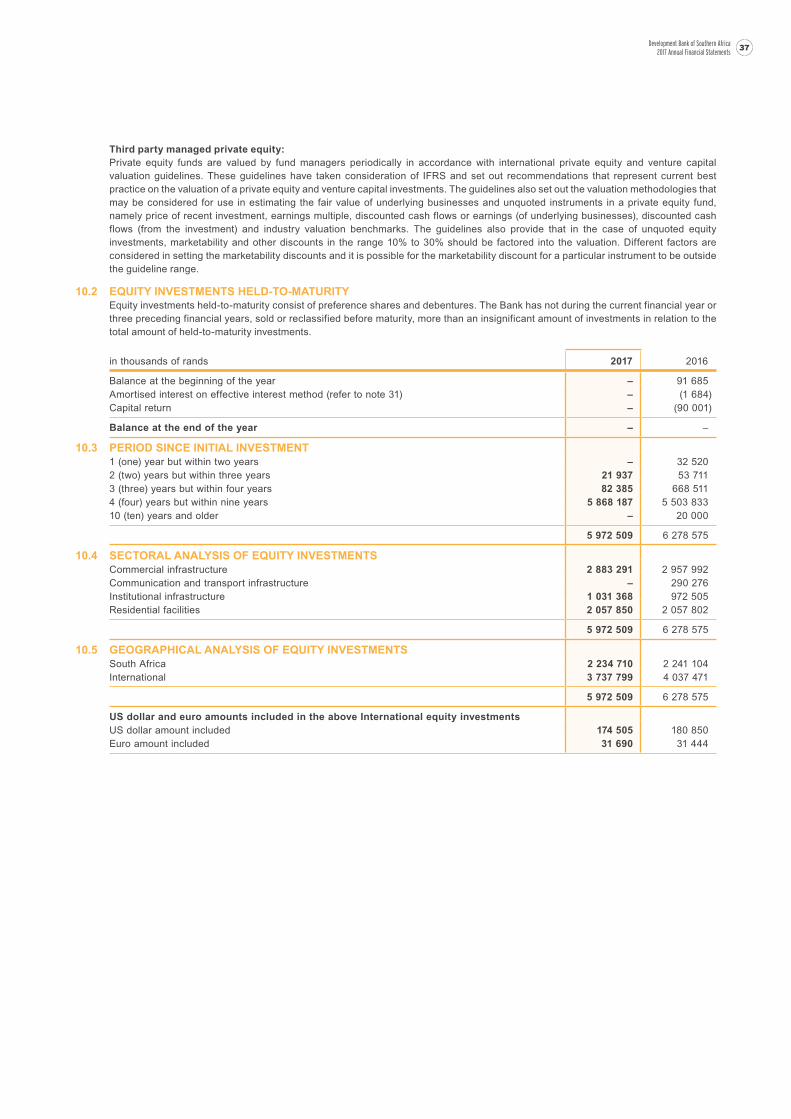
Development Bank of Southern Africa2017 Annual Financial Statements
37
Third party managed private equity:Private equity funds are valued by fund managers periodically in accordance with international private equity and venture capital valuation guidelines. These guidelines have taken consideration of IFRS and set out recommendations that represent current best practice on the valuation of a private equity and venture capital investments. The guidelines also set out the valuation methodologies that may be considered for use in estimating the fair value of underlying businesses and unquoted instruments in a private equity fund, namely price of recent investment, earnings multiple, discounted cash flows or earnings (of underlying businesses), discounted cash flows (from the investment) and industry valuation benchmarks. The guidelines also provide that in the case of unquoted equity investments, marketability and other discounts in the range 10% to 30% should be factored into the valuation. Different factors are considered in setting the marketability discounts and it is possible for the marketability discount for a particular instrument to be outside the guideline range.
10.2 EQUITY INVESTMENTS HELD-TO-MATURITYEquity investments held-to-maturity consist of preference shares and debentures. The Bank has not during the current financial year or three preceding financial years, sold or reclassified before maturity, more than an insignificant amount of investments in relation to the total amount of held-to-maturity investments.
in thousands of rands 2017 2016
Balance at the beginning of the year – 91 685Amortised interest on effective interest method (refer to note 31) – (1 684)Capital return – (90 001)
Balance at the end of the year – –
10.3 PERIOD SINCE INITIAL INVESTMENT1 (one) year but within two years – 32 5202 (two) years but within three years 21 937 53 7113 (three) years but within four years 82 385 668 5114 (four) years but within nine years 5 868 187 5 503 83310 (ten) years and older – 20 000
5 972 509 6 278 575
10.4 SECTORAL ANALYSIS OF EQUITY INVESTMENTSCommercial infrastructure 2 883 291 2 957 992Communication and transport infrastructure – 290 276Institutional infrastructure 1 031 368 972 505Residential facilities 2 057 850 2 057 802
5 972 509 6 278 575
10.5 GEOGRAPHICAL ANALYSIS OF EQUITY INVESTMENTSSouth Africa 2 234 710 2 241 104International 3 737 799 4 037 471
5 972 509 6 278 575
US dollar and euro amounts included in the above International equity investmentsUS dollar amount included 174 505 180 850Euro amount included 31 690 31 444

NOTES TO THE ANNUAL FINANCIAL STATEMENTS CONTINUEDFOR THE YEAR ENDED 31 MARCH 2017
03 NOTES TO THE ANNUAL FINANCIAL STATEMENTS
11. FAIR VALUE HIERARCHY DISCLOSURESThe table below shows the Bank’s financial assets and financial liabilities that are recognised and subsequently measured at fair value analysed by valuation technique. The classification of instruments is based on the lowest level input that is significant to the fair value measurement in its entirety. A description of the nature of the techniques used to calculate valuations based on observable inputs and valuations based on unobservable inputs is detailed in the table below.
in thousands of rands Notes
Valuationswith reference to observable prices Level 1
Valuations based on
observable input Level 2
Valuations based on
unobservableinput Level 3* Total
March 2017Available-for-sale financial assetsInvestment securities 7 215 763 – – 215 763Financial assets designated at fair value through profit and lossInvestment securities 7 853 322 – – 853 322Derivatives assets held for risk management 8.1 – 846 141 – 846 141Equity investments 10 – 5 438 239 534 270 5 972 509
Total financial assets 1 069 085 6 284 380 534 270 7 887 735
Financial liabilities designated at fair value through profit and lossFunding: debt securities 19 6 336 487 – – 6 336 487Derivatives liabilities held for risk management 8.2 – 142 857 – 142 857
Total financial liabilities 6 336 487 142 857 – 6 479 344
March 2016Available-for-sale financial assetsInvestment securities 7 88 264 82 – 88 346Financial assets designated at fair value through profit and lossInvestment securities 7 1 143 541 – – 1 143 541Derivative assets held for risk management 8.1 – 1 163 533 – 1 163 533Equity investments 10 – 5 358 105 920 470 6 278 575
Total financial assets 1 231 805 6 521 720 920 470 8 673 995
Financial liabilities designated at fair value through profit and lossFunding: debt securities 19 6 188 780 – – 6 188 780Derivative liabilities held for risk management 8.2 – 148 551 – 148 551
Total financial liabilities 6 188 780 148 551 – 6 337 331
Level 1Financial instruments valued with reference to unadjusted quoted prices for identical assets or liabilities in active markets where the quoted price is readily available and the price represents actual and regularly occurring market transactions on an arm’s-length basis. An active market is one in which transactions occur with sufficient volume and frequency to provide pricing information on an ongoing basis. This category includes capital market assets, listed equity investments and debt securities.
Level 2Financial instruments valued using inputs other than quoted prices as described above for level 1 but that are observable for the asset or liability, either directly or indirectly, such as:• Quoted price for similar assets or liabilities in inactive markets• Quoted price for identical or similar assets or liabilities in inactive markets• Valuation model using observable inputs• Valuation model using inputs derived from or corroborated by observable market data
This category includes deposits, derivatives, unlisted equity investments and debt securities.
Level 3Valuations are based on unobservable inputs.
Financial instruments valued using discounted cash flow analysis. This category includes only unlisted equity investments.

Development Bank of Southern Africa2017 Annual Financial Statements
39
11.1 EQUITY INVESTMENTSValuation methods within level 3 fair value hierarchy are applied appropriately and may produce a fair value measurement that may not be indicative of ultimate realisable value. Movements are all due to fair value adjustments to profit and loss. Furthermore, while management believes its valuation methods are appropriate and consistent with those used by other market participants, the use of different methodologies or assumptions to determine the fair value of certain financial instruments could result in a different estimate of fair value at the reporting date. Those estimated values may differ significantly from the values that would have been used had a readily available market for such investments existed, or had such investments been liquidated, and these differences could be material to the Annual Financial Statements.
in thousands of rands 2017 2016
Reconciliation of level 3 assetsBalance at the beginning of year 920 470 431 990(Loss)/gain to profit and loss (refer to note 31) (386 200) 488 480
Balance at the end of the year 534 270 920 470
12. DEVELOPMENT BONDSDevelopment bonds consist of the following:Held-to-maturity development bondsMunicipal bonds 1 290 319 1 290 296
12.1 ANALYSIS OF DEVELOPMENT BONDSBalance at the beginning of the year 1 290 466 1 290 608Movement during the year 141 (142)
Gross development bonds 1 290 607 1 290 466Allowance for credit losses on development bonds (refer to note 12.3) (288) (170)
Balance at the end of the year 1 290 319 1 290 296
12.2 MOVEMENTS DURING THE YEARInterest accrued (refer to note 27) 122 001 122 301Gross interest repayments (121 860) (122 443)
141 (142)
12.3 ALLOWANCE FOR CREDIT LOSSES ON DEVELOPMENT BONDS RECONCILIATIONBalance at the beginning of the year 170 218Increase/(decrease) in allowance for credit losses on development bonds (refer to note 35) 118 (48)
Balance at the end of the year 288 170
Development bonds are held-to-maturity investments that are measured at amortised cost using the effective interest rate method.
13. DEVELOPMENT LOANS13.1 ANALYSIS OF DEVELOPMENT LOANS
Balance at the beginning of the year 73 300 535 59 669 184Movements during the year 2 366 691 13 631 351
Gross development loans 75 667 226 73 300 535Allowance for credit losses on development loans (refer to note 13.9) (4 162 048) (3 805 581)
Net development loans at the end of the year 71 505 178 69 494 954
Movements during the yearLoans disbursed – current year 12 103 967 16 461 393Interest accrued – statement of comprehensive income (refer to note 27) 6 911 392 6 051 513Impairment of current year interest (refer to note 13.9) 46 090 (204 710)Development loans written off (refer to note 13.9) (28 987) (343 998)Loans waiver (refer to note 13.9) (815) (69)Foreign exchange adjustment (1 725 536) 3 028 107Gross repayments (15 159 743) (11 486 190)Fees raised – current year 220 323 125 305
2 366 691 13 631 351

NOTES TO THE ANNUAL FINANCIAL STATEMENTS CONTINUEDFOR THE YEAR ENDED 31 MARCH 2017
03 NOTES TO THE ANNUAL FINANCIAL STATEMENTS
in thousands of rands 2017 2016
13. DEVELOPMENT LOANS CONTINUED13.2 MATURITY ANALYSIS OF DEVELOPMENT LOANS
Due within 1 (one) year 9 462 225 9 713 568Due after 1 (one) year but within 2 (two) years 5 059 156 4 675 135Due after 2 (two) years but within 3 (three) years 5 402 608 4 833 111Due after 3 (three) years but within 4 (four) years 4 489 097 4 922 874Due after 4 (four) years but within 9 (nine) years 19 670 764 19 172 544Due after 9 (nine) years but within 14 (fourteen) years 24 026 534 19 258 878Due after 14 (fourteen years) 7 556 842 10 724 425
75 667 226 73 300 535
13.3 SECTORAL ANALYSISCommercial – fund 952 236 997 066Commercial – manufacturing 442 969 526 478Commercial – mining 281 776 872 359Commercial – tourism 259 060 314 292Commercial – other 278 849 293 217Communication and transport infrastructure 3 706 776 4 838 342Energy – electricity 43 983 222 37 405 877Energy – non-grid standalone 374 409 624 882Human resources development 1 059 283 876 319Institutional infrastructure 12 165 13 277Residential facilities 1 377 981 1 623 442Roads and drainage 13 664 490 15 362 347Sanitation 1 413 349 1 315 224Social infrastructure 4 982 853 5 219 724Water 2 877 808 3 017 689
75 667 226 73 300 535
13.4 GEOGRAPHICAL ANALYSISEastern Cape 1 992 212 2 296 640Free State 1 583 484 1 262 742Gauteng 34 033 622 32 062 158KwaZulu-Natal 7 131 214 7 406 822Limpopo 1 022 667 1 173 175Mpumalanga 1 071 990 1 243 419North West 913 046 854 253Northern Cape 7 121 586 5 671 535Western Cape 3 187 617 3 140 557Multi-regional – South Africa – 849Rest of Africa 17 609 788 18 188 385
75 667 226 73 300 535
Rest of AfricaAngola 2 072 938 2 997 457Congo 1 369 557 1 505 153Ghana 1 582 410 199 046Kenya 304 643 100 002Lesotho 610 611 660 006Mauritius 467 714 518 706Mozambique 510 578 715 484Namibia 83 917 150 000Swaziland 217 825 202 167Tanzania 113 283 218 855Zambia 7 124 096 6 464 135Zimbabwe 2 561 248 2 943 837Multi-regional 590 968 1 513 537
17 609 788 18 188 385
US dollar amounts included in the above Rest of Africa loans 1 235 465 1 149 344

Development Bank of Southern Africa2017 Annual Financial Statements
41
in thousands of rands 2017 2016
13.5 CLIENT CLASSIFICATIONDevelopment finance institutions 603 934 847 600Educational institutions 974 220 791 959Local government 27 006 956 24 590 120National and provincial government 2 083 032 2 532 729Private sector intermediaries 19 517 229 18 696 019Public utilities 25 481 855 25 842 108
75 667 226 73 300 535
13.6 FIXED AND VARIABLE INTEREST RATE LOANSFixed interest rate loans 41 236 119 38 470 980Variable interest rate loans 34 431 107 34 829 555
75 667 226 73 300 535
13.7 NON-PERFORMING LOANS (INCLUDED IN TOTAL DEVELOPMENT LOANS)13.7.1 SECTORAL ANALYSIS
Commercial – manufacturing 374 644 449 264Commercial – mining 281 776 269 745Commercial – tourism 259 060 312 967Commercial – other 195 269 194 149Communication and transport infrastructure 463 449 484 934Energy 171 196 286 459Human resources development 28 688 24 217Institution building 3 000 –Residential facilities 228 581 209 026Roads and drainage 62 299 81 759Sanitation 29 214 23 936Social infrastructure 206 210 169 105Water 183 570 201 605
2 486 956 2 707 166
13.7.2 GEOGRAPHICAL ANALYSISEastern Cape 231 272 216 608Free State 83 884 99 589Gauteng 344 391 564 183KwaZulu-Natal 33 699 32 234Limpopo 273 696 243 531Mpumalanga 156 444 155 511North West 238 739 259 486Northern Cape 40 539 91 529Western Cape 70 255 115 992Rest of Africa 1 014 037 928 503
2 486 956 2 707 166
Rest of AfricaMauritius 193 749 –Mozambique 183 017 193 700Swaziland 157 354 138 018Tanzania 113 283 203 045Zambia 237 074 264 498Zimbabwe 129 560 129 242
1 014 037 928 503
13.7.3 CLIENT CLASSIFICATION ON NON-PERFORMING LOANSEducational institutions 2 798 1 327Local government 341 566 423 609National and provincial government 193 749 –Private sector intermediaries 1 733 156 2 052 479Public utilities 215 687 229 751
2 486 956 2 707 166

NOTES TO THE ANNUAL FINANCIAL STATEMENTS CONTINUEDFOR THE YEAR ENDED 31 MARCH 2017
03 NOTES TO THE ANNUAL FINANCIAL STATEMENTS
in thousands of rands 2017 2016
13. DEVELOPMENT LOANS CONTINUED13.8 CLIENT CONCENTRATION OF TOTAL DEVELOPMENT LOANS
One client as percentage of total loan portfolio (%) 20.2 20.9Seven clients as percentage of total loan portfolio (%) 54.6 54.8
13.9 ALLOWANCE FOR CREDIT LOSSES ON DEVELOPMENT LOANS RECONCILIATIONBalance at the beginning of the year 3 805 581 2 928 965Impairment of current year interest (refer to note 13.1) 46 090 (204 710)Loans written off during the year (refer to note 13.1) (28 987) (343 998)Loans waiver (refer to note 13.1) (815) (69)Impairment charge (refer to note 35) 340 179 1 425 393
Identifiable impairmentsNon-performing book (171 456) 290 493Performing book 359 794 519 171Unidentifiable impairmentsModel driven – performing book 151 841 615 729
Balance at the end of the year 4 162 048 3 805 581
14. PROPERTY, PLANT AND EQUIPMENT
March 2017 2016
in thousands of randsCost/
ValuationAccumulated depreciation
Carrying value
Cost/Valuation
Accumulated depreciation
Carrying value
Revalued land 94 000 – 94 000 84 600 – 84 600Revalued buildings 334 068 (29 568) 304 500 412 439 (25 383) 387 056Furniture and fittings 19 851 (17 135) 2 716 19 402 (15 358) 4 044Motor vehicles 1 448 (748) 700 1 448 (625) 823Office equipment 14 257 (9 654) 4 603 18 040 (13 150) 4 890Computer equipment 68 286 (59 888) 8 398 66 565 (47 525) 19 040Leasehold improvements 770 (278) 492 770 (21) 749
Total 532 680 (117 271) 415 409 603 264 (102 062) 501 202
Reconciliation of property, plant and equipment – March 2017
in thousands of randsOpening balance Additions Disposals Revaluations Depreciation
Closing balance
Revalued land 84 600 – – 9 400 – 94 000Revalued buildings 387 056 1 962 – (80 334) (4 184) 304 500Furniture and fittings 4 044 – – – (1 328) 2 716Motor vehicles 823 – – – (123) 700Office equipment 4 890 493 (87) – (693) 4 603Computer equipment 19 040 1 532 (187) – (11 987) 8 398Leasehold improvements 749 – – – (257) 492
501 202 3 987 (274) (70 934) (18 572) 415 409

Development Bank of Southern Africa2017 Annual Financial Statements
43
Reconciliation of property, plant and equipment – March 2016
in thousands of randsOpening balance Additions Disposals Depreciation
Closing balance
Revalued land 84 600 – – – 84 600Revalued buildings 384 000 7 140 – (4 084) 387 056Furniture and fittings 5 286 138 – (1 380) 4 044Motor vehicles 1 022 – – (199) 823Office equipment 4 544 1 053 (4) (703) 4 890Computer equipment 23 524 6 817 (93) (11 208) 19 040Leasehold improvements – 770 – (21) 749
502 976 15 918 (97) (17 595) 501 202
VALUATIONS LAND
Land constitutes Portion 465 (of Portion 442) of the Farm Randjesfontein 405 measuring 25 066 hectares donated by the South African government in 1985.
The land was valued at fair value of R94 million by an independent valuator on 31 March 2017 (2016: R84.6 million, by management). Land is measured at the revalued amount in accordance with the Bank’s revaluation policy.
BUILDINGSThe existing buildings were erected in 1987 at a cost of R35.2 million. Improvements of R1.9 million were effected during the 2017 financial year (2016: R7.1 million). The buildings were valued at fair value of R304.5 million by an independent valuator on 31 March 2017 (2016: R387 million by management).
The historical carrying value of the existing buildings is R219.8 million (2016: R218.3 million).
15. INTANGIBLE ASSETS
March 2017 2016
in thousands of randsCost/
ValuationAccumulated amortisation
Carrying value
Cost/Valuation
Accumulated amortisation
Carrying value
Computer software 176 897 (88 939) 87 958 155 404 (76 262) 79 142
Reconciliation of intangible assets – March 2017
in thousands of randsOpening balance Additions Amortisation
Closing balance
Computer software 79 142 21 493 (12 677) 87 958
Reconciliation of intangible assets – March 2016
Openingbalance Additions Amortisation
Closing balance
Computer software 77 412 14 728 (12 998) 79 142

NOTES TO THE ANNUAL FINANCIAL STATEMENTS CONTINUEDFOR THE YEAR ENDED 31 MARCH 2017
03 NOTES TO THE ANNUAL FINANCIAL STATEMENTS
in thousands of rands 2017 2016
16. TRADE AND OTHER PAYABLESTrade and other payables 378 126 424 670Accrued interest (financial market liabilities) 460 465 470 125
Total other payables 838 591 894 795
Included in trade and other payables are amounts due to third party managed funds and mandates comprising of:African World Heritage Fund (AWHF) 11 –Angola – Facility Agency fees 1 275 2 805Department of Basic Education for Accelerated Infrastructure Schools 2 636 –Ekurhuleni Metropolitan Municipality 270 –Gauteng Cleaner Remedial Fund – 34 820Gauteng Schools Programme 31 31Hospital Revitalisation Programme 237 237Municipal Financial Improvement Programme (NT MFIP) 506 506Municipal Infrastructure Support Agency (MISA) 848 337National Rural Youth Service Corporation (NARYSEC) 116 116SAM Funding 1 870 1 410
Balance at the end of the year 7 800 40 262
Included in trade and other payables is retention and bonus provision as reconciled below
in thousands of randsOpening balance
Utilised during
the year
Reversal of prior year provision
Current year provision
Closing balance
Retention bonuses 18 914 (678) (18 236) – –Bonus provision 166 882 (139 687) (27 195) 157 562 157 562
185 796 (140 365) (45 431) 157 562 157 562
17. PROVISIONSReconciliation of provisions – March 2017
in thousands of randsOpening Balance
Current year provision
Utilised during
the yearCurrent year
reversalsClosing
balance
Developmental expenditure 64 591 27 181 (18 480) – 73 292Restructuring 38 794 – – (38 794) –Strategic initiatives 49 148 38 794 (34 604) – 53 338
152 533 65 975 (53 084) (38 794) 126 630
Reconciliation of provisions – March 2016
in thousands of randsOpening Balance
Current year provision
Utilised during the
yearClosing balance
Development expenditure 31 521 45 128 (12 058) 64 591Restructuring 41 190 – (2 396) 38 794Strategic initiatives 50 000 – (852) 49 148
122 711 45 128 (15 306) 152 533
Provision for developmental expenditureIn response to meeting mandate requirements, the Bank approved the granting of assistance to municipalities in the Market 2 (secondary cities)/Market 3 (under-resourced municipalities) space by way of providing loans at rates lower than the required economic return on equity by the Bank. The provision for developmental expenditure represents the quantum of the financial assistance provided on deals contracted.
Provision for strategic initiativesThe provision for strategic initiatives represents costs that are in support of the new strategy that are not associated with the Bank’s ongoing activities.

Development Bank of Southern Africa2017 Annual Financial Statements
45
18. EMPLOYEE BENEFITS18.1 LIABILITY FOR FUNERAL BENEFITS
This benefit covers all current and retired employees of the Bank. In respect of these employees, a gross amount of R33 000 is paid to the family upon the death of an employee or retired employee. The obligation was valued by management on 31 March 2017.
Movement in liability for funeral benefits recognised in the statement of financial position
in thousands of rands 2017 2016
Balance at the end of the year 3 100 3 100Increase in liability 126 –
Balance at the end of the year 3 226 3 100
18.2 POST-RETIREMENT MEDICAL BENEFITSThe Bank operates an unfunded defined benefit plan for qualifying employees. In terms of the plan, the Bank pays 100% of the medical aid contributions of qualifying pensioners.
Pensioners include retired employees and their widow(er)s. The liability is in respect of pensioners who continue to belong to the medical aid after retirement.
The investment in Medipref, as specified in note 9, has been set aside to fund this obligation.
The amount recognised in the statement of financial position in respect of the Bank’s post-retirement medical benefit is detailed below:
Present value of unfunded obligationBalance at the beginning of the year 239 289 160 412Interest cost 17 474 13 476Current service cost (includes interest to year-end) 45 41Past service costs – 4 748Benefits paid (11 535) (10 399)(Reversal of actuarial gain)/actuarial gain for the year (44 636) 71 011Payment to pensioners (159 925) –
Balance at the end of the year 40 712 239 289
The projected unit credit method has been used to determine the actuarial valuation.
The amount recognised as an expense in the statement of comprehensive income in respect of the defined benefit plan is as follows:Interest cost 17 474 13 476Current service cost 45 41Past service costs – 4 748(Reversal of actuarial gain)/actuarial gain for the year (44 636) 71 011
Total charge for the year (included in personnel expenses in the statement of comprehensive income – refer note 36) (27 117) 89 276
Market value of post-retirement medical benefit investmentBalance at the beginning of the year 49 978 59 536Income 2 277 2 849Expenses (398) (342)Contributions (6 736) (11 453)Decrease in market value 130 (612)
Balance at the end of the year 45 251 49 978
The principal assumptions in determining the post-retirement medical benefits obligation are as follows:Discount rate (before taxation (%)) 10.20 10.60
Medical aid inflation rate (%) 9.20 9.70
Sensitivity analysisThe valuation results set out above are based on a number of assumptions. The value of the liability could be overstated or understated, depending on the extent to which actual experience differs from the assumptions adopted.

NOTES TO THE ANNUAL FINANCIAL STATEMENTS CONTINUEDFOR THE YEAR ENDED 31 MARCH 2017
03 NOTES TO THE ANNUAL FINANCIAL STATEMENTS
18. EMPLOYEE BENEFITS CONTINUED18.2 POST-RETIREMENT MEDICAL BENEFITS CONTINUED
Sensitivity analysis continued
Central assumption
% point decrease
% point increase
Medical aid inflation rate (%) 9.20 (1.00) 1.00Accrued liability 31 March 2017 (R’000) 40 712 37 305 44 683% change (8.40) 9.80Current service cost + interest cost 2017/18 (R’000) 4 024 3 668 4 440% change (8.80) 10.30Sensitivity results from previous valuation: Medical aid inflation rate 2016/17 (%) 9.70 (1.00) 1.00Current service cost + interest cost 2016/17 (R’000) 17 519 15 818 19 518% change (9.70) 11.40
in thousands of rands
The obligation for the four years prior to March 2016 is as follows:March 2015 160 412March 2014 165 051March 2013 148 421March 2012 354 880
in thousands of rands 2017 2016
18.3 DEFINED CONTRIBUTION PLANThe total amount expensed during the period (including group life assurance and income continuity benefits) 53 010 48 805
The Development Bank of Southern Africa Provident Fund (the Fund) was established on 1 June 1994. As a condition of employment, all eligible employees are required to join as members.
The Fund, which is governed by the Pension Funds Act, No 24 of 1956, is a defined contribution plan for permanent employees of the Bank.
The number of employees covered by the plan for March 2017 is 611 (March 2016: 452).
19. DEBT SECURITIESClassification of debt securitiesHeld at fair value through profit or loss 6 336 487 6 188 780Held at amortised cost 30 117 774 29 082 355
36 454 261 35 271 135
R80 billion Domestic Medium-Term Note Programme is currently registered and listed on the JSE Securities Exchange as at 31 March 2017.
Debt securities designated at fair value through profit or loss consists of listed and unlisted DV bonds and private placements. The debt securities held at fair value through profit and loss are assessed based on credit rating reviews by rating agencies for own credit risk adjustment.
Debt securities carried at amortised cost consists of Eurorand bond issues, money market issuance (bridging bonds and short-term commercial paper), medium and long-term fixed rating and floating rate bond.
Floating rate notes and commercial paper – nominal valuesFloating rate notes – commercial paper 2 118 000 4 256 000Floating rate notes – medium-term notes 5 828 000 2 866 000
7 946 000 7 122 000
The Bank issued several floating commercial paper notes during the financial year under instruments codes DVC. These instruments have a maturity of less than one year.
The Bank also issued several floating medium-term notes under instrument codes DVF. These instruments have a maturity of three to five years.
Floating rate notes and commercial paper are held at amortised cost.
Funding held at fair value through profit or loss represents the hedged funding that forms part of effective qualifying hedge relationships.

Development Bank of Southern Africa2017 Annual Financial Statements
47
in thousands of rands 2017 2016
20. FUNDING: LINES OF CREDITHeld at amortised cost 14 015 426 16 371 534
21. SHARE CAPITALAuthorised2 020 000 ordinary shares (31 March 2016: 2 020 000) at a par value of R10 000 each 20 200 000 20 200 000
Callable capital (authorised but not yet issued)2 000 000 ordinary shares (31 March 2016: 2 000 000) at a par value of R10 000 each 20 000 000 20 000 000
In terms of regulation 18 of the DBSA Act, the directors may issue shares and call upon the shareholders in respect of monies payable under such issue.
The Board may, with the approval of the shareholder previously given at a shareholder’s meeting, increase the issued share capital of the Bank by the creation and issue of ordinary and preference shares.
The DBSA Act was amended in 2014 to increase the authorised share capital to R20.2 billion, divided into 2 020 000 ordinary shares. In terms of section 13(2A) of the amended Act, the Minister may, after consultation with the Board and notice in the Gazette, adjust the amount of the authorised share capital of the Bank and number of ordinary shares.
Issued capital20 000 ordinary shares (31 March 2016: 20 000) at a par value of R10 000 each 200 000 200 000
All issued capital is fully paid for.
22. PERMANENT GOVERNMENT FUNDINGBalance at the beginning of the year 11 692 344 8 692 344Government recapitalisation – 3 000 000
Balance at the end of the year 11 692 344 11 692 344
This represents capital provided by the South African government and remains part of the permanent capital of the Bank.
The last tranche of the capital injection was received in the 2016 year from National Treasury.
There are no repayment terms and this funding is interest-free. To date no cash repayments have been made and the full amount initially received is equal to the residual amount and is thus allocated to equity.
23. REVALUATION RESERVE ON LAND AND BUILDINGSBalance at the beginning of the year 269 256 269 256Loss on revaluation of land and buildings (refer to note 14) (70 934) –
Balance at the end of the year 198 322 269 256
This reserve represents the fair value adjustment recognised on the revaluation of the land and buildings.
24. CASH FLOW HEDGE RESERVEBalance at the beginning of the year 123 050 116 288Unrealised gain on cash flow hedges 12 846 142 063Gain/(loss) on cash flow hedges reclassified to the statement of comprehensive income 5 784 (135 301)
Balance at the end of the year 141 680 123 050
The net gain reclassified to the statement of comprehensive income was included in the net foreign exchange gain line item.
Own credit risk adjustment included in the unrealised gain on cash flow hedges line item amounted to R89 million (31 March 2016: R22 million).
25. RESERVE FOR GENERAL LOAN RISKSBalance at the beginning of the year 2 436 358 2 143 975Transfer (from)/to general loan reserve (148 867) 292 383
Balance at the end of the year 2 287 491 2 436 358
The reserve is maintained based on the risk grading of the borrowers and movements are recognised directly between the reserve for general loan risk and retained earnings.

NOTES TO THE ANNUAL FINANCIAL STATEMENTS CONTINUEDFOR THE YEAR ENDED 31 MARCH 2017
03 NOTES TO THE ANNUAL FINANCIAL STATEMENTS
in thousands of rands 2017 2016
26. AVAILABLE-FOR-SALE RESERVEBalance at the beginning of the year (810) 257Change in value of available-for-sale financial assets (2 228) (1 067)
Balance at the end of the year (3 038) (810)
The fair value reserve comprises all fair value adjustments for available-for-sale financial market instruments excluding impairment loss.
27. INTEREST INCOMEInterest income received on:Cash and cash equivalents 197 981 192 120Investment securities 116 558 148 811
Held at fair value through profit and loss 105 791 127 835Held-to-maturity 1 803 9 556Available-for-sale 8 964 11 420
Home ownership scheme loans – 145Equity investments 25 953 7 628Development loans (refer to note 13.1) 6 911 392 6 051 513Development bonds (refer to note 12.2) 122 001 122 301Derivative assets held for risk management (791) 18 510
Total interest income 7 373 094 6 541 028
27.1 INTEREST INCOME ON DEVELOPMENT LOANSInterest income on development loansOn performing loans 6 806 013 5 897 404On non-performing loans 105 379 154 109
6 911 392 6 051 513
27.2 INTEREST INCOME ON DEVELOPMENT LOANS – CLIENT CLASSIFICATIONDevelopment finance institutions 37 051 43 625Educational institutions 87 482 75 215Local government 2 499 311 2 087 642National and provincial government 155 028 169 294Private sector intermediaries 1 840 489 1 619 011Public utilities 2 292 031 2 056 726
6 911 392 6 051 513
28. INTEREST EXPENSEInterest expense incurred on:Bank and other payables 9 567 7 137Funding: debt securities 3 355 999 3 211 931Funding: lines of credit 395 380 292 245Derivative liabilities held for risk management (57 186) (155 884)
Total interest expense 3 703 760 3 355 429
Net interest income 3 669 334 3 185 599
Included in interest expense on Funding: debt securities for the year ended 31 March 2017 is R627 million (March 2016: R627 million) relating to debt securities designated held at fair value through profit or loss.
Included in interest expense on Funding: debt securities for the year ended 31 March 2017 is R2.7 billion (2016: R2.8 billion) relating to debt securities held at amortised cost.

Development Bank of Southern Africa2017 Annual Financial Statements
49
in thousands of rands 2017 2016
29. NET FEE INCOMEFee incomeLending fees 182 991 103 961Other non-lending fees 10 216 36 699Management fees 136 270 147 545
Total fee income 329 477 288 205
Fee expenseCommitment fees on funding 7 707 9 111Guarantee fees 3 504 3 180
Total fee expense 11 211 12 291
Net fee income 318 266 275 914
Management fees comprises:Agence Francaise Developpement PPS Fund 542 –African World Heritage Fund (AWHF) 1 170 1 170Anglo American South Africa 1 259 3 880Cenpower 157 125Cities Project Preparation Facility (CPPF) 1 125 1 500Department of Basic Education for Accelerated Infrastructure Schools Programme 23 878 38 222Department of Rural Development & Land Reform – 464Department of Trade and Industry 7 811 5 254Dryland Rehabilitation Programme – 2 436Eastern Cape Department of Education 4 494 –Ekurhuleni Metropolitan Municipality 28 595 13 042Elliotdale Rural Human Settlement 1 929 2 206European Investment Bank (EIB) 14 968 28 566Gauteng Department of Agriculture 586 –Global Environment Facility 4 588 6 887Green Fund 57 4 359Independent Power Producers (IPP) Office 4 716 4 663Infrastructure Delivery Improvement Programme (IDIP) 148 1 331Infrastructure Investment Programme for South Africa (IIPSA) 877 877Itezhi – Tezhi Power Corporation – 259KFW HIV/VCT 2 Programme 2 295 2 216KFW SADC Water Fund 427 672KwaZulu-Natal Department of Education 10 876 328Limpopo Department of Health 1 289 11 489Limpopo Department of Public Works 5 653 6 510Limpopo Department of Education 4 807 –Maamba Colliers Limited – 152Municipal Infrastructure Support Agency (MISA) 8 37National Department of Health 5 728 9 112National Department of Public Works 883 –National Treasury Cities Support Programme (NTCSP) 1 307 1 470SADC PPFD 4 685 –Sefako Makgatho University 1 035 –Spatial Development Initiative – 43Tripartite Trust Account DFID 234 275Zambia Electricity Supply Corporation 143 –
136 270 147 545

NOTES TO THE ANNUAL FINANCIAL STATEMENTS CONTINUEDFOR THE YEAR ENDED 31 MARCH 2017
03 NOTES TO THE ANNUAL FINANCIAL STATEMENTS
in thousands of rands 2017 2016
30. NET FOREIGN EXCHANGE (LOSS)/GAINUnrealisedCash and cash equivalents: (loss)/gain (18 953) 103 616Hedging derivatives – funding: (loss)/gain (351 273) 339 586Equity investments: (loss)/gain (refer to note 10.1) (317 849) 520 768Development loans: (loss)/gain (2 732 915) 1 933 176Hedging derivatives – development loans: gain 14 601 112 152Funding (Lines of Credit): gain/(loss) 1 730 728 (2 320 341)
(1 675 661) 688 957
RealisedDevelopment loans: gain 1 002 287 1 092 037Equity investments: gain/(loss) (refer to note 10.1) 2 832 (108)Funding and hedging: gain/(loss) 51 893 (778 714)
1 057 012 313 215
Net foreign exchange (loss)/gain (618 649) 1 002 172
31. NET (LOSS)/GAIN FROM FINANCIAL ASSETS AND FINANCIAL LIABILITIESNet gain/(loss) on derivatives held for risk management at fair value through profit or lossInterest rate derivativesUnrealised 135 569 (226 307)Realised 20 243 6 741
155 812 (219 566)
Foreign exchange derivativesUnrealised (61 623) 12 258Realised (7 347) (6 099)
(68 970) 6 159
Investment securities designated at fair value through profit or lossGovernment bonds – unrealised 2 289 (4 292)Corporate bonds – unrealised 2 355 (9 832)Municipal bonds – unrealised 7 931 (46 802)Corporate, government and municipal bonds – realised 6 292 –
18 867 (60 926)
Debt securitiesDesignated at fair value through profit or loss – unrealised (225 799) 473 349
Equity investmentsDesignated at fair value through profit and loss – unrealised (refer to note 10.1) 81 462 254 856Held-to-maturity unrealised (refer to note 10.2) – (1 684)
81 462 253 172
OtherPost-retirement medical benefits investment designated at fair value through profit or loss – unrealised (4 726) (9 558)
Total net (loss)/gain from financial assets and liabilities (43 354) 442 630
The total unrealised (losses)/gains for the year related to level 3 positions held at period end are set below.Equity investments (refer to note 11.1) (386 200) 488 480
32. OTHER INCOMENon-interest incomeDividend income 15 830 18 795Gain on sale of equipment 578 90Other income 53 187 71 663Realised capital gain on equity investments (refer to 10.1) 664 495 43 807
734 090 134 355

Development Bank of Southern Africa2017 Annual Financial Statements
51
in thousands of rands 2017 2016
33. PROJECT PREPARATION EXPENDITUREExpenditure incurred on the planning, project definition, pre-feasibility, feasibility and structuring phase of projects 24 453 14 651
34. DEVELOPMENT EXPENDITUREIn support of secondary and under-resourced municipalities 27 181 43 869
35. NET IMPAIRMENT LOSS ON FINANCIAL ASSETSImpairment of other trade and receivables (refer to note 6) (848) 634Impairment on development loans (refer to note 13.9) 340 179 1 425 393Impairment on housing scheme loans – 180Impairment on development bonds (refer to note 12.3) 118 (48)
339 449 1 426 159
36. PERSONNEL EXPENSESPost-retirement medical benefits liability movement (refer note 18.2) (27 117) 89 276Personnel expenses 630 725 641 661
603 608 730 937
Included in other personnel expenses are the following:Directors’ emoluments includes the Chief Executive Officer's and Chief Financial Officer's remuneration (refer to note 42) 20 553 22 115Executive members’ remuneration (refer to note 42) 28 744 30 442
49 297 52 557
37. OTHER EXPENSESAuditor’s remuneration 6 567 6 942Technical services 24 389 21 571Communication costs 6 914 6 159Information technology costs 43 131 49 676Legal expenses 19 308 6 814Public relations activities 10 094 12 915Subsistence and travel 36 369 44 421Low value assets 1 040 1 341Other expenses 54 368 63 814
202 180 213 653
38. DEPRECIATION AND AMORTISATION (REFER NOTES 14 AND 15)Revalued buildings 4 184 4 084Furniture and fittings 1 328 1 380Motor vehicles 123 199Office equipment 693 703Computer equipment 11 987 11 208Leasehold improvements 257 21Intangible assets 12 677 12 998
31 249 30 593

NOTES TO THE ANNUAL FINANCIAL STATEMENTS CONTINUEDFOR THE YEAR ENDED 31 MARCH 2017
03 NOTES TO THE ANNUAL FINANCIAL STATEMENTS
in thousands of rands 2017 2016
39. GRANTSAfrican Union Foundation 948 –African World Heritage Fund (AWHF) – 500Association of African Development Finance Institutions 694 594Citizen Entrepreneurial Development Agency 162 –Pan African Capacity Building Platform (PACBF) 6 667 –Scout South Africa 60 –Social Responsibility Fund – 174Southern African Netherlands Chamber of Commerce – 67SADC – Development Finance Resource Centre 1 342 1 544South African Local Government Association (SALGA) – 750South African National Defence Force Education Trust – 500World Resource Institute 845 –
10 718 4 129
These grants are discretionary grants.
40. NET PROFIT/(LOSS) ADJUSTED FOR NON-CASH ITEMSNet profit for the year 2 820 849 2 576 679Depreciation and amortisation (refer to note 38) 31 249 30 593Profit on sale of assets (refer to note 32) (578) (90)Grants, development expenditure and project preparation expenditure paid 62 352 62 650Unrealised loss/(gain) from financial assets and liabilities 63 496 (443 028)Upfront fees deferred 32 312 23 891Fees accrued (33 384) 25 628Unrealised foreign exchange (loss)/gain (refer to note 30) 1 675 661 (688 957)Capital gain on equity investments (refer to note 32) (664 495) (43 807)Net impairment loss on financial assets (refer to note 35) 339 449 1 426 159Change in liability for funeral benefits and post-retirement medical benefit (198 452) 78 878Net interest income (refer to note 28) (3 669 334) (3 185 599)
459 125 (137 003)
41. NET DECREASE IN WORKING CAPITALMovements in provisions (61 784) (14 047)Decrease/(increase) in other receivables 33 235 (26 998)Decrease in home ownership scheme loans – 5 462(Decrease)/increase in other payables (82 348) 4 523
(110 897) (31 060)
42. SCHEDULE OF DIRECTORS’ AND PRESCRIBED OFFICERS’ EMOLUMENTS42.1 EXECUTIVE MEMBERS’ REMUNERATION AND PRESCRIBED OFFICERS
Basic salaries and
feesR
Medical aid, group
life and provident
fund contributions
R
Subsistence and travel
RCell costs
RBonus
R
Total 2017
R
Total 2016
R
Executive DirectorsMr PK Dlamini 4 744 317 677 724 115 929 – 3 859 158 9 397 128 10 070 483Ms K Naidoo 2 788 869 343 170 118 550 24 000 1 045 850 4 320 439 5 237 299Executive ManagersMr PA Currie 2 572 045 316 075 10 510 24 000 1 658 912 4 581 542 4 815 899Mr E Dietrich 2 245 498 521 898 57 469 60 000 1 520 000 4 404 865 3 470 163Mr M Hillary 2 121 998 391 424 10 790 24 000 1 357 959 3 906 171 4 199 997Ms D Mashishi 2 389 643 360 608 27 179 20 000 1 256 113 4 053 543 4 291 566Mr R Shaik 2 196 954 347 943 28 998 60 000 1 203 750 3 837 645 3 411 361Ms S Sibisi 2 204 759 330 137 2 057 44 000 – 2 580 953 4 415 080Mr M Vivekanandan 2 763 211 626 520 88 750 18 000 1 882 560 5 379 041 5 837 431
Total 24 027 294 3 915 499 460 232 274 000 13 784 302 42 461 327 45 749 279

Development Bank of Southern Africa2017 Annual Financial Statements
53
42.2 REMUNERATION OF NON-EXECUTIVE DIRECTORS AND CO-OPTED MEMBERS OF THE BOARD
Fees for services as
directors R
Subsistence and travel
R
Total 2017
R
Total 2016
R
Mr PJ Moleketi (Chairman) 997 026 22 919 1 019 945 958 568Mr FM Baleni (Deputy Chairman) 615 069 38 037 653 106 651 204Dr L Bhengu-Baloyi 480 035 – 480 035 488 776Ms T Dingaan1 108 029 – 108 029 680 520Mr OA Latiff – – – 374 064Ms B Mabuza 759 110 4 847 763 957 500 517Ms D Marole 684 517 3 071 687 588 647 549Mr A Moloto 597 068 – 597 068 583 256Ms G Mtetwa 895 726 12 930 908 656 629 350Ms A Singh 580 349 3 071 583 420 536 372Prof M Swilling 319 276 – 319 276 345 617Ms M Janse Van Rensburg 714 101 – 714 101 117 675Ms M Vilakazi – – – 187 935Co-opted membersProf B Figaji – – – 106 348
6 750 306 84 875 6 835 181 6 807 751
1. Ms T Dingaan resigned on 31 May 2016.
43. RISK MANAGEMENTMarket risk is the risk that the Bank’s earnings and capital will be adversely affected by movements in the level or volatility of market rates or prices such as interest rates and foreign exchange rates. The overarching objective of market risk management in the Bank is to protect the Bank’s net earnings against adverse market movements by containing the innate interest rate and foreign currency risks within acceptable parameters.
Market risk management in the Bank is centralised in the Treasury unit and is governed by the interest rate, currency and liquidity risk management policies. As with all risk management policies of the Bank, these policies reside under the authority of the Board of Directors. Whilst the ultimate responsibility for prudent and effective asset-liability management rests with the Board, the authority for policy formulation, revision, strategic management and administration is assigned to the Asset and Liability Management Committee (ALCO). ALCO is responsible for assessing and monitoring the Bank’s market risk exposures and is supported in these functions by the Group Risk Assurance (GRA) division.
INTEREST RATE RISKInterest rate risk refers to the susceptibility of the Bank’s financial position to adverse fluctuations in market interest rates. Variations in market interest rates impact on the cash flows and income stream of the Bank through their net effect on interest rate sensitive assets and liabilities. At the same time movements in interest rates impact on the Bank’s capital through their net effect on the market value of assets and liabilities. Interest rate risk in the Bank arises naturally as a result of its funding and lending operations, and occurs primarily in the form of repricing risk caused by mismatches in the amount of assets and liabilities re-pricing at any one time, and to a lesser extent, basis risk, the risk of spread compression between assets and liabilities priced off different reference rates.
The Treasury Unit, under oversight of the Audit and Risk Committee, is charged with managing and containing the Bank’s interest rate risk exposures within Board approved limits. To this end, the Bank makes use of derivative instruments to achieve its desired interest rate risk profile.
The Bank’s primary interest rate risk management objective is to protect its net interest income (NII) from adverse fluctuations in market interest rates. To achieve this objective, it is the policy of the Bank to measure and manage its interest rate risk exposure both over the short and long term in order to protect the Bank’s earnings stream and ensure its continued financial sustainability. Limits are set both with respect to short-term NII sensitivity using the 12-month cumulative re-pricing gap to total earning assets ratio, and in the longer term, with respect to the portfolio value analysis.
The management of interest rate risk against these limits is supplemented by scenario analysis, which measures the sensitivity of the Bank’s NII and market value of equity to extreme interest rate movements. At a minimum, scenarios include hypothetical interest rate shocks both, up and down, of at least 100 basis points.
The re-pricing profile as at financial year-end is encapsulated in the table below. As reflected in the 12-month cumulative re-pricing gap, the Bank is asset sensitive, with an immediate 100 basis points parallel upward or downward shift in the yield curve expected to results in an increase (decrease) in net interest income over the projected 12-month period of approximately R35.97 million (March 2016: R77.8 million).

NOTES TO THE ANNUAL FINANCIAL STATEMENTS CONTINUEDFOR THE YEAR ENDED 31 MARCH 2017
03 NOTES TO THE ANNUAL FINANCIAL STATEMENTS
43. RISK MANAGEMENT CONTINUED HEDGING OF INTEREST RATE RISK
Desired changes to the Bank’s interest rate risk profile are achieved primarily through the use of derivative instruments, particularly interest rate swaps, in line with the Bank’s hedging guidelines.
As at 31 March 2017, the Bank had a combined ZAR interest rate and USD interest rate swaps portfolio with a total notional contract amount of R4.85 billion (March 2016: R5.7 billion). The Bank classifies interest rate swaps as fair value hedges and states them at fair value (refer to note 8). The net fair value of these swaps as at 31 March 2017 was R165 million (March 2016: R133 million), comprising assets of R191 million (March 2016: R152 million) and liabilities of R26.3 million (March 2016: R30 million). These amounts are recognised as fair value derivatives.
The table below shows the contractual repricing gap for 31 March 2017:
Contractual Repricing Gap
in millions of rands <1M 1-3M 3-12M 1-2 Yrs 2-3 Yrs 3-4 Yrs 4-5 Yrs >5 Yrs Total
Cash and cash equivalents ZAR 2 132 – – – – – – – 2 132USD 166 – – – – – – – 166
Investment: government bonds ZAR – – – – – – – 245 245Development bonds ZAR – – – 75 – 100 – 1 842 2 017Development loans USD 1 604 6 075 6 457 – – – – 943 15 079
ZAR 4 303 9 962 1 150 438 487 664 3 454 34 050 54 508Derivative: development loans ZAR – – – – 2 000 1 350 500 820 4 670
USD – – – – – – – 191 191EUR – – – – 114 – – 1 825 1 939
Total financial market assets 8 205 16 037 7 607 513 2 601 2 114 3 954 39 916 80 947
CCS: Lines of credit USD (15) (702) (10) – – – – – (727)ZAR 11 (253) – – – – – (608) (850)
Funding bonds ZAR (100) (8 285) – – (9 228) – (897) (15 079) (33 589)Funding: Lines of credit EUR – – – – (114) – – (1 825) (1 939)
USD (6 226) (458) (4 089) – – – – (770) (11 543)ZAR – (410) (120) – – – – – (530)
Interest rate swaps ZAR – (4 670) – – – – – – (4 670)USD – (191) – – – – – – (191)
Funding: Money market debt ZAR (650) (935) (1 150) – – – – – (2 735)
Total financial market liabilities (6 980) (15 904) (5 369) – (9 342) – (897) (18 282) (56 774)
Repricing gap 1 225 133 2 238 513 (6 741) 2 114 3 057 21 634Cumulative repricing gap 1 225 1 358 3 596 4 109 (2 632) (518) 2 539 24 173

Development Bank of Southern Africa2017 Annual Financial Statements
55
The table below shows the contractual repricing gap for 31 March 2016
Contractual Repricing Gap
in millions of rands <1M 1-3M 3-12M 1-2 Yrs 2-3 Yrs 3-4 Yrs 4-5 Yrs >5 Yrs Total
Cash and cash equivalents ZAR 1 972 – – – – – – – 1 972EUR 1 – – – – – – – 1USD 112 – – – – – – – 112
Investment: government bonds ZAR – – 272 – 106 – – – 378Investment: municipal bonds ZAR – – 33 – 75 – 100 1 892 2 100Development loans EUR 7 – – – – – – – 7
USD 2 190 7 110 6 442 – – – – 175 15 917ZAR 4 845 11 635 1 033 544 689 634 858 33 332 53 570
Derivative: development loans EUR – – 20 – – 187 – 2 394 2 601
USD – – 30 – – – – 246 276ZAR – 1 195 – – – 3 350 – – 4 545
Total financial market assets 9 127 19 940 7 830 544 870 4 171 958 38 039 81 479
CCS: Lines of credit USD – (1 136) (61) – – – – – (1 197)ZAR – (4 651) – – – – – (853) (5 504)
Funding bonds ZAR – (8 122) (292) – – (9 228) – (15 755) (33 397)Funding: Lines of credit EUR – – (20) – – (187) – (2 394) (2 601)
USD (2 832) (4 303) (5 386) (44) – – – (576) (13 141)ZAR – (488) (137) – – – – – (625)
Funding: Money market debt ZAR – – (1 920) – – – – – (1 920)
Total financial market liabilities (2 832) (18 700) (7 816) (44) – (9 415) – (19 578) (58 385)
Repricing gap 6 295 1 240 14 500 870 (5 244) 958 18 461Cumulative repricing gap 6 295 7 535 7 549 8 049 8 919 3 675 4 633 23 094
The above analysis is based on performing assets only. Variable interest rate instruments are included in the maturity bucket in which they re-price. Fixed rate instruments, although not technically subject to re-pricing risk, are included in the maturity bucket in which it matures, due to the assumption that it will be rolled at maturity or that it will be held as cash.
FOREIGN EXCHANGE RISKForeign exchange risk is the risk of financial loss resulting from adverse movements in foreign currency exchange rates. Foreign exchange risk in the DBSA arises primarily as a result of foreign currency denominated borrowings, foreign currency lending, equity investments, foreign currency net interest income, expenditure and dividends.
The Bank’s primary foreign exchange risk management objective is to protect its net earnings against the impact of adverse exchange rate movements. Hedging of currency exposures is effected either naturally through offsetting assets and liabilities of substantially similar size, maturities, currency, and repricing bases; or in the absence thereof, through the use of approved derivative instruments transacted with approved financial institutions.
HEDGING OF FOREIGN CURRENCY RISK EXPOSUREThe Bank uses cross currency swaps and forward exchange contracts (FECs) to hedge its foreign currency risk. As at 31 March 2017, the Bank had FECs with a notional amount of R10.9 million (March 2016: R130 million) and cross- currency swaps with a notional amount of R1.56 billion (March 2016: R2.8 billion)
The notional principal amounts indicate the volume of currency hedged liabilities outstanding at the balance sheet date and do not represent the amount at risk. The fair value of derivative financial instruments represents the positive or negative cash flows which would have occurred had the rights and obligations arising from that instrument been closed out in an orderly market at statement of financial position date.

NOTES TO THE ANNUAL FINANCIAL STATEMENTS CONTINUEDFOR THE YEAR ENDED 31 MARCH 2017
03 NOTES TO THE ANNUAL FINANCIAL STATEMENTS
43. RISK MANAGEMENT CONTINUED FOREIGN CURRENCY SENSITIVITY ANALYSIS
Potential impact of rand sensitivity on profit/loss based on current net open position/currency exposure.
March 2017 March 2016
Currency (in thousands of rands) EUR USD EUR USD
Cash at bank 23 12 406 27 882Loan assets 264 1 123 560 407 1 077 705Equity investments 31 690 174 505 28 560 161 430Cross-currency swaps 135 648 (52 991) 154 779 (62 462)Derivative foreign exchange contracts – (1 126) – (9 885)Liabilities (135 658) (860 160) (154 779) (890 057)
31 967 396 194 28 994 277 613
Foreign currency exchange rate (FX) sensitivity analysis
Sensitivity % EUR/ZAREUR potential
impact USD/ZARUSD potential
impactFX Sensitivity
combined
(15) 12.1470 (68) 11.4067 (798) (866)(10) 12.8616 (45) 12.0777 (532) (577)(5) 13.5761 (22) 12.7487 (266) (288)– 14.2933 – 13.4197 – –5 15.0052 22 14.0907 266 288
10 15.7197 45 14.7617 532 57715 15.4342 68 15.4327 798 866
Spot exchange rate used EUR/ZAR 14.2933USD/ZAR 13.4197
LIQUIDITY RISKLiquidity risk is defined as the risk of failure to meet all financial obligations on a timely basis, when due, and in the currency due without incurring above normal costs. In the case of the DBSA this risk specifically arises from the inability to honour obligations with respect to commitments to borrowers, lenders and investors and operational expenditure.
In order to shield the Bank against the risk of a liquidity shortfall, the Bank’s liquidity risk management policy requires the maintenance of prudential liquidity levels conservatively based on the level of actual disbursements for a rolling 12 months. In addition, in the interest of added prudence, the Bank has adopted the Basel III recommended liquidity risk metrics (the liquidity coverage ratio and the net stable funding ratio as part of the liquidity risk management policy).
Liquidity is held primarily in the form of money market instruments such as call deposits, negotiable certificate of deposits, promissory notes as well as liquid debt issues from government, municipalities and other approved issuers.
Total liquidity at 31 March 2017 was R4.56 billion (March 2016: R4.55 billion). This includes cash and cash equivalents of R2.3 billion (March 2016: R2.08 billion), corporate and municipal bonds of R2.02 billion (March 2016: R2.1 billion) and government bonds amounting to R245 million (March 2016: R378 million).
Available Liquidity March 2017 March 2016
High quality liquid assetsCash 2 299 247 2 084 585Government bonds 245 000 378 000Other less liquid assetsSOE bonds 150 000 150 000Municipal bonds 1 867 000 1 950 333
Total available liquidity 4 561 247 4 562 918
In addition to holding a minimum level of liquidity in the form of cash and near cash equivalents (tradable market securities) as described above, the Bank has at its disposal a variety of funding sources should the need arise. These include uncommitted credit lines with reputable financial institutions, committed loan facilities with multilateral, bilateral and other development finance institutions, money and capital securities issuance under the Bank’s domestic medium-term programme and capital market repurchase transactions.
The Bank uses cash flow forecasts and cumulative maturity gap analysis to assess and monitor its liquidity requirements and risk levels. A maturity gap profile report forms part of the asset and liability report which is reviewed and analysed by the ALCO on a periodic basis. Calculated on a nominal maturity basis, the 12-month cumulative liquidity gap as at 31 March 2017 was approximately negative R3.02 billion (31 March 2016: negative R3.9 billion).

Development Bank of Southern Africa2017 Annual Financial Statements
57
The table below analyses the contractual liquidity gap for 31 March 2017.
in millions of rands <1M 1-3M 3-12M 1-2 Yrs 2-3 Yrs 3-4 Yrs 4-5 Yrs >5 Years Total
Cash and cash equivalents ZAR 2 132 – – – – – – – 2 132USD 166 – – – – – – – 166
Investment: government bonds ZAR – – – – – – – 245 245Development bonds ZAR – – – 75 – 100 – 1 842 2 017Development loans USD 31 380 1 621 2 249 2 344 2 005 1 561 4 888 15 079
ZAR 27 694 1 539 2 553 2 914 2 364 5 362 39 056 54 509Derivative: Development bonds EUR – 74 182 257 234 211 211 770 1 939
Total financial market assets 2 356 1 148 3 342 5 134 5 492 4 680 7 134 46 801 76 087CCS: Lines of credit USD (15) (54) (64) (108) (108) (108) (108) (162) (727)
ZAR 11 (17) (86) (108) (94) (80) (80) (398) (852)Funding bonds ZAR – – (2 457) (1 395) (11 816) – (2 842) (15 079) (33 589)Funding: Lines of credit EUR – (74) (182) (256) (234) (211) (211) (770) (1 938)
USD – (421) (3 679) (2 246) (2 234) (823) (448) (1 692) (11 543)ZAR – (7) (88) (94) (94) (94) (62) (91) (530)
Funding: Money market debt ZAR (650) (935) (1 150) – – – – – (2 735)
Total financial market liabilities (654) (1 508) (7 706) (4 207) (14 580) (1 316) (3 751) (18 192) (51 914)
Liquidity gap 1 702 (360) (4 364) 927 (9 088) 3 364 3 383 28 609
Cumulative liquidity gap 1 702 1 342 (3 022) (2 095) (11 183) (7 819) (4 436) 24 173
Note that the contractual liquidity gap has been adjusted to include the Bank’s 2027 zero coupon liability at current book value. This bond contractually matures in 2027 and accrues interest semi-annually toward a maturity value of R7.47 billion.
As per the table above DBSA has a positive cumulative liquidity gap where the contractual inflows exceed outflows across all time buckets. This profile is anticipated due to the nature of the business where the Bank has raised long dated stable funding and generated short-term amortising assets.
There are no behavioural assumptions made on the liquidity gap and all assets and liabilities are disclosed with the underlying contractual maturity as determined by the cash flow profile for each record.

NOTES TO THE ANNUAL FINANCIAL STATEMENTS CONTINUEDFOR THE YEAR ENDED 31 MARCH 2017
03 NOTES TO THE ANNUAL FINANCIAL STATEMENTS
43. RISK MANAGEMENT CONTINUED LIQUIDITY RISK CONTINUED
The table below analyses the contractual liquidity gap for 31 March 2016.
in millions of rands <1M 1-3M 3-12M 1-2 Yrs 2-3 Yrs 3-4 Yrs 4-5 Yrs >5 Years Total
Cash and cash equivalents ZAR 1 972 – – – – – – – 1 972 USD 112 – – – – – – – 112
Investment: government bonds ZAR – – 272 – 106 – – – 378Investment: municipal bonds ZAR – – 33 – 75 – 100 1 892 2 100Development loans EUR – – 1 1 2 2 – – 6
USD 485 (776) 1 464 1 977 2 078 2 126 1 760 5 956 15 070ZAR 363 2 897 2 320 2 640 2 662 2 710 2 135 38 691 54 418
Derivatives: development bonds EUR 10 87 224 302 302 275 248 1 153 2 601 ZAR – – 10 5 – – – – 15
Total financial market assets 2 942 2 208 4 324 4 925 5 225 5 113 4 243 47 692 76 672
CCS: Lines of credit USD 1 (59) (80) (129) (119) (119) (119) (297) (921)ZAR – (17) (91) (108) (108) (94) (80) (477) (975)
Funding bonds ZAR – (2 407) (4 712) – (1 295) (9 228) – (15 755) (33 397)Funding: Lines of credit EUR (10) (87) (224) (302) (302) (275) (248) (1 154) (2 602)
USD (59) (546) (3 088) (1 517) (2 422) (2 409) (857) (2 243) (13 141)ZAR – (7) (88) (94) (94) (94) (94) (153) (624)
Funding: Money market debt ZAR – (1 420) (500) – – – – – (1 920)
Total financial market liabilities (68) (4 543) (8 783) (2 150) (4 340) (12 219) (1 398) (20 079) (53 580)
Liquidity gap 2 874 (2 335) (4 459) 2 775 885 (7 106) 2 845 27 613
Cumulative liquidity gap 2 874 539 (3 920) (1 145) (260) (7 366) (4 521) 23 092
Note that the contractual liquidity gap has been adjusted to include the Bank’s 2027 zero coupon liability at current book value. This bond contractually matures in 2027 and accrues interest semi-annually toward a maturity value of R7.47 billion.
CREDIT RISK DEFINITION OF CREDIT RISK
Credit risk is the risk of economic loss should any of the Bank’s clients or market counterparties fail to fulfil their contractual obligations. Credit risk is inherent mainly in the Bank’s development financing and lending operations as a result of potential counterparty defaults on debt repayments. Credit risk may also arise where the downgrading of a client’s rating causes the fair value of the investment in that entity to deteriorate. Credit risk is also manifested as country risk in the event where circumstances arise in a country in which an exposure or counterparty is domiciled, resulting in a reduction of the value of assets. Settlement risk is another form of credit risk, which is the risk of a counterparty failing to deliver cash (securities) due to be delivered at a particular moment in time, following release of the corresponding cash (securities) by the Bank in settlement of a transaction.
MANAGEMENT OF CREDIT RISKThe DBSA, as a development finance institution, faces a unique challenge in maintaining a sustainable balance between maximising development returns and minimising financial loss in its lending and other investment operations. As a result, the performance of the Bank is to a large extent dependent on its ability to take credit risks responsibly in exchange for appropriate rewards and to manage the resultant exposure to credit risk effectively in the pursuance of its corporate objectives.
The Bank meets its credit risk management objectives through i) an enterprise-wide framework of credit risk oversight, governance and assurance, ii) an integrated system of internal credit risk ratings, pricing and mitigation guided by its risk appetite, and iii) a rigorous standard for the measurement, monitoring and control of credit risk exposures in the credit portfolio.
CREDIT RISK OVERSIGHT, GOVERNANCE AND ASSURANCECredit risk oversight: The Board of Directors, as part of their oversight duties, sets the tone for the management of risk and defines the level of risk that the Bank is willing to assume, as well as considers the granting of large credits and reviews the overall performance in the management of risk through its subcommittees. A risk appetite statement, that details the level of risk that the Bank is willing to take in order to achieve its objectives and mandate, is approved annually by the Board of Directors.
Credit risk governance: The ongoing governance of the Bank’s risk taking activities is devolved to management. For credit risk management, the Bank has in place Board and corporate level credit committees mandated to maintain credit policies and standards, review and approve credits under delegated authority, as well as monitor and report the overall level of exposures to credit risk and performance in the management of these exposures. Portfolio reports are presented to the Corporate Credit Committee on a quarterly basis and Board Valuations Committee on a semi-annual basis. The Board also reviews and approves the Bank’s risk appetite statement on an annual basis.

Development Bank of Southern Africa2017 Annual Financial Statements
59
Credit risk assurance: The quality of credit risk management is assured through the centralised Group Risk Assurance division, responsible for the development of policy, models and standards in support of the efficient and effective management of credit risk. Credit analysts, who report to Financing Operations division, have been deployed as a first line of defence to provide an objective view of the quality of individual credits under consideration. This team also works closely with the frontline to monitor the performance of assets post-approval on an ongoing basis.
CREDIT RISK RATINGS CREDIT RISK RATINGS, PRICING AND MITIGATION
Obligor credit risk ratings: The Bank is not regulated by the SARB under the Banks Act, but rather by the DBSA Act, and as such is not formally obligated to comply with Basel II Pillar 1 requirements. However, as a leveraged financial institution, prudence requires it to maintain the adequate levels of capital to cover for expected losses. The Bank does comply with Basel standards in the development of risk models as industry best practice rather than for regulatory purposes. The key variables in the Bank’s quantitative assessment of expected loss and by implication in setting risk- adjusted pricing are:• Probability of default (PD), which determines the likelihood that the client will not be able to meet its debt repayments based on
creditworthiness.• Exposure at default (EAD), which calculates the size of exposure and thus potential loss at the point of default.• Loss given default (LGD), which estimates the portion of exposure that is expected not to be recovered at the event of default.
The Bank has developed a number of internal credit risk rating models for all of its major asset classes to calculate credit risk ratings as a basis for assigning a probability of default. All credit ratings are confirmed through the Credit Committee process to ensure consistency and effective challenge. The credit risk rating models are all subjected to validation and review before implementation. The application of credit risk models has been system enabled and deployed to all business divisions.
The models are also subjected to performance monitoring and validation by a technical committee as a part of governance requirements every three years. The principal objective for this is to ensure that assumptions used in model development are still appropriate and ensure that any deficiencies are identified early and that the models produce the most accurate possible quantitative assessment of the credit risk to which the Bank is exposed, from the level of individual facilities up to the total portfolio. As part of model reviews, these models are calibrated to performance along with functional improvements to cater appropriately for the asset classes being measured.
COUNTRY RISK RATINGSCountry risk ratings: The Bank has implemented an internal country risk rating model which uses external ratings agency ratings as well as economic data from various sources such as International Monetary Fund and the World Bank. The Country Risk Technical Committee reviews the country ratings on an annual basis or as necessary in accordance with rating schedules or rapid reviews where the risk profile changes materially over a shorter period. The country risk rating methodology considers solvency, liquidity, economic and political issues to risk rate countries and generate probability of default. The model inputs are continuously updated to reflect economic and political changes in individual countries. The Bank’s country risk limits are calculated using sovereign risk ratings in conjunction with debt absorption capacity of countries as measured by the gross domestic product. The limits therefore consider the economic strength of countries ensuring that country exposures are related to the degrees of perceived risk as well as the country’s debt absorption capacity. Using PD and LGD in the calculation of the risk limits per country, the limits set are also subject to the availability of capital and the number of simultaneous defaults that can be absorbed by that capital. All limits are set in line with the approved risk appetite.
A key element of DBSA’s internal risk rating and pricing model is the PD master rating scale as shown overleaf. This scale has been developed to distinguish meaningful differences in the probability of default risk throughout the risk range. The banding estimates are derived from internal data which is based on the performance of the Bank’s loan book. The master-scale is comparable and has been approximately benchmarked to rating agencies as well as similar financial institutions.

NOTES TO THE ANNUAL FINANCIAL STATEMENTS CONTINUEDFOR THE YEAR ENDED 31 MARCH 2017
03 NOTES TO THE ANNUAL FINANCIAL STATEMENTS
43. RISK MANAGEMENT CONTINUED CREDIT RISK RATINGS CONTINUED
Rating gradeMid joint
PD (%)Lower bound
PD (%)Upper bound
PD (%)Mapping to S&P
Mapping to Moody’s
MS 1 0.01 - 0.02 AAA AaaMS 2 0.02 0.02 0.03 AA+ Aa1MS 3 0.03 0.03 0.04 AA Aa2MS 4 0.04 0.04 0.05 AA- Aa3MS 5 0.05 0.05 0.06 A+ A1MS 6 0.06 0.06 0.08 A A2MS 7 0.10 0.08 0.14 A- A3MS 8 0.17 0.14 0.24 BBB Baa1MS 9 0.30 0.24 0.40 BBB Baa2MS 10 0.50 0.40 0.68 BBB- Baa3MS 11 0.85 0.68 1.13 BB+ Ba1MS 12 1.40 1.13 1.90 BB Ba2MS 13 2.40 1.90 3.20 BB- Ba3MS 14 4.00 3.20 5.50 B+ B1MS 15 7.00 5.50 9.50 B B2MS 16 12.00 9.50 16.00 B- B3MS 17 58.00 16.00 99.99 CCC Caa etc
Default 100.00 99.99 100.00 Default D
PRICING OF LOANSThe pricing of loans has been stable and consistent through the use of a standardised pricing model applied since January 2013. The model was developed to take into account risk capital and deliver an accurate risk adjusted return on capital (RAROC), net present value (NPV) and sustainability profit on an economic basis.
The pricing model has been updated annually to take into account changes to cost structure and budget as well as credit risk performance. The risk ratings from credit risk models approved by the Investment Committee are used for both the calculation of expected loss in the cash flow of the model as well as the influence on risk capital held at the cost of capital and the hurdle rate of return required on the risk capital.
Further enhancements to the pricing model were carried out in the 2016/17 financial year to improve the output information including measures such as ROE, ROA, RAROC, ROEC and economic profit. This will enable the setting of hurdle rates specific to types of business with different economic return vs developmental return. Further enhancements to the pricing model include products other than loans. The latest version of the pricing model will be implemented in the 2017/18 financial year.
CREDIT RISK MODELSThe credit risk models (PD, LGD, and EAD) for all major portfolios of the DBSA loan book (Municipal, Balance Sheet Lending and Project Finance) were subjected to review and further development during the 2016/17 financial year.
This is required to be carried out on a three-year cycle for governance purposes and approved by the Risk Models Technical Committee which is a sub-committee of the Investment Committee. The review and further development was embarked upon in conjunction with KPMG. Substantial improvements were made to the functional capabilities of the models to cater for possible financial structures and changes in environment.
The new versions of the models are more adaptable and predictive. The models were recalibrated to current performance of the DBSA loan book and larger benchmark portfolios. Future enhancements have been earmarked for consideration of IFRS9 implications. The new versions of the credit risk models were successfully approved by the Technical Committee and implemented. Performance of these models will be tracked as part of the governance requirements.
CREDIT RISK MITIGATIONIn addition to pricing for risk, the Bank uses a wide range of instruments to enhance the quality of credit and/or reduce the expected losses in its lending portfolio. The amount and type of credit risk mitigation depends on the asset quality and nature of each transaction. Collateral and guarantees are used by the Bank for credit risk mitigations. The main types of collateral taken comprise mortgage bond over commercial and industrial properties, bonds over plant and equipment, and the underlying moveable assets financed. The Bank also uses various forms of specialised legal agreements like guarantees and similar legal contracts in support of credit extension, where necessary.

Development Bank of Southern Africa2017 Annual Financial Statements
61
CREDIT RISK MONITORING, MEASUREMENT AND REPORTINGThe Bank dedicates considerable resources to monitor the quality of credit throughout the life time of assets and measure the exposure and performance of assets across portfolios.
At individual level:• Performance of credit is monitored and reported in terms of adherence to terms and conditions;• Credit risk ratings are updated on an annual basis;• Potential problem loans are identified based on early indications of distress and placed on a credit watch list;• Non-performing accounts are transferred for independent workout and recovery;• Financial covenants are an important tool for credit mitigation within the DBSA in monitoring the quality and performance of
counterparties; and• A watch list process is in place where clients that are in stress, or where there are signs of possible future stress due to changing
operating environment, are monitored closely and strategies are put in place to minimise the possibility of default.
At portfolio level:• Limits are established within the Bank’s risk appetite to monitor and control the aggregate amount of risk that the Bank is taking on; and• Overall performance of portfolios is measured and reported on a quarterly basis in terms of standard KPIs.
CREDIT RISK EXPOSURE MAXIMUM EXPOSURE
The Bank prepares monthly financial results as well as quarterly financial statements. These results are crucial for internal decision making. Consequently, it is imperative that the asset portfolio be comprehensively reviewed and significant risk indicators impacting the valuations and impairments be reflected timeously and adequately in the financial results. As a result, regular reviews are conducted on the loans and equities portfolio. The Back Office team reviews the accounting implications of credit risk and investment specific factors within the portfolio on a monthly basis. This ensures that the effect of the changes reported in the monthly financial results and quarterly financial statements are on a proactive and timely basis.
These reviews are conducted as part of and in complementing the Investment Committee process. The following factors are reviewed: global and local economic factors, observable and unobservable market factors, asset specific factors affecting portfolio impairment levels, fair values and discount rates with the objective of ensuring that risk in the asset portfolio is adequately, fairly and timely reflected in the DBSA's results. The reviews include assessment of the impairment triggers and reversals within the asset portfolio, review of performance of the equity portfolio on a regular basis with the asset managers. In addition the Impairment Working Group and Watch list meetings are held monthly.
March 2017 March 2016
in thousands of randsGross
amount
Allowance for credit
lossesCarrying
amountGross
amount
Allowance for credit
lossesCarrying amount
(a) Development loansNon-performing bookMunicipalities 341 565 168 498 173 067 423 610 225 756 197 854Other 2 145 391 1 149 163 996 228 2 283 556 1 293 164 990 392
2 486 956 1 317 661 1 169 295 2 707 166 1 518 920 1 188 246
Performing bookLow risk
Municipal 16 005 279 13 871 15 991 408 17 165 549 18 432 17 147 117Other 2 752 658 3 847 2 748 811 2 202 931 13 969 2 188 962
Medium riskMunicipal 10 326 671 19 748 10 306 923 6 582 197 152 606 6 429 591Other 28 745 052 655 183 28 089 869 33 805 013 628 021 33 176 992
High riskMunicipal 333 441 21 298 312 143 418 762 40 412 378 350Other 15 017 169 1 645 759 13 371 410 10 418 916 994 630 9 424 286
73 180 270 2 359 706 70 820 564 70 593 368 1 848 070 68 745 298
Total book debt 75 667 226 3 677 367 71 989 859 73 300 534 3 366 990 69 933 544

NOTES TO THE ANNUAL FINANCIAL STATEMENTS CONTINUEDFOR THE YEAR ENDED 31 MARCH 2017
03 NOTES TO THE ANNUAL FINANCIAL STATEMENTS
43. RISK MANAGEMENT CONTINUED CREDIT RISK EXPOSURE CONTINUED MAXIMUM EXPOSURE CONTINUED
The following types of collateral are held in respect of the above loans: guarantees, cession of debtors, cession of income streams, mortgages, investments, notarial bonds, sinking fund investments, promissory notes, insurance policies and treaty obligations.
March 2017 March 2016
in thousands of randsGross
amount
Allowance for credit
lossesCarrying
amountGross
amount
Allowance for credit
lossesCarrying amount
Geographical analysis of development loansNon-performing bookSouth Africa 1 472 919 805 665 667 254 1 778 663 1 085 773 692 890Rest of Africa 1 014 037 511 996 502 041 928 503 433 147 495 356
Total 2 486 956 1 317 661 1 169 295 2 707 166 1 518 920 1 188 246
Performing bookSouth Africa 56 584 520 482 290 56 102 230 53 333 488 476 380 52 857 108Rest of Africa 16 595 750 1 877 416 14 718 334 17 259 880 1 371 690 15 888 190
Total 73 180 270 2 359 706 70 820 564 70 593 368 1 848 070 68 745 298
Grand total 75 667 226 3 677 367 71 989 859 73 300 534 3 366 990 69 933 544
Impairment balance sheet (excluding interest in suspense (March 2017: R462.7 million (2016: R438.6 million))
in thousands of rands 2017 2016
Identified impairmentsPerforming loans 1 016 229 656 434Non-performing loans 1 317 661 1 518 920
Total 2 333 890 2 175 354
Unidentified impairmentsModel driven 1 343 477 1 191 636
Grand total 3 677 367 3 366 990
March 2017 March 2016
in thousands of randsGross
amount
Allowance for credit
lossesCarrying
amountGross
amount
Allowance for credit
lossesCarrying amount
(b) Development bondsPerformingMunicipal 1 290 607 288 1 290 319 1 290 466 170 1 290 296
The maximum exposure relating to development bonds is R1.3 billion (March 2016: R1.3 billion).

Development Bank of Southern Africa2017 Annual Financial Statements
63
March 2017 March 2016
in thousands of randsGross
amount
Allowance for credit
lossesCarrying
amountGross
amount
Allowance for credit
lossesCarrying amount
(c) Other receivables:Performing bookTrade debtors – 90 days and above 12 350 2 265 10 085 8 557 2 942 5 615Other debtors: 90 days and above 356 – 356 9 808 – 9 808
12 706 2 265 10 441 18 365 2 942 15 423
Performing bookTrade debtor: 30 days 42 264 – 42 264 46 600 – 46 600Other debtors: 30 days 1 558 – 1 558 2 867 – 2 867 Trade debtors: 30 to 60 days 6 939 – 6 939 15 841 – 15 841Other debtors: 30 to 60 days – – – 658 – 658Trade debtors: 60 to 90 days 1 806 – 1 806 171 171 –Other debtors: 60 days – 90 days – – – 27 – 27
52 567 – 52 567 66 164 171 65 993
Staff and study loans 37 – 37 21 – 21Municipal deposits 88 – 88 480 – 480Prepaid expenses 10 627 – 10 627 13 144 – 13 144
10 752 – 10 752 13 645 – 13 645
Total book debt 76 025 2 265 73 760 98 174 3 113 95 061
in thousands of rands 2017 2016
(d) Commitments (loans signed, but not yet fully disbursed)Low risk
Municipal 106 002 90 710Other 1 040 000 61 500
Medium riskMunicipal 39 453 684 743Other 6 869 294 5 874 376
High riskOther 948 316 716 276
9 003 065 7 427 605
(e) Guarantees 172 938 94 099
March 2017 March 2016
in thousands of rands Total3
months3-6
months6-12
months> 12
months Total3
months3-6
months6-12
months> 12
months
(f) Loans that are past due not individually impairedOverdue amounts 593 301 435 195 131 757 25 174 1 175 448 306 415 095 9 723 23 488 -Not yet due 11 480 808 11 159 899
12 074 109 11 608 205
An amount of R239 million was received after the reporting date but before the authorisation of the Annual Financial Statements.
The fair value of collateral held in respect of the above amounted to R223 million (2016: R290 million). For the purposes of calculating this aggregated total, the fair value of each collateral is limited to the carrying value for each individual loan.
The above collaterals consist of guarantees, cession of debtors, mortgages, investments, notarial bonds, sinking fund investments and insurance policies.

NOTES TO THE ANNUAL FINANCIAL STATEMENTS CONTINUEDFOR THE YEAR ENDED 31 MARCH 2017
03 NOTES TO THE ANNUAL FINANCIAL STATEMENTS
43. RISK MANAGEMENT CONTINUED CREDIT RISK EXPOSURE CONTINUED MAXIMUM EXPOSURE CONTINUED
in thousands of rands 2017 2016
(g) Financial counterparty exposureBonds 2 023 445 2 069 136Derivatives 704 341 1 134 255Cash and money markets 2 299 247 2 084 565
5 027 033 5 287 956
CAPITAL MANAGEMENTThe Bank embarked on a project to improve Capital and Balance Sheet Management by aligning the Bank’s framework to international best practice. The framework largely borrows from Basel accord in so far as risk quantification and capital allocation are concerned. The solution has been customised to take into account the developmental nature of the Bank. The framework has been developed and the project will now move into the implementation phase. The following key benefits and outcomes are foreseen:• Improved measurement of portfolio risk that will allow the Bank to allocate capital more effectively to business/projects on an
ongoing basis• Detailed assessment and quantification of credit, operational and market risks.• Risk capital forecasting.• Risk capital stress testing.• Divisional performance reporting (move to risk performance measurement).
The above will ensure efficient utilisation of capital to support the Bank in implementing its strategy and ensuring long-term financial sustainability.
44. NON-CURRENT ASSET HELD-FOR-SALEDuring a previous financial year, as a result of calling on its security against a loan in default, the Bank obtained a 100% shareholding in a property investment company with a view to sell. This investment was classified as a non-current asset held-for-sale, as it is the Bank’s intention to dispose of the investment within 12 months. The value of the asset at the reporting date is R2 (March 2016: R2).
45. RELATED PARTIES45.1 RELATED PARTY RELATIONSHIPS
The DBSA is Schedule 2 major public entities in terms of the PFMA and therefore falls within the national sphere of government. As a consequence, the Bank has a significant number of related parties that also fall within the national sphere of government.
In addition, the Bank has a related party relationship with the directors and Executive Management. Unless specifically disclosed otherwise, these transactions are concluded on an arm’s length basis and the Bank is able to transact with any entity.
The South African government, through the Ministry of Finance, is the parent of the Bank and exercises ultimate control.
The DBSA has a 100% shareholding in Frandevco.
45.2 TRANSACTIONS WITH RELATED PARTIESThe following is a summary of transactions with related parties during the year and balances due at the end of the year:
45.2.1 NATIONAL PUBLIC ENTITIESThe total book debt of loans extended to national public entities amounts to R15.8 billion (March 2016: R15.9 billion). None of these loans are non-performing.
45.2.2. NATIONAL MANDATESThe net amount advanced to national mandates at year-end amounted to R41 million (March 2016: R44 million).
45.2.3 BRICSThere were no amounts paid to National Treasury for expenses relating to the BRICS programme during the year (March 2016: RNil).
45.2.4 FRANDEVCOThe Bank has 100% shareholding in Frandevco (March 2016: 100%).
There were no transactions with Frandevco during the year (March 2016: RNil).
45.2.5 RELATED PARTY TRANSACTIONSThere were no related party transactions with directors and key management personnel during the year (March 2016: RNil).

Development Bank of Southern Africa2017 Annual Financial Statements
65
in thousands of rands 2017 2016
46. CONTINGENCIES46.1 GUARANTEES
The Bank has approved and issued guarantees on behalf of borrowers amounting to: 172 938 94 099
After consideration by management it was decided that these borrowers are unlikely to default and therefore these guarantees were not recognised in the statement of financial position as a liability.
The book debt to the credit provider is: 172 938 94 099
46.2 CONTINGENT LIABILITIESThe Bank operates in a legal and regulatory environment that exposes it to litigation risks. As a result the Bank is involved in disputes and legal proceedings which arise in the ordinary course of business. The Bank does not expect the ultimate resolution of any of the proceedings to have a significant adverse effect on the financial position of the Bank. These claims cannot be reasonably estimated at this time.
47. COMMITMENTSAt the reporting date, the Bank had the following commitments:Development loan commitments 9 003 065 7 427 605Development expenditure 37 644 82 652Project preparation expenditure 91 370 63 636Equity investments commitments 1 214 247 1 612 185Capital commitments 66 200 113 000
10 412 526 9 299 078
47.1 DEVELOPMENT LOAN COMMITMENTSAs the disbursement pattern for loans committed but not disbursed is a primary function of individual borrowers’ implementation and administrative capacities, this pattern is not quantifiable. Loan commitments are to be financed from funds generated from operations and funds raised from local financial markets and foreign sources.
47.2 DEVELOPMENTAL EXPENDITUREDevelopmental expenditure on loan commitments approved but not yet contracted are to be financed from funds generated from operations and available cash resources.
47.3 PROJECT PREPARATION EXPENDITUREProject preparation expenditure, approved but not yet disbursed, are to be financed from funds generated from operations and available resources.
47.4 EQUITY INVESTMENT COMMITMENTSCommitment relates to private equity funds approved but not yet disbursed.
47.5 CAPITAL COMMITMENTSCapital expenditure is in respect of property, plant and equipment and intangible assets authorised, but not contracted for. These commitments will be financed from available cash resources, funds generated from operations and available borrowing capacity. These commitments are expected to be settled in the following financial year.

NOTES TO THE ANNUAL FINANCIAL STATEMENTS CONTINUEDFOR THE YEAR ENDED 31 MARCH 2017
03 NOTES TO THE ANNUAL FINANCIAL STATEMENTS
in thousands of rands 2017 2016
48. FINANCE LEASE OBLIGATIONMinimum lease payments due– within one year 563 514– in second to fifth year inclusive 508 1 074
Total 1 071 1 588
The Bank has entered into commercial lease on property. These leases have an average life of between three and five years with no renewal option or option to acquire the assets at termination date included in the contracts. There are no restrictions placed upon the Bank by entering into these leases.
49. IRREGULAR, FRUITLESS AND WASTEFUL EXPENDITUREFruitless and wasteful expenditure 20 143Irregular expenditure 929 –
949 143
Details of Fruitless and Wasteful expenditureMissed flights and fee charged on the late cancellation of a disciplinary hearing chaired by an external party 19 –Interest on late payments 1 –IT system error – Trade and other receivables – 143
20 143
Details of irregular expenditureSupply chain management variation orders 929 –
929 –
Two (2) incidents of fruitless and wasteful expenditure occurred during the year. One (1) incident is being negotiated with the utility company and no disciplinary action was taken. In the second incident, no disciplinary action was taken because there was no longer a need for disciplinary hearing services chaired by an external party. Three (3) incidents of irregular expenditure occurred during the year under review. Disciplinary action was taken on two (2) incidents and on the third incident no disciplinary action was taken, because the incident resulted from a change in business requirements.
50. FUNDS ADMINISTERED ON BEHALF OF THIRD PARTIESBalance at the beginning of the year 746 366 626 064Funds received 2 321 002 2 379 670Interest, foreign exchange and other movements 93 439 149 174Funds disbursed (2 211 966) (2 408 542)
Balance at the end of the year 948 841 746 366

Development Bank of Southern Africa2017 Annual Financial Statements
67
in thousands of rands 2017 2016
51. THIRD PARTY MANAGED FUNDS COST RECOVEREDThird party funds and mandatesAfrican Peer Review Mechanism (APRM) (1) 3 420African World Heritage Fund (AWHF) 5 653 4 904Anglo American 5 355 6 722Cities Project Preparation Facility (CPPF) 5 173 5 013Department of Basic Education for Accelerated Infrastructure Schools Programme 7 446 6 960Department of Rural Development & Land Reform – 1 043Department of Trade and Industry – 3 454Eastern Cape Department of Education – 15 907Ekurhuleni Metropolitan Municipality 747 13 340Elliotdale Human Rural Settlement (EHRS) 52 917European Investment Bank (EIB) – 607Green Fund 10 589 15 415GTAC – IPP Office 81 982 59 495Infrastructure Delivery Improvement Programme (IDIP) 788 5 120Infrastructure Investment Programme for South Africa (IIPSA) 3 532 4 122Investment Climate Facility (Anglo) 76 516KFW/VCT II – HIV Prevention by Voluntary Counselling and Testing Programme 1 569 1 742KFW SADC Water Fund 2 189 1 548Limpopo Department of Health – 873Limpopo Department of Public Works 2 114 3 396Municipal Infrastructure Support Agency (MISA) 858 852National Department of Health 9 137 17 904National Treasury Cities Support Programme (NTCSP) 3 532 3 524National Treasury – the Power Producer Projects unit (PPP) – 1 090New Partnership for Africa's Development (NEPAD) – 3 762Pan African Capacity Building Platform (PACBP) 3 250 3 062Southern African Development Community Secretariat – 24Spatial Development Initiatives (SDI) – 1 244Timbuktu Mali – 6
144 041 185 982
Third party managed funds managed per divisionFinancing Operations 96 105 81 800Finance 8 901 15 150Infrastructure Delivery 33 862 84 019South Africa Financing 5 173 5 013
144 041 185 982
Cost recovery for each divisionCorporate Services 140 569 168 309Financing Operations 307 2 359Infrastructure Delivery 3 165 15 132South Africa Financing – 182
144 041 185 982
03 NOTES TO THE ANNUAL FINANCIAL STATEMENTS
NOTES TO THE ANNUAL FINANCIAL STATEMENTS CONTINUEDFOR THE YEAR ENDED 31 MARCH 2017
52. TAXATIONThe Bank is exempt from South African normal taxation in terms of section 10(1)(t)(x) of the Income Tax Act, No 58 of 1962, as amended, and consequently no liability for normal taxation has been recognised. The Bank is registered for VAT, PAYE, SDL and UIF.
53. EVENTS AFTER THE REPORTING PERIOD APPROVAL OF FINANCIAL STATEMENTS
There were no adjusting events that occurred after the reporting date.
DISPOSAL OF EQUITY INVESTMENTThe Bank anticipates to dispose 50% of one of its equity investments. The exit price will be based on the March 2017 valuation and was approved in May 2017.
CREDIT RATING DOWNGRADEThe DBSA credit rating was downgraded following the sovereign credit downgrade. The short-term risk associated with the downgrade to the DBSA relates to the dollar book and at this point is largely restricted to a non-material incremental cost to the organisation.
54. COMPARATIVE FIGURESCertain comparative figures have been reclassified.

Development Bank of Southern Africa2017 Annual Financial Statements
69
AADFI Association of African Development Finance Institutions
AFD Agence Française de Développement
AfDB African Development Bank
AUCO Asset and Liability Management Committee
ASIDI Accelerated Schools Infrastructure Delivery Initiative
B-BBEE Broad-Based Black Economic Empowerment
BRIC Brazil, Russia, India and China
BRICS Brazil, Russia, India, China and South Africa
BSC Balanced Scorecard
COMESA Common Market for Eastern and Southern Africa
DBE Department of Basic Education
DBSA Development Bank of Southern Africa Limited
DFID The United Kingdom’s Department for International Development
DFRC Development Finance Resource Centre
DIRCO Department of International Relations and Cooperation
DTI Department of Trade and Industry
EAD Exposure at default
ECOWAS Economic Community of West African States
EIB European Investment Bank
EPC Engineering, procurement and construction
GDP Gross domestic product
IASB International Accounting Standards Board
ICAS Independent Counseling and Advisory Services
ICT Information and communications technology
IDIP Infrastructure Delivery Improvement Programme
IFRS International Financial Reporting Standards
IIPSA Infrastructure Investment Programme for South Africa
IPP Independent Power Producers
IRBA Independent Regulatory Board for Auditors
JICA Japan International Cooperation Agency
KfW The German agency Kreditanstalt für Wiederaufbau
LGD Loss given default
MIG Municipal Infrastructure Grant
MISA Municipal Infrastructure Support Agency
MTEF Medium-Term Economic Framework
NDP National Development Plan
NEPAD New Partnership for Africa’s Development
NII Net Interest Income
NSC North-South Corridor
ABBREVIATIONS AND ACRONYMS

04 REFERENCE INFORMATION
NTCSP National Treasury Cities Support Programme
PD Probability of default
PEG Price Earnings Growth
PFMA Public Finance Management Act, No 1 of 1999
PICC Presidential Infrastructure Coordinating Commission
PPP Public/private partnership
PRASA Passenger Rail Agency of South Africa
REIPPP Renewable Energy Independent Power Producers Procurement
SA Inc. South Africa Incorporated
SADC Southern African Development Community
SANRAL South African National Roads Agency Limited
SIP Strategic integrated project
SMME Small, medium and micro-enterprise
SOC State-owned company
UNOPS United Nations Office for Project Services
ABBREVIATIONS AND ACRONYMS CONTINUED

Development Bank of Southern Africa2017 Annual Financial Statements
71
FINANCIAL DEFINITIONS
Callable capital The authorised but as yet unissued share capital of the DBSA
Cost-to-income ratio Operating expenses, including personnel, other, depreciation and amortisation expenses, as a percentage of income from operations
Income from operations Net interest income, net fee income and other operating income
Interest cover Interest income divided by interest expense
Long-term debt/equity ratio Total liabilities, excluding other payables, provisions and liabilities for funeral benefits, as a percentage of total equity
Debt/equity ratio (including callable capital)
Total liabilities, excluding other payables, provisions and liabilities for funeral benefits, (including callable capital), as a percentage of total equity and callable capital
Net interest margin Net interest income as a percentage of interest income
Return on average assets Net profit or loss for the year expressed as a percentage of average total assets
Return on average equity Net profit or loss for the year expressed as a percentage of average total equity
Sustainable earnings Profit or loss from operations before grants, net foreign exchange gain/(loss) and net gain/(loss) from financial assets and financial liabilities, including revaluation on equity investments
Registered office Headway Hill1258 Lever Road, Midrand, Johannesburg, South Africa
Postal address PO Box 1234Halfway House1685South Africa
Banker The Standard Bank of South Africa
Auditor Nkonki Inc. Registered Auditor
Company registration number 1600157FN
Preparer The Annual Financial Statements were compiled under the supervision of the Acting Chief Financial Officer, Zodwa Mbele CA (SA)
Telephone + 27 11 313 3911Fax + 27 11 313 3086Home page www.dbsa.org
GENERAL INFORMATION

Development Bank of Southern Africa2017 Annual Financial Statements
72
NOTES

1221

WWW.DBSA.ORG