annual monitoring report - greater cambridge planning
TRANSCRIPT

Annual Monitoring Report
December 2012
Planning Services 1 A
pril
2011
– 31
Mar
ch 2
012

Annual Monitoring Report 2012
Cambridge City Council Annual Monitoring Report December 2012 Covering the period 1st April 2011 – 31st March 2012

Annual Monitoring Report 2012
Contents Page List of Abbreviations i Executive Summary iii Main Report Page 1 Introduction 1 2 Cambridge Today 4 3 Designing Cambridge 9 4 Conserving Cambridge 13 5 Living in Cambridge 16 6 Enjoying Cambridge 27 7 Working and Studying in Cambridge 30 8 Connecting and Servicing Cambridge 34 9 Areas of Major Change 38 10 Implementation 44 11 Local Development Scheme 47 12 Development Monitoring Framework 54 Appendices Page Appendix A Contextual Indicators 58 Appendix B Local Indicators 66 Appendix C Local Plan Policy Usage 71 Appendix D Housing Trajectory 74 Appendix E Housing Summary 75 Appendix F Feed in Tariff Installations Statistical Report 81 Appendix G Cambridge East Indicators 83 Appendix H North West Cambridge Indicators 85 Appendix I Use Classes Order 87 Appendix J Advice Note – Deleted Local Plan Policies 89 Figures Page Figure 1 Population Forecast to 2031 6
Figure 2 Housing Completions and Projected Completions 1st April 2001 to 31st March 2031.
18
Figure 3 Five Year Land Supply Summary Table 20 Figure 4 Cumulative Completions 21 Figure 5 Dwelling Completions 1999 – 2011 23 Figure 6 Dwelling Size Mix 2011/12 25
Figure 7 Proportion of Residents aged 16-64 Claiming Job Seekers Allowance
32
Figure 8 Southern Fringe 38 Figure 9 Local Development Scheme Timetable 50 Figure 10 Evidence Based Work 51 Figure 11 Local Development Framework Documents 53 Page Bibliography 93

List of Abbreviations
Annual Monitoring Report 2012 i
Definition AAP Area Action Plan AMR Annual Monitoring Report ASHE Annual Survey of Hours and Earnings BfL Building for Life BREEAM Building Research Establishment Environmental Assessment
Method CATS Cambridge Area Transport Strategy CCC Cambridge City Council CHP Combined Heat & Power CIL Community Infrastructure Levy CiWs City Wildlife Site CLG Department for Communities and Local Government CPERC Cambridgeshire and Peterborough Environmental Records Centre CSR Cambridge Sub-Region DPD Development Plan Document DPH Density Per Hectare DPSSC Development Plan Sub Scrutiny Committee EEDA East of England Development Agency EERA East of England Regional Assembly ELR Employment Land Review EU European Union GCP Greater Cambridge Partnership GO-EAST The Government Office for the East of England Grade I Listed Buildings of exceptional interest, sometimes considered to
be internationally important. Grade II Listing Buildings that are nationally important and are of special
interest. Grade II* Listed Buildings that are particularly important and of more than
special interest. ha Hectares HESA Higher Education Statistics Agency HMO Housing in Multiple Occupation HRA Habitats Regulation Assessment HSSA Housing Strategy Statistical Appendix IMD Index of Multiple Deprivation IPPG Informal Planning Policy Guidance JDCC Joint Development Control Committee JSGIC Joint Strategic Growth Implementation Committee JTF Joint Transport Forum LDF Local Development Framework LDS Local Development Scheme LEP Local Enterprise Partnership LNR Local Nature Reserve Local Plan Review The Cambridge Local Plan - Towards 2031 LTP3 The 3rd Local Transport Plan m² Square Metres MW Megawatt NHB New Homes Bonus NHS National Health Service NIAB National Institute of Agricultural Botany

List of Abbreviations
Annual Monitoring Report 2012 ii
Definition NPPF National Planning Policy Framework ODPM Office of the Deputy Prime Minister (succeeded by the CLG) ONS Office for National Statistics PDL Previously Developed Land PPS Planning Policy Statement RDA Regional Development Agency RGF Regional Growth Fund RSS Regional Spatial Strategy (also known as the East of England
Plan) S106 Section 106 S29 Section 29 Committee SA Sustainability Appraisal SFRA Strategic Flood Risk Assessment SHLAA Strategic Housing Land Availability Assessment SHMA Strategic Housing Market Assessment SPD Supplementary Planning Document SSSI Site of Special Scientific Interest SuDs Sustainable Drainage Systems TIF Transport Innovation Fund WCS Water Cycle Strategy

Executive Summary
Annual Monitoring Report 2012 iii
The Annual Monitoring Report (AMR) provides background information on the city and highlights the issues that need to be considered when developing planning policies. Cambridge Today (Chapter 2) and the Contextual and Local Indicators (Appendix A & B) provide a general picture of what the city is like, for example, how many people live in Cambridge, how many students there are, or the unemployment rate. Key highlights The National Planning Policy Framework (NPPF) was published on 27th March 2012. The document replaces 44 National Planning Policy Statements, Guidance, Government Circulars and Notes to Chief Planning Officers. Since the NPPF was produced, the Council has analysed the level of conformity of the current Local Plan with the NPPF. Analysis has shown that the Local Plan is strongly compliant with the NPPF. Areas of Major Change There are six areas of major change: East Cambridge, Southern Fringe, Northern Fringe, Madingley Road/Huntingdon Road, Huntingdon Road/Histon Road, Station Area. A considerable amount of work has been carried out and is continuing in order to ensure that the areas of major change are as sustainable as possible in providing successful new communities in Cambridge. Construction is now underway at Trumpington Meadows, Clay Farm and Glebe Farm, with the first homes occupied in Trumpington Meadows in August 2012 and Glebe Farm in September 2012. Work is also underway in the Station Area and Student Accommodation has nearly been completed on Blocks M1, 2, 5 and 6 of the CB1 masterplan and nine bus stops - two of which are double stops providing 11 bays in total were completed this year. There are two bidders in the running for the development of the proposed Papworth Hospital. Skanska and Bouygues, have developed proposals for a new Papworth Hospital on the Addenbrooke's site under the Private Finance Initiative process. A decision on the successful bidder is likely in Spring 2013. Local Plan Review Progress on developing the new Local Plan is set out in Chapter 11. Good progress has been made. The Issues and Option stage has recently been completed with consultation on the Issues and Options Report taking place for six weeks between 15th June to 27th July 2012. The Issues and Options Report set out a series of issues and options relating to the future planning and development of the city over the 20 years and asked for people’s views including local residents and other key stakeholders. All documents were available on the Council’s website and at libraries for people to view. A series of exhibitions were also held across the city and over 11,000 comments have been received from 858 respondents. The next stage is the Issues and Options 2 consultation which will run from 7th January to 18th February 2013. This is split into two parts. Part 1 of this second stage of Issues and Options consultation is a joint consultation (with South Cambridgeshire District Council) on options for the development strategy for the wider Cambridge area and for site options for housing or employment development on the edge of Cambridge on land currently in the Green Belt. It also includes options on sub-regional sporting, cultural and community facilities and site options for a community stadium. It builds on the Issues and Options consultations that took place in Summer 2012 and provides background information on the

Executive Summary
Annual Monitoring Report 2012 iv
housing and employment needs of the area as a whole, as well as outlining what that means for the future development strategy. In Part 2, the City Council will be consulting on site options for the urban area of Cambridge, including a range of uses for possible site allocations, as well as picking up more detailed matters such as consultation on residential space standards and car and cycle parking standards. The document will also include designations of land for a range of purposes, e.g. Protected Open Space. The timetable for the Community Infrastructure Levy will run in parallel to the review of the Local Plan and more information can be found in Chapter 10.

1 - Introduction
Annual Monitoring Report 2012 -1-
Introduction 1.1 Comprehensive monitoring is essential in order to establish whether the Council is
succeeding in promoting and managing the future development of Cambridge. Section 35 of the Planning and Compulsory Purchase Act 2004 established the statutory need for monitoring to be integral to policy-making and introduced the requirement for an Annual Monitoring Report (AMR). Section 48 of the Town and Country Planning (Local Development) (England) Regulations 2004 covers the mechanisms that will be triggered if policies and allocations are not being met.
1.2 Guidance issued by the Department for Communities and Local Government (CLG)
- in March 2005 and updated in October 2005 and July 2008 (ODPM, 2005a & CLG 2008a) - was revoked in a letter from Bob Neill (Parliamentary Under Secretary of State) dated 30th March 2011 (CLG, 2011b [online]). This means that there is no longer a requirement to produce a set of Core Indicators as in previous years’ AMRs. There is merit in continuing to monitor these Local Indicators, therefore they can be found in Appendix B of this year’s AMR.
1.3 The Localism Act has removed the requirement to send an AMR to the Secretary of
State. However, there will still be a requirement to produce this report (at least annually), and it will be published on the Council’s website annually.
1.4 The AMR should:
• cover the period from 1st April of the previous year to 31st March of the submission year;
• contain a review of progress for each of the documents in the Council’s Local Development Scheme (LDS);
• identify any policies from Development Plan Documents (DPDs) or any previous Local Plan policies that are still in place but are not being implemented. As a part of this work, investigation will be carried out to establish why policies are not being implemented, and what steps will be taken to either secure implementation of the policy or replace it;
• produce a housing trajectory including net annual completions for the relevant AMR period and the net annual completions since the adoption of a housing requirement policy;
• Information on Local Development Orders adopted by the authority, reasons for their creation or reasons for the revocation of such orders.
• make the AMR available on the Council’s website as soon as possible following submission.
This AMR meets the requirements as set out above and many of the additional elements as set out in the guidance.
Policy Context
1.5 The Cambridge Local Plan was adopted on 20th July 2006. The Secretary of State issued a formal Direction on 2nd July 2009 saving the majority of policies in the Cambridge Local Plan 2006. Only those policies listed in the Direction are now formally part of the Cambridge Local Plan 2006 (See Appendix J for a list of deleted policies).

1 - Introduction
Annual Monitoring Report 2012 -2-
1.6 Whilst the review of the Local Plan is well underway, the Cambridge Local Plan 2006, two Area Action Plans and six Supplementary Planning Documents have been reviewed to establish the extent to which they are compliant with the NPPF. The analysis showed that there is significant overall compliance with the NPPF.
1.7 The Council’s Development Plan Sub Scrutiny Committee agreed (on 22nd March 2011) a new approach and timescales for the review of the Local Plan 2006. The current estimated date for adoption is April 2014. This process is referenced throughout this document as the Local Plan Review or the Cambridge Local Plan - Towards 2031. Further information on the progress and preparation of the Cambridge Local Plan - Towards 2031 can be found in Chapter 11.
Building for the Future 1.8 As with last year’s AMR, the Council has tried to strengthen the housing trajectory in
terms of developing a more robust approach to projecting housing completions; considering existing permissions; and estimating when Local Plan allocations might come forward.
Topic Chapters 1.9 The topic chapters of the AMR are structured in the same way as the Local Plan.
This makes it easier to select and review an area of interest. In addition, Contextual and Local Indicators can also be found in Appendix A and B respectively to enable quick access to these results.
1.10 Each topic chapter has been split into 5 or 6 sections. These sections are explained
in more detail in the paragraphs below:
• Introduction • Use of Policies • Issues to Consider • Target Based Policies and/or Other Indicators • Conclusion & Actions
1.10.1 The Introduction establishes the key issues and information for the city. 1.10.2 Use of Policies in the Council’s decisions concerning planning applications.
This involves straightforward recording of the key policies used in planning decision-making. Reasons for policy usage can then be explored if necessary. In many cases, under-usage of policies will occur because there have not been any relevant applications or that the policies have been used only in pre-application discussions by Development Management. Appendix C shows all Local Plan policies and their associated usage over 2011/12 year. This year’s policy usage figures are higher than the previous year by 16%.
1.10.3 Issues to Consider - This section considers whether any problems or issues
have been identified with particular policies. Discussions with Development Management officers have taken place to highlight where there may be potential problems, explore the nature of the issues and identify potential solutions or opportunities to review policies. Information from annual discussions carried out from the adoption of the Local Plan 2006 and analysis

1 - Introduction
Annual Monitoring Report 2012 -3-
from subsequent Annual Monitoring Reports will help feed into the preparation of the Cambridge Local Plan - Towards 2031. Other important information such as the emergence of new policy documents, background evidence or schemes are also included in this chapter.
1.10.4 Target Based Policies and/or Other Indicators - A number of policies in the
Local Plan are based on thresholds and/or targets, which trigger provision of some kind. The provision of affordable housing through Policy 5/5 is one such example. For this AMR, a limited number of policies have been selected for monitoring in this way. Analysis of this work will show how successful the Council is at implementing these policies or whether there are any issues that need to be addressed.
1.10.5 Conclusion & Actions – This section identifies any actions that will be taken
during the coming year and pulls together key issues and concluding comments for the chapter.
1.11 Some chapters such as the Local Development Scheme, Areas of Major Change
and Living in Cambridge have been laid out differently as more detailed content is required. A change in format helps to ensure ease of reading.

2 – Cambridge Today
Annual Monitoring Report 2012 -4-
2.1 Cambridge has an area of approximately 4,070 hectares and is located around 60 miles north-east of London. It is best known as the home of the University of Cambridge (which is made up of 31 colleges), and the resulting historic environment that has been created.
2.2 Recent results from the 2011 census show a ‘usually resident’ population in
Cambridge at 123,900. This indicates that the population of Cambridge has grown by 13.8% since the last Census figures in 2001.1 Census population density calculations show Cambridge as having 30.4 persons per hectare, significantly higher than that of the rest of the county which reveals an average density of 2 persons per hectare.
2.3 The 2011 Census shows that out of a population of 123,900, 16,500 people live in
communal establishments. The average household size is 2.3 persons per household.
2.4 The 2011 Census also estimates that Cambridge has 3,300 short-term non-uk
residents. The total figure for the whole of Cambridgeshire is 4,100. 2.5 Usual resident population by age group shows that Cambridge has a high
percentage of residents in their twenties (25%), whilst 22% of the population is 19 years old or under.
Cambridgeshire Cambridge %
All Ages 621,200 123,900 100% 0-4 36,800 6,700 5.41% 5-9 33,700 5,100 4.12%
10-14 34,800 5,000 4.04% 15-19 39,500 10,200 8.23% 20-24 44,200 18,100 14.61% 25-29 41,700 13,400 10.82% 30-34 41,900 11,400 9.20% 35-39 42,700 8,500 6.86% 40-44 46,300 7,700 6.21% 45-49 45,900 7,100 5.73% 50-54 39,500 5,900 4.76% 55-59 35,700 5,400 4.36% 60-64 38,200 5,000 4.04% 65-69 30,000 3,800 3.07% 70-74 23,200 3,000 2.42% 75-79 18,700 2,700 2.18% 80-84 14,500 2,300 1.86% 85-90 9,100 1,700 1.37%
90+ 4,800 1,000 0.81% 2.6 The latest population estimates put the population of the city at 120,900
(Cambridgeshire County Council, 2011f [online]) for 2011. Cambridge is the main settlement within a rapidly growing sub-region. As a county, Cambridgeshire2
1 http://www.cambridgeshire.gov.uk/business/research/populationresearch/Census+2011.htm 2 Cambridgeshire consists of Cambridge, East Cambridgeshire, Fenland, Huntingdonshire, South Cambridgeshire Local Authorities unless stated otherwise

2 – Cambridge Today
Annual Monitoring Report 2012 -5-
encompasses over 612,600 people living in surrounding villages, new settlements and market towns. Around 29,087 students study at the two universities in Cambridge. This figure has dropped since last year’s AMR, in which the student population was estimated at 30,311. The figures in Appendix A illustrate that student numbers the University of Cambridge have decreased, whilst intake numbers at Anglia Ruskin University have increased.
2.7 The city is enclosed by a Green Belt, the boundaries of which have been the
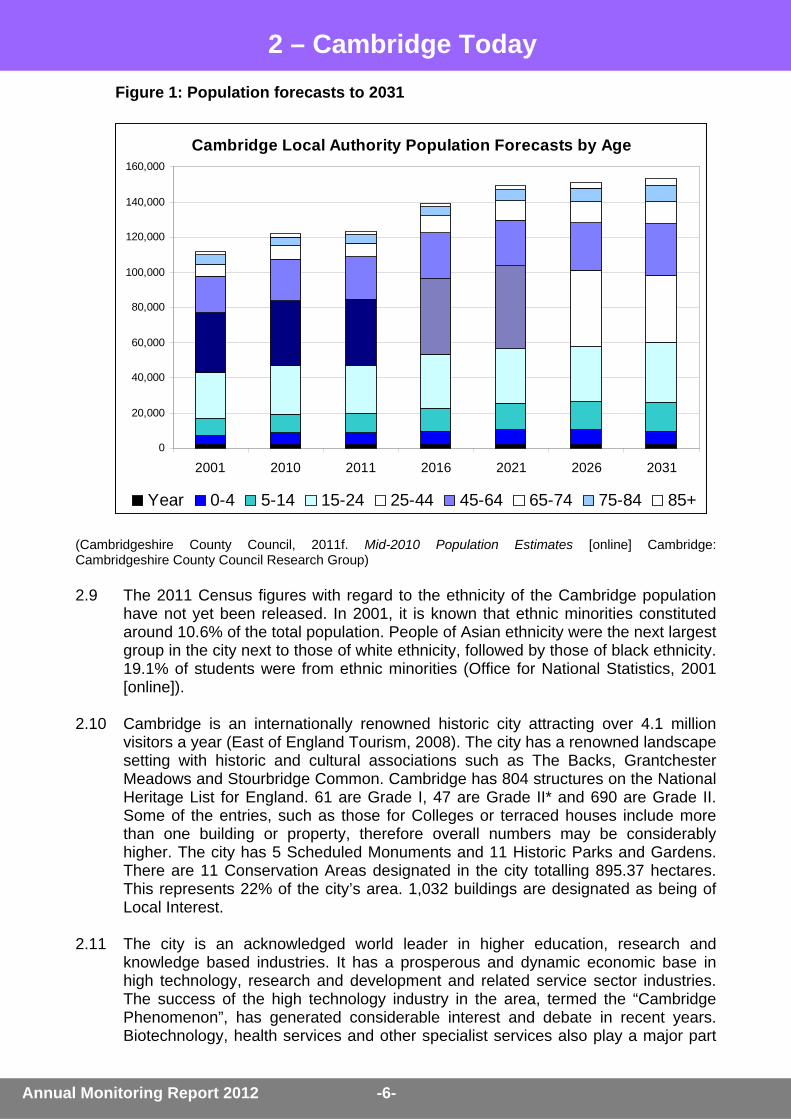
subject of recent planned changes to allow for more sustainable growth in the Cambridge area. These developments will provide more homes for key workers and other groups and increase the population of the city further. The County Council’s 2010 mid-year population forecasts (released in 2011) estimated that between 2011 and 2016, the population is projected to rise to 137,300: an increase of 11% and by 2026 to 148,600 an increase of 18%. By 2031, the population is expected to rise by 20% and reach 151,000.
2.8 Figure 1 illustrates the 2010 Mid-Year Population Forecasts produced by the
Cambridgeshire County Council Research Group. These forecasts have been split into age groups. Important information to consider when regarding the chart is as follows:
“These forecasts should be considered provisional. The proposed abolition of the RSS and ongoing uncertainty over the future of some developments included here means that there is considerable uncertainty over future housing targets and likely trajectories. In Cambridge, the Cambridge East development at Cambridge Airport is unlikely to proceed in the manner reflected in this forecast. The Government's decision not to fund A14 Ellington to Fen Ditton improvements may also limit the growth planned on the city's north-west fringe. These forecasts do not represent either County Council or District Council plans or policy when they go beyond current approved plans or policy.”
(Cambridgeshire County Council, 2010f [online])
2 – Cambridge Today
Annual Monitoring Report 2012 -6-
Figure 1: Population forecasts to 2031
Cambridge Local Authority Population Forecasts by Age
0
20,000
40,000
60,000
80,000
100,000
120,000
140,000
160,000
2001 2010 2011 2016 2021 2026 2031
Year 0-4 5-14 15-24 25-44 45-64 65-74 75-84 85+
(Cambridgeshire County Council, 2011f. Mid-2010 Population Estimates [online] Cambridge: Cambridgeshire County Council Research Group) 2.9 The 2011 Census figures with regard to the ethnicity of the Cambridge population
have not yet been released. In 2001, it is known that ethnic minorities constituted around 10.6% of the total population. People of Asian ethnicity were the next largest group in the city next to those of white ethnicity, followed by those of black ethnicity. 19.1% of students were from ethnic minorities (Office for National Statistics, 2001 [online]).
2.10 Cambridge is an internationally renowned historic city attracting over 4.1 million
visitors a year (East of England Tourism, 2008). The city has a renowned landscape setting with historic and cultural associations such as The Backs, Grantchester Meadows and Stourbridge Common. Cambridge has 804 structures on the National Heritage List for England. 61 are Grade I, 47 are Grade II* and 690 are Grade II. Some of the entries, such as those for Colleges or terraced houses include more than one building or property, therefore overall numbers may be considerably higher. The city has 5 Scheduled Monuments and 11 Historic Parks and Gardens. There are 11 Conservation Areas designated in the city totalling 895.37 hectares. This represents 22% of the city’s area. 1,032 buildings are designated as being of Local Interest.
2.11 The city is an acknowledged world leader in higher education, research and
knowledge based industries. It has a prosperous and dynamic economic base in high technology, research and development and related service sector industries. The success of the high technology industry in the area, termed the “Cambridge Phenomenon”, has generated considerable interest and debate in recent years. Biotechnology, health services and other specialist services also play a major part

2 – Cambridge Today
Annual Monitoring Report 2012 -7-
within the local economy. In early 2006, the city had 16,518 jobs within 461 high technology firms. By early 2008, employment levels had remained roughly the same at 16,577 but the numbers of firms had reduced slightly to 410. Biotech employment within this amounted to 5,543 jobs in 2008. High tech employment overall reduced from 18% of all employment in 2006 to 17% in 2008 (Cambridgeshire County Council, 2006 [online]). Unemployment levels are relatively low at 2.1% in April 2010 below the regional and national averages of 3.2% and 3.9% respectively (ONS: Claimant Count cited in Nomis [online]).
2.12 Cambridge and the surrounding rural district of South Cambridgeshire provide over
152,800 employee jobs (ONS: Annual Business Inquiry 2008 cited in Nomis [online]), approximately 88,100 of which are based within the city boundary. Cambridge’s total jobs figure is 100,000, which includes the self-employed, Government-supported trainees, HM Forces, and the employee jobs figure mentioned earlier in the paragraph (ONS: Jobs Density 2008 cited in Nomis [online]). Cambridge’s labour demand is higher than its available workforce, with a jobs-to-working age population ratio of 1.13 (ONS: Jobs Density 2008 cited in Nomis [online]).
2.13 Cambridge is well served in terms of strategic communication. Cambridge has
direct infrastructure links to the A14 and M11 providing easy access to London and the Eastern port of Felixstowe. A short drive along the A14 also leads you to the A1, one of the major road networks linking the north and south of the country. Access to London by rail is quick and easy, taking approximately 50 minutes from Cambridge. Cambridge is also within an hour’s drive of the international airports of Stansted and Luton and less than two hours from Gatwick, East Midlands and Birmingham Airports. Marshall Airport Cambridge UK is a privately owned airport based in Cambridge. The airport provides the flexibility of a local airport and benefits from direct access to London, the East of England and beyond3. The nearest major ports to Cambridge are Felixstowe (which is directly linked to Cambridge via the A14 road network), Great Yarmouth, Lowestoft, Ipswich and Harwich in Essex. Smaller ports such as Wisbech and King’s Lynn are only 40 miles away.
2.14 As a small city, Cambridge does however suffer from a number of serious local
transport problems, particularly in relation to traffic congestion on radial routes and in respect of public transport capacity in the City Centre. The 2008 Place Survey showed that 50% of resident respondents ranked the level of traffic congestion as the issue that needed the most improvement in Cambridge.
2.15 A Transport Strategy for Cambridge and South Cambridgeshire is currently being
prepared by Cambridgeshire County Council in partnership with Cambridge City Council and South Cambridgeshire District Council. The emphasis is to support sustainable development particularly in relation to growth in the Cambridge area.
2.16 Affordability of housing is an important issue for many groups, but particularly for
key workers and those on lower incomes. Salaries within the Cambridge area are somewhat skewed by the presence of so many high technology companies, as salaries tend to be higher in this industry. Around 17% of the city’s jobs were associated with these firms in 2008.
3 http://www.marshallairportcambridge.co.uk/

2 – Cambridge Today
Annual Monitoring Report 2012 -8-
2.17 Figures on average house prices and average wage levels suggest that in 2010 the ratio or multiplier of wages to average house prices in the city was around 9.2. The ratio of lower quartile earnings, which is more appropriate for first time buyers, against the cheapest housing available was around 9.5 in 2010 up from 8.2 in 2009, this highlights the continuing issue of affordability for first time buyers in Cambridge. Average (mean) house prices are now around £321,189, an increase of 12% from 2009. (CLG, 2011 [online]).
2.18 Gross Median Household Income has decreased from 30,000 in 2009 to 29,800 in
2010. The English Indices of Deprivation 2010 – compiled by the Department for Communities and Local Government (see Appendix A), shows a notable change since it was last compiled in 2007. In 2007 Cambridge had a ‘Rank of Average Score’ of 236, where a rank of 1 indicates the most deprived Local Authority Area and 326 the least deprived. The 2010 results show Cambridge with a rank of 193. Results also show that in 2007 Cambridge had 11 Super Output Areas (SOA) within 40% of the most deprived SOAs in England, this has now increased to 20.
2.19 The number of rough sleepers in Cambridge in November 2010 was counted at 64.
The Government has recently revised how rough sleeping is counted across the country, to ensure that we have a more consistent and accurate evaluation of the number of people sleeping rough. The methodology of the Council's street count was amended in line with the revised guidance, for the November 2010 count. The Council is confident that the work undertaken with our voluntary and statutory sector partners means that we have a clear picture of all the people who sleep rough in the city. With this in mind, the Council will now undertake a yearly estimate in line with the appropriate guidance.
2.20 The number of homeless households in priority need has increased slightly from
134 in 2008/09 to 141 in 2009/10 (see Contextual Indicators Appendix A).
4 http://www.cambridge.gov.uk/ccm/content/housing/homeless-people/tackling-rough-sleeping.en

3 – Designing Cambridge
Annual Monitoring Report 2012 -9-
Introduction 3.1 Promoting sustainable development and design quality is a key overarching theme
running throughout Council policy. Policies in this chapter are frequently cited in decisions on planning applications, as they relate to matters of building and site design. The built and natural environments have always been an important consideration in the development of the city. New development is expected to promote high standards of built form and urban and landscape design. The quality of the city’s environment plays an important role in the local economy, attracting tourists, employees and residents, who all contribute to the continued success of Cambridge.
Use of Policies 3.2 Policies of particular relevance in decision-making include Policy 3/4 Responding to
Context, which was used 1116 times. Policy 3/7 Creating Successful Places was used 589 times and Policy 3/14 Extending Buildings was used 577 times. These policies are key to ensuring that new development is of a high quality of design and has a positive impact on its setting. Policy 3/1 Sustainable Development was also used on 790 occasions and requires the submission of a Sustainable Development Checklist with major developments.
3.3 Policy 3/7 plays an important role in place-making and the development of the city
and its urban extensions. Development Management find it especially useful when dealing with areas where the street scene may be affected through development. Considerable work is undertaken on planning applications for the major growth sites and much of the work associated with these sites relates to the processing of outline and reserved matters planning applications, negotiating planning obligations, facilitating pre-application discussion, and preparing design codes. Further information about the major growth sites can be found in Chapter 9.
3.4 Some policies were used on only a few occasions – Policy 3/2 Setting of the City (6
times), 3/3 Safeguarding Environmental Character (7 times), 3/9 Watercourses and other Bodies of Water (7) and 3/13 Tall Buildings and the Skyline (10). Whilst usage of these policies is low, they all have a part to play, especially in relation to large development sites, sites on the edge of the city (of which Policy 3/2 is very useful) and sites adjacent to the river and other bodies of water. The use of these policies is very dependent upon the type and location of applications that have been submitted during the monitoring year.
Issues to Consider 3.5 In practice, Policy 3/6 Ensuring Co-ordinated Development has proved challenging to
implement if not accompanied by a development brief or vision document. Whilst the Council is not advocating any amendment or deletion of Policy 3/6, it remains difficult to prove if, or how one development may be prejudicial to other developments, especially where the ‘larger site’ is not defined, or in instances where different parties do not get along. The use of the policy has highlighted the need to consider the re-development of a site or sites in a holistic way, and to provide, in some cases, guidance in the form of development briefs to support future development proposals. This policy will be reviewed as part of the Local Plan Review.

3 – Designing Cambridge
Annual Monitoring Report 2012 -10-
3.6 Policy 3/7 Creating Successful Places has been used extensively for pre-application discussion and in processing planning applications for large and small sites. Its detailed criteria are particularly effective when considering the impact of a large-scale new development upon a wider neighbourhood and the need for integration. The quality, sustainability, functionality and light penetration of amenity spaces is however absent from this list of criteria. Given the challenges to accommodate maximum numbers of units on sites, many schemes involve small and heavily shaded amenity areas, more often than not above a car park. These amenity areas do not attract use and often have poor quality planting, due to the limited growing space available. This issue should be addressed in the new Local Plan.
3.7 Last year, concern over the application of policy 3/8 and the issue of seeking on site
provision was raised by Councillors especially in areas where there is a deficiency in open space. Officers sought to clarify the position as reflected in the Open Space and Recreation Strategy 2011, in Paragraphs 1.3 and 6.3, which confirm that on site provision should be sought in most instances. However, in a recent appeal decision regarding open space provision, the planning inspector considered that the current policy framework permitted shortfalls in on-site provision to be made up through commuted payments.
3.8 The interpretation of the wording in Policy 3/9 Watercourses and Other Bodies of
Water remains an issue. The policy refers to waterside and water-related development. The review of the Local Plan will seek to address this matter.
3.9 The use and interpretation of Policy 3/10 Sub-division of Existing Plots has improved
over the past year thanks to an advice note entitled Advice Note on Development Affecting Private Gardens in Cambridge (Cambridge City Council 2011c), which was approved at Planning Committee on 1st June 2011. The Cambridge Local Plan Towards 2031: Issues and Options report includes two options, which address small scale residential development and infill development in rear gardens. The first option (Option 114) acknowledges the importance that small scale residential development and infill development can play in increasing housing supply in Cambridge subject to certain factors. The second (Option 115) outlines the possibility of resisting development in rear gardens.
3.10 The use of Policy 3/13 Tall Buildings and the Skyline has been greatly improved with
regard to negotiations on building heights in planning applications. This is due to the introduction of the Cambridge Skyline Guidance, which was adopted on 13th March 2012. The Cambridge Local Plan Towards 2031: Issues and Options report includes three options (72 – 74), which address the issue of building heights in Cambridge.
3.11 Policy 3/15 Shopfronts and Signage is considered a key policy and is relied on by
Development Management and Urban Design for adverts and signage. It is thought (by Development Management Officers) that the policy would benefit from extending the scope by including other forms of signage such as billboards. The Cambridge Local Plan Towards 2031: Issues and Options report includes Option 71, which addresses works to shopfronts, signage and shop security measures.

3 – Designing Cambridge
Annual Monitoring Report 2012 -11-
Target Based Policies 3.12 No policies have been identified for target based monitoring at present. However,
the supporting text to Policy 3/1 Sustainable Development makes reference to the Cambridge Sustainable Development Guidelines which includes the need to ensure that residential development is proposed at densities of at least 30 Dwellings Per Hectare (DPH).
3.13 283 completed sites of nine or above dwellings, were monitored in the 2011/12-year.
The average density of these sites was 88.25 DPH, 91.5% of these sites had a density of 50 DPH or more and 96.4% of permissions had a density of over 30 DPH. This indicates that Cambridge continues to make the best use of land for development. (Cambridgeshire County Council, 2012d & 2012e [online]).
Building for Life
3.14 Local Indicator H6 covers housing quality, measured against Building for Life criteria
(BfL). BfL assessments were introduced to the AMR last year and score the design quality of planned or completed housing developments against 20 criteria. Good quality housing design can improve social well-being and quality of life by reducing crime, improving public health, easing transport problems and increasing property values5.
3.15 Government support was offered in the form of training for one officer in each Local
Authority to enable them to assess developments. Subsequently, this training was rolled out internally to Planning Officers. The Council has developed processes and procedures to ensure BfL is used at both application determination stage and at the stage of substantial completion of development.
3.16 The results of the BfL assessments carried out on developments of 10+ units
completed in the 2011/12 monitoring year are as follows (to see a list of the assessed sites please refer to Appendix A):
• Very good (16 or more) –2 developments • Good (14 - 15.5) – 3 developments • Average (10 - 13.5) – 0 developments • Poor (9.5 or less) – 0 developments
3.17 The results above show all 5 of the completed schemes assessed achieved a rating
of ‘good’ or above and scored 14 or more positive answers out of the 20 BfL criteria. In the same vein as last year, the two developments which achieved a ‘good’ rating performed well under the categories relating to Environment and Community, Character, Streets and Parking, but all underachieved in the last category relating to Design and Construction, in particular against questions 19 and 20 which relate to advances in construction technology and the out-performance of statutory minima.
5 http://www.buildingforlife.org/about

3 – Designing Cambridge
Annual Monitoring Report 2012 -12-
Conclusion and Actions 3.18 The chapter Designing Cambridge remains an effective and sound section of the
Local Plan for assessing new development across the city. The policies are used very frequently, as they were in previous monitoring years. However some of the policies (for example Policy 3/9 and 3/15) will need to be reviewed as the Cambridge Local Plan - Towards 2031 progresses and have already been raised as part of the Issues and Options report (June 2012).

4 - Conserving Cambridge
Annual Monitoring Report 2012 -13-
Introduction 4.1 A major part in the success and attraction of Cambridge is its high quality natural
and built environment. Cambridge is a compact city with a thriving historic centre and a framework of attractive and historic green spaces, trees and other landscape features.
Use of Policies 4.2 There are 13 policies in this chapter of the Local Plan. Through monitoring the use
of these policies, it was established that the most frequently used policies were: Policy 4/4 Trees which was used 153 times; Policy 4/10 Listed Buildings was used on 168 occasions; Policy 4/11 Conservation Areas 550 times; and Policy 4/13 Pollution and Amenity was used on 234 occasions.
4.3 Policy 4/8 Local Biodiversity Action Plans was only used twice. The use of the
policies in this chapter is highly dependent upon the nature and location of applications submitted within the monitoring year. As such, these policies remain a useful part of the planning policy framework of the city.
Issues to Consider 4.4 Concerns still remain as to whether Policy 4/4 Trees is being used consistently by
consultees. Development Management believe more clarity should be given to advise consultees how to refer to policies such as these. This is something that will be followed up over the course of the year.
4.5 Issues remain concerning Policy 4/12 Buildings of Local Interest. The principal
issue in relation to Policy 4/12 is that it only applies when works are proposed which require planning permission. Buildings of Local Interest outside Conservation Areas have no formal protection from demolition and concerns have been expressed regarding the application of this policy. This is an issue which has been addressed by Option 69 in the Issues and Options report.
4.6 In 2011, the Central Conservation Area was extended in two areas and the West
Cambridge Conservation Area boundary was also revised. In 2012/13 there are a number of Conservation Areas under review:
• Central Conservation Area: Castle and Victoria Road • Brooklands Avenue Conservation Area • Southacre Conservation Area • Newnham Croft Conservation Area
4.7 Conservation Area Appraisals contain guidance to protect the best features of an
area. The special character of Conservation Areas means that the development is controlled more strictly than in other areas.
4.8 A number of Suburbs and Approaches Studies were approved in March 2012
• Hills Road • Long Road • Trumpington Road
4 - Conserving Cambridge
Annual Monitoring Report 2012 -14-
Suburbs and Approaches Studies have no statutory status, but provide assessments of local distinctiveness, which can be used as a basis when considering planning proposals
Target Based Policies 4.9 No policies have been identified for target based monitoring at present. However
the Cambridge Today chapter gives a useful summary of the number of Listed Buildings, Scheduled Monuments and Historic Parks and Gardens
E2 Change in areas of biodiversity importance Cambridge has 2 sites designated as Sites of Special Scientific Interest
(SSSI): Cherry Hinton Pit and Traveller’s Rest Pit, totalling 15.03 hectares, In 2009/10 this was recorded as 14.97 hectares. In 2010/11, the boundary of the Traveller’s Rest Pit SSSI was changed after re-survey, which led to a small increase in its area and the addition of one unit. The Traveller’s Rest Pit site is a SSSI designated for geological reasons. It was re-surveyed due to forthcoming development in the north-western area of Cambridge within which it is located. 36.1% of SSSI land area in the city remains in favourable condition; this figure has remained stable from the previous year. 57.4% of SSSI land is classed as Unfavourable Recovering and 6.5% as Unfavourable No Change. Last year (10/11) these figures were the same. Cambridge has 12 Local Nature Reserves (LNR) totalling 77.1 hectares. In 2011/12 Stourbridge Common and Sheeps Green and Coe Fen were designated as LNRs, increasing the LNR area by 36.2ha.
LNR Name Total area (ha)
Area in authority (ha)
Barnwell East 3.26 3.26 Barnwell West 4.02 4.02 Bramblefields 2.06 2.06 Byrons Pool 4.36 2.82 Coldhams Common 10.37 10.37 East Pit 8.11 8.11 Limekiln Close 2.87 2.87 Logans Meadow 2.13 2.13 Paradise 2.17 2.17 Sheeps Green and Coe Fen 16.85 16.85 Stourbridge Common 19.38 19.38 West Pit 3.03 3.03
There is no change in the number of County Wildlife Sites and City Wildlife Sites (CiWS) which remain as 15 and 51 respectively. No new sites have been selected or deleted in the period 2011/12. The boundary of one CiWS site has been amended in the 2011/12 year and therefore 0.41 hectares have been lost from this site. In total Cambridge has 92.54 hectares of County wildlife sites and 168.61 hectares of City Wildlife Sites

4 - Conserving Cambridge
Annual Monitoring Report 2012 -15-
National Indicator 197: Improved Local Biodiversity, looks at the proportion of local sites where positive conservation management has been or is being implemented and shows that 44 out of 66 sites (66.7%) have shown positive conservation management. This demonstrates a 4.6% increase on last year’s figures and illustrates the Council’s positive approach towards conservation management. One City Wildlife Site, Long Road Plantation has been significantly affected by development in Cambridge in the year 2011/12. Some of the plantation has been removed as part of the on-going Trumpington Meadows and Clay Farm development. The boundary of the site has not yet been amended to reflect this change.
Source: CPERC 2012 4.10 Table E2 shows that the standard of SSSI land has not worsened and that positive
conservation management techniques are being successfully implemented across the Authority.
Conclusion and Actions 4.11 The chapter Conserving Cambridge remains an effective and sound section of the
Local Plan contributing effectively towards the high quality natural and built environment of the city. The policies are used frequently.
4.12 Further work on the Conservation Area Appraisals and Suburbs and approaches
Studies is scheduled for the coming year. 4.13 Some of the policies will need to be reviewed as the Cambridge Local Plan
Towards 2031 progresses and have already been raised in the Issues and Options report.

5 – Living in Cambridge
Annual Monitoring Report 2012 -16-
Introduction 5.1 The high cost of housing in Cambridge is a major issue. As prices rise, it makes it
more and more difficult for first time buyers and those on lower incomes to buy or rent in the city. This also has a knock-on effect as employees have to look further a field for housing and then commute in, which in turn has implications for sustainability issues and congestion on the city’s roads. Despite the economic downturn prices remain high in the city.
5.2 Policies such as Policy 5/5 Meeting Housing Needs in the Local Plan 2006 look to
secure new affordable housing to meet local needs in housing developments. The Local Plan chapter also includes policies about community facilities (Policies 5/11 to 5/14), which are considered key to the development of more sustainable communities.
5.3 This chapter also includes information relating to the five-year land supply, housing
trajectory for Cambridge, dwelling mix and housing completions and commitments. Use of Policies 5.4 Development Management have used 13 policies out of 14 in this chapter, the most
used policies were 5/1 Housing Provision, used 89 times and 5/14 Provision of Community Facilities Through New Development used 59 times. Development Management have indicated that many of the policies in this chapter are also used at the pre-application stage.
Issues to Consider 5.5 Policy 5/1 Housing Provision will need to be updated as part of the Local Plan
Review. The Local Plan 2006 cites the provision of 12,500 dwellings from 1999 – to 2016. The Cambridge Local Plan - Towards 2031 will update this figure to cover the years 2011 – 2031.
5.6 Policy 5/11 Protection of Existing Facilities is used frequently during pre-application
discussion and planning applications with regard to the loss of community facilities. Development Management consider that more detail could be given in terms of issues that may arise with this policy when faced with temporary changes of use. This issue will be considered in developing Option 170 of the Issues and Options report, which addresses the need to protect existing community facilities.
5.7 Last year, Policy 5/11 was been the subject of some discussion in relation to the
loss of public houses in Cambridge. Uses predominantly within the D1 Use Class are the focus of this policy, yet public houses (categorised as A4 Use Class) are not included within the community facilities definition in the Cambridge Local Plan 2006. The National Planning Policy Framework (paragraph 70), however, addresses community facilities, including public houses, and states that planning policies and decisions should plan positively for the provision and use of community facilities (including public houses) to enhance the sustainability of communities and residential environments and guard against the unnecessary loss of valued facilities and services.

5 – Living in Cambridge
Annual Monitoring Report 2012 -17-
5.8 Research in early 2012 indicated over 20 public houses had closed in recent years. In response to local concerns regarding the number of public houses lost to alternative uses, the Council commissioned GVA Hotels & Leisure to complete a thorough study of Cambridge’s public houses and produced Interim Planning Policy Guidance (IPPG) prior to the adoption of the new Local Plan in 2014.
5.9 The IPPG was adopted as a material consideration in the determination of
planning applications by Cambridge City Council at Environment Scrutiny Committee on 9 October 2012 (See Appendix I for a Use Classes Order summary). The IPPG will be reported on in more detail in the following Annual Monitoring Period (2012-13).
5.10 The introduction of the Community Right to Bid and its associated list of
community assets may also help to define the role of community facilities and thus strengthen the policy. The Council has a set procedure for nominating sites for inclusion on the register of assets of community value. This can be accessed at: http://www.cambridge.gov.uk/ccm/content/community-and-living/local-communities/community-right-to-bid-scheme.en
5.11 Housing Supply
H1 Plan period and housing targets • Revised RSS target from 2011 to 2031 – 14,000 dwellings.
• Local Plan 2006 Target 1999-2016 – 12,500
See Appendix D for an explanation of the approach in this year’s trajectory.
H2 (a) Net additional dwellings in previous years See Appendix D H2 (b) Net additional dwellings – 2011-2012 331 dwellings H2(c) Net additional dwellings – in future years See Appendix D H2 (d) Managed delivery target See Appendix D H3 New and converted dwellings – on previously developed land
(Gross) 2011-2012 93.8% H4 Net additional pitches (Gypsy and Traveller) 2011-2012 0 H5 Gross affordable housing completions 2011-2012 67 H6 Housing quality – Building for Life Assessments 2011-2012 2 – Very Good
3 – Good 0 – Poor 0 – Very Poor
5 – Living in Cambridge
Annual Monitoring Report 2012 -18-
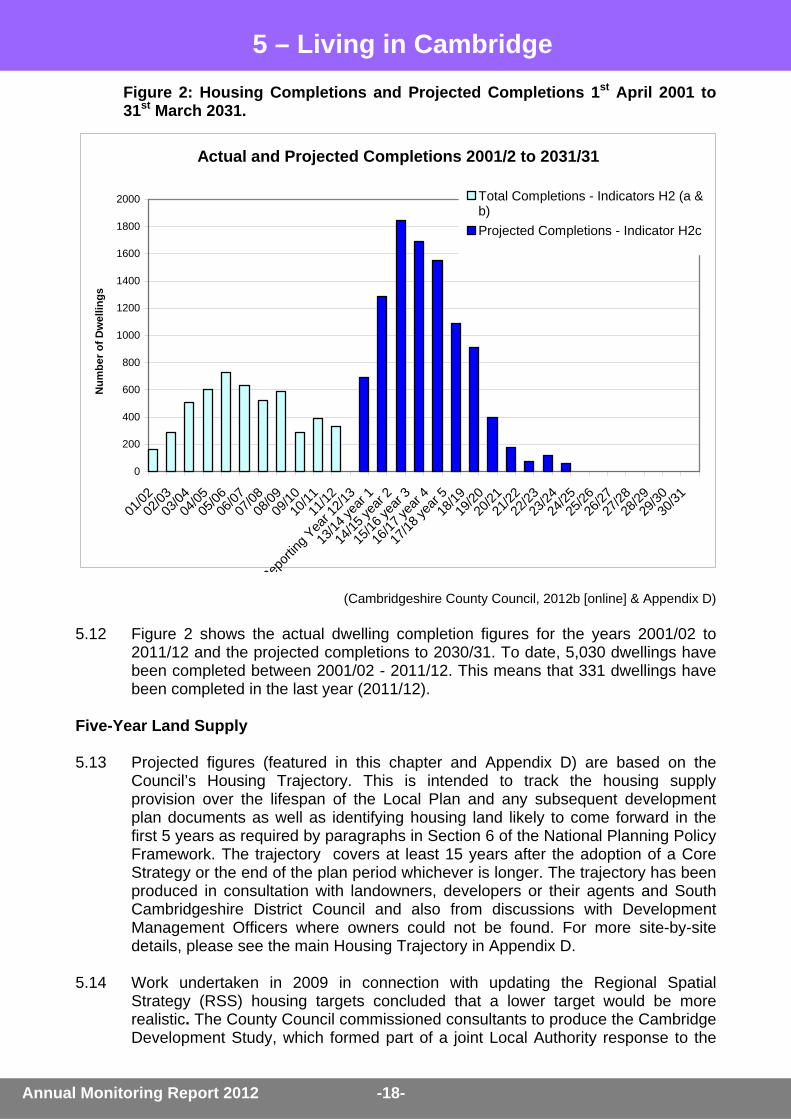
Figure 2: Housing Completions and Projected Completions 1st April 2001 to 31st March 2031.
Actual and Projected Completions 2001/2 to 2031/31
0
200
400
600
800
1000
1200
1400
1600
1800
2000
01/02
02/03
03/04
04/05
05/06
06/07
07/08
08/09
09/10
10/11 11
/12
Report
ing Y
ear 1
2/13
13/14
year
1
14/15
year
2
15/16
year
3
16/17
year
4
17/18
year
518
/1919
/2020
/21 21
/22 22
/2323
/2424
/2525
/2626
/2727
/2828
/2929
/3030
/31
Num
ber o
f Dw
ellin
gs
Total Completions - Indicators H2 (a &b)Projected Completions - Indicator H2c
(Cambridgeshire County Council, 2012b [online] & Appendix D)
5.12 Figure 2 shows the actual dwelling completion figures for the years 2001/02 to
2011/12 and the projected completions to 2030/31. To date, 5,030 dwellings have been completed between 2001/02 - 2011/12. This means that 331 dwellings have been completed in the last year (2011/12).
Five-Year Land Supply 5.13 Projected figures (featured in this chapter and Appendix D) are based on the
Council’s Housing Trajectory. This is intended to track the housing supply provision over the lifespan of the Local Plan and any subsequent development plan documents as well as identifying housing land likely to come forward in the first 5 years as required by paragraphs in Section 6 of the National Planning Policy Framework. The trajectory covers at least 15 years after the adoption of a Core Strategy or the end of the plan period whichever is longer. The trajectory has been produced in consultation with landowners, developers or their agents and South Cambridgeshire District Council and also from discussions with Development Management Officers where owners could not be found. For more site-by-site details, please see the main Housing Trajectory in Appendix D.
5.14 Work undertaken in 2009 in connection with updating the Regional Spatial
Strategy (RSS) housing targets concluded that a lower target would be more realistic. The County Council commissioned consultants to produce the Cambridge Development Study, which formed part of a joint Local Authority response to the

5 – Living in Cambridge
Annual Monitoring Report 2012 -19-
East of England Regional Assembly’s (EERA) consultation on the Review of the RSS in 2009. Cambridgeshire County Council and its Districts formed a member group CReSSP (Cambridgeshire Regional Spatial Strategy Panel) to agree a joint response to the EERA consultation. This response was agreed in a report to the City Council’s Development Plan Steering Group on 17th November 2009. This proposed a figure of 14,000 dwellings to be built in Cambridge (700 dwellings per year) and 21,000 in South Cambridgeshire (1175 dwellings per year) between 2011 and 2031. This level of provision is one which is much more realistic than the adopted RSS target of 19,000 to 2021. It is also supported by the findings of the 2009 Cambridgeshire Development Study.
5.15 This approach was agreed by the Cambridgeshire Local Authorities in a joint
statement, which was reported to Councillors in October 2010. Appendix E sets out the background to this. The adopted RSS target is technically still a material consideration until it is abolished through the Localism Act 2011. This will be undertaken on a region-by-region basis. Local Authorities will then be responsible for establishing the right level of local housing in their areas. The Local Plan Review will set out the appropriate level of future provision in Cambridge to 2031. For the purposes of the AMR, this figure (14,000) has been adopted in this year’s Housing Trajectory as being a more realistic estimate and target of the likely level of future housing delivery. This is consistent with the approach taken in the 2010 and 2011 AMR.
5.16 If 14,000 dwellings are to be provided between April 2011 and the end of March
2031, the annualised projected requirement would be 700 dwellings per annum. Taking into account past and predicted completions of 1,022 dwellings in 2011/12-2012/13, this leaves 12,978 to be built over 18 years, or 721 dwellings per annum. This means that over the next five years (2013/14 to 2017/18), 3,605 will be required. Projected completions over the next 5 years are 7,450 so on this basis the Council currently has a generous five-year supply of 207%. The National Planning Policy Framework (Paragraph 47) would require Local Planning Authorities to:
“identify and update annually a supply of specific deliverable11 sites sufficient to provide five years worth of housing against their housing requirements with an additional buffer of 5% (moved forward from later in the plan period) to ensure choice and competition in the market for land. Where there has been a record of persistent under delivery of housing, local planning authorities should increase the buffer to 20% (moved forward from later in the plan period) to provide a realistic prospect of achieving the planned supply and to ensure choice and competition in the market for land;”
Given this, the Council currently has an excess of the required supply target, this equates to 10.33 years supply when measured against the five-year supply target of 721 dwellings per year. This is illustrated in Figure 3.

5 – Living in Cambridge
Annual Monitoring Report 2012 -20-
Figure 3: Five Year Land Supply Summary Table
2013/14 2014/15 2015/16 2016/17 2017/18Housing Trajectory Total – predicted completions 1,285 1,842 1,687 1,548 1,088Revised RSS Target Year on Year from April 2011 to March 2031 taking into account past completions (14,000-1,022 divided by 18 years = 721pa) Draft East Of England Plan 2010 721 721 721 721 721Under/Over Supply in relation to RRS Target 564 1,121 966 827 367Total Under/Over Supply in relation to RRS Target (2013/14-2017/18) 3,845 (207%)
5.17 It is difficult to project forward completions in such times of economic uncertainty. To an extent, development predictions in the longer term are based on a return to normal market conditions, as there is no way of knowing how long a recession will last. The housing trajectory will be reviewed next year, again in consultation with developers to ascertain how things have changed. The Strategic Housing Land Availability Assessment (SHLAA) will serve to update the 5-year land supply position and housing trajectory.
Housing Trajectory
5.18 The economic downturn will inevitably have an effect on housing delivery in the next few years. Information from developers suggests that, generally speaking, they expect developments to start one or two years later than planned. This is especially so for developments thought likely to start within the next year or two. In addition, larger developments are likely to be spread over a longer time period. It should be noted the effects of the recession relate to the timing of development rather than its extent, or location.
5.19 Developers’ reasons for other possible delays in housing developments also include: market conditions, site preparation costs, infrastructure costs, and planning obligations. All these cost factors have the potential to affect delivery of housing on this site.
5.20 In last year’s AMR, it was projected that 413 dwellings would be completed in
2011/12 and actual completions were 331. 5.21 Factors that will affect the capacity and timing of specific sites include:
• Cambridge East – under the Cambridge East AAP this site was to deliver significant levels of housing in the city and South Cambridgeshire. Marshall announced in April 2010 that they have been unable to find an alternative site and that they do not envisage relocating by 2031. No allowance is therefore made in the trajectory for the main airport site.
5.22 The capacity and availability of some Local Plan allocated sites has also been
raised by landowners, the following allocations will need to be reviewed as part of

5 – Living in Cambridge
Annual Monitoring Report 2012 -21-
the Local Plan Review and through the SHLAA as they have been highlighted as unlikely to provide further residential development in the future:
• The Territorial Army Centre on Cherry Hinton Road (site 5.08), • The Nuffield Hospital (site 5.10), • Caravan Park – Fen Road (site 5.11), • Milton Infant and Junior School (site 5.13),
Figure 4: Cumulative completions (1) Projected, (2) Required to meet the current implied RSS target and (3) showing the difference between the two
Cumulative Required and Projected Completions With Under/Over Supply 2011/12 to 2030/31
-6000
-4000
-2000
0
2000
4000
6000
8000
10000
12000
14000
16000
11/12
Reporti
ng Year 1
2/13
13/14
year
1
14/15
year
2
15/16
year
3
16/17
year
4
17/18
year
518
/1919
/2020
/21 21
/22 22
/2323
/2424
/2525
/2626
/2727
/2828
/2929
/3030
/31
Num
ber o
f Dw
ellin
gs
1) Cumulative completions actual and projected
2) Cumulative required completions
3) Cumulative under/oversupply
(Cambridgeshire County Council, 2012b [online] & Appendix D)
5.23 Figure 4 above shows that there is an adequate housing supply in relation to the
implied RSS target for the period to 2025/26. There is a period of acceleration between 2013/14 and 2016/17, as the urban extensions are developed.
5.24 The Housing Trajectory only identifies potential new developments over 10
dwellings, Local Plan Allocated Sites and urban extensions and therefore it is expected that smaller developments will help to meet future housing completions. The emergence of new planning applications over future years and work undertaken as part of the Local Plan review and annual review of the SHLAA to identify new housing allocation sites will enable the Council to cover future supply to 2031.
5.25 A public consultation on the SHLAA took place between 30th September to 11th
November 2011, which identified potential sites, rejected sites and a call for new sites. By the end of the consultation, a total of 507 separate representations had been made and 35 new sites suggested. 13 of these sites spanned the boundary of Cambridge and South Cambridgeshire. Further work is currently underway
5 – Living in Cambridge
Annual Monitoring Report 2012 -22-
through the Local Plan Review to identify the realistic potential for new residential development in Cambridge to 2031. This will then feed into the next version of the SHLAA in 2013.
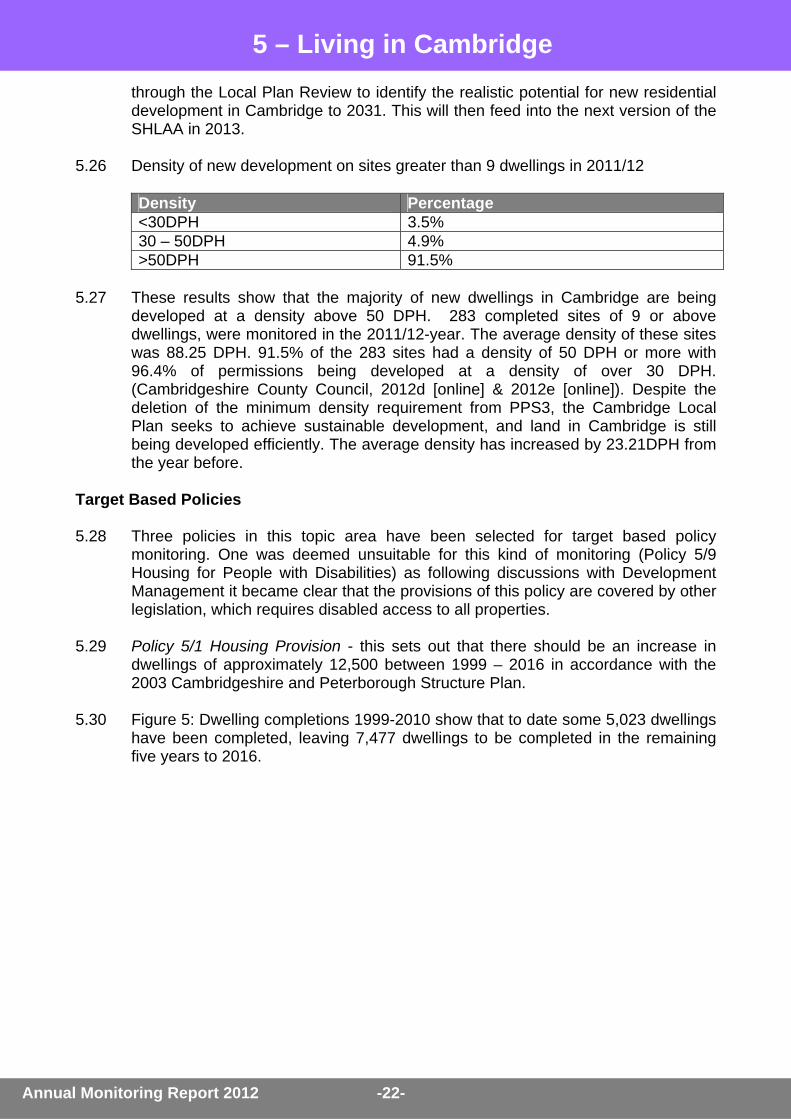
5.26 Density of new development on sites greater than 9 dwellings in 2011/12
Density Percentage <30DPH 3.5% 30 – 50DPH 4.9% >50DPH 91.5%
5.27 These results show that the majority of new dwellings in Cambridge are being
developed at a density above 50 DPH. 283 completed sites of 9 or above dwellings, were monitored in the 2011/12-year. The average density of these sites was 88.25 DPH. 91.5% of the 283 sites had a density of 50 DPH or more with 96.4% of permissions being developed at a density of over 30 DPH. (Cambridgeshire County Council, 2012d [online] & 2012e [online]). Despite the deletion of the minimum density requirement from PPS3, the Cambridge Local Plan seeks to achieve sustainable development, and land in Cambridge is still being developed efficiently. The average density has increased by 23.21DPH from the year before.
Target Based Policies 5.28 Three policies in this topic area have been selected for target based policy
monitoring. One was deemed unsuitable for this kind of monitoring (Policy 5/9 Housing for People with Disabilities) as following discussions with Development Management it became clear that the provisions of this policy are covered by other legislation, which requires disabled access to all properties.
5.29 Policy 5/1 Housing Provision - this sets out that there should be an increase in
dwellings of approximately 12,500 between 1999 – 2016 in accordance with the 2003 Cambridgeshire and Peterborough Structure Plan.
5.30 Figure 5: Dwelling completions 1999-2010 show that to date some 5,023 dwellings
have been completed, leaving 7,477 dwellings to be completed in the remaining five years to 2016.

5 – Living in Cambridge
Annual Monitoring Report 2012 -23-
Figure 5: Dwelling Completions 1999 – 2011
325 331484
7711276
1877
2608
32373758
43464634
53555024
0
1000
2000
3000
4000
5000
6000
1999
/01
2001
/02
2002
/03
2003
/04
2004
/05
2005
/06
2006
/07
2007
/08
2008
/09
2009
/10
2010
/11
2011
/12
Dw
ellin
g C
ompl
etio
ns
Completions Cumulative Completions
(Cambridgeshire County Council, 2012b [online]) 5.31 Policy 5/5 Meeting Housing Needs - 13 planning applications were submitted
relating to Policy 5/5 this year: four of these applications were refused and so were not evaluated. This left nine sites to be assessed under this policy. The sites assessed were: 43 Parkside, 1 Ditton Walk, 92 Milton Road, Land At Cambridge University Press Off Clarendon Road And Fitzwilliam Road, Cambridge Regional College - Former Brunswick Site- Newmarket Road, Station Area, Land to the Rear of 100 - 108 Shelford Road, Seymour Court – Seymour Street and 82 Canterbury Street. The results are as follows:
• 43 Parkside – This was an application for 99 apartments of which 39 are affordable;
• 1 Ditton Walk – Was an application for the erection of 12 dwellings with a site area of 0.27ha, therefore the policy is not applicable;
• 92 Milton Road – Extension to rear of property, not applicable; • Land At Cambridge University Press Off Clarendon Road And Fitzwilliam
Road – redesign of building not applicable; • Cambridge Regional College - Former Brunswick Site- Newmarket Road
– application to vary extant consent, therefore already been assessed; • Station Area - Application for 169 residential units (including 63
affordable units; • Land to the Rear of 100 - 108 Shelford Road – Was an application for the
erection of 13 dwellings with a site area of 0.33ha, therefore the policy is not applicable;
• Seymour Court – Seymour Street - Residential development comprising 34 units (20 affordable flats for the over 50s and 14 private houses);
• 82 Canterbury Street. - Conversion of detached garage into student 'flat' as part of a student hostel (a sui generis use).

5 – Living in Cambridge
Annual Monitoring Report 2012 -24-
In the cases where no monitoring was required or the policy was not applicable, it is most likely that the policy was used by Development Management Officers to discuss or illustrate a related issue.
5.32 These results show that the policy is working in relation to meeting housing needs,
with all relevant applications providing 40% affordable housing. 5.33 Policy 5/10 Dwelling Mix - This policy sets out that on sites of 0.5 ha or more or 15
dwellings or more will be expected to provide a mix of dwelling sizes based on the number of bedrooms. The policy does not set any proportions for mix, however, Annex 2 to the Affordable Housing SPD includes key findings from the SHMA, which sets out a guide for new affordable housing provision. It goes on to note that the guidance “…will also be a material consideration in the determination of planning applications for the market housing element…” (Cambridge City Council, 2008, p5).
5.34 The guidance sets out the following mix: 50% 1 and 2 bedroom dwellings, but with
no more than 10% 1 bed dwellings, 50% 3 bedroom or larger dwellings, but with no less than 20% 3 bed dwellings. Annex 2 of the SPD is caveated by reference to the site size, location and previous decisions.
5.35 There were 13 sites that related to Policy 5/10. Of these 13 sites, three were
refused permission and so were not monitored, this left 10 sites to evaluate. The sites that have been assessed are listed below:
• 43 Parkside - This was an application for 99 apartments. The dwelling mix was 43 one-bedroom, 35 two-bedroom and 21 three-bedroom;
• 274 Coldhams Lane – Erection of a two bedroom house; • Land At Former Monsanto Site, West Of Hauxton Road – This
application is split approximately as follows: 6% one-bedroom flats, 25% two-bedroom flats, 11% two-bedroom houses, 37% three-bedroom houses and 21% four-bedroom houses;
• Land At Cambridge University Press Off Clarendon Road And Fitzwilliam Road - – application to vary extant consent, therefore already been assessed;
• Royal Showground, Parcels 10, 11, 12b And 12c Land South Of Clay Farm – The application consists of 1% studio flats, 8% one-bed flats, 30% two-bed flats, 2% three-bed flats, 11% two-bedroom houses, 30% three-bedroom houses, 17% four-bedroom houses and 1% five-bedroom houses;
• Cambridge Regional College - Former Brunswick Site- Newmarket Road - – redesign of building not applicable;
• Station Area - Application for 169 residential units comprising 6% studio units, 30% one-bed units, 59% two-bed units and 5% three-bed units.;
• 109 Glebe Road – Site too small 0.41 ha; • Land to the Rear of 100 - 108 Shelford Road – Was an application
for the erection of 13 dwellings with a site area of 0.33ha, therefore the policy is not applicable;
• Seymour Court – Seymour Street - Residential development comprising 34 units which will be split as 2 one-bed units and 32 two-bed units. The application was permitted as it was seen as the

5 – Living in Cambridge
Annual Monitoring Report 2012 -25-
existing accommodation at Seymour Court is in poor condition and is not fit for purpose. Although the proposal will not result in an increase in residential accommodation from the original site, it will represent an improvement in the quality of affordable housing for people over 55 years old.
In the cases where no monitoring was required or the policy was not applicable, it is most likely that the policy was used by Development Management Officers to discuss or illustrate a related issue.
5.36 These results show that the policy is working in relation to providing for a range of
sizes (apart from the specialist housing). Substantive increases in family accommodation (3 and 4 bed plus) are not likely to be noticeable until the Council start to get completions in the urban extensions.
5.37 Figure 6 shows the dwelling size mix of completed new dwellings in 201112. The
total figure used is 372 and represents the GROSS number of new dwelling completions in the 2011/12 financial year as opposed to the NET number of housing completions for this year (331), which has been used in Appendix D for the Housing Trajectory.
Figure 6: Dwelling Size Mix 2011/12
26%
48%
15%
6% 5%
1 Bed 2 Bed 3 Bed 4+ Bed Unknown
(Cambridgeshire County Council, 2012c [online])
Conclusions and Actions 5.38 Housing is a key issue in Cambridge, especially in terms of affordability. The
Council is making progress in this area and is using Policy 5/5 Meeting Housing Needs which seeks the provision of at least 40% affordable housing on sites to meet the threshold. However, it takes a number of years for this policy to be fully reflected in the monitoring as affordable housing has to be secured in the legal agreement usually at the outline stage.
5 – Living in Cambridge
Annual Monitoring Report 2012 -26-
5.39 Some of the policies in the chapter are being reviewed when the Cambridge Local
Plan Towards 2031 is progressed. The Local Plan will also need to confirm the appropriate level of future housing provision to 2031.
5.40 The Council currently has a predicted 207% of its five-year supply target (see
paragraph 5.10 to 5.14), this equates to 10.33 years’ supply when measured against the five-year supply target of 721 dwellings per year (accounting for past completions). New housing allocations will need to be identified to cover the level of provision after 2025/26 (see Figure 4) as part of the Local Plan Review.
6 – Enjoying Cambridge
Annual Monitoring Report 2012 -27-
Introduction 6.1 Shopping, leisure and tourist attractions all have an important part to play in serving
those who live, work and study in Cambridge and those visiting the world renowned city.
6.2 Main sub-regional shopping facilities are located in two distinct areas of the City
Centre: the historic centre and Fitzroy/Burleigh Street, which contains The Grafton. The historic centre has undergone considerable redevelopment over recent years with the construction and opening of Christ’s Lane and the Grand Arcade. The recession did have some impact on retailers in Cambridge, with a higher number of unit vacancies than usual in 2009/10. However, the situation this year has improved with most previously empty shops reoccupied and fewer vacancies.
6.3 Cambridge’s retail ranking rose from 22nd place to 16th in the National Retail Index
of top places to shop (GCP Quarterly Economic Review Oct-Dec 2009 [online]). The 2012 CACI Retail Footprint, which compares the consumer expenditure of city retail areas, ranked Cambridge as 32nd nationally, showing consumer expenditure as £640m.
6.4 The city is also a key sub-regional location for indoor and outdoor cultural and
entertainment venues, such as concert venues and theatres. Outdoor events such as the Cambridge Folk Festival, Pop in the Park and Summer in the City events are hosted on the open spaces throughout the city.
6.5 Tourism plays a key role in the city’s economy. However, the Council has a policy of
managing rather than promoting tourism. Cambridge has a lot to offer visitors, but as well as bringing economic benefits, they contribute to existing pressures, such as increasing the level of traffic congestion.
Use of Policies 6.6 Policy 6/10 Food and Drink Outlets, was the most used policy (20 times). This
policy ensures that new developments for food and drink uses do not cause unacceptable environmental problems or nuisance. In many cases this policy was used where there was a change of use application to an A3 (restaurant and café) or an A5 (hot food take-away) use. Policy 6/2 New Leisure Facilities was used 12 times and Policy 6/7 Shopping Development and Change of Use in District and Local Centres was used 9 times.
Issues to Consider 6.7 Retail diversity has been an issue, particularly in the Mill Road District Centres,
which are known for their independent traders. An amendment was proposed to the Localism Bill, known as the ‘Cambridge Amendment’. This asked for a requirement to assess the vitality and diversity of shopping areas and potentially include policies within local planning documents setting out the desired retail mix for retail centres in order to promote sustainability and diversity. This amendment was not taken through into the final Localism Act. The same comments were made in relation to the consultation on the National Planning Policy Framework but were not taken through into the final document. Cambridge MP Julian Huppert is attempting to forward the issue through The Local Services (Planning) Bill.

6 – Enjoying Cambridge
Annual Monitoring Report 2012 -28-
6.8 The shopping survey of the City Centre, District and Local Centres has been updated. This has made it easier to apply Policy 6/7 Shopping Development and Change of Use in District and Local Centres. The District and Local Centre boundaries will be reviewed as part of the Local Plan review. This will include consideration of whether centres are in the correct position within the shopping hierarchy and whether there are any new centres which may need to be added to the list. Views from Development Management Officers are:
• Some Local Centres need to be reviewed to see if they should still be designated as a Local Centre, as they may not be functioning as such e.g. Victoria Road, Cromwell Road, Newnham Road, Akeman Street, Green End Road;
• The four corners of the Hills Road/Cherry Hinton Road Junction should all be included as a Local Centre catchment, as should the area around the new Station Area Development.
6.9 The City Centre boundary will also be reviewed as part of the Local Plan review.
This will include identification of the primary shopping area and primary and secondary frontages. Evidence from the shopping survey and the review of the Retail Study will be used. The Cambridge Sub Region Retail Study (2008) is currently being updated by consultants.
Other Indicators
BD4 Amount of completed floorspace (m²) 2011/12 in Cambridge A1 A2 B1 (a) D2
Gains 907 776 146 0Losses -922 -578 -627 -95
Town Centre
Net -15 198 -481 -95Gains 1,172 1,036 6,193 470Losses -1,152 -578 -8,126 -119
Local Authority Area
Net 20 458 -1,935 351 6.10 A1 figures are for net tradable floorspace (sales space). Floorspace for the rest of
the use classes is gross. The table shows losses of floorspace in A1 and A2 uses, however these are mostly changes of use to other A classes such as food and drink establishments (particularly A3 and A5). These uses are becoming increasingly popular in the City Centre and other centres, and they help to add to vitality and viability. However, there also needs to be a balance with shops and facilities which are useful to local residents, particularly in the District and Local Centres. See Appendix I for a Use Classes Order summary.
6.11 The Council undertook a Hotel Study dated April 2012. The study identifies the
scale and nature of new hotel development required to meet the city’s future business and leisure tourism needs through to 2031 and forms part of the evidence base which will inform the creation of the new Local Plan for Cambridge.
6.12 A range of options have been included in Chapter 10 of the Issues and Options
report addressing hotel and retail uses within the city.

6 – Enjoying Cambridge
Annual Monitoring Report 2012 -29-
Conclusion and Actions 6.13 Work has been completed on updating the shopping survey and collecting data on
the condition of the District and Local Centres. This information will be used as an evidence base in developing policies in the Cambridge Local Plan Review. In particular this survey work will highlight the proportion of different uses within the centres and will identify if A1 retail is still the predominant use and whether there are any issues with the level of food and drink uses (A3 and A5).
6.14 No other particular issues or problems have been identified, however, consideration
should be given to monitoring policies at a more detailed level to better understand policy usage and to feed into the Local Plan Review.

7 – Working & Studying in Cambridge
Annual Monitoring Report 2012 -30-
Introduction 7.1 The Working & Studying chapter of the Local Plan relates to the key areas of the
city’s economy. The policies in this chapter allow the city to develop and be shaped in a way that will provide a sustainable and future-proofed economy.
7.2 The city is home to the University of Cambridge, Anglia Ruskin University and hosts
a branch of the Open University. Around 30,311 students study at the two universities in Cambridge (See Appendix A).
7.3 Language schools also make an important contribution to the city’s economy. There
are 22 accredited schools in the Cambridge area employing over 300 staff. Fees and accommodation generate around £50 million per annum and spend in the local area is thought to exceed £78 million per annum (SQW, 2010).
Use of Policies 7.4 All policies within the Working and Studying chapter have seen infrequent usage by
Development Management during the year. The Selective Management of the Economy - Policy 7/2 was used on 13 occasions. Policy 7/3 Protection of Industrial Storage Space was used 12 times.
Issues to Consider 7.5 Discussions with Development Management indicate that many of the policies in
this chapter are key at the pre-application stage. 7.6 The application of Policy 7/2 Selective Management of the Economy requires
further consideration. With the emergence of the National Planning Policy Framework, consideration should be given as to whether the economy should be restricted in this way. The NPPF states that economic related policies should be more flexible. This makes the determination of planning applications problematic as Development Management Officers have had to refuse applications on the basis of this policy, which Councillors feel is unnecessarily restrictive. When taken to appeal however the Planning Inspector dismissed the appeal suggesting that they do not regard there to be any conflict between the policy and the NPPF.
7.7 Policy 7/10 Speculative Student Accommodation refers to purpose built
accommodation, yet most student accommodation is achieved through building conversions. The policy restricts accommodation building to the 2 Universities in Cambridge, but it is difficult to demonstrate that other institutions should be treated differently.
7.8 Policy options for student accommodation and language schools were further
considered and consulted upon in the Council’s Issues and Options Report. These issues are being actively considered as part of work on the review of the Local Plan.
7.9 In January 2012, Cambridge City Council and South Cambridgeshire District
Council commissioned an update to the Councils’ Employment Land Review. The aims of the report were to:
• Reconsider and update the findings from the Employment Land Review 2008, to focus on the period 2011-2031; and

7 – Working & Studying in Cambridge
Annual Monitoring Report 2012 -31-
• Review – in the light of evidence – existing Selective Management of the Economy policies in the Cambridge area.
The Employment Land Review provides an evidence base for developing policies and allocating sites in the review of the Local Plan and is also a material consideration in the determination of planning applications.
7.10 The Development Plan Scrutiny Sub-Committee endorsed the update to the Employment Land Review for use as an evidence base for the review of the Local Plan and as a material consideration in planning decisions in October 2012.
Target Based Policies 7.11 No policies have been identified for target based monitoring at present. The RSS
introduced new targets for employment growth in Cambridgeshire with 75,000 new jobs proposed to 2021 in Cambridgeshire and Peterborough. Within Cambridge and South Cambridgeshire, around 49,390 jobs are forecast, of these 31,780 are anticipated in the city. The joint Employment Land Review reviewed the portfolio of sites in both Districts available to meet this target. This Study will form part of the evidence base into the new development plan, which will replace the 2006 Local Plan. When the RSS is revoked, these targets will no longer be applicable for Cambridge.
Other Indicators
Business Completions Gains Losses
BD1 Land (ha)
Floorspace (sqm)
Land (ha) BD2
% on PDL
B1 (unspecified) 0 0.00 -224 -0.09 0 N/AB1a 6193 0.50 -8,128 -4.56 6,193 100%B1b 11845 2.07 -2666 -2.26 11845 100%B1c 0 0.00 -4,695 -3.02 0 N/AB2 348 0.16 -773 -0.15 348 100%B8 965 0.20 -53 -0.16 965 100%Total 19,351 2.93 -16,539 -10.24 19,351 100%
Employment land lost to residential B1-B8 (ha) -8.85Land lost in Employment/Regeneration areas B1-B8 (ha)
-9.17
Definitions Gains = developments that involve the creation of new business use land/floorspace, on land that was previously in business use. Losses = developments that involve the loss of business floorspace, to allow the land to be used for a non-business use. BD1 = Total Amount of Additional employment floorspace (Sqm) BD2 = Additional Employment Floorspace on PDL (Sqm) Data spans 01/04/2011 to 31/03/2012
(Cambridgeshire County Council – Business completions 2011g[online])

7 – Working & Studying in Cambridge
Annual Monitoring Report 2012 -32-
7.12 There has been a net loss of employment floorspace mostly B use classes. Losses
in B1a, office use, will be redressed by completions close to the Station in the short-term, however in the medium to long term the evidence points towards a shortage of office floorspace. This is backed up by evidence from the Employment Land Review 2012. There were significant gains of B1b employment space, associated with the development of the a research laboratory and experimental glasshouse at the Botanical Gardens, and the evidence points towards a sufficient supply of such land in Cambridge and South Cambridgeshire. Losses of B1c and B2 , light industrial and industrial are part of a long-term trend of such losses, which have not been prevented by policy despite the evidence of need for such land. The small gains in B8 are a result of changes of use from industrial uses, to storage. The losses of industrial land are primarily down to the great difference in land values between industrial uses and other uses, principally residential. The Employment Land Review 2012, notes that the viability of industrial land is likely to be an ongoing issue for the foreseeable future, alternative provision is necessary, possibly outside the city, the increasing importance of hybrid buildings which enable flexibility of use needs to be recognised. (See Appendix I for a Use Classes Order summary).
Figure 7: Proportion of Residents aged 16-64 Claiming Job Seekers Allowance
0.00.51.01.52.02.53.03.54.04.5
Feb-08
May-08
Aug-08
Nov-08
Feb-09
May-09
Aug-09
Nov-09
Feb-10
May-10
Aug-10
Nov-10
Feb-11
May-11
Aug-11
Nov-11
Feb-12
May-12
Aug-12
JSA
Cla
iman
t Cou
nt R
ate
(%)
Cambridge UK East of England
(Official Labour Market Statistics cited in Nomis [online]) 7.13 Important note - Percentages in Figure 7 show claimants as a proportion of the
resident population of the same age. Previously it showed claimants as a percentage of all claimants
Conclusion and Actions 7.14 The saved policies in the Working & Studying chapter remain sound and effective
for assessing development proposals in Cambridge. The policies were not used frequently in the monitoring year 2010112, this is because many are site-specific, or
7 – Working & Studying in Cambridge
Annual Monitoring Report 2012 -33-
linked to specific types of development. Furthermore, many of the policies in this chapter are key at the pre-application stage. However, there is the need to review policies 7/7 and 7/10.
7.15 Consideration of the need for student accommodation is necessary to ensure that
speculative development does not lead to an oversupply. Any revisions to Policy 7/10 (Speculative Student Accommodation) should look to consider the inclusion of a needs clause to address this. Policy 7/7 should also be reconsidered.

8 – Connecting & Servicing Cambridge
Annual Monitoring Report 2012 -34-
Introduction 8.1 This section encompasses a number of topic areas including: transport;
telecommunications; energy resources; water; sewerage; drainage infrastructure and waste. These issues are key in making development in the city more sustainable.
8.2 A Transport Strategy for Cambridge and South Cambridgeshire is currently being
prepared by Cambridgeshire County Council in partnership with Cambridge City Council and South Cambridgeshire District Council. The emphasis is to support sustainable development particularly in relation to the high level of planned growth in the Cambridge area. It has recently undergone public consultation with a view to producing a draft plan by Summer 2013.
Use of Policies 8.3 Three policies were identified by Development Management as being key policies:
Policy 8/2 Transport Impact (185 uses), Policy 8/6 Cycle Parking (162 uses) and Policy 8/10 Off Street Parking (169 uses). Development Management have identified policies in this chapter as being especially important in pre-application discussions.
8.4 Policy 8/12 Cambridge Airport and Policy 8/13 Cambridge Airport Public Safety
Zone were not used during the monitoring year. The use of these policies are highly dependent upon the nature and location of applications submitted within the monitoring year. This policy remains a useful part of the planning policy framework. Policy 8/13 is mostly used at pre-application stage and therefore is still a valuable policy. The Council has recently received new mapping data from Marshall which addresses the air safeguarding zones which are referred to in the supporting text to Policy 8/13. This data forms new constraints information which will inform pre-application advice and decision-making.
Issues to Consider 8.5 Policy 8/2 Transport Impact is used to deal with highway safety issues, as there is
not an appropriate policy to deal with this. For example, a residential vehicular access route which crosses a cycle and pedestrian footpath is deemed unsafe yet there is no real policy to prevent this. The policy needs to be fit for purpose and updated to help with this issue.
8.6 The Cycle Parking Guide for New Residential Developments was adopted in
February 2010, to help inform Policy 8/8 Land for Public Transport. The cycle parking standards contained within the guidance are currently being updated through the Local Plan review.
8.7 Policy 8/17 Renewable Energy is a policy that may see an increase in usage over
the following years. The regulations surrounding permitted development rights mostly cover the issues that deal with this policy, with the exception of works on listed buildings which are dealt with through conservation related policies.

8 – Connecting & Servicing Cambridge
Annual Monitoring Report 2012 -35-
8.8 The A14 Ellington to Fen Ditton (A14efd) scheme was withdrawn during the 2010 Spending Review. On 8th October 2012, it was announced that £22 million package was approved for improvements to the A14 between junctions 31 and 32, Girton to Milton. This would see reductions in congestion by widening the A14 between the junctions and installing three sign gantries across the width of the carriageway. In addition the Highways Agency and the Department for Transport are working with the Local Authorities on a new large-scale improvement project worth £1.5 billion for the A14, which could include innovative proposals such as tolling part of the route. It is hoped that work will start in 2018.
8.9 Cambridge Science Park Station will be a new railway station in the north of
Cambridge, which will provide links to transport routes for cyclists, pedestrians and bus users. The station will be built in the area of Chesterton sidings, close to the Science Park, St John's Innovation Centre and Cambridge Business Park. The railway station will provide a huge boost for the local economy, and will kick start development and the creation of jobs by improving accessibility and journey times. The County Council are consulting on the plans during November 2012.
8.10 Cambridgeshire County Council has been successful in securing £1.7 million worth
of funding from the Department for Transport's Better Bus Area Fund. The aim of the fund is to increase bus patronage in busy urban areas, to help deliver the Department for Transports aims of creating growth and cutting carbon emissions.
8.11 Cambridgeshire County Council has been awarded £5 million from the
Government's Local Sustainable Transport Fund (LSTF) for transport in Cambridgeshire, which will be used to reduce congestion and help improve journey choices. The bid was developed with a wide range of partners from across the public, private and third sectors, and focuses on improving links to transport interchanges and corridors, improving links to employment areas and targeted marketing and information. The full funding bid can be downloaded below. The funding announcement was made in May 2012, and the funding will be spent between 2012 and 2015.
Target Based Policies 8.12 Policy 8/16 Renewable Energy in New Developments dictates that major
development proposals will be required to provide at least 10% of the development’s total predicted energy requirements on site from renewable energy sources. The policy was used 24 times over the past year in determining planning applications. There is evidence that provision of 10% renewables in line with policy is being secured through conditions to planning permissions. However, there needs to be further provision and recording of information in relation to implementation of schemes and recording of supplementary information to make better use of progress towards wider corporate objectives. At present, it is unclear whether schemes being implemented are generating the levels of renewable energy that were modelled at the planning application stage, and there can be a considerable difference between predicted generation and installed generation.
8.13 Given the issues surrounding the monitoring of Policy 8/16 (which is based on a
Merton Rule-style policy), South Cambridgeshire District Council, working with the other Cambridgeshire authorities, commissioned consultants to carry out research into the impact of the Merton Rule-style policies in four local planning authorities

8 – Connecting & Servicing Cambridge
Annual Monitoring Report 2012 -36-
and makes recommendations in terms of the future role of Merton Rule-style policies in the planning system. An option considering the retention of a Merton Rule approach was included within the carbon reduction policy options of the Local Plan Issues and Options Report. The study recommends that if Merton Rule policies are to continue to have a role in planning policy that they should focus on those technologies with a proven track record of performance and ease of use for building occupants. To this end, the study recommends adopting a ‘solar first’ approach, with either solar thermal or photovoltaic being required for new homes, and photovoltaic being required for all non-residential development. It also recommends that a more flexible approach be adopted for large estates, for example University of Cambridge academic sites, so that a site-wide approach to specifying renewable energy can be considered as opposed to requiring every new building on a site to include 10% renewable energy. The arguments in favour of a ‘solar first’ approach include that they are mature technologies and are relatively simple to monitor and enforce. However, in the past national planning policy has been opposed to the use of policies that are technology specific, and developers tend to be opposed to such an approach. There is no specific wording in the National Planning Policy Framework that would support or object to this approach, and as such it is likely that it would be tested at examination. The recommendations from this study will feed into the Local Plan review and the formulation of renewable energy policies for the draft Local Plan.
Other Indicators
Environmental Quality E3 Renewable energy generation
Installed Capacity (MW)
2011/12 Potential Sites - Installed capacity (MW) 2011/12
Wind 0.0001 0Biomass 0 0Landfill gas 0 0Sewage gas 0 0Photovoltaic 0.8515 0.2748Hydro-power 0 0
(Source: Cambridgeshire County Council Research Group) 8.14 The table above provides monitoring information related to the installation of
renewable energy technologies in Cambridge. This year’s table uses a combination of County Council monitoring information (which looks at non domestic installations) and the Feed in Tariff (which monitors domestic installations). The Feed in Tariff picks up a lot more sites than the County Council have monitored, including ones that did not need planning permission, but it is only available down to the first half of the postcode level, therefore some sites will have been missed out of the monitoring. While this monitoring represents an improvement to last year’s figures and is helpful in tracking renewable installations in Cambridge, it still does not capture all information about the installed renewable energy capacity of the city. It is also not clear whether this captures information regarding the renewable technologies being installed to meet the requirements of Policy 8/16 of the Local Plan, or those installations that do not require planning consent. For example, many householder installations will not require planning consent, and since the introduction of the Feed in Tariff, installation rates have increased. Data from the

8 – Connecting & Servicing Cambridge
Annual Monitoring Report 2012 -37-
Feed in Tariff Statistical Report for 2011/2012 (see Appendix F), shows that between April 2011 and March 2012, there were 3 commercial and 420 domestic installations of photovoltaic panels. The introduction of the Renewable Heat Incentive in April 2012 may have a similar impact on the update of renewable heat generation.
8.15 The table below shows the amount of new residential development within 30 and 15
minutes public transport and/or walking distance of key services.
Accessibility of Services Amount of completed new residential development (within the 2011/12 year) within 30 minutes and 15 minutes public transport time of a GP; a hospital; a primary school; a secondary school; areas of employment; and a major retail centre. Key Service % of population
who are within 30 minutes public transport time of Key services
% of population who are within 15 minutes public transport time of Key services
GP Surgery 100% 100%Hospital with A & E 97% 40.3%Hospital with Outpatients 97% 40.3%Primary School 100% 97.3%Secondary School 100% 69.1%Area of Employment 100% 100%Retail Centre 100% 85%
8.16 Only a very small proportion of the dwellings completed are situated more than 30
minutes by public transport, these results are unsurprising due to the compact nature of the city. This year sees the introduction of the 15 minute measurement, which shows a more varied set of results. As the growth areas in the city are developed, access to such facilities will need to be assessed to determine what facilities may be needed in the future.
Conclusion and Actions 8.17 The future of a percentage renewable energy policy approach is currently being
considered as part of the review of the Local Plan, and any future policy approach will need to be capable of being monitored effectively.

9 – Areas of Major Change
Annual Monitoring Report 2012 -38-
Introduction 9.1 A number of urban extensions have been allocated around Cambridge and sites
such as the Station Area have been earmarked for redevelopment. These areas will be the focus of substantial development over the next 10–20 years. As well as providing residential accommodation, the development of these communities will need to provide a mix of uses appropriate to their scale to ensure the most sustainable development possible.
9.2 The vision for the urban extensions is to provide high quality, sustainable design,
housing people can afford, thriving local neighbourhoods with good local facilities, green open spaces and the priority of travel by non-car modes.
9.3 There are six Areas of Major Change:
• Cambridge East • Southern Fringe • Northern Fringe East • Madingley Road/Huntingdon Road • Huntingdon Road/Histon Road • Station Area
Updates on the progress of these areas can be seen below. 9.4 The majority of these sites straddle the Cambridge/South Cambridgeshire district
boundaries. This chapter deals with the parts of development which are in the Cambridge City Council local authority area. Development in South Cambridgeshire is monitored through their Annual Monitoring Report. The cross-boundary nature of these urban extensions has given rise to a significant level of ongoing joint working between the City Council and South Cambridgeshire District Council. Once built out, the urban extensions will remain split between the two local authority areas.
Cambridge East 9.5 The 2008 Cambridge East Area Action Plan (AAP) identified this site as a new
urban quarter of approximately 10,000 to 12,000 dwellings and associated infrastructure. Last year, the housing trajectory (Appendix D) showed the potential for 406 dwellings on this site. However, most of this site is now unlikely to come forward before 2031. The Issues and Options report includes a number of options (34 – 36) which address Cambridge East, ranging from retaining the current allocation; safeguarding the land for future development; to returning the land to the Cambridge Green Belt. However, some development is possible on the Land at Coldhams Lane – 91 dwellings (see two site entries against site number 9.01 in the Housing Trajectory Appendix D). Appendix G shows indicators that will be monitored once development is underway.

9 – Areas of Major Change
Annual Monitoring Report 2012 -39-
Southern Fringe 9.6 The Southern Fringe is split into the following: Figure 8: Southern Fringe
Site Description Progress Addenbrooke’s Hospital
Clinical/biomedical uses/research and development
Applications received for: • Cambridge Biomedical Campus
06/0796/OUT) • Multi-storey Car Park
(11/0780/REM): Approved. • The Forum (10/1209/EXP) • LMB Building (07/0651/FUL) –
Completed: occupation expected early 2013
• Helipad (10/0094/FUL) Applications received
• Southern Spine Road (12/1304/REM)
Clay Farm Up to 2,300
dwellings Reserved matters applications approved:
• 10/1296/REM for 306 dwellings • 11/0698/REM for 128 dwellings. • 12/0754/REM for 102 dwellings.
Reserved matters applications submitted:
• 12/0867/REM for 274 dwellings • 12/0794 for 229 dwellings
Construction is now underway. Trumpington Meadows (Monsanto)
Approximately 1,200 dwellings (split between Cambridge and South Cambridgeshire District Council)
Two reserved matters applications approved – 11/0073/REM is for 164 dwellings that are wholly within Cambridge City Council boundary 11/0075/REM is for 189 dwellings, 160 of which are within Cambridge City Council boundary and 29 of which are within South Cambridgeshire District Council boundary. Construction is now underway.
Bell School 347 dwellings and 100 Student rooms
06/0795/OUT approved June 2008. Reserved matters access from Babraham Road (12/0890/REM) was refused and is currently at appeal.
Glebe Farm
286 dwellings
09/1140/FUL approved, S106 signed August 2010. Construction is now underway.

9 – Areas of Major Change
Annual Monitoring Report 2012 -40-
Addenbrooke’s
9.7 A Reserved Matters application (11/0780/REM) for a 1,228 space multi-storey car park at the southern corner of the current Addenbrooke's campus off Robinson Way was approved in December 2011. Initially it will be used to replace existing surface car parking to allow the Forum development. Ultimately, the car park will also serve the new Papworth Hospital. Construction is likely to commence early 2013. A new application for the Forum is likely to be submitted in 2013 to include a private hospital. An application for an Energy Centre has been submitted to the County Council.
9.8 There are two bidders in the running for the development of the proposed Papworth
Hospital. Skanska and Bouygues, have developed proposals for a new Papworth Hospital on the Addenbrooke's site under the Private Finance Initiative process. A decision on the successful bidder is likely in Spring 2013.
Residential
9.9 Construction is now underway at Trumpington Meadows, Clay Farm and Glebe Farm, with the first occupations in Trumpington Meadows in August 2012 and Glebe Farm in September 2012.
9.10 Trumpington Meadows Primary School (application number: S/00506/CC) is due to
open in 2013. A planning application has been approved for temporary accommodation at Fawcett School to be used prior to the school opening (planning application C/05001/12/CC).
9.11 Applications are likely to be submitted in early 2013 for a Secondary School and
Community Centre on Clay Farm. Northern Fringe East 9.12 The spatial strategy in the current Local Plan identifies this area for a high density
mixed use development around a new railway station and transport interchange at Chesterton Sidings and adjoining land within the city. The Government has made a commitment to the delivery of the new station and transport interchange, to be called Cambridge Science Park Station. The Issues and Options report includes a strategic priority within Option 33 on Northern Fringe East. This option sets out the requirements for a new high density mixed employment-led development of a high quality and sustainability.
Madingley Road/Huntingdon Road (North West Cambridge) 9.13 The 2009 North West Cambridge Area Action Plan identifies land to be released
from the Cambridge Green Belt to contribute towards meeting the development needs of Cambridge University. It establishes an overall vision and objectives to achieve this. It also sets out policies and proposals to guide the development as a whole.
9.14 The outline application (11/1114/OUT) (and sister application for the area in SCDC
S/1886/11) was received and validated in September 2011. The applications were approved by the Joint Development Control Committee in August 2012, subject to
9 – Areas of Major Change
Annual Monitoring Report 2012 -41-
the completion of a Section 106 agreement which is expected to be completed by the end of December 2012. Discharge of conditions and reserved matters submissions for Phase 1 are expected to be submitted from March 2013.
9.15 The application proposes 3,000 dwellings, 2,000 student bedspaces, 100,000sqm
of employment floorspace, 5,300 sqm gross retail floorspace, 6,500sqm for a residential institution e.g. a care home, Community Centre, Police, Primary Health Care; Primary School, Nurseries, Indoor Sports Provision and Open Space and a 130 room hotel. Appendix H shows indicators that will be monitored once development is underway.
Land Between Huntingdon Road and Histon Road (NIAB) 9.16 Land between Huntingdon Road & Histon Road (NIAB 1) – the outline application
for 1,593 homes was approved by the Joint Development Control Committee (JDCC) in July 2010, subject to the signing of a Section 106 agreement. It is envisaged that the agreement will be signed and the permission issued by the end of 2012. Officers and the site promoters are now discussing the form of the proposed development. The evolving details were shown at the north west Cambridge drop in event on 11 February 2012 and a Design Code is being prepared to guide the design of development. Further events are being planned.
9.17 NIAB Frontage – The reserved matters application was approved by the JDCC in
May 2008 for 187 dwellings. Construction on the frontage site commenced in 2010 and the initial phase of homes is nearing completion, with some of the dwellings now occupied. See Appendix D – Housing Trajectory for completion figures.
Station Area 9.18 The major redevelopment of Cambridge’s station area, reported to be worth £850
million, received outline approval in April 2010. Details of the application (08/0266/OUT) include:
• 331 residential units - inclusive of 40% affordable homes • 1250 student units • 53560m2 of Class B1a (office) floorspace • 5255m2 of Class A1/A3/A4 and/or A5 (retail) floorspace • a 6658m2 polyclinic • 86m2 of D1 (art workshop) floorspace • 1753m2 of D1 and/or D2 floorspace - gym, nursery, student/community
facilities • a 7466m2 hotel • a new transport interchange and station square, including 30 taxi bays and
nine bus stops - two of which are double stops providing 11 bays in total - a new multi storey cycle and car park including accommodation for 2,812 cycle spaces, 50 motorcycle space and 652 car parking spaces
• highway works including improvements to the existing Hills Road/Brooklands Avenue junction and the Hills Road/Station Road junction and other highway improvements, along with an improved pedestrian/cyclist connection with Carter Bridge - and works to create new and improved private and public spaces.

9 – Areas of Major Change
Annual Monitoring Report 2012 -42-
9.19 The outline planning permission for the CB1 development establishes the principle
of development on the site but before works can commence the Council will need to approve the detailed plans for the buildings and spaces. The appearance, landscaping, layout and scale of buildings and spaces are controlled through the reserved matters applications.
9.20 In August 2010 a reserved matters application (10/0810/REM) was submitted. This
application sought to agree the appearance, landscaping, layout and scale of buildings and spaces to provide 511 student units in four blocks, two facing the bus interchange, two close to Hills Road and two shops fronting Hills Road and the bus only link road. In association with the submission, applications were also made to seek non-material amendments to the parameter plans approved under the outline planning permission. These related to the use of the upper floors of 125 Hills Road and the basements and footprints of the buildings. This was approved at Planning Committee in October 2010. Works have commenced on site and the project is due for completion in 2012.
9.21 A reserved matters submission for the erection of an office building at the junction
of Station Road with Tenison Road was submitted in August 2010. Application 10/0810/REM sought to agree the appearance, landscaping, layout and scale of buildings and spaces to provide an office building (9808 square metres), a pocket park and a garden part of which will become part the Station Road Open Space. The office building (The Microsoft Building) is nearing completion.
9.22 A reserved matters application (11/0633/REM) was also submitted for four buildings
accommodating predominately residential accommodation and the conversion of the former Fosters Mill building to 19 flats submitted in May 2011. Blocks L1 to L4 are on a north/south alignment and will be located between Station Road and Hills Road opposite the Warren Close development. The application includes commercial space at ground floor level in Block L1 and Fosters Mill and a community room in Block L4. A mixture of private and affordable housing units is proposed, including 169 flats of which 63 will be affordable homes. The application also includes part of the local park, which is to be laid out for use as an informal open space for public use. This was agreed at Planning Committee on 21st September 2011.
9.23 Nine bus stops - two of which are double stops providing 11 bays in total were
completed this year. Use of Policies 9.24 Use of the policies in this chapter are determined by the progress of development
on the specific growth areas as they are used in deciding applications for the urban extensions. This year Policy 9/8 Land between Huntingdon Road and Histon Road was not used, yet Policy 9/5 Southern Fringe was used 18 times, which is reflected in the progress made in this area.
9.25 As part of the work on Areas of Major Change, the Cambridge East and North West
Cambridge AAPs were developed and adopted, superseding Policies 9/4 East Cambridge and 9/7 Land between Madingley Road and Huntingdon Road. Not all policies however, have been developed into AAPs. In the case of the Southern

9 – Areas of Major Change
Annual Monitoring Report 2012 -43-
Fringe and Station Area, Area Development Frameworks support the policies for these areas. These frameworks are material considerations.
Conclusion and Actions 9.26 A considerable amount of work has been carried out and is continuing in order to
ensure that the areas of major change are as sustainable as possible in providing successful new communities in Cambridge.
9.27 Construction is now underway at Trumpington Meadows, Clay Farm and Glebe
Farm, with the first occupations in Trumpington Meadows in August 2012 and Glebe Farm in September 2012.
9.28 Work is underway in the Station Area and Student Accommodation has nearly been
completed on Blocks M1, 2, 5 and 6 of the CB1 masterplan and nine bus stops - two of which are double stops providing 11 bays in total were completed this year.
9.29 There are two bidders in the running for the development of the proposed Papworth
Hospital. Skanska and Bouygues, have developed proposals for a new Papworth Hospital on the Addenbrooke's site under the Private Finance Initiative process. A decision on the successful bidder is likely in Spring 2013.

10 - Implementation
Annual Monitoring Report 2012 - 44 -
Introduction 10.1 This Local Plan chapter sets out how the proposals and policies of the Local Plan
will be implemented in order to fulfil the objectives of the Plan. It highlights how these proposals and policies will enable development to occur in a way which will benefit residents, businesses, students and tourists, thus supporting the city’s role in the sub-region.
10.2 The Local Plan sets out a vision for the continued growth and development of
Cambridge until 2016, by creating the opportunities and framework for development to take place. Delivery of the vision relies on partnership working and consultation between the Council and a variety of other stakeholders including other local authorities, agencies, landowners, developers and residents.
10.3 This chapter provides an update of the progress on the Community Infrastructure
Levy. Use of Policies 10.4 Policy usage research (see Appendix C for full listing) found that Policy 10/1
Infrastructure Improvements was used 63 times in deciding planning applications. Development Management Officers have, through discussions, noted that it is key throughout the progress of a development proposal from pre-applications to permission.
Target Based Policies 10.5 There are no specific target based policies associated with this topic. Community Infrastructure Levy (CIL) 10.6 The 2008 Planning Act established powers to create a Community Infrastructure
Levy (CIL) in England and Wales. This came into force on 6 April 2010 through the Community Infrastructure Levy Regulations 2010 (now amended by the Community Infrastructure Levy (Amendment) Regulations 2011). Essentially it allows local authorities to levy a charge on new development in their area. The money can be used to fund a wide range of infrastructure that is needed as a result of the development. This includes new or safer road schemes, flood defences, schools, hospitals and other health facilities, park improvements, green spaces, etc.
10.7 It was agreed at Development Plan Scrutiny Sub Committee on 22/03/2011, that
the Council’s CIL approach would be prepared and taken forward in parallel with the Local Plan review, with the intention of adopting a CIL Charging Schedule by April 2014.
10.8 In order to mitigate the impact of new development, the Council collects
contributions towards infrastructure provision from new developments in the form of planning obligations, sometimes referred to as Section 106 Agreements. CIL is intended to supplement (not replace) other funding streams. A number of contributions will still be acquired through S106 Planning Obligations. These include affordable housing requirements (although a Government CIL consultation includes

10 - Implementation
Annual Monitoring Report 2012 - 45 -
the possibility of including affordable housing within the scope of CIL)(both on-site and off-site) and site-specific on-site infrastructure. However, the Government considers that the CIL is a more transparent and simple method of collecting funds for infrastructure to support development than the current system of planning obligations (S106).
10.9 CIL allows local authorities to raise funds from developers, via a charging schedule,
for a wide range of infrastructure. The levy takes the form of a standardised charge (which is set locally) applied per square metre of new development. CIL breaks the direct link between development and infrastructure provision, which gives the Council and beneficiaries of CIL monies more flexibility over what infrastructure funding may be spent on. CIL monies can be spent on any identified infrastructure need (unlike S106 Agreements which require a direct link between the development and any infrastructure project).
10.10 The levy is based on economic viability and is intended to encourage development
by creating a balance between collecting revenue to fund infrastructure and ensuring the rates are not so high that they discourage development. It will be important to demonstrate that any potential charging levels are reasonable and justified in terms of viability. The recent CIL examination at Huntingdonshire District Council and other examinations have highlighted the importance of having viability consultants with extensive knowledge of the financial workings of the development industry.
10.11 Exceptions to the levy include:
• Charities that own part of the land and the development will be used wholly or mainly for charitable purposes;
• Social housing; and, • The option of a levy waiver in exceptional circumstances that would have an
unacceptable impact on the economic viability of a development.
10.12 The Cambridge City & South Cambridgeshire District Council Joint Infrastructure Study 2012 was adopted at Development Plan Scrutiny Sun Committee on 11th September 2012. Peter Brett Associates and Transport Planning International completed the study which sets out when and where infrastructure will need to be provided, the scale of funding needed to achieve this and potential sources of funding. The study was been produced in collaboration with infrastructure and community service providers in order to obtain first hand views on requirements. The output is a study that provides the Council with an evidence base to support its planning policies on infrastructure and developer contributions. This document will form a key part of the evidence base at both Local Plan and Community Infrastructure Levy examinations.
10.13 In order to introduce CIL, the Council needs to have an up to date development
plan in place. As a result it has been agreed to take CIL forward in tandem with the Local Plan Review. This should help to ensure complementarity and effective use of resources. There are three main strands of work that need to be progressed in order to adopt CIL:
• Publication of a charging schedule; • Development of new administrative and accountancy processes; • Governance.
10 - Implementation
Annual Monitoring Report 2012 - 46 -
Conclusion and Actions 10.14 The implementation of the Community Infrastructure Levy is being progressed in-
line with the production of the new Cambridge Local Plan, which is detailed in Chapter 12 – Local Development Framework.
11 – Local Development Scheme
Annual Monitoring Report 2012 - 47 -
Introduction 11.1 This chapter is split into 5 parts and predominantly focuses on the progress of the
Local Plan Review (development of the Cambridge Local Plan - Towards 2031). 11.2 This year’s AMR updates the progress and timescales for production of the Local
Plan – Towards 2031. Government Changes
The National Planning Policy Framework 11.3 The National Planning Policy Framework was published on 27th March 2012. The
document replaces 44 National Planning Policy Statements, Guidance, Government Circulars and Notes to Chief Planning Officers. Since the NPPF was produced, the Council has analysed the level of conformity of the current Local Plan with the NPPF. Analysis has shown that the Local Plan is strongly compliant with the NPPF. This analysis was reported to Environment Scrutiny Committee in June 2012.
Joint working and Duty to Co-operate
11.4 The Council has a long history of joint working with South Cambridgeshire District
Council on a variety of planning matters over many years reflecting the close functional relationship between the tightly drawn city boundary and its rural surroundings. This includes working together on key strategic and joint issues at both officer and Member level through the preparation of Structure Plans, input to Regional Plans, the preparation of existing development plans, joint Area Action Plans for major developments, the preparation of joint evidence base documents on a wide variety of topics, and other planning matters including various transport strategy documents.
11.5 The Localism Act and the National Planning Policy Framework (NPPF) have
introduced a requirement for Councils to work together on planning issues that cross administrative boundaries. This requirement is known as the ‘Duty to Cooperate’ and also involves a number of other public bodies such as Local Enterprise Partnerships (LEPs), Highways Agency, Environment Agency, English Heritage, Natural England and Primary Care Trusts. The duty requires Councils to engage constructively, actively and on an ongoing basis on ‘strategic matters’ regarding sustainable development or use of land that has or would have a significant impact on at least two planning areas. The NPPF says that Councils should work collaboratively with other bodies to ensure that strategic priorities across local boundaries are properly coordinated and clearly reflected in individual Local Plans. It says that Councils should consider producing joint planning policies on strategic matters, but there is no requirement to do so.
11.6 The Councils have decided to prepare separate Local Plans for Cambridge and
South Cambridgeshire, but are fully aware of the need to work effectively together and that they will need to demonstrate how they have cooperated effectively, both with each other and other key public bodies including the County Council, on the preparation of their respective new Local Plans. The Councils’ ongoing approach

11 – Local Development Scheme
Annual Monitoring Report 2012 - 48 -
to joint working is therefore now a specific legal requirement and it will be necessary to provide formal evidence of the cooperation as part of the plan making process.
11.7 Some respondents to both Issues and Options (Summer 2012) consultations
questioned why the Councils were not preparing a single joint strategic plan covering the Cambridge area as a whole and whether anything less than this satisfied the duty to co-operate.
11.8 The Councils believe that cooperation while preparing separate plans allows a
comprehensive approach to the planning of the wider area to be developed and sound arrangements have been put in place in order to ensure this. Given the close functional relationship between Cambridge and South Cambridgeshire, the Councils are working jointly to ensure that cross boundary issues and relevant wider matters are addressed in a consistent and joined up manner. It is not a requirement of the NPPF that a single plan is produced in these circumstances, rather that the Duty to Co-operate is effectively discharged.
11.9 Joint working arrangements have already been established. At a member level,
previous joint working groups have been replaced by two new member groups: the Cambridgeshire and Peterborough Joint Strategic Planning and Transport Member Group which is a County wide group and the Joint Strategic Transport and Spatial Planning Group specifically to address issues affecting Cambridge and South Cambridgeshire. Work is ongoing at an officer level, steered by regular meetings of senior officers: Chief Planning Officers group for county-wide issues and officers from the three Councils for more Cambridge-focused issues.
11.10 Councils have already established and then commissioned the Joint Strategic
Planning Unit to prepare a strategic spatial framework for Cambridgeshire and Peterborough, which will also help demonstrate the coordinated approach to planning for the long term needs of the wider area and the Unit has also assisted with the preparation of the evidence base for this consultation.
11.11 The Councils have been working together throughout the preparation of the
Issues and Options consultations on the Cambridge Local Plan and the South Cambridgeshire Local Plan, and also the parallel consultation on issues for a new Transport Strategy for Cambridge and South Cambridgeshire. The Councils took the same approach to joint issues in the recent Issues and Options consultation. Each of the Issues and Options consultation documents took a common approach to the Green Belt on the edge of Cambridge, the future planning of Cambridge East and Northern Fringe East and sub-regional sporting, cultural and community facilities. Each document also highlighted the corresponding consultation by the other Council.
11.12 The Councils have agreed to continue to work jointly as plan preparation
continues. In terms of timetables, the Councils’ Local Plan programmes have been very similar, although it did not prove possible to align them completely for the Issues and Options (Summer 2012) consultation. The consultations did however overlap in July 2012.

11 – Local Development Scheme
Annual Monitoring Report 2012 - 49 -
Local Development Scheme 11.13 The Council has prepared a Local Development Scheme (LDS), which sets out a
planning work programme over a three-year period detailing the timetable required to produce the Development Plan documents.
11.14 The main documents of the current Development Plan for Cambridge are the
East of England Plan 2008 (note this will be deleted from the development plan hierarchy through the Localism Act), saved policies from the Cambridgeshire & Peterborough Structure Plan 2003, the saved Cambridgeshire & Peterborough Waste Local Plan 2003, the saved Cambridgeshire Aggregates (Minerals) Local Plan 1991, the Cambridge Local Plan 2006, the Cambridge East Area Action Plan (2008) and the North West Cambridge Action Area Plan (October 2009).
11.15 The LDS sets out the timetable for the review of the Cambridge Local Plan 2006.
It lists current planning policy and guidance documents applicable to development in Cambridge, and what new local development documents are to be produced and when. The intention is that it will be clear to the reader what policy documents are in force at any particular time. The LDS also sets out the evidence base that either has been or will be produced to support the development of the Cambridge Local Plan - Towards 2031.
11.16 On completion of the review of the current Local Plan, the development plan for
Cambridge will comprise the following documents:
• The Cambridge Local Plan - Towards 2031 – which will combine the Core Strategy, Site Specific Allocations and Generic Development Control Policies;
• The Cambridgeshire and Peterborough Minerals and Waste Plan (The Core Strategy was adopted in July 2011 and the Sites Specific Plan in February 2012);
• The North West Cambridge Area Action Plan (2009); and • The Cambridge East Area Action Plan (2008).
Local Plan Review 11.17 The development of the Cambridge Local Plan - Towards 2031 (otherwise known
as the Local Plan Review) was agreed at DPSSC in March 2011 and an updated time schedule was agreed at DPSSC in October 2012.
11.18 The preparation of a Local Plan involves a number of stages including public
consultation. This is to ensure that it is robust and comprehensive. Key stages in the process are: Preparation of Evidence Base – preparation and completion of various studies
which will be used to inform issues and options and policy development; Consultation on Issues and Options – Identification of relevant Issues and
Options for the future development and protection of the city. Consultation with relevant stakeholder groups and with the wider public;

11 – Local Development Scheme
Annual Monitoring Report 2012 - 50 -
Consultation on Site Options – This includes consultation on joint sites with South Cambridgeshire District Council for housing and employment development, sites within the city’s urban area for a ranges of uses, residential space standards, car and cycle parking standards, and designation of land for protection of particular uses, e.g. Protected Open Space;
Submission Draft Consultation - Consultation on the draft Plan;
Submission - Submission of the new Local Plan document to the Secretary of
State; Examination - An independent Government Inspector considers the
‘soundness’ of the document in a public examination and produces a report; and;
Adoption - Formally adopted by the Council.
11.19 The main schedule for these stages are as follows:
Figure 19: Local Development Scheme Timetable
Stage Timescales Preparation & Completion of Evidence Base Spring 2011 – June 2012 Issues & Options Consultation 15th June 2012 – 27th July 2012 Sites Options Consultation 7th January – 18th February 2013 Draft Submission Plan Consultation Summer 2013 Submission Winter 2013 Examination Winter 2013/2014 Adoption 2014
11.20 The Issues and Option 1 stage has recently been completed with consultation on
the Issues and Options Report taking place for six weeks between 15th June and 27th July 2012. The Issues and Options Report set out a series of issues and options relating to the future planning and development of the city over the 20 years and asked for people’s views including local residents and other key stakeholders. All documents were available on the Council’s website and at libraries for people to view. A series of exhibitions were also held across the city and over 11,000 comments have been received from 858 respondents.
11.21 The next stage is the Issues and Options 2 consultation which will run from 7th
January to 18th February 2013. This is split into two parts. Part 1 of this second stage of Issues and Options consultation is a joint consultation (with South Cambridgeshire District Council) on options for the development strategy for the wider Cambridge area and for site options for housing or employment development on the edge of Cambridge on land currently in the Green Belt. It also includes options on sub-regional sporting, cultural and community facilities and site options for a community stadium. It builds on the Issues and Options consultations that took place in Summer 2012 and provides background information on the housing and employment needs of the area as a whole, as well as outlining what that means for the future development strategy. In Part 2, the City Council will be consulting on site options for the urban area of Cambridge, including a range of uses for possible site allocations, as well as
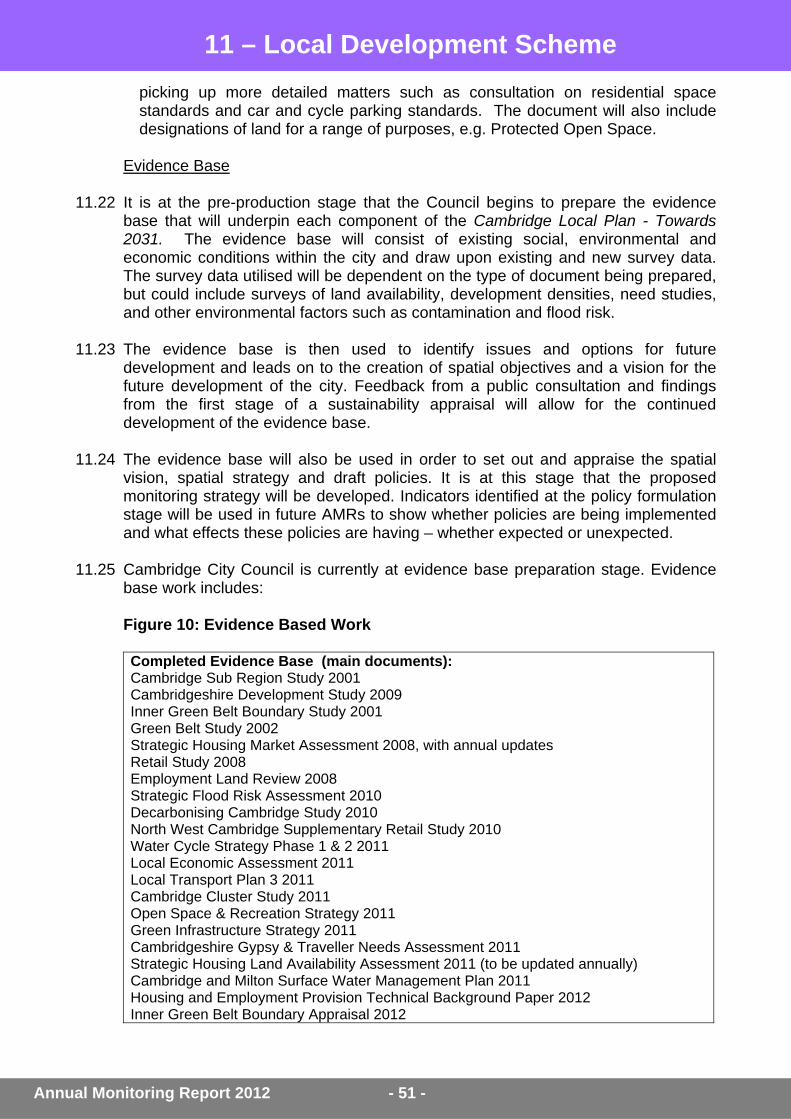
11 – Local Development Scheme
Annual Monitoring Report 2012 - 51 -
picking up more detailed matters such as consultation on residential space standards and car and cycle parking standards. The document will also include designations of land for a range of purposes, e.g. Protected Open Space.
Evidence Base
11.22 It is at the pre-production stage that the Council begins to prepare the evidence
base that will underpin each component of the Cambridge Local Plan - Towards 2031. The evidence base will consist of existing social, environmental and economic conditions within the city and draw upon existing and new survey data. The survey data utilised will be dependent on the type of document being prepared, but could include surveys of land availability, development densities, need studies, and other environmental factors such as contamination and flood risk.
11.23 The evidence base is then used to identify issues and options for future
development and leads on to the creation of spatial objectives and a vision for the future development of the city. Feedback from a public consultation and findings from the first stage of a sustainability appraisal will allow for the continued development of the evidence base.
11.24 The evidence base will also be used in order to set out and appraise the spatial
vision, spatial strategy and draft policies. It is at this stage that the proposed monitoring strategy will be developed. Indicators identified at the policy formulation stage will be used in future AMRs to show whether policies are being implemented and what effects these policies are having – whether expected or unexpected.
11.25 Cambridge City Council is currently at evidence base preparation stage. Evidence
base work includes:
Figure 10: Evidence Based Work
Completed Evidence Base (main documents): Cambridge Sub Region Study 2001 Cambridgeshire Development Study 2009 Inner Green Belt Boundary Study 2001 Green Belt Study 2002 Strategic Housing Market Assessment 2008, with annual updates Retail Study 2008 Employment Land Review 2008 Strategic Flood Risk Assessment 2010 Decarbonising Cambridge Study 2010 North West Cambridge Supplementary Retail Study 2010 Water Cycle Strategy Phase 1 & 2 2011 Local Economic Assessment 2011 Local Transport Plan 3 2011 Cambridge Cluster Study 2011 Open Space & Recreation Strategy 2011 Green Infrastructure Strategy 2011 Cambridgeshire Gypsy & Traveller Needs Assessment 2011 Strategic Housing Land Availability Assessment 2011 (to be updated annually) Cambridge and Milton Surface Water Management Plan 2011 Housing and Employment Provision Technical Background Paper 2012 Inner Green Belt Boundary Appraisal 2012
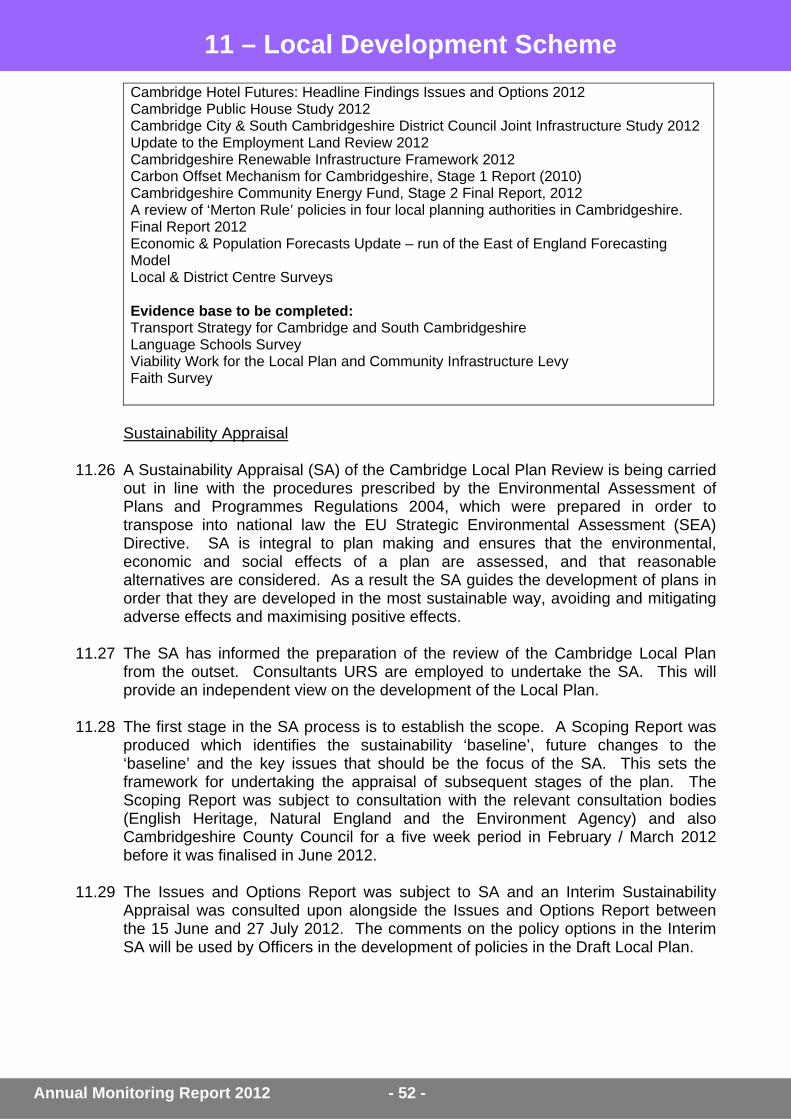
11 – Local Development Scheme
Annual Monitoring Report 2012 - 52 -
Cambridge Hotel Futures: Headline Findings Issues and Options 2012 Cambridge Public House Study 2012 Cambridge City & South Cambridgeshire District Council Joint Infrastructure Study 2012 Update to the Employment Land Review 2012 Cambridgeshire Renewable Infrastructure Framework 2012 Carbon Offset Mechanism for Cambridgeshire, Stage 1 Report (2010) Cambridgeshire Community Energy Fund, Stage 2 Final Report, 2012 A review of ‘Merton Rule’ policies in four local planning authorities in Cambridgeshire. Final Report 2012 Economic & Population Forecasts Update – run of the East of England Forecasting Model Local & District Centre Surveys Evidence base to be completed: Transport Strategy for Cambridge and South Cambridgeshire Language Schools Survey Viability Work for the Local Plan and Community Infrastructure Levy Faith Survey
Sustainability Appraisal
11.26 A Sustainability Appraisal (SA) of the Cambridge Local Plan Review is being carried
out in line with the procedures prescribed by the Environmental Assessment of Plans and Programmes Regulations 2004, which were prepared in order to transpose into national law the EU Strategic Environmental Assessment (SEA) Directive. SA is integral to plan making and ensures that the environmental, economic and social effects of a plan are assessed, and that reasonable alternatives are considered. As a result the SA guides the development of plans in order that they are developed in the most sustainable way, avoiding and mitigating adverse effects and maximising positive effects.
11.27 The SA has informed the preparation of the review of the Cambridge Local Plan
from the outset. Consultants URS are employed to undertake the SA. This will provide an independent view on the development of the Local Plan.
11.28 The first stage in the SA process is to establish the scope. A Scoping Report was
produced which identifies the sustainability ‘baseline’, future changes to the ‘baseline’ and the key issues that should be the focus of the SA. This sets the framework for undertaking the appraisal of subsequent stages of the plan. The Scoping Report was subject to consultation with the relevant consultation bodies (English Heritage, Natural England and the Environment Agency) and also Cambridgeshire County Council for a five week period in February / March 2012 before it was finalised in June 2012.
11.29 The Issues and Options Report was subject to SA and an Interim Sustainability
Appraisal was consulted upon alongside the Issues and Options Report between the 15 June and 27 July 2012. The comments on the policy options in the Interim SA will be used by Officers in the development of policies in the Draft Local Plan.

11 – Local Development Scheme
Annual Monitoring Report 2012 - 53 -
Habitats Regulations Assessment 11.30 The Local Plan will also be subject to a Habitats Regulations Assessment (HRA) in
order to meet the requirements of the Habitats Directive (92/43/EEC), which has been transposed into UK law as the Conservation (Natural Habitats, &c.) Regulations 1994. This Directive provides the legal protection for habitats and species of European importance, and established a European-wide network of sites of international importance for nature conservation, referred to as Natura 2000 sites. The purpose of the Habitats Regulations Assessment is to assess the potential effects of the proposed Local Plan in combination with other plans and projects on one or more Natura 2000 sites.
11.31 Natural England is the statutory nature conservation body for HRA. Discussions
with Natural England resulted in agreement that a formal assessment will be undertaken when a Draft Local Plan has been developed, before pre-submission consultation, as it will not be until this time that the potential impacts can be properly assessed.
Planning Policy Documents 11.32 Progress against evidence base documents can be found in Figure 12. A list of
other completed planning documents associated with the Local Development Scheme (including Supplementary Planning Documents (SPD) can be found below.
Figure 11: Local Development Framework Documents Completed Development Plan Documents Document Title Adoption Date Local Plan 2006 Adopted 2006 Cambridge East Area Action Plan February 2008 North West Cambridge Area Action Plan October 2009 Completed Supplementary Planning Documents Sustainable Design and Construction SPD June 2007 Affordable Housing SPD January 2008 Old Press/Mill Lane Site SPD January 2010 Public Art SPD January 2010 Planning Obligations Strategy SPD March 2010 Eastern Gate Development Framework SPD October 2011 Guidance Documents Informal Planning Policy Guidance (IPPG) on Foodstore Provision in North West Cambridge
March 2011
Cambridge Skyline Guidance March 2012 Interim Planning Policy Guidance (IPPG) on the Protection of Public Houses in the City of Cambridge
October 2012
11.33 The Council has also produced a Statement of Community Involvement that was
adopted in September 2007. The Consultation and Community Engagement Strategy for the Local Plan Review was produced by the Council and approved at Development Plan Scrutiny Sub Committee in November 2011.

11 – Local Development Scheme
Annual Monitoring Report 2012 - 54 -
Saving Local Plan Policies 11.34 In accordance with the requirements of the Planning and Compulsory Purchase Act
2004, the Council submitted a list of all policies within the Local Plan to the Government Office for the East of England six months before 20th July 2009. This list defined policies to be saved and policies to be deleted. The Secretary of State issued a formal direction on 2nd July 2009 saving the majority of policies in the Local Plan. Eight policies were deleted from the plan. Further details can be found in Appendix J.
11.35 These policies will remain in place until superseded by the adoption of the
Cambridge Local Plan - Towards 2031. Whilst the review of the Local Plan is well underway, the Cambridge Local Plan 2006, two Area Action Plans and six Supplementary Planning Documents have been reviewed to establish the extent to which they are compliant with the NPPF. The results of analysis show that there is significant overall compliance with the NPPF.
Conclusion and Actions 11.36 The Council will follow the Local Development Scheme and an update on progress
will be recorded in next year’s AMR.
Annual Monitoring Report 2012 - 55 -
12 – Development Monitoring Framework Introduction 12.1 The previous chapter explained the Council’s revised Local Development Scheme,
new Government regulations surrounding the planning policy process and the timescale for the development of the Cambridge Local Plan - Towards 2031. This chapter explains the process associated with monitoring and evidence gathering, which is used to inform the development of the Local Plan and monitor its effectiveness.
12.2 The role and importance of monitoring has long been recognised by the Council as
a vital part of the plan-making and review process. It enables feedback on the performance of policies and the physical effects they have on the city.
12.3 Monitoring will be crucial to the successful delivery and implementation of the
Cambridge Local Plan – Towards 2031, enabling the development of a comprehensive evidence base, which will in turn inform the preparation of policy documents. Monitoring will also provide a feedback loop mechanism, giving information about policy performance and highlighting policies that need to be replaced/amended.
12.4 Monitoring is a key feature of the planning system and as such is central to the
plan-making process. There are five stages that contribute towards the creation of monitoring information, these are:
Evidence Base Sustainability Appraisal Habitats Regulations Assessment Policy Usage Policy Monitoring
Policy Usage 12.5 The use of policies by Development Management is monitored each year through
the Annual Monitoring Report. All information gathered over the years will help to inform the creation of new policies in the Cambridge Local Plan - Towards 2031.
12.6 Policy usage monitoring for the Cambridge Local Plan - Towards 2031 (once
adopted) will also be monitored to analyse the effectiveness of the new policies. Policy Monitoring 12.7 Policy targets linked to output indicators will be developed to provide a benchmark
for measuring policy implementation. These targets must reflect real world developments that can be directly influenced by the development plan, for example housing completions and provision of open space.
12.8 These targets are reported back through the Council’s Annual Monitoring Report. 12.9 The Good Practice Guide developed by CLG6 recommends that local authorities
apply the objectives-policies-targets-indicators approach in order to facilitate implementation, monitoring and review of the development plan.
6 Local Development Framework Monitoring: A Good Practice Guide: ODPM (March 2005)

Annual Monitoring Report 2012 - 56 -
12 – Development Monitoring Framework 12.10 Targets must be realistic and achievable within the specified timeframe. In
developing targets, CLG recommend that authorities adopt the ‘SMART’ approach of Specific, Measurable, Achievable, Realistic and Time-bound targets wherever possible.
Final Stage 12.11 Responses to the consultations on the Local Plan Review, along with the full
Sustainability Appraisal, will continue to inform all aspects of the development plan. It will also enable the development of clear links between spatial objectives, policy targets and proposed output, significant effects and contextual indicators.
12.12 The final stage in integrating the monitoring and review process with the
development of the Cambridge Local Plan - Towards 2031 arises as a result of the examination and publication of the Inspector’s Report. The examination looks at the soundness of the document, and this includes an assessment of the evidence base and the appropriateness of the monitoring framework. Modifications may need to be made to the proposed monitoring strategy in light of the Inspector’s Report; this may include changes to the output, significant effects and indicators. Once agreed, the monitoring strategy; policy targets; output and contextual indicators; sustainability appraisal targets and significant effects indicators will need to be reported in the AMR.
Linkages with other Authorities 12.13 The Council continues to work with South Cambridgeshire District Council when
dealing with policy development for urban extensions, and evidence based work which spans the boundary between the two districts, for example the Employment Land Review and work on both districts’ Strategic Housing Land Availability Assessments. The two Councils produce separate AMRs which deal with their own districts.
12.14 In addition to the need to monitor individual districts, it will be important to monitor
developments that span the administrative boundary. To this end, indicators have been developed for the joint AAPs for Cambridge East and North West Cambridge, drawing together the monitoring of the developments across both districts. This will allow for the monitoring of housing completions against the policy requirements for the development as a whole. A number of specific local indicators have also been developed to enable the monitoring of policies that set specific requirements for development, for example, housing density and access to public transport (see Appendices H and I).
12.15 Policy development for other cross-boundary developments such as the Northern
Fringe East also requires partnership working with South Cambridgeshire District Council in a similar way. This work will come forward in line with the Council’s LDS.

Annual Monitoring Report 2012 - 57 -
12 – Development Monitoring Framework Conclusion and Actions 12.16 Government guidance notes that monitoring the development plan should be a
continuation and development of existing good practice and that authorities should build upon their existing monitoring systems.
12.17 As work progresses on the development plan, it will be necessary to develop new
indicators to monitor the effectiveness of planning policies and report results in subsequent AMRs. As policies are developed, consideration will need to be given as to how they will be monitored and reported in terms of appropriate targets and indicators and whether these are based on information that the Council already has access to or whether new sources need to be identified.
12.18 Significant Effects Indicators will also be developed as part of the development plan
process, linked to Sustainability Appraisals. As development plan documents come forward, Significant Effects Indicators will be developed, with similar consideration given to the monitoring of policies and subsequent reporting in the AMR.
12.19 Future housing provision will need reviewing as part of the Local Plan Review and
any necessary changes confirmed through the review of the Local Plan. This will be highlighted in next year’s AMR.
12.20 The Council is working in partnership with the neighbouring authority of South
Cambridgeshire District Council on a number of urban extensions. Work has been and will continue to be carried out to identify and monitor appropriate indicators in both districts.
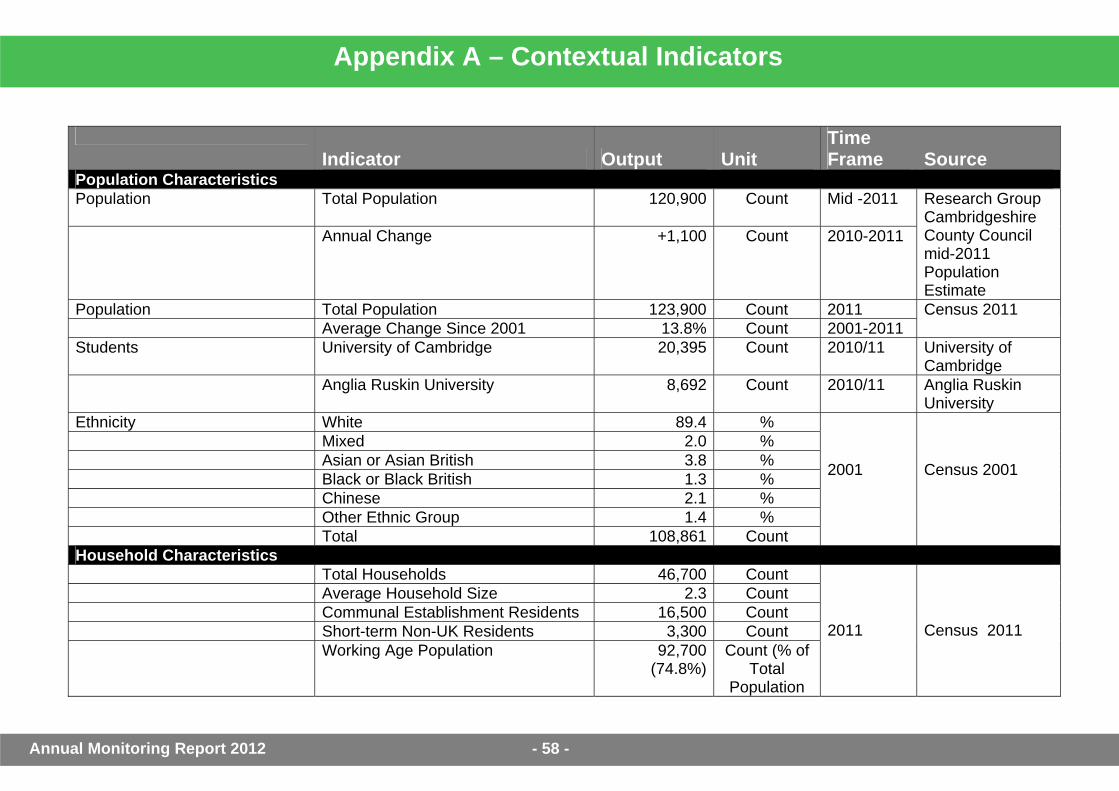
Appendix A – Contextual Indicators
Annual Monitoring Report 2012 - 58 -
Indicator Output Unit Time Frame Source
Population Characteristics Population
Total Population 120,900 Count Mid -2011
Annual Change +1,100 Count 2010-2011
Research Group Cambridgeshire County Council mid-2011 Population Estimate
Population Total Population 123,900 Count 2011 Average Change Since 2001 13.8% Count 2001-2011
Census 2011
Students University of Cambridge 20,395 Count 2010/11 University of Cambridge
Anglia Ruskin University 8,692 Count 2010/11 Anglia Ruskin University
Ethnicity White 89.4 % Mixed 2.0 % Asian or Asian British 3.8 % Black or Black British 1.3 % Chinese 2.1 % Other Ethnic Group 1.4 % Total 108,861 Count
2001
Census 2001
Household Characteristics Total Households 46,700 Count Average Household Size 2.3 Count Communal Establishment Residents 16,500 Count Short-term Non-UK Residents 3,300 Count Working Age Population 92,700
(74.8%)Count (% of
Total Population
2011 Census 2011

Appendix A – Contextual Indicators
Annual Monitoring Report 2012 - 59 -
Indicator Output Unit
Time Frame Source
Single Adult Households Non Pensioner
21.7 %
Single Adult Households Pensioner 14.1 % Couple Households No Children 16.9 % Couple Households With Dependant
Children 16.4 %
Lone Parents With Dependant Children
4.8 %
Other Households 26.1 %
2001 Census 2001
Dwelling Stock
Local Authority 7,202 Count 1st April 2012
ELASH (English Local Authority Statistics on Housing)
Social Rented Register Social Landlords (RSL) & Other Public Sector
104 Other Public
Sector only reported on
new form
Count 1st April 2012
ELASH (English Local Authority Statistics on Housing
Private Sector Non RSL Count 1st April 2012
No longer reported on
Total Dwellings, 49,415 Count 1st April 2011
HSSA 2011 & Council Tax
Tenure Private Sector Rented 8,774 Count Local Authority Rented 7,571 Count Housing Association/RSL Rented 2,516 Count Owner Occupied 22,802 Count Others 991 Count
2001
Census
Number of Affordable Dwellings Count 31st March 2012
No longer reported on new

Appendix A – Contextual Indicators
Annual Monitoring Report 2012 - 60 -
Indicator Output Unit
Time Frame Source
ELASH English Local Authority Statistics on Housing)
Average House Price Terraced 334,801 Price £ Semi Detached 338,348 Price £ Flat/Maisonette 229,139 Price £ Detached 618,414 Price £
March – August 2012
Cambridgeshire Research Group/ Hometrack sales & Valuation
Homelessness
Number of Homeless Households in Priority Need
141 Count 2009/10 HSSA 2009/10
Rough Sleepers 6 Count November 2010
Street Count Results – Cambridge City Council
Gypsy & Travellers Housing Estimated Number of Gypsy/Traveller Households in District
55 Count Households
2006 CSR Travellers Needs Assessment -May 2006
No of licensed permanent sites within LA
2 Licences 2009 Environment & Planning CCC Both private sites. Not specific for travellers/gypsies.
Number of Transit Sites 07 Count 2011 Need identified in Local Plan for a transit site.
7 “The evidence from recorded short-term unauthorised encampments and other sources, whilst patchy, demonstrates some demand for transit or emergency stopping places. However, it is not possible to determine a precise amount of demand in any one local authority area. This is because of travel routes through the Cambridge area, where the same caravans may stop in different local authority areas at different times. Therefore, a well-placed transit site within one local authority may serve the needs of two or more local authorities. Travellers Liaison Officers advise that current thinking is towards providing more emergency stopping places rather than transit pitches.” - Cambridge Sub-Regional Gypsy and Traveller Accommodation Needs Assessment 2011.

Appendix A – Contextual Indicators
Annual Monitoring Report 2012 - 61 -
Indicator Output Unit
Time Frame Source
ODPM calculation of need15 pitches
No of permanent licensed pitches in District
5 Count Licences
July 2011 An estimated 5 pitches on the 2 licensed caravan sites (not specifically designated as G&T sites) are occupied by Gypsies and Travellers
Average Number of Unauthorised Caravans
0 Count 2008/09 ODPM Jan and July Counts
Households Living in Local Authority Housing
37 Count 2006 ODPM (Now CLG) Count/CSR Travellers Needs Assessment -May 2006
Building For Life

Appendix A – Contextual Indicators
Annual Monitoring Report 2012 - 62 -
Indicator Output Unit
Time Frame Source
Ratings Rated as Very Good 2 Rated as Good 3 Rated as Average 0 Rated as Poor 0
Count
2011/12
2010/11 BfL Assessment – Cambridge City Council
Land Adjacent to 5 Wellington Court [09/0819/FUL]
15.5
Simons House [09/0494/FUL] 17.0Land to the rear of 99-105 Shelford Road [08/0016/FUL]
14.0
George Nuttall Close [06/1257/FUL] 15.5
Sites Assessed
13 Chesterton Road [09/0967/FUL] 16.0
Score 2011/12 2011/12 BfL Assessment – Cambridge City Council
Economic Characteristics Economic Activity Rate – Aged 16-64
yrs 75 % April 2011
– March 2012
Annual Population Survey/NOMIS
Unemployed (Aged 16-64 yrs) 1, 779 Count Unemployed Rate (as % of resident
population aged 16-64 years) 1.9 % April 2012
Job Seakers Allowance: Claimant Count/NOMIS
Business Demography Number of active VAT and/or PAYE based enterprises
4,655 Count Business Demography/ ONS
Net Change 2004-2009 315 Count
2009
Business Births 450 Count Business Deaths 495 Count Count of Active Enterprises 4,540 Count
2010 Business Demography/ ONS

Appendix A – Contextual Indicators
Annual Monitoring Report 2012 - 63 -
Indicator Output Unit
Time Frame Source
Business Premises Availability Rates
B1a/b Availability (Offices) 19 %
Laboratories Availability 12 % B1c, B2, B8 Availability (Industrial) 7 %
4rth Quarter 2011
Bidwells Business Space No. 23 - 2012
Earnings Gross Household Income Median 29,800 £ 2010 CACI Ltd./Research Group Cambridgeshire County Council
Deprivation Local Authority Average Score 15.56 Rank Local Authority Rank Of Average
Score 193 Rank
SOAs in 40% Most Deprived in England
20 Count 2010
The English Indices of Deprivation 2010 – Department of Communities and Local Government
Crime Rates Crime Rate Per 1,000 Population 114.3 Count 2010/11 Cambridgeshire Crime Research Team
Commuting Characteristics Total Workforce Population 78,667 Count Employed Residents 2001 49,221 Count Live and Work in Cambridge 2001 35,360 Count Percent Living & Working in
Cambridge 71.8 %
2001
Percent Living & Working in Cambridge 1991
79.0 % 1991
Live in South Cambs and work in Cambridge 2001
20,727 Count 2001
Census

Appendix A – Contextual Indicators
Annual Monitoring Report 2012 - 64 -
Indicator Output Unit
Time Frame Source
Live in East Cambs and work in Cambridge 2001
6,227 Count
Live in Hunts and work in Cambridge 2001
4,248 Count
Live in Suffolk and work in Cambridge 2001
4,067 Count
Live rest of UK and work in Cambridge
8,048 Count
Mode of Travel to work Work From Home 5.4 % Public Transport 9.5 % Car 57.4 % Cycle/Motorcycle/Walk 27.3 % Other 0.5 %
Environmental Characteristics Annual Average Concentration Nitrogen Dioxide (NO2)
Regent St (exceedences hourly average)
40 (0)
Montague Road (exceedences hourly average)
36(0)
Gonville Place (exceedences hourly average)
39 (0)
Parker St (exceedences hourly average)
50 (1)
Newmarket Road (exceedences hourly average)
28 (0)
Annual Average Fine Particles (PM10)
Montague Road (exceedences daily average)
23 (6)
Gonville Place (exceedences daily average)
22 (7)
Parker St (exceedences daily average)
50 (1)
ug/m3 1st April 2010 to 31st March -2011
CCC & Netcen

Appendix A – Contextual Indicators
Annual Monitoring Report 2012 - 65 -
Indicator Output Unit
Time Frame Source
Annual Average Fine Particles (PM2.5)
Newmarket Rd 12
Total Area of Cambridge Local Authority
Total Area of Cambridge Local Authority
4070 ha Cambridge City Council
Open Space Area of Protected Open Space per 1,000 Population (743.59 ha/119.8)
6.2 ha
Area of total Protected Open Space Accessible to the Public per 1,000 population
2.9 ha
Area of Semi-Natural Green Spaces Accessible to The Public
88.89 ha
2011 Open Space & Recreation Strategy 2011
Area of Local Nature Reserve per 1,000 Population
0.36 ha 2009 Recalculated from information from Sustainability Appraisal Scoping Report March 07.
2001 Census figures have been updated to display 2011 Census data where information is available. More data will come forward in time and be updated in next years AMR

Appendix B – Local Indicators
Annual Monitoring Report 2010 - 66 - Annual Monitoring Report 2012 - 66 -
Business Development and Town Centres BD1 Total amount of additional employment floorspace - by type (m²)
BD2 Total amount of employment floorspace on previously developed land - by type (m²)
BD3 Employment land available - by type (ha)
BD4 Total amount of floorspace for 'town centre uses' (m²)
Housing
H1 Plan period and housing targets
H2 (a) Net additional dwellings – in previous years
H2 (b) Net additional dwellings – 2011/2012
H2 (c) Net additional dwellings – in future years
H2 (d) Managed delivery target
H3 New and converted dwellings – on previously developed land (Gross) 2011-2012
H4 Net additional pitches (Gypsy and Traveller) 2011-2012
H5 Gross affordable housing completions 2011-2012
H6 Housing Quality – Building for Life Assessments 2011-12
Environmental Quality
E1 Number of planning permissions granted contrary to Environment Agency advice on (i) flooding and (ii) water quality grounds – No Current information this year
E2 Change in areas of biodiversity importance
E3 Renewable energy generation (MW)

Appendix B – Local Indicators
Annual Monitoring Report 2010 - 67 - Annual Monitoring Report 2012 - 67 -
Business Development and Town Centres BD1 Total amount of additional employment floorspace - by type (m²)
BD2 Total amount of employment floorspace on previously developed land - by type (m²)
BD3 Employment land available - by type (ha) (Source: Cambridgeshire County Council Research Group)
Business Completions Gains Losses
BD1 Land (ha)
Floorspace (sqm)
Land (ha) BD2 % on PDL
B1 (unspecified) 0 0.00 -224 -0.09 0 N/AB1a 6193 0.50 -8,128 -4.56 6,193 100%B1b 11845 2.07 -2666 -2.26 11845 100%B1c 0 0.00 -4,695 -3.02 0 N/AB2 348 0.16 -773 -0.15 348 100%B8 965 0.20 -53 -0.16 965 100%Total 19,35
1 2.93 -16,539 -10.24 19,351 100%
Employment land lost to residential B1-B8 (ha) -8.85Land lost in Employment/Regeneration areas B1-B8 (ha)
-9.17
Definitions Gains = developments that involve the creation of new business use land/floorspace, on land that was previously in business use. Losses = developments that involve the loss of business floorspace, to allow the land to be used for a non-business use. BD1 = Total Amount of Additional employment floorspace (sqm) BD2 = Additional Employment Floorspace on PDL (Sqm) Data spans 01/04/2010 to 31/03/2011
(Cambridgeshire County Council – Business completions 2011g [online]) BD4 Amount of completed floorspace (m²) 2011/12 in Cambridge A1 A2 B1 (a) D2
Gains 907 776 146 0Losses -922 -578 -627 -95
Town Centre
Net -15 198 -481 -95Gains 1,172 1,036 6,193 470Losses -1,152 -578 -8,126 -119
Local Authority Area
Net 20 458 -1,935 351(Cambridgeshire County Council – Business completions 2012g [online])

Appendix B – Local Indicators
Annual Monitoring Report 2010 - 68 - Annual Monitoring Report 2012 - 68 -
Housing H1 Plan period and housing targets • Revised RSS target from 2011 to 2031 – 14,000 dwellings.
• Local Plan 2006 Target 1999-2016 – 12,500
See Appendix D for an explanation of the approach in this year’s trajectory. H2 (a) Net additional dwellings – in previous years See Appendix D H2 (b) Net additional dwellings – 2011-2012 331 dwellings H2(c) Net additional dwellings – in future years See Appendix D H2 (d) Managed delivery target See Appendix D H3 New and converted dwellings – on previously developed land (Gross)
2011-2012 93.8% H4 Net additional pitches (Gypsy and Traveller) 2011-2012 0 H5 Gross affordable housing completions 2011-2012 67 H6 Housing Quality – Building for Life Assessments 2011-2012 2 - Very Good
3 – Good 0 – Poor 0 – Very Poor Source: Cambridge City Council
Environmental Quality
E1 Number of planning permissions granted contrary to Environment Agency advice on (i) flooding and (ii) water quality grounds 2011/12
i 0
ii 0 E2 Change in areas of biodiversity importance Cambridge has 2 sites designated as Sites of Special Scientific Interest (SSSI):
Cherry Hinton Pit and Traveller’s Rest Pit., totalling 15.03 hectares, In 2009/10 this was recorded as 14.97 hectares. In 2010/11, the boundary of the Traveller’s Rest Pit SSSI was changed after re-survey, which led to a small increase in its area and the addition of one unit. The Traveller’s Rest Pit site is a SSSI designated for geological reasons. It was re-surveyed due to forthcoming development in the north-western area of Cambridge within which it is located. 36.1% of SSSI land area in the city remains in favourable condition; this figure
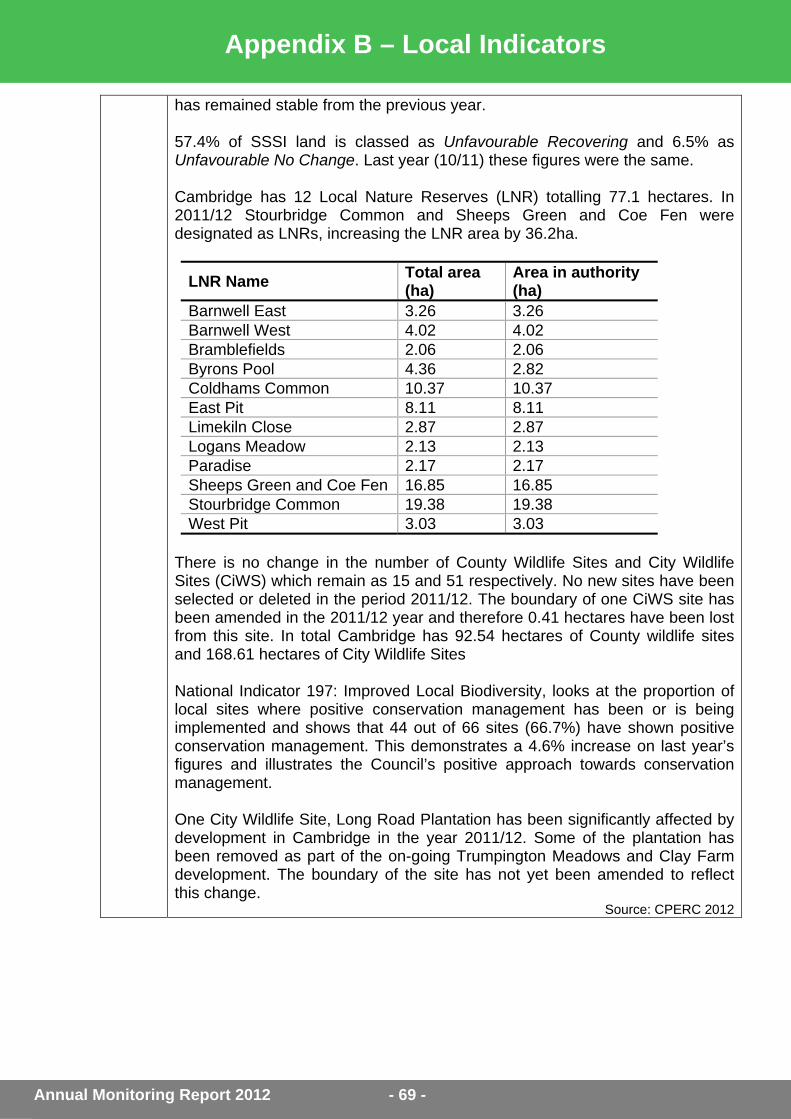
Appendix B – Local Indicators
Annual Monitoring Report 2010 - 69 - Annual Monitoring Report 2012 - 69 -
has remained stable from the previous year. 57.4% of SSSI land is classed as Unfavourable Recovering and 6.5% as Unfavourable No Change. Last year (10/11) these figures were the same. Cambridge has 12 Local Nature Reserves (LNR) totalling 77.1 hectares. In 2011/12 Stourbridge Common and Sheeps Green and Coe Fen were designated as LNRs, increasing the LNR area by 36.2ha.
LNR Name Total area (ha)
Area in authority (ha)
Barnwell East 3.26 3.26 Barnwell West 4.02 4.02 Bramblefields 2.06 2.06 Byrons Pool 4.36 2.82 Coldhams Common 10.37 10.37 East Pit 8.11 8.11 Limekiln Close 2.87 2.87 Logans Meadow 2.13 2.13 Paradise 2.17 2.17 Sheeps Green and Coe Fen 16.85 16.85 Stourbridge Common 19.38 19.38 West Pit 3.03 3.03
There is no change in the number of County Wildlife Sites and City Wildlife Sites (CiWS) which remain as 15 and 51 respectively. No new sites have been selected or deleted in the period 2011/12. The boundary of one CiWS site has been amended in the 2011/12 year and therefore 0.41 hectares have been lost from this site. In total Cambridge has 92.54 hectares of County wildlife sites and 168.61 hectares of City Wildlife Sites National Indicator 197: Improved Local Biodiversity, looks at the proportion of local sites where positive conservation management has been or is being implemented and shows that 44 out of 66 sites (66.7%) have shown positive conservation management. This demonstrates a 4.6% increase on last year’s figures and illustrates the Council’s positive approach towards conservation management. One City Wildlife Site, Long Road Plantation has been significantly affected by development in Cambridge in the year 2011/12. Some of the plantation has been removed as part of the on-going Trumpington Meadows and Clay Farm development. The boundary of the site has not yet been amended to reflect this change.
Source: CPERC 2012

Appendix B – Local Indicators
Annual Monitoring Report 2010 - 70 - Annual Monitoring Report 2012 - 70 -
Environmental Quality E3 Renewable energy generation
Installed Capacity
(MW) 2011/12 Potential Sites - Installed capacity (MW) 2011/12
Wind 0.0001 0Biomass 0 0Landfill gas 0 0Sewage gas 0 0Photovoltaic 0.8515 0.2748Hydro-power 0 0
(Source: Cambridgeshire County Council Research Group) Other Indicators Density range of completed dwellings on sites greater than nine dwellings Density Percentage <30DPH 3.5%30 – 50DPH 4.9%>50DPH 91.5%
(Cambridgeshire County Council, 2012e [online]) Other Indicators Accessibility of Services - Amount of completed new residential development (within the 2011/12 year) within 30 minutes and 15 minutes public transport time of a GP; a hospital; a primary school; a secondary school; areas of employment; and a major retail centre. Key Service % of population
who are within 30 minutes public transport time of Key services
% of population who are within 15 minutes public transport time of Key services
GP Surgery 100% 100%Hospital with A & E 97% 40.3%Hospital with Outpatients 97% 40.3%Primary School 100% 97.3%Secondary School 100% 69.1%Area of Employment 100% 100%Retail Centre 100% 85%
(Source: Cambridgeshire County Council Research Group)

Appendix C – Local Plan Policy Usage
Annual Monitoring Report 2012 - 71 -
Policy Title Uses Recorded 2011/12
Designing Cambridge 3/1 Sustainable Development 7903/2 Setting of the City 63/3 Safeguarding Environmental Character 73/4 Responding to Context 11163/6 Ensuring Coordinated Development 223/7 Creating Successful Places 5893/8 Open Space and Recreation Provision through New
Development 663/9 Watercourses and Other bodies of Water 73/10 Sub-division of Existing Plots 553/11 The Design of External Spaces 1983/12 The Design of New Buildings 1823/13 Tall Buildings and the Sky Line 103/14 Extending Buildings 5773/15 Shop fronts and Signage 95Conserving Cambridge 4/1 Green Belt 134/2 Protection of Open Space 384/3 Safeguarding Features of Amenity or Nature
Conservation Value 134/4 Trees 1534/6 Protection of Sites of Local Nature Conservation
Importance 84/8 Local Biodiversity Action Plans 24/9 Scheduled Ancient Monuments/Archaeological Areas
94/10 Listed Buildings 1684/11 Conservation Areas 5504/12 Buildings of Local Interest 344/13 Pollution and Amenity 2344/14 Air Quality Management Areas 164/15 Lighting 24Living in Cambridge 5/1 Housing Provision 895/2 Conversion of Large Properties 295/3 Housing Lost to Other Uses 45/4 Loss of Housing 145/5 Meeting Housing Needs 13

Appendix C – Local Plan Policy Usage
Annual Monitoring Report 2012 - 72 -
Policy Title Uses Recorded 2011/12
5/7 Supported Housing/Housing in Multiple Occupation 16
5/8 Travellers 05/9 Housing for People with Disabilities 55/10 Dwelling Mix 135/11 Protection of Existing Facilities 105/12 New Community Facilities 135/13 Community Facilities in the Areas of Major Change
25/14 Provision of Community Facilities through New
Development 595/15 Addenbrooke’s 3Enjoying Cambridge 6/1 Protection of leisure Facilities 26/2 New Leisure Facilities 126/3 Tourist Accommodation 86/4 Visitor Attractions 06/6 Change of Use in the City Centre 56/7 Shopping Development and Change of Use in District
and Local Centres 96/8 Convenience Shopping 56/9 Retail Warehouses 26/10 Food and Drink Outlets 20Working and Studying in Cambridge 7/1 Employment Provision 77/2 Selective Management of the Economy 137/3 Protection of Industrial and Storage Space 127/4 Promotion of Cluster Development 47/5 Faculty development in the Central Area, University of
Cambridge 47/6 West Cambridge, South of Madingley Road 37/7 College and University of Cambridge Staff and Student
Housing 57/8 Anglia Ruskin University East Road Campus 27/9 Student Hostels for Anglia Ruskin University 67/10 Speculative Student Hostel Accommodation 47/11 Language Schools 4Connecting and Servicing Cambridge 8/1 Spatial Location of Development 38/2 Transport Impact 185

Appendix C – Local Plan Policy Usage
Annual Monitoring Report 2012 - 73 -
Policy Title Uses Recorded 2011/12
8/3 Mitigating Measures 308/4 Walking and Cycling Accessibility 348/5 Pedestrian and Cycle Network 118/6 Cycle Parking 1628/7 Public Transport Accessibility 98/8 Land for Public Transport 38/9 Commercial Vehicles and Servicing 98/10 Off-Street Car Parking 1698/11 New Roads 38/12 Cambridge Airport 08/13 Cambridge Airport Public Safety Zone 08/14 Telecommunications Development 608/15 Mullards Radio Astronomy Observatory, Lord’s Bridge
08/16 Renewable Energy in Major New Developments
248/17 Renewable Energy 258/18 Water, Sewerage and Drainage Infrastructure 32Areas of Major Change 9/1 Further Policy/Guidance for the Development of Areas
of Major Change 29/2 Phasing of Areas of Major Change 09/3 Development in the Urban extensions 39/5 Southern Fringe 189/6 Northern Fringe 29/8 Land between Huntingdon Road and Histon Road
09/9 Station Area 1Implementation 10/1 Infrastructure Improvements 63

Appendix D – Housing Trajectory
Annual Monitoring Report 2012 - 74 -
What is a Housing Trajectory? Appendix D contains the following:
• The Housing Trajectory (with a five year land supply total summary) split into the following categories:
• Urban Extensions • Local Plan Allocations • Large Sites Over 50 • Small Sites 10-49 Dwellings • Housing Trajectory Summary Tables which include: • A summary of the Housing Trajectory, including the five-year land supply total
summary. • Previous years completions and predicted totals table. This tracks the Council's
progress against the revised RSS housing delivery target (see Chapter 5 for more detailed information) and includes actual completion figures.
• All documents cover the Cambridge City Council Local Authority Area. The documents estimate housing completions and developments over a predetermined time period. The Housing Trajectory covers the time period from 2011/12 to 2030/31.
Method The Five Year Land Supply Totals and Housing Trajectory take into account all planning applications for 10 dwellings and above and also housing allocations set out in the Council’s Local Plan such as Cambridge East and the North West Cambridge. The information is gathered by the following means:
• questionnaires to developers, landowners and agents, which includes a survey and a ‘best estimate’ table of completions.
• talking to the Council’s Development Management and Building Control teams to identify progress on sites and completions.
• referencing applications against the County Council’s completions data. • talking to the City Council’s New Neighbourhoods Team concerning major sites. • in cases where no information was returned, estimates were made though
information obtained from the Development Management and New Neighbourhoods teams.
• through information from the SHLAA. In some cases, a site may indicate no development across the whole of the trajectory period. This denotes that the site is no longer available for development, but is still allocated for housing in the Local Plan.

Appendix D – Housing Trajectory
Annual Monitoring Report 2012 - 75 -
Definitions
• Availability – Identifies the site as being available for development and indicates that there are no legal or ownership problems or that there is current planning permission granted.
• Suitability – Indicates that the site is a suitable location for development and would contribute to the creation of sustainable communities. This includes assessing any policy restrictions, physical limitations and potential impacts and environmental conditions that could be experienced by prospective residents
• Achievability – Indicates that the housing will be delivered on site within 5 years • Market and Affordable housing – In some cases a site has been split in two with
the initials M, A after the site name. This indicates whether the figures are referring to market or affordable housing provision. U/K denotes that the type of housing (Market or Affordable) is unknown.
• Built to date column – identifies how many houses have been built on that site by 31/03/12.
• Reporting Year 12/13 column – the figures in this column are not actual figures and are in fact derived from the same method explained under ‘Method’ section above.
Small Print The Five Year Land Supply Totals and Housing Trajectory are based on replies from developers, agents and planning professionals. This information is, however, influenced by market conditions and economic circumstances and therefore may change significantly over time. The Future of the Housing Trajectory Next year’s housing trajectory will take into account information gleaned from the Strategic Housing Land Availability Assessment (SHLAA) which is due to be completed in 2012. In future, the Housing Trajectory will coincide with the update of SHLAA data. The Localism Act 2011 will revoke the RSSs. Until this has been undertaken the revised Local Authority housing targets will remain applicable. The Council will be reviewing its housing targets through the Local Plan Review, which is scheduled for adoption in 2014. Changes to Site 9.01 – Cambridge East The 2008 Cambridge East Area Action Plan (AAP) identified this site as a new urban quarter of approximately 10,000 to 12,000 dwellings and associated infrastructure. Last year the housing trajectory (Appendix D) showed the potential for 406 dwellings on this site, however most of this site is now unlikely to come forward before 2031 as the airport operators have decided not to relocate the airfield in the immediate future. However, some development is possible on the Land at Coldhams Lane – 91 dwellings (see two site entries against site number 9.01 in the Housing Trajectory Appendix D).

Site NoApplication Number Site Name and Address Size (ha) M
arke
t or
Affo
rdab
le Target number of dwellings on site
Built to date
Outstanding dwellings (12/13-30/31)
Reporting Year 12/13*
13/14 year 1
14/15 year 2
15/16 year 3
16/17 year 4
17/18 year 5 18/19 19/20 20/21 21/22 22/23 23/24 24/25 25/26 26/27 27/28 28/29 29/30 30/31
Total (13/14-30/31) A
vaila
bilit
y
Suita
bilit
y
Ach
ieva
bilit
y
Comments
M 0 0 0 0 0 0 0 0 0 0 0 0 0 0 0 0 0 0 0 0 0 0 0
A 0 0 0 0 0 0 0 0 0 0 0 0 0 0 0 0 0 0 0 0 0 0 0Total 0 0 0 0 0 0 0 0 0 0 0 0 0 0 0 0 0 0 0 0 0 0 0
M 55 0 55 0 0 6 18 31 0 0 0 0 0 0 0 0 0 0 0 0 0 0 55
A 36 0 36 0 0 4 12 20 0 0 0 0 0 0 0 0 0 0 0 0 0 0 36Total 91 0 91 0 0 10 30 51 0 0 0 0 0 0 0 0 0 0 0 0 0 0 91
Total - Cambridge East 91 0 91 0 0 10 30 51 0 0 0 0 0 0 0 0 0 0 0 0 0 0 91
M 956 0 956 0 0 90 180 200 200 200 86 0 0 0 0 0 0 0 0 0 0 0 956
A 637 0 637 0 0 60 120 140 140 157 20 0 0 0 0 0 0 0 0 0 0 0 637Total 1593 0 1593 0 0 150 300 340 340 357 106 0 0 0 0 0 0 0 0 0 0 0 1593M 141 64 77 23 20 0 0 34 0 0 0 0 0 0 0 0 0 0 0 0 0 0 54A 46 20 26 26 0 0 0 0 0 0 0 0 0 0 0 0 0 0 0 0 0 0 0Total 187 84 103 49 20 0 0 34 0 0 0 0 0 0 0 0 0 0 0 0 0 0 54
Total - NIAB 1780 84 1696 49 20 150 300 374 340 357 106 0 0 0 0 0 0 0 0 0 0 0 1647
M 689 0 689 26 133 102 145 123 95 65 0 0 0 0 0 0 0 0 0 0 0 0 663
A 459 0 459 23 102 62 93 82 62 35 0 0 0 0 0 0 0 0 0 0 0 0 436Total 1148 0 1148 49 235 164 238 205 157 100 0 0 0 0 0 0 0 0 0 0 0 0 1099M 251 0 251 38 39 43 58 58 15 0 0 0 0 0 0 0 0 0 0 0 0 0 213
A 167 0 167 39 12 29 38 39 10 0 0 0 0 0 0 0 0 0 0 0 0 0 128Total 418 0 418 77 51 72 96 97 25 0 0 0 0 0 0 0 0 0 0 0 0 0 341
M 270 0 270 0 96 84 60 30 0 0 0 0 0 0 0 0 0 0 0 0 0 0 270
A 180 0 180 0 81 50 40 9 0 0 0 0 0 0 0 0 0 0 0 0 0 0 180Total 450 0 450 0 177 134 100 39 0 0 0 0 0 0 0 0 0 0 0 0 0 0 450
M 105 0 105 0 0 36 48 21 0 0 0 0 0 0 0 0 0 0 0 0 0 0 105
A 104 0 104 0 0 36 48 20 0 0 0 0 0 0 0 0 0 0 0 0 0 0 104Total 209 0 209 0 0 72 96 41 0 0 0 0 0 0 0 0 0 0 0 0 0 0 209
Total - Clay Farm 2225 0 2225 126 463 442 530 382 182 100 0 0 0 0 0 0 0 0 0 0 0 0 2099
M 924 0 924 0 0 0 0 51 255 203 215 160 40 0 0 0 0 0 0 0 0 0 924
A 924 0 924 0 0 520 225 179 0 0 0 0 0 0 0 0 0 0 0 0 0 924Total 1848 0 1848 0 0 520 225 230 255 203 215 160 40 0 0 0 0 0 0 0 0 0 1848
M 164 164 0 0 44 44 51 25 0 0 0 0 0 0 0 0 0 0 0 0 0 164
A 110 110 0 0 30 30 34 16 0 0 0 0 0 0 0 0 0 0 0 0 0 110Total 274 0 274 0 0 74 74 85 41 0 0 0 0 0 0 0 0 0 0 0 0 0 274M 194 0 194 72 78 44 0 0 0 0 0 0 0 0 0 0 0 0 0 0 0 0 122A 130 0 130 48 52 30 0 0 0 0 0 0 0 0 0 0 0 0 0 0 0 0 82Total 324 0 324 120 130 74 0 0 0 0 0 0 0 0 0 0 0 0 0 0 0 0 204
598 0 598 120 130 148 74 85 41 0 0 0 0 0 0 0 0 0 0 0 0 0 478
M 209 0 209 0 0 66 66 77 0 0 0 0 0 0 0 0 0 0 0 0 0 0 209
A 138 0 138 0 0 44 44 50 0 0 0 0 0 0 0 0 0 0 0 0 0 0 138Total 347 0 347 0 0 110 110 127 0 0 0 0 0 0 0 0 0 0 0 0 0 0 347M 117 0 117 28 60 29 0 0 0 0 0 0 0 0 0 0 0 0 0 0 0 0 89A 78 0 78 35 34 9 0 0 0 0 0 0 0 0 0 0 0 0 0 0 0 0 43Total 195 0 195 63 94 38 0 0 0 0 0 0 0 0 0 0 0 0 0 0 0 0 132M 55 0 55 0 0 8 47 0 0 0 0 0 0 0 0 0 0 0 0 0 0 0 55A 36 0 36 0 0 5 31 0 0 0 0 0 0 0 0 0 0 0 0 0 0 0 36Total 91 0 91 0 0 13 78 0 0 0 0 0 0 0 0 0 0 0 0 0 0 0 91
Total - Glebe Farm 286 0 286 63 94 51 78 0 0 0 0 0 0 0 0 0 0 0 0 0 0 0 2237175 84 7091 358 707 1431 1347 1249 818 660 321 160 40 0 0 0 0 0 0 0 0 0 6733
5552
Target number of dwellings on site
Built to date
Outstanding dwellings (12/13-30/31)
Reporting Year 12/13*
13/14 year 1
14/15 year 2
15/16 year 3
16/17 year 4
17/18 year 5 18/19 19/20 20/21 21/22 22/23 23/24 24/25 25/26 26/27 27/28 28/29 29/30 30/31
Total (12/13-30/31)
1593 0 1593 0 0 150 300 340 340 357 106 0 0 0 0 0 0 0 0 0 0 0 1593187 84 103 49 20 0 0 34 0 0 0 0 0 0 0 0 0 0 0 0 0 0 54
1848 0 1848 0 0 520 225 230 255 203 215 160 40 0 0 0 0 0 0 0 0 0 18483628 84 3544 49 20 670 525 604 595 560 321 160 40 0 0 0 0 0 0 0 0 0 3495
0 0 0 0 0 0 0 0 0 0 0 0 0 0 0 0 0 0 0 0 0 0 091 0 91 0 0 10 30 51 0 0 0 0 0 0 0 0 0 0 0 0 0 0 9191 0 91 0 0 10 30 51 0 0 0 0 0 0 0 0 0 0 0 0 0 0 91
2225 0 2225 126 463 442 530 382 182 100 0 0 0 0 0 0 0 0 0 0 0 0 2099598 0 598 120 130 148 74 85 41 0 0 0 0 0 0 0 0 0 0 0 0 0 478286 0 286 63 94 51 78 0 0 0 0 0 0 0 0 0 0 0 0 0 0 0 223347 0 347 0 0 110 110 127 0 0 0 0 0 0 0 0 0 0 0 0 0 0 347
3456 0 3456 309 687 751 792 594 223 100 0 0 0 0 0 0 0 0 0 0 0 0 31477175 84 7091 358 707 1431 1347 1249 818 660 321 160 40 0 0 0 0 0 0 0 0 0 6733
* Figures in the Reporting Year column are not actual completion figures
Glebe FarmBell School SiteTotal - Southern FringeTotal Urban Extensions
Cambridge East - Land at Coldhams LaneTotal - Cambridge EastClay FarmTrumpington Meadows
NIAB - FrontageNW - Cambridge UniversityTotal - North West Cambridge
Cambridge East Land North of Cherry Hinton
Summary - Urban Extensions by Growth Area
Site Name and AddressNIAB - Main
Total - Urban ExtensionsFive Year Supply Total
9.79
15.5 (including site below)
See AboveTrumpington Meadows - Phase 1
Glebe Farm
Bell School Site
Total - Trumpington Meadows
7.61
Y
Y
Y
Trumpington Meadows - Minus Phase 1
NW - Cambridge University 67.86
Y Y
Y Y Y
Note, the applicants intend to submit a new application for approximately 280 dwellings.
Y
Y Y
Existing farm use of the site; start on site of development subject to University Regent House Approval, start on site of market housing conditional upon securing acceptable bids / legal agreements with private sector developers
Y Y
Y Y
Y Y YDependant on infrastructure, sale of land and planning obligations
Y Y
Y Y Y
Y Y Y
Y
X
Y
Dependant on infrastructure & access costs S106 and CIL requirements. Also securing outline planning permissionY
Falls with airport safeguarding height for referal, subject to approval.
Under Construction
Y
Y Y
YY
See Above
See Above
Y
Y
1.3
52.87
29.31 (including
sites below)
9.1308/0361 & 08/0363 or
9.08 11/0075/REM
See Above
06/0795
Previously 9.07/9.11 of the Local Plan 11/1114/OUT
9.08
9.0511/0698/REM, 12/0867/REM
Clay Farm/Showground (Parcel 21)
9.0507/0620/OUT, 12/0754/REM
Clay Farm/Showground (Skanska)
9.06 07/0620/OUT
NIAB Frontage
Clay Farm/Showground (Countryside Properties)
Cambridge East - Land at Coldhams Lane
NIAB Main9.03 07/0003
9.01
Urban Extensions
Cambridge East Land North of Cherry Hinton9.01 X X8.38
Operators have decided not to relocate the airfield in the immediate future
9.03 07/1124/REM
Y9.1308/0361 & 08/0363 or
9.06 & 9.05
07/0620/OUT, 10/1296/REM, 12/0794/REM
Clay Farm/Showground (Bovis)
Glebe Farm See Above Y Y

Site NoApplication Number Site Name and Address Size (ha)
Market or Affordable
Target number of dwellings on site
Built to date
Outstanding dwellings (12/13-30/31)
Reporting Year 12/13*
13/14 year 1
14/15 year 2
15/16 year 3
16/17 year 4
17/18 year 5 18/19 19/20 20/21 21/22 22/23 23/24 24/25 25/26 26/27 27/28 28/29 29/30 30/31
Total (13/14-30/31) A
vaila
bilit
y
Suita
bilit
y
Ach
ieva
bilit
y
CommentsM 286 132 154 55 55 44 0 0 0 0 0 0 0 0 0 0 0 0 0 0 0 0 99A 122 68 54 30 24 0 0 0 0 0 0 0 0 0 0 0 0 0 0 0 0 0 24Total 408 200 208 85 79 44 0 0 0 0 0 0 0 0 0 0 0 0 0 0 0 0 123M 74 0 74 0 0 0 0 0 0 0 0 0 0 37 37 0 0 0 0 0 0 0 74A 49 0 49 0 0 0 0 0 0 0 0 0 0 24 25 0 0 0 0 0 0 0 49Total 123 0 123 0 0 0 0 0 0 0 0 0 0 61 62 0 0 0 0 0 0 0 123
5.0311/0902/REM & 08/0500/OUT British Telecom, Cromwell Road 1.2 U/K 136 0 136 0 0 68 68 0 0 0 0 0 0 0 0 0 0 0 0 0 0 0 136 Y Y Y Under Construction
5.04 379-381 Milton Road 2.4 U/K 88 0 88 0 0 0 0 0 0 0 0 0 33 55 0 0 0 0 0 0 0 0 88 X Y Y
5.05 11/0008/FULCambridge City Football Ground, Milton Road 1.6 U/K 147 0 147 0 0 0 0 50 50 47 0 0 0 0 0 0 0 0 0 0 0 0 147 Y Y Y
Application lodged, awaiting decision. Possible constraints: Access restrictions and reprovision of existing open space. Deliverable if reprovision can be secured.
5.06 British Telecom, Long Road 1.7 U/K 76 0 76 0 0 0 0 0 26 50 0 0 0 0 0 0 0 0 0 0 0 0 76 Y Y Y
Current owner reviewing and considering partial land release as site is underutilised despite recent rationalisation - deliverable
5.07 Willowcroft, Histon Road 1.4 U/K 67 0 67 0 0 0 0 0 0 17 50 0 0 0 0 0 0 0 0 0 0 0 67 X Y YDevelopable - subject to landowners agreeing timing and mix of uses
5.08 Territorial Army, Cherry Hinton Road 1.26 U/K 0 0 0 0 0 0 0 0 0 0 0 0 0 0 0 0 0 0 0 0 0 0 0 X Y X
No intention to pursue for residential use. However cannot predict what government changes will bring with reviews of reserved forces over the period of the next review
5.09 11/1294/FUL Travis Perkins, Devonshire Road 1.2 U/K 43 0 43 0 0 15 28 0 0 0 0 0 0 0 0 0 0 0 0 0 0 0 43 Y Y Y
Awaiting application decision - Contamination issues may delay development. Also subject to relocation of existing use and S106, affordable housing, open space and chisholm trail negotiations.
5.10The Nuffield Hospital, Trumpington Road 1.19 U/K 0 0 0 0 0 0 0 0 0 0 0 0 0 0 0 0 0 0 0 0 0 0 0 X Y X
No intention of developing for residential use
5.11 Caravan Park, Fen Road 0.8 U/K 0 0 0 0 0 0 0 0 0 0 0 0 0 0 0 0 0 0 0 0 0 0 0 X Y X
Council Assessment - not coming forward for development, Is a permanent static home site.
5.12Police Station, Parkside (remainder of site) 0.5 U/K 131 0 131 0 0 0 0 31 50 50 0 0 0 0 0 0 0 0 0 0 0 0 131 Y Y Y
5.12 10/0523 Fire Station , Parkside 0.4 U/K 99 0 99 20 79 0 0 0 0 0 0 0 0 0 0 0 0 0 0 0 0 0 79 Y Y Y Under Construction
5.13 07/0328Milton Infant & Junior School, Milton Road 0.4 U/K 0 0 0 0 0 0 0 0 0 0 0 0 0 0 0 0 0 0 0 0 0 0 0 X Y X
Part Built as nursing home. Development of residential flats unlikely. Likely to be developed for extra care units.
5.14 Ridgeons, Cavendish Road 0.7 U/K 28 0 28 0 0 0 0 28 0 0 0 0 0 0 0 0 0 0 0 0 0 0 28 X Y Y
5.15
Housing allocation at, Henry Giles House, Chesterton Road, Cambridge, CB4 0.8 U/K 48 0 48 0 0 0 0 10 10 10 10 8 0 0 0 0 0 0 0 0 0 0 48 X Y Y
Land owner working on plans to bring this site forward in medium term. Will also involve current tennant. Developable
M 92 0 92 0 40 52 0 0 0 0 0 0 0 0 0 0 0 0 0 0 0 0 92A 40 0 40 0 20 20 0 0 0 0 0 0 0 0 0 0 0 0 0 0 0 0 40Total 132 0 132 0 60 72 0 0 0 0 0 0 0 0 0 0 0 0 0 0 0 0 132
5.17 295 Histon Road 0.7 U/K 32 0 32 0 0 0 0 12 20 0 0 0 0 0 0 0 0 0 0 0 0 0 32 X Y Y
5.18 Sandy Lane 0.6 U/K 23 0 23 0 10 13 0 0 0 0 0 0 0 0 0 0 0 0 0 0 0 0 23 Y Y Y Site cleared for development
5.20 06/0794 Netherhall School, Queen Edith's Way U/K 0 0 0 0 0 0 0 0 0 0 0 0 0 0 0 0 0 0 0 0 0 0 0 X X X
7.01 10/1090 110 Newmarket Road
0.46 (includes sites below) U/K 2 2 0 0 0 0 0 0 0 0 0 0 0 0 0 0 0 0 0 0 0 0 0 Completed in 2010/11
7.01 10/1067 23-29 Occupation RoadSee Above U/K 14 0 14 14 0 0 0 0 0 0 0 0 0 0 0 0 0 0 0 0 0 0 0 Y Y Y Under Construction
7.01 12/0628 30-31 Occupation RoadSee Above U/K 13 0 13 0 0 13 0 0 0 0 0 0 0 0 0 0 0 0 0 0 0 0 0 Y Y Y
7.01 09/0743 20 Occupation RoadSee Above U/K 5 0 5 5 0 0 0 0 0 0 0 0 0 0 0 0 0 0 0 0 0 0 0 Y Y Y Under Construction
7.01 11/1097 71-73 New StreetSee Above U/K 6 0 6 0 0 0 6 0 0 0 0 0 0 0 0 0 0 0 0 0 0 0 6 Y Y Y
7.01 11/0219 9-15 Harvest WaySee Above U/K 102 0 102 0 72 30 0 0 0 0 0 0 0 0 0 0 0 0 0 0 0 0 102 Y Y Y
Total - Site 7.01 142 2 140 19 72 43 6 0 0 0 0 0 0 0 0 0 0 0 0 0 0 0 1087.02 06/0552 Betjemen House, Hills Road 0.7 U/K 156 0 156 0 0 56 50 50 0 0 0 0 0 0 0 0 0 0 0 0 0 0 156 Y Y Y
7.03 Coldhams Lane/Newmarket Road 0.47 U/K 0 0 0 0 0 0 0 0 0 0 0 0 0 0 0 0 0 0 0 0 0 0 0 Y Y X
Hotel application approved on part of the site, housing not likely to come forward on remainder.
7.04 Mitcham's Corner (remainder of site) 0.7 U/K 0 0 0 0 0 0 0 0 0 0 0 0 0 0 0 0 0 0 0 0 0 0 0 X Y XExpected to be developed as retail and student accomodation
7.06 West Cambridge Site, Madingley Road 66.9 U/K 0 0 0 0 0 0 0 0 0 0 0 0 0 0 0 0 0 0 0 0 0 0 0 X Y XNo intention to develop further residential units
7.07 Leckhampton House Grounds 2.94 U/K 0 0 0 0 0 0 0 0 0 0 0 0 0 0 0 0 0 0 0 0 0 0 0 X Y X
7.09 Grange Farm off Wilberforce Road 0.2 U/K 0 0 0 0 0 0 0 0 0 0 0 0 0 0 0 0 0 0 0 0 0 0 0 Y Y YPossibility for use as student accommodation
M 90 0 90 0 0 0 0 30 30 30 0 0 0 0 0 0 0 0 0 0 0 0 90
A 60 0 60 0 0 0 0 20 20 20 0 0 0 0 0 0 0 0 0 0 0 0 60Total 150 0 150 0 0 0 0 50 50 50 0 0 0 0 0 0 0 0 0 0 0 0 150
7.1109/0181, 09/0179 & 11/0327 Brunswick Site 0.8 U/K 205 15 190 180 10 0 0 0 0 0 0 0 0 0 0 0 0 0 0 0 0 0 10 Y Y Y Under Construction
7.12 Magnet Warehouse, Mill Road 0.6 U/K 50 0 50 0 0 0 0 0 0 20 20 10 0 0 0 0 0 0 0 0 0 0 50 Y Y Y
9.14 64-66 Peverel Road 1.4 U/K 10 0 10 0 0 0 0 0 0 10 0 0 0 0 0 0 0 0 0 0 0 0 10 Y Y X
gProtected Open Space. Council has no intention of developing. Remainder of site only 0.3ha housing numbers have been reduced to 10 units
9.02 08/0165Downing College, Athletic Ground, Long Road 1.5 U/K 100 100 0 0 0 0 0 0 0 0 0 0 0 0 0 0 0 0 0 0 0 0 0 Completed in 2011/12
M 106 0 106 0 50 37 19 0 0 0 0 0 0 0 0 0 0 0 0 0 0 0 106A 63 0 63 0 40 23 0 0 0 0 0 0 0 0 0 0 0 0 0 0 0 0 63Total 169 0 169 0 90 60 19 0 0 0 0 0 0 0 0 0 0 0 0 0 0 0 169M 98 0 98 0 0 0 50 27 21 0 0 0 0 0 0 0 0 0 0 0 0 0 98A 64 0 64 0 0 0 40 11 13 0 0 0 0 0 0 0 0 0 0 0 0 0 64Total 162 0 162 0 0 0 90 38 34 0 0 0 0 0 0 0 0 0 0 0 0 0 162
Total - Station Area 331 0 331 0 90 60 109 38 34 0 0 0 0 0 0 0 0 0 0 0 0 0 3312725 317 2408 304 400 371 261 269 240 254 80 18 33 116 62 0 0 0 0 0 0 0 2091
* Figures in the Reporting Year column are not actual completion figures 1541
Land not available until current leases expire
Under construction
Lead development partner needs to be selected and masterplan to be developed and planning applications to be approved before development starts.
YYY Under Construction
YYY
YYX
YYY
Total - Sites Allocated in the Local Plan
YYY
YYY0.3Station Area12/0964/REM9.10 + 9.15
7.3Station Area - Blue Phase08/02669.10 + 9.15
0.8Land Around 16 Mill Lane7.10
0.9Junction of Cherry Hinton & Hills Road08/05055.16
Five Year Supply Total
Sites Allocated in the Local Plan
3CUP Site Clarendon Road06/05845.01
2.7The Paddocks Trading Estate, Cherry Hinton Road5.02

Application Number Site Name and Address
Size (ha)
Market or Affordable
Target number of dwellings on site
Built to date
Outstanding dwellings (12/13-30/31)
Reporting Year 12/13*
13/14 year 1
14/15 year 2
15/16 year 3
16/17 year 4
17/18 year 5 18/19 19/20 20/21 21/22 22/23 23/24 24/25 25/26 26/27 27/28 28/29 29/30 30/31
Total (13/14-30/31) A
vaila
bilit
y
Suita
bilit
y
Ach
ieva
bilit
y
Comments
M 100 0 100 0 20 40 40 0 0 0 0 0 0 0 0 0 0 0 0 0 0 0 100
A 43 0 43 0 43 0 0 0 0 0 0 0 0 0 0 0 0 0 0 0 0 0 43143 0 143 0 63 40 40 0 0 0 0 0 0 0 0 0 0 0 0 0 0 0 143
06/1257 George Nutall Close 2 U/K 182 182 0 0 0 0 0 0 0 0 0 0 0 0 0 0 0 0 0 0 0 0 0 Completed 2011/12
02/0999, 06/527, 06/524
Government Offices, Brooklands Avenue 6.35 U/K 390 357 33 19 14 0 0 0 0 0 0 0 0 0 0 0 0 0 0 0 0 0 14 Y Y Y
07/1093Homerton College, Hills Road 1.4 U/K 85 0 85 0 0 0 25 30 30 0 0 0 0 0 0 0 0 0 0 0 0 0 85 Y Y Y
800 539 261 19 77 40 65 30 30 0 0 0 0 0 0 0 0 0 0 0 0 0 242* Figures in the Reporting Year column are not actual completion figures 242Five Year Supply Total
Large Sites Over 50
Total - Large Sites Over 50
1.2Cambridge Water Company, Rustat Road
07/1223/REM & 05/1336/OUT Y Y Y

Application Number Site Name and Address Size (ha)
Market or Affordable
Target number of dwellings on site
Built to date
Outstanding dwellings (12/13-30/31)
Reporting Year 12 /13*
13/14 year 1
14/15 year 2
15/16 year 3
16/17 year 4
17/18 year 5 18/19 19/20 20/21 21/22 22/23 23/24 24/25 25/26 26/27 27/28 28/29 29/30 30/31
Total (13/14-30/31) A
vaila
bilit
y
Suita
bilit
y
Ach
ieva
bilit
y
Comments10/0087/FUL 89a Cherry Hinton Road U/K 14 0 14 0 0 0 14 0 0 0 0 0 0 0 0 0 0 0 0 0 0 0 14 X Y Y
M 28 0 28 0 28 0 0 0 0 0 0 0 0 0 0 0 0 0 0 0 0 0 28 Y Y YA 12 0 12 0 12 0 0 0 0 0 0 0 0 0 0 0 0 0 0 0 0 0 12 Y Y Y
40 0 40 0 40 0 0 0 0 0 0 0 0 0 0 0 0 0 0 0 0 0 4008/0982 35 Parkside 0.1 U/K 12 12 0 0 0 0 0 0 0 0 0 0 0 0 0 0 0 0 0 0 0 0 0 Completed 2011/12
08/0016 Land to the Rear of 99-105 Shelford Road U/K 14 14 0 0 0 0 0 0 0 0 0 0 0 0 0 0 0 0 0 0 0 0 0 Completed 2011/1209/0967 13 Chesterton Road U/K 12 12 0 0 0 0 0 0 0 0 0 0 0 0 0 0 0 0 0 0 0 0 0 Completed 2011/12
09/0819Land Adjacent to 5 Wellington Court Cambridge U/K 14 14 0 0 0 0 0 0 0 0 0 0 0 0 0 0 0 0 0 0 0 0 0 Completed 2011/12
09/0494 Simons House, Rackham House U/K 40 40 0 0 0 0 0 0 0 0 0 0 0 0 0 0 0 0 0 0 0 0 0 Completed 2011/1211/0545 The Old Maltings, Prospect Row U/K 10 0 10 10 0 0 0 0 0 0 0 0 0 0 0 0 0 0 0 0 0 0 0 Y Y Y Under Construction
05/1329Sorrento Hotel: 190-196 Cherry Hinton Road 0.2 U/K 16 2 14 0 0 0 0 0 0 14 0 0 0 0 0 0 0 0 0 0 0 0 14 X Y Y
11/0596 141 Ditton Walk, Cambridge 0.34 U/K 14 0 14 0 0 0 0 0 0 14 0 0 0 0 0 0 0 0 0 0 0 0 14 X Y Y Application permitted
11/0970Seymour Court, Seymour Street, Cambridge, CB1 3DL U/K 34 0 34 0 34 0 0 0 0 0 0 0 0 0 0 0 0 0 0 0 0 0 34 Y Y Y Application permitted
11/0955 100-108 Shelford Road U/K 13 0 13 0 13 0 0 0 0 0 0 0 0 0 0 0 0 0 0 0 0 0 13 Y Y Y Application permitted12/0321 190-192 Histon Road U/K 14 0 14 0 14 0 0 0 0 0 0 0 0 0 0 0 0 0 0 0 0 0 14 Y Y Y Under construction
247 94 153 10 101 0 14 0 0 28 0 0 0 0 0 0 0 0 0 0 0 0 143* Figures in the Reporting Year column are not actual completion figures 115
Small Sites: 10-49 Dwellings
Five Year Supply TotalTotal - Small Sites 10-49 dwellings
09/0403 Neath Farm Business Park, Church End 0.9

Target number of dwellings on site
Built to date
Outstanding dwellings (12/13-30/31)
Reporting Year 12/13
13/14 year 1
14/15 year 2
15/16 year 3
16/17 year 4
17/18 year 5 18/19 19/20 20/21 21/22 22/23 23/24 24/25 25/26 26/27 27/28 28/29 29/30 30/31
Total (13/14-31/32)
Urban Extensions 7175 84 7091 358 707 1431 1347 1249 818 660 321 160 40 0 0 0 0 0 0 0 0 0 6733Sites Allocated in the Local Plan 2725 317 2408 304 400 371 261 269 240 254 80 18 33 116 62 0 0 0 0 0 0 0 2091Large Sites Over 50 800 539 261 19 77 40 65 30 30 0 0 0 0 0 0 0 0 0 0 0 0 0 242Small Sites 10-49 Dwellings 247 94 153 10 101 0 14 0 0 28 0 0 0 0 0 0 0 0 0 0 0 0 28Total 10947 1034 9913 691 1285 1842 1687 1548 1088 942 401 178 73 116 62 0 0 0 0 0 0 0 9094
7450
700 700 700 700 700585 1142 987 848 388
721 721 721 721 721
564 1121 966 827 3673845
01/02 02/03 03/04 04/05 05/06 06/07 07/08 08/09 09/10 10/11 11/12
Reporting Year 12/13
13/14 year 1
14/15 year 2
15/16 year 3
16/17 year 4
17/18 year 5 18/19 19/20 20/21 21/22 22/23 23/24 24/25 25/26 26/27 27/28 28/29 29/30 30/31 Totals
Total Completions - Indicators H2 (a & b) 159 287 505 601 731 629 521 588 288 390 331 5030Cumulative Completions 159 446 951 1552 2283 2912 3433 4021 4309 4699 5030Projected Completions - Indicator H2c 691 1285 1842 1687 1548 1088 942 401 178 73 116 62 0 0 0 0 0 0 0 9913
Cumulative Future Completions 691 1976 3818 5505 7053 8141 9083 9484 9662 9735 9851 9913 9913 9913 9913 9913 9913 9913 9913Cumulative Actual & Future Completions (H2 a & b + H2c) 159 446 951 1552 2283 2912 3433 4021 4309 4699 5030 5721 7006 8848 10535 12083 13171 14113 14514 14692 14765 14881 14943 14943 14943 14943 14943 14943 14943 14943
Revised RSS Housing Target Year on Year from April 2011 to March 2031 (14,000 divided by 20 years = 700pa) Draft East Of England Plan 2010 700 700 700 700 700 700 700 700 700 700 700 700 700 700 700 700 700 700 700 700 14000Cumulative RSS Residual 700 1400 2100 2800 3500 4200 4900 5600 6300 7000 7700 8400 9100 9800 10500 11200 11900 12600 13300 14000Annual Difference From Annual RSS Requirement for Projected Completions (H2 c) -369 -9 585 1142 987 848 388 242 -299 -522 -627 -584 -638 -700 -700 -700 -700 -700 -700 -700 -3756
1) Cumulative completions actual and projected 331 1022 2307 4149 5836 7384 8472 9414 9815 9993 10066 10182 10244 10244 10244 10244 10244 10244 10244 10244 102442) Residual required completions based on past completions actual and predicted 13669 12978 11693 9851 8164 6616 5528 4586 4185 4007 3934 3818 3756 3756 3756 3756 3756 3756 3756 3756 37563) Cumulative required completions 700 1400 2100 2800 3500 4200 4900 5600 6300 7000 7700 8400 9100 9800 10500 11200 11900 12600 13300 14000 140004) Residual required annual completions based on past completions actual and predicted 700 719 721 688 616 544 473 425 382 380 401 437 477 537 626 751 939 1252 1878 3756 3756
5) Cumulative under/oversupply -369 -378 207 1349 2336 3184 3572 3814 3515 2993 2366 1782 1144 444 -256 -956 -1656 -2356 -3056 -3756 -3756
Note that the difference between this housing trajectory and the County Council monitoring data, which shows commitments of 10,366 at March 2012, is due this housing trajectory not including data for sites of under 10 dwellings.
As demonstrated through the Housing Trajectory Summary table no new development has been identified after 2024/25. The emergence of new planning applications over future years and work undertaken as part of the Local Plan review to identify new housing allocation sites enable the Council to cover this future under supply. The Housing Trajectory only identifies potential new developments over 10 dwellings and therefore it is also expected that smaller developments will also help to meet future housing completions.
Previous years completions and predicted totals
Core Output Indicators
Regional Spatial Strategy
Housing Trajectory Summary 2011/12 to 2030/31
Housing Trajectory Summary Tables
Managed Delivery Target in relation to draft RSS target (H2 d)
Work Undertaken in 2010 in connection with updating the RSS housing targets concluded that a lower forecast was more achievable with 14,000 new homes being provided in Cambridge between April 2011 and March 2031. This level of provision was agreed by the Cambridgeshire Local Authorities in a joint statement which was reported to members in October 2010. This figure has been adopted in this years trajectory as being a more realistic estimate of the likely level of future housing delivery.
Revised RSS Housing Target - Year on Year from April 2011 to March 2031 (14,000 divided by 20 years = 700pa) Draft East Of England Plan 2010
Housing Trajectory Five Year Supply Total
Housing Trajectory Under/Over Supply in relation to RSS Target
Total Five Year Under/Over Supply 2012/13 - 16/17
Revised RSS Housing Target - Year on Year from April 2011 to March 2031 (14,000 divided by 20 years = 700pa) Draft East Of England Plan 2010. Taking it into account past completionsHousing Trajectory Under/Over Supply in relation to RSS Target taking into account past completions

2
Annual Monitoring Report 2012 - 81 -
Appendix E – Housing Summary Introduction 1. How many houses were proposed in the Adopted 2008 East Of England Plan
(Regional Spatial Strategy)?
The adopted 2008 Regional Spatial Strategy for the East of England proposed to continue the approach to housing apportionment set out in the Structure Plan. It proposed 19,000 dwellings minimum in Cambridge between 2001-2021. The Council has always objected to this level of provision, as it was unachievable by 2021.
2. What did preparatory work on the RSS Review 2009 reveal?
At the start of the RSS review process, EERA asked all the County Councils to test higher levels of growth than in the existing RSS for the period 2011 to 2031 as part of their input to the early stages of the review. Cambridgeshire County Council invited all the Districts to join with it in preparing its advice to EERA and formed a member group CReSSP to oversee its work. The Cambridgeshire authorities responded to EERA's request by commissioning consultants to prepare a new Cambridgeshire Development Study. That study, which was completed in the spring of 2009, looked at how well the existing strategy was working and how the strategy could be developed if further growth was needed. EERA consulted on the RSS Review “East of England Plan > 2031” between 2nd September and 24th November 2009. Cambridgeshire County Council through CReSSP made a joint response to the EERA consultation. This response was agreed in a report to a DPSG on 17th November 2009. This proposed a figure of 14,000 dwellings to be built in Cambridge (700 dwellings per year) between 2011 and 2031. This level of provision is one which is much more realistic than the adopted RSS target of 19,000 to 2021. It is also supported by the findings of the 2009 Cambridgeshire Development Study.
3. What is the Cambridgeshire Local Authorities Agreement?
In May and June 2010, the Government issued statements saying that Regional Spatial Strategies (RSSs) are to be revoked. This is to be implemented through the adoption of the Localism Bill. In the light of this Cambridgeshire Local Authorities agreed a joint position statement setting out the development Strategy for Cambridgeshire. For Cambridge this agreement suggested replacing the 19,000 dwelling target in the 2008 adopted RSS for the period 2001-2021 with one of 14,000 dwellings for the period 2011-2031. The RSS is technically still in place but our 2010 & 2011 Annual

2
Annual Monitoring Report 2012 - 82 -
Appendix E – Housing Summary Monitoring Report uses the 14,000 figure as a more realistic assumption of future provision by 2031. The above figures are a starting point for the Local Plan Review process, which also consider a wide range of other evidence. Evidence from the SHLAA will also inform this.
4. How many homes does the current Draft Strategic Housing Land Availability Assessment provide?
The Draft Strategic Housing Land Availability Assessment (SHLAA) for Cambridge is at an early stage and is currently out to public consultation. This will form our key evidence for the amount of housing that can be accommodated in Cambridge. Initial indications are that these sites could provide potential for around 1,770 dwellings by 2031. The consultation ran for six weeks from 30th September to 11th November and sought information on any additional provision land owners may wish to draw to our attention and we will rigorously assess any sites put forward as part of finalising the SHLAA which will come back to Councillors in 2012 for final approval.
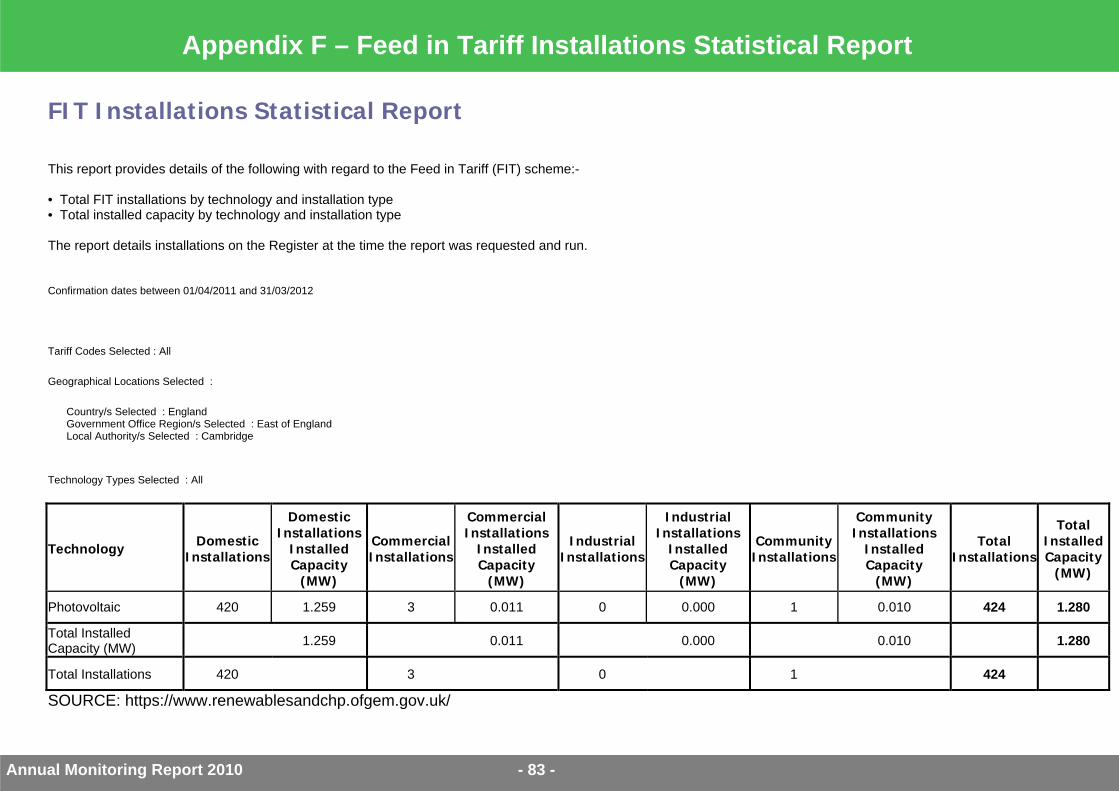
Appendix F – Feed in Tariff Installations Statistical Report
Annual Monitoring Report 2010 - 83 -
FIT Installations Statistical Report This report provides details of the following with regard to the Feed in Tariff (FIT) scheme:- • Total FIT installations by technology and installation type • Total installed capacity by technology and installation type The report details installations on the Register at the time the report was requested and run.
Confirmation dates between 01/04/2011 and 31/03/2012
Tariff Codes Selected : All
Geographical Locations Selected :
Country/s Selected : England Government Office Region/s Selected : East of England Local Authority/s Selected : Cambridge
Technology Types Selected : All
Technology Domestic Installations
Domestic Installations
Installed Capacity
(MW)
CommercialInstallations
CommercialInstallations
Installed Capacity
(MW)
Industrial Installations
Industrial Installations
Installed Capacity
(MW)
CommunityInstallations
Community Installations
Installed Capacity
(MW)
Total Installations
Total Installed Capacity
(MW)
Photovoltaic 420 1.259 3 0.011 0 0.000 1 0.010 424 1.280 Total Installed Capacity (MW) 1.259 0.011 0.000 0.010 1.280 Total Installations 420 3 0 1 424 SOURCE: https://www.renewablesandchp.ofgem.gov.uk/

Appendix G – Cambridge East Indicators (extract from Cambridge East Area Action Plan)
Annual Monitoring Report 2012 - 84 -
Objective B/a: To create a new and distinctive sustainable community on the eastern edge of Cambridge which will enhance the special character of the City and its setting and is connected to the rest of the City by high quality public transport and non-motorised modes of transport.
Indicator Number Indicator Type of Indicator
Related Chapter Objectives
Related Policies Targets
CE01 Total Housing Completions / Annual Rate
Core D3/a CE/7 To provide an adequate and continuous supply of land for housing development for (1) approximately 10,000-12,000 dwellings at the Cambridge East site as a whole before 2016, and (2) approximately 1,500-2,000 dwellings by 2016. The total housing completions and annual rate of completions for Cambridge East will be monitored through the Cambridge East housing trajectory.
CE02 Housing Density Core D3/b CE/7 At least 50 dwellings per hectare
CE03 Housing Mix Core D3/c CE/7 No specific target - Cambridge East should provide a mix of housing sizes that address the level of need for smaller 1 and 2 bedroom homes in the Cambridge area whilst at the same time creating a balanced community for the long term.
CE04 Employment Land Supply by type Core D4/a, D4/b CE/8 Equivalent of 20-25 hectares of employment land.
CE05 Distance to Public Transport Local D6/d, D7/I CE/11 All development within 600m of a stop on dedicated local busway or 400m of other local bus stops. The Total housing completions and annual rate of completions for Cambridge East will be monitored through the Cambridge East housing trajectory.
CE06 Distance to public Open Space Local D10/b CE/20 Formal sports pitches within15 minutes walk; No home more than one minute’s walk (i.e. 100m actual walk distance) from a LAP; no home more than five minutes walk (i.e. 400m actual walk distance) from a LEAP; no home more than 15 minutes walk (i.e. 1,000m actual walk distance) from a NEAP or SIP.
CE07 Renewable energy installed by type Core D13/e CE/24 Renewable energy to provide at least 10% of predicted energy requirements
CE08 Investment secured for infrastructure and community facilities through developer contributions.
Core E2/a, D5/c CE/35, CE/9
Targets to be detailed through s.46 agreement or planning obligations.

Appendix H – North West Cambridge Indicators (extract from North West Cambridge AAP)
Annual Monitoring Report 2012 - 85 -
Indicator Number Indicator Type of Indicator
Related Preferred Policy Options Targets
NWC01 Total no. of: (1) Units of student accommodation
completed (2) Housing Completions / Annual
Rate
Core NW5 To provide an adequate supply of land for housing for development (1) for 2,000 university students, and (2) for 3,000 open market and affordable dwellings. The total housing completions and annual rate of completions for North West Cambridge will be monitored against the North West Cambridge AAP housing trajectory in each Council’s Annual Monitoring Report.
NWC02 Housing Density Core NW5 At least 50 dwellings per hectare average net density.
NWC03 Percentage of Housing which is Affordable
Core NW6 At least 50% affordable housing must be provided to meet the needs of Cambridge University and College key workers.
NWC04 Employment Land Supply by type Core NW8, NW10 (1) 100,000m² of employment and academic development; (2) Approximately 60,000m2 of higher education uses, including academic faculty development and a University Conference Centre, within Use Class D1.
NWC05 Employment Uses in the Local Centre
Core NW9 100% of completed development for B1 uses in the local centre in units not exceeding 300m2.
NWC06 Distance to Public Transport Local NW16 Majority of development within 400m of a bus stop.
NWC07 Amount (and percentage) of completed non-residential development complying with car parking standards
Core NW19 Car parking standards are set out in Appendices 1 and 2 of the North West Cambridge AAP.
NWC08 Public Open Space and Recreation Facilities
Local NW23 Standards for provision of public open space and recreation facilities are set out in Appendix 3 of the North West Cambridge AAP Protection of Traveller’s Rest Pit SSSI and surrounding geodiversity.

Appendix H – North West Cambridge Indicators (extract from North West Cambridge AAP)
Annual Monitoring Report 2012 - 86 -
Indicator Number Indicator Type of Indicator
Related Preferred Policy Options Targets
NWC09 Sustainable Development Local NW24 Amount of Residential development designed in line with the Code for Sustainable Homes: (1) Percentage approved on or before 31 March 2013 designed to
meet Code level 4 or higher, up to a maximum of 50 dwellings; (2) Percentage approved after 1 April 2013, designed to Code level
5 or higher. Amount of Non-residential development designed in line with BREEAM: (1) Percentage approved designed to “Excellent” standards.
NWC10 Renewable energy installed by type Core NW24 (1) Percentage of the non-residential development and student accommodation energy requirements provided by renewable energy (at least 20% required if renewable CHP is not viable);
(2) Percentage of the development served by a Combined Heat and Power (CHP) plant or a District Heating Scheme fuelled by renewable energy sources.
NWC11 Water Conservation Local NW24 (1) Percentage of residential development approved pm pr before 31 March 2013 which reduces water consumption by 30%, based on 2006 per capita levels; and
(2) Percentage of residential development approved after 1 April 2013, which reduces water consumption by 47% based on 2006 per capita levels.
NWC12 Investment secured for infrastructure and community facilities through developer contributions.
Core NW31 Targets points set out in S106 agreements or planning obligations.
Appendix I – Use Classes Order
Annual Monitoring Report 2012 - 87 -
The Town and Country Planning (Use Classes) (Amendment) (England) Order 2010 came into force on 6th April 2010 and puts uses of land and buildings into various categories known as 'Use Classes'.
Use Class Description A1 Shops Shops, retail warehouses, hairdressers, undertakers, travel and
ticket agencies, post offices (but not sorting offices), pet shops, sandwich bars, showrooms, domestic hire shops, dry cleaners, funeral directors and internet cafes.
A2 Financial and professional services
Financial services such as banks and building societies, professional services (other than health and medical services) including estate and employment agencies and betting offices.
A3 Restaurants and cafés
For the sale of food and drink for consumption on the premises - restaurants, snack bars and cafes.
A4 Drinking establishments
Public houses, wine bars or other drinking establishments (but not night clubs).
A5 Hot food takeaways
For the sale of hot food for consumption off the premises.
B1 Business Offices (other than those that fall within A2), research and development of products and processes, light industry appropriate in a residential area.
B2 General Industrial Use for industrial process other than one falling within class B1 (excluding incineration purposes, chemical treatment or landfill or hazardous waste).
B8 Storage or distribution
This class includes open air storage.
C1 Hotels Hotels, boarding and guest houses where no significant element of care is provided (excludes hostels).
C2 Residential institutions
Residential care homes, hospitals, nursing homes, boarding schools, residential colleges and training centres.
C2A Secure residential institution
Use for a provision of secure residential accommodation, including use as a prison, young offenders institution, detention centre, secure training centre, custody centre, short term holding centre, secure hospital, secure local authority accommodation or use as a military barracks.
C3 Dwellinghouses This class is formed of 3 parts: C3(a) covers use by a single person or a family (a couple whether
married or not, a person related to one another with members of the family of one of the couple to be treated as members of the family of the other), an employer and certain domestic employees (such as an au pair, nanny, nurse, governess, servant, chauffeur, gardener, secretary and personal assistant), a carer and the person receiving the care and a foster parent and foster child.
C3(b) up to six people living together as a single household and receiving care e.g. supported housing schemes such as those for people with learning disabilities or mental health problems.

Appendix I – Use Classes Order
Annual Monitoring Report 2012 - 88 -
Use Class Description C3(c) allows for groups of people (up to six) living together as a single
household. This allows for those groupings that do not fall within the C4 HMO definition, but which fell within the previous C3 use class, to be provided for i.e. a small religious community may fall into this section as could a homeowner who is living with a lodger.
C4 Houses in multiple occupation
small shared dwelling houses occupied by between three and six unrelated individuals, as their only or main residence, who share basic amenities such as a kitchen or bathroom.
D1 Non-residential institutions
Clinics, health centres, crèches, day nurseries, day centres, schools, art galleries (other than for sale or hire), museums, libraries, halls, places of worship, church halls, law court. Non residential education and training centres.
D2 Assembly and leisure
Cinemas, music and concert halls, bingo and dance halls (but not night clubs), swimming baths, skating rinks, gymnasiums or area for indoor or outdoor sports and recreations (except for motor sports, or where firearms are used).
Sui Generis Certain uses do not fall within any use class and are considered 'sui generis'. Such uses include: theatres, houses in multiple occupation, hostels providing no significant element of care, scrap yards. Petrol filling stations and shops selling and/or displaying motor vehicles. Retail warehouse clubs, nightclubs, launderettes, taxi businesses, amusement centres and casinos.
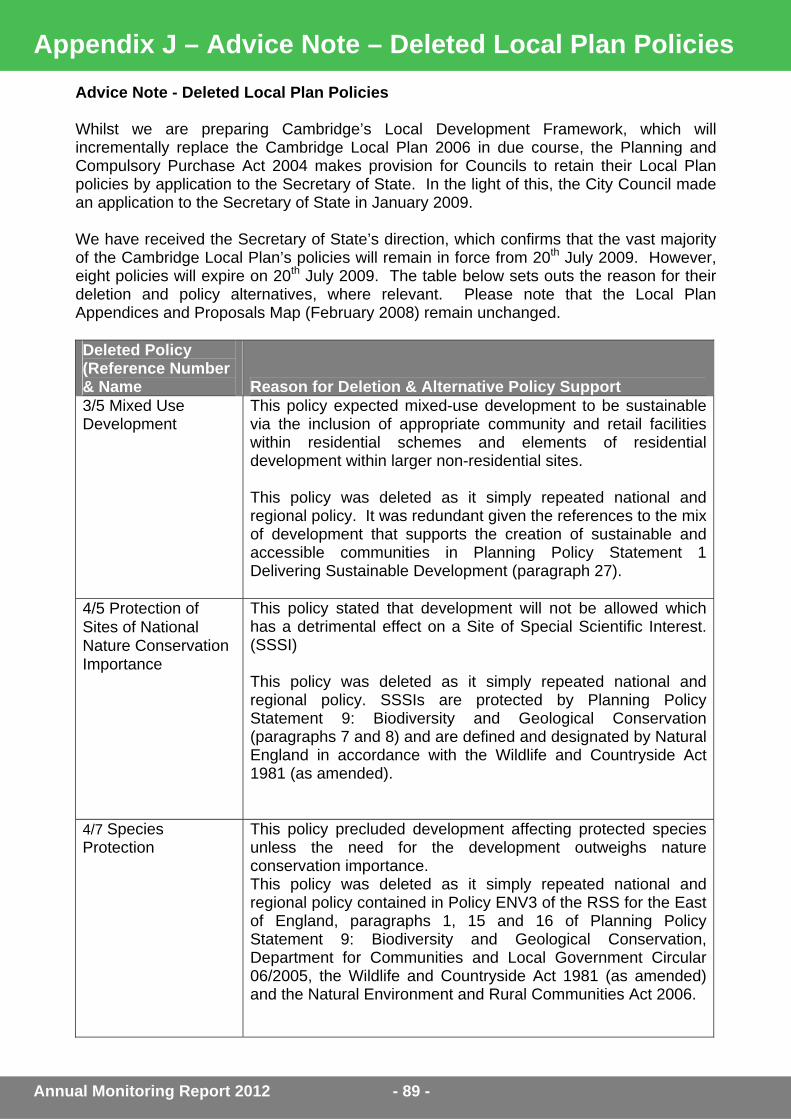
Annual Monitoring Report 2012 - 89 -
Appendix J – Advice Note – Deleted Local Plan Policies Advice Note - Deleted Local Plan Policies Whilst we are preparing Cambridge’s Local Development Framework, which will incrementally replace the Cambridge Local Plan 2006 in due course, the Planning and Compulsory Purchase Act 2004 makes provision for Councils to retain their Local Plan policies by application to the Secretary of State. In the light of this, the City Council made an application to the Secretary of State in January 2009. We have received the Secretary of State’s direction, which confirms that the vast majority of the Cambridge Local Plan’s policies will remain in force from 20th July 2009. However, eight policies will expire on 20th July 2009. The table below sets outs the reason for their deletion and policy alternatives, where relevant. Please note that the Local Plan Appendices and Proposals Map (February 2008) remain unchanged. Deleted Policy (Reference Number & Name Reason for Deletion & Alternative Policy Support 3/5 Mixed Use Development
This policy expected mixed-use development to be sustainable via the inclusion of appropriate community and retail facilities within residential schemes and elements of residential development within larger non-residential sites. This policy was deleted as it simply repeated national and regional policy. It was redundant given the references to the mix of development that supports the creation of sustainable and accessible communities in Planning Policy Statement 1 Delivering Sustainable Development (paragraph 27).
4/5 Protection of Sites of National Nature Conservation Importance
This policy stated that development will not be allowed which has a detrimental effect on a Site of Special Scientific Interest. (SSSI) This policy was deleted as it simply repeated national and regional policy. SSSIs are protected by Planning Policy Statement 9: Biodiversity and Geological Conservation (paragraphs 7 and 8) and are defined and designated by Natural England in accordance with the Wildlife and Countryside Act 1981 (as amended).
4/7 Species Protection
This policy precluded development affecting protected species unless the need for the development outweighs nature conservation importance. This policy was deleted as it simply repeated national and regional policy contained in Policy ENV3 of the RSS for the East of England, paragraphs 1, 15 and 16 of Planning Policy Statement 9: Biodiversity and Geological Conservation, Department for Communities and Local Government Circular 06/2005, the Wildlife and Countryside Act 1981 (as amended) and the Natural Environment and Rural Communities Act 2006.
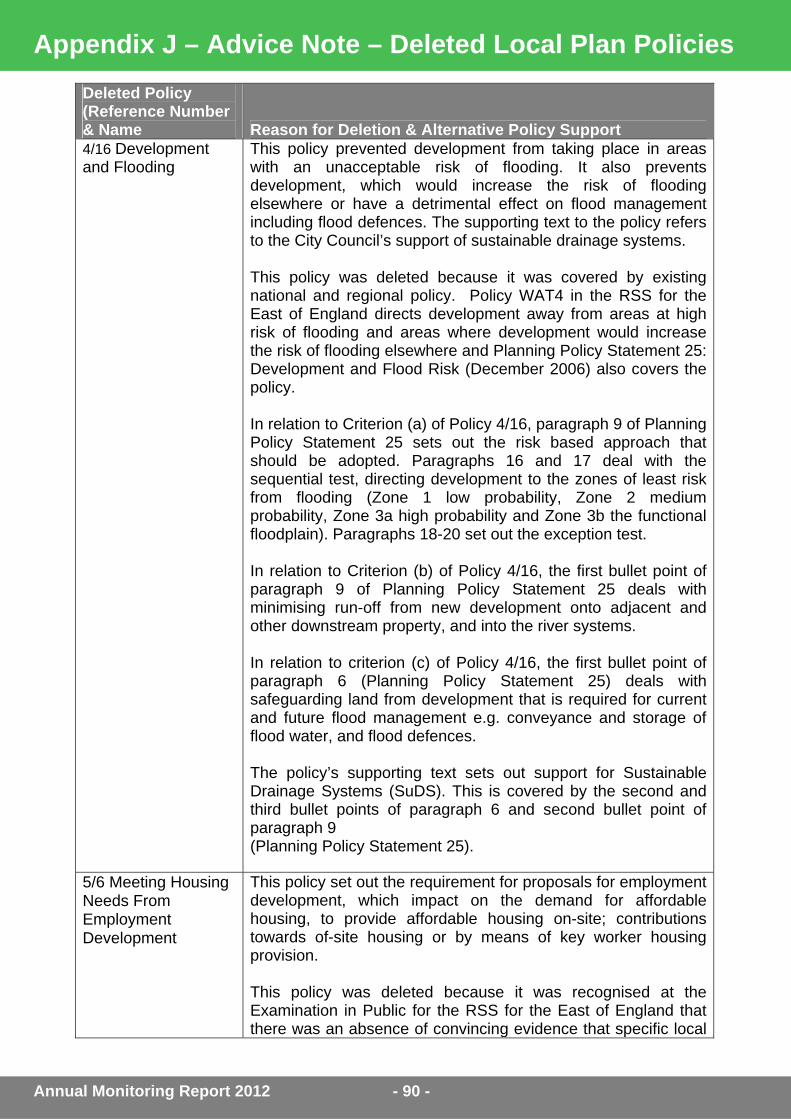
Annual Monitoring Report 2012 - 90 -
Appendix J – Advice Note – Deleted Local Plan Policies Deleted Policy (Reference Number & Name Reason for Deletion & Alternative Policy Support 4/16 Development and Flooding
This policy prevented development from taking place in areas with an unacceptable risk of flooding. It also prevents development, which would increase the risk of flooding elsewhere or have a detrimental effect on flood management including flood defences. The supporting text to the policy refers to the City Council’s support of sustainable drainage systems. This policy was deleted because it was covered by existing national and regional policy. Policy WAT4 in the RSS for the East of England directs development away from areas at high risk of flooding and areas where development would increase the risk of flooding elsewhere and Planning Policy Statement 25: Development and Flood Risk (December 2006) also covers the policy. In relation to Criterion (a) of Policy 4/16, paragraph 9 of Planning Policy Statement 25 sets out the risk based approach that should be adopted. Paragraphs 16 and 17 deal with the sequential test, directing development to the zones of least risk from flooding (Zone 1 low probability, Zone 2 medium probability, Zone 3a high probability and Zone 3b the functional floodplain). Paragraphs 18-20 set out the exception test. In relation to Criterion (b) of Policy 4/16, the first bullet point of paragraph 9 of Planning Policy Statement 25 deals with minimising run-off from new development onto adjacent and other downstream property, and into the river systems. In relation to criterion (c) of Policy 4/16, the first bullet point of paragraph 6 (Planning Policy Statement 25) deals with safeguarding land from development that is required for current and future flood management e.g. conveyance and storage of flood water, and flood defences. The policy’s supporting text sets out support for Sustainable Drainage Systems (SuDS). This is covered by the second and third bullet points of paragraph 6 and second bullet point of paragraph 9 (Planning Policy Statement 25).
5/6 Meeting Housing Needs From Employment Development
This policy set out the requirement for proposals for employment development, which impact on the demand for affordable housing, to provide affordable housing on-site; contributions towards of-site housing or by means of key worker housing provision. This policy was deleted because it was recognised at the Examination in Public for the RSS for the East of England that there was an absence of convincing evidence that specific local

Annual Monitoring Report 2012 - 91 -
Appendix J – Advice Note – Deleted Local Plan Policies Deleted Policy (Reference Number & Name Reason for Deletion & Alternative Policy Support
circumstances existed to justify the imposition of the requirement as referred to in the Council’s Affordable Housing Supplementary Planning Document (SPD). The Affordable Housing SPD does not provide any further detail in taking this policy forward. The RSS for the East of England does not make specific reference to the need for employment development to provide for affordable housing and Policy P9/1 of the Cambridgeshire and Peterborough Structure Plan 2003 was not saved.
6/5 Shopping Development in the City Centre
This policy stated that retail proposals in the City Centre would only be permitted where they maintained and enhanced the vitality and viability of the City Centre and which were of an appropriate nature and scale. This policy was deleted because it reiterated national guidance in paragraphs 3.13 – 3.19 of Planning Policy Statement 6: Planning for Town Centres that require the application of sequential testing and proof that the development is of appropriate nature and scale. Additionally, paragraphs 3.20 - 3.23 of Planning Policy Statement 6 cover the need to consider the impact of the proposal on the vitality and viability of existing centres within the catchment area of the proposed development, including the likely cumulative effect of recent permissions, developments under construction and completed developments. It clarifies that the identification of need does not necessarily indicate that there will be no negative impact.
9/4 East Cambridge This policy set out the criteria for development at East Cambridge. This policy was deleted because it has been superseded by the Cambridge East, which was adopted by both Cambridge City Council and South Cambridgeshire District Council in February 2008.
10/2 Monitoring and Review
This policy set out the monitoring process for the Local Plan and identified review work and actions, which would be brought into play in the event that the Local Plan policies and development plan allocations were not being met. This policy was deleted because Section 35 of the Planning and Compulsory Purchase Act 2004 covers the need to monitor policies by making an annual report to the Secretary of State, which covers the implementation of the Local Development Scheme and the extent to which the policies set out in the local development documents are being achieved.

Annual Monitoring Report 2012 - 92 -
Appendix J – Advice Note – Deleted Local Plan Policies Deleted Policy (Reference Number & Name Reason for Deletion & Alternative Policy Support
Section 48 of the Town and Country Planning (Local Development) (England) Regulations 2004 covers the mechanisms that will be triggered if policies and allocations are not being met.
The North West Cambridge AAP was adopted in October 2009. As a result, the following Local Plan Policy and allocations were superseded:
• Policy 9/7 – Land between Madingley Road and Huntingdon Road • Proposal Site 9.07 – Madingley Road/Huntingdon Road • Proposal Site 9.11 – 19 Acre Field and land at Gravel Hill Farm

Bibliography
Annual Monitoring Report 2012 - 93 -
This bibliography includes: • Publications • Acts of Parliament, Statutory Instruments, White Papers, Guidance and Circulars • Online Articles and Data
Publications • Cambridge City Council, 2006a. Cambridge Local Plan – July 2006. Cambridge:
Cambridge City Council • Cambridge City Council, 2006b. Open Space and Recreation Strategy – November
2006. Cambridge: Cambridge City Council • Cambridge City Council, 2007.Sustainable Design & Construction: Supplementary
Planning Document – June 2007. Cambridge: Cambridge City Council • Cambridge City Council, 2007.Statement of Community Involvement: A
Consultation Strategy for Cambridge – September 2007. Cambridge: Cambridge City Council
• Cambridge City Council, 2008. Affordable Housing Supplementary Planning Document – January 2008. Cambridge: Cambridge City Council
• Cambridge City Council, 2010a.Old Press/Mill Lane Supplementary Planning Document – January 2010. Cambridge: Cambridge City Council
• Cambridge City Council, 2010b. Planning Obligations Strategy Supplementary Planning Document – March 2010. Cambridge: Cambridge City Council
• Cambridge City Council, 2010c. Public Art: Supplementary Planning Document – January 2010. Cambridge: Cambridge City Council
• Cambridge City Council, 2011a. Open Space and Recreation Strategy – October 2011. Cambridge: Cambridge City Council
• Cambridge City Council, 2011b. Eastern Gate Development Framework Supplementary Planning document – October 2011. Cambridge: Cambridge City Council
• Cambridge City Council, 2011c Advice note on Development Affecting Private Gardens – June 2011. Cambridge: Cambridge City Council.
• Cambridge City Council, 2011d Informal Planning Policy Guidance on Foodstore Provision in North West Cambridge - 2011. Cambridge: Cambridge City Council
• Cambridge City Council, 2012a Interim Planning Policy Guidance on the Protection of Public Houses in the City of Cambridge 2012. Cambridge: Cambridge City Council
• Cambridge City Council, 2012b Guidance for the application of Policy 3/13 (Tall Buildings and the Skyline) of the Cambridge Local Plan (2006): Cambridge City Council
• Cambridge City Council, 2012c Cambridge Hotel Futures: Headline Findings Issues and Options: Cambridge City Council
• Cambridge City Council and South Cambridgeshire District Council, 2008. Local Development Framework: Cambridge East Area Action Plan, Development Plan Document – Adopted February 2008. Cambourne: South Cambridgeshire District Council & Cambridge City Council
• Cambridge City Council & South Cambridgeshire District Council, 2009. North West Cambridge Area Action Plan: Local Development Plan Framework Development Plan Document – Adopted October 2009. Cambridge: Cambridge City Council
• Cambridge City Council & South Cambridgeshire District Council, 2012. Cambridge City & South Cambridgeshire District Council Joint Infrastructure Study 2012
• Cambridgeshire & Peterborough Environmental Records Centre (CPERC), 2012. Cambridgeshire & Peterborough Environmental Records Centre (CPREC) LDF

Bibliography
Annual Monitoring Report 2012 - 94 -
Annual Monitoring Report supporting information for Cambridge City Council – Reporting Year 2011/12. Cambridge: CPERC
• Cambridgeshire County Council, 2011. Local Transport Plan 3 - covering the period 2011 to 2026. Cambridge: Cambridgeshire County Council
• Cambridgeshire County Council and Peterborough City Council, 2003. Cambridgeshire & Peterborough Structure Plan 2003 – Planning for Success. Cambridgeshire: Cambridgeshire County Council and Peterborough City Council
• Cambridgeshire Horizons, 2009. Strategic Housing Market Assessment. Cambridge: Cambridge Horizons
• Cambridgeshire Horizons, 2011. Detailed Water Cycle Strategy up to 2031 Major Growth Areas in and around Cambridge: Phase 2 – Detailed Strategy. Cambridge: Cambridge Horizons
• Communities & Local Government, 2010. Community Infrastructure Levy: An Overview. London: CLG
• Communities & Local Government, 2011. How change of use is handled in the planning system – tell us what you think: Issues Paper. London: CLG – June 2011
• East of England Tourism, 2008. Economic Impact of Tourism: Cambridge – 2007. Bury St Edmunds: East of England Tourism.
• Government Office For The East Of England, 2008. East of England Plan: The Revision to the Regional Spatial Strategy for the East of England. London: TSO
• SQW, 2011. Cambridge Cluster at 50: Final Report to EEDA and Partners – March 2011. Cambridgeshire: SQW
• SQW, 2012 Cambridge and South Cambridgeshire Employment Land Review Update 2012. Cambridge: SQW.
• Transport Initiatives LLP and Cambridge City Council, 2010. First Edition February 2010: Cycle Parking Guide For New Residential Developments. Cambridge: Cambridge City Council
• Terence O’Rourke Ltd, 2010. Decarbonising Cambridge: A renewable and low carbon energy study for Cambridge City Council Final Report – September 2010. Cambridge: Terrence O’Rourke Ltd
• Warwick Business Management Limited, 2008. Cambridge City and South Cambridgeshire: Employment Land Review – July 2008. Cambridge: Cambridge City Council & South Cambridgeshire District Council
• WSP Development and Transportation, 2010. Cambridge and South Cambridgeshire Level 1 Strategic Flood Risk Assessment – September 2010. Cambridge City Council and South Cambridgeshire District Council.
Acts of Parliament, Statutory Instruments, White Papers, Guidance and Circulars
• Communities & Local Government, 2008a. Local Development Framework: Core
Output Indicators – Update2/2008. London: TSO • Communities & Local Government, 2008b. Planning Policy Statement 12: Local
Spatial Planning. London: TSO • Communities & Local Government, 2009a. Planning Policy Statement 4: Planning
for Sustainable Economic Growth. London: TSO • Communities & Local Government, 2010a. Planning Policy Statement 3: Housing.
London: Communities & Local Government • Communities & Local Government, 2010b. Planning Policy Statement 5: Planning
for the Historic Environment. London: TSO • Communities & Local Government, 2012. National Planning Policy Framework.
London CLG

Bibliography
Annual Monitoring Report 2012 - 95 -
• Office of the Deputy Prime Minister, 2005a. Local Development Framework Monitoring: A Good Practice Guide. London: ODPM
• Office of the Deputy Prime Minister, 2005b. ODPM Circular 05/2005. London: ODPM
• Planning & Compulsory Purchase Act 2004. (c.5) • The Town and Country Planning (General Permitted Development) Order 1995,
No.418 • The Town and Country Planning (Local Development) (England) Regulations 2004.
No.2204 • Planning Act 2008. (c.29) • Town and Country Planning Act 1990 (as amended). c.8 • Localism Act 2011 (c.20) • Community Infrastructure Levy Regulations 2010 (now amended by the Community
Infrastructure Levy (Amendment) Regulations 2011). Online Articles and Data
• Cambridge City Council, 2011a. Pre Application Advice [online] Cambridge:
Cambridge City Council. Available online at: http://www.cambridge.gov.uk/ccm/navigation/planning-and-building-control/planning/pre-application-and-planning-advice/ [Accessed November 2011]
• Cambridge City Council, 2011b. Conservation Area Appraisals [online] Cambridge: Cambridge City Council. Available online at: http://www.cambridge.gov.uk/ccm/navigation/planning-and-building-control/historic-environment-and-trees/conservation-areas/ [Accessed November 2011]
• Cambridgeshire County Council, 2006. Employment in the High-Tech “Community” Cambridgeshire & Peterborough 2006 [online] Cambridge: Cambridgeshire County Council. Available at: http://www.cambridgeshire.gov.uk/NR/rdonlyres/E394F26D-3925-4B75-AF95-BEF041B1BE82/0/HiTech06.pdf [Accessed November 2011]
• Cambridgeshire County Council, 2010a. Cambridgeshire’s Economic Assessment [online] Cambridge: Cambridgeshire County Council. Available at: http://www.cambridgeshire.gov.uk/business/economicandcommunitydev/ecodevelopment/economicassessment.htm [Accessed November 2011]
• Cambridgeshire County Council, 2011f. Mid-2011 Population Estimates [online] Cambridge: Cambridgeshire County Council Research Group. Available at: http://www.cambridgeshire.gov.uk/business/research/populationresearch/population/forecasts/ [Accessed November 2011].
• Cambridgeshire County Council, 2012b. Table H1.1. Dwellings Completed (NET) by Districts in Cambridgeshire (2001-2010) [online] Cambridge: Cambridgeshire County Council Research Group. Available at: http://www.cambridgeshire.gov.uk/NR/rdonlyres/688EEB82-9F26-4B01-B56E-BEA00FD80FBF/0/TableH11DwellingsCompleted_NET_byDistrictsandDistributionofhousingcompletions.pdf [Accessed November 2011].
• Cambridgeshire County Council, 2012c. Table H1.4. Gross Housing Completions Showing Number of Bedrooms [online] Cambridge: Cambridgeshire County Council Research Group. Available at: http://www.cambridgeshire.gov.uk/NR/rdonlyres/C138ABD6-7BE6-4C2C-8E7B-BECE03752F0A/0/TableH14GrosshousingcompletionsshowingnumberofBedrooms.pdf [Accessed November 2011].
• Cambridgeshire County Council, 2012d. Table H1.7. Average Density of Housing Completions [online] Cambridge: Cambridgeshire County Council Research Group. Available at: http://www.cambridgeshire.gov.uk/NR/rdonlyres/60936E2D-E400-

Bibliography
Annual Monitoring Report 2012 - 96 -
4A53-BE69-3FD3B318E8DC/0/TableH17Averagedensityofhousingcompletions.pdf [Accessed November 2011].
• Cambridgeshire County Council, 2012e. Table H1.8. Density Range of Housing Completions [online] Cambridge: Cambridgeshire County Council Research Group. Available at: http://www.cambridgeshire.gov.uk/NR/rdonlyres/B3CB0374-1226-4886-980C-D5DF6D7F6108/0/TableH18DensityRangeofhousingcompletions.pdf [Accessed November 2011].
• Cambridgeshire County Council, 2012g. Mid-2011 Business Completions [online] Cambridge: Cambridgeshire County Council Research Group. Available at: http://www.cambridgeshire.gov.uk/environment/planning/policies/monitoring/businessdevelopment.htm [Accessed November 2011].
• Communities & Local Government, 2011. Live tables on housing market and house prices [online]. London: Communities and Local Government. Available at:
o http://www.communities.gov.uk/documents/housing/xls/322286.xls o http://www.communities.gov.uk/documents/housing/xls/152924.xls o http://www.communities.gov.uk/documents/housing/xls/table-585.xls
Accessed November 2011] • Communities & Local Government (CLG), 2011a. Relaxation of Planning Rules for
Change of Use from Commercial to Residential [online]. London: Communities and Local Government. Available at: http://www.communities.gov.uk/publications/planningandbuilding/relaxationchangeconsultation [Accessed November 2011]
• Communities & Local Government (CLG), 2011b. Letter from Bob Neill MP – Preparation and Monitoring of Local Plans [online]. London: Communities and Local Government. Available at: http://www.communities.gov.uk/documents/planningandbuilding/pdf/1876440.pdf [Accessed November 2011]
• Cambridgeshire Horizons, 2011. Cambridgeshire Green Infrastructure Strategy – 2011. [online] Cambridge: Cambridgeshire Horizons. Available at: http://www.cambridgeshirehorizons.co.uk/our_challenge/GIS.aspx
• Greater Cambridge Partnership, 2009. Greater Cambridge Quarterly Economic Review: Economic Intelligence & Business Trends – July-September 2010. [online] Cambridge: Greater Cambridge Partnership. Available at: http://www.gcp.uk.net/downloads/R2RQR_0910.pdf [Accessed November 2010]
• Office for National Statistics, 2001. Census 2001 [online] London: Office for National Statistics. Available at: http://www.statistics.gov.uk/census2001/census2001.asp [Accessed November 2011].
• Nomis [online] https://www.nomisweb.co.uk/ [Accessed 1st November 2011] • Marshall [online] http://www.marshallairportcambridge.co.uk/ [Accessed November
2010]