annual performance planannual performance plan 2018/19 – 2020/21 5 fighting disease, fighting...
TRANSCRIPT

ANNUAL PERFORMANCE PLAN
2018/19 - 2020/21

ANNUAL PERFORMANCE PLAN 2018/19 – 2020/21
1
Fighting Disease, Fighting Poverty, Giving Hope
TABLE OF CONTENTS
FOREWORD BY THE EXECUTIVE AUTHORITY ........................................................................................................... 5
STATEMENT BY THE ACTING HEAD: HEALTH ........................................................................................................... 7
Official Sign-off of the 2018/19 - 2020/21 Annual Performance Plan ................................................................ 8
PART A: STRATEGIC OVERVIEW .............................................................................................................................. 9
STRATEGIC OVERVIEW .......................................................................................................................................... 11
Situation Analysis ......................................................................................................................................................... 19
Performance against 2015-2019 Strategic Goals .................................................................................................. 32
Legislative and Other Mandates .............................................................................................................................. 50
Planning Frameworks .................................................................................................................................................. 52
Strategic Planning Process ........................................................................................................................................ 56
Overview of the 2018/19 Budget and MTEF Estimates ......................................................................................... 57
PART B: PROGRAMME & SUB-PROGRAMME PLANS ........................................................................................... 62
PROGRAMME 1: ADMINISTRATION ..................................................................................................................... 65
PROGRAMME 2: DISTRICT HEALTH SERVICES ...................................................................................................... 77
Sub-Programme: Primary Health Care ................................................................................................................... 78
Sub-Programme: District Hospitals ............................................................................................................................ 89
Sub-Programme: HIV, AIDS, STI & TB Control.......................................................................................................... 97
Sub-Programme: Maternal, Neonatal, Child & Women’s Health and Nutrition ............................................ 107
Sub-Programme: Disease Prevention & Control ................................................................................................. 123
PROGRAMME 3: EMERGENCY MEDICAL SERVICES ......................................................................................... 135
PROGRAMME 4: PROVINCIAL HOSPITALS (REGIONAL AND SPECIALISED) .................................................... 145
Sub-Programme: Regional Hospitals..................................................................................................................... 146
Sub-Programme: Specialised TB Hospitals ........................................................................................................... 152
Sub-Programme: Specialised Psychiatric Hospitals ............................................................................................ 157
Sub-Programme: Chronic/ Sub-Acute Hospitals ................................................................................................ 161
Sub-Programme Oral and Dental Training Centre .............................................................................................. 165
PROGRAMME 5: CENTRAL AND TERTIARY HOSPITALS ...................................................................................... 171
Sub-Programme: Tertiary Hospitals (Greys, King Edward Vlll & Ngwelezana Hospitals) ............................... 173
Sub-Programme: Central Hospital (Inkosi Albert Luthuli Central Hospital) ..................................................... 178
PROGRAMME 6: HEALTH SCIENCES AND TRAINING ........................................................................................ 187
PROGRAMME 7: HEALTH CARE SUPPORT SERVICES ......................................................................................... 197
PROGRAMME 8: HEALTH FACILITIES MANAGEMENT ......................................................................................... 207
PART C: LINK TO OTHER PLANS ........................................................................................................................... 217
Infrastructure Project Plan 2018/19 MTEF ............................................................................................................... 221
Conditional Grants .................................................................................................................................................... 229
State Aided Facilities ................................................................................................................................................ 230
Public Private Partnership ........................................................................................................................................ 232
PART D: 2015-2019 STRATEGIC PLAN REVIEW .................................................................................................... 233
CONCLUSION ...................................................................................................................................................... 242
Abbreviations ............................................................................................................................................................. 243

ANNUAL PERFORMANCE PLAN 2018/19 – 2020/21
2
Fighting Disease, Fighting Poverty, Giving Hope
LIST OF TABLES Table 1: Alignment of Macro Plans .......................................................................................................................... 12
Table 2: Strategic Goals, Objectives and Objective Statements ...................................................................... 14
Table 3: Progress towards MTEF Impact Indicators................................................................................................ 19
Table 4: Social determinants of health ................................................................................................................... 21
Table 5: Public health facilities in service delivery platform ............................................................................... 27
Table 6: Disability leave 2015/16 – 2016/17 ............................................................................................................. 31
Table 7: (A2) Health Personnel – 2016/17 ................................................................................................................ 31
Table 8: Progress: Strategic Goal 1.......................................................................................................................... 32
Table 9: Progress: Strategic Goal 2.......................................................................................................................... 38
Table 10: Progress: Strategic Goal 3 ....................................................................................................................... 43
Table 11: Progress: Strategic Goal 4 ....................................................................................................................... 45
Table 12: Progress: Strategic Goal 5 ....................................................................................................................... 47
Table 13 (A2): Expenditure Estimates Summary of Payments and Estimates (R’000) ..................................... 58
Table 14 (A3): Summary of Provincial Expenditure Estimates by Economic Classification (R’000) ............. 59
Table 15: (A4) Trends in Provincial Public Health Expenditure (R’000) ............................................................... 60
Table 16: Conditional Grants Expenditure Trends (R’000) ................................................................................... 61
Table 17: 2015-2019 Strategic Plan Targets ............................................................................................................ 67
Table 18: (ADMIN 2) Strategic Objectives, Indicators and Targets ................................................................... 68
Table 19: (ADMIN 3) Quarterly and Annual Targets .............................................................................................. 74
Table 20: (ADMIN 4a) Expenditure Estimates (R’000) ........................................................................................... 74
Table 21: (ADMIN 4b) Summary of Payments and Estimates by Economic Classification (R’000) ............... 74
Table 22: Risk Management ...................................................................................................................................... 76
Table 23: (DHS1) District Health Service Facilities per Health District – 2016/17 ............................................... 78
Table 24: (DHS 2) Situation Analysis Indicators ...................................................................................................... 82
Table 25: 2015-2019 Strategic Plan Targets (PHC) ................................................................................................ 83
Table 26: (DHS3) Strategic Objectives, Indicators & Targets .............................................................................. 84
Table 27: (DHS 4) Quarterly and Annual Targets .................................................................................................. 88
Table 28: (DHS5) Situation Analysis Indicators ....................................................................................................... 90
Table 29: 2015-2019 Strategic Plan Targets ............................................................................................................ 92
Table 30: (DHS6) Strategic Objectives, Indicators and Targets .......................................................................... 92
Table 31: (DHS7) Quarterly and Annual Targets ................................................................................................... 96
Table 32: (DHS8) Situation Analysis Indicators ....................................................................................................... 98
Table 33: 2015-2019 Strategic Plan Targets .......................................................................................................... 101
Table 34: (DHS9) Strategic Objectives, Indicators and Targets ........................................................................ 102
Table 35: (DHS 10) Quarterly and Annual Targets .............................................................................................. 106
Table 36: (DHS11) Situation Analysis Indicators ................................................................................................... 108
Table 37: Strategic Plan 2015-2019 Targets .......................................................................................................... 112
Table 38: (DHS12) Strategic Objectives, Indicators and Targets ...................................................................... 113
Table 39: (DHS13) Quarterly and Annual Targets .............................................................................................. 121
Table 40: (DHS14) Situation Analysis Indicators ................................................................................................... 124
Table 41: Strategic Plan 2015-2019 Targets .......................................................................................................... 125
Table 42: (DHS15) Strategic Objectives, Indicators and Targets ...................................................................... 125
Table 43: (DHS16) Quarterly and Annual Targets ............................................................................................... 129
Table 44: (DHS17 a) Summary of Payments and Estimates (R’000) ................................................................. 130
Table 45: (DHS17 b) Summary of Payments and Estimates by Economic Classification (R’000) ............... 131
Table 46: Risk Management .................................................................................................................................... 133
Table 47: (EMS1) Situation Analysis Indicators ..................................................................................................... 137
Table 48: Strategic Plan 2015-2019 Targets .......................................................................................................... 138
Table 49: (EMS2) Strategic Objectives, Indicators and Targets........................................................................ 138
Table 50: (EMS3) Quarterly and Annual Targets ................................................................................................. 140
Table 51: (EMS4 a) Expenditure Estimates ............................................................................................................ 141

ANNUAL PERFORMANCE PLAN 2018/19 – 2020/21
3
Fighting Disease, Fighting Poverty, Giving Hope
Table 52: (EMS4 b) Summary of Provincial Expenditure Estimates by Economic Classification ................. 141
Table 53: Risk Management .................................................................................................................................... 143
Table 54: 2015-2019 Strategic Plan Targets .......................................................................................................... 147
Table 55: (PHS1) Strategic Objectives, Indicators and Targets ........................................................................ 148
Table 56: (PHS2) Quarterly and Annual Targets .................................................................................................. 151
Table 57: (PHS3 a) Strategic Objectives, Indicators and Targets ...................................................................... 153
Table 58: (PHS4 a) Quarterly and Annual Targets .............................................................................................. 156
Table 59: (PHS3 b) Strategic Objectives, Indicators and Targets ..................................................................... 158
Table 60: (PHS4 b) Quarterly and Annual Targets .............................................................................................. 160
Table 61: (PHS3 c) Strategic Objectives, Indicators and Targets ..................................................................... 162
Table 62: (PHS4 c) Quarterly and Annual Targets .............................................................................................. 164
Table 63: Strategic Objectives, Indicators and Targets ..................................................................................... 166
Table 64: Quarterly and Annual Targets .............................................................................................................. 166
Table 65: (PHS5 a) Summary of Payments and Estimates (R’000) ................................................................... 167
Table 66: (PHS5 b) Summary of payments and expenditure by Economic Classification (R’000) ............ 167
Table 67: Risk Management .................................................................................................................................... 169
Table 68: Strategic Plan 2015-2019 Targets .......................................................................................................... 172
Table 69: (C&THS1) Strategic Objectives, Indicators and Targets ................................................................... 174
Table 70: (THS2) Quarterly and Annual Targets ................................................................................................... 177
Table 71: (C&THS3) Strategic Objectives, Indicators and Targets ................................................................... 179
Table 72: (C&THS4) Quarterly and Annual Targets ............................................................................................. 182
Table 73: (C&THS7 a) Summary of Payments and Estimates (R’000) .............................................................. 183
Table 74: (C&THS7 b) Summary of Payments and Estimates by Economic Classification (R’000) ............ 183
Table 75: Risk Management .................................................................................................................................... 185
Table 76: Strategic Plan 2015-2019 Targets .......................................................................................................... 189
Table 77: (HST1) Strategic Priorities, Indicators and Targets ............................................................................... 190
Table 78: (HST2) Quarterly and Annual Targets ................................................................................................... 192
Table 79: (HST4 a) Expenditure Estimates (R’000) ............................................................................................... 193
Table 80: (HST4 b) Summary of Provincial Expenditure Estimates by Economic Classification (R’000)..... 194
Table 81: Risk Management .................................................................................................................................... 196
Table 82: Strategic Plan 2015-2019 Targets .......................................................................................................... 199
Table 83: (HCSS1) Strategic Objectives, Indicators and Targets...................................................................... 200
Table 84: (HCSS2) Quarterly and Annual Targets ............................................................................................... 203
Table 85: (HCSS4 a) Expenditure Estimates (R’000) ............................................................................................ 204
Table 86: (HCSS4 b) Summary of Payments and Estimates by Economic Classification (R’000) ............... 204
Table 87: Risk Management .................................................................................................................................... 206
Table 88: Strategic Plan 2015-2019 Targets .......................................................................................................... 209
Table 89: (HFM1) Strategic Objectives, Indicators and Targets ....................................................................... 209
Table 90: (HFM3) Quarterly and Annual Targets ................................................................................................. 211
Table 91: (HFM4 a) Expenditure Estimates (R’000).............................................................................................. 212
Table 92: (HFM4 b) Summary of Provincial Expenditure Estimates by Economic Classification (R’000) ... 213
Table 93: Risk Management .................................................................................................................................... 215
Table 94: Facilities affected by storm damage and recovery cost ................................................................ 220
Table 95: Infrastructure Project List 2018/19 MTEF ............................................................................................... 221
Table 96: Conditional Grants .................................................................................................................................. 229
Table 97: State Aided Facilities .............................................................................................................................. 230
Table 98: Public Private Partnership ...................................................................................................................... 232
Table 99: Review of 2015-2019 Strategic Plan ..................................................................................................... 233

ANNUAL PERFORMANCE PLAN 2018/19 – 2020/21
4
Fighting Disease, Fighting Poverty, Giving Hope
LIST OF GRAPHS
Graph 1: KZN population 2015 - 2017 ..................................................................................................................... 20 Graph 2: KZN fertility rates ......................................................................................................................................... 20 Graph 3: Life expectancy in KZN ............................................................................................................................. 21 Graph 4: Ten leading causes of years of life lost .................................................................................................. 22 Graph 5: Clients remaining on ART ......................................................................................................................... 23 Graph 6: TB notification rate per 100 000 ............................................................................................................... 23 Graph 7: Maternal mortality in facility ratio and maternal deaths .................................................................... 24 Graph 8: Survival rate by weight ............................................................................................................................. 25 Graph 9: Survival rate by weight bands.................................................................................................................. 25 Graph 10: Diarrhoea, pneumonia and severe acute malnutrition deaths ..................................................... 26 Graph 11: Hypertension & Diabetes new cases ................................................................................................... 27 Graph 12: Vacancy rate per salary band .............................................................................................................. 30 Graph 13: Vacancy and Turnover rates – critical occupations ......................................................................... 30 Graph 14: PHC utilisation ........................................................................................................................................... 33 Graph 15: Ideal Clinic scores - March 2017 .......................................................................................................... 34 Graph 16: Trends in hospital patient footprint ........................................................................................................ 35 Graph 17: Total bed utilisation rate......................................................................................................................... 35 Graph 18: TB lost to follow up and death rate ...................................................................................................... 40 Graph 19: Deliveries vs. Couple year protection rate .......................................................................................... 40 Graph 20: Antenatal 1st visit before 20 weeks ........................................................................................................ 41 Graph 21: Immunisation coverage under 1 year ................................................................................................. 42 Graph 22: EMS skills mix - 2016/17 ............................................................................................................................ 49
LIST OF FIGURES
Figure 1: Macro Organisational Structure ............................................................................................................... 29

ANNUAL PERFORMANCE PLAN 2018/19 – 2020/21
5
Fighting Disease, Fighting Poverty, Giving Hope
FOREWORD BY THE EXECUTIVE AUTHORITY
As we approach the end of the current term of office, we reflect and note with pride the prodigious
strides we have made in redressing some of the historical imbalances in health service delivery in the
Province.
Progressive shifts from the previously fragmented institution–based services to more comprehensive and
integrated primary health care and community-based services, augmenting the Constitutional right of
all citizens to have access to health care closer to where they live, indeed contributed to more
equitable access to basic health care services.
We are proud of our achievements in reducing the burden of disease including consistent year on year
reductions in child and maternal mortality, a significant reduction in the mother to child transmission of
HIV, and improved TB outcomes. The number of people on ART was increased exponentially over the
last four years, which is one of the contributing factors to the noted increase in life expectancy in KZN.
That said, we acknowledge that a lot of work still needs to be done. For the year ahead, the
Department will focus on maintaining the gains made in reducing the burden of disease and invest in
improving health system efficiencies and patient satisfaction.
The core annual agenda, unpacked in the Annual Performance Plan, will include:
1. Filling of executive leadership posts to ensure effective and sustained leadership.
2. Implementation of an approved Turn-Around Strategy and Plan with strong focus on strengthening
the health system to improve efficiencies and serve as foundation for improved service delivery at
the coal face. The plan will include:
Financial and Supply Chain Management
Human Resource Management
Infrastructure and Health Technology Services
Governance, Institutional Arrangements and Medico-Legal Strategy
Rationalisation of services to improve access, equity and ensure optimal utilisation of resources
Medico-legal litigation strategy
Emergency Medical and Forensic Pathology Services
3. Follow-through with the Oncology service intervention introduced in quarter four of 2017/18.
4. Strengthening community-based partnerships giving a voice to communities.
I remain committed to provide the necessary leadership and support to ensure that we continue to
strive for excellence in service delivery.

ANNUAL PERFORMANCE PLAN 2018/19 – 2020/21
6
Fighting Disease, Fighting Poverty, Giving Hope
I endorse the 2018/19 Annual Performance Plan as the guiding framework within which the Department
will execute its mandate (within the available funding envelope) in serving all the people of KwaZulu-
Natal.
ANNUAL PERFORMANCE PLAN 2018/19 – 2020/21
7
Fighting Disease, Fighting Poverty, Giving Hope
STATEMENT BY THE ACTING HEAD: HEALTH
The 2018/19 Annual Performance Plan was crafted following extensive reflection, consultation and
analysis of health system performance, service delivery and health outcomes. It is unmistakably clear
that a lot more needs to be done to improve and strengthen health system efficiencies as enabling
framework for high quality service delivery. The Department will build on past successes and actively
explore innovative solutions within current financial constraints.
The R44.957 billion that has been allocated to the Department for the 2018/19 financial year will be used
towards achieving the Departmental goals, strategic priorities and performance targets set in the APP.
The allocated budget is a reduction in real terms, and when juxtaposed against the quadruple burden
of disease, escalating service pressures as well as increasing resource constraints it will indeed require
absolute commitment and innovation to define the appropriate space and leverage points for focus
that will stretch the rand and ensure value for money.
The overall intent is to narrow focus to core game changers as part of the Turn-Around Plan that will
have the greatest impact on service delivery and health outcomes. We are cognisant of our
responsibility to address issues of equity, access, high quality patient care and patient satisfaction – to
achieve this we will lead from the front to strengthen the overall organisational performance.
Given the budget pressures and resource constraints, it will not be business as usual. Service gaps and
challenges will be addressed through implementation of the integrated Turn-Around Plan which will be
robustly monitored with regular performance reports presented to Oversight Committees.
As Senior Management we remain committed to lead from the front and ensure that enabling systems
and processes are in place to capacitate staff at service delivery level to deliver on our mandate.
I want to thank the Honourable MEC for Health, Dr SM Dhlomo, for his continued leadership and
support. To all staff, remember that the change we want to see starts with us. Let us continue to serve
our communities with commitment and compassion to make an impact where it matters most.

ANNUAL PERFORMANCE PLAN 2018/19 – 2020/21
8
Fighting Disease, Fighting Poverty, Giving Hope
Official Sign-off of the 2018/19 - 2020/21 Annual
Performance Plan
It is hereby certified that the 2018/19 – 2020/21 Annual Performance Plan:
Was developed by the Management of the KwaZulu-Natal Department of Health under leadership
of the MEC for Health Dr SM Dhlomo and Acting Head: Health Dr M Gumede and through
consultation with service providers and relevant stakeholders.
Takes into account all the relevant legislation and policies, and specific mandates for which the
KwaZulu-Natal Department of Health is responsible.
Accurately reflects the strategic outcome orientated goals and objectives which the KwaZulu-Natal
Department of Health will endeavour to achieve during the 2018/19 – 2020/21 period.

ANNUAL PERFORMANCE PLAN 2018/19 – 2020/21
9
Fighting Disease, Fighting Poverty, Giving Hope
PART A: STRATEGIC OVERVIEW
Strategic Overview
Mission, Vision, Values
Strategic Goals and Objectives
Situational Analysis
Organisational Environment
Legislative and Other Mandates
Planning Frameworks
Strategic Planning Process
Overview of the 2018/19 Budget and MTEF Estimates

ANNUAL PERFORMANCE PLAN 2018/19 – 2020/21
10
Fighting Disease, Fighting Poverty, Giving Hope
NOTES
……………………………………………………………………………………………………………………………………
……………………………………………………………………………………………………………………………………
……………………………………………………………………………………………………………………………………
……………………………………………………………………………………………………………………………………
……………………………………………………………………………………………………………………………………
……………………………………………………………………………………………………………………………………
……………………………………………………………………………………………………………………………………
……………………………………………………………………………………………………………………………………
……………………………………………………………………………………………………………………………………
……………………………………………………………………………………………………………………………………
……………………………………………………………………………………………………………………………………
……………………………………………………………………………………………………………………………………
……………………………………………………………………………………………………………………………………
……………………………………………………………………………………………………………………………………
……………………………………………………………………………………………………………………………………
……………………………………………………………………………………………………………………………………
…………………………………………………………………………………………………………………………………….

ANNUAL PERFORMANCE PLAN 2018/19 – 2020/21
11
Fighting Disease, Fighting Poverty, Giving Hope
STRATEGIC OVERVIEW
Vision, Mission and Core Values
Vision
Optimal health for all persons in KwaZulu-Natal
Mission
To develop and implement a sustainable, coordinated, integrated and comprehensive health system
at all levels, based on the Primary Health Care approach through the District Health System, to ensure
universal access to health care.
Core Values
Trustworthiness, honesty and integrity
Open communication, transparency and consultation
Professionalism, accountability and commitment to excellence
Loyalty and compassion
Continuous learning, amenable to change and innovation
KZN Department of Health Strategic Goals
The following macro plans (top-down) informed Provincial strategic goals and objectives, while actual
outputs and outcomes (bottom-up) informed strategic priorities and performance measures that will
steer the Department towards achieving its Vision.
National Development Plan 2030
The National Development Plan (NDP) sets out nine (9) long-term health goals for South Africa to be
achieved by 2030. Five of these goals relate to improving the health and well-being of the population,
while the other four deal with aspects of health systems strengthening.

ANNUAL PERFORMANCE PLAN 2018/19 – 2020/21
12
Fighting Disease, Fighting Poverty, Giving Hope
Sustainable Development Goals 2030
The Sustainable Development Goals (SDGs) 2030, building on the Millennium Development Goals 2015,
were adopted as Global Goals by world leaders on 25 September 2015. There are 17 SDGs aimed at
ending poverty, fighting inequality and managing climate change by 2030. Thirteen targets are
included under Goal 3 to “Ensure healthy lives and promote well-being for all at all ages”.
Medium Term Strategic Framework 2014-2019
The Medium Term Strategic Framework (MTSF) serves as framework to guide Government’s Programmes
during the current electoral cycle (2014-2019). It is a statement of intent in accordance with the NDP
goals over the same period. Strategic priorities for the Health Sector, Goal 2 “A long and healthy life for
all South Africans”, include 10 Sub-Outcomes that will steer the Sector towards Vision 2030.
Provincial Growth and Development Plan
The Provincial Growth and Development Plan (PGDP), aligned with the NDP, provides the framework of
action for Provincial Government towards the 2030 NDP Vision.
The table below illustrates the alignment between the KwaZulu-Natal (KZN) Department of Health’s
Strategic Goals and relevant national and provincial macro plans.
Table 1: Alignment of Macro Plans
KZN Department of
Health
Strategic Goals
National
Development Plan
2030
Medium Term
Strategic
Framework 2014-
2019
Provincial Growth &
Development Plan
2030
Sustainable Development Goals 2030
Strategic Goal 1:
Strengthen health
system
effectiveness
Strategic Goal 6:
Health system
reforms complete
Priority b: Strengthen
the health system
Priority c: Improve
health information
systems
Strategic Goal 7:
PHC teams
deployed to
provide care to
families &
communities
Sub-Output 3:
Implement the re-
engineering of PHC
Sub-Output 4:
Reduced health
care cost
Sub-Output 6:
Improved health
management &
leadership
Sub-Output 10:
Efficient health
information
management
system developed
and implemented
to improve
decision-making
Strategic Objective
3.2: Enhance the
health of citizens
and healthy
communities
Intervention 3.2(a):
Re-engineering of
PHC
Target 7: Achieve universal health
coverage, including financial risk
protection, access to quality essential
health-care services and access to
safe, effective, quality and affordable
essential medicines and vaccines for all
Strategic Goal 2:
Reduce and
manage the
burden of disease
Strategic Goal:
Average male &
female life
expectancy
increased to 70
years
Sub-Output 8: HIV,
AIDS & TB
prevented &
successfully
managed
Intervention 3.2.(b):
Scaling up
programmes to
improve maternal,
child and women’s
health
Target 1: By 2030, reduce the global
maternal mortality ratio to less than 70
per 100,000 live births
Target 2: By 2030, end preventable
deaths of newborns & children under 5
years, aiming to reduce neonatal
mortality to at least 12 per 1,000 live
births and under-5 mortality to at least

ANNUAL PERFORMANCE PLAN 2018/19 – 2020/21
13
Fighting Disease, Fighting Poverty, Giving Hope
KZN Department of
Health
Strategic Goals
National
Development Plan
2030
Medium Term
Strategic
Framework 2014-
2019
Provincial Growth &
Development Plan
2030
Sustainable Development Goals 2030
Strategic Goal 2: TB
prevention & cure
progressively
improved
Strategic Goal 3:
Maternal, infant
and child mortality
reduced
Strategic Goal 4:
Prevalence of
NCD’s reduced by
28%
Strategic Goal 5:
Injury, accidents
and violence
reduced by 50%
from 2010 levels
Priority a: Address
the social
determinants that
affect health and
disease
Priority d: Prevent
and reduce the
disease burden and
promote health
Sub-Output 9:
Maternal, infant &
child mortality
reduced
Intervention 3.2 (c):
Scaling up
integrated
programmes to
expand healthy
lifestyle
programmes and
reduce and
manage non-
communicable
diseases
Intervention 3.2 (d):
Scaling up
programmes to
reduce incidence &
manage
prevalence of HIV,
AIDS and STIs
Intervention 3.2 (e):
Scaling up
programmes to
improve TB
outcomes
Intervention 3.2 (f):
Implementing
programmes to
reduce local
malaria incidence
25 per 1,000 live births
Target 3: By 2030, end the epidemics of
AIDS, tuberculosis, malaria and
neglected tropical diseases and
combat hepatitis, water-borne diseases
and other communicable diseases
Target 4: By 2030, reduce by one third
premature mortality from non-
communicable diseases through
prevention and treatment and promote
mental health and well-being.
Strengthen prevention and treatment of
substance abuse, including narcotic
drug abuse and harmful use of alcohol
Target 5: By 2020, halve the number of
global deaths and injuries from road
traffic accidents
Target 6: By 2030, ensure universal
access to sexual and reproductive
healthcare services, including family
planning, information and education,
and the integration of reproductive
health into national strategies and
programmes
Target 8: By 2030, substantially reduce
the number of deaths and illnesses from
hazardous chemicals and air, water
and soil pollution and contamination
Target 9: Strengthen the
implementation of the World Health
Organization Framework Convention on
Tobacco Control in all countries, as
appropriate
Target 10: Support research and
development of vaccines and
medicines for communicable and non-
communicable diseases
Strategic Goal 3:
Universal health
coverage
Strategic Goal 8:
Universal health
coverage achieved
Priority e: Financing
universal health
care coverage
Sub-Output 1:
Universal health
coverage
progressively
achieved through
implementation of
NHI
Sub-Output 7:
Improved health
facility planning &
infrastructure
delivery
Strategic Objective
3.2: Enhance the
health of citizens
and healthy
communities
Target 7: Achieve universal health
coverage, including financial risk
protection, access to quality essential
health-care services and access to
safe, effective, quality and affordable
essential medicines and vaccines for all
Strategic Goal 4:
Strengthen human
resources for health
Strategic Goal 9:
Posts filled with
skilled, committed
& competent
individuals
Priority f: Improve
human resources in
the health sector
Priority g: Review
management
positions and
appointments and
strengthen
accountability
mechanisms
Sub-Output 5:
Improved human
resources for health
Intervention 3.2 (g):
Improving human
resources for health
Target 11: Substantially increase health
financing and the recruitment,
development, training and retention of
the health workforce in developing
countries, especially in least developed
countries and small island’ developing
states

ANNUAL PERFORMANCE PLAN 2018/19 – 2020/21
14
Fighting Disease, Fighting Poverty, Giving Hope
KZN Department of
Health
Strategic Goals
National
Development Plan
2030
Medium Term
Strategic
Framework 2014-
2019
Provincial Growth &
Development Plan
2030
Sustainable Development Goals 2030
Strategic Goal 5:
Improved quality of
health care
Priority h: Improve
quality by using
evidence
Sub-Output 2:
Improved quality of
health care
Strategic Objective
3.2: Enhance the
health of citizens
and healthy
communities
Target 12: Strengthen the capacity of all
countries, in particular developing
countries, for early warning, risk
reduction and management of
national and global health risks
Table 2 reflects the Strategic Goals, Strategic Goal Statements, Strategic Objectives and Strategic
Objective Statements included in the 2015-2019 Strategic Plan and 2018/19 Annual Performance Plan.
Table 2: Strategic Goals, Objectives and Objective Statements
2015-2019 Strategic Plan Goals, Goal Statements, Strategic Objectives and Statements
STRATEGIC GOAL 1: STRENGTHEN HEALTH SYSTEM EFFECTIVENESS
STRATEGIC GOAL STATEMENT: Identifying and implementing changes in policy and/or practice to improve response to health and
health system challenges and any array of initiatives and strategies that improves one or more of the functions of the health system
that improves access, coverage, quality, or efficiency and strengthen performance and interconnectedness of the WHO Health
System Building Blocks including service delivery, health workforce, strategic information, commodities, health financing, leadership
and governance.
STRATEGIC OBJECTIVES (SO) AND STRATEGIC OBJECTIVE STATEMENTS (SOS) SUB-OUTPUTS (SO) MEDIUM TERM STRATEGIC
FRAMEWORK (NATIONAL DELIVERABLES)
SO 1.1) Approve the integrated 2017-2027 Long Term Plan -
SOS 1.1.1) 2017 – 2027 Strategic Position Statement and Long Term Plan
approved by March 2019 (Reviewed 2018/19)
-
SO 1.2) Improve financial management and compliance to PFMA prescripts SO 6: Improved health management and leadership
SOS 1.2.1) Annual unqualified audit opinion for financial statements and
performance information from 2015/16 onwards
SOS 1.2.3) Monthly submission of disclosures of donations, sponsorships,
and gifts as per Circular G15/2016
Target 2019/20
7 Departments (1 National and 6 Provincial
Departments) received unqualified audit
reports from the Auditor General by 2019
SO 1.3) Improve Supply Chain Management -
SOS 1.3.1) Costed annual Procurement Plan for minor and major assets
by the end of April in each reporting year
-
SO 1.4) Improve health technology and information management SO 10: Efficient health information management system
developed and implemented to improve decision-
making
SOS 1.4.1) Connectivity established at 40% public health facilities by
March 2020 (Reviewed 2018/19)
Key interventions: Management of effective
data systems; data quality audits; Strengthen
use of information; Web-based data system
SO 1.5) Accelerate implementation of PHC re-engineering SO 3: Implement the re-engineering of PHC
SOS 1.5.1) Accelerate implementation of PHC re-engineering by
increasing household registration coverage by at least 15% per annum
SOS 1.5.2) Increase the number of ward based outreach teams to 160 by
March 2020 (Reviewed 2018/19)
SOS 1.5.3) PHC utilisation rate of at least 2.5 visits per person per year by
March 2020 (Reviewed 2018/19)
SOS 1.5.4) Under 5 utilisation rate of at least 3.9 visits per child per year
(Reviewed 2018/19)
SOS 1.5.6) Increase the expenditure per PHC headcount to at least R436
by March 2020 (Reviewed 2018/19)
SOS 1.5.7) Increase School Health Teams to 215 by March 2020
SOS 1.5.8) Increase the accredited Health Promoting Schools to 350 by
March 2020
SOS 1.5.9) Increase the number of learners screened by at least 5% per
annum
Targets 2019/20
40% School Grade 1 screening coverage
(annualised)
25% School Grade 8 screening coverage
(annualised)
3 000 functional Ward Based PHC Outreach
Teams

ANNUAL PERFORMANCE PLAN 2018/19 – 2020/21
15
Fighting Disease, Fighting Poverty, Giving Hope
2015-2019 Strategic Plan Goals, Goal Statements, Strategic Objectives and Statements
SO 1.6) Scale up implementation of Operation Phakisa ICRM SO 3: Implement the re-engineering of PHC
SOS 1.6.1) 100% Provincial fixed PHC facilities score above 70% on the
Ideal Clinic Dashboard by March 2020 (Reviewed 2016/17)
Target 2019/20
100% of clinics qualify as Ideal Clinics
SO 1.7) Improve hospital efficiencies SO 2: Improved quality of health care
SOS 1.7.1) Maintain a bed utilisation rate of 75% (or more) by March 2020
SOS 1.7.2) Hospital Rationalisation Plan approved by September 2018
(Reviewed 2018/19) – Relevant to all hospital services
SOS 1.7.3) Improve hospital efficiencies by reducing the average length
of stay to at least 5.5 days (District), 5.3 (Regional), 15 days (TB), 286.5
days (Psych), 28.5 days (Chronic), 9 days (Tertiary), and 8.6 days
(Central) by March 2020
SOS 1.7.4) Maintain expenditure per PDE within the provincial norms
SOS 1.7.5) Reduce the unreferred outpatient department (OPD)
headcounts by at least 7% per annum
Target 2019/20
17 Gazetted Tertiary Hospitals provide the full
package of tertiary 1 services
SO 1.8) Improve EMS efficiencies SO 2: Improved quality of health care
SOS 1.8.1) EMS Turn-Around Strategy approved by June 2018 (Reviewed
2018/19)
SOS 1.8.2) Increase the average number of daily operational
ambulances to 220 by March 2020 (Reviewed 2017/18)
SOS 1.8.4) Improve P1 urban response times of under 15 minutes to 20%
by March 2020 (Reviewed 2017/18)
SOS 1.8.5) Improve P1 rural response times of under 40 minutes to 40% by
March 2020 (Reviewed 2017/18)
SOS 1.8.6) Increase the inter-facility transfer rate to 50% by March 2020
SOS 1.8.7) Increase number of bases with network access to 50 by
March 2020
-
SO 1.9) Strengthen health system effectiveness -
SOS 1.9.1) Increase the number of operational Orthotic Centres to 3 by
March 2020 (Reviewed 2018/19 based on budget constraints in the
Infrastructure budget)
SOS 1.9.2) Decrease and maintain zero clean linen stock outs in facilities
from March 2020 onwards
SOS 1.9.5) Implement the approved Forensic Pathology Rationalisation
Plan by March 2019 (Reviewed 2018/19 – finalising the Turn-Around Plan)
-
STRATEGIC GOAL 2: REDUCE THE BURDEN OF DISEASE
STRATEGIC GOAL STATEMENT: Reduce and manage the burden of disease to ensure better health outcomes and an increase in life
expectancy at birth.
STRATEGIC OBJECTIVES AND STRATEGIC OBJECTIVE STATEMENTS
SO 2.1) Increase life expectancy at birth -
SOS 2.1.1) Increase the total life expectancy to 61.5 years by March 2020
(Reviewed 2018/19)
SOS 2.1.2) Increase the life expectancy of males to 58.4 years by March
2020
SOS 2.1.3) Increase the life expectancy of females to 64.5 years by
March 2020 (Reviewed 2018/19)
-
SO 2.2) Reduce HIV incidence SO 8: HIV, AIDS & TB prevented & successfully
managed
SOS 2.2.1) Reduce the HIV incidence to 1% (or less) by March 2020
SOS 2.2.2) Test at least 16.5 million people for HIV by March 2020
(cumulative) (Reviewed 2017/18)
SOS 2.2.3) Increase the male condom distribution to 206 million by
March 2020 (Reviewed 2018/19)
SOS 2.2.4) Increase the medical male circumcisions to 1.2 million by
March 2020 (cumulative) (Reviewed 2018/19)
SOS 2.2.5) Decrease male urethritis syndrome incidence to at least 26.2
per 1000 population by March 2020 (Reviewed 2018/19)
Targets 2019/20
10 Million clients tested for HIV (annually)
800 Million male condoms distributed
(annually)
25 Million female condoms distributed
(annually)
5 Million males medically circumcised
(cumulative)

ANNUAL PERFORMANCE PLAN 2018/19 – 2020/21
16
Fighting Disease, Fighting Poverty, Giving Hope
2015-2019 Strategic Plan Goals, Goal Statements, Strategic Objectives and Statements
SO 2.3) Manage HIV prevalence SO 8: HIV, AIDS & TB prevented & successfully
managed
SOS 2.3.1) Increase the number of patients on ART to at least 1.5 million
by March 2020 (cumulative)
Target 2019/20
5 Million clients remaining on ART
SO 2.4) Improve TB outcomes SO 8: HIV, AIDS & TB prevented & successfully
managed
SOS 2.4.1) Increase the TB client treatment success rate to 90% (or more)
by March 2020
SOS 2.4.2) Reduce the TB incidence to 400 (or less) per 100 000
population by March 2020
SOS 2.4.3) Sustain a TB death rate of 5% or less by March 2020 (Reviewed
2018/19)
SOS 2.4.4) Increase the MDR-TB treatment success rate to 65% (or more)
by March 2020 (Review 2018/19)
SOS 2.4.5) Increase the TB 5 years and older start on treatment to 92% by
March 2020 (Reviewed 2017/18)
SOS 2.4.6) Stabilise the TB client lost to follow up at 5% (or less) by March
2020 (Reviewed 2018/19)
SOS 2.4.7) Improve Drug Resistant TB outcomes by ensuring that 90% (or
more) diagnosed MDR/XDR-TB patients are initiated on treatment by
March 2020
Targets 2019/20
8 Million people screened for TB (annually)
85% TB new client treatment success rate
Less than 5% TB client lost to follow up
5% (or less) TB death rate
80% TB MDR confirmed client start on treatment
65% TB MDR client successfully completing
treatment
SO 2.5) Reduce infant mortality SO 9: Maternal, infant & child mortality reduced
SOS 2.5.1) Reduce the infant mortality rate to 29 per 1000 live births by
March 2021 (Reviewed 2018/19)
SOS 2.5.2) Reduce the mother to child transmission of HIV to less than
0.5% by March 2020
SOS 2.5.3) Reduce the neonatal death in facility rate to at least 11.3 per
1,000 live births by March 2020 (Reviewed 2018/19)
Targets 2019/20
Infant 1st PCR test positive around 10 week rate
less than 1.5%
Infant Mortality Rate 23/1000
Live birth under 2500g in facility rate 11.6%
Neonatal mortality rate 8/1000
SO 2.6) Reduce under 5 mortality SO 9: Maternal, infant & child mortality reduced
SOS 2.6.1) Reduce the under 5 mortality rate to 40 per 1000 live births by
March 2021 (Reviewed 2018/19)
SOS 2.6.2) Reduce severe acute malnutrition incidence under 5 years to
under 4.6 per 1000 population by March 2020 (Reviewed 2018/19)
SOS 2.6.3) Increase immunisation coverage to at least 82% or more by
March 2020 (Reviewed 2017/18)
SOS 2.6.4) Maintain the measles 2nd dose coverage of 80% (or more)
from March 2018 onwards (Reviewed 2017/18)
SOS 2.6.6) Reduce the diarrhoea case fatality under 5 years rate to 2%
(or less) by March 2020
SOS 2.6.7) Reduce the pneumonia case fatality under 5 years rate to
2.4% (or less) by March 2020
SOS 2.6.8) Reduce the severe acute malnutrition case fatality under 5
years rate to 6% (or less) by March 2020
SOS 2.6.9) Increase the Vitamin A dose 12-59 months coverage to 63% or
more by March 2020
SOS 2.6.10) Reduce under-5 diarrhoea with dehydration incidence to 10
(or less) per 1000 population by March 2020
SOS 2.6.11) Reduce the under-5 pneumonia incidence to 52 (or less) per
1000 population by March 2020
SOS 2.6.12) Reduce the death in facility under 1 year rate to 5.9% or less
by March 2020 (Reviewed 2017/18)
SOS 2.6.13) Reduce the death in facility under 5 years rate to 4.2% (or
less) by March 2020
Targets 2019/20
Immunisation coverage under 1 year
(annualised) 95%
DTaP-IPV-HepB-Hib3 -Measles 1st dose drop-out
rate less than 5%
Measles 2nd dose coverage 85%
Child U-5 years diarrhoea case fatality rate less
than 2%
Child U-5 years severe pneumonia case fatality
rate less than 2.5%
Child U-5 years severe acute malnutrition case
fatality rate less than 5%
Infant exclusively breastfed at DTaP-IPV-Hib-
HBV 3rd dose rate 65%
Under-5 mortality rate 33/1000
SO 2.7) Reduce maternal mortality SO 9: Maternal, infant & child mortality reduced
SOS 2.7.1) Reduce the maternal mortality in facility ratio to 100 (or less)
per 100 000 live births by March 2020
SOS 2.7.2) Reduce the caesarean section rate to 27.5% (District), 37%
(Regional), 60% (Tertiary), and 67% or less (Central) by March 2020
SOS 2.7.3) Increase the antenatal 1st visit before 20 weeks rate to 70% (or
more) by March 2020
Targets 2019/20
Antenatal visits before 20 weeks rate 70%
Mother postnatal visit within 6 days rate 80%
Antenatal client initiated on ART rate 98%
Maternal Mortality Ratio (MMR) less than
100/100 000

ANNUAL PERFORMANCE PLAN 2018/19 – 2020/21
17
Fighting Disease, Fighting Poverty, Giving Hope
2015-2019 Strategic Plan Goals, Goal Statements, Strategic Objectives and Statements
SOS 2.7.4) Increase the postnatal visit within 6 days rate to 70% (or more)
by March 2020
SOS 2.7.6) Reduce deliveries 10 – 19 years to 21% or less by March 2020
(Reviewed 2018/19)
SOS 2.7.5) Initiate 97% eligible antenatal clients on ART by March 2020
SO 2.8) Improve women’s health SO 9: Maternal, infant & child mortality reduced
SOS 2.8.1) Couple year protection rate of at least 36% by March 2020
(Reviewed 2018/19)
SOS 2.8.2) Maintain the cervical cancer screening coverage of 75% (or
more)
SOS 2.8.3) Maintain programme to target 9 year old girls with HPV
vaccine 1st and 2nd dose as part of cervical cancer prevention
programme
Targets 2019/20
Couple year protection rate 75%
Cervical cancer screening coverage 70%
HPV 1st dose coverage 90%
SO 2.9) Reduce the morbidity and mortality of non-communicable diseases SO 3: Implement the re-engineering of PHC
SOS 2.9.1) Hypertension incidence of 24.6 per 1000 population by March
2020 (Reviewed 2017/18)
SOS 2.9.2) Diabetes incidence of 3.1 per 1000 population by March 2020
(Reviewed 2018/19)
SOS 2.9.3) Screen at least 2.5 million people (40 years and older) for
hypertension per annum by March 2020
SOS 2.9.4) Screen at least 2.5 million people (40 years and older) for
diabetes per annum by March 2020
SOS 2.9.5) Screen at least 35% of PHC clients for mental disorders by
March 2020
SOS 2.9.6) Increase the cataract surgery rate to at least 950 per 1 mil
uninsured population by March 2020 (Reviewed 2017/18)
SOS 2.9.7) Increase the number of wheelchairs issued to 4 200 by March
2020
Targets 2019/20
5 Million people counselled & screened for
hypertension
5 Million people counselled & screened for
diabetes
2.2 Million people screened for mental health
disorders
SO 2.10) Eliminate malaria -
SOS 2.10.1) Zero new local malaria cases by March 2020
SOS 2.10.2) Reduce the malaria case fatality rate to less than 0.5% by
March 2020
-
STRATEGIC GOAL 3: UNIVERSAL HEALTH COVERAGE
STRATEGIC GOAL STATEMENT: All people receive the full spectrum of the essential health services package including health promotion,
prevention, treatment and clinical care, rehabilitation and palliative care.
STRATEGIC OBJECTIVES AND STRATEGIC OBJECTIVE STATEMENTS
SO 3.2) Create job opportunities -
SOS 3.2.1) Create 11 800 jobs through the Expanded Public Works
Programme by March 2020 (cumulative)
-
SO 3.3) Improve health facility planning and infrastructure delivery SO 7: Improved health facility planning &
infrastructure delivery
SOS 3.3.1) Complete 40 new and replacement projects by March 2020
(Reviewed 2017/18)
SOS 3.3.2) Complete 47 upgrade and addition projects by March 2020
(Reviewed 2017/18)
SOS 3.3.3) Complete 24 renovation and refurbishment projects by March
2020
SOS 3.3.4) Major and minor refurbishment completed as per approved
Infrastructure Plan
SOS 3.3.5) 100% of maintenance budget spent annually
-
STRATEGIC GOAL 4: STRENGTHEN HUMAN RESOURCES FOR HEALTH
STRATEGIC GOAL STATEMENTS: Develop and maintain a capacitated workforce with the capacity to deliver the appropriate
package of health services at all levels of the health care system.
STRATEGIC OBJECTIVES AND STRATEGIC OBJECTIVE STATEMENTS
SO 4.1) Improve human resources for health SO 1: Universal health coverage

ANNUAL PERFORMANCE PLAN 2018/19 – 2020/21
18
Fighting Disease, Fighting Poverty, Giving Hope
2015-2019 Strategic Plan Goals, Goal Statements, Strategic Objectives and Statements
SOS 4.1.2) Review and approve macro and micro structures aligned to
function (Reviewed 2017/18)
SOS 4.1.3) Implement the Community Based Training in a PHC Model in
collaboration with the University of KwaZulu-Natal with Phase 1 pilot
commencing in 2016/17
SOS 4.1.4) Allocate 197 bursaries for first year medicine students between
2015/16 and 2019/20 (Reviewed 2017/18)
SOS 4.1.5) Allocate 1 000 bursaries for first year nursing students between
2015/16 and 2019/20 (Reviewed 2015/16)
SOS 4.1.6) Increase intake of Mid-Level Workers by at least 10% per
annum
SOS 4.1.7) Increase the EMS skills pool by increasing the number of ILS
student intakes to 300 by March 2020 (Reviewed 2017/18)
SOS 4.1.8) Increase the number of Medical Ortho Prosthetics (MOPs) who
successfully completed the degree course at Durban University of
Technology (DUT) to 61 (cumulative) by March 2020 (Reviewed 2017/18)
SOS 4.1.9) Provide sufficient staff with appropriate skills per occupational
group within the framework of Provincial staffing norms by March 2020
4.1.9) Increase enrolment of Advanced Midwives by at least 10% per
annum pending available budget1
4.1.11) Appoint an average of 10 000 CCGs per annum on contract
4.1.12) Strengthening the dental prosthesis and training platform
Target 2019/20
10 Central Hospitals with standardised
organisational structures and approved
delegations
SO 4.2: Improve Performance Management and Development -
SOS 4.2.1) All personnel comply with performance management
requirements from March 2016 onwards
-
SO 4.3: Accreditation of KZNCN as Institution of Higher Education -
4.3.1) KZNCN accredited as IHE by March 2017 -
STRATEGIC GOAL 5: IMPROVED QUALITY OF HEALTH CARE
STRATEGIC GOAL STATEMENT: Rendering services that are (1) Effective (adherent to an evidence base resulting in improved health
outcomes); (2) Efficient (maximises resource utilisation and avoids waste); (3) Accessible (geographically reasonable, timely and
provided in a setting where skills and resources are appropriate to medical need); (4) Acceptable and patient-centred (takes into
account need and demand and the aspirations of users); (5) Equitable (services that do not vary in quality because of personal
characteristics such as gender, race, ethnicity, geographical location, or socioeconomic status); and (6) Safe (minimises risks and
harm to service users).
STRATEGIC OBJECTIVES AND STRATEGIC OBJECTIVE STATEMENTS
SO 5.1) Improve compliance to the Ideal Clinic and National Core Standards SO 2: Improved quality of health care
SOS 5.1.2) 60% (or more) public health hospitals achieved 75% or more
on National Core Standards self-assessment rate by March 2020
(Reviewed 2017/18)
SOS 5.1.6) Sustain a complaint resolution rate of 95% (or more) in all
public health facilities from March 2020 onwards
SOS 5.1.7) Sustain a 95% (or more) complaint resolution within 25 working
days rate in all public health facilities from March 2020 onwards
Target 2019/20
≥ 75% compliance with national core
standards in 10 Central, 17 Tertiary, 30 Regional
and 15 Specialised Hospitals
SO 5.2) Improve quality of care SO 2: Improved quality of health care
SOS 5.2.1) Increase the percentage of pharmacies that comply with the
SA Pharmacy Council Standards (A or B grading) to 100% by March 2020
SOS 5.2.3) Decrease medicine stock-out rates to less than 1% in PPSD
and all health facilities by March 2020
SOS 5.2.4) Improve pharmaceutical procurement and distribution
reforms
SOS 5.2.5) 100% Public health hospitals score more than 75% on the Food
Service Monitoring Standards Grading System (FSMSGS) by March 2020
SOS 5.2.6) Conduct at least 40 ethics workshops per annum from
2017/18 onwards
SOS 5.2.7) Improve the restoration to extraction ratio to 18:1 or less by
March 2020
Targets 2019/20
100% Patient satisfaction survey rate
85% Patient satisfaction rate
1 Due to budget constraints the intended 10% increase per annum will be reconsidered year on year in line with the available funding envelope
and provision for absorption

ANNUAL PERFORMANCE PLAN 2018/19 – 2020/21
19
Fighting Disease, Fighting Poverty, Giving Hope
The table below shows performance against the 2019 MTSF impact indicator targets.
Table 3: Progress towards MTSF Impact Indicators
Impact indicator South Africa
2009
South Africa
2014
South Africa
2019 Target
KZN
2012
KZN
2016
KZN
2019 Target
Life expectancy at birth
- Total
57.1 Years 62.9 Years At least 65
years
51.5 Years2 56.4 Years3 61.5 Years
Life expectancy at
birth - Male
54.6 Years 60 Years At least 61.5
years
49.2 Years 54 Years 58.4 Years
Life expectancy at birth
- Female
59.7 Years 65.8 Years At least 67
years
53.8 years 58.7 Years 64.5 Years
Under 5 mortality rate 56/1000 live
births
39/1000 live
births
33/1000 live
births
43.4/1000 live
births4
42/1000 live
births
40/1000 live
births
Neonatal mortality
rate5
- 14/1000 live
births
8/1000 live
births
9.2/1 000 live
births
9.7/1000 live
births
8.5/1000 live
births
Infant mortality
rate
39/1000 live
births
28/1000 live
births
23/1000 live
births
32.1/1000 live
births
31/1000 live
births
29/1000 live
births
Maternal mortality ratio
(in facility)
280/100 000
live births
(2008)
269/100 000
live births
(2010)
˂100/100 000
live births
165/100 000
live births
106.7/100 000
live births
95/100 000 live
births
Live birth under 2500g
in facility
- 12.9% 11.6% 12.5% 11.9% 9.5%
Situation Analysis
Demographic Profile
According to Stats SA Mid-Year Population Estimates, the KZN population decreased from 11 079 717 in
20166 to 11 074 784 (19.6% of the total South African population) in 20177. During the same period, the
uninsured population (public sector dependent) decreased from 9 761 231 to 9 756 887.8
Out-migration outstrips in-migration year on year with an average -62 360 (2011-2016) and -53 707 (2016-
2021)9.
According to Stats SA, 31.9% (3 536 736) of the population is younger than 15 years; 48.6% (5 705 895) is
between 20 – 60 years (economically active population); and 7.4% (824 994) older than 60 years
(dependent population).
Nearly 52% of the total population resides in the three economic hubs in the Province i.e. eThekwini
(33.1%), Umgungundlovu (10%) and King Cetshwayo (8.8%). The smallest proportions of the total
population are in Harry Gwala (4.5%) and Amajuba (4.8%). Population densities vary between
2 Life expectancy for 2012 (Stats SA 2012 Mid-Year Estimates); 2015 (Stats SA 2015 Mid-Year Estimates) 3 Life expectancy (total, male & female) based on Stats SA 2016 Mid-Year Estimates 4 U5MR and IMR from the Medical Research Council (2013) – Rapid Mortality Surveillance Report 2012 5 Inpatient neonatal death rate from DHIS 6 Stats SA 2016 Mid-Year Estimates 7 Stats SA 2017 Mid-Year Estimates 8 According to the 2016 General Household Survey, the uninsured population increased from 87.2% in 2014 to 88.1% in 2016 9 Stats SA 2017 Mid-Year Population Estimates

ANNUAL PERFORMANCE PLAN 2018/19 – 2020/21
20
Fighting Disease, Fighting Poverty, Giving Hope
1 502/km2 in eThekwini and 48/km2 in Umkhanyakude, which have a significant impact on access to
services and service delivery.
Based on 2017 population estimates, population decreases are noted in the 0 – 24 age cohorts, most
significant in the 0 – 4 and 5 – 9 age cohorts; and the most significant increases in the 30 – 34 and 35 – 39
age cohorts (Graph 1).
Graph 1: KZN population 2015 - 2017
Source: Stats SA 2015, 2016 and 2017 Mid-year Population Estimates
KZN fertility rates show an overall decline year on year (Graph 2),10 which in turn explains the decrease
in the 0-4 year cohort in the population structure. The decrease is also supported by the consistent
decline in the total number of deliveries in public health facilities in the Province. National fertility rates,
over the same period, were estimated at 2.5; 2.46; 2.43; and 2.41.
Graph 2: KZN fertility rates
Statistics SA estimated a year on year increase in life expectancy for both males and females in KZN
(Graph 3)11. The increase is attributed to inter alia the significant reduction in mother to child
10 Stats SA 2017 Mid-year Population Estimates 11 Stats SA 2017 Mid-Year Population Estimates
0
200 000
400 000
600 000
800 000
1 000 000
1 200 000
1 400 000
1 600 000
0-4 5-9 10-14 15-19 20-24 25-29 30-34 35-39 40-44 45-49 50-54 55-59 60-64 65-69 70-74 75-79 80+
2015 2016 2017

ANNUAL PERFORMANCE PLAN 2018/19 – 2020/21
21
Fighting Disease, Fighting Poverty, Giving Hope
transmission of HIV; improved infant & child survival rates; improved TB outcomes; and the significant
number of HIV positive people on antiretroviral therapy.
Graph 3: Life expectancy in KZN
Social Determinants of Health
Socio economic factors are associated with poor health status and negative health outcomes.
According to the 2016 General Household Survey (GHS), 8.1% of households in KZN live in informal
settlements (15.4% in eThekwini); more than one third of the population (36%) and 50.4% of households
were grant beneficiaries and 26.4% of households received a grant as single source of income.
It is estimated that 76% of households have adequate access to food, 18.2% inadequate access and
5.8% severely inadequate access.
The table below shows district-specific measures of poverty and access to basic services that will have
an impact on health outcomes. The Department therefore considered these variables in prioritisation of
target populations to address equity in service delivery and the optimal health impact.
Table 4: Social determinants of health
District
Po
pu
latio
n
Ho
use
ho
lds
Fe
ma
le h
ea
de
d
ho
use
ho
lds
Mo
nth
ly
inc
om
e R
1 6
00
an
d le
ss
Un
em
plo
ye
d
No
ac
ce
ss t
o
pip
ed
or
tap
wa
ter
No
ac
ce
ss t
o
san
ita
tio
n
Ugu 759 134 127 889 87 215 (68%) 305 891 59 387 26 768 (21%) 8 118 (6%)
Umgungundlovu 1 104 912 270 701 123 916 (46%) 386 848 106 777 22 651 (8%) 8 004 (3%)
Uthukela 702 395 147 097 77 480 (53%) 302 357 58 764 29 647 (20%) 12 321 (8%)
Umzinyathi 527 386 114 085 67 372 (59%) 265 911 29 303 39 236 (34%) 15 082 (13%)
Amajuba 530 447 111 086 52 860 (48%) 216 317 51 053 8 640 (8%) 3 934 (4%)
Zululand 854 893 157 755 85 535 (54%) 383 132 58 245 48 334 (31%) 31 254 (20%)
Umkhanyakude 655 617 128 192 69 098 (54%) 359 124 57 212 53 462 (42%) 26 844 (21%)
King Cetshwayo 968 620 202 961 99 288 (49%) 323 761 65 679 28 291 (14%) 21 515 (11%)

ANNUAL PERFORMANCE PLAN 2018/19 – 2020/21
22
Fighting Disease, Fighting Poverty, Giving Hope
District
Po
pu
latio
n
Ho
use
ho
lds
Fe
ma
le h
ea
de
d
ho
use
ho
lds
Mo
nth
ly
inc
om
e R
1 6
00
an
d le
ss
Un
em
plo
ye
d
No
ac
ce
ss t
o
pip
ed
or
tap
wa
ter
No
ac
ce
ss t
o
san
ita
tio
n
Ilembe 662 413 157 664 72 207 (46%) 286 197 50 619 30 169 (19%) 7 783 (5%)
Harry Gwala 492 203 113 766 62 859 (55%) 223 096 35 020 40 160 (35%) 3 519 (3%)
eThekwini 3 548 516 963 013 386 133 (40%) 1 145 920 434 316 29 807 (3%) 20 474 (2%)
Source: 2016 Stats SA Estimates
Epidemiological Profile
According to Stats SA, the highest proportion of reported deaths was reported in Gauteng (21.3%),
followed by 17% KZN.12 HIV/ AIDS and TB remain the leading causes of death in KZN as illustrated in
causes of years of life lost in Graph 4 below.13
Graph 4: Ten leading causes of years of life lost
Source: District Health Barometer 2015/16
HIV and AIDS
According to 2017 Stats SA estimates14, the Provincial HIV incidence and prevalence rates in the
general population are 0.63% and 18% respectively. The incidence is highest in females aged 15-24
(2.55%) compared with 0.86% for males in the same age group. The HIV prevalence is highest in males
(25.8%) and females (33.8%) in the 25 years and older age groups.
12 Mortality and causes of death in South Africa, 2014: Findings from death notification. Statistics South Africa 13 Massyn N, Peer N, English R, Padarath A, Barron P, Day C, editors. District Health Barometer 2015/16. Durban: Health Systems Trust; 2016 14 http://www.thembisa.org/downloads
2.5%
2.6%
2.6%
3.2%
3.2%
5.5%
5.9%
6.0%
14.8%
17.5%
0.0% 2.0% 4.0% 6.0% 8.0% 10.0%12.0%14.0%16.0%18.0%20.0%
Road injuries
Nephritis/Nephrosis
Accidental gunshot
Ischaemic heart disease
Diabetes Mellitus
Diarrhoeal disease
Lower respiratory Infections
Cerebrovascular disease
Tuberculosis
HIV/ AIDS

ANNUAL PERFORMANCE PLAN 2018/19 – 2020/21
23
Fighting Disease, Fighting Poverty, Giving Hope
840 738 951 462
1 027 700
1 181 691
-
500 000
1 000 000
1 500 000
2013/14 2014/15 2015/16 2016/17
According to 2017 estimates (Thembisa Model), an estimated 1 951 266 people are living with HIV in
KZN, representing 27% of the total number of people living with HIV in South Africa. More than 27 000
people have died from AIDS in KZN (accounting for 20% of total AIDS deaths in SA).
The 28% decline in AIDS deaths between 2013 and 2017 is significant, in spite of the exponential increase
in uptake of the ART programme. Graph 5 illustrates the number of HIV positive people remaining on
ART at the end of March 2017, including 1 129 314 adults and 52 377 children15.
Graph 5: Clients remaining on ART
Source: DHIS (May 2017)
Tuberculosis
Between 2014/15 and 2016/17, the TB treatment success rate increased from 85.3% to 88.7% and the TB
deaths (during treatment) decreased from 1 271 to 561 (56%). The TB notification rate (per 100,000
population) shows a year on year decrease since 2011/12 (Graph 6)16.
Graph 6: TB notification rate per 100 000
Source: ETR.Net (May 2017)
The burden of MDR-TB remains high in KZN with a total of 16 173 new cases diagnosed since 2012. This
has significant implications for programme planning especially in light of the fiscal constraints and
15 2014/15 and 2016/17 Annual Reports – DHIS data 16 ETR.net (TB database)

ANNUAL PERFORMANCE PLAN 2018/19 – 2020/21
24
Fighting Disease, Fighting Poverty, Giving Hope
resource demands to ensure appropriate provision of resources for inpatient and community-based
care.
Maternal Health
The maternal mortality ratio (in public health facilities) shows a steady decline year on year (Graph 7).
Intensified community and facility based programmes to improve early antenatal booking, improved
intrapartum and postnatal care contributed to the improved outcomes.
Graph 7: Maternal mortality in facility ratio and maternal deaths
Source: DHIS (May 2017)
Between 2014/15 and 2016/17, the number of deliveries in public hospitals decreased from 169 928 to
157 470 (in line with the reduction in estimated fertility rate in the Province). During 2016/17, 54.7% of
deliveries were in District Hospitals, 40.5% in Regional, 4.5% in Tertiary, and 0.2% in Central Hospitals.
Neonatal Health
The Neonatal Infection Prevention Policy was reviewed in late 2017/18 and presented for approval. The
Policy makes provision for clinical charts which would address many issues created by poor record
keeping resulting in an increase in medico-legals cases.
Between 2014/15 and 2016/17, the early inpatient neonatal death rate showed a consistent decrease
from 11.1/ 1000 population (2 650 deaths) to 9.7/1000 population (1 736 deaths), fluctuating between
8.1 in Uthukela and 12.5 in Harry Gwala.
During the same period, the mother to child transmission rate decreased from 1.3% to 1.1% (1 003 and
476 children testing HIV positive 10 weeks after birth), ranging between 0.8% in Umzinyathi and Harry
Gwala to 1.5% in Umkhanyakude and Ilembe.
Graph 8, using Perinatal Problem Identification Programme (PPIP) data, depicts the survival rate by
weight which is important when identifying gaps and challenges within the service delivery platform for
neonates.
Children born between 500g to 999g have the lowest chance of survival and require highly specialised
care and equipment to lower the death rate.

ANNUAL PERFORMANCE PLAN 2018/19 – 2020/21
25
Fighting Disease, Fighting Poverty, Giving Hope
Graph 8: Survival rate by weight
Source: PPIP 2016
To increase survival rates, the biggest gains to be made are in the over 1kg weight band and missed
opportunities must be identified to close the gap to improve survival rates.
An intervention is being implemented whereby paediatric wards with low bed utilisations are portioned
off for the establishment or increase of neonate nurseries. This is however only possible with appropriate
infrastructure as the entrance to the neonatal nursery cannot be through the main paediatric ward but
has to be positioned off to the side so it can be enclosed and contained to prevent cross-infection. This
has been successfully done in Manguzi and King Dinizulu Hospitals, and reconfiguration of the
paediatric/ neonatal nursery in Hlabisa Hospital is currently being explored.
Graph 9: Survival rate by weight bands
Source: PPIP 2016
Child Health
Significant progress has been made towards reduction of child mortality. Since 2014/15, inpatient
deaths under 1 year decreased by 964 (25.4%); and inpatient under 5 deaths decreased by 1 461
(30.5%).
Diarrhoea, pneumonia and severe acute malnutrition remain the leading causes of child deaths in KZN.
Incidence rates for all three conditions showed a decrease between 2013/14 and 2016/17 i.e. diarrhoea

ANNUAL PERFORMANCE PLAN 2018/19 – 2020/21
26
Fighting Disease, Fighting Poverty, Giving Hope
with dehydration from 15/1000 to 12.5/1000 (16.7%); pneumonia from 92.2/1000 to 58/1000 (37.1%); and
severe acute malnutrition from 5.6/1000 to 4.6/1000 (17.9%).
The severe acute malnutrition, diarrhoea and pneumonia deaths of children under the age of 5 years
decreased with 44.7%, 33.3% and 43.2% respectively (Graph 10).
Between 2015/16 and 2016/17, the neonatal deaths in facility decreased from 1 945 to 1 736 (10.7%);
the inpatient deaths under 1 year decreased from 3 348 to 2 838 (15.2%); and inpatient deaths under 5
years decreased from 4 215 to 3 326 (21.1%).
Graph 10: Diarrhoea, pneumonia and severe acute malnutrition deaths
Source: DHIS (May 2017)
Non-Communicable Diseases
In South Africa, non-communicable diseases account for 43% of recorded deaths17, while the WHO
predicts that these diseases will account for 73% of deaths and 60% of the disease burden by the year
2020.18
Mental disorders reduce the quality of life, lower life expectancy and increase the risk of co-morbid
physical illness. These disorders often co-occur with other chronic conditions, and exacerbate the
quadruple burden of disease. Research suggests a high prevalence of mental disorders among people
living with HIV19 as well as those diagnosed with TB20, which is specifically relevant to KZN with the high
prevalence of both HIV and TB.
Between 2013 and 2016, the number of new patients on hypertension and diabetes treatment
increased by 7% and 58.2% respectively (Graph 11). The increase in the number of new cases was
expected as a result of intensified screening and early detection at community and facility levels.
17 Mayosi BM, Fisher AJ, Lalloo UG, Sitas F, Tollman SM, Bradshaw D. The burden of non-communicable diseases in South Africa: Lancet.
2009;374:934-47 18 Beaglehole R, Bonita R, Alleyne G, Horton R, Li L, and Lincoln P, et al. UN High-Level Meeting on Non-Communicable Diseases: addressing four
questions. Lancet, 2011;378(9789):449-55 19 Freeman M, Nkomo N, Kafaar Z, Kelly K. Mental disorders in people living with HIV/AIDS in South Africa. S Afr J Psychol.2008;38(3):489-500 20 Peltzer K, Naidoo P, Matseke G, Louw J, McHunu G, Tutshana B. Prevalence of psychological distress and associated factors in tuberculosis
patients in public primary health care clinics in South Africa. BMC Psychiatry. 2012;12:89
347
221
192
300 308
200
405
281 230
0
50
100
150
200
250
300
350
400
450
2014/15 2015/16 2016/117
Diarrhoea death Pneumonia death Severe acute malnutrution death

ANNUAL PERFORMANCE PLAN 2018/19 – 2020/21
27
Fighting Disease, Fighting Poverty, Giving Hope
According to the Demographic Health Survey21 the hypertension prevalence (90/99 – 140/159) is 26.1%
for females and 26.4% for males. Severe obesity, related to the increase in non-communicable diseases,
is 22.5% for females and 5.0% for males (Body Mass Index ≥35.0).
Graph 11: Hypertension & Diabetes new cases
Source: DHIS (May 2017)
Organisational Environment
Service Delivery Platform
Table 5: Public health facilities in service delivery platform
District
PHC Hospitals
Mo
bile
s
Fix
ed
Clin
ics2
2
CH
C’s
Dis
tric
t
Re
gio
na
l
Tert
iary
Ce
ntr
al
Sp
ec
ialis
ed
Tub
erc
ulo
sis
Sp
ec
ialis
ed
Psy
ch
iatr
ic
Ch
ron
ic/
Su
b-A
cu
te
Ugu 17 54 2 3 1 0 0 1 0 0
Umgungundlovu 1623 50 3 2 1 1 0 2 3 0
Uthukela 14 36 1 2 1 0 0 0 0 0
Umzinyathi 13 51 1 4 0 0 0 0 0 0
Amajuba 8 25 1 1 224 0 0 0 0 0
Zululand 16 70 1 5 0 0 0 1 (+2)25 1 0
Umkhanyakude 1826 57 0 5 0 0 0 0 0 0
King Cetshwayo 18 61 1 6 127 1 0 0 0 0
Ilembe 11 34 2 3 1 0 0 0 0 0
Harry Gwala 13 39 1 4 0 0 0 1 1 0
21 South Africa Demographic & Health Survey 2016 – Stats SA 22 Includes Provincial and Local Government clinics 23 Includes 1 LG Mobile 24 Newcastle Hospital rendering Mother & Child Services 25 Includes Siloah Lutheran and Mountain View State Aided TB Hospitals 26 Includes 1 State Aided Mobile 27 Queen Nandi Hospital rendering Maternal & Child Health services for Northern KZN

ANNUAL PERFORMANCE PLAN 2018/19 – 2020/21
28
Fighting Disease, Fighting Poverty, Giving Hope
District
PHC Hospitals
Mo
bile
s
Fix
ed
Clin
ics2
2
CH
C’s
Dis
tric
t
Re
gio
na
l
Tert
iary
Ce
ntr
al
Sp
ec
ialis
ed
Tub
erc
ulo
sis
Sp
ec
ialis
ed
Psy
ch
iatr
ic
Ch
ron
ic/
Su
b-A
cu
te
eThekwini 36 11228 829 3 6 1 1 2 1 2
KZN Total 180 589 21 38 13 3 1 9 6 2
Catchment populations per clinic, influenced by the unique topography and demography in the
Province and location of facilities, vary between 4 500 and 32 260. Inequities in allocation of human
resources will be addressed as part of the Essential Post List Project.
Regional Hospitals render a significant proportion of District Hospital package of services mainly due to
the population distribution and location of these hospitals. This arrangement ensures improved access
to district level of care, although it has significant cost implications. The current hospital information
system is not making provision for quantifying district and regional patients, which affects decision-
making and resource allocation.
Clairwood Hospital is rendering mainly step-down services for eThekwini. A Kangaroo Mother Care
(KMC) ward has been commissioned in the hospital in 2016/17 to improve access for under-weight
babies. Storm damage to the hospital impacts negatively on utilisation at the moment.
King Edward VIII Hospital (classified as Central Hospital and rendering approximately 50% regional and
50% tertiary services) was reported as Tertiary Hospital in 2016/17 following a Management Committee
(ManCo) resolution. Resourcing the hospital as central poses a challenge also exacerbated by
infrastructure challenges that impact on its ability to develop to Central Hospital.
McCords Provincial Specialised Eye Care Hospital is currently classified as a District Hospital although it
started reporting as Regional Hospital since the change of package of services.
King Dinuzulu Hospital, classified as Regional Hospital, is reported as a District Hospitals (400 level 1 beds)
in the APP. This will be addressed as part of the Hospital Rationalisation Plan.
Organisation Structure and Human Resources
Figure 1 represents the approved macro structure (level 14 – 16) that has been aligned with the
mandate and core business of the Department. Due to fiscal constraints and necessary austerity
measures, a decision was taken not to fill the 4 Regional Chief Director posts. Alternative service
arrangements have been made to ensure effective leadership and oversight at district and facility
levels.
The Department will review the macro structure once the generic structure, developed by the
Department of Public Service Administration (DPSA), has been approved by the National Health
Council.
Review of facility structures commenced taking into consideration designation of facilities, package of
services per level of care, and alignment of the service delivery and training platforms to also
28 Includes 47 Public Health, 56 LG and 9 NGO clinics 29 Include 1 CHC managed dually (Province and LG)

ANNUAL PERFORMANCE PLAN 2018/19 – 2020/21
29
Fighting Disease, Fighting Poverty, Giving Hope
accommodate implementation of the Decentralised Training Model in collaboration with the University
of KwaZulu-Natal (UKZN).
Figure 1: Macro Organisational Structure
MEC for Health
Head: Health
Branch: Financial Management Services
Deputy Director General
Branch: Corporate Management Services
Deputy Director General
Branch: District Health Services
Deputy Director General
Chief Directorate: Risk Assurance Management
Chief Director
Branch: Specialised Services & Clinical
SupportDeputy Director General
Chief Directorate: Infrastructure Development, Maintenance & Technical
ServicesChief Director
Clinical SupportChief Director
Emergency Medical Services
Chief Director
Hospital ServicesChief Director
Forensic Pathology Services
Chief Director
Hospital Support Programmes
Chief Director
Professional Standards & ComplianceChief Director
Strategic Health Programmes
Chief Director
District Hospitals & PHCChief Director
Region 1Chief Director
Region 2Chief Director
Region 3Chief Director
Region 4Chief Director
Strategic Planning & Support
Chief Director
Non-Communicable Diseases
Chief Director
OmbudspersonDirector
Budget Planning, Management &
ControlChief Director
Financial Accounting & Reporting
Chief Director
Supply Chain ManagementChief Director
Information technologyChief Director
Human Resource Practices, Labour Relations and EAP
Chief Director
Human Resource Development, Planning
and ODChief Director
Legal ServicesChief Director
Corporate Communications
Chief Director
Employment, Vacancy and Turnover Rates
At the end of March 2017, there were 69 924 employees in the Department (72% female and 28% male)
of which 91.9% were employed on a permanent basis and the rest on contract (including interns,
community service personnel and student/pupil nurses).
Equity: 42% Senior Management positions were filled by females; 86% of posts incumbents were
Africans; 2% Whites, 2% Coloureds and 10% Indians; and 0.58% of incumbents were classified as
disabled.
Age profile: The workforce is relatively young with 3.7% of employees’ under the age of 25 years; 46%
aged 25 to 40 years; 39.5% aged 41 to 55 years; 7.8% aged 56 to 60 years; 3% aged 61 to 65 years; and
0.1% over 65 years.
Vacancy rates: Between 2015/16 and 2016/17, the total vacancy rate increased from 8.4% to 11.6%,
mainly due to an increase in post levels 9-12 (13.9%) and 13-16 (13.4%). Vacancy rates per Programme
varied between 25% (Programme 1) and 9.7% (Programme 3). The vacancy rates in Programmes 2, 4
and 5 (11.4%, 11% and 11.2%) is a concern as it impacts on service delivery.
Graph 12 illustrates the vacancy rates per salary band.

ANNUAL PERFORMANCE PLAN 2018/19 – 2020/21
30
Fighting Disease, Fighting Poverty, Giving Hope
Graph 12: Vacancy rate per salary band
Source: 2016/17 Annual Report (HR Oversight Report)
Fiscal constraints and pressure on the Cost of Employee budget has had a significant impact on the
filling of posts during 2016/17 and 2017/18. The hospital efficiency study and Essential Post List Project
that commenced in 2017/18 will be used to improve equity in resource allocation within the available
funding envelope.
Turnover Rate: Between 2015/16 and 2017/18 the total turnover rate decreased slightly from 7.4% to
7.1%. High turnover rates of especially Allied Workers, Medical Officers and Medical Specialists (Graph
13) are of concern and innovative strategies are being explored to retain these professionals.
Graph 13: Vacancy and Turnover rates – critical occupations
Source: 2016/17 Annual Report (HR Oversight Report)
Disability Leave
Although the number of employees using disability leave has decreased since 2015/16 (Table 6) the
average number of days taken by employees increased significantly. The health and wellness
0.0%
5.0%
10.0%
15.0%
20.0%
25.0%
30.0%
35.0%
40.0%
0.0%
5.0%
10.0%
15.0%
20.0%
25.0%
30.0%
35.0%
40.0%
Vacancy rate Turnover rate

ANNUAL PERFORMANCE PLAN 2018/19 – 2020/21
31
Fighting Disease, Fighting Poverty, Giving Hope
programme increased outreach to employees and expanded physical activity opportunities at district
and Head Office levels.
Table 6: Disability leave 2015/16 – 2016/17
Salary Band
Number of employees
using disability leave
Average number of days
per employee
Estimated cost
R’000
2015/16 2016/17 2015/16 2017/18 2015/16 2016/17
Salary level 1-2 287 80 25 46 R 3 265 R 1 674
Salary level 3-5 1 706 460 22 48 R 23 901 R 16 614
Salary level 6-8 758 200 23 55 R 18 026 R 12 457
Salary level 9-12 595 191 26 48 R 29 738 R 17 204
Salary level 13-16 12 14 16 62 R 712 R 3 209
Total 3 358 945 112 259 R 75 642 R 51 158
Source: 2016/17 Annual Report (HR Oversight Report)
Imbalances in Service Structures and Staffing Mix
Imbalances in staffing allocation and distribution still exist in a number of facilities. Facility structures are
being reviewed to ensure appropriate posts based on classification and package of services.
Distribution of human resources is being addressed through the Essential Post List Project that includes
identification of essential posts based on service demands and package of services per level of care,
addressing inequities in allocation of resources, and ensuring optimal utilisation of scarce resources
through implementation of the Service Rationalisation Plan. The project commenced in late 2017/18
and will be finalised in 2018/19.
Table 7: (A2) Health Personnel – 2016/17
Categories of Staff Number
employed
% of total
employed
Number
per 100,000
people
Number
per 100,000
uninsured
people
Vacancy
rate
% of total
personnel
budget
Annual
cost per
staff
member
Ambulance and Related
Workers
2 805 4.0% 25.3 28.7 9.8% 3.3% R 236 302
Medical Officers 3 544 5.1% 32 36.3 15.0% 10.2% R 690 187
Medical Specialists 798 1.1% 7.2 8.2 30.9% 3.6% R 1 189 095
Dentists 151 0.2% 1.4 1.5 11.2% 0.5% R 725 786
Professional Nurses 17 009 24.3% 153.5 174.3 11.6% 35.0% R 415 900
Pharmacists 835 1.2% 7.5 8.6 12.7% 2.4% R 588 162
Physiotherapists 358 0.5% 3.2 3.7 10.7% 0.6% R 415 175
Occupational Therapists 213 0.3% 1.9 2.2 18.1% 0.3% R 384 381
Radiographers 633 0.9% 5.7 6.5 12.2% 1.3% R 443 857
Dieticians 215 0.3% 1.9 2.2 13.3% 0.4% R 391 576
Other 26 561 38.0% 239.7 272.1 - - -

ANNUAL PERFORMANCE PLAN 2018/19 – 2020/21
32
Fighting Disease, Fighting Poverty, Giving Hope
Categories of Staff Number
employed
% of total
employed
Number
per 100,000
people
Number
per 100,000
uninsured
people
Vacancy
rate
% of total
personnel
budget
Annual
cost per
staff
member
Total 69 924 100% 631.1 716.1 12.9% 100% R 258 235
Source: 2016/17 Annual Report
Performance against 2015-2019 Strategic Goals
Strategic Goal 1: Strengthen health system effectiveness
Table 8: Progress: Strategic Goal 1
Indicator Baseline Actual Target
2014/15 2016/17 2019/20
Approved 2017-2027 Long Term Plan Not approved Not approved Approved
Audit opinion from Auditor General Qualified Qualified Unqualified
Approved annual Procurement Plan Not reported Approved Approved
Percentage of facilities with broadband access Hospitals (3%)
Clinics (44.5%)
Hospitals (9.6%)
Clinics (17.7%)30
40% (all
facilities)
Number of organisational structures approved Not reported 1 100
(cumulative)
Community-based Training in a PHC Model Not reported Implemented Implemented
OHH registration visit coverage 4.1% 25.5% 36.1%
Number ward-based outreach teams Not reported 154 160
PHC utilisation rate 2.9 2.7 2.5
PHC utilisation rate under 5 years 4.4 4.3 3.9
Percentage fixed PHC facilities scoring above 70% on
the Ideal Clinic Dashboard
Not reported 64.2% 100%
Inpatient bed utilisation rate District: 62.8%
Regional: 74.5%
TB: 57%
Psych: 70.4%
Chronic: 56.9%
Tertiary: 83.4%
Central: 67%
District: 57.8%
Regional: 72.1%
TB: 42.65
Psych: 71.2%
Chronic: 52.1%
Tertiary: 71.6%
Central: 66.6%
75% (all
hospitals)
Approved Hospital Rationalisation Plan Nor reported Not approved Approved
Approved EMS Turn-Around Strategy Not reported Not approved Approved
Average number of daily operational ambulances 192 180 220
Number of Orthotic Centres 2 2 4
Percentage facilities reporting clean linen stock out 19% 13% Zero
Number of jobs created through EPWP 4 982 9 687 11 800
(cumulative)
30 The indicator was incorrectly interpreted in 2014/15 and corrected in 2015/16 – hence drop in coverage

ANNUAL PERFORMANCE PLAN 2018/19 – 2020/21
33
Fighting Disease, Fighting Poverty, Giving Hope
PHC Re-engineering
Between 2015/16 and 2016/17, the PHC headcount (in fixed facilities) decreased by 1 544 873 (5%); the
under-5 headcount decreased by 237 357 (4.6%); and PHC patients who entered the health system at
hospital level (unreferred outpatient headcount) decreased by 14 718 (2%). All districts reported a
decrease varying from 2% in Zululand to 11.5% in Ugu.
During 2016/17, a total of 6 110 348 clients accessed health services at community level (service points
other than mobile services, clinics and Community Health Centres). A total of 651 894 households were
visited; 619 020 patients received their chronic medication through 606 community-based distribution
points; 107 234 learners were screened for health conditions through the School Health Programme, and
1 161 Phila Mntwana Centres were operational (346 located in Operation Sukuma Sakhe (OSS) War
Rooms and 461 in Early Child Development (ECD) Centres). A total of 422 454 children have been seen
at these Centres and 8 295 referred for further management.
A total of 9 924 Community Care Givers (CCGs) rendered community-based services receiving support
from 497 CCG Supervisors.
Graph 14 illustrates where clients accessed PHC services during 2016/17. The proportion of PHC clients
accessing health services in places other than fixed facilities include 10% that were registered to access
medication through the Centralised Chronic Medicine Dispensing and Distribution (CCMDD)
programme; 74% received services through ward based outreach teams (Outreach Households); 5%
accessed services at Phila Mntwana Centres; and 11% accessing PHC services at outpatient
departments (not referred).
Graph 14: PHC utilisation
Source: DHIS (May 2017)
To date, 338 schools have been accredited as Health Promoting Schools in partnership with the
Department of Education. Regular follow-up visits ensure sustainability of the 5 key action areas namely
skills, policies, environment, community participation and services.
63% 12%
7%
18% Fixed clinics
CHC's
Mobiles
Outside formal PHC
platform

ANNUAL PERFORMANCE PLAN 2018/19 – 2020/21
34
Fighting Disease, Fighting Poverty, Giving Hope
276
73
51
116
28
80% or more
70% - 79%
60% - 69%
40% - 59%
Less than 40%
Ideal Clinic Programme
According to the March 2017 National Ideal Clinic Report, the Provincial average Ideal Clinic score was
73.8%, ranging between 62% in Harry Gwala and 89% in Umzinyathi. Ilembe, Zululand, King Cetshwayo,
Harry Gwala, Ugu, Umkhanyakude and eThekwini all scored less than the Provincial average.
Of the 544 clinics that conducted self-assessments, 306 achieved Ideal Clinic status i.e. Silver (104 or
33.9%); Gold (180 or 88.5%); and Platinum (22 or 7.2%). A total of 144 (26.5%) clinics scored less than 59%
and are being targeted to improve compliance.
The highest scores were obtained for the Medicines, Supplies & Laboratory Services component (83%)
followed by the Human Resources component (81%). The lowest score were obtained for the Health
System Support component (64%).
The vital elements with the highest failure rates were (1) Restoration of the emergency trolley (46%); and
(2) Resuscitation room equipped with functional basic equipment and resuscitation (40%). The
elements with the lowest failure rate were (1) Sharp containers disposed of when they reach the limit
(1%); and (2) Sharps disposed of in impenetrable tamperproof containers (1%).
Graph 15: Ideal Clinic scores - March 2017
Source: March 2017 National Ideal Clinic Report
Hospital Services
Between 2014/15 and 2016/17, admissions per 1000 population showed a decrease in District Hospitals
(33.5 to 29.6), Regional Hospitals (28 to 23.6), and Central Hospital (2.3 to 0.86). Admissions increased in
Tertiary Hospitals (2.3 to 4.4), Specialised TB Hospitals (0.19 to 1.38) and Specialised Psychiatric Hospitals
(0.37 to 0.86).
Graph 16 illustrates the three year trends in hospital patient footprint. Between 2015/16 and 2016/17,
the OPD headcount decreased by 4.3%, inpatient days by 1.5% and patient day equivalent by 8.2%.
The OPD headcount not referred decreased by 177 347 (19.7%) since 2014/15 which is a positive trend
indicating a shift towards clients entering the public health system at the appropriate level.

ANNUAL PERFORMANCE PLAN 2018/19 – 2020/21
35
Fighting Disease, Fighting Poverty, Giving Hope
51.4%
31.1%
17.6%
Less than 60%
60 and 75%
75% and 100%
0
2 000 000
4 000 000
6 000 000
8 000 000
10 000 000
2014/15 2015/16 2016/17
OPD total headcount Inpatient days PDE
Graph 16: Trends in hospital patient footprint
Source: DHIS (May 2017)
Graph 17 illustrates the 2016/17 bed utilisation rates (all hospital categories). Utilisation of Regional and
Tertiary Hospitals are efficient with 84.6% (11/13) and 100% (3/3) hospitals reporting utilisation rates of
more than 76%. This however raises concerns taking into consideration the vacancy rates in critical
positions e.g. 30.9% for Specialists and 15% for Medical Officers.
Utilisation rates of District and Specialised Hospitals is low with 68.4% and 47.4% reporting utilisation rates
below 60%. Only 2 (5.3%) District, 2 (33.3%) Psychiatric, and 1 (50%) Chronic reported utilisation rates of
75% and more. The relationship between average length of stay, utilisation, availability of resources and
expenditure trends is being explored as part of the efficiency assessment study currently being
conducted.
Graph 17: Total bed utilisation rate
Source: DHIS (May 2017)
Information Management
Rollout of the web-based information system: Phase 1 commenced in December 2016 in hospitals and
CHCs with 336 users trained on WebDHIS. Information captured at these facilities is available at district,
provincial and national levels within 24 hours, which significantly reduces the led time. Information
Technology (IT) is fast tracking connectivity in clinics for implementation of Phase 2 of the project in PHC
clinics. Training of Provincial and District Programme Managers on use of the WebDHIS encourages use
of information for monitoring and planning purposes.

ANNUAL PERFORMANCE PLAN 2018/19 – 2020/21
36
Fighting Disease, Fighting Poverty, Giving Hope
Standardise/ rationalise data collection tools: All data collection tools at hospital and PHC level have
been aligned to the National Indicator Data Set (NIDS) 2017, and consultations with Programme
Managers informed the selection of the Provincial Indicator Data Set (PIDS). The project for the
rationalisation of registers continued with customised registers at PHC clinics.
TIER.Net scale-up: Between 2015/16 and 2016/17, the number of Tier2 Phase 6 sites increased from 598
to 637, with 39 new facilities signed off (fully digitised HIV patient records and eligible to report on ART
Quarterly Cohort Indicators).
Integrated TB/HIV Information System (THIS): All districts were trained on the new integrated TB/HIV
Information System (TIER.net with TB module). Implementation of the new system commenced in March
2017 in 83 targeted sites.
Data Capturers: Data Capturers were appointed (funded through the HIV/TB Conditional Grant) and
deployed in clinics and hospitals in Amajuba, Uthukela, Umzinyathi, Umgungundlovu, Umkhanyakude
and Harry Gwala Districts to maintain routine data systems i.e. DHIS, TIER.net and ETR.net.
Hospital Information System: The Meditech full package of modules is available in IALCH, Addington
and King Dinuzulu Hospitals, and the billing module in Greys, Vryheid, Newcastle, Dundee, Ladysmith
and RK Khan Hospitals. The Proc-Lin system is used at St Aidens and King Edward Vlll Hospitals, and the
TrackCare System at McCords Hospital. Other hospitals are dependent on manual systems for clinical
services.
Medico-Legal Litigation
A series of Medico Legal Indabas were conducted to explore mitigation strategies, after which a
Business Plan, detailing specific interventions to reduce and manage litigation more effectively, was
drafted and submitted for approval. A strategy has been put in place to improve clinical governance
and to improve efficiencies in the retrieval of medical records. Adverse Risk Events Committees have
been established in hospitals to ensure immediate response to red flags and workshops were
conducted to sensitise staff on implications of medico legal claims and to strengthening Adverse Events
Committees.
A Quality Improvement and Clinical Governance Framework have been developed to standardise
clinical practice across service platforms – awaiting approval. The Department collaborated with the
Office of Health Standards Compliance to induct Quality Managers, Chief Executive Officers (CEOs)
and District Managers on the management of quality improvement projects, and the Centre for Public
Service Innovation trained CEOs on Innovation Management.
Challenges & Mitigating Strategies
Budget constraints
The ability to respond to health demands exacerbated by the quadruple burden of disease has
become a quandary as a result of the shrinking fiscal envelope. The budget remains inadequate to
respond to existing needs with dire consequences for prioritisation of service demands and the
accompanying resource allocation to sustain such. The Turn-Around Strategy will focus on innovations
to effect cost saving in order to address other critical strategic and operational issues in the short,
medium and long term.
ANNUAL PERFORMANCE PLAN 2018/19 – 2020/21
37
Fighting Disease, Fighting Poverty, Giving Hope
Hospital Services
Bed utilisation, ranging between 15.2% and 97.1%, remains a concern. A District Hospital Efficiency
Assessment Study and Provincial Hospital Audit commenced in 2017/18 with the aim to identify root
causes of hospital inefficiencies and best practices to inform the Rationalisation Plan.
The Essential Post List Project will, in addition, focus on human resource issues that are relevant to service
improvement. This will also inform negotiations for additional funds to ensure an adequately resourced
service platform.
The demand for some clinical services, at especially regional, specialised, tertiary and central level,
exceeded available resources resulted in extended waiting times and backlogs. This put considerable
pressure on the workforce to ensure optimal utilisation of resources. The cost of employee budget was
under extreme pressure during 2016/17, which delayed filling of additional critical posts resulting in
increased clinical backlogs and high workloads. An in-depth analysis of clinical service pressures versus
available resources commenced during 2017/18 to inform the Rationalisation Plan with the aim to
improve efficiencies and access in Regional, Specialised, Tertiary and Central Hospitals.
High vacancy and turn-over rates for especially Clinical Specialists (30.9% and 18.5%), Medical Officers
(15% and 25.8%), and Professional Nurses (11.9% and 6.9%) affected expansion and sustainability of
clinical services.
Turn-Around Strategy & Implementation Plan
The integrated Turn-Around Strategy, that will inform the Strategic Position Statement and Long Term
Plan, commenced in late 2016/17 and has not been finalised. The Strategy (short, medium and long
term) will make provision for interventions targeting (1) Improved audit outcomes; (2) Improved
Financial and Supply Chain Management and processes; (3) Improved Human Resources
Management; (4) Governance and Organisational Arrangements; (5) Infrastructure Development; and
(6) Health Service Rationalisation.
Organisational Structure
A number of facility structures are outdated and not aligned with designations and package of
services. Although Organisational Efficiency Services (OES) commenced with review of structures, the
process is delayed due to the lack of approved staffing norms. The use of WISN (Workload Indicator of
Staffing Needs) will not be used as framework for PHC staffing norms as it is not affordable in the current
fiscal climate.
Medico Legal Claims
The increase in medico legal claims remains a concern and continues to put severe pressure on the
already inadequate budget. Since 2016/17 a significant increase in claims for cerebral palsy cases was
noted. Capacity in the Medico Legal Unit is inadequate to manage the increasing case load, and the
shortage of clinical specialists (especially Radiologists) to investigate cases delay processes. A Business

ANNUAL PERFORMANCE PLAN 2018/19 – 2020/21
38
Fighting Disease, Fighting Poverty, Giving Hope
Plan, including proposed structure and interventions to address medico legal issues has been submitted
for approval. The plan will be implemented in 2018/19.
Information Management
The shortage of registers negatively impacted on recording and reporting of data, which in turn has a
negative impact on interpretation of data trends, planning and decision-making. Steps were taken to
address this shortfall and registers will be available from Central Provincial Stores once the relevant
approvals have been granted.
Quality, management and use of data must be improved. Consultation commenced for the
development of a Data Management Turn-Around Strategy, informed by prevailing challenges that will
be implemented from 2018/19 onwards. There will be a strong focus on multi-sectoral collaboration to
improve system and process efficiencies at all levels of the health system. In support of the strategy, the
Provincial Health Information System Committee Meetings will be revived and a standardised Terms of
Reference will be developed to improve the efficiency of District and Facility Information Committee
meetings.
The lack of an effective hospital information system remains a challenge that impacts negatively on
monitoring, managing and use of data for decision-making. A process commenced to improve access
to routine clinical data using existing systems.
Orthotic and Prosthetic Services
There is a need to expand the Orthotic and Prosthetic service platform to an additional 2 decentralised
sites (Ladysmith and Ngwelezana) to improve access to services. Due to financial limitations it was not
possible in 2017/18 as originally planned. Additional equipment was procured for the 2 existing sites,
which supported outreach services. The proposed Ngwelezana site is in the planning and design phase
and in the U-AMP for the next MTEF.
Strategic Goal 2: Reduce the burden of disease
Table 9: Progress: Strategic Goal 2
Indicator Baseline Actual Target
2014/15 2016/17 2019/20
Life expectancy at birth 50.1 years 56.4 years 61.5 years
Life expectancy at birth – male 49.2 years 54 years 58.4 years
Life expectancy at birth - female 51 years 58.7 years 64.5 years
HIV incidence 1.01% 1.01% 1% or less
Client tested for HIV (including ANC) 2 067 065 9 929 024 16.5 million
Adults remaining on ART - total 951 462 1 181 691 1.5 million
TB client treatment success rate 85.3% 88.7% 90% or more
TB incidence (per 100 000 population) 828/ 100 000 511.3/ 100 000 400/ 100 000

ANNUAL PERFORMANCE PLAN 2018/19 – 2020/21
39
Fighting Disease, Fighting Poverty, Giving Hope
Indicator Baseline Actual Target
2014/15 2016/17 2019/20
TB death rate 4.3% 3.2% 5%
TB-MDR treatment success rate Not reported 60% 65% or more
Infant mortality rate (per 1000 live births) 32/ 1000 31/ 1000 29/1000
Infant PCR test positive around 10 weeks rate 1.3% 1.1% Less than 0.5%
Under 5 mortality rate (per 1000 live births) 43/ 1000 42/ 1000 40/ 1000
Child under 5 years severe acute malnutrition incidence
(per 1000 population)
6.3/ 1000 4.6/ 1000 4.6/ 1000
Maternal mortality in facility ratio (per 100 000 live births) 124.9/ 100 100 106.7/ 100 000 95/ 100 000
Couple year protection rate 57.8% 53.9% 36%
Cervical cancer screening coverage 30 years and older 70.3% 86% 85% or more
Hypertension incidence (per 1000 population) 19.2/ 1000 21.8/ 1000 23/ 1000
Diabetes incidence (per 1000 population) 1.6/ 1000 2.8/ 1000 3.1/ 1000
Malaria incidence per 1000 population at risk 1.03/ 1000 0.3/ 1000 Zero new local
Malaria case fatality rate 1.05% 1.2% Less than 0.5%
HIV, AIDS and Sexually Transmitted Infections (STIs)
Implementation of the 90-90-90 strategy gained momentum with an exponential increase in the number
of people remaining on ART.
Numerous prevention programmes have been scaled up and sustained at community and facility levels
including the Unfinished Business Project; Hlola Manje Zivikele campaign; Dreams project in partnership
with PEPFAR, Gates Foundation and Nike Foundation to reduce HIV infections among adolescent girls
and young women; the universal test and treat strategy; and dual protection strategy including the She
Conquers programme targeting young women and girls to reduce unwanted pregnancies and reduce
new HIV and STI infections. Services at Institutions of Higher Education were expanded in partnership
with HEAids (Higher Education HIV and AIDS Programme) to increase access to prevention and
treatment of HIV.
Results from the District Health Expenditure Review show significant district variations in expenditure for
HIV services. For example, the cost to administer an HIV test ranged between R 227 in Umkhanyakude
and R 97 in Umzinyathi; and the Medical Male Circumcision cost per unit varied between R 637 in
Amajuba and Umkhanyakude to R 209 in King Cetshwayo.
Expenditure on HIV/AIDS increased by R 403.2 million (12.9%) which is higher than the CPIX index for the
same period. The HIV/AIDS Policy however changed during this period which makes provision for all
people diagnosed with HIV to start on ART treatment regardless of their CD4 count. ART medication
accounted for R 1.616 billion of the HIV/AIDS Conditional Grant.
Tuberculosis
Between 2015/16 and 2016/17, the TB new client treatment success rate increased by 5% (88.7%); and
the TB cure rate by 5.4% (84.1%). Early detection, and improved management and follow-up had a
positive impact on the death rate as illustrated in Graph 18.

ANNUAL PERFORMANCE PLAN 2018/19 – 2020/21
40
Fighting Disease, Fighting Poverty, Giving Hope
Graph 18: TB lost to follow up and death rate
Source: ETR.Net (March 2017)
The Department expanded integrated patient centered care focusing on TB screening and
management at community and facility levels. At the end of March 2017, a total of 4 744 233 people
were screened for TB at facility level and 180 026 at community level. During the same period, a total of
2 904 MDR-TB patients started on treatment and 2 185 successfully completed treatment.
The TB programme is being implemented at Correctional Facilities including screening of inmates and X-
rays on admission and 6 monthly or annually depending on duration of stay.
Maternal, Child and Women’s Health
Programmes to reduce maternal mortality show positive results with maternal deaths decreasing year
on year. Since 2013/14, deaths decreased by 32% (280 to 190).
Deliveries in public health facilities decreased by 7.8% since 2013/14, with no plausible reason for the
spike in 2014/15 (Graph 19). The estimated year on year decrease in fertility rate (from 2.7 in 2011-2016
to 2.58 in 2016-202131) may be one of the contributory factors in the decreased deliveries.
Contraceptive coverage remains low and seems not to have a significant impact.
Graph 19: Deliveries vs. Couple year protection rate
Source: DHIS (May 2017)
31 2017 Mid-Year Population Estimates – Statistics South Africa
4.1% 4.0% 4.1% 4.3%
3.4% 3.2%
0.0%
1.0%
2.0%
3.0%
4.0%
5.0%
2014/15 2015/16 2016/17
Loss to follow up Death rate
194 758 203 742 186 063 179 540
45%
58% 52% 54%
0%
10%
20%
30%
40%
50%
60%
70%
160 000
170 000
180 000
190 000
200 000
210 000
2013/14 2014/15 2015/16 2016/17
Total Number of deliveries in facilty
Couple year protection

ANNUAL PERFORMANCE PLAN 2018/19 – 2020/21
41
Fighting Disease, Fighting Poverty, Giving Hope
Early antenatal care has been identified as one of the priorities to improve maternal health outcomes.
Since 2014/15, the antenatal visits before 20 weeks increased by 71.2% (Graph 20). This has been
attributed to increased community awareness and community-based pregnancy testing by CCGs to
improve early referral and booking for antenatal care. The graph below illustrates the relationship
between 1st antenatal visits and 1st visits before 20 weeks.
Graph 20: Antenatal 1st visit before 20 weeks
Source: DHIS (May 2017)
Other initiatives that contributed to the reduction of maternal deaths included the robust
implementation and monitoring of the Partogram; Quality Improvement Programme in labour wards;
up-skilling of staff through training in the Essential Steps in the Management of Obstetric Emergencies;
and integrated management of TB and HIV in pregnancies; campaigns against illegal abortions to
reduce maternal deaths from septic abortions; and ensuring access to ARVs for eligible pregnant
women.
Significant progress has been made towards the reduction of neonatal and child mortality. Since
2014/15, inpatient neonatal deaths decreased by 700 (26.4%); inpatient deaths under 1 year with 964
(25.4%); and inpatient under 5 deaths with 1 461 (30.5%).
The number of children under the age of 1 year that were fully immunised (189 516) is lower than
expected with 10 districts reporting coverage below the 90% target (Graph 21).
136 813 133 761 135 367 140 867
242 759 233 593 208 903 200 689
0%
10%
20%
30%
40%
50%
60%
70%
80%
-
50 000
100 000
150 000
200 000
250 000
300 000
2013/14 2014/15 2015/16 2016/17
ANC 1st visit before 20 weeks ANC 1st Visit total
ANC before 20 weeks rate

ANNUAL PERFORMANCE PLAN 2018/19 – 2020/21
42
Fighting Disease, Fighting Poverty, Giving Hope
Graph 21: Immunisation coverage under 1 year
Source: DHIS (May 2017)
Various child health initiatives contributed to improved child health outcomes. Phila Mntwana Sites,
focusing on health promotion, disease prevention, and enhanced access to social relief packages
through intra-departmental linkages, increased from 1 098 to 1 161 sites. A total number of 422 454
children were screened for malnutrition, TB, HIV, immunisation and physical and psychological
development, and 8 295 referred for further management.
Intensified implementation of Integrated Management of Childhood Illness (IMCI) ensured that children
are treated early to prevent hospitalisation. Accreditation of neonatal wards and hospital quality
improvement plans, aligned to Recommendations of the National Committee on Morbidity and
Mortality (CoMMIC) in children under 5, are monitored actively.
Non-Communicable Diseases
Implementation of mental health programmes, including substance abuse programmes, were
prioritised and actively monitored. High vacancy rates of Specialists and Specialised Mental Health
Nurses remain a serious concern especially taking into account fiscal constraints and the impact on the
filling of vacant posts. Consultation for the rationalisation of specialised psychiatric services
commenced as part of the Rationalisation Plan.
Early detection and routine screening have been prioritised for hypertension and diabetes to ensure
early management and effective follow up of patients on treatment. Implementation of the integrated
90-90-90 strategy and integrated healthy lifestyle programmes further improved prevention and
treatment programmes for non-communicable diseases.
Challenges & Mitigating Strategies
Specialised TB Hospitals
New MDR-TB treatment regimens require longer hospitalisation (inpatient care), which challenge the
current distribution of MDR-TB beds (that comply with IPC and infrastructure requirements). The lack of
MDR-TB decentralised sites in Amajuba, Uthukela and Ilembe puts undue pressure on King Dinuzulu
Hospital and takes patients away from place of residence. Inadequate TB Teams for effective
108.6%
87.3% 85.5% 85.4% 83.7% 81.1% 77.4% 76.9% 76.8% 75.8% 70.4%
62.3%
-10.0%
10.0%
30.0%
50.0%
70.0%
90.0%
110.0%
eTh
ekw
ini
Um
zin
ya
thi
Ilem
be
Kw
aZu
lu-N
ata
l
Um
kh
an
ya
ku
de
Kin
g C
ets
hw
ayo
Uth
uke
la
Am
aju
ba
Zu
lula
nd
Ug
u
Ha
rry G
wa
la
Um
gu
ng
un
dlo
vu
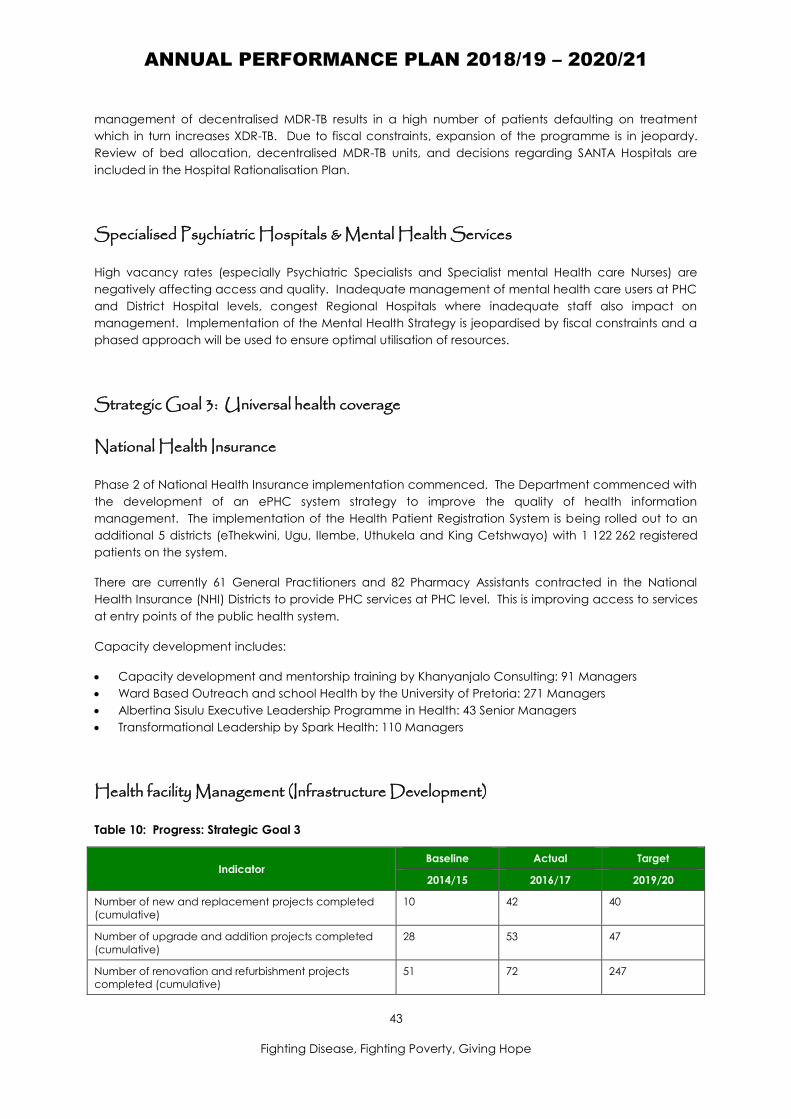
ANNUAL PERFORMANCE PLAN 2018/19 – 2020/21
43
Fighting Disease, Fighting Poverty, Giving Hope
management of decentralised MDR-TB results in a high number of patients defaulting on treatment
which in turn increases XDR-TB. Due to fiscal constraints, expansion of the programme is in jeopardy.
Review of bed allocation, decentralised MDR-TB units, and decisions regarding SANTA Hospitals are
included in the Hospital Rationalisation Plan.
Specialised Psychiatric Hospitals & Mental Health Services
High vacancy rates (especially Psychiatric Specialists and Specialist mental Health care Nurses) are
negatively affecting access and quality. Inadequate management of mental health care users at PHC
and District Hospital levels, congest Regional Hospitals where inadequate staff also impact on
management. Implementation of the Mental Health Strategy is jeopardised by fiscal constraints and a
phased approach will be used to ensure optimal utilisation of resources.
Strategic Goal 3: Universal health coverage
National Health Insurance
Phase 2 of National Health Insurance implementation commenced. The Department commenced with
the development of an ePHC system strategy to improve the quality of health information
management. The implementation of the Health Patient Registration System is being rolled out to an
additional 5 districts (eThekwini, Ugu, Ilembe, Uthukela and King Cetshwayo) with 1 122 262 registered
patients on the system.
There are currently 61 General Practitioners and 82 Pharmacy Assistants contracted in the National
Health Insurance (NHI) Districts to provide PHC services at PHC level. This is improving access to services
at entry points of the public health system.
Capacity development includes:
Capacity development and mentorship training by Khanyanjalo Consulting: 91 Managers
Ward Based Outreach and school Health by the University of Pretoria: 271 Managers
Albertina Sisulu Executive Leadership Programme in Health: 43 Senior Managers
Transformational Leadership by Spark Health: 110 Managers
Health facility Management (Infrastructure Development)
Table 10: Progress: Strategic Goal 3
Indicator Baseline Actual Target
2014/15 2016/17 2019/20
Number of new and replacement projects completed
(cumulative)
10 42 40
Number of upgrade and addition projects completed
(cumulative)
28 53 47
Number of renovation and refurbishment projects
completed (cumulative)
51 72 247

ANNUAL PERFORMANCE PLAN 2018/19 – 2020/21
44
Fighting Disease, Fighting Poverty, Giving Hope
Infrastructure demands far outstripped available budget, which inevitably delays prioritised projects.
Ageing infrastructure across the service platform requires significant investment which has put pressure
on the limited budget also taking into consideration required standards for National Core Standards.
Challenges with contractors delayed a number of projects in 2016/17 with significant cost and
commissioning implications. The Department accelerated the appointment of built environment
professionals at Head Office Level, with the main aim to improve infrastructure planning, oversight on
project implementation and maintenance.
Various Units within the Department have contributed towards development of the User Asset
Management Plan (U-AMP), Infrastructure Programme Management Plan (IPMP), and Annual
Implementation Plan (AIP). All plans have been costed to ensure effective management and
compliance with the Public Finance Management Act (PFMA) imperatives. The Department used the
Department of Public Works as Implementing Agent of choice.
The AIP (Annual Implementation Plan) focused on the following main priorities:
Construction of the new 500-bed Dr Pixley ka Isaka Seme Regional Hospital in the KwaMashu,
Inanda, Ntuzuma (INK) area.
Ngwelezana Tertiary Hospital: Construction of new 192-bed Surgical Wards.
Stanger Hospital: Construction of a Maternity Block. The contractor on this project is not performing
well and the project may therefore finish later than the contractual completion date.
Construction of the new Jozini CHC.
Commissioning of the completed Usuthu Replacement Clinic.
Major refurbishment and upgrading projects were undertaken at Madadeni Regional Hospital, King
Edward Vlll Tertiary Hospital, Charles Johnson Memorial District Hospital and Mbongolwane District
Hospital.
Replaced lifts at Addington, Stanger, Eshowe, Vryheid, and Charles Johnson Memorial Hospitals,
and RK Khan and Northdale Nursing Residences.
New autoclaves were commissioned in 6 hospitals namely Ngwelezana, Nkandla, Osindisweni,
McCords, RK Khan and Wentworth Hospitals.
Standby generators were commissioned in 10 hospitals and one CHC namely Appelsbosch,
Bethesda, Catherine Booth, Dunstan Farrell, EG & Usher Memorial, Hlabisa, Mseleni, St Andrews,
Townhill and Umzimkhulu Hospitals and Imbalenhle CHC.
Maintenance was prioritised with a budget allocation of R300 million, which catered for both
preventative and corrective maintenance. Due to the negative impact of drought, institutions
used a portion of this budget to install 20kl water storage tanks in some clinics.
In-house capacity: At the end of the year under review, 76% of the Head Office Infrastructure posts
were filled (17 appointments during the year) of which 39% incumbents are women. The Department
appointed 8 young graduates who are undergoing mentorship under the supervision of chief
professionals. The graduates are in the fields of Electrical and Mechanical Engineering, Quantity
Surveying, Project Management and Architecture. Table 11 shows the progress made in filling of
Infrastructure posts.
The Department identified unused buildings next to the King Dinuzulu Hospital for the establishment of
the eThekwini Maintenance Hub Workshop. Buildings require major refurbishment, and the Department
of Public Works are at the planning stage for refurbishment. The Department deployed 4 members from

ANNUAL PERFORMANCE PLAN 2018/19 – 2020/21
45
Fighting Disease, Fighting Poverty, Giving Hope
the Head Office Structure, led by the Chief Engineer, to start preparatory work for the Hub. It is
anticipated that the concept document for this Hub will be finalised in 2017/18 and staged
implementation will start in April 2018.
During 2016/17, the Department conducted condition audits on Ekhombe Hospital and 7 clinics. Audits
were used to prioritise backlog maintenance for the 2017/18 AIP; and assisted new officials to familiarise
themselves with the Departmental infrastructure asset base; and to facilitate teamwork amongst various
disciplines. Audits will be conducted every year to improve knowledge base of infrastructure assets and
improve the asset register information.
Challenges & Mitigating Strategies
Infrastructure Development
Demand outstrips the funding envelope. Due to fiscal constraints a significant number of projects were
put on hold which will impact on service delivery and impair access to services. The uncoordinated
approach by facilities/ districts in requesting infrastructure projects resulted in duplication of work and
poor briefs for projects. Prioritisation at district level will be managed as part of the Turn-Around
Strategy.
Strategic Goal 4: Strengthen human resources for health
Table 11: Progress: Strategic Goal 4
Indicator Baseline Actual Target
2014/15 2016/17 2019/20
Number of bursaries awarded for 1st year medical
students
Not reported 16 30
Number of bursaries awarded for 1st year nursing students Not reported 108 150
Number of MOPs that successfully completed the
degree course at DUT
Not reported 0 (still in training) 6132
Number of Intermediate Life Support graduates per
annum
54 38 72
Training intakes had to be reviewed to comply with the funding envelope. Absorption of qualifying
personnel is still a challenge, and adequate provision is not always made to action that.
Due to financial constraints, as well as the agreement with Mpumalanga, KwaZulu-Natal College of
Nursing (KZNCN) bursary intake has been drastically reduced with only one intake annually.
A total of 1 501 nurses graduated in 2016/17. To provide for the gap in specialised nursing, a total of
321 Clinical Specialists, 54 Advanced Midwifes and 173 PHC nurses (from UKZN) completed training
for absorption into the system.
A total of 205 students were registered for the R425 programme, of which 108 were bursaries, 15 in-
service learners and 82 Mpumalanga learners.
32 Last 6 of 61 will graduate in 2019/20

ANNUAL PERFORMANCE PLAN 2018/19 – 2020/21
46
Fighting Disease, Fighting Poverty, Giving Hope
Community service and service obligation placements for all bursary obligation students of the
KZNCN were successfully done in all gazetted institutions.
100 Employees, inclusive of 60 Community Care Givers (CCGs) and 40 Lay Counsellors have completed
training through UKZN Extended Learning and are awaiting translation to Health Promotion Assistants.
The challenge is to absorb these students taking into consideration the current funding envelope.
599 Employees were trained on Sign Language in 2016/17. The planned target (220) was exceeded as
additional funding was sourced from a Non-Governmental Organisation (NGO) partner and the
HWSETA (Health & Welfare Sectoral Educational Training Authority).
115 Health and Welfare Sector Education and Training Authority (HWSETA) funded graduates have
been placed in various health establishments receiving a monthly stipend of R 5 000.
116 Technical Vocational Educational and Training (TVET) PSETA funded learners in the Artisan
Programme have been placed in various health establishments.
57 HWSETA funded Dentals Assistant and Oral Hygiene Interns, placed for work experience,
completed their internship in June 2016.
15 HWSETA funded Social Work and Environmental Health Interns completed in November 2016.
39 HWSETA funded TVET learners commenced with a one year experiential training programme in
February 2017.
25 HWSETA funded learners commenced with the two year nursing bridging programme in January
2017.
The Department has entered into a Memorandum of Agreement with Africa Mayibuye Leadership
PTY (LTD) for the funding of 200 TVET learners placed in various health institutions. Learners receive a
monthly stipend of R 1 800 for a period of 18 months.
50 TVET learners, placed at various health facilities, receive a monthly stipend of R 1 500 for the next
eighteen months funded under the agreement entered with LNM Rise PTY LTD.
51 TVET learners have signed with Libalel Enterprise receiving a monthly stipend of R 1 500 and are
placed in various health facilities.
A total of 113 Clinical Associates, funded under the bursary programme, are in training through the
Walter Sisulu University and University of Pretoria. A total of 44 completed training in 2016 and were
placed in various health facilities in January 2017. 42 Occupational Therapy Assistants completed their
training and were translated to Occupational Therapy Technicians; and 42 Occupational Therapy
Assistants completed their training and were translated to Occupational Therapy Technicians.
The Department engaged with the Umgungundlovu TVET to develop Learnerships targeting people with
disabilities to increase the skills pool for people with disabilities. Partnerships are also being formed with
Disabled Peoples’ Organisations with the objective to establish a comprehensive database for suitably
qualified Persons with Disabilities that may take up employment in the Department.
The Department is actively involved in collective bargaining at Public Health and Social Development
Sectoral Bargaining Council (PHSDSBC), Provincial Chamber and Provincial Labour Relations Forum, and
monitors the activities of Institutional Management and Labour Committees (IMLCs). Labour Relations
Officials from district offices and hospitals completed a course on Presiding and Investigation facilitated
by the Commission for Conciliation, Mediation and Arbitration (CCMA) to improve case management.
Additionally, the Department has improved on timeous finalisation of disciplinary cases. Intervention of
training more Investigating Officers and Presiding Officers has been done in order to extend the pool.
The training was conducted by the Office of The Premier from 27 to 31 March 2017.
The training of Managers was prioritised to improve leadership and management at the different levels
of the health care system. During 2016/17 the following number of Senior Managers participated in
training courses:

ANNUAL PERFORMANCE PLAN 2018/19 – 2020/21
47
Fighting Disease, Fighting Poverty, Giving Hope
Mentoring for Growth – 28 Female Managers.
Leadership Course for Middle Managers – 32 Managers.
Disability Management in the Public Service – 72 Managers.
Project Khaedu Methods and Perspectives – 24 Managers.
Project Khaedu Field Assignment – 24 Managers.
Effective Management Principles for Junior Management – 43 Managers.
Financial Management for Non-financial Managers – 14 Senior Managers.
Project Management Course – 20 Managers.
Ethics and values for Managers – 2 Managers.
Albertina Sisulu Executive and Leadership Programme for Health (ASELPH) – 28 Senior Managers.
Challenges & Mitigating Strategies
Human Resource Development
Alignment of the Training and Development Plan with specific needs and demands from the
operational (service delivery) level is inadequate. District plans are not yet fully aligned with service
needs and demands, which will have an impact on the optimal skills mix at service delivery level.
Vacancies of various essential posts
High vacancy rates are noted in various disciplines as well as essential support positions, which
inevitably impact on service delivery. The Department engaged in a process to identify essential
vacant posts that must be filled to ensure effective service delivery as per mandate and packages of
care at various levels of the service delivery platform. The essential post list will be costed and will serve
as framework for the filling of posts.
Strategic Goal 5: Improved quality of health care
Table 12: Progress: Strategic Goal 5
Indicator Baseline Actual Target
2014/15 2016/17 2019/20
Hospitals achieved 75% and more on National Core
Standards self-assessment rate
District: 133
Regional: 0
Spec TB: 0
Spec Psych: 0
Chronic: 0
Tertiary: 0
Central: 1
District: 0
Regional: 0
Spec TB: 2
Spec Psych: 1
Chronic: 0
Tertiary: 0
Central: 1
60% or more (all
hospitals)
EMS P1 urban response time under 15 min rate 5% 5.1% 20%
EMS P1 rural response time under 40 min rate 32% 34.9% 40%
EMS inter-facility transfer rate 39% 30.2% 50%
33 NCS baselines for hospitals 2015/16

ANNUAL PERFORMANCE PLAN 2018/19 – 2020/21
48
Fighting Disease, Fighting Poverty, Giving Hope
Indicator Baseline Actual Target
2014/15 2016/17 2019/20
Percentage of pharmacies that obtained A and B
grading upon inspection
83% 91% 100%
Tracer medicine stock out rate (PPSD) 6.4% 6.3% Less than 1%
Tracer medicines stock out rate (Institutions) 3% 2% Less than 1%
National Core Standards
Although all facilities implement the National Core Standards (NCSs), self-assessments and the
development of Quality Improvement Plans (QIPs) remain poor. Only 4 hospitals complied with all
extreme measures and at least 90% of the vital measures of the NCSs.
Infection Prevention and Control (IPC)
Reviewed the Provincial IPC Policy (awaiting approval); KZN IPC Guidelines to ensure compliance to the
NCS; Viral Haemorrhagic Fevers (VHF) Policy in collaboration with Communicable Disease Control
(CDC) and the Department of Virology; and the Decontamination Policy have been drafted and
circulated for comments.
All IPC practitioners have been trained on surveillance of healthcare associated infections and
outbreak response. A real time surveillance tool was instituted in 2016/17 to improve data on
healthcare associated infections; serve as an early warning system for outbreaks; monitors turnaround
time for results; and improve stewardship programmes.
Six probable outbreaks in hospitals have been reported. After assessment of the clinical data and
microbiological and epidemiology profiling only four outbreaks were deemed probable cases and
investigated further. The early warning system coupled with rapid outbreak responses resulted in control
of the outbreak and prevention of further morbidity and mortality.
Nosocomial transmission of TB in facilities remains a major concern partly due to non-compliance with
infrastructure standards. The Department focussed on cough triage at the point of entry; fast tracking
patients with symptoms of PTB; open window policy to ensure air flow; and use of personal protective
equipment.
Emergency Medical Services
Between 2015/16 and 2016/17 the P1 emergency calls in urban areas increased slightly by 84 and in
rural areas decreased significantly by 19 343 calls. Response times increased slightly in urban areas from
5% to 5.1% and in rural areas from 32% to 34.9%.
There is a year on year decrease in the number of daily operational ambulances, from 211 in 2013/14 to
the current 180. The ambulance fleet is old with 37% exceeding 250 000km on the clock, which
significantly increase downtime for repairs, and decrease operational ambulances and emergency
response times. Due to the ageing fleet, new ambulances basically replace old ambulances with no
growth in the number of operational ambulances.
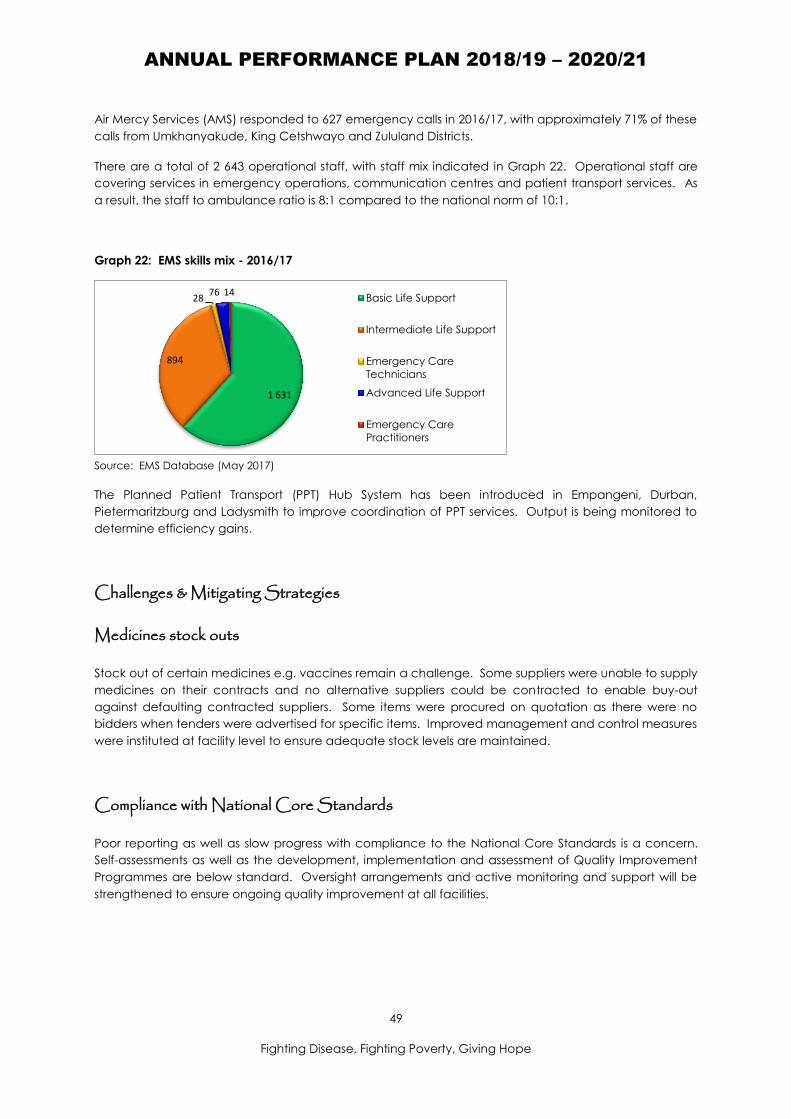
ANNUAL PERFORMANCE PLAN 2018/19 – 2020/21
49
Fighting Disease, Fighting Poverty, Giving Hope
1 631
894
28 76 14
Basic Life Support
Intermediate Life Support
Emergency Care
Technicians
Advanced Life Support
Emergency Care
Practitioners
Air Mercy Services (AMS) responded to 627 emergency calls in 2016/17, with approximately 71% of these
calls from Umkhanyakude, King Cetshwayo and Zululand Districts.
There are a total of 2 643 operational staff, with staff mix indicated in Graph 22. Operational staff are
covering services in emergency operations, communication centres and patient transport services. As
a result, the staff to ambulance ratio is 8:1 compared to the national norm of 10:1.
Graph 22: EMS skills mix - 2016/17
Source: EMS Database (May 2017)
The Planned Patient Transport (PPT) Hub System has been introduced in Empangeni, Durban,
Pietermaritzburg and Ladysmith to improve coordination of PPT services. Output is being monitored to
determine efficiency gains.
Challenges & Mitigating Strategies
Medicines stock outs
Stock out of certain medicines e.g. vaccines remain a challenge. Some suppliers were unable to supply
medicines on their contracts and no alternative suppliers could be contracted to enable buy-out
against defaulting contracted suppliers. Some items were procured on quotation as there were no
bidders when tenders were advertised for specific items. Improved management and control measures
were instituted at facility level to ensure adequate stock levels are maintained.
Compliance with National Core Standards
Poor reporting as well as slow progress with compliance to the National Core Standards is a concern.
Self-assessments as well as the development, implementation and assessment of Quality Improvement
Programmes are below standard. Oversight arrangements and active monitoring and support will be
strengthened to ensure ongoing quality improvement at all facilities.

ANNUAL PERFORMANCE PLAN 2018/19 – 2020/21
50
Fighting Disease, Fighting Poverty, Giving Hope
Emergency Medical Services
The ageing vehicle fleet (with increasing maintenance costs) as well as an inadequate number of
appropriately trained staff to man ambulances remains a concern. Although the Department
purchase vehicles annually, new vehicles just replace old vehicles with no increase in the number of
operational vehicles. The EMS strategy to improve efficiencies will be reviewed to make provision for
identified gaps.
Legislative and Other Mandates
There are no current court rulings that have a significant, ongoing impact on the operations or service
delivery obligations of the Department.
Constitutional Mandates
The Constitution of the Republic of South Africa (Act No. 108 of 1996): In terms of the Constitutional
provisions, the Department is guided by amongst others the following sections and schedules:
Section 27(1): “Everyone has the right to have access to … health care services, including
reproductive health care”.
Section 27 (2): The State must take reasonable legislative and other measures, within its available
resources, to achieve the progressive realisation of each of these rights.
Section 27(3): “No one may be refused emergency medical treatment”.
Section 28(1): “Every child has the right to …basic health care services…”
Schedule 4 list health services as a concurrent national and provincial legislative competence.
Section 195: Public administration must be governed by the democratic values and principles
enshrined in the Constitution.
Section 195 (1b): Efficient, economic and effective use of resources must be promoted.
Section 195 (1d): Services must be provided impartially, fairly, equitably and without bias.
Section 195 (1h): Good human resource management and career development practices, to
maximise human potential must be cultivated.
Legal Mandates
In carrying out its functions, the Department is governed mainly by the following national and provincial
legislated Acts and Regulations. Some of the legislation has a specific or direct impact on the
Department whereas others have a more peripheral impact.
Basic Conditions of Employment Act (Act No. 75 of 1997): Provides for the minimum conditions of
employment that employers must comply with in their workplace.

ANNUAL PERFORMANCE PLAN 2018/19 – 2020/21
51
Fighting Disease, Fighting Poverty, Giving Hope
Child Care Act, 74 of 1983: Provides for the protection, welfare and treatment of certain children
and to provide for incidental matters.
Choice of Termination of Pregnancy Act (Act No. 92 of 1996, as amended): Provides a legal
framework for termination of pregnancies (under certain circumstances) and based on informed
choice.
Chiropractors, Homeopaths and Allied Health Service Professions Act, 63 of 1982: Provides for the
control of the practice of the professions of Chiropractors, Homeopaths and Allied Health
Professions, to determine its functions and matters connected therewith.
Dental Technicians Act, 19 of 1979: Consolidate and amend laws relating to the profession of
Dental Technician and to provide for matters connected therewith.
Division of Revenue Act (Act 7 of 2003): Provides for the manner in which revenue generated may
be disbursed.
Health Professions Act (Act No. 56 of 1974): Provides for the regulation of health professions, in
particular medical practitioners, dentists, psychologists and other related health professions,
including community service by these professionals.
Human Tissue Act (Act No. 65 of 1983): Provides for the administration of matters pertaining to
human tissue.
KwaZulu-Natal Health Act (Act No. 1 of 2009) and Regulations: Provides for a transformed Provincial
Health System within framework of the National Health Act of 2003.
Labour Relations Act (Act No. 66 of 1995): Provides for the law governing labour relations and
incidental matters.
Medicines and Related Substances Act (Act No. 101 of 1965 as amended): Provides for the
registration of medicines and other medicinal products to ensure their safety, quality and efficacy,
and also provides for transparency in the pricing of medicines.
Mental Health Care Act (Act No. 17 of 2002): Provides a legal framework for mental health and in
particular the admission and discharge of mental health patients in mental health institutions.
National Health Act (Act No. 61 of 2003) and Amendments: Provides for a transformed National
Health System to the entire Republic.
National Health Laboratories Services Act (Act No. 37 of 2000): Provides for a statutory body that
provides laboratory services to the public health sector.
Nursing Act (Act 33 of 2005): Provides for the regulation of the nursing profession.
Occupational Health and Safety Act (Act No. 85 of 1993): Provides for the requirements that
employees must comply with in order to create a safe working environment in the workplace.
Public Finance Management Act (Act No. 1 of 1999 as amended) and Treasury Regulations:
Provides for the administration of State funds by functionaries, their responsibilities and incidental
matters.
Preferential Procurement Policy Framework Act (Act No. 5 of 2000): Provides for the implementation
on the policy for preferential procurement pertaining to historically disadvantaged entrepreneurs.

ANNUAL PERFORMANCE PLAN 2018/19 – 2020/21
52
Fighting Disease, Fighting Poverty, Giving Hope
Public Service Act (Act No. 103 of 1994) and the Public Service Regulations: Provisions for the
administration of the public service in its national and provincial spheres, as well as provides for the
powers of ministers to hire and fire.
Pharmacy Act (Act No. 53 of 1974 as amended): Provides for the regulation of the pharmacy
profession, including community service by pharmacists.
Skills Development Act (Act No. 97 of 1998): Provides for the measures that employers are required
to take to improve the levels of skills of employees in the workplace.
Traditional Health Practitioners Act (Act No. 35 of 2004): Regulates the practice and conduct of
Traditional Health Practitioners.
Policy Mandates
Clinical Policies and Guidelines: The Department is implementing and monitoring an extensive
number of clinical health policies to improve management and clinical outcomes.
National and Provincial Data Management Policies: Provides the framework for effective
management of health information at all levels of reporting.
Financial Management Policies: The Department generates financial management policies that
are aligned with legislative and Treasury Regulations.
Provincial Health Research Policy and Guidelines: Provides the policy framework and guidelines for
health research.
Human Resource Policies: The Department contributes to and develops numerous Provincial
Human Resource Policies to ensure compliance to human resource imperatives.
Policy on National Health Insurance: Provides for systems strengthening to ensure universal access
to health care.
Policy on Management of Hospitals: Provides the policy imperatives for management of Public
Health Hospitals.
Regulations Relating to Classification of Hospitals: Provides the policy framework for classification
of Public Health Hospitals.
Planning Frameworks
The National Development Plan 2030
The NDP will be implemented over three electoral cycles with the vision to:
Increase life expectancy, for both males and females, to at least 70 years.
Produce a generation of under-20 year olds that are largely HIV free.
Reduce the burden of disease radically compared to the previous two decades.
Achieve an infant mortality rate of less than 20 deaths per 1000 live births.
Achieve an under-5 mortality rate of less than 30 deaths per 1000 live births.

ANNUAL PERFORMANCE PLAN 2018/19 – 2020/21
53
Fighting Disease, Fighting Poverty, Giving Hope
Achieve a significant shift in equity, efficiency and quality of health care provision.
Achieve universal coverage for health.
Significantly reduce the social determinants of disease and adverse ecological factors.
The Medium Term Strategic Framework 2014-2019 (Health)
Sub-Outcome 1: Universal health coverage progressively achieved through implementation of
National Health Insurance
Sub-Outcome 2: Improve quality of health care
Sub-Outcome 3: Implement the re-engineering of Primary Health Care
Sub-Outcome 4: Reduce health care costs
Sub-Outcome 5: Improve human resources for health
Sub-Outcome 6: Improve health management and leadership
Sub-Outcome 7: Improve health facility planning and infrastructure delivery
Sub-Outcome 8: HIV & AIDS and Tuberculosis prevented and successfully managed
Sub-Outcome 9: Maternal, infant and child mortality reduced
Sub-Outcome 10: Efficient health management information system developed and implemented
for improved decision-making
Sustainable Development Goals 2030
The 13 targets in Goal 3 are relevant to the Health Sector.
By 2030, reduce the global maternal mortality ratio to less than 70 per 100 000 live births.
By 2030, end preventable deaths of newborns and children under 5 years of age, with all countries
aiming to reduce neonatal mortality to at least as low as 12 per 1 000 live births and under-5
mortality to at least as low as 25 per 1 000 live births.
By 2030, end the epidemics of AIDS, tuberculosis, malaria and neglected tropical diseases and
combat hepatitis, water-borne diseases and other communicable diseases.
By 2030, reduce by one third premature mortality from non-communicable diseases through
prevention and treatment, and promote mental health and well-being, strengthen the prevention
and treatment of substance abuse including narcotic drug abuse and harmful use of alcohol.
By 2020, halve the number of global deaths and injuries from road traffic accidents.
By 2030, ensure universal access to sexual and reproductive health care services, including for
family planning, information and education, and the integration of reproductive health into
national strategies and programmes.
Achieve universal health coverage, including financial risk protection, access to quality essential
health care services and access to safe, effective, quality and affordable essential medicines and
vaccines for all.
By 2030, substantially reduce the number of deaths and illnesses from hazardous chemicals and air,
water and soil pollution and contamination.

ANNUAL PERFORMANCE PLAN 2018/19 – 2020/21
54
Fighting Disease, Fighting Poverty, Giving Hope
Strengthen the implementation of the World Health Organization Framework Convention on
Tobacco Control in all countries, as appropriate.
Support the research and development of vaccines and medicines for communicable and non-
communicable diseases that primarily affect developing countries, provide access to affordable
essential medicines and vaccines, in accordance with the Doha Declaration on the TRIPS
Agreement and Public Health, which affirms the right of developing countries to use to the full the
provisions in the Agreement on Trade Related Aspects of Intellectual Property Rights regarding
flexibilities to protect public health, and, in particular, provide access to medicines for all.
Substantially increase health financing and the recruitment, development, training and retention of
the health workforce in developing countries, especially in least developed countries and Small
Island developing states.
Strengthen the capacity of all countries, in particular developing countries, for early warning, risk
reduction and management of national and global health risks.
The Provincial Growth and Development Plan
The PGDP is aligned with the NDP and cover the Provincial Plan of Action.
Strategic Goal 1: Job Creation
Strategic Goal 2: Human Resource Development
Strategic Goal 3: Human and Community Development
Strategic Goal 4: Strategic Infrastructure
Strategic Goal 5: Environmental Sustainability
Strategic Goal 6: Governance and Policy
Strategic Goal 7: Spatial Equity
Provincial Poverty Eradication Master Plan
The Provincial vision is to create a poverty free, food secure, empowered and productive citizenry in
KZN by 2030 with a healthy and skilled population leading a dignified life.
The mission is to eradicate poverty in all its forms in KwaZulu-Natal and to establish a foundation for
individual and community empowerment and prosperity in an economically efficient and
environmentally sustainable manner within a spatial context and incorporating the principles of good
governance, equity and participatory democracy.
Goals
1. Reduce households going hungry in a 12-month period from 35% to less than 25% by 2020.
2. Halve households that lie below the upper bound poverty line by 2030. Achieve 54.7% in 2020 and
33.8% in 2030.
Objectives
1. Address high incidences of malnutrition, hunger and related social ills within KwaZulu-Natal.

ANNUAL PERFORMANCE PLAN 2018/19 – 2020/21
55
Fighting Disease, Fighting Poverty, Giving Hope
2. Accelerate the response to poverty and hunger.
Policy Initiatives
The following National and Provincial Policies, Frameworks and Strategies will be relevant in 2018/19.
Sustainable Development Goals: Target programmes and transversal services relevant to the
development goals and targets.
Medium Term Strategic Framework 2014-2019: Based on the NDP priorities and provides the
framework for the 2015-2019 Strategic Plan and five Annual Performance Plans.
Provincial Growth and Development Plan: Based on the NDP and target province-specific priorities.
Align Strategic Plan and five Annual Performance Plans to ensure integration and working towards
common vision.
Provincial Long Term Plan (including Turn-Around Plan) 2017-2027: Provide the blue print for short,
medium and long term evidence-based plans and taking into consideration service gaps and the
burden of disease. Implementation Plan will provide specific timelines for strategies and activities to
realise the long term transformational vision.
Campaign on Accelerated Reduction of Maternal and Child Mortality in Africa (CARMMA): The
programme will be expanded to improve maternal and child health outcomes.
Integrated Chronic Disease Management Model: The Model will be rolled out and relevant
Provincial policies and Standard Operational Procedures will be reviewed/ developed.
National and Provincial Strategic Plans for HIV, AIDS, STI and TB: Implement the Provincial Plan.
KwaZulu-Natal Monitoring and Evaluation Framework: Implement the approved Framework.
Medical Male Circumcision Escalation Plan: Strategies and activities for MMC will be scaled up as
part of the Prevention Programme for HIV, AIDS, STI and TB (90-90-90 strategy).
National Human Resource for Health Strategy: Human resource audit, gap analysis and costing;
decentralised training platform (with UKZN); and organisational review (micro structures) will be
targeted over the reporting period.
National Nursing Strategy: The Training and Development Plan will be aligned with the Long Term
Plan to ensure effective Human Resource Management Services.
National and Provincial Strategies for Non-Communicable Diseases: The Provincial strategy will be
rolled out in a phased approach taking into account the funding envelope.
National and Provincial Contraceptive Strategies: Implementation will be scaled up as part of the
intensified sexual and reproductive health strategy to improve health outcomes.
National and Provincial MNCWH Strategies: Reviewed implementation plan will be implemented.
Provincial Neonatal Strategy: The strategy will be scaled up to all facilities and relevant policies will
be developed or reviewed.
PHC Re-Engineering: PHC re-engineering will be scaled up with a strong focus on community-based
services, Ideal Clinic Realisation and Maintenance and system strengthening.

ANNUAL PERFORMANCE PLAN 2018/19 – 2020/21
56
Fighting Disease, Fighting Poverty, Giving Hope
Provincial Mental Health Care Strategy 2014-2019: The Provincial strategy will be implemented using
a phased approach.
Clinical policies: Relevant policies will be reviewed or developed and implemented to standardise
and improve quality of care.
Emergency Medical Services: Finalise the EMS Strategy in line with EMS Regulations and reforms.
Data Management Policy and Turn-Around Strategy: Improve effective management of health
information through the District Health Information System.
Provincial Poverty Eradication Master Plan: Integrated Provincial strategy to address poverty in KZN.
The strategy and implementation will be monitored through the Office of the Premier.
Operation Phakisa Ideal Clinic Realisation and Maintenance: Integrated into PHC re-engineering.
The focus for 2018/19 will be on expanding the programme with a focus to improve service delivery,
quality of care and patient satisfaction.
90-90-90 strategy for HIV/AIDS and TB: Strategy will be scaled up towards reaching the 2020 targets.
90-90-90 integrated strategy for Non-Communicable Diseases: Implementation of strategy will be
scaled up with a strong focus on screening, early detection and management of non-
communicable diseases.
Strategic Planning Process
Different approaches/ methodologies have been used during the planning cycle to identify and
prioritise the 2018/19 priorities using the top-down and bottom-up approach. Five training courses have
been facilitated to develop capacity on essential planning approaches & methodologies including
Population-Based Planning; Theory of Change, Bottleneck Analysis; Root Cause Analysis; Prioritisation
Matrix and Problem-Solving. The SWOT (Strengths, Weaknesses, and Opportunities & Threats) analysis
further informed prioritisation and decision-making.
Conducted 15 integrated District Health Expenditure Review workshops to inform the 2018/19 HIV/AIDS
Conditional Grant allocation as well as district and facility budgets, and inform the 2018/19 priorities.
This process includes the aggregation of 2018/19 performance information targets using the bottom-up
and top-down approach. Aggregation of targets will be finalised during Provincial and District
consultative processes. Final targets will be confirmed during a bilateral with the National Department
of Health in February 2018.
The Department conducted quarterly reviews (Provincial and District) to monitor implementation of
plans and identify pressure areas and challenges. The first draft District Operational Plans (DOPs) with
complete Conditional Grant targets/ activities were submitted in the second quarter. Engagements
between districts, facilities and province followed this process to discuss and justify district and provincial
targets. The Operational Plan template was finalised in the second quarter and workshops were
facilitated to finalise templates (all Components) for 2nd quarter reporting. Facility planning workshop
attended by Hospital CEOs, M&E Managers, Quality Assurance, and Facility Information Officers to
discuss facility planning and M&E. Finalise the customised Facility Strategic Plan and Annual Plan
Templates for implementation from 2018/19 onwards. First Provincial Planning workshop planned for the
end of September 2017 to confirm 2018/19 priorities and focus areas.

ANNUAL PERFORMANCE PLAN 2018/19 – 2020/21
57
Fighting Disease, Fighting Poverty, Giving Hope
Quarter 3 (October – December): Branch and Component consultation to align the Annual
Performance Plan and District/ Facility annual Plans with Provincial priorities and budget. Mid-year
review conducted (November 2017) to determine progress against targets and to discuss interventions
to improve performance.
Quarter 4 (January – March): A ManCo Caucus Meeting was conducted in preparation of the
Provincial Strategic Planning Workshop in February 2018. Strategic priorities and focus areas have been
identified through a process of deliberation under leadership of the MEC for Health and Acting Head:
Health. A Provincial Strategic Planning Workshop for Senior Management was facilitated from 9-10
February 2018, where priorities have been unpacked during break away Commissions. The final budget
adjustments will be aligned with the approved priorities. The alignment of various macro plans, the APP,
as well as District and Facility Plans will be finalised before official submission and sign off.
Overview of the 2018/19 Budget and MTEF Estimates
The indicative percentage for salary increases for improvement of conditions of service is determined at
a national level. The increase in the compensation of employees budget allocation are far below the
latest Wage Agreement provisions for the 2018/19 MTEF and will require stringent discipline in managing
actual personnel numbers, in spite of the growth in patient numbers that demand public health care.
This required re-prioritisation to ensure optimal service delivery within the available funding envelope.
The allocation for Goods and Services does not keep pace with inflation and requires a real reduction in
the Goods and Services expenditure. If these reductions cannot be achieved through improved
efficiencies and rationalisation, staff numbers will probably have to be reduced further, which will have
a negative impact on access to essential services, service delivery and health outcomes.
The commissioning of new facilities, including commissioning of the Pixley Ka Isaka Seme Regional
Hospital in 2019, creates a significant challenge to the Province given the operational budgetary
pressures. It will be necessary for the Province to further re-prioritise to accommodate the running costs
for the hospital once commissioned. The focus for Infrastructure Development is shifting to maintenance
for the foreseeable future based on the decrease in real terms and new facilities will be built in the MTEF.
While the Department is faced with a real decline in the budget, it caters for a significant patient
footprint with escalating costs for medicines and clinical treatment. The Department will therefore have
to refrain from expanding clinical services especially related to clinical sub-specialities to fund existing
service pressures in the absence of additional funding.
The Department will monitor expenditure and business processes vigorously, including the
implementation of the Turn-Around Strategy, to ensure efficiency in a resource constraint environment
while maintaining optimal service delivery and quality of care.

ANNUAL PERFORMANCE PLAN 2018/19 – 2020/21
58
Fighting Disease, Fighting Poverty, Giving Hope
Expenditure Estimates
Table 13 (A2): Expenditure Estimates Summary of Payments and Estimates (R’000)
Sub-Programme Audited Expenditure Outcomes Main
Appropriation
Adjusted
Appropriation
Revised
Estimate Medium Term Expenditure Estimates
R’000 2014/15 2015/16 2016/17 2017/18 2018/19 2019/20 2020/21
Administration 701 925 846 622 845 674 891 171 897 415 882 614 965 411 812 687 868 200
District Health Services 14 334 353 16 007 896 17 723 971 18 993 346 19 441 200 19 659 155 20 825 714 22 429 843 24 246 450
Emergency Medical Services 1 068 113 1 174 378 1 209 263 1 277 850 1 358 514 1 403 117 1 415 686 1 521 158 1 632 004
Provincial Hospital Services 8 473 425 9 214 364 9 822 915 10 612 363 10 622 756 10 728 960 11 078 214 11 847 092 12 747 510
Central Hospital Services 3 817 800 4 124 929 4 534 157 4 581 578 4 681 578 4 755 928 4 955 993 5 213 898 5 714 321
Health Sciences and Training 1 018 949 1 058 822 1 201 074 1 241 683 1 241 683 1 263 186 1 264 350 1 281 885 1 312 749
Health Care Support Services 151 908 166 095 268 768 293 954 229 354 221 476 313 640 322 359 343 490
Health Facilities Management 1 679 037 1 517 618 1 420 575 1 656 528 1 457 978 1 515 727 1 528 656 1 528 213 1 459 252
Sub-Total 31 245 510 34 110 724 37 026 397 39 548 473 39 930 478 40 430 163 42 347 664 44 957 135 48 323 976
Unauthorized expenditure (1st
charge) not available for
spending
- 107 607 - - - - - - -
Baseline available for
spending after 1st charge
31 245 510 34 110 724 37 026 397 39 548 473 39 930 478 40 430 163 42 347 664 44 957 135 48 323 976

ANNUAL PERFORMANCE PLAN 2018/19 – 2020/21
59
Fighting Disease, Fighting Poverty, Giving Hope
Table 14 (A3): Summary of Provincial Expenditure Estimates by Economic Classification (R’000)
Economic Classification Audited Expenditure Outcomes Main
Appropriation
Adjusted
Appropriation
Revised
Estimate Medium-Term Expenditure Estimates
R’000 2014/15 2015/16 2016/17 2017/18 2018/19 2019/20 2020/21
Current payments 28 911 128 31 899 939 34 739 862 37 075 809 37 215 923 37 548 048 39 541 755 42 352 834 45 784 761
Compensation of employees 20 014 542 21 793 160 23 354 896 25 246 832 24 962 432 24 777 838 26 024 422 28 191 328 30 565 276
Goods and services 8 895 900 10 105 233 11 382 844 11 828 580 12 251 359 12 767 311 13 516 936 14 161 087 15 219 043
Communication 99 330 98 598 116 893 112 226 105 437 105 506 113 301 119 121 125 667
Computer Services 133 813 150 913 163 632 192 130 160 501 149 576 163 678 181 004 190 957
Consultants, Contractors & special
services
1 227 268 1 327 793 3 263 774 3 364 250 3 710 969 4 003 229 3 828 220 3 762 103 3 960 747
Inventory 4 142 072 4 653 964 5 885 762 5 956 748 6 002 502 6 268 599 6 938 009 7 449 701 8 101 703
Operating leases 135 476 153 493 139 376 158 677 152 203 148 507 152 709 155 592 158 835
Travel and subsistence 80 518 79 975 83 199 90 264 67 559 68 678 78 415 82 615 87 231
Interest and rent on land 686 1 546 2 122 397 2 132 2 899 397 419 442
Maintenance, repair and running
costs
293 620 290 149 - - - - - - -
Financial Transactions in assets and
Liabilities
- - - - - - - - -
Other including Assets<5000, training
and development, property
payments, operating expenditure and
venues and facilities
2 783 803 3 350 348 1 730 139 1 954 285 2 050 910 2 023 210 2 242 604 2 410 951 1 730 139
Transfers and subsidies to 828 088 843 093 1 035 657 923 771 1 027 358 1 194 477 982 961 985 139 1 035 657
Provinces and municipalities 122 618 133 330 159 755 198 990 210 519 225 894 219 734 232 091 244 857
Departmental agencies and
accounts
15 895 19 019 20 131 20 031 19 155 19 274 21 067 22 246 23 469
Universities and Technicon’s 16 - - - - - - - -
Foreign governments and
international organisations
66 - - - 143 454 142 226 54 870 56 513 58 508
Non-profit institutions 222 051 213 402 203 929 210 687 654 230 807 083 687 290 674 289 696 561

ANNUAL PERFORMANCE PLAN 2018/19 – 2020/21
60
Fighting Disease, Fighting Poverty, Giving Hope
Economic Classification Audited Expenditure Outcomes Main
Appropriation
Adjusted
Appropriation
Revised
Estimate Medium-Term Expenditure Estimates
R’000 2014/15 2015/16 2016/17 2017/18 2018/19 2019/20 2020/21
Households 467 442 477 342 651 842 494 063 210 519 225 894 219 734 232 091 244 857
Payments for capital assets 1 505 879 1 257 629 1 106 314 1 441 285 1 579 473 1 579 896 1 668 744 1 619 162 1 515 820
Buildings and other fixed structures 1 206 505 1 052 053 910 917 819 107 926 250 972 667 963 192 743 360 646 960
Machinery and equipment 299 374 205 576 195 397 622 178 653 223 607 229 705 552 875 802 868 860
Software and other tangible assets - - - - - - - - -
Payment for financial assets 415 110 063 144 564 107 608 107 724 107 742 154 204 - -
Total economic classification 31 245 510 34 110 724 37 026 397 39 548 473 39 930 478 40 430 163 42 347 664 44 957 135 48 323 976
Expenditure Trends
Table 15: (A4) Trends in Provincial Public Health Expenditure (R’000)
Expenditure
R’000
Audited/ Actual Estimate Medium Term Projections
2014/15 2015/16 2016/17 2017/18 2018/19 2019/20 2020/21
Current prices
Total 31 245 510 34 110 724 37 026 397 40 430 163 42 347 664 44 957 135 48 323 976
Total per person 2 955.65 3 191.45 3 426.30 3 588.23 3 709.13 3 887.02 4 125.54
Total per uninsured person 3 385.63 3 647.38 3 843.52 4 072.91 4 210.14 4 417.07 4 688.11
Constant (2016/17) prices
Total 28 478 052 31 091 925 33 731 048 36 831 878 38 578 722 40 955 950 44 023 142
Total per person 2 693.90 2 909.00 3 121.36 3 268.88 3 379.02 3 541.08 3 758.36
Total per uninsured person 3 085.80 3 324.58 3 501.45 3 710.42 3 835.44 4 023.95 4 270.88
% of Total spent on
District Health Services 45.88% 46.93% 47.88% 48.62% 49.18% 49.89% 50.17%

ANNUAL PERFORMANCE PLAN 2018/19 – 2020/21
61
Fighting Disease, Fighting Poverty, Giving Hope
Expenditure
R’000
Audited/ Actual Estimate Medium Term Projections
2014/15 2015/16 2016/17 2017/18 2018/19 2019/20 2020/21
Provincial Health Services 27.12% 27.01% 26.53% 26.54% 26.16% 26.35% 26.38%
Central health Services 12.22% 12.09% 12.25% 11.76% 11.70% 11.60% 11.83%
All personnel 20 014 422 21 793 160 23 354 896 24 777 838 26 024 422 28 191 328 30 565 276
Capital 1 505 879 1 257 629 1 106 314 1 579 896 1 668 744 1 619 162 1 515 820
Table 16: Conditional Grants Expenditure Trends (R’000)
Conditional Grants
R’000
Audited Actual Estimate Medium Term Projections
2014/15 2015/16 2016/17 2017/18 2018/19 2019/20 2020/21
Health Professions Training and Development
Grant
292 847 299 898 312 377 331 944 351 197 370 863 391 260
Health Facility Revitalisation Grant 1 362 469 1 231 997 1 121 993 1 149 355 1 202 480 1 153 049 1 216 467
National Tertiary Services Grant 1 496 427 1 530 223 1 596 286 1 696 266 1 794 649 1 895 149 2 022 124
Comprehensive HIV, AIDS and TB Grant 3 257 870 3 813 455 4 247 525 5 118 107 5 677 225 6 114 218 6 701 673
Human Papillomavirus Vaccine Grant - - - - 44 976 47 495 50 107
Social Sector EPWP Incentive Grant for
Provinces
2 580 13 000 13 000 47 058 24 182 - -
EPWP Integrated Grant for Provinces 2 581 3 682 7 122 8400 8 896 - -
National Health Insurance Grant 18 399 9 494 25 045 - - - -
Total 6 433 173 6 901 749 7 323 348 8 351 130 9 103 605 9 580 774 10 381 631

ANNUAL PERFORMANCE PLAN 2018/19 – 2020/21
62
Fighting Disease, Fighting Poverty, Giving Hope
NOTES
……………………………………………………………………………………………………………………………………
……………………………………………………………………………………………………………………………………
……………………………………………………………………………………………………………………………………
……………………………………………………………………………………………………………………………………
……………………………………………………………………………………………………………………………………
……………………………………………………………………………………………………………………………………
……………………………………………………………………………………………………………………………………
……………………………………………………………………………………………………………………………………
……………………………………………………………………………………………………………………………………
……………………………………………………………………………………………………………………………………
……………………………………………………………………………………………………………………………………
……………………………………………………………………………………………………………………………………
……………………………………………………………………………………………………………………………………
……………………………………………………………………………………………………………………………………
……………………………………………………………………………………………………………………………………
……………………………………………………………………………………………………………………………………
……………………………………………………………………………………………………………………………………
……………………………………………………………………………………………………………………………………
ANNUAL PERFORMANCE PLAN 2018/19 – 2020/21
63
Fighting Disease, Fighting Poverty, Giving Hope
PART B: PROGRAMME & SUB-PROGRAMME PLANS
Programme 1: Administration
Programme 2: District Health Services
Programme 3: Emergency Medical Services
Programme 4: Regional & Specialised Hospital Services
Programme 5: Tertiary & Central Hospital Services
Programme 6: Health Sciences & Training
Programme 7: Health Care Support Services
Programme 8: Health Facilities Management

ANNUAL PERFORMANCE PLAN 2018/19 – 2020/21
64
Fighting Disease, Fighting Poverty, Giving Hope
NOTES
……………………………………………………………………………………………………………………………………
……………………………………………………………………………………………………………………………………
……………………………………………………………………………………………………………………………………
……………………………………………………………………………………………………………………………………
……………………………………………………………………………………………………………………………………
……………………………………………………………………………………………………………………………………
……………………………………………………………………………………………………………………………………
……………………………………………………………………………………………………………………………………
……………………………………………………………………………………………………………………………………
……………………………………………………………………………………………………………………………………
……………………………………………………………………………………………………………………………………
……………………………………………………………………………………………………………………………………
……………………………………………………………………………………………………………………………………
……………………………………………………………………………………………………………………………………
……………………………………………………………………………………………………………………………………
……………………………………………………………………………………………………………………………………
……………………………………………………………………………………………………………………………………
……………………………………………………………………………………………………………………………………

ANNUAL PERFORMANCE PLAN 2018/19 – 2020/21
65
Fighting Disease, Fighting Poverty, Giving Hope
PROGRAMME 1: ADMINISTRATION
Programme Purpose
Conduct the strategic management and overall administration of the Department of Health. There are
no changes to the Programme 1 structure.
Sub-Programme 1.1: Office of the Member of the Executive Council (MEC)
Render advisory, secretarial and administrative support, and public relations, communication and
parliamentary support.
Sub-Programme 1.2: Office of the Head: Health (Head Office Branches and Units)
Policy formulation, overall leadership, management and administration support of the Department and
the respective districts and institutions within the Department.

ANNUAL PERFORMANCE PLAN 2018/19 – 2020/21
66
Fighting Disease, Fighting Poverty, Giving Hope
2018/19 Priorities
Priorities Key Focus Areas
Improve audit outcomes Supply Chain, Asset & Contract Management Strategy (Section
18 intervention).
Internal control and rigorous implementation & monitoring of the
Audit Improvement Plan.
Performance Information Improvement Plan.
Management of Commuted Overtime.
Financial management including Savings and Cost Containment
Plan.
Implement & monitor reviewed decentralised SCM, Financial and
HR delegations.
Improve human resources
management
Continue with review of organisational structures.
Finalise the Essential Post List Project.
Strengthen performance management & development (EPMDS)
including amended and approved Policy including basic 360
assessments at all levels.
Improve management of
performance information
Implement strategy to improve record management.
Further rollout of the web-based DHIS.
Improve review and use of data at facility, sub-district & district
level and improve the feedback system.
Implement the performance information management strategy &
implementation plan.
Implement the approved IT strategy including increasing
broadband access at facility level.
Implement strategy to reduce
medico legal risks
Finalise and implement the approved Medico-Legal Strategy &
Implementation Plan.
Manage finalisation and
implementation of the
integrated Turn-Around Plan
Finalise the integrated Turn-Around Plan and manage and
monitor implementation at all levels.
Establish enabling environment for service delivery.
Strengthen oversight and
technical support to districts
and facilities to improve
seamless service delivery
Strengthen consultation and the feedback loop between
province, districts and facilities
Finalise and implement the approved integrated Communication
Plan

ANNUAL PERFORMANCE PLAN 2018/19 – 2020/21
67
Fighting Disease, Fighting Poverty, Giving Hope
Strategic Objectives, Indicators and Targets
Table 17: 2015-2019 Strategic Plan Targets
Strategic Goal Strategic Objective Strategic Objective Statement Indicator Target 2019/20
Strategic Goal 1:
Strengthen health
system effectiveness
1.1) Approve the
integrated 2017-2027
Long Term Plan
(Amended 2017/18)
1.1.1) 2017 – 2027 Strategic Position Statement and Long Term
Plan approved by March 2019 (Reviewed 2018/19)
Approved 2017-2027 Long Term
Plan (Amended 2017/18)
Approved 2017 –
2027 Long Term
Plan (Amended
2017/18)
1.2) Improve financial
management and
compliance to PFMA
prescripts
1.2.1) Annual unqualified audit opinion for financial statements
and performance information from 2015/16 onwards
Audit opinion from Auditor-
General
Unqualified
opinion from
2015/16 onwards
1.3) Improve Supply Chain
Management
1.3.1) Costed annual Procurement Plan for minor and major
assets by the end of April in each reporting year (Reviewed
2015/16)
Approved Annual Procurement
Plan (Reviewed 2015/16)
Approved and
costed annual
procurement
plan (Amended
2015/16)
1.4) Improve health
technology and
information management
1.4.1) Connectivity established at 40% public health facilities by
March 2020 (Reviewed 2015/16 and 2018/19)
Percentage of hospitals with
broadband access
40% (Reviewed
2015/16 and
2018/19)
Strategic Goal 4:
Strengthen human
resources for health
4.1) Improve human
resources for health
4.1.2) Review and approve macro and micro structures
aligned to function (Reviewed 2018/19)
Number of organisational
structures approved (Reviewed
2017/18)
100 cumulative
4.1.3) Implement the Community Based Training in a PHC
Model in collaboration with the University of KwaZulu-Natal
with Phase 1 pilot commencing in 2016/17
Community Based Training in a
PHC Model implemented
(Amended 2015/16)
Implement
Model

ANNUAL PERFORMANCE PLAN 2018/19 – 2020/21
68
Fighting Disease, Fighting Poverty, Giving Hope
Table 18: (ADMIN 2) Strategic Objectives, Indicators and Targets
Strategic
Objective
Statement
Indicators Data Source Frequency/
Type
Audited/ Actual Performance Estimated
Performance
2017/18
Medium Term Targets Strategic
Plan Target
2019/20 2014/15 2015/16 2016/17 2018/19 2019/20 2020/21
Strategic Objective 1.2: Improve financial management and compliance to PFMA prescripts
1.2.1) Annual
unqualified
audit opinion
for financial
statements and
performance
information
from 2015/16
onwards
1. Audit opinion
from Auditor-
General
Annual
Report
Annual
Categorical
Qualification Qualification Qualification Audit for
2017/18 not
yet
conducted
by the
Auditor
General
Unqualified Unqualified Unqualified Unqualified
opinion from
2015/16
onwards
Strategic Objective 1.4: Improve health technology and information management
1.4.1)
Connectivity
established at
40% public
health facilities
by March 2020
2. Percentage of
hospitals with
broadband
access
Network
reports that
confirm
availability of
broadband
Quarterly
%
Not reported 9.7% 9.7% 56% 58.3%34 61.1% 63.9% 40% public
health
facilities
Total number of
hospitals with
minimum 2 Mbps
connectivity
Network
reports that
confirm
availability of
broadband
No - 7 7 40 42 44 46
Total number of
public hospitals
DHIS No - 72 72 72 72 72 72
3. Percentage of
fixed PHC facilities
with broadband
access
Network
reports that
confirm
availability of
broadband
Quarterly
%
*44.5%35 5.1% 17.7% 23% 26.9% 29% 35.1%
Number of PHC
facilities that have
access to at least
1Mbps connectivity
Network
reports that
confirm
availability of
broadband
No 267 31 108 140 164 177 214
34 (Indicator 2 and 3): Budget constraints, high cost of connectivity and slow procurement process through SITA slow down progress - hence review of MTEF targets while other options are being explored 35 The indicator definition was incorrectly interpreted for reported – that has been corrected for the 2015/16 Annual Report

ANNUAL PERFORMANCE PLAN 2018/19 – 2020/21
69
Fighting Disease, Fighting Poverty, Giving Hope
Strategic
Objective
Statement
Indicators Data Source Frequency/
Type
Audited/ Actual Performance Estimated
Performance
2017/18
Medium Term Targets Strategic
Plan Target
2019/20 2014/15 2015/16 2016/17 2018/19 2019/20 2020/21
Total number of fixed
PHC facilities
DHIS No 600 607 610 610 610 610 610
FINANCE AND SUPPLY CHAIN MANAGEMENT
Strategic Objective 1.3: Improve Supply Chain Management
1.3.1) Costed
annual
Procurement
Plan for minor
and major
assets by the
end of April in
each reporting
year
4. Approved annual
procurement plan
Procurement
Plan
Annual
Categorical
Yes No Approved &
costed Plan
Approved &
costed Plan
Approved &
costed Plan
Approved &
costed Plan
Approved &
costed Plan
Approved
and costed
annual
Procurement
Plan
HUMAN RESOURCE MANAGEMENT SERVICES
Strategic Objective 4.1: Improve human resources for health
4.1.2) Review
and approve
macro and
micro structures
aligned to
function
5. Number of
organisational
structures
reviewed &
submitted for
approval
HRMS;
Approved
structures
Annual
No
Not reported Macro
structure
reviewed
136 1137 1038 10 9 100
cumulative
over
planning
cycle
4.1.3)
Implement the
Community
Based Training
in a PHC Model
in collaboration
with UKZN with
Phase 1 pilot
commencing in
2016/17
6. Implement the
Community Based
Training in a PHC
Model
Community
Based
Training in a
PHC Model
Business Plan
Annual
Categorical
Draft Business
Plan
Approved
Business Plan
Implement
Phase 1 in
King
Cetshwayo
District
Implement
Phase 2 in
identified
sites in King
Cetshwayo,
Amajuba
and Ugu
Districts
Implement
Model
Implement
Model
Implement
Model
Implement
Model
36 One structure signed off by the MEC for Health 37 Nine structures have been submitted and approved at the end of the 3rd quarter of 2017/18 38 Targets for outer years will be reviewed annually based on availability of resources and identified priorities and needs

ANNUAL PERFORMANCE PLAN 2018/19 – 2020/21
70
Fighting Disease, Fighting Poverty, Giving Hope
Strategic
Objective
Statement
Indicators Data Source Frequency/
Type
Audited/ Actual Performance Estimated
Performance
2017/18
Medium Term Targets Strategic
Plan Target
2019/20 2014/15 2015/16 2016/17 2018/19 2019/20 2020/21
4.1.9) Provide
sufficient staff
with
appropriate
skills per
occupational
group within the
framework of
Provincial
staffing norms
by March 2020
7. Medical Officers
per 100 000
population
Persal
Stats SA
Annual
No per
100,000
population
28.5 29.2* 27.8 26.8 27.739 27.4 27.1 -
Number of Medical
Officers posts filled
Persal No 3 012 3 124 3 007 3 01640 3 165 3 170 3 170
Total KZN population Stats SA
(DHIS)
No 10 571 313 10 688 168 10 806 538 11 267 433 11 417 133 11 565 969 11 713 378
8. Professional Nurses
per 100 000
population
Persal
Stats SA
Annual
No per
100,000
population
137.7 163.5* 160.73 154.3 153.5 151.7 149.8 -
Number of
Professional Nurses
posts filled
Persal No 14 556 17 475 17 370 17 38841 17 525 17 550 17 550
Total KZN population Stats SA
(DHIS)
No 10 571 313 10 688 168 10 806 538 11 267 433 11 417 133 11 565 969 11 713 378
9. Pharmacists per
100 000
population
Persal
Stats SA
Annual
No per
100,000
population
7.4 7.8* 7.9 7.7 7.4 7.4 7.3 -
Number of
Pharmacists posts
filled
Persal No 782 833 849 86242 850 855 855
Total KZN population Stats SA
(DHIS)
No 10 571 313 10 688 168 10 806 538 11 267 433 11 417 133 11 565 969 11 713 378
Strategic Objective 4.2: Improve Performance Management and Development
39 Indicators 8, 9 and 10: Minimal increase in the number of staff taking into consideration the limited funding envelope for filling of posts – this will be reviewed annually to align with available budget for COE 40 Includes Clinical Managers, Interns, Community Service, Registrars and Production level 41 Includes Nursing Managers, Institutional Heads and Production level 42 Includes Pharmacy Managers, Interns, Community Service and Production level

ANNUAL PERFORMANCE PLAN 2018/19 – 2020/21
71
Fighting Disease, Fighting Poverty, Giving Hope
Strategic
Objective
Statement
Indicators Data Source Frequency/
Type
Audited/ Actual Performance Estimated
Performance
2017/18
Medium Term Targets Strategic
Plan Target
2019/20 2014/15 2015/16 2016/17 2018/19 2019/20 2020/21
4.2.1) All
personnel
comply with
performance
management
requirements
from March
2016 onwards
10. Number of
Hospital
Managers who
have signed
Performance
Agreements
(PA’s)
EPMDS
Database;
Signed PA’s
Annual
No
37
56 46
72 72 72 72 -
11. Number of
District
Managers who
have signed
PA’s
EPMDS
Database;
Signed PA’s
Annual
No
11 12 10 1243 12 12 12 -
12. Percentage of
Head Office
Managers
(Level 13 and
above) who
have signed
PA’s
EPMDS
Database;
Signed PA’s
Annual
%
78% 67.8% 93.1% 100% 100% 100% 100% -
Head Office
Managers (level 13
and above) who
signed PA’s in the
reporting cycle
EPMDS
Database;
Signed PAs
No 39 40 54 64 64 64 64
Number of Head
Office Managers
(level 13 and above)
Persal
No 50 59 58 64 6444 64 64
PLANNING, MONITORING & EVALUATION
Strategic Objective 1.1: Approve the integrated 2017-2027 Long Term Plan
43 Includes 11 District Directors and one Chief Director for the eThekwini Metro 44 This number will fluctuate year on year and will be adjusted accordingly for reporting purposes

ANNUAL PERFORMANCE PLAN 2018/19 – 2020/21
72
Fighting Disease, Fighting Poverty, Giving Hope
Strategic
Objective
Statement
Indicators Data Source Frequency/
Type
Audited/ Actual Performance Estimated
Performance
2017/18
Medium Term Targets Strategic
Plan Target
2019/20 2014/15 2015/16 2016/17 2018/19 2019/20 2020/21
1.1.1) 2017 –
2027 Strategic
Position
Statement and
Long Term Plan
approved by
March 2019
13. Approved 2017-
2027 Long Term
Plan
Approved
Long Term
Plan
Annual
Categorical
Not
approved
Not
approved
Not
approved
Not
approved
Approved
2017 – 2027
Long Term
Plan
Implement
approved
Long Term
Plan
Implement
approved
Long Term
Plan
Approved
2017-2027
Long Term
Plan
SPECIALISED SERVICES AND CLINICAL SUPPORT
Strategic Objective 1.7: Improve hospital efficiencies
1.7.2) Hospital
Rationalisation
Plan approved
by September
2018
14. Approved
Hospital
Rationalisation
Plan45
Approved
Hospital
Rationalisa-
tion Plan
Annual
Categorical
Not reported Not
approved
Not
approved
Not
approved
Approved
Hospital
Rationali-
sation Plan
Implement
approved
Plan
Implement
approved
Plan
-
Strategic Objective 5.2) Improve quality of care
5.2.5) 100%
Public health
hospitals score
more than 75%
on the Food
Service
Monitoring
Standards
Grading System
(FSMSGS) by
March 2020
15. Percentage of
public health
hospitals that
scored more
than 75% on the
Food Service
Monitoring
Standards
Grading System
Food
Services
Grading
Register
Annual
%
64% 43.8% 65.2% 80.6% 86.1% 100% 100% -
Public health
hospitals that score
more than 75% on
the FSMSGS
Food
Services
Grading
Register
No 46 32 47 58 62 72 72
Number of public
health hospitals
assessed
Assessment
Records
No 72 72 72 72 72 72 72
EXECUTIVE SUPPORT SERVICES
Strategic Objective 4.1) Improve human resources for health
45 The Plan is relevant to all hospitals and will be incorporated in the Long Term and Turn-Around Plan – oversight and support will be provided form Head Office

ANNUAL PERFORMANCE PLAN 2018/19 – 2020/21
73
Fighting Disease, Fighting Poverty, Giving Hope
Strategic
Objective
Statement
Indicators Data Source Frequency/
Type
Audited/ Actual Performance Estimated
Performance
2017/18
Medium Term Targets Strategic
Plan Target
2019/20 2014/15 2015/16 2016/17 2018/19 2019/20 2020/21
4.1.11) Appoint
an average of
10 000 CCGs
per annum on
contract
16. Number of
Community
Care Givers
appointed on
contract
CCG
Database;
Persal
Annual
No
Not reported Not reported Not reported 10 007 10 000 10 000 10 000 -
Strategic Objective 5.2) Improve quality of care
5.2.6) Conduct
at least 40
ethics
workshops per
annum from
2017/18
onwards
17. Number of
ethics workshops
conducted
Attendance
Registers
Quarterly
No
Not reported Not reported Not reported 40 40 40 40 -
Strategic Objective 1.2) Improve financial management and compliance to PFMA prescripts
1.2.3) Monthly
submission of
disclosures of
donations,
sponsorships,
and gifts as per
Circular
G15/2016
18. Number of
complete
submissions of
disclosures of
donations,
sponsorships and
gifts submitted
to Finance
Gift Registers;
Reports to
Finance
Quarterly
No
Not reported Not reported Not reported 12 12 12 12 -

ANNUAL PERFORMANCE PLAN 2018/19 – 2020/21
74
Fighting Disease, Fighting Poverty, Giving Hope
2018/19 Targets
Table 19: (ADMIN 3) Quarterly and Annual Targets
Performance
Indicators
Frequency/
Type
Targets Quarterly & Annual Targets
2018/19 Q1 Q2 Q3 Q4 Annual
1. Audit opinion
from Auditor-
General
Annual
Categorical
Unqualified - Unqualified - - Unqualified
2. Percentage of
hospitals with
broadband
access
Quarterly
%
Cumulative
58.3% 57% 57% 57% 58.3% 58.3%
3. Percentage of
fixed PHC
facilities with
broadband
access
Quarterly
%
Cumulative
26.9% 24.6% 24.6% 26.2% 26.9% 26.9%
4. Approved annual
Procurement Plan
Annual
Categorical
Approved
Plan
Approved
Plan
- - - Approved
Plan
5. Number of
organisational
structures
reviewed &
submitted for
approval
Annual
No
10 3 3 3 1 10
6. Implement the
Community
Based Training in
a PHC Model
Annual
Categorical
Implement
Model
- - - - Implement
Model
7. Medical Officers
per 100,000
population
Annual
No
27.7 - - - 27.7 27.7
8. Professional
Nurses per
100,000
population
Annual
No
153.5 - - - 153.5 153.5
9. Pharmacists per
100,000
population
Annual
No
7.4 - - - 7.4 7.4
10. Number of
Hospital
Managers who
have signed
Performance
Agreements
(PA’s)
Annual
No
72 72 - - - 72
11. Number of District
Managers who
have signed PA’s
Annual
No
12 12 - - - 12
12. Percentage of
Head Office
Managers (Level
13 and above)
who have signed
PA’s
Annual
%
100% 100% - - - 100%
13. Approved 2017-
2027 Long Term
Plan
Annual
Categorical
Approved
Plan
- - - Approved
Plan
Approved
Plan
14. Approved
Hospital
Rationalisation
Plan
Annual
Categorical
Approved
Plan
- - Approved
Plan
- Approved
Plan

ANNUAL PERFORMANCE PLAN 2018/19 – 2020/21
75
Fighting Disease, Fighting Poverty, Giving Hope
Performance
Indicators
Frequency/
Type
Targets Quarterly & Annual Targets
2018/19 Q1 Q2 Q3 Q4 Annual
15. Percentage of
public health
hospitals that
scored more than
75% on the Food
Service
Monitoring
Standards
Grading System
Annual
%
Cumulative
86.1% - - - 86.1% 86.1%
16. Number of
Community Care
Givers appointed
on contract
Annual
No
10 000 - - - 10 000 10 000
17. Number of ethics
workshops
conducted
Quarterly
No
40 10 10 10 10 40
18. Number of
complete
submissions of
disclosures of
donations,
sponsorships and
gifts submitted to
Finance
Quarterly
No
12 3 3 3 3 12

ANNUAL PERFORMANCE PLAN 2018/19 – 2020/21
74
Fighting Disease, Fighting Poverty, Giving Hope
Reconciling Performance Targets with Expenditure Trends and Budgets
Table 20: (ADMIN 4a) Expenditure Estimates (R’000)
Sub-Programme Audited Expenditure Outcomes Main
Appropriation
Adjusted
Appropriation
Revised
Estimate Medium Term Expenditure Estimates
R’000 2014/15 2015/16 2016/17 2017/18 2018/19 2019/20 2020/21
Office of the MEC 16 818 18 455 18 990 20 891 20 891 21 678 23 285 23 532 25 233
Management 685 107 828 167 826 684 870 280 876 524 860 936 942 126 789 155 842 967
Sub-Total 701 925 846 622 845 674 891 171 20 891 21 678 23 285 23 532 25 233
Unauthorized expenditure (1st
charge) not available for spending
- 107 608 - - - - - - -
Baseline available for spending after
1st charge
701 925 846 622 845 674 891 171 897 415 882 614 965 411 812 687 868 200
Table 21: (ADMIN 4b) Summary of Payments and Estimates by Economic Classification (R’000)
Economic Classification Audited Expenditure Outcomes Main
Appropriation
Adjusted
Appropriation
Revised
Estimate Medium-Term Expenditure Estimates
R’000 2014/15 2015/16 2016/17 2017/18 2018/19 2019/20 2020/21
Current payments 678 837 722 304 683 440 771 212 771 446 720 997 764 167 774 916 829 084
Compensation of employees 292 983 326 812 365 803 402 196 383 149 387 367 419 446 450 325 486 351
Goods and services 385 799 395 388 316 817 369 016 388 271 333 480 344 721 324 591 342 733
Communication 10 581 10 963 11 462 12 208 11 509 11 654 12 954 13 679 14 432
Computer Services 133 465 147 306 158 740 190 000 155 524 141 550 153 174 169 962 179 309
Consultants, Contractors and special
services
42 306 76 640 64 627 74 395 134 267 95 621 84 636 41 698 43 991
Inventory 2 082 - 5 721 6 347 3 198 2 857 3 743 4 121 4 349
Operating leases 5 012 5 095 5 113 5 611 5 051 5 055 5 952 6 285 6 631
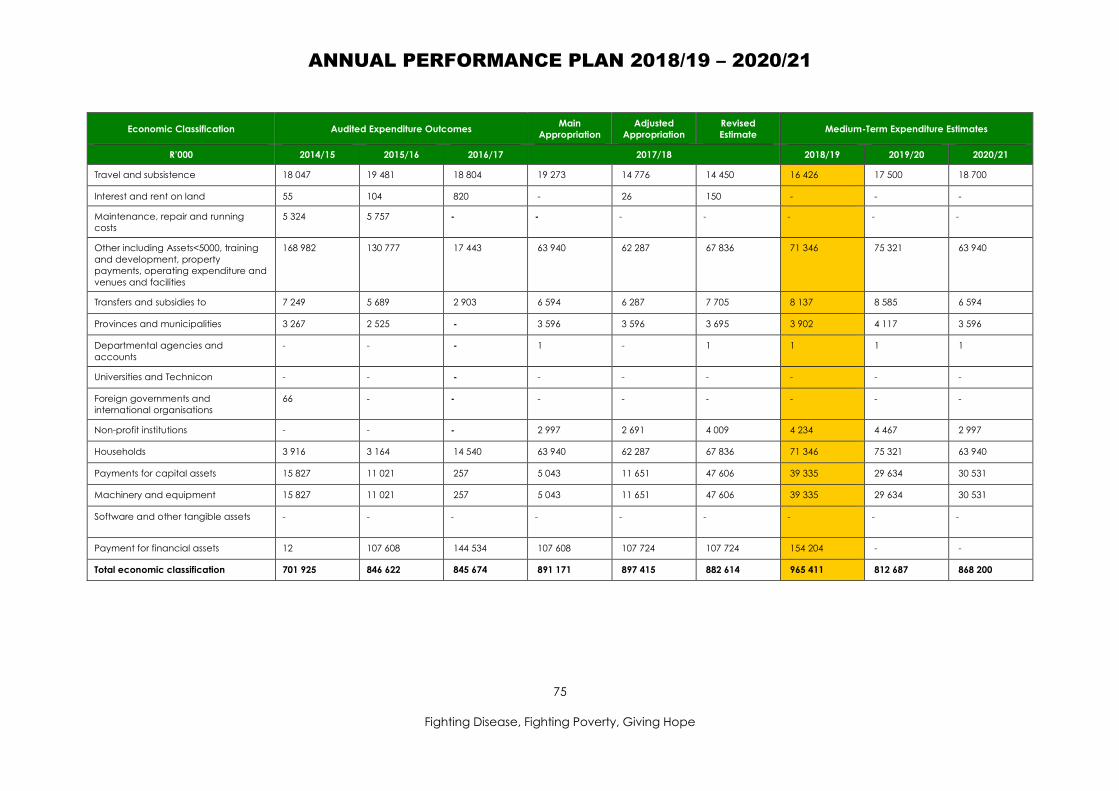
ANNUAL PERFORMANCE PLAN 2018/19 – 2020/21
75
Fighting Disease, Fighting Poverty, Giving Hope
Economic Classification Audited Expenditure Outcomes Main
Appropriation
Adjusted
Appropriation
Revised
Estimate Medium-Term Expenditure Estimates
R’000 2014/15 2015/16 2016/17 2017/18 2018/19 2019/20 2020/21
Travel and subsistence 18 047 19 481 18 804 19 273 14 776 14 450 16 426 17 500 18 700
Interest and rent on land 55 104 820 - 26 150 - - -
Maintenance, repair and running
costs
5 324 5 757 - - - - - - -
Other including Assets<5000, training
and development, property
payments, operating expenditure and
venues and facilities
168 982 130 777 17 443 63 940 62 287 67 836 71 346 75 321 63 940
Transfers and subsidies to 7 249 5 689 2 903 6 594 6 287 7 705 8 137 8 585 6 594
Provinces and municipalities 3 267 2 525 - 3 596 3 596 3 695 3 902 4 117 3 596
Departmental agencies and
accounts
- - - 1 - 1 1 1 1
Universities and Technicon - - - - - - - - -
Foreign governments and
international organisations
66 - - - - - - - -
Non-profit institutions - - - 2 997 2 691 4 009 4 234 4 467 2 997
Households 3 916 3 164 14 540 63 940 62 287 67 836 71 346 75 321 63 940
Payments for capital assets 15 827 11 021 257 5 043 11 651 47 606 39 335 29 634 30 531
Machinery and equipment 15 827 11 021 257 5 043 11 651 47 606 39 335 29 634 30 531
Software and other tangible assets - - - - - - - - -
Payment for financial assets 12 107 608 144 534 107 608 107 724 107 724 154 204 - -
Total economic classification 701 925 846 622 845 674 891 171 897 415 882 614 965 411 812 687 868 200

ANNUAL PERFORMANCE PLAN 2018/19 – 2020/21
76
Fighting Disease, Fighting Poverty, Giving Hope
Performance and Expenditure Trends
Programme 1 is allocated 2.07 per cent of the total 2018/19 Vote 7 allocation compared to 2.26 per
cent in the revised estimate for 2017/18. This amounts to a decrease of R 46 468 million to make
provision for increase in the service delivery allocations at facility levels.
Risk Management
Table 22: Risk Management
Potential Risks Mitigating Strategies
Negative impact of
budget and resource
constraints
Strengthen internal control and budget/ expenditure auditing at
all levels. Structured technical support and oversight at district &
facility levels.
Enforce strict compliance and accountability against
implementation of the approved Cost Containment and Savings
Plan at all levels.
Monitor cost saving through implementation of the approved
Rationalisation Plan.
Present quantifiable budget shortfalls to Provincial Treasury.
Escalating medico legal
claims and costs
Implement approved Medico Legal Strategy and monitor output
and outcome.
Strengthen systems and capacity within the Department to
defend legal claims.
Improve record management at provincial and facility levels.
Inadequate human
resources for health
Implement the Essential Post List Project addressing equity and
resource allocation.
Present approved Essential Post List to Cabinet to rescind the
current process for approval of critical posts.
Improve the performance management system including
consequence management.
Poor data quality and
management with data
Implement the Data Management Strategy.
Improve review and feedback of data at facility, sub-district &
district level.
Supply chain inefficiencies Implement SCM Improvement Plan (Section 18 Strategy).
Reform SCM health technology services.
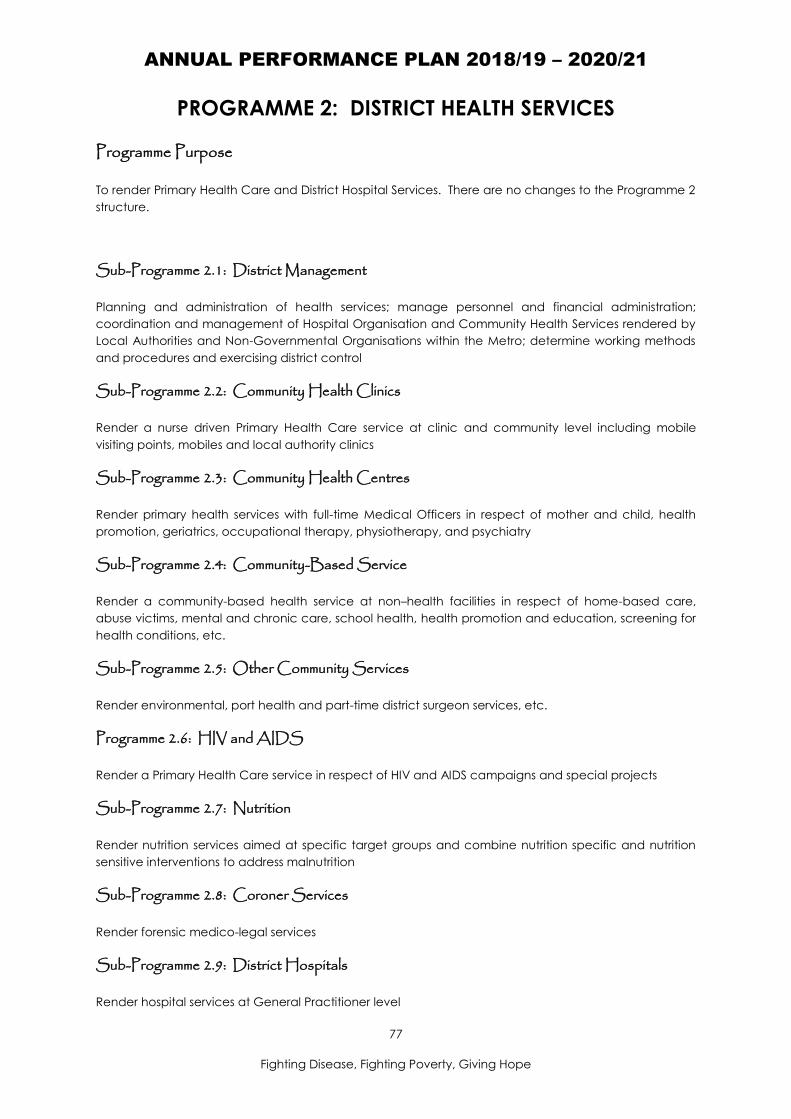
ANNUAL PERFORMANCE PLAN 2018/19 – 2020/21
77
Fighting Disease, Fighting Poverty, Giving Hope
PROGRAMME 2: DISTRICT HEALTH SERVICES
Programme Purpose
To render Primary Health Care and District Hospital Services. There are no changes to the Programme 2
structure.
Sub-Programme 2.1: District Management
Planning and administration of health services; manage personnel and financial administration;
coordination and management of Hospital Organisation and Community Health Services rendered by
Local Authorities and Non-Governmental Organisations within the Metro; determine working methods
and procedures and exercising district control
Sub-Programme 2.2: Community Health Clinics
Render a nurse driven Primary Health Care service at clinic and community level including mobile
visiting points, mobiles and local authority clinics
Sub-Programme 2.3: Community Health Centres
Render primary health services with full-time Medical Officers in respect of mother and child, health
promotion, geriatrics, occupational therapy, physiotherapy, and psychiatry
Sub-Programme 2.4: Community-Based Service
Render a community-based health service at non–health facilities in respect of home-based care,
abuse victims, mental and chronic care, school health, health promotion and education, screening for
health conditions, etc.
Sub-Programme 2.5: Other Community Services
Render environmental, port health and part-time district surgeon services, etc.
Programme 2.6: HIV and AIDS
Render a Primary Health Care service in respect of HIV and AIDS campaigns and special projects
Sub-Programme 2.7: Nutrition
Render nutrition services aimed at specific target groups and combine nutrition specific and nutrition
sensitive interventions to address malnutrition
Sub-Programme 2.8: Coroner Services
Render forensic medico-legal services
Sub-Programme 2.9: District Hospitals
Render hospital services at General Practitioner level

ANNUAL PERFORMANCE PLAN 2018/19 – 2020/21
78
Fighting Disease, Fighting Poverty, Giving Hope
Sub-Programme: Primary Health Care
Service Delivery Platform (District Health System)
Table 23: (DHS1) District Health Service Facilities per Health District – 2016/17
Health District Facility Type
Number
of
facilities
Total
population
Population
per PHC
facility/
Hospital bed
PHC
Headcount/
Inpatient
Separations
Per capita
utilisation
Ugu
Non-fixed clinics 17
759 134 13 556 2 299 757
3.0
Fixed clinics operated by LG 0
Fixed clinics operated by PG 54
Fixed clinics operated by NGO’s 0
Total fixed clinics 54
CHCs 2
Subtotal fixed clinics + CHC’s 56
District Hospitals 3 688 32 721
Umgungundlovu
Non-fixed clinics 1646
1 104 912 20 847 2 867 185
2.6
Fixed clinics operated by LG 0
Fixed clinics operated by PG 50
Fixed clinics operated by NGO’s 0
Total fixed clinics 50
CHCs 3
Sub-total fixed clinics + CHC’s 53
District Hospitals 2 1 935 30 437
Uthukela
Non-fixed clinics 14
702 395 18 984 1 691 071
2.4
Fixed clinics operated by LG 0
Fixed clinics operated by PG 36
Fixed clinics operated by NGO’s 0
Total fixed clinics 36
CHCs 1
Sub-total fixed clinics + CHC’s 37
District Hospitals 2 1 517 19 594
Umzinyathi
Non-fixed clinics 13
527 386 10 142 1 485 971
2.8
Fixed clinics operated by LG 0
Fixed clinics operated by PG 51
Fixed clinics operated by NGO’s 0
Total fixed clinics 51
CHCs 1
Sub-total fixed clinics + CHC’s 52
District Hospitals 4 458 36 782
Amajuba Non-fixed clinics 8
530 447 20 402 1 133 775 2.1 Fixed clinics operated by LG 0
Fixed clinics operated by PG 25
Fixed clinics operated by NGO’s 0
46 Includes 1 LG Mobile

ANNUAL PERFORMANCE PLAN 2018/19 – 2020/21
79
Fighting Disease, Fighting Poverty, Giving Hope
Health District Facility Type
Number
of
facilities
Total
population
Population
per PHC
facility/
Hospital bed
PHC
Headcount/
Inpatient
Separations
Per capita
utilisation
Total fixed clinics 25
CHCs 1
Sub-total fixed clinics + CHC’s 26
District Hospitals 1 10 201 2 760
Zululand
Non-fixed clinics 16
854 893 12 041 2 187 292
2.6
Fixed clinics operated by LG 0
Fixed clinics operated by PG 70
Fixed clinics operated by NGO’s 0
Total fixed clinics 70
CHCs 1
Sub-total fixed clinics + CHC’s 71
District Hospitals 5 563 49 486
Umkhanyakude Non-fixed clinics 1847
655 617 11 502 2 187 292
3.3
Fixed clinics operated by LG 0
Fixed clinics operated by PG 57
Fixed clinics operated by NGO’s 0
Total fixed clinics 57
CHCs 0
Sub-total fixed clinics + CHC’s 57
District Hospitals 5 591 47 829
King Cetshwayo
Non-fixed clinics 18
968 620 15 622 2 690 024
2.8
Fixed clinics operated by LG 0
Fixed clinics operated by PG 61
Fixed clinics operated by NGO’s 0
Total fixed clinics 61
CHCs 1
Sub-total fixed clinics+ CHC’s 62
District Hospitals 6 784 30 995
Ilembe
Non-fixed clinics 11
662 413 18 400 1 978 209
3.0
Fixed clinics operated by LG 0
Fixed clinics operated by PG 34
Fixed clinics operated by NGO’s 0
Total fixed clinics 34
CHCs 2
Sub-total fixed clinics 36
District Hospitals 3 1 734 11 218
Harry Gwala
Non-fixed clinics 13
492 203 12 305 1 254 868 2.5
Fixed clinics operated by LG 0
Fixed clinics operated by PG 39
Fixed clinics operated by NGO’s 0
Total fixed clinics 39
CHCs 1
47 Including 1 State Aided Mobile

ANNUAL PERFORMANCE PLAN 2018/19 – 2020/21
80
Fighting Disease, Fighting Poverty, Giving Hope
Health District Facility Type
Number
of
facilities
Total
population
Population
per PHC
facility/
Hospital bed
PHC
Headcount/
Inpatient
Separations
Per capita
utilisation
Sub-total fixed clinics 40
District Hospitals 4 547 30 573
eThekwini
Non-fixed clinics 3648
3 548 516 29 570 9 148 353
2.7
Fixed clinics operated by LG 56
Fixed clinics operated by PG 4749
Fixed clinics operated by NGO’s 9
Total fixed clinics 112
CHCs 850
Sub-total fixed clinics 120
District Hospitals 351 4 802 32 661
KwaZulu-Natal
Non-fixed clinics 180
10 806 538 17 716 29 200 948
2.7
Fixed clinics operated by LG 56
Fixed clinics operated by PG 524
Fixed clinics operated by NGO’s 9
Total fixed clinics 589
CHCs 21
Sub-total fixed clinics 610
District Hospitals 38 1 171 325 056
Health Posts have not been included in total for non-fixed clinics
Abbreviations: LG: Local Government; and PG: Provincial Government
48 Includes 15 PG and 22 LG Mobiles 49 Includes 1 Mental Health Centre, 1 Reproductive Centre, and 2 Special Clinics 50 Includes 1 CHC (integrated with LG) 51 Including the State Aided St Mary’s Hospital (190 beds) - providing services in eThekwini West

ANNUAL PERFORMANCE PLAN 2018/19 – 2020/21
81
Fighting Disease, Fighting Poverty, Giving Hope
2018/19 Priorities
Priorities Key Focus Areas
Strengthening PHC re-
engineering
Implementation of the District Health System Sub-District Model in
collaboration with districts, facilities and communities and
monitor progress.
Expand integrated community-based and outreach services as
part of the community-based model.
Improve quality and utilisation of performance information
(including community-based information) through capacitation
of service providers.
Manage systems challenges to ensure an enabling performance
information system and process.
Strengthen review of performance information to inform planning
and decision-making at provincial, district and facility levels.
Rollout of NHI projects including contracting General Practitioners
and Allied Workers and further rollout of the Patient Registration
System to remaining districts.
Strengthen the Ideal Clinic Programme with focus on self-
assessment and development & implementation of Facility
Improvement Plans.
Strengthen district capacity in Ugu, King Cetshwayo, Ilembe,
Harry Gwala and eThekwini to improve overall Ideal Clinic
performance.
Strengthen supervision in all districts.
Strengthen capacity at district and facility levels to ensure
implementation of the District Planning & Monitoring Framework.
Facilitate a Train-the-Trainer course for Planners and M&E
Managers to improve the quality and monitoring of district and
facility plans.
Manage the Essential Post List Project in relation to human
resource distribution and allocation to improve equity and
utilisation of scarce resources.
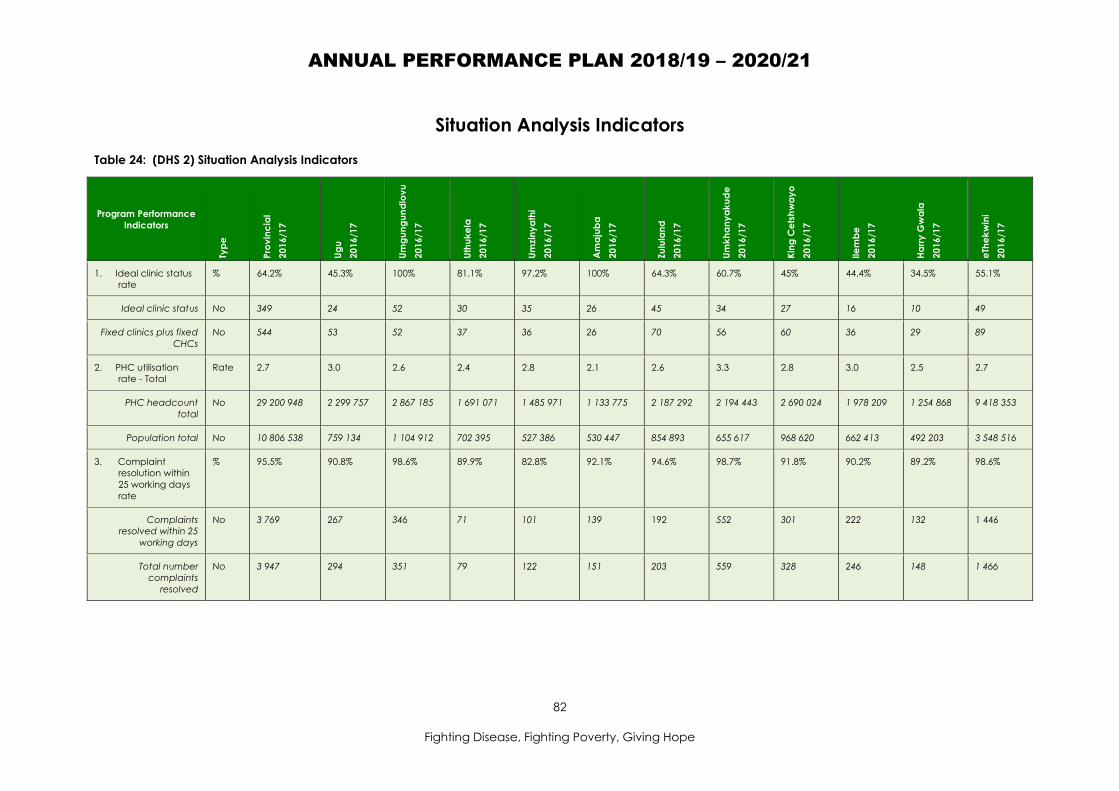
ANNUAL PERFORMANCE PLAN 2018/19 – 2020/21
82
Fighting Disease, Fighting Poverty, Giving Hope
Situation Analysis Indicators
Table 24: (DHS 2) Situation Analysis Indicators
Program Performance
Indicators Ty
pe
Pro
vin
cia
l
20
16
/17
Ug
u
20
16
/17
Um
gu
ng
un
dlo
vu
20
16
/17
Uth
uk
ela
20
16
/17
Um
zin
ya
thi
20
16
/17
Am
aju
ba
20
16
/17
Zu
lula
nd
20
16
/17
Um
kh
an
ya
ku
de
20
16
/17
Kin
g C
ets
hw
ay
o
20
16
/17
Ile
mb
e
20
16
/17
Ha
rry
Gw
ala
20
16
/17
eTh
ek
win
i
20
16
/17
1. Ideal clinic status
rate
% 64.2% 45.3% 100% 81.1% 97.2% 100% 64.3% 60.7% 45% 44.4% 34.5% 55.1%
Ideal clinic status No 349 24 52 30 35 26 45 34 27 16 10 49
Fixed clinics plus fixed
CHCs
No 544 53 52 37 36 26 70 56 60 36 29 89
2. PHC utilisation
rate - Total
Rate 2.7 3.0 2.6 2.4 2.8 2.1 2.6 3.3 2.8 3.0 2.5 2.7
PHC headcount
total
No 29 200 948 2 299 757 2 867 185 1 691 071 1 485 971 1 133 775 2 187 292 2 194 443 2 690 024 1 978 209 1 254 868 9 418 353
Population total No 10 806 538 759 134 1 104 912 702 395 527 386 530 447 854 893 655 617 968 620 662 413 492 203 3 548 516
3. Complaint
resolution within
25 working days
rate
% 95.5% 90.8% 98.6% 89.9% 82.8% 92.1% 94.6% 98.7% 91.8% 90.2% 89.2% 98.6%
Complaints
resolved within 25
working days
No 3 769 267 346 71 101 139 192 552 301 222 132 1 446
Total number
complaints
resolved
No 3 947 294 351 79 122 151 203 559 328 246 148 1 466

ANNUAL PERFORMANCE PLAN 2018/19 – 2020/21
83
Fighting Disease, Fighting Poverty, Giving Hope
Strategic Objectives, Indicators and Targets
Table 25: 2015-2019 Strategic Plan Targets (PHC)
Strategic Goal Strategic Objective Strategic Objective Statement Indicator Targets 2019/20
Life Expectancy
Strategic Goal 2:
Reduce and
manage the burden
of disease
2.1) Increase life
expectancy at birth
2.1.1) Increase the total life expectancy to 61.5 years by March
2020 (Reviewed 2017/18 based on Stats SA estimates and
projections).
Life expectancy at birth: Total 61.5 years (Stats SA
Mid-Year estimates)
2.1.2) Increase the life expectancy of males to 58.4 years by
March 2020 (Reviewed 2017/18 based on Stats SA estimates
and projections).
Life expectancy at birth: Male 58.4 years (Stats SA
Mid-Year estimates)
2.1.3) Increase the life expectancy of females to 64.5 years by
March 2020 (Reviewed 2017/18 based on Stats SA estimates
and projections).
Life expectancy at birth: Female 64.5 years (Stats SA
Mid-Year estimates)
Primary Health Care
Strategic Goal 1:
Strengthen health
system effectiveness
1.5) Accelerate
implementation of PHC
re-engineering
1.5.1) Accelerate implementation of PHC re-engineering by
increasing household registration coverage by at least 15% per
annum.
OHH registration visit coverage
(annualised)
15% annual increase
1.5.2) Increase the number of ward based outreach teams to
160 by March 2020 (Reviewed 2017/18 to align with the
allocated funding envelope).
Number of ward based outreach
teams (cumulative)
160
1.5.3: PHC utilisation rate of at least 2.5 visits per person per
year by March 2020 (Reviewed 2017/18 based on facility-
based trends – excluding community-based headcounts).
PHC utilisation rate (annualised) 2.5
1.5.4) Under 5 utilisation rate of at least 3.9 visits per child per year
(Reviewed 2017/18 based on facility-based trends – excluding
community-based headcounts).
PHC utilisation rate under 5 years
(annualised)
3.9
1.6) Scale up
implementation of
Operation Phakisa Ideal
Clinic Realisation &
Maintenance
1.6.1) 100% Provincial fixed PHC facilities score above 70% on
the Ideal Clinic Dashboard by March 2020 (Reviewed 2016/17)
Ideal Clinic status rate (Reviewed
2018/19)
100%

ANNUAL PERFORMANCE PLAN 2018/19 – 2020/21
84
Fighting Disease, Fighting Poverty, Giving Hope
Table 26: (DHS3) Strategic Objectives, Indicators & Targets
Strategic
Objective
Statement
Indicator Source Frequency/
Type
Audited/ Actual Performance Estimated
Performance
2017/18
Medium Term Targets Strategic
Plan
Target 2014/15 2015/16 2016/17 2018/19 2019/20 2020/21
Strategic Objective 1.6: Scale up implementation of Operation Phakisa ICRM
1.6.1) 100%
Provincial fixed
PHC facilities
score above
70% on the Ideal
Clinic
Dashboard by
March 2020
1. Ideal clinic status
rate
Assessment
records; Ideal
Clinic
Dashboard;
DHIS
Annual
%
Not reported 25.9% 64.2% 83.2% 87% 100% 100% 100%
Ideal clinic status Assessment
Records; DHIS
No - 141 349 508 531 610 610
Fixed clinics plus fixed
CHCs
DHIS No - 544 544 610 610 610 610
Strategic Objective 1.5: Accelerate implementation of PHC re-engineering
1.5.3: PHC
utilisation rate
of at least 2.5
visits per person
per year by
March 2020
2. PHC utilisation rate
- total (annualised)
DHIS Quarterly
No
2.9 2.9 2.7 2.652 2.653 2.5 2.5 2.5
PHC headcount total PHC Tick
Register
No 31 232 092 30 745 82154 29 200 948 28 999 286 29 200 245 29 189 445 29 009 254
Population total DHIS/ Stats SA
No 10 571 313 10 688 165 10 806 538 11 267 436 11 417 132 11 565 963 11 713 378
Strategic Objective 5.1: Improve compliance to the Ideal Clinic and National Core Standards
5.1.7) Sustain a
95% (or more)
complaint
resolution within
25 working days
rate in all public
health facilities
from March
2020 onwards
3. Complaint
resolution within 25
working days rate
Complaints
Register; DHIS
Quarterly
%
90.7% 94.1% 95.5% 94.9% 96% 96% 96.5% -
Complaint resolved
within 25 working
days
Complaints
Register
No 3 348 3 735 3 769 3 440 4 104 4 032 4 028
Complaint resolved Complaints
Register
No 3 690 3 970 3 947 3 623 4 275 4 200 4 175
52 This calculation is based on fixed facility headcount only. The total PHC headcount (including community services) is 35 168 576, which increases the total PHC utilisation rate to 3.1 53 Targets for the MTEF are based on fixed facility headcount only (not including headcount from community-based services) 54 This includes clinics, CHC’s, mobiles, reproductive and specialised clinics

ANNUAL PERFORMANCE PLAN 2018/19 – 2020/21
85
Fighting Disease, Fighting Poverty, Giving Hope
Strategic
Objective
Statement
Indicator Source Frequency/
Type
Audited/ Actual Performance Estimated
Performance
2017/18
Medium Term Targets Strategic
Plan
Target 2014/15 2015/16 2016/17 2018/19 2019/20 2020/21
5.1.6) Sustain a
complaint
resolution rate
of 95% (or
more) in all
public health
facilities from
March 2020
onwards
4. Complaint
resolution rate
Complaints
Register; DHIS
Quarterly
%
77.3% 80.6% 88.4% 88.3% 93% 95% 95% -
Complaint resolved Complaints
Register
No 3 690 3 970 3 947 3 623 4 275 4 200 4 175
Complaint received Complaints
Register
No 4 774 4 925 4 465 4 104 4 596 4 421 4 395
Strategic Objective 2.1: Increase life expectancy at birth
2.1.1) Increase
the total life
expectancy to
61.5 years by
March 2020
5. Life expectancy at
birth - Total
Stats SA mid-
year
population
estimates
Annual
estimates
Years
56.9 years55 57.7 years56 56.4 years 60.7 years57 61.1years 61.5 years 61.8 years -
2.1.2) Increase
the life
expectancy of
males to 58.4
years by March
2020
6. Life expectancy at
birth - Male
Stats SA mid-
year
population
estimates
Annual
estimates
Years
54.4 years 57 years 54 years 57.8 years 58.1 years 58.4 years 58.6 years 58.4
years
2.1.3) Increase
the life
expectancy of
females to 64.5
years by March
2020
7. Life expectancy at
birth - Female
Stats SA mid-
year
population
estimates
Annual
estimates
Years
59.4 years 58.4 years 58.7 years 63.5 years 64 years 64.5 years 64.9 years 64.5
years
Strategic Objective 1.5: Accelerate implementation of PHC re-engineering
1.5.4) Under 5
utilisation rate
of at least 3.9
8. PHC utilisation rate
under 5 years
(annualised)
PHC Register;
DHIS
Quarterly
No
4.4 4.5 4.3 3.758 3.959 3.9 3.9 3.9
55 Indicators 6, 7 and 8: Stats SA 2014 Mid-year Population Estimates 56 Indicators 6, 7 and 8: Stats SA 2015 Mid-year Population Estimates 57 2017 Mid-Year Estimates, Statistics SA 58 This calculation (rate) is based on fixed facility headcount only. The total PHC under 5 headcount (including community services) is 6 462 270, which increases the total PHC utilisation rate to 4.8 59 Targets for the MTEF are based on fixed facility headcount only (excluding headcount for community-based services)

ANNUAL PERFORMANCE PLAN 2018/19 – 2020/21
86
Fighting Disease, Fighting Poverty, Giving Hope
Strategic
Objective
Statement
Indicator Source Frequency/
Type
Audited/ Actual Performance Estimated
Performance
2017/18
Medium Term Targets Strategic
Plan
Target 2014/15 2015/16 2016/17 2018/19 2019/20 2020/21
visits per child
per year PHC headcount under
5 years
PHC Register;
DHIS
No 5 064 825 5 184 506 4 947 149 4 901 730 5 129 112 5 100 899 5 100 236
Population under 5
years
Stats SA; DHIS No 1 164 382 1 154 061 1 142 878 1 339 178 1 330 900 1 323 674 1 317 449
1.5.6) Increase
the expenditure
per PHC
headcount to
at least R 436
by March 2020
9. Expenditure per
PHC headcount
DHIS; BAS Quarterly
R
R 275 R 319 R 380 R 35860 R 405 R 436 R 476 -
Total expenditure
PHC (Sub-
Programmes 2.2,
2.3, 2.6 & 2.7)
BAS R’000 8 599 800 9 815 401 11 123 133 10 383 756 11 816 318 12 719 205 13 815 780
PHC headcount
total
DHIS No 31 232 092 30 745 821 29 200 948 28 999 286 29 200 245 29 189 445 29 009 254
1.5.7) Increase
School Health
Teams to 215
by March 2020
10. Number of school
health teams
(cumulative)
Persal; District
Management
Annual
No
170 214 209 192 210 215 220 -
1.5.2: Increase
the number of
ward based
outreach
teams to 160 by
March 2020
11. Number of ward
based outreach
teams61
(cumulative)
Persal; District
Management
Annual
No
7462 135 154 124 150 160 170 160
1.5.8) Increase
the accredited
Health
Promoting
Schools to 350
by March 2020
12. Number of
accredited health
promoting schools
(cumulative)
Accreditation
Certificates;
Health
Promotion
Schools
Database
Annual
No
278 297 314 338 342 350 355 -
1.5.1)
Accelerate
implementation
of PHC re-
engineering by
13. Outreach
household
registration visit
coverage
(annualised)
Outreach
Registers;
DHIS
Annual
%
4.1% 25.1% 25.5% 27.3% 31.4% 36.1% 41.5% 15%
Annual
increase
60 Calculation of the indicator has been amended i.e. Community Services & Other Community Services are now excluded as community-based headcounts are not included in headcount 61The 169 wards worst affected by poverty is targeted as part of the Poverty Eradication Master Plan 62All appointed teams not fully functional (inadequate allocated vehicles, teams not adequately staffed due to staff turnover, etc.)

ANNUAL PERFORMANCE PLAN 2018/19 – 2020/21
87
Fighting Disease, Fighting Poverty, Giving Hope
Strategic
Objective
Statement
Indicator Source Frequency/
Type
Audited/ Actual Performance Estimated
Performance
2017/18
Medium Term Targets Strategic
Plan
Target 2014/15 2015/16 2016/17 2018/19 2019/20 2020/21
increasing
household
registration
coverage by at
least 15% per
annum
Outreach households
registration visit
Outreach
Registers
No 103 852 617 610 651 894 693 445 797 462 917 081 1 054 643
Households in the
population
Stats SA –
Community
Survey
No
(estimate)
2 539 430 2 549 433 2 549 433 63 2 539 20964 2 539 209 2 539 209 2 539 209
63 The estimated households per district were not available at the time of tabling the 2016/17 APP – for that reason the denominator was flat lined. The new DHIS denominator is 2 798 270 64 Stats SA 2016 projections (COGTA Household data per Municipality)

ANNUAL PERFORMANCE PLAN 2018/19 – 2020/21
88
Fighting Disease, Fighting Poverty, Giving Hope
2018/19 Targets
Table 27: (DHS 4) Quarterly and Annual Targets
Performance Indicators Frequency Type Targets
2018/19
Quarterly Targets Annual
Targets Q1 Q2 Q3 Q4
1. Ideal clinic status
rate
Annual
(Cumulative)
% 87% - - - - 87%
2. PHC utilisation rate Quarterly
(Annualised)
No 2.6 2.6 2.6 2.6 2.6 2.6
3. Complaint resolution
within 25 working
days rate
Quarterly % 96% 96% 96% 96% 96% 96%
4. Complaint
resolution rate
Quarterly % 93% 89% 90% 91% 93% 93%
5. Life expectancy at
birth: Total
Annual
(Stats SA
estimate)
Years 61.1 years - - - - 61.1
years
6. Life expectancy at
birth: Male
Annual
(Stats SA
estimate)
Years 58.1 years - - - - 58.1
years
7. Life expectancy at
birth: Female
Annual
(Stats SA
estimate)
Years 64 years - - - - 64 years
8. PHC utilisation rate
under 5 years
Quarterly
(Annualised)
No 3.9 3.9 3.9 3.9 3.9 3.9
9. Expenditure per PHC
headcount
Quarterly Rand R 405 R 380 R 390 R 400 R 405 R 405
10. Number of school
health teams
Annual
(Cumulative)
No 210 - - - - 210
11. Number of ward-
based outreach
teams
Annual
(Cumulative)
No 150 - - - - 150
12. Number of
accredited health
promoting schools
Annual
(Cumulative)
No 342 - - - - 342
13. Outreach
household
registration visit
coverage
Annual
(Annualised)
% 31.4% - - - - 31.4%

ANNUAL PERFORMANCE PLAN 2018/19 – 2020/21
89
Fighting Disease, Fighting Poverty, Giving Hope
Sub-Programme: District Hospitals
2018/19 Priorities
Priorities Key Focus Areas
Improve access, inequities,
quality and efficiencies of
District Hospitals
Finalise the District Hospital Efficiency Study and use findings
to inform the final District Hospital Rationalisaiton Plan.
Implement the approved Rationalisation Plan and actively
monitor progress.
Rationalisation including: Reclassification and review of
package of services; Review referral systems & pathways;
Establish palliative care beds in identified hospitals; Re-
define roles/ functions of Family Physicians in DHS; and
Complexing of identified facilities to ensure optimal
utilisation of resources.
Scale up implementation of the NCSs with focus on self-
assessments and development and implementation of
Quality Improvement Plans.
Strengthen Clinical Governance in all facilities.
Strengthen clinical audits and internal controls with
technical support from Head Office.
Implement the recommendations from the Essential Post List
Project in District Hospitals with focus on equitable
allocation of resources.

ANNUAL PERFORMANCE PLAN 2018/19 – 2020/21
90
Fighting Disease, Fighting Poverty, Giving Hope
Situational Analysis Indicators
Table 28: (DHS5) Situation Analysis Indicators
Programme
Performance
Indicators
Ty
pe
P
rov
inc
ial
2
01
6/1
7
U
gu
2
01
6/1
7
U
mg
un
gu
nd
lov
u
2
01
6/1
7
U
thu
ke
la
2
01
6/1
7
U
mzi
ny
ath
i
2
01
6/1
7
A
ma
jub
a
2
01
6/1
7
Zu
lula
nd
2
01
6/1
7
U
mk
ha
ny
ak
ud
e
2
01
6/1
7
K
ing
Ce
tsh
wa
yo
2
01
6/1
7
Ile
mb
e
2
01
6/1
7
H
arr
y G
wa
la
2
01
6/1
7
e
The
kw
ini
2
01
6/1
7
1. Hospital achieved
75% and more on
National Core
Standards self-
assessment rate
% Not reported - - - - - - - - - - -
Hospital achieved 75%
and more on National
Core Standards self-
assessment
No - - - - - - - - - - - -
National Core
Standards self-
assessment
No - - - - - - - - - - - -
2. Average length of
stay
Days 5.7 Days 5.9 Days 5.3 Days 5.2 Days 6.0 Days 4.5 Days 5.4 Days 5.0 Days 6.4 Days 6.2 Days 4.9 Days 7.0 Days
Inpatient days - total No 1 909 462 192 129 159 191 101 872 218 122 12 155 268 126 238 343 195 945 68 342 148 949 306 288
½ Day patients No 14 698 481 1 613 418 803 574 1 579 535 653 544 1 112 6 386
Inpatient separations No 336 487 32 721 30 437 19 594 36 782 2 760 49 486 47 829 30 995 11 218 30 573 44 092
3. Inpatient bed
utilisation rate
% 57.8%65 65.3% 76.7% 60.4% 51.9% 65.5% 59.2% 58.1% 44.4% 49.3% 57.2% 62.8%
Inpatient days - total No 1 909 462 192 129 159 191 101 872 218 122 12 155 268 126 238 343 195 945 68 342 148 949 306 288
½ Day patients No 14 698 481 1 613 418 803 574 1 579 535 653 544 1 112 6 386
65
DHIS reflects as 57%
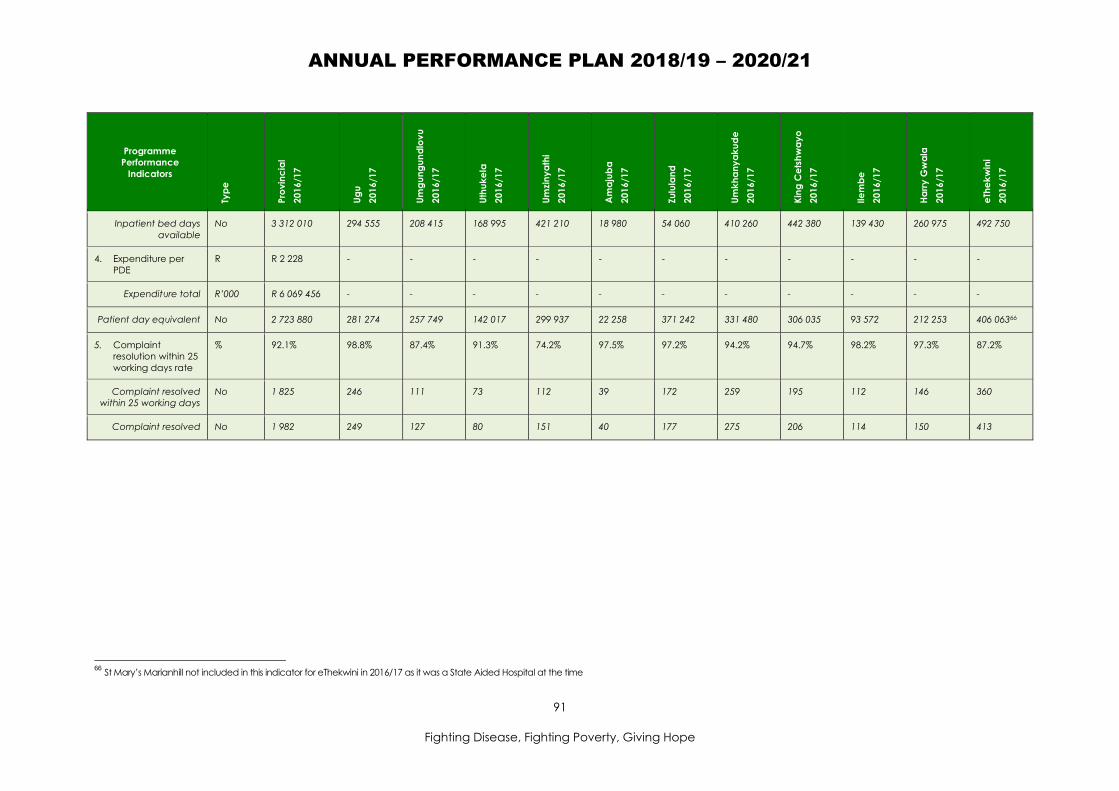
ANNUAL PERFORMANCE PLAN 2018/19 – 2020/21
91
Fighting Disease, Fighting Poverty, Giving Hope
Programme
Performance
Indicators
Ty
pe
P
rov
inc
ial
2
01
6/1
7
U
gu
2
01
6/1
7
U
mg
un
gu
nd
lov
u
2
01
6/1
7
U
thu
ke
la
2
01
6/1
7
U
mzi
ny
ath
i
2
01
6/1
7
A
ma
jub
a
2
01
6/1
7
Zu
lula
nd
2
01
6/1
7
U
mk
ha
ny
ak
ud
e
2
01
6/1
7
K
ing
Ce
tsh
wa
yo
2
01
6/1
7
Ile
mb
e
2
01
6/1
7
H
arr
y G
wa
la
2
01
6/1
7
e
The
kw
ini
2
01
6/1
7
Inpatient bed days
available
No 3 312 010 294 555 208 415 168 995 421 210 18 980 54 060 410 260 442 380 139 430 260 975 492 750
4. Expenditure per
PDE
R R 2 228 - - - - - - - - - - -
Expenditure total R’000 R 6 069 456 - - - - - - - - - - -
Patient day equivalent No 2 723 880 281 274 257 749 142 017 299 937 22 258 371 242 331 480 306 035 93 572 212 253 406 06366
5. Complaint
resolution within 25
working days rate
% 92.1% 98.8% 87.4% 91.3% 74.2% 97.5% 97.2% 94.2% 94.7% 98.2% 97.3% 87.2%
Complaint resolved
within 25 working days
No 1 825 246 111 73 112 39 172 259 195 112 146 360
Complaint resolved No 1 982 249 127 80 151 40 177 275 206 114 150 413
66
St Mary’s Marianhill not included in this indicator for eThekwini in 2016/17 as it was a State Aided Hospital at the time

ANNUAL PERFORMANCE PLAN 2018/19 – 2020/21
92
Fighting Disease, Fighting Poverty, Giving Hope
Strategic Objectives, Indicators and Targets
Table 29: 2015-2019 Strategic Plan Targets
Strategic Goal Strategic Objective Strategic Objective Statement Indicator Targets 2019/20
Strategic Goal 1:
Strengthen health
system effectiveness
1.7) Improve hospital
efficiencies
1.7.1) Maintain a bed utilisation rate of 75% (or more) by March
2020 (The strategic objective has not been reviewed as 75% is
considered as minimum for efficiency).
Inpatient bed utilisation rate - total 75% (or more)
1.7.2) Approved Hospital Rationalisation Plan by September
2018 (Reviewed 2017/18 to make provision for inclusion in the
Departmental Turn-Around Plan. This is managed from
Programme 1 for all hospitals).
Approved Hospital Rationalisation
Plan
Approved Plan
implemented
Strategic Goal 5:
Improved quality of
health care
5.1) Improve compliance
to the Ideal Clinic and
National Core Standards
5.1.2) 60% (or more) public health hospitals achieved 75% and
more on NCS self-assessment rate by March 2020 (Amended
2017/18 - Indicator description amended in compliance with
NIDS).
Hospitals achieved 75% and more on
National Core Standards self-
assessment rate (Review 2017/18 in
compliance with NIDS)
60% (or more)
Table 30: (DHS6) Strategic Objectives, Indicators and Targets
Strategic
Objective
Statement
Performance
Indicators Data Source
Frequency
Type
Audited/ Actual Performance Estimated
Performance
2017/18
Medium Term Targets Strategic
Plan
Targets
2019/20 2014/15 2015/16 2016/17 2018/19 2019/20 2020/21
Strategic Objective 5.1: Improve compliance to the Ideal Clinic and National Core Standards
5.1.2) 60% (or
more) public
health hospitals
achieved 75%
and more on
the National
Core Standards
(NCS) self-
assessment rate
1. Hospital
achieved 75%
and more on
NCS self-
assessment rate
Self-
assessment
Records; QA
records; DHIS
Quarterly
%
Not reported Not reported Not reported 90% 39%67 60% 65.8% 60% (or
more)
Hospital achieved
75% and more on
NCS self-assessment
NCS
Assessment
Records
No - - - 9 15 20 25
67 The number of hospitals achieving 75% and more has been increased by 6 (numerator) while all hospitals (as opposed to10 in 2017/18) are expected to conduct self-assessments (% target therefore misleading)

ANNUAL PERFORMANCE PLAN 2018/19 – 2020/21
93
Fighting Disease, Fighting Poverty, Giving Hope
Strategic
Objective
Statement
Performance
Indicators Data Source
Frequency
Type
Audited/ Actual Performance Estimated
Performance
2017/18
Medium Term Targets Strategic
Plan
Targets
2019/20 2014/15 2015/16 2016/17 2018/19 2019/20 2020/21
by March 2020 Number of hospitals
that conducted a
NCS self-assessment
NCS
Assessment
Records
No - - - 10 38 38 38
Strategic Objective 1.7: Improve hospital efficiencies
1.7.3) Improve
hospital
efficiencies by
reducing the
average length
of stay to at
least 5.5 days
(District), 5.3
(Regional), 15
days (TB), 286.5
days (Psych),
28.5 days
(Chronic), 9
days (Tertiary),
and 8.6 days
(Central) by
March 2020
2. Average length
of stay - total
DHIS Quarterly
Days
5.8 Days 5.8 Days 5.7 Days 5.7 Days 5.6 Days 5.5 Days 5.5 Days -
In-patient days - total Midnight
Census
No 1 972 507 1 891 030 1 909 462 1 793 894 1 820 226 1 804 998 1 804 998
½ Day patients Admission/
Discharge
Register
No 11 392 12 636 14 698 14 219 14 215 14 268 14 268
Inpatient separations Admission/
Discharge
Register
No 339 195 331 820 336 487 316 486 327 996 329 478 326 972
1.7.1) Maintain
a bed utilisation
rate of 75% (or
more) by
March 2020
3. Inpatient bed
utilisation rate -
total
DHIS Quarterly
%
62.8% 60.2% 57.8%68 59.4% 60.2% 62.7% 65.3% 75% or
more
In-patient days - total Midnight
Census
No 1 972 507 1 891 030 1 909 462 1 793 894 1 820 226 1 804 998 1 804 998
½ Day patients Admission/
Discharge
Register
No 11 392 12 636 14 698 14 219 14 215 14 268 14 268
Inpatient bed days
available
DHIS No 3 057 240 3 116 370 3 312 010 3 044 708 3 045 557 2 899 411 2 787 895
Strategic Objective 1.7: Improve hospital efficiencies
1.7.4) Maintain
expenditure per
PDE within the
4. Expenditure per
patient day
equivalent (PDE)
BAS; DHIS Quarterly
R
R 2 032 R 2 116 R 2 228 R 2 501 R 2 542 R 2 781 R 3 125 -
68 Calculated manually due to missing bed numbers on DHIS - DHIS reflected as 57%

ANNUAL PERFORMANCE PLAN 2018/19 – 2020/21
94
Fighting Disease, Fighting Poverty, Giving Hope
Strategic
Objective
Statement
Performance
Indicators Data Source
Frequency
Type
Audited/ Actual Performance Estimated
Performance
2017/18
Medium Term Targets Strategic
Plan
Targets
2019/20 2014/15 2015/16 2016/17 2018/19 2019/20 2020/21
provincial
norms
Expenditure total BAS R’000 5 685 230 5 726 246 6 069 456 6 319 400 6 915 092 7 507 560 8 059 811
Patient day
equivalent
DHIS No 2 803 295 2 705 625 2 723 880 2 526 578 2 719 962 2 699 977 2 578 839
Strategic Objective 5.1: Improve compliance to the Ideal Clinic and National Core Standards
5.1.7) Sustain a
95% (or more)
complaint
resolution within
25 working days
rate in all public
health facilities
from March
2020 onwards
5. Complaint
resolution within
25 working days
rate
DHIS; QA
Database
Quarterly
%
92.1% 89.8% 92.1% 90.4% 94% 95% 96% -
Complaints resolved
within 25 working
days
Complaints
Register
No 1 716 1 841 1 825 1 486 1 918 2 050 2 167
Complaints resolved Complaints
Register
No 1 864 2 050 1 982 1 643 2 040 2 158 2 257
Strategic Objective 2.7: Reduce maternal mortality
5.1.6) Sustain a
complaint
resolution rate
of 95% (or
more) in all
public health
facilities from
March 2020
onwards
6. Complaints
resolution rate
DHIS; QA
Database
Quarterly
%
70.5% 80.8% 78.6% 80.1% 87.1% 94.7% 98.6% -
Complaints resolved Complaints
Register
No 1 863 2 050 1 982 1 643 2 040 2 158 2 257
Complaints received Complaints
Register
No 2 643 2 537 2 523 2 052 2 341 2 279 2 289
2.7.2) Reduce
the caesarean
section rate to
27.5% (District),
37% (Regional),
60% (Tertiary),
and 67% or less
(Central) by
March 2020
7. Delivery by
caesarean
section rate
DHIS Quarterly
%
27.8% 28.8% 28.9% 27.6% 27.5% 27.5% 27% -
Delivery by caesarean
section
Theatre
Registers
No 24 762 23 958 24 959 23 680 23 651 23 622 23 138
Delivery in facility total Delivery &
Theatre
Registers
No 89 014 83 219 86 145 85 844 86 002 85 897 85 695
Strategic Objective 1.7: Improve hospital efficiencies
1.7.5) Reduce
the unreferred
8. OPD headcount-
total
DHIS; OPD
Register
Quarterly
No
2 419 561 2 319 180 2 310 070 2 300 904 2 309 775 2 299 385 2 088 198 -

ANNUAL PERFORMANCE PLAN 2018/19 – 2020/21
95
Fighting Disease, Fighting Poverty, Giving Hope
Strategic
Objective
Statement
Performance
Indicators Data Source
Frequency
Type
Audited/ Actual Performance Estimated
Performance
2017/18
Medium Term Targets Strategic
Plan
Targets
2019/20 2014/15 2015/16 2016/17 2018/19 2019/20 2020/21
outpatient
department
(OPD)
headcounts by
at least 7% per
annum
9. OPD headcount
not referred new
DHIS; OPD
Register
Quarterly
No
526 271 448 763 460 530 439 372 408 61669 380 013 353 413 -
69 7% decrease per annum (linked with improved PHC management & referral)
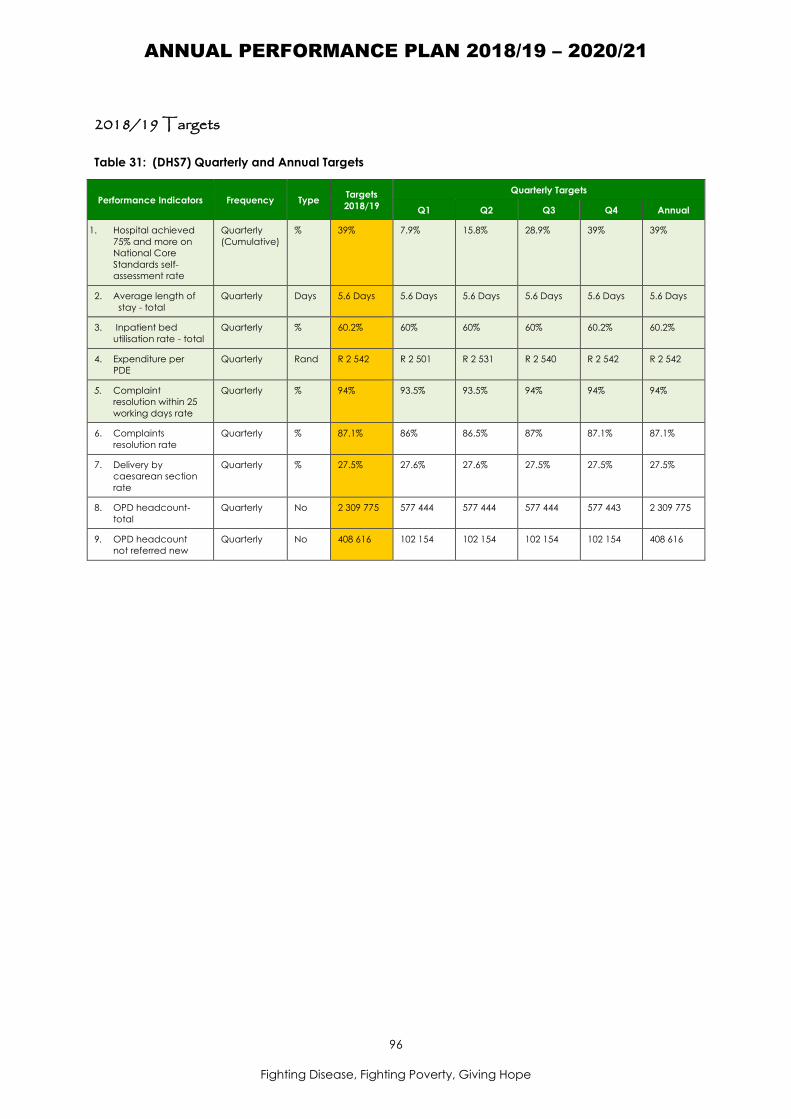
ANNUAL PERFORMANCE PLAN 2018/19 – 2020/21
96
Fighting Disease, Fighting Poverty, Giving Hope
2018/19 Targets
Table 31: (DHS7) Quarterly and Annual Targets
Performance Indicators Frequency Type Targets
2018/19
Quarterly Targets
Q1 Q2 Q3 Q4 Annual
1. Hospital achieved
75% and more on
National Core
Standards self-
assessment rate
Quarterly
(Cumulative)
% 39% 7.9% 15.8% 28.9% 39% 39%
2. Average length of
stay - total
Quarterly Days 5.6 Days 5.6 Days 5.6 Days 5.6 Days 5.6 Days 5.6 Days
3. Inpatient bed
utilisation rate - total
Quarterly % 60.2% 60% 60% 60% 60.2% 60.2%
4. Expenditure per
PDE
Quarterly Rand R 2 542 R 2 501 R 2 531 R 2 540 R 2 542 R 2 542
5. Complaint
resolution within 25
working days rate
Quarterly % 94% 93.5% 93.5% 94% 94% 94%
6. Complaints
resolution rate
Quarterly % 87.1% 86% 86.5% 87% 87.1% 87.1%
7. Delivery by
caesarean section
rate
Quarterly % 27.5% 27.6% 27.6% 27.5% 27.5% 27.5%
8. OPD headcount-
total
Quarterly No 2 309 775 577 444 577 444 577 444 577 443 2 309 775
9. OPD headcount
not referred new
Quarterly No 408 616 102 154 102 154 102 154 102 154 408 616
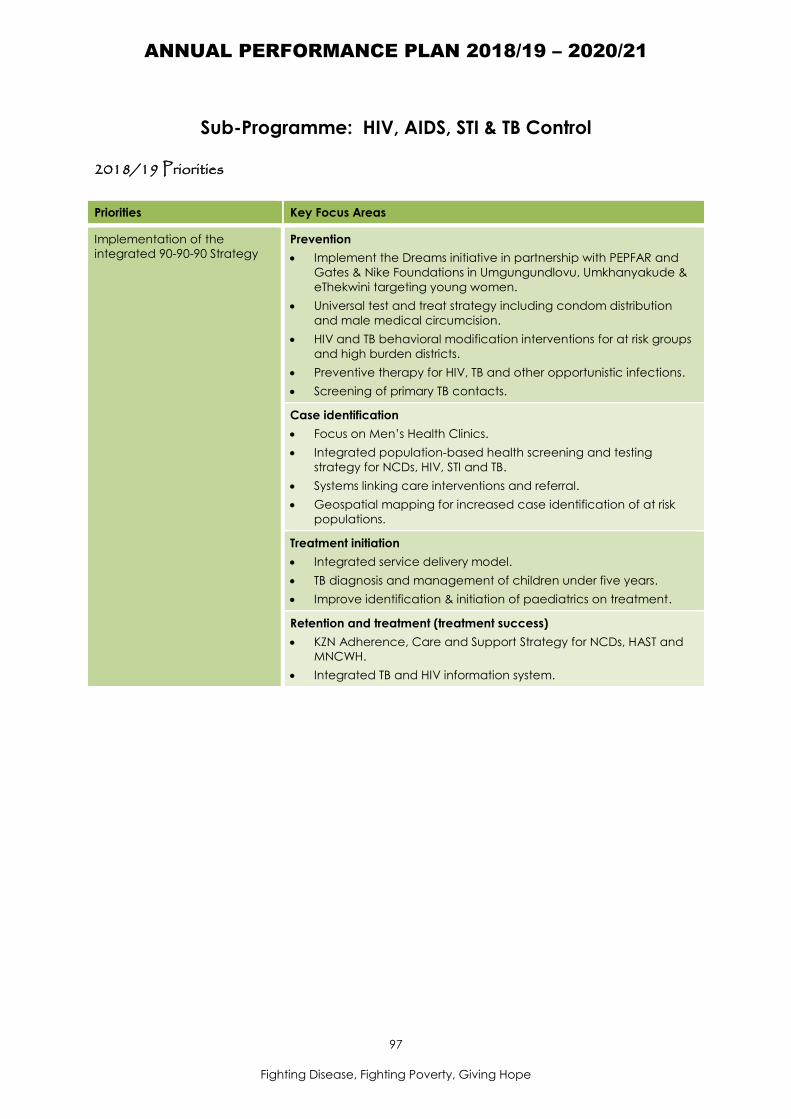
ANNUAL PERFORMANCE PLAN 2018/19 – 2020/21
97
Fighting Disease, Fighting Poverty, Giving Hope
Sub-Programme: HIV, AIDS, STI & TB Control
2018/19 Priorities
Priorities Key Focus Areas
Implementation of the
integrated 90-90-90 Strategy
Prevention
Implement the Dreams initiative in partnership with PEPFAR and
Gates & Nike Foundations in Umgungundlovu, Umkhanyakude &
eThekwini targeting young women.
Universal test and treat strategy including condom distribution
and male medical circumcision.
HIV and TB behavioral modification interventions for at risk groups
and high burden districts.
Preventive therapy for HIV, TB and other opportunistic infections.
Screening of primary TB contacts.
Case identification
Focus on Men’s Health Clinics.
Integrated population-based health screening and testing
strategy for NCDs, HIV, STI and TB.
Systems linking care interventions and referral.
Geospatial mapping for increased case identification of at risk
populations.
Treatment initiation
Integrated service delivery model.
TB diagnosis and management of children under five years.
Improve identification & initiation of paediatrics on treatment.
Retention and treatment (treatment success)
KZN Adherence, Care and Support Strategy for NCDs, HAST and
MNCWH.
Integrated TB and HIV information system.

ANNUAL PERFORMANCE PLAN 2018/19 – 2020/21
98
Fighting Disease, Fighting Poverty, Giving Hope
Situation Analysis Indicators
Table 32: (DHS8) Situation Analysis Indicators
Indicator Ty
pe
Pro
vin
cia
l
20
16
/17
Ug
u
20
16
/17
Um
gu
ng
un
dlo
vu
20
16
/17
Uth
uk
ela
20
16
/17
Um
zin
ya
thi
20
16
/17
Am
aju
ba
20
16
/17
Zu
lula
nd
20
16
/17
Um
kh
an
ya
ku
de
20
16
/17
Kin
g C
ets
hw
ay
o
20
16
/17
Ile
mb
e
20
16
/17
Ha
rry
Gw
ala
20
16
/17
eTh
ek
win
i
20
16
/17
1. ART client remain
on ART end of
month - total
No 1 181 691 86 388 135 654 70 052 54 593 50 794 101 471 84 506 105 433 66 889 49 519 376 392
2. TB / HIV co-
infected client on
ART rate
% 88% 94% 100% 88.5% 96.8% 85% 87.8% 97.8% 99.6% 94.3% 94.7% 75.8%
TB/HIV co-infected
client on ART
No 41 611 3 508 4 961 2 332 1 637 1 314 3 127 2 784 4 636 2 741 1 897 12 674
HIV positive TB client No 47 269 3 733 4 961 2636 1 691 1 545 3 563 2 848 4 655 2 906 2 004 16 727
3. HIV test done -
total
No 3 167 664 304 544 269 555 123 580 230 306 141 915 225 053 146 913 305 011 180 554 182 089 1 058 144
4. Male condoms
distributed
No 185 574 089 10 580 808 24025 094 12 459 361 23 472 867 8 419 270 13 829 379 8 310 801 11 853 972 12 654 860 11 469 300 48 498 377
5. Medical male
circumcision - total
No 122 132 6 740 19 091 10 848 12 871 4 471 10 295 7 237 11 142 6 219 5 213 28 005
6. TB 5 years and
older start on
treatment rate
% Not reported - - - - - - - - - - -
TB 5 years and older
start on treatment
No - - - - - - - - - - - -

ANNUAL PERFORMANCE PLAN 2018/19 – 2020/21
99
Fighting Disease, Fighting Poverty, Giving Hope
Indicator
Typ
e
Pro
vin
cia
l
20
16
/17
Ug
u
20
16
/17
Um
gu
ng
un
dlo
vu
20
16
/17
Uth
uk
ela
20
16
/17
Um
zin
ya
thi
20
16
/17
Am
aju
ba
20
16
/17
Zu
lula
nd
20
16
/17
Um
kh
an
ya
ku
de
20
16
/17
Kin
g C
ets
hw
ay
o
20
16
/17
Ile
mb
e
20
16
/17
Ha
rry
Gw
ala
20
16
/17
eTh
ek
win
i
20
16
/17
TB symptomatic client
5 years and older
tested positive
No - - - - - - - - - - - -
7. TB client treatment
success rate
% 88.7% 91.9% 91.5% 81.6% 92.4% 81.1% 87.6% 90.5% 98.7% 87.8% 88.2% 85.8%
TB client successfully
completed treatment
No 15 707 2 091 1 514 569 596 569 816 803 1 626 552 540 6 031
New smear positive TB
client start on
treatment
No 17 711 2 276 1 654 697 645 702 932 887 1 648 629 612 7 029
8. TB client lost to
follow up rate
% 4.1% 2.7% 4.4% 1.4% 0.6% 6.3% 3% 1.7% 0.1% 6.5% 3.9% 5.9%
TB client lost to follow
up
No 719 61 72 10 4 44 28 15 2 41 24 418
TB client start on
treatment
No 17 711 2 276 1 654 697 645 702 932 887 1 648 629 612 7 029
9. TB client death
rate
% 3.2% 2.8% 3.3% 2.6% 6.5% 8.7% 5.9% 3.2% 0.6% 3% 5.1% 2.5%
TB client died during
treatment
No 561 64 54 18 42 61 55 28 10 19 31 179
TB client start on
treatment
No 17 711 2 276 1 654 697 645 702 932 887 1 648 629 612 7 029
10. TB MDR treatment
success rate
% 60.3% 57.4% 62.5% 61.8% 62.8% 63.2% 58.8% 73.1% 61.1% 100% 56.3% 58.4%

ANNUAL PERFORMANCE PLAN 2018/19 – 2020/21
100
Fighting Disease, Fighting Poverty, Giving Hope
Indicator
Typ
e
Pro
vin
cia
l
20
16
/17
Ug
u
20
16
/17
Um
gu
ng
un
dlo
vu
20
16
/17
Uth
uk
ela
20
16
/17
Um
zin
ya
thi
20
16
/17
Am
aju
ba
20
16
/17
Zu
lula
nd
20
16
/17
Um
kh
an
ya
ku
de
20
16
/17
Kin
g C
ets
hw
ay
o
20
16
/17
Ile
mb
e
20
16
/17
Ha
rry
Gw
ala
20
16
/17
eTh
ek
win
i
20
16
/17
TB MDR client
successfully completed
treatment
No 2 185 171 173 21 98 12 238 217 210 1 67 977
TB MDR confirmed
client start on
treatment
No 3 624 298 277 34 156 19 405 297 344 1 119 1 674

ANNUAL PERFORMANCE PLAN 2018/19 – 2020/21
101
Fighting Disease, Fighting Poverty, Giving Hope
Strategic Objectives, Indicators and Targets
Table 33: 2015-2019 Strategic Plan Targets
Strategic Goal Strategic Objective Strategic Objective Statement Indicators Targets 2019/20
Strategic Goal 2:
Reduce and
manage the burden
of disease
HIV, AIDS and STI
2.2) Reduce HIV
Incidence
2.2.1) Reduce the HIV incidence to 1% (or less) by March 2020
(Thembisa Model estimates)
HIV incidence 1% (or less) – Estimate
2.2.2) Test at least 16.5 million people (cumulative) for HIV by
March 2020 (Reviewed 2016/17)
HIV test done – total (Reviewed
2017/18 in accordance with NIDS)
At least 16.5 million
(cumulative)
2.3) Manage HIV
prevalence
2.3.2) Increase the number of patients on ART to at least 1.5
million by March 2020 (cumulative)
ART client remain on ART at end of
month – total (Reviewed 2017/18 in
accordance with NIDS)
At least 1.5 million
Tuberculosis
2.4) Improve TB outcomes 2.4.1) Increase the TB client treatment success rate to 90% (or
more) by March 2020
TB client treatment success rate 90% (or more)
2.4.2) Reduce the TB incidence to 400 (or less) per 100 000 by
March 2020
TB incidence (per 100 000
population)
400 (or less) per
100 000 population
2.4.3) Sustain a TB death rate of 5% (or less) by March 2020
(Reviewed 2018/19)
TB death rate 5%
2.4.4) Increase the MDR-TB treatment success rate to 62% (or
more) by March 2020 (Reviewed 2018/19)
TB MDR treatment success rate 62% (or more)

ANNUAL PERFORMANCE PLAN 2018/19 – 2020/21
102
Fighting Disease, Fighting Poverty, Giving Hope
Table 34: (DHS9) Strategic Objectives, Indicators and Targets
Strategic
Objective
Statement
Performance
Indicators Data Source
Frequency
Type
Audited/ Actual Performance Estimated
Performance
2017/18
Medium Term Targets Strategic
Plan Target
2019/20 2014/15 2015/16 2016/17 2018/19 2019/20 2020/21
Strategic Objective 2.3: Manage HIV prevalence
2.3.1) Increase
the number of
patients on ART
to at least 1.5
million by March
2020
(cumulative)
1. ART client remain
on ART end of
month - total
DHIS; ART
Register
Quarterly
No
897 270 1 059 193 1 181 691 1 259 612 1 313 804 1 444 558 1 578 737 1.5 million
2. TB/ HIV co-
infected clients
on ART rate
ART register;
TIER.Net;
DHIS
Quarterly
%
61.5% 86.8% 88% 89.1% 95% 95% 95% -
TB/HIV co-infected
clients on ART
ART Register;
ETR.Net
No 27 050 42 414 41 611 35 924 38 308 36 408 34 204
HIV positive TB client ART Register;
ETR.Net
No 71 116 48 857 47 269 40 300 40 324 38 324 36 004
Strategic Objective 2.2: Reduce HIV Incidence
2.2.2) Test at
least 16.5 million
people for HIV
by March 2020
(cumulative)
3. HIV test done -
total
DHIS; HIV
Register
Quarterly
No
2 541 231 2 627 230
(6 761 360
cumulative)
3 167 664
(9 929 024
cumulative)
3 100 696
(13 029 720
cumulative)
2 982 771
(16 012 491
cumulative)
3 134 424
(19 146 915
cumulative)
3 134 424
(22 281 339
cumulative)
16.5 million
(cumulative)
2.2.3) Increase
the male
condom
distribution to
206 million by
March 2020
4. Male condoms
distributed
Stock; Bin
Cards
No 196 002 188 184 431 641 185 574 089 94 153 67670 199 500 000 206 757 450 220 917 212 -
2.2.4) Increase
the medical
male
circumcisions to
1.2 million by
March 2020
(cumulative)
5. Medical male
circumcision –
total
MMC
Register;
Theatre
register; DHIS
Quarterly
No
536 137
cumulative
143 390
annual
662 580
cumulative
126 443
annual
784 712
cumulative
122 132
annual
996 936
cumulative
182 224
annual 71
1 106 974
cumulative
140 038
annual72
1 262 990
cumulative
156 016
annual
1 427 496
cumulative
164 506
annual
-
70 Calculation of the indicator changed from the inclusion of “distribution from primary & secondary distribution sites” to inclusion of “only primary distribution sites” – hence drop in numbers 71 The significant increase in the estimated data is as a result of additional services rendered by contracted General Practitioners and the national campaign during the year 72 The target has been aligned with available budget – hence drop in annual number from the estimated performance for 2017/18

ANNUAL PERFORMANCE PLAN 2018/19 – 2020/21
103
Fighting Disease, Fighting Poverty, Giving Hope
Strategic
Objective
Statement
Performance
Indicators Data Source
Frequency
Type
Audited/ Actual Performance Estimated
Performance
2017/18
Medium Term Targets Strategic
Plan Target
2019/20 2014/15 2015/16 2016/17 2018/19 2019/20 2020/21
Strategic Objective 2.4: Improve TB outcomes
2.4.5) Increase
the TB 5 years
and older start
on treatment to
92% by March
2020
6. TB 5 years and
older start on
treatment rate
TB/HIV
Registers;
TIER.Net;
Quarterly
%
Not reported Not reported Not reported 106.9%73 90% 92% 94% -
TB client 5 years and
older start on
treatment
TB/HIV
Registers;
TIER.Net
No - - - 68 676 49 559 48 818 48 449
TB symptomatic client
5 years and older
tested positive
TB/HIV
Registers;
TIER.Net;
No - - - 64 324 55 110 53 063 51 541
2.4.1) Increase
the TB client
treatment
success rate to
90% (or more)
by March 2020
7. TB client
treatment
success rate
TB Register;
ETR.Net
Quarterly
%
85.3% 84.5% 88.7% 83% 87.6% 90% 92% 90% or more
TB client successfully
completed
treatment
TB Register No 25 332 19 313 15 707 46 808 47 563 47 051 46 717
TB client start on
treatment
TB Register No 31 080 22 853 17 711 56 395 54 296 52 279 50 779
2.4.6) Stabilise
the TB client lost
to follow up at
5% (or less) by
March 2020
8. TB client lost to
follow up rate
TB Register;
ETR.Net
Quarterly
%
4.1% 4% 4.1% 5%74 5% 5% 5% -
TB client on treatment
lost to follow up
TB Register No 1 288 918 719 2 814 2 715 2 614 2 539
TB client start on
treatment
TB Register No 31 080 22 853 17 711 56 395 54 296 52 279 50 779
2.4.3) Sustain a
TB death rate of
9. TB client death
rate
ETR.Net Annual
%
4.3% 3.4% 3.2% 4.2%75 5%76 5% 5% 5%
73 Data quality/ completeness is a challenge since change of the denominator i.e. all TB tests are now included in denominator (including laboratory) as opposed to sputum only previously – this result in clients being
captured on Tier.Net as having started on treatment while not being captured as testing positive. This is being addressed by the TB Programme 74 The Lost to follow up rate has increased due to inadequate resources including vehicles and surveillance staff. TB Tracer Teams amalgamated with MDR-TB Injection Teams resulting in reduced capacity to trace defaulters.
This may worsen over the MTEF period due to a decreasing funding envelope 75 Screening and diagnostic tools have improved resulting in patients being identified and managed earlier – late presentation by patients at facilities however continues to be a challenge to effective management and
improved treatment outcomes 76 Same comment as above

ANNUAL PERFORMANCE PLAN 2018/19 – 2020/21
104
Fighting Disease, Fighting Poverty, Giving Hope
Strategic
Objective
Statement
Performance
Indicators Data Source
Frequency
Type
Audited/ Actual Performance Estimated
Performance
2017/18
Medium Term Targets Strategic
Plan Target
2019/20 2014/15 2015/16 2016/17 2018/19 2019/20 2020/21
5% (or less) by
March 2020 TB client death during
treatment
TB Register No 1 271 772 561 2 353 2 715 2 614 2 539
TB client start on
treatment
TB Register No 29 646 22 853 17 711 56 395 54 296 52 279 50 779
2.4.4) Increase
the MDR-TB
treatment
success rate to
62% (or more)
by March 2020
10. TB MDR
treatment
success rate
MDR
register; EDR
Web
Annual
%
55% 58% 60% 58% 60% 62% 65% 62% or more
TB MDR client
successfully
completing treatment
MDR
Register
No 1 428 2 267 2 185 2 185 2 185 1 996 1 976
TB MDR confirmed
client start on
treatment
MDR
Register
No 2 597 3 906 3 624 3 767 3 624 3 220 3 040
2.4.2) Reduce
the TB
incidence to
400 (or less) per
100 000 by
March 2020
11. TB incidence TB register;
ETR.Net
Annual
No per
100,000 pop
828/100 000 643/100 000 511/100 000 501/100 000 500/ 100 000 450/ 100 000 400/ 100 000 400 (or less)
per 100 000
population
New confirmed TB
cases
TB Register No 87 518 68 678 55 249 56 395 57 086 52 047 46 853
Total population in
KZN
DHIS; Stats
SA
Population 10 571 312 10 688 165 10 806 538 11 267 43677 11 417 132 11 565 963 11 713 378
2.4.7) Improve
Drug Resistant
TB outcomes by
ensuring that
90% (or more)
diagnosed
MDR/XDR-TB
patients are
initiated on
treatment by
March 2020
12. TB XDR confirmed
client start on
treatment
XDR TB
Register;
EDR Web;
TIER.Net
Quarterly
No
130 165 170 6378 50 40 30 -
Strategic Objective 2.2: Reduce HIV Incidence
77 This denominator aligns with the DHIS KZN total population. According to the TB Programme Director, the National Department of Health uses a different population when calculating the indicator – data will therefore
differ at national level 78 Previous data and targets included pre-XDR clients and XDR clients rounded off by the information system. The lower figures are as a result of improved data quality and only include confirmed XDR cases

ANNUAL PERFORMANCE PLAN 2018/19 – 2020/21
105
Fighting Disease, Fighting Poverty, Giving Hope
Strategic
Objective
Statement
Performance
Indicators Data Source
Frequency
Type
Audited/ Actual Performance Estimated
Performance
2017/18
Medium Term Targets Strategic
Plan Target
2019/20 2014/15 2015/16 2016/17 2018/19 2019/20 2020/21
2.2.1) Reduce
the HIV
incidence to 1%
(or less) by
March 2020
13. HIV incidence Thembisa
Model
Projections
Annual
%
0.85% 0.78% 0.71% 0.63% 0.57% 0.52% 0.49% 1% or less
(projections/
estimates)
2.2.5) Decrease
male urethritis
syndrome
incidence to at
least 26.2/ 1000
by March 2020
14. Male urethritis
syndrome
incidence
DHIS; Stats
SA
Quarterly
No per 1000
population
35.8/ 1000 32.7/ 1000 29.5/ 1000 29.4/ 1000 27.2/ 1000 26.2/ 1000 24.2/ 1000 -
Male urethritis
syndrome
treated – new
episodes
PHC Register No 118 536 110 085 82 957 83 282 78 490 77 053 72 741
Male population 15-
49 years
DHIS; Stats
SA
Population 3 314 204 3 370 509 2 814 805 2 831 094 2 885 117 2 942 528 3 002 614
Strategic Objective 2.3) Manage HIV prevalence
2.3.1) Increase
the number of
patients on ART
to at least 1.5
million by March
2020
(cumulative)
15. ART adult remain
on ART end of
period
ART Register;
TIER.Net
Quarterly
No
Not reported Not reported 1 129 314 1 207 716 1 259 491 1 373 047 1 398 124 -
16. ART child under
15 years remain
on ART end of
period
ART Register;
TIER.Net
Quarterly
No
Not reported Not reported 52 377 51 896 54 313 60 500 61 123 -
TB indicators: Reporting for TB indicators changed from reporting only New smear positive PTB cases to reporting ALL TB cases in the denominator – hence significance variance in data from 2017/18 onwards

ANNUAL PERFORMANCE PLAN 2018/19 – 2020/21
106
Fighting Disease, Fighting Poverty, Giving Hope
2018/19 Targets
Table 35: (DHS 10) Quarterly and Annual Targets
Performance
Indicators Frequency Type
Targets
2018/19
Quarterly Targets
Q1 Q2 Q3 Q4 Annual
1. ART client
remain on ART
end of month -
total
Quarterly No 1 313 804 1 273 160 1 286 708 1 300 256 1 313 804 1 313 804
2. TB/HIV co-
infected
clients on ART
rate
Quarterly % 95% 91.5% 92.9% 94% 95% 95%
3. HIV test done -
total
Quarterly No 2 982 771 745 693 745 693 745 693 745 692 2 982 771
4. Male condom
distribution
Quarterly No 199 500 000 49 874 996 49 874 996 49 875 012 49 874 996 199 500 000
5. Medical male
circumcision
performed –
total
Quarterly No 140 038
annual
33 605 47 621 28 003 30 809 140 038
annual
6. TB client 5
years and
older start on
treatment rate
Quarterly % 90% 90% 90% 90% 90% 90%
7. TB client
treatment
success rate
Quarterly % 87.6% 87.6% 87.6% 87.6% 87.6% 87.6%
8. TB client lost to
follow up rate
Quarterly % 5% 5% 5% 5% 5% 5%
9. TB client death
rate
Annual % 5% - - - - 5%
10. TB MDR
treatment
success rate
Annual % 60% - - - - 60%
11. TB incidence Annual No per
100k
pop
500/ 100 000 - - - - 500/ 100 000
12. TB XDR
confirmed
client start on
treatment
Quarterly No 50 12 12 13 13 50
13. HIV incidence Annual
(Estimate)
% 0.57% - - - - 0.57%
14. Male urethritis
syndrome
incidence
Quarterly No per
1000
pop
27.2/ 1000 28.8/ 1000 28/ 1000 27.5/ 1000 27.2/ 1000 27.2/ 1000
15. ART adult
remain on ART
end of period
Quarterly No 1 259 491 1 220 660 1 233 604 1 246 548 1 259 491 1 259 491
16. ART child
under 15 years
remain on ART
end of period
Quarterly No 54 313 52 500 53 104 53 708 54 313 54 313

ANNUAL PERFORMANCE PLAN 2018/19 – 2020/21
107
Fighting Disease, Fighting Poverty, Giving Hope
Sub-Programme: Maternal, Neonatal, Child & Women’s Health and
Nutrition
2018/19 Priorities
Priorities Key Focus Areas
Improve uptake of Family
Planning and dual protection
Strengthen Family Planning uptake at facility level.
Reduce maternal mortality Improve safety at caesarean section delivery sites.
Improve quality of antenatal, intrapartum and postnatal care.
Prevention of child malnutrition
and child obesity
Improve breastfeeding practices and complementary feeding.
Improve the management of malnutrition at facility level.
Reduce under 5 mortality Strengthen notification of deaths of newborns and children in
hospital.
Improve clinical audits of deaths using the Child Problem
Identification Programme (Child PIP) and Perinatal Problem
Identification Programme (PPIP).
Strengthen Paediatric outreach through the District Clinical
Specialist Teams.
Compliance with process of the neonatal dashboard.
Increase cervical cancer
screening coverage
Scale up cervical cancer screening in all facilities.
Training and monitoring to improve smear quality.
Reduce miscarriage related to
death
Increase the number of sites offering Choice on Termination of
Pregnancy services.
Expanded Programme on
Immunisation
Improve the surveillance system.
Improve immunisation coverage.
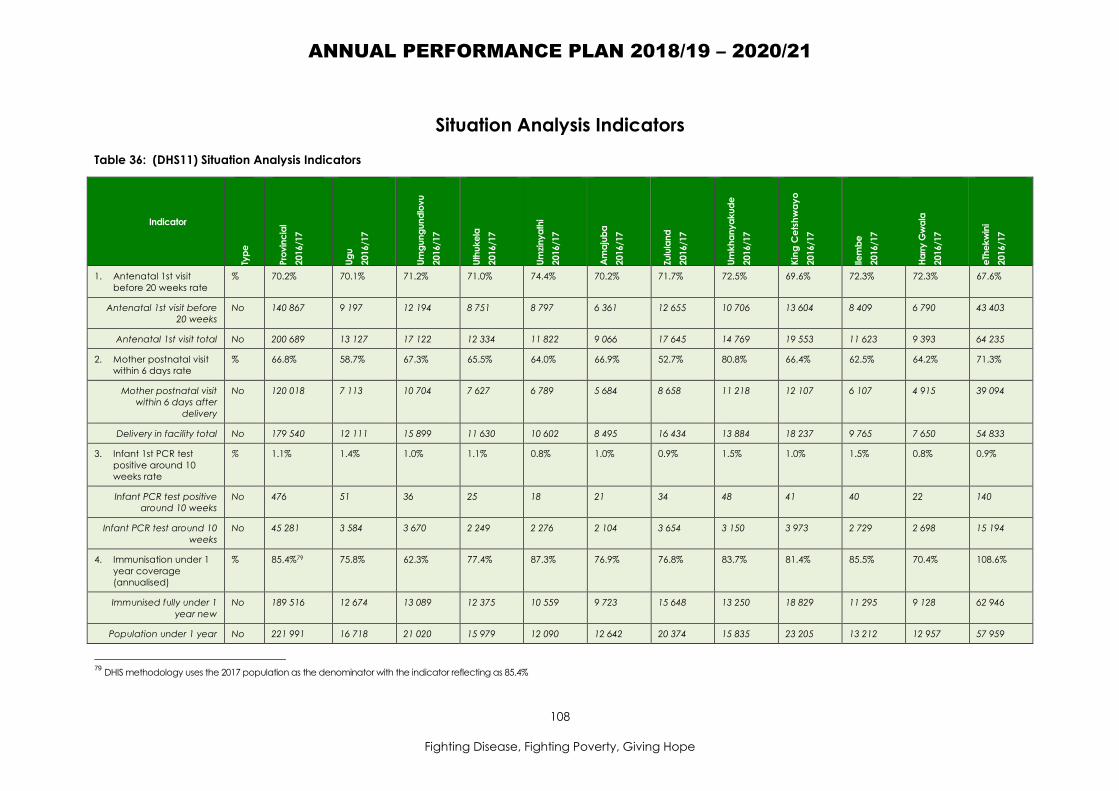
ANNUAL PERFORMANCE PLAN 2018/19 – 2020/21
108
Fighting Disease, Fighting Poverty, Giving Hope
Situation Analysis Indicators
Table 36: (DHS11) Situation Analysis Indicators
Indicator
Typ
e
Pro
vin
cia
l
2016/1
7
Ug
u
2016/1
7
Um
gu
ng
un
dlo
vu
2016/1
7
Uth
uke
la
2016/1
7
Um
zin
ya
thi
2016/1
7
Am
aju
ba
2016/1
7
Zulu
lan
d
2016/1
7
Um
kh
an
ya
ku
de
2016/1
7
Kin
g C
ets
hw
ay
o
2016/1
7
Ilem
be
2016/1
7
Ha
rry G
wa
la
2016/1
7
eTh
ekw
ini
2016/1
7
1. Antenatal 1st visit
before 20 weeks rate
% 70.2% 70.1% 71.2% 71.0% 74.4% 70.2% 71.7% 72.5% 69.6% 72.3% 72.3% 67.6%
Antenatal 1st visit before
20 weeks
No 140 867 9 197 12 194 8 751 8 797 6 361 12 655 10 706 13 604 8 409 6 790 43 403
Antenatal 1st visit total No 200 689 13 127 17 122 12 334 11 822 9 066 17 645 14 769 19 553 11 623 9 393 64 235
2. Mother postnatal visit
within 6 days rate
% 66.8% 58.7% 67.3% 65.5% 64.0% 66.9% 52.7% 80.8% 66.4% 62.5% 64.2% 71.3%
Mother postnatal visit
within 6 days after
delivery
No 120 018 7 113 10 704 7 627 6 789 5 684 8 658 11 218 12 107 6 107 4 915 39 094
Delivery in facility total No 179 540 12 111 15 899 11 630 10 602 8 495 16 434 13 884 18 237 9 765 7 650 54 833
3. Infant 1st PCR test
positive around 10
weeks rate
% 1.1% 1.4% 1.0% 1.1% 0.8% 1.0% 0.9% 1.5% 1.0% 1.5% 0.8% 0.9%
Infant PCR test positive
around 10 weeks
No 476 51 36 25 18 21 34 48 41 40 22 140
Infant PCR test around 10
weeks
No 45 281 3 584 3 670 2 249 2 276 2 104 3 654 3 150 3 973 2 729 2 698 15 194
4. Immunisation under 1
year coverage
(annualised)
% 85.4%79 75.8% 62.3% 77.4% 87.3% 76.9% 76.8% 83.7% 81.4% 85.5% 70.4% 108.6%
Immunised fully under 1
year new
No 189 516 12 674 13 089 12 375 10 559 9 723 15 648 13 250 18 829 11 295 9 128 62 946
Population under 1 year No 221 991 16 718 21 020 15 979 12 090 12 642 20 374 15 835 23 205 13 212 12 957 57 959
79
DHIS methodology uses the 2017 population as the denominator with the indicator reflecting as 85.4%

ANNUAL PERFORMANCE PLAN 2018/19 – 2020/21
109
Fighting Disease, Fighting Poverty, Giving Hope
Indicator
Typ
e
Pro
vin
cia
l
2016/1
7
Ug
u
2016/1
7
Um
gu
ng
un
dlo
vu
2016/1
7
Uth
uke
la
2016/1
7
Um
zin
ya
thi
2016/1
7
Am
aju
ba
2016/1
7
Zulu
lan
d
2016/1
7
Um
kh
an
ya
ku
de
2016/1
7
Kin
g C
ets
hw
ay
o
2016/1
7
Ilem
be
2016/1
7
Ha
rry G
wa
la
2016/1
7
eTh
ekw
ini
2016/1
7
5. Measles 2nd dose
coverage (annualised)
% 99.5%80 97.7% 81.3% 94.5% 107.5% 92.5% 94.1% 101.8% 96.9% 111% 105.7% 106.4%
Measles 2nd dose No 225 110 17 093 17 318 15 314 13 586 11 304 19 182 16 738 22 875 15 077 13 572 63 051
Population 1 year No 226 330 17 499 21 311 16 202 12 633 12 219 20 390 16 438 23 597 13 581 12 788 59 672
6. Diarrhoea case fatality
rate
% 2.0% 1.8% 1.6% 2.4% 1.6% 0.6% 3.2% 2.3% 1.3% 2.9% 2.5% 1.8%
Diarrhoea death under 5
years
No 192 12 13 15 11 3 35 21 15 12 14 41
Diarrhoea separation
under 5 years
No 9 765 669 825 625 690 541 1 110 902 1 162 413 571 2 257
7. Pneumonia case
fatality rate
% 1.8% 1.5% 1.6% 1.3% 1.6% 1.0% 3.2% 1.9% 1.3% 1.8% 2.1% 2.0%
Pneumonia death under 5
years
No 200 18 19 9 12 8 26 14 11 11 13 59
Pneumonia separation
under 5 years
No 11 081 1 214 1 161 690 730 811 805 723 826 618 617 2 886
8. Severe acute
malnutrition case
fatality rate
% 7.4% 7.2% 4.2% 14.2% 4.5% 6.1% 15.7% 5.6% 7.2% 3.4% 7.5% 6.2%
Severe acute malnutrition
death in facility under
5 years
No 230 19 9 30 11 7 47 13 25 9 15 45
Severe acute malnutrition
separation under 5
years
No 3 122 265 213 211 243 115 299 232 348 264 201 731
9. School Grade 1
learners screening
No 70 707 7 946 3 667 5 192 5 041 7 023 9 001 5 552 5 230 3 160 6 095 12 800
80 DHIS methodology uses the 2017 population as the denominator with the indicator reflecting as 99.8%

ANNUAL PERFORMANCE PLAN 2018/19 – 2020/21
110
Fighting Disease, Fighting Poverty, Giving Hope
Indicator
Typ
e
Pro
vin
cia
l
2016/1
7
Ug
u
2016/1
7
Um
gu
ng
un
dlo
vu
2016/1
7
Uth
uke
la
2016/1
7
Um
zin
ya
thi
2016/1
7
Am
aju
ba
2016/1
7
Zulu
lan
d
2016/1
7
Um
kh
an
ya
ku
de
2016/1
7
Kin
g C
ets
hw
ay
o
2016/1
7
Ilem
be
2016/1
7
Ha
rry G
wa
la
2016/1
7
eTh
ekw
ini
2016/1
7
10. School Grade 8
learners screened
No 36 527 5 538 1 596 3 433 1 963 1 663 4 090 3 546 3 346 2 208 2 949 6 195
11. Delivery in 10 to 19
years in facility rate
%
Not
reported
- - - - - - - - - - -
Delivery 10 to 19 years in
facility
No - - - - - - - - - - - -
Delivery in facility - total No - - - - - - - - - - - -
12. Couple year
protection rate (int)
% 53.9%81 49.8% 58.8% 54.9% 101.7% 52.8% 51.1% 48.4% 42.8% 56% 61.6% 49%
Couple year protection No 1 599 550 101 876 184 487 107 721 152 958 77 482 121 970 86 319 113 524 106 231 82 262 464 719
Population 15-49 years
females
No 2 966 033 204 485 313 924 196 169 150 456 146 806 238 739 178 305 265 041 189 855 133 546 948 707
13. Cervical cancer
screening coverage
30 years and older 82
% 86%83 91.8% 71.2% 93% 169.5% 89.6% 82.9% 89.4% 86.1% 85.2% 110.1% 73.3%
Cervical cancer screening
in woman 30 years
and older
No 205 706 14 493 18 544 13 901 18 568 9 830 13 354 11 152 17 279 14 297 10 133 64 155
Population 30 years and
older female
No 239 122 15 796 26 028 14 942 10 957 10 975 16 109 12 471 20 060 15 016 9 206 87 555
14. Antenatal client start
on ART rate
% 97.2% 89.2% 94.4% 101.6% 99.7% 94.6% 101.2% 99.6% 98.6% 98.2% 93.0% 97.4%
Antenatal client start on
ART
No 38 215 2 295 3 785 2 158 1 639 1 685 3 414 2 763 3 496 2 346 1 513 13 121
81 DHIS methodology utilizes the 2017 population with the indicator reflecting a value of 53.6%. For individual districts variations please consult DHIS 82 Indicator changed from final customised indicator “Cervical cancer screening coverage 20 years and older” as per communicate from the Director General health dated 09 February 2017 83 DHIS methodology utilizes the 2017 population with the indicator reflecting a value of 85.6%. For individual district variations please consult DHIS

ANNUAL PERFORMANCE PLAN 2018/19 – 2020/21
111
Fighting Disease, Fighting Poverty, Giving Hope
Indicator
Typ
e
Pro
vin
cia
l
2016/1
7
Ug
u
2016/1
7
Um
gu
ng
un
dlo
vu
2016/1
7
Uth
uke
la
2016/1
7
Um
zin
ya
thi
2016/1
7
Am
aju
ba
2016/1
7
Zulu
lan
d
2016/1
7
Um
kh
an
ya
ku
de
2016/1
7
Kin
g C
ets
hw
ay
o
2016/1
7
Ilem
be
2016/1
7
Ha
rry G
wa
la
2016/1
7
eTh
ekw
ini
2016/1
7
Antenatal client known HIV
positive but not on ART
at 1st visit
No 39 325 2 574 4 010 2 124 1 644 1 793 3 372 2 774 3 544 2 390 1 627 13 473
15. Human papilloma virus
(HPV) 1st dose
No 65 341 3 523 5 174 4 140 5 928 3 833 7 497 5 769 5 848 3 316 3 788 16 525
16. Human papilloma virus
(HPV) 2nd dose
No 64 973 4 527 5 042 4 657 5 178 3 913 6 852 7 030 6 781 3 336 3 191 14 466
17. Maternal mortality in
facility ratio
No
per
100k
live
births
106.7/
100,000
132.6/
100,000
178.2/
100,000
112.1/
100,000
28.3/
100,000
130.3/
100,000
98.0/
100,000
43.4/
100,000
132.9/
100,000
62.0/
100,000
79.0/
100,000
112.7/
100,000
Maternal death in facility No 190 16 28 13 3 11 16 6 24 6 6 61
Live birth in facility plus
Born alive before
arrival at facility
No 178 066 12 062 15 717 11 592 10 604 8 440 16 327 13 834 18 064 9 683 7 593 54 150
18. Neonatal death in
facility rate
No
per
1000
live
births
12.4/ 1000 12.2/ 1000 11.5/ 1000 12.8/ 1000 11.1/ 1000 13.8/ 1000 11.1/ 1000 8.2/ 1000 13.5/ 1000 14.5/ 1000 14.6/ 1000 13.1/ 1000
Neonatal 0-28 days death
in facility
No 2 211 147 180 148 118 117 182 113 243 140 111 712
Live birth in facility No 178 066 12 062 15 717 11 592 10 604 8 440 16 327 13 834 18 064 9 683 7 593 54 150
19. Vitamin A 12-59
months coverage
% 61.9%84 59.0% 64.6% 111.5% 49.9% 64.4% 68.0% 43.7% 39.0% 58.9% 73.0% 61.3%
Vitamin A dose 12 - 59
months
No 1 141 124 85 826 111 369 145 747 51 854 60 898 110 752 58 958 74 833 64 906 73 376 302 605
Population 12-59 months
(multiplied by 2)
No 1 841 762 145 408 172 930 130 686 103 908 94 606 162 812 135 050 191 888 110 186 100 484 493 804
84 This indicator has been calculated manually using the 2016/17 APP population - DHIS (62%) used 2017 updated population for calculation
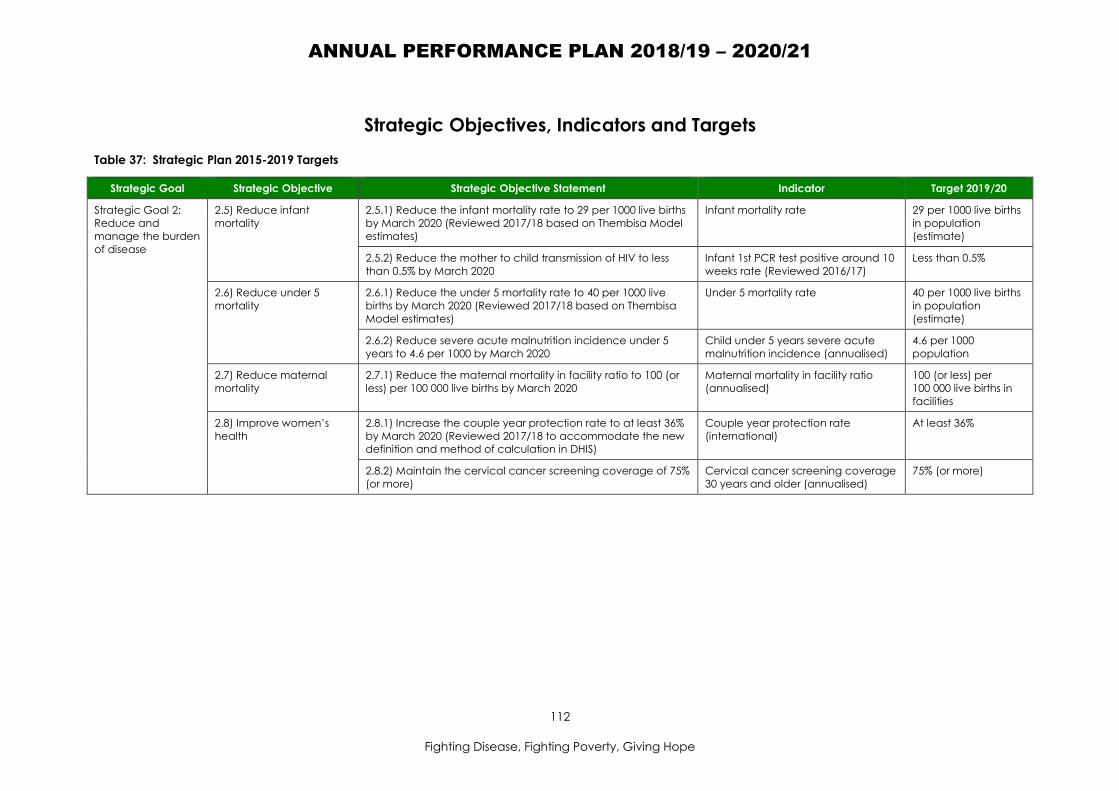
ANNUAL PERFORMANCE PLAN 2018/19 – 2020/21
112
Fighting Disease, Fighting Poverty, Giving Hope
Strategic Objectives, Indicators and Targets
Table 37: Strategic Plan 2015-2019 Targets
Strategic Goal Strategic Objective Strategic Objective Statement Indicator Target 2019/20
Strategic Goal 2:
Reduce and
manage the burden
of disease
2.5) Reduce infant
mortality
2.5.1) Reduce the infant mortality rate to 29 per 1000 live births
by March 2020 (Reviewed 2017/18 based on Thembisa Model
estimates)
Infant mortality rate 29 per 1000 live births
in population
(estimate)
2.5.2) Reduce the mother to child transmission of HIV to less
than 0.5% by March 2020
Infant 1st PCR test positive around 10
weeks rate (Reviewed 2016/17)
Less than 0.5%
2.6) Reduce under 5
mortality
2.6.1) Reduce the under 5 mortality rate to 40 per 1000 live
births by March 2020 (Reviewed 2017/18 based on Thembisa
Model estimates)
Under 5 mortality rate 40 per 1000 live births
in population
(estimate)
2.6.2) Reduce severe acute malnutrition incidence under 5
years to 4.6 per 1000 by March 2020
Child under 5 years severe acute
malnutrition incidence (annualised)
4.6 per 1000
population
2.7) Reduce maternal
mortality
2.7.1) Reduce the maternal mortality in facility ratio to 100 (or
less) per 100 000 live births by March 2020
Maternal mortality in facility ratio
(annualised)
100 (or less) per
100 000 live births in
facilities
2.8) Improve women’s
health
2.8.1) Increase the couple year protection rate to at least 36%
by March 2020 (Reviewed 2017/18 to accommodate the new
definition and method of calculation in DHIS)
Couple year protection rate
(international)
At least 36%
2.8.2) Maintain the cervical cancer screening coverage of 75%
(or more)
Cervical cancer screening coverage
30 years and older (annualised)
75% (or more)

ANNUAL PERFORMANCE PLAN 2018/19 – 2020/21
113
Fighting Disease, Fighting Poverty, Giving Hope
Table 38: (DHS12) Strategic Objectives, Indicators and Targets
Strategic
Objective
Statement
Performance
Indicators Data Source
Frequency
Type
Audited/ Actual Performance Estimated
Performance
2017/18
Medium Term Targets Strategic
Plan
Target
2019/20 2014/15 2015/16 2016/17 2018/19 2019/20 2020/21
Strategic Objective 2.7: Reduce maternal mortality
2.7.3) Increase
the antenatal
1st visit before
20 weeks rate
to 70% (or
more) by
March 2020
1. Antenatal 1st visit
before 20 weeks
rate
PHC
Register;
DHIS
Quarterly
%
57.3% 64.8% 70.2% 70.2% 71% 72% 73% -
Antenatal 1st visit
before 20 weeks
PHC
Register
No 133 761 135 367 140 867 140 915 153 667 150 410 151 524
Antenatal 1st visit total PHC
Register
No 233 593 208 903 200 689 200 734 216 431 208 903 207 567
2.7.4) Increase
the postnatal
visit within 6
days rate to
70% (or more)
by March 2020
2. Mother postnatal
visit within 6 days
rate
PHC &
Delivery
Register;
DHIS
Quarterly
%
66.4% 69.8% 66.8% 74.4% 75%
77%
79%
-
Mother postnatal visit
within 6 days after
delivery
PHC
Register
No 135 375 129 873 120 018 135 626 136 941
140 285
143 771
Delivery in facility total Delivery
Register
No 203 742 186 063 179 540 182 356 182 588 182 188 181 988
2.7.6) Reduce
deliveries 10-19
years to 21% or
less by March
2020
3. Delivery in 10 to 19
years in facility
rate
DHIS Quarterly
%
Not reported Not reported Not reported 23.3% 22%
21%
20%
-
Delivery 10 to 19 years
in facility
Tick Register No - - - 42 448 40 169
38 260
36 398
Delivery in facility -
total
DHIS; Stats
SA
No - - - 182 356 182 588 182 188 181 988
2.7.5) Initiate
97% eligible
antenatal
clients on ART
by March 2020
4. Antenatal client
start on ART rate
ART; PHC
Registers;
DHIS
Annual
%
95.2% 97.6% 97.2% 97% 97% 97% 97% -
Antenatal client start
on ART
ART & PHC
Registers
No 55 761 43 733 38 215 31 804 39 262 38 828 38 432

ANNUAL PERFORMANCE PLAN 2018/19 – 2020/21
114
Fighting Disease, Fighting Poverty, Giving Hope
Strategic
Objective
Statement
Performance
Indicators Data Source
Frequency
Type
Audited/ Actual Performance Estimated
Performance
2017/18
Medium Term Targets Strategic
Plan
Target
2019/20 2014/15 2015/16 2016/17 2018/19 2019/20 2020/21
Antenatal client
known HIV positive
but not on ART at 1st
visit
ART & PHC
Registers
No 58 598 44 786 39 325 32 788 40 476 40 029 39 621
2.7.1) Reduce
the maternal
mortality in
facility ratio to
100 (or less) per
100 000 live
births by March
2020
5. Maternal mortality
in facility ratio
(annualised)
Midnight
Census;
Maternity &
Death
Register;
DHIS
Annual
No per
100,000 live
births in facility
124.9/
100 000
121.1/
100 000
106.7/
100 000
109.3/
100 000
100/
100 000
95/
100 000
90/
100 000
100 (or
less) per
100 000
live births
in facilities
Maternal death in
facility
Midnight
Census;
Death
Register
No 252 223
190 206 194 184 174
Live birth in facility plus
Born alive before
arrival at facility
Maternity
Register
No 201 797 184 184 178 066 188 414 194 065 193 871 193 692
Strategic Objective 2.8: Improve women’s health
2.8.1) Couple
year protection
rate of at least
36% by March
202085
6. Couple year
protection rate
(international)
DHIS Quarterly
%
57.8% 52% 53.9%86 34.6%87 35% 36% 37% 36%
Couple year
protection
Tick Register
PHC; Hospital
Register
No 1 677 645 1 555 481 1 599 550 1 045 742 1 073 220 1 120 898 1 170 325
Population 15-49 years
females
DHIS; Stats
SA
No 2 896 655 2 929 747 2 966 034 3 022 377 3 066 343 3 113 342 3 163 041
2.8.2) Maintain
the cervical
cancer
screening
7. Cervical cancer
screening
coverage 30 years
and older
DHIS Quarterly
%
70.3% 72.7% 86%88 78.8% 82%
84%
85% 75% (or
more)
85 This makes provision for the change in definition and calculation method 86 Indicator manually calculated. DHIS uses 2017 with the indictor reflecting a value of 53.6% 87 Used the DHIS source data for the projected performance as well as MTEF targets (the system is not currently annualising the indicator correctly) – the indicator definition and calculation method changed, which reduced
actual performance in 2017/18. Using DHIS (not calculating the indicator manually) will ensure consistency in reporting 88 DHIS calculationIndicator manually calculated. DHIS reflects a value of 85.6% as it uses the 2017 population as a denominator

ANNUAL PERFORMANCE PLAN 2018/19 – 2020/21
115
Fighting Disease, Fighting Poverty, Giving Hope
Strategic
Objective
Statement
Performance
Indicators Data Source
Frequency
Type
Audited/ Actual Performance Estimated
Performance
2017/18
Medium Term Targets Strategic
Plan
Target
2019/20 2014/15 2015/16 2016/17 2018/19 2019/20 2020/21
coverage of
75% (or more) Cervical cancer
screening in woman
30 years and older
Tick Register
PHC; Hospital
Register
No 161 707 171 150 205 706 182 624 194 685
204 315
211 695
Population 30 years
and older female/10
DHIS; Stats
SA
No 228 913 234 228 239 122 231 645 237 421
243 232 249 053
2.8.3) Maintain
programme to
target 9 year
old girls with
HPV vaccine 1st
and 2nd dose as
part of cervical
cancer
prevention
programme
8. Human papilloma
virus (HPV) 1st dose
HPV
Register;
DHIS
Annual
No
150 519 41 943 65 341 74 254 84 150 85 150 86 150
9. HPV 2nd dose HPV
Register;
DHIS
Annual
No
Not reported Not reported 64 973 73 541 84 150 85 150 86 150 -
Strategic Objective 2.5: Reduce infant mortality
2.5.2) Reduce
the mother to
child
transmission of
HIV to less than
0.5% by March
2020
10. Infant 1st PCR test
positive around 10
weeks rate
PHC
Register;
TIER.Net;
DHIS
Quarterly
%
1.3% 1.2% 1.1% 0.8% 0.8% 0.8% 0.8% Less than
0.5%
Infant PCR test
positive around 10
weeks
PHC
Register
No 1 003 521 476 414 355 89 355 355
Infant PCR test around
10 weeks
PHC
Register
No 76 653 44 400 45 281 50 502 44 400
44 400 44 000
2.5.3) Reduce
the neonatal
death in facility
rate to at least
11.3/1000 live
births in facility
11. Neonatal death in
facility rate
Midnight
Census;
Maternity &
Death
Register;
DHIS
Annual
No per 1000
live births in
facility
13.2 / 1000 * 13.4 / 1000* 12.4 / 1000 * 11.8 / 1000 11.5 / 1000 11.3 / 1000 11.3 /1000 -
89 Flat lined targets for the MTEF – will be reconsidered annually

ANNUAL PERFORMANCE PLAN 2018/19 – 2020/21
116
Fighting Disease, Fighting Poverty, Giving Hope
Strategic
Objective
Statement
Performance
Indicators Data Source
Frequency
Type
Audited/ Actual Performance Estimated
Performance
2017/18
Medium Term Targets Strategic
Plan
Target
2019/20 2014/15 2015/16 2016/17 2018/19 2019/20 2020/21
by March 2020 Neonatal 0-28 days
death in facility
Midnight
Census;
Death
Register
No 2 654 2 478 2 211 2 230 2 118 2 033 2 031
Live birth in facility Maternity
Register
No 201 797 184 184 178 066 188 414 184 184 179 899 179 698
Strategic Objective 2.6: Reduce under 5 mortality
2.6.3) Increase
immunisation
coverage to at
least 82% or
more by March
2020
12. Immunisation
under 1 year
coverage
(annualised)
PHC
Register;
DHIS
Quarterly
%
89.9% 85.0% 85.4% 75.9%90 80%
82%
85%
-
Immunised fully under
1 year new
PHC
Register
No 207 670 191 946 189 516 193 844 205 968
213 386
222 805
Population under 1
year
DHIS; Stats
SA
No 232 450 227 216 221 991 255 475 257 461
260 227 262 123
2.6.4) Maintain
the measles 2nd
dose coverage
of 80% (or
more) from
March 2018
onwards
13. Measles 2nd dose
coverage
(annualised)
PHC
Register;
DHIS
Quarterly
%
86.3% 82.6% 99.5% 79% 80% 91 81%
82%
-
Measles 2nd dose PHC
Register
No 200 353 189 035 225 110 208 435 210 394
212 742
215 048
Population 1 year DHIS; Stats
SA
No 232 450 227 216 226 330 263 843 262 993
262 645 262 254
2.6.6) Reduce
the diarrhoea
case fatality
under 5 years
rate to 2% (or
less) by March
14. Diarrhoea case
fatality under 5
years rate
PHC &
Death
Register;
DHIS
Quarterly
%
3.0% 2.2% 2% 2.1%92 2%
1.8 %
1.6%
-
Diarrhoea death
under 5 years
Death
Register
No 347 221 192 112 180 170 160
90 The under 1 population (Stats SA projections) increased by 15.1% between 2016/17 and 2017/18 which have a significant impact on the indicator performance – target based on increase in numerator 91 Population 1 year (Stats SA projections) increased by 16.6% between 2016/17 and 2017/18, which affects performance on indicator. Targets are based on the increase in the numerator 92 Although the projected percentage is within range, under-reporting is expected (lower deaths & separations) due to a dire shortage of Paediatricians in especially Northern KZN. Data challenges are being addressed as a
matter of urgency and will be corrected in time for the Annual Report.

ANNUAL PERFORMANCE PLAN 2018/19 – 2020/21
117
Fighting Disease, Fighting Poverty, Giving Hope
Strategic
Objective
Statement
Performance
Indicators Data Source
Frequency
Type
Audited/ Actual Performance Estimated
Performance
2017/18
Medium Term Targets Strategic
Plan
Target
2019/20 2014/15 2015/16 2016/17 2018/19 2019/20 2020/21
2020 Diarrhoea separation
under 5 years
Admission &
Discharge
Register
No 11 578 10 259 9 765 5 26293 9 000 9 444 10 000
2.6.7) Reduce
the pneumonia
case fatality
under 5 years
rate to 2.4% (or
less) by March
2020
15. Pneumonia case
fatality under 5
years rate
DHIS Quarterly
%
2.7% 2.7% 1.8% 2.9% 2.6 %
2.4% 2.2%
-
Pneumonia death
under 5 years
Tick
Register/
Death
Register
No 300 308 200 28894 220 200 180
Pneumonia
separation under
5 years
Admission
Records
No 11 011 11 215 11 081 9 91695 8 462 8 333 8 182
2.6.8) Reduce
the severe
acute
malnutrition
case fatality
under 5 years
rate to 6% (or
less) by March
2020
16. Severe acute
malnutrition case
fatality under 5
years rate
DHIS Quarterly
%
10.4% 7.7% 7.4% 3.6% 96 6.5%
6%
5.5%
-
Severe acute
malnutrition
death in facility
under 5 years
Tick
Register/
Death
Register
No 405 281 230 196 208 191 174
Severe acute
malnutrition
separation under
5 years
Admission &
Discharge
Records
No 3 880 3 664 3 122 5 40197 3 208 3 170 3 156
2.6.9) Increase
the Vitamin A
dose 12-59
months
17. Vitamin A dose 12-
59 months
coverage
(annualised)
PHC
Register;
DHIS; Stats
SA
Quarterly
%
54.5% 63.7% 61.9%98 55.8% 60% 63% 65% -
93 Denominator changed from “Diarrhoea admitted under-5 years” to “Diarrhoea separation under-5 years” which affected trends in the denominator. Targets for the MTEF based on trends and will be monitored 94 See under-reporting due to shortage of Paediatricians (same as diarrhoea) 95 Denominator changed from “Pneumonia admitted under-5 years” to “Pneumonia separation under-5 years” which affected trends. Targets for MTEF based on current trends and will be monitored 96 The significant decrease is due to change in denominator as well as shortage of staff and capturing in DHIS – this is being addressed at facility level. Targets therefore based on trends and not the once-off decrease noted
in 2017/18. KZN is lower than the National average of 30%, at 26% of all children who die in hospital have SAM 97 This denominator has increased substantially with the change in definition from “SAM admitted under 5 years” to “SAM separations under 5 years”. Trends are being monitored to ensure data veracity – targets will be
reviewed annually 98 This indicator was calculated manually - DHIS (62% using the 2017 population as a denominator)
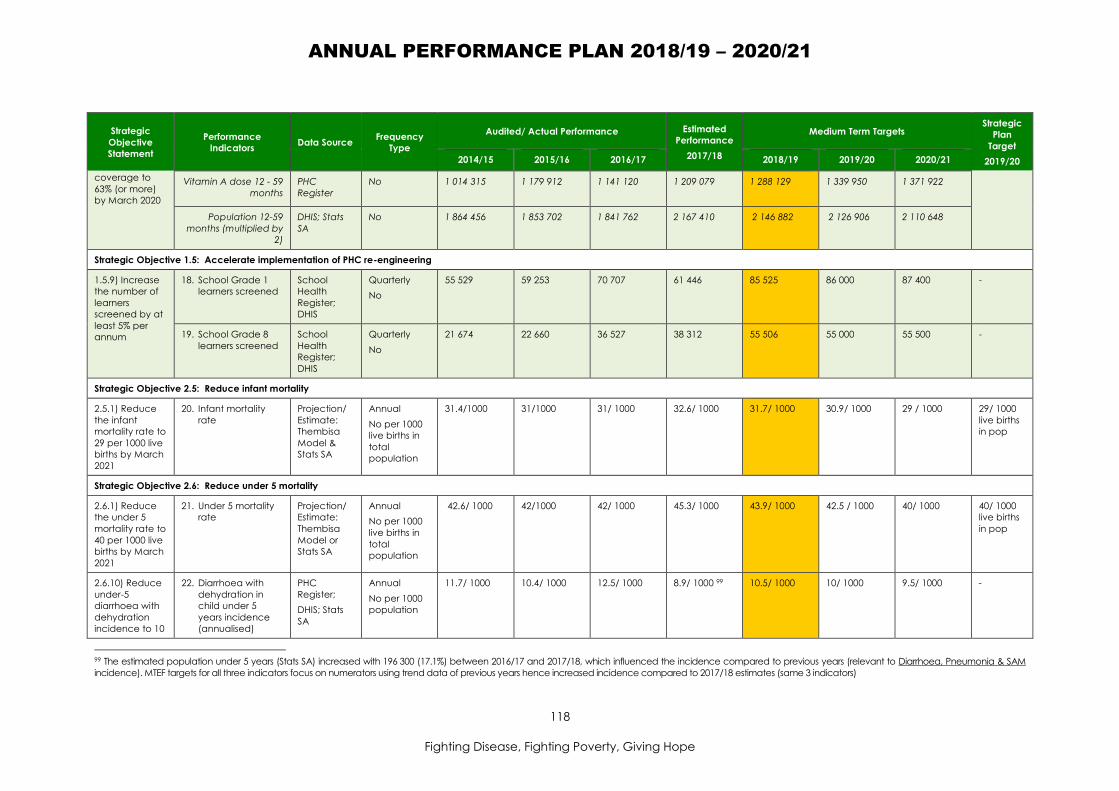
ANNUAL PERFORMANCE PLAN 2018/19 – 2020/21
118
Fighting Disease, Fighting Poverty, Giving Hope
Strategic
Objective
Statement
Performance
Indicators Data Source
Frequency
Type
Audited/ Actual Performance Estimated
Performance
2017/18
Medium Term Targets Strategic
Plan
Target
2019/20 2014/15 2015/16 2016/17 2018/19 2019/20 2020/21
coverage to
63% (or more)
by March 2020
Vitamin A dose 12 - 59
months
PHC
Register
No 1 014 315 1 179 912 1 141 120 1 209 079 1 288 129
1 339 950 1 371 922
Population 12-59
months (multiplied by
2)
DHIS; Stats
SA
No 1 864 456 1 853 702 1 841 762 2 167 410 2 146 882 2 126 906 2 110 648
Strategic Objective 1.5: Accelerate implementation of PHC re-engineering
1.5.9) Increase
the number of
learners
screened by at
least 5% per
annum
18. School Grade 1
learners screened
School
Health
Register;
DHIS
Quarterly
No
55 529 59 253 70 707 61 446 85 525 86 000 87 400 -
19. School Grade 8
learners screened
School
Health
Register;
DHIS
Quarterly
No
21 674 22 660 36 527 38 312 55 506
55 000 55 500 -
Strategic Objective 2.5: Reduce infant mortality
2.5.1) Reduce
the infant
mortality rate to
29 per 1000 live
births by March
2021
20. Infant mortality
rate
Projection/
Estimate:
Thembisa
Model &
Stats SA
Annual
No per 1000
live births in
total
population
31.4/1000 31/1000 31/ 1000 32.6/ 1000 31.7/ 1000 30.9/ 1000 29 / 1000 29/ 1000
live births
in pop
Strategic Objective 2.6: Reduce under 5 mortality
2.6.1) Reduce
the under 5
mortality rate to
40 per 1000 live
births by March
2021
21. Under 5 mortality
rate
Projection/
Estimate:
Thembisa
Model or
Stats SA
Annual
No per 1000
live births in
total
population
42.6/ 1000 42/1000 42/ 1000 45.3/ 1000 43.9/ 1000 42.5 / 1000 40/ 1000 40/ 1000
live births
in pop
2.6.10) Reduce
under-5
diarrhoea with
dehydration
incidence to 10
22. Diarrhoea with
dehydration in
child under 5
years incidence
(annualised)
PHC
Register;
DHIS; Stats
SA
Annual
No per 1000
population
11.7/ 1000 10.4/ 1000 12.5/ 1000 8.9/ 1000 99 10.5/ 1000 10/ 1000 9.5/ 1000 -
99 The estimated population under 5 years (Stats SA) increased with 196 300 (17.1%) between 2016/17 and 2017/18, which influenced the incidence compared to previous years (relevant to Diarrhoea, Pneumonia & SAM
incidence). MTEF targets for all three indicators focus on numerators using trend data of previous years hence increased incidence compared to 2017/18 estimates (same 3 indicators)

ANNUAL PERFORMANCE PLAN 2018/19 – 2020/21
119
Fighting Disease, Fighting Poverty, Giving Hope
Strategic
Objective
Statement
Performance
Indicators Data Source
Frequency
Type
Audited/ Actual Performance Estimated
Performance
2017/18
Medium Term Targets Strategic
Plan
Target
2019/20 2014/15 2015/16 2016/17 2018/19 2019/20 2020/21
(or less) per
1000
population by
March 2020
Diarrhoea with
dehydration new in
child under 5 years
PHC
Register
No 13 614 11 993 14 294 11 936100 13 975
13 237
12 516
Population under 5
years
DHIS; Stats
SA
No 1 164 682 1 154 059 1 142 878 1 339 178 1 330 900 1 323 674 1 317 449
2.6.11) Reduce
the under-5
pneumonia
incidence to 52
(or less) per
1000
population by
March 2020
23. Pneumonia in
child under 5
years incidence
(annualised)
PHC
Register;
DHIS; Stats
SA
Annual
No per 1000
population
85.7/ 1000 74.3/ 1000 57.9/ 1000 45.1/ 1000 55/ 1000 52/ 1000 50/ 1000 -
Pneumonia new in
child under 5 years
PHC
Register
No 99 805 85 715 66 150 60 334 73 199 68 831 65 872
Population under 5
years
DHIS; Stats
SA
No 1 164 682 1 154 059 1 142 878 1 339 178 1 330 900 1 323 674 1 317 449
2.6.2) Reduce
severe acute
malnutrition
incidence
under 5 years to
4.6 per 1000
population by
March 2020
24. Child under 5
years severe
acute malnutrition
incidence
(annualised)
DHIS Annual
No per 1000
population
6.3/ 1 000 5.3/ 1 000 4.6/ 1000 3.6/ 1000 4.3/ 1000 4.2/ 1000 4.1/ 1000 4.6/1000
pop
Child under 5 years
with severe acute
malnutrition new
DHIS; PHC
Tick Register
No 7 331 6 136 5 192 4 821 5 723
5 559
5 401
Population under 5
years
DHIS; Stats
SA
No 1 164 682 1 154 059 1 142 878 1 339 178 1 330 900 1 323 674 1 317 449
2.6.12) Reduce
the death in
facility under 1
year rate to
5.9% or less by
March 2020
25. Death in facility
under 1 year rate
(annualised)
DHIS Annual
%
7.3% 7.4% 6.4% 6.6% 6.1%
5.9%
5.7%
-
Death in facility under
1 year total
Death
Register
No 3 802 3 381 2 838 2 808 2 699
2 611
2 522
100 It is suspected that the data for 2017/18 is under-estimated (for diarrhoea, pneumonia & SAM) due to incomplete data/ under-reporting for the 1st 3 quarters of the year - this is being investigated by the Programme
Managers for correction. The MTEF targets are based on previous years trend data (numerators) and will be monitored closely

ANNUAL PERFORMANCE PLAN 2018/19 – 2020/21
120
Fighting Disease, Fighting Poverty, Giving Hope
Strategic
Objective
Statement
Performance
Indicators Data Source
Frequency
Type
Audited/ Actual Performance Estimated
Performance
2017/18
Medium Term Targets Strategic
Plan
Target
2019/20 2014/15 2015/16 2016/17 2018/19 2019/20 2020/21
Inpatient separations
under 1 year
Midnight
Census/
Admissions,
Discharge &
Death
Registers
No 52 193 45 780 44 252 42 862 44 252
44 252
44 252
2.6.13) Reduce
the death in
facility under 5
years rate to
4.2% (or less) by
March 2020
26. Death in facility
under 5 years
rate
DHIS Annual
%
5.8% 5.1% 4.5% 4.6% 4.4% 4.2% 4% -
Death in facility under
5 years total
Death
Register
No 4 849 4 009 3 326 3 246 3 344 3 191 3 039
Inpatient separations
under 5 years
Midnight
Census/
Admissions,
Discharge &
Death
Registers
No 70 967 77 563 74 612 70 652 76 009 75 987 75 987

ANNUAL PERFORMANCE PLAN 2018/19 – 2020/21
121
Fighting Disease, Fighting Poverty, Giving Hope
2018/19 Targets
Table 39: (DHS13) Quarterly and Annual Targets
Performance Indicators Frequency Type Targets
2018/19
Quarterly Targets
Q1 Q2 Q3 Q4 Annual
1. Antenatal 1st visit
before 20 weeks rate
(annualised)
Quarterly % 71% 70.2% 70.3% 70.6% 71% 71%
2. Mother postnatal visit
within 6 days rate
Quarterly % 75%
74.4% 74.4%
74.6%
75%
75%
3. Delivery in 10 to 19
years in facility rate
Quarterly % 22%
22%
22%
22%
22%
22%
4. Antenatal client start
on ART rate
Annual % 97% 97% 97% 97% 97% 97%
5. Maternal mortality
in facility ratio
(annualised)
Annual No per
100,000
live
births
100/
100,000
- - - - 100/
100,000
6. Couple year
protection rate
(international)
Quarterly % 35%
34.7%
34.8% 34.9% 35% 35%
7. Cervical cancer
screening coverage
20 years and over
(annualised)
Quarterly % 82% 80% 80% 81% 82% 82%
8. HPV 1st dose Annual % 84 150 - - - - 84 150
9. HPV 2nd dose Annual % 84 150 - - - - 84 150
10. Infant 1st PCR test
positive around 10
weeks rate
Quarterly % 0.8% 1% 1% 0.9% 0.8% 0.8%
11. Neonatal death in
facility rate
Annual No per
1000
live
births
11.5/ 1000 - - - - 11.5/ 1000
12. Immunisation
coverage under 1
year (annualised)
Quarterly % 80% 76% 77% 78% 80% 80%
13. Measles 2nd dose
coverage
(annualised)
Quarterly % 80% 80% 80% 80% 80% 80%
14. Diarrhoea case
fatality under 5 years
rate
Quarterly % 2% 2.4% 2.3% 2.1% 2% 2%
15. Pneumonia case
fatality under 5 years
rate
Quarterly % 2.6% 3% 2.9% 2.7% 2.6% 2.6%
16. Severe acute
malnutrition case
fatality under 5 years
rate
Quarterly % 6.5% 7% 6.8% 6.7% 6.5% 6.5%
17. Vitamin A dose 12-59
months coverage
(annualised)
Quarterly % 60% 60% 60% 60% 60% 60%
18. School Grade 1
learners screened
Quarterly No 85 525 21 381 21 381 21 381 21 382 85 525
19. School Grade 8
learners screened
Quarterly No 55 506 13 877 13 877 13 877 13 875 55 506

ANNUAL PERFORMANCE PLAN 2018/19 – 2020/21
122
Fighting Disease, Fighting Poverty, Giving Hope
Performance Indicators Frequency Type Targets
2018/19
Quarterly Targets
Q1 Q2 Q3 Q4 Annual
20. Infant mortality rate Annual No per
1000
live
births in
pop
31.7/ 1000 - - - - 31.7/
1 000
21. Under 5 mortality
rate
Annual No per
1000
live
births in
pop
43.9/ 1 000 - - - - 43.9/ 1000
22. Diarrhoea with
dehydration in child
under 5 years
incidence
(annualised)
Annual No per
1000
pop
10.5/ 1000 - - - - 10.5/ 1000
23. Pneumonia in child
under 5 years
incidence
(annualised)
Annual No per
1000
pop
55/ 1000 - - - - 55/ 1000
24. Severe acute
malnutrition in child
under 5 incidence
(annualised)
Annual No per
1000
pop
4.3/ 1000 - - - - 4.3/ 1000
25. Death in facility
under 1 year rate
(annualised)
Annual % 6.1% - - - - 6.1%
26. Death in facility
under 5 years rate
(annualised)
Annual % 4.4% - - - - 4.4%

ANNUAL PERFORMANCE PLAN 2018/19 – 2020/21
123
Fighting Disease, Fighting Poverty, Giving Hope
Sub-Programme: Disease Prevention & Control
2018/19 Priorities
Priorities Key Focus Areas
Scale up implementation and
monitoring of the integrated 90-90-90
strategy for non-communicable
diseases
Screening, detection and treatment compliance for
hypertension and diabetes.
Increase cataract surgery through partnerships – targeting
allocation of resources for Zululand, Uthukela, Ilembe and
Umkhanyakude Districts.
Scale up implementation and monitoring of the Integrated
Chronic Disease Management Model in all districts.
Strengthen the integrated inter-departmental healthy
lifestyles strategy.
Finalise the Provincial Strategy for Palliative Care; establish
systems and processes for implementation in all districts.
Implement the approved Mental
Health Strategy and Rationalisation
Plan and actively monitor progress
Re-engineering primary and community-based mental
health services including screening; treatment and psycho
social rehabilitation; psychological first aid in communities;
and developing psycho social rehabilitation hubs in all
districts.
Scale up primary prevention programmes for substance
abuse including screening for substance abuse disorders;
health education and healthy lifestyle programmes; and
treatment programmes in PHC facilities for effective
management of substance abuse.
Expand the detoxification treatment programmes including
management of medical emergencies and medical
complications in identified sites.
Collaborate with Specialised Services and DHS in finalising
and implementing the Specialised Psychiatric Hospitals
Rationalisation Plan.
Strengthen Rehabilitation Services Review strategy for the recruitment and retention of
rehabilitation personnel (Allied Health) as part of the
Essential Post List Project.
Decrease the backlog for assistive devices in all districts.
Implement a strategy for rehabilitation for blind and partial
sighted services.
Strengthen Oral Health Services Improve access to oral health services including services in
mobiles, clinics, CHCs and the hospital platform.
Increase Oral Hygienist coverage for the School Oral Health
Programme and at facility level as part of the Essential Post
List Project.
Increase oral health education, awareness, early detection
and treatment to positively impact on the extraction to
restoration ratio.
Monitor allocation and utilisation of equipment in identified
sites.
Improve decentralised access to
Orthotic & Prosthetic services
Collaboration with Infrastructure to complete project for
decentralised site in King Cetshwayo.
Monitor outreach from eThekwini & Umgungundlovu.

ANNUAL PERFORMANCE PLAN 2018/19 – 2020/21
124
Fighting Disease, Fighting Poverty, Giving Hope
Situation Analysis Indicators
Table 40: (DHS14) Situation Analysis Indicators
Programme
Performance Indicator
Typ
e
Pro
vin
cia
l
20
16
/17
Ug
u
20
16
/17
Um
gu
ng
un
dlo
vu
20
16
/17
Uth
uk
ela
20
16
/17
Um
zin
ya
thi
20
16
/17
Am
aju
ba
20
16
/17
Zu
lula
nd
20
16
/17
Um
kh
an
ya
ku
de
20
16
/17
Kin
g C
ets
hw
ay
o
20
16
/17
Ile
mb
e
20
16
/17
Ha
rry
Gw
ala
20
16
/17
eTh
ek
win
i
20
161
7
1. Cataract surgery
rate (annualised)
No per
1mil
uninsured
population
888.1/ 1mil 2 011.1/
Imil
1 570.6/
1mil
584.5/ 1mil 1 169.8/
1mil
1 607/ 1mil 0/ 1mil 879.4/ 1mil 1 122.2/
1mil
330.2/ 1mil 1 643.2/
1mil
713.5/ 1mil
Cataract surgery total No 8 556 1 361 1 547 366 550 76 0 514 969 195 721 2 257
Population uninsured
total
No 9 633 452 676 722 984 962 626 142 470 132 472 861 762 085 584 443 863 466 590 501 438 769 3 163 289
2. Malaria case
fatality rate
% 1.2% 0% 0% 0% 0% 0% 11.1% 0.89% 3.2% 0% 0% 0%
Deaths from malaria No 7 0 0 0 0 0 2 2 3 0 0 0
Total number of
Malaria cases reported
No 557 11 17 5 6 3 18 224 91 7 4 171

ANNUAL PERFORMANCE PLAN 2018/19 – 2020/21
125
Fighting Disease, Fighting Poverty, Giving Hope
Strategic Objectives, Indicators and Targets
Table 41: Strategic Plan 2015-2019 Targets
Strategic Goal Strategic Objective Strategic Objective Statement Indicator Target March 2020
Strategic Goal 2:
Reduce and
manage the burden
of disease
2.9) Reduce the morbidity
and mortality of non-
communicable diseases
2.9.1) Hypertension incidence of 24.6 or less per 1000
population by March 2020
Hypertension incidence (annualised) 24.6 or less per 1000
population
2.9.2) Diabetes incidence of 3.3 or less per 1000 population by
March 2020
Diabetes incidence (annualised) 3.3 or less per 1000
population
2.10) Eliminate malaria 2.10.1) Zero new local malaria cases by March 2020 Malaria incidence per 1000
population at risk
Zero new local
malaria cases
2.10.2) Reduce the malaria case fatality rate to less than 0.5%
by March 2020
Malaria case fatality rate Less than 0.5%
Table 42: (DHS15) Strategic Objectives, Indicators and Targets
Strategic
Objective
Statement
Performance Indicators Data Source Frequency
Type
Audited/ Actual Performance Estimated
Performance
2017/18
Medium Term Targets Strategic
Plan
Target
2019/20 2014/15 2015/16 2016/17 2018/19 2019/20 2020/21
Strategic Objective 2.9: Reduce the morbidity and mortality of non-communicable diseases
2.9.6) Increase
the cataract
surgery rate to
at least 950
per 1 mil
uninsured
population by
March 2020
1. Cataract surgery
rate (annualised)
DHIS Quarterly
No per 1mil
uninsured
population
870.9/ 1mil 588.7/1mil 888.1 / 1 mil 956.4/1 mil 944.5/ 1mil 953/ 1mil 960.4/ 1mil -
Total number of
cataract surgeries
completed
Theatre
Register
No 8 037 5 487101 8 556 9 494 9 500 9 700 9 900
Population uninsured DHIS; Stats SA No 9 228 755 9 320 082102 9 633 452 9 926 611 10 058 493 10 178 047 10 307 773
Strategic Objective 2.10: Eliminate malaria
101This includes cataract surgery performed in provincial hospitals only. No private data has been included 102An uninsured population figure of 87.2% was used to determine figures. This will not align with the DHER 2015/16 where the General Household Survey (GHS) was used to determine uninsured population

ANNUAL PERFORMANCE PLAN 2018/19 – 2020/21
126
Fighting Disease, Fighting Poverty, Giving Hope
Strategic
Objective
Statement
Performance Indicators Data Source Frequency
Type
Audited/ Actual Performance Estimated
Performance
2017/18
Medium Term Targets Strategic
Plan
Target
2019/20 2014/15 2015/16 2016/17 2018/19 2019/20 2020/21
2.10.2) Reduce
the malaria
case fatality
rate to less
than 0.5% by
March 2020
2. Malaria case
fatality rate
Malaria
Information
System
Quarterly
%
1.05% 1% 1.2% 1.5% 0.6% 0.4% 0.2% Less than
0.5%
Deaths from malaria Malaria
Register; Tick
Sheets PHC
No 7 5 7 8 3 2 1
Total number of
Malaria cases
reported
Malaria
Register; Tick
Sheets PHC
No 664 502 557 532 513 500 495
2.10.1) Zero
new local
malaria cases
by March 2020
3. Malaria incidence
per 1000
population at risk
Malaria
Register; Stats
SA
Annual
No per 1000
pop at risk
1/ 1000 0.8 / 1000 0.3 / 1000 0.8/ 1000 0.1/ 1000 Zero new
local
infections
Zero new
local
infections
Zero new
local
infections
Number of malaria
cases (new)
Malaria
Register; Tick
Register PHC
No 664 519 224103 532104 70 0 0
Population
Umkhanyakude
DHIS; Stats SA No 643 759 649 645 655 616 687 572 696 042 704 651 704 651
Strategic Objective 2.9: Reduce the morbidity and mortality of non-communicable diseases
2.9.3) Screen
at least 2.5
million people
(40 years and
older) per
annum for
hypertension
by March 2020
4. Clients 40 years
and older
screened for
hypertension
DHIS; Tick
Register
Quarterly
No
Not reported 7 706 460* 10 537 695105 5 067 680 2 535 282 2 555 563 2 555 996 -
2.9.1)
Hypertension
incidence of
5. Hypertension
incidence
(annualised)
DHIS Annual
No per 1000
population
19.2/1000
18.6 / 1000 21.8 / 1000106 22 / 1000 23/ 1000107 23/ 1000 23/1000 24.6 or less
per 1000
population
103 These are new cases specific to Umkhanyakude and do not include all the provincial cases diagnosed 104 Confirm if this is cases from Umkhanyakude only – or also including cross border cases – seems too high for local cases 105 The data for 2015/16 and 2016/17 are not exclusive to screening, hence over-reported. An SOP was developed in 2017/18 to ensure more accurate reporting 106 Calculated manually - DHIS reflects as 21.7 due to the 2017 population being used as the denominator 107 It is expected that more effective early detection of patients will increase the number of patients on treatment – increase before tapering down

ANNUAL PERFORMANCE PLAN 2018/19 – 2020/21
127
Fighting Disease, Fighting Poverty, Giving Hope
Strategic
Objective
Statement
Performance Indicators Data Source Frequency
Type
Audited/ Actual Performance Estimated
Performance
2017/18
Medium Term Targets Strategic
Plan
Target
2019/20 2014/15 2015/16 2016/17 2018/19 2019/20 2020/21
24.6 or less per
1000
population by
March 2020
Hypertension client
treatment new
PHC Register No 48 925 48 837 58 396 55 455 59 114 60 348 61 724
Population 40 years
and older
DHIS; Stats SA No 2 547 122 2 547 127 2 680 947 2 520 246 2 570 168 2 623 843 2 683 650
2.9.4) Screen
at least 2.5
million people
(40 years and
older) per
annum for
diabetes by
March 2020
6. Clients 40 years
and older
screened for
diabetes
DHIS; Tick
Register
Quarterly
No
Not reported Not reported Not reported 4 536 356 2 535 282 2 555 563 2 555 996 -
2.9.2) Diabetes
incidence of
3.1 per 1000
population by
March 2020
7. Diabetes
incidence
(annualised)
DHIS Annual
No per 1000
population
1.6/1000 2.2 / 1000 2.8 / 1000 3.1 / 1000 3.1/ 1000 3.1/ 1000 3.1/1000 3.1 per
1000
population
Diabetes client
treatment new
PHC Register No 17 051 27 641 29 943 34 929 35 393 35 854 36 311
Population total DHIS; Stats SA No 10 571 313 10 688 165 10 806 538 11 267 436 11 417 132 11 565 963 11 713 378
2.9.5) Screen
at least 35% of
PHC clients for
mental
disorders by
March 2020
8. Mental disorders
screening rate
DHIS Quarterly
%
Not reported 3.7% 22.4% 31.9% 33.6% 35% 35% -
PHC client screened for
mental disorders
PHC Register No - 1 135 000 6 550 458 9 243 156 9 815 319 10 216 306 10 153 239
PHC headcount - total PHC Register No - 30 745 821108 29 200 948 28 999 286 29 200 245 29 189 445 29 009 254
2.9.7) Increase
the number of
wheelchairs
issued to 4 200
by March 2020
9. Wheelchairs
issued
PHC & OPD
Registers;
DHIS
Quarterly
No
Not reported Not reported 7 576
2 012 4 100 4 200 4 300 -
Strategic Objective 5.2) Improve quality of care
5.2.7) Improve
the restoration
10. Dental extraction
to restoration ratio
DHIS Quarterly
No
19:1 19:1 19:1 17:1 19:1 18:1 17:1 -
108 This includes clinics, CHC’s, mobiles, reproductive and specialised clinics

ANNUAL PERFORMANCE PLAN 2018/19 – 2020/21
128
Fighting Disease, Fighting Poverty, Giving Hope
Strategic
Objective
Statement
Performance Indicators Data Source Frequency
Type
Audited/ Actual Performance Estimated
Performance
2017/18
Medium Term Targets Strategic
Plan
Target
2019/20 2014/15 2015/16 2016/17 2018/19 2019/20 2020/21
to extraction
ratio to 18:1 or
less by March
2020
Tooth extraction PHC Register;
OPD &
Theatre
Registers
No 559 020 548 034 537 762 513 070 454 230 432 250 413 525
Tooth restoration PHC Register;
OPD &
Theatre
Registers
No 29 444 27 957 28 809 29 442 23 907 24 013 24 325

ANNUAL PERFORMANCE PLAN 2018/19 – 2020/21
129
Fighting Disease, Fighting Poverty, Giving Hope
2018/19 Targets
Table 43: (DHS16) Quarterly and Annual Targets
Performance Indicators Frequency Type Targets
2018/19
Targets
Q1 Q2 Q3 Q4 Annual
1. Cataract surgery rate
(annualised)
Quarterly No per
1mil
uninsured
population
944.5/
1mil
236.1/
1mil
472.2/
1mil
708.3/
1mil
944.5/
1mil
944.5/
1mil
2. Malaria case fatality rate Quarterly % 0.6% 1.3% 0.9% 0.7% 0.6% 0.6%
3. Malaria incidence per
1000 population at risk
Annual No per
1000
population
at risk
0.1/1000 - - - - 0.1/1000
4. Clients 40 years and
older screened for
hypertension
Quarterly No 2 535 282 633 820 1 267 640 1 901 460 2 535 282 2 535 282
5. Hypertension incidence
(annualised)
Annual No per
1000
population
23/ 1000 - - - - 23/ 1000
6. Clients 40 years and
older screened for
diabetes
Quarterly No 2 535 282 633 820 1 267 640 1 901 460 2 535 282 2 535 282
7. Diabetes incidence
(annualised)
Annual No per
1000
population
3.1/ 1000 - - - - 3.1/ 1000
8. Mental disorders
screening rate
Quarterly % 33.6% 33.6% 33.6% 33.6% 33.6% 33.6%
9. Wheelchairs issued Quarterly No 4 100 1 025 1 025 1 025 1 025 4 100
10. Dental extraction to
restoration ratio
Quarterly Ratio 19:1 19:1 19:1 19:1 19:1 19:1
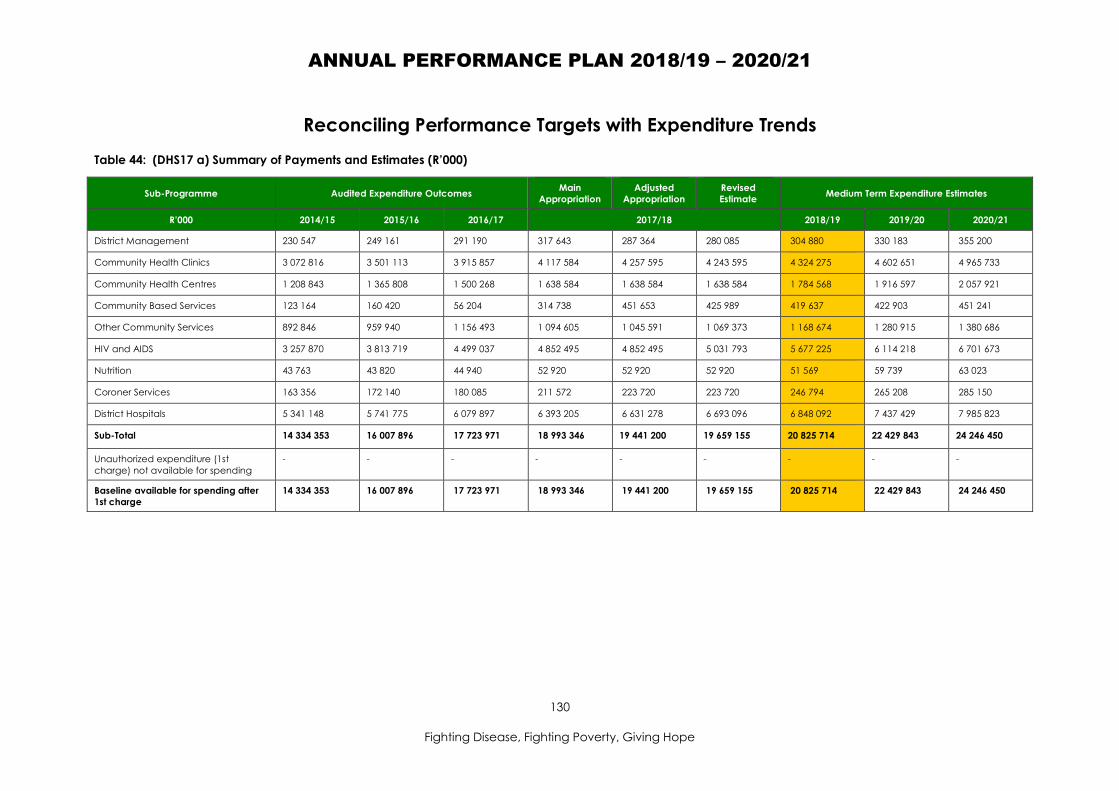
ANNUAL PERFORMANCE PLAN 2018/19 – 2020/21
130
Fighting Disease, Fighting Poverty, Giving Hope
Reconciling Performance Targets with Expenditure Trends
Table 44: (DHS17 a) Summary of Payments and Estimates (R’000)
Sub-Programme Audited Expenditure Outcomes Main
Appropriation
Adjusted
Appropriation
Revised
Estimate Medium Term Expenditure Estimates
R’000 2014/15 2015/16 2016/17 2017/18 2018/19 2019/20 2020/21
District Management 230 547 249 161 291 190 317 643 287 364 280 085 304 880 330 183 355 200
Community Health Clinics 3 072 816 3 501 113 3 915 857 4 117 584 4 257 595 4 243 595 4 324 275 4 602 651 4 965 733
Community Health Centres 1 208 843 1 365 808 1 500 268 1 638 584 1 638 584 1 638 584 1 784 568 1 916 597 2 057 921
Community Based Services 123 164 160 420 56 204 314 738 451 653 425 989 419 637 422 903 451 241
Other Community Services 892 846 959 940 1 156 493 1 094 605 1 045 591 1 069 373 1 168 674 1 280 915 1 380 686
HIV and AIDS 3 257 870 3 813 719 4 499 037 4 852 495 4 852 495 5 031 793 5 677 225 6 114 218 6 701 673
Nutrition 43 763 43 820 44 940 52 920 52 920 52 920 51 569 59 739 63 023
Coroner Services 163 356 172 140 180 085 211 572 223 720 223 720 246 794 265 208 285 150
District Hospitals 5 341 148 5 741 775 6 079 897 6 393 205 6 631 278 6 693 096 6 848 092 7 437 429 7 985 823
Sub-Total 14 334 353 16 007 896 17 723 971 18 993 346 19 441 200 19 659 155 20 825 714 22 429 843 24 246 450
Unauthorized expenditure (1st
charge) not available for spending
- - - - - - - - -
Baseline available for spending after
1st charge
14 334 353 16 007 896 17 723 971 18 993 346 19 441 200 19 659 155 20 825 714 22 429 843 24 246 450

ANNUAL PERFORMANCE PLAN 2018/19 – 2020/21
131
Fighting Disease, Fighting Poverty, Giving Hope
Table 45: (DHS17 b) Summary of Payments and Estimates by Economic Classification (R’000)
Economic Classification Audited Expenditure Outcomes Main
Appropriation
Adjusted
Appropriation
Revised
Estimate Medium-Term Expenditure Estimates
R’000 2014/15 2015/16 2016/17 2017/18 2018/19 2019/20 2020/21
Current payments 13 774 307 15 589 077 17 198 336 18 402 782 18 710 274 18 874 337 20 118 237 21 645 795 23 377 105
Compensation of employees 9 481 720 10 476 826 11 229 551 12 176 936 12 079 378 11 967 344 12 396 711 13 445 989 14 536 078
Goods and services 4 292 441 5 111 894 5 967 879 6 225 453 6 630 616 6 906 598 7 721 133 8 199 391 8 840 589
Communication 53 110 52 806 67 461 59 965 56 558 56 812 59 633 62 618 66 064
Computer Services 93 3 252 1 457 - 1 460 1 094 1 289 1 354 1 428
Consultants, Contractors and Special
Services
133 179 125 432 1 345 427 1 475 291 1 737 319 1 885 682 1 877 396 1 866 879 1 951 516
Inventory 2 356 382 2 910 695 3 670 592 3 689 403 3 875 328 4 021 043 4 748 984 5 182 460 5 675 767
Operating leases 41 646 46 271 37 100 36 926 32 374 27 064 32 677 34 313 36 201
Travel and subsistence 26 087 28 841 24 063 24 740 20 135 19 355 24 346 25 573 26 978
Interest and rent on land 146 357 906 393 280 395 393 415 438
Maintenance, repair and running
costs
94 603 91 734 - - - - - - -
Other including Assets<5000, training
and development, property
payments, operating expenditure and
venues and facilities
1 587 341 1 852 863 821 746 939 128 906 170 895 548 976 808 1 026 194 1 082 634
Transfers and subsidies to 411 766 363 631 458 294 457 659 475 617 579 002 455 387 487 529 556 518
Provinces and municipalities 117 404 129 600 154 750 193 000 204 284 219 659 213 394 225 396 237 793
Departmental agencies and
accounts
10 48 107 43 67 107 45 47 49
Universities and Technicon - - - - - - - - -
Non-profit institutions 190 405 165 147 171 372 175 844 108 611 114 758 49 701 51 034 52 865
Households 103 947 68 836 132 065 88 772 162 655 244 478 192 247 211 052 265 811
Payments for capital assets 148 259 55 159 67 311 132 905 255 309 205 798 252 090 296 519 312 827
Machinery and equipment 148 049 55 159 67 311 132 905 252 509 202 998 252 090 296 519 312 827

ANNUAL PERFORMANCE PLAN 2018/19 – 2020/21
132
Fighting Disease, Fighting Poverty, Giving Hope
Economic Classification Audited Expenditure Outcomes Main
Appropriation
Adjusted
Appropriation
Revised
Estimate Medium-Term Expenditure Estimates
R’000 2014/15 2015/16 2016/17 2017/18 2018/19 2019/20 2020/21
Software and other tangible assets - - - - - - - - -
Payment for financial assets 21 29 30 - - 6 - - -
Total economic classification 14 334 353 16 007 896 17 723 971 18 993 346 19 441 200 19 659 155 20 825 714 22 429 843 24 246 450
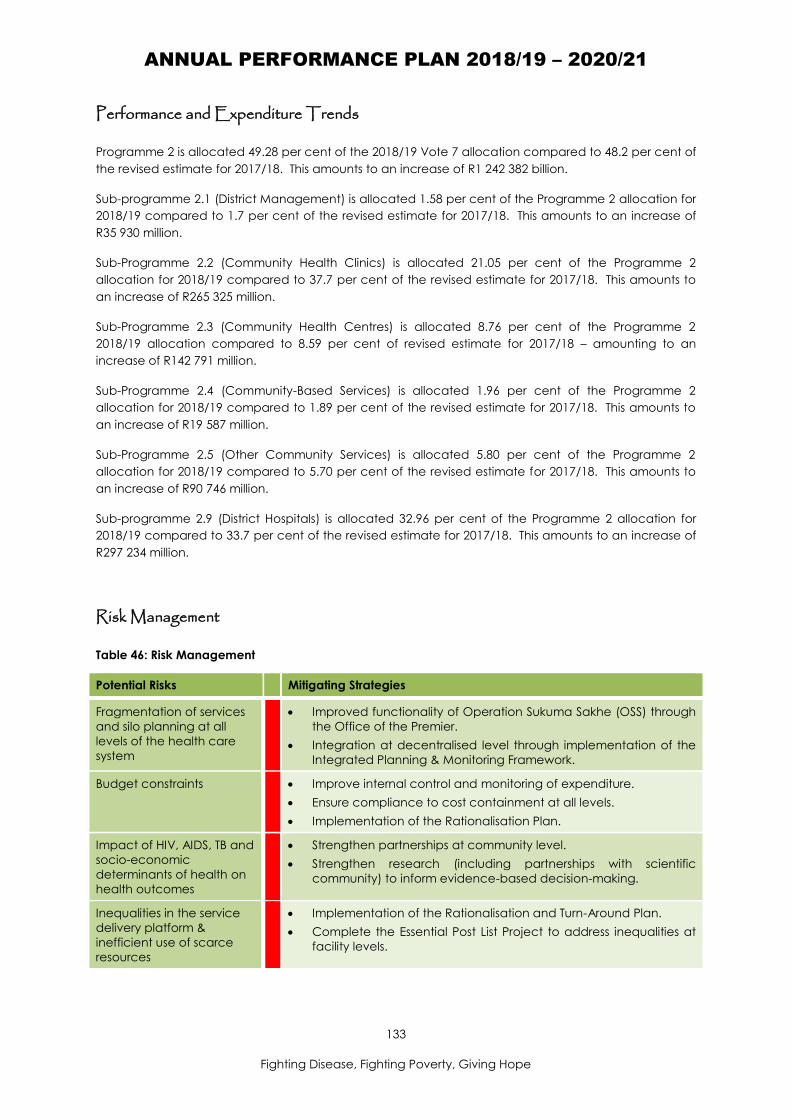
ANNUAL PERFORMANCE PLAN 2018/19 – 2020/21
133
Fighting Disease, Fighting Poverty, Giving Hope
Performance and Expenditure Trends
Programme 2 is allocated 49.28 per cent of the 2018/19 Vote 7 allocation compared to 48.2 per cent of
the revised estimate for 2017/18. This amounts to an increase of R1 242 382 billion.
Sub-programme 2.1 (District Management) is allocated 1.58 per cent of the Programme 2 allocation for
2018/19 compared to 1.7 per cent of the revised estimate for 2017/18. This amounts to an increase of
R35 930 million.
Sub-Programme 2.2 (Community Health Clinics) is allocated 21.05 per cent of the Programme 2
allocation for 2018/19 compared to 37.7 per cent of the revised estimate for 2017/18. This amounts to
an increase of R265 325 million.
Sub-Programme 2.3 (Community Health Centres) is allocated 8.76 per cent of the Programme 2
2018/19 allocation compared to 8.59 per cent of revised estimate for 2017/18 – amounting to an
increase of R142 791 million.
Sub-Programme 2.4 (Community-Based Services) is allocated 1.96 per cent of the Programme 2
allocation for 2018/19 compared to 1.89 per cent of the revised estimate for 2017/18. This amounts to
an increase of R19 587 million.
Sub-Programme 2.5 (Other Community Services) is allocated 5.80 per cent of the Programme 2
allocation for 2018/19 compared to 5.70 per cent of the revised estimate for 2017/18. This amounts to
an increase of R90 746 million.
Sub-programme 2.9 (District Hospitals) is allocated 32.96 per cent of the Programme 2 allocation for
2018/19 compared to 33.7 per cent of the revised estimate for 2017/18. This amounts to an increase of
R297 234 million.
Risk Management
Table 46: Risk Management
Potential Risks Mitigating Strategies
Fragmentation of services
and silo planning at all
levels of the health care
system
Improved functionality of Operation Sukuma Sakhe (OSS) through
the Office of the Premier.
Integration at decentralised level through implementation of the
Integrated Planning & Monitoring Framework.
Budget constraints Improve internal control and monitoring of expenditure.
Ensure compliance to cost containment at all levels.
Implementation of the Rationalisation Plan.
Impact of HIV, AIDS, TB and
socio-economic
determinants of health on
health outcomes
Strengthen partnerships at community level.
Strengthen research (including partnerships with scientific
community) to inform evidence-based decision-making.
Inequalities in the service
delivery platform &
inefficient use of scarce
resources
Implementation of the Rationalisation and Turn-Around Plan.
Complete the Essential Post List Project to address inequalities at
facility levels.

ANNUAL PERFORMANCE PLAN 2018/19 – 2020/21
134
Fighting Disease, Fighting Poverty, Giving Hope
NOTES
……………………………………………………………………………………………………………………………………
……………………………………………………………………………………………………………………………………
……………………………………………………………………………………………………………………………………
……………………………………………………………………………………………………………………………………
……………………………………………………………………………………………………………………………………
……………………………………………………………………………………………………………………………………
……………………………………………………………………………………………………………………………………
……………………………………………………………………………………………………………………………………
……………………………………………………………………………………………………………………………………
……………………………………………………………………………………………………………………………………
……………………………………………………………………………………………………………………………………
……………………………………………………………………………………………………………………………………
……………………………………………………………………………………………………………………………………
……………………………………………………………………………………………………………………………………
……………………………………………………………………………………………………………………………………
……………………………………………………………………………………………………………………………………
……………………………………………………………………………………………………………………………………
……………………………………………………………………………………………………………………………………

ANNUAL PERFORMANCE PLAN 2018/19 – 2020/21
135
Fighting Disease, Fighting Poverty, Giving Hope
PROGRAMME 3: EMERGENCY MEDICAL SERVICES
Programme Purpose
Rendering pre-hospital Emergency Medical Services, including Inter-hospital Transfers and Planned
Patient Transport - The previous structure included Sub-Programme 3.3: Disaster Management which is a
Municipal function.
Sub-Programme 3.1: Emergency Medical Services
Render Emergency Medical Services including Ambulance Services, Special Operations, and
Communication and Air Ambulance services.
Sub-Programme 3.2: Patient Transport Services (PTS)
Render Planned Patient Transport including Local Outpatient Transport (within the boundaries of a
given town or local area) and Inter-City/Town Outpatient Transport (into referral centres).

ANNUAL PERFORMANCE PLAN 2018/19 – 2020/21
136
Fighting Disease, Fighting Poverty, Giving Hope
2018/19 Priorities
Priorities Key Focus Areas
Finalise & implement the Emergency
Medical Services Turn-Around
Strategy and Plan as part of the
Provincial Turn-Around Plan and
monitor progress
Implement the approved EMS Turn-Around Plan (aligned
with new EMS Regulations and Policy reforms) and monitor
progress against deliverables.
Review and align referral pathways with service delivery.
Improve access to quality Disaster Medicine Services as
part of the Rationalisaiton and Turn-Around Plan.
Implement the approved transformation plan for EMS
Education and Training within the NCET (National
Emergency Care Education and Training) Policy
Framework.
Strengthen effective governance systems and processes.
Strengthen the electronic EMS information system – Web-
Based DHIS.
Monitor quality and utilisation of information for planning
and decision-making.
Construction of EMS Wash Bays (as per approved
Infrastructure Plan)

ANNUAL PERFORMANCE PLAN 2018/19 – 2020/21
137
Fighting Disease, Fighting Poverty, Giving Hope
Situation Analysis Indicators
Table 47: (EMS1) Situation Analysis Indicators
Programme Performance
Indicator
Da
ta S
ou
rce
Pro
vin
ce
20
16
/17
Ug
u
20
16
/17
UM
gu
ng
un
dlo
vu
20
16
/17
Uth
uke
la
20
16
/17
UM
zin
ya
thi
20
16
/17
Am
aju
ba
20
16
/17
Zulu
lan
d
20
16
/17
UM
kh
an
ya
ku
de
20
16
/17
Kin
g C
ets
hw
ay
o
20
16
/17
Ilem
be
20
16
/17
Ha
rry G
wa
la
20
16
/17
eTh
ekw
ini
20
16
/17
1. EMS P1 urban
response under 15
minutes rate
EMS
Register
5.1% 2.6% 3.1% 6.2% 32.3% 75.4% N/A N/A 25.4% 10.2% N/A 3.1%
No P1 urban calls with
response times under 15
minutes
EMS Callout
Register
7 980 289 534 264 298 2 470 - - 143 372 - 3 610
All P1 urban call outs EMS Callout
Register
157 550 11 164 17 102 4 267 922 3 278 - - 563 3 653 - 116 601
2. EMS P1 rural
response under 40
minutes rate
EMS
Register
34.9% 10.5% 8.9% 17.3% 27.2% 81.6% 52.8% 24.3% 31.9% 28.9% 38.8% 24%
No P1 rural calls with
response times under 40
minutes
EMS Callout
Register
65 050
1 383 1 179 3 575 5 517 16 918 12 980 2 740 9 264 3 967 7 458 69
All P1 rural call outs EMS Callout
Register
186 325
13 219 13 242 20 682 20 316 20 744 24 571 11 298 29 036 13 718 19 211 288
3. EMS inter-facility
transfer rate
EMS
Register;
EMS
Database
30.2% 34.5% 36% 35.4% 10.5% 25.6% 31% 38.6% 34.1% 26.2% 29.9% 28%
EMS inter-facility transfer EMS
Register
199 869 17 791 23 544 13 257 3 483 11 106 12 060 18 598 19 776 9 656 8 823 61 775
EMS clients total EMS
Register
662 742 51 509 65 452 37 403 33 027 43 404 38 927 48 234 57 983 36 798 29 465 220 540
Source: 2016/17 Annual Report

ANNUAL PERFORMANCE PLAN 2018/19 – 2020/21
138
Fighting Disease, Fighting Poverty, Giving Hope
Strategic Objectives, Indicators and Targets
Table 48: Strategic Plan 2015-2019 Targets
Strategic Goal Strategic Objective Strategic Objective Statement Indicator Targets 2019/20
Strategic Goal 1:
Strengthen health
system effectiveness
1.8) Improve EMS
efficiencies
1.8.1) EMS Turn-Around Strategy approved by June 2018
(Reviewed 2017/18)
Approved EMS Turn-Around Strategy
(Reviewed 2017/18)
Approved EMS Turn-
Around Strategy
(Reviewed 2017/18)
1.8.2) Increase the average number of daily operational
ambulances to 220 by March 2020 (Reviewed 2017/18)
Average number of daily operational
ambulances
220 (Reviewed
2017/18)
Strategic Goal 5:
Improved quality of
health care
1.8.4) Improve P1 urban response times of under 15 minutes to
20% by March 2020 (Reviewed 2017/18)
EMS P1 urban response under 15
minutes rate
20% (Reviewed
2017/18)
1.8.5) Improve P1 rural response times of under 40 minutes to
40% by March 2020 ((Reviewed 2017/18)
EMS P1 rural response under 40
minutes rate
40% (Reviewed
2017/18)
1.8.6) Increase the inter-facility transfer rate to 50% by March
2020
EMS inter-facility transfer rate 50%
Table 49: (EMS2) Strategic Objectives, Indicators and Targets
Strategic
Objective
Statement
Performance
Indicators Data Source
Frequency
Type
Audited/ Actual Performance Estimated
Performance Medium Term Targets Strategic Plan
Targets
2019/20 2014/15 2015/16 2016/17 2017/18 2018/19 2019/20 2020/21
9Strategic Objective 1.8: Improve EMS efficiencies
1.8.4) Improve
P1 urban
response times
of under 15
minutes to 20%
(or more) by
March 2020
1. EMS P1 urban
response under
15 minutes rate
EMS
Database;
DHIS
Quarterly
%
5% 5% 5.1% 21.6% 23% 25% 27% 20% (or
more)
EMS P1 urban
response under 15
minutes
EMS Callout
Register
No 8 524 7 896 7 980 34 129 36 523 39 415 42 927
EMS P1 urban calls EMS Callout
Register
No 166 854 162 760 157 550 158 009 158 798 157 661 158 991

ANNUAL PERFORMANCE PLAN 2018/19 – 2020/21
139
Fighting Disease, Fighting Poverty, Giving Hope
Strategic
Objective
Statement
Performance
Indicators Data Source
Frequency
Type
Audited/ Actual Performance Estimated
Performance Medium Term Targets Strategic Plan
Targets
2019/20 2014/15 2015/16 2016/17 2017/18 2018/19 2019/20 2020/21
1.8.5) Improve
P1 rural
response times
of under 40
minutes to 40%
by March 2020
2. EMS P1 rural
response under
40 minutes rate
EMS
Database;
DHIS
Quarterly
%
32% 32% 34.9% 36% 38% 40% 44% 40%
EMS P1 rural response
under 40 minutes
EMS Callout
Register
No 71 399 66 543 65 050 52 055 76 711 80 401 88 702
EMS P1 rural calls EMS Callout
Register
No 224 560 205 668 186 325 146 266 201 873 201 004 201 643
1.8.6) Increase
the inter-facility
transfer rate to
50% by March
2020
3. EMS inter-facility
transfer rate
EMS
Database;
DHIS
Quarterly
%
39.4% 41% 30.2% 38.5% 46% 50% 53% 50%
EMS inter-facility
transfer
EMS Register No 222 446 208 628 199 869 128 133 253 858 275 827 292 580
EMS clients total EMS Register No 564 529 509 594 662 742 333 178 551 866 551 655 552 039
1.8.1) EMS Turn-
Around
Strategy
approved by
June 2018
4. Approved EMS
Turn-Around
Strategy
Approved
EMS Turn-
Around
Strategy
Annual
Categorical
Not reported Not
approved
Not
approved
Not
approved
Approved
Turn-Around
Strategy
Implement
approved
EMS Turn-
Around
Strategy
Implement
approved
EMS Turn-
Around
Strategy
Implement
approved
EMS Turn-
Around
Strategy
1.8.2) Increase
the average
number of daily
operational
ambulances to
220 by March
2020
5. Average number
of daily
operational
ambulances109
EMS Daily
Operations
Reports; EMS
Database
Annual
No
192 187 180 187 200 220 230 220
1.8.7) Increase
number bases
with network
access to 50 by
March 2020
6. Number of bases
with access to
intranet/ e-mail
ICT Roll-out
Report; IT
Database
Annual
No
20 50 (access to
computer)
23 (access to
email &
intranet)
38 23 40 50 60 -
109 This will include improved fleet management, maintenance, purchase/allocation of new ambulances and appointment of staff

ANNUAL PERFORMANCE PLAN 2018/19 – 2020/21
140
Fighting Disease, Fighting Poverty, Giving Hope
2018/19 Targets
Table 50: (EMS3) Quarterly and Annual Targets
Performance
Indicators Frequency Type
Annual
Target
2018/19
Targets
Q1 Q2 Q3 Q4 Annual
1. EMS P1 urban
response under
15 minutes rate
Quarterly
Cumulative
% 23% 21.6% 22.5% 22.8% 23% 23%
2. EMS P1 rural
response under
40 minutes rate
Quarterly
Cumulative
% 38% 36% 36% 37% 38% 38%
3. EMS inter-facility
transfer rate
Quarterly
Cumulative
% 46% 39% 41% 43% 46% 46%
4. Approved EMS
Turn-Around
Strategy
Annual Categorical Approved
EMS Turn-
Around
Strategy
- - - - Approved
EMS Turn-
Around
Strategy
5. Average number
of daily
operational
ambulances
Quarterly
Cumulative
No 200 185 190 195 200 200
6. Number of bases
with access to
computers and
intranet/ e-mail
Quarterly
Cumulative
No 40 38 38 39 40 40

ANNUAL PERFORMANCE PLAN 2018/19 – 2020/21
141
Fighting DIsease, FIghting Poverty, Giving Hope
Reconciling Performance Targets with Expenditure Trends
Table 51: (EMS4 a) Expenditure Estimates
Sub-Programme Audited Expenditure Outcomes Main
Appropriation
Adjusted
Appropriation
Revised
Estimate Medium Term Expenditure Estimates
R’000 2014/15 2015/16 2016/17 2017/18 2018/19 2019/20 2020/21
Emergency Services 1 026 983 1 106 709 1 114 738 1 195 647 1 242 392 1 275 170 1 299 438 1 410 574 1 513 694
Planned Patient Transport 41 130 67 669 94 525 82 203 116 122 127 947 116 248 110 584 118 310
Sub-Total 1 068 113 1 174 378 1 209 263 1 277 850 1 358 514 1 403 117 1 415 686 1 521 158 1 632 004
Unauthorized expenditure (1st charge)
not available for spending
- - - - - - - - -
Baseline available for spending after 1st
charge
1 068 113 1 174 378 1 209 263 1 277 850 1 358 514 1 403 117 1 415 686 1 521 158 1 632 004
Table 52: (EMS4 b) Summary of Provincial Expenditure Estimates by Economic Classification
Economic Classification Audited Expenditure Outcomes Main
Appropriation
Adjusted
Appropriation
Revised
Estimate Medium-Term Expenditure Estimates
R’000 2014/15 2015/16 2016/17 2017/18 2018/19 2019/20 2020/21
Current payments 1 061 869 1 133 984 1 189 528 1 220 793 1 301 802 1 347 223 1 329 375 1 419 356 1 524 602
Compensation of employees 768 178 822 311 866 530 899 259 942 036 966 812 962 392 1 087 276 1 174 258
Goods and services 293 675 311 638 322 937 321 534 359 747 380 406 366 983 332 080 350 344
Communication 8 107 8 734 9 395 10 148 9 381 9 415 11 468 12 111 12 777
Computer Services 45 - - - - - - - -
Consultants, Contractors and special
services
1 608 3 059 181 957 173 325 215 105 238 727 214 363 178 665 188 493
Inventory 15 155 21 843 27 707 27 838 25 380 25 423 34 351 29 962 31 609
Operating leases 1 441 1 615 1 624 1 610 1 335 1 259 1 622 1 712 1 806

ANNUAL PERFORMANCE PLAN 2018/19 – 2020/21
142
Fighting Disease, Fighting Poverty, Giving Hope
Economic Classification Audited Expenditure Outcomes Main
Appropriation
Adjusted
Appropriation
Revised
Estimate Medium-Term Expenditure Estimates
R’000 2014/15 2015/16 2016/17 2017/18 2018/19 2019/20 2020/21
Travel and subsistence 4 503 3 678 1 961 1 782 1 912 2 380 2 187 2 310 2 437
Interest and rent on land 16 35 61 - 19 5 - - -
Maintenance, repair and running costs 169 437 168 660 - - - - - - -
Other including Assets<5000, training
and development, property payments,
operating expenditure and venues and
facilities
93 379 104 049 100 293 106 831 106 634 103 202 102 992 107 320 113 222
Transfers and subsidies to 4 684 3 437 3 779 5 057 4 703 3 885 5 311 5 609 5 918
Provinces and municipalities 1 947 1 177 2 001 2 500 2 624 2 624 2 645 2 793 2 947
Departmental agencies and accounts 2 2 2 2 - - 2 2 2
Households 2 735 2 258 1 776 2 555 2 079 1 261 2 664 2 814 2 969
Payments for capital assets 1 189 36 957 15 956 52 000 52 009 52 009 81 000 96 193 101 484
Machinery and equipment 1 189 36 957 15 956 52 000 52 009 52 009 81 000 96 193 101 484
Payment for financial assets 371 - - - - - - - -
Total economic classification 1 068 113 1 174 378 1 209 263 1 277 850 1 358 514 1 403 117 1 415 686 1 521 158 1 632 004

ANNUAL PERFORMANCE PLAN 2018/19 – 2020/21
143
Fighting Disease, Fighting Poverty, Giving Hope
Performance and Expenditure Trends
Programme 3 (Emergency Medical Services) is allocated 3.2 per cent of the total 2018/19 Vote 7
allocation compared to 3.2 per cent of the revised estimate for 2017/18. This amounts to an increase of
R16 428 million.
Sub-Programme Emergency Services is allocated 92.7 per cent of the Programme 3 allocation for
2018/19 compared to 98.3 per cent of the revised estimate for 2017/18. This amounts to an increase of
R22 522 million.
Sub-Programme Planned Patient Transport is allocated 7.29 per cent of the Programme 3 allocation for
2018/19 compared to 5.6 per cent of the revised estimate for 2017/18. This amounts to a decrease of
R6 094 million.
Risk Management
Table 53: Risk Management
Potential Risks Mitigating Strategies
Budget constraints Re-prioritisation based on Turn-Around Strategy.
Improve revenue generation.
Inadequate electronic EMS
information system
Re-prioritise electronic information system for triage in line with the
approved ICT strategy.
Implementation of the web-based EMS/ DHIS system.
Monitor data quality and use of information for planning and
decision-making.
Inadequate ambulance
fleet
Prioritise procurement of ambulances to replace old fleet.
Implement the approved Fleet Management Plan.
Non-compliance to EMS
Regulations and Policy
reforms
Monitor implementation of the approved EMS Turn-around Plan to
track progress towards compliance.
Inadequate EMS
infrastructure
Re-prioritise EMS infrastructure in collaboration with Infrastructure
Development – alignment to approved 10-year Infrastructure
Implementation Plan.

ANNUAL PERFORMANCE PLAN 2018/19 – 2020/21
144
Fighting Disease, Fighting Poverty, Giving Hope
NOTES
……………………………………………………………………………………………………………………………………
……………………………………………………………………………………………………………………………………
……………………………………………………………………………………………………………………………………
……………………………………………………………………………………………………………………………………
……………………………………………………………………………………………………………………………………
……………………………………………………………………………………………………………………………………
……………………………………………………………………………………………………………………………………
……………………………………………………………………………………………………………………………………
……………………………………………………………………………………………………………………………………
……………………………………………………………………………………………………………………………………
……………………………………………………………………………………………………………………………………
……………………………………………………………………………………………………………………………………
……………………………………………………………………………………………………………………………………
……………………………………………………………………………………………………………………………………
……………………………………………………………………………………………………………………………………
……………………………………………………………………………………………………………………………………
……………………………………………………………………………………………………………………………………
……………………………………………………………………………………………………………………………………

ANNUAL PERFORMANCE PLAN 2018/19 – 2020/21
145
Fighting Disease, Fighting Poverty, Giving Hope
PROGRAMME 4: PROVINCIAL HOSPITALS (REGIONAL AND
SPECIALISED)
Programme Purpose
Deliver hospital services which are accessible, appropriate, and effective and provide general specialist
services, including specialized rehabilitation services, and a platform for training health professionals
and research. There are no changes to the Programme 4 structure.
Sub-Programme 4.1: General (Regional) Hospitals
Render hospital services at a general specialist level and provides a training platform for training of
health workers and research.
Sub-Programme 4.2: Specialised Tuberculosis Hospitals
Convert present Tuberculosis hospitals into strategically placed centres of excellence. TB centres of
excellence will admit patients with complicated TB requiring isolation for public protection and
specialised clinical management in the intensive phase of treatment to improve clinical outcomes. This
strategy will reduce operational costs in the long term.
Sub-Programme 4.3: Specialised Psychiatric/ Mental Health Hospitals
Render a specialist psychiatric hospital service for people with mental illnesses and intellectual disability
and provide a platform for the training of health workers and research.
Sub-Programme 4.4: Chronic/ Sub-Acute Hospitals
Provide medium to long term care to patients who require rehabilitation and/or a minimum degree of
active medical care but cannot be sent home. These patients are often unable to access ambulatory
care at our services or their socio-economic or family circumstances do not allow for them to be cared
for at home.
Sub-Programme 4.5: Oral and Dental Training Centre
Render an affordable and comprehensive oral health service and training, based on the primary health
care approach.

ANNUAL PERFORMANCE PLAN 2018/19 – 2020/21
146
Fighting Disease, Fighting Poverty, Giving Hope
Sub-Programme: Regional Hospitals
2018/19 Priorities
Priorities Key Focus Areas
Improve access to the Regional
Hospital package of services and
improve efficiencies and clinical care
Implement the approved Regional Hospital Rationalisation
Plan and monitor progress.
Review classification, package of services and structures as
per Business Plan.
Monitor allocation and utilisation of resources as per
recommendations from the Essential Post List Project.
Improve quality of care and clinical governance at facility
level in line with the approved Clinical Governance Policy.
Improve leadership and management at facility level
through mentoring and training programmes.
Implementation of the National Core Standards with
emphasis in self-assessments and implementation of Quality
Improvement Plans.
Strengthen oversight and support and monitor
implementation of reviewed delegations at facility level.
Improve the hospital information system within the
framework of the approved ICT Strategy.
Implement the Pixley ka Isaka Seme Regional Hospital pre-
commissioning plan and monitor progress.
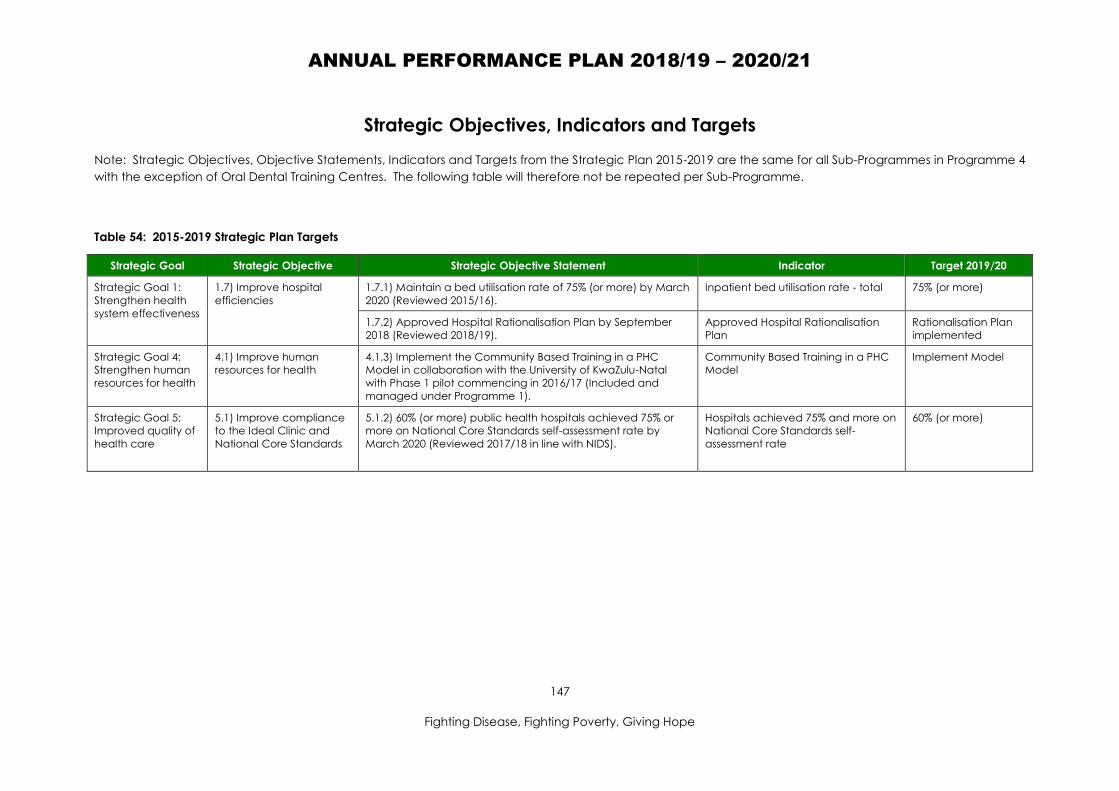
ANNUAL PERFORMANCE PLAN 2018/19 – 2020/21
147
Fighting Disease, Fighting Poverty, Giving Hope
Strategic Objectives, Indicators and Targets
Note: Strategic Objectives, Objective Statements, Indicators and Targets from the Strategic Plan 2015-2019 are the same for all Sub-Programmes in Programme 4
with the exception of Oral Dental Training Centres. The following table will therefore not be repeated per Sub-Programme.
Table 54: 2015-2019 Strategic Plan Targets
Strategic Goal Strategic Objective Strategic Objective Statement Indicator Target 2019/20
Strategic Goal 1:
Strengthen health
system effectiveness
1.7) Improve hospital
efficiencies
1.7.1) Maintain a bed utilisation rate of 75% (or more) by March
2020 (Reviewed 2015/16).
Inpatient bed utilisation rate - total 75% (or more)
1.7.2) Approved Hospital Rationalisation Plan by September
2018 (Reviewed 2018/19).
Approved Hospital Rationalisation
Plan
Rationalisation Plan
implemented
Strategic Goal 4:
Strengthen human
resources for health
4.1) Improve human
resources for health
4.1.3) Implement the Community Based Training in a PHC
Model in collaboration with the University of KwaZulu-Natal
with Phase 1 pilot commencing in 2016/17 (Included and
managed under Programme 1).
Community Based Training in a PHC
Model
Implement Model
Strategic Goal 5:
Improved quality of
health care
5.1) Improve compliance
to the Ideal Clinic and
National Core Standards
5.1.2) 60% (or more) public health hospitals achieved 75% or
more on National Core Standards self-assessment rate by
March 2020 (Reviewed 2017/18 in line with NIDS).
Hospitals achieved 75% and more on
National Core Standards self-
assessment rate
60% (or more)
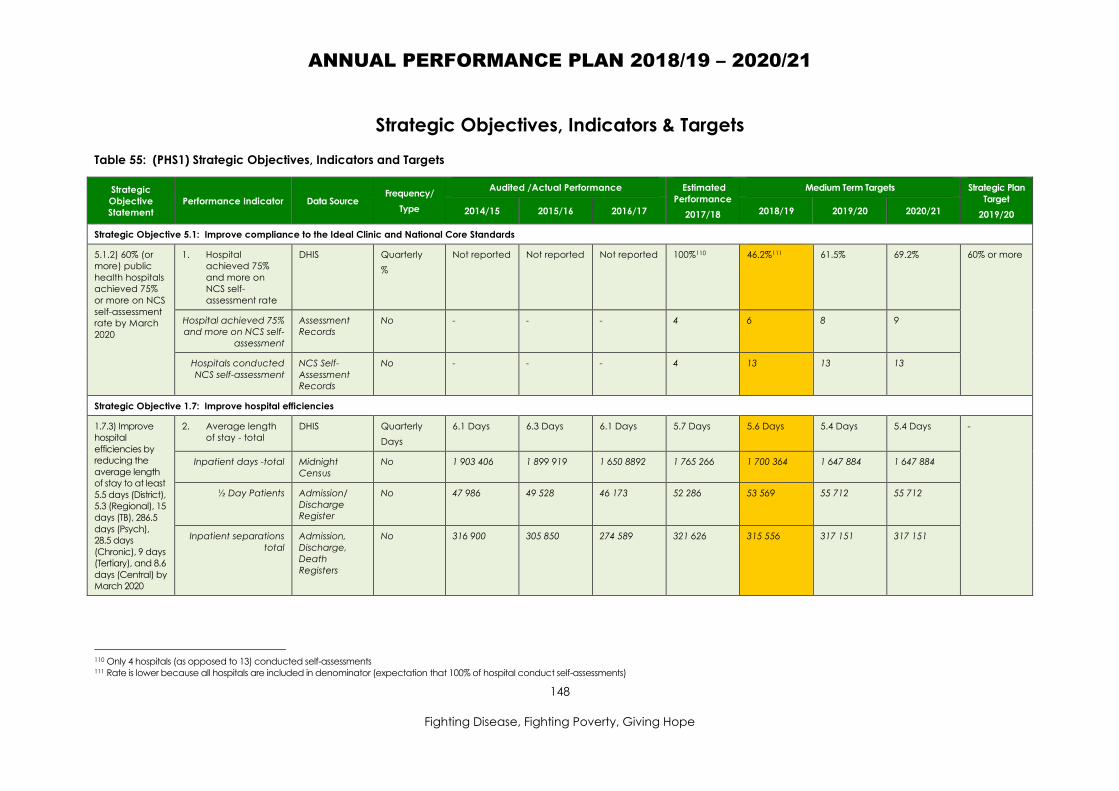
ANNUAL PERFORMANCE PLAN 2018/19 – 2020/21
148
Fighting Disease, Fighting Poverty, Giving Hope
Strategic Objectives, Indicators & Targets
Table 55: (PHS1) Strategic Objectives, Indicators and Targets
Strategic
Objective
Statement
Performance Indicator Data Source Frequency/
Type
Audited /Actual Performance Estimated
Performance
2017/18
Medium Term Targets Strategic Plan
Target
2019/20 2014/15 2015/16 2016/17 2018/19 2019/20 2020/21
Strategic Objective 5.1: Improve compliance to the Ideal Clinic and National Core Standards
5.1.2) 60% (or
more) public
health hospitals
achieved 75%
or more on NCS
self-assessment
rate by March
2020
1. Hospital
achieved 75%
and more on
NCS self-
assessment rate
DHIS Quarterly
%
Not reported Not reported Not reported 100%110 46.2%111 61.5% 69.2% 60% or more
Hospital achieved 75%
and more on NCS self-
assessment
Assessment
Records
No - - - 4 6 8 9
Hospitals conducted
NCS self-assessment
NCS Self-
Assessment
Records
No - - - 4 13 13 13
Strategic Objective 1.7: Improve hospital efficiencies
1.7.3) Improve
hospital
efficiencies by
reducing the
average length
of stay to at least
5.5 days (District),
5.3 (Regional), 15
days (TB), 286.5
days (Psych),
28.5 days
(Chronic), 9 days
(Tertiary), and 8.6
days (Central) by
March 2020
2. Average length
of stay - total
DHIS Quarterly
Days
6.1 Days 6.3 Days 6.1 Days 5.7 Days 5.6 Days 5.4 Days 5.4 Days -
Inpatient days -total Midnight
Census
No 1 903 406 1 899 919 1 650 8892 1 765 266 1 700 364 1 647 884 1 647 884
½ Day Patients Admission/
Discharge
Register
No 47 986 49 528 46 173 52 286 53 569 55 712 55 712
Inpatient separations
total
Admission,
Discharge,
Death
Registers
No 316 900 305 850 274 589 321 626 315 556 317 151 317 151
110 Only 4 hospitals (as opposed to 13) conducted self-assessments 111 Rate is lower because all hospitals are included in denominator (expectation that 100% of hospital conduct self-assessments)
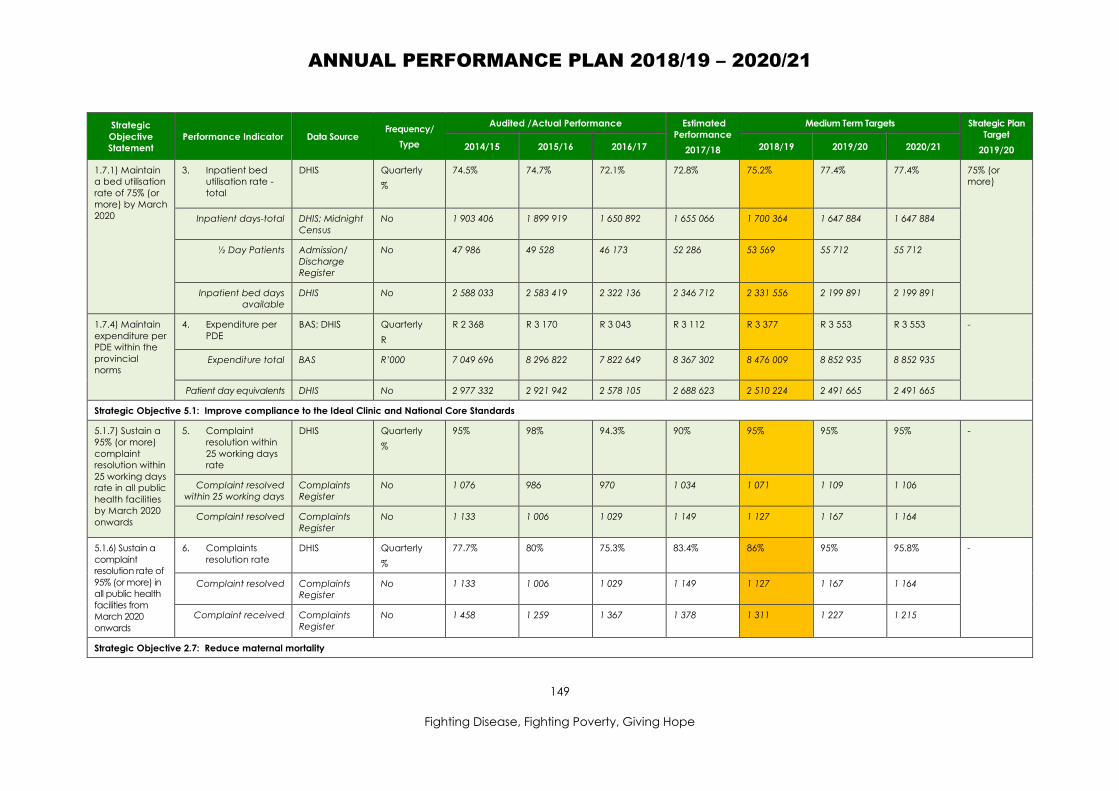
ANNUAL PERFORMANCE PLAN 2018/19 – 2020/21
149
Fighting Disease, Fighting Poverty, Giving Hope
Strategic
Objective
Statement
Performance Indicator Data Source Frequency/
Type
Audited /Actual Performance Estimated
Performance
2017/18
Medium Term Targets Strategic Plan
Target
2019/20 2014/15 2015/16 2016/17 2018/19 2019/20 2020/21
1.7.1) Maintain
a bed utilisation
rate of 75% (or
more) by March
2020
3. Inpatient bed
utilisation rate -
total
DHIS Quarterly
%
74.5% 74.7% 72.1% 72.8% 75.2% 77.4% 77.4% 75% (or
more)
Inpatient days-total DHIS; Midnight
Census
No 1 903 406 1 899 919 1 650 892 1 655 066 1 700 364 1 647 884 1 647 884
½ Day Patients Admission/
Discharge
Register
No 47 986 49 528 46 173 52 286 53 569 55 712 55 712
Inpatient bed days
available
DHIS No 2 588 033 2 583 419 2 322 136 2 346 712 2 331 556 2 199 891 2 199 891
1.7.4) Maintain
expenditure per
PDE within the
provincial
norms
4. Expenditure per
PDE
BAS; DHIS Quarterly
R
R 2 368 R 3 170 R 3 043 R 3 112 R 3 377 R 3 553 R 3 553 -
Expenditure total BAS R’000 7 049 696 8 296 822 7 822 649 8 367 302 8 476 009 8 852 935 8 852 935
Patient day equivalents DHIS No 2 977 332 2 921 942 2 578 105 2 688 623 2 510 224 2 491 665 2 491 665
Strategic Objective 5.1: Improve compliance to the Ideal Clinic and National Core Standards
5.1.7) Sustain a
95% (or more)
complaint
resolution within
25 working days
rate in all public
health facilities
by March 2020
onwards
5. Complaint
resolution within
25 working days
rate
DHIS Quarterly
%
95% 98% 94.3% 90% 95% 95% 95% -
Complaint resolved
within 25 working days
Complaints
Register
No 1 076 986 970 1 034 1 071 1 109 1 106
Complaint resolved Complaints
Register
No 1 133 1 006 1 029 1 149 1 127 1 167 1 164
5.1.6) Sustain a
complaint
resolution rate of
95% (or more) in
all public health
facilities from
March 2020
onwards
6. Complaints
resolution rate
DHIS Quarterly
%
77.7% 80% 75.3% 83.4% 86% 95% 95.8% -
Complaint resolved Complaints
Register
No 1 133 1 006 1 029 1 149 1 127 1 167 1 164
Complaint received Complaints
Register
No 1 458 1 259 1 367 1 378 1 311 1 227 1 215
Strategic Objective 2.7: Reduce maternal mortality

ANNUAL PERFORMANCE PLAN 2018/19 – 2020/21
150
Fighting Disease, Fighting Poverty, Giving Hope
Strategic
Objective
Statement
Performance Indicator Data Source Frequency/
Type
Audited /Actual Performance Estimated
Performance
2017/18
Medium Term Targets Strategic Plan
Target
2019/20 2014/15 2015/16 2016/17 2018/19 2019/20 2020/21
2.7.2) Reduce
the caesarean
section rate to
27.5% (District),
37% (Regional),
60% (Tertiary),
and 67% or less
(Central) by
March 2020
7. Delivery by
caesarean section
rate
DHIS Quarterly
%
39.2% 41.7% 41.2% 39.4% 39% 37% 37% -
Delivery by caesarean
section
Theatre &
Delivery
Registers
No 31 082 29 551 26 260 28 790 28 571 25 898 25 777
Delivery in facility total Theatre &
Delivery
Registers
No 79 386 70 882 63 791 72 998 73 261 69 997 69 667
Strategic Objective 1.7: Improve hospital efficiencies
1.7.5) Reduce
the unreferred
outpatient
department
(OPD)
headcounts by
at least 7% per
annum
8. OPD headcount -
total
DHIS; OPD Tick
Register
Quarterly
No
2 795 600 2 575 296 2 367 033 2 352 202 2 001 357 1 998 552 1 974 001 -
9. OPD headcount
new case not
referred
DHIS/ OPD Tick
Register
Quarterly
No
222 443 182 998 171 162 218 972 203 644112 189 389 176 132 -
112 Adjusted to 7% decrease from estimated performance

ANNUAL PERFORMANCE PLAN 2018/19 – 2020/21
151
Fighting Disease, Fighting Poverty, Giving Hope
2018/19 Targets
Table 56: (PHS2) Quarterly and Annual Targets
Performance Indicators Frequency Type
Annual
Target
2018/19
Targets
Q1 Q2 Q3 Q4 Annual
1. Hospital achieved
75% and more on
National Core
Standards self-
assessment rate
Quarterly
Cumulative
% 46.2% 7.7% 15.4% 30.7% 46.2% 46.2%
2. Average length of
stay – total
Quarterly Days 5.6 Days 5.7 Days 5.7 Days 5.6 Days 5.6 Days 5.6 Days
3. Inpatient bed
utilisation rate –
total
Quarterly % 75.2% 73% 73.5% 74.5% 75.2% 75.2%
4. Expenditure per
PDE
Quarterly R R 3 377 R 3 119 R 3 253 R 3 321 R 3 377 R 3 377
5. Complaint
resolution within 25
working days rate
Quarterly % 95% 91% 92% 93% 95% 95%
6. Complaints
resolution rate
Quarterly % 86% 83% 84% 85% 86% 86%
7. Delivery by
caesarean section
rate
Quarterly % 39% 39% 39% 39% 39% 39%
8. OPD headcount -
total
Quarterly No 2 001 357 500 339 500 339 500 339 500 340 2 001 357
9. OPD headcount
new case not
referred
Quarterly No 203 644 50 911 50 911 50 911 50 911 203 644

ANNUAL PERFORMANCE PLAN 2018/19 – 2020/21
152
Fighting Disease, Fighting Poverty, Giving Hope
Sub-Programme: Specialised TB Hospitals
2018/19 Priorities
Priorities Key Focus Areas
Improve efficiencies and quality of
Specialised TB Hospitals
Implement the approved Specialised TB Hospital
Rationalisation Plan and actively monitor progress.
Review integrated service arrangements for Decentralised
Drug-Resistant TB Units to improve access to services at
district level.
Implement and monitor progress of Essential Post List Project
recommendations.
Review service arrangements for SANTA and State Aided TB
Hospitals and develop Business Plans for approval and
implementation.
Improve quality of care and clinical governance within
Quality Assurance Policy Framework.
Scale up implementation of National Core Standards with
focus on self-assessment and Quality Improvement Plans.
Collaborate with Infrastructure Development for inclusion of
infrastructure projects in approved 10-year plan.

ANNUAL PERFORMANCE PLAN 2018/19 – 2020/21
153
Fighting Disease, Fighting Poverty, Giving Hope
Strategic Objectives, Indicators & Targets
Table 57: (PHS3 a) Strategic Objectives, Indicators and Targets
Strategic
Objective
Statement
Performance
Indicator Data Source
Frequency/
Type
Audited /Actual Performance Estimated
Performance
2017/18
Medium Term Targets Strategic
Plan Target
2019/20 2014/15 2015/16 2016/17 2018/19 2019/20 2020/21
Strategic Objective 5.1: Improve compliance to the Ideal Clinic and National Core Standards
5.1.2) 60% (or
more) public
health hospitals
achieved 75%
or more on
NCS self-
assessment
rate by March
2020
1. Hospital
achieved 75%
and more on
NCS self-
assessment rate
DHIS Quarterly
%
Not
reported
Not
reported
Not
reported
50% 40%113 60% 70% 60% or more
Hospital achieved
75% and more on
NCS self-assessment
Assessment
Records
No - - - 1 4 6 7
Hospitals conducted
NCS self-assessment
Assessment
Records
No - - - 2 10 10 10
5.1.7) Sustain a
95% (or more)
complaint
resolution
within 25
working days
rate in all
public health
facilities by
March 2020
onwards
2. Complaint
resolution within
25 working days
rate
DHIS Quarterly
%
98.1% 93.4% 94.3% 95% 96.5% 96.6% 97.7% -
Complaint resolved
within 25 working
days
Complaints
Register
No 101 128 60 76 83 86 85
Complaint resolved Complaints
Register
No 103 137 62 80 86 89 87
Strategic Objective 1.7: Improve hospital efficiencies
5.1.6) Sustain a
complaint
resolution rate
of 95% (or
more) in all
public health
facilities from
March 2020
onwards
3. Complaints
resolution rate
DHIS Quarterly
%
29.8% 19.1% 75.3% 75.5% 86.9% 94.7% 94.6%
Complaint resolved Complaints
Register
No 103 137 62 80 86 89 87
Complaint received Complaints
Register
No 345 716 86 106 99 94 92
113 Lower percentage as denominator increased from 2 to 10 hospitals conducting self-assessments

ANNUAL PERFORMANCE PLAN 2018/19 – 2020/21
154
Fighting Disease, Fighting Poverty, Giving Hope
Strategic
Objective
Statement
Performance
Indicator Data Source
Frequency/
Type
Audited /Actual Performance Estimated
Performance
2017/18
Medium Term Targets Strategic
Plan Target
2019/20 2014/15 2015/16 2016/17 2018/19 2019/20 2020/21
1.7.3) Improve
hospital
efficiencies by
reducing the
average length
of stay to at
least 5.5 days
(District), 5.3
(Regional), 15
days (TB), 286.5
days (Psych),
25.8 days
(Chronic), 9
days (Tertiary),
and 8.6 days
(Central) by
March 2020
4. Average length
of stay – total
DHIS Quarterly
Days
16.5 Days 17.2 Days 48.4 Days 56.5 Days 40.1 Days 38.9 Days 37.6 Days -
Inpatient days-
total
Midnight
Census
No 411 283 331 547 159 750 143 994 143 885 142 988 142 756
½ Day Patients Admission/
Discharge
Register
No 536 733 550 34 36 38 42
Inpatient
separations
total
Admission/
Discharge
Register
No 24 961 19 307 3 306 2 548 3 591 3 678 3 799
1.7.1) Maintain
a bed
utilisation rate
of 75% (or
more) by
March 2020
5. Inpatient bed
utilisation rate –
total
DHIS Quarterly
%
57% 56.2% 42.6% 53.8% 56.2%114 56% 57.3% 75% (or
more)
Inpatient days-total Midnight
Census
No 411 283 331 547 159 570 143 994 143 885 142 988 142 756
½ Day Patients Admission/
Discharge
Register
No 536 733 550 34 36 38 42
Inpatient bed days
available
DHIS No 722 396 591 152 374 490 267 879 256 221 255 348 249 002
1.7.4) Maintain
expenditure
per PDE within
the provincial
norms
6. Expenditure per
PDE 115
BAS; DHIS Quarterly
R
R 1 300 R1 613 R 4 742 R 2 184 R 2 932 R 3 129 R 3 256 -
Total expenditure TB
Hospitals
BAS R’000 673 274 734 142 776 902 385 025 884 431 933 961 959 319
Patient day
equivalents
DHIS No 518 023 426 465 163 828 176 290 301 649 298 446 294 631
1.7.5) Reduce
the unreferred
OPD
7. OPD
headcount –
total
DHIS; OPD
Tick Register
Quarterly
No
294 629 255 718 94 969 199 224 198 872 179 987 168 856 -
114 Rationalisation of TB Hospitals (SANTA) will have an impact on available beds which will increase the bed utilisation rate 115 For planning purposes, NHLS costs for GeneXpert and NPI’s have been included in the projected budget figures

ANNUAL PERFORMANCE PLAN 2018/19 – 2020/21
155
Fighting Disease, Fighting Poverty, Giving Hope
Strategic
Objective
Statement
Performance
Indicator Data Source
Frequency/
Type
Audited /Actual Performance Estimated
Performance
2017/18
Medium Term Targets Strategic
Plan Target
2019/20 2014/15 2015/16 2016/17 2018/19 2019/20 2020/21
headcounts by
at least 7% per
annum
8. OPD headcount
new case not
referred
DHIS/OPD
tick Register
Quarterly
No
54 505 30 637 9 136 25 997 24 172116 22 486 20 912 -
116 Based on 7% reduction

ANNUAL PERFORMANCE PLAN 2018/19 – 2020/21
156
Fighting Disease, Fighting Poverty, Giving Hope
2018/19 Targets
Table 58: (PHS4 a) Quarterly and Annual Targets
Performance Indicators Frequency Type
Annual
Target
2018/19
Target
Q1 Q2 Q3 Q4 Annual
1. Hospital achieved
75% and more on
National Core
Standards self-
assessment rate
Quarterly % 40% 0% 20% 0% 20% 40%
2. Complaint resolution
within 25 working
days rate
Quarterly % 96.5% 95% 95% 96% 96.5% 96.5%
3. Complaints resolution
rate
Quarterly % 86.9% 79% 82% 85% 86.9% 86.9%
4. Average length of
stay – total
Quarterly Days 40.1 Days 40.1 Days 40.1 Days 40.1 Days 40.1 Days 40.1 Days
5. Inpatient bed
utilisation rate – total
Quarterly % 56.2% 54.5% 55% 55.5% 56.2% 56.2%
6. Expenditure per PDE Quarterly R R 2 932 R 2 682 R 2 790 R 2 900 R 2 932 R 2 932
7. OPD headcount -
total
Quarterly No 198 872 49 718 49 718 49 718 49 718 198 872
8. OPD headcount new
case not referred
Quarterly No 24 172 6 043 6 043 6 043 6 043 24 172

ANNUAL PERFORMANCE PLAN 2018/19 – 2020/21
157
Fighting Disease, Fighting Poverty, Giving Hope
Sub-Programme: Specialised Psychiatric Hospitals
2018/19 Priorities
Priorities Key Focus Areas
Improve access, equity, quality and
efficiencies of Specialised Psychiatric
Hospitals
Finalise & implement the Mental Health Strategy
Implementation Plan.
Implement the approved Rationalisation Plan for
Psychiatric Hospitals and monitor progress.
Implement a recruitment strategy for Specialists to improve
access & coverage for specialised services.
Improve quality of care and clinical governance – within
the Clinical Governance Policy Framework.
Scale up implementation of the National Core Standards
with focus on self-assessment and Quality Improvement
Programmes.
Increase availability of 72-hour observation services at
identified District Hospitals (10-year Infrastructure Plan).
Assessment of hospital efficiencies to inform optimization of
resources – rationalisation of services.

ANNUAL PERFORMANCE PLAN 2018/19 – 2020/21
158
Fighting Disease, Fighting Poverty, Giving Hope
Strategic Objectives, Indicators & Targets
Table 59: (PHS3 b) Strategic Objectives, Indicators and Targets
Strategic
Objective
Statement
Performance Indicator Data Source Frequency/
Type
Audited /Actual Performance Estimated
Performance
2017/18
Medium Term Targets Strategic Plan
Target
2019/20 2014/15 2015/16 2016/17 2018/19 2019/20 2020/21
Strategic Objective 5.1: Improve compliance to the Ideal Clinic and National Core Standards
5.1.2) 60% (or
more) public
health hospitals
achieved 75%
or more on NCS
self-assessment
rate by March
2020
1. Hospital
achieved 75%
and more on
NCS self-
assessment rate
DHIS Quarterly
%
Not reported Not reported Not reported 17% 33% 60% 66.7% 60% or more
Hospital achieved 75%
and more on NCS self-
assessment
Assessment
Records
No - - - 1 2 3 4
Hospitals conducted
NCS self-assessment
Assessment
Records
No - - - 6 6 6 6
5.1.7) Sustain a
95% (or more)
complaint
resolution within
25 working days
rate in all public
health facilities
by March 2020
onwards
2. Complaint
resolution within
25 working days
rate
DHIS Quarterly
%
62.7% 83.3% 100% 87.9% 90.6% 95.5% 95.5% -
Complaint resolved
within 25 days
Complaints
Register
No 37 50 55 58 58 63 64
Complaint resolved Complaints
Register
No 59 60 55 66 64 66 67
5.1.6) Sustain a
complaint
resolution rate of
95% (or more) in
all public health
facilities from
March 2020
onwards
3. Complaints
resolution rate
DHIS Quarterly
%
93.7% 93.8% 98.2% 95.7% 97% 97.1% 98.5%
Complaint resolved Complaints
Register
No 60 60 55 66 64 66 67
Complaint received Complaints
Register
No 64 64 56 69 66 68 68
Strategic Objective 1.7: Improve hospital efficiencies
1.7.3) Improve
hospital
4. Average length
of stay – total
DHIS Quarterly
Days
305.8 Days 296.8 Days 291.1 Days 279.4 Days 289.2 Days 290.6 Days 290.6 Days -

ANNUAL PERFORMANCE PLAN 2018/19 – 2020/21
159
Fighting Disease, Fighting Poverty, Giving Hope
Strategic
Objective
Statement
Performance Indicator Data Source Frequency/
Type
Audited /Actual Performance Estimated
Performance
2017/18
Medium Term Targets Strategic Plan
Target
2019/20 2014/15 2015/16 2016/17 2018/19 2019/20 2020/21
efficiencies by
reducing the
average length
of stay to at least
5.5 days (District),
5.3 (Regional), 15
days (TB), 286.5
days (Psych),
25.8 days
(Chronic), 9 days
(Tertiary), and 8.6
days (Central) by
March 2020
Inpatient days-
total
Midnight
Census
No 627 724 621 164 638 302 637 648 627 229 627 209 627 209
½ Day Patients Admission/
Discharge
Register
No 2 0 15 18 0 0 0
Inpatient
separations total
Admission/
Discharge
Register
No 2 053 2 093 2 206 2 282 2 169 2 158 2 158
1.7.1) Maintain
a bed utilisation
rate of 75% (or
more)by March
2020
5. Inpatient bed
utilisation rate –
total
DHIS Quarterly
%
70.4% 67.5% 71.2% 71.8% 72.1% 75.4% 75.4% 75% (or
more)
Inpatient days-total Midnight
Census
No 627 724 621 164 638 302 637 648 627 229 627 209 627 209
½ Day Patients Admission/
Discharge
Register
No 2 0 15 18 0 0 0
Inpatient bed days
available
DHIS No 891 573 920 540 897 710 887 707 869 689 831 540 831 540
1.7.4) Maintain
expenditure per
PDE within the
provincial norms
6. Expenditure per
PDE
BAS; DHIS Quarterly
R
R 1 189 R 1 257 R 1 284 R 1 297 R 1 311 R 1 326 R 1 382 -
Total expenditure
Psychiatric Hospitals
BAS R’000 753 353 788 178 825 338 833 210 843 240 856 339 884 237
Patient day equivalents DHIS No 633 444 626 751 642 871 642 456 643 349 645 742 640 003
1.7.5) Reduce
the unreferred
OPD
headcounts by
at least 7% per
annum
7. OPD headcount
– total
DHIS; OPD
Tick Register
Quarterly
No
17 020 16 220 11 596 13 688 13 592 13 446 13 391 -
8. OPD headcount
new case not
referred
DHIS; OPD Tick
Register
Quarterly
No
1 032 1 587 1 037 1 002 932 867 807 -

ANNUAL PERFORMANCE PLAN 2018/19 – 2020/21
160
Fighting Disease, Fighting Poverty, Giving Hope
2018/19 Targets
Table 60: (PHS4 b) Quarterly and Annual Targets
Performance Indicators Frequency Type
Annual
Target
2018/19
Targets
Q1 Q2 Q3 Q4 Annual
1. Hospital achieved
75% and more on
NCS self-
assessment rate
Quarterly % 33% 0% 0% 16% 33% 33%
2. Complaint
resolution within
25 working days
rate
Quarterly % 90.6% 88% 88.5% 89.5% 90.6% 90.6%
3. Complaints
resolution rate
Quarterly % 97% 96% 96% 96.5% 97% 97%
4. Average length
of stay – total
Quarterly Days 289.2 Days 290 Days 290 Days 289.2 Days 289.2 Days 289.2 Days
5. Inpatient bed
utilisation rate –
total
Quarterly % 72.1% 71.9% 72% 72% 72.1% 72.1%
6. Expenditure per
PDE
Quarterly R R 1 311 R 1 310 R 1 310 R 1 310 R 1 311 R 1 311
7. OPD headcount -
total
Quarterly No 13 592 3 398 3 398 3 398 3 398 13 592
8. OPD headcount
new case not
referred
Quarterly No 932 233 233 233 233 932

ANNUAL PERFORMANCE PLAN 2018/19 – 2020/21
161
Fighting Disease, Fighting Poverty, Giving Hope
Sub-Programme: Chronic/ Sub-Acute Hospitals
2018/19 Priorities
Priorities Key Focus Areas
Improve hospital efficiencies and
quality through implementation of
the approved Rationalisation Plan
Review package of services of Clairwood Hospital.
Make provision for Palliative Care beds.
Improve quality of care within Clinical Governance Policy
Framework.
Scale up implementation of the National Core Standards
with focus on self-assessment and implementation of
Quality Improvement Plans.

ANNUAL PERFORMANCE PLAN 2018/19 – 2020/21
162
Fighting Disease, Fighting Poverty, Giving Hope
Strategic Objectives, Indicators & Targets
Table 61: (PHS3 c) Strategic Objectives, Indicators and Targets
Strategic
Objective
Statement
Performance Indicator Data Source Frequency
Type
Audited /Actual Performance Estimated
Performance
2017/18
Medium Term Targets Strategic Plan
Target
2019/20 2014/15 2015/16 2016/17 2018/19 2019/20 2020/21
Strategic Objective 5.1: Improve compliance to the Ideal Clinic and National Core Standards
5.1.2) 60% (or
more) public
health hospitals
compliant with
extreme and
vital measures
of the NCS by
March 2020
1. Hospital
achieved 75%
and more on
NCS self-
assessment rate
DHIS Quarterly
%
Not reported Not reported Not reported 50% 100% 100% 100% 60% or more
-
Hospital achieved 75%
and more on NCS self-
assessment
Assessment
Records
No - - - 1 2 2 2
Hospitals conducted
NCS self-assessment
Assessment
Records
No - - - 2 2 2 2
5.1.7) Sustain a
95% (or more)
complaint
resolution within
25 working days
rate in all public
health facilities
by March 2020
onwards
2. Complaint
resolution within
25 working days
rate
DHIS Quarterly
%
98.8% 100% 100% 100% 100% 100% 100% -
Complaint resolved
within 25 days
Complaints
Register
No 83 60 55 58 57 57 56
Complaint resolved Complaints
Register
No 84 60 55 58 57 57 56
5.1.6) Sustain a
complaint
resolution rate of
95% (or more) in
all public health
facilities from
March 2020
onwards
3. Complaints
resolution rate
DHIS Quarterly
%
80.8% 93.8% 98.2% 98.3% 98.3% 98.3% 98.2% -
Complaint resolved Complaints
Register
No 84 60 55 58 57 57 56
Complaint received Complaints
Register
No 104 64 56 59 58 58 57
Strategic Objective 1.7: Improve hospital efficiencies
1.7.3) Improve
hospital
4. Average length
of stay – total
DHIS Quarterly
Days
30.5 Days 38.7 Days 32.3 Days 35.7 Days 33.8 Days 28.5 Days 28.5 Days -

ANNUAL PERFORMANCE PLAN 2018/19 – 2020/21
163
Fighting Disease, Fighting Poverty, Giving Hope
Strategic
Objective
Statement
Performance Indicator Data Source Frequency
Type
Audited /Actual Performance Estimated
Performance
2017/18
Medium Term Targets Strategic Plan
Target
2019/20 2014/15 2015/16 2016/17 2018/19 2019/20 2020/21
efficiencies by
reducing the
average length
of stay to at least
5.5 days (District),
5.3 (Regional), 15
days (TB), 286.5
days (Psych),
28.5 days
(Chronic), 9 days
(Tertiary), and 8.6
days (Central) by
March 2020
Inpatient days-total Midnight
Census
No 108 954 105 247 99 887 96 626 104 700 114 998 114 998
½ Day patients Admission/
Discharge
Register
No 0 0 9 0 0 0 0
Inpatient separations
total
Admission/
Discharge
Register
No 3 577 2 720 3 089 2 706 3 098 4 030 4 030
1.7.1) Maintain
a bed utilisation
rate of 75% (or
more)by March
2020
5. Inpatient bed
utilisation rate –
total
DHIS Quarterly
%
56.9% 55.2% 52.1% 54.8% 65.6% 74.5% 75% 75% (or
more)
Inpatient days-total Midnight
Census
No 108 954 105 247 99 887 98 626 104 700 114 998 114 998
½ Day Patients Admission/
Discharge
Register
No 0 0 9 0 0 0 0
Inpatient bed days
available
DHIS No 191 625 190 733 191 625 179 823 159 544 153 400 153 400
1.7.4) Maintain
expenditure per
PDE within the
provincial norms
6. Expenditure per
PDE
BAS; DHIS Quarterly
R
R 1 816 R2 299 R 2 548 R 2 711 R 2 727 R 2 735 R 2 748 -
Total expenditure –
Chronic Hospitals
BAS R’000 301 941 361 110 378 575 388 445 399 778 400 118 401 228
Patient day equivalent DHIS No 166 243 157 033 148 588 143 294 146 622 146 299 146 002
1.7.5) Reduce
the unreferred
OPD
headcounts by
at least 7% per
annum
7. OPD headcount
– total
DHIS; OPD
Tick Register
Quarterly
No
171 451 154 990 145 949 141 559 139 872 132 885 131 996 -
8. OPD headcount
new cases not
referred
DHIS; OPD
Tick Register
Quarterly
No
65 964 51 071 48 667 48 069 44 702 41 576 38 666 -
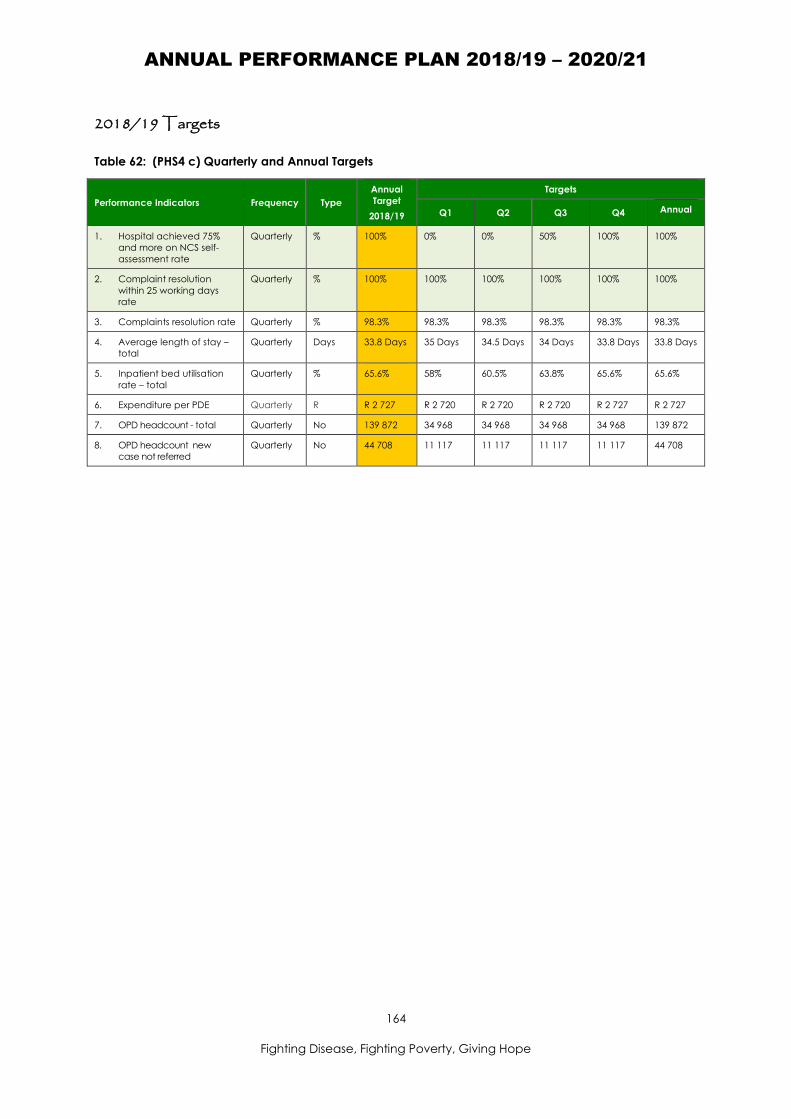
ANNUAL PERFORMANCE PLAN 2018/19 – 2020/21
164
Fighting Disease, Fighting Poverty, Giving Hope
2018/19 Targets
Table 62: (PHS4 c) Quarterly and Annual Targets
Performance Indicators Frequency Type
Annual
Target
2018/19
Targets
Q1 Q2 Q3 Q4 Annual
1. Hospital achieved 75%
and more on NCS self-
assessment rate
Quarterly % 100% 0% 0% 50% 100% 100%
2. Complaint resolution
within 25 working days
rate
Quarterly % 100% 100% 100% 100% 100% 100%
3. Complaints resolution rate Quarterly % 98.3% 98.3% 98.3% 98.3% 98.3% 98.3%
4. Average length of stay –
total
Quarterly Days 33.8 Days 35 Days 34.5 Days 34 Days 33.8 Days 33.8 Days
5. Inpatient bed utilisation
rate – total
Quarterly % 65.6% 58% 60.5% 63.8% 65.6% 65.6%
6. Expenditure per PDE Quarterly R R 2 727 R 2 720 R 2 720 R 2 720 R 2 727 R 2 727
7. OPD headcount - total Quarterly No 139 872 34 968 34 968 34 968 34 968 139 872
8. OPD headcount new
case not referred
Quarterly No 44 708 11 117 11 117 11 117 11 117 44 708

ANNUAL PERFORMANCE PLAN 2018/19 – 2020/21
165
Fighting Disease, Fighting Poverty, Giving Hope
Sub-Programme Oral and Dental Training Centre
2018/19 Targets
Priorities Key Focus Areas
Implement the Oral Health Training
Strategy to improve access to oral &
dental health services
Manage appropriate training initiatives to improve access
and quality of Oral Health services.
Increase the number of dentures issued per annum.
Strengthen the partnership with UKZN to improve Oral and
Dental Health Services.

ANNUAL PERFORMANCE PLAN 2018/19 – 2020/21
166
Fighting Disease, Fighting Poverty, Giving Hope
Strategic Objectives, Indicators and Targets
Table 63: Strategic Objectives, Indicators and Targets
Strategic
Objective
Statement
Performance Indicator Data Source Frequency
Type
Audited /Actual Performance Estimated
Performance
2017/18
Medium Term Targets Strategic Plan
Target
2019/20 2014/15 2015/16 2016/17 2018/19 2019/20 2020/21
Strategic Objective 5.1: Improve compliance to the Ideal Clinic and National Core Standards
4.1.12)
Strengthening
the dental
prosthesis and
training
platform
1. Number of
dentures issued
per annum
Dental
Register
Annual
Number
Not reported Not reported Not reported 250 300 350 400 -
2. Number of Oral
Hygienist and
Dental Therapists
trained per
annum
Training
Register
Annual
Number
Not reported Not reported Not reported 40 40 40 40
2018/19 Targets
Table 64: Quarterly and Annual Targets
Performance Indicators Frequency Type Annual Target
2018/19
Quarterly Targets Annual Targets
Q1 Q2 Q3 Q4
1. Number of dentures issued per annum Annual No 300 - - - - 300
2. Number of Oral Hygienist and Dental
Therapists trained per annum
Annual No 40 - - - - 40

ANNUAL PERFORMANCE PLAN 2018/19 – 2020/21
167
Fighting Disease, Fighting Poverty, Giving Hope
Reconciling Performance Targets with Expenditure Trends
Table 65: (PHS5 a) Summary of Payments and Estimates (R’000)
Sub-Programme Audited Expenditure Outcomes Main
Appropriation
Adjusted
Appropriation
Revised
Estimate Medium Term Expenditure Estimates
R’000 2014/15 2015/16 2016/17 2017/18 2018/19 2019/20 2020/21
General (Regional) Hospitals 6 727 470 7 311 976 7 822 649 8 468 660 8 526 093 8 657 907 8 874 356 9 480 008 10 199 494
Tuberculosis Hospitals 673 267 734 142 776 902 812 781 807 317 796 063 832 736 893 855 958 483
Psychiatric-Mental Hospitals 753 333 788 178 825 338 891 958 875 232 868 808 929 156 998 539 1 079 095
Sub-acute, Step-down and Chronic
Medical Hospitals
301 940 361 110 378 575 417 707 392 857 386 541 418 476 449 941 483 751
Dental Training Hospital 17 415 18 958 19 451 21 257 21 257 19 641 23 490 24 749 26 687
Sub-Total 8 473 425 9 214 364 9 822 915 10 612 363 10 622 756 10 728 960 11 078 214 11 847 092 12 747 510
Unauthorized expenditure (1st charge)
not available for spending
- - - - - - - - -
Baseline available for spending after 1st
charge
8 473 425 9 214 364 9 822 915 10 612 363 10 622 756 10 728 960 11 078 214 11 847 092 12 747 510
Table 66: (PHS5 b) Summary of payments and expenditure by Economic Classification (R’000)
Economic Classification Audited Expenditure Outcomes Main
Appropriation
Adjusted
Appropriation
Revised
Estimate Medium-Term Expenditure Estimates
R’000 2014/15 2015/16 2016/17 2017/18 2018/19 2019/20 2020/21
Current payments 8 316 935 9 047 148 9 621 228 10 433 135 10 266 749 10 360 621 10 735 631 11 476 311 12 350 923
Compensation of employees 6 505 622 6 989 676 7 442 082 7 997 996 7 838 241 7 763 049 8 262 835 8 920 704 9 654 757
Goods and services 1 811 170 2 056 552 2 178 854 2 435 135 2 426 701 2 595 225 2 472 792 2 555 603 2 696 162
Communication 20 856 19 520 20 514 20 941 19 265 19 519 20 281 21 296 22 467
Computer Services 165 6 224 - 9 9 9 9 9

ANNUAL PERFORMANCE PLAN 2018/19 – 2020/21
168
Fighting Disease, Fighting Poverty, Giving Hope
Economic Classification Audited Expenditure Outcomes Main
Appropriation
Adjusted
Appropriation
Revised
Estimate Medium-Term Expenditure Estimates
R’000 2014/15 2015/16 2016/17 2017/18 2018/19 2019/20 2020/21
Consultants, Contractors and special
services
157 806 162 024 485 553 601 647 662 807 762 703 629 996 618 905 652 946
Inventory 1 027 454 1 042 699 1 203 142 1 304 324 1 195 060 1 265 636 1 237 274 1 300 897 1 372 448
Operating leases 9 578 10 769 10 036 11 259 10 131 9 879 10 818 11 358 11 982
Travel and subsistence 5 118 4 561 3 123 3 882 2 501 2 231 2 490 2 616 2 760
Interest and rent on land 143 920 292 4 1 807 2 347 4 4 4
Maintenance, repair and running costs 16 685 16 330 - - - - - - -
Other including Assets<5000, training
and development, property payments,
operating expenditure and venues and
facilities
573 508 800 643 456 262 493 082 536 928 535 248 571 924 600 522 633 550
Transfers and subsidies to 124 026 134 412 193 032 143 360 240 139 277 693 225 447 228 509 246 490
Provinces and municipalities - - 101 - - - - - -
Departmental agencies and accounts 64 54 127 83 118 198 88 93 98
Universities and Technikons - - - - - - - - -
Non-profit institutions 31 646 28 255 32 557 34 843 34 843 27 468 5 169 5 479 5 643
Households 92 316 106 103 160 247 108 434 205 178 250 027 220 190 222 937 240 749
Payments for capital assets 32 459 30 385 8 655 35 868 115 868 90 646 117 136 142 272 150 097
Buildings and other fixed structures
Machinery and equipment 32 459 30 385 8 655 35 868 115 868 90 646 117 136 142 272 150 097
Software and other tangible assets - - - - - - - - -
Payment for financial assets 5 2 419 - - - - - - -
Total economic classification 8 473 425 9 214 364 9 822 915 10 612 363 10 622 756 10 728 960 11 078 214 11 847 092 12 747 510

ANNUAL PERFORMANCE PLAN 2018/19 – 2020/21
169
Fighting Disease, FIghting Poverty, Giving Hope
Performance and Expenditure Trends
Programme 4 (Provincial Hospital Services) is allocated 26.63 per cent of the total Vote 7 allocation for
2018/19 compared to 26.9 per cent of the revised estimate for 2017/18. This amounts to an increase of
R390 683 million.
Sub-programme 4.1 (General (Regional) Hospitals) is allocated 79.4 per cent of the Programme 4
budget for 2018/19 compared to 79.8 per cent of the revised estimate for 2017/18. This amounts to an
increase of R70 506 million.
Sub-programme 4.2 (TB Hospitals) is allocated 7.9 per cent of the Programme 4 budget for 2018/19
compared to 7.7 per cent of the revised estimate for 2017/18. This amounts to an increase of R70 506
million.
Sub-programme 4.3 (Psychiatric Hospitals) is allocated 8.6 per cent of the Programme 4 budget for
2018/19 remaining the same as allocation for revised estimate for 2017/18. This amounts to an increase
of R86 427 million.
Sub-programme 4.4 (Chronic/ Step-Down Hospitals) is allocated 3.8 per cent of the Programme 4
budget for 2018/19 compared to 3.9 per cent of the revised estimate for 2017/18. This amounts to an
increase of R17 660 million.
Sub-programme 4.5 (Dental Training Hospitals) is allocated 0.2 per cent of the Programme 4 budget for
2018/19 compared to 0.19 per cent of the revised estimate for 2017/18. This amounts to an increase of
R1 216 million.
Risk Management
Table 67: Risk Management
Potential Risks Mitigating Strategies
Budget constraints Robust monitoring of expenditure and use of limited resources.
Ensure cost containment and efficiency measures are in place
and strictly adhered to.
Vigilant control over the filling of posts as per Essential Post List.
Implement approved Hospital Rationalisation Plan.
Inadequate human
resources
Finalise the Essential Post List Project.
Strategy to improve retention of scarce skills.
Alignment of structures with function.
Inadequate hospital
information system
Prioritise hospital information system as part of the approved ICT
Strategy.
Improve review and utilisation of information.
Leadership and
management
Implement development and mentoring programme for Hospital
CEOs.
Medico legal litigation Strategy to improve management of litigation cases.

ANNUAL PERFORMANCE PLAN 2018/19 – 2020/21
170
Fighting Disease, Fighting Poverty, Giving Hope
NOTES
……………………………………………………………………………………………………………………………………
……………………………………………………………………………………………………………………………………
……………………………………………………………………………………………………………………………………
……………………………………………………………………………………………………………………………………
……………………………………………………………………………………………………………………………………
……………………………………………………………………………………………………………………………………
……………………………………………………………………………………………………………………………………
……………………………………………………………………………………………………………………………………
……………………………………………………………………………………………………………………………………
……………………………………………………………………………………………………………………………………
……………………………………………………………………………………………………………………………………
……………………………………………………………………………………………………………………………………
……………………………………………………………………………………………………………………………………
……………………………………………………………………………………………………………………………………
……………………………………………………………………………………………………………………………………
……………………………………………………………………………………………………………………………………
……………………………………………………………………………………………………………………………………

ANNUAL PERFORMANCE PLAN 2018/19 – 2020/21
171
Fighting Disease, Fighting Poverty, Giving Hope
PROGRAMME 5: CENTRAL AND TERTIARY HOSPITALS
Programme Purpose
To provide tertiary services and creates a platform for training of health professionals - there are no
changes to the Programme 5 structure.
Sub-Programme 5.1: Central Hospitals
Render highly specialised medical health tertiary and quaternary services on a national basis and serve
as platform for the training of health workers and research.
Sub-Programme 5.2: Tertiary Hospitals
To provide tertiary health services and creates a platform for the training of Specialist health
professionals.

ANNUAL PERFORMANCE PLAN 2018/19 – 2020/21
172
Fighting Disease, Fighting Poverty, Giving Hope
Strategic Objectives, Targets & Indicators (Tertiary & Central
Hospitals)
The Strategic Objectives, Objective Statements, Indicators and Targets from the Strategic Plan 2015-
2019 are the same for Tertiary and Central Hospitals. The table is therefore not repeated for Tertiary and
Central Hospitals.
The Hospital Rationalisation Plan (as component of the Turn-Around & Long Term Plan) will make
provision for specific strategic and operational priorities that will be specific to the different hospitals
and categories of hospitals. That will be unpacked once finalised and approved.
Table 68: Strategic Plan 2015-2019 Targets
Strategic
Goal
Strategic
Objective
Strategic Objective Statement Indicator Target
2019/20
Strategic
Goal 1:
Strengthen
health
system
effectiveness
1.7) Improve
hospital
efficiencies
1.7.1) Maintain a bed utilisation rate of
75% (or more) by March 2020
Inpatient bed
utilisation rate - total
75% (or
more)
1.7.2) Approved Hospital Rationalisation
Plan by September 2018 (Reviewed
2018/19)
Approved Hospital
Rationalisation Plan
Implement
approved
plan
Strategic
Goal 4:
Strengthen
human
resources for
health
4.1) Improve
human
resources for
health
4.1.3) Implement the Community Based
Training in a PHC Model in collaboration
with the University of KwaZulu-Natal with
Phase 1 pilot commencing in 2016/17
(included in Programme 1)
Community Based
Training in a PHC
Model
implement
Model
Strategic
Goal 5:
Improved
quality of
health care
5.1) Improve
compliance to
the Ideal Clinic
and NCS
5.1.2) 60% (or more) public health
hospitals achieved 75% and more on
NCS self-assessment rate by March 2020
(Reviewed 2017/18)
Hospitals achieved
75% and more on NCS
self-assessment rate
(Reviewed 2017/18)
60% (or
more)

ANNUAL PERFORMANCE PLAN 2018/19 – 2020/21
173
Fighting Disease, Fighting Poverty, Giving Hope
Sub-Programme: Tertiary Hospitals (Greys, King Edward Vlll &
Ngwelezana Hospitals)
2018/19 Priorities
Priorities Key Focus Areas
Improve access, efficiencies and
quality of services in Tertiary Hospitals
Implement the approved Rationalisation Plan to improve
equity in resource allocation and access to the tertiary
package of services.
Address identified service pressures e.g. oncology,
radiology, orthopaedic, nephrology & urology.
Review package of services and organisational structures
of King Edward Vlll and Ngwelezana Hospitals in line with
rationalisation of services.
Review the referral policy and system in line with
rationalisation of services – including EMS referral patterns.
Phased implementation of Bed Bureaus.
Standardise Clinical Outreach Programmes, oversight,
mentorship and development support.
Improving quality of care and clinical governance.
Implement Operation Clean Audit.
Implement National Core Standards with focus on self-
assessments and implementation of Quality Improvement
Plans to address identified gaps.
Implement hospital information system including
identification of core indicators/ data elements and
standardisation of registers and tools.

ANNUAL PERFORMANCE PLAN 2018/19 – 2020/21
174
Fighting Disease, Fighting Poverty, Giving Hope
Strategic Objectives, Indicators and Targets
Table 69: (C&THS1) Strategic Objectives, Indicators and Targets
Strategic
Objective
Statement
Performance Indicator Data Source Frequency
/ Type
Audited/ Actual Performance Estimated
Performance
2017/18
Medium Term Targets Strategic Plan
Targets
2019/20 2014/15 2015/16 2016/17 2018/19 2019/20 2020/21
Strategic Objective 5.1: Improve compliance to the Ideal Clinic and National Core Standards
5.1.2) 60% (or
more) public
health hospitals
achieved 75%
or more on NCS
self-assessment
rate by March
2020
1. Hospital
achieved 75%
and more on
NCS self-
assessment rate
DHIS Quarterly
%
Not reported Not reported Not reported 0% 66% 100% 100% 60% or more
Hospital achieved 75%
and more on NCS
self-assessment
Assessment
Records
No - - - 0 2 3 3
Hospitals conducted
National Core
Standards self-
assessment
Assessment
Records
No - - - 0 3 3 3
Strategic Objective 1.7: Improve hospital efficiencies
1.7.3) Improve
hospital
efficiencies by
reducing the
average length
of stay to at least
5.5 days (District),
5.3 (Regional), 15
days (TB), 286.5
days (Psych), 28.5
days (Chronic), 9
days (Tertiary),
and 8.6 days
(Central) by
March 2020
2. Average length of
stay - total
DHIS Quarterly
Days
9.6 Days 9.6 Days 7.7 Days 9.3 Days 9.4 Days 9.4 Days 9.4 Days -
Inpatient days-total Midnight
Census
No 297 816 262 345 454 218 286 791 278 885 270 215 269 997
½ Day Patients Admission/
Discharge
Register
No 9 781 12 100 20 037 16 148 15 641 15 310 15 105
Inpatient separations
total
Admission/
Discharge
Register
No 31 668 28 840 60 670 32 441 31 217
30 452 30 302
1.7.1) Maintain
a bed utilisation
rate of 75% (or
3. Inpatient bed
utilisation rate -
total
DHIS Quarterly
%
83.4% 77.8% 71,6% 70% 75% 76.5% 76.5% 75% (or
more)
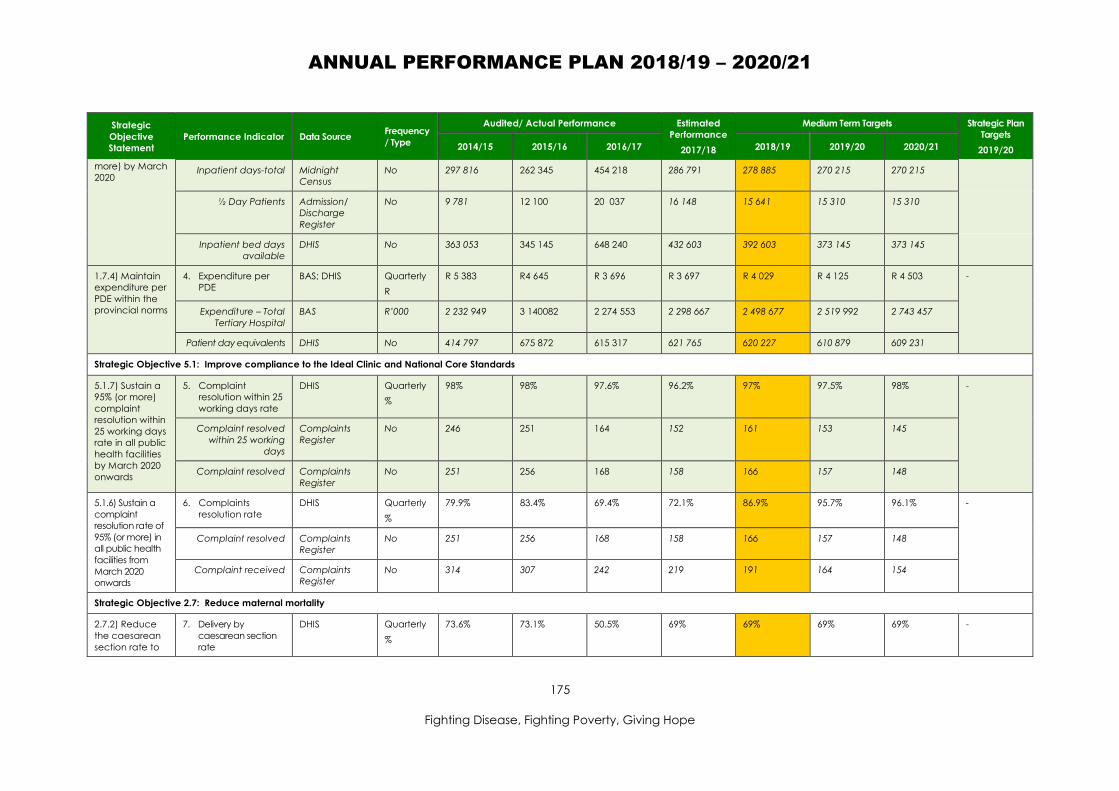
ANNUAL PERFORMANCE PLAN 2018/19 – 2020/21
175
Fighting Disease, Fighting Poverty, Giving Hope
Strategic
Objective
Statement
Performance Indicator Data Source Frequency
/ Type
Audited/ Actual Performance Estimated
Performance
2017/18
Medium Term Targets Strategic Plan
Targets
2019/20 2014/15 2015/16 2016/17 2018/19 2019/20 2020/21
more) by March
2020 Inpatient days-total Midnight
Census
No 297 816 262 345 454 218 286 791 278 885 270 215 270 215
½ Day Patients Admission/
Discharge
Register
No 9 781 12 100 20 037 16 148 15 641 15 310 15 310
Inpatient bed days
available
DHIS No 363 053 345 145 648 240 432 603 392 603 373 145 373 145
1.7.4) Maintain
expenditure per
PDE within the
provincial norms
4. Expenditure per
PDE
BAS; DHIS Quarterly
R
R 5 383 R4 645 R 3 696 R 3 697 R 4 029 R 4 125 R 4 503 -
Expenditure – Total
Tertiary Hospital
BAS R’000 2 232 949 3 140082 2 274 553 2 298 667 2 498 677 2 519 992 2 743 457
Patient day equivalents DHIS No 414 797 675 872 615 317 621 765 620 227 610 879 609 231
Strategic Objective 5.1: Improve compliance to the Ideal Clinic and National Core Standards
5.1.7) Sustain a
95% (or more)
complaint
resolution within
25 working days
rate in all public
health facilities
by March 2020
onwards
5. Complaint
resolution within 25
working days rate
DHIS Quarterly
%
98% 98% 97.6% 96.2% 97% 97.5% 98% -
Complaint resolved
within 25 working
days
Complaints
Register
No 246 251 164 152 161 153 145
Complaint resolved Complaints
Register
No 251 256 168 158 166 157 148
5.1.6) Sustain a
complaint
resolution rate of
95% (or more) in
all public health
facilities from
March 2020
onwards
6. Complaints
resolution rate
DHIS Quarterly
%
79.9% 83.4% 69.4% 72.1% 86.9% 95.7% 96.1% -
Complaint resolved Complaints
Register
No 251 256 168 158 166 157 148
Complaint received Complaints
Register
No 314 307 242 219 191 164 154
Strategic Objective 2.7: Reduce maternal mortality
2.7.2) Reduce
the caesarean
section rate to
7. Delivery by
caesarean section
rate
DHIS Quarterly
%
73.6% 73.1% 50.5% 69% 69% 69% 69% -
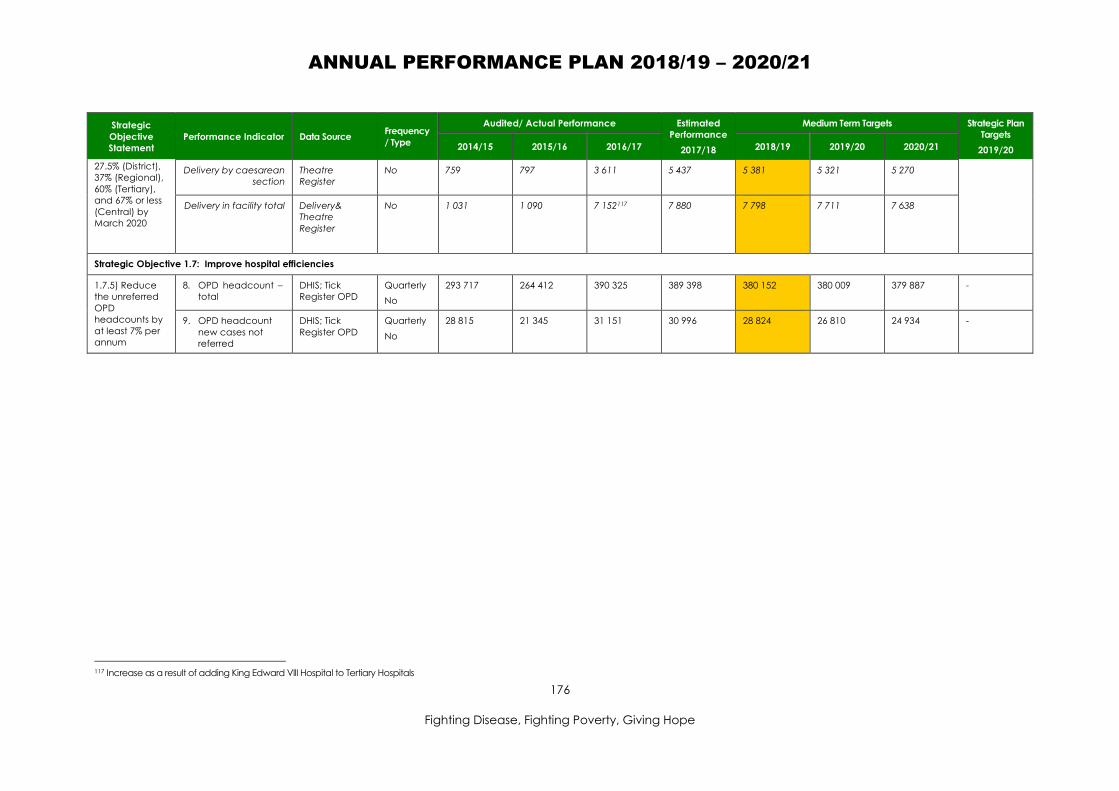
ANNUAL PERFORMANCE PLAN 2018/19 – 2020/21
176
Fighting Disease, Fighting Poverty, Giving Hope
Strategic
Objective
Statement
Performance Indicator Data Source Frequency
/ Type
Audited/ Actual Performance Estimated
Performance
2017/18
Medium Term Targets Strategic Plan
Targets
2019/20 2014/15 2015/16 2016/17 2018/19 2019/20 2020/21
27.5% (District),
37% (Regional),
60% (Tertiary),
and 67% or less
(Central) by
March 2020
Delivery by caesarean
section
Theatre
Register
No 759 797
3 611 5 437 5 381 5 321 5 270
Delivery in facility total Delivery&
Theatre
Register
No 1 031 1 090 7 152117 7 880 7 798 7 711 7 638
Strategic Objective 1.7: Improve hospital efficiencies
1.7.5) Reduce
the unreferred
OPD
headcounts by
at least 7% per
annum
8. OPD headcount –
total
DHIS; Tick
Register OPD
Quarterly
No
293 717 264 412 390 325 389 398 380 152 380 009 379 887 -
9. OPD headcount
new cases not
referred
DHIS; Tick
Register OPD
Quarterly
No
28 815 21 345 31 151 30 996 28 824 26 810 24 934 -
117 Increase as a result of adding King Edward Vlll Hospital to Tertiary Hospitals

ANNUAL PERFORMANCE PLAN 2018/19 – 2020/21
177
Fighting Disease, Fighting Poverty, Giving Hope
2018/19 Targets
Table 70: (THS2) Quarterly and Annual Targets
Performance Indicators Frequency Type
Annual
Target
2018/19
Target
Q1 Q2 Q3 Q4 Annual
1. Hospital achieved 75%
and more on NCS self-
assessment rate
Quarterly % 66% 0% 0% 33% 66% 66%
2. Average length of stay –
total
Quarterly Days 9.4 Days 9.4 Days 9.4 Days 9.4 Days 9.4 Days 9.4 Days
3. Inpatient bed utilisation
rate – total
Quarterly % 75% 73% 74% 75% 75% 75%
4. Expenditure per PDE Quarterly R R 4 029 R 3 840 R 3 880 R 3 995 R 4 029 R 4 029
5. Complaint resolution
within 25 working days
rate
Quarterly % 97% 97% 97% 97% 97% 97%
6. Complaints resolution rate Quarterly % 86.9% 80.5% 83% 85% 86.9% 86.9%
7. Delivery by caesarean
section rate
Quarterly % 69% 69% 69% 69% 69% 69%
8. OPD headcount - total Quarterly No 380 152 95 038 95 038 95 038 95 038 380 152
9. OPD headcount new
case not referred
Quarterly No 28 824 7 206 7 206 7 206 7 206 28 824

ANNUAL PERFORMANCE PLAN 2018/19 – 2020/21
178
Fighting Disease, Fighting Poverty, Giving Hope
Sub-Programme: Central Hospital (Inkosi Albert Luthuli Central
Hospital)
2018/19 Priorities
Priorities Key Focus Areas
Finalise & implement the Hospital
Rationalisation Plan (as part of the
Provincial Turn-Around Plan)
Phased implementation of Bed Bureaus.
Standardise Clinical Outreach Programmes, oversight,
mentorship and development support.
Improving quality of care and clinical governance.
Implement Operation Clean Audit.
Implement the National Core Standards.
Implementation of the approved Rationalisation Plan
including filling of essential posts (Essential Post List Project).

ANNUAL PERFORMANCE PLAN 2018/19 – 2020/21
179
Fighting Disease, Fighting Poverty, Giving Hope
Strategic Objectives, Indicators & Targets
Table 71: (C&THS3) Strategic Objectives, Indicators and Targets
Strategic
Objective
Statement
Performance Indicator Data Source Frequency
Type
Audited/ Actual Performance Estimated
Performance
2017/18
Medium Term Targets Strategic Plan
Targets
2019/20 2014/15 2015/16 2016/17 2018/19 2019/20 2020/21
Strategic Objective 5.1: Improve compliance to the Ideal Clinic and National Core Standards
5.1.2) 60% (or
more) public
health hospitals
achieved 75%
or more on NCS
self-assessment
rate by March
2020
1. Hospital
achieved 75%
and more on
NCS self-
assessment rate
DHIS Quarterly
%
Not reported Not reported Not reported 0% 100% 100% 100% 60% or more
Hospital achieved 75%
and more on NCS self-
assessment
Assessment
records
No - - - 0 1 1 1
Hospitals conducted
NCS self-assessment
Assessment
records
No - - - 0 1 1 1 -
Strategic Objective 1.7: Improve hospital efficiencies
1.7.3) Improve
hospital
efficiencies by
reducing the
average length
of stay to at least
5.5 days (District),
5.3 (Regional), 15
days (TB), 286.5
days (Psych),
28.5 days
(Chronic), 9 days
(Tertiary), and 8.6
days (Central) by
March 2020
2. Average length of
stay - total
DHIS Quarterly
Days
8.4 Days 8.6 Days 8.7 Days 8.7 Days 8.8 Days 8.8 Days 8.8 Days -
Inpatient days-total Midnight
Census
No 206 116 203 522 204 871 204 667 204 459 204 228 204 009
½ Day Patients Admission/
Discharge
Register
No 1 587 1 602 1 651 1 650 1 649 1 638 1 630
Inpatient separations Admission/
Discharge
Registers
No 24 583 23 756 23 515 23 616 23 429 23 419 23 401
1.7.1) Maintain
a bed utilisation
rate of 75% (or
more) by March
2020
3. Inpatient bed
utilisation rate -
total
DHIS Quarterly
%
67% 66.2% 66.6% 66.8% 66.8% 71% 71.9% 75% (or
more)
Inpatient days-total Midnight
Census
No 206 116 203 522 204 871 204 667 204 459 204 228 204 009

ANNUAL PERFORMANCE PLAN 2018/19 – 2020/21
180
Fighting Disease, Fighting Poverty, Giving Hope
Strategic
Objective
Statement
Performance Indicator Data Source Frequency
Type
Audited/ Actual Performance Estimated
Performance
2017/18
Medium Term Targets Strategic Plan
Targets
2019/20 2014/15 2015/16 2016/17 2018/19 2019/20 2020/21
½ Day Patients Admission/
Discharge
Register
No 1 587 1 602 1 651 1 650 1 649 1 638 1 630
Inpatient bed days
available
DHIS No 308 790 308 824 308 790 308 790 308 730 290 026 286 026
1.7.4) Maintain
expenditure per
PDE within the
provincial norms
4. Expenditure per
PDE
BAS; DHIS Quarterly
R
R 3 288 R7 701 R 8 323 R 8 370 R 8 373 R 8 380 R 8 386 -
Total expenditure
Central Hospital
BAS R’000 908 448 2 087 907 2 259 604 2 260 554 2 260 631 2 260 750 2 260 833
Patient day equivalents DHIS No 276 275 271 090 271 479 270 083 269 988 269 788 269 599
Strategic Objective 5.1: Improve compliance to the Ideal Clinic and National Core Standards
5.1.7) Sustain a
95% (or more)
complaint
resolution within
25 working days
rate in all public
health facilities
by March 2020
onwards
5. Complaint
resolution within 25
working days rate
DHIS Quarterly
%
100% 96.6% 87.3% 92.9% 95.9% 97.5% 99.2% -
Complaint resolved
within 25 working days
Complaints
Register
No 31 115 110 118 118 118 118
Complaint resolved Complaints
Register
No 31 119 126 127 123 121 119
5.1.6) Sustain a
complaint
resolution rate of
95% (or more) in
all public health
facilities from
March 2020
onwards
6. Complaints
resolution rate
DHIS Quarterly
%
67.4% 99.2% 99.2% 99.2% 99.2% 99.2% 99.2% -
Complaint resolved Complaints
Register
No 31 119 126 127 123 121 119
Complaint received Complaints
Register
No 46 120 127 128 124 122 120
Strategic Objective 2.7: Reduce maternal mortality
2.7.2) Reduce
the caesarean
section rate to
27.5% (District),
37% (Regional),
60% (Tertiary),
7. Delivery by
caesarean section
rate
DHIS Quarterly
%
80.5% 72.2% 78.5% 75.5% 75% 75% 75.1% -
Delivery by caesarean
section
Theatre
Register
No 400 301 300 320 314 308 305

ANNUAL PERFORMANCE PLAN 2018/19 – 2020/21
181
Fighting Disease, Fighting Poverty, Giving Hope
Strategic
Objective
Statement
Performance Indicator Data Source Frequency
Type
Audited/ Actual Performance Estimated
Performance
2017/18
Medium Term Targets Strategic Plan
Targets
2019/20 2014/15 2015/16 2016/17 2018/19 2019/20 2020/21
and 67% or less
(Central) by
March 2020
Delivery in facility total Delivery
Register
No 497 417 382 424 419 411 406
Strategic Objective 1.7: Improve hospital efficiencies
1.7.6)
Appropriate
referral as per
referral criteria
8. OPD headcount
– total
DHIS; Tick
Register OPD
Quarterly
No
203 228 195 333 192 511 191 886 191 464 191 398 191 336 -

ANNUAL PERFORMANCE PLAN 2018/19 – 2020/21
182
Fighting Disease, Fighting Poverty, Giving Hope
2018/19 Targets
Table 72: (C&THS4) Quarterly and Annual Targets
Performance Indicators Frequency Type
Annual
Target
2018/19
Targets
Q1 Q2 Q3 Q4 Annual
1. Hospital achieved 75% and
more on NCS self-assessment
rate
Quarterly % 100% 0% 0% 0% 100% 100%
2. Average length of stay – total Quarterly Days 8.8 Days 8.8 Days 8.8 Days 8.8 Days 8.8 Days 8.8 Days
3. Inpatient bed utilisation rate –
total
Quarterly % 66.8% 66.8% 66.8% 66.8% 66.8% 66.8%
4. Expenditure per PDE Quarterly R R 8 373 R 8 373 R 8 373 R 8 373 R 8 373 R 8 373
5. Complaint resolution within 25
working days rate
Quarterly % 95.9% 93% 94% 95% 95.9% 95.9%
6. Complaints resolution rate Quarterly % 99.2% 98.5% 98.5% 99% 99.2% 99.2%
7. Delivery by caesarean section
rate
Quarterly % 75% 75% 75% 75% 75% 75%
8. OPD headcount - total Quarterly No 191 464 47 866 47 866 47 866 47 866 191 464

ANNUAL PERFORMANCE PLAN 2018/19 – 2020/21
183
Fighting Disease, Fighting Poverty, Giving Hope
Reconciling Performance Targets with Expenditure Trends
Table 73: (C&THS7 a) Summary of Payments and Estimates (R’000)
Sub-Programme Audited Expenditure Outcomes Main
Appropriation
Adjusted
Appropriation
Revised
Estimate Medium Term Expenditure Estimates
R’000 2014/15 2015/16 2016/17 2017/18 2018/19 2019/20 2020/21
Central Hospital Services 1 914 646 2 087 907 2259604 2 241 188 2263188 2 335 727 2 402 978 2 555 712 2 787 360
Provincial Tertiary Hospital Services 1 903 154 2 037 022 2 274 553 2 340 390 2 418 390 2 420 201 2 553 015 2 658 186 2 926 961
Sub-Total 3 817 800 4 124 929 4 534 157 4 581 578 4 681 578 4 755 928 4 955 993 5 213 898 5 714 321
Unauthorized expenditure (1st charge)
not available for spending
- - - - - - - - -
Baseline available for spending after 1st
charge
3 817 800 4 124 929 4 534 157 4 581 578 4 681 578 4 755 928 4 955 993 5 213 898 5 714 321
Table 74: (C&THS7 b) Summary of Payments and Estimates by Economic Classification (R’000)
Sub-Programme Audited Expenditure Outcomes Main
Appropriation
Adjusted
Appropriation
Revised
Estimate Medium Term Expenditure Estimates
R’000 2014/15 2015/16 2016/17 2017/18 2018/19 2019/20 2020/21
Current payments 3 774 252 4 092 468 4 472 417 4 547 518 4 570 316 4 661 622 4 805 919 5 116 860 5 597 039
Compensation of employees 2 135 330 2 331 335 2 492 410 2 689 663 2 666 039 2 648 995 2 843 834 3 086 384 3 410 817
Goods and services 1 638 596 1 761 005 1 979 967 1 857 855 1 904 277 2 012 626 1 962 085 2 030 476 2 186 222
Communication 5 307 5 526 6413 6 943 6 912 6 298 7 299 7 664 8 085
Computer Services - - 3 020 0 3508 6 923 6 948 7 295 7 696
Consultants, Contractors and special
services
787 620 875 154 1068950 909 253 947 829 1 007 087 1 007 294 1 038 509 1 105 402
Inventory 722 905 646 954 796515 830384 810 784 861 494 799 115 828 508 908 370

ANNUAL PERFORMANCE PLAN 2018/19 – 2020/21
184
Fighting Disease, Fighting Poverty, Giving Hope
Sub-Programme Audited Expenditure Outcomes Main
Appropriation
Adjusted
Appropriation
Revised
Estimate Medium Term Expenditure Estimates
R’000 2014/15 2015/16 2016/17 2017/18 2018/19 2019/20 2020/21
Operating leases 732 959 956 1 144 1 056 1 269 1 441 1 513 1 596
Travel and subsistence 868 431 590 509 775 702 790 830 879
Interest and rent on land 326 128 40 0 0 1 0 0 0
Maintenance, repair and running costs 932 940 - - - - - - -
Other including Assets<5000, training
and development, property payments,
operating expenditure and venues and
facilities
120 232 231 041 103 523 109 622 133 413 128 853 139 198 146 157 154 194
Transfers and subsidies to 40 875 30 432 48 533 27060 11696 10883 27 715 39 267 50 877
Provinces and municipalities - - 0 0 0 0 0 0 0
Departmental agencies and accounts 51 52 53 60 119 119 63 67 71
Universities and Technikons - - 0 0 0 0 0 0 0
Non-profit institutions - - 0 0 0 0 0 0 0
Households 40 824 30 380 48 480 27000 11577 10 764 27 652 39 200 50 806
Payments for capital assets 2 673 2 029 13 207 7 000 99566 83 423 122 359 57 771 66 405
Machinery and equipment 2 673 2 029 11 207 7 000 99566 83 423 122 359 57 771 66 405
Software and other tangible assets - - 0 0 0 0 0 0 0
Payment for financial assets - - - - - - - - -
Total economic classification 3 817 800 4 124 929 4 534 157 4 581 578 4 681 578 4 755 928 4 955 993 5 213 898 5 714 321

ANNUAL PERFORMANCE PLAN 2018/19 – 2020/21
185
Fighting Disease, Fighting Poverty, Giving Hope
Performance and Expenditure Trends
Programme 5 (Central and Tertiary Hospital Services) is allocated 11.81 per cent of the 2018/19 Vote 7
allocation compared to 11.6 per cent of the revised estimate for 2017/18. This amounts to an increase
of R302 769 million.
Sub-programme Central Hospitals is allocated 48.59 per cent of the Programme 5 allocation for 2018/19
compared to 48.9 per cent of the revised estimate for 2017/18. This amounts to an increase of R171 810
million.
Tertiary Hospitals is allocated 51.4 per cent of the Programme 5 allocation for 2018/19 compared to 51.1
per cent of the revised estimate for 2017/18. This amounts to an increase of R130 959.
Risk Management
Table 75: Risk Management
Potential Risks Mitigating Strategies
Budget constraints Robust monitoring of expenditure against allocated budget.
Ensure cost containment and efficiency measures are in place
and strictly adhered to.
Vigilant control over the filling of posts as per Essential Post List.
Finalise the Hospital Rationalisation Plan for Tertiary & Central
Hospitals with cost saving strategies embedded in plan.
Inadequate human
resources
Essential Post List based on gap analysis – robust monitoring of
compliance.
Strategy to improve retention of scarce skills.
Alignment of structures with function.
Inadequate hospital
information system
Prioritise hospital information system in ICT Long Term Plan.
Interim arrangements for reporting of routine clinical data.
Improve review and utilisation of information.
Leadership and
management
Implement development and mentoring programme for Hospital
CEOs.
Medical litigation Improved clinical governance.
Strategy to improve management of litigation cases.

ANNUAL PERFORMANCE PLAN 2018/19 – 2020/21
186
Fighting Disease, Fighting Poverty, Giving Hope
NOTES
……………………………………………………………………………………………………………………………………
……………………………………………………………………………………………………………………………………
……………………………………………………………………………………………………………………………………
……………………………………………………………………………………………………………………………………
……………………………………………………………………………………………………………………………………
……………………………………………………………………………………………………………………………………
……………………………………………………………………………………………………………………………………
……………………………………………………………………………………………………………………………………
……………………………………………………………………………………………………………………………………
……………………………………………………………………………………………………………………………………
……………………………………………………………………………………………………………………………………
……………………………………………………………………………………………………………………………………
……………………………………………………………………………………………………………………………………
……………………………………………………………………………………………………………………………………
……………………………………………………………………………………………………………………………………
……………………………………………………………………………………………………………………………………
……………………………………………………………………………………………………………………………………

ANNUAL PERFORMANCE PLAN 2018/19 – 2020/21
187
Fighting Disease, Fighting Poverty, Giving Hope
PROGRAMME 6: HEALTH SCIENCES AND TRAINING
Programme Purpose
Render training and development opportunities for actual and potential employees of the Department
of Health - There are no changes to the Programme 6 structure.
Sub-Programme 6.1: Nurse Training College
Train nurses at undergraduate and post-basic level. Target group includes actual and potential
employees
Sub-Programme 6.2: EMS Training College
Train rescue and ambulance personnel. Target group includes actual and potential employees
Sub-Programme 6.3: Bursaries
Provision of bursaries for health science training programmes at under- and postgraduate levels,
targeting actual and potential employees
Sub-Programme 6.4: PHC Training
Provision of PHC related training for personnel, provided by the regions
Sub-Programme 6.5: Training (Other)
Provision of skills development programmes for all occupational categories in the Department. Target
group includes actual and potential employees.

ANNUAL PERFORMANCE PLAN 2018/19 – 2020/21
188
Fighting Disease, Fighting Poverty, Giving Hope
2018/19 Priorities
Priorities Key Focus Areas
Training in sign language Training of front line staff and healthcare professionals in
sign language.
Bursary allocation Prioritise bursary allocation to address scarce and critical/
essential skills.
Training of Mid-Level Workers Identify occupational categories requiring mid-level
workers in consultation with programme managers.
Liaise with training institutions for the enrolment of identified
candidates.
Compliance with employee
performance management
Conduct workshops and send reminders on compliance.
Implement PMDS elements, i.e. capture assessment results
on PERSAL, Process pay/grade progressions and facilitate
the performance improvement plan through PDP or
incapacity due to poor work performance.

ANNUAL PERFORMANCE PLAN 2018/19 – 2020/21
189
Fighting Disease, Fighting Poverty, Giving Hope
Strategic Objectives, Indicators and Targets
Table 76: Strategic Plan 2015-2019 Targets
Strategic Goal Strategic Objective Strategic Objective Statement Indicator Target 2019/20
Strategic Goal 4:
Strengthen human
resources for health
4.1) Improve human
resources for health
4.1.4) Allocate 197 bursaries for first year medicine students
between 2015/16 and 2019/20 (Reviewed 2017/18)
Number of bursaries awarded
for first year medicine students
197 (Reviewed
2017/18)
4.1.5) Allocate 1 000 bursaries for fist year nursing students
between 2015/16 and 2019/20 (Reviewed 2016/17)
Number of bursaries awarded
for first year nursing students
1 000 (Reviewed
2016/17)
4.1.8) Increase the number of MOPs who successfully
completed the degree course at Durban University of
Technology (DUT) to 61 (cumulative) by March 2020 (Reviewed
2017/18)
Number of MOPs that
successfully completed the
degree course at DUT
61(Reviewed
2017/18)
4.1.6) Increase intake of Mid-Level Workers with at least 10%
per annum pending availability of budget (Reviewed 2017/18)
Number of new students
enrolled in Mid-Level Worker
training courses
10% increase
(pending availability
of budget)
(Reviewed 2017/18)
4.1.7) Increase the EMS skills pool by increasing the number of
ILS intakes to 300 by March 2020 (Reviewed 2017/18)
Number of Intermediate Life
Support graduates per annum
(Reviewed 2017/18)
300 (Reviewed
2017/18)

ANNUAL PERFORMANCE PLAN 2018/19 – 2020/21
190
Fighting Disease, Fighting Poverty, Giving Hope
Table 77: (HST1) Strategic Priorities, Indicators and Targets
Strategic
Objective
Statement
Performance Indicator Data Source Frequency/
Type
Audited/ Actual Performance Estimated
Performance
2017/18
Medium Term Targets Strategic
Plan Target
2019/20 2014/15 2015/16 2016/17 2018/19 2019/20 2020/21
Strategic Objective 4.1: Improve human resources for health
4.1.4) Allocate
197 bursaries for
first year
medicine
students
between
2015/16 and
2019/20
1. Number of
bursaries
awarded for first
year medicine
students
Bursary
Register
Annual
No
131 57 16 30 30118 30119 30 197
4.1.5) Allocate
1 000 bursaries
for 1st year
nursing students
between
2015/16 and
2019/20
2. Number of
bursaries
awarded for first
year nursing
students
Bursary
Register
Annual
No
Not reported 90 108 150 150 150 150 1 000
Strategic Objective 4.3: Accreditation of KZNCN as Institution of Higher Education
4.3.1) KZNCN
accredited as
IHE by March
2017
3. KZNCN
accredited as
Institution of
Higher Education
Accreditation
Certificate
Annual
Categorical
Not reported Not
accredited
Not
accredited
Not
accredited
Accredited Accredited
& Providing
Training as
IHE
Accredited
& Providing
Training as
IHE
-
Strategic Objective 4.1: Improve human resources for health
4.1.9) Increase
enrolment of
Advanced
Midwives by at
least 10% per
annum pending
available
budget120
4. Number of
Advanced
Midwifes
graduating per
annum
KZNCN
Database
Annual
No
146 29 54 30 30 30 30 -
118 A total of 1 084 bursaries will be allocated to medical students with 58 RSA students completing in 2018 and 10 existing students from the Cuban programme. There will be no new intakes for the Cuban
Programme due to budget constraints. Bursaries will be allocated to 284 Allied Professions including 60 new intakes 119 A total of 670 bursaries will be allocated to medical students with 325 students completing from the Cuban programme and 47 on the RSA programme. There will be no intakes for the Cuban programme due to budget
constraints. Bursaries will be allocated to 109 Allied Professions with 60 new intakes 120 Due to budget constraints the intended 10% increase per annum will be reconsidered year on year in line with the available funding envelope and provision for absorption

ANNUAL PERFORMANCE PLAN 2018/19 – 2020/21
191
Fighting Disease, Fighting Poverty, Giving Hope
Strategic
Objective
Statement
Performance Indicator Data Source Frequency/
Type
Audited/ Actual Performance Estimated
Performance
2017/18
Medium Term Targets Strategic
Plan Target
2019/20 2014/15 2015/16 2016/17 2018/19 2019/20 2020/21
4.1.8) Increase
the number of
MOP’s who
successfully
completed the
degree course
at DUT to 61
(cumulative) by
March 2020
5. Number of
MOP’s that
successfully
completed the
degree course at
DUT
Training
Report/
Student
Records DUT
Annual
No
Not reported Nil Nil 34 18 6 0 61
4.1.6) Increase
intake of Mid-
Level Workers
with at least
10% per annum
(pending
availability of
budget)
6. Number of new
Pharmacy
Assistants
enrolled in
training courses
Annual
Training
Report
Annual
No
372 208 206 20 20 20 15 167
4.1.7) Increase
the EMS skills
pool by
increasing the
number ILS
student intakes
to 300 by March
2020
7. Number of
Intermediate Life
Support
graduates per
annum
Training
Report; EMS
College
Register
Annual
No
54 41 38 48 72 72 72 300

ANNUAL PERFORMANCE PLAN 2018/19 – 2020/21
192
Fighting Disease, Fighting Poverty, Giving Hope
2018/19 Targets
Table 78: (HST2) Quarterly and Annual Targets
Performance Indicators Frequency Type Targets
2018/19
Targets
Q1 Q2 Q3 Q4 Annual
1. Number of bursaries
awarded for first year
medicine students
Annual Number 30 - - - - 30
2. Number of bursaries
awarded for first year nursing
students
Annual Number 150 - - - - 150
3. KZNCN accredited as
Institution of Higher
Education
Annual Categorical Accredited - - - - Accredited
4. Number of Advanced
Midwifes graduating per
annum
Annual Number 30 - - - - 30
5. Number of MOP’s that
successfully completed the
degree course at DUT
Annual Number 18 - - - - 18
6. Number of new Pharmacy
Assistants enrolled in training
courses
Annual Number 20 - - - - 20
7. Number of Intermediate Life
Support graduates per
annum
Annual Number 72 - - - - 72

ANNUAL PERFORMANCE PLAN 2018/19 – 2020/21
193
Fighting Disease, Fighting Poverty, Giving Hope
Reconciling Performance Targets with Expenditure Trends
Table 79: (HST4 a) Expenditure Estimates (R’000)
Sub-Programme Audited Expenditure Outcomes Main
Appropriation
Adjusted
Appropriation
Revised
Estimate Medium Term Expenditure Estimates
R’000 2014/15 2015/16 2016/17 2017/18 2018/19 2019/20 2020/21
Nursing Training Colleges 276 189 277 502 275 229 300 650 278 443 270 097 293 908 311 721 333 156
EMS Training Colleges 5 039 5 298 16 542 18 304 17 297 17 296 19 127 20 319 21 665
Bursaries 243 405 280 604 322 878 293 912 291 109 319 488 265 492 220 248 159 250
Primary Health Care Training 41 957 41 069 39 135 46 481 50 985 53 225 59 100 61 837 65 862
Training Other 452 359 454 321 547 290 582 336 603 849 603 080 626 723 667 760 732 816
Sub-Total 1 018 949 1 058 794 1 201 074 1 241 683 1 241 683 1 263 186 1 264 350 1 281 885 1 312 749
Unauthorized expenditure (1st charge)
not available for spending
- - - - - - - - -
Baseline available for spending after 1st
charge
1 018 949 1 058 794 1 201 074 1 241 683 1 241 683 1 263 186 1 264 350 1 281 885 1 312 749

ANNUAL PERFORMANCE PLAN 2018/19 – 2020/21
194
Fighting Disease, Fighting Poverty, Giving Hope
Table 80: (HST4 b) Summary of Provincial Expenditure Estimates by Economic Classification (R’000)
Economic Classification Audited Expenditure Outcomes Main
Appropriation
Adjusted
Appropriation
Revised
Estimate Medium-Term Expenditure Estimates
R’000 2014/15 2015/16 2016/17 2017/18 2018/19 2019/20 2020/21
Current payments 778 344 773 468 887 101 952 340 946 604 941 989 994 094 1 056 577 1 148 152
Compensation of employees 722 027 721 247 821 215 877 206 890 053 883 289 918 016 976 837 1 064 266
Goods and services 56 317 52 219 65 883 75 134 56 551 58 700 76 078 79 740 83 886
Communication 948 697 753 795 745 744 140 147 154
Computer Services 45 138 191 - - - - - -
Consultants, Contractors and special
services
94 77 2 572 1 911 2 759 3 124 3 824 4 057 4 298
Inventory 491 597 3 523 6 555 6 459 4 978 4 805 5 012 5 281
Operating leases 1 273 1 402 1 337 1 663 2 958 1 224 1 247 1 310 1 376
Travel and subsistence 25 585 22 344 34 296 37 960 26 296 28 297 32 000 33 600 35 281
Interest and rent on land - 2 3 - - - - - -
Maintenance, repair and running costs 2 320 2 361 - - - - - - -
Other including Assets<5000, training
and development, property payments,
operating expenditure and venues and
facilities
25 561 24 603 23 211 26 250 17 334 20 333 34 062 35 614 37 496
Transfers and subsidies to 238 187 285 248 313 940 282 631 287 832 315 739 260 659 215 310 154 186
Provinces and municipalities - 28 - - 15 15 - - -
Departmental agencies and accounts 15 768 18 863 19 842 19 842 18 850 18 850 20 868 22 036 23 248
Universities and Technicon’s 16 - - - - - - - -
Non-profit institutions - - - - - - - - -
Households 222 403 266 357 294 098 262 789 268 967 296 874 239 791 193 274 130 938
Payments for capital assets 2 412 99 33 6 712 7 247 5 458 9 597 9 998 10 411
Buildings and other fixed structures - - - - - - - - -

ANNUAL PERFORMANCE PLAN 2018/19 – 2020/21
195
Fighting Disease, Fighting Poverty, Giving Hope
Economic Classification Audited Expenditure Outcomes Main
Appropriation
Adjusted
Appropriation
Revised
Estimate Medium-Term Expenditure Estimates
R’000 2014/15 2015/16 2016/17 2017/18 2018/19 2019/20 2020/21
Machinery and equipment 2 412 99 33 6 712 7 247 5 458 9 597 9 998 10 411
Software and other tangible assets - - - - - - - - -
Payment for financial assets 6 7 - - - - - - -
Total economic classification 1 018 949 1 058 822 1 201 074 1 241 683 1 241 683 1 263 186 1 264 350 1 281 885 1 312 749

ANNUAL PERFORMANCE PLAN 2018/19 – 2020/21
196
Fighting Disease, Fighting Poverty, Giving Hope
Performance and Expenditure Trends
Programme 6 (Health Sciences & Training) is allocated 3.0 per cent of the total Vote 7 allocation for
2018/19 compared to 3.1 per cent of the revised estimate for 2017/18. This amounts to an increase of
R26 668 million.
Sub-programme Nurse Training Colleges is allocated 24.19 per cent of the Programme 6 allocation for
2018/19 compared to 24.2 per cent of the revised estimate for 2017/18. This amounts to an increase of
R25 749 million.
Sub-programme EMS Training Colleges is allocated 1.40 per cent of the Programme 6 allocation for
2018/19 compared to 1.5 per cent of the revised estimate for 2017/18. This amounts to a decrease of R1
571 million.
Sub-programme Bursaries are allocated 22.89 per cent of the Programme 6 allocation for 2018/19
compared to 23.7 per cent of the revised estimate for 2017/18. This amounts to a decrease of R4 403
million.
Sub-programme PHC Training is allocated 3.44 per cent of the Programme 6 allocation for 2018/19
compared to 3.7 per cent of the revised estimate for 2017/18. This amounts to an increase of R4 055
million.
Sub-programme Other Training is allocated 48.05 per cent of the Programme 6 allocation for 2018/19
compared to 46.9 per cent of the revised estimate for 2017/18. This amounts to a decrease of R4 304
million.
Risk Management
Table 81: Risk Management
Potential Risks Mitigating Strategies
Budget constraints Robust monitoring of expenditure against allocated budget.
Ensure cost containment and efficiency measures are in place
and strictly adhered to.
Re-prioritise allocation per Sub-Programme.
Compliance with NCET
Policy (EMS)
Rationalisaiton and turn-around plan within framework of NCET
Policy.
Absorption of bursary
holders post training
Strategy for absorption of bursary holders after graduation.
Vigilant monitoring of student progress.
Leadership and
management
Leadership and management training and mentoring
programmes.
Bursary holders breach of
contractual obligation prior
to or during placement
Orientation of bursary holders.
Visit bursary holders at universities to promote mentorship and
remind them about bursary obligation.
Failure to recover debts
from bursary holders who
breached their obligation
Track and trace agent to recover and collect debts has been
appointed.
Initiate legal processes to recover debts.

ANNUAL PERFORMANCE PLAN 2018/19 – 2020/21
197
Fighting Disease, FIghting Poverty, Giving Hope
PROGRAMME 7: HEALTH CARE SUPPORT SERVICES
Programme Purpose
To render support services required by the Department to realise its aims.
There are no changes to the Programme 7 structure.
Sub-Programme 7.1: Laundry Services
Render laundry services to hospitals, care and rehabilitation centres and certain local authorities.
Sub-Programme 7.2: Engineering Services
Render a maintenance service to equipment and engineering installations, and minor maintenance to
buildings.
Sub-Programme 7.3: Forensic Services
Render specialised forensic and medico-legal services in order to establish the circumstances and
causes surrounding unnatural death.
Sub-Programme 7.4: Orthotic and Prosthetic Services
Render specialised orthotic and prosthetic services.
Sub-Programme 7.5: Pharmaceutical Service (Medicine Trading Account)
Render Pharmaceutical services to the Department. Manage the supply of pharmaceuticals and
medical sundries to hospitals, Community Health Centres and local authorities via the Medicine Trading
Account.

ANNUAL PERFORMANCE PLAN 2018/19 – 2020/21
198
Fighting Disease, FIghting Poverty, Giving Hope
2018/19 Priorities
Priorities Key Focus Areas
Improve pharmaceutical efficiencies Finalise and approve Pharmaceutical Services Strategy &
Implementation Plan.
Early warning system for medicine
stock out
Electronic Stock Management System at PHC facilities,
Hospitals and Depot/ Central Warehouse.
Pharmaceuticals Procurement and
Distribution Reforms
Direct deliveries and cross-docking of medicine supplies.
Central Chronic Medicines
Dispensing and Distribution
Programme
Further rollout of programme to all municipalities.
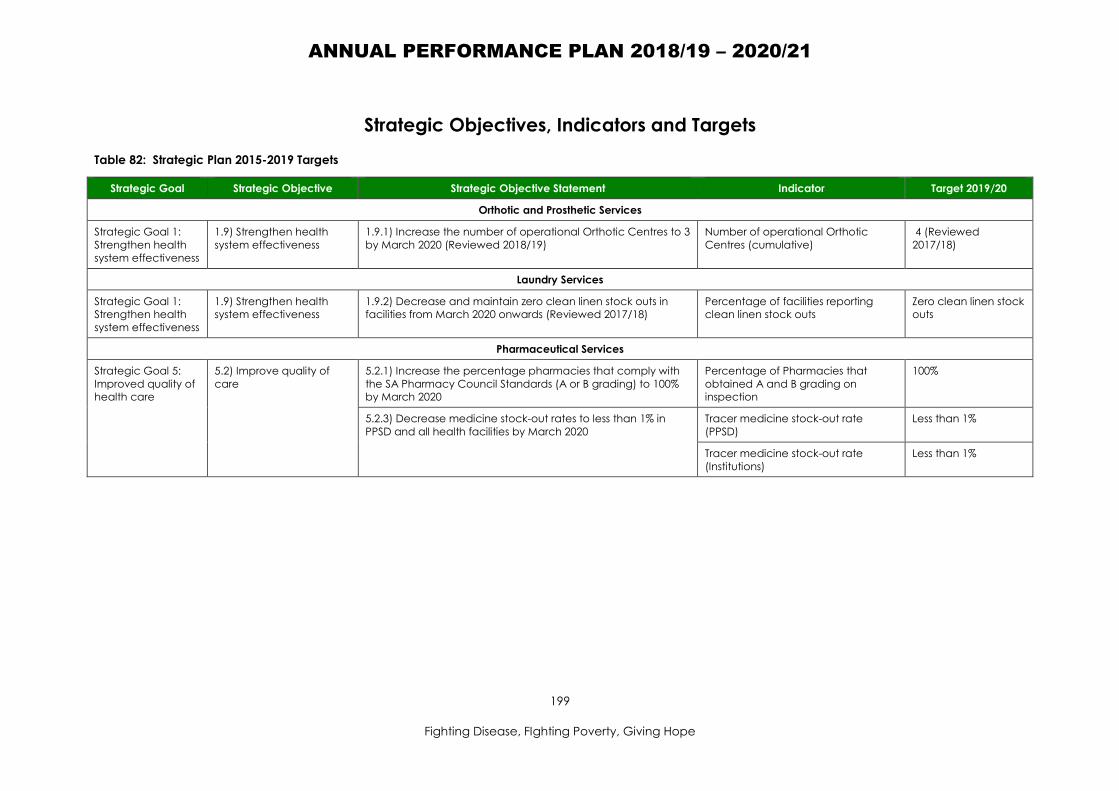
ANNUAL PERFORMANCE PLAN 2018/19 – 2020/21
199
Fighting Disease, FIghting Poverty, Giving Hope
Strategic Objectives, Indicators and Targets
Table 82: Strategic Plan 2015-2019 Targets
Strategic Goal Strategic Objective Strategic Objective Statement Indicator Target 2019/20
Orthotic and Prosthetic Services
Strategic Goal 1:
Strengthen health
system effectiveness
1.9) Strengthen health
system effectiveness
1.9.1) Increase the number of operational Orthotic Centres to 3
by March 2020 (Reviewed 2018/19)
Number of operational Orthotic
Centres (cumulative)
4 (Reviewed
2017/18)
Laundry Services
Strategic Goal 1:
Strengthen health
system effectiveness
1.9) Strengthen health
system effectiveness
1.9.2) Decrease and maintain zero clean linen stock outs in
facilities from March 2020 onwards (Reviewed 2017/18)
Percentage of facilities reporting
clean linen stock outs
Zero clean linen stock
outs
Pharmaceutical Services
Strategic Goal 5:
Improved quality of
health care
5.2) Improve quality of
care
5.2.1) Increase the percentage pharmacies that comply with
the SA Pharmacy Council Standards (A or B grading) to 100%
by March 2020
Percentage of Pharmacies that
obtained A and B grading on
inspection
100%
5.2.3) Decrease medicine stock-out rates to less than 1% in
PPSD and all health facilities by March 2020
Tracer medicine stock-out rate
(PPSD)
Less than 1%
Tracer medicine stock-out rate
(Institutions)
Less than 1%

ANNUAL PERFORMANCE PLAN 2018/19 – 2020/21
200
Fighting Disease, FIghting Poverty, Giving Hope
Table 83: (HCSS1) Strategic Objectives, Indicators and Targets
Strategic
Objective
Statement
Performance Indicator
Data Source
Frequency/
Type
Audited/ Actual Performance Estimated
Performance
2017/18
Medium Term Targets Strategic
Plan Target
2019/20 2014/15 2015/16 2016/17 2018/19 2019/20 2020/21
Strategic Objective 1.9: Strengthen health system effectiveness
1.9.2) Decrease
and maintain
zero clean linen
stock outs in
facilities from
March 2020
onwards
1. Percentage of
facilities
reporting clean
linen stock outs
Laundry
Register
Quarterly
%
14% 18% 13% 2.8% 1.4% 0% 0% Zero clean
linen stock
outs
Number of facilities
reporting clean linen
stock out
Laundry
Register
No 10 13 9 2 1 0 0
Facilities total DHIS No 72 72 73 72 72 72 72
1.9.5)
Implement the
approved
Forensic
Pathology
Rationalisation
Plan by March
2019
2. Forensic
Pathology
Rationalisation
Plan
FPS Reports/
Rationalisation
Plan
Annual
Categorical
Not reported Not
approved
Not
approved
Not
approved
Approved
Plan
Implement
approved
Plan
Implement
approved
Plan
-
1.9.1) Increase
the number of
operational
Orthotic
Centres to 4 by
March 2020
3. Number of
operational
Orthotic Centres
- cumulative
Operational
Centres
reports
Annual
No
Not reported 2121 2 2 3 3 4 4
Strategic Objective 5.2: Improve quality of care
5.2.1) Increase
the percentage
pharmacies
that comply
with the SA
Pharmacy
Council
Standards (A or
4. Percentage of
Pharmacies that
obtained A and
B grading on
inspection
Pharmacy
database/
Grading
Certificates
Annual
%
83% 97% 91% 93.7% 95.8% 100% 100% 100%
Pharmacies with A or
B Grading
Grading
Certificates
No 78 84 86 89 91 95 95
121 Fully functional Operational Centres in Wentworth and Pietermaritzburg

ANNUAL PERFORMANCE PLAN 2018/19 – 2020/21
201
Fighting Disease, FIghting Poverty, Giving Hope
Strategic
Objective
Statement
Performance Indicator
Data Source
Frequency/
Type
Audited/ Actual Performance Estimated
Performance
2017/18
Medium Term Targets Strategic
Plan Target
2019/20 2014/15 2015/16 2016/17 2018/19 2019/20 2020/21
B grading) to
100% by March
2020
Number of
pharmacies
Pharmacy
Records
No 94 87 95 95 95 95 95
5.2.3) Decrease
medicine stock-
out rates to less
than 1% in all
health facilities
and PPSD by
March 2020
5. Tracer medicine
stock-out rate
(PPSD)
Pharmacy
Database
Quarterly
%
6.4% 17.4% 7% 8.7% 3% 1% 1% Less than 1%
Number of tracer
medicine out of stock
Pharmacy
Records
No 34 96 10 12 Fluctuates Fluctuates Fluctuates
Total number of tracer
medicine expected to
be in stock
Pharmacy
Records
No 530 552 138 138 Fluctuates Fluctuates Fluctuates
6. Tracer medicine
stock-out rate
(Institutions)
Pharmacy
Database
Quarterly
%
2.96% 4.4%122
2% 1.7% 1.5% 1% 1% Less than 1%
Number of tracer
medicines stock out
in bulk store
Pharmacy
Records
No 1 551 1 555 1 298 1 086 Fluctuates Fluctuates Fluctuates
Number of tracer
medicines expected
to be stocked in the
bulk store
Pharmacy
Records
No 52 416 50 832 80 751 64 290 Fluctuates Fluctuates Fluctuates
5.2.4) Improve
pharmaceutical
procurement
and distribution
reforms
7. Percentage
facilities on
Direct Delivery
Model for
Procurement
and Distribution
of
Pharmaceuticals
Pharmacy
Database
Quarterly
%
Not reported Not reported 97% 97% 100% 100% 100% -
Number of facilities on
Direct Delivery Model
Facilities
Records
No - - 93 93 94 96 96
Total number of
facilities eligible for
Direct Delivery Model
Pharmacy
Database
No - - 96 96 94 96 96 -
122 343/ 7 734 (3%) in hospitals and CHCs and 1 212/ 43 098 (2.8%) in clinics

ANNUAL PERFORMANCE PLAN 2018/19 – 2020/21
202
Fighting Disease, FIghting Poverty, Giving Hope
Strategic
Objective
Statement
Performance Indicator
Data Source
Frequency/
Type
Audited/ Actual Performance Estimated
Performance
2017/18
Medium Term Targets Strategic
Plan Target
2019/20 2014/15 2015/16 2016/17 2018/19 2019/20 2020/21
8. Percentage
facilities on
Cross-Docking
Model for
Procurement
and Distribution
of
Pharmaceuticals
Pharmacy
Database
Quarterly
%
Not reported Not reported 0% 0% 40% 60% 80% -
Number of facilities on
Cross-Docking Model
Pharmacy
Database
No - - 0 0 298 448 597
Total number of
facilities eligible for
Cross-Docking Model
Pharmacy
Database
No - - 748 748 746 746 746
9. Percentage of
items on Direct
Delivery and
Cross Docking
Model
Pharmacy
Database
Quarterly
%
Not reported Not reported 54% 58% 70% 70% 73% -
Number of items on
Direct Delivery and
Cross Docking Model
Pharmacy
Database
No - - 482 524 Fluctuates Fluctuates Fluctuates
Total number of items
in the Provincial
Essential Medicines
Catalogue
Provincial
Essential
Medicines
Catalogue
No - - 900 905 Fluctuates Fluctuates Fluctuates
10. Number of
facilities
implementing
the CCMDD
Programme
Pharmacy
Database
Quarterly
No
Not reported Not reported 606 692 717 717 717 -
11. Number of
patients enrolled
on CCMDD
programme
(cumulative)
Pharmacy
Database
Quarterly
No
Not reported Not reported 619 020 839 187 1 350 000 1 750 000 1 850 000 -
12. Number of pick-
up points linked
to CCMDD
Pharmacy
Database
Quarterly
No
Not reported Not reported 2 069 2 404 3 000 3 000 3 200 -

ANNUAL PERFORMANCE PLAN 2018/19 – 2020/21
203
Fighting Disease, FIghting Poverty, Giving Hope
2018/19 Targets
Table 84: (HCSS2) Quarterly and Annual Targets
Performance Indicators Frequency Type Targets
2018/19
Targets
Q1 Q2 Q3 Q4 Annual
1. Percentage of
facilities reporting
clean linen stock
outs
Quarterly % 1.4% 2.8% 2.8% 2.8% 1.4% 1.4%
2. Forensic Pathology
Rationalisation
Plan
Annual Catego-
rical
Approved
Plan
- - - - Approved
Plan
3. Number of
operational
Orthotic Centres
(cumulative)
Annual Number 3 - - - - 3
4. Percentage of
Pharmacies that
obtained A and B
grading on
inspection
Annual % 95.8% - - - - 95.8%
5. Tracer medicine
stock-out rate
(PPSD)
Quarterly % 3% 6% 5% 4% 3% 3%
6. Tracer medicine
stock-out rate
(Institutions)
Quarterly % 1.5% 1.7% 1.7% 1.6% 1.5% 1.5%
7. Percentage
facilities on Direct
Delivery Model for
Procurement and
Distribution of
Pharmaceuticals
Quarterly % 100% 98% 98% 99% 100% 100%
8. Percentage
facilities on Cross-
Docking Model for
Procurement and
Distribution of
Pharmaceuticals
Quarterly % 40% 15% 25% 34% 40% 40%
9. Percentage of
items on Direct
Delivery and Cross
Docking Model
Quarterly % 70% 59% 65% 65% 65% 65%
10. Number of facilities
implementing the
CCMDD
Programme
(cumulative)
Quarterly No 717 690 695 700 717 717
11. Number of
patients enrolled
on CCMDD
programme
(cumulative)
Quarterly No 1 350 000 839 187 900 000 1 200 000 1 350 000 1 350 000
12. Number of pick-up
points linked to
CCMDD
(cumulative)
Quarterly No 3 000 2 404 2 650 2 800 3 000 3 000

ANNUAL PERFORMANCE PLAN 2018/19 – 2020/21
204
Fighting Disease, FIghting Poverty, Giving Hope
Reconciling Performance Targets with Expenditure Trends
Table 85: (HCSS4 a) Expenditure Estimates (R’000)
Sub-Programme Audited Expenditure Outcomes Main
Appropriation
Adjusted
Appropriation
Revised
Estimate Medium Term Expenditure Estimates
R’000 2014/15 2015/16 2016/17 2017/18 2018/19 2019/20 2020/21
Medicine Trading Account 6 0 - 64 600 - - 73 477 77 587 81 854
Laundry Services 125 667 134 153 241 603 186 767 193 082 177 276 185 396 195 778 209 144
Orthotic and Prosthetic Services 26 235 31 942 27 165 42 587 36 272 44 200 54 767 48 994 52 492
Sub-Total 151 908 166 095 268 768 293 954 229 354 221 476 313 640 322 359 343 490
Unauthorized expenditure (1st charge)
not available for spending
- - - - - - - - -
Baseline available for spending after 1st
charge
151 908 166 095 268 768 293 954 229 354 221 476 313 640 322 359 343 490
Table 86: (HCSS4 b) Summary of Payments and Estimates by Economic Classification (R’000)
Economic Classification Audited Expenditure Outcomes Main
Appropriation
Adjusted
Appropriation
Revised
Estimate Medium-Term Expenditure Estimates
R’000 2014/15 2015/16 2016/17 2017/18 2018/19 2019/20 2020/21
Current payments 147 452 165 637 268 086 287 608 216 363 209 954 298 086 315 439 336 189
Compensation of employees 84 524 90 967 94 283 152 176 108 440 103 686 162 692 172 467 185 352
Goods and services 62 928 74 670 173 803 135 432 107 923 106 267 135 394 142 972 150 837
Communication 417 299 895 1 226 1 067 1 064 1 526 1 606 1 688
Computer Services - - - 2 130 - - 2 258 2 384 2 515
Consultants, Contractors and special
services
603 504 4 280 4 609 4 933 4 425 10 711 11 278 11 873
Inventory 9 665 14 140 144 447 76 285 76 540 74 976 76 067 79 989 84 096

ANNUAL PERFORMANCE PLAN 2018/19 – 2020/21
205
Fighting Disease, FIghting Poverty, Giving Hope
Economic Classification Audited Expenditure Outcomes Main
Appropriation
Adjusted
Appropriation
Revised
Estimate Medium-Term Expenditure Estimates
R’000 2014/15 2015/16 2016/17 2017/18 2018/19 2019/20 2020/21
Operating leases 110 125 101 464 114 124 531 560 590
Travel and subsistence 116 78 60 118 64 71 176 186 196
Interest and rent on land - - - - - 1 - - -
Maintenance, repair and running costs 4 319 4 367 - - - - - - -
Other including Assets<5000, training
and development, property payments,
operating expenditure and venues and
facilities
47 698 55 157 24 020 50 600 25 205 25 607 44 125 46 969 49 879
Transfers and subsidies to 1 264 244 636 696 777 988 737 778 821
Provinces and municipalities - - - - - - - - -
Departmental agencies and accounts - - - - - - - - -
Universities and Technicon’s - - - - - - - - -
Non-profit institutions - - - - - - - - -
Households 1 264 244 636 696 777 988 737 778 821
Payments for capital assets 3 192 214 46 5 650 12 214 10 534 14 817 6 142 6 480
Buildings and other fixed structures - -
Machinery and equipment 3 192 214 46 5 650 12 214 10 534 14 817 6 142 6 480
Software and other tangible assets - - - - - - - - -
Payment for financial assets - - - - - - - - -
Total economic classification 151 908 166 095 268 768 293 954 229 354 221 476 313 640 322 359 343 490

ANNUAL PERFORMANCE PLAN 2018/19 – 2020/21
206
Fighting Disease, FIghting Poverty, Giving Hope
Performance and Expenditure Trends
Programme 7 (Health Care Support Services) is allocated 0.54 per cent of the 2018/19 Vote 7 allocation
compared to 0.7 per cent of the revised estimate for 2017/18. This amounts to an increase of R15 116
million.
Sub-programme 7.1 (Laundry Services) is allocated 80.2 per cent of Programme 7 allocation for 2018/19
compared to 63.5 per cent of the revised estimate for 2017/18. This amounts to a decrease of R1 371
million.
Sub-programme 7.2 (Orthotic and Prosthetic Services) is allocated 19.79 per cent of the Programme 7
allocation for 2018/19 compared to 14.5 per cent of the adjusted estimate for 2017/18. This amounts to
a decrease of R13 745 million.
Risk Management
Table 87: Risk Management
Potential Risks Mitigating Strategies
Budget constraints Ensure cost containment and efficiency measures are in place
and strictly adhered to.
Implementation of the Pharmaceutical Services Strategy.
Medicine stock out, theft
and abuse and wastage
Enforce Board of Surveys.
Automisation of Expired Medication Alerts to improve stock
management.
Robust monitoring of security management at facilities.
Waiting times (patient
satisfaction)
Phased implementation of CCMDD and monitoring of patient
satisfaction (as part of the Service Delivery Improvement Plan).
Support at PHC level to improve efficiencies.
Inadequate storage
capacity at facilities for
pharmaceuticals
Implement Direct Delivery System to hospitals and CHCs.
Implement Cross Docking (phased implementation in line with
funding envelope.

ANNUAL PERFORMANCE PLAN 2018/19 – 2020/21
207
Fighting Disease, FIghting Poverty, Giving Hope
PROGRAMME 8: HEALTH FACILITIES MANAGEMENT
Programme Purpose
Provision of new health facilities and the refurbishment, upgrading and maintenance of existing health
facilities - there are no changes to the structure of Programme 8.
Sub-Programme 8.1: Community Health Facilities
Construction of new facilities and refurbishment, upgrading and maintenance of existing Community
Health Centres and Primary Health Care clinics and facilities
Sub-Programme 8.2: Emergency Medical Services
Construction of new facilities and refurbishment, upgrading and maintenance of existing EMS facilities
Sub-Programme 8.3: District Hospitals
Construction of new facilities and refurbishment, upgrading and maintenance of existing District
Hospitals
Sub-Programme 8.4: Provincial (Regional) Hospital Services
Construction of new facilities and refurbishment, upgrading and maintenance of existing Provincial/
Regional Hospitals and Specialised Hospitals
Sub-Programme 8.5: Central Hospital Services
Construction of new facilities and refurbishment, upgrading and maintenance of existing Tertiary and
Central Hospitals
Sub-Programme 8.6: Other Facilities
Construction of new facilities and refurbishment, upgrading and maintenance of other health facilities
including Forensic Pathology facilities and Nursing Colleges and Schools

ANNUAL PERFORMANCE PLAN 2018/19 – 2020/21
208
Fighting Disease, FIghting Poverty, Giving Hope
2018/19 Priorities
Priorities Key Focus Areas
Completion of Infrastructure Projects
as per U-AMP
(See Part C: Infrastructure Project
Plan for details)
• Construction of Dr Pixley ka Isaka Seme Regional Hospital.
• Ngwelezana Tertiary Hospital: Construction of the new 192-
bedded Surgical Wards.
• Construction of the new Jozini CHC.
• Construction of Groutville replacement to extra-large clinic.
• King Edward Hospital: Upgrade of the nursery incorporating
Maternity Ward Hot Water System Restoration; Unblocking
of storm drainage and replacement of roofs.
• Hlabisa Hospital: Upgrade of Outpatient Department.
• Stanger and Port Shepstone Hospitals: Construction of new
25 bedded Psychiatric Units.
• Osindisweni Hospital: Construction of MDR-TB Wards.
• Catherine Booth Hospital: Refurbishing and renovating
existing maternity, male and female wards.
• King Dinuzulu Hospital: Infrastructure Maintenance Hub in
eThekwini; New Psychiatric Complex Phase 2 (Completion
Contract); New TB Complex (Completion Contract).
• St Apollinaris Hospital: Reconfiguring existing building to
provide for a Neonatal Nursery.
• GJ Crookes Hospital: Upgrade of the roof and plumbing in
the maternity ward.
Maintenance of all hospitals • Water Storage Tanks.
• Resuscitation of boreholes especially in rural areas.
• Generators for back-up power during power failure.
• Autoclaves and air conditioners in theatres.
Dundee Regional Laundry • Replacement of laundry equipment.
Improve EMS efficiencies • Wash bays.

ANNUAL PERFORMANCE PLAN 2018/19 – 2020/21
209
Fighting Disease, FIghting Poverty, Giving Hope
Strategic Objectives, Indicators and Targets
Table 88: Strategic Plan 2015-2019 Targets
Strategic Goal Strategic Objective Strategic Objective Statement Indicator Target 2019/20
Strategic Goal 1:
Strengthen health
system effectiveness
3.2) Create job opportunities 3.2.1) Create 11 800 jobs through the Expanded Public Works
Programme by March 2020 (cumulative)
Number of jobs created through the EPWP 11 800
Strategic Goal 3:
Universal health
coverage
3.3) Improve health facility
planning and infrastructure
delivery
3.3.1) Complete 40 new and replaced projects by March 2020 (Added
2017/18)
Number of new and replaced projects
completed (Added 2017/18)
40 (Reviewed 2017/18)
3.3.2) Complete 47 upgrade and addition projects by March 2020
(Added 2017/18)
Number of upgrade and addition projects
completed (Added 2017/18)
47 (Reviewed 2017/18)
3.3.3.) Complete 24 renovation and refurbishment projects by March
2020 (Added 2017/18)
Number of renovation and refurbishment
projects completed (Added 2017/18)
24 (Reviewed 2017/18)
Table 89: (HFM1) Strategic Objectives, Indicators and Targets
Strategic
Objective
Statement
Performance Indicator Data Source Frequency/
Type
Audited/ Actual Performance Estimated
Performance
2017/18
Medium Term Targets Strategic
Plan Target
2019/20 2014/15 2015/16 2016/17 2018/19 2019/20 2020/21
Strategic Objective 3.3: Improved health facility planning and infrastructure delivery
3.3.4) Major and
minor
refurbishment
completed as
per approved
Infrastructure
Plan
1. Number of health
facilities that
have undergone
major and minor
refurbishment in
NHI Pilot District
IRM; PMIS
and Monthly
Reports
Annual
No
Not reported Not reported 50 148 148
Clinics: 131
Hospitals:17
148
Clinics: 131
Hospitals:17
148
Clinics: 131
Hospitals:17
-
2. Number of health
facilities that
have undergone
major and minor
refurbishment
outside NHI Pilot
District
(excluding
facilities in NHI
Pilot Districts).
IRM; PMIS
and Monthly
Reports
Annual
No
Not reported Not reported 50 464 464
Clinics: 410
Hospitals: 54
464
Clinics: 410
Hospitals: 54
464
Clinics: 410
Hospitals: 54
-

ANNUAL PERFORMANCE PLAN 2018/19 – 2020/21
210
Fighting Disease, FIghting Poverty, Giving Hope
Strategic
Objective
Statement
Performance Indicator Data Source Frequency/
Type
Audited/ Actual Performance Estimated
Performance
2017/18
Medium Term Targets Strategic
Plan Target
2019/20 2014/15 2015/16 2016/17 2018/19 2019/20 2020/21
Strategic Objective 3.2: Create job opportunities
3.2.1) Create
11,800 jobs
through the
Expanded
Public Works
Programme
(EPWP) by
March 2020
(cumulative)
3. Number of jobs
created through
the EPWP
IRS and
EPWP
Quarterly
Reports
Quarterly
No
4 982 2 084 2 621 2 869 4 971 4 971 4 971 11 800
Strategic Objective 3.3: Improved health facility planning and infrastructure delivery
3.3.1) Complete
40 new and
replacement
projects by
March 2020
4. Number of new
and
replacement
projects
completed
IRM, PMIS
and monthly
reports
Quarterly
No
Not reported Not reported Not reported 11 11 14 16 40
3.3.2) Complete
47 upgrade and
addition
projects by
March 2020
5. Number of
upgrade and
addition projects
completed
IRM, PMIS
and monthly
reports
Quarterly
No
Not reported Not reported Not reported 14 14 11 12 47
3.3.3) Complete
24 renovation
and
refurbishment
projects by
March 2020
6. Number of
renovation and
refurbishment
projects
completed
IRM, PMIS
and monthly
reports
Quarterly
No
Not reported Not reported Not reported 12 12 5 4 24
3.3.5) 100% of
maintenance
budget spent
annually
7. Percentage of
maintenance
and repairs
budget spent
BAS Quarterly
%
102% 108.28% 99% 67% 100% 100% 100% -
Maintenance
budget
expenditure
BAS R’000 R 233 207 R 196 250 R 285 079 R 131 000 R 140 000 R 140 000 R 150 000
Total
maintenance
budget
BAS R’000 R 211 595 R 212 495 R 287 079 R 195.5 000 R 140 000 R 140 000 R 150 000

ANNUAL PERFORMANCE PLAN 2018/19 – 2020/21
211
Fighting Disease, FIghting Poverty, Giving Hope
2017/18 Targets
Table 90: (HFM3) Quarterly and Annual Targets
Indicators Frequency Type Targets
2018/19
Targets
Q1 Q2 Q3 Q4 Annual
1. Number of health facilities
that have undergone
major and minor
refurbishment in NHI Pilot
Districts
Annual No 148 - - - - 148
2. Number of health facilities
that have undergone
major and minor
refurbishment outside NHI
Pilot District (excluding
facilities in NHI Pilot
District.
Annual No 464 - - - - 464
3. Number of jobs created
through the EPWP
Quarterly No 4 971 1 243 1 243 1 243 1 242 4 971
4. Number of new and
replacement projects
completed
Annual No 11 - - - - 11
5. Number of upgrade and
addition projects
completed
Annual No 14 - - - - 14
6. Number of renovation
and refurbishment
projects completed
Annual No 12 - - - - 12
7. Percentage of
maintenance and repairs
budget spent
Quarterly % 100% 25% 50% 75% 100% 100%

ANNUAL PERFORMANCE PLAN 2018/19 – 2020/21
212
Fighting Disease, Fighting Poverty, Giving Hope
Reconciling Performance Targets with Expenditure Trends
Table 91: (HFM4 a) Expenditure Estimates (R’000)
Sub-Programme Audited Expenditure Outcomes Main
Appropriation
Adjusted
Appropriation
Revised
Estimate Medium Term Expenditure Estimates
R’000 2014/15 2015/16 2016/17 2017/18 2018/19 2019/20 2020/21
Community Health Facilities 443 562 184 965 142 856 165 800 133 051 113 914 153 121 173 782 183 341
District Hospital Services 476 652 207 502 165 189 240 000 138 772 142 338 246 538 315 136 352 469
Emergency Medical Services - - - - - - - - -
Provincial Hospital Services 500 232 848 813 863 523 849 184 875 913 994 259 831 872 744 089 618 081
Central Hospital Services 18 685 29 896 22 601 103 819 29 062 29 659 87 628 61 199 64 565
Other Facilities 239 906 246 442 226 406 297 725 281 180 235 557 209 497 234 007 240 796
Sub-Total 1 679 037 1 517 618 1 420 575 1 656 528 1 457 978 1 515 727 1 528 656 1 528 213 1 459 252
Unauthorized expenditure (1st charge)
not available for spending
- - - - - - - - -
Baseline available for spending after 1st
charge
1 679 037 1 517 618 1 420 575 1 656 528 1 457 978 1 515 727 1 528 656 1 528 213 1 459 252

ANNUAL PERFORMANCE PLAN 2018/19 – 2020/21
213
Fighting Disease, Fighting Poverty, Giving Hope
Table 92: (HFM4 b) Summary of Provincial Expenditure Estimates by Economic Classification (R’000)
Economic Classification Audited Expenditure Outcomes Main
Appropriation
Adjusted
Appropriation
Revised
Estimate Medium-Term Expenditure Estimates
R’000 2014/15 2015/16 2016/17 2017/18 2018/19 2019/20 2020/21
Current payments 379 132 375 853 419 726 460 421 432 369 431 305 496 246 547 580 621 667
Compensation of employees 24 158 33 986 43 022 51 400 55 096 57 296 58 496 51 346 53 397
Goods and services 354 974 341 867 376 704 409 021 377 273 374 009 437 750 496 234 568 270
Communication 4 53 - - - - - - -
Computer Services - 211 - - - - - - -
Consultants, Contractors and special services 104 052 84 903 110 408 123 819 5 950 5 860 - 2 112 2 228
Inventory 7 938 17 667 34 115 15 612 9 753 12 192 33 670 18 752 19 783
Operating leases 75 684 87 257 83 109 100 000 99 184 102 633 98 421 98 541 98 653
Travel and subsistence 194 561 302 2 000 1 100 1 192 - - -
Interest and rent on land - - - - - - - - -
Maintenance, repair and running costs - - - - - - - - -
Other including Assets<5000, training and
development, property payments, operating
expenditure and venues and facilities
167 102 151 215 148 770 167 590 261 286 252 132 305 659 376 829 447 606
Transfers and subsidies to 37 20 000 - - - - - - -
Provinces and municipalities - - - - - - - - -
Departmental agencies and accounts - - - - - - - - -
Universities and Technikons - - - - - - - - -
Non-profit institutions - 20 000 - - - - - - -
Households 37 - - - - - - - -
Payments for capital assets 1 299 868 1 121 765 1 000 849 1 196 107 1 025 609 1 084 422 1 032 410 980 633 837 585
Buildings and other fixed structures 908 917 819 107 923 450 969 867 963 192 743 360 646 960 908 917 819 107

ANNUAL PERFORMANCE PLAN 2018/19 – 2020/21
214
Fighting Disease, Fighting Poverty, Giving Hope
Economic Classification Audited Expenditure Outcomes Main
Appropriation
Adjusted
Appropriation
Revised
Estimate Medium-Term Expenditure Estimates
R’000 2014/15 2015/16 2016/17 2017/18 2018/19 2019/20 2020/21
Machinery and equipment 93 573 69 712 91 932 377 000 102 159 114 555 69 218 237 273 190 625
Software and other tangible assets - - - - - - - - -
Payment for financial assets - - - - - - - - -
Total economic classification 1 679 037 1 517 618 1 420 575 1 656 528 1 457 978 1 515 727 1 528 656 1 528 213 1 459 252

ANNUAL PERFORMANCE PLAN 2018/19 – 2020/21
215
Fighting Disease, Fighting Poverty, Giving Hope
Performance and Expenditure Trends
Programme 8 (Health Facilities Management) is allocated 3.43 per cent of the 2018/19 Vote 7 allocation
compared to 4.2 per cent of the revised estimate for 2017/18. This translates to a decrease of R165 351
million.
Sub-programme Community Health Facilities are allocated 9.30 per cent of the Programme 8 allocation
for 2018/19 compared to 10 per cent of the revised estimate for 2017/18. This amounts to a decrease of
R31 051 million.
Sub-programme District Hospitals are allocated 16.32 per cent of the Programme 8 allocation for
2018/19 compared to 14.5 per cent of the revised estimate for 2017/18. This amounts to an increase of
R29 599 million.
Sub-programme Provincial Hospitals are allocated 53.87 per cent of the Programme 8 allocation for
2018/19 compared to 51.3 per cent of the revised estimate for 2017/18. This amounts to a decrease of
R90 338 million.
Sub-programme Central Hospitals are allocated 6.75 per cent of the Programme 8 allocation for
2018/19 compared to 6.3 per cent of the revised estimate for 2017/18. This amounts to a decrease of
R4 204 million.
Sub-programme Other Facilities are allocated 13.73 per cent of the Programme 8 allocation for 2018/19
compared to 18 per cent of the revised estimate for 2017/18. This amounts to a decrease of R69 357
million.
Risk Management
Table 93: Risk Management
Potential Risks Mitigating Strategies
Delays in procurement Intervention by National Treasury and National Department of
Health.
Delays in projects
completion
Strengthen monitoring of consultants and contracts.
Impose penalties on late delivery.
Continuously reducing
infrastructure budget
Reprioritize projects.
New projects placed on hold.
Focus on maintenance.
Investigate non-infrastructure solutions.
Service delivery constraints
due to drought
Increase number of facilities with boreholes.
Install static tanks where applicable.
Use water wise fittings.
Ongoing disputes at the
new Dr Pixley ka Isaka
Seme Regional Hospital
Use monthly progress meetings to resolve disputes.
Appoint legal experts to defend the Department.

ANNUAL PERFORMANCE PLAN 2018/19 – 2020/21
216
Fighting Disease, Fighting Poverty, Giving Hope
NOTES
……………………………………………………………………………………………………………………………………
……………………………………………………………………………………………………………………………………
……………………………………………………………………………………………………………………………………
……………………………………………………………………………………………………………………………………
……………………………………………………………………………………………………………………………………
……………………………………………………………………………………………………………………………………
……………………………………………………………………………………………………………………………………
……………………………………………………………………………………………………………………………………
……………………………………………………………………………………………………………………………………
……………………………………………………………………………………………………………………………………
……………………………………………………………………………………………………………………………………
……………………………………………………………………………………………………………………………………
……………………………………………………………………………………………………………………………………
……………………………………………………………………………………………………………………………………
……………………………………………………………………………………………………………………………………
……………………………………………………………………………………………………………………………………
……………………………………………………………………………………………………………………………………
…………………………………………………………………………………………………………………………………..

ANNUAL PERFORMANCE PLAN 2018/19 – 2020/21
217
Fighting Disease, Fighting Poverty, Giving Hope
PART C: LINK TO OTHER PLANS
Infrastructure Plan
Conditional Grants
Public Entities
Public Private Partnership
Conclusion

ANNUAL PERFORMANCE PLAN 2018/19 – 2020/21
218
Fighting Disease, Fighting Poverty, Giving Hope
NOTES
……………………………………………………………………………………………………………………………………
……………………………………………………………………………………………………………………………………
……………………………………………………………………………………………………………………………………
……………………………………………………………………………………………………………………………………
……………………………………………………………………………………………………………………………………
……………………………………………………………………………………………………………………………………
……………………………………………………………………………………………………………………………………
……………………………………………………………………………………………………………………………………
……………………………………………………………………………………………………………………………………
……………………………………………………………………………………………………………………………………
……………………………………………………………………………………………………………………………………
……………………………………………………………………………………………………………………………………
……………………………………………………………………………………………………………………………………
……………………………………………………………………………………………………………………………………
……………………………………………………………………………………………………………………………………
……………………………………………………………………………………………………………………………………
……………………………………………………………………………………………………………………………………
…………………………………………………………………………………………………………………………………….

ANNUAL PERFORMANCE PLAN 2018/19 – 2020/21
219
Fighting Disease, Fighting Poverty, Giving Hope
Infrastructure Plan
The aging infrastructure and consequent infrastructure demands requires significant investment, which
has put immense pressure on the limited infrastructure budget.
Challenges with contractors delayed a number of projects in 2017/18 with significant cost and
commissioning implications. The Department accelerated the appointment of built environment
professionals at Head Office with the aim to improve infrastructure planning, oversight on project
implementation and maintenance.
Various Units within the Department have input towards development of the User Asset Management
Plan (U-AMP), Infrastructure Programme Management Plan (IPMP), and Annual Implementation Plan
(AIP). All plans have been costed to ensure effective management and compliance with the Public
Finance Management Act (PFMA) imperatives. The Department is using the Department of Public
Works (DoPW) as Implementing Agent but the Department is also implementing some projects in-house.
The 2018/19 Annual Implementation Plan is focusing on the following main priorities:
Construction of the new 500-bedded Dr Pixley ka Isaka Seme Regional Hospital in the KwaMashu,
Inanda, Ntuzuma INK area: Due for completion in June 2019.
Ngwelezana Tertiary Hospital: Construction of the new 192-bedded Surgical Wards - Practical
completion due at the end of April 2018.
Construction of the new Jozini CHC: Practical completion was taken on 15 December 2017. It is
anticipated that the CHC will be fully operational by 1 April 2018.
Construction of Groutville Clinic: Replacement of the existing clinic with an extra-large clinic
making provision for a PMTCT Unit. The project is at 20% completion and is expected to be finalised
by 14 November 2018.
King Edward Hospital: Upgrade of the nursery, which is incorporating a Maternity Ward Hot Water
System Restoration. The project has been awarded and will commence on site in March 2018.
King Edward Hospital: Unblocking of Storm Drainage, which also incorporates the replacement of
roofs. Practical completion is due in May 2018.
Hlabisa Hospital: Upgrade of the Outpatient Department. The project is at the final stages of being
awarded and is expected to be on site by end of March 2018.
There are also Projects in the Planning Stage on the Annual Implementation Plan for 2018/19 Financial
Year including:
Stanger Hospital: Construction of a new 25 bedded Psychiatric Unit.
Port Shepstone Hospital: Construction of a new 25 bedded Psychiatric Unit.
Osindisweni Hospital: Construction of MDR-TB Wards.
Catherine Booth Hospital: Refurbishing and renovating existing maternity, male and female wards.
King Dinuzulu Hospital: Infrastructure Maintenance Hub in eThekwini.
King Dinuzulu Hospital: New Psychiatric Hospital Phase 2 (Completion Contract).
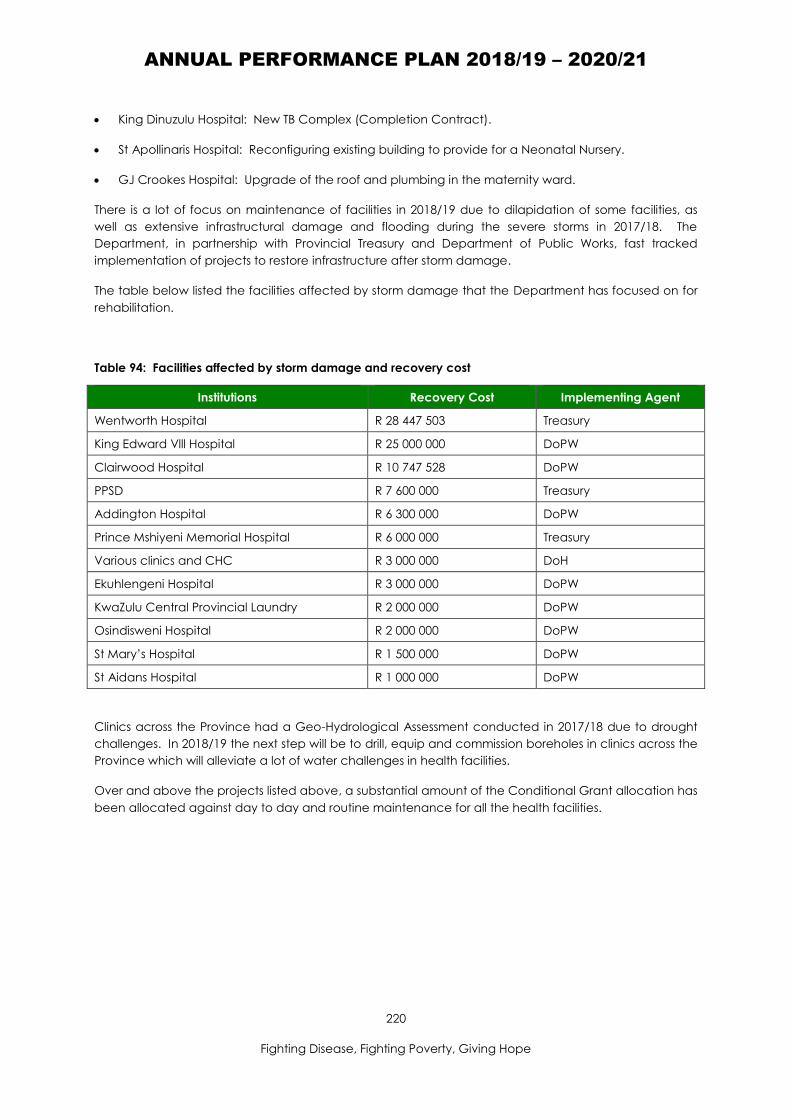
ANNUAL PERFORMANCE PLAN 2018/19 – 2020/21
220
Fighting Disease, Fighting Poverty, Giving Hope
King Dinuzulu Hospital: New TB Complex (Completion Contract).
St Apollinaris Hospital: Reconfiguring existing building to provide for a Neonatal Nursery.
GJ Crookes Hospital: Upgrade of the roof and plumbing in the maternity ward.
There is a lot of focus on maintenance of facilities in 2018/19 due to dilapidation of some facilities, as
well as extensive infrastructural damage and flooding during the severe storms in 2017/18. The
Department, in partnership with Provincial Treasury and Department of Public Works, fast tracked
implementation of projects to restore infrastructure after storm damage.
The table below listed the facilities affected by storm damage that the Department has focused on for
rehabilitation.
Table 94: Facilities affected by storm damage and recovery cost
Institutions Recovery Cost Implementing Agent
Wentworth Hospital R 28 447 503 Treasury
King Edward Vlll Hospital R 25 000 000 DoPW
Clairwood Hospital R 10 747 528 DoPW
PPSD R 7 600 000 Treasury
Addington Hospital R 6 300 000 DoPW
Prince Mshiyeni Memorial Hospital R 6 000 000 Treasury
Various clinics and CHC R 3 000 000 DoH
Ekuhlengeni Hospital R 3 000 000 DoPW
KwaZulu Central Provincial Laundry R 2 000 000 DoPW
Osindisweni Hospital R 2 000 000 DoPW
St Mary’s Hospital R 1 500 000 DoPW
St Aidans Hospital R 1 000 000 DoPW
Clinics across the Province had a Geo-Hydrological Assessment conducted in 2017/18 due to drought
challenges. In 2018/19 the next step will be to drill, equip and commission boreholes in clinics across the
Province which will alleviate a lot of water challenges in health facilities.
Over and above the projects listed above, a substantial amount of the Conditional Grant allocation has
been allocated against day to day and routine maintenance for all the health facilities.
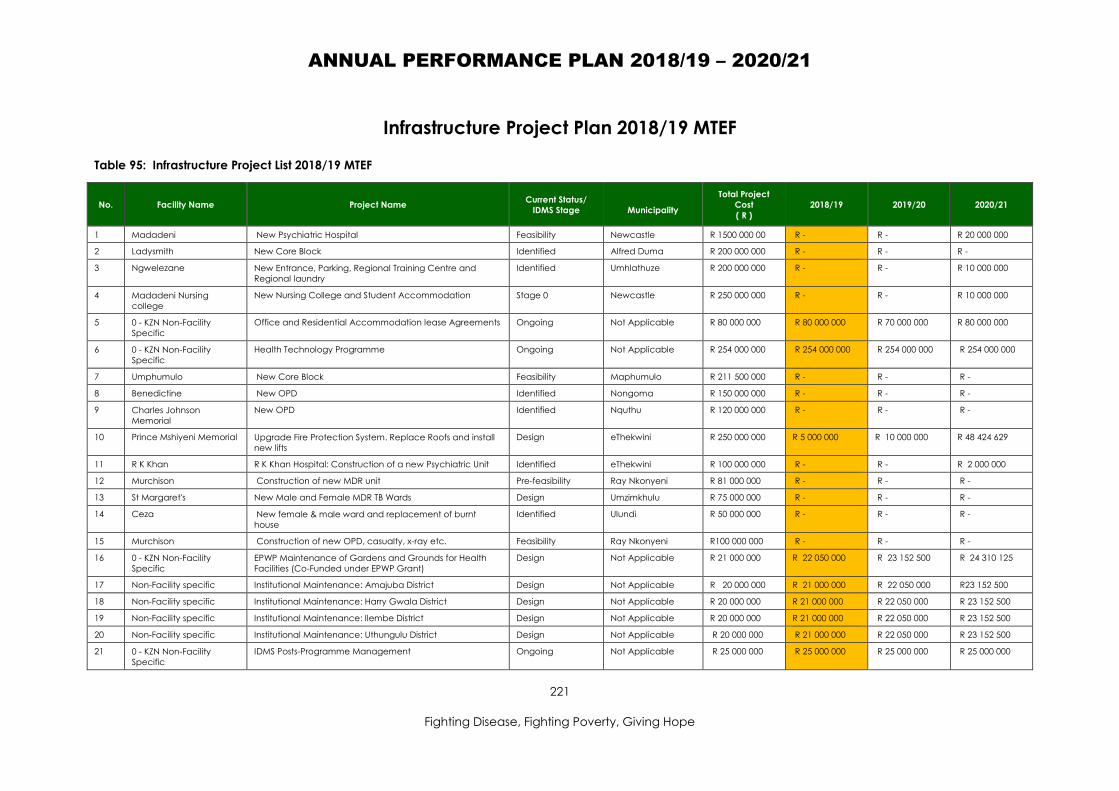
ANNUAL PERFORMANCE PLAN 2018/19 – 2020/21
221
Fighting Disease, Fighting Poverty, Giving Hope
Infrastructure Project Plan 2018/19 MTEF
Table 95: Infrastructure Project List 2018/19 MTEF
No. Facility Name Project Name Current Status/
IDMS Stage
Municipality
Total Project
Cost
( R )
2018/19 2019/20 2020/21
1 Madadeni New Psychiatric Hospital Feasibility Newcastle R 1500 000 00 R - R - R 20 000 000
2 Ladysmith New Core Block Identified Alfred Duma R 200 000 000 R - R - R -
3 Ngwelezane New Entrance, Parking, Regional Training Centre and
Regional laundry
Identified Umhlathuze R 200 000 000 R - R - R 10 000 000
4 Madadeni Nursing
college
New Nursing College and Student Accommodation Stage 0 Newcastle R 250 000 000 R - R - R 10 000 000
5 0 - KZN Non-Facility
Specific
Office and Residential Accommodation lease Agreements Ongoing Not Applicable R 80 000 000 R 80 000 000 R 70 000 000 R 80 000 000
6 0 - KZN Non-Facility
Specific
Health Technology Programme Ongoing Not Applicable R 254 000 000 R 254 000 000 R 254 000 000 R 254 000 000
7 Umphumulo New Core Block Feasibility Maphumulo R 211 500 000 R - R - R -
8 Benedictine New OPD Identified Nongoma R 150 000 000 R - R - R -
9 Charles Johnson
Memorial
New OPD Identified Nquthu R 120 000 000 R - R - R -
10 Prince Mshiyeni Memorial Upgrade Fire Protection System. Replace Roofs and install
new lifts
Design eThekwini R 250 000 000 R 5 000 000 R 10 000 000 R 48 424 629
11 R K Khan R K Khan Hospital: Construction of a new Psychiatric Unit Identified eThekwini R 100 000 000 R - R - R 2 000 000
12 Murchison Construction of new MDR unit Pre-feasibility Ray Nkonyeni R 81 000 000 R - R - R -
13 St Margaret's New Male and Female MDR TB Wards Design Umzimkhulu R 75 000 000 R - R - R -
14 Ceza New female & male ward and replacement of burnt
house
Identified Ulundi R 50 000 000 R - R - R -
15 Murchison Construction of new OPD, casualty, x-ray etc. Feasibility Ray Nkonyeni R100 000 000 R - R - R -
16 0 - KZN Non-Facility
Specific
EPWP Maintenance of Gardens and Grounds for Health
Facilities (Co-Funded under EPWP Grant)
Design Not Applicable R 21 000 000 R 22 050 000 R 23 152 500 R 24 310 125
17 Non-Facility specific Institutional Maintenance: Amajuba District Design Not Applicable R 20 000 000 R 21 000 000 R 22 050 000 R23 152 500
18 Non-Facility specific Institutional Maintenance: Harry Gwala District Design Not Applicable R 20 000 000 R 21 000 000 R 22 050 000 R 23 152 500
19 Non-Facility specific Institutional Maintenance: Ilembe District Design Not Applicable R 20 000 000 R 21 000 000 R 22 050 000 R 23 152 500
20 Non-Facility specific Institutional Maintenance: Uthungulu District Design Not Applicable R 20 000 000 R 21 000 000 R 22 050 000 R 23 152 500
21 0 - KZN Non-Facility
Specific
IDMS Posts-Programme Management Ongoing Not Applicable R 25 000 000 R 25 000 000 R 25 000 000 R 25 000 000

ANNUAL PERFORMANCE PLAN 2018/19 – 2020/21
222
Fighting Disease, Fighting Poverty, Giving Hope
No. Facility Name Project Name Current Status/
IDMS Stage
Municipality
Total Project
Cost
( R )
2018/19 2019/20 2020/21
22 Natalia Building Upgrade Fire Protection System. Identified Msunduzi R 1 500 000 R - R - R -
23 Bethesda Maternity ward & CSSD Identified Jozini R 30 000 000 R - R - R -
24 Gamalakhe Residential Accommodation Identified Ray Nkonyeni R50 000 000 R - R - R -
25 Charles Johnson Nursing
College
New staff Accommodation Identified Nquthu R 45 000 000 R - R - R -
26 Mahatma Ghandi Construction of a Mental Health Care Unit (20 beds and 4
Isolation wards)
Identified eThekwini R 60 000 000 R - R - R -
27 Clairwood Renovations to PPSD Identified eThekwini R 20 000 000 R - R - R -
28 Ixopo New Forensic Medico Legal Mortuary Identified Dr Nkosazana
Dlamini Zuma
R30 000 000 R - R - R -
29 Clairwood Repairs and renovations to FM1 and FM2 for TB Identified eThekwini R 30 000 000 R - R - R -
30 Non-Facility specific Institutional Maintenance: eThekwini District Design Not Applicable R 10 000 000 R10 500 000 R11 025 000 R11 576 250
31 Non-Facility specific Institutional Maintenance: Head Office Design Not Applicable R10 000 000 R10 500 000 R 11 025 000 R1 576 250
32 Non-Facility specific Institutional Maintenance: Ugu District Design Not Applicable R10 000 000 R10 500 000 R11 025 000 R11 576 250
33 Non-Facility specific Institutional Maintenance: Umkhanyakude District Design Not Applicable R 10 000 000 R10 500 000 R 11 025 000 R 11 576 250
34 Non-Facility specific Institutional Maintenance: Umzinyathi District Design Not Applicable R10 000 000 R10 500 000 R11 025 000 R11 576 250
35 Non-Facility specific Institutional Maintenance: Uthukela District Design Not Applicable R10 000 000 R10 500 000 R11 025 000 R 11 576 250
36 Non-Facility specific Institutional Maintenance: Zululand District Design Not Applicable R 10 000 000 R 10 500 000 R 11 025 000 R11 576 250
37 Madadeni New 72-hour Assessment ward Proposed Newcastle R15 000 000 R - R - R
38 Ndelu Replacement of a New clinic small clinic with a Med Design Umzumbe R 70 000 000 R - R - R1 000 000
39 E G & Usher Memorial New Maternity Ward Block & Reorganise existing Wards Identified Greater Kokstad R100 000 000 R - R - R10 000 000
40 Prince Mshiyeni Memorial New 72-hour Assessment ward and upgrade existing Psych
Ward
Identified eThekwini R 20 000 000 R - R - R -
41 Mosvold Nursing College Upgrade Nursing College and new Staff accommodation Identified Jozini R10 000 000 R - R - R -
42 Midlands Laundry (Fort
Napier)
Upgrade Regional Laundry Pre-feasibility Msunduzi R 10 000 000 R - R - R -
43 Benedictine Staff Accommodation Identified Nongoma R 30 000 000 R - R - R -
44 Christ the King Upgrade children’s ward Identified Ubuhlebezwe R10 000 000 R - R - R -
45 Greytown Building Of New TB Ward Identified Umvoti R10 000 000 R - R - R -
46 Fort Napier Upgrading of ward 17 Identified Msunduzi R 8 000 000 R - R - R -
47 KZN Non-Facility Specific Food Services : Cold Rooms Pre-feasibility Not Applicable R 22 000 000 R - R - R5 000 000
48 Nkonjeni Build a new Neonatal facility & renovate existing Design Ulundi R 32 250 000 R - R - R -
49 Wentworth Renovation Of OPD And Upgrade Gateway Clinic Identified eThekwini R10 000 000 R - R - R -

ANNUAL PERFORMANCE PLAN 2018/19 – 2020/21
223
Fighting Disease, Fighting Poverty, Giving Hope
No. Facility Name Project Name Current Status/
IDMS Stage
Municipality
Total Project
Cost
( R )
2018/19 2019/20 2020/21
50 Grey's Hospital Expansion of main stores Identified Msunduzi R 5 000 000 R - R - R -
51 Wentworth Replace Asbestos Roofs including walkways at the hospital Identified eThekwini R 65 000 000 R - R - R1 000 000
52 McCord's Refurbishment of abandoned admin block floors (1st &
2nd floors)
Design eThekwini R 23 000 000 R - R - R -
53 King Edward VIII Renovations to S-Block, Replace walkways and reroute
services
Identified eThekwini R50 000 000 R - R - R -
54 Murchison Build a new 72-hour observation unit Identified Ray Nkonyeni R15 000 000 R - R - R -
55 Mseleni Upgrade sewer on the eastern side of the to eliminate all
septic tanks and provide pump to the sewer ponds
Identified Umhlabuyalingana R 5 000 000 R - R - R -
56 King Edward VIII Replace roof and renovate Nursing College Identified eThekwini R 30 000 000 R - R - R -
57 KZN Non-Facility Specific Radio Repeater High Sites Maintenance and Licencing Identified Not Applicable R 3 500 000 R3 500 000 R 3 500 000 R3 500 000
58 Natalia Building Carpet Removal from Office Floor Walls Identified Msunduzi R 30 000 000 R - R - R2 000 000
59 KwaZulu Provincial
Central Laundry
Provincial Laundry - 3 yrs Facilities Management Contract Identified eThekwini R11 500 000 R 3 000 000 R 3 000 000 R 3 000 000
60 Port Shepstone Construction of new accommodation Staff Identified Ray Nkonyeni R 35 000 000 R - R - R -
61 Eshowe Building of 20 lockable garage for Government vehicles
and construction of internal roads
Identified uMlalazi R 3 000 000 R - R - R -
62 Non-Facility specific Institutional Maintenance: Umgungundlovu District Design Not Applicable R 1 559 700 R1 637 685 R1 719 569 R1 805 547
63 Madadeni Upgrade to steam line installation of new water reservoir Feasibility Newcastle R39 000 000 R - R - R2 000 000
64 Ekuhlengeni Life Care Replace the Star-Building and convert existing Dining Hall
to Admin Offices
Identified eThekwini R 30 000 000 R - R - R 2 000 000
65 Mseleni Replacement of existing fence Identified Umhlabuyalingana R 2 000 000 R - R - R -
66 Mkhuze New Forensic Medico Legal Mortuary Identified Big Five Hlabisa R30 000 000 R - R - R -
67 Ladysmith Upgrade/Replace existing Psychiatric Unit Identified Alfred Duma R60 000 000 R - R - R -
68 E G & Usher Memorial Proper Medical waste area room Identified Greater Kokstad R2 000 000 R - R - R -
69 E G & Usher Memorial Water reticulation pipes replacement Identified Greater Kokstad R 2 000 000 R - R - R -
70 Dr Pixley ka Isaka Seme
Memorial
Bridge City Levy Ongoing for
project duration
eThekwini R1 134 000 R 1 134 000 R 1 134 000 R 1 134 000
71 Ngwelezane New PTS Hubs Identified Umhlathuze R15 000 000 R - R - R -
72 Grey's Hospital Construction of the Antenatal Clinic and new Gastro and
SOPD Clinic
Identified Msunduzi R10 000 000 R - R - R -
73 Natalia Building Upgrade Eastern Plaza for additional Parking and Fire
Fighting Access
Identified Msunduzi R 10 000 000 R - R - R -
74 Ladysmith New Forensic Medico Legal Mortuary Identified Alfred Duma R 30 000 000 R - R - R 2 000 000

ANNUAL PERFORMANCE PLAN 2018/19 – 2020/21
224
Fighting Disease, Fighting Poverty, Giving Hope
No. Facility Name Project Name Current Status/
IDMS Stage
Municipality
Total Project
Cost
( R )
2018/19 2019/20 2020/21
75 Catherine Booth Build MDR new pharmacy Identified Amatikulu R 2 000 000 R - R - R -
76 Rosary Rosary Clinic- Replace existing Clinic Feasibility Newcastle R 70 000 000 R - R - R -
77 Mbongolwane New maternity ward Identified uMlalazi R15 000 000 R - R - R -
78 Mahatma Ghandi Extension of the existing Pharmacy Department for ARV
service
Identified eThekwini R 7 000 000 R - R - R -
79 Madadeni Gateway Upgrade Gateway clinic to ideal status Feasibility Newcastle R 30 000 000 R - R - R -
80 Grey's Hospital Theatre Modification Identified Msunduzi R 35 000 000 R - R - R -
81 Eshowe Upgrading of Mortuary and Laundry building Identified uMlalazi R 5 000 000 R - R - R -
82 Elim Construction of Replacement Small Clinic Identified Umuziwabantu R 70 000 000 R - R - R -
83 Charles Johnson
Memorial
New Paediatric Ward Identified Nquthu R 10 000 000 R - R - R -
84 Charles Johnson
Memorial
Upgrade water and sewer services Identified Nquthu R 10 000 000 R - R - R -
85 Catherine Booth New staff Accommodation for 50 staff (Nursing staff and
students)
Identified Amatikulu R 40 000 000 R - R - R -
86 Untunjambili New staff Accommodation for staff Identified Maphumulo R 40 000 000 R - R - R 1 000 000
87 Pietermaritzburg New PTS Hubs Identified Msunduzi R 11 500 000 R - R - R -
88 Stanger Replacement of Entire Roof In OPD, and Surgical Wards Identified KwaDukuza R 20 000 000 R - R - R 500 000
89 Christ the King Completion Contract: Staff Accommodation Identified Ubuhlebezwe R 5 000 000 R - R - R -
90 Umphumulo New 72 hour assessment ward Identified Maphumulo R10 000 000 R - R - R -
91 R K Khan Upgrading and renovations to staff residences Identified eThekwini R 10 000 000 R - R - R -
92 Queensburgh Repairs to the building and provision of fire escape Identified eThekwini R 2 000 000 R - R - R -
93 Mbongolwane Upgrade mortuary Identified uMlalazi R 5 000 000 R - R - R -
94 Edendale Nursing
College
Additional classrooms Stage 3 Msunduzi R 4 000 000 R - R - R -
95 Sokhela Clinic Expansion to include Hast Unit and Midwife Obstetric
Unit
Design Dr Nkosazana
Dlamini Zuma
R 8 000 000 R - R - R -
96 Vryheid New Forensic Medico Legal Mortuary Identified Abaqulusi R 30 000 000 R - R - R -
97 Ngwelezane New 8-Theatre block and Crisis Centre Feasibility Umhlathuze R 710 659 526 R 30 000 000 R 80 000 000 R 200 000 000
98 Umlazi V Replacement of existing clinic Identified eThekwini R 150 000 000 R 5 000 000 R 3 952 930 R 60 000 000
99 Dundee Regional
Laundry
Upgrade Regional Laundry: Phase 2 Planning Dannhauser R 60 000 000 R - R - R 10 000 000
100 Umzimkhulu New Forensic Psychiatric Unit and staff accommodation Design Umzimkhulu R 200 000 000 R 5 000 000 R 40 000 000 R 100 000 000

ANNUAL PERFORMANCE PLAN 2018/19 – 2020/21
225
Fighting Disease, Fighting Poverty, Giving Hope
No. Facility Name Project Name Current Status/
IDMS Stage
Municipality
Total Project
Cost
( R )
2018/19 2019/20 2020/21
101 Itshelejuba Replacement of perimeter fence Identified Uphongolo R 3 000 000 R - R - R -
102 Mosvold Construction of 40Units Block of Staff Accommodation
and Paediatric Unit
Identified Jozini R 80 000 000 R 1 000 000 R 3 000 000 R 30 000 000
203 Benedictine Replacement of the roof and upgrade water reticulation Identified Nongoma R 50 000 000 R - R 2 000 000 R 20 000 000
104 Bethesda Staff residences Identified Jozini R 50 000 000 R - R 1 000 000 R 5 000 000
105 King Dinuzulu Hospital Rehabilitation of vacant building for 72-hour Assessment
ward
Identified eThekwini R 2 500 000 R - R - R -
106 eDumbe Residential Accommodation Identified eDumbe R 50 000 000 R - R - R 4 000 000
107 Church of Scotland New staff Accommodation for staff Feasibility Msinga R 30 000 000 R - R - R 5 000 000
108 Ceza Replacement of Perimeter Fence Identified Ulundi R 2 000 000 R - R - R 2 000 000
109 Nseleni Construction of new Helipad and Ablution block Identified Umhlathuze R 2 000 000 R - R - R -
110 St Margaret's Temporary storage for health care risk waste Identified Umzimkhulu R 1 000 000 R - R - R -
111 Northdale Nurses Home Rooms & Convert into Flatlets Design Msunduzi R 66 000 000 R - R - R 6 000 000
112 Manguzi Camp New Overnight accommodation Pre-feasibility Umhlabuyalingana R 1 000 000 R - R - R -
113 KZN Non-Facility Specific Investigation Ongoing Not Applicable R 3 000 000 R - R - R 1 000 000
114 KZN Non-Facility Specific Investigation Ongoing Not Applicable R 3 000 000 R - R - R 1 000 000
115 KZN Non-Facility Specific Investigation Ongoing Not Applicable R 3 000 000 R - R - R 1 000 000
116 Itshelejuba Staff accommodation Identified Uphongolo R 23 000 000 R - R - R
117 Newcastle Upgrade Water and Sewer Reticulation Identified Newcastle R 4 800 000 R - R - R 1 000 000
118 Vryheid Upgrading of male and female wards to have isolation
wards. Renovate old Admin
Identified Abaqulusi R10 000 000 R - R - R 500 000
119 St Andrew's Construction of Staff accommodation for 10 Comm. Serve
Doctors
Feasibility Umuziwabantu R 8 000 000 R - R - R 1 000 000
120 Natalia Building Waterproofing of roofs Identified Msunduzi R 6 000 000 R - R - R 1 000 000
121 Ceza Replacement of asbestos roofs Identified Ulundi R 4 000 000 R - R - R 500 000
122 KwaZulu Provincial
Central Laundry
Upgrade and Additions to Central Laundry Identified eThekwini R 10 000 000 R - R - R 2 000 000
123 Emmaus Fencing of Hospital Identified Alfred Duma R 5 000 000 R - R - R 500 000
124 Emmaus Upgrade internal roads and storm water drainage Identified Alfred Duma R 3 000 000 R - R - R 500 000
125 St Andrew's Replacement of 1 x Autoclave (400L single door) Identified Umuziwabantu R 430 000 R 30 000 R - R -
126 Niemeyer Memorial Replacement of 1 x Autoclave (400L single door) Identified Emadlangeni R 430 000 R 30 000 R - R -
127 Christ the King Replacement of Autoclaves Identified Ubuhlebezwe R 430 000 R 30 000 R - R -
128 Hlabisa Upgrade OPD Tender Mtubatuba R 205 000 000 R 60 000 000 R 80 000 000 R 41 000 000

ANNUAL PERFORMANCE PLAN 2018/19 – 2020/21
226
Fighting Disease, Fighting Poverty, Giving Hope
No. Facility Name Project Name Current Status/
IDMS Stage
Municipality
Total Project
Cost
( R )
2018/19 2019/20 2020/21
129 Stanger New 25 bedded Psychiatric Ward Feasibility KwaDukuza R 75 123 414.00 R 20 000 000 R 40 000 000 R 9 123 414
130 Springfield Refurbish existing accommodation as EMS student
accommodation
Construct EMS training college wing
Feasibility eThekwini R 105 000 000 R 10 000 000 R 42 000 000 R 40 000 000
131 Port Shepstone New 25 bedded Psychiatric Unit Design Ray Nkonyeni R 104 127 500 R 10 000 000 R 40 000 000 R 40 000 000
132 Newcastle Amajuba Maintenance Programme - Various buildings and
Electrical installation
Design Newcastle R 95 000 000 R 30 000 000 R 30 000 000 R 30 000 000
133 Catherine Booth Refurbish existing wards Design Amatikulu R 50 000 000 R 10 000 000 R 28 000 000 R 2 000 000
134 Groutville Replacement of existing clinic Tender KwaDukuza R 82 000 000 R 42 215 757 R 28 000 000 R 1 784 243
135 King Edward VIII King Edward VIII Hospital- Renovations to Maternity and
Labour wards
Identified eThekwini R 70 000 000 R 10 000 000 R 27 500 000 R 30 000 000
136 King Edward VIII Upgrade Nursery Design eThekwini R 58 126 291 R 25 000 000 R 25 000 000 R 2 126 291.00
137 R K Khan Replacement of 2x Cooling Towers, Upgrade Existing
Theatres and HVAC
Feasibility eThekwini R 40 000 000 R 4 000 000 R 21 000 000 R 12 000 000
138 St Apollinaris Reconfigure Existing Building To Provide for Neonatal
Nursery
Design Dr Nkosazana
Dlamini Zuma
R 42 822 322 R 6 000 000 R 20 000 000 R 12 000 000
139 King Dinuzulu Hospital New TB Complex (Completion Contract) Design eThekwini R 33 700 000 R 13 000 000 R 18 852 000 R 843 000
140 King Dinuzulu Hospital New Psychiatric Hospital Phase 2 (Completion Contract) Design eThekwini R 35 200 000 R15 000 000 R 18 240 000 R 880 000
141 Dundee Regional
Laundry
Upgrade Regional Laundry: Phase 1 Planning Dannhauser R 60 000 000 R 40 000 000 R 15 000 000 R 3 000 000
142 Dundee Assessment and Upgrade of Air-conditioning System Identified Endumeni R16 000 000 R 3 000 000 R 12 000 000 R 800 000
143 eThekwini Maintenance
Hib
New Maintenance Hub Design eThekwini R 20 000 000 R 10 000 000 R 8 600 000 R -
144 R K Khan RK Khan Hospital Renovations to M-Block visitors ablutions Identified eThekwini R 10 000 000 R 1 000 000 R 8 500 000 R 200 000
145 G J Crookes Upgrade the roof and plumbing in maternity ward Design Umdoni R 15 000 000 R 7 500 000 R 5 250 000 R -
146 Non-district specific Investigate upgrading and rehabilitation of PHC Clinics Identified Non-municipality
specific
R 5 000 000 R 500 000 R 4 500 000 R -
147 Natalia Building Replacement of HVAC Ducting Identified Msunduzi R 15 000 000 R 10 950 000 R 3 450 000 R 600 000
148 Northdale Renovate existing space for a 72-hour observation unit Identified Msunduzi R 2 000 000 R R 2 000 000 R -
149 Ngwelezane Security Upgrade Tender Umhlathuze R 40 000 000 R 23 000 000 R 2 000 000 R -
150 0 - KZN Non-Facility
Specific
Food Services : Repair and replace Freezers Pre-feasibility Not Applicable R 7 000 000 R 1 000 000 R 2 000 000 R 2 000 000
151 Murchison 72 hour water storage Design Ray Nkonyeni R 7 900 000 R 5 360 000.00 R 605 000 R 335 000
152 Murchison Replace Theatre A/C Plant Identified Ray Nkonyeni R 3 000 000 R 1 200 000 R 1 500 000 R100 000
153 Madadeni New Wash bay Identified Newcastle R 2 000 000 R 500 000 R 1 500 000 R -
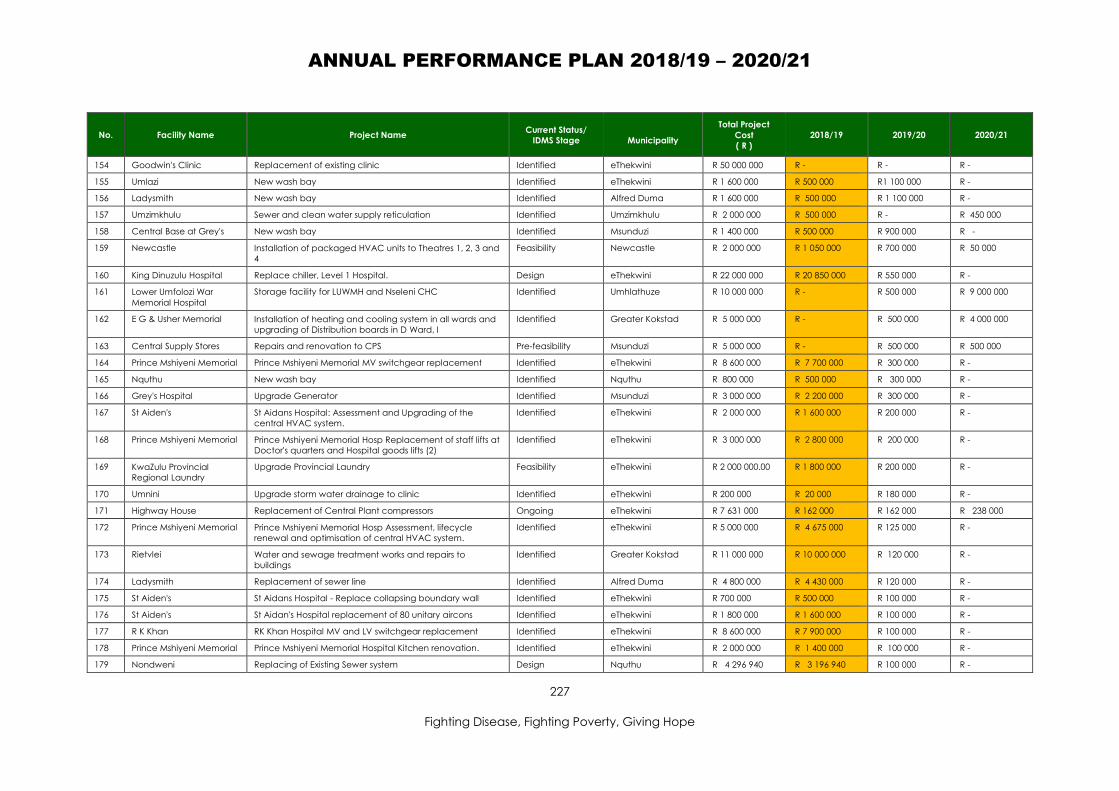
ANNUAL PERFORMANCE PLAN 2018/19 – 2020/21
227
Fighting Disease, Fighting Poverty, Giving Hope
No. Facility Name Project Name Current Status/
IDMS Stage
Municipality
Total Project
Cost
( R )
2018/19 2019/20 2020/21
154 Goodwin's Clinic Replacement of existing clinic Identified eThekwini R 50 000 000 R - R - R -
155 Umlazi New wash bay Identified eThekwini R 1 600 000 R 500 000 R1 100 000 R -
156 Ladysmith New wash bay Identified Alfred Duma R 1 600 000 R 500 000 R 1 100 000 R -
157 Umzimkhulu Sewer and clean water supply reticulation Identified Umzimkhulu R 2 000 000 R 500 000 R - R 450 000
158 Central Base at Grey's New wash bay Identified Msunduzi R 1 400 000 R 500 000 R 900 000 R -
159 Newcastle Installation of packaged HVAC units to Theatres 1, 2, 3 and
4
Feasibility Newcastle R 2 000 000 R 1 050 000 R 700 000 R 50 000
160 King Dinuzulu Hospital Replace chiller, Level 1 Hospital. Design eThekwini R 22 000 000 R 20 850 000 R 550 000 R -
161 Lower Umfolozi War
Memorial Hospital
Storage facility for LUWMH and Nseleni CHC Identified Umhlathuze R 10 000 000 R - R 500 000 R 9 000 000
162 E G & Usher Memorial Installation of heating and cooling system in all wards and
upgrading of Distribution boards in D Ward, I
Identified Greater Kokstad R 5 000 000 R - R 500 000 R 4 000 000
163 Central Supply Stores Repairs and renovation to CPS Pre-feasibility Msunduzi R 5 000 000 R - R 500 000 R 500 000
164 Prince Mshiyeni Memorial Prince Mshiyeni Memorial MV switchgear replacement Identified eThekwini R 8 600 000 R 7 700 000 R 300 000 R -
165 Nquthu New wash bay Identified Nquthu R 800 000 R 500 000 R 300 000 R -
166 Grey's Hospital Upgrade Generator Identified Msunduzi R 3 000 000 R 2 200 000 R 300 000 R -
167 St Aiden's St Aidans Hospital: Assessment and Upgrading of the
central HVAC system.
Identified eThekwini R 2 000 000 R 1 600 000 R 200 000 R -
168 Prince Mshiyeni Memorial Prince Mshiyeni Memorial Hosp Replacement of staff lifts at
Doctor's quarters and Hospital goods lifts (2)
Identified eThekwini R 3 000 000 R 2 800 000 R 200 000 R -
169 KwaZulu Provincial
Regional Laundry
Upgrade Provincial Laundry Feasibility eThekwini R 2 000 000.00 R 1 800 000 R 200 000 R -
170 Umnini Upgrade storm water drainage to clinic Identified eThekwini R 200 000 R 20 000 R 180 000 R -
171 Highway House Replacement of Central Plant compressors Ongoing eThekwini R 7 631 000 R 162 000 R 162 000 R 238 000
172 Prince Mshiyeni Memorial Prince Mshiyeni Memorial Hosp Assessment, lifecycle
renewal and optimisation of central HVAC system.
Identified eThekwini R 5 000 000 R 4 675 000 R 125 000 R -
173 Rietvlei Water and sewage treatment works and repairs to
buildings
Identified Greater Kokstad R 11 000 000 R 10 000 000 R 120 000 R -
174 Ladysmith Replacement of sewer line Identified Alfred Duma R 4 800 000 R 4 430 000 R 120 000 R -
175 St Aiden's St Aidans Hospital - Replace collapsing boundary wall Identified eThekwini R 700 000 R 500 000 R 100 000 R -
176 St Aiden's St Aidan's Hospital replacement of 80 unitary aircons Identified eThekwini R 1 800 000 R 1 600 000 R 100 000 R -
177 R K Khan RK Khan Hospital MV and LV switchgear replacement Identified eThekwini R 8 600 000 R 7 900 000 R 100 000 R -
178 Prince Mshiyeni Memorial Prince Mshiyeni Memorial Hospital Kitchen renovation. Identified eThekwini R 2 000 000 R 1 400 000 R 100 000 R -
179 Nondweni Replacing of Existing Sewer system Design Nquthu R 4 296 940 R 3 196 940 R 100 000 R -

ANNUAL PERFORMANCE PLAN 2018/19 – 2020/21
228
Fighting Disease, Fighting Poverty, Giving Hope
No. Facility Name Project Name Current Status/
IDMS Stage
Municipality
Total Project
Cost
( R )
2018/19 2019/20 2020/21
180 Douglas Replacing of Existing Sewer System Design Msinga R 2 800 000 R 1 700 000 R 100 000 R -
181 Amaoti Repair sewer line Identified eThekwini R 1 900 000 R 1 700 000 R 100 000 R -
182 Addington Addington Hospital renovations Identified eThekwini R 1 700 000 R 1 000 000 R 100 000 R -

ANNUAL PERFORMANCE PLAN 2018/19 – 2020/21
229
Fighting Disease, Fighting Poverty, Giving Hope
Conditional Grants
Table 96: Conditional Grants
Purpose of the Grant Performance Indicators
2018/19
Targets
2018/19
Comprehensive HIV and AIDS Conditional Grant
To enable the health sector to develop an
effective response to HIV, AIDS and TB including
universal access to HIV Counselling and Testing.
To support the implementation of the National
Operational Plan for Comprehensive HIV, AIDS
and TB Treatment and Care.
To subsidise in-part funding for the Antiretroviral
Treatment Programme/ Plan.
Number of new patients that started
treatment on ART 250 017
Number of patients on ART remaining in care 1 313 804
Number of antenatal clients initiated on ART 39 262
Number active Home-Based Carers receiving
stipends 9 796
Number of male condoms distributed 199 500 000
Number of female condoms distributed 6 141 078
Number of HTA intervention sites (cumulative) 476
Number of HIV positive patients that started
on IPT 137 544
Number of active lay counsellors on stipends 1 967
Number of clients tested for HIV (including
antenatal) 2 982 771
Number of health facilities offering MMC
services 446
Number of Medical Male Circumcisions
performed 140 038
Number of babies PCR tested around 10
weeks 44 400
Number of sexual assault cases offered ARV
prophylaxis 4 270
Number of Doctors trained on HIV/AIDS, STIs,
TB and chronic diseases 191
Number of Professional Nurses trained on
HIV/AIDS, STIs, TB and chronic diseases 3 930
Number of HIV positive clients screened for TB 1 319 597
National Tertiary Services Grant
To ensure provision of tertiary health services for
South African citizens.
To compensate tertiary facilities for the costs
associated with provision of tertiary services
including cross border patients.
Number of National Central and Tertiary
Hospitals providing components of Tertiary
services
4
Health Professional Training and Development Grant
Support provinces to fund service costs
associated with training of health science
trainees on the public service platform.
Co-funding of the National Human Resources
Plan for Health in expanding undergraduate
medical education for 2012 and beyond (2025).
Number of Registrars supervised 320 (100 January
2018 intake)
Funded by
Grant: 275
National Health Grant

ANNUAL PERFORMANCE PLAN 2018/19 – 2020/21
230
Fighting Disease, Fighting Poverty, Giving Hope
Purpose of the Grant Performance Indicators
2018/19
Targets
2018/19
Help accelerate construction, maintenance,
upgrading and rehabilitation of new and
existing infrastructure in health, including inter
alia, health technology, organisational systems
and quality assurance.
Supplement expenditure on health
infrastructure delivered through public-private
partnerships
Number of new and replaced projects
completed
11
Number of upgrade and addition projects
completed
14
Number of renovation and refurbishment
projects completed
12
Social Sector EPWP Incentive Grant for Provinces
To incentivise Provincial Departments to
expand work creation efforts through the use
of labour intensive delivery methods in the
following identified focus areas, in compliance
with the EPWP guidelines i.e. road
maintenance and the maintenance of
buildings.
To incentivise Provincial Social Sector
Departments identified in the 2013 Social
Sector EPWP Log-Frame to increase job
creation by focusing on strengthening and
expansion of social service programmes that
have employment potential.
Number of work opportunities created
4 971
Health Facility Revitalisation Grant
To help accelerate construction, maintenance,
upgrading and rehabilitation of new and
existing infrastructure in health, including health
technology, organisational development
systems and quality assurance.
To enhance capacity to deliver health
infrastructure.
Number of health facilities, planned,
designed, constructed, equipped,
operationalised and maintained.
612
State Aided Facilities
There are no Public Entities reporting to the Department of Health. For purposes of reporting, State
Aided Institutions have been included as they render a critical service in support of health. The table
below includes the current (at time of finalising the Annual Performance Plan) allocations for State
Aided Institutions. Submissions remain open and will be considered until the end of March 2018. The
current list may therefore not be complete for the MTEF.
Table 97: State Aided Facilities
Name of State
Aided Facility Mandate Output
Allocation (before adjustment)
R’000 Date of
next
Evaluation 2018/19 2019/20 2020/21
Bekimpelo Trust PHC services PHC package of services R 9 613 R 9 438 R 9 957 Sept 2018
DPSA Community-
based
Rehabilitation
Mental health
services
Community-based
rehabilitation, peer support
and self-help groups for
R 1 013 R 1 044 - Sept 2018

ANNUAL PERFORMANCE PLAN 2018/19 – 2020/21
231
Fighting Disease, Fighting Poverty, Giving Hope
Name of State
Aided Facility Mandate Output
Allocation (before adjustment)
R’000 Date of
next
Evaluation 2018/19 2019/20 2020/21
people with disabilities
DPSA wheelchair
repair &
maintenance
Services for
the disabled
Wheelchair repair &
maintenance support for
the disabled
R 930 R 958 - Jan 2019
Durban Coastal –
Happy Hours
Nyangana
Mental health
services
Day care: Adult
(vocational) and children
(severely/ profound
disabled) stimulation
R 298 R 307 R 324 Jan 2019
Ethembeni Care
Centre
Step-down
services
Step-down care for
HIV/AIDS patients
R 5 179 R 5 179 - Jan 2019
Ekukhanyeni Clinic Step-down
services
Step-down care for
HIV/AIDS patients
R 1 087 R 1 152 R 1 215 Jan 2019
Estcourt Hospice Palliative
care services
Palliative care for chronic
diseases
R 574 - - Jan 2019
Enkumane Clinic PHC services PHC package of services R 295 R 304 R 321 Jan 2019
Genesis Care
Centre
Step-down
services
Step-down care for
HIV/AIDS patients
R 2 946 R 2 946 - Jan 2019
Highway Hospice Palliative
care services
Palliative care for chronic
diseases
R 775 R 798 - Jan 2019
Howick Hospice Palliative
care services
Palliative care for chronic
diseases
R 636 R 655 - Jan 2019
Hibberdine Care
Centre
Palliative
care services
Palliative care for chronic
diseases
R 341 R 351 - Jan 2019
Ikhanzi Care Centre Mental health
services
Residential care for mental
health care users: Psycho-
social rehabilitation,
severely/ profound disabled
R 138 R 143 R 351 Jan 2019
John Peattie House Mental health
services
Residential care for mental
health care users: Psycho-
social rehabilitation,
severely/ profound disabled
R 1 331 R 1 371 R 1 446 Jan 2019
KZN Blind and Deaf
Society
Services for
the disabled
Rehabilitation services for
the visually impaired
R 900 R 927 - Jan 2019
Lynn House Mental health
services
Residential care for mental
health care users: Psycho-
social rehabilitation,
severely/ profound disabled
R 668 R 688 R 726 Jan 2019
Matikwe Oblate
Clinic
PHC services PHC package of services R 526 R 642 - Jan 2019
Magaye School for
the Blind
Mental health
services
Rehabilitation services for
the visually impaired
R 563 R 580 - Jan 2019
Mountain View
Hospital
TB Hospital Inpatient services for TB
patients
R 5 169 R 5 479 - Jan 2019
Philanjalo Hospice Step-down
services
Step-down services for
HIV/AIDS patients
R 2 609 R 2 740 - Jan 2019
Philakade TLC
(Power of God
Centre)
HIV and AIDS
services
Residential care for
HIV/AIDS patients
R 1 238 R 1 275 - Jan 2019

ANNUAL PERFORMANCE PLAN 2018/19 – 2020/21
232
Fighting Disease, Fighting Poverty, Giving Hope
Name of State
Aided Facility Mandate Output
Allocation (before adjustment)
R’000 Date of
next
Evaluation 2018/19 2019/20 2020/21
Rainbow Haven Mental health
services
Residential care for mental
health care users: Psycho-
social rehabilitation,
severely/ profound disabled
R 446 R 460 - Jan 2019
Solid Found for
Rural Development
Rehabilitation
services
Community-based
rehabilitation services
R 703 R 724 - Jan 2019
Siloah Hospital TB Hospital Inpatient services for TB
patients
R 12 798 R 13 182 - Jan 2019
South Coast
Hospice
Step-down
services
Palliative care for chronic
diseases
R 196 R 202 - Jan 2019
Sunfield Home Mental health
services
Residential care for mental
health care users: Psycho-
social rehabilitation,
severely/ profound disabled
R 294 R 302 - Jan 2019
Umsundusi Hospice Palliative
care services
Palliative care for chronic
diseases
R 1 495 R 1 540 - Jan 2019
For further negotiation R 26 299 R 29 624 R 72 768 -
Total R 78 610 R 83 011 R 86 908 -
Public Private Partnership
Table 98: Public Private Partnership
Name of
PPP Purpose Output
Current Annual Budget
R’000
Date of
Termination
Measures to
ensure
smooth
transfer of
responsibilities
Inkosi Albert
Luthuli
Central
Hospital
The
Department
in
partnership
with Impilo
Consortium
(Pty) Ltd
and
Cowslip
Investments
(Pty) Ltd
Supply equipment and
information management
and technology systems and
replace the equipment and
systems to ensure that they
remain state of the art.
Supply and replace non-
medical equipment.
Provide the services
necessary to manage
project assets in
accordance with best
industry practice.
Maintain and replace
Departmental assets in terms
of replacement schedules.
Provide or procure utilities,
consumables and surgical
Instruments.
Provide facility
management services.
Delivery of
non-clinical
services to
IALCH
The PPP agreement
contract for a further 3
years extension was
signed on the 27th
January 2017. The
commitment /
obligation are as
follows:
2018/19: R710
million
2019/20: R737
million
The total obligation to
remaining period is R
2.097 billion.
The
contract
with Impilo
Consortium
(Pty) Ltd
will
terminate
in 2020
Termination
arrangements
are detailed
in the project
agreement in
clauses 35, 36,
37 and the
penalty
regime
(Schedule 15).
The Provincial
Treasury PPP
Unit is
rendering
assistance to
the
Department
of Health
regarding its
exit strategy.

ANNUAL PERFORMANCE PLAN 2018/19 – 2020/21
233
Fighting Disease, Fighting Poverty, Giving Hope
PART D: 2015-2019 STRATEGIC PLAN REVIEW
Table 99: Review of 2015-2019 Strategic Plan
Strategic Objective Strategic Objective Statement Indicator Strategic Plan Target 2019/20
PROGRAMME 1: ADMINISTRATION
1.1) Finalise
integrated long term
health service
improvement
platform
Amended 2016/17:
Approve the
integrated 2017-2027
Long Term Plan
1.1.1) Long Term Plan approved by March 2016, implemented and monitored
thereafter.
Reviewed 2018/19: 2017 – 2027 Strategic Position Statement and Long
Term Plan approved by March 2019. Review informed by complexity of
re-formulating the transformation plan based on current budget
constraints and necessity for extensive consultation before finalising the
plan. The plan must be informed by the Departmental Turn-Around Plan
that must be finalised and approved for implementation in 2018/19.
Provincial Long Term Plan
Amended 2017/18: Approved
2017-2027 Long Term Plan
Approved Long Term Plan
Approved 2017-2027 Long
Term Plan (Amended
2017/18)
1.2) Improve financial
management and
compliance to PFMA
prescripts
1.2.2) Maintain financial efficiency by ensuring under/ over expenditure within
1% of the annual allocated budget throughout the reporting cycle
Removed 2018/19: Removed based on cash blocking which regulates
expenditure.
Percentage over/ under
expenditure
Removed 2018/18
New indicator
Removed 2018/19
1.3) Improve Supply
Chain Management
1.3.1) Costed Procurement Plan for minor and major assets by the end of April
in each reporting year.
Amended 2016/17: Costed annual Procurement Plan for minor and
major assets by the end of April in each reporting year.
Annual Procurement Plan
Amended 2016/17: Approved
Annual Procurement Plan
Annual costed
Procurement Plan
Approved and costed
annual procurement plan
(Amended 2016/17)
1.3.2) Ensure that 100% sites registered on the asset system account for all
assets by performing monthly reconciliation reports by March 2016 and
annually thereafter.
Removed 2015/16: Strategic Objective Statement and indicator not
considered SMART (Advised: Finance Section).
Number of registered sites
performing monthly asset
reconciliation reports
Removed 2015/16
All registered sites
Removed 2015/16
1.4) Improve health
technology and
information
management
1.4.1) Connectivity established at 100% public health facilities by March 2018.
Reviewed 2016/17: Connectivity established in 90% public health
facilities by March 2020. Reviewed target based on significant
challenges to ensure access to networks; speed of connectivity (1Mbps)
for PHC clinics; significant SITA delays; and increasing budget constraints.
Percentage of public health
facilities with stable bandwidth
connectivity
Amended 2015/16 (as per
National customised indicators):
Percentage of hospitals with
100%
90% (Reviewed 2016/17)
40% (Reviewed 2018/19)

ANNUAL PERFORMANCE PLAN 2018/19 – 2020/21
234
Fighting Disease, Fighting Poverty, Giving Hope
Strategic Objective Strategic Objective Statement Indicator Strategic Plan Target 2019/20
Reviewed 2018/19: Connectivity established in 40% public health facilities
by March 2020. Severe budget constraints, high cost of connectivity, and
slow procurement process through SITA necessitated review of target.
broadband access and
Percentage fixed PHC facilities
with broadband access
1.4.6) Reduce performance data error rate to 2% (or less) by March 2020.
Removed 2017/18: Strategic Objective Statement and indicator(s)
removed based on the inadequate sample size used for reporting on the
indicator. Error rate will however be monitored during review meetings
and audit processes.
Audit error rate (PHC clinics, CHC’s
and Hospitals)
Removed 2017/18
2% (or less)
Removed 2017/18
1.4.4) Web-based health information system established in 90% public health
facilities by March 2020 (National 700 Clinic Project).
Removed 2016/17: This is a National Department of Health project with
no Provincial control. There are significant delays in rollout of the system
with no guarantee of actual completion time. The process will be
monitored as it is rolled out.
Percentage of public health
facilities with a web-based
information system.
Removed 2016/17
90%
Removed 2016/17
4.1) Improve human
resources for health
4.1.1) Long Term Human Resources Plan approved by March 2016 and
implemented and monitored thereafter.
Removed 2017/18: The Human Resources Long Term Plan will be
incorporated in the 2017-2027 Long Term Plan as it is dependent on the
proposed service delivery platform and rationalisation process - will
therefore not be developed or monitored as vertical plan.
Long Term Human Resources Plan
Removed 2017/18
Long Term HRP
implemented and
monitored
Removed 2017/18
4.1.2) Finalise 610 organisational structures by March 2020.
Reviewed 2017/18: Review and approve macro and micro structures
aligned to function. The target was set based on national indication that
the WISN norms will be available at the beginning of the planning cycle
(review of all structures). Significant delays in concluding the national
processes (WISN and generic structures) significantly delayed Provincial
processes.
Number of organisational
structures finalised
Amended 2017/18: Number of
organisational structures
approved
Amended 2018/19: Number of
organisational structures reviewed
and submitted
610
100 (Reviewed 2017/18)
4.1.3) Implement the Community Based Training in a PHC Model in
collaboration with the University of KwaZulu-Natal with Phase 1 pilot
commencing in 2016/17.
Community Based Training in a
PHC Model
Amended 2016/17: Community
Based Training in a PHC Model
implemented
Implement Model
PROGRAMME 2: SUB-PROGRAMME PHC

ANNUAL PERFORMANCE PLAN 2018/19 – 2020/21
235
Fighting Disease, Fighting Poverty, Giving Hope
Strategic Objective Strategic Objective Statement Indicator Strategic Plan Target 2019/20
2.1) Increase life
expectancy at birth
2.1.1) Increase the total life expectancy to 60.5 years by March 2020.
Reviewed target 2018/19: Increase the total life expectancy to 61.5 years
by March 2020. Review based on Stats SA estimates and projections.
Life expectancy at birth: Total 60.5 years
61.5 years (Reviewed
2018/19)
2.1.3) Increase the life expectancy of females to 62.7 years by March 2020.
Reviewed target 2018/19: Increase the life expectancy of females to 64.5
years by March 2020. Review based on Stats SA estimates and
projections.
Life expectancy at birth: Female 62.7 years
64.5 years (Reviewed
2018/19)
1.5) Accelerate
implementation of
PHC re-engineering
1.5.2) Increase the number of ward-based outreach teams in the 169 wards
worst affected by poverty to 169 by March 2020 as part of the Poverty
Eradication Programme.
Reviewed 2016/17: Increase the number of ward based outreach teams
to 190 by March 2020. Exceeded the initial target. Teams will cover all
wards in the catchment areas including the 169 wards worst affected by
poverty as indicated in the initial Objective Statement.
Reviewed 2018/19: Increase the number of ward based outreach teams
to 160 by March 2020. Review of the target necessitated based on
budget constraints and re-prioritisation.
Number of ward based outreach
teams in the 169 wards worst
affected by poverty (cumulative)
Amended 2016/17: Number of
ward based outreach teams
(cumulative)
169
190 (Reviewed 2017/18)
160 (Reviewed 2018/19)
1.5.3) Increase the PHC utilisation rate to 3.1 visits per person per year by
March 2020.
Reviewed 2018/19: PHC utilisation rate of at least 2.5 visits per person per
year by March 2020. The utilisation rate includes facility headcounts only.
Review based on facility headcount trends over the last 3 years which
shows a consistent decrease, with simultaneous increase of community-
based headcounts. The total PHC utilisation rate (including facility and
community-based data) is currently 3.1.
PHC utilisation rate
Amended 2016/17 (compliance
with NIDS): PHC utilisation rate
(annualised)
3.1
At least 2.5 (Reviewed
2018/19)
1.5.4) Increase the PHC utilisation rate under-5 years to 4.8 visits per child by
March 2020.
Reviewed 2018/19: Sustain an under 5 utilisation rate of at least 3.9 visits per
child per year. The utilisation rate includes facility headcounts only. Review
based on facility headcount trends over the last 3 years shows a consistent
decrease, with simultaneous increase of community-based headcounts.
The total PHC utilisation rate under 5 years (including facility and
community-based data) is currently 4.8.
PHC utilisation rate under 5 years
(annualised)
4.8
At least 3.9 (Reviewed
2018/19)
1.6) Scale up
implementation of
Operation Phakisa
1.6.1) 100% Provincial fixed PHC facilities score above 80% on the Ideal Clinic
Dashboard by March 2020.
Percentage of fixed PHC facilities
scoring above 80% on the Ideal
100%

ANNUAL PERFORMANCE PLAN 2018/19 – 2020/21
236
Fighting Disease, Fighting Poverty, Giving Hope
Strategic Objective Strategic Objective Statement Indicator Strategic Plan Target 2019/20
Ideal Clinic
Realisation &
Maintenance
Reviewed 2016/17: 100% Provincial fixed PHC facilities score above 70% on
the Ideal Clinic Dashboard by March 2020. The National Department of
Health changed the scoring percentage as per approved customised
indicators.
Clinic Dashboard
Amended 2016/17: Percentage of
fixed PHC facilities scoring above
70% on the Ideal Clinic Dashboard
(In compliance with National
requirement)
Amended 2018/19 (compliance
with NIDS): Ideal clinic status rate
5.1) Improve
compliance to the
Ideal Clinic and
National Core
Standards
5.1.1) Sustain a patient satisfaction rate of 95% (or more) at all public health
facilities by March 2020.
Removed from APP in 2017/18: The National Department of Health
removed the indicator from the APP based on the lack of an appropriate
information system to collect the relevant data. Patient satisfaction will
however be monitored through implementation of the Service Delivery
Improvement Plan (SDIP). The Strategic Objective is therefore NOT
removed from the Strategic Plan.
Patient satisfaction rate
Removed 2017/18: Removed from
APP NOT the Strategic Plan
95% (or more)
Removed 2017/18
PROGRAMME 2: SUB-PROGRAMME HIV, AIDS AND TB
2.2) Reduce HIV
Incidence
2.2.2) Test 9 million people (cumulative) for HIV by March 2020.
Reviewed 2015/16: Test 4 million people for HIV by March 2020
(cumulative). Target reduced based on available budget and HIV
Conditional Grant Business Plan.
Reviewed 2016/17: Test at least 16.5 million people for HIV by March
2020 (cumulative). Increased in accordance with 90-90-90 strategy and
targets.
Client tested for HIV (including
ANC)
Amended 2016/17 (compliance
with NIDS): HIV test done – Total
9 million (cumulative)
4 million (cumulative)
(Reviewed 2015/16)
At least 16.5 million
(cumulative) (Reviewed
2016/17)
2.3) Manage HIV
prevalence
2.3.1) Reduce the HIV prevalence among 15-24 year old pregnant women to
25% by March 2020.
Removed 2016/17: This indicator is dependent on National Surveys and
timeous publishing of results – results not published annually. The indicator
will however be tracked once data become available.
HIV prevalence among 15-24 year
old pregnant women
Removed 2016/17
25%
Removed 2016/17
2.3.2) Increase the number of patients on ART to 1 450 000 (cumulative) by
March 2018.
Reviewed 2017/18: Increase the number of patients on ART to at least 1.5
million (cumulative) by March 2020. The previous target has been
exceeded; making provision for Policy changes; and implementation of
the 90-90-90 strategy with more aggressive targets.
Total clients remaining on ART
Reviewed 2017/18 (compliance
with NIDS): ART client remain on
ART at end of month – total
1 450 000 (Previous)
At least 1.5 million
(Reviewed 2017/18)

ANNUAL PERFORMANCE PLAN 2018/19 – 2020/21
237
Fighting Disease, Fighting Poverty, Giving Hope
Strategic Objective Strategic Objective Statement Indicator Strategic Plan Target 2019/20
2.4) Improve TB
outcomes
2.4.1) Increase the TB new client treatment success rate to 90% (or more) by
March 2020.
Amended 2015/16: Increase the TB client treatment success rate to 90%
(or more) by March 2020.
TB new client treatment success
rate
Amended 2015/16 (in compliance
with NIDS): TB client treatment
success rate
90% (or more)
2.4) Improve TB
outcomes
2.4.3) Decrease the TB death rate to 2% by March 2020.
Reviewed 2018/19: Stabilise the TB death rate at 5% by March 2020.
Trends show an increase in reported deaths mostly due to improved
surveillance and follow-up on treatment outcomes.
TB death rate 2%
5% (Reviewed 2018/19)
2.4) Improve TB
outcomes
2.4.4) Increase the MDR-TB treatment success rate to 75% (or more) by March
2020
Reviewed 2016/17: Increase the MDR-TB treatment success rate to 65%
(or more) by March 2020.
Reviewed 2018/19: Increase the MDR-TB treatment success rate to 65%
(or more) by March 2020.
TB-MDR treatment success rate 75% or more
65% or more (Reviewed
2016/17)
62% or more (Reviewed
2018/19)
PROGRAMME 2: SUB-PROGRAMME MATERNAL, CHILD & WOMEN’S HEALTH
2.5.2) Reduce the
mother to child
transmission of HIV to
less than 0.5% by
March 2020
2.5.2) Reduce the mother to child transmission of HIV to less than 0.5% by
March 2020.
Infant 1st PCR test positive around
6 weeks rate
Reviewed 2016/17 (compliance
with customised national
indicator): Infant 1st PCR test
positive around 10 weeks rate
Reviewed 2017/18 (compliance
with NIDS): Infant PCR test positive
around 10 week’s rate
Less than 0.5%
2.8) Improve women’s
health
2.8.1) Increase the couple year protection rate to 75% by March 2020.
Review 2018/19: Increase the couple year protection rate to at least 36%
by March 2020. The indicator definition and method of calculation
changed, which resulted in significant reduction in actual performance
data.
Couple year protection rate
Amended 2017/18 (compliance
with NIDS): Couple year
protection rate (international)
75%
36% (Reviewed 2018/19)
PROGRAMME 2: SUB-PROGRAMME NON-COMMUNICABLE DISEASES
2.9) Reduce
incidence of non-
communicable
2.9.1) Decrease the hypertension incidence by at least 10% per annum.
Reviewed 2017/18: Hypertension incidence of 24.6 or less per 1000
population by March 2020. Intensified screening/ detection is expected
Hypertension incidence
(annualised)
Increase by at least 10%
per annum
24.6 or less per 1000

ANNUAL PERFORMANCE PLAN 2018/19 – 2020/21
238
Fighting Disease, Fighting Poverty, Giving Hope
Strategic Objective Strategic Objective Statement Indicator Strategic Plan Target 2019/20
diseases to initially increase the number of new cases. Trends are being
monitored.
(Reviewed 2017/18)
2.9.2) Decrease the diabetes incidence by at least 10% per annum.
Reviewed 2017/18: Diabetes incidence of 3.3 or less per 1000 population
by March 2020. Intensified screening/ detection is expected to initially
increase the number of new cases. Trends are being monitored.
Diabetes incidence (annualised) Increase by at least 10%
per annum
3.3 or less per 1000
(Reviewed 2017/18)
PROGRAMMES 2, 4 AND 5: DISTRICT, REGIONAL, SPECIALISED TB AND PSYCHIATRIC, CHRONIC/ NON-ACUTE, TERTIARY & CENTRAL HOSPITAL SERVICES
5.1) Improve
compliance to the
Ideal Clinic and
National Core
Standards
5.1.1) Sustain a patient satisfaction rate of 95% (or more) at all public health
facilities by March 2020.
Removed from the 2017/18 APP: National Department of Health
removed this customised indicator due to lack of an appropriate
information system to collect relevant data. Patient satisfaction will
however be monitored through implementation of the Service Delivery
Improvement Plan (SDIP). The Strategic Objective Statement and
Indicator therefore not removed from the Strategic Plan.
Patient satisfaction rate (Removed
2017/18 APP BUT still monitored as
part of the Service Delivery
Improvement Plan)
95% (or more) (Removed
from APP but still monitred
1.7) Improve hospital
efficiencies
1.7.1) Maintain a bed utilisation rate of 75% (or more).
Amended 2015/16: Maintain a bed utilisation rate of 75% (or more) by
March 2020.
Inpatient bed utilisation rate
Inpatient bed utilisation rate –
total (Amended 2015/16)
75% (or more)
1.7.2) Develop and implement the approved Hospital Rationalisation Plan by
March 2016.
Reviewed 2016/17: Develop & implement the approved Hospital
Rationalisation Plan by June 2017. Align with the 2017-2027 Long Term
Plan.
Reviewed 2018/19: Develop & implement the approved Hospital
Rationalisation Plan by September 2018. The Plan will form part of the
Department’s integrated Turn-Around Plan.
Hospital Rationalisation Plan
Amended 2015/16: Approved
Hospital Rationalisation Plan
Plan implemented
Approved Plan
implemented (Amended
2015/16)
2.7) Reduce maternal
mortality
2.7.2) Improve maternal health outcomes by establishing 11 District
Caesarean Section Centres by March 2018.
Removed 2016/17. The development of national norms and standards
for these Centres has been delayed and Provincial processes are
therefore on hold.
Number of fully functional District
Caesarean Section Centres
(cumulative)
Removed 2016/17
11
Removed 2016/17
5.1) Improve
compliance to the
Ideal Clinic and
National Core
5.1.2) 60% (or more) public health hospitals compliant with extreme and vital
measures of the NCS by March 2020.
Amended 2017/18: 60% (or more) public health hospitals achieved 75%
Percentage of hospitals compliant
with all extreme and vital
measures of the national core
60% (or more)

ANNUAL PERFORMANCE PLAN 2018/19 – 2020/21
239
Fighting Disease, Fighting Poverty, Giving Hope
Strategic Objective Strategic Objective Statement Indicator Strategic Plan Target 2019/20
Standards and more on NCS self-assessment rate by March 2020. The National
customised indicator changed in compliance with NIDS.
standards
Amended 2017/18 (in compliance
with NIDS): Hospitals achieved 75%
and more on NCS self-assessment
rate
PROGRAMME 3: EMERGENCY MEDICAL SERVICES
1.8) Improve EMS
efficiencies
1.8.1) Evidence-based EMS Model approved and implemented by March
2016.
Reviewed 2017/18: EMS Turn-Around Strategy approved by June 2017.
Approved revised EMS Model
Amended 2017/18: Approved EMS
Turn-Around Strategy
Approved revised EMS
Model implemented
Reviewed 2017/18:
Approved EMS Turn-Around
Strategy
1.8.2) Increase the average number of daily operational ambulances to 550
by March 2020.
Reviewed 2017/18: Increase the average number of daily operational
ambulances to 220 by March 2020. The ageing vehicle fleet, need for
replacement of ambulances, and limited budget impact on purchase of
an adequate number of ambulances to expand the fleet - currently
ambulances are replaced.
Average number of daily
operational ambulances
550
220 (Reviewed 2017/18)
1.8.3) Rationalise 4 clustered communication centres by March 2020.
Removed 2017/18: Due to significant reduction in the infrastructure
budget the projects were put on hold indefinitely. Rationalisation of
communication centres remain part of the EMS Turn-Around Plan
although it is surpassed with other essential interventions for the remaining
3 years of the strategic planning period. This will be reconsidered in the
next cycle pending available funding.
Number of clustered
communications centres
established and operational
Removed 2017/18
4
Removed 2017/18
1.8.4) Improve P1 urban response times of under-15 minutes to 25% by March
2020.
Reviewed 2017/18: Improve P1 urban response times of under-15 minutes
to 20% by March 2020.
EMS P1 urban response under 15
minutes rate
25%
20% (Reviewed 2017/18)
1.8.5) Improve P1 rural response times of under-45 minutes to 40% by March
2020.
Reviewed 2017/18: Improve P1 rural response times of under-40 minutes
to 40% by March 2020.
EMS P1 rural response under 40
minutes rate
45%
40% (Reviewed 2017/18)
PROGRAMME 6: HEALTH SCIENCES & TRAINING

ANNUAL PERFORMANCE PLAN 2018/19 – 2020/21
240
Fighting Disease, Fighting Poverty, Giving Hope
Strategic Objective Strategic Objective Statement Indicator Strategic Plan Target 2019/20
4.1) Improve human
resources for health
4.1.4) Allocate 569 bursaries for first year medicine students between 2015/16
and 2019/20.
Reviewed 2017/18: Allocate 197 bursaries for first year medicine students
between 2015/16 and 2019/20. The decrease in target is based on the
drastic reduction of allocated and projected budget for bursaries. The
target will be reviewed year on year depending on available funding.
Number of bursaries awarded to
first year medical students
569
197 (Reviewed 2017/18)
4.1.5) Allocate 2 000 bursaries for fist year nursing students between 2015/16
and 2019/20
Reviewed 2016/17: Allocate 1 000 bursaries for fist year nursing students
between 2015/16 and 2019/20. The decrease in target is based on the
drastic reduction of allocated and projected budget for bursaries. The
target will be reviewed year on year depending on available funding.
Number of bursaries awarded for
first year nursing students
2 000
1 000 (Reviewed 2016/17)
4.1.6) Increase intake of Mid-Level Workers with at least 10% per annum
(based on need per category).
Reviewed 2017/18: Increase intake of Mid-Level Workers with at least 10%
per annum based on budget allocation. The limited funding envelope
necessitated re-prioritisation of the 2017/18 MTEF allocation for training.
Intake of Mid-Level Workers has been flat lined for the three years, and
will be reviewed annually. Intake also takes into consideration availability
of budget to ensure absorption of students post training.
Number of new students enrolled
in Mid-Level Worker training
courses
167
10% increase per annum
based on budget
allocation (Reviewed
2017/18)
4.1.8) Increase the number of MOPs who successfully completed the degree
course at DUT to 90 (cumulative) by March 2020.
Reviewed 2017/18: Increase the number of MOPs who successfully
completed the degree course at DUT to 61 (cumulative) by March 2020.
There will be no further intake of students until all graduates can be
absorbed in the health system. Due to current and projected budget
constraints, the Department will not be able to absorb more graduates.
Intake will be reviewed year on year based on available funding.
Number of MOPs that successfully
completed the degree course at
DUT
90
61 (Reviewed 2017/18)
4.1) Improve human
resources for health
4.1.7) Increase the EMS skills pool by increasing the number of EMS personnel
trained in ILS to 360 and ECT to 150 by March 2020.
Reviewed 2017/18: Increase the EMS skills pool by increasing the number
of ILS (Intermediate Life Support) student intakes to 300 by March 2020.
The College of Emergency Care (CoEC) aligned its training qualifications
with the new National Emergency Care Education and Training (NECET)
qualifications and training. The demand for ILS professionals necessitates
prioritisation (taking into consideration the limited funding envelope).
Number of ILS graduates per
annum
Number of Emergency Care
Technician graduates per annum
(Removed 2017/18)
360 (ILS)
150 (ECT)
300 ILS (Reviewed 2017/18)

ANNUAL PERFORMANCE PLAN 2018/19 – 2020/21
241
Fighting Disease, Fighting Poverty, Giving Hope
Strategic Objective Strategic Objective Statement Indicator Strategic Plan Target 2019/20
PROGRAMME 7: HEALTH CARE SUPPORT SERVICES
1.9) Strengthen health
system effectiveness
1.9.1) Increase the number of operational Orthotic Centres to 11 by March
2020.
Reviewed 2017/18: Increase the number of operational Orthotic Centres
to 4 by March 2020. Target was reduced based on budget challenges,
specifically related to infrastructure and equipment.
Number of operational Orthotic
Centres (cumulative)
11
4 (Reviewed 2017/18)
1.9.2) Decrease and maintain zero clean linen stock outs in facilities from
March 2018 onwards.
Reviewed 2017/18: Decrease and maintain zero clean linen stock outs in
facilities from March 2020 onwards.
Percentage of facilities reporting
clean linen stock outs
Zero clean linen stock outs
5.2.2) PPSD compliant with good Wholesaling Practice Regulations by March
2017.
Removed 2016/17: Removed on advisement of Pharmaceutical Services
and based on executive decision that alternative arrangements are
made to accommodate stock.
PPSD compliant with good
Wholesaling Practice Regulations
Remove 2016/17
Compliant
Remove 2016/17
PROGRAMME 8: HEALTH FACILITIES MANAGEMENT
3.3) Improve health
facility planning and
infrastructure delivery
3.3.1) Commission 28 new projects by March 2020.
Reviewed 2017/18: Complete 40 new and replaced projects by March 2020.
Number of new clinical projects
with completed construction
Number of new clinical projects
where commissioning is complete
Number new and replaced
projects completed (Added
2017/18)
8
28
40 (Reviewed 2017/18)
3.3.2) Complete 35 upgrading and renovation projects by March 2020.
Reviewed 2017/18: Complete 47 upgrade and addition projects by
March 2020.
Added 2017/18: 3.3.3.) Complete 24 renovation and refurbishment
projects by March 2020
Number of upgrading and
renovation projects with
completed construction.
Number upgrade and addition
projects completed (Added
2017/18)
Number renovation and
refurbishment projects completed
(Added 2017/18)
35
47 (Reviewed 2017/18)
24 (Added 2017/18)

ANNUAL PERFORMANCE PLAN 2018/19 – 2020/21
242
Fighting Disease, Fighting Poverty, Giving Hope
CONCLUSION
The Department remains steadfast in its commitment to quality health services and improved health
outcomes. Resources will be allocated and utilised in the most appropriate manner to ensure optimal
utilisation as scarce resources and access to health services in all corners of KZN.
The 2018/19 Annual Performance Plan will be implemented and monitored in a robust manner with
formal quarterly reviews and reports that will service as yardstick for decisive decision-making.

ANNUAL PERFORMANCE PLAN 2018/19 – 2020/21
243
Fighting Disease, Fighting Poverty, Giving Hope
Abbreviations
Abbreviation Description
A
AIDS Acquired Immune Deficiency Syndrome
AIP Annual Implementation Plan
ALOS Average Length of Stay
ALS Advanced Life Support
AMS Air Mercy Services
ANC Antenatal Care
APP Annual Performance Plan
ART Anti-Retroviral Therapy
ASELPH Albertina Sisulu Executive and Leadership Programme for Health
ASSA AIDS Committee of Actuarial Society of South Africa
B
BAS Basic Accounting System
BLS Basic Life Support
C
CCG(s) Community Care Giver(s)
CCMA Commission for Conciliation, Mediation and Arbitration
CCMDD Centralised Chronic Medicine Dispensing and Distribution
CDC Communicable Disease Control
CEO(s) Chief Executive Officer(s)
CHC(s) Community Health Centre(s)
COE Compensation of Employees
CoEC College of Emergency Care
CoMMIC Committee on Morbidity and Mortality in Children under 5
CSS Client Satisfaction Survey
CTOP Choice on Termination of Pregnancy
D
DCST(s) District Clinical Specialist Team(s)
DDG Deputy Director General
DHIS District Health Information System
DHS District Health System
DOPW Department of Public Works
DPC Disease Prevention and Control
DPME Department Planning Monitoring and Evaluation
DR-TB Drug Resistant Tuberculosis
DUT Durban University of Technology
E
ECD Early Child Development

ANNUAL PERFORMANCE PLAN 2018/19 – 2020/21
244
Fighting Disease, Fighting Poverty, Giving Hope
Abbreviation Description
ECP Emergency Care Practitioner
ECT Emergency Care Technician
EMS Emergency Medical Services
EMS P1 Calls Emergency Medical Services Priority 1 Calls
EPWP Expanded Public Works Programme
ESMOE Essential Steps in Management of Obstetric Emergencies
ETR.Net Electronic Register for TB
F, G, H
FPS Forensic Pathology Services
GHS General Household Survey
HCSS Health Care Support Services
HIV Human Immuno Virus
HPV Human Papilloma Virus
HRD Human Resource Development
HTA’s High Transmission Areas
HWSETA Health and Welfare Sector Education and Training Authority
I
IA(s) Implementing Agent(s)
IALCH Inkosi Albert Luthuli Central Hospital
ICRM Ideal Clinic Realisation and Maintenance
ICT Information Communication Technology
IDT Independent Development Trust
IDMS Infrastructure Delivery Management Programme
ILS Intermediate Life Support
IMCI Integrated Management of Childhood Illnesses
IMLCs Institutional Management and Labour Committees
IPC Infection Prevention and Control
IPMP Infrastructure Programme Management Plan
IPT Ionized Preventive Therapy
IT Information Technology
K, L
KZN KwaZulu-Natal
KZNCN KwaZulu-Natal College of Nursing
LG Local Government
M
ManCo Management Committee
M&E Monitoring and Evaluation
MDR-TB Multi Drug Resistant Tuberculosis
MEC Member of the Executive Council
MMC Medical Male Circumcision

ANNUAL PERFORMANCE PLAN 2018/19 – 2020/21
245
Fighting Disease, Fighting Poverty, Giving Hope
Abbreviation Description
MMR Maternal Mortality Rate
MNC&WH Maternal, Neonatal, Child & Women’s Health
MOP Medical Ortho Prosthetics
MTEF Medium Term Expenditure Framework
MTSF Medium Term Strategic Framework
N
NCS National Core Standards
NCD(s) Non-Communicable Disease(s)
NDP National Development Plan
NECET National Emergency Care Education and Training
NGO(s) Non-Governmental Organisation(s)
NHI National Health Insurance
NIDS National Information Data Set
NIMART Nurse Initiated and Managed Antiretroviral Therapy
NSDA Negotiated Service Delivery Agreement
O
OES Occupation Efficiency Service
OHH Outreach Households
OPD Out-Patient Department
OSS Operation Sukuma Sakhe
OTP Office of the Premier
P
PA(s) Performance Agreement(s)
PCR Polymerase Chain Reaction
PDE Patient Day Equivalent
PEMP Poverty Eradication Master Plan
PERSAL Personnel and Salaries System
PGDP Provincial Growth and Development Plan
PHC Primary Health Care
PHSDSBC Public Health and Social Development Sectoral Bargaining Council
PIA Provincial Implementing Agents
PIDS Provincial Indicator Data set
PMDS Performance Management and Development System
PMPU Provincial Medicine Procurement Unit
PMTCT Prevention of Mother to Child Transmission
PN Professional Nurse
PPSD Provincial Pharmaceutical Supply Depot
PPT Planned Patient Transport
PTB Pulmonary Tuberculosis
PTS Patient Transport Services
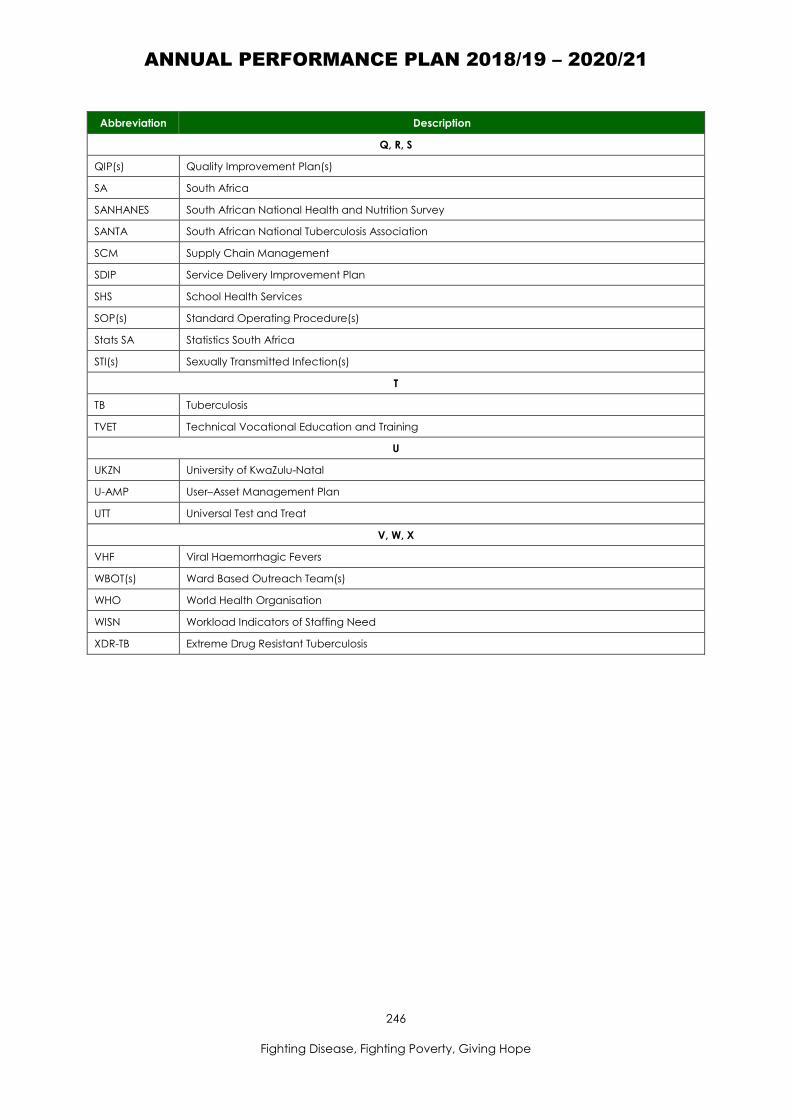
ANNUAL PERFORMANCE PLAN 2018/19 – 2020/21
246
Fighting Disease, Fighting Poverty, Giving Hope
Abbreviation Description
Q, R, S
QIP(s) Quality Improvement Plan(s)
SA South Africa
SANHANES South African National Health and Nutrition Survey
SANTA South African National Tuberculosis Association
SCM Supply Chain Management
SDIP Service Delivery Improvement Plan
SHS School Health Services
SOP(s) Standard Operating Procedure(s)
Stats SA Statistics South Africa
STI(s) Sexually Transmitted Infection(s)
T
TB Tuberculosis
TVET Technical Vocational Education and Training
U
UKZN University of KwaZulu-Natal
U-AMP User–Asset Management Plan
UTT Universal Test and Treat
V, W, X
VHF Viral Haemorrhagic Fevers
WBOT(s) Ward Based Outreach Team(s)
WHO World Health Organisation
WISN Workload Indicators of Staffing Need
XDR-TB Extreme Drug Resistant Tuberculosis

PR Number: 19/2018 ISBN Number: 549-0-334-90231-1
HEAD OFFICE - NATALIA BUILDINGPostal Address: P/Bag X9051 Pietermaritzburg 3200
Physical Address: Natalia 330 Langalibalele Street, Pietermaritzburg 3201Tel: 033 395 2111 (switchboard),
Web: www.kznhealth.gov.za