annual report 2009-2010 - bseindia.com. a. raghu vasu# independent 1 yes – 1 – – non-executive...
TRANSCRIPT

8-2-120/112/88-89, Park View Estate, 4th Floor, Road No. 2, Banjara Hills, Hyderabad - 500 034, IndiaTel.: +91 40 2354 0994 Fax : +91 40 2355 5465www.zenotechlabs.com
Annual Report2009-2010
CONQUERCANCER
Don’t have to be afraid of CANCER
CANCER is curable if detected early

(Recombinant Human Interleukin-2)
TM
The Valiant Immunomodulator
Zenotech provides a range of quality Oncologicals
Dr. Jayaram ChigurupatiFounder and Managing Director
State of the art Manufacturing facilities

ANNUAL REPORT 2007-2008
1
ANNUAL REPORT 2009-2010
Corporate governance report 02
Directors' report 10
Management's discussion and analysis report 21
Financial statements
- Auditor's report 24
- Balance sheet 28
- Profit and loss account 29
- Cash flow statement 30
- Schedules forming part of balance sheet and profit and loss account 32
- Balance sheet abstract 51
Consolidated financial statements 52
Section 212 report 74
Financials - Zenotech Farmaceutica Do Brasil Ltda., Brazil 75
Financials - Zenotech Laboratories Nigeria Limited, Nigeria 81
Financials - Zenotech Inc., USA 85
Notice of the Annual General Meeting 92
Glossary 94
Proxy form and attendance slip 95
ContentsContentsContentsContentsContents
Annual Report2009-2010

ANNUAL REPORT 2007-2008
2
ANNUAL REPORT 2009-2010
Corporate Governance Report
Company PhilosophyCompany PhilosophyCompany PhilosophyCompany PhilosophyCompany Philosophy
The Company believes that good corporate governance practices enable the management to direct and control the affairs ofthe Company in an efficient manner and to achieve the Company's goal of maximizing value for all its stake holders.
The board considers itself as a trustee of its shareholders and acknowledges its responsibilities to the Shareholders forcreating and safeguarding shareholders wealth, while upholding the core values of transparency, integrity, honesty andaccountability.
The Company's code of conduct serves as a guide to the employees on the values, ethics and business principles expectedof them.
BoarBoarBoarBoarBoard of Dird of Dird of Dird of Dird of Directorsectorsectorsectorsectors
The Board of Zenotech Laboratories Limited consists of three eminent Directors.
None of the Directors on the Board is a member on more than 10 committees or Chairman of more than 5 committees asspecified in clause 49, across all the Companies in which he is a Director. Necessary disclosures regarding Committeepositions have been made by the Directors.
4 Board Meetings were held during the year ended March 31, 2010. The dates on which the Board Meetings were held are asfollows.
October 1, 2009; November 16, 2009; January 13, 2010 and February 26, 2010.
None of the Non-Executive Directors have any material pecuniary relationship or transaction with the Company.
The minimum necessary information as mentioned in Annexure 1A to clause 49 of the listing agreement has been placedbefore the Board for their consideration.
The names and categories of the Directors on the Board, their attendance at Board meetings held during the year and thenumber of Directorships and Committee memberships held by them in other companies is given below. Other directorships donot include alternate directorships, directorships of private limited Companies and companies incorporated outside India.Chairmanship/membership of Board committees, include only membership of Audit and Shareholders/Investors GrievanceCommittee.

ANNUAL REPORT 2007-2008
3
ANNUAL REPORT 2009-2010
Corporate Governance Report
NameNameNameNameName CategorCategorCategorCategorCategoryyyyy No. ofNo. ofNo. ofNo. ofNo. of WhetherWhetherWhetherWhetherWhether No. of No. of No. of No. of No. of No. of committeeNo. of committeeNo. of committeeNo. of committeeNo. of committeeBoarBoarBoarBoarBoarddddd AttendedAttendedAttendedAttendedAttended DirDirDirDirDirectorshipsectorshipsectorshipsectorshipsectorships positionspositionspositionspositionspositions
MeetingsMeetingsMeetingsMeetingsMeetings AGM heldAGM heldAGM heldAGM heldAGM held in otherin otherin otherin otherin other held in otherheld in otherheld in otherheld in otherheld in otherattendedattendedattendedattendedattended ononononon publicpublicpublicpublicpublic publicpublicpublicpublicpublic
during theduring theduring theduring theduring the 26.02.1026.02.1026.02.1026.02.1026.02.10 CompaniesCompaniesCompaniesCompaniesCompanies CompaniesCompaniesCompaniesCompaniesCompaniesyearyearyearyearyear
2009-102009-102009-102009-102009-10
ChairChairChairChairChairmanmanmanmanman MemberMemberMemberMemberMember ChairChairChairChairChairmanmanmanmanman MemberMemberMemberMemberMember
Dr. Jayaram Chigurupati, Executive 4 Yes – 6 – –Managing Director (Promoter)
Justice A. Gopal Rao# Independent 1 Yes – – – –Non-Executive
Mr. A. Raghu Vasu# Independent 1 Yes – 1 – –Non-Executive
Mr. M.R. Vikram* Independent 3 Yes – 4 – 6Non-Executive
Dr. Uma Devi Komath* Independent 3 Yes – – – –Executive
Mr. S.M. Bhutani** Independent – No – – – –Non-Executive
Lt. Col.(Retd.) Independent – No – – – –Sukhdev Singh Gill*** Non-Executive
# Appointed by the Hon'ble High Court as Independent Directors vide its order dated 23.02.2009.
* Resigned on March 10, 2010
** Resigned on August 19, 2009.
*** Resigned on August 25, 2009.
As a result of the disputes between the Promoters and the significant shareholder of the Company, the Company couldnot report compliance on Audit Committee, Remuneration Committee and Shareholders/Investors Grievance Committee.The matters are subjudiced before the Hon'ble High Court of Andhra Pradesh and the Hon'ble Company Law Board,Southern Regional Bench, Chennai.

ANNUAL REPORT 2007-2008
4
ANNUAL REPORT 2009-2010
General Body MeetingsGeneral Body MeetingsGeneral Body MeetingsGeneral Body MeetingsGeneral Body Meetings
The 21st Annual general Meeting for the financial year 2009- 10 will be held on January 18, 2011 at 11.00 A.M. at factorypremises of the Company situated at Survey No.250-252, Turkapally Village, Shameerpet Mandal, R.R. District 500078.
Details of Last thrDetails of Last thrDetails of Last thrDetails of Last thrDetails of Last three Annual general Meetings aree Annual general Meetings aree Annual general Meetings aree Annual general Meetings aree Annual general Meetings are as follows:e as follows:e as follows:e as follows:e as follows:
YYYYYearearearearear MeetingMeetingMeetingMeetingMeeting DayDayDayDayDay, Date and Time of, Date and Time of, Date and Time of, Date and Time of, Date and Time of VVVVVenueenueenueenueenuethe Meetingthe Meetingthe Meetingthe Meetingthe Meeting
2008-09 20th AGM Friday, February 26, 2010 Survey No. 250-252,at 12.00 Noon Turkapally Village,
Sameerpet Mandal,R. R. District- 500 078
2007-08 19th AGM Friday, February 26, 2010 Survey No. 250-252,at 10.00 A.M. Turkapally Village,
Sameerpet Mandal,R. R. District- 500 078
2006-07 18th AGM Thursday, November 8, Surana Udyog Auditorium2007 at 3.00 P. M. FAPCCI Premises,
Federation House,Hyderabad - 500 004
The details of special rThe details of special rThe details of special rThe details of special rThe details of special resolutions passed by the members during the last thresolutions passed by the members during the last thresolutions passed by the members during the last thresolutions passed by the members during the last thresolutions passed by the members during the last three Annual General Meetings of the Company:ee Annual General Meetings of the Company:ee Annual General Meetings of the Company:ee Annual General Meetings of the Company:ee Annual General Meetings of the Company:
No. of AGMNo. of AGMNo. of AGMNo. of AGMNo. of AGM Item on which special rItem on which special rItem on which special rItem on which special rItem on which special resolution passedesolution passedesolution passedesolution passedesolution passed
20th AGM Nil
19th AGM Nil
18th AGM 1. Create, offer, issue and allot up to 54,89,536 equity shares of the Company toRanbaxy Laboratories Limited on preferential allotment basis at a price ofRs.160/- per share.
All the above resolutions were passed with requisite majority
For past three years there were no ordinary or special resolutions passed that require a postal ballot. No Resolution, whichrequires approval through postal ballot, is proposed to be conducted at the ensuing Annual General Meeting.
Corporate Governance Report

ANNUAL REPORT 2007-2008
5
ANNUAL REPORT 2009-2010
DisclosurDisclosurDisclosurDisclosurDisclosureseseseses
There are no materially significant related party transactions of the Company with Promoters, directors or the Management ortheir relatives or the Subsidiary Company which have potential conflict with the interest of Company at large. Transactions withrelated parties as per requirements of Accounting Standards - (AS-18) - "Related Party Disclosures" issued by the Institute ofChartered Accountants of India are disclosed in Note 17 of Schedule 21 to Standalone financials in the annual report.
There were no cases of non-compliance by the Company, penalties, strictures imposed on the Company by stock exchangesor SEBI or any statutory authority, on any matter related to capital markets, during the year March 31, 2010.
Code of conduct:Code of conduct:Code of conduct:Code of conduct:Code of conduct: The code of conduct as adopted by the Board of Directors is applicable to all directors, senior managementand employees in above officers' level. The prime purpose of the code is to create an environment wherein all the BoardMembers and Senior Management of the Company maintain ethical standards and to ensure compliance to the laid downethical standards. The code is available on the Company's website: www.zenotechlabs.com
Declaration as rDeclaration as rDeclaration as rDeclaration as rDeclaration as requirequirequirequirequired under Clause 49 of the Listing Agred under Clause 49 of the Listing Agred under Clause 49 of the Listing Agred under Clause 49 of the Listing Agred under Clause 49 of the Listing Agreementeementeementeementeement
All the directors and senior management of the Company have affirmed compliancewith the Company's code of conduct for the financial year ended March 31, 2010.
Hyderabad DrDrDrDrDr. Jayaram Chigurupati. Jayaram Chigurupati. Jayaram Chigurupati. Jayaram Chigurupati. Jayaram ChigurupatiDecember 11, 2010 Managing Director
Compliance: Compliance: Compliance: Compliance: Compliance: At every Board meeting, a statement of Compliance with all laws and regulations as certified by the ManagingDirector is placed before the Board for its review. The Board reviews the compliance of all the applicable laws and givesappropriate directions wherever necessary.
Risk Management:Risk Management:Risk Management:Risk Management:Risk Management: The Board regularly discusses the significant business risks identified by the management and the mitigationprocess being taken up.
PrPrPrPrPreferefereferefereferential Issue Prential Issue Prential Issue Prential Issue Prential Issue Proceeds: oceeds: oceeds: oceeds: oceeds: The utilization of preferential issue proceeds are regularly placed before the Board for review.
CEO & CFO cerCEO & CFO cerCEO & CFO cerCEO & CFO cerCEO & CFO certificate:tificate:tificate:tificate:tificate: The Managing Director and Senior Manager - Finance have certified to the Board on the mattersrequired to be reported as per Clause 49 of the listing agreement.
SecrSecrSecrSecrSecretarial Audit: etarial Audit: etarial Audit: etarial Audit: etarial Audit: A practicing Company Secretary carried out a secretarial audit to reconcile the total admitted capital withNational Securities Depository Limited (NSDL) and Central Depository services (India) Limited (CDSL) and the total issuedand listed capital. The audit confirms that the total issued / paid-up capital of the Company is in agreement with the totalnumber of shares in physical form and the total number of dematerialized shares held with NSDL and CDSL.
Corporate Governance Report
ANNUAL REPORT 2007-2008
6
ANNUAL REPORT 2009-2010
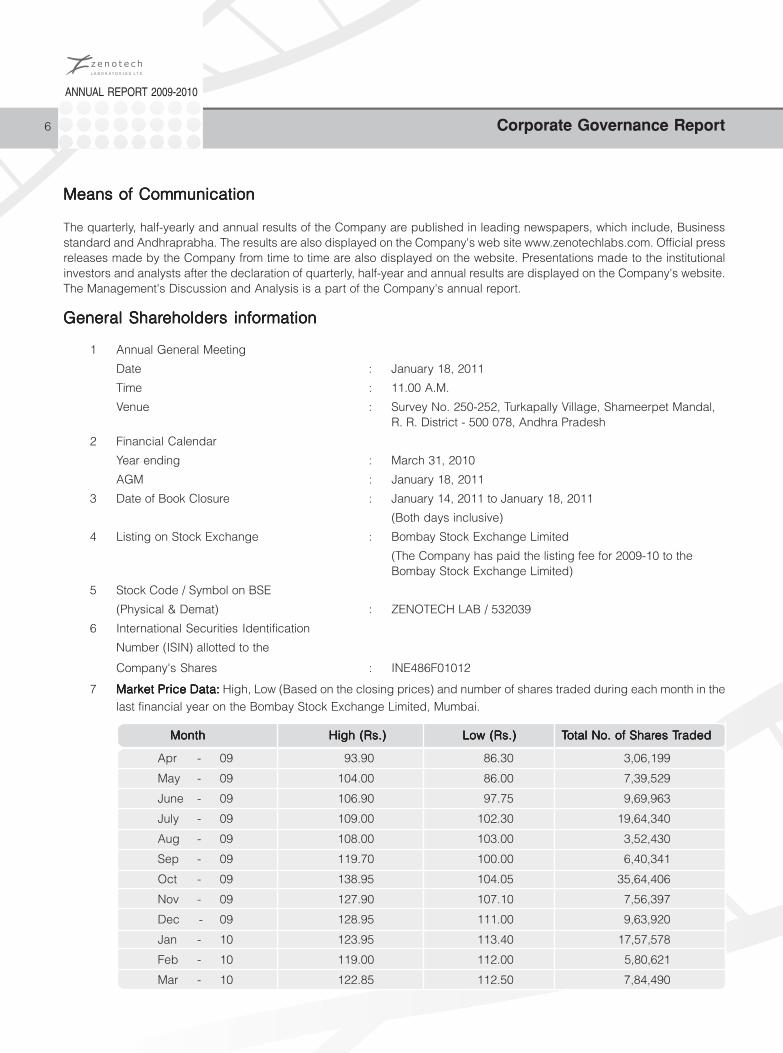
Means of ComMeans of ComMeans of ComMeans of ComMeans of Communicationmunicationmunicationmunicationmunication
The quarterly, half-yearly and annual results of the Company are published in leading newspapers, which include, Businessstandard and Andhraprabha. The results are also displayed on the Company's web site www.zenotechlabs.com. Official pressreleases made by the Company from time to time are also displayed on the website. Presentations made to the institutionalinvestors and analysts after the declaration of quarterly, half-year and annual results are displayed on the Company's website.The Management's Discussion and Analysis is a part of the Company's annual report.
General SharGeneral SharGeneral SharGeneral SharGeneral Shareholders inforeholders inforeholders inforeholders inforeholders informationmationmationmationmation
1 Annual General Meeting
Date : January 18, 2011
Time : 11.00 A.M.
Venue : Survey No. 250-252, Turkapally Village, Shameerpet Mandal,R. R. District - 500 078, Andhra Pradesh
2 Financial Calendar
Year ending : March 31, 2010
AGM : January 18, 2011
3 Date of Book Closure : January 14, 2011 to January 18, 2011
(Both days inclusive)
4 Listing on Stock Exchange : Bombay Stock Exchange Limited
(The Company has paid the listing fee for 2009-10 to theBombay Stock Exchange Limited)
5 Stock Code / Symbol on BSE
(Physical & Demat) : ZENOTECH LAB / 532039
6 International Securities Identification
Number (ISIN) allotted to the
Company's Shares : INE486F01012
7 Market Price Data:Market Price Data:Market Price Data:Market Price Data:Market Price Data: High, Low (Based on the closing prices) and number of shares traded during each month in thelast financial year on the Bombay Stock Exchange Limited, Mumbai.
MonthMonthMonthMonthMonth High (Rs.)High (Rs.)High (Rs.)High (Rs.)High (Rs.) Low (Rs.)Low (Rs.)Low (Rs.)Low (Rs.)Low (Rs.) TTTTTotal No. of Sharotal No. of Sharotal No. of Sharotal No. of Sharotal No. of Shares Tes Tes Tes Tes Tradedradedradedradedraded
Apr - 09 93.90 86.30 3,06,199
May - 09 104.00 86.00 7,39,529
June - 09 106.90 97.75 9,69,963
July - 09 109.00 102.30 19,64,340
Aug - 09 108.00 103.00 3,52,430
Sep - 09 119.70 100.00 6,40,341
Oct - 09 138.95 104.05 35,64,406
Nov - 09 127.90 107.10 7,56,397
Dec - 09 128.95 111.00 9,63,920
Jan - 10 123.95 113.40 17,57,578
Feb - 10 119.00 112.00 5,80,621
Mar - 10 122.85 112.50 7,84,490
Corporate Governance Report

ANNUAL REPORT 2007-2008
7
ANNUAL REPORT 2009-2010
8 Performance of share price of the Company in comparison to BSE Sensex
MonthMonthMonthMonthMonth Zenotech's Closing Price (Rs.)Zenotech's Closing Price (Rs.)Zenotech's Closing Price (Rs.)Zenotech's Closing Price (Rs.)Zenotech's Closing Price (Rs.) BSE Sensex ClosingBSE Sensex ClosingBSE Sensex ClosingBSE Sensex ClosingBSE Sensex Closing
Apr - 09 88.85 11,403.25
May - 09 98.35 14,625,.25
June - 09 104.20 14,493.84
July - 09 104.05 15,670.31
Aug - 09 104.70 15,666.64
Sep - 09 107.10 17,126.84
Oct - 09 107.15 15,896.28
Nov - 09 122.65 16,926.22
Dec - 09 114.20 17,464.81
Jan - 10 114.25 16,357.96
Feb - 10 114.05 16,429.55
Mar - 10 112.95 17,527.77
(SourSourSourSourSource: ce: ce: ce: ce: The information is compiled from the data available from the BSE website)
CharCharCharCharChart pert pert pert pert pertaining to the movement of Company's shartaining to the movement of Company's shartaining to the movement of Company's shartaining to the movement of Company's shartaining to the movement of Company's share price on BSE compare price on BSE compare price on BSE compare price on BSE compare price on BSE compared to BSE Sensex during theed to BSE Sensex during theed to BSE Sensex during theed to BSE Sensex during theed to BSE Sensex during thefinancial year 2009-10.financial year 2009-10.financial year 2009-10.financial year 2009-10.financial year 2009-10.
9 Registrar and Transfer Agents:Name & Address : Karvy Computershare Private Limited
Unit: Zenotech Laboratories LimitedPlot No. 17 to 24, Vithalrao Nagar, Madhapur, Hyderabad 500 081Tel: 91 - 40 - 23420818 & 23420828, Fax: 91 - 40 - 23420814E-mail: [email protected] Website: www.karvy.com
Corporate Governance Report

ANNUAL REPORT 2007-2008
8
ANNUAL REPORT 2009-2010
Corporate Governance Report
10 Share Transfer System:
The Company's shares are traded in the stock exchanges compulsorily in Demat form. The Company's Registrarand Transfer agent is the common agency to look after physical and Demat share work. The shares lodged fortransfer at the registrar are processed and returned to shareholders within the stipulated time.
11 Shareholding (as on March 31, 2010):
a)a)a)a)a) Distribution of sharDistribution of sharDistribution of sharDistribution of sharDistribution of shareholding as on Mareholding as on Mareholding as on Mareholding as on Mareholding as on March 31, 2010ch 31, 2010ch 31, 2010ch 31, 2010ch 31, 2010
No. of SharNo. of SharNo. of SharNo. of SharNo. of Shareseseseses Holding CapitalHolding CapitalHolding CapitalHolding CapitalHolding Capital % to accounts% to accounts% to accounts% to accounts% to accounts No. of AccountsNo. of AccountsNo. of AccountsNo. of AccountsNo. of Accounts % to T% to T% to T% to T% to Totalotalotalotalotal
1 - 500 9,02,169 2.62 6,161 82.93
501 - 1000 4,89,304 1.42 582 7.83
1001 - 2000 4,24,098 1.23 273 3.67
2001 - 3000 3,17,585 0.92 123 1.66
3001 - 4000 1,71,099 0.50 46 0.62
4001 - 5000 2,60,066 0.76 55 0.74
5001 - 10000 5,94,485 1.73 78 1.05
10001 & above 3,12,66,194 90.82 104 1.50
GRAND TOTAL 3,44,25,000 100.00 7,422 100.00
b)b)b)b)b) Categories of SharCategories of SharCategories of SharCategories of SharCategories of Shareholders as on Mareholders as on Mareholders as on Mareholders as on Mareholders as on March 31, 2010ch 31, 2010ch 31, 2010ch 31, 2010ch 31, 2010
CategorCategorCategorCategorCategoryyyyy No. of sharNo. of sharNo. of sharNo. of sharNo. of shareholderseholderseholderseholderseholders No. of sharNo. of sharNo. of sharNo. of sharNo. of shareseseseses PerPerPerPerPercentagecentagecentagecentagecentage
Indian Promoters 1 33,45,238 9.72
Foreign Promoters 1 24,12,500 7.01
Persons acting in Concert - Indian 1 30,60,500 8.89
Banks, Financial Institutions,Insurance Companies (Central / 6 18,18,938 5.28State Gov. Institutions / Non-government Institutions)
Foreign Institutional Investors 2 38,200 0.11
Private Corporate Bodies * 299 1,73,68,499 50.45
Indian Public 7,009 61,70,590 17.93
NRIs / OCBs 81 1,94,166 0.56
Clearing Members 22 16,369 0.05
TOTAL 7,422 3,44,25,000 100.00
* The Bodies Corporate as mentioned above includes 1,61,27,293 equity shares, constituting 46.85% of thepaid-up capital of the company, belongs to Ranbaxy Laboratories Ltd., in respect of which, opinion regardingstatus of shareholder is awaited.

ANNUAL REPORT 2007-2008
9
ANNUAL REPORT 2009-2010
CerCerCerCerCertificate on Compliance of Corporate Govertificate on Compliance of Corporate Govertificate on Compliance of Corporate Govertificate on Compliance of Corporate Govertificate on Compliance of Corporate Governancenancenancenancenance
TTTTTo the members of Zenotech Laboratories Limitedo the members of Zenotech Laboratories Limitedo the members of Zenotech Laboratories Limitedo the members of Zenotech Laboratories Limitedo the members of Zenotech Laboratories Limited
I have examined the compliance of the conditions of Corporate Governance by Zenotech Laboratories Limited for theyear ended March 31, 2010 as stipulated in Clause 49 of the Listing Agreement of the said company with the stockexchanges.
The compliance of conditions of corporate governance is the responsibility of management. My examination has beenlimited to a review of the procedures and implementation there of, adopted by the Company or ensuring the compliancewith the conditions of corporate governance. It is neither an audit nor an expression of opinion on the financial statementsof the Company.
In my opinion and to the best of my information and according to the explanations given to me, and the representationsmade by the directors and the management, I certify that the Company has not complied with the conditions of corporategovernance as stipulated in the above mentioned listing agreement.
As per records maintained by the Company, I state that no investor grievances are pending for a period exceeding onemonth against the Company.
Place : Hyderabad K. Ramesh BabuK. Ramesh BabuK. Ramesh BabuK. Ramesh BabuK. Ramesh BabuDate : December 11, 2010 Practicing Company Secretary
C.P. No. 6115
12 Dematerialization of shares and liquidity:The company's shares are compulsorily traded in dematerialization form. Equity shares of the Company representing80.97% of the company's share capital are dematerialized as on March 31, 2010. The Company's shares are regularlytraded on Bombay Stock Exchange Limited.
13 As on March 31, 2010, the company did not have any outstanding GDRs /ADRs / Warrants or any convertibleinstruments
14 Manufacture facility : Zenotech Laboratories LimitedSurvey No. 250-252 and 253, Turkapally Village,Shameerpet Village, R R District 500 078, Andhra Pradesh
15 Address of Correspondence : Zenotech Laboratories Limited8-2-120/112/88-89, Park View Estate, 4th Floor,Road No.2, Banjarahills, Hyderabad-500 034
Corporate Governance Report

ANNUAL REPORT 2007-2008
10
ANNUAL REPORT 2009-2010
Dear Members,Zenotech Laboratories Limited
Your directors herewith present the Twenty first Annual Report together with the audited accounts of the company for the yearended March 31, 2010.
Financial HighlightsFinancial HighlightsFinancial HighlightsFinancial HighlightsFinancial HighlightsRs. in lacs
2009-102009-102009-102009-102009-10 2008-092008-092008-092008-092008-09
Sales 691.58 655.02
Other Income 211.26 457.14
Profit/ (Loss) before interest, depreciation and amortization ofMisc. expenditure (608.31) (1140.02)
Interest 195.42 143.48
Depreciation 324.34 294.07
Amortization of Misc. expenditure 119.42 119.41
Profit/(Loss) before tax (1247.49) (1696.98)
Provision for tax (including deferred taxes) (2.03) 4.61
Profit / (Loss) after tax (1245.46) (2167.07)
Loss brought forward from previous year (3867.92) (1700.85)
Profit/(Loss) carried forward to balance sheet (5113.38) (3867.92)
Earnings Per Share (Rs.) - Basic (3.62) (6.30)
Company's business and operating rCompany's business and operating rCompany's business and operating rCompany's business and operating rCompany's business and operating resultsesultsesultsesultsesults
Revenues for the year were Rs. 902.84 lakhs, as against Rs. 1112.16 lakhs during the previous year. The revenues were mainlyfrom the Indian market with about Rs.8.98 lakhs coming from the export markets. Due to losses the company does not proposeany dividend.
ExporExporExporExporExport market and strategical alliances:t market and strategical alliances:t market and strategical alliances:t market and strategical alliances:t market and strategical alliances:
During the year under review, your Company has made exports to Kenya and Vietnam. Your Company has several distributionagreements in place including distribution agreement with Ranbaxy for CIS and Latin American countries.
SharSharSharSharShare capitale capitale capitale capitale capital
Your company has not made any allotment during the year
Directors' Report

ANNUAL REPORT 2007-2008
11
ANNUAL REPORT 2009-2010
PrPrPrPrPreferefereferefereferential allotmentential allotmentential allotmentential allotmentential allotment
Out of monies collected by way of issue of preferential allotment of Rs.87.83 Crores, the Company has utilized Rs.80.33 Croresas on December 11, 2010 towards, reimbursement of secured and unsecured loans, incurring of R&D expenditure, expansionactivities and working capital needs of the Company. The balance amount of Rs.7.50 Crores is kept in fixed deposits withbanks.
InterInterInterInterInternal audit and payment of Internal audit and payment of Internal audit and payment of Internal audit and payment of Internal audit and payment of Interest on Securest on Securest on Securest on Securest on Secured loans:ed loans:ed loans:ed loans:ed loans:
The Company is in the process of implementing the internal audit system. Further, the Company as on date has paid allamounts of loan and interest except loan availed from Technology Development Board (TDB), as was reported in point no. xiin annexure to the Auditors' Report. In respect of the loan availed from TDB, the Company is pursuing the matter with their headoffice, for reschedulement of the installments.
Employee Stock Option SchemeEmployee Stock Option SchemeEmployee Stock Option SchemeEmployee Stock Option SchemeEmployee Stock Option Scheme
Disclosures in this regard upto March 31, 2010 as required to be made in accordance with Clause 12 of SEBI (EmployeesStock Option Scheme and Employee Stock Purchase Scheme) Guidelines, 1999 are provided in the Annexure - A to thisreport.
CorporateCorporateCorporateCorporateCorporate Gov Gov Gov Gov Govererererernance and Management Discussion and Analysis Repornance and Management Discussion and Analysis Repornance and Management Discussion and Analysis Repornance and Management Discussion and Analysis Repornance and Management Discussion and Analysis Reporttttt
Separate reports on Corporate Governance along with Certificate of practicing Company Secretary on its compliance andManagement Discussion and analysis forming part of this report are given in separate sections in this Annual Report.
Status of Legal Cases filed against the CompanyStatus of Legal Cases filed against the CompanyStatus of Legal Cases filed against the CompanyStatus of Legal Cases filed against the CompanyStatus of Legal Cases filed against the Company
The original Promoters have filed a Company Petition No. 51 of 2009 dated 30.06.2009 before the Hon'ble Company LawBoard alleging oppression against Ranbaxy Laboratories Limited and its associates. Company is one of the Parties in thisCompany Petition.
Further Ranbaxy Laboratories Limited has filed another Company Petition No. 83 of 2009 on 07.10.2009 before the Hon'bleCompany Law Board counter alleging oppression and mismanagement against the original Promoters Dr. Jayaram Chigurupati,Mrs.Padmasree Chigurupati and Zenotech, L.L.C. The Company is one of the Respondents in this Petition also.
The Board of Directors have authorised Dr.Jayaram Chigurupati, Managing Director and Mr. Srivenkateswara Rao Sr. Manager-Finance to represent the Company before the Company Law Board and other courts and tribunals on May 21, 2010
Mr. D. Seshadri Naidu, Advocate was appointed as Counsel to represent the Company before the Hon'ble Company LawBoard and High Courts.
Mr. D. Seshadri Naidu, Advocate appeared before the Hon'ble Company Law Board and filed the documents with the CompanyLaw Board. Copy of the same is placed before the Board for its perusal.
Directors' Report

ANNUAL REPORT 2007-2008
12
ANNUAL REPORT 2009-2010
Mr. D. Seshadri Naidu is appearing before the Hon'ble High Court representing the Company.
When the matter stood thus, the Company through its Managing Director has issued a notice dated 13.02.2010 for terminationof the Development, License and Supply Agreement for Marketing and Sales dated 31.01.2007 related to GCSF on 19.04.2010for the breach of conditions by Ranbaxy Laboratories Limited. Ranbaxy Laboratories Limited replied to the same vide its lettersdated 04.05.2010.
Ranbaxy Laboratories Limited has filed a Company Application No. 80 of 2010 in Company Petition No. 51 of 2009 dated08.05.2010. The Hon'ble Company Law Board passed an order dated 21.05.2010 and passed the following order:
i. the operation of the termination notice dated February 13, 2010 issued by Zenotech stands stayed
ii. Zenotech is restrained from acting on the termination notice dated 13.02.2010.
Aggrieved with the order of the Company Law Board the Company has filed an appeal against the order vide CompanyAppeal No. 12 of 2010 dated 19.07.2010, which is pending before the Hon'ble High Court of Andhra Pradesh.
Meanwhile Ranbaxy filed a Company Application No. 150 of 2010 dated 24.09.2010 in Company Petition No. 83 of 2009 underSection 186 for convening an Extra Ordinary General Meeting in order to appoint three nominees on the board of the Company.The Hon'ble Company Law Board allowed the Application and passed the orders allowing the calling of EGM for appointmentof three directors on 24.11.2010.
The Original Promoters have challenged the order before the Hon'ble High Court vide Company Appeal No. 20 of 2010 on30.11.2010 which is pending for disposal.
The Company has initiated arbitration proceedings against Ranbaxy Pharmaceuticals, Inc, a subsidiary of Ranbaxy LaboratoriesLimited for breach and non-performance by Ranbaxy Pharmaceuticals, Inc pursuant to Development, Supply and MarketingAgreements dated March 3rd, 2007 in the week of October 18, 2010. This relates to seven ANDAs filed from Zenotech inDecember, 2007. Further the Company has issued a notice for Demand of Arbitration to Ranbaxy Laboratories Limited forbreach and non-performance by Ranbaxy Pharmaceuticals, Inc pursuant to Development, Supply and Marketing Agreementsdated January 31, 2007 related to GCSF on November 1, 2010.
SubsidiarSubsidiarSubsidiarSubsidiarSubsidiary Companiesy Companiesy Companiesy Companiesy Companies
1) The Company has a wholly owned subsidiary company, Zenotech Farmaceutica Do Brasil Limitada (ZFDBL), Brazil. Thesubsidiary company was acquired in January 2005. The subsidiary company has received ANVISA approval for itswarehouse facility in Brazil. Further regulatory approvals are to be received before commencement of commercial business.The Company has consolidated the financials in accordance with the IGAAP.
2) The Company has a wholly owned subsidiary company, Zenotech Laboratories Nigeria Limited (ZLNL), Nigeria. Thesubsidiary company was established in August 2005. The Company has obtained regulatory clearances for its productrange to commence commercial business and is already supplied with stocks, which are yet to be sold. The Companyhas consolidated the financials in accordance with the IGAAP.
3) The Company has a wholly owned subsidiary company, Zenotech Inc., New Jersey, USA. The subsidiary company hasconsolidated the financials in accordance with the IGAAP.
Directors' Report

ANNUAL REPORT 2007-2008
13
ANNUAL REPORT 2009-2010
However, in view of serious software problem encountered in accounting packages used by the subsidiaries as mentioned at1 to 3 above, they could submit only un-audited financial statements, as approved by their respective Board of Directors as perIndian GAAP and the directors of your company have relied upon the same. In terms of section 212 of the Companies Act,1956 the said un-audited financial statements as approved by the respective boards of above subsidiaries as well as astatement prepared pursuant to Section 212 (1) (e) of the said Act are attached herewith.
DirDirDirDirDirectors' Responsibility Statementectors' Responsibility Statementectors' Responsibility Statementectors' Responsibility Statementectors' Responsibility Statement
In compliance of Section 217 (2AA) of the Companies Act, 1956, the Board submits as under:
— in the preparation of the annual accounts, the applicable accounting standards had been followed along with properexplanation relating to material departures, if any;
— the Directors had selected such accounting policies and applied them consistently and made judgments and estimatesthat are reasonable and prudent so as to give a true and fair view of the state of affairs of the Company at the end ofthe financial year and of the profit or loss of the Company for that period;
— the Directors had taken proper and sufficient care for the maintenance of adequate accounting records in accordancewith the provisions of the Act for safeguarding the assets of the Company and for preventing and detecting fraudand other irregularities;
— the Directors had prepared the annual accounts on a going concern basis.
DepositsDepositsDepositsDepositsDeposits
The Company has not accepted any deposit under Section 58A of the Companies Act, 1956 during the year under review.
DirDirDirDirDirectorsectorsectorsectorsectors
The Board of Directors of the Company consists of three Directors one Managing Director and two independent Directorsappointed by the Hon'ble High Court of Andhra Pradesh vide its order dated 23.02.2010, hence none of the directors are liableto retire by rotation.
AuditorsAuditorsAuditorsAuditorsAuditors
M/s Deloitte Haskins & Sells, Chartered Accountants, Statutory Auditors of your Company hold office until the conclusion of theensuing Annual General Meeting. They have shown their inability to be re-appointed as the Statutory Auditors. Therefore, theBoard of Directors has proposed the appointment of M/s. BSR & Associates, Chartered Accountants, as the Statutory Auditors.The Company has received a certificate from them to the effect that their appointment if made would be within the limitsprescribed under Section 224(1) of the Companies Act, 1956.
Managements Response to Auditors Qualifications/Remarks:Managements Response to Auditors Qualifications/Remarks:Managements Response to Auditors Qualifications/Remarks:Managements Response to Auditors Qualifications/Remarks:Managements Response to Auditors Qualifications/Remarks:
1. In respect of observation made at point No. 4 (a) of the report, in the opinion of the Management, Zenotech Inc. in USA,a 100% subsidiary of the Company has many valuable IPRs', which were not considered and evaluated due to prevailingAccounting standards and norms. The Management further feels that at the consolidate level there is no erosion ofmonies utilised by the Zenotech Inc., USA for this purpose.
Directors' Report

ANNUAL REPORT 2007-2008
14
ANNUAL REPORT 2009-2010
2. In respect of observation made at point No. 4 (b) of the report, the Company is holding 24% stake in Credence OrganicsPrivate Limited aggregating to Rs. 0.24 lakhs and has also advanced a loan of Rs. 14.71 lakhs for its business purposeand in the opinion of the management, Credence Organics Private Limited is in the process of building its factory and theloan will be recoverable once it commences its operations.
3. In respect of observation made at point No. 4 (c) of the report, the Expenditure of Rs. 1040.03 lakhs, being spent ascapital work-in-progress, is represented by assets including buildings, plant & machinery and other assets. In the opinionof the Management, the stated value of these assets is realizable value and thus the same was appropriately stated.
4. In respect of observation made at point No. 4 (d) of the report, in the opinion of the Management the carrying cost of Plantand Machinery of Rs. 4,845.58 lakhs is appropriate considering the value of investment made to meet the objects of thecompany and the potential revenues can be generated there from over a period of time. Further, the management did notforesee any reason which may force the company to stop its business immediately.
5. In respect of observation made at point No. 4 (e) of the report, in the opinion of the Management, the Product DevelopmentExpenditure of Rs. 152.32 lakhs would be written off in the future years.
6. In respect of observation made at point No. 5 of the report, the disclosure relating to earning per shares as required interms of the Guidance Note on Accounting for employee share based payment has been made in Directors Report for theyear ended March 31, 2010.
7. In respect of observation made at point No. 6 of the report, the company did not owe any amounts to Micro and SmallEnterprises as at the Balance Sheet date.
ParParParParParticulars of Employeesticulars of Employeesticulars of Employeesticulars of Employeesticulars of Employees
During the year under review, none of the employees of the Company have drawn remuneration as specified under Section217(2A) of the Companies Act, 1956 read with the Companies (Particulars of Employees) Rules, 1975, except the following:
Sl. No.Sl. No.Sl. No.Sl. No.Sl. No. DetailsDetailsDetailsDetailsDetails ParParParParParticularsticularsticularsticularsticulars
1. Name of the employee Dr. Uma Devi Komath
2. The age of the employee. 48 years
3. Designation of the employee/Duties Vice President - Research andTechnical Services
4. Remuneration received. Rs.27,50,245
5. Nature of employment, whether contractual or otherwise. Contractual
6. Qualifications and experience of the employee. M. Sc - Biochemistry ., Ph.D
7. Date of commencement of employment. 01/08/2003
8. The last employment held by such employee before Dr. Reddy Laboratories Limited,joining the company. Hyderabad
9. The percentage of equity shares held by the employee in thecompany within the meaning of sub-clause (iii) of 0.00016% (58 Shares)clause (a) of sub-section (2A) of section 217 of the Act.
Directors' Report

ANNUAL REPORT 2007-2008
15
ANNUAL REPORT 2009-2010
Energy Conservation, ResearEnergy Conservation, ResearEnergy Conservation, ResearEnergy Conservation, ResearEnergy Conservation, Research and Developments, Tch and Developments, Tch and Developments, Tch and Developments, Tch and Developments, Technology absorption, Forechnology absorption, Forechnology absorption, Forechnology absorption, Forechnology absorption, Foreigneigneigneigneignexchange earexchange earexchange earexchange earexchange earnings and Outgonings and Outgonings and Outgonings and Outgonings and Outgo
The particulars relating to energy conservation, research and development, technology absorption, foreign exchange earningsand outgo, as required to be disclosed under Section 217(1)(e) of the Companies Act, 1956 read with Companies (Disclosureof Particulars in the Report of Board of Directors) Rules, 1988 are provided as Annexure - B to this report.
AcknowledgementAcknowledgementAcknowledgementAcknowledgementAcknowledgement
The Board of Directors would like to express their grateful appreciation for the assistance and co-operation received from theFinancial Institutions and Banks, like Andhra Pradesh State Financial Corporation (APSFC), Technology Development Board(TDB), Yes Bank, other banks, Government Authorities, Customers, Vendors and Members during the year under review.
Yours Directors also wish to place on record the sincere efforts and committed services put in by the employees at all levels.
For and on behalf of the Board
Place : Hyderabad DrDrDrDrDr. Jayaram Chigurupati. Jayaram Chigurupati. Jayaram Chigurupati. Jayaram Chigurupati. Jayaram Chigurupati Date : December 11, 2010 Managing Director
Directors' Report

ANNUAL REPORT 2007-2008
16
ANNUAL REPORT 2009-2010
DESCRIPTIONDESCRIPTIONDESCRIPTIONDESCRIPTIONDESCRIPTION PLAN - 1APLAN - 1APLAN - 1APLAN - 1APLAN - 1A PLAN 2PLAN 2PLAN 2PLAN 2PLAN 2
Number of Options available under the Scheme 92,000 42,500
Total Number of Options granted 92,000 42,500
Options granted during the year Nil Nil
Pricing formula The market price of the Share quoted on theBombay Stock Exchange as per SEBI(SEOS & ESPS) Guidelines, 1999 in vogue.
Options vested during FY 2009-10 Nil Nil
Options exercised during FY 2009-10 4250* Nil
The total number of shares arising as a result ofexercise of options 4250* Nil
Options lapsed during FY 2009-10 which aresubject to reissue Nil 10,000
Variation of terms of options Nil Nil
Money realized by exercise of options Rs.2,96,225 Nil
Grant Price (Face value of Rs.10) Rs. 69.70 Rs. 103.65
Total Number of options in force as onMarch 31, 2009 (cumulative) 17,000* 32,500
Grant details of members of senior management teamduring the year 2009-10 Nil Nil
Number of other employees who receives a grant in any one year options amounting to 5% or more of options Nil Nilgranted during that year
Number of employees who are granted options during anyone year, equal to or exceeding 1% of the issued capital Nil Nil(excluding outstanding warrants and conversions) of theCompany at the time of grant.
Diluted Earnings per Share (EPS) pursuant to issue of (Rs.3.64)shares on exercise of options calculated in accordancewith Accounting Standard (AS) 20
i) Method of calculation of employee compensation cost The grant price is the market price prevailing on the grantdate. Therefore, there will be no compensation cost asper Intrinsic Value basis.
ii) Difference between the employee compensation costso computed at (i) above and the employee compensation cost that shall have been recognized if it had Rs. 3.78 lakhsused the fair value of the options (in case the companyhas calculated the compensation cost using the intrinsicvalue of the Stock Options).
AnnexurAnnexurAnnexurAnnexurAnnexure – A :e – A :e – A :e – A :e – A :Details of Stock Options granted under Zenotech Stock Option Scheme, 2005 (ZESOS, 2005) as on 31.03.2010.Details of Stock Options granted under Zenotech Stock Option Scheme, 2005 (ZESOS, 2005) as on 31.03.2010.Details of Stock Options granted under Zenotech Stock Option Scheme, 2005 (ZESOS, 2005) as on 31.03.2010.Details of Stock Options granted under Zenotech Stock Option Scheme, 2005 (ZESOS, 2005) as on 31.03.2010.Details of Stock Options granted under Zenotech Stock Option Scheme, 2005 (ZESOS, 2005) as on 31.03.2010.
Pursuant to SEBI (Employees Stock Option Scheme and Employee Stock Purchase Scheme) Guidelines, 1999
Annexures to the Directors' Report

ANNUAL REPORT 2007-2008
17
ANNUAL REPORT 2009-2010
DESCRIPTIONDESCRIPTIONDESCRIPTIONDESCRIPTIONDESCRIPTION PLAN - 1APLAN - 1APLAN - 1APLAN - 1APLAN - 1A PLAN 2PLAN 2PLAN 2PLAN 2PLAN 2
iii) The impact of this difference on losses and The effect on the loss and earnings per share, had the fairearnings per share of the company value method been adopted, is presented below:
Loss after tax Rs. In lakhs
As reported (1247.49)
Add:Intrinsic Value Compensation cost Nil
Less:Fair Value Compensation Cost 3.78(Black Scholes model)
Adjusted Loss (1251.27)
Earnings Per Share Basic and diluted (Rs.)
As reported (3.64)
As adjusted (3.65)
iv) Weighted average exercise price fair value of stock options granted
Stock Options granted on 17.07.2006 30.07.2008
Weighted Average Exercise Price NA NA
Weighted Average Net Fair Value (Fair Value-Grant Price) Rs. 38.43 Rs. 25.19
Market price at BSE on the date of Grant (Rs.) Rs. 69.70 Rs.103.65
v) Description of the method and significant assumptions The Black-Scholes options-pricing model was developedused during the year to estimate the fair value of the for estimating fair value of traded options that have nooptions, including the following weighted average vesting restrictions and are fully transferable. Since,information options-pricing models require use of substantive
assumptions; changes therein can materially affect the fairvalue of options. The options-pricing models do notnecessarily provide a reliable measure of the fair value ofoptions.
vi) the main assumptions used in the Black- Scholes option-pricing model during the year were as follows:
Risk -free interest rate (%) 7% 7%
Expected Life of options from the date(s) of grant (Years) 3 3
Expected volatility (%) 0.47%
Dividend yield 0
*Note: Though the employees have exercised 4250 stock options which will result in allotment of equal number of shares andpaid the total amount, the Company could able to allot only 2500 equity shares as per the order of the Hon'ble Company LawBoard dated 06.08.2010
Annexures to the Directors' Report

ANNUAL REPORT 2007-2008
18
ANNUAL REPORT 2009-2010
AnnexurAnnexurAnnexurAnnexurAnnexure – B :e – B :e – B :e – B :e – B :
Additional inforAdditional inforAdditional inforAdditional inforAdditional information as rmation as rmation as rmation as rmation as requirequirequirequirequired under the Companies (Disclosured under the Companies (Disclosured under the Companies (Disclosured under the Companies (Disclosured under the Companies (Disclosure of pare of pare of pare of pare of particulars in the Reporticulars in the Reporticulars in the Reporticulars in the Reporticulars in the Report of the Boart of the Boart of the Boart of the Boart of the Board of Dird of Dird of Dird of Dird of Directors)ectors)ectors)ectors)ectors)Rules, 1988:Rules, 1988:Rules, 1988:Rules, 1988:Rules, 1988:
FORM AFORM AFORM AFORM AFORM A
A.A.A.A.A. Conservation of EnergyConservation of EnergyConservation of EnergyConservation of EnergyConservation of Energy
The Company has taken significant measures to reduce energy consumption by using energy efficient equipments.
Form for disclosure of particulars with respect to conservation of energy:
A. A. A. A. A. Power and fuel consumptionPower and fuel consumptionPower and fuel consumptionPower and fuel consumptionPower and fuel consumption As on MarAs on MarAs on MarAs on MarAs on March 31, 2010ch 31, 2010ch 31, 2010ch 31, 2010ch 31, 2010
1.1.1.1.1. ElectricityElectricityElectricityElectricityElectricity
i)i)i)i)i) PurPurPurPurPurchasedchasedchasedchasedchased
Units 24,02,800
Total amount (Rs.) 97,37,937
Rate/unit (Rs.) 4.05
ii)ii)ii)ii)ii) Own generation thrOwn generation thrOwn generation thrOwn generation thrOwn generation through diesel generation setough diesel generation setough diesel generation setough diesel generation setough diesel generation set
Units 3,86,791
Total amount (Rs.) 38,94,168
Units per liter of diesel oil 3.60
Rate/unit (Rs.) 10.07
2.2.2.2.2. Diesel (used in boiler)Diesel (used in boiler)Diesel (used in boiler)Diesel (used in boiler)Diesel (used in boiler)
Quantity (tonnes) 2,264
Total cost (Rs.) 47,91,351
Average rate (Rs.) 2,116
B. B. B. B. B. Consumption per unit of prConsumption per unit of prConsumption per unit of prConsumption per unit of prConsumption per unit of productionoductionoductionoductionoduction
The Company manufactures injectables of various forms and strengths. It is therefore, impractical to apportionthe consumption and cost of utilities to each unit.
B. TB. TB. TB. TB. Technology Absorptionechnology Absorptionechnology Absorptionechnology Absorptionechnology Absorption
During the financial year, the Company has not undertaken any technology transfer.
Annexures to the Directors' Report

ANNUAL REPORT 2007-2008
19
ANNUAL REPORT 2009-2010
FORM B :FORM B :FORM B :FORM B :FORM B : ResearResearResearResearResearch and Developmentch and Developmentch and Developmentch and Developmentch and Development
1.1.1.1.1. Specific arSpecific arSpecific arSpecific arSpecific areas in which R&D was carried out by the Companyeas in which R&D was carried out by the Companyeas in which R&D was carried out by the Companyeas in which R&D was carried out by the Companyeas in which R&D was carried out by the Company
In the year 2009-10, the areas of focus for R & D have been the following.
� Clone development and expression studies for more biosimilar products, Herceptin, Avastin, Interferon beta1a,Darbepoietin and Lucentis
� Pre-clinical toxicology studies for biosimilar Interferon beta1b and Pegylated Filgrastim after receiving regulatoryapprovals from RCGM
� Human comparative clinical trial for biosimilar Etanercept, study being initiated by the CRO Clinsys, after receivingapproval from the DCGI
� Development of improved processes leading to five-fold increase in expression levels of the mammalian cell clones.Aim to improve it further by another 2 to 5 fold during the year
� Coordination with Production team, as and when required, for bulk and formulation manufacture of commercialbatches of Filgrastim (Xphil nuTM), Molgramostim (MacrogenTM) and Aldesleukin (RecilTM) against market ordersreceived from Ranbaxy
� Improved product characterization, glycosylation and other biochemical and biophysical tests for all the products inthe pipeline.
New biosimilar products entered the pipeline for development. Biosimilar Herceptin targeted for treatment of breastcancer, Avastin for the treatment of metastatic cancer of colon, rectum or Her2 negative breast tumours, Interferon beta1a for multiple sclerosis, Darbepoietin for anemia related to chronic renal failure and Lucentis for age related maculardegeneration of the eye. Besides, improved cell culture processes have increased the expression levels significantly forthe mammalian cells by almost five-fold.
The pre-clinical toxicology studies for pegylated filgrastim and Interferon beta1b have been approved by the RCGM andthe studies have been initiated. The human clinical trial for Rituximab is ongoing and the Etanercept clinical trial is beinginitiated at different centres across the country.
The three flagship biosimilar products from the Biotech R&D product pipeline (Xphil nuTM, MacrogenTM and RecilTM)continue to be manufactured by Zenotech and marketed by Ranbaxy.
As the European and US regulatory authorities firm up their guidelines on allowing biosimilars to be marketed in theircountries, one needs to keep up with the rigorous tests required to prove biosimilarity and be internationally competitive.Keeping this in view, molecular characterization studies for all the biosimilar products, from glycosylations to otherbiochemical and biophysical studies have been stepped up.
2.2.2.2.2. Benefits derived as a rBenefits derived as a rBenefits derived as a rBenefits derived as a rBenefits derived as a result of the R&Desult of the R&Desult of the R&Desult of the R&Desult of the R&D
The R&D team with its integrated technology platforms has saved the company several crores of rupees, which wouldotherwise have been spent on acquiring technologies and building the product pipeline. It is a matter of pride for thecompany to be counted among the privileged few biotech companies that have such a capability. Whether it is expressionof heterologous genes in a microbial or mammalian host, selection of high producing clones, media optimization,fermentation and bioreactor technologies, protein purification, process scale-up or formulation, it is done entirely in-house by a dedicated and efficient R&D team.
Annexures to the Directors' Report

ANNUAL REPORT 2007-2008
20
ANNUAL REPORT 2009-2010
3.3.3.3.3. FuturFuturFuturFuturFuture plan of actione plan of actione plan of actione plan of actione plan of action
Biotech R&D plans to move more numbers up the product pipeline, seeing each of them through the regulatory hurdlesthat are mandatory for launching the products in the Indian market. With this phase accomplished, R&D can seek to lookbeyond the boundaries and hone its skills for entering the world of regulated markets. The biosimilar guidelines are all setto be framed for the US market, it is just a matter of fine print details, before it sees the light of the day. With Europe alreadyhaving put its maiden foot forward towards framing biosimilar guidelines, the uncertainty period across the globe seemsto draw to a close. There is no going back on the biosimilars story, and the R&D team needs to brace itself to meet thetough competition that lies ahead.
4.4.4.4.4. ExpenditurExpenditurExpenditurExpenditurExpenditure on R & De on R & De on R & De on R & De on R & DRs. in Lakhs
a. Capital 7.48
b. Recurring 236.79
c. Total 244.27
d. Total as percentage of turnover 37.21%
5.5.5.5.5. TTTTTechnology absorption, adoption and innovationechnology absorption, adoption and innovationechnology absorption, adoption and innovationechnology absorption, adoption and innovationechnology absorption, adoption and innovation
All processes transferred for pilot scale and commercial production will be developed by the in-house R&D team. Thereare no plans to collaborate with or out source technology from outside agencies.
6. For6. For6. For6. For6. Foreign Exchange Eareign Exchange Eareign Exchange Eareign Exchange Eareign Exchange Earnings and Outgonings and Outgonings and Outgonings and Outgonings and Outgo
Total foreign exchange used and earned:Rs. in lakhs
i) Foreign Exchange earnings 7.98
ii) Foreign Exchange outgo (including rawmaterials, components and spare parts ofcapital goods, investments and otherexpenditures in foreign currency includingdividends) 136.38
For and on behalf of the Board
Place : Hyderabad DrDrDrDrDr. Jayaram Chigurupati. Jayaram Chigurupati. Jayaram Chigurupati. Jayaram Chigurupati. Jayaram Chigurupati Date : December 11, 2010 Managing Director
Annexures to the Directors' Report

ANNUAL REPORT 2007-2008
21
ANNUAL REPORT 2009-2010
MANAGEMENT'S DISCUSSION AND ANALYSIS REPORT(This review contains Management's discussion of the Company's operational results and financial condition, and should beread in conjunction with the accompanying audited financial statements and associated notes).
IndustrIndustrIndustrIndustrIndustry Structury Structury Structury Structury Structure, Development and Outlooke, Development and Outlooke, Development and Outlooke, Development and Outlooke, Development and Outlook
The pharmaceutical industry is one of the success stories of India ensuring that good quality essential drugs are madeavailable at affordable prices to the vast population of the country as well as competing with some of the best names in theglobal markets. The industry is an intellectual industry and is in the front rank of India's science-based industries with investmentin research and development and wide ranging capabilities in the complex field of drug manufacture and technology. India'spharmaceutical industry is now the third largest in the world in terms of volume and 14th in terms of value. One reason for lowervalue share is the lower cost of drugs in India ranging from 5% to 50% less as compared to developed countries.
According to data published by the Department of Pharmaceuticals, Ministry of Chemicals and Fertilizers, total turnover ofIndia's pharmaceuticals industry between September 2008 and September 2009 was $ 21.04 billion. Of this, the domesticmarket was worth $ 12.3 billion.
According to an Ernst & Young and an industry body study released in September 2009, the increasing population of thehigher income group in the country will by 2015 open a potential $ 8 billion market. Besides, the report said the domesticpharma market is likely to touch $ 20 billion by 2015, making India a lucrative destination for clinical trials for global giants.
The accelerated growth over the years has been fuelled by exports to more than 200 countries with a sizeable share in theadvanced regulated markets of US and Western Europe. 40% of the world's active ingredient requirement is met by India.
Pharmaceutical industry in India ranks very high in terms of technology, quality and range of medicines manufactured. Fromsimple headache pills to sophisticated antibiotics and complex cardiac compounds, almost every type of medicine is nowmade indigenously.
The industry has made significant progress in creation of required infrastructure, meeting global needs for supply of qualitymedicines and active pharmaceutical ingredients (APIs), as also entering into the highly opportune area of contract researchand manufacturing (CRAM) and clinical trials.
Export of pharmaceutical products from India showed a combined annual growth rate (CAGR) of 21.25% during three consecutiveyears ending 2008-09 but grew only by 13% in 2009-10. India tops the world in exporting generic medicines worth of $ 11billion.
The biopharma sector contributed nearly three-fifth to the industry's revenues at US$ 1.9 billion, a rise of 12 per cent, followedby bioservices at US$ 573 million and bioagri at US$ 420.4 million. The remaining revenue came from the bioindustrials US$122.5 million and bioinformatics US$ 50.2 million segments.
Biopharma and bioservices sectors contributed 63 per cent and 33 per cent, respectively, to the total biotech exports. Thebioagriculture, bioindustrials and bioinformatics sectors remained focussed on domestic operations, bringing in nearly 90 percent of their revenues from India.
While the industry, spanning bio-pharma and agri-biotech, accounted for US$ 3 billion, the equipment and ancillary segmentcontributed around US$ 1 billion.
Management's Discussion and Analysis Report

ANNUAL REPORT 2007-2008
22
ANNUAL REPORT 2009-2010
India is also gaining importance as a clinical trial destination. According to a joint study by an industry body and Ernst and
Young (E&Y) released in August 2009, the industry-sponsored Phase II, Phase III clinical trial sites in India have grown by 116
per cent during June 2008 and August 2009, with the country moving from rank 18 to 12 across the 60 most active countries.
India participates in 7 per cent of the global Phase III trials and 3.2 per cent in the Phase II trials with industry-sponsored trials
having grown by 39 per cent CAGR during 2004-08.
OpporOpporOpporOpporOpportunities, Thrtunities, Thrtunities, Thrtunities, Thrtunities, Threats, Risks and Concereats, Risks and Concereats, Risks and Concereats, Risks and Concereats, Risks and Concernsnsnsnsns
It is now obvious that biosimilars presents a huge potential market. It is estimated that by 2013 about half of all products
coming off-patent will be biologicals. Exploiting the full potential however is dependent on several issues which were hithertounknown for small molecule generic drugs. The first and foremost of these is the ability to completely characterize the biological
macromolecule with respect to the innovator drug. For the first wave of biosimilar products, it was relatively easy with the
comparability exercise being fairly straightforward. But now, looming on the horizon are more complex biosimilar candidatessuch as EPO, heparins and monoclonal antibodies. The size, complexity and glycosylation patterns of these biologicals will
pose real challenges for the biosimilar comparability exercise, with the generic monoclonal antibodies topping the list in terms
of complexity. Monoclonal antibodies are not just big in size (150 KD versus 19 KD for GCSF), they are also increasingly
complex in function with the same molecule exhibiting several immune effector functions like complement dependent cytotoxicity(CDC) and antibody-dependent cellular cytotoxicity (ADCC). To add to this, the complex glycosylation pattern of the antibody
can affect function and immunogenicity, impacting the overall potency and safety of generic monoclonal antibodies.
Nonetheless, generic monoclonal antibodies represent a very significant business opportunity with several monoclonal antibody
therapeutics (rituximab, infliximab, etanercept, trantuzumab, adalimumab) losing patent protection in the next five years.
Even though, biosimilar monoclonal antibodies have just begun to show up in emerging countries, the regulatory pathway forapproving generic monoclonal antibodies does not exist in the EU or elsewhere in the regulated markets. It is anticipated that
EU will again take the lead in approving biosimilar monoclonal antibodies. The regulatory pathway would evolve further to
include more in-vitro and in-vivo functional assays as well as larger clinical trials to facilitate approval of biosimilar monoclonalantibodies. The capability to identify and respond to the challenges posed by the emergence of new and complex regulations
in biosimilars, will be the key to success in this market.
Analysis of financial perAnalysis of financial perAnalysis of financial perAnalysis of financial perAnalysis of financial perforforforforformance of the Companymance of the Companymance of the Companymance of the Companymance of the Company
Revenues for the year were Rs. 902.84 lakhs as against the previous year revenues of 1112.17 lakhs. The Company had anoperating loss of Rs. 608.31 lakhs for the year as against operating loss of Rs.1140.02 lakhs of previous year and the net lossafter tax is Rs.1245.45 lakhs as against a net loss of Rs. 2167.07 lakhs of previous year.
Liquidity and capital rLiquidity and capital rLiquidity and capital rLiquidity and capital rLiquidity and capital resouresouresouresouresources:ces:ces:ces:ces:
There is no change in shareholders funds during the financial year 2009-10.
The Company has invested over Rs.1225.23 lakhs in acquiring long term assets
Net working capital stood at Rs.2,477.96 lakhs against Rs.4,055.11 lakhs of previous year
Management's Discussion and Analysis Report

ANNUAL REPORT 2007-2008
23
ANNUAL REPORT 2009-2010
The Company's ability to generate funds from operating activities, including product sales, equity funds and debt financingfrom its financial institutions and others are expected to provide sufficient liquidity to meet its expansion/modernization andResearch and Development programs and working capital needs of the Company.
Material developments in HR/Industrial Relations frMaterial developments in HR/Industrial Relations frMaterial developments in HR/Industrial Relations frMaterial developments in HR/Industrial Relations frMaterial developments in HR/Industrial Relations front including number of peopleont including number of peopleont including number of peopleont including number of peopleont including number of peopleemployedemployedemployedemployedemployed
Your Company believes that the quality of its employees is the key to its success. It is committed to providing necessary humanresource development and training opportunities to equip them with necessary skills, which enables them to adapt tocontemporary technological advancements.
Employee relations during the year continued to be cordial and your Company is committed to maintaining good relations.
InterInterInterInterInternal contrnal contrnal contrnal contrnal control systems and their adequacyol systems and their adequacyol systems and their adequacyol systems and their adequacyol systems and their adequacy
The Company has an extensive system of internal controls to ensure that all of its assets are safeguarded and protectedagainst loss from unauthorized use or disposition, and that transactions are authorized, recorded and reported correctly.
The Company is aimed at implementing an internal control system that is geared towards achieving efficiency in operations,optimum utilization of resources, effective monitoring and compliance with all applicable laws and regulations.
FuturFuturFuturFuturFuture outlooke outlooke outlooke outlooke outlook
Your Company envisions developing G-CSF for EU market in Collaboration with Ranbaxy Laboratories Limited. Several genericmonoclonal antibodies are in clinical development and are likely to be launched in India.
CautionarCautionarCautionarCautionarCautionary statementy statementy statementy statementy statement
Statements in the Management's Discussion & Analysis Report, which seek to describe the Company's objectives, projections,estimates, expectations or predictions may be considered to be "forward looking statements" and are stated as required byapplicable laws and regulations. Actual results could differ from those expressed or implied. Many factors including globaland domestic demand-supply conditions, prices, raw-materials availability, technological changes, changes in GovernmentRegulations and policies, tax laws and other statutes may effect the actual results, which can be different from what theDirectors envisages in terms of future performance and outlook.
Management's Discussion and Analysis Report

ANNUAL REPORT 2007-2008
24
ANNUAL REPORT 2009-2010
TTTTTo the members of Zenotech Laboratories Limited,o the members of Zenotech Laboratories Limited,o the members of Zenotech Laboratories Limited,o the members of Zenotech Laboratories Limited,o the members of Zenotech Laboratories Limited,
1. We have audited the attached Balance Sheet of ZENOTECH LABORAZENOTECH LABORAZENOTECH LABORAZENOTECH LABORAZENOTECH LABORATORIES LIMITEDTORIES LIMITEDTORIES LIMITEDTORIES LIMITEDTORIES LIMITED ("the Company") as at March 31,2010, the Profit and Loss Account for the year ended on that date and the Cash Flow Statement for the year ended on thatdate, both annexed thereto. These financial statements are the responsibility of the Company's management. Ourresponsibility is to express an opinion on these financial statements based on our audit.
2. We conducted our audit in accordance with the auditing standards generally accepted in India. Those Standards requirethat we plan and perform the audit to obtain reasonable assurance about whether the financial statements are free ofmaterial misstatements. An audit includes examining, on a test basis, evidence supporting the amounts and disclosuresin the financial statements. An audit also includes assessing the accounting principles used and significant estimatesmade by the management, as well as evaluating the overall financial statement presentation. We believe that our auditprovides a reasonable basis for our opinion.
3. As required by the Companies (Auditor's Report) Order, 2003 [CARO], issued by the Central Government of India interms of Section 227(4A) of the Companies Act, 1956, we enclose in the Annexure a statement on the matters specifiedin the paragraphs 4 and 5 of the said Order.
4. We invite attention to:
a) Note 21 of Schedule 21 to the Financial Statements regarding investment of Rs.105.60 lakhs (31.3.2009 - Rs. 105.60lakhs) in and advances of Rs.366.04 lakhs (31.3.2009 - Rs. 398.93 lakhs) made to a wholly owned subsidiary and inrespect of which no provision has been made for reasons stated therein. We are unable to comment on the carryingcost of the investment and the recoverability of the amounts advanced.
b) Note 22 of Schedule 21 to the Financial Statements regarding investment of Rs. 0.24 lakhs in and loan of Rs. 14.71lakhs made to an associate company and in respect of which no provision has been made for reasons statedtherein. We are unable to comment on the carrying cost of the investment and the recoverability of the loans given.
c) Note 23 of Schedule 21 to the Financial Statements regarding carrying cost of Fixed Assets of Rs. 1,040.03 lakhs(31.3.2009 - Rs. 1041.65 lakhs) relating to an export oriented unit which is yet to be commissioned. We are unable tocomment on the appropriateness of the stated value in the financial statements.
d) In the absence of an assessment of indications that the Company's Plant & Machinery may be impaired andconsequential estimation of the recoverable amounts as required by Accounting Standard (AS) 28 - Impairment ofAssets - we are unable to comment on the appropriateness of the carrying cost of Plant & Machinery of Rs. 4,845.58lakhs.
e) Note 25 of Schedule 21 to the Financial Statements in respect of Product Development Expenditure amounting toRs. 152.32 lakhs being carried forward as at March 31, 2010 to be written of in future years for the reasons statedtherein. We are unable to comment in this regard.
The matters referred to in paragraphs (a) and (c) above, were also subject matters of qualifications in our auditreport on the financial statements for the year ended March 31, 2009.
Auditors' Report

ANNUAL REPORT 2007-2008
25
ANNUAL REPORT 2009-2010
5. Attention is invited to Note 24 (c) regarding absence of disclosures relating to Earnings Per Share as required interms of the Guidance Note on Accounting for Employee Share-based Payment issued by the Institute of CharteredAccountants of India.
6. The financial statements do not disclose information relating to amounts due to Micro enterprises and Small Enterprisesas at the Balance Sheet date and other disclosures required in terms of Schedule VI to the Companies Act, 1956.
7. Further to our comments in the Annexure referred to in paragraph 3 above and subject to paragraphs 4, 5 and 6above, we report that:
a) we have obtained all the information and explanation, which to the best of our knowledge and belief, werenecessary for the purposes of our audit;
b) in our opinion, proper books of account as required by law have been kept by the Company so far as appearsfrom our examination of those books;
c) the Balance Sheet, Profit and Loss Account and Cash Flow Statement dealt with by this report are in agreementwith the books of account;
d) in our opinion, the Balance Sheet, Profit and Loss Account and Cash Flow Statement dealt with by this reportcomply with the Accounting Standards referred to in Section 211(3C) of the Companies Act, 1956;
e) in our opinion and to the best of our information and explanations given to us, the said accounts, subject toadjustments which may be required in respect of matters dealt with in paragraph 4 above, the effect of whichwe are unable to determine, give the information required by the Companies Act, 1956, in the manner sorequired and give a true and fair view in conformity with the accounting principles generally accepted in India:
(i) in the case of Balance Sheet, of the state of affairs of the Company as at March, 31, 2010;
(ii) in the case of Profit and Loss Account, of the loss for the year ended on that date, and
(iii) in the case of Cash Flow Statement, of the cash flows of the Company for the year ended on that date.
8. On the basis of the written representations received from the directors as on March 31, 2010 and taken on record bythe Board of Directors, none of the Directors is disqualified as on March 31, 2010 from being appointed as a directorin terms of Section 274 (1)(g) of the Companies Act, 1956.
For Deloitte Haskins & SellsFor Deloitte Haskins & SellsFor Deloitte Haskins & SellsFor Deloitte Haskins & SellsFor Deloitte Haskins & SellsChartered Accountants
(Registration No 008072S)
K.RajasekharK.RajasekharK.RajasekharK.RajasekharK.RajasekharPlace : Secunderabad PartnerDate : August 5, 2010 Membership No.: 23341
Auditors' Report

ANNUAL REPORT 2007-2008
26
ANNUAL REPORT 2009-2010
(r(r(r(r(referreferreferreferreferreeeeed to in paragraph 3 of our rd to in paragraph 3 of our rd to in paragraph 3 of our rd to in paragraph 3 of our rd to in paragraph 3 of our reporeporeporeporeport of even date)t of even date)t of even date)t of even date)t of even date)
(i) Having regard to the nature of the Company's business/ activities/ result, clauses (vi), (xii), (xiii), (xiv), (xv), (xviii), (xix) and(xx) of CARO are not applicable.
(ii) In respect of fixed assets:
(a) The Company has maintained proper records showing full particulars including quantitative details and situation ofthe fixed assets.
(b) The fixed assets have been physically verified during the year by the management in accordance with a regularprogramme of verification which, in our opinion, provides for physical verification of all fixed assets at reasonableintervals, having regard to the size of the Company and the nature of its assets. According to the information andexplanations given to us, no material discrepancies were noticed on such verification.
(c) The fixed assets disposed off during the year, in our opinion, do not constitute substantial part of the fixed assets ofthe Company and such disposal has, in our opinion, not affected the going concern status of the Company.
(iii) In respect of inventory:
(a) As explained to us, the inventories have been physically verified during the year by the management at reasonableintervals.
(b) In our opinion and according to the information and explanations given to us, the procedures of physical verificationof inventories followed by the management were reasonable and adequate in relation to the size of the Companyand the nature of its business.
(c) In our opinion and according to the information and explanations given to us, the Company has maintained properrecords of its inventories and no material discrepancies were noticed on physical verification.
(iv) The Company has neither granted nor taken any loans, secured or unsecured, to/from companies, firms or other partieslisted in the Register maintained under Section 301 of the Companies Act, 1956.
(v) In our opinion and according to the information and explanations given to us, having regard to the explanation that someof the items purchased are of special nature and suitable alternative sources are not readily available for obtainingcomparable quotations, there is an adequate internal control system commensurate with the size of the Company and thenature of its business with regard to purchases of inventory and fixed assets and the sale of goods and services. Duringthe course of our audit, we have not observed any major weakness in such internal control system.
(vi) In respect of contracts or arrangements entered in the Register maintained in pursuance of Section 301 of the CompaniesAct, 1956, to the best of our knowledge and belief and according to the information and explanations given to us:
(a) The particulars of contracts or arrangements referred to Section 301 that needed to be entered in the Registermaintained under the said Section have been so entered.
(b) Where each such transaction is in excess of rupees five lakhs in respect of any party, the transactions have beenmade at prices which are prima facie reasonable having regard to the prevailing market prices at the relevant timeexcept in respect of certain purchases for which comparable quotations are not available and in respect of which weare unable to comment.
(vii) The Company does not have an internal audit system.
(viii) We have broadly reviewed the books of account maintained by the Company pursuant to the rules made by the CentralGovernment for maintenance of cost records under Section 209 (1) (d) of the Companies Act, 1956 in respect ofPharmaceutical Products and are of the opinion that prima facie the prescribed accounts and records have been madeand maintained. We have however, not made a detailed examination of the records with a view to determining whetherthey are accurate or complete. .
Annexure to the Auditors' Report

ANNUAL REPORT 2007-2008
27
ANNUAL REPORT 2009-2010
(ix) According to the information and explanations given to us in respect of statutory dues:
(a) The Company has generally been regular in depositing undisputed statutory dues including, investor education andprotection fund, employees' state insurance, income tax, sales tax, wealth tax, service tax, customs duty, exciseduty, cess and any other statutory dues applicable to it with the appropriate authorities. In respect of provident fundthere are delays in depositing dues.
(b) Except for provident fund dues of Rs. 45,000, there were no undisputed amounts payable in respect of income tax,wealth tax, customs duty, excise duty, cess and other material statutory dues in arrears as at March 31, 2010 for aperiod of more than six months from the date they became payable.
(c) There are no dues of income tax, sales tax, wealth tax, service tax, customs duty, excise duty and cess which havenot been deposited as at March 31, 2010 on account of any dispute.
(x) The accumulated losses of the Company at the end of the financial year are not less than fifty percent of its net worth. TheCompany has incurred cash loss during the financial year, and in the immediately preceding financial year.
(xi) According to the information and explanations given to us, the Company has defaulted in repayment of dues to financialinstitutions and banks as stated below:
Amount of default (loan and interAmount of default (loan and interAmount of default (loan and interAmount of default (loan and interAmount of default (loan and interest)est)est)est)est) Period of delayPeriod of delayPeriod of delayPeriod of delayPeriod of delay(Rs. Lakhs) (in days)(in days)(in days)(in days)(in days)
80.28 121
81.91 304
83.63 486
66.67 669
46.15 852
(xii) In our opinion and according to the information and explanations given to us, the term loans have been applied for thepurposes for which they were obtained.
(xiii) In our opinion and according to the information and explanations given to us and on an overall examination of theBalance Sheet of the Company, we report that funds raised on short term basis have not been used during the year forlong term investment.
(xiv) To the best of our knowledge and according to the information and explanations given to us, no fraud on or by theCompany has been noticed or reported during the year.
For Deloitte Haskins & SellsFor Deloitte Haskins & SellsFor Deloitte Haskins & SellsFor Deloitte Haskins & SellsFor Deloitte Haskins & SellsChartered Accountants
(Registration No 008072S)
K.RajasekharK.RajasekharK.RajasekharK.RajasekharK.RajasekharPlace : Secunderabad PartnerDate : August 5, 2010 Membership No.: 23341
Annexure to the Auditors' Report

ANNUAL REPORT 2007-2008
28
ANNUAL REPORT 2009-2010
Rs. in Lakhs
I.I.I.I.I. SOURCES OF FUNDSSOURCES OF FUNDSSOURCES OF FUNDSSOURCES OF FUNDSSOURCES OF FUNDS1.1.1.1.1. SharSharSharSharShareholders' Fundseholders' Fundseholders' Fundseholders' Fundseholders' Funds
(a) Share capital 1 3,442.50 3,442.50(b) Reserves and surplus 2 11,641.76 11,641.76
15,084.26 15,084.26
2.2.2.2.2. SharSharSharSharShare application money pending allotmente application money pending allotmente application money pending allotmente application money pending allotmente application money pending allotment 2.96 –3.3.3.3.3. Loan FundsLoan FundsLoan FundsLoan FundsLoan Funds
(a) Secured Loans 3 975.48 1,637.22(b) Unsecured Loans 4 12.80 12.80
988.28 1,650.02TTTTTotalotalotalotalotal 16,075.5016,075.5016,075.5016,075.5016,075.50 16,734.28 16,734.28 16,734.28 16,734.28 16,734.28
II.II.II.II.II. APPLICAAPPLICAAPPLICAAPPLICAAPPLICATION OF FUNDSTION OF FUNDSTION OF FUNDSTION OF FUNDSTION OF FUNDS1.1.1.1.1. Fixed Assets :Fixed Assets :Fixed Assets :Fixed Assets :Fixed Assets : 5
(a) Gross block 8,117.40 6,908.33(b) Less: Depreciation 1,164.12 843.87
(c) Net Block 6,953.28 6,064.46(d) Capital work-in-progress 1,272.73 2,369.21
8,226.01 8,433.672.2.2.2.2. InvestmentsInvestmentsInvestmentsInvestmentsInvestments 6 105.84 105.84
3.3.3.3.3. CurrCurrCurrCurrCurrent Assets, Loans and Advancesent Assets, Loans and Advancesent Assets, Loans and Advancesent Assets, Loans and Advancesent Assets, Loans and Advances(a) Inventories 7 232.13 289.50(b) Sundry Debtors 8 173.18 59.41(c) Cash and Bank balances 9 1,632.77 3,257.92(d) Loans and advances 10 854.22 981.12
2,892.30 4,587.95Less : CurrLess : CurrLess : CurrLess : CurrLess : Current Liabilities and Prent Liabilities and Prent Liabilities and Prent Liabilities and Prent Liabilities and Provisionsovisionsovisionsovisionsovisions(a) Current Liabilities 11 360.30 492.63(b) Provisions 12 54.05 40.21
414.35 532.84Net Current Assets 2,477.95 4,055.11
4.4.4.4.4. Miscellaneous ExpenditurMiscellaneous ExpenditurMiscellaneous ExpenditurMiscellaneous ExpenditurMiscellaneous Expenditureeeee(to the extent not written off or adjusted)Product development expenditure 13 152.32 262.40Other – 152.32 9.34 271.74
5.5.5.5.5. PrPrPrPrProfit and Loss Accountofit and Loss Accountofit and Loss Accountofit and Loss Accountofit and Loss Account 5,113.38 3,867.92
TTTTTotalotalotalotalotal 16,075.5016,075.5016,075.5016,075.5016,075.50 16,734.2816,734.2816,734.2816,734.2816,734.28
Significant accounting policies and notes 21
SchedulesSchedulesSchedulesSchedulesSchedules As atAs atAs atAs atAs at As at As at As at As at As atMarMarMarMarMarch 31, 2010ch 31, 2010ch 31, 2010ch 31, 2010ch 31, 2010 MarMarMarMarMarch 31, 2009ch 31, 2009ch 31, 2009ch 31, 2009ch 31, 2009
Schedules 1 to 21 annexed hereto form part of these financial statements. For and on behalf of the Board of Directors
Per our report attachedFor Deloitte Haskins & SellsFor Deloitte Haskins & SellsFor Deloitte Haskins & SellsFor Deloitte Haskins & SellsFor Deloitte Haskins & SellsChartered Accountants A. Raghu VA. Raghu VA. Raghu VA. Raghu VA. Raghu Vasuasuasuasuasu Justice A. Gopal RaoJustice A. Gopal RaoJustice A. Gopal RaoJustice A. Gopal RaoJustice A. Gopal Rao DrDrDrDrDr. Jayaram Chigurupati. Jayaram Chigurupati. Jayaram Chigurupati. Jayaram Chigurupati. Jayaram Chigurupati
Director Director Managing DirectorK. RajasekharK. RajasekharK. RajasekharK. RajasekharK. RajasekharPartner
Place : SecunderabadDate : August 5, 2010
Balance sheet as at March 31, 2010

ANNUAL REPORT 2007-2008
29
ANNUAL REPORT 2009-2010
Rs. in Lakhs
INININININCOMECOMECOMECOMECOMEIncome from Sales and Operations 691.58 655.02Less : Excise duty 35.07 52.70
Net sales 656.51 602.32Other income 14 211.26 457.14
867.77867.77867.77867.77867.77 1,059.461,059.461,059.461,059.461,059.46
EXPENDITUREEXPENDITUREEXPENDITUREEXPENDITUREEXPENDITURERaw materials consumed 15 249.05 470.92Payments and benefits to employees 16 460.08 622.25Manufacturing expenses 17 400.42 411.55Administrative and other expenses 18 263.22 384.29Product development expenses 103.31 310.47Interest and Bank charges 19 195.42 143.48Depreciation 324.34 294.07Amortisation of miscellaneous expenditure
- Product development expenditure 110.08 110.08- Other 9.34 9.33
119.42 119.41
2,115.26 2,756.44
Loss for the year beforLoss for the year beforLoss for the year beforLoss for the year beforLoss for the year before exceptional itemse exceptional itemse exceptional itemse exceptional itemse exceptional items (1,247.49) (1,696.98)
Less : Exceptional itemsLess : Exceptional itemsLess : Exceptional itemsLess : Exceptional itemsLess : Exceptional itemsProvision for diminution in the value of
investments – 119.78Provision for doubtful advance towards
share capital – 345.70
Loss for the year after exceptinal itemsLoss for the year after exceptinal itemsLoss for the year after exceptinal itemsLoss for the year after exceptinal itemsLoss for the year after exceptinal items (1,247.49) (2,162.46)Current Tax – –Provision for earlier years written back (2.03) –
Fringe benefit Tax – 4.61
Loss for the year after taxationLoss for the year after taxationLoss for the year after taxationLoss for the year after taxationLoss for the year after taxation (1,245.46) (2,167.07)Loss brought forward from previous year (3,867.92) (1,700.85)
Loss carried to Balance Sheet (5,113.38) (3,867.92)
Earning per Share (Face value Rs.10 each )- Basic and diluted (Rs.) (3.62) (6.30)
Significant accounting policies and notes 21
SchedulesSchedulesSchedulesSchedulesSchedules YYYYYear endedear endedear endedear endedear ended Y Y Y Y Year endedear endedear endedear endedear endedMarMarMarMarMarch 31, 2010ch 31, 2010ch 31, 2010ch 31, 2010ch 31, 2010 MarMarMarMarMarch 31, 2009ch 31, 2009ch 31, 2009ch 31, 2009ch 31, 2009
Schedules 1 to 21 annexed hereto form part of these financial statements. For and on behalf of the Board of Directors
Per our report attachedFor Deloitte Haskins & SellsFor Deloitte Haskins & SellsFor Deloitte Haskins & SellsFor Deloitte Haskins & SellsFor Deloitte Haskins & SellsChartered Accountants A. Raghu VA. Raghu VA. Raghu VA. Raghu VA. Raghu Vasuasuasuasuasu Justice A. Gopal RaoJustice A. Gopal RaoJustice A. Gopal RaoJustice A. Gopal RaoJustice A. Gopal Rao DrDrDrDrDr. Jayaram Chigurupati. Jayaram Chigurupati. Jayaram Chigurupati. Jayaram Chigurupati. Jayaram Chigurupati
Director Director Managing DirectorK. RajasekharK. RajasekharK. RajasekharK. RajasekharK. RajasekharPartner
Place : SecunderabadDate : August 5, 2010
Profit and Loss Account for the year ended March 31, 2010

ANNUAL REPORT 2007-2008
30
ANNUAL REPORT 2009-2010
Cash Flow Statement for the year ended March 31, 2010
Rs. in Lakhs
A.A.A.A.A. CASH FLOCASH FLOCASH FLOCASH FLOCASH FLOW FROM OPERAW FROM OPERAW FROM OPERAW FROM OPERAW FROM OPERATING ACTIVITIES:TING ACTIVITIES:TING ACTIVITIES:TING ACTIVITIES:TING ACTIVITIES:Net loss before tax and extraordinary items (1,247.49) (1,696.98)Adjustments for:Adjustments for:Adjustments for:Adjustments for:Adjustments for:
Depreciation 324.34 294.07Amortisation of Miscellaneous Expenditure 119.41 119.41Provision for doubtful advance – 8.14Interest income (198.87) (442.99)Foreign exchange loss/(gain) 33.05 (59.12)Interest expense 161.72 193.49Loss on sale of fixed assets 4.52 2.96
Operating loss beforOperating loss beforOperating loss beforOperating loss beforOperating loss before working capital changese working capital changese working capital changese working capital changese working capital changes (803.32)(803.32)(803.32)(803.32)(803.32) (1,581.02) (1,581.02) (1,581.02) (1,581.02) (1,581.02)
Adjustments for :Adjustments for :Adjustments for :Adjustments for :Adjustments for :Inventory 57.37 238.58Trade and Other receivables (113.93) 157.39Loans and advances 29.67 29.89Trade and Other payables (107.68) (182.91)
Cash used in operationsCash used in operationsCash used in operationsCash used in operationsCash used in operations (937.89) (937.89) (937.89) (937.89) (937.89) (1,338.07) (1,338.07) (1,338.07) (1,338.07) (1,338.07)
Taxes paid (including fringe benefit tax and wealth tax) (28.47) (108.75)
Net cash used in operating activitiesNet cash used in operating activitiesNet cash used in operating activitiesNet cash used in operating activitiesNet cash used in operating activities (966.36) (966.36) (966.36) (966.36) (966.36) (1,446.82) (1,446.82) (1,446.82) (1,446.82) (1,446.82)
B.B.B.B.B. CASH FLOW FROM INVESTING ACTIVITIES:CASH FLOW FROM INVESTING ACTIVITIES:CASH FLOW FROM INVESTING ACTIVITIES:CASH FLOW FROM INVESTING ACTIVITIES:CASH FLOW FROM INVESTING ACTIVITIES:Purchase of fixed assets (128.75) (1,290.21)Sale of fixed assets 7.56 5.00Advance towards share capital of subsidiaries – (62.45)Advance to subsidiaries – –Loans to subsidiary – (108.30)Interest received 293.13 445.89Proceeds from Bank fixed deposits 3,121.57 2,817.76Investment in Bank fixed deposits (400.00) –
Net cash frNet cash frNet cash frNet cash frNet cash from investing activitiesom investing activitiesom investing activitiesom investing activitiesom investing activities 2,893.512,893.512,893.512,893.512,893.51 1,807.69 1,807.69 1,807.69 1,807.69 1,807.69
C.C.C.C.C. CASH FLOW FROM FINANCING ACTIVITIES:CASH FLOW FROM FINANCING ACTIVITIES:CASH FLOW FROM FINANCING ACTIVITIES:CASH FLOW FROM FINANCING ACTIVITIES:CASH FLOW FROM FINANCING ACTIVITIES:Proceeds from issue of equity share capital – 7.50Share application money pending allotment 2.96 –Share premium received – 44.78Proceeds from borrowings – 48.81Repayment of borrowings (743.23) (189.00)Interest paid (90.46) (185.31)
Net cash used in financing activitiesNet cash used in financing activitiesNet cash used in financing activitiesNet cash used in financing activitiesNet cash used in financing activities (830.73)(830.73)(830.73)(830.73)(830.73) (273.22) (273.22) (273.22) (273.22) (273.22)
Net increase/(decrease) in cash and cash equivalents 1,096.421,096.421,096.421,096.421,096.42 87.65 87.65 87.65 87.65 87.65
CASH AND CASH EQUIVALENTS AT THE COMMENCEMENT OF THE YEAR 136.35 48.70CASH AND CASH EQUIVALENTS AT THE END OF THE YEAR * 1,232.77 136.35
* includes restricted cash balance (margin money) Rs. 126.09 lakhs (Previous year: Rs. 128.16 lakhs)
YYYYYear endedear endedear endedear endedear ended Y Y Y Y Year endedear endedear endedear endedear endedMarMarMarMarMarch 31, 2010ch 31, 2010ch 31, 2010ch 31, 2010ch 31, 2010 MarMarMarMarMarch 31, 2009ch 31, 2009ch 31, 2009ch 31, 2009ch 31, 2009
(Cntd..)
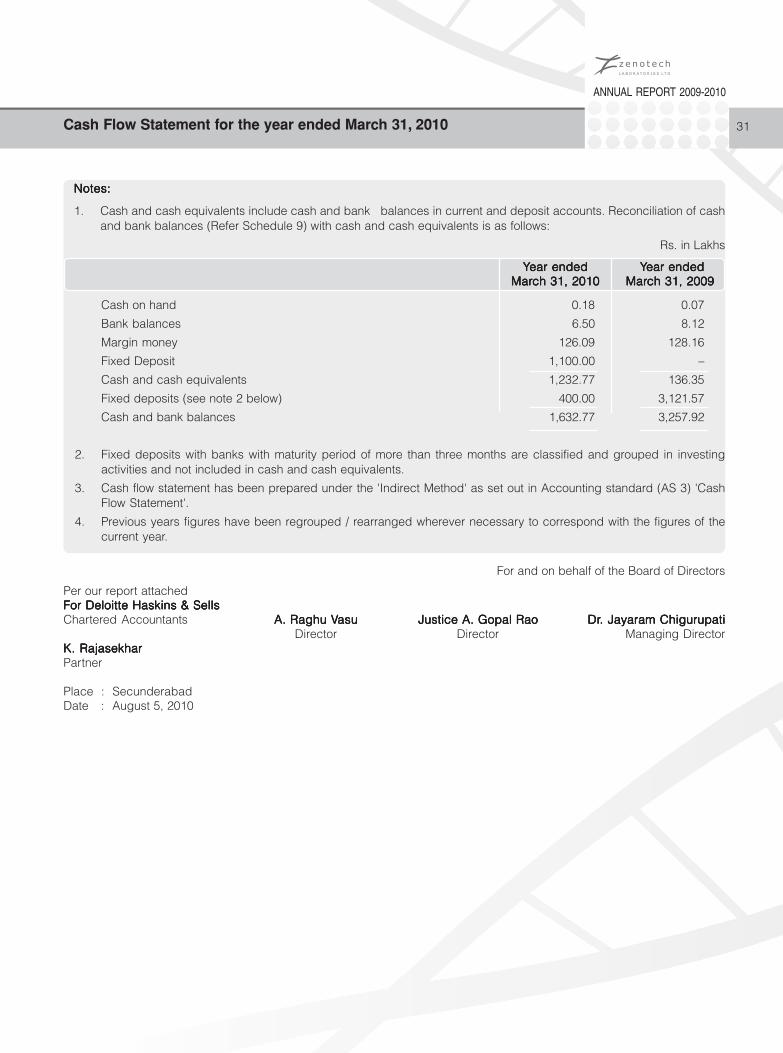
ANNUAL REPORT 2007-2008
31
ANNUAL REPORT 2009-2010
Cash Flow Statement for the year ended March 31, 2010
Rs. in Lakhs
Cash on hand 0.18 0.07
Bank balances 6.50 8.12
Margin money 126.09 128.16
Fixed Deposit 1,100.00 –
Cash and cash equivalents 1,232.77 136.35
Fixed deposits (see note 2 below) 400.00 3,121.57
Cash and bank balances 1,632.77 3,257.92
2. Fixed deposits with banks with maturity period of more than three months are classified and grouped in investingactivities and not included in cash and cash equivalents.
3. Cash flow statement has been prepared under the 'Indirect Method' as set out in Accounting standard (AS 3) 'CashFlow Statement'.
4. Previous years figures have been regrouped / rearranged wherever necessary to correspond with the figures of thecurrent year.
YYYYYear endedear endedear endedear endedear ended Y Y Y Y Year endedear endedear endedear endedear endedMarMarMarMarMarch 31, 2010ch 31, 2010ch 31, 2010ch 31, 2010ch 31, 2010 MarMarMarMarMarch 31, 2009ch 31, 2009ch 31, 2009ch 31, 2009ch 31, 2009
For and on behalf of the Board of Directors
Per our report attachedFor Deloitte Haskins & SellsFor Deloitte Haskins & SellsFor Deloitte Haskins & SellsFor Deloitte Haskins & SellsFor Deloitte Haskins & SellsChartered Accountants A. Raghu VA. Raghu VA. Raghu VA. Raghu VA. Raghu Vasuasuasuasuasu Justice A. Gopal RaoJustice A. Gopal RaoJustice A. Gopal RaoJustice A. Gopal RaoJustice A. Gopal Rao DrDrDrDrDr. Jayaram Chigurupati. Jayaram Chigurupati. Jayaram Chigurupati. Jayaram Chigurupati. Jayaram Chigurupati
Director Director Managing DirectorK. RajasekharK. RajasekharK. RajasekharK. RajasekharK. RajasekharPartner
Place : SecunderabadDate : August 5, 2010
Notes:Notes:Notes:Notes:Notes:
1. Cash and cash equivalents include cash and bank balances in current and deposit accounts. Reconciliation of cashand bank balances (Refer Schedule 9) with cash and cash equivalents is as follows:

ANNUAL REPORT 2007-2008
32
ANNUAL REPORT 2009-2010
Rs. in Lakhs
SCHEDULE 1SCHEDULE 1SCHEDULE 1SCHEDULE 1SCHEDULE 1 - SHARE CAPIT- SHARE CAPIT- SHARE CAPIT- SHARE CAPIT- SHARE CAPITALALALALAL
AuthorisedAuthorisedAuthorisedAuthorisedAuthorised
3,50,00,000 Equity Shares of Rs.10/- each 3,500.00 3,500.00
Issued and SubscribedIssued and SubscribedIssued and SubscribedIssued and SubscribedIssued and Subscribed
3,44,25,000 Equity Shares of Rs. 10/- each fully paid 3,442.50 3,442.50
3,442.503,442.503,442.503,442.503,442.50 3,442.503,442.503,442.503,442.503,442.50
Of the above
a) 1,11,27,664 equity shares of Rs.10/- each issued to erstwhileshareholders of Credence Pharmaceuticals Limited andHemarus Healthcare Private Limited pursuant to Scheme ofAmalgamation
b) 91,82,500 equity shares of Rs.10/- each issued to erstwhileShareholders of Zenotech Laboratories Private Limited,pursuant to Scheme of Amalgamation
c) Under the Zenotech Stock Option Scheme 2005, the Companyhas granted (net of options lapsed) 1,25,000 options of which125,000 vested options have been exercised
d) Under the Zenotech Employee Stock Option Scheme 2005,the Company granted 17,000 options (net of options lapsed)of which 4250 vested options have been exercised and arepending allotment (Refer Note 24(a))
e) Under the Zenotech Employee Stock Option Scheme 2005,the Company has granted 32,500 options(net of options lapsed)unvested as on 31.03.2010
SCHEDULE 2 - RESERSCHEDULE 2 - RESERSCHEDULE 2 - RESERSCHEDULE 2 - RESERSCHEDULE 2 - RESERVES & SURPLUSVES & SURPLUSVES & SURPLUSVES & SURPLUSVES & SURPLUS
SharSharSharSharShare Pre Pre Pre Pre Premiumemiumemiumemiumemium
At commencement of the year 11,641.76 11,596.98
Add : On issue of equity shares – 44.78
11,641.7611,641.7611,641.7611,641.7611,641.76 11,641.7611,641.7611,641.7611,641.7611,641.76
As atAs atAs atAs atAs at As at As at As at As at As atMarMarMarMarMarch 31, 2010ch 31, 2010ch 31, 2010ch 31, 2010ch 31, 2010 MarMarMarMarMarch 31, 2009ch 31, 2009ch 31, 2009ch 31, 2009ch 31, 2009
Schedules forming part of Balance Sheet

ANNUAL REPORT 2007-2008
33
ANNUAL REPORT 2009-2010
Rs. in Lakhs
SCHEDULE 3 - SECURED LOANSSCHEDULE 3 - SECURED LOANSSCHEDULE 3 - SECURED LOANSSCHEDULE 3 - SECURED LOANSSCHEDULE 3 - SECURED LOANS
(a)(a)(a)(a)(a) CashCashCashCashCash Cr Cr Cr Cr Credits / Wedits / Wedits / Wedits / Wedits / Working Capital loansorking Capital loansorking Capital loansorking Capital loansorking Capital loans
(i)(i)(i)(i)(i) BanksBanksBanksBanksBanks
YES Bank – 484.92
(Secured by first paripassu charge oncurrent assets of the Company)
(b)(b)(b)(b)(b) TTTTTerererererm Loansm Loansm Loansm Loansm Loans
(i)(i)(i)(i)(i) Financial InstitutionsFinancial InstitutionsFinancial InstitutionsFinancial InstitutionsFinancial Institutions
Andhra Pradesh State Financial Corporation 317.00 564.14
(Secured by way of hypothecation of plant and machineryand mortgage of land related to Biologics Facility and R&DFacility and personal guarantee of the Director of theCompany)
Technology Development Board (TDB) 512.81 512.81
(Secured by way of paripassu first charge on the whole ofmovable properties of the Company including movable plantand machinery, machinery spares, tools and accessories andother movables, both present and future and paripassu firstcharge on land or other immovable property of the Company,present and future, and personal guarantee of the Directorof the Company)
(ii)(ii)(ii)(ii)(ii) BanksBanksBanksBanksBanks
HDFC Bank Limited & Vijaya Bank 14.68 25.85
(Vehicle loans taken are secured by way of hypothecationof the respective vehicles)
(c)(c)(c)(c)(c) InterInterInterInterInterest accurest accurest accurest accurest accured and due on tered and due on tered and due on tered and due on tered and due on term loan frm loan frm loan frm loan frm loan from TDBom TDBom TDBom TDBom TDB 130.99 49.50
975.48975.48975.48975.48975.48 1,637.221,637.221,637.221,637.221,637.22
SCHEDULE 4 - UNSECURED LOANSSCHEDULE 4 - UNSECURED LOANSSCHEDULE 4 - UNSECURED LOANSSCHEDULE 4 - UNSECURED LOANSSCHEDULE 4 - UNSECURED LOANS
(other than short term)
Biotech Consortium India Limited 12.80 12.80
12.80 12.80 12.80 12.80 12.80 12.8012.8012.8012.8012.80
Repayable within one year Rs. 1.68 lakhs (31.03.2009: Rs. Nil)
As atAs atAs atAs atAs at As at As at As at As at As atMarMarMarMarMarch 31, 2010ch 31, 2010ch 31, 2010ch 31, 2010ch 31, 2010 MarMarMarMarMarch 31, 2009ch 31, 2009ch 31, 2009ch 31, 2009ch 31, 2009
Schedules forming part of Balance Sheet

ANNUAL REPORT 2007-2008
34
ANNUAL REPORT 2009-2010
Schedules forming part of Balance Sheet
Rs.
in L
akhs
Des
crip
tion
Des
crip
tion
Des
crip
tion
Des
crip
tion
Des
crip
tion
Gr
Gr
Gr
Gr
Gr o
ss B
lack
oss
Bla
ckos
s B
lack
oss
Bla
ckos
s B
lack
Dep
rD
epr
Dep
rD
epr
Dep
r eci
atio
nec
iatio
nec
iatio
nec
iatio
nec
iatio
nN
et B
ook
VN
et B
ook
VN
et B
ook
VN
et B
ook
VN
et B
ook
V alu
eal
ueal
ueal
ueal
ue
31-M
ar31
-Mar
31-M
ar31
-Mar
31-M
ar-0-0-0-0 -0
9999 9Ad
ditio
nsAd
ditio
nsAd
ditio
nsAd
ditio
nsAd
ditio
nsD
educ
tions
Ded
uctio
nsD
educ
tions
Ded
uctio
nsD
educ
tions
31-M
ar31
-Mar
31-M
ar31
-Mar
31-M
ar---- - 1
0101010 1031
-Mar
31-M
ar31
-Mar
31-M
ar31
-Mar
-0-0-0-0 -09999 9
For
the
year
For
the
year
For
the
year
For
the
year
For
the
year
Ded
uctio
nsD
educ
tions
Ded
uctio
nsD
educ
tions
Ded
uctio
ns31
-Mar
31-M
ar31
-Mar
31-M
ar31
-Mar
---- - 10101010 10
31-M
ar31
-Mar
31-M
ar31
-Mar
31-M
ar---- - 1
0101010 1031
-Mar
31-M
ar31
-Mar
31-M
ar31
-Mar
-0 -0-0-0 -09999 9
SC
HE
DU
LE -
5S
CH
ED
ULE
- 5
SC
HE
DU
LE -
5S
CH
ED
ULE
- 5
SC
HE
DU
LE -
5
FI
XE
D A
SS
ETS
FIX
ED
AS
SE
TS
FI
XE
D A
SS
ETS
FIX
ED
AS
SE
TS
FI
XE
D A
SS
ETS
Land
(fre
ehol
d)
140
.08
– –
140
.08
– –
– –
140
.08
140
.08
Bui
ldin
gs
2,0
46.6
6 5
.61
– 2
,052
.27
191
.39
68.
41 –
259
.80
1,7
92.4
7 1
,855
.27
Leas
ehol
d I
mp
rove
men
ts 3
2.61
– –
32.
61 2
7.51
2.0
2 –
29.
53 3
.08
5.1
0
Pla
nt a
nd M
achi
nery
4,4
04.9
0 1
,215
.93
– 5
,620
.83
546
.32
228
.93
– 7
75.2
5 4
,845
.58
3,8
58.5
8
ED
P E
qui
pm
ent
45.
22 1
.75
– 4
6.97
24.
26 7
.51
– 3
1.77
15.
20 2
0.96
Offi
ce E
qui
pm
ent
4.9
6 0
.35
– 5
.31
1.1
7 0
.33
– 1
.50
3.8
1 3
.79
Furn
iture
and
Fix
ture
s 1
21.2
9 1
.60
– 1
22.8
9 2
4.19
7.3
7 –
31.
56 9
1.33
97.
10
Vehi
cles
112
.61
– 1
6.17
96.
44 2
9.03
9.7
7 4
.09
34.
71 6
1.73
83.
58
6,9
08.3
3 6
,908
.33
6,9
08.3
3 6
,908
.33
6,9
08.3
3 1
,225
.24
1,2
25.2
4 1
,225
.24
1,2
25.2
4 1
,225
.24
16.
17 1
6.17
16.
17 1
6.17
16.
17 8
,117
.40
8,1
17.4
0 8
,117
.40
8,1
17.4
0 8
,117
.40
843
.87
843
.87
843
.87
843
.87
843
.87
324
.34
324
.34
324
.34
324
.34
324
.34
4.0
9 4
.09
4.0
9 4
.09
4.0
9 1
,164
.12
1,1
64.1
2 1
,164
.12
1,1
64.1
2 1
,164
.12
6,9
53.2
8 6
,953
.28
6,9
53.2
8 6
,953
.28
6,9
53.2
8
As
at M
arch
31,
200
9 6
,497
.09
424
.17
12.
93 6
,908
.33
554
.77
294
.07
4.9
7 8
43.8
7–
6,0
64.4
6
Not
es :
1.Fr
eeho
ld la
nd in
clud
es a
sum
of R
s.31
.76
lakh
s in
res
pec
t of w
hich
con
veya
nce
is p
end
ing
.
2.P
lant
and
Mac
hine
ry in
clud
es M
achi
nery
cos
ting
Rs.
132.
24 la
khs
whi
ch w
ere
retir
ed fr
om a
ctiv
e us
e w
ith e
ffect
from
Jul
y 31
, 200
8. N
et b
ook
valu
e of
thes
e as
sets
as
at th
e d
ate
of r
etire
men
t is
Rs.
112.
84 la
khs.

ANNUAL REPORT 2007-2008
35
ANNUAL REPORT 2009-2010
Schedules forming part of Balance Sheet
Rs. in Lakhs
SCHEDULE 6 - INVESTMENTSSCHEDULE 6 - INVESTMENTSSCHEDULE 6 - INVESTMENTSSCHEDULE 6 - INVESTMENTSSCHEDULE 6 - INVESTMENTSLong TLong TLong TLong TLong Terererererm (At Cost)m (At Cost)m (At Cost)m (At Cost)m (At Cost)
Trade - Unquotated
A.A.A.A.A. SharSharSharSharShares in wholly owned subsidiarieses in wholly owned subsidiarieses in wholly owned subsidiarieses in wholly owned subsidiarieses in wholly owned subsidiaries
Zenotech Farmaceutica Do Brasil Ltda 116.61 116.6139,600 quotas of Reais 10 eachLess: Provision for diminution in value (116.61) – (116.61) –
Zenotech Laboratories Limited, Nigeria 3.17 3.179,99,000 Ordinary shares of Naira 1 eachLess: Provision for diminution in value (3.17) – (3.17) –
Zenotech Inc., USA10,00,000 shares of USD 0.10 each 105.60 105.60
B.B.B.B.B. SharSharSharSharShares in associate companyes in associate companyes in associate companyes in associate companyes in associate companyCredence Organics Pvt. Ltd2400 shares of Rs.10 each 0.24 0.24
105.84105.84105.84105.84105.84 105.84105.84105.84105.84105.84
SCHEDULE 7 - INVENTORIESSCHEDULE 7 - INVENTORIESSCHEDULE 7 - INVENTORIESSCHEDULE 7 - INVENTORIESSCHEDULE 7 - INVENTORIES(at lower of cost and net realisable value)Raw and packing material 103.70 163.90Work in process 115.94 112.71Finished goods 12.49 12.89
232.13232.13232.13232.13232.13 289.50289.50289.50289.50289.50SCHEDULE 8 - SUNDRSCHEDULE 8 - SUNDRSCHEDULE 8 - SUNDRSCHEDULE 8 - SUNDRSCHEDULE 8 - SUNDRY DEBTORSY DEBTORSY DEBTORSY DEBTORSY DEBTORS
Unsecured, considered good unless otherwise specified
Debts outstandng for a period exceeding six months 30.80 2.36
Other Debts 142.38 57.05
173.18173.18173.18173.18173.18 59.4159.4159.4159.4159.41SCHEDULE 9 - CASH AND BANK BALANCESSCHEDULE 9 - CASH AND BANK BALANCESSCHEDULE 9 - CASH AND BANK BALANCESSCHEDULE 9 - CASH AND BANK BALANCESSCHEDULE 9 - CASH AND BANK BALANCES
Cash on Hand 0.18 0.07
With Scheduled Banks
- Current Account 6.22 7.83
- Fixed Deposit 1,100.00 3,121.57
- Margin Account 126.09 128.16
With Non- Scheduled Bank *
- Current Account 0.28 0.29
- Deposit Account 400.00 –
1,632.771,632.771,632.771,632.771,632.77 3,257.92 3,257.92 3,257.92 3,257.92 3,257.92
* Balance with Coastal Local Area Bank Limited. Maximum balance during the year is Rs. 400.29 lakhs(31.03.2009: Rs. 150 lakhs)
The Managing Director of the Company is also a Director/ Shareholder of this Bank.
As atAs atAs atAs atAs at As at As at As at As at As atMarMarMarMarMarch 31, 2010ch 31, 2010ch 31, 2010ch 31, 2010ch 31, 2010 MarMarMarMarMarch 31, 2009ch 31, 2009ch 31, 2009ch 31, 2009ch 31, 2009

ANNUAL REPORT 2007-2008
36
ANNUAL REPORT 2009-2010
As atAs atAs atAs atAs at As at As at As at As at As atMarMarMarMarMarch 31, 2010ch 31, 2010ch 31, 2010ch 31, 2010ch 31, 2010 MarMarMarMarMarch 31, 2009ch 31, 2009ch 31, 2009ch 31, 2009ch 31, 2009
SCHEDULE 10 - LOANS AND ADVSCHEDULE 10 - LOANS AND ADVSCHEDULE 10 - LOANS AND ADVSCHEDULE 10 - LOANS AND ADVSCHEDULE 10 - LOANS AND ADVANCESANCESANCESANCESANCES(Unsecured)
Loans to Companies 14.71 14.71Loan to Subsidiary (interest free loan)
Zenotech Inc, USA(Maximum amount outstanding during the period Rs. 232.92 lakhs;31.03.2009: Rs.262.90 lakhs)" 232.92 262.90
Advance to SubsidiaryZenotech Laboratories Limited, Nigeria(Maximum amount outstanding during the year Rs.8.14 lakhs;31.03.2009 - Rs. 8.14 lakhs)" 8.14 8.14Zenotech Inc., USA(Maximum amount outstanding during the year Rs. 25.48 lakhs;31.03.2009 - Rs. 25.48 lakhs)" 22.57 25.48
Advance recoverable in cash or in kind or for value to be received* 241.53 269.62Interest accrued on loans/ deposits 30.12 124.38Advances against share capital to subsidiaries
Zenotech Farmaceutica Do Brasil Ltda 319.56 319.56Zenotech Laboratories Limited, Nigeria 26.14 26.14Zenotech Inc., USA 110.55 110.55
Balance with Excise Authorities on Current Account 1.75 3.38Advance Income Tax (incl TDS receivable) 200.07 170.10
1,208.06 1,334.96Less: Provision for doubtful advances 353.84 353.84
854.22 981.12Of the above: Considered Good 854.22 981.12
Considered doubtful 353.84 353.84
1,208.061,208.061,208.061,208.061,208.06 1,334.96 1,334.96 1,334.96 1,334.96 1,334.96*Includes
Due from Managing Director Rs. 1.47 lakhs (31.03.2009 - Rs. 9.99 lakhs).Maximum amount outstanding during the year Rs. 26.73 lakhs (31.03.2009- Rs. 17.71 lakhs)
1. Disclosure in terms of Clause 32 of the listing agreement:
a. Interest free advance given to Credence Clinical Research Pvt.Ltd. Rs. 20.89 lakhs (31.03.2009 - Rs. 20.89 lakhs). CertainDirectors of the Company are also Director/ Shareholders of theabove Company. Maximum amount outstanding during the yearRs. 20.89 lakhs (31.03.2009 - Rs. 20.89 lakhs)
b. There has been no investments in the Company's shares by theLoanee
Schedules forming part of Balance Sheet
Rs. in Lakhs

ANNUAL REPORT 2007-2008
37
ANNUAL REPORT 2009-2010
Schedules forming part of Balance Sheet
Rs. in Lakhs
SCHEDULE 11 - CURRENT LIABILITIESSCHEDULE 11 - CURRENT LIABILITIESSCHEDULE 11 - CURRENT LIABILITIESSCHEDULE 11 - CURRENT LIABILITIESSCHEDULE 11 - CURRENT LIABILITIESSundry Creditors (See Note. 14)
(i) Due to micro enterprises and small enterprises – –
(ii) Due to other than micro enterprises and small enterprises * 209.73 374.12
Due to Subsidiaries
Zenotech Inc., USA 19.85 –
Interest accrued but not due on loans 17.27 27.72
Other liabilities 113.45 ** 90.79
360.30360.30360.30360.30360.30 492.63 492.63 492.63 492.63 492.63
Note: There are no amounts due and outstanding to becredited to Investors Education and Protection Fund
* included interest accrued and due to Ranbaxy LaboratoriesLimited Rs. 7.05 lakhs (31.03.2009: Rs. 7.05 lakhs)
** included dues to Managing Director Rs. 15.75 lakhs(31.03.2009: Rs. Nil)
SCHEDULE 12 - PROVISIONSSCHEDULE 12 - PROVISIONSSCHEDULE 12 - PROVISIONSSCHEDULE 12 - PROVISIONSSCHEDULE 12 - PROVISIONS
Fringe Benefit Tax (Net) – 0.57Compensated Absences 24.93 19.11Gratuity 29.12 20.53
54.0554.0554.0554.0554.05 40.2140.2140.2140.2140.21
As atAs atAs atAs atAs at As at As at As at As at As atMarMarMarMarMarch 31, 2010ch 31, 2010ch 31, 2010ch 31, 2010ch 31, 2010 MarMarMarMarMarch 31, 2009ch 31, 2009ch 31, 2009ch 31, 2009ch 31, 2009
BalanceBalanceBalanceBalanceBalance AdditionsAdditionsAdditionsAdditionsAdditions WWWWWritten ofritten ofritten ofritten ofritten offffff BalanceBalanceBalanceBalanceBalanceas atas atas atas atas at duringduringduringduringduring as atas atas atas atas at
April 1, 2009April 1, 2009April 1, 2009April 1, 2009April 1, 2009 the yearthe yearthe yearthe yearthe year MarMarMarMarMarch 31, 2010ch 31, 2010ch 31, 2010ch 31, 2010ch 31, 2010
Preliminary expenses 1.67 – 1.67 –
Amalgamation expenses 7.67 – 7.67 –
Product development expenses 262.40 – 110.08 152.32
271.74271.74271.74271.74271.74 – 119.42 119.42 119.42 119.42 119.42 152.32 152.32 152.32 152.32 152.32
SCHEDULE 13 - MISCELLANEOUS EXPENDITURESCHEDULE 13 - MISCELLANEOUS EXPENDITURESCHEDULE 13 - MISCELLANEOUS EXPENDITURESCHEDULE 13 - MISCELLANEOUS EXPENDITURESCHEDULE 13 - MISCELLANEOUS EXPENDITURE (to the extent not written off or adjusted)
Rs. in Lakhs

ANNUAL REPORT 2007-2008
38
ANNUAL REPORT 2009-2010
SCHEDUSCHEDUSCHEDUSCHEDUSCHEDULE 14 - OTHER INCOMELE 14 - OTHER INCOMELE 14 - OTHER INCOMELE 14 - OTHER INCOMELE 14 - OTHER INCOME
Interest on deposits and loans (gross) (tax deducted at sourceRs. 27.60 lakhs; Previous Year: Rs. 100.94 lakhs) 198.87 442.99
Miscellaneous 12.39 14.15
211.26211.26211.26211.26211.26 457.14 457.14 457.14 457.14 457.14
SCHEDULE 15 - RASCHEDULE 15 - RASCHEDULE 15 - RASCHEDULE 15 - RASCHEDULE 15 - RAW MAW MAW MAW MAW MATERIALS CONSUMEDTERIALS CONSUMEDTERIALS CONSUMEDTERIALS CONSUMEDTERIALS CONSUMED
a)a)a)a)a) Raw material and packing material consumedRaw material and packing material consumedRaw material and packing material consumedRaw material and packing material consumedRaw material and packing material consumedOpening stock 163.90 214.62
Purchases 249.46 354.68
413.36 569.30Less: Closing stock 103.70 163.90
309.66 405.40Less: Transferred to product development expenses 54.28 106.36
255.38255.38255.38255.38255.38 299.04299.04299.04299.04299.04
b)b)b)b)b) (Incr(Incr(Incr(Incr(Increase) / Decrease) / Decrease) / Decrease) / Decrease) / Decrease in Finished Goods and Wease in Finished Goods and Wease in Finished Goods and Wease in Finished Goods and Wease in Finished Goods and Work-in-prork-in-prork-in-prork-in-prork-in-processocessocessocessocessOpening Stock :
- Finished Goods 12.89 278.44- Work - in - process 112.71 35.02
125.60 313.46Less: Closing stock :
- Finished Goods 12.49 12.89- Work - in - process 115.94 112.71
128.43 125.60(2.83) 187.86
c)c)c)c)c) Excise duty on incrExcise duty on incrExcise duty on incrExcise duty on incrExcise duty on increase/(decrease/(decrease/(decrease/(decrease/(decrease) of finished goodsease) of finished goodsease) of finished goodsease) of finished goodsease) of finished goods (3.50) (15.98)
249.05249.05249.05249.05249.05 470.92470.92470.92470.92470.92
SCHEDULESCHEDULESCHEDULESCHEDULESCHEDULE 16 - PA 16 - PA 16 - PA 16 - PA 16 - PAYMENTS AND BENEFITS TO EMPLOYEESYMENTS AND BENEFITS TO EMPLOYEESYMENTS AND BENEFITS TO EMPLOYEESYMENTS AND BENEFITS TO EMPLOYEESYMENTS AND BENEFITS TO EMPLOYEES
Salaries, Wages etc., 369.46 536.90
Contribution to Provident and other funds 31.45 30.51
Staff welfare 59.17 54.84
460.08460.08460.08460.08460.08 622.25 622.25 622.25 622.25 622.25
YYYYYear endedear endedear endedear endedear ended Y Y Y Y Year endedear endedear endedear endedear endedMarMarMarMarMarch 31, 2010ch 31, 2010ch 31, 2010ch 31, 2010ch 31, 2010 MarMarMarMarMarch 31, 2009ch 31, 2009ch 31, 2009ch 31, 2009ch 31, 2009
Schedules forming part of Profit & Loss Account
Rs. in Lakhs

ANNUAL REPORT 2007-2008
39
ANNUAL REPORT 2009-2010
SCHEDULE 17 - MANUFSCHEDULE 17 - MANUFSCHEDULE 17 - MANUFSCHEDULE 17 - MANUFSCHEDULE 17 - MANUFACTURING EXPENSESACTURING EXPENSESACTURING EXPENSESACTURING EXPENSESACTURING EXPENSESPower, fuel and water 189.36 210.85Repairs and maintenance
- Plant and Machinery 66.85 54.74- Building 12.34 15.15- Others 81.71 82.31
Contract manpower expenses 48.10 45.74Other manufacturing expenses 2.06 2.76
400.42400.42400.42400.42400.42 411.55 411.55 411.55 411.55 411.55
SCHEDULE 18 -SCHEDULE 18 -SCHEDULE 18 -SCHEDULE 18 -SCHEDULE 18 -ADADADADADMINISTRAMINISTRAMINISTRAMINISTRAMINISTRATIVE, SELLING AND DISTRIBUTION AND OTHER EXPENSESTIVE, SELLING AND DISTRIBUTION AND OTHER EXPENSESTIVE, SELLING AND DISTRIBUTION AND OTHER EXPENSESTIVE, SELLING AND DISTRIBUTION AND OTHER EXPENSESTIVE, SELLING AND DISTRIBUTION AND OTHER EXPENSES
Rent 21.19 19.05Office and general maintenance 32.37 30.78Rates and taxes 70.92 29.09Insurance 9.91 8.78Printing and stationery 5.12 12.93Communication expenses 10.54 8.66Legal and professional charges 62.05 55.53Travelling and conveyance expenses 19.27 35.01Commission on sales 4.21 4.14Selling and distribution expenses 2.79 18.33Loss/(Profit) on sale of fixed assets (net) 4.52 2.96Miscellaneous 20.33 20.07Debts written off – 130.82Provision for advance given to subsidiary – 8.14
263.22263.22263.22263.22263.22 384.29 384.29 384.29 384.29 384.29
SCHEDULSCHEDULSCHEDULSCHEDULSCHEDULE 19 - InterE 19 - InterE 19 - InterE 19 - InterE 19 - Interest and bank chargesest and bank chargesest and bank chargesest and bank chargesest and bank chargesOn Fixed Term Loans 124.15 134.59Others 37.57 58.90Foreign Exchange Loss/ (Gain) 32.50 (58.33)Bank Charges etc. 1.20 8.32
195.42195.42195.42195.42195.42 143.48143.48143.48143.48143.48
YYYYYear endedear endedear endedear endedear ended YYYYYear endedear endedear endedear endedear endedMarMarMarMarMarch 31, 2010ch 31, 2010ch 31, 2010ch 31, 2010ch 31, 2010 MarMarMarMarMarch 31, 2009ch 31, 2009ch 31, 2009ch 31, 2009ch 31, 2009
Schedules forming part of Profit & Loss Account
Rs. in Lakhs

ANNUAL REPORT 2007-2008
40
ANNUAL REPORT 2009-2010
Schedules forming part of Balance Sheet & Profit and Loss Account
Schedule 20 - CapacitySchedule 20 - CapacitySchedule 20 - CapacitySchedule 20 - CapacitySchedule 20 - Capacity, Pr, Pr, Pr, Pr, Production, Sales, consumptions and stocks:oduction, Sales, consumptions and stocks:oduction, Sales, consumptions and stocks:oduction, Sales, consumptions and stocks:oduction, Sales, consumptions and stocks:a)a)a)a)a) Quantitative inforQuantitative inforQuantitative inforQuantitative inforQuantitative information in rmation in rmation in rmation in rmation in respect of goods manufacturespect of goods manufacturespect of goods manufacturespect of goods manufacturespect of goods manufacturededededed
Unit Unit Unit Unit Unit 2009-102009-102009-102009-102009-10 2008-092008-092008-092008-092008-09
Licensed Licensed Licensed Licensed Licensed Capacity per annum *Capacity per annum *Capacity per annum *Capacity per annum *Capacity per annum *
i) Pharmaceutical formulations, Injectable Numbers 800,000 800,000
Lyophalized & liquid injections, Capsule Numbers 400,000 400,000
Tablets and capsules* Tablet Numbers 1,000,000 1,000,000
ii) Granulocyte Colony Stimulating Grams 200 200
Factor (G-CSF)
iii) Granulocyte Macrophage Colony Grams 100 100
Stimulating Factor (G-MCSF)
iv) Interleukin - II (IL-2) Grams 100 100
* Department of Industrial Policy and Promotion, Ministry of Commerce and Industry vide its Notification S.O.1386 (E)
dated 23rd September, 2005 has omitted Drugs and Pharmaceuticals from the Scheduled List. Licensed capacity
as given above is based on Licenses/Letter of Intent obtained earlier.
Installed capacityInstalled capacityInstalled capacityInstalled capacityInstalled capacity
(as certified by the management and relied upon by auditors,
being a technical matter)
i) Pharmaceutical formulations,
Lyophilized & liquid injections, Injectable Numbers 800,000 800,000
- Oncology
ii) Granulocyte Colony Stimulating Grams 200 200
Factor (G-CSF) or equivalent
Injectable Numbers 666,667 666,667
iii) Granulocyte Macrophage Colony Grams 100 100
Stimulating Factor (G-MCSF) or equivalent
Injectable Numbers 250,000 250,000
iv) Interleukin - II ( IL 2) Grams 100 100
or equivalent
Injectable Numbers 90,909 90,909
iv) Anesthesiology and others Injectable Numbers 2,400,000 2,400,000
PrPrPrPrProductionoductionoductionoductionoduction
i) Pharmaceutical formulations, Oncology Injectable Numbers 51,161 50,756
ii) GCSF Injectable Numbers 20,795 –
iii) GMCSF Injectable Numbers 1,712 956
iv) IL 2 Injectable Numbers 1,000 1,320

ANNUAL REPORT 2007-2008
41
ANNUAL REPORT 2009-2010
Schedules forming part of Balance Sheet & Profit and Loss Account
UnitUnitUnitUnitUnit 2009-102009-102009-102009-102009-10 2008-092008-092008-092008-092008-09
QuantityQuantityQuantityQuantityQuantity Rs. in lakhsRs. in lakhsRs. in lakhsRs. in lakhsRs. in lakhs QuantityQuantityQuantityQuantityQuantity Rs. in lakhsRs. in lakhsRs. in lakhsRs. in lakhsRs. in lakhs
b)b)b)b)b) Sales *Sales *Sales *Sales *Sales *Pharmaceutical formulations,- Oncology Injectable Numbers 49,934 511.82 56,123 495.64G-CSF Injectable Numbers 20,643 102.08 2,083 9.98G-MCSF Injectable Numbers 1,701 19.64 3,922 46.93IL 2 Injectable Numbers 880 31.75 1,320 47.62Anesthesiology and others Injectable Numbers – – 47,933 27.85
665.29 628.02Contract manufacturing income 26.29 27.00
691.58691.58691.58691.58691.58 655.02655.02655.02655.02655.02* Net of sales returns
c)c)c)c)c) Opening Stock of finished goodsOpening Stock of finished goodsOpening Stock of finished goodsOpening Stock of finished goodsOpening Stock of finished goodsPharmaceutical formulations,- Oncology Injectable Numbers 1,036 12.89 20,915 135.82G-CSF Injectable Numbers - - 3,997 54.61G-MCSF Injectable Numbers - - 6,014 16.47IL 2 Injectable Numbers - - - -Anesthesiology and others Injectable Numbers - - 147,899 71.54
12.8912.8912.8912.8912.89 278.44 278.44 278.44 278.44 278.44d)d)d)d)d) Closing Stock of finished goodsClosing Stock of finished goodsClosing Stock of finished goodsClosing Stock of finished goodsClosing Stock of finished goods
Pharmacetucial formulations,- Oncology Injectable Numbers 1,153 9.42 1,036 12.89G-CSF Injectable Numbers - - - -G-MCSF Injectable Numbers - - - -IL 2 Injectable Numbers 120 3.07 - -Anesthesiology and others Injectable Numbers - - - -
12.4912.4912.4912.4912.49 12.8912.8912.8912.8912.89
e)e)e)e)e) Raw and packing materials consumed*Raw and packing materials consumed*Raw and packing materials consumed*Raw and packing materials consumed*Raw and packing materials consumed*Docetaxel grams 261.50 6.95 499.96 20.06Epirubicin grams 133.29 12.37 230.16 23.77Gemcetabine grams 6742.60 24.35 2,933.50 18.41Paclitaxel grams 1794.70 38.63 1,822.78 42.47L-Asparagenase grams 346.30 17.88 404.90 18.84Others 209.48 281.85
309.66 405.40
* includes raw materials consumed for product development.

ANNUAL REPORT 2007-2008
42
ANNUAL REPORT 2009-2010
Schedules forming part of Balance Sheet & Profit and Loss Account
Schedule 21: Significant accounting policies and notes on accounts for the year endedSchedule 21: Significant accounting policies and notes on accounts for the year endedSchedule 21: Significant accounting policies and notes on accounts for the year endedSchedule 21: Significant accounting policies and notes on accounts for the year endedSchedule 21: Significant accounting policies and notes on accounts for the year endedMarMarMarMarMarch 31, 2010ch 31, 2010ch 31, 2010ch 31, 2010ch 31, 20101.1.1.1.1. Significant accounting policiesSignificant accounting policiesSignificant accounting policiesSignificant accounting policiesSignificant accounting policies
a)a)a)a)a) Basis of Accounting:Basis of Accounting:Basis of Accounting:Basis of Accounting:Basis of Accounting:
The financial statements have been prepared under historical cost convention, on accrual basis, in accordancewith the generally accepted accounting principles in India and in accordance with Accounting Standards asnotified by Companies (Accounting Standards) Rules 2006.
b)b)b)b)b) Use of Accounting EstimatesUse of Accounting EstimatesUse of Accounting EstimatesUse of Accounting EstimatesUse of Accounting Estimates
The preparation of financial statements in conformity with generally accepted accounting principles requiresmanagement to make estimates and assumptions that affect the reported amount of assets and liabilities anddisclosure of contingent liabilities on the date of financial statements and the result of operations during thereporting period. Although these estimates are based on management's knowledge of current events and actions,actual results could differ from those estimates.
c)c)c)c)c) Fixed assets:Fixed assets:Fixed assets:Fixed assets:Fixed assets:
Fixed Assets are carried at cost of acquisition or construction less accumulated depreciation. The actual costcapitalized comprises of cost of acquisition of the asset, clearing charges in case of imported assets, duties,taxes and other incidental expenditure incurred for acquiring the assets. Borrowing costs directly attributable toacquisition or construction of those fixed assets which necessarily take a substantial period of time to get ready fortheir intended use are capitalized.
d)d)d)d)d) DeprDeprDeprDeprDepreciation:eciation:eciation:eciation:eciation:
Depreciation on fixed assets is provided on the straight-line method and at the rates and in the manner specifiedin Schedule XIV to the Companies Act, 1956, except in respect of improvements to leasehold premises, wheredepreciation is charged over the lease period.
e)e)e)e)e) PrPrPrPrProduct development expendituroduct development expendituroduct development expendituroduct development expendituroduct development expenditure:e:e:e:e:
Direct material and overhead costs in relation to product development activities are treated as deferred revenueexpenditure and amortized over five years from the date revenue is generated from the respective products. Allother revenue expenditure is expensed as incurred and capital expenditure incurred on product development iscapitalized as fixed assets and depreciated in accordance with depreciation policy of the Company.
f)f)f)f)f) ForForForForForeign curreign curreign curreign curreign currency translations:ency translations:ency translations:ency translations:ency translations:
Transactions denominated in foreign currencies are recorded at the exchange rate prevailing at the time oftransaction. Monetary assets and liabilities related to foreign currency transactions remaining unsettled at the endof the year are translated at year end rates. The difference in translation of monetary assets and liabilities andrealized gains and losses to foreign exchange transactions are recognized in Profit and Loss account.
g)g)g)g)g) Investments:Investments:Investments:Investments:Investments:
Long term investments are stated at cost of acquisition less provision for permanent diminution in value of suchinvestments.
h)h)h)h)h) Inventories:Inventories:Inventories:Inventories:Inventories:
Inventories are valued at the lower of cost and net realisable value. Cost of inventories comprises cost of purchase,cost of conversion and other costs incurred in bringing the inventories to their present location and condition. Themethod of determining cost of various categories of inventories is as below:
i) Raw materials, Packing materials, Stores and spares - First - in - First Out method.
ii) Finished goods and Work-in-process - Weighted average method, which comprises direct material costs andappropriate overheads.

ANNUAL REPORT 2007-2008
43
ANNUAL REPORT 2009-2010
Schedules forming part of Balance Sheet & Profit and Loss Account
i)i)i)i)i) RetirRetirRetirRetirRetirement benefits:ement benefits:ement benefits:ement benefits:ement benefits:
Liability for employee benefits, both short and long term, for present and past services which are due as per termsof employment are recorded in accordance with Accounting Standard (AS) 15 " Employee Benefits" as notified bythe Companies (Accounting Standards) Rules, 2006.
i) Gratuity
Liability on account of Gratuity is determined and charged to Profit and Loss account on the basis of valuationby an independent Actuary. The liability is unfunded.
ii) Provident Fund
Contribution to Provident Fund (a defined contribution plan) is recognized and expensed on accrual basis.
iii) Compensated Absences
Liability in respect of compensated absence is determined and charged to Profit and Loss account on thebasis of valuation by an independent actuary.
j)j)j)j)j) Revenue rRevenue rRevenue rRevenue rRevenue recognition:ecognition:ecognition:ecognition:ecognition:
Sale of goods is recognized at the point of dispatch of finished goods to customers. Sales include amount recoveredtowards excise duty but excludes sales tax and is net of sales returns.
Service income is recognized as per the terms of the contract with customers when the related services areperformed.
Income from interest on deposits is recognised on time proportionate basis.
k)k)k)k)k) TTTTTaxes on Income :axes on Income :axes on Income :axes on Income :axes on Income :
Current tax is determined as the amount of tax payable in respect of taxable income for the year. Deferred tax isrecognized, subject to the consideration of prudence, on timing differences, being the difference between taxableincome and accounting income that originate in one period and are capable of reversal in one or more subsequentperiods.
l)l)l)l)l) Leases :Leases :Leases :Leases :Leases :
The Company's significant leasing arrangements are in respect of operating leases for office premises. Theleasing arrangements which are not cancelable range between 11 months to 5 years are generally and usuallyrenewable by mutual consent on agreed terms. The aggregate lease rents payable are charged as rent in theProfit and Loss account.
m)m)m)m)m) Miscellaneous expenditurMiscellaneous expenditurMiscellaneous expenditurMiscellaneous expenditurMiscellaneous expenditure:e:e:e:e:
Written off over a period of five years or the period over which the benefit of the expenditure is expected to bederived.
2. Subsequent to Daiichi Sankyo Company Limited (Daiichi) acquiring 63.92% stake in Ranbaxy Laboratories Limited(Ranbaxy) in October 2008, Daiichi announced an open offer to acquire 20% shares of Zenotech Laboratories Limited(the Company) at Rs. 113.62 per share. Aggrieved by the pricing of the share, one of the shareholders filed a petitionin the Hon'ble High Court of Madras. The Company has been named as Respondent in the said case. An interiminjunction in connection with the offer was given by the Hon'ble High Court of Madras and subsequently it was quashedby the Hon'ble Supreme Court based on a petition filed by Daiichi against the said injunction. Meanwhile some of theshareholders (excluding Ranbaxy) including Promoter and Managing Director of the Company filed a petition withSecurities Appellate Tribunal (SAT) with respect to the pricing of the share of the Company. SAT directed Daiichi to pricethe open offer at Rs. 160 per share. Daiichi has filed an appeal against the SAT order in the Supreme Court. TheSupreme Court vide its order dated July 8, 2010 has ruled in favour of Daiichi and allowed the open offer to be made atthe price of Rs.113.62 per share.

ANNUAL REPORT 2007-2008
44
ANNUAL REPORT 2009-2010
Schedules forming part of Balance Sheet & Profit and Loss Account
3.3.3.3.3. VVVVValue of imporalue of imporalue of imporalue of imporalue of imported and indigenous consumptionted and indigenous consumptionted and indigenous consumptionted and indigenous consumptionted and indigenous consumption
2009-102009-102009-102009-102009-10 2008-092008-092008-092008-092008-09
VVVVValuealuealuealuealue %%%%% VVVVValuealuealuealuealue %%%%%Rs. in lakhsRs. in lakhsRs. in lakhsRs. in lakhsRs. in lakhs Rs. in lakhsRs. in lakhsRs. in lakhsRs. in lakhsRs. in lakhs
i) Raw and packing materials
Imported 42.57 14 116.52 29
Indigenous 267.09 86 288.88 71
309.66309.66309.66309.66309.66 405.40405.40405.40405.40405.40
ii) Components and spare parts – –
309.66309.66309.66309.66309.66 405.40405.40405.40405.40405.40
Note: Components and spare parts referred to in para 4D(c) of Part II of Schedule VI to Companies Act, 1956 areassumed to be those incorporated in the goods produced and not those for maintenance of Plant andMachinery.
2009-102009-102009-102009-102009-10 2008-092008-092008-092008-092008-09
44444..... VVVVValue of Imporalue of Imporalue of Imporalue of Imporalue of Imports (on CIF Basis):ts (on CIF Basis):ts (on CIF Basis):ts (on CIF Basis):ts (on CIF Basis):Capital goods 60.69 58.64Raw materials and others 34.75 105.67Spares 6.02 7.85
101.46 172.165.5.5.5.5. EarEarEarEarEarnings in Fornings in Fornings in Fornings in Fornings in Foreign Exchangeeign Exchangeeign Exchangeeign Exchangeeign Exchange:
Exports of finished goods on FOB basis 7.98 39.19
6.6.6.6.6. ExpenditurExpenditurExpenditurExpenditurExpenditure in fore in fore in fore in fore in foreign curreign curreign curreign curreign currencyencyencyencyencyProduct development expenses 22.06 172.38Others 12.85 11.10
34.91 183.487.7.7.7.7. Managerial rManagerial rManagerial rManagerial rManagerial remuneration:emuneration:emuneration:emuneration:emuneration:
Salary 15.00 15.00Perquisites 7.80 7.80
22.8022.8022.8022.8022.80 22.8022.8022.8022.8022.80
Note:Note:Note:Note:Note:
1. Having regard to the fact that Gratuity is a defined benefit accrued based on actuarial valuation the amount applicableto an individual employee is not ascertainable and accordingly, has not been considered in the above computation.
2. Perquisites include contribution to Provident Fund Rs.1.80 lakhs (previous year Rs.1.80 lakhs)
8.8.8.8.8. Auditor's rAuditor's rAuditor's rAuditor's rAuditor's remunerationemunerationemunerationemunerationemuneration
Audit fees 10.00 5.00
Tax Audit fees – 2.00
Other Services 0.50 3.58
Out of pocket expenses 0.25 0.11
10.7510.7510.7510.7510.75 10.6910.6910.6910.6910.69

ANNUAL REPORT 2007-2008
45
ANNUAL REPORT 2009-2010
Rs. in lakhs
9.9.9.9.9. PrPrPrPrProduct development expendituroduct development expendituroduct development expendituroduct development expendituroduct development expenditure incurre incurre incurre incurre incurred comprises of:ed comprises of:ed comprises of:ed comprises of:ed comprises of:
Rs. in lakhs
2009-102009-102009-102009-102009-10 2008-092008-092008-092008-092008-09
Salaries 98.70 223.05
Raw and packing material consumed 54.28 106.36
Clinical Trial and Studies 23.71 19.11
Fees for technical services 22.82 172.38
Depreciation 29.15 27.37
Others 2.98 17.30
231.64231.64231.64231.64231.64 565.57565.57565.57565.57565.57
Note:
Product development expenditure has been shown under appropriate expenditure heads.
10.10.10.10.10. EarEarEarEarEarnings per sharnings per sharnings per sharnings per sharnings per shareeeee
2009-102009-102009-102009-102009-10 2008-092008-092008-092008-092008-09
a) Loss for the year ( Rs. in lakhs) (1247.48) (2,167.07)
b) Weighted Average number of Equity Shares
outstanding during the year 3,44,25,000 3,44,10,616
c) Potential equity shares on EmployeeStock option granted - Anti dilutive (13,932) (22,585)
d) Weighted average number of dilutive potentialequity shares in respect of share application money 2,454 –
e) Weighted Average number of Equity Shares incomputing diluted earnings per share ( b + d ) 3,44,27,454 3,43,88,031
f) Face value of each Equity Share (Rs.) 10 10
g) Earnings per share
- Basic (Rs.) (3.62) (6.30)
- Diluted (Rs.) (a / e) (3.62) (6.30)
11.11.11.11.11. Contingent liabilitiesContingent liabilitiesContingent liabilitiesContingent liabilitiesContingent liabilities
As atAs atAs atAs atAs at As atAs atAs atAs atAs atMarMarMarMarMarch 31, 2010ch 31, 2010ch 31, 2010ch 31, 2010ch 31, 2010 MarMarMarMarMarch 31,2009ch 31,2009ch 31,2009ch 31,2009ch 31,2009
Liability in respect of Bank guarantees 118.88 116.96
Liability in respect of Letter of credits – 48.33
12.12.12.12.12. Estimated amount of contracts remaining to be executed on capital account (net of advances) not provided for, as atMarch 31, 2010 is Rs. Nil (March 31, 2009: Rs. 20.56 lakhs).
13.13.13.13.13. Capital work-in-progress includes capital advances of Rs. Nil (March 31, 2009 Rs.24.44 lakhs)
Schedules forming part of Balance Sheet & Profit and Loss Account
Rs. in lakhs

ANNUAL REPORT 2007-2008
46
ANNUAL REPORT 2009-2010
14.14.14.14.14. SundrSundrSundrSundrSundry Cry Cry Cry Cry Creditors:editors:editors:editors:editors:
The Company has not received any confirmation from "suppliers" regarding their status under the Micro and SmallEnterprises Development Act 2006 and hence disclosures, if any, relating to amount unpaid as at the year endtogether with interest paid/payable as required under the said Act have not been given.
15.15.15.15.15. Segment rSegment rSegment rSegment rSegment reporeporeporeporeporting:ting:ting:ting:ting:
The Company has considered business segment as the primary segment for disclosure. The Company is engagedin the manufacture and trading of Pharmaceuticals in India, which in the context of Accounting Standard (AS) 17 -"Segment Reporting" notified by the Companies (Accounting Standards) Rules, 2006 is considered the only businesssegment.
16.16.16.16.16. TTTTTaxation:axation:axation:axation:axation:
In view of the brought forwards losses and no taxable income for the current year, the company has not recorded thecumulative deferred tax liability/asset as on March 31, 2009 and for the year arising on account of timing differences,as stipulated in Accounting Standard(AS) 22 - Accounting for taxes on income.
17.17.17.17.17. Related ParRelated ParRelated ParRelated ParRelated Party Disclosurty Disclosurty Disclosurty Disclosurty Disclosures:es:es:es:es:
Information relating to Related Party transactions as per "Accounting Standard (AS) 18" notified by the Companies(Accounting Standards) Rules, 2006.
(A)(A)(A)(A)(A) Name of the Related ParName of the Related ParName of the Related ParName of the Related ParName of the Related Partytytytyty RelationshipRelationshipRelationshipRelationshipRelationshipZenotech Farmaceutica Do Brasil Limiteda, Brazil (ZFDBL)Zenotech Laboratories Nigeria Limited, Nigeria (ZLNL) SubsidiaryZenotech, Inc., USA
Credence Organics Private Limited (COPL) Associate
Ranbaxy Laboratories Limited (RLL) Entity holding more than 20%
Hemarus Therapeutics Limited (HTHL)(Formerly known as Credence Clinical Promoter Group companiesResearch Private Limited) where common control exists
Rite Diagnostics Private Limited (RDPL) and with which the companyHemarus Technologies Limited (HTL) had transactionsCredence Power Projects Limited (CPPL)Credence Infrastructure Limited (CIL)Hemarus Biologicals Limited (HBL)
Dr. Jayaram Chigurupati, Promoter and KeyManaging Director Management Personnel
Schedules forming part of Balance Sheet & Profit and Loss Account

ANNUAL REPORT 2007-2008
47
ANNUAL REPORT 2009-2010
Schedules forming part of Balance Sheet & Profit and Loss Account
2009
-10
200
8-09
2009
-10
200
8-09
2009
-10
200
8-09
2009
-10
200
8-09
2009
-10
200
8-09
Sale
s to
RLL
––
––
––
497.
3647
3.86
– –
Prod
uct d
evel
opm
ent e
xpen
ses
paid
to
Zeno
tech
Inc,
USA
22.0
617
2.38
––
––
––
––
Rent
pai
d to
HTH
L–
––
–
–1.
79–
––
–
Rent
exp
ense
s sh
ared
with
HTL
––
––
1.68
6.5
––
––
Reim
burs
emen
t of
exp
ense
s–
––
––
––
8.36
––
Mat
eria
l Pur
chas
es fr
om
– RL
L–
––
––
–1.
3210
.79
––
– Ze
note
ch In
c., U
SA3.
69–
––
––
––
––
Fixe
d As
sets
pur
chas
ed fr
om
Zeno
tech
Inc.
, USA
23.7
4–
––
––
––
––
Purc
hase
of S
ervi
ces
from
RD
PL–
––
–0.
34–
––
––
Adva
nces
to H
BL–
––
––
0.03
––
––
Loan
s gi
ven
– Ze
note
ch In
c, U
SA–
53.1
1–
––
––
––
–
Inte
rest
acc
rued
on
loan
– C
OPL
––
1.83
1.83
– –
––
––
Adva
nce
for
shar
e ca
pita
l to
subs
idia
ries
ZFD
BL–
62.4
6–
––
––
––
–
Dire
ctor
s re
mun
erat
ion
––
––
– –
––
22.8
022
.80
Prov
isio
n fo
r D
imin
utio
n in
inve
stm
ents
– Z
FDBL
–11
6.61
––
––
––
––
– Z
LNL
–3.
17–
––
––
––
–
Prov
isio
n fo
r ad
vanc
es
– Z
LNL
–8.
14–
––
––
––
–
Prov
isio
n to
war
ds s
hare
app
licat
ion
mon
ey
– Z
FDBL
–31
9.56
––
––
––
––
– Z
LNL
–26
.14
––
––
––
––
(B)
(B)
(B)
(B)
(B)
Det
ails
of
tran
sact
ions
bet
wee
n th
e C
ompa
ny a
nd r
Det
ails
of
tran
sact
ions
bet
wee
n th
e C
ompa
ny a
nd r
Det
ails
of
tran
sact
ions
bet
wee
n th
e C
ompa
ny a
nd r
Det
ails
of
tran
sact
ions
bet
wee
n th
e C
ompa
ny a
nd r
Det
ails
of
tran
sact
ions
bet
wee
n th
e C
ompa
ny a
nd r
elat
ed P
arel
ated
Par
elat
ed P
arel
ated
Par
elat
ed P
artie
s an
d th
e st
atus
of
outs
tand
ing
bala
nces
at
the
year
end
ties
and
the
stat
us o
f ou
tsta
ndin
g ba
lanc
es a
t th
e ye
ar e
ndtie
s an
d th
e st
atus
of
outs
tand
ing
bala
nces
at
the
year
end
ties
and
the
stat
us o
f ou
tsta
ndin
g ba
lanc
es a
t th
e ye
ar e
ndtie
s an
d th
e st
atus
of
outs
tand
ing
bala
nces
at
the
year
end
Rs.
in la
khs
Parti
cula
rsSu
bsid
iarie
sA
ssoc
iate
Prom
oter
Gro
upEn
tity
hold
ing
Key
mor
e th
an 2
0%M
anag
emen
tPe
rson
nel a
ndPr
omot
er

ANNUAL REPORT 2007-2008
48
ANNUAL REPORT 2009-2010
Schedules forming part of Balance Sheet & Profit and Loss Account
2009
-10
200
8-09
2009
-10
200
8-09
2009
-10
200
8-09
2009
-10
200
8-09
2009
-10
200
8-09
Out
stan
ding
bal
ance
s at
the
year
end
(a)
Rec
eiva
ble
– H
THL
––
––
20.8
920
.89
––
––
– RL
L–
––
––
–15
0.43
41.0
7
– H
BL–
––
––
0.03
––
––
(b)
Paya
ble
– R
LL–
––
––
–5.
8817
.84
––
– Ze
note
ch In
c., U
SA27
.43
––
––
––
––
–
– D
irect
ors
rem
uner
atio
n–
––
––
––
–15
.75
–
(c)
Adva
nces
tow
ards
sha
reca
pita
l in
subs
idia
ries
– ZF
DBL
–31
9.56
––
––
––
––
– ZL
NL
–26
.14
––
––
––
––
– Ze
note
ch In
c, U
SA–
110.
55–
––
––
––
–
(d)
Adva
nces
out
stan
ding
– ZL
NL
–8.
14–
––
––
––
–
– Ze
note
ch In
c, U
SA22
.57
25.4
8–
––
––
––
–
– C
OPL
––
7.76
5.9
31.
47 9
.99
(e)
Loan
– D
ue to
––
––
––
––
––
– D
ue fr
om
– Z
enot
ech
Inc,
USA
232.
9226
2.9
––
––
––
––
– C
OPL
––
14.7
114
.71
––
––
––
(B)
(B)
(B)
(B)
(B)
Det
ails
of
tran
sact
ions
bet
wee
n th
e C
ompa
ny a
nd r
Det
ails
of
tran
sact
ions
bet
wee
n th
e C
ompa
ny a
nd r
Det
ails
of
tran
sact
ions
bet
wee
n th
e C
ompa
ny a
nd r
Det
ails
of
tran
sact
ions
bet
wee
n th
e C
ompa
ny a
nd r
Det
ails
of
tran
sact
ions
bet
wee
n th
e C
ompa
ny a
nd r
elat
ed P
arel
ated
Par
elat
ed P
arel
ated
Par
elat
ed P
artie
s an
d th
e st
atus
of
outs
tand
ing
bala
nces
at
the
year
end
ties
and
the
stat
us o
f ou
tsta
ndin
g ba
lanc
es a
t th
e ye
ar e
ndtie
s an
d th
e st
atus
of
outs
tand
ing
bala
nces
at
the
year
end
ties
and
the
stat
us o
f ou
tsta
ndin
g ba
lanc
es a
t th
e ye
ar e
ndtie
s an
d th
e st
atus
of
outs
tand
ing
bala
nces
at
the
year
end
Rs.
in la
khs
Parti
cula
rsSu
bsid
iarie
sA
ssoc
iate
Prom
oter
Gro
upEn
tity
hold
ing
Key
mor
e th
an 2
0%M
anag
emen
tPe
rson
nel a
ndPr
omot
er

ANNUAL REPORT 2007-2008
49
ANNUAL REPORT 2009-2010
18.18.18.18.18. Disclosure as required under Accounting Standard (AS) 15
Employee Benefits in respect of Gratuity
Rs in Lakhs
31-03-201031-03-201031-03-201031-03-201031-03-2010 31-03-200931-03-200931-03-200931-03-200931-03-2009
PrPrPrPrProjected benefit obligation at the beginning of the yearojected benefit obligation at the beginning of the yearojected benefit obligation at the beginning of the yearojected benefit obligation at the beginning of the yearojected benefit obligation at the beginning of the year 20.5320.5320.5320.5320.53 15.4215.4215.4215.4215.42Current Service Cost 6.70 6.68Interest Cost 2.02 1.89Actuarial (Gain)/Loss (4.82) (3.46)Past Service cost 5.28 –Benefits Paid (0.59) –Projected benefit obligation at the end of the year 29.1229.1229.1229.1229.12 20.5320.5320.5320.5320.53
Amounts rAmounts rAmounts rAmounts rAmounts recognized in the balance sheetecognized in the balance sheetecognized in the balance sheetecognized in the balance sheetecognized in the balance sheetProjected benefit obligation at the end of the year 29.12 20.53Fair value of the plan assets at the end of the year – –Liability recognized in the Balance Sheet 29.1229.1229.1229.1229.12 20.5320.5320.5320.5320.53
Cost of the RetirCost of the RetirCost of the RetirCost of the RetirCost of the Retirement and Other Benefits for the yearement and Other Benefits for the yearement and Other Benefits for the yearement and Other Benefits for the yearement and Other Benefits for the yearCurrent Service Cost 6.70 6.68Interest Cost 2.02 1.89Expected return on plan assets – –Net actuarial (Gain)/Loss recognized in the year (4.82) (3.46)Past Service cost 5.28 –Net Cost recognized in the Profit and Loss Account 9.189.189.189.189.18 5.115.115.115.115.11
AssumptionsAssumptionsAssumptionsAssumptionsAssumptionsDiscount Rate 8.30% 7.55%
Long term rate of compensation increase 10.00% 10.00%
19.19.19.19.19. a) There are no outstanding forward exchange contracts as at the year end.
b) The year end foreign currency exposures that have not been hedged by a derivative instrument or otherwise areas under:
2009-102009-102009-102009-102009-10 2008-092008-092008-092008-092008-09
ForForForForForeigneigneigneigneign RupeesRupeesRupeesRupeesRupees ForForForForForeigneigneigneigneign RupeesRupeesRupeesRupeesRupeesCurrCurrCurrCurrCurrencyencyencyencyency in Lakhsin Lakhsin Lakhsin Lakhsin Lakhs CurrCurrCurrCurrCurrencyencyencyencyency in Lakhsin Lakhsin Lakhsin Lakhsin Lakhs
(i) Amounts payable in foreign currency
at the year end on account of the
following:
Import of goods
Import of capital equipment – – 67,880 USD 34.59
(ii) Amounts receivable in foreign currency at
the year end on account of the following:
Export of finished goods 4,502.50 USD 2.03 1,31,591 USD 54.55
Schedules forming part of Balance Sheet & Profit and Loss Account

ANNUAL REPORT 2007-2008
50
ANNUAL REPORT 2009-2010
20. 20. 20. 20. 20. End use of money raised by preferential issue and ESOS of equity shares:-
ParParParParParticularsticularsticularsticularsticulars Rs. in LakhsRs. in LakhsRs. in LakhsRs. in LakhsRs. in Lakhs
Proceeds of issue 8,873.34
Utilization:
Research and development of biogenerics 212.93
Research and development of new biological entities 304.34
Capital expenditure for existing and new manufacturing facilities 1,426.81
Repayment of secured and unsecured loans 3,054.06
Working capital 2,375.20
Fixed deposits 1,500.00
21.21.21.21.21. The Company has investments of Rs.105.60 lakhs (31.03.2009 - Rs.105.60 lakhs) in Zenotech Inc., USA (Subsidiary) andhas advance (including towards share capital Rs.110.55) aggregating to Rs.366.04 lakhs (31.03.2009 - Rs.398.93 lakhs)to Zenotech Inc., USA. The networth of the subsidiary based on management accounts as at March 31, 2009 has beencompletely eroded. However having regard to the long term involvement of the Company, management is of the view thatno provision is required on this account at this stage.
22.22.22.22.22. The company has a investment of Rs.0.24 lakhs (31.03.2009 - Rs.0.24 lakhs) in Credence Organics Private Limited(Associate Company) and has given loan of Rs.14.71 lakhs (31.03.2009 - Rs.14.71 lakhs) to the aforesaid entity which isoutstanding from earlier years. The networth of the associate based on management accounts as at March 31, 2010 hasbeen completely eroded. However having regard to the long term involvement of the Company, management is of theview that no provision is required on this account at this stage.
23.23.23.23.23. Capital work in progress shown under fixed assets includes Rs1040.03 lakhs (31.03.2009 - Rs.1041.65 lakhs) in respectof export oriented unit. The said unit has not yet been commissioned.
24.24.24.24.24. a) Under the Zenotech Employee Stock Option Scheme 2005, the company granted 17,000 options (net of optionslapsed) of which 4,250 vested options have been exercised during year, and is pending allotment. Accordingly Rs.2.96 lakhs received on exercise of options has been shown under "Share Application Money pending allotment".
b) The Company uses the intrinsic value method for accounting employee share based payments.
c) The company has not disclosed the impact on the net results and earnings per share (both basic and diluted) for theyear using the fair value method as required in terms of the Guidance Note on Accounting for Employee Share-based Payment issued by the Institute of Chartered Accountants of India.
25.25.25.25.25. The Company has carried forward as at March 31, 2010 product development expenditure amounting to Rs. 152.32 lakhsto be written off in future years, notwithstanding the insignificant operations during the year and continuing operatinglosses and low utilization of plant, having regard to the Company's expectation of improving its future level of productionand sales.
26.26.26.26.26. Figures of the previous year have been regrouped / recast wherever necessary to compare with current year's classification.
Schedules forming part of Balance Sheet & Profit and Loss Account
For and on behalf of the Board of Directors
A. Raghu VA. Raghu VA. Raghu VA. Raghu VA. Raghu Vasuasuasuasuasu Justice A. Gopal RaoJustice A. Gopal RaoJustice A. Gopal RaoJustice A. Gopal RaoJustice A. Gopal Rao DrDrDrDrDr. Jayaram Chigurupati. Jayaram Chigurupati. Jayaram Chigurupati. Jayaram Chigurupati. Jayaram ChigurupatiDirector Director Managing Director
Place : SecunderabadDate : August 5, 2010

ANNUAL REPORT 2007-2008
51
ANNUAL REPORT 2009-2010
BALANCE SHEET ABSTRACT AND COMPBALANCE SHEET ABSTRACT AND COMPBALANCE SHEET ABSTRACT AND COMPBALANCE SHEET ABSTRACT AND COMPBALANCE SHEET ABSTRACT AND COMPANY'S GENERALANY'S GENERALANY'S GENERALANY'S GENERALANY'S GENERALBUSINESS PROFILE (As per ParBUSINESS PROFILE (As per ParBUSINESS PROFILE (As per ParBUSINESS PROFILE (As per ParBUSINESS PROFILE (As per Part IV of Schedule VI of the Companies Act, 1956)t IV of Schedule VI of the Companies Act, 1956)t IV of Schedule VI of the Companies Act, 1956)t IV of Schedule VI of the Companies Act, 1956)t IV of Schedule VI of the Companies Act, 1956)
i.i.i.i.i. RegisRegisRegisRegisRegistration detailstration detailstration detailstration detailstration detailsRegistration number 01-10122State code 01Balance sheet date March 31, 2010
IIIIIIIIII Capital raised during the year ( Amount in Rs. Thousands)Capital raised during the year ( Amount in Rs. Thousands)Capital raised during the year ( Amount in Rs. Thousands)Capital raised during the year ( Amount in Rs. Thousands)Capital raised during the year ( Amount in Rs. Thousands)Public issue NilRights issue NilBonus issue NilPrivate placement - Issue of ESOPs Nil
IIIIIIIIIIIIIII Position of mobilization and deployment of fundsPosition of mobilization and deployment of fundsPosition of mobilization and deployment of fundsPosition of mobilization and deployment of fundsPosition of mobilization and deployment of funds(Amount in Rs. Thousands)Total liabilities 16,07,549.10Total assets 16,07,549.10Source of funds
Paid up capital 3,44,250.00Reserves and surplus 11,64,175.20Secured loans 97,547.68Unsecured loans 1,280.00Deferred tax liability Nil
Application of fundsNet fixed assets 8,22,598.69Investments 10,584.00Net current assets 2,47,795.24Miscellaneous expenditure 15,230.70Accumulated losses 5,11,340.47
IVIVIVIVIV PerPerPerPerPerforforforforformance of the Company (Amount in Rs. Thousands)mance of the Company (Amount in Rs. Thousands)mance of the Company (Amount in Rs. Thousands)mance of the Company (Amount in Rs. Thousands)mance of the Company (Amount in Rs. Thousands)Turnover 65,651.51Total income 86,778.18Total expenditure 2,11,528.31Profit/(loss) before tax (1,24,750.13)Profit/(loss) after tax (1,24,547.16)Earning per share (in Rs.) (3.62)
VVVVV Generic names of thrGeneric names of thrGeneric names of thrGeneric names of thrGeneric names of three principal pree principal pree principal pree principal pree principal products/services of companyoducts/services of companyoducts/services of companyoducts/services of companyoducts/services of company(As per moneraty terms) Item code no. (ITC Code) Product description
30049095 Gemciabine30049095 Paclitaxel30049095 Docetaxel
For and on behalf of the Board of Directors
A. Raghu VA. Raghu VA. Raghu VA. Raghu VA. Raghu Vasuasuasuasuasu Justice A. Gopal RaoJustice A. Gopal RaoJustice A. Gopal RaoJustice A. Gopal RaoJustice A. Gopal Rao DrDrDrDrDr. Jayaram Chigurupati. Jayaram Chigurupati. Jayaram Chigurupati. Jayaram Chigurupati. Jayaram ChigurupatiDirector Director Managing Director
Place : HyderabadDate : August 5, 2010

ANNUAL REPORT 2007-2008
52
ANNUAL REPORT 2009-2010
Auditors' ReporAuditors' ReporAuditors' ReporAuditors' ReporAuditors' Reporttttt
To the Board of Directors of Zenotech Laboratories Limited
1. We have audited the attached Consolidated Balance Sheet of ZENOTECH LABORATORIES LIMITED ("the Company"), itssubsidiaries (the Company, its subsidiaries and jointly controlled entities constitute "the Group") as at March 31, 2010 theConsolidated Profit and Loss Account and the Consolidated Cash Flow Statement of the Group for the year ended on thatdate, both annexed thereto. The Consolidated Financial Statements include investments in associates accounted on theequity method in accordance with Accounting Standard 23 (Accounting for Investments in Associates in ConsolidatedFinancial Statements) as notified under the Companies (Accounting Standards) Rules, 2006. These financial statementsare the responsibility of the Company's Management and have been prepared on the basis of the separate financialstatements and other financial information regarding components. Our responsibility is to express an opinion on theseConsolidated Financial Statements based on our audit.
2. We conducted our audit in accordance with the auditing standards generally accepted in India. Those Standards requirethat we plan and perform the audit to obtain reasonable assurance about whether the financial statements are free ofmaterial misstatements. An audit includes examining, on a test basis, evidence supporting the amounts and the disclosuresin the financial statements. An audit also includes assessing the accounting principles used and the significant estimatesmade by the Management, as well as evaluating the overall financial statement presentation. We believe that our auditprovides a reasonable basis for our opinion.
3. We did not audit the financial statements of subsidiaries whose financial statements reflect total assets of Rs.51.18 lakhsas at March 31, 2010, total revenues of Rs.0.14 lakhs and net cash inflows amounting to Rs.5 lakhs for the year ended onthat date as considered in the Consolidated Financial Statements and the figures used for the Consolidation are based onManagement's estimates and have not been audited by their auditors.
4. We invite attention to.
(a) Note 17 of Schedule 20 to the Consolidated Financial Statements regarding carrying cost of Rs.1,040.03 lakhs(31.03.2009-Rs.1041.65 lakhs) relating to an export oriented unit of the Parent Company which is yet to becommissioned. We are unable to comment on the appropriateness of the stated value in the Consolidated FinancialStatements.
(b) Note 20 of Schedule 20 to the Consolidated Financial Statements regarding goodwill on consolidation of Rs.101.21lakhs (31.03.2009-Rs.101.21 lakhs). We are unable to comment on the appropriateness of the stated values.
(c) Note 18 of Schedule 20 to the Consolidated Financial Statements in respect of Product Development Expenditureamounting to Rs.152.32 lakhs being carried forward as at March 31, 2010 to be written off in future years for reasonsstated therein. We are unable to comment in this regard.
(d) Note 19 of Schedule 20 to the Consolidated Financial Statements in respect of Preliminary Expenses of a subsidiarycompany amounting to Rs. 25.04 lakhs being carried forward as at March 31, 2010 to be written off in future years forreasons stated therein. We are unable to comment in this regard
(e) Note 21of Schedule 20 to the Consolidated Financial Statements regarding loan of Rs.14.71 lakhs made to anassociate company and in respect of which no provision has been made for reasons stated therein. We are unableto comment on the recoverability of the loans given.
(f) In the absence of an assessment of indications that the Parent Company's Plant & Machinery may be impaired andconsequential estimation of the recoverable amounts as required by Accounting Standard (AS) 28 - Impairment ofAssets, we are unable to comment on the appropriateness of the carrying cost of Plant & Machinery of Rs.4,845.58lakhs.
The matters referred to in paragraphs (a) and (b) above, were also subject matters of qualifications in our audit report onthe financial statements for the year ended March 31, 2009.
5. Attention is invited to Note 15(c) of Schedule 20 to the Consolidated Financial Statements of disclosures relating toEarnings Per Share as required in terms of Guidance Note on Accounting for Employee Share-based payment issued bythe Institute of Chartered Accountants of India.
Consolidated Financial Statements

ANNUAL REPORT 2007-2008
53
ANNUAL REPORT 2009-2010
6. We report that the Consolidated Financial Statements have been prepared by the Company in accordance with therequirements of Accounting Standard 21 (Consolidated Financial Statements), Accounting Standard 23 (Accounting forInvestment in Associates in Consolidated Financial Statements) as notified under the Companies (Accounting Standards)Rules, 2006.
7. Subject to paragraphs 3 and 5 above and further subject to adjustments which may be required in respect of mattersdealt with in paragraph 4 above,based on our audit and on consideration of individual financial statements of the subsidiariesand an associate and to the best of our information and according to the explanations given to us, in our opinion, theConsolidated Financial Statements give a true and fair view in conformity with the accounting principles generally acceptedin India:
(i) in the case of the Consolidated Balance Sheet, of the state of affairs of the Group as at March 31, 2010;
(ii) in the case of the Consolidated Profit and Loss Account, of the loss of the Group for the year ended on that date and
(iii) in the case of the Consolidated Cash Flow Statement, of the cash flows of the Group for the year ended on that date.
For Deloitte Haskins & SellsFor Deloitte Haskins & SellsFor Deloitte Haskins & SellsFor Deloitte Haskins & SellsFor Deloitte Haskins & SellsChartered Accountants
(Registration No.008072S)
K. RajasekharK. RajasekharK. RajasekharK. RajasekharK. RajasekharPlace : Secunderabad PartnerDate : December 11, 2010 (Membership No.23341)
Consolidated Financial Statements

ANNUAL REPORT 2007-2008
54
ANNUAL REPORT 2009-2010
Consolidated Balance Sheet as at March 31, 2010
Rs. in Lakhs
I.I.I.I.I. SOURCES OF FUNDSSOURCES OF FUNDSSOURCES OF FUNDSSOURCES OF FUNDSSOURCES OF FUNDS1.1.1.1.1. SharSharSharSharShareholders' Fundseholders' Fundseholders' Fundseholders' Fundseholders' Funds
(a) Share capital 1 3,442.50 3,442.50(b) Reserves and surplus 2 11,630.45 11,594.70
15,072.95 15,037.202.2.2.2.2. SharSharSharSharShare application moneye application moneye application moneye application moneye application money
pending allotmentpending allotmentpending allotmentpending allotmentpending allotment 2.96 –3.3.3.3.3. Loan FundsLoan FundsLoan FundsLoan FundsLoan Funds
(a) Secured Loans 3 975.54 1,664.76(b) Unsecured Loans 4 37.20 12.80
1,012.74 1,677.56TOTAL 16,088.6516,088.6516,088.6516,088.6516,088.65 16,714.76 16,714.76 16,714.76 16,714.76 16,714.76
II.II.II.II.II. APPLICA APPLICA APPLICA APPLICA APPLICATION OF FUNDSTION OF FUNDSTION OF FUNDSTION OF FUNDSTION OF FUNDS1.1.1.1.1. Goodwill on ConsolidationGoodwill on ConsolidationGoodwill on ConsolidationGoodwill on ConsolidationGoodwill on Consolidation 101.21 101.212.2.2.2.2. Fixed Assets :Fixed Assets :Fixed Assets :Fixed Assets :Fixed Assets :
(a) Gross block 5 8,138.07 6,994.56(b) Less: Depreciation 1,177.73 902.26(c) Net Block 6,960.34 6,092.30(d) Capital work-in-progress 1,272.73 2,369.21
8,233.07 8,461.513.3.3.3.3. InvestmentsInvestmentsInvestmentsInvestmentsInvestments 6 – –4.4.4.4.4. CurrCurrCurrCurrCurrent Assets, Loans and Advancesent Assets, Loans and Advancesent Assets, Loans and Advancesent Assets, Loans and Advancesent Assets, Loans and Advances
(a) Inventories 7 232.13 289.50(b) Sundry Debtors 8 173.18 59.41(c) Cash and Bank balances 9 1,633.81 3,263.96(d) Loans and advances 10 506.22 605.64
2,545.34 4,218.51Less : CurrLess : CurrLess : CurrLess : CurrLess : Current Liabilities and Prent Liabilities and Prent Liabilities and Prent Liabilities and Prent Liabilities and Provisionsovisionsovisionsovisionsovisions(a) Current Liabilities 11 342.52 502.59(b) Provisions 12 54.05 40.21
396.57 542.80Net Current Assets 2,148.77 2,148.77 2,148.77 2,148.77 2,148.77 3,675.71 3,675.71 3,675.71 3,675.71 3,675.71
5.5.5.5.5. Miscellaneous ExpenditurMiscellaneous ExpenditurMiscellaneous ExpenditurMiscellaneous ExpenditurMiscellaneous Expenditureeeee 13(to the extent not written off or adjusted)Product Development Expenditure 152.32 262.40Other 25.04 177.36 38.14 300.54
6. Profit and Loss Account 5,428.24 4,175.79TOTAL 16,088.65 16,088.65 16,088.65 16,088.65 16,088.65 16,714.76 16,714.76 16,714.76 16,714.76 16,714.76Significant accounting policies and notes 20
SchedulesSchedulesSchedulesSchedulesSchedules As atAs atAs atAs atAs at As at As at As at As at As atMarMarMarMarMarch 31, 2010ch 31, 2010ch 31, 2010ch 31, 2010ch 31, 2010 MarMarMarMarMarch 31, 2009ch 31, 2009ch 31, 2009ch 31, 2009ch 31, 2009
Schedules 1 to 20 annexed hereto form part of these financial statements.
Per our report attached For and on behalf of the Board of DirectorsFor Deloitte Haskins & SellsFor Deloitte Haskins & SellsFor Deloitte Haskins & SellsFor Deloitte Haskins & SellsFor Deloitte Haskins & SellsChartered Accountants A. Raghu VA. Raghu VA. Raghu VA. Raghu VA. Raghu Vasuasuasuasuasu Justice A. Gopal RaoJustice A. Gopal RaoJustice A. Gopal RaoJustice A. Gopal RaoJustice A. Gopal Rao DrDrDrDrDr. Jayaram Chigurupati. Jayaram Chigurupati. Jayaram Chigurupati. Jayaram Chigurupati. Jayaram Chigurupati
Director Director Managing DirectorK. RajasekharK. RajasekharK. RajasekharK. RajasekharK. RajasekharPartner
Place : SecunderabadDate : December 11, 2010

ANNUAL REPORT 2007-2008
55
ANNUAL REPORT 2009-2010
Consolidated Profit and Loss Account for the year ended March 31, 2010
INCINCINCINCINCOMEOMEOMEOMEOMEIncome from Sales and Operations 691.58 655.02Less : Excise duty 35.07 52.70Net sales 656.51 602.32Other income 14 211.40 462.58
867.91867.91867.91867.91867.91 1,064.901,064.901,064.901,064.901,064.90EXPENDITUREEXPENDITUREEXPENDITUREEXPENDITUREEXPENDITURE
Raw materials consumed 15 249.31 510.15Payments and benefits to employees 16 473.06 720.35Manufacturing expenses 17 400.42 411.55Administrative,selling and distribution
and other expenses 18 273.69 406.22Product development expenses 81.25 138.10Interest and Bank charges 19 195.57 147.15Depreciation 325.91 307.44Amortisation of miscellaneous expenditure
- Product development expenditure 110.08 110.08- Other 13.10 123.18 9.66 119.74
Impairment of goodwill – 56.01
2,122.392,122.392,122.392,122.392,122.39 2,816.71 2,816.71 2,816.71 2,816.71 2,816.71
LOSS BEFORE TLOSS BEFORE TLOSS BEFORE TLOSS BEFORE TLOSS BEFORE TAXAAXAAXAAXAAXATIONTIONTIONTIONTION (1,254.48) (1,751.81)Deferred Tax – –Fringe benefit Tax – 4.61Provision for earlier years written back (2.03) –
LOSS FOR THE YEAR AFTER TLOSS FOR THE YEAR AFTER TLOSS FOR THE YEAR AFTER TLOSS FOR THE YEAR AFTER TLOSS FOR THE YEAR AFTER TAXAAXAAXAAXAAXATION BEFORETION BEFORETION BEFORETION BEFORETION BEFORESHARE OF RESULSHARE OF RESULSHARE OF RESULSHARE OF RESULSHARE OF RESULTS OF ASSOCIATS OF ASSOCIATS OF ASSOCIATS OF ASSOCIATS OF ASSOCIATESTESTESTESTES (1,252.45) (1,756.42)
Share of Net Profit/(loss) of Associates – –
NET LOSSNET LOSSNET LOSSNET LOSSNET LOSS (1,252.45) (1,756.42)
Balance brought forward loss from previous year (4,175.79) (2,419.37)
Balance carried to Balance sheet (5,428.24) (5,428.24) (5,428.24) (5,428.24) (5,428.24) (4,175.79)(4,175.79)(4,175.79)(4,175.79)(4,175.79)
Earning per share (Face value Rs.10 each)
- Basic and diluted (Rs.) (3.64) (5.10)
Significant accounting policies and notes 20
SchedulesSchedulesSchedulesSchedulesSchedules YYYYYear endedear endedear endedear endedear ended Y Y Y Y Year endedear endedear endedear endedear endedMarMarMarMarMarch 31, 2010ch 31, 2010ch 31, 2010ch 31, 2010ch 31, 2010 MarMarMarMarMarch 31, 2009ch 31, 2009ch 31, 2009ch 31, 2009ch 31, 2009
Schedules 1 to 20 annexed hereto form part of these financial statements.
Per our report attached For and on behalf of the Board of DirectorsFor Deloitte Haskins & SellsFor Deloitte Haskins & SellsFor Deloitte Haskins & SellsFor Deloitte Haskins & SellsFor Deloitte Haskins & SellsChartered Accountants A. Raghu VA. Raghu VA. Raghu VA. Raghu VA. Raghu Vasuasuasuasuasu Justice A. Gopal RaoJustice A. Gopal RaoJustice A. Gopal RaoJustice A. Gopal RaoJustice A. Gopal Rao DrDrDrDrDr. Jayaram Chigurupati. Jayaram Chigurupati. Jayaram Chigurupati. Jayaram Chigurupati. Jayaram Chigurupati
Director Director Managing DirectorK. RajasekharK. RajasekharK. RajasekharK. RajasekharK. RajasekharPartner
Place : SecunderabadDate : December 11, 2010
Rs. in Lakhs

ANNUAL REPORT 2007-2008
56
ANNUAL REPORT 2009-2010
Consolidated Cash flow Statement for the year ended March 31, 2010
A.A.A.A.A. CASH FLOW FROM OPERACASH FLOW FROM OPERACASH FLOW FROM OPERACASH FLOW FROM OPERACASH FLOW FROM OPERATING ACTIVITIES:TING ACTIVITIES:TING ACTIVITIES:TING ACTIVITIES:TING ACTIVITIES:Net loss before tax and extraordinary items (1,254.48) (1,751.81)Adjustments for:Adjustments for:Adjustments for:Adjustments for:Adjustments for:
Depreciation 325.91 307.44Amortisation of miscellaneous expenditure 123.18 119.74Impairment of goodwill – 56.01Interest income (198.87) (442.99)Unrealised Foreign exchange loss/(gain) 0.16 (5.21)Interest expense 161.77 196.78Loss on sale of fixed assets (net) 4.52 2.96
Operating loss beforOperating loss beforOperating loss beforOperating loss beforOperating loss before working capital changese working capital changese working capital changese working capital changese working capital changes (837.81) (837.81) (837.81) (837.81) (837.81) (1,517.08) (1,517.08) (1,517.08) (1,517.08) (1,517.08)
Adjustments for :Adjustments for :Adjustments for :Adjustments for :Adjustments for :Inventory 57.37 256.99Trade and other receivables (113.93) 130.85Loans and advances 37.34 (30.35)Trade and other payables (135.43) (214.49)
Cash generated frCash generated frCash generated frCash generated frCash generated from operationsom operationsom operationsom operationsom operations (992.46) (992.46) (992.46) (992.46) (992.46) (1,374.08) (1,374.08) (1,374.08) (1,374.08) (1,374.08)Taxes paid (including fringe benefit tax) (28.47) (108.72)
Cash flow frCash flow frCash flow frCash flow frCash flow from operating activities beforom operating activities beforom operating activities beforom operating activities beforom operating activities before extraore extraore extraore extraore extraordinardinardinardinardinary itemsy itemsy itemsy itemsy items (1,020.93) (1,482.80)Foreign Currency translation reserve (arising on account
of currency translation) 35.75 (71.74)
Net cash used in operating activitiesNet cash used in operating activitiesNet cash used in operating activitiesNet cash used in operating activitiesNet cash used in operating activities (985.18) (985.18) (985.18) (985.18) (985.18) (1,554.54) (1,554.54) (1,554.54) (1,554.54) (1,554.54)
B.B.B.B.B. CASH FLOW FROM INVESTING ACTIVITIES:CASH FLOW FROM INVESTING ACTIVITIES:CASH FLOW FROM INVESTING ACTIVITIES:CASH FLOW FROM INVESTING ACTIVITIES:CASH FLOW FROM INVESTING ACTIVITIES:Purchase of fixed assets (111.58) (1,290.73)Sale of fixed assets 7.56 5.00Interest received 293.13 445.88Proceeds from bank fixed deposits 3,121.57 –Investment in bank fixed deposits (400.00) 2,857.72
Net cash frNet cash frNet cash frNet cash frNet cash from investing activitiesom investing activitiesom investing activitiesom investing activitiesom investing activities 2,910.682,910.682,910.682,910.682,910.68 2,017.87 2,017.87 2,017.87 2,017.87 2,017.87
C.C.C.C.C. CASH FLOW FROM FINANCING ACTIVITIES:CASH FLOW FROM FINANCING ACTIVITIES:CASH FLOW FROM FINANCING ACTIVITIES:CASH FLOW FROM FINANCING ACTIVITIES:CASH FLOW FROM FINANCING ACTIVITIES:Proceeds from issue of equity share capital – 7.50Share application money pending allotment 2.96 –Share premium received – 44.78Proceeds from borrowings 24.40 48.81Repayment of borrowings (770.71) (293.79)Interest paid (90.73) (188.60)
Net cash used in financing activitiesNet cash used in financing activitiesNet cash used in financing activitiesNet cash used in financing activitiesNet cash used in financing activities (834.08) (834.08) (834.08) (834.08) (834.08) (381.30) (381.30) (381.30) (381.30) (381.30)
Net incrNet incrNet incrNet incrNet increase/(decrease/(decrease/(decrease/(decrease/(decrease) in cash and cash equivalentsease) in cash and cash equivalentsease) in cash and cash equivalentsease) in cash and cash equivalentsease) in cash and cash equivalents 1,091.421,091.421,091.421,091.421,091.42 82.03 82.03 82.03 82.03 82.03
Cash and cash equivalents at the commencement of the yearCash and cash equivalents at the commencement of the yearCash and cash equivalents at the commencement of the yearCash and cash equivalents at the commencement of the yearCash and cash equivalents at the commencement of the year 142.39 60.36Cash and cash equivalents at the end of the year *Cash and cash equivalents at the end of the year *Cash and cash equivalents at the end of the year *Cash and cash equivalents at the end of the year *Cash and cash equivalents at the end of the year * 1,233.81 142.39
* includes restricted cash balance (margin money) Rs.126.09 lakhs (previous year Rs.128.16 lakhs)
YYYYYear endedear endedear endedear endedear ended Y Y Y Y Year endedear endedear endedear endedear endedMarMarMarMarMarch 31, 2010ch 31, 2010ch 31, 2010ch 31, 2010ch 31, 2010 MarMarMarMarMarch 31, 2009ch 31, 2009ch 31, 2009ch 31, 2009ch 31, 2009
(Contd..)
Rs. in Lakhs

ANNUAL REPORT 2007-2008
57
ANNUAL REPORT 2009-2010
Consolidated Cash flow Statement for the year ended March 31, 2010
Rs. in Lakhs
Cash on hand 0.68 0.51
Bank balances 7.04 13.72
Margin money 126.09 128.16
Fixed deposits 1,100.00 –
Cash and cash equivalents 1,233.81 142.39
Fixed deposits (see note 2 below) 400.00 3,121.57
Cash and bank balances 1,633.811,633.811,633.811,633.811,633.81 3,263.963,263.963,263.963,263.963,263.96
2. Fixed deposits with banks with maturity period of more than three months are classified and grouped in investingactivities and not included in cash and cash equivalents.
3. Cash flow statement has been prepared under the 'Indirect Method' as set out in Accounting standard (AS 3) ' CashFlow Statement
4. Previous years figures have been regrouped / rearranged wherever necessary to correspond with the figures of thecurrent year
YYYYYear endedear endedear endedear endedear ended Y Y Y Y Year endedear endedear endedear endedear endedMarMarMarMarMarch 31, 2010ch 31, 2010ch 31, 2010ch 31, 2010ch 31, 2010 MarMarMarMarMarch 31, 2009ch 31, 2009ch 31, 2009ch 31, 2009ch 31, 2009
Per our report attached For and on behalf of the Board of DirectorsFor Deloitte Haskins & SellsFor Deloitte Haskins & SellsFor Deloitte Haskins & SellsFor Deloitte Haskins & SellsFor Deloitte Haskins & SellsChartered Accountants A. Raghu VA. Raghu VA. Raghu VA. Raghu VA. Raghu Vasuasuasuasuasu Justice A. Gopal RaoJustice A. Gopal RaoJustice A. Gopal RaoJustice A. Gopal RaoJustice A. Gopal Rao DrDrDrDrDr. Jayaram Chigurupati. Jayaram Chigurupati. Jayaram Chigurupati. Jayaram Chigurupati. Jayaram Chigurupati
Director Director Managing DirectorK. RajasekharK. RajasekharK. RajasekharK. RajasekharK. RajasekharPartner
Place : SecunderabadDate : December 11, 2010
Notes:Notes:Notes:Notes:Notes:
1. Cash and cash equivalents include cash and bank balances in current and deposit accounts. Reconciliation of cashand bank balances (Refer Schedule 9) with cash and cash equivalents is as follows:
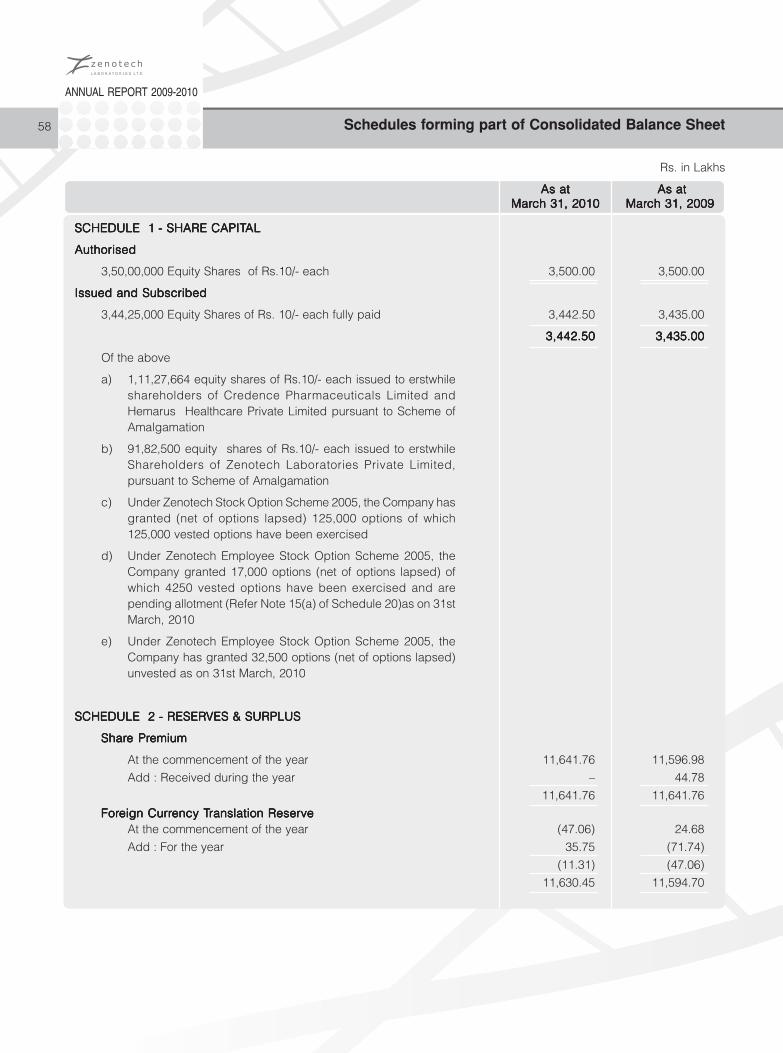
ANNUAL REPORT 2007-2008
58
ANNUAL REPORT 2009-2010
Schedules forming part of Consolidated Balance Sheet
Rs. in Lakhs
SCHEDULE 1SCHEDULE 1SCHEDULE 1SCHEDULE 1SCHEDULE 1 - SHARE CAPIT- SHARE CAPIT- SHARE CAPIT- SHARE CAPIT- SHARE CAPITALALALALAL
AuthorisedAuthorisedAuthorisedAuthorisedAuthorised
3,50,00,000 Equity Shares of Rs.10/- each 3,500.00 3,500.00
Issued and SubscribedIssued and SubscribedIssued and SubscribedIssued and SubscribedIssued and Subscribed
3,44,25,000 Equity Shares of Rs. 10/- each fully paid 3,442.50 3,435.00
3,442.503,442.503,442.503,442.503,442.50 3,435.00 3,435.00 3,435.00 3,435.00 3,435.00
Of the above
a) 1,11,27,664 equity shares of Rs.10/- each issued to erstwhileshareholders of Credence Pharmaceuticals Limited andHemarus Healthcare Private Limited pursuant to Scheme ofAmalgamation
b) 91,82,500 equity shares of Rs.10/- each issued to erstwhileShareholders of Zenotech Laboratories Private Limited,pursuant to Scheme of Amalgamation
c) Under Zenotech Stock Option Scheme 2005, the Company hasgranted (net of options lapsed) 125,000 options of which125,000 vested options have been exercised
d) Under Zenotech Employee Stock Option Scheme 2005, theCompany granted 17,000 options (net of options lapsed) ofwhich 4250 vested options have been exercised and arepending allotment (Refer Note 15(a) of Schedule 20)as on 31stMarch, 2010
e) Under Zenotech Employee Stock Option Scheme 2005, theCompany has granted 32,500 options (net of options lapsed)unvested as on 31st March, 2010
SCHEDULE 2 - RESERSCHEDULE 2 - RESERSCHEDULE 2 - RESERSCHEDULE 2 - RESERSCHEDULE 2 - RESERVES & SURPLUSVES & SURPLUSVES & SURPLUSVES & SURPLUSVES & SURPLUS
SharSharSharSharShare Pre Pre Pre Pre Premiumemiumemiumemiumemium
At the commencement of the year 11,641.76 11,596.98Add : Received during the year – 44.78
11,641.76 11,641.76
ForForForForForeign Curreign Curreign Curreign Curreign Currency Tency Tency Tency Tency Translation Reserveranslation Reserveranslation Reserveranslation Reserveranslation ReserveAt the commencement of the year (47.06) 24.68
Add : For the year 35.75 (71.74)
(11.31) (47.06) 11,630.45 11,594.70
As atAs atAs atAs atAs at As at As at As at As at As atMarMarMarMarMarch 31, 2010ch 31, 2010ch 31, 2010ch 31, 2010ch 31, 2010 MarMarMarMarMarch 31, 2009ch 31, 2009ch 31, 2009ch 31, 2009ch 31, 2009

ANNUAL REPORT 2007-2008
59
ANNUAL REPORT 2009-2010
Rs. in Lakhs
SCHEDULE 3 - SECURED LOANSSCHEDULE 3 - SECURED LOANSSCHEDULE 3 - SECURED LOANSSCHEDULE 3 - SECURED LOANSSCHEDULE 3 - SECURED LOANS
(a)(a)(a)(a)(a) CashCashCashCashCash Cr Cr Cr Cr Credits / Wedits / Wedits / Wedits / Wedits / Working Capital loansorking Capital loansorking Capital loansorking Capital loansorking Capital loans
(i)(i)(i)(i)(i) BanksBanksBanksBanksBanks
Yes Bank Limited - 484.92
(Secured by first paripassu charge on currentassets of the Company)
PNC Bank 0.06 2.61
b)b)b)b)b) TTTTTerererererm Loansm Loansm Loansm Loansm Loans
i)i)i)i)i) Financial InstitutionsFinancial InstitutionsFinancial InstitutionsFinancial InstitutionsFinancial Institutions
Andhra Pradesh State Financial Corporation 317.00 564.14(Secured by way of hypothecation of plant and machineryand mortgage of land related to Biologics Facility andR&D Facility and personal guarantee of the Director of theCompany)
Technology Development Board (TDB) 512.81 512.81(Secured by way of paripassu first charge on the whole ofmovable properties of the Company including movable plantand machinery, machinery spares, tools and accessories andother movables, both present and future and paripassu firstcharge on land or other immovable property of the Company,present and future, and personal guarantee of the Directorof the Company)
ii)ii)ii)ii)ii) BanksBanksBanksBanksBanksPNC Bank, USA - 24.93
HDFC Bank Limited & Vijaya Bank 14.68 25.85
(Vehicle loans taken are secured by way of hypothecation
of the respective vehicles)
c)c)c)c)c) InterInterInterInterInterest accrued and due on terest accrued and due on terest accrued and due on terest accrued and due on terest accrued and due on term loan frm loan frm loan frm loan frm loan from TDBom TDBom TDBom TDBom TDB 130.99 49.50
975.54 1664.76
SCHEDULE 4 - UNSECURED LOANSSCHEDULE 4 - UNSECURED LOANSSCHEDULE 4 - UNSECURED LOANSSCHEDULE 4 - UNSECURED LOANSSCHEDULE 4 - UNSECURED LOANS
(other than short term)
Biotech Consortium India Ltd * 12.80 12.80
Others 24.40 –
37.20 12.80
* Repayable within a year Rs. 1.68 lakhs (31.3.2009 Rs.Nil)
As atAs atAs atAs atAs at As at As at As at As at As atMarMarMarMarMarch 31, 2010ch 31, 2010ch 31, 2010ch 31, 2010ch 31, 2010 MarMarMarMarMarch 31, 2009ch 31, 2009ch 31, 2009ch 31, 2009ch 31, 2009
Schedules forming part of Consolidated Balance Sheet

ANNUAL REPORT 2007-2008
60
ANNUAL REPORT 2009-2010
Schedules forming part of Consolidated Balance Sheet
Land
(fre
ehol
d) 1
40.0
8–
– –
140
.08
– –
– –
– 1
40.0
8 1
40.0
8
Bui
ldin
gs 2
,046
.66
5.6
1 –
– 2
,052
.27
191
.39
– 6
8.41
– 2
59.8
0 1
,792
.47
1,8
55.2
7
Leas
ehol
d im
prov
emen
ts 3
5.40
– –
0.4
1 3
5.81
30.
30 0
.41
2.0
2 –
32.
73 3
.08
5.1
0
Plan
t and
mac
hine
ry 4
,473
.28
1,2
15.9
3 6
0.04
(7.6
5) 5
,621
.52
595
.09
(4.1
0) 2
28.9
3 4
3.98
775
.94
4,8
45.5
8 3
,878
.19
EDP
equi
pmen
t 4
8.52
1.7
5 –
0.3
1 5
0.58
26.
59 0
.44
7.8
1 –
34.
84 1
5.74
21.
93
Offi
ce e
quip
men
t 4
.96
0.3
5 –
– 5
.31
1.1
7 –
0.3
3 –
1.5
0 3
.81
3.7
9
Furn
iture
and
fixt
ures
133
.05
1.6
0 –
1.4
1 1
36.0
6 2
8.69
0.8
8 8
.64
– 3
8.21
97.
85 1
04.3
6
Vehi
cles
112
.61
– 1
6.17
– 9
6.44
29.
03 –
9.7
7 4
.09
34.
71 6
1.73
83.
58
6,9
94.5
6 6
,994
.56
6,9
94.5
6 6
,994
.56
6,9
94.5
612
25.2
412
25.2
412
25.2
412
25.2
412
25.2
4 7
6.21
76.
21 7
6.21
76.
21 7
6.21
(5.
52)
(5.
52)
(5.
52)
(5.
52)
(5.
52)
8,1
38.0
7 8
,138
.07
8,1
38.0
7 8
,138
.07
8,1
38.0
7 9
02.2
6 9
02.2
6 9
02.2
6 9
02.2
6 9
02.2
6 (
2.37
) (
2.37
) (
2.37
) (
2.37
) (
2.37
) 3
25.9
1 3
25.9
1 3
25.9
1 3
25.9
1 3
25.9
1 4
8.07
48.
07 4
8.07
48.
07 4
8.07
1177
.73
1177
.73
1177
.73
1177
.73
1177
.73
6,9
60.3
4 6
,960
.34
6,9
60.3
4 6
,960
.34
6,9
60.3
4
As a
t Mar
ch 3
1, 2
009
6,5
69.1
0 4
24.6
9 1
2.93
13.
70 6
,994
.56
592
.39
7.4
0 3
07.4
4 4
.97
902
.26
– 6
,092
.30
Not
es :
Not
es :
Not
es :
Not
es :
Not
es :
1.Fr
eeho
ld la
nd in
clud
es R
s.31
.76
lakh
s as
on
31st
Mar
ch, 2
010
in re
spec
t of w
hich
con
veya
nce
is p
endi
ng.
2.Pl
ant a
nd M
achi
nery
incl
udes
Mac
hine
ry c
ostin
g Rs
.132
.24
lakh
s w
hich
wer
e re
tired
from
act
ive
use
with
effe
ct fr
om J
uly
31, 2
008.
Net
boo
k va
lue
of th
ese
asse
ts a
sat
the
date
of r
etire
men
t is
Rs.1
12.8
4 la
khs.
SC
HE
DU
LE -
5
: FI
XE
D A
SS
ETS
SC
HE
DU
LE -
5
: FI
XE
D A
SS
ETS
SC
HE
DU
LE -
5
: FI
XE
D A
SS
ETS
SC
HE
DU
LE -
5
: FI
XE
D A
SS
ETS
SC
HE
DU
LE -
5
: FI
XE
D A
SS
ETS
Rs.
in la
khs
Gr
Gr
Gr
Gr
Gr o
ss B
lock
oss
Blo
ckos
s B
lock
oss
Blo
ckos
s B
lock
Dep
rD
epr
Dep
rD
epr
Dep
r eci
atio
nec
iatio
nec
iatio
nec
iatio
nec
iatio
nN
et B
ook
VN
et B
ook
VN
et B
ook
VN
et B
ook
VN
et B
ook
V alu
eal
ueal
ueal
ueal
ue
Des
crip
tion
Des
crip
tion
Des
crip
tion
Des
crip
tion
Des
crip
tion
As
atA
s at
As
atA
s at
As
atA
dd
ition
sA
dd
ition
sA
dd
ition
sA
dd
ition
sA
dd
ition
sD
educ
t-D
educ
t-D
educ
t-D
educ
t-D
educ
t-Fo
rFo
rFo
rFo
rFo
r eig
nei
gn
eig
nei
gn
eig
nA
s at
As
atA
s at
As
atA
s at
As
atA
s at
As
atA
s at
As
atFo
rFo
rFo
rFo
rFo
r eig
nei
gn
eig
nei
gn
eig
nFo
r th
eFo
r th
eFo
r th
eFo
r th
eFo
r th
eD
educ
t-D
educ
t-D
educ
t-D
educ
t-D
educ
t-A
s at
As
atA
s at
As
atA
s at
As
atA
s at
As
atA
s at
As
atA
s at
As
atA
s at
As
atA
s at
01.0
4.09
01.0
4.09
01.0
4.09
01.0
4.09
01.0
4.09
ions
ions
ions
ions
ions
exch
ang
eex
chan
ge
exch
ang
eex
chan
ge
exch
ang
e31
.03.
1031
.03.
1031
.03.
1031
.03.
1031
.03.
1001
.04.
0901
.04.
0901
.04.
0901
.04.
0901
.04.
09ex
chan
ge
exch
ang
eex
chan
ge
exch
ang
eex
chan
ge
year
year
year
year
year
ions
ions
ions
ions
ions
31.0
3.10
31.0
3.10
31.0
3.10
31.0
3.10
31.0
3.10
31.0
3.10
31.0
3.10
31.0
3.10
31.0
3.10
31.0
3.10
31.0
3.09
31.0
3.09
31.0
3.09
31.0
3.09
31.0
3.09
adju
st-
adju
st-
adju
st-
adju
st-
adju
st-
adju
st-
adju
st-
adju
st-
adju
st-
adju
st-
men
tm
ent
men
tm
ent
men
tm
ent
men
tm
ent
men
tm
ent

ANNUAL REPORT 2007-2008
61
ANNUAL REPORT 2009-2010
Schedules forming part of Consolidated Balance Sheet
As atAs atAs atAs atAs at As at As at As at As at As atMarMarMarMarMarch 31 , 2010ch 31 , 2010ch 31 , 2010ch 31 , 2010ch 31 , 2010 MarMarMarMarMarch 31, 2009ch 31, 2009ch 31, 2009ch 31, 2009ch 31, 2009
SCHEDULE 6 - INVESTMENTSSCHEDULE 6 - INVESTMENTSSCHEDULE 6 - INVESTMENTSSCHEDULE 6 - INVESTMENTSSCHEDULE 6 - INVESTMENTSLong TLong TLong TLong TLong Terererererm (At cost)m (At cost)m (At cost)m (At cost)m (At cost)Trade - Unquoted
SharSharSharSharShares in associate companyes in associate companyes in associate companyes in associate companyes in associate company
Credeence Organics Pvt Ltd : 2400 shares of Rs.10 each 0.24 0.24
Add/Less: Group Share of Profits/(losses) upto 31.03.2009 (0.24) – (0.24) –
––––– –––––
SCHEDULE 7 SCHEDULE 7 SCHEDULE 7 SCHEDULE 7 SCHEDULE 7 - INVENTORIES- INVENTORIES- INVENTORIES- INVENTORIES- INVENTORIES(as lower of cost and net realisable value)
Raw and packing material 103.70 163.90Work in process 115.94 112.71Finished goods 12.49 12.89
232.13232.13232.13232.13232.13 289.50289.50289.50289.50289.50
SCHEDULE 8 - SUNDRSCHEDULE 8 - SUNDRSCHEDULE 8 - SUNDRSCHEDULE 8 - SUNDRSCHEDULE 8 - SUNDRY DEBTORSY DEBTORSY DEBTORSY DEBTORSY DEBTORS(Unsecured, considered good unless otherwise specified)
Debts outstandng for a period exceeding six months 30.80 2.36
Other debts 142.38 57.05
173.18173.18173.18173.18173.18 59.4159.4159.4159.4159.41
SCHEDULE 9 - CASH AND BANK BALANCESSCHEDULE 9 - CASH AND BANK BALANCESSCHEDULE 9 - CASH AND BANK BALANCESSCHEDULE 9 - CASH AND BANK BALANCESSCHEDULE 9 - CASH AND BANK BALANCES
Cash on hand 0.68 0.51
With Scheduled Banks
- Current accounts 6.76 13.43
- Fixed deposits 1,100.00 3,121.57
- Margin account 126.09 128.16
With Non-Scheduled Bank *
- Current accounts 0.28 0.29
- Fixed Deposits 400.00 –
1,633.811,633.811,633.811,633.811,633.81 3263.963263.963263.963263.963263.96
* Balance with Coastal Local Area Bank Limited. Maximum balance during the year is Rs.400.29 lakhs
(31.3.2009:Rs.150 lakhs)
The Managing Director of the Company is also a Director/shareholder of this Bank
Rs. in Lakhs

ANNUAL REPORT 2007-2008
62
ANNUAL REPORT 2009-2010
Schedules forming part of Consolidated Balance Sheet
As atAs atAs atAs atAs at As at As at As at As at As atMarMarMarMarMarch 31, 2010ch 31, 2010ch 31, 2010ch 31, 2010ch 31, 2010 MarMarMarMarMarch 31, 2009ch 31, 2009ch 31, 2009ch 31, 2009ch 31, 2009
SCHEDULE 10 - LOANS AND ADVSCHEDULE 10 - LOANS AND ADVSCHEDULE 10 - LOANS AND ADVSCHEDULE 10 - LOANS AND ADVSCHEDULE 10 - LOANS AND ADVANCESANCESANCESANCESANCES(Unsecured and Considered good)
Loan to Associate 14.71 14.71Advances recoverable in cash or in kind or for value to be received * 259.57 293.07Interest accrued on loans / deposits 30.12 124.38Balance with Excise Authorities on Current Account 1.75 3.38Advance Income Tax 200.07 170.10
506.22 506.22 506.22 506.22 506.22 605.64 605.64 605.64 605.64 605.64* IncludesDue from Managing Director Rs.1.47 lakhs (31.03.2009 :Rs.9.99 lakhs)Maximum amount outstanding during the year Rs.26.73 lakhs (31.03.2009 Rs.17.71 lakhs)
1. Disclosure in terms of Clause 32 of the listing agreement:(a) Interest free advance given to Hemarus
Therapeutics Ltd. Rs. 20.89 lakhs(31.03.2009 - Rs. 20.89 lakhs). Certain Directors of theCompany are also Director/ Shareholders of the aboveCompany. Maximum amount outstanding during the yearRs. 20.89 lakhs (31.03.2009 - Rs. 20.89 lakhs)
(b) There have been no investment in the company'sshares by the loanee.
SCSCSCSCSCHEDULE 11 - CURRENT LIABILITIESHEDULE 11 - CURRENT LIABILITIESHEDULE 11 - CURRENT LIABILITIESHEDULE 11 - CURRENT LIABILITIESHEDULE 11 - CURRENT LIABILITIESSundry Creditors
i) Due to Micro, Small and Medium Enterprises - -
ii) Due other than to Micro, Small and Medium Enterprises* 209.73 380.60Interest accrued but not due 17.27 27.72
Other liabilities 115.52 ** 94.27
342.52 502.59
Note: There are no amounts due and outstanding to be credited to
Investors Education and Protection Fund
* included interest accrued and due to Ranbaxy Laboratories Limited Rs. 7.05 lakhs (31.03.2009: Rs. 7.05 lakhs)
** included dues to Managing Director Rs. 15.75 lakhs (31.03.2009: Rs. Nil)
Rs. in Lakhs

ANNUAL REPORT 2007-2008
63
ANNUAL REPORT 2009-2010
Schedules forming part of Consolidated Balance Sheet
Rs. in Lakhs
SCHEDULE 12 - PROVISIONSSCHEDULE 12 - PROVISIONSSCHEDULE 12 - PROVISIONSSCHEDULE 12 - PROVISIONSSCHEDULE 12 - PROVISIONS
Fringe Benefit Tax - Net – 0.57
Compensated absences 24.93 19.11
Gratuity 29.12 20.53
54.0554.0554.0554.0554.05 40.2140.2140.2140.2140.21
As atAs atAs atAs atAs at As at As at As at As at As atMarMarMarMarMarch 31, 2010ch 31, 2010ch 31, 2010ch 31, 2010ch 31, 2010 MarMarMarMarMarch 31, 2009ch 31, 2009ch 31, 2009ch 31, 2009ch 31, 2009
BalanceBalanceBalanceBalanceBalance AdditionsAdditionsAdditionsAdditionsAdditions BalanceBalanceBalanceBalanceBalanceas atas atas atas atas at duringduringduringduringduring WWWWWritten ofritten ofritten ofritten ofritten offffff as atas atas atas atas at
April 1, 2009April 1, 2009April 1, 2009April 1, 2009April 1, 2009 the yearthe yearthe yearthe yearthe year MarMarMarMarMarch 31, 2010ch 31, 2010ch 31, 2010ch 31, 2010ch 31, 2010
Preliminary expenses 30.47 - 5.43 25.04
Amalgamation expenses 7.67 - 7.67 -
Product development expenses 262.40 - 110.08 152.32
300.54 300.54 300.54 300.54 300.54 - - - - - 123.18 123.18 123.18 123.18 123.18 177.36 177.36 177.36 177.36 177.36
SCHEDULE 13 - MISCELLANEOUS EXPENDITURESCHEDULE 13 - MISCELLANEOUS EXPENDITURESCHEDULE 13 - MISCELLANEOUS EXPENDITURESCHEDULE 13 - MISCELLANEOUS EXPENDITURESCHEDULE 13 - MISCELLANEOUS EXPENDITURE (to the extent not written off or adjusted)
Rs. in Lakhs

ANNUAL REPORT 2007-2008
64
ANNUAL REPORT 2009-2010
SCHEDUSCHEDUSCHEDUSCHEDUSCHEDULE 14 - OTHER INCOMELE 14 - OTHER INCOMELE 14 - OTHER INCOMELE 14 - OTHER INCOMELE 14 - OTHER INCOME
Interest on deposits and loans (gross) (tax deducted at sourceRs. 27.60 lakhs; Previous Year: Rs. 100.94 lakhs) 198.87 442.99
Miscellaneous 12.53 19.59
211.40211.40211.40211.40211.40 462.58 462.58 462.58 462.58 462.58
SCHEDULE 15 - RASCHEDULE 15 - RASCHEDULE 15 - RASCHEDULE 15 - RASCHEDULE 15 - RAW MAW MAW MAW MAW MATERIALS CONSUMEDTERIALS CONSUMEDTERIALS CONSUMEDTERIALS CONSUMEDTERIALS CONSUMED
a)a)a)a)a) Raw material and packing material consumedRaw material and packing material consumedRaw material and packing material consumedRaw material and packing material consumedRaw material and packing material consumedOpening stock 163.90 214.62
Add: Purchases 249.72 375.50413.62 590.12
Less: Closing stock 103.70 163.90
309.92 426.22Less: Transferred to product development expenses 54.28 106.36
255.64255.64255.64255.64255.64 319.86 319.86 319.86 319.86 319.86b)b)b)b)b) (Incr(Incr(Incr(Incr(Increase) / Decrease) / Decrease) / Decrease) / Decrease) / Decrease in Finished Goods and Wease in Finished Goods and Wease in Finished Goods and Wease in Finished Goods and Wease in Finished Goods and Work-in-prork-in-prork-in-prork-in-prork-in-processocessocessocessocess
Opening Stock :- Finished Goods 12.89 296.85- Work - in - process 112.71 35.02
125.60 331.87Less: Closing stock :Less: Closing stock :Less: Closing stock :Less: Closing stock :Less: Closing stock :
- Finished Goods 12.49 12.89- Work - in - process 115.94 112.71
128.43 125.60(2.83) 206.27
c)c)c)c)c) Excise duty on incrExcise duty on incrExcise duty on incrExcise duty on incrExcise duty on increase / ( decrease / ( decrease / ( decrease / ( decrease / ( decrease) of finished goods, stocksease) of finished goods, stocksease) of finished goods, stocksease) of finished goods, stocksease) of finished goods, stocks (3.50) (15.98)
249.31249.31249.31249.31249.31 510.15 510.15 510.15 510.15 510.15
SCHEDULESCHEDULESCHEDULESCHEDULESCHEDULE 16 - PA 16 - PA 16 - PA 16 - PA 16 - PAYMENTS AND BENEFITS TO EMPLOYEESYMENTS AND BENEFITS TO EMPLOYEESYMENTS AND BENEFITS TO EMPLOYEESYMENTS AND BENEFITS TO EMPLOYEESYMENTS AND BENEFITS TO EMPLOYEES
Salaries, Wages etc., 382.44 665.19
Contribution to Provident and other funds 31.45 31.30
Staff welfare 59.17 23.86
473.06473.06473.06473.06473.06 720.35 720.35 720.35 720.35 720.35
YYYYYear endedear endedear endedear endedear ended Y Y Y Y Year endedear endedear endedear endedear endedMarMarMarMarMarch 31, 2010ch 31, 2010ch 31, 2010ch 31, 2010ch 31, 2010 MarMarMarMarMarch 31, 2009ch 31, 2009ch 31, 2009ch 31, 2009ch 31, 2009
Rs. in Lakhs
Schedules forming part of Consolidated Profit and Loss Account

ANNUAL REPORT 2007-2008
65
ANNUAL REPORT 2009-2010
SCHEDULE 17 - MANUFSCHEDULE 17 - MANUFSCHEDULE 17 - MANUFSCHEDULE 17 - MANUFSCHEDULE 17 - MANUFACTURING EXPENSESACTURING EXPENSESACTURING EXPENSESACTURING EXPENSESACTURING EXPENSESPower, fuel and water 189.36 210.85Repairs and maintenance
- Plant and Machinery 66.85 54.74- Building 12.34 15.15- Others 81.71 82.31
Contract manpower expenses 48.10 45.74Other manufacturing expenses 2.06 2.76
400.42400.42400.42400.42400.42 411.55 411.55 411.55 411.55 411.55
SCHEDULE 18 -SCHEDULE 18 -SCHEDULE 18 -SCHEDULE 18 -SCHEDULE 18 -ADADADADADMINISTRAMINISTRAMINISTRAMINISTRAMINISTRATIVE, SELLING AND DISTRIBUTION AND OTHER EXPENSESTIVE, SELLING AND DISTRIBUTION AND OTHER EXPENSESTIVE, SELLING AND DISTRIBUTION AND OTHER EXPENSESTIVE, SELLING AND DISTRIBUTION AND OTHER EXPENSESTIVE, SELLING AND DISTRIBUTION AND OTHER EXPENSES
Rent 23.75 37.14Office and general maintenance 34.02 40.23Rates and taxes 71.09 29.67Insurance . 12.74 27.06Printing and stationery 5.19 13.08Communication expenses 10.91 10.21Legal and professional charges 62.71 57.96Travelling and conveyance expenses 19.57 37.39Commission on sales 4.21 4.14Selling and distribution expenses 2.79 18.33Loss / (profit) on sale of fixed assets (net) 4.52 2.96Miscellaneous 22.19 23.77Debts written off – 104.28
273.69273.69273.69273.69273.69 406.22 406.22 406.22 406.22 406.22
SCHEDULSCHEDULSCHEDULSCHEDULSCHEDULE 19 - InterE 19 - InterE 19 - InterE 19 - InterE 19 - Interest and bank chargesest and bank chargesest and bank chargesest and bank chargesest and bank chargesOn fixed term loans 124.15 134.59Other loans 37.62 62.19Foreign Exchange Loss/(Gain) 32.50 (58.33)Bank charges 1.30 8.70
195.57195.57195.57195.57195.57 147.15 147.15 147.15 147.15 147.15
YYYYYear endedear endedear endedear endedear ended YYYYYear endedear endedear endedear endedear endedMarMarMarMarMarch 31, 2010ch 31, 2010ch 31, 2010ch 31, 2010ch 31, 2010 MarMarMarMarMarch 31, 2009ch 31, 2009ch 31, 2009ch 31, 2009ch 31, 2009
Rs. in Lakhs
Schedules forming part of Consolidated Profit and Loss Account

ANNUAL REPORT 2007-2008
66
ANNUAL REPORT 2009-2010
Schedule 20: Significant accounting policies and notes on accounts for the year endedSchedule 20: Significant accounting policies and notes on accounts for the year endedSchedule 20: Significant accounting policies and notes on accounts for the year endedSchedule 20: Significant accounting policies and notes on accounts for the year endedSchedule 20: Significant accounting policies and notes on accounts for the year ended31st Mar31st Mar31st Mar31st Mar31st March, 2010ch, 2010ch, 2010ch, 2010ch, 20101. a) The Consolidated Financial Statements have been prepared in accordance with Accounting Standard (AS) 21 -
"Consolidated Financial Statements" notified by the Companies (Accounting Standards) Rules, 2006.
b) The subsidiaries (which along with Zenotech Laboratories Limited, the parent, constitute the Group) considered inthe preparation of these consolidated financial statements are:
NameNameNameNameName CountrCountrCountrCountrCountry ofy ofy ofy ofy of PerPerPerPerPercentage ofcentage ofcentage ofcentage ofcentage ofIncorporationIncorporationIncorporationIncorporationIncorporation voting power as at voting power as at voting power as at voting power as at voting power as at
MarMarMarMarMarch 31, 2010ch 31, 2010ch 31, 2010ch 31, 2010ch 31, 2010
Zenotech Farmaceutica do Brasil Ltda Brazil 100%Zenotech Laboratories Nigeria Limited Nigeria 100%Zenotech Inc New Jersey, USA 100%
The unaudited financial statements of the aforesaid companies have been considered for consolidation.
c) The group associate is :
NameNameNameNameName CountrCountrCountrCountrCountry ofy ofy ofy ofy of PerPerPerPerPercentage ofcentage ofcentage ofcentage ofcentage ofIncorporationIncorporationIncorporationIncorporationIncorporation voting power as at voting power as at voting power as at voting power as at voting power as at
MarMarMarMarMarch 31, 2010ch 31, 2010ch 31, 2010ch 31, 2010ch 31, 2010
Credence Organics Private Limited India 24%
2.2.2.2.2. Subsequent to Daiichi Sankyo Company Limited (Daiichi) acquiring 63.92% stake in Ranbaxy Laboratories Limited(Ranbaxy) in October 2008, Daiichi announced an open offer to acquire 20% shares of Zenotech Laboratories Limited(the Parent Company) at Rs. 113.62 per share. Aggrieved by the pricing of the share, one of the shareholders filed apetition in the Hon'ble High Court of Madras. The Parent Company has been named as Respondent in the said case. Aninterim injunction in connection with the offer was given by the Hon'ble High Court of Madras and subsequently it wasquashed by the Hon'ble Supreme Court based on a petition filed by Daiichi against the said injunction. Meanwhile someof the shareholders (excluding Ranbaxy) including Promoter and Managing Director of the Parent Company filed a petitionwith Securities Appellate Tribunal (SAT) with respect to the pricing of the share of the Parent Company. SAT directedDaiichi to price the open offer at Rs. 160 per share. Daiichi has filed an appeal against the SAT order in the SupremeCourt. The Supreme Court vide its order dated July 8, 2010 has ruled in favour of Daiichi and allowed the open offer to bemade at the price of Rs.113.62 per share.
3.3.3.3.3. Significant accounting policies:Significant accounting policies:Significant accounting policies:Significant accounting policies:Significant accounting policies:
a)a)a)a)a) Basis of Accounting:Basis of Accounting:Basis of Accounting:Basis of Accounting:Basis of Accounting:
The financial statements have been prepared under historical cost convention, on accrual basis, in accordance withthe generally accepted accounting principles in India and in accordance with Accounting Standards as notified byCompanies (Accounting Standards) Rules 2006.
b)b)b)b)b) Use of Accounting EstimatesUse of Accounting EstimatesUse of Accounting EstimatesUse of Accounting EstimatesUse of Accounting Estimates
The preparation of financial statements in conformity with generally accepted accounting principles requiresmanagement to make estimates and assumptions that affect the reported amount of assets and liabilities and disclosureof contingent liabilities on the date of financial statements and the result of operations during the reporting period.Although these estimates are based on management's knowledge of current events and actions, actual resultscould differ from those estimates.
c)c)c)c)c) Fixed assets:Fixed assets:Fixed assets:Fixed assets:Fixed assets:
Fixed Assets are carried at cost of acquisition or construction less accumulated depreciation. The actual costcapitalized comprises of cost of acquisition of the asset, clearing charges in case of imported assets, duties, taxes
Schedules forming part of Consolidated Balance Sheet andConsolidated Profit & Loss Account

ANNUAL REPORT 2007-2008
67
ANNUAL REPORT 2009-2010
and other incidental expenditure incurred for acquiring the assets. Borrowing costs directly attributable to acquisitionor construction of those fixed assets which necessarily take a substantial period of time to get ready for their intendeduse are capitalized.
d)d)d)d)d) DeprDeprDeprDeprDepreciation:eciation:eciation:eciation:eciation:
Depreciation on fixed assets is provided on the straight-line method and at the rates and in the manner specified inSchedule XIV to the Companies Act, 1956, except in respect of improvements to leasehold premises, wheredepreciation is charged over the lease period.
e)e)e)e)e) PrPrPrPrProduct development expendituroduct development expendituroduct development expendituroduct development expendituroduct development expenditure:e:e:e:e:
Direct material and overhead costs in relation to product development activities are treated as deferred revenueexpenditure and amortized over five years from the date revenue is generated from the respective products. Allother revenue expenditure is expensed as incurred and capital expenditure incurred on product development iscapitalized as fixed assets and depreciated in accordance with depreciation policy of the Parent Company.
f)f)f)f)f) ForForForForForeign curreign curreign curreign curreign currency translations:ency translations:ency translations:ency translations:ency translations:
Transactions denominated in foreign currencies are recorded at the exchange rate prevailing at the time of transaction.Monetary assets and liabilities related to foreign currency transactions remaining unsettled at the end of the year aretranslated at year end rates. The difference in translation of monetary assets and liabilities and realized gains andlosses to foreign exchange transactions are recognized in Profit and Loss account.
g)g)g)g)g) Investments:Investments:Investments:Investments:Investments:
Long term investments are stated at cost of acquisition less provision for permanent diminution in value of suchinvestments.
h)h)h)h)h) Inventories:Inventories:Inventories:Inventories:Inventories:
Inventories are valued at the lower of cost and net realisable value. Cost of inventories comprises cost of purchase,cost of conversion and other costs incurred in bringing the inventories to their present location and condition. Themethod of determining cost of various categories of inventories is as below:
i) Raw materials, Packing materials, Stores and spares - First - in - First Out method.
ii) Finished goods and Work-in-process - Weighted average method, which comprises direct material costs andappropriate overheads.
i)i)i)i)i) RetirRetirRetirRetirRetirement benefits:ement benefits:ement benefits:ement benefits:ement benefits:
Liability for employee benefits, both short and long term, for present and past services which are due as per termsof employment are recorded in accordance with Accounting Standard (AS) 15 " Employee Benefits" as notified bythe Companies (Accounting Standards) Rules, 2006.
i) Gratuity
Liability on account of Gratuity is determined and charged to Profit and Loss account on the basis of valuationby an independent Actuary. The liability is unfunded.
ii) Provident Fund
Contribution to Provident Fund (a defined contribution plan) is recognized and expensed on accrual basis.
iii) Compensated Absences
Liability in respect of compensated absence is determined and charged to Profit and Loss account on thebasis of valuation by an independent actuary.
j)j)j)j)j) Revenue rRevenue rRevenue rRevenue rRevenue recognition:ecognition:ecognition:ecognition:ecognition:
Sale of goods is recognized at the point of dispatch of finished goods to customers. Sales include amount recoveredtowards excise duty but excludes sales tax and is net of sales returns.
Schedules forming part of Consolidated Balance Sheet andConsolidated Profit & Loss Account

ANNUAL REPORT 2007-2008
68
ANNUAL REPORT 2009-2010
Service income is recognized as per the terms of the contract with customers when the related services are performed.
Income from interest on deposits is recognised on time proportionate basis.
k)k)k)k)k) TTTTTaxes on Income :axes on Income :axes on Income :axes on Income :axes on Income :
Current tax is determined as the amount of tax payable in respect of taxable income for the year. Deferred tax isrecognized, subject to the consideration of prudence, on timing differences, being the difference between taxableincome and accounting income that originate in one period and are capable of reversal in one or more subsequentperiods.
l)l)l)l)l) Leases :Leases :Leases :Leases :Leases :
The Parent Company's significant leasing arrangements are in respect of operating leases for office premises. Theleasing arrangements which are not cancelable range between 11 months to 5 years are generally and usuallyrenewable by mutual consent on agreed terms. The aggregate lease rents payable are charged as rent in the Profitand Loss account.
m)m)m)m)m) Miscellaneous expenditurMiscellaneous expenditurMiscellaneous expenditurMiscellaneous expenditurMiscellaneous expenditure:e:e:e:e:
Written off over a period of five years or the period over which the benefit of the expenditure is expected to bederived.
4.4.4.4.4. Managerial rManagerial rManagerial rManagerial rManagerial remunerationemunerationemunerationemunerationemuneration
Rs. in lakhs
2009-102009-102009-102009-102009-10 2008-092008-092008-092008-092008-09
Salary 15.00 15.00
Perquisites 7.80 7.80
22.8022.8022.8022.8022.80 22.8022.8022.8022.8022.80
Note: 1. Having regard to the fact that Gratuity is a defined benefit accrued based on actuarial valuation the amountapplicable to an individual employee is not ascertainable and accordingly, has not been considered in theabove computation.
2. Perquisites include contribution to Provident Fund Rs.1.80 lakhs (previous year Rs.1.80 lakhs)
5.5.5.5.5. PrPrPrPrProduct development expendituroduct development expendituroduct development expendituroduct development expendituroduct development expenditure incurre incurre incurre incurre incurred comprises of:ed comprises of:ed comprises of:ed comprises of:ed comprises of:Rs. in lakhs
2009-102009-102009-102009-102009-10 2008-092008-092008-092008-092008-09
Salaries 98.70 223.05
Raw and packing material consumed 54.28 106.36
Clinical Trial and Studies 23.71 19.11
Depreciation 29.15 27.37
Others 2.98 17.30
208.82208.82208.82208.82208.82 393.19393.19393.19393.19393.19
Note:
Product development expenditure has been shown under appropriate expenditure heads.
Schedules forming part of Consolidated Balance Sheet andConsolidated Profit & Loss Account

ANNUAL REPORT 2007-2008
69
ANNUAL REPORT 2009-2010
Rs. in lakhs6.6.6.6.6. EarEarEarEarEarnings per sharnings per sharnings per sharnings per sharnings per shareeeee
2009-102009-102009-102009-102009-10 2008-092008-092008-092008-092008-09
a) Loss for the year ( Rs. in lakhs) (1,252.45) (1,756.42)
b) Weighted Average number of Equity Sharesoutstanding during the year 3,44,25,000 3,44,10,616
c) Potential equity shares on Employee Stock option
granted - Anti dilutive (13,932) (22,585)
d) Weighted average number of dilutive potential equity sharesin respect of share application money 2,454 –
e) Weighted Average number of Equity Shares incomputing diluted earnings per share ( b + d ) 3,44,27,454 3,43,88,031
f) Face value of each Equity Share (Rs.) 10 10
g) Earnings per share
- Basic (Rs.) (3.64) (5.10)
- Diluted (Rs.) (a / e) (3.64) (5.10)
7.7.7.7.7. Contingent liabilitiesContingent liabilitiesContingent liabilitiesContingent liabilitiesContingent liabilities
As atAs atAs atAs atAs at As atAs atAs atAs atAs atMarMarMarMarMarch 31, 2010ch 31, 2010ch 31, 2010ch 31, 2010ch 31, 2010 MarMarMarMarMarch 31, 2009ch 31, 2009ch 31, 2009ch 31, 2009ch 31, 2009
Liability in respect of Bank guarantees 118.88 116.96
Liability in respect of Letter of credits – 48.33
8.8.8.8.8. Estimated amount of contracts remaining to be executed on capital account (net of advances) not provided for, as atMarch 31, 2010 is Rs. Nil (March 31, 2009: Rs. 20.56 lakhs).
9.9.9.9.9. Capital work-in-progress includes capital advances of Rs. Nil (March 31, 2009 Rs. 24.44 lakhs)
10.10.10.10.10. Segment rSegment rSegment rSegment rSegment reporeporeporeporeporting:ting:ting:ting:ting:
The Parent Company has considered business segment as the primary segment for disclosure. The Parent Companyis engaged in the manufacture and trading of Pharmaceuticals in India, which in the context of Accounting Standard(AS) 17 - "Segment Reporting" notified by the Companies (Accounting Standards) Rules, 2006 is considered the onlybusiness segment.
11.11.11.11.11. TTTTTaxation:axation:axation:axation:axation:
In view of the brought forwards losses and no taxable income for the current year, the Parent Company has notrecorded the cumulative deferred tax liability/asset as on March 31, 2010 and for the year arising on account of timingdifferences, as stipulated in Accounting Standard(AS) 22 - Accounting for taxes on income.
Rs. in lakhs
Schedules forming part of Consolidated Balance Sheet andConsolidated Profit & Loss Account

ANNUAL REPORT 2007-2008
70
ANNUAL REPORT 2009-2010
12.12.12.12.12. Related ParRelated ParRelated ParRelated ParRelated Party Disclosurty Disclosurty Disclosurty Disclosurty Disclosures:es:es:es:es:
Information relating to Related Party transactions as per "Accounting Standard (AS) 18" notified by the Companies(Accounting Standards) Rules, 2006.
(A)(A)(A)(A)(A) NamNamNamNamName of the Related Pare of the Related Pare of the Related Pare of the Related Pare of the Related Partytytytyty RelationshipRelationshipRelationshipRelationshipRelationship
Credence Organics Private Limited (COPL) Associate
Ranbaxy Laboratories Limited (RLL) Entity holding more than 20%
Hemarus Therapeutics Limited (HTHL) (Formerly known as Credence Clinical Promoter Group companiesResearch Private Limited) where common control existsRite Diagnostics Private Limited (RDPL) and with which the companyHemarus Technologies Limited (HTL) had transactionsCredence Power Projects Limited (CPPL)Credence Infrastructure Limited (CIL)Hemarus Biologicals Limited (HBL)
Dr. Jayaram Chigurupati, Promoter and KeyManaging Director Management Personnel
Schedules forming part of Consolidated Balance Sheet andConsolidated Profit & Loss Account

ANNUAL REPORT 2007-2008
71
ANNUAL REPORT 2009-2010
Sal
es to
RLL
––
––
497.
3647
3.86
– –
Ren
t pai
d to
HTH
L–
–
–1.
79–
––
–
Ren
t ex
pen
ses
––
1.68
6.50
––
––
shar
ed w
ith H
TL
Rei
mb
urse
men
t of
exp
ense
s–
––
––
8.36
––
Mat
eria
l Pur
chas
es f
rom
– R
LL–
––
–1.
3210
.79
––
Pur
chas
e of
Ser
vice
s fro
m R
DP
L–
–0.
34–
––
––
Ad
vanc
es to
HB
L–
––
0.03
––
––
Inte
rest
acc
rued
on
loan
– C
OP
L1.
831.
83–
––
––
–
Dire
ctor
s re
mun
erat
ion
––
– –
––
22.8
022
.80
Out
stan
din
g b
alan
ces
at th
e ye
ar e
nd
(a)
Rec
eiva
ble
– H
THL
––
20.8
920
.89
––
––
– R
LL–
––
–15
0.43
41.0
7
– H
BL
––
–0.
03–
––
–
(b)
Pay
able
– R
LL–
––
–5.
8817
.84
––
– D
irect
ors
rem
uner
atio
n–
––
––
–15
.75
–
(c)
Ad
vanc
es o
utst
and
ing
– C
OP
L7.
76
5.
931.
47 9
.99
(d)
Loan
– D
ue to
––
––
––
––
– D
ue fr
om
– C
OP
L14
.71
14.7
1–
––
––
–
(B)
(B)
(B)
(B)
(B)
Det
ails
of
tran
sact
ions
bet
wee
n th
e Pa
rD
etai
ls o
f tr
ansa
ctio
ns b
etw
een
the
Par
Det
ails
of
tran
sact
ions
bet
wee
n th
e Pa
rD
etai
ls o
f tr
ansa
ctio
ns b
etw
een
the
Par
Det
ails
of
tran
sact
ions
bet
wee
n th
e Pa
r ent
Com
pany
and
ren
t C
ompa
ny a
nd r
ent
Com
pany
and
ren
t C
ompa
ny a
nd r
ent
Com
pany
and
rel
ated
Par
elat
ed P
arel
ated
Par
elat
ed P
arel
ated
Par
ties
and
the
stat
us o
f ou
tsta
ndin
g ba
lanc
es a
t th
e ye
ar e
nd:
ties
and
the
stat
us o
f ou
tsta
ndin
g ba
lanc
es a
t th
e ye
ar e
nd:
ties
and
the
stat
us o
f ou
tsta
ndin
g ba
lanc
es a
t th
e ye
ar e
nd:
ties
and
the
stat
us o
f ou
tsta
ndin
g ba
lanc
es a
t th
e ye
ar e
nd:
ties
and
the
stat
us o
f ou
tsta
ndin
g ba
lanc
es a
t th
e ye
ar e
nd:
Rs.
in la
khs
Key
Parti
cula
rsA
ssoc
iate
Prom
oter
Gro
upEn
tity
hold
ing
Man
agem
ent
mor
e th
an 2
0%Pe
rson
nel a
ndPr
omot
er
2009
-10
200
8-09
2009
-10
200
8-09
2009
-10
200
8-09
2009
-10
200
8-09
Schedules forming part of Consolidated Balance Sheet andConsolidated Profit & Loss Account

ANNUAL REPORT 2007-2008
72
ANNUAL REPORT 2009-2010
13.13.13.13.13. Disclosure as required under Accounting Standard (AS) 15
Employee Benefits in respect of Gratuity
Rs in Lakhs
31-03-201031-03-201031-03-201031-03-201031-03-2010 31-03-200931-03-200931-03-200931-03-200931-03-2009
PrPrPrPrProjected bojected bojected bojected bojected benefit obligation at the beginning of the yearenefit obligation at the beginning of the yearenefit obligation at the beginning of the yearenefit obligation at the beginning of the yearenefit obligation at the beginning of the year 20.5320.5320.5320.5320.53 15.4215.4215.4215.4215.42
Current Service Cost 6.70 6.68
Interest Cost 2.02 1.89
Actuarial (Gain)/Loss (4.82) (3.46)
Past Service cost 5.28 –
Benefits Paid (0.59) –
Projected benefit obligation at the end of the year 29.1229.1229.1229.1229.12 20.5320.5320.5320.5320.53
Amounts rAmounts rAmounts rAmounts rAmounts recognized in the balance sheetecognized in the balance sheetecognized in the balance sheetecognized in the balance sheetecognized in the balance sheet
Projected benefit obligation at the end of the year 29.12 20.53
Liability recognized in the Balance Sheet 29.1229.1229.1229.1229.12 20.5320.5320.5320.5320.53
Cost of the RetirCost of the RetirCost of the RetirCost of the RetirCost of the Retirement and Other Benefits for the yearement and Other Benefits for the yearement and Other Benefits for the yearement and Other Benefits for the yearement and Other Benefits for the year
Current Service Cost 6.70 6.68
Interest Cost 2.02 1.89
Net actuarial (Gain)/Loss recognized in the year (4.82) (3.46)
Past Service cost 5.28 –
Net Cost recognized in the Profit and Loss Account 9.189.189.189.189.18 5.115.115.115.115.11
AssumptionsAssumptionsAssumptionsAssumptionsAssumptions
Discount Rate 8.30% 7.55%
Long term rate of compensation increase 10.00% 10.00%
14.14.14.14.14. a) There are no outstanding forward exchange contracts as at the year end.
b) The year end foreign currency exposures that have not been hedged by a derivative instrument or otherwise areas under:
2009-102009-102009-102009-102009-10 2008-092008-092008-092008-092008-09
ForForForForForeigneigneigneigneign RupeesRupeesRupeesRupeesRupees ForForForForForeigneigneigneigneign RupeesRupeesRupeesRupeesRupeesCurrCurrCurrCurrCurrencyencyencyencyency in Lakhsin Lakhsin Lakhsin Lakhsin Lakhs CurrCurrCurrCurrCurrencyencyencyencyency in Lakhsin Lakhsin Lakhsin Lakhsin Lakhs
(i) Amounts payable in foreign currency
at the year end on account of
the following:
Import of goods - - 67,880 USD 34.59
(ii) Amounts receivable in foreign
currency at the year end on account
of the following:
Export of finished goods 4,502.50 USD 2.03 1,31,591 USD 54.55
Schedules forming part of Consolidated Balance Sheet andConsolidated Profit & Loss Account

ANNUAL REPORT 2007-2008
73
ANNUAL REPORT 2009-2010
15.15.15.15.15. a) Under the Zenotech Employee Stock Option Scheme 2005, the Parent Company granted 17,000 options (net ofoptions lapsed) of which 4,250 vested options have been exercised during year, and is pending allotment.Accordingly Rs. 2.96 lakhs received on exercise of options has been shown under "Share Application Moneypending allotment".
d) The Parent Company uses the intrinsic value method for accounting employee share based payments.
e) The Parent Company has not disclosed the impact on the net results and earnings per share (both basic anddiluted) for the year using the fair value method as required in terms of the Guidance Note on Accounting forEmployee Share-based Payment issued by the Institute of Chartered Accountants of India.
1616161616 End use of money raised by preferential issue and ESOS of equity shares:-
ParParParParParticularsticularsticularsticularsticulars Rs. in LakhsRs. in LakhsRs. in LakhsRs. in LakhsRs. in Lakhs
Proceeds of issue 8,873.34
Utilization:
Research and development of biogenerics 212.93
Research and development of new biological entities 304.34
Capital expenditure for existing and new manufacturing facilities 1,426.81
Repayment of secured and unsecured loans 3,054.06
Working capital 2,375.20
Fixed deposits 1,500.00
17.17.17.17.17. Capital work in progress shown under fixed assets includes Rs.1040.03 lakhs (31.03.2009- Rs.1041.65 lakhs) in respectof export oriented unit. The said unit has not yet been commissioned.
18.18.18.18.18. The Parent Company has carried forward as at March 31, 2010 product development expenditure amounting to Rs.152.32 lakhs to be written off in future years, notwithstanding the insignificant operations during the year and continuingoperating losses and low utilization of plant, having regard to the Parent Company's expectation of improving its futurelevel of production and sales.
19.19.19.19.19. The Parent Company has carried forward as at March 31, 2010 preliminary expenses of a subsidiary company amountingto Rs.25.04 lakhs to be written off in future years. Operations of the subsidiary have ceased.
20.20.20.20.20. The goodwill on consolidation of Rs.101.21 lakhs represents goodwill in Zenotech Inc., USA, a wholly owned subsidiary.The networth of the Company has completely eroded. Management is of the view that the diminution in value of investmentis temporary and hence no impairment loss in this regard needs to be recorded at this stage.
21.21.21.21.21. The Company has given a loan of Rs.14.71 lakhs (31.03.2009- Rs. 14.71 lakhs) to Credence Organics Private Limited(Associate Company) which is outstanding from earlier years. The networth of the associate based on the managementaccounts as at March 31, 2010 has been completely eroded. However having regard to the long term involvement of theCompany, management is of the view that no provision is required on this account at this stage.
22.22.22.22.22. Figures of the previous year have been regrouped / recast wherever necessary to compare with current year's classification.
For and on behalf of Board
A. Raghu VA. Raghu VA. Raghu VA. Raghu VA. Raghu Vasuasuasuasuasu Justice A. Gopal RaoJustice A. Gopal RaoJustice A. Gopal RaoJustice A. Gopal RaoJustice A. Gopal Rao DrDrDrDrDr. Jayaram Chigurupati. Jayaram Chigurupati. Jayaram Chigurupati. Jayaram Chigurupati. Jayaram ChigurupatiDirector Director Managing Director
Place : SecunderabadDate : December 11, 2010
Schedules forming part of Consolidated Balance Sheet andConsolidated Profit & Loss Account

ANNUAL REPORT 2007-2008
74
ANNUAL REPORT 2009-2010
Statement pursuant to Section 212 of the Companies Act, 1956
Sta
tem
ent
pur
suan
t to
Sec
tion
212
of t
he C
omp
anie
s A
ct,
1956
Sta
tem
ent
pur
suan
t to
Sec
tion
212
of t
he C
omp
anie
s A
ct,
1956
Sta
tem
ent
pur
suan
t to
Sec
tion
212
of t
he C
omp
anie
s A
ct,
1956
Sta
tem
ent
pur
suan
t to
Sec
tion
212
of t
he C
omp
anie
s A
ct,
1956
Sta
tem
ent
pur
suan
t to
Sec
tion
212
of t
he C
omp
anie
s A
ct,
1956
rrrr r ela
ting
to
sub
sid
iar
elat
ing
to
sub
sid
iar
elat
ing
to
sub
sid
iar
elat
ing
to
sub
sid
iar
elat
ing
to
sub
sid
iar y
com
pan
ies
y co
mp
anie
sy
com
pan
ies
y co
mp
anie
sy
com
pan
ies
Sl.
Sl.
Sl.
Sl.
Sl.
Par
Par
Par
Par
Par
ticul
ars
ticul
ars
ticul
ars
ticul
ars
ticul
ars
Zen
otec
hZ
enot
ech
Zen
otec
hZ
enot
ech
Zen
otec
hZ
enot
ech
Zen
otec
hZ
enot
ech
Zen
otec
hZ
enot
ech
Zen
otec
h In
c.Z
enot
ech
Inc.
Zen
otec
h In
c.Z
enot
ech
Inc.
Zen
otec
h In
c.N
o.
No
.N
o.
No
.N
o.
Far
Far
Far
Far
Far m
aceu
tica
Do
mac
eutic
a D
om
aceu
tica
Do
mac
eutic
a D
om
aceu
tica
Do
Lab
orat
orie
sLa
bor
ator
ies
Lab
orat
orie
sLa
bor
ator
ies
Lab
orat
orie
sU
SA
US
AU
SA
US
AU
SA
Bra
sil
Lim
itad
a,B
rasi
l Li
mita
da,
Bra
sil
Lim
itad
a,B
rasi
l Li
mita
da,
Bra
sil
Lim
itad
a,N
iger
iaN
iger
iaN
iger
iaN
iger
iaN
iger
iaB
rasi
lB
rasi
lB
rasi
lB
rasi
lB
rasi
lLi
mite
d,
Nig
eria
Lim
ited
, N
iger
iaLi
mite
d,
Nig
eria
Lim
ited
, N
iger
iaLi
mite
d,
Nig
eria
1.Fi
nanc
ial y
ear
of th
e su
bsi
dia
ry c
omp
any
end
ed o
nM
arch
31,
201
0M
arch
31,
201
0M
arch
31,
201
0
2.H
old
ing
com
pan
y's
inte
rest
100%
in e
qui
ty10
0% in
eq
uity
100%
in e
qui
ty
3.N
o. o
f sha
res
held
by
the
hold
ing
com
pan
y in
the
sub
sid
iary
39,6
009,
99,0
0010
,00,
000
4.Th
e ne
t ag
gre
gat
e of
pro
fits
or (
loss
es)
of th
e su
bsi
dia
ry fo
r th
e cu
rren
tp
erio
d s
o fa
r as
it c
once
rns
the
mem
ber
s of
the
hold
ing
com
pan
y
a.D
ealt
with
or
pro
vid
ed fo
r in
the
acco
unts
of t
he h
old
ing
com
pan
y-
--
b.
not d
ealt
with
or
pro
vid
ed fo
r in
the
acco
unts
of t
he h
old
ing
com
pan
y(3
.11)
(3.7
6)(0
.12)
5.Th
e ne
t ag
gre
gat
e of
pro
fits
or lo
sses
for
pre
viou
s fin
anci
al y
ears
of t
hesu
bsi
dia
ry s
o fa
r as
it c
once
rns
the
mem
ber
s of
the
hold
ing
com
pan
y
a.D
ealt
with
or
pro
vid
ed fo
r in
the
acco
unts
of t
he h
old
ing
com
pan
y-
--
b.
not d
ealt
with
or
pro
vid
ed fo
r in
the
acco
unts
of t
he h
old
ing
com
pan
y(3
51.8
1)(2
.52)
(362
.78)
6.C
hang
es in
the
inte
rest
of Z
enot
ech
Lab
orat
orie
s Li
mite
d, b
etw
een
the
end
of t
he la
st fi
nanc
ial y
ear
and
Mar
ch 3
1st,
2010
Nil
Nil
Nil
7.M
ater
ial c
hang
es b
etw
een
the
last
fina
ncia
l yea
r an
d M
arch
31,
201
0N
ilN
ilN
il
For
and
beh
alf o
f the
Boa
rd o
f Dire
ctor
s
A.
Rag
hu V
A.
Rag
hu V
A.
Rag
hu V
A.
Rag
hu V
A.
Rag
hu V
asu
asu
asu
asu
asu
Just
ice
A.
Gop
al R
aoJu
stic
e A
. G
opal
Rao
Just
ice
A.
Gop
al R
aoJu
stic
e A
. G
opal
Rao
Just
ice
A.
Gop
al R
aoD
rD
rD
rD
rD
r . Ja
yara
m C
hig
urup
ati
. Ja
yara
m C
hig
urup
ati
. Ja
yara
m C
hig
urup
ati
. Ja
yara
m C
hig
urup
ati
. Ja
yara
m C
hig
urup
ati
Dire
ctor
Dire
ctor
Man
agin
g D
irect
orP
lace
:H
yder
abad
Dat
e:
Dec
emb
er 1
1, 2
010

ANNUAL REPORT 2007-2008
75
ANNUAL REPORT 2009-2010
DirDirDirDirDirectors' Reporectors' Reporectors' Reporectors' Reporectors' Reporttttt
The directors have pleasure in submitting their report together with the un-audited financial Statements as at March 31, 2010.
Principal ActivityPrincipal ActivityPrincipal ActivityPrincipal ActivityPrincipal ActivityThe nature of business of the company is to market pharmaceutical drugs and other associated products.
Review of OperationsReview of OperationsReview of OperationsReview of OperationsReview of OperationsDuring the period under review, the Company registered a loss of R$. 0.12 lakhs comprising of cost of personnel, administrationand interest expenses and the cumulative loss up to March 31, 2010 R$ 18.48 lakhs
DirDirDirDirDirectorsectorsectorsectorsectorsThe Director at the date of this report is Dr. Jayaram Chigurupati.
AuditorsAuditorsAuditorsAuditorsAuditorsThe Auditors, procontrol Consultoria Contabil, Chartered Accountants, have expressed their willingness to accept theappointment.
Statement by DirStatement by DirStatement by DirStatement by DirStatement by DirectorsectorsectorsectorsectorsIn the opinion of the Directors, the accompanying un-audited financial statements were drawn up so as to give a true and fairview of the state of affairs of the Company as at March 31, 2010 and of the results of the business for that period. Your Directorshave taken all reasonable steps to prepare these financial statements on a going concern basis and that suitable accountingpolicies have been adopted consistently. In view of serious software problem encountered during the year in the accountingpackages used by the company, it was not possible for the management of the company to complete the audit of the financialstatements given along with this report. However, the audit will be completed soon after the software problem is rectified.
By order of the Board
Date : October 30, 2010 Director
Zenotech Farmaceutica Do Brasil Ltda., Brazil

ANNUAL REPORT 2007-2008
76
ANNUAL REPORT 2009-2010
Zenotech Farmaceutica Do Brasil Ltda., Brazil
Amount in R$
I.I.I.I.I. SOURCESOURCESOURCESOURCESOURCES OF FUNDSS OF FUNDSS OF FUNDSS OF FUNDSS OF FUNDS1.1.1.1.1. SharSharSharSharShareholders' Fundseholders' Fundseholders' Fundseholders' Fundseholders' Funds
(a) Share capital 1 1,858,542 1,858,542(b) Reserves and surplus 2 73,406 73,406
TOTTOTTOTTOTTOTALALALALAL 1,931,948 1,931,948 1,931,948 1,931,948 1,931,948 1,931,948 1,931,948 1,931,948 1,931,948 1,931,948
II.II.II.II.II. APPLICA APPLICA APPLICA APPLICA APPLICATION OF FUNDSTION OF FUNDSTION OF FUNDSTION OF FUNDSTION OF FUNDS1.1.1.1.1. Fixed Assets :Fixed Assets :Fixed Assets :Fixed Assets :Fixed Assets :
(a) Gross block 3 75,963 75,963(b) Less: Depreciation 53,771 47,708
(c) Net Block 22,192 28,255
2.2.2.2.2. CurrCurrCurrCurrCurrent Assets, Loans and Advancesent Assets, Loans and Advancesent Assets, Loans and Advancesent Assets, Loans and Advancesent Assets, Loans and Advances 4(a) Cash and Bank balances 1,983 1,983(b) Loans and advances 68,400 68,400
70,383 70,383
Less: CurrLess: CurrLess: CurrLess: CurrLess: Current Liabilities and Prent Liabilities and Prent Liabilities and Prent Liabilities and Prent Liabilities and Provisionsovisionsovisionsovisionsovisions(a) Current Liabilities 5 8.205 2,205
8.205 2,205
Net CurrNet CurrNet CurrNet CurrNet Current Assetsent Assetsent Assetsent Assetsent Assets 62.178 68,178
3.3.3.3.3. PrPrPrPrProfit and Loss Accountofit and Loss Accountofit and Loss Accountofit and Loss Accountofit and Loss Account 1,847,578 1,835,515
TOTTOTTOTTOTTOTALALALALAL 1,931,948 1,931,948 1,931,948 1,931,948 1,931,948 1,931,9481,931,9481,931,9481,931,9481,931,948
Notes to the accounts 8
SchedulesSchedulesSchedulesSchedulesSchedules As atAs atAs atAs atAs at As at As at As at As at As atMarMarMarMarMarch 31 , 2010ch 31 , 2010ch 31 , 2010ch 31 , 2010ch 31 , 2010 MarMarMarMarMarch 31, 2009ch 31, 2009ch 31, 2009ch 31, 2009ch 31, 2009
By order of the Board
Date : October 30, 2010 Director
Balance Sheet

ANNUAL REPORT 2007-2008
77
ANNUAL REPORT 2009-2010
Amount in R$
INCOMEINCOMEINCOMEINCOMEINCOME – –
EXPENDITUREEXPENDITUREEXPENDITUREEXPENDITUREEXPENDITURE
Personnel 6 – 21,600
Administrative, Selling and Distributionand other expenses 7 6,000 12,000
Depreciation 6,063 7,173
12,06312,06312,06312,06312,063 40,77340,77340,77340,77340,773
PROFIT / (LOSS) BEFORE TPROFIT / (LOSS) BEFORE TPROFIT / (LOSS) BEFORE TPROFIT / (LOSS) BEFORE TPROFIT / (LOSS) BEFORE TAXAAXAAXAAXAAXATIONTIONTIONTIONTION (12,063)(12,063)(12,063)(12,063)(12,063) (40,773)(40,773)(40,773)(40,773)(40,773)
Provision for Taxation – –
PROFIT / (LOSS) AFTER TPROFIT / (LOSS) AFTER TPROFIT / (LOSS) AFTER TPROFIT / (LOSS) AFTER TPROFIT / (LOSS) AFTER TAXAAXAAXAAXAAXATIONTIONTIONTIONTION (12,063)(12,063)(12,063)(12,063)(12,063) (40,773)(40,773)(40,773)(40,773)(40,773)
Balance brought forward from previous year (1,835,515) (1,794,742)
Balance carried to Balance sheet (1,847,578) (1,847,578) (1,847,578) (1,847,578) (1,847,578) (1,835,515)(1,835,515)(1,835,515)(1,835,515)(1,835,515)
Notes to the Accounts 8
SchedulesSchedulesSchedulesSchedulesSchedules YYYYYear endedear endedear endedear endedear ended YYYYYear endedear endedear endedear endedear endedMarMarMarMarMarch 31 , 2010ch 31 , 2010ch 31 , 2010ch 31 , 2010ch 31 , 2010 MarMarMarMarMarch 31, 2009ch 31, 2009ch 31, 2009ch 31, 2009ch 31, 2009
By order of the Board
Date : October 30, 2010 Director
Zenotech Farmaceutica Do Brasil Ltda., Brazil
Profit and Loss Account

ANNUAL REPORT 2007-2008
78
ANNUAL REPORT 2009-2010
SCHEDSCHEDSCHEDSCHEDSCHEDULE 1ULE 1ULE 1ULE 1ULE 1 - SHARE CAPITSHARE CAPITSHARE CAPITSHARE CAPITSHARE CAPITALALALALAL
AuthorisedAuthorisedAuthorisedAuthorisedAuthorised40000 Quotas of Reais 10 each 400,000 400,000
ISSUED AND SUBSCRIBEDISSUED AND SUBSCRIBEDISSUED AND SUBSCRIBEDISSUED AND SUBSCRIBEDISSUED AND SUBSCRIBED
40000 Quotas of Reais 10 each Equity Shares of Rs. 10/- each fully paid 400,000 400,000
Advance for Capital increase 1,458,542 1,458,542
1,858,5421,858,5421,858,5421,858,5421,858,542 1,858,542 1,858,542 1,858,542 1,858,542 1,858,542
SCHEDULE 2 – RESERSCHEDULE 2 – RESERSCHEDULE 2 – RESERSCHEDULE 2 – RESERSCHEDULE 2 – RESERVES & SURPLUSVES & SURPLUSVES & SURPLUSVES & SURPLUSVES & SURPLUSSharSharSharSharShare Pre Pre Pre Pre Premiumemiumemiumemiumemium
At commencement of the year 73,406 73,406
Add : On issue of equity shares – –
73,406 73,406
SCHEDULE 4 - CURRENT ASSETS, LOANS & ADVSCHEDULE 4 - CURRENT ASSETS, LOANS & ADVSCHEDULE 4 - CURRENT ASSETS, LOANS & ADVSCHEDULE 4 - CURRENT ASSETS, LOANS & ADVSCHEDULE 4 - CURRENT ASSETS, LOANS & ADVANCESANCESANCESANCESANCESCASH AND BANK BALANCESCASH AND BANK BALANCESCASH AND BANK BALANCESCASH AND BANK BALANCESCASH AND BANK BALANCES
Cash on hand 1,983 1,983
With Scheduled Banks
- Current accounts - -
1,983 1,983
LOANS & ADVLOANS & ADVLOANS & ADVLOANS & ADVLOANS & ADVANCESANCESANCESANCESANCES
(Unsecured, Considered good unless otherwise specified)
Advance to others 24,400 24,400
Advances recoverable in cash or in kind or for value to be received 44,000 44,000
68,40068,40068,40068,40068,400 68,400 68,400 68,400 68,400 68,400
SCHEDULESCHEDULESCHEDULESCHEDULESCHEDULE 5 – CURRENT LIABILITIES 5 – CURRENT LIABILITIES 5 – CURRENT LIABILITIES 5 – CURRENT LIABILITIES 5 – CURRENT LIABILITIES
Other liabilities 8,205 2,205
8,2058,2058,2058,2058,205 2,205 2,205 2,205 2,205 2,205
As atAs atAs atAs atAs at As at As at As at As at As atMarMarMarMarMarch 31 , 2010ch 31 , 2010ch 31 , 2010ch 31 , 2010ch 31 , 2010 MarMarMarMarMarch 31, 2009ch 31, 2009ch 31, 2009ch 31, 2009ch 31, 2009
Amount in R$
Zenotech Farmaceutica Do Brasil Ltda., Brazil
Schedules forming part of the Balance Sheet

ANNUAL REPORT 2007-2008
79
ANNUAL REPORT 2009-2010
Zenotech Farmaceutica Do Brasil Ltda., Brazil
SC
HE
DU
LE :
3S
CH
ED
ULE
: 3
SC
HE
DU
LE :
3S
CH
ED
ULE
: 3
SC
HE
DU
LE :
3Fi
xed
ass
ets
Fixe
d a
sset
sFi
xed
ass
ets
Fixe
d a
sset
sFi
xed
ass
ets
Amou
nt in
R$
Cos
tC
ost
Cos
tC
ost
Cos
tD
epr
Dep
rD
epr
Dep
rD
epr e
ciat
ion
ecia
tion
ecia
tion
ecia
tion
ecia
tion
Net
Boo
k V
Net
Boo
k V
Net
Boo
k V
Net
Boo
k V
Net
Boo
k V a
lue
alue
alue
alue
alue
Des
crip
tion
Des
crip
tion
Des
crip
tion
Des
crip
tion
Des
crip
tion
31.0
3.09
31.0
3.09
31.0
3.09
31.0
3.09
31.0
3.09
Ad
diti
ons
Ad
diti
ons
Ad
diti
ons
Ad
diti
ons
Ad
diti
ons
Ded
uct-
Ded
uct-
Ded
uct-
Ded
uct-
Ded
uct-
31.0
3.10
31.0
3.10
31.0
3.10
31.0
3.10
31.0
3.10
31.0
3.09
31.0
3.09
31.0
3.09
31.0
3.09
31.0
3.09
For
the
For
the
For
the
For
the
For
the
Ded
uct-
Ded
uct-
Ded
uct-
Ded
uct-
Ded
uct-
31.0
3.10
31.0
3.10
31.0
3.10
31.0
3.10
31.0
3.10
31.0
3.10
31.0
3.10
31.0
3.10
31.0
3.10
31.0
3.10
31.0
3.09
31.0
3.09
31.0
3.09
31.0
3.09
31.0
3.09
ions
ions
ions
ions
ions
year
year
year
year
year
ions
ions
ions
ions
ions
Leas
ehol
d im
prov
emen
ts 1
2,69
8 -
- 1
2,69
8 1
2,69
8 -
- 1
2,69
8 -
-
Plan
t and
mac
hine
ry 2
,756
- -
2,7
56 2
,756
- -
2,7
56 -
-
EDP
equi
pmen
t 1
2,19
5 -
- 1
2,19
5 1
0,96
9 1
,226
- 1
2,19
5 -
1,2
26
Furn
iture
and
fixt
ures
48,
314
- -
48,
314
21,
285
4,8
37 -
26,
122
22,
192
27,
029
75,
963
- -
75,
963
47,
708
6,0
63 -
53,
771
22,
192
31-M
arch
-09
75,9
63-
-75
,963
40,5
357,
173
-47
,708
28,2
55
Sch
edu
les
form
ing
par
t o
f th
e B
alan
ce S
hee
t

ANNUAL REPORT 2007-2008
80
ANNUAL REPORT 2009-2010
1.1.1.1.1. Significant accounting PracticesSignificant accounting PracticesSignificant accounting PracticesSignificant accounting PracticesSignificant accounting Practices
a) The Company adopts the accrual basis of accounting
b) Assets and Liabilities that are realizable or due more than twelve months after the financial statements date areclassified as non-current
c) Assets and Liabilities in foreign currencies are translated at exchange rates in effect at the financial dates
d) Fixed assets are recorded at historical cost and depreciated on the straight-line method based on the estimateduseful lives of the assets.
2.2.2.2.2. PrPrPrPrPresentation of financial statementsesentation of financial statementsesentation of financial statementsesentation of financial statementsesentation of financial statements
The financial statements have been prepared in conformity with accounting practices followed in Brazil based on corporatelegislation.
3.3.3.3.3. Operations:Operations:Operations:Operations:Operations:
Zenotech Farmaceutica do Brasil Ltda. is in pre-operational process yet.
Schedule 8 - Notes on financial statements for the year ended March 31, 2010
By order of the Board
Date : October 30, 2010 Director
Zenotech Farmaceutica Do Brasil Ltda., Brazil
Schedules forming part of the Profit and Loss AccountAmount in R$
YYYYYear endedear endedear endedear endedear ended Y Y Y Y Year endedear endedear endedear endedear endedMarMarMarMarMarch 31 , 2010ch 31 , 2010ch 31 , 2010ch 31 , 2010ch 31 , 2010 MarMarMarMarMarch 31, 2009ch 31, 2009ch 31, 2009ch 31, 2009ch 31, 2009
SCHEDULE 6SCHEDULE 6SCHEDULE 6SCHEDULE 6SCHEDULE 6 - - - - - PERSONNELPERSONNELPERSONNELPERSONNELPERSONNEL
Salaries, Wages etc., - 18,000
Social charges on salaries - 3,600
----- 21,600 21,600 21,600 21,600 21,600
SCHEDULE 7SCHEDULE 7SCHEDULE 7SCHEDULE 7SCHEDULE 7
ADMINISTRAADMINISTRAADMINISTRAADMINISTRAADMINISTRATIVE, SELLING AND DISTRIBUTION AND OTHER EXPENSESTIVE, SELLING AND DISTRIBUTION AND OTHER EXPENSESTIVE, SELLING AND DISTRIBUTION AND OTHER EXPENSESTIVE, SELLING AND DISTRIBUTION AND OTHER EXPENSESTIVE, SELLING AND DISTRIBUTION AND OTHER EXPENSES
Miscellaneous 6,000 12,000
6,0006,0006,0006,0006,000 12,000 12,000 12,000 12,000 12,000

ANNUAL REPORT 2007-2008
81
ANNUAL REPORT 2009-2010
DirDirDirDirDirectors' Reporectors' Reporectors' Reporectors' Reporectors' Reporttttt
The directors have pleasure in submitting their report together with the un-audited Statement of Affairs at March 31, 2010.
Principal activityPrincipal activityPrincipal activityPrincipal activityPrincipal activityThe nature of business of the company is to market pharmaceutical drugs and other associated products.
Review of OperationsReview of OperationsReview of OperationsReview of OperationsReview of OperationsThe Company is, yet to commence its operations.
DirDirDirDirDirectorsectorsectorsectorsectorsDirector at the date of this report is Mr. Obinna Emeribe
AuditorsAuditorsAuditorsAuditorsAuditorsIn accordance with Section 357 (2) of the Companies and Allied Matters Act, 1990, the Auditors Messrs Kunle Akiode & Co.shall continue in office having indicated their willingness to do so.
Statement by DirStatement by DirStatement by DirStatement by DirStatement by DirectorsectorsectorsectorsectorsIn the opinion of the Directors, the accompanying un-audited financial statements were drawn up so as to give a true and fairview of the state of affairs of the Company as at March 31, 2010 and of the results of the business for that period. Your Directorshave taken all reasonable steps to prepare these financial statements on a going concern basis and that suitable accountingpolicies have been adopted consistently. In view of serious software problem encountered during the year in the accountingpackages used by the company, it was not possible for the management of the company to complete that audit of the financialstatements given along with this report. However, the audit will be completed soon after the software problem is rectified.
By order of the Board
Date : October 30, 2010 Director
Zenotech Laboratories Nigeria Limited

ANNUAL REPORT 2007-2008
82
ANNUAL REPORT 2009-2010
Amount in Naira
I.I.I.I.I. SOURCESOURCESOURCESOURCESOURCES OF FUNDSS OF FUNDSS OF FUNDSS OF FUNDSS OF FUNDS
1.1.1.1.1. SharSharSharSharShareholders' Fundseholders' Fundseholders' Fundseholders' Fundseholders' Funds
Share capital 1 9,214,142 9,214,142
TOTTOTTOTTOTTOTALALALALAL 9,214,1429,214,1429,214,1429,214,1429,214,142 9,214,142 9,214,142 9,214,142 9,214,142 9,214,142
II.II.II.II.II. APPLICAAPPLICAAPPLICAAPPLICAAPPLICATION OF FUNDSTION OF FUNDSTION OF FUNDSTION OF FUNDSTION OF FUNDS
1.1.1.1.1. Fixed Assets :Fixed Assets :Fixed Assets :Fixed Assets :Fixed Assets :
(a) Gross block 2 513,350 513,350
(b) Less: Depreciation - -
(c) Net Block 513,350 513,350
3.3.3.3.3. CurrCurrCurrCurrCurrent Assets, Loans and Advancesent Assets, Loans and Advancesent Assets, Loans and Advancesent Assets, Loans and Advancesent Assets, Loans and Advances 3
(a) Cash and Bank balances 6,143 6,143
(b) Loans and advances 270,837 270,837
276,980 276,980
Less: CurrLess: CurrLess: CurrLess: CurrLess: Current Liabilities and Prent Liabilities and Prent Liabilities and Prent Liabilities and Prent Liabilities and Provisionsovisionsovisionsovisionsovisions ----- -----
Net CurrNet CurrNet CurrNet CurrNet Current Assetsent Assetsent Assetsent Assetsent Assets 276,980 276,980
4.4.4.4.4. Miscellaneous ExpenditurMiscellaneous ExpenditurMiscellaneous ExpenditurMiscellaneous ExpenditurMiscellaneous Expenditureeeee
Pre-operative expenses 8,423,812 8,423,812
TOTTOTTOTTOTTOTALALALALAL 9,214,1429,214,1429,214,1429,214,1429,214,142 9,214,142 9,214,142 9,214,142 9,214,142 9,214,142
Notes to the Accounts 4
SchedulesSchedulesSchedulesSchedulesSchedules As atAs atAs atAs atAs at As at As at As at As at As atMarMarMarMarMarch 31 , 2010ch 31 , 2010ch 31 , 2010ch 31 , 2010ch 31 , 2010 MarMarMarMarMarch 31, 2009ch 31, 2009ch 31, 2009ch 31, 2009ch 31, 2009
By order of the Board
Date : October 30, 2010 Director
Zenotech Laboratories Nigeria Limited
Balance sheet

ANNUAL REPORT 2007-2008
83
ANNUAL REPORT 2009-2010
SCHEDULE 1 - SHARE CAPITSCHEDULE 1 - SHARE CAPITSCHEDULE 1 - SHARE CAPITSCHEDULE 1 - SHARE CAPITSCHEDULE 1 - SHARE CAPITALALALALAL
AuthorisedAuthorisedAuthorisedAuthorisedAuthorised
10,00,000 Ordinary Shares 1,000,000 1,000,000
Issued and SubscribedIssued and SubscribedIssued and SubscribedIssued and SubscribedIssued and Subscribed10,00,000 Ordinary Shares 1,000,000 1,000,000
Advance for Capital increase 8,214,142 8,214,142
9,214,142 9,214,142 9,214,142 9,214,142 9,214,142 9,214,142 9,214,142 9,214,142 9,214,142 9,214,142
SCHEDULE 3 - CURRENT ASSETS, LOANS & ADVSCHEDULE 3 - CURRENT ASSETS, LOANS & ADVSCHEDULE 3 - CURRENT ASSETS, LOANS & ADVSCHEDULE 3 - CURRENT ASSETS, LOANS & ADVSCHEDULE 3 - CURRENT ASSETS, LOANS & ADVANCESANCESANCESANCESANCESCASH AND BANK BALANCESCASH AND BANK BALANCESCASH AND BANK BALANCESCASH AND BANK BALANCESCASH AND BANK BALANCES
Cash on hand - -With Scheduled Banks
- Current accounts 6,143 6,143
6,143 6,143 6,143 6,143 6,143 6,143 6,143 6,143 6,143 6,143LOANS & ADVLOANS & ADVLOANS & ADVLOANS & ADVLOANS & ADVANCESANCESANCESANCESANCES(Unsecured, Considered good unless otherwise specified)
Advances recoverable in cash or in kind or for value to be received 270,837 270,837
270,837 270,837 270,837 270,837 270,837 270,837 270,837 270,837 270,837 270,837
As atAs atAs atAs atAs at As at As at As at As at As atMarMarMarMarMarch 31 , 2010ch 31 , 2010ch 31 , 2010ch 31 , 2010ch 31 , 2010 MarMarMarMarMarch 31, 2009ch 31, 2009ch 31, 2009ch 31, 2009ch 31, 2009
Schedules forming part of the Balance Sheet
Amount in Naira
Zenotech Laboratories Nigeria Limited

ANNUAL REPORT 2007-2008
84
ANNUAL REPORT 2009-2010
Sch
edul
e -
4:
Not
es t
o th
e fin
anci
al s
tate
men
ts f
or t
he y
ear
end
ed M
arS
ched
ule
- 4:
N
otes
to
the
finan
cial
sta
tem
ents
for
the
yea
r en
ded
Mar
Sch
edul
e -
4:
Not
es t
o th
e fin
anci
al s
tate
men
ts f
or t
he y
ear
end
ed M
arS
ched
ule
- 4:
N
otes
to
the
finan
cial
sta
tem
ents
for
the
yea
r en
ded
Mar
Sch
edul
e -
4:
Not
es t
o th
e fin
anci
al s
tate
men
ts f
or t
he y
ear
end
ed M
arch
31,
201
0ch
31,
201
0ch
31,
201
0ch
31,
201
0ch
31,
201
0
Sig
nific
ant
Acc
ount
ing
Pol
icie
sS
igni
fican
t A
ccou
ntin
g P
olic
ies
Sig
nific
ant
Acc
ount
ing
Pol
icie
sS
igni
fican
t A
ccou
ntin
g P
olic
ies
Sig
nific
ant
Acc
ount
ing
Pol
icie
s
1.
1.1.
1. 1.
BA
SIS
OF
AC
CO
UN
TIN
GB
AS
IS O
F A
CC
OU
NTI
NG
BA
SIS
OF
AC
CO
UN
TIN
GB
AS
IS O
F A
CC
OU
NTI
NG
BA
SIS
OF
AC
CO
UN
TIN
G
This
sta
tem
ent o
f affa
irs h
as b
een
pre
par
ed u
nder
the
hist
oric
al c
ost c
onve
ntio
n of
acc
ount
ing
Ad
just
men
ts h
ave
not b
een
mad
e to
ref
lect
the
imp
act o
f pric
e le
vel c
hang
es o
n th
e ac
coun
ts.
2.
2.2.
2. 2.
STO
CK
STO
CK
STO
CK
STO
CK
STO
CK
Sto
ck is
val
ued
at t
he lo
wer
of c
ost a
nd n
et r
ealiz
able
val
ue w
ith c
ost d
eter
min
ed o
n fir
st in
firs
t bas
is
3.FO
RE
IGN
CU
RR
EN
CY
ITE
MS
FOR
EIG
N C
UR
RE
NC
Y I
TEM
SFO
RE
IGN
CU
RR
EN
CY
ITE
MS
FOR
EIG
N C
UR
RE
NC
Y I
TEM
SFO
RE
IGN
CU
RR
EN
CY
ITE
MS
Fore
ign
curr
ency
item
s w
ere
tran
slat
ed a
t the
rul
ing
mar
ket p
rice
for
the
per
iod
end
ed a
t the
rat
e if
N15
1.88
to th
e d
olla
r.
By
ord
er o
f the
Boa
rd
Dat
e:
Oct
ober
30,
201
0D
irect
or
Zenotech Laboratories Nigeria Limited
EDP
equi
pmen
t 1
81,5
00 –
– 1
81,5
00 –
– –
– 1
81,5
00 1
81,5
00
Furn
iture
and
fixt
ures
331
,850
– –
331
,850
– –
– –
331
,850
331
,850
513
,350
513
,350
513
,350
513
,350
513
,350
– – – – – – – – – –
513
,350
513
,350
513
,350
513
,350
513
,350
– – – – – – – – – –
– – – – – – – – – –
513
,350
513
,350
513
,350
513
,350
513
,350
31–M
ar–0
9 5
13,3
50 –
– 5
13,3
50 –
– –
– 5
13,3
50
Sch
edu
les
form
ing
par
t o
f th
e B
alan
ce S
hee
t
SC
HE
DU
LE
2S
CH
ED
ULE
2
SC
HE
DU
LE
2S
CH
ED
ULE
2
SC
HE
DU
LE
2 – –
–
–
– F
IXE
D A
SS
ETS
FIX
ED
AS
SE
TSFI
XE
D A
SS
ETS
FIX
ED
AS
SE
TSFI
XE
D A
SS
ETS
Am
ount
in N
aira
Cos
tC
ost
Cos
tC
ost
Cos
tD
epr
Dep
rD
epr
Dep
rD
epr e
ciat
ion
ecia
tion
ecia
tion
ecia
tion
ecia
tion
Net
Boo
k V
Net
Boo
k V
Net
Boo
k V
Net
Boo
k V
Net
Boo
k V a
lue
alue
alue
alue
alue
Des
crip
tion
Des
crip
tion
Des
crip
tion
Des
crip
tion
Des
crip
tion
31.0
3.09
31.0
3.09
31.0
3.09
31.0
3.09
31.0
3.09
Ad
diti
ons
Ad
diti
ons
Ad
diti
ons
Ad
diti
ons
Ad
diti
ons
Ded
uct-
Ded
uct-
Ded
uct-
Ded
uct-
Ded
uct-
31.0
3.10
31.0
3.10
31.0
3.10
31.0
3.10
31.0
3.10
31.0
3.09
31.0
3.09
31.0
3.09
31.0
3.09
31.0
3.09
For
the
For
the
For
the
For
the
For
the
Ded
uct-
Ded
uct-
Ded
uct-
Ded
uct-
Ded
uct-
31.0
3.10
31.0
3.10
31.0
3.10
31.0
3.10
31.0
3.10
31.0
3.10
31.0
3.10
31.0
3.10
31.0
3.10
31.0
3.10
31.0
3.09
31.0
3.09
31.0
3.09
31.0
3.09
31.0
3.09
ions
ions
ions
ions
ions
per
iod
per
iod
per
iod
per
iod
per
iod
ions
ions
ions
ions
ions

ANNUAL REPORT 2007-2008
85
ANNUAL REPORT 2009-2010
DirDirDirDirDirectors' Reporectors' Reporectors' Reporectors' Reporectors' Reporttttt
The Directors present their report and the un-audited financial statements for the period ended March 31, 2010.
Principal activityPrincipal activityPrincipal activityPrincipal activityPrincipal activityZenotech Inc. is a Research and Development Company and has a full fledged laboratory at New Jersey, USA. The Companydevelops monoclonal antibodies. The Company's drug discovery projects are involved in developing new biological entitiesfor known targets in cancer.
Review of OperationsReview of OperationsReview of OperationsReview of OperationsReview of OperationsDuring the period under review, the Company registered a loss of USD 0.001 lakhs comprising of cost of raw material, personnel,administrative, selling and interest expenses.
AuditorsAuditorsAuditorsAuditorsAuditorsThe Auditors, Murphy and Associates, Chartered Accountants, have expressed their willingness to accept the appointment.
DirDirDirDirDirectorsectorsectorsectorsectorsThe Directors at the date of this report are: Dr. Jayaram Chigurupati and Ms. Padmasree Chigurupati.
Statement by DirStatement by DirStatement by DirStatement by DirStatement by DirectorsectorsectorsectorsectorsIn the opinion of the Directors, the accompanying un-audited financial statements were drawn up so as to give a true and fairview of the state of affairs of the Company as at March 31, 2010 and of the results of the business for that period. Your Directorshave taken all reasonable steps to prepare these financial statements on a going concern basis and that suitable accountingpolicies have been adopted consistently. In view of serious software problem encountered during the year in the accountingpackages used by the company, it was not possible for the management of the company to complete the audit of the financialstatements given along with this report. However, the audit will be completed soon after the software problem is rectified.
By order of the Board
Date : October 30, 2010 Director
Zenotech Inc,USA

ANNUAL REPORT 2007-2008
86
ANNUAL REPORT 2009-2010
Amount in US $
I.I.I.I.I. SOURCES OSOURCES OSOURCES OSOURCES OSOURCES OF FUNDSF FUNDSF FUNDSF FUNDSF FUNDS
1.1.1.1.1. SharSharSharSharShareholders' Fundseholders' Fundseholders' Fundseholders' Fundseholders' Funds(a) Share capital 1 255,000 255,000
255,000255,000255,000255,000255,000 255,000255,000255,000255,000255,000
2.2.2.2.2. Loan FundsLoan FundsLoan FundsLoan FundsLoan Funds(a) Secured Loans 2 130 54,066(b) Unsecured Loans 3 570,052 516,000
570,182 570,066
TOTAL 825,182 825,182 825,182 825,182 825,182 825,066825,066825,066825,066825,066
II.II.II.II.II. APPLICAAPPLICAAPPLICAAPPLICAAPPLICATION OF FUNDSTION OF FUNDSTION OF FUNDSTION OF FUNDSTION OF FUNDS
1.1.1.1.1. Fixed Assets :Fixed Assets :Fixed Assets :Fixed Assets :Fixed Assets :(a) Gross block 4 – 133,016(b) Less: Depreciation – 97,441
(c) Net Block – – – – – 35,57535,57535,57535,57535,575
2.2.2.2.2. CurrCurrCurrCurrCurrent Assets, Loans and Advancesent Assets, Loans and Advancesent Assets, Loans and Advancesent Assets, Loans and Advancesent Assets, Loans and Advances 5(a) Sundry Debtors 41,442 –(b) Cash and Bank balances 1,163 10,947(c) Loans and advances – 14,662
42,605 25,609
Less : CurrLess : CurrLess : CurrLess : CurrLess : Current Liabilities and Prent Liabilities and Prent Liabilities and Prent Liabilities and Prent Liabilities and ProvisionsovisionsovisionsovisionsovisionsCurrent Liabilities 6 50,000 68,595
50,000 50,000 50,000 50,000 50,000 68,59568,59568,59568,59568,595
Net CurrNet CurrNet CurrNet CurrNet Current Assetsent Assetsent Assetsent Assetsent Assets (7,395) (42,986)
3.3.3.3.3. PrPrPrPrProfit and Loss Accountofit and Loss Accountofit and Loss Accountofit and Loss Accountofit and Loss Account 832,477 832,477
TOTAL 825,066 825,066 825,066 825,066 825,066 825,066 825,066 825,066 825,066 825,066
Notes to the Accounts 12
SchedulesSchedulesSchedulesSchedulesSchedules As atAs atAs atAs atAs at As at As at As at As at As atMarMarMarMarMarch 31 , 2010ch 31 , 2010ch 31 , 2010ch 31 , 2010ch 31 , 2010 MarMarMarMarMarch 31, 2009ch 31, 2009ch 31, 2009ch 31, 2009ch 31, 2009
By order of the Board
Date : October 30, 2010 Director
Zenotech Inc,USA
Balance sheet

ANNUAL REPORT 2007-2008
87
ANNUAL REPORT 2009-2010
Amount in US $
INCINCINCINCINCOMEOMEOMEOMEOME
Income from Sales and Operations 45,000 380,000
Other income 7 5,867 12,003
50,86750,86750,86750,86750,867 392,003392,003392,003392,003392,003
EXPENDITUREEXPENDITUREEXPENDITUREEXPENDITUREEXPENDITURE
Raw Materials, Finished goods, etc., 8 5,978 45,890
Personnel 9 26,468 205,774
Administrative and other expenses 10 18,211 118,955
Interest and Bank charges 11 310 8,088
Depreciation – 26,603
50,96750,96750,96750,96750,967 405,310405,310405,310405,310405,310
PROFIT / (LOSS) BEFORE TPROFIT / (LOSS) BEFORE TPROFIT / (LOSS) BEFORE TPROFIT / (LOSS) BEFORE TPROFIT / (LOSS) BEFORE TAXAAXAAXAAXAAXATIONTIONTIONTIONTION (100) (13,307)
Provision for Taxation
PrPrPrPrProfit / (Loss) for the periodofit / (Loss) for the periodofit / (Loss) for the periodofit / (Loss) for the periodofit / (Loss) for the period (100) (13,307)
Balance brought forward from previous year (832,477) (819,170)
Balance carried to Balance sheet (832,577)(832,577)(832,577)(832,577)(832,577) (832,477) (832,477) (832,477) (832,477) (832,477)
Notes to the Accounts 12
By order of the Board
Date : October 30, 2010 Director
SchedulesSchedulesSchedulesSchedulesSchedules YYYYYear endedear endedear endedear endedear ended YYYYYear endedear endedear endedear endedear endedMarMarMarMarMarch 31 , 2010ch 31 , 2010ch 31 , 2010ch 31 , 2010ch 31 , 2010 MarMarMarMarMarch 31, 2009ch 31, 2009ch 31, 2009ch 31, 2009ch 31, 2009
Profit and Loss Account
Zenotech Inc,USA

ANNUAL REPORT 2007-2008
88
ANNUAL REPORT 2009-2010
SCHEDULE 1 – SHARE CAPITSCHEDULE 1 – SHARE CAPITSCHEDULE 1 – SHARE CAPITSCHEDULE 1 – SHARE CAPITSCHEDULE 1 – SHARE CAPITALALALALALAuthorisedAuthorisedAuthorisedAuthorisedAuthorised
Capital Stock 10,00,000 shares authorized, par value $0.01 10,000 10,000
Issued and SubscribedIssued and SubscribedIssued and SubscribedIssued and SubscribedIssued and SubscribedCapital Stock 10,00,000 shares authorized, par value $0.01 10,000 10,000Advance for Capital increase 245,000 245,000
255,000255,000255,000255,000255,000 255,000 255,000 255,000 255,000 255,000
SCHEDULE 2 – SECURED LOANSSCHEDULE 2 – SECURED LOANSSCHEDULE 2 – SECURED LOANSSCHEDULE 2 – SECURED LOANSSCHEDULE 2 – SECURED LOANS
a)a)a)a)a) Cash CrCash CrCash CrCash CrCash Credits / Wedits / Wedits / Wedits / Wedits / Working Capital loansorking Capital loansorking Capital loansorking Capital loansorking Capital loansi)i)i)i)i) BanksBanksBanksBanksBanks
Bank Loans 130 5,130
b)b)b)b)b) TTTTTerererererm Loansm Loansm Loansm Loansm Loansi) Banks
PNC Bank - 48,936
130 54,066
SCHEDULE 3 – UNSECURED LOANSSCHEDULE 3 – UNSECURED LOANSSCHEDULE 3 – UNSECURED LOANSSCHEDULE 3 – UNSECURED LOANSSCHEDULE 3 – UNSECURED LOANSFrom Promoters - interest free 516,000 516,000From others 54,052 -
570,052570,052570,052570,052570,052 516,000 516,000 516,000 516,000 516,000
SCHEDULE 5 - CURRENT ASSETS, LOANS & ADVSCHEDULE 5 - CURRENT ASSETS, LOANS & ADVSCHEDULE 5 - CURRENT ASSETS, LOANS & ADVSCHEDULE 5 - CURRENT ASSETS, LOANS & ADVSCHEDULE 5 - CURRENT ASSETS, LOANS & ADVANCESANCESANCESANCESANCESSUNDRSUNDRSUNDRSUNDRSUNDRY DEBTORSY DEBTORSY DEBTORSY DEBTORSY DEBTORS
(Unsecured, considered good unless otherwise specified)Debts outstandng for a period exceeding six months 41,442 -Other debts - - - - - -----
41,44241,44241,44241,44241,442 - - - - -
CASH AND BANK BALANCESCASH AND BANK BALANCESCASH AND BANK BALANCESCASH AND BANK BALANCESCASH AND BANK BALANCESCash on hand - -With Scheduled Banks
- Current accounts 1,163 10,947
1,1631,1631,1631,1631,163 10,947 10,947 10,947 10,947 10,947
LOANS & ADVLOANS & ADVLOANS & ADVLOANS & ADVLOANS & ADVANCESANCESANCESANCESANCES(Unsecured, Considered good unless otherwise specified)Advance to others - 10,400Advances recoverable in cash or in kind or for value to be received - 4,262
----- 14,662 14,662 14,662 14,662 14,662
SCHEDULE 6 - CURRENT LIABILITIESSCHEDULE 6 - CURRENT LIABILITIESSCHEDULE 6 - CURRENT LIABILITIESSCHEDULE 6 - CURRENT LIABILITIESSCHEDULE 6 - CURRENT LIABILITIESSundry Creditors - 12,721Other liabilities 50,000 55,874
50,000 50,000 50,000 50,000 50,000 68,59568,59568,59568,59568,595
As atAs atAs atAs atAs at As at As at As at As at As atMarMarMarMarMarch 31 , 2010ch 31 , 2010ch 31 , 2010ch 31 , 2010ch 31 , 2010 MarMarMarMarMarch 31, 2009ch 31, 2009ch 31, 2009ch 31, 2009ch 31, 2009
Amount in US $
Zenotech Inc,USA
Schedules forming part of the Balance Sheet

ANNUAL REPORT 2007-2008
89
ANNUAL REPORT 2009-2010
Zenotech Inc,USA
Sch
edu
les
form
ing
par
t o
f th
e B
alan
ce S
hee
t
Plan
t and
mac
hine
ry 1
33,0
16 –
133
,016
– 9
7,44
1 –
97,
441
– –
61,
151
133
,016
133,
016
133,
016
133,
016
133,
016
– – – – – 1
33,0
16 1
33,0
16 1
33,0
16 1
33,0
16 1
33,0
16 – – – – –
97,
441
97,
441
97,
441
97,
441
97,
441
– – – – – 9
7,44
1 9
7,44
1 9
7,44
1 9
7,44
1 9
7,44
1 – – – – –
– – – – –
31–M
ar–0
913
1,98
91,
027
–13
3,01
613
3,01
613
3,01
613
3,01
613
3,01
670
,838
70,8
3870
,838
70,8
3870
,838
26,6
0326
,603
26,6
0326
,603
26,6
03–––– –
97,4
4197
,441
97,4
4197
,441
97,4
41 6
1,15
1 6
1,15
1 6
1,15
1 6
1,15
1 6
1,15
1
SC
HE
DU
LE
4 –
FIX
ED
AS
SE
TSS
CH
ED
ULE
4
– FI
XE
D A
SS
ETS
SC
HE
DU
LE
4 –
FIX
ED
AS
SE
TSS
CH
ED
ULE
4
– FI
XE
D A
SS
ETS
SC
HE
DU
LE
4 –
FIX
ED
AS
SE
TS
Cos
tC
ost
Cos
tC
ost
Cos
tD
epr
Dep
rD
epr
Dep
rD
epr e
ciat
ion
ecia
tion
ecia
tion
ecia
tion
ecia
tion
Net
Boo
k V
Net
Boo
k V
Net
Boo
k V
Net
Boo
k V
Net
Boo
k V a
lue
alue
alue
alue
alue
Des
crip
tion
D
escr
iptio
n
Des
crip
tion
D
escr
iptio
n
Des
crip
tion
31.0
3.09
31.0
3.09
31.0
3.09
31.0
3.09
31.0
3.09
Ad
diti
ons
Ad
diti
ons
Ad
diti
ons
Ad
diti
ons
Ad
diti
ons
Ded
uct-
Ded
uct-
Ded
uct-
Ded
uct-
Ded
uct-
31.0
3.10
31.0
3.10
31.0
3.10
31.0
3.10
31.0
3.10
31.0
3.09
31.0
3.09
31.0
3.09
31.0
3.09
31.0
3.09
For
the
For
the
For
the
For
the
For
the
Ded
uct-
Ded
uct-
Ded
uct-
Ded
uct-
Ded
uct-
31.0
3.10
31.0
3.10
31.0
3.10
31.0
3.10
31.0
3.10
31.0
3.10
31.0
3.10
31.0
3.10
31.0
3.10
31.0
3.10
31.0
3.09
31.0
3.09
31.0
3.09
31.0
3.09
31.0
3.09
ions
ions
ions
ions
ions
year
year
year
year
year
ions
ions
ions
ions
ions
Am
ount
in U
S $

ANNUAL REPORT 2007-2008
90
ANNUAL REPORT 2009-2010
Amount in US $
YYYYYear endedear endedear endedear endedear ended Y Y Y Y Year endedear endedear endedear endedear endedMarMarMarMarMarch 31 , 2010ch 31 , 2010ch 31 , 2010ch 31 , 2010ch 31 , 2010 MarMarMarMarMarch 31, 2009ch 31, 2009ch 31, 2009ch 31, 2009ch 31, 2009
SCHEDULE 7 – SCHEDULE 7 – SCHEDULE 7 – SCHEDULE 7 – SCHEDULE 7 – OTHER INCOMEOTHER INCOMEOTHER INCOMEOTHER INCOMEOTHER INCOMEMiscelaneous income 5,573 12,003Profit on sale of assets 294 -
5,8675,8675,8675,8675,867 12,003 12,003 12,003 12,003 12,003
SCHEDULE 8 - RASCHEDULE 8 - RASCHEDULE 8 - RASCHEDULE 8 - RASCHEDULE 8 - RAW MAW MAW MAW MAW MATERIALS, FINISHED GOODS, ETC.,TERIALS, FINISHED GOODS, ETC.,TERIALS, FINISHED GOODS, ETC.,TERIALS, FINISHED GOODS, ETC.,TERIALS, FINISHED GOODS, ETC.,
a) Raw material and packing material consumed
Opening stock - -
Purchases 5,978 45,890
Less: Closing stock - -
5,9785,9785,9785,9785,978 45,890 45,890 45,890 45,890 45,890
SCHEDULE 9 - PERSONNELSCHEDULE 9 - PERSONNELSCHEDULE 9 - PERSONNELSCHEDULE 9 - PERSONNELSCHEDULE 9 - PERSONNEL
Salaries, Wages etc., 26,468 205,774
26,468 26,468 26,468 26,468 26,468 205,774 205,774 205,774 205,774 205,774
SCHEDULE 10 - ADMINISTRASCHEDULE 10 - ADMINISTRASCHEDULE 10 - ADMINISTRASCHEDULE 10 - ADMINISTRASCHEDULE 10 - ADMINISTRATIVE, SELLINGTIVE, SELLINGTIVE, SELLINGTIVE, SELLINGTIVE, SELLING
AND DISTRIBUTION AND OTHER EXPENSESAND DISTRIBUTION AND OTHER EXPENSESAND DISTRIBUTION AND OTHER EXPENSESAND DISTRIBUTION AND OTHER EXPENSESAND DISTRIBUTION AND OTHER EXPENSESRent 5,222 39,874Office and general maintenance 3,361 20,834Rates and taxes 353 1,286Insurance 5,773 40,307Printing and stationery 140 335Communication expenses 753 3,411Legal and professional charges 1,333 5,348Travelling and entertainment 621 5,244Miscellaneous 655 2,316
18,21118,21118,21118,21118,211 118,955 118,955 118,955 118,955 118,955
SCHEDULE 11 - INTEREST AND BANK CHARGESSCHEDULE 11 - INTEREST AND BANK CHARGESSCHEDULE 11 - INTEREST AND BANK CHARGESSCHEDULE 11 - INTEREST AND BANK CHARGESSCHEDULE 11 - INTEREST AND BANK CHARGES
On fixed term loans
Other loans 112 7,258
Bank charges 198 830
310310310310310 8,088 8,088 8,088 8,088 8,088
Zenotech Inc,USA
Schedules forming part of Profit and Loss Account

ANNUAL REPORT 2007-2008
91
ANNUAL REPORT 2009-2010
Zenotech Inc,USA
Schedule - 12 Notes to Financial Statements for the period ended MarSchedule - 12 Notes to Financial Statements for the period ended MarSchedule - 12 Notes to Financial Statements for the period ended MarSchedule - 12 Notes to Financial Statements for the period ended MarSchedule - 12 Notes to Financial Statements for the period ended March 31, 2010ch 31, 2010ch 31, 2010ch 31, 2010ch 31, 2010
1.1.1.1.1. Significant Accounting PoliciesSignificant Accounting PoliciesSignificant Accounting PoliciesSignificant Accounting PoliciesSignificant Accounting Policies
Basic of accountingBasic of accountingBasic of accountingBasic of accountingBasic of accounting
The Company uses the accrual basis in accordance with generally accounting policies. Particularly significant policiesare outlined below.
Business activityBusiness activityBusiness activityBusiness activityBusiness activity
Zenotech Inc is as American Research and Development Company which develops second generation generic monoclonalantibodies used as human therapeutics. The Company has developed the clones to produce five generic monoclonalantibodies. The Company also developed technologies to produce these antibodies in mammalian cell culture up to 10liters in bioreactors. The Company has also developed technologies to purity the products from culture media andformulate them for human use.
The Company has R&D facilities at 1 Deer Park Drive, Suite H6, Monmouth Junction, N.J. Its scientists are highly qualifiedwith prior research experience in monoclonal antibodies at Case Western University, Stanford University and PrincetonUniversity.
Use of estimatesUse of estimatesUse of estimatesUse of estimatesUse of estimates
The preparation of financial statements in conformity with generally accepted accounting principles requires managementto make estimate and assumptions that affect the reported amounts of assets, liabilities, revenues and expenses and thedisclosure of contingent assets and liabilities. Actual results could differ from those estimates.
2.2.2.2.2. Related ParRelated ParRelated ParRelated ParRelated Party Tty Tty Tty Tty Transactionsransactionsransactionsransactionsransactions
The Company has a note payable to major stockholder $ 516,000 at the end of March31, 2010. The loan is a demandloan with no interest.
3.3.3.3.3. Defined Contribution Pension PlanDefined Contribution Pension PlanDefined Contribution Pension PlanDefined Contribution Pension PlanDefined Contribution Pension Plan
The Company sponsors a simple IRA Plan whereby the employees contribute to the plan administers by TD Waterhousefrom their pretax earnings. The Company makes a small matching Contribution of 2% of employee earnings.
By order of the Board
Date : October 30, 2010 Director

ANNUAL REPORT 2007-2008
92
ANNUAL REPORT 2009-2010
Notice to the Shareholders
NOTICENOTICENOTICENOTICENOTICE
Notice is hereby given that the Twenty first Annual General Meeting of the members of the Company will be held on Tuesday,the January 18, 2011 at 11.00 A.M. at Factory premises of the Company situated at Survey No. 250-252, Turkapally Village,Shameerpet, Mandal, Ranga Reddy District 500078, to transact the following business.
ORDINARORDINARORDINARORDINARORDINARY BUSINESSY BUSINESSY BUSINESSY BUSINESSY BUSINESS
1) To receive, Consider and adopt the audited Balance Sheet as at March 31, 2010 and the Profit and Loss account for theyear ended on that date together with the reports of the Director's and Auditors thereon.
2) To appoint Auditors and fix their remuneration.
Whereas M/s Deloitte Haskins & Sells., Chartered Accountants, Hyderabad the retiring statutory auditors of the Company,have expressed their inability to continue as auditors of the Company. In view of this the Board proposes to M/s.BSR &Associates., Chartered Accountants, Hyderabad are proposed to be appointed as Auditors of the Company to hold officefor the period commencing from the conclusion of this Annual General Meeting till the conclusion of the next AnnualGeneral Meeting on such remuneration as may be fixed by the Board of Directors of the company. This notice may also betreated as special notice under section 225 of the Companies Act, 1956 to pass with or without modification the followingresolution.
"RESOLVED that M/s. BSR & Associates., Chartered Accountants, Hyderabad be and are hereby appointed as the StatutoryAuditors of the Company in place of M/s. Deloitte Haskins & Sells to hold office from the conclusion of this Annual GeneralMeeting until the conclusion of the next Annual General Meeting at a remuneration as may be mutually agreed uponbetween the said M/s. BSR & Associates., and the Board of Directors of the Company.
By Order Of The BoardFor Zenotech Laboratories LimitedZenotech Laboratories LimitedZenotech Laboratories LimitedZenotech Laboratories LimitedZenotech Laboratories Limited
Place : Hyderabad Dr. Jayaram ChigurupatiDate : December 11, 2010 Managing Director

ANNUAL REPORT 2007-2008
93
ANNUAL REPORT 2009-2010
1. A member entitled to attend and vote at the meeting is entitled to appoint a proxy to attend and vote instead of himself andthe proxy need not be a member of the company. The proxy form duly completed and signed should be deposited at theregistered office of the company not later that 48 hours before the commencement of the meeting.
3. The Register of members and transfer Books of the Company will be closed from January 14, 10, 2011 to January 18,2010 (both days inclusive) for the purpose of Annual General Meeting.
4. The members are requested to -
a) Intimate to the Registrars and Transfer Agents of the Company / Depository Participants changes, if any, in theirregistered addresses at an early date.
b) Quote Ledger Folio/Client ID in all the correspondence.
c) Bring the copy of the Annual Report and attendance slip with them to the Annual General Meeting.
5. Shareholders holding shares in physical form are requested to advise any change of address immediately to company'sRegistrar and Share Transfer Agent, Karvy Computershare Private Limited. Shareholders holding shares in electronicform must send the advice about change in address to their respective Depository participants and not to the Company.
6. Members seeking any information with regard to accounts are requested to write to the Company at least 10 days inadvance of the meeting to enable the management to keep the information ready.
7. Under Section 109A of the Companies Act, 1956 shareholders are entitled to make nomination in respect of shares heldby them in physical form. Shareholders desirous of making nominations are requested to send their requests in Form 2B(which will be available on request) to the Registrars and Transfer Agents M/s. Karvy Computershare Private Limited.
8. Corporate Members intending to send their authorized representative are requested to send a duly certified copy of theBoard Resolution authorizing their representatives to attend and vote at the Annual General Meeting.
NOTESNOTESNOTESNOTESNOTES
NOTES

ANNUAL REPORT 2007-2008
1
ANNUAL REPORT 2009-2010
Addendum to the Notice
ADDENDUM TO TADDENDUM TO TADDENDUM TO TADDENDUM TO TADDENDUM TO THE NOTICE CALLING THE TWENTY FIRST ANNUAL GENERAL MEETING OF THE MEMBERS OFHE NOTICE CALLING THE TWENTY FIRST ANNUAL GENERAL MEETING OF THE MEMBERS OFHE NOTICE CALLING THE TWENTY FIRST ANNUAL GENERAL MEETING OF THE MEMBERS OFHE NOTICE CALLING THE TWENTY FIRST ANNUAL GENERAL MEETING OF THE MEMBERS OFHE NOTICE CALLING THE TWENTY FIRST ANNUAL GENERAL MEETING OF THE MEMBERS OFTHE COMPTHE COMPTHE COMPTHE COMPTHE COMPANY WHICH IS TO BE HELD ON TUESDAANY WHICH IS TO BE HELD ON TUESDAANY WHICH IS TO BE HELD ON TUESDAANY WHICH IS TO BE HELD ON TUESDAANY WHICH IS TO BE HELD ON TUESDAYYYYY, THE JANUAR, THE JANUAR, THE JANUAR, THE JANUAR, THE JANUARY 18, 2011 AY 18, 2011 AY 18, 2011 AY 18, 2011 AY 18, 2011 AT 11.00 A.M. AT 11.00 A.M. AT 11.00 A.M. AT 11.00 A.M. AT 11.00 A.M. AT FT FT FT FT FACTORACTORACTORACTORACTORY PREMISESY PREMISESY PREMISESY PREMISESY PREMISESOF THE COMPOF THE COMPOF THE COMPOF THE COMPOF THE COMPANY SITUAANY SITUAANY SITUAANY SITUAANY SITUATED ATED ATED ATED ATED AT SURT SURT SURT SURT SURVEY NO.250-252, TURKAPVEY NO.250-252, TURKAPVEY NO.250-252, TURKAPVEY NO.250-252, TURKAPVEY NO.250-252, TURKAPALLALLALLALLALLY VILLAGE, SHAMEERPET MANDAL, RANGAY VILLAGE, SHAMEERPET MANDAL, RANGAY VILLAGE, SHAMEERPET MANDAL, RANGAY VILLAGE, SHAMEERPET MANDAL, RANGAY VILLAGE, SHAMEERPET MANDAL, RANGAREDDY DISTRICT 500078, TO TRANSACT THE FOLLOWING BUSINESS.REDDY DISTRICT 500078, TO TRANSACT THE FOLLOWING BUSINESS.REDDY DISTRICT 500078, TO TRANSACT THE FOLLOWING BUSINESS.REDDY DISTRICT 500078, TO TRANSACT THE FOLLOWING BUSINESS.REDDY DISTRICT 500078, TO TRANSACT THE FOLLOWING BUSINESS.
M/s Ranbaxy Laboratories Ltd a shareholder, filed a petition (No. 83 of 2009) under section 397/398 of the companies act,before Hon’ble Company Law Board, against the company and core promoters Namely Dr. Jayaram Chigurupati and hisgroup.
This is to inform the members that Ranbaxy Laboratories Limited has filed a Company Application No. 150 of 2010 inCompany Petition No.83 of 2010 before the Hon’ble Company Law Board under Section 186 of the Companies Act, 1956seeking for convening the Extra-ordinary General Meeting of the Company for appointment of three of its nominee directors.
The Hon’ble Company Law Board on 24.11.2010 allowed the application filed by Ranbaxy Laboratories Limited. Dr. JayaramChigurupati and his group filed Company Appeal No. 20 of 2010 before the Hon’ble High Court of Andhra Pradesh challengingthe order of Hon’ble Company Law Board. Meanwhile Ranbaxy Laboratories Limited has filed one more Company ApplicationNo. 209 before the Hon’ble Company Law Board for fixing the date of Extra-ordinary General Meeting. When the matterstood thus the Company Appeal No. 20 came up for hearing on 20.12.2010 wherein the Hon’ble High Court of AndhraPradesh has passed an order as follows “….In the meanwhile, the E.G.M. as allowed by the Company Law Boar“….In the meanwhile, the E.G.M. as allowed by the Company Law Boar“….In the meanwhile, the E.G.M. as allowed by the Company Law Boar“….In the meanwhile, the E.G.M. as allowed by the Company Law Boar“….In the meanwhile, the E.G.M. as allowed by the Company Law Board in C.A.d in C.A.d in C.A.d in C.A.d in C.A.No. 150 of 2010 may go on, however the rNo. 150 of 2010 may go on, however the rNo. 150 of 2010 may go on, however the rNo. 150 of 2010 may go on, however the rNo. 150 of 2010 may go on, however the resolutions passed shall not be given efesolutions passed shall not be given efesolutions passed shall not be given efesolutions passed shall not be given efesolutions passed shall not be given effect to until furfect to until furfect to until furfect to until furfect to until further orther orther orther orther orders.”ders.”ders.”ders.”ders.”
On 21.12.2010, on proposal of Sr. Counsel for Ranbaxy and accepted by the company, the Hon’ble Company Law Boardhas directed the Company to include the following agenda to the Notice calling the Annual General Meeting instead ofcalling a separate Extra Ordinary General Meeting.
Shareholder may kindly note that the following Resolutions will not be given effect to until further orders of Hon’ble HighCourt of Andhra Pradesh.
Special Business:Special Business:Special Business:Special Business:Special Business:
3. To consider and if thought fit, to pass with or without modification(s) the following resolution as an OrOrOrOrOrdinardinardinardinardinary Resolutiony Resolutiony Resolutiony Resolutiony Resolution:
“RESOLVED THAT Dr. Sudershan K. Arora be and is hereby appointed as a Director of the Company.”
4. To consider and if thought fit, to pass with or without modification(s) the following resolution as an OrOrOrOrOrdinardinardinardinardinary Resolutiony Resolutiony Resolutiony Resolutiony Resolution:
“RESOLVED THAT Mr. Ranjit Kohli be and is hereby appointed as a Director of the Company.”
5. To consider and if thought fit, to pass with or without modification(s) the following resolution as an OrOrOrOrOrdinardinardinardinardinary Resolutiony Resolutiony Resolutiony Resolutiony Resolution:
“RESOLVED THAT Dr. N. K. Ganguly and is hereby appointed as a Director of the Company.”
For Zenotech Laboratories Limited Zenotech Laboratories Limited Zenotech Laboratories Limited Zenotech Laboratories Limited Zenotech Laboratories Limited
Place: Hyderabad DrDrDrDrDr. Jayaram Chigurupati. Jayaram Chigurupati. Jayaram Chigurupati. Jayaram Chigurupati. Jayaram ChigurupatiDate: 22.12.2010 Managing Director
EXPLANAEXPLANAEXPLANAEXPLANAEXPLANATORTORTORTORTORY STY STY STY STY STAAAAATEMENT PURSUANT TO SECTION 173(2) OF THE COMPTEMENT PURSUANT TO SECTION 173(2) OF THE COMPTEMENT PURSUANT TO SECTION 173(2) OF THE COMPTEMENT PURSUANT TO SECTION 173(2) OF THE COMPTEMENT PURSUANT TO SECTION 173(2) OF THE COMPANIES ACTANIES ACTANIES ACTANIES ACTANIES ACT, 1956, 1956, 1956, 1956, 1956ITEM NO. 3ITEM NO. 3ITEM NO. 3ITEM NO. 3ITEM NO. 3
APPOINTMENT OF DrAPPOINTMENT OF DrAPPOINTMENT OF DrAPPOINTMENT OF DrAPPOINTMENT OF Dr. SUDERSHAN K. ARORA. SUDERSHAN K. ARORA. SUDERSHAN K. ARORA. SUDERSHAN K. ARORA. SUDERSHAN K. ARORA
Dr. Sudershan K. Arora, currently working as President – R&D, Ranbaxy Laboratories Limited has over 30 years of extensiveexperience in Drug Discovery, pre-clinical and clinical development and in leading research programs for design, synthesisand pre-clinical development of NCEs/natural products.
Dr. Arora has worked with many leading Indian and global pharmaceutical companies including Greenwich PharmaceuticalsInc., USA, Medicarb Inc., Biogen Inc., USA, Lupin and Sandoz, Austria.
With a PhD, in Synthetic Organic Chemistry from Kurukshetra University and a D.Sc from Bundelkhand University. Dr. Arorahas been a prominent speaker at various national and international scientific forums. He is also on the governing bodies ofnumerous academic institutions in India, besides being an eminent speaker in various forums. He has 30 US patents/PCTapplications to his credits and his articles are regularly published in reputed ACS and Indian Journals. Dr.Arora has beenbestowed with awards by various institutes.
Dr. Arora does not hold any shares in the Company.
Nature of expertise is specific functional area: Research & Development.
In view of his background and experience, it is proposed to appoint Dr.Sudershan K. Arora as a Director of the Company,which would be in the interest of the Company.
None of the other directors are interested or concerned in the proposed Resolution.

ANNUAL REPORT 2007-2008
2
ANNUAL REPORT 2009-2010
ITEM NITEM NITEM NITEM NITEM NO. 4O. 4O. 4O. 4O. 4
APPOINTMENT OF MrAPPOINTMENT OF MrAPPOINTMENT OF MrAPPOINTMENT OF MrAPPOINTMENT OF Mr. RANJIT KOHLI. RANJIT KOHLI. RANJIT KOHLI. RANJIT KOHLI. RANJIT KOHLI
Mr. Ranjit Kohli is a Commerce Graduate and a member of Institute of Chartered Accountants of India with an experience ofover 29 years in the field of Finance and Accounts. Mr. Kohli is currently working as Director Global Accounts with RanbaxyLaboratories Limited.
Before joining Ranbaxy, Mr. Kohli had also worked with Ernst & Young and DCM Ltd.
Mr. Kohli does not hold any shares in the Company.
Nature of expertise is specific functional area: Finance.
In view of his background and experience, it is proposed to appoint Mr. Ranjit Kohli as a Director of the Company, whichwould be in the interest of the Company.
None of the other directors are interested or concerned in the proposed Resolution.
ITEM NO. 3ITEM NO. 3ITEM NO. 3ITEM NO. 3ITEM NO. 3
APPOINTMENT OF PrAPPOINTMENT OF PrAPPOINTMENT OF PrAPPOINTMENT OF PrAPPOINTMENT OF Prof. N.K. GANGULof. N.K. GANGULof. N.K. GANGULof. N.K. GANGULof. N.K. GANGULYYYYY
Prof. N.K. Ganguly did his MBBS from University of Kolkatta, MD (Microbiology) from Post Graduate Institute of MedicalEducation & Research, Chandigarh and obtained D.Sc. (h.c.) from University of Calcutta, Kolkata, Bundelkhand University,Jhansi; Chhatrapati Shahu Ji Maharaj University, Kanpur and Guru Nanak Dev University, Amritsar.
Prof. Ganguly has been honoured with the prestigious Padma Bhushan award by Her Excellency the President of India on26th of January, 2008 in the filed of ‘Medicine’.
Currently, he is working as Distinguished Biotechnology Professor & Advisor in the Translational Health Science and TechnologyInstitute, President, Jawaharlal Institute of post Graduate Medical Education & Research, Pondicherry, Chairman of ImmunologyFoundation, Vice-President, Governing Body of Central Council for Research in Ayurveda & Siddha, Department of AYUSH,Ministry of Health & Family Welfare, President of Asian Institute of Public Health and Technology and Adviser to Departmentof Health & Research.
Prof. Ganguly is a Governing Body member of many Indian Institutes and Public Health Foundation of India as well asChairman/member if various national and international groups/committees/task force constituted by organizations such asWHO, International Vaccine Institute etc., on public health and medicine. He has been Scientific Advisory Committee memberof various research institutes in India. He has participated as Temporary Advisors in more than 121 WHO meetings till date.He is also Chairman of various committees of Govt. of India like GM Food, Vitamin A, Environmental Health etc.
Prof. Ganguly has also been on the Editorial boards of various National and International Journals such as Indian Journal ofMedical Research and ICMR Bulletin. In past Prof. Ganguly had been advisor to Union Minister of Health & Family Welfare,Govt. of India besides holding prestigious positions in various bodies/institutes such as Director General, Indian Council ofMedical Research, New Delhi, General President (Elect), the Indian Science Congress Association, Director Post GraduateInstitute of Medical Education & Research, Chandigarh etc.
Prof. Ganguly has published 741 papers and guided 130 PhD thesis as guide/co-guide. His major research areas havebeen tropical diseases, cardiovascular diseases and diarrhoeal diseases. His area of specialization is infection and hasinterests in this area ranges from immunology, biotechnology and public health. He has also a visiting faculty to variouseducational institutes and universities in India and abroad.
Prof. Ganguly is Fellow, Imperial College Faculty of Medicine, London; Royal College of Pathologists, London; InternationalAcademy of Cardiovascular Sciences Academy, New Delhi, Fellow of National Academy, New Delhi; National Academy ofScience, Allahabad; and Indian Academy of Sciences, Bangalore.
During his illustrious career, Prof. Ganguly has been bestowed upon with more than 100 various national and internationalprizes.
Prof. Ganguly does not hold any shares in the Company.
Nature of expertise is specific functional area: Research & Development.
In view of his background and experience, it is proposed to appoint Prof.N.K.Ganguly as a Director of the Company, whichwould be in the interest of the Company.
None of the other directors are interested or concerned in the proposed Resolution.For Zenotech Laboratories Limited Zenotech Laboratories Limited Zenotech Laboratories Limited Zenotech Laboratories Limited Zenotech Laboratories Limited
Place: Hyderabad DrDrDrDrDr. Jayaram Chigurupati. Jayaram Chigurupati. Jayaram Chigurupati. Jayaram Chigurupati. Jayaram ChigurupatiDate: 22.12.2010 Managing Director
Addendum to the Notice

ANNUAL REPORT 2007-2008
94
ANNUAL REPORT 2009-2010
Glossary
AS Accounting Stands as issued by the Institute of Chartered Accountant of India
ANDA Abbreviated New Drug Application
ANVISA An agency of Ministry of Health, Brazil
API Active Pharmaceutical Ingredient
APPCB Andhra Pradesh Pollution Control Board
APSFC Andhra Pradesh State Finance Corporation
BSE Bombay Stock Exchange Limited, Mumbai
CDSL Central Depository Services Limited
Companies Act The Companies Act, 1956, as amended from time to time
CSE The Calcutta Stock Exchange Association Limited, Kolkata
cGMP Current Good Manufacturing Practices
cGLP Current Good Laboratory Practices
DP Depository Participant
DCG(I) Drug Controller General of India
DSIR Department of Scientific and Industrial Research
EMD Earnest Money Deposit
EMEA European Medicines Evaluation Agency
EOU Export Oriented Unit
EPS Earnings per equity share
Equity Shares Equity shares of the Company of Rs. 10/- each unless otherwise specified in the context thereof
EU European Union
ESOP Employees Stock Option Plan
ESOS Employees Stock Option Scheme
Financial year/fiscal/FY The twelve months ended March 31 of a particular year
G-CSF Granulocyte Colony Stimulating Factor
GM-CSF Granulocyte Macrophage-colony Stimulating Factor
HSE The Hyderabad Stock Exchange Limited
IGAAP Indian Generally Accepted Accounting Principles
IL-2 Interlukin-2
NSDL National Securities Depository Limited
RBI Reserve Bank of India
R&D Research and Development
ROC Registrar of Companies, Hyderabad, Andhra Pradesh
RTA Registrars and Transfer Agents
SEBI The Securities and Exchange Board of India constituted under the SEBI Act
SEBI Guidelines SEBI (Guidelines for Disclosure and Investor Protection) 2000 issued by SEBI effective from January
27, 2000, as amended, including instructions and clarifications issued by SEBI from time to time
Stock Exchanges BSE and CSE
US FDA US Food and Drug Administration
GLOSSARGLOSSARGLOSSARGLOSSARGLOSSARYYYYY

ANNUAL REPORT 2007-2008
95
ANNUAL REPORT 2009-2010
ZENOTECH LABORAZENOTECH LABORAZENOTECH LABORAZENOTECH LABORAZENOTECH LABORATORIES LIMITEDTORIES LIMITEDTORIES LIMITEDTORIES LIMITEDTORIES LIMITEDRegd. Office: 8-2-120/11/88-89, Park View Estate, 4th Floor
Road No. 2, Banjara Hills, Hyderabad - 500 034.
AAAAATTENDANCE SLIPTTENDANCE SLIPTTENDANCE SLIPTTENDANCE SLIPTTENDANCE SLIP
I hereby record my presence at the 21st Annual General Meeting of the Company to be held on Tuesday, the January 18, 2011at 11.00 A.M. at factory premises of the Company situated at Survey No. 250-252, Turkapally Village,Shameerpet Mandal, R R District 500 078, Andhra Pradesh.
Member's Folio No./Client ID _____________________________________________
Member's / Proxy's full name _____________________________________________
No. of shares held _____________________________________________
Member's/PrMember's/PrMember's/PrMember's/PrMember's/Proxy Signaturoxy Signaturoxy Signaturoxy Signaturoxy Signatureeeee
Note: Member/Proxy wish to attend the meeting must bring this Attendance Slip to the meeting and handover at the entranceduly signed.
ZENOTECH LABORAZENOTECH LABORAZENOTECH LABORAZENOTECH LABORAZENOTECH LABORATORIES LIMITEDTORIES LIMITEDTORIES LIMITEDTORIES LIMITEDTORIES LIMITEDRegd. Office: 8-2-120/11/88-89, Park View Estate, 4th Floor
Road No. 2, Banjara Hills, Hyderabad - 500 034.
PROXY FORMPROXY FORMPROXY FORMPROXY FORMPROXY FORM
I/We _______________________________________________________________________________________________________ of_____________________________________________________ being a Member (s) of above named Company, hereby appoint__________________________________ of __________________________________________________________ of failing him/her_____________________________ of _____________________________ as my/our proxy to attend and vote for me/us, on my/ourbehalf at the 21st Annual General Meeting of the Company to be held on Tuesday, the January 18, 2011 at 11.00 A.M. at factorypremises of the Company situated at Survey No. 250-252, Turkapally Village, Shameerpet Mandal, R R District 500 078,Andhra Pradesh,at any adjourned meeting thereof.
Signed this ____________ day of _________________________ 2011
Folio No./ Client ID _____________________________________________
Signature of Member(s) _____________________________________________
Member's/PrMember's/PrMember's/PrMember's/PrMember's/Proxy Signaturoxy Signaturoxy Signaturoxy Signaturoxy Signatureeeee
Note: The proxy in order to be effective should be duly stamped, completed, signed and must be deposited at the RegisteredOffice of the Company not less than Forty eight hours before the time for holding the aforesaid meeting. The proxy need not bemember of the Company.
� ��
�
�


(Recombinant Human Interleukin-2)
TM
The Valiant Immunomodulator
Zenotech provides a range of quality Oncologicals
Dr. Jayaram ChigurupatiFounder and Managing Director
State of the art Manufacturing facilities

8-2-120/112/88-89, Park View Estate, 4th Floor, Road No. 2, Banjara Hills, Hyderabad - 500 034, IndiaTel.: +91 40 2354 0994 Fax : +91 40 2355 5465www.zenotechlabs.com
Annual Report2009-2010
CONQUERCANCER
Don’t have to be afraid of CANCER
CANCER is curable if detected early