annual report 2009 kazakhstan stock exchange - kasekase.kz/files/reports/2009_en.pdf · dear...
TRANSCRIPT

892
691
720900
1157
12241192
1394
1589
1739
1838
1870
December
November
October
September
August
July
June
May
April
March
February
January
KASE Index
ANNUAL REPORT2009
Kazakhstan Stock Exchange
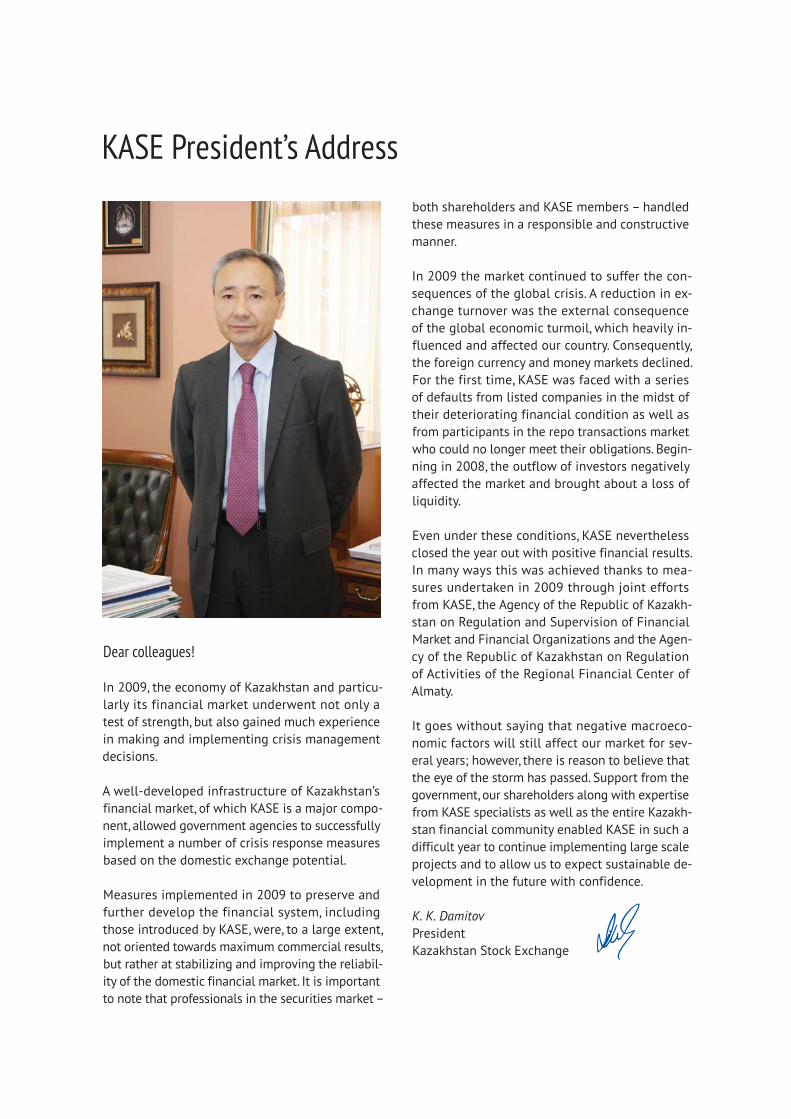
Dear colleagues!
In 2009, the economy of Kazakhstan and particu-
larly its financial market underwent not only a
test of strength, but also gained much experience
in making and implementing crisis management
decisions.
A well-developed infrastructure of Kazakhstan’s
financial market, of which KASE is a major compo-
nent, allowed government agencies to successfully
implement a number of crisis response measures
based on the domestic exchange potential.
Measures implemented in 2009 to preserve and
further develop the financial system, including
those introduced by KASE, were, to a large extent,
not oriented towards maximum commercial results,
but rather at stabilizing and improving the reliabil-
ity of the domestic financial market. It is important
KASE President’s Address
these measures in a responsible and constructive
manner.
In 2009 the market continued to suffer the con-
sequences of the global crisis. A reduction in ex-
change turnover was the external consequence
of the global economic turmoil, which heavily in-
fluenced and affected our country. Consequently,
the foreign currency and money markets declined.
For the first time, KASE was faced with a series
of defaults from listed companies in the midst of
their deteriorating financial condition as well as
from participants in the repo transactions market
who could no longer meet their obligations. Begin-
ning in 2008, the outflow of investors negatively
affected the market and brought about a loss of
liquidity.
Even under these conditions, KASE nevertheless
closed the year out with positive financial results.
In many ways this was achieved thanks to mea-
sures undertaken in 2009 through joint efforts
from KASE, the Agency of the Republic of Kazakh-
stan on Regulation and Supervision of Financial
Market and Financial Organizations and the Agen-
cy of the Republic of Kazakhstan on Regulation
of Activities of the Regional Financial Center of
Almaty.
It goes without saying that negative macroeco-
nomic factors will still affect our market for sev-
eral years; however, there is reason to believe that
the eye of the storm has passed. Support from the
government, our shareholders along with expertise
from KASE specialists as well as the entire Kazakh-
stan financial community enabled KASE in such a
difficult year to continue implementing large scale
projects and to allow us to expect sustainable de-
velopment in the future with confidence.
K. K. Damitov
President
Kazakhstan Stock Exchange


Contents
Glossary . . . . . . . . . . . . . . . . . . . . . . . . . . . . . . . . . . . . . . . . . . . . . . . . . . . . . . . . . . . . . . . . . . . . . . . . . . . . . . . . 6
Section I. Summary of Market Conditions in 2009 . . . . . . . . . . . . . . . . . . . . . . . . . . . . . . . . . . . . . . . . . . . . . 9
Section II. Main Events of 2009 . . . . . . . . . . . . . . . . . . . . . . . . . . . . . . . . . . . . . . . . . . . . . . . . . . . . . . . . . . . 15
KASE Executive Strategy . . . . . . . . . . . . . . . . . . . . . . . . . . . . . . . . . . . . . . . . . . . . . . . . . . . . . . . . . . . . . . . . 16
Development through Crisis Management. . . . . . . . . . . . . . . . . . . . . . . . . . . . . . . . . . . . . . . . . . . . . . . . . 19
Improvement of Corporate Governance . . . . . . . . . . . . . . . . . . . . . . . . . . . . . . . . . . . . . . . . . . . . . . . . . . . 22
Section III. 2009 Financial Results . . . . . . . . . . . . . . . . . . . . . . . . . . . . . . . . . . . . . . . . . . . . . . . . . . . . . . . . . 25
Assets and Liabilities Analysis . . . . . . . . . . . . . . . . . . . . . . . . . . . . . . . . . . . . . . . . . . . . . . . . . . . . . . . . . . . 26
Income and Expenses Analysis. . . . . . . . . . . . . . . . . . . . . . . . . . . . . . . . . . . . . . . . . . . . . . . . . . . . . . . . . . . 26
Key Financial Activity Indicators . . . . . . . . . . . . . . . . . . . . . . . . . . . . . . . . . . . . . . . . . . . . . . . . . . . . . . . . . 28
Section IV. The Group Y2009 Consolidated Financial Statements . . . . . . . . . . . . . . . . . . . . . . . . . . . . . . . . 29
Independent Auditors’ Report. . . . . . . . . . . . . . . . . . . . . . . . . . . . . . . . . . . . . . . . . . . . . . . . . . . . . . . . . . . . 30
. . . . . . . . . 31
Consolidated Statement of Financial Position. . . . . . . . . . . . . . . . . . . . . . . . . . . . . . . . . . . . . . . . . . . . . . 32
Consolidated Statement of Comprehensive Income. . . . . . . . . . . . . . . . . . . . . . . . . . . . . . . . . . . . . . . . . 34
Consolidated Statement of Changes in Equity. . . . . . . . . . . . . . . . . . . . . . . . . . . . . . . . . . . . . . . . . . . . . . 35
Consolidated Statement of Cash Flows . . . . . . . . . . . . . . . . . . . . . . . . . . . . . . . . . . . . . . . . . . . . . . . . . . . 36
Section V. Factbook. . . . . . . . . . . . . . . . . . . . . . . . . . . . . . . . . . . . . . . . . . . . . . . . . . . . . . . . . . . . . . . . . . . . . . 37

6
Glossary
The following acronyms and abbreviations are used in this document:
ALT Almaty time (GMT + 06:00)
ARA RFCA Agency of the Republic of Kazakhstan on Regulation of Activities of the Regional Financial Center of Almaty
bn Billion
CD Central Securities Depository
CJSC closed joint stock company
CS corporate securities
EBITDA Earnings Before Interest, Taxes, Depreciation and Amortization
EUR euro
Exchange Kazakhstan Stock Exchange Inc.
FGS foreign government securities
FSA Agency of the Republic of Kazakhstan on Regulation and Supervision of Financial Market and Financial Organizations
GAAP Generally Accepted Accounting Principles (applied in USA and some other countries)
GDP gross domestic product (Republic of Kazakhstan, unless otherwise specified)
GS government securities
IAS international accounting standards
IAS / IFRS International Accounting Standards / International Financial Reporting Standards
IFO international financial organization (organizations)
IPO Initial Public Offering
IREIF incorporated real estate investment fund
ISIN International Securities Identification Number
JSC joint stock company
KASE Kazakhstan Stock Exchange Inc.
KASE Group Kazakhstan Stock Exchange Inc. and its affiliates Information Agency for Financial Markets IRBIS LLP and eTrade.kz LLP
KASE Index KASE Index of shares market
KazPrime average value of offering rates of money for deposits announced by best credit quality banks for Kazakhstan
KIBID average value of indicative borrowing rates on inter-bank deposits in Kazakhstan
KIBOR average value of indicative offering rates on inter-bank deposits in Kazakhstan
KIMEAN average value between KIBOR and KIBID
KZT Kazakhstan tenge
LLP limited liability partnership
l/c data are not cited due to the lack of comparability
m Million
MAOKAM government special mid-term treasury obligations of the Ministry of Finance of the Republic of Kazakhstan (with two and three years circulation term) (abbreviation from securities name in Kazakh)
MAOKO government special offsetting treasury obligations of the Ministry of Finance of the Republic of Kazakhstan (with one, two and three years circulation term) (abbreviation from securities name in Kazakh)
MCI monthly calculation index for accounting of pensions, allowances and social payments, and imposing penalties, taxes and other payments in compliance with the legislation of the Republic of Kazakhstan, the value of which is set by laws of the Republic of Kazakhstan on the national budget for corresponding years
MEIJKAM government long-term saving treasury obligations of the Ministry of Finance of the Republic of Kazakhstan (with over five years circulation term), offered among accumulative pension funds (abbreviation from securities name in Kazakh)
MEIKAM government index-linked treasury obligations of the Ministry of Finance of the Republic of Kazakhstan (with three months and over circulation term) (abbreviation from securities name in Kazakh)
MEKAM government treasury obligations of the Ministry of Finance of the Republic of Kazakhstan (abbreviation from securities name in Kazakh)
MEKKAM government short-term treasury obligations of the Ministry of Finance of the Republic of Kazakhstan (with the circulation term up to one year inclusive) (abbreviation from securities name in Kazakh)
MEOKAM government mid-term treasury obligations of the Ministry of Finance of the Republic of Kazakhstan (with the circulation term over one up to five years inclusive) (abbreviation from securities name in Kazakh)

7
If this report does not specify a source reference, it is assumed that KASE used data collected and clas-
sified by its own personnel.
MEUKAM government long-term treasury obligations of the Ministry of Finance of the Republic of Kazakhstan (with over five years circulation term) (abbreviation from securities name in Kazakh)
Ministry of Finance
Ministry of Finance of the Republic of Kazakhstan
MTF KASE KASE main trading floor (as opposed to STF RFCA)
MUIKAM government long-term indexed-linked treasury obligations of the Ministry of Finance of the Republic of Kazakhstan (with over five years circulation term) (abbreviation from securities name in Kazakh)
National Bank, NBK, NB RK
National Bank of the Republic of Kazakhstan
NIN security national identification number assigned in compliance with the legislation of the Republic of Kazakhstan
NWF National Welfare Fund
n/t not traded instrument
PA pension assets
PAIMO pension assets investment management organization (organizations)
pic. Picture
RFCA Regional Financial Center of Almaty
RSE republican state enterprise
RUB Russian ruble
SB subsidiary bank
SBS state-owned block of shares
SPT settlements term, when a deal is executed on the second business day from the day of its conclusion (eng. "spot")
STB second-tier bank (banks)
STF RFCA Special Trading Floor of the Regional Financial Center of Almaty
T+0 see TOD
T+1 see TOM
T+2 see SPT
T+N settlements term, when a deal is executed on an n business day from the day of its conclusion
tab. table
th. thousand
The Strategy Exchange internal document 2007–2010 Kazakhstan Stock Exchange Development Strategy
TOD settlements term, when a deal is executed on the day of its conclusion (eng. "today")
TOM settlements term, when a deal is executed on the next business day from the day of its conclusion (eng. "tomorrow")
TONIA Average interest rate on repo opening deals with one day term on the automatic repo market on government securities of the Republic of Kazakhstan
Trading System, TS
Kazakhstan Stock Exchange trading system
USA United States of America
USD US dollar


Summary of Market Conditions in 2009
I
10
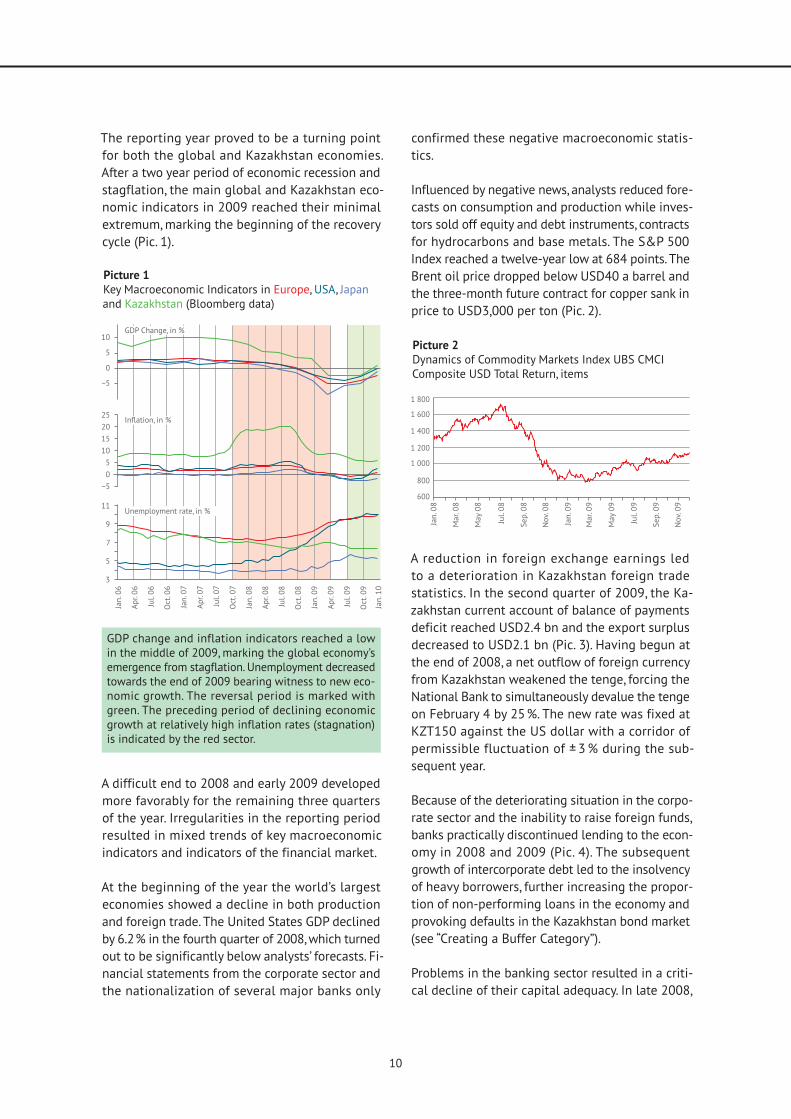
The reporting year proved to be a turning point
for both the global and Kazakhstan economies.
After a two year period of economic recession and
stagflation, the main global and Kazakhstan eco-
nomic indicators in 2009 reached their minimal
extremum, marking the beginning of the recovery
cycle (Pic. 1).
Picture 1
Key Macroeconomic Indicators in Europe, USA, JapanKazakhstan (Bloomberg data)
GDP change and inflation indicators reached a low in the middle of 2009, marking the global economy’s emergence from stagflation. Unemployment decreased towards the end of 2009 bearing witness to new eco-nomic growth. The reversal period is marked with green. The preceding period of declining economic growth at relatively high inflation rates (stagnation) is indicated by the red sector.
confirmed these negative macroeconomic statis-
tics.
Influenced by negative news, analysts reduced fore-
casts on consumption and production while inves-
tors sold off equity and debt instruments, contracts
Brent oil price dropped below USD40 a barrel and
the three-month future contract for copper sank in
price to USD3,000 per ton (Pic. 2).
Picture 2
Dynamics of Commodity Markets Index UBS CMCI Composite USD Total Return, items
A difficult end to 2008 and early 2009 developed
more favorably for the remaining three quarters
of the year. Irregularities in the reporting period
resulted in mixed trends of key macroeconomic
indicators and indicators of the financial market.
At the beginning of the year the world’s largest
economies showed a decline in both production
and foreign trade. The United States GDP declined
by 6.2% in the fourth quarter of 2008, which turned
out to be significantly below analysts’ forecasts. Fi-
nancial statements from the corporate sector and
the nationalization of several major banks only
A reduction in foreign exchange earnings led
to a deterioration in Kazakhstan foreign trade
statistics. In the second quarter of 2009, the Ka-
zakhstan current account of balance of payments
deficit reached USD2.4 bn and the export surplus
decreased to USD2.1 bn (Pic. 3). Having begun at
the end of 2008, a net outflow of foreign currency
from Kazakhstan weakened the tenge, forcing the
National Bank to simultaneously devalue the tenge
on February 4 by 25%. The new rate was fixed at
KZT150 against the US dollar with a corridor of
permissible fluctuation of ± 3 % during the sub-
sequent year.
Because of the deteriorating situation in the corpo-
rate sector and the inability to raise foreign funds,
banks practically discontinued lending to the econ-
omy in 2008 and 2009 (Pic. 4). The subsequent
growth of intercorporate debt led to the insolvency
of heavy borrowers, further increasing the propor-
tion of non-performing loans in the economy and
provoking defaults in the Kazakhstan bond market
(see “Creating a Buffer Category”).
Problems in the banking sector resulted in a criti-
cal decline of their capital adequacy. In late 2008,

Section I. Summary of Market Conditions in 2009
11
Picture 3
Kazakhstan Current Account Balance Indicators Dynamics in 2008 and 2009, bn USD
Picture 4
Total Volume of Issued to the Economy Loans in
Picture 5
Money Market Indicators Dynamics in 2009, % APR
JSC National Welfare Fund Samruk-Kazyna signed
a memorandum of understanding with four stra-
tegic banks, which stipulated the basic principles
of their additional capitalization. In January 2009,
KZT120 bn was deposited into the accounts of JSC
Kazkommertsbank and JSC Halyk Savings Bank of
Kazakhstan. On February 2, the FSA recommended
that Samruk-Kazyna implement additional capi-
talization of BTA Bank through a buy-out of an
additional 29.9 million shares worth KZT251.3 bn
(78.14% of total offered shares). On the same day,
Samruk-Kazyna announced the purchase of 76% of
Alliance Bank’s shares from JSC Financial Corpora-
tion Seimar Alliance and depositing at the bank
of an additional KZT24 bn aimed at supporting
Alliance Bank’s financial sustainability and further
additional capitalization.
The problems of the Kazakhstan economy affected
2009, speculation about the national currency de-
preciation and the unavailability of foreign funds
exacerbated the shortage of short-term tenge li-
quidity. Money market rates in the first quarter of
2009 reached historical maximum values: the TO-
NIA indicator exceeded 19% APR in February and
the quarterly KazPrime was 15% APR (Pic. 5).
Given the negative information and an acute
shortage of liquidity, investors closed long posi-
tions on what were at that time extremely risky
Kazakhstan shares and bonds. By February 2009,
the KASE Index had reached its lowest value since
dynamics were observed from JSC Kazakhtelecom’s
shares of mining companies who faired better than
average market trends included: JSC KAZAKHMYS
A price collapse in the stock market led to the fact
that the cost of repo operations portfolios turned
out to be much less than the cost of obligations
on them. On January 25, 2009, due to tightening of
the Rules of Repo Transactions Execution1, portfo-
lio holders could no longer extend their problem
obligations and in fact turned out to be in default
(see Risk Reduction Measures Section). As a result,
the Kazakhstan nego repo market was affected by
1 KASE internal document “Rules of Repo Transactions Execution”, approved by Kazakhstan Stock Exchange CJSC members’ general
meeting of December 23, 2002.

12
Meanwhile, despite the projected decline in con-
sumer and commodity prices and rising unem-
ployment in the first quarter, there were favor-
able conditions for recovery in Western countries.
In summer 2009, the first positive data were re-
ported by the US and Eurozone. Following second,
third and fourth quarters, GDP growth and inflation
from the leading world economies were showing
improvements, though the unemployment rate in
the US and Eurozone peaked in the fourth quarter
(Pic. 7).
The long-awaited news was positively received by
financial market participants. By the end of Au-
gust 2009, the Bloomberg Professional Confidence
Index indicator exceeded 50 points for the first
time, setting early expectations of rapid economic
growth (Pic. 7). The world’s leading stock indices,
having bottomed out in the second quarter of 2009,
higher than in 2008 (Pic. 8).
The growing demand had positively influenced
commodity markets (Pic. 2). For example, the
Brent oil price stabilized in the fourth quarter at
minimum.
At the time, Kazakhstan had undergone additional
measures under a government supported program
that began in mid-2008. As a result of government
incentives, the economy received over USD10 bn,
Picture 6
KASE Index and Representative List Shares Prices Dynamics in 2009 and 2008, % (01.01.09 = 100)
Picture 7
Dynamics, items
The KASE Index grew in 2009 by 98.2%. Extracting companies were the main growth “source”, whose share price grew following the world prices for oil and metals.
2009, when the portion of overdue obligations
exceeded 25 % of the total volume of open Ka-
zakhstan money market transactions.
Meanwhile, despite the projected decline in con-
sumer and commodity prices and rising unem-
ployment in the first quarter, there were favor-
able conditions for recovery in Western countries.
In summer 2009, the first positive data were re-
ported by the US and Eurozone. Following second,
third and fourth quarters, GDP growth and inflation
from the leading world economies were showing
improvements, though the unemployment rate in
the US and Eurozone peaked in the fourth quarter
(Pic. 7).

Section I. Summary of Market Conditions in 2009
13
which in one form or another remained in the cor-
respondent accounts of banks.
In mid-March 2009, the National Bank of the Re-
public of Kazakhstan launched a mechanism pro-
viding additional short-term liquidity to the worst
off banks: Alliance and BTA. These banks listed their
debt obligations and swapped them for bonds of
the National Welfare Fund Samruk-Kazyna, which
were then used as repo transaction collateral with
the National Bank of the Republic of Kazakhstan.
The Exchange infrastructure has been used in full
to implement this mechanism.
A slowing credit flow of government money into
the economy led to saturation of the money market
in the second half of the year, the TONIA indica-
a decline in attraction to the repo market. Start-
ing in April 2009, the KazPrime indicator steadily
declined to 3% APR by the end of the year (Pic. 5).
Picture 8
World Stock Indices Dynamics in 2009 and 2008, %
growth was facilitated by a recovery in world raw ma-terials markets and positive news and statistics from the USA and European countries. The most positive trends were demonstrated by Russia’s MICEX index in response to a significant rise in prices for hydro-carbons.
The government budget deficit, which totaled
3.1% of the GDP, resulted in an increase in public
debt from 6.3 % GDP to 10.1 % GDP. The Ministry
of Finance actively increased the issue of MEK-
KAM resulting in volume growth in government
securities trading in 2009 by 50% and amounted
to KZT1,408.1 bn.
Kazakhstan’s equity instruments market responded
positively to external and internal news. By year
end, the KASE Index had grown to 98.2% (206.5%
in relation to the annual minimum) and the shares
market capitalization increased by 84.3%. All KASE
Index representative list shares turned out a sur-
plus (Pic. 6). The top leaders here were owners of
common shares of mining companies KAZAKHMYS
PLC (+704 %), EURASIAN NATURAL RESOURCES
CORPORATION (+382%), KazMunaiGas Exploration
Production (+238%), and common shares of Halyk
Savings Bank of Kazakhstan (+381%).
It should also be noted that as a result of joint ac-
tion between the FSA and the Exchange, several
amendments in KASE internal documents aimed
at stabilizing and improving the quality of nego
repo market operations were enacted. By April, it
succeeded in minimizing the volume and number
of new defaults being registered in the exchange
market sector and in the second half, defaults in
this sector were not observed at all (see Risk Re-
duction Measures Section).
The above suggests that 2009 proved to be a year
of positive change. For the first time since autumn
2007, we saw not only signs of stabilization in the
economy and markets, but also the dawn of hope
for future growth.
* * *


Main Events of 2009
IIDuring the year, work continued on implement-
Development Strategy. Its provisions became the
basis for development of the 2009 Action Plan (see
“Corporate Governance Improvement”). However, the
plans and implementation of large projects not
envisioned by the Strategy. Below is a description
2009 in regards to the strategic plan and the anti-
crisis program.
16
KASE Executive Strategy
New Listing Requirements Based on Trading Floors Merger
One of KASE’s main achievements in 2009 was the
implementation of the Legal and Tax Regimens
Dissemination Strategy Regulation related to the
Special Trading Floor of the Regional Financial
Center of Almaty to the entire financial market of
Kazakhstan. This objective was solved on Novem-
ber 9, 2009 through the STF RFCA and MTF KASE
merger.
Taking effect on January 7, 2007, KASE was defined
as the operator of STF RFCA through Order #14
from the ARA RFCA Chairman on December 15,
2006 and the official Kazakhstan stock market was
and MTF KASE.
The market exchange split proved to be inefficient.
In 2007, STF RFCA trade volume was 3.9 % of the
total volume of exchange trading in the shares and
corporate bonds market; in 2008, it was 15.2%. The
existence of two floors trading nearly the same
securities but with various legal and tax regimens
brought uncertainty and questions of listing and
investing into the Kazakhstan stock market.
In March 2007, a Conciliation Committee had been
created to define interactions between ARA RFCA
and KASE. On of the decisions made was to merge
the STF RFCA and MTF KASE trading floors. It was
from this moment that KASE and regulators from
the ARA RFCA and FSA started actively working to
restore market unity.
On January 15, 2008, amendments were made to
“Rules of the Special Trading Floor of the Regional
Financial Center of Almaty Organization and Func-
tioning”, which removed the ban for KASE category
“A”2 members to become members of other catego-
ries and vice versa. It was the first step towards
the merger.
2 Entitled to participate in all being circulated (traded) on STF RFCA instruments trading.
3
4
Owing to activities of the working group created
in October 2007 for STF RFCA and MTF KASE in or-
and September 1, 2008 two new documents took
effect:
ARA RFCA Chairman Order #04.2-09/119 “On
Requirements for Issuers, whose Securities
are Admissible or Admitted to the Official
List of the Special Trading Floor of the Re-
gional Financial Center of Almaty, and for such
Securities”3 on May 8, 2008;
FSA Board Resolution # 77 “On Requirements
for Issuers and their Securities Admissible (Ad-
mitted) to Circulation on Stock Exchange, and
for Stock Exchange List Certain Categories”4
on May 26, 2008.
This order and resolution established a new struc-
ture of official lists and listing requirements for the
STF RFCA and MTF KASE, respectively. Thus, most
of the work implemented on unifying the listing
requirements of the two floors allowed for the last
However, the difficult situation in the Kazakhstan
financial market in the first half of 2009 neces-
sitated the need for three amendments to both
the order and the resolution. The most significant
ones were:
setting a value to which an issuer’s equity
capital decreases if his/her shares are in the
official list’s highest categories (effective until
July 1, 2012);
loosening requirements for an issuer’s net
profit:
for shares located in the official list’s first
category (effective until July 1, 2012);
for inclusion of shares into the second ca-
tegory and debt securities into the “Non-
rated Debt Securities” category, as well as
for these securities located in these ca-
tegories;
removing requirements for a market-maker

Section II. Main Events of 2009
17
presence in debt securities, included in the
“Non-rated Debt Securities” second subcat-
egory;
supplementing debt securities sector with the
buffer category (see Section “Creating a Buffer
Category“);
establishing a list of events in which an is-
suer securities are liable to unconditional de-
listing;
establishing additional requirements for equity
investment funds and new requirements for
real estate funds.
The Board of Directors developed and approved the
new “Rules of Kazakhstan Stock Exchange Trading
Floor Functioning as the Special Trading Floor of
the Regional Financial Center of Almaty” on July 30.
Within this document to STF RFCA, all KASE main
trading floor elements were relegated, except for
those intended for foreign currencies trade. This
document also retained specific legal and tax regi-
mens for transactions on the stock market between
organizations who are RFCA participants.
At the same time the Exchange developed a new
version of the Listing Rules, approved by the Board
of Directors on November 5 and on the same day
was approved by FSA and ARA RFCA. The new List-
ing Rules cover all recent amendments in Kazakh-
stan legislation concerning listing requirements as
well as KASE experience on listing procedures im-
plementation gained over the last twelve years.
The principal innovation behind the Listing Rules
was to use the Exchange’s credit ratings from cred-
it agencies as eligibility criteria of debt securities
and their issuers’ compliance with listing require-
ments and existence of requirements for rating
agencies, whose ratings KASE takes in account
when implementing listing procedures.
On November 9, 2009, the Rules of Kazakhstan
Stock Exchange Trading Floor Functioning as the
Special Trading Floor of the Regional Financial
Center of Almaty, the new Listing Rules, and the
official list of the merged KASE and RFCA trad-
ing floor securities (approved by the Listing Com-
mission on October 30) took effect. Subsequently,
the old Rules of the Special Trading Floor of the
Regional Financial Center of Almaty Organization
and Functioning, approved on December 28, 2006,
expired.
Thus, as of November 9, 2009, STF RFCA and MTF
KASE ceased to exist and the merged trading
floor started functioning, regulated by the order,
the resolution and the new listing rules (Factbook,
table 61). This brought to an end more than two
years of work by KASE, FSA and ARA RFCA on res-
toration unity to the official securities market and
upgrading requirements for this market and its
participants.
Concentration of Bid and Ask on Illiquid Shares
On May 12, 2009, the Exchange Board of Directors
decided to carry out an experiment from June 1 to
October 1 and reduced the trading day on illiquid
shares to two hours (from 15:00 to 17:00 ALT). In
compliance with liquidity criteria approved by the
Exchange Board of Directors, 51 shares fell into
the illiquid shares category and 28 shares fell into
the liquid category.
On October 29, based on experiment results, the
Exchange Board of Directors decided to extend
the experiment until December 1, 2009 and subse-
quently put into operation the new illiquid shares
trading mode. On December 1, 2009, the Manag-
ing Board decided to amend the “Regulations of
Trades and Confirmation System Operation”5 docu-
ment, which officially shortened the trading day for
illiquid stocks to two hours on January 1, 2010.
On December 1, 2009, the Exchange Board of
Directors adopted new Methods of Determining
Liquidity Securities, which established a procedure
for compiling quarterly liquid and illiquid stock
lists to be used together with the Regulations. In
the first quarter of 2010, the illiquid stocks list
contained 73 stocks and the liquid stocks list
included 10.
Reduction of Frankfurt Trading Method Use in Stock Trading
Amendments to regulations were introduced De-
cember 1, 2009 concerning the case list of standby
5

18
mode when trading stocks. From this date, stock
trades were transferred to standby mode, during
which time they are conducted with the Frankfurt
trading method. In this way, there is no overlap or
intersection of price bids for the sale and purchase
of shares. The only exception is if the price of the
proposed transaction differs from the last trade of
those shares by 10 % for liquid and 5 % for non-
liquid stocks or in the absence of transactions in
these shares within 15 or more calendar days.
This innovation brought the KASE market closer to
the standards of developed world markets and in
the opinion of the KASE Managing Board, should
facilitate share liquidity in the Stock Exchange
trading.
Introduction of Closing Auctions
On September 29, 2009, the Exchange Managing
Board approved amendments to the Regulations,
which set forth the possibility of transfer by order-
driven market trade in the Frankfurt auction model
15 minutes prior to the end of the trading day with
this auction closing at a randomly chosen time.
The Frankfurt trading method uses a very similar
end of trading session as those used by other
large foreign exchanges. This mechanism helps
to minimize the possibility of price manipulation
at the last second and contributes to a more
representative value of closing prices.
Auction closings were launched by KASE starting
on October 5, 2009 for all trading of stocks
admitted in the Exchange. Auctions start at
over to the Frankfurt trading mode, which then
closes at a randomly selected time between 16:58
and 17:00 ALT.
Expanding the List of Available Instruments for KASE Members
The December 1, 2010 amendments to the Regula-
tions set forth new financial trading instruments
for the foreign currencies market. The following
instruments emerged on the Kazakhstan exchange
currency market on December 14, 2009:
euro settled in tenge on the second wor-
EURKZT_SPT);
euro settled in US dollars on the day of the
euro settled in US dollars on the next
EURUSD_TOM);
euro settled in US dollars on the second
EURUSD_SPT).
Transactions done in euros and settled in tenge
also became available in currency swap transac-
tions:
currency swap transactions consisting of euro
buy/sell transactions liable to satisfaction on
the trading day and, at the same time, conclude
in this transaction a cross euro buy/sell deal
in the same quantity with satisfaction to the
second of these deals on the next working day
following the trading day (EURKZT_0_001);
currency swap transactions consisting of euro
buy/sell transactions liable to satisfaction on
the trades day and, at the same time, conclude
in this transaction a cross euro buy/sell deal in
the same quantity with satisfaction to the sec-
ond of these deals on the second working day
following the trading day (EURKZT_0_002);
currency swap transactions consisting of euro
buy/sell transactions liable to satisfaction on
the next working day following the trading
day and, at the same time, conclude in this
transaction a cross euro buy/sell deal in the
same quantity with satisfaction to the second
of these deals on the second working day fol-
lowing the trading day (EURKZT_1_002).
The above instruments and transactions were
launched to increase affordable and professional
participant instruments as well as to improve the
attractiveness and competitiveness of the ex-
change market segment.
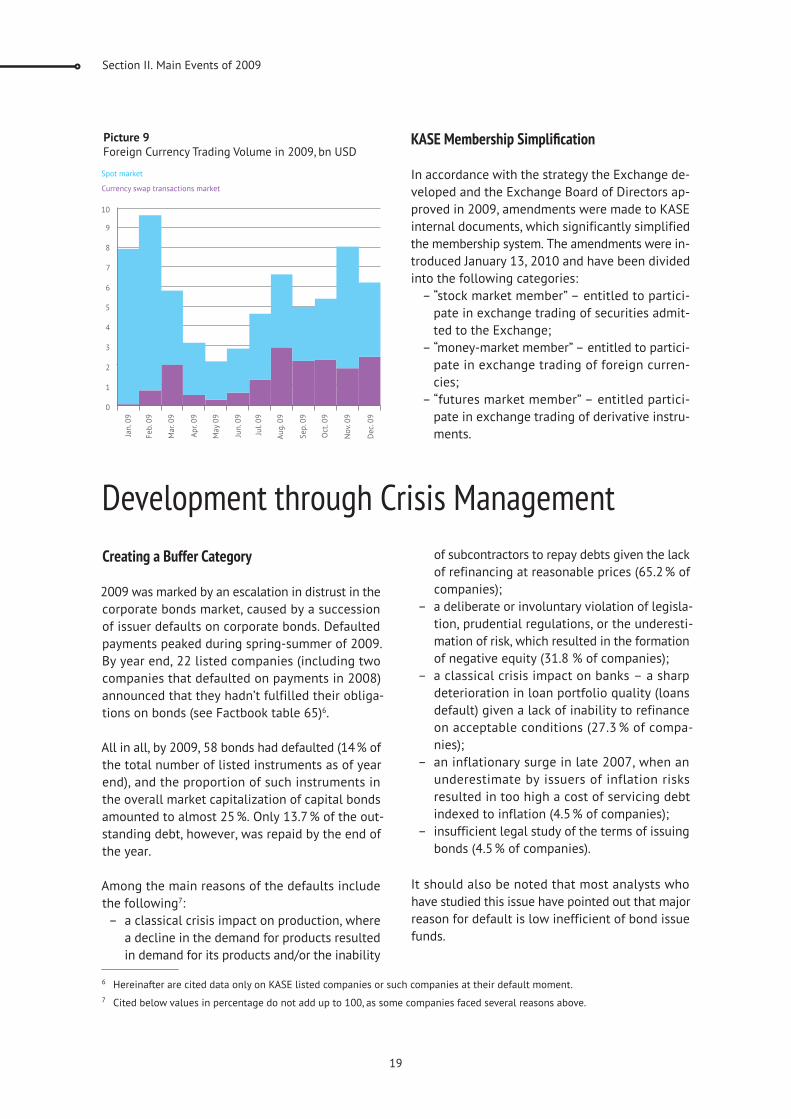
It should be emphasized that the reporting year
revealed high interest from KASE members in the
currency exchange transactions at the end of 2008
(in 2008, US-dollar currency exchange transactions
became accessible). These operations accounted
for about 26% of the foreign currency trading vol-
ume in 2009 (Pic. 9).
Section II. Main Events of 2009
19
Picture 9
Foreign Currency Trading Volume in 2009, bn USD
In accordance with the strategy the Exchange de-
veloped and the Exchange Board of Directors ap-
proved in 2009, amendments were made to KASE
internal documents, which significantly simplified
the membership system. The amendments were in-
troduced January 13, 2010 and have been divided
into the following categories:
“stock market member” -
pate in exchange trading of securities admit-
ted to the Exchange;
“money-market member” -
pate in exchange trading of foreign curren-
cies;
“futures market member” -
pate in exchange trading of derivative instru-
ments.
Development through Crisis Management
Creating a Buffer Category
2009 was marked by an escalation in distrust in the
corporate bonds market, caused by a succession
of issuer defaults on corporate bonds. Defaulted
payments peaked during spring-summer of 2009.
By year end, 22 listed companies (including two
companies that defaulted on payments in 2008)
announced that they hadn’t fulfilled their obliga-
tions on bonds (see Factbook table 65)6.
All in all, by 2009, 58 bonds had defaulted (14% of
the total number of listed instruments as of year
end), and the proportion of such instruments in
the overall market capitalization of capital bonds
amounted to almost 25%. Only 13.7% of the out-
standing debt, however, was repaid by the end of
the year.
Among the main reasons of the defaults include
the following7:
a classical crisis impact on production, where
a decline in the demand for products resulted
in demand for its products and/or the inability
of subcontractors to repay debts given the lack
of refinancing at reasonable prices (65.2% of
companies);
a deliberate or involuntary violation of legisla-
tion, prudential regulations, or the underesti-
mation of risk, which resulted in the formation
of negative equity (31.8 % of companies);
deterioration in loan portfolio quality (loans
default) given a lack of inability to refinance
on acceptable conditions (27.3 % of compa-
nies);
an inflationary surge in late 2007, when an
underestimate by issuers of inflation risks
resulted in too high a cost of servicing debt
indexed to inflation (4.5% of companies);
insufficient legal study of the terms of issuing
bonds (4.5% of companies).
It should also be noted that most analysts who
have studied this issue have pointed out that major
reason for default is low inefficient of bond issue
funds.
6 Hereinafter are cited data only on KASE listed companies or such companies at their default moment.
7 Cited below values in percentage do not add up to 100, as some companies faced several reasons above.

20
In this situation, the state securities market regu-
regulations determining the official list of the Ex-
change and set forth requirements for the securi-
ties and also for the securities issuers. With the
introduction of these amendments8, the structure
of the debt securities sector was supplemented
by a new buffer category, which made transfers of
corporate debt securities in the following cases:
non-compliance of securities and their issuers
with mentioned legal acts requirements that
need to be observed for securities presence
in other categories of the debt securities sec-
tor;
an issuer default on interest;
restructuring the obligations of an issuer.
In accordance with these amendments, the manda-
tory transfer of securities into the buffer category
is developed by the issuer and approved by its
Board of Directors’ (an established issuer supervi-
sory committee in another, apart from a joint stock
company business) plan for eliminating grounds
for securities transfer into the buffer category.
In this case, the transfer of securities into the buf-
fer category was carried out in 2009 only in the
event that the KASE Listing Commission made a
decision on accepting the mentioned plan and
with the mandatory approval by the Exchange
Board of Directors. Otherwise, securities were
subject to delisting on KASE.
Amendments also established that the maximum
period of securities being listing in the buffer cat-
egory can not exceed 12 months. After that time,
subject to this plan, securities are returned to the
debt securities official list category (subcatego-
ry) with which they comply. If an issuer fails to
implement the plan, the securities are subject to
delisting.
The amendments described in this section were
primarily introduced to, first of all, protect the in-
terests of the investor, since listing securities in
the buffer category does not absolve them from
listing requirements, including information disclo-
sure requirements. They also oblige the initiator of
the report to regularly report to the Exchange on
the progress of implementing the aforementioned
plan. Information on such securities and their is-
suer is public, but securities remain accessible on
the official market.
In addition, in the event that the causes for trans-
ferring the securities to the buffer category are
eliminated, these securities may return to the debt
securities official list category of the Exchange.
In 2009, the KASE Listing Commission reviewed
the plans of action that addresses the reasons for
transferring securities to the buffer category for 20
listed companies. As a result, five companies were
subject to delisting while 15 companies were put
in the buffer category.
Risk Reduction Measures
The year was full of events that changed the Ka-
zakhstan financial market and facilitated its re-
organization. The global financial crisis exposed
weaknesses and forced KASE to take a look at the
existing market infrastructure from a new angle.
Ethical issues affected weaknesses in monitoring
systems and in control of market risks.
Throughout the year, KASE conducted legislative
and regulatory activities together with FSA aimed
at reducing existing risks and bringing the local
financial market into line with internationally
accepted standards. The strategic goal of all the
amendments was to create a basis for qualitative
and quantitative development of all sectors of the
post-crisis stock market.
Changes in the Repo Transaction Market Rules
The most significant changes have affected the
repo transactions market, the most problematic
segment of the exchange market in 2009. After un-
8 Amendments to the FSA Board Resolution “On the Requirements for Issuers and their Securities Authorized to Stock Exchange Trading and to Individual Categories of the Stock Exchange” on May 26, 2008 # 77 and were effective from August 20, 2009.
the Special Trading Floor of the Regional Financial Center of Almaty, and for other such Securities” on May 8, 2008 # 04.2-09/119, effective September 20, 2009.

Section II. Main Events of 2009
21
controlled use of the sector by market professional
participants and their clients9 in financial pyramids
and “short” selling schemes, this exchange market
was under the pressure of sharply increased credit
risk. The main reason for this was accounted for
by an unprecedented landslide of repo transac-
solvency related problems for companies, the main
reasons of which are described in the Creating a
Buffer Category section.
The first persistent alarms sounded in autumn
2008, when, under the pressure of a sharp fall in
prices, the market significantly increased the por-
tion of prolonged repo transactions. December 18,
2008 marked the first case of repo transaction de-
fault, which occurred for this exact reason. By late
March, the proportion of defaults in the nego repo
transactions market exceeded 25% of the cost of
liabilities open at that time, while the proportion
of obligations with extended terms was 13%.
On January 1, 2009, amendments were made to the
“Rules of Repo Transactions Execution” to solve
problems related to non-performance of transac-
tions in the repo market. In accordance with these
amendments, the maximum allowed term for auto
repo transactions was reduced to 30 days. This was
approved January 8, 2009 by the Exchange Board
of Directors and on January 25, the following were
put into effect:
set the maximum term for nego repo trans-
actions at 90 days, considering all possible
extensions;
banned extensions for auto repo transac-
tions.
On April 1, 2009, amendments to the Specifications
of Auto Repo Market10 came into force, which were
made to reduce risks linked to the collateral of
repo transactions. The necessity of these amend-
ments has been caused by defaults of corporate
bonds as well as reduced levels of transparency
and disclosure of issuer information. From this
date, it was banned to use the following as col-
lateral of repo transaction:
securities whose issuer failed to pay interest
and/or the principal amount of its debt securi-
ties and/or dividends on preferred shares in a
timely manner;
securities whose admittance initiator signifi-
cantly violated information disclosure require-
ments set out by the Listing Rules and/or the
Listing Agreement.
The significant event of the year was the approval
of the “Agreement on General Term of Nego Repo
Transactions Execution”
Board of Directors on May 28, 2009. The agree-
ment was drafted to be the legal framework for
the introduction of the mark-to-market system in
on nego repo transactions as well as the calcula-
tion and transfer of compensation payments in the
event of critical price change for repo transaction
collateral. The mark-to-market system being a
developed market attribute allows timely detec-
tion and efficient leveling of almost all risks that
occur on the nego repo market.
Implementation of the above measures on the
money market regulation by KASE and FSA proved
to be efficient: since mid-July 2009, there have
been no new obligations defaults.
Improvement of Settlement Procedures
During 2009, KASE was working to improve the
quality of settlements and related risks in the stock
market. This work was especially important in light
of ongoing events to attract both local and foreign
investors to the domestic stock market. Statistics
results for 2009 show a high level of settlement
risks across virtually all market sectors of KASE.
In 2009, for instance, 10 out of 10 leading ranked
companies in the corporate bonds and shares mar-
ket failed to fulfill their payment obligations: In
the repo market, it was 7 out of 10 and in the GS
market, 6 out of 10.
The working group continued to work on the im-
plementation of a T+N guaranteed settlements
9 Primarily nego repo transactions.
10
December 24, 2002 #137/0.

22
system. As a result, the group developed a concept
and then a plan for implementation in two phases:
the first phase stipulates implementation of full
pre-deposit (advance delivery) system for the T+0
scheme, which would serve as a basis for intro-
duction of the TN guaranteed settlements system
implementation in the second phase.
Trading Suspension as Prices Dive
In order to ensure compliance with the FSA Reso-
lution #170 (“On Approval of Rules of Activities of
Organizers of Securities and Other Financial Instru-
ments Trading”), the “Rules of Securities Exchange
Trading”11 amendments were approved on January
8, 2009 and enacted on January 25. According to
these amendments:
if the share price of any denomination listed
in the Exchange as first category is reduced
by 30% or more, KASE automatically suspends
trade on these shares;
if the KASE Index value reduces by 15 % or
more against the index’s final value for the
last or next to last trading day, KASE automati-
cally suspends trading in all stocks listed in
the Exchange12.
If no other instructions from FSA are received,
trading is suspended until the beginning of the
next trading day.
Throughout the year, KASE suspended trading
shares of certain denominations 19 times, includ-
ing three times due to technical errors. Trade was
never suspended due to a crucial change in the
KASE Index.
11 KASE internal document “Rules of Securities Exchange Trading”, approved by the Directorate Resolution of Kazakhstan National Securities Commission of October 26, 1999 # 462.
12 The part of the above mentioned internal document is cited considering amendments of February 11, 2009.
13
On April 30, 2009, the KASE Board of Directors
elected K. Damitov as the new KASE President for
a two-year term. Before K. Damitov, this position
had been held by A. Zholdasbekov.
Prior to being elected president of KASE, K. Dami-
tov held positions in leading companies of Ka-
zakhstan, was the Chairman of the Boards for Ertis
National Company Social and Entrepreneurship
Corporation, worked as an advisor to the President
of the Republic of Kazakhstan and was Chairman
of the National Bank of the Republic of Kazakh-
stan.
Priorities for the new President include improving
corporate governance, streamlining and improving
internal corporate business processes, furthering
development of the Exchange and developing the
securities market infrastructure.
Improvement of Corporate Governance
Transition to Main Business Processes Planning
At the beginning of the year, per instruction of the
Exchange Board of Directors, the KASE Managing
Board developed an action plan for 200913, ap-
proved by the Board of Directors on March 5 and
by the KASE Managing Board on March 25, 2009.
For the first time in Exchange history, its activities
were being carried out in accordance with a plan
approved by the managing body.
The plan was developed in compliance with the
Kazakhstan Stock Exchange Development Strategy
-
ment areas as well as used procedures and tech-
nologies for improvement of the Exchange. The
Managing Board submitted monthly reports to the
Exchange Board of Directors on implementation
of plan-related issues. On January 28, 2010, the
Section II. Main Events of 2009
23
Exchange Board of Directors accepted the final
report on the execution of the plan.
Preparation for Introduction of an Employee Performance Assessment System
In 2009, as a result of studying several employee
performance appraisal concepts used internation-
ally and domestically, the Exchange Managing
Board and the Board of Directors developed and
agreed on “Procedure for Evaluation of Kazakhstan
Stock Exchange Employees’ Performance”. On De-
cember 31, 2009, the Managing Board approved
the document and put it into operation beginning
January 1, 2010.
Thus, as a result of KASE activities in 2009, a
mechanism was employed to evaluate employee’s
performance as well as evaluate each unit as a
whole. Assessment is done on a monthly basis
using the performance indicators set forth in the
aforementioned document.
Creation of an Internal Audit Service and Audit Committee
As part of its strategy to improve corporate gover-
nance, KASE undertook measures in 2009 aimed
at promoting and strengthening internal control
and improving transparency.
In June 2009, the Internal Audit Service hired a
specialist with more than 10 years of work experi-
ence in the financial sector, including nine years
of management experience and two years as head
of an internal audit service in one of the leading
foreign banks in the Republic of Kazakhstan.
In August, an Internal Audit Committee was created
by the Exchange Board of Directors. According to
the corporate governance recommended standards
and in order to achieve unbiased and independent
performance, the Committee was formed mainly
of Exchange Board of Directors members and not
KASE executive office members. The Committee
was headed by an independent director of the Ex-
change.
During 2009, the Internal Audit Service internally
audited financial statements from affiliated RTRS
LLP, the Exchange’s assets inventory and invest-
ment, as well as developed a plan for audits for the
first and second quarters of 2010, which cover the
highest risk areas of KASE main activities.
In order to increase transparency of the Exchange’s
corporate structure and to avoid potential conflict
of interest, the Exchange undertook actions in 2009
to gain full control over its two affiliates.
On August 27, the Exchange Board of Directors de-
cided to buy back the 48.8% stake in eTrade.kz LLP
held by four Exchange employees. On November
26, the Exchange Board of Directors decided to
purchase from Kenes Service LLP a 20 % stake in
the Information Agency for Financial Markets IRBIS.
Both deals were closed in the reporting year.
In addition to the aforementioned, the KASE Man-
aging Board initiated amendments to the by-laws
of the Information Agency for Financial Markets IR-
BIS, changing the partnership management struc-
ture. On December 24, 2009, the Exchange Board of
Directors approved amendments whereby compli-
ance with partnership activities must be controlled
by a Supervisory Council, which consisted of three
KASE chief executive officers. The first members
of the Supervisory Council were elected by the
Exchange Board of Directors for a two year term
on January 28, 2010. The council was composed
of the KASE President and two members from the
Exchange Board of Directors.


2009 Financial Results
III
26
14
compared with the corresponding 2008 period.
Assets and Liabilities14 Analysis
Income and Expenses Analysis
As of December 31, 2009, the Exchange assets to-
taled KZT1,808.6 m, or 26.7% higher than the pre-
vious year. Asset growth is mainly due to retained
earnings for the reporting period, most of which
the Exchange accumulated in the form of short-
term assets. Cash and equivalents doubled in 2009
from KZT452.6 m to KZT906.6 m and constituted
almost half of all Exchange assets, or 87.6% of the
amount of short-term assets.
In 2009, incoming cash flows received from operat-
ing activities were accumulated to form additional
reserves that the Exchange could use to cover all
necessary incidental expenses and to accumulate
sufficient funds to purchase its own building, al-
lowing the Exchange to save substantially on rent
costs (see below).
The Exchange income made up KZT1,297.6 m in
2009; 17.5 % higher than the previous year. In-
come from operating activities (pic. 10) increased
by 25.6 % to KZT1,197.0 m, of which 90 % came
from commission, listing and membership fees. The
Exchange commission fees structure is shown on
pic. 11.
Income from Membership Fees
Membership fees increased 7.4 % during the re-
porting period from KZT198.9 m (22.4 % of rev-
enue) to KZT213.6 m (18.9%). This revenue growth
was a result of an increase in MCI (the basis for
membership fees calculation) by 8.9%, while the
number of Stock Exchange members decreased
from 98 to 83. This is explained by a withdrawal
of some member companies who were category “ ”
Exchange members (due to the merger between
STF RFCA and MTF KASE) and the discontinuation
of some brokerage firms.
It should also be noted that due to the Exchange’s
long-term investment goals, its portfolio has been
reclassified in the 2009 balance sheet from “finan-
cial assets available for sale” to “held to maturity”.
In 2009, the portion of financial assets held to
maturity was 26.7% of total assets of the Exchange
(in 2008 the portion of available for sale assets
made up 23.7%).
In 2009, the Exchange’s long-term liabilities con-
sisted only of deferred tax liabilities with a volume
that did not exceed KZT15.0 m. The long-term debt
to assets ratio for the year was 0.8 % with a long-
term debt to capital ratio of 0.9 %. At the same
time, net income received in 2009 in the amount of
KZT369.7 m increased its equity capital by 27.5%
to KZT1,717.3 m.
Income from Listing Fees
Despite the decline in the total number of listed
companies in 2009 from 144 to 127, the number of
listed corporate securities on the KASE official list
increased by the end of the year to 415 (up from
376 the previous year). Because of this and other
non-recurring events (see below), the amount of
introductory and annual listing fees in 2009 in-
creased by 44.1%, reaching KZT390.4 m. Positive
impact on the amount of listing fees also helped
to unify listing in 2008 and the merger of STF
RFCA and MTF KASE in 2009, which finally cast
light on listing and investing related issues in the
Kazakhstan stock market. At the same time, there
was a substantial adverse effect on a number of
listed debt securities (and consequently the listing
fees volume), creating a “crisis of confidence”, as
some companies failed to fulfill obligations. This
factor affected funding costs on the local market,
increasing values to levels unacceptable to the

Section III. 2009 Financial Results
27
Picture 10
Structure of Exchange Proceeds of Activity in 2009 and 2008
Picture 11
Exchange Commission Fees in 2009 and 2008
majority of domestic securities issuers.
Income from Commission Fees
As a result of unfavorable conditions in the do-
mestic stock market between the second half of
2008 and the first half of 2009, investment outflow
to other assets type or foreign markets were ob-
served. Toughening of rules in the closely-related
equity market and nego repo transactions sector
also affected the situation (see Brief Description of
Market Conditions in 2009), which eventually lim-
ited participants ability to exercise in short sales
and leveraged trades.
As a result, commission fees from buy-sell transac-
tions in equity instruments (excluding transactions
concluded in special trade mode) decreased by
40.6% to KZT52.0 m with trade volume declining
by 45.1%.
Trading declines in corporate bonds by 12.1% were
offset by increasing the proportion of nego deals
in these securities from 1.0% to 2.0%, resulting in
an increase of commission fees from this market
by 2.8%.
Commission fees in the government securities
market grew by 84 % to KZT142.9 m (30 % of all
commission fees), which resulted from three main
reasons: relatively high issuing activity from the
Ministry of Finance, increased demand for instru-
ments with minimum risk (see Summary of Market
Conditions in 2009) and an increase in GS trading
volume by 50.1%.
Provision of funds to the banks under the govern-
ment support program coupled with the slowing
economy has impacted the decrease of rates and
trade volume in the repo market. During most of
2009, the Kazakhstan financial market saw an ex-
cess of tenge liquidity, resulting in the amount of
commission fees from the repo transactions market
(excluding the income on annulled transactions)
totaling KZT73.4 m, which is 39.6% below 2008
levels15.
Income from Non-recurring Events
It should be noted that in 2009, non-recurring
events had a significant impact on KASE financial
activities results.
During the year, several bond issues were listed on
the KASE which were not circulated on the open
market and were used as the collateral of repo
transactions when problem banks got liquidity
from the National Bank of the Republic of Ka-
zakhstan. In 2009, the aggregated listing fees on
these issues made up KZT96.9 m, while the total
income for the Exchange from entry and listing
fees made up KZT390.4 m. In other words, almost
25% of income from listing fees for the year fell on
specific securities which were de-facto not traded
on the KASE.
In addition, KASE collected KZT101.4 m in com-
mission fees from annulled repo transactions. This
revenue resulted from a series of defaults on nego
repo transactions, which in turn triggered high
credit as well as market and settlement risks in the
15 The commission fee size depends on both the transaction volume and repo rate size..

28
first half of 2009, largely caused by amendments
to the Rules of Repo Transactions Execution (see
Risk Reduction Measures). In the event of proce-
dural closure of the mentioned repo transactions,
KASE income might have been less.
It should also be reminded that on November 25,
2009, KASE held special auctions for the sale of
Central Asia Petroleum Ltd stock in Mangistau-
venture between KazMunaiGaz National JSC and
CNPC Exploration and Development Company Ltd.
The deal was for KZT387.6 bn and the commission
fees from this transactions totaled KZT19.4 m, or
24.7 % of all commission fees on the exchange
shares market.
All these developments are considered by the Ex-
change as non-recurring events with a low prob-
ability of reoccurrence in the future. The total in-
come from them is estimated at KZT217.7 m, which
is 16.8% of the total revenue of KASE in 2009.
As a result of KASE income growth by 17% and
a decrease in expenses by 11.8 % in 2009, the
consolidated net income of the Exchange grew
The return on assets (ROA) in 2009 was 20.4 %
(8.5% in 2008) and the return on equity (ROE) was
Expenses
In 2009, the Exchange took efforts to decrease op-
erating expenses. As a result of these efforts, the
Exchange management succeeded in decreasing
the front-office rental payment by approximately
39%. In 2008, this line-item constituted about 32%
of all expenses; in 2009, the rental payment por-
tion decreased to 22% (Pic. 12). As a result, overall
expenses were reduced by 11.8% to KZT841.5 m.
Picture 12
Exchange Expenses Structure in 2009 and 2008
Key Financial Activity Indicators
21.5% (9.0%). ROE growth was made possible due
to improvement of net profit margins from 10.9 %
to 28.4% at relatively low financial leverage indi-
In addition, during the reporting year, the Exchange
had a good liquid position. The cash ratio was
11.9x, whereas the current ratio is 13.6x (6.6x and
10.1x in 2008, respectively).

The Group Y2009 Consolidated Financial Statements
IV

30
To Kazakhstan Stock Exchange shareholders
March 31, 2010
We have audited the accompanying consolidated financial statements for shareholders of Kazakhstan
December 31, 2009, the income statement, cash flow statement and statement of changes in equity for
years ended as of the mentioned dates, and the summary of significant accounting policies and other
explanatory notes.
Management’s Responsibility for the Consolidated Financial StatementsThe Group management is responsible for the preparation and fair presentation of the consolidated finan-
cial statements in accordance with International Financial Reporting Standards (IFRS). This responsibility
includes designing, implementing and maintaining internal control relevant to the preparation and fair
presentation of financial statements that are free from material misstatement, whether due to fraud or
error; selecting and applying appropriate accounting policies; and making accounting estimates that are
reasonable in the circumstances.
Auditor’s ResponsibilityOur responsibility is to express an opinion on these financial statements based on our audit. We conducted
our audit in accordance with International Standards of Auditing. Those standards require that we comply
with ethical requirements and plan, and perform the audit to obtain reasonable assurance whether the
financial statements are free from material misstatement.
An audit involves performing procedures to obtain evidence about the amounts and disclosures in the
consolidated financial statements. The procedures selected depend on the auditor’s judgment, including
the assessment of the risks of material misstatement of the consolidated financial statements, whether due
to fraud or error. In making those risk assessments, the auditor considers internal control relevant to the
entity’s preparation and fair presentation of the consolidated financial statements in order to design audit
procedures that are appropriate in the circumstances, but not for the purpose of expressing an opinion on
the effectiveness of the entity’s internal control. An audit also includes evaluating the appropriateness
of accounting policies used and the reasonableness of accounting estimates made by the management,
as well as evaluating the overall presentation of the consolidated financial statements.
We believe that the audit evidence we have obtained is sufficient and appropriate to provide a basis for
our audit opinion.
OpinionIn our opinion the consolidated financial statements present fairly, in all material respects, the financial
position of Kazakhstan Stock Exchange as of December 31, 2009 and of its financial performance and its
cash flow for years, ended as of the mentioned dates, in accordance with International Financial Report-
ing Standards.
Independent Auditors’ Report
Auditor’s certificate of competence No 497, issued by Kazakhstan Qualifications Commission on Auditors’ Certification on 18.01.2000.
Auditor R. Taipova

Section IV. The Group Y2009 Consolidated Financial Statements
31
President K. Damitov
Chief Accountant L. Ryabushkina
Statement of Responsibility for Preparation
is responsible for preparation of the consolidated financial statements assert the KASE financial state-
ments as on the end of December 31, 2009 reliably reflect in all important aspects its activities results,
cash flows and changes in equity for 2009 in compliance with the International Financial Reporting
Standards (IFRS).
In preparing the consolidated financial statements the KASE management is responsible for:
selecting suitable accounting principles and applying them consistently
making judgments and estimates that are reasonable and prudent
observing the IFRS requirements or disclosing significant deviations from IFRS in notes to the con-
solidated financial statements
preparation of the consolidated financial statements based on the assumption that KASE will continue
as a going concern in foreseeable future, excluding cases when such assumption is illegal
The KASE management is also responsible for:
designing, implementing and maintaining of an efficient and reliable KASE internal control system
maintaining proper accounting records which enable them, with reasonable accuracy at any time,
to prepare information on the KASE financial position and to ensure that the consolidated financial
statements of KASE comply with the IFRS requirements
maintaining statutory accounting records in compliance with the legislation of the Republic of
Kazakhstan
undertaking measures within its competence to protect KASE assets
detecting and preventing frauds and misuse
These financial statements have been approved by the KASE management in the person of the President
and Chief Account.
32
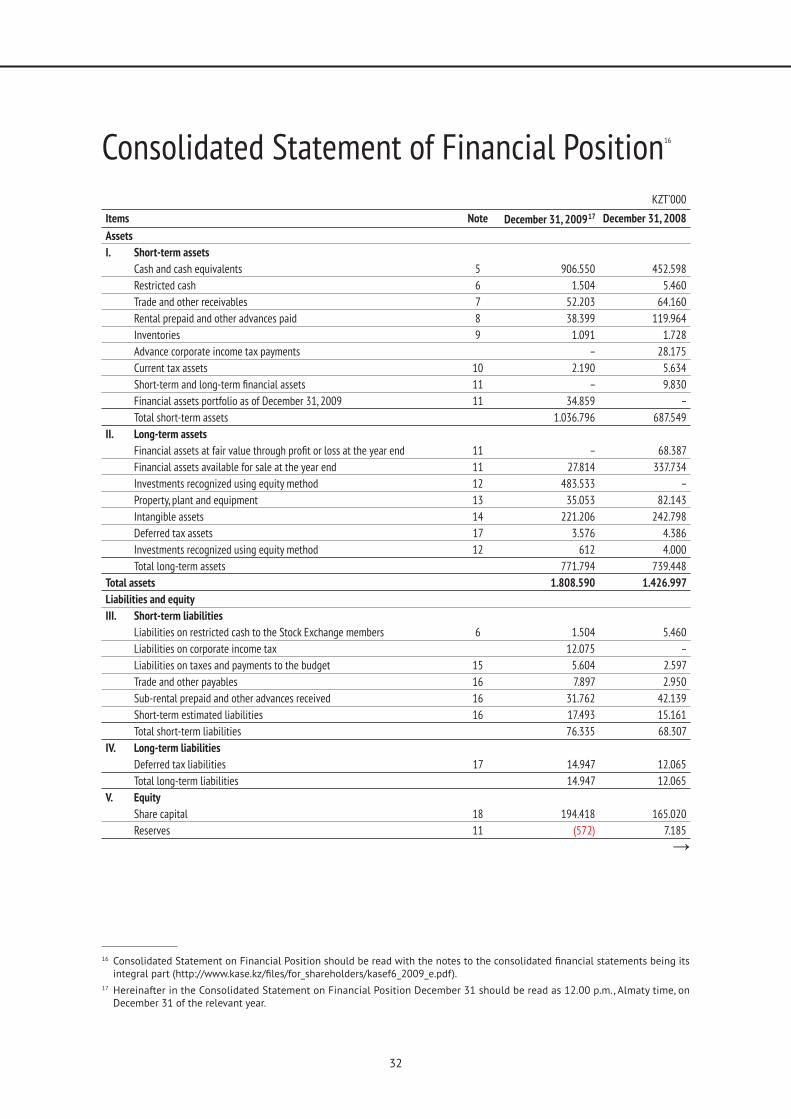
Items Note December 31, 200917 December 31, 2008
Assets
I. Short-term assets
Cash and cash equivalents 5 906.550 452.598
Restricted cash 6 1.504 5.460
Trade and other receivables 7 52.203 64.160
Rental prepaid and other advances paid 8 38.399 119.964
Inventories 9 1.091 1.728
Advance corporate income tax payments – 28.175
Current tax assets 10 2.190 5.634
11 – 9.830
Financial assets portfolio as of December 31, 2009 11 34.859 –
Total short-term assets 1.036.796 687.549
II. Long-term assets
11 – 68.387
Financial assets available for sale at the year end 11 27.814 337.734
Investments recognized using equity method 12 483.533 –
Property, plant and equipment 13 35.053 82.143
Intangible assets 14 221.206 242.798
Deferred tax assets 17 3.576 4.386
Investments recognized using equity method 12 612 4.000
Total long-term assets 771.794 739.448
Total assets 1.808.590 1.426.997
Liabilities and equity
III. Short-term liabilities
Liabilities on restricted cash to the Stock Exchange members 6 1.504 5.460
Liabilities on corporate income tax 12.075 –
Liabilities on taxes and payments to the budget 15 5.604 2.597
Trade and other payables 16 7.897 2.950
Sub-rental prepaid and other advances received 16 31.762 42.139
Short-term estimated liabilities 16 17.493 15.161
Total short-term liabilities 76.335 68.307
IV. Long-term liabilities
Deferred tax liabilities 17 14.947 12.065
Total long-term liabilities 14.947 12.065
V. Equity
Share capital 18 194.418 165.020
Reserves 11 (572) 7.185
16
17 Hereinafter in the Consolidated Statement on Financial Position December 31 should be read as 12.00 p.m., Almaty time, on December 31 of the relevant year.
KZT’000
Consolidated Statement of Financial Position16

Section IV. The Group Y2009 Consolidated Financial Statements
33
KZT’000
Retained earnings 1.523.462 1.159.251
Minority interest – 15.169
Total equity 1.717.308 1.346.625
Total liabilities and equity 1.808.590 1.426.997
Consolidated Statement of Financial Position (continuation)
President K. Damitov
Chief Accountant L. Ryabushkina

34
18
Consolidated Statement of Comprehensive Income18
Items Note 2009 2008
Income from operating activities 21 1.196.993 953.242
Income from rentals 60.968 130.450
Other income 11.251 8.820
21 (2.709) 6.158
4.271 6.206
Penalties, forfeits received 26.858 24.159
– (24.270)
Total income 1.297.632 1.104.765
Salary expenses and provisions for vacations (383.540) (398.581)
Taxes and other payments to the budget (63.628) (81.795)
Amortization (36.292) (32.482)
Travel and entertainment expenses (17.382) (24.343)
Expenses on communication and Internet (16.753) (17.099)
Materials write-off (8.974) (13.122)
(6.309) (5.815)
Rent (186.406) (306.191)
Net loss from property, plant and equipment sold (1.863) (132)
Financial consultants services – (12.100)
Other expenses 22 (120.365) (62.082)
Total expenses (841.512) (953.742)
Operating income for the period 456.120 151.023
Interest income 23 55.829 29.203
Deposit interest income 23 27.558 565
Interest expenses 23 (326) (381)
Interest income for the period 83.061 29.387
(47.090) (4.468)
Income before tax 492.091 175.942
Corporate income tax expenses 17 (122.421) (54.784)
Net income for the period 369.670 121.158
Other comprehensive income/loss (7.757) 7.185
361.913 128.343
361.913 128.343
369.670 115.435
– 5.723
Earnings per share (basic and diluted), tenge 20 820,29 257,52
President K. Damitov
Chief Accountant L. Ryabushkina

Section IV. The Group Y2009 Consolidated Financial Statements
35
Consolidated Statement of Changes in Equity19
Share capital20 Treasury stock Revaluation surplus21
Retained earnings22
Minority interest
Total
As of December 31. 20023 165.020 (2.567) (16.179) 1.043.816 11.091 1.201.181
Treasury shares sold in the reporting period
– 2.567 – – – 2.567
Change in securities value available for selling
– – (906) – – (906)
Loss, earlier recognized in capital from – – 24.270 – – 24.270
Retained earnings of the reporting period
– – – 115.435 5.723 121.158
Dividends – – – – (1.645) (1.645)
As of December 31.2008 165.020 – 7.185 1.159.251 15.169 1.346.625
Own shares additionally offered in the reporting period
29.398 – – – – 29.398
Minority stake acquisition – – – (5.459) (13.528) (18.987)
Minority stake decrease in authorized capital
– – – – (1.115) (1.115)
Aggregate income of the reporting period
– – (7.757) 369.670 – 361.913
Dividends – – – – (526) (526)
As of December 31. 2009 194.418 – (572) 1.523.462 – 1.717.308
19
20 Share capital is a total cost of offered shares at offering value.21 -
egory.22 Retained earnings is the accumulated income of the Group (Kazakhstan Stock Exchange Inc. and its subsidiaries).23 Hereinafter in the consolidated balance sheet December 31 should be read as 12.00 p.m., Almaty time, on December 31 of the
relevant year.
KZT’000
President K. Damitov
Chief Accountant L. Ryabushkina

36
24
KZT’000
Items 2009 2008
Cash flows from operating activities
Income before tax 492.091 175.943
Adjustment of net income 94.475 (150.800)
including: 36.292 32.482
amortization (4.271) (6.206)
1.863 132
loss from property, plant and equipment disposals 2.709 (6.158)
326 381
(55.829) (29.203)
Accrued income on deposits (19.588) –
share in income (loss) of entities recognized using equity method 47.090 4.468
– 24.270
65.292 –
increase in inventories 637 1.826
increase in trade and other receivables, rental prepaid and other advances paid 93.522 21.181
increase (decrease) in sub-rental prepaid and other advances received (10.377) (13.396)
increase (decrease) in taxes payable 6.451 (2.505)
increase (decrease) in trade and other receivables, short-term estimated liabilities 7.279 2.043
increase (decrease) in liabilities on restricted cash to the Stock Exchange members (3.956) (137.196)
corporate income tax paid (72.965) (42.919)
586.566 25.143
Cash flows from investing activities
Purchase of PPE and intangible assets (16.269) (100.648)
Proceeds from PPE and intangible assets sold 567 –
(1.213.305) (858.762)
Proceeds from disposal 1.005.920 1.150.160
Financial assets interest received 40.995 28.292
Deposits interest received 16.650 –
3.956 137.196
(161.486) 356.238
Cash flows from financing activities
Proceeds from share offering 29.398 –
Proceeds from treasury shares sold – 2.567
Dividends paid to minority (526) (1.645)
28.872 922
Net increase in cash and cash equivalents 453.952 382.303
Cash and cash equivalents at the beginning of the year 452.598 70.295
Cash and cash equivalents at the end of the year 906.550 452.598
Consolidated Statement of Cash Flows24
President K. Damitov
Chief Accountant L. Ryabushkina

Factbook
V

38

39
Contents:
Shares and Shareholders . . . . . . . . . . . . . . . . . . . . . . . . . . . . . . . . . . . . . . . . . . . . . . . . . . . . . . . . . . . . . . . . . . . 40
KASE Members. . . . . . . . . . . . . . . . . . . . . . . . . . . . . . . . . . . . . . . . . . . . . . . . . . . . . . . . . . . . . . . . . . . . . . . . . . . . 41
Kazakhstan Exchange Market Performance in 2009 . . . . . . . . . . . . . . . . . . . . . . . . . . . . . . . . . . . . . . . . . . . . 45
Equities . . . . . . . . . . . . . . . . . . . . . . . . . . . . . . . . . . . . . . . . . . . . . . . . . . . . . . . . . . . . . . . . . . . . . . . . . . . . . . . . . . 48
Corporate Bonds . . . . . . . . . . . . . . . . . . . . . . . . . . . . . . . . . . . . . . . . . . . . . . . . . . . . . . . . . . . . . . . . . . . . . . . . . . 60
Treasury Bills. . . . . . . . . . . . . . . . . . . . . . . . . . . . . . . . . . . . . . . . . . . . . . . . . . . . . . . . . . . . . . . . . . . . . . . . . . . . . . 76
IFO Bonds . . . . . . . . . . . . . . . . . . . . . . . . . . . . . . . . . . . . . . . . . . . . . . . . . . . . . . . . . . . . . . . . . . . . . . . . . . . . . . . . 85
Repo. . . . . . . . . . . . . . . . . . . . . . . . . . . . . . . . . . . . . . . . . . . . . . . . . . . . . . . . . . . . . . . . . . . . . . . . . . . . . . . . . . . . . 85
Currency . . . . . . . . . . . . . . . . . . . . . . . . . . . . . . . . . . . . . . . . . . . . . . . . . . . . . . . . . . . . . . . . . . . . . . . . . . . . . . . . . 92
Interbank Deposit Indicators . . . . . . . . . . . . . . . . . . . . . . . . . . . . . . . . . . . . . . . . . . . . . . . . . . . . . . . . . . . . . . . 96
Reference Information . . . . . . . . . . . . . . . . . . . . . . . . . . . . . . . . . . . . . . . . . . . . . . . . . . . . . . . . . . . . . . . . . . . . . 97
Notes to Factbook . . . . . . . . . . . . . . . . . . . . . . . . . . . . . . . . . . . . . . . . . . . . . . . . . . . . . . . . . . . . . . . . . . . . . . . . 129

40
Shares and Shareholders
Shareholder Shares held Shares outstanding, %
Regional Financial Center of Almaty JSC 55,200 12.05
24,000 5.24
SUBSIDIARY BANK KAZAKHSTAN ZIRAAT INTERNATIONAL BANK JSC 18,000 3.93
Centras Capital LLP 12,538 2.74
Upravlenie proektami LLP 12,538 2.74
Subsidiary of Kazkommertsbank JSC - Kazkommerts Securities JSC 12,369 2.70
Bank CenterCredit JSC 12,266 2.68
Registratorskaya sistema tsennykh bumag JSC 12,266 2.68
VISOR Holding LLP 12,266 2.68
Investment Financial House RESMI JSC 12,000 2.62
Subsidiary Bank RBS Kazakhstan JSC 12,000 2.62
Astana-Finance JSC 11,244 2.46
Centras Securities JSC 6,402 1.40
VISOR Capital JSC 6,268 1.37
Subsidiary of Halyk Bank of Kazakhstan JSC - Halyk Finance JSC 6,268 1.37
Subsidiary of Halyk Bank of Kazakhstan JSC - Accumulative Pension Fund of Halyk Bank of Kazakhstan JSC
6,268 1.37
AQUALUX LLP 6,268 1.37
CAIFC Company JSC 6,183 1.35
Seven Rivers Capital JSC 6,180 1.35
Halyk Savings Bank of Kazakhstan JSC 6,134 1.34
BCC Invest JSC - Subsidiary of Bank CenterCredit JSC 6,133 1.34
HOMEBROKER JSC 6,133 1.34
Alliance Bank JSC 6,133 1.34
Subsidiary of BTA Bank JSC - BTA Securities JSC 6,133 1.34
Kazkommertsbank JSC 6,133 1.34
State Accumulative Pension Fund SAPF JSC 6,133 1.34
Nurbank JSC 6,133 1.34
Tengry Finance JSC 6,133 1.34
Tsesna Capital JSC 6,133 1.34
Tsesnabank JSC 6,133 1.34
Subsidiary of Kazkommertsbank JSC - Pension Assets Investment Management Company GRANTUM Asset Management JSC
6,133 1.34
Subsidiary Bank HSBC Bank Kazakhstan JSC 6,133 1.34
KAUZHAR LLP 6,133 1.34
SENIM-BANK JSC 6,010 1.31
Delta Bank JSC 6,000 1.31
Alan Securities JSC 6,000 1.31
6,000 1.31
ATFBank JSC 6,000 1.31
Subsidiary of Bank Apoalim B.M. - BankPositive JSC 6,000 1.31
Development Bank of Kazakhstan JSC 6,000 1.31
BTA Bank JSC 6,000 1.31
DB Securities (Kazakhstan) JSC 6,000 1.31
Kazinvestbank JSC 6,000 1.31
Citibank Kazakhstan JSC 6,000 1.31
Table 1
KASE shareholders as on January 1, 2010
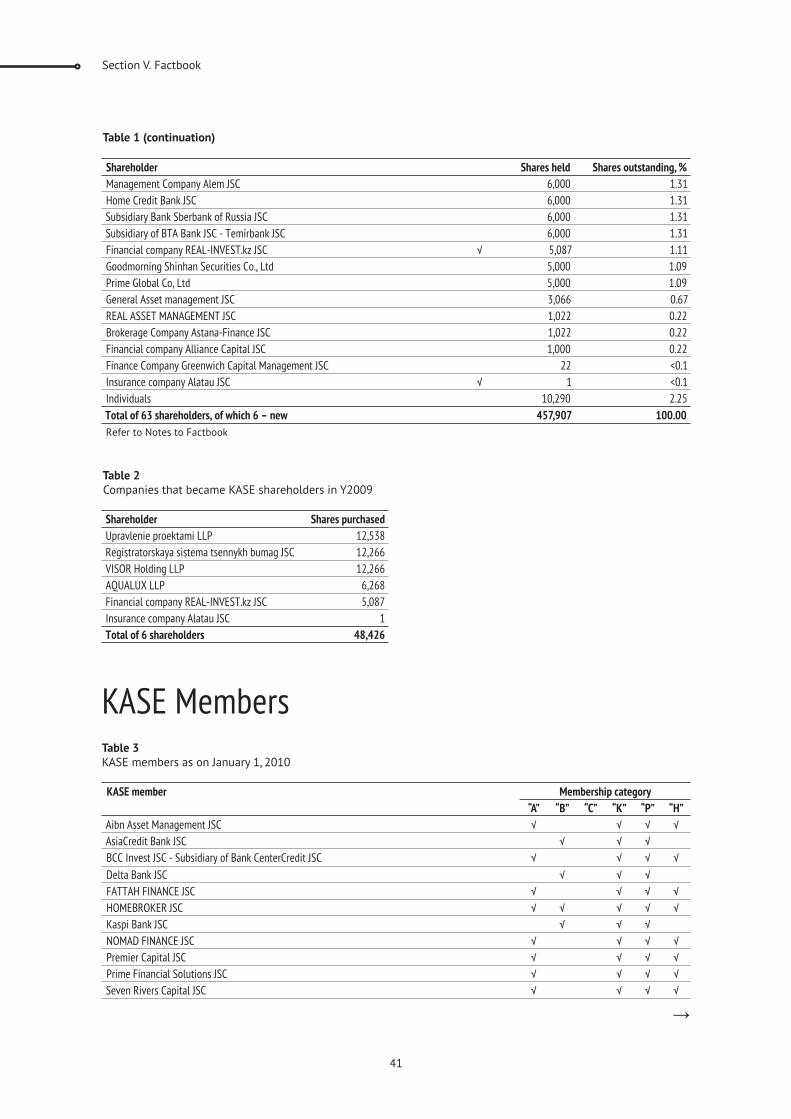
Section V. Factbook
41
Shareholder Shares held Shares outstanding, %
Management Company Alem JSC 6,000 1.31
Home Credit Bank JSC 6,000 1.31
Subsidiary Bank Sberbank of Russia JSC 6,000 1.31
Subsidiary of BTA Bank JSC - Temirbank JSC 6,000 1.31
Financial company REAL-INVEST.kz JSC 5,087 1.11
Goodmorning Shinhan Securities Co., Ltd 5,000 1.09
Prime Global Co, Ltd 5,000 1.09
General Asset management JSC 3,066 0.67
REAL ASSET MANAGEMENT JSC 1,022 0.22
Brokerage Company Astana-Finance JSC 1,022 0.22
Financial company Alliance Capital JSC 1,000 0.22
Finance Company Greenwich Capital Management JSC 22 <0.1
Insurance company Alatau JSC 1 <0.1
Individuals 10,290 2.25
Total of 63 shareholders, of which 6 – new 457,907 100.00
Refer to Notes to Factbook
Shareholder Shares purchased
Upravlenie proektami LLP 12,538
Registratorskaya sistema tsennykh bumag JSC 12,266
VISOR Holding LLP 12,266
AQUALUX LLP 6,268
Financial company REAL-INVEST.kz JSC 5,087
Insurance company Alatau JSC 1
Total of 6 shareholders 48,426
Table 1 (continuation)
Table 2
Companies that became KASE shareholders in Y2009
KASE MembersTable 3
KASE members as on January 1, 2010
KASE member Membership category
“A” “B” “C” “K” “P” “H”
Aibn Asset Management JSC
AsiaCredit Bank JSC
BCC Invest JSC - Subsidiary of Bank CenterCredit JSC
Delta Bank JSC
FATTAH FINANCE JSC
HOMEBROKER JSC
Kaspi Bank JSC
NOMAD FINANCE JSC
Premier Capital JSC
Prime Financial Solutions JSC
Seven Rivers Capital JSC

42
KASE member Membership category
“A” “B” “C” “K” “P” “H”
Smart Group JSC
Unicorn IFC JSC
VISOR Capital JSC
VOSTOK CAPITAL JSC
Zurich Invest Management JSC
Alibi Securities JSC
Alliance Bank JSC
ASYL-INVEST JSC
ATFBank JSC
Development Bank of Kazakhstan JSC
Bank CenterCredit JSC
Subsidiary of Bank Apoalim B.M. - BankPositive JSC
Brokerage Company Astana-Finance JSC
BTA Bank JSC
Verny Capital JSC
SB Securities (Kazakhstan) JSC
SUBSIDIARY BANK KAZAKHSTAN ZIRAAT INTERNATIONAL BANK JSC
Subsidiary of BTA Bank JSC - BTA Securities JSC
Subsidiary of Nurbank JSC - MONEY EXPERTS JCS
Subsidiary of Halyk Bank of Kazakhstan JSC - Halyk Capital JSC
Subsidiary of Halyk Bank of Kazakhstan JSC - Halyk Finance JSC
Eurasian Bank JSC
Eurasian Capital JSC
Housing Construction Savings Bank of Kazakhstan JSC
Investment Financial House RESMI JSC
Investments Company CenterInvest JSC
Information-Registration Center JSC
IFG CONTINENT JSC
Kazakhstan Finservice JSC
Kazakhstan Innovative Commercial Bank JSC
Kazinvestbank JSC
Kazkommerts Securities JSC(Subsidiary of Kazkommertsbank JSC)
Kazkommertsbank JSC
Kazpost JSC
CAIFC Company JSC
State Accumulative Pension Fund SAPF JSC
Accumulative Pension Fund of Halyk Bank of Kazakhstan JSC - Subsidiary of Halyk Bank
Halyk Savings Bank of Kazakhstan JSC
Nurbank JSC
Pension Assets Investment Management Company GRANTUM Asset Management JCS (Subsidiary of Kazkommertsbank JSC)
Pension Assets Investment Management Company ZHETYSU JSC
Pension Assets Investment Management Company Orleu JSC
Open Accumulative Pension Fund Otan JSC(Subsidiary of ATFBank JSC)
Renaissance Capital Investments Kazakhstan JSC
SENIM-BANK JSC
Centras Securities JSC
Table 3 (continuation)

Section V. Factbook
43
Table 3 (continuation)
KASE member Membership category
“A” “B” “C” “K” “P” “H”
Citibank Kazakhstan JSC
Tengry Finance JSC
Thor Invest JSC
Troika Dialog Kazakhstan JSC
Management Company Asia Capital JSC
Management Company Alem JSC
Management Company Alfa-Trust JSC
Management Company ASYL-INVEST JSC
Financial Company Greenwich Capital Management JSC
Financial Company REAL-INVEST.kz JSC
Financial Company Alliance Capital JSC
Home Credit Bank JSC
Tsesna Capital JSC
Tsesnabank JSC
Eximbank Kazakhstan JSC
Subsidiary Bank RBS (Kazakhstan) JSC
Subsidiary Bank Alfa-Bank JSC
Subsidiary Bank China Bank Kazakhstan JSC
Almaty Financial Center JSC
Accumulative Pension Fund Kazakhmys JSC
Management Company ORDA Capital JSC
State institution National Bank of Republic of Kazakhstan
Subsidiary Bank HSBC Bank Kazakhstan JSC
Subsidiary Bank Sberbank of Russia JSC
Subsidiary of ATFBank JSC - ATF Finance JSC
Subsidiary of BTA Bank JSC - Temirbank JSC
Total of 83 members 41 31 7 79 79 44
Table 4
KASE membership changes in Y2009
KASE member Date:
admission withdrawal
Category “A”
BCC Invest JSC - Subsidiary of Bank CenterCredit JSC Jan 29, 2009
Premier Capital JSC Feb 26, 2009
VISOR Investment Solutions JSC Feb 27, 2009
Centras Financial LLP Feb 27, 2009
MAG Capital LLP Feb 27, 2009
Kazkommerts Invest RFCA LLP Feb 27, 2009
Almaty Investment Management JSC Mar 27, 2009
Capitalist Securities JSC Mar 27, 2009
Zurich Invest Management JSC Apr 30, 2009
AIM Capital JSC May 4, 2009
Global Securities (Kazakhstan) JSC May 4, 2009
RESMI Investment House Almaty LLP May 29, 2009
GLOTUR INVEST JSC Jul 31, 2009
REAL-INVEST RFCA (Kazakhstan) JSC Jul 31, 2009
Alan Securities JSC Jul 31, 2009

44
KASE member Date:
admission withdrawal
Asia Broker Services JSC Aug 28, 2009
BCC Securities JSC - Subsidiary of Bank CenterCredit JSC Aug 28, 2009
Aibn Asset Management JSC Oct 1, 2009
The Royal Bank of Scotland Securities (Kazakhstan) JSC Oct 30, 2009
Total in category “A” 4 15
VISOR Investment Solutions JSC Feb 27, 2009
Almaty Investment Management JSC Mar 27, 2009
Zurich Invest Management JSC Apr 30, 2009
Global Securities (Kazakhstan) JSC May 4, 2009
GLOTUR INVEST JSC Jul 31, 2009
REAL-INVEST RFCA (Kazakhstan) JSC Jul 31, 2009
Alan Securities JSC Jul 31, 2009
KAZEXPORTASTYK-SECURITIES JSC Jul 31, 2009
FATTAH FINANCE JSC Aug 27, 2009
Asia Broker Services JSC Aug 28, 2009
Aibn Asset Management JSC Oct 1, 2009
The Royal Bank of Scotland Securities (Kazakhstan) JSC Oct 30, 2009
Astana-Finance JSC Oct 30, 2009
3 10
Category “P”
VISOR Investment Solutions JSC Feb 27, 2009
Almaty Investment Management JSC Mar 27, 2009
Zurich Invest Management JSC Apr 30, 2009
Global Securities (Kazakhstan) JSC May 4, 2009
GLOTUR INVEST JSC Jul 31, 2009
REAL-INVEST RFCA (Kazakhstan) JSC Jul 31, 2009
Alan Securities JSC Jul 31, 2009
KAZEXPORTASTYK-SECURITIES JSC Jul 31, 2009
FATTAH FINANCE JSC Aug 27, 2009
Asia Broker Services JSC Aug 28, 2009
Aibn Asset Management JSC Oct 1, 2009
The Royal Bank of Scotland Securities (Kazakhstan) JSC Oct 30, 2009
Astana-Finance JSC Oct 30, 2009
Total in category “P” 3 10
Category “H”
VISOR Investment Solutions JSC Feb 27, 2009
Almaty Investment Management JSC Mar 27, 2009
Zurich Invest Management JSC Apr 30, 2009
Global Securities (Kazakhstan) JSC May 4, 2009
GLOTUR INVEST JSC Jul 31, 2009
REAL-INVEST RFCA (Kazakhstan) JSC Jul 31, 2009
Alan Securities JSC Jul 31, 2009
KAZEXPORTASTYK-SECURITIES JSC Jul 31, 2009
FATTAH FINANCE JSC Aug 27, 2009
Asia Broker Services JSC Aug 28, 2009
Aibn Asset Management JSC Oct 1, 2009
The Royal Bank of Scotland Securities (Kazakhstan) JSC Oct 30, 2009
Astana-Finance JSC Oct 30, 2009
Table 4 (continuation)

Section V. Factbook
45
KASE member Date:
admission withdrawal
Total in category “H” 3 10
Category “B”
Financial Company REAL-INVEST.kz JSC Mar 26, 2009
Total in category “B” 1 0
Category “C”
Financial Company REAL-INVEST.kz JSC Mar 26, 2009
Total in category “C” 1 0
Table 4 (continuation)
Table 5
KASE members in terms of categories
Table 6
Exchange market structure in recent 10 years (bn USD) and comparison of exchange traded value with Kazakhstan GDP
Category Jan 1, 2009 Jan 1, 2010 Entitled to trade
“A” 52 41 all instruments, circulating (trading) on STF RFCA
“B” 30 31 currency
“C” 6 7 futures contracts circulating (trading) on KASE
“K” 86 79 GS, including municipal bonds
“P” 86 79 CS (including foreign), listing on KASE; IFO bonds; foreign GS circulating (trading) on KASE
“H” 51 44 ‘Unlisted securities’ admitted to KASE, state-owned shareholding of privatized organizations
Total 98 83
Kazakhstan Exchange Market Performance
Exchange market sector Y2000 Y2001 Y2002 Y2003 Y2004 Y2005 Y2006 Y2007 Y2008 Y2009
Equities 0.1 0.1 0.3 0.4 1.0 1.0 4.0 8.9 3.8 4.3
% of GDP 0.4 0.7 1.4 1.4 2.4 1.9 5.2 8.5 2.9 4.0
Notes – – <0.1 <0.1 – – – <0.1 – –
% of GDP – – <0.1 <0.1 – – – <0.1 – –
Currency 1.7 2.0 3.0 6.4 9.4 12.0 41.7 91.4 138.9 67.7
at exchange turnover 1.7 2.0 3.0 6.4 9.4 12.0 41.7 91.4 138.9 85.3
% of GDP 9.5 8.9 12.1 21.4 22.9 21.6 54.3 87.5 105.5 63.3
Foreign GS – – – – – <0.1 <0.1 <0.1 – –
% of GDP – – – – – <0.1 <0.1 <0.1 – –
Kazakhstan GS 1.2 1.5 2.0 2.4 5.6 4.8 6.6 8.1 7.8 9.4
% of GDP 6.4 7.0 7.9 7.9 13.5 8.5 8.6 7.7 5.9 8.8
Corporate bonds <0.1 0.2 0.3 0.6 0.9 1.7 3.0 4.3 3.6 2.6
% of GDP 0.3 0.8 1.1 2.0 2.1 3.1 3.9 4.1 2.8 2.5
IFO bonds – <0.1 – – <0.1 <0.1 – – – –
% of GDP – <0.1 – – <0.1 <0.1 – – – –

46
Exchange market sector Y2000 Y2001 Y2002 Y2003 Y2004 Y2005 Y2006 Y2007 Y2008 Y2009
Repo (GS and CS) 1.0 3.0 9.2 10.8 21.2 30.5 58.0 104.3 109.1 71.6
at exchange turnover 2.0 5.9 18.3 21.5 42.0 60.8 114.0 209.8 217.0 144.1
% of GDP 5.6 13.4 37.2 36.1 51.5 54.5 75.6 99.8 82.8 66.9
Futures contracts 0.1 0.5 0.8 2.5 <0.1 – – – <0.1 –
% of GDP 0.4 2.4 3.4 8.2 <0.1 – – – <0.1 –
Total 4.1 7.3 15.5 23.1 38.1 50.0 113.4 217.1 263.2 155.7
at exchange turnover 5.2 10.2 24.6 33.8 59.0 80.4 169.3 322.5 371.1 245.7
% of GDP 22.5 33.0 63.0 77.1 92.4 89.5 147.6 207.7 199.9 145.5
GDP, bn USD 18.3 22.2 24.6 29.9 41.2 55.9 76.8 104.5 131.7 107.0
Refer to Notes to Factbook
Table 6 (continuation)
Picture 1
Structure and exchange market in Y2009 in terms of months (traded value, trillions KZT)
Picture 2
(bn USD) and comparison with Kazakhstan GDP

Section V. Factbook
47
Exch
ange
mar
ket s
egm
ent
bn K
ZTm
USD
Y200
8Y2
009
Tren
dY2
008
Y200
9Tr
end
Valu
e%
Valu
e%
Valu
e%
Valu
e%
Valu
e%
Valu
e%
Equi
ties
460.
31.
563
7.6
2.8
+177
.3+3
8.5
3,82
5.9
1.5
4,30
0.7
2.8
+474
.7+1
2.4
Curr
ency
16,7
08.7
52.8
9,87
9.0
43.5
138,
874.
052
.767
,725
.743
.5
incl
udin
g:
spot
-mar
ket
16,7
08.1
52.8
7,24
3.6
31.9
138,
869.
052
.750
,173
.232
.2
swap
-mar
ket
0.6
<0.1
2,63
5.4
11.6
5.0
<0.1
17,5
52.5
11.3
at e
xcha
nge
turn
over
1.2
<0.1
5,27
1.0
14.7
10.0
<0.1
35,1
05.0
14.3
Kaza
khst
an G
S93
8.4
3.0
1,40
8.1
6.2
+469
.7+5
0.1
7,80
4.8
3.0
9,44
3.2
6.1
+1,6
38.4
+21.
0
incl
udin
g:
prim
ary
mar
ket
465.
21.
569
8.1
3.1
+233
.0+5
0.1
3,86
8.9
1.5
4,65
8.7
3.0
+789
.7+2
0.4
seco
ndar
y m
arke
t47
3.2
1.5
710.
03.
1+2
36.8
+50.
03,
935.
81.
54,
784.
53.
1+8
48.7
+21.
6
Corp
orat
e bo
nds
439.
11.
438
6.1
1.7
3,65
2.0
1.4
2,63
7.6
1.7
Repo
(GS
and
CS)
13,1
25.0
41.4
10,4
09.8
45.8
109,
155.
441
.571
,552
.146
.0
at e
xcha
nge
turn
over
26,1
05.4
58.5
20,9
67.3
58.4
217,
107.
858
.514
4,05
3.7
58.6
incl
udin
g:
nego
repo
in G
S17
3.7
0.5
120.
90.
51,
444.
30.
581
3.1
0.5
at e
xcha
nge
turn
over
333.
40.
723
7.5
0.7
2,77
2.1
0.7
1,60
4.7
0.7
auto
repo
in G
S10
,382
.732
.88,
919.
439
.386
,356
.932
.861
,226
.539
.3
at e
xcha
nge
turn
over
20,6
80.9
46.3
17,8
90.8
49.8
172,
011.
046
.312
2,75
0.5
50.0
nego
repo
in C
S84
9.6
2.7
753.
03.
37,
064.
02.
75,
162.
33.
3
at e
xcha
nge
turn
over
1,66
9.4
3.7
1,53
5.5
4.3
13,8
79.3
3.7
10,5
27.7
4.3
auto
repo
in C
S1,
719.
05.
461
6.6
2.7
14,2
90.1
5.4
4,35
0.3
2.8
at e
xcha
nge
turn
over
3,42
1.7
7.7
1,30
3.6
3.6
28,4
45.4
7.7
9,17
0.7
3.7
Futu
res
cont
ract
s0.
1<0
.1–
–0.
4<0
.1–
–X
X
Tota
l tra
ded
valu
e31
,671
.510
0.0
22,7
20.6
100.
026
3,31
2.6
100.
015
5,65
9.3
100.
0
at e
xcha
nge
turn
over
44,6
51.9
35,9
13.7
371,
265.
024
5,71
3.3
Tab
le 7
KA
SE
tra
ded
val
ue a
nd
mar
ket
stru
ctu
re, Y
20
08
vs.
Y2
00
9
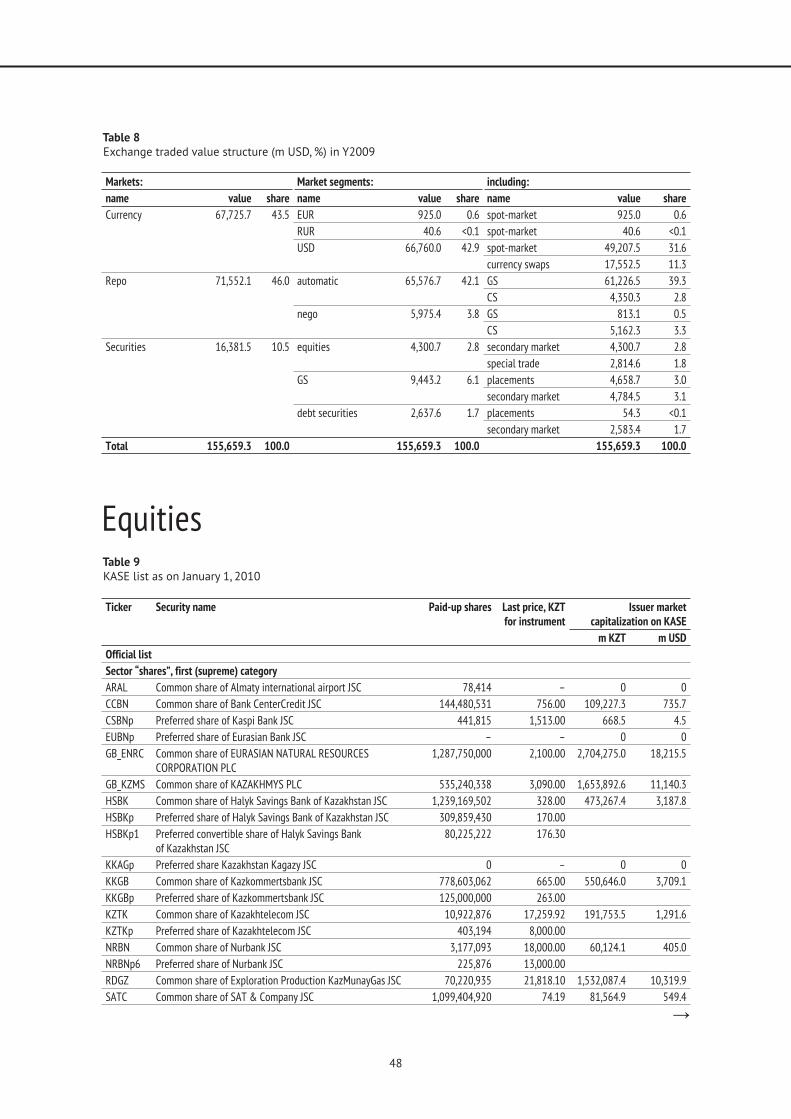
48
Table 8
Exchange traded value structure (m USD, %) in Y2009
Table 9
KASE list as on January 1, 2010
Equities
Ticker Security name Paid-up shares Last price, KZT for instrument
Issuer market capitalization on KASE
m KZT m USD
Official list
Sector “shares”, first (supreme) category
ARAL Common share of Almaty international airport JSC 78,414 – 0 0
CCBN Common share of Bank CenterCredit JSC 144,480,531 756.00 109,227.3 735.7
CSBNp Preferred share of Kaspi Bank JSC 441,815 1,513.00 668.5 4.5
EUBNp Preferred share of Eurasian Bank JSC – – 0 0
GB_ENRC Common share of EURASIAN NATURAL RESOURCES CORPORATION PLC
1,287,750,000 2,100.00 2,704,275.0 18,215.5
GB_KZMS 535,240,338 3,090.00 1,653,892.6 11,140.3
HSBK Common share of Halyk Savings Bank of Kazakhstan JSC 1,239,169,502 328.00 473,267.4 3,187.8
HSBKp Preferred share of Halyk Savings Bank of Kazakhstan JSC 309,859,430 170.00
HSBKp1 Preferred convertible share of Halyk Savings Bank 80,225,222 176.30
KKAGp Preferred share Kazakhstan Kagazy JSC 0 – 0 0
KKGB Common share of Kazkommertsbank JSC 778,603,062 665.00 550,646.0 3,709.1
KKGBp Preferred share of Kazkommertsbank JSC 125,000,000 263.00
KZTK Common share of Kazakhtelecom JSC 10,922,876 17,259.92 191,753.5 1,291.6
KZTKp Preferred share of Kazakhtelecom JSC 403,194 8,000.00
NRBN Common share of Nurbank JSC 3,177,093 18,000.00 60,124.1 405.0
NRBNp6 Preferred share of Nurbank JSC 225,876 13,000.00
RDGZ Common share of Exploration Production KazMunayGas JSC 70,220,935 21,818.10 1,532,087.4 10,319.9
SATC Common share of SAT & Company JSC 1,099,404,920 74.19 81,564.9 549.4
Markets: Market segments: including:
name value share name value share name value share
Currency 67,725.7 43.5 EUR 925.0 0.6 spot-market 925.0 0.6
RUR 40.6 <0.1 spot-market 40.6 <0.1
USD 66,760.0 42.9 spot-market 49,207.5 31.6
currency swaps 17,552.5 11.3
Repo 71,552.1 46.0 automatic 65,576.7 42.1 GS 61,226.5 39.3
CS 4,350.3 2.8
nego 5,975.4 3.8 GS 813.1 0.5
CS 5,162.3 3.3
Securities 16,381.5 10.5 equities 4,300.7 2.8 secondary market 4,300.7 2.8
special trade 2,814.6 1.8
GS 9,443.2 6.1 placements 4,658.7 3.0
secondary market 4,784.5 3.1
debt securities 2,637.6 1.7 placements 54.3 <0.1
secondary market 2,583.4 1.7
Total 155,659.3 100.0 155,659.3 100.0 155,659.3 100.0

Section V. Factbook
49
Table 9 (continuation)
Ticker Security name Paid-up shares Last price, KZT for instrument
Issuer market capitalization on KASE
m KZT m USD
SATCp Preferred share of SAT & Company JSC 0 –
TEBN Common share of Subsidiary of BTA Bank JSC - Temirbank JSC 19,067,000 955.00 19,680.0 132.6
TEBNp Preferred share of Subsidiary of BTA Bank JSC - Temirbank JSC 4,903,380 300.00
TSBNp Preferred share of Tsesnabank JSC 2,500,000 865.00 2,162.5 14.6
Total of 22 stocks of 15 issuers 5,711,673,588 7,379,349.1 49,706.0
Sector “shares”, second (supreme) category
ALLZ Common share of Alternative Finance JSC 80,804 – 0 0
ASAV Common share of AZIA AVTO JSC 100,000 175,450.00 17,545.0 118.2
ASFL Common share of Leasing Company Astana-Finance JSC 681,300 – 0 0
ASND Common share of Astana-Nedvizhimost JSC 1,000,000 55,000.00 55,001.0 370.5
ASNDp Preferred share of Astana-Nedvizhimost JSC 100 10,000.00
AZNOp Preferred share of Aktobe Oil Equipment Plant JSC 0 – 0 0
CHFM Common share of Chimpharm JSC 5,113,117 1,464.10 7,486.1 50.4
EXBN Common share of Eximbank Kazakhstan JSC 9,610,232 800.00 9,779.1 65.9
EXBNp Preferred share of Eximbank Kazakhstan JSC 2,000,000 1,045.45
IFDR Common share of Investment Financial House RESMI JSC 342,520 – 0 0
KATR Common share of Atameken-Agro JSC 9,000,324 3,599.00 46,876.7 315.8
KATRp Preferred share of Atameken-Agro JSC 1,448,457 10,000.00
KAZI Common share of Karaganda Asbestos and Cement Plant JSC 40,000,000 200.00 12,590.0 84.8
KAZIp Preferred share of Karaganda Asbestos and Cement Plant JSC 15,000,000 306.00
KSMK Common share of RT Holding JSC 4,447,359 – 0 0
KSMKp Preferred share of RT Holding JSC 1,111,840 –
KZIK Common share of Kazakhstan Mortgage Company JSC 2,792,010 – 0 0
KZTC Common share of KazTransCom JSC 2,386,898 3,025.00 7,320.4 49.3
KZTCp Preferred share of KazTransCom JSC 113,624 880.00
MAG_ Common share of MAG JSC 3,205,000 – 0 0
MAG_p Preferred share of MAG JSC 150,000 –
MREK Common share of Mangistau Electricity Distribution Network Company JSC
1,985,853 1,760.00 3,495.1 23.5
NFBN Common share of Delta Bank JSC 4,668,420 2,000.00 9,336.8 62.9
PAIN Common share of Insurance Company Pana Insurance JSC 176,203 – 0 0
PNHZ Common share of Pavlodar Oil Chemistry Refinery JSC 7,000,000 – 0 0
REAL Common share of Financial Company REAL-INVEST.kz JSC 1,072,000,000 – 0 0
REALp Preferred share of Financial Company REAL-INVEST.kz JSC 1,250,000,000 –
RGBR Common share of RG Brands JSC 3,442,092 – 0 0
SHUK Common share of Shubarkol komir JSC 3,517,772 – 0 0
SHUKp Preferred share of Shubarkol komir JSC 119,027 –
TKUDp Preferred share of Ore mining and processing enterprise Tort-Kudyk JSC
75,000,000 – 0 0
TMLZ Common share of Temirleasing JSC 1,560,000 3,956.52 6,172.2 41.6
TSBN Common share of Tsesnabank JSC 15,500,000 940.00 14,570.0 98.1
UKPF Common share of Ust-Kamenogorsk poultry plant JSC 166,200 – 0 0
UKPFp Preferred share of Ust-Kamenogorsk poultry plant JSC 25,200 –
ZERD Common share of Kazcat JSC 1,500,000,000 4.90 10,125.0 68.2
ZERDp Preferred share of Kazcat JSC 500,000,000 5.55
Total of 37 stocks of 26 issuers 4,533,744,352 200,297.4 1,349.2
Sector “shares”, third (under the supreme) category
AKFI Common share of AMF Group JSC 48,043,800 10.00 480.4 3.2

50
Table 9 (continuation)
Ticker Security name Paid-up shares Last price, KZT for instrument
Issuer market capitalization on KASE
m KZT m USD
ALSA Common share of Almatinskiy Sakhar JSC 651,000 – 0 0
AMIN Common share Insurance Company AMANAT INSURANCE JSC 210,000 – 0 0
ASSA Common share of ASIA SAKHAR JSC 210,000 27,911.38 5,861.4 39.5
ASTL Common share of ASTEL JSC 226,000 1,000.00 226.0 1.5
ASZS Common share of Astana Gas Service JSC 102,000 30,000.00 3,060.0 20.6
ATFB Common share of ATFBank JSC 37,640,549 5,300.00 199,494.9 1,343.8
AZNO Common share of Aktobe Oil Equipment Plant JSC 600,000 1,089.00 653.4 4.4
BSUL Common share of Bayan Sulu JSC 6,666,667 25.00 166.7 1.1
CHFMp Preferred share of Chimpharm JSC 131,945 700.00 92.4 0.6
CSBN Common share of Kaspi Bank JSC 19,324,822 4,069.57 78,643.7 529.7
DNBN Common share of Danabank JSC 2,000,000 400.00 800.0 5.4
EKTN Common share of ECOTON+ JSC 93,500 117,800.00 11,014.3 74.2
GG_TPL_ Common share of Tethys Petroleum Limited 45,116,696 – 0 0
KANT Common share of Kant JSC 6,890,131 3,916.75 26,986.9 181.8
KIBN Common share of Kazinvestbank JSC 68,778,806 187.00 12,861.6 86.6
KMSO Common share of Insurance Company Kommesk - Omir JSC 122,400 5,100.00 624.2 4.2
KZIS Common share of Subsidiary insurance company of Halyk Bank of Kazakhstan JSC - Halyk - Kazakhinstrakh JSC
338,011 41,030.00 13,868.6 93.4
KZPF Common share of Accumulative pension fund BTA Kazakhstan JSC - Subsidiary of BTA Bank JSC
6,004,000 – 0 0
KZVP Common share of Kazakhvzryvprom JSC 63,060 – 0 0
LNAT Common share of Subsidiary of BTA Bank JSC - Insurance Company London-Almaty JSC
1,500,000 8,500.00 12,750.0 85.9
LNPT Common share of Lancaster Petroleum JSC 1,304,563 18,928.06 24,692.8 166.3
MMGZ Common share of Mangistaumunaygas JSC 107,856,540 3,593.35 393,013.6 2,647.3
MMGZp Preferred share of Mangistaumunaygas JSC 1,089,460 5,000.00
PDEN Common share of PAVLODARENERGO JSC 148,599,957 – 0 0
PDES Common share of Pavlodar Regional Electric Distribution Company JSC
11,131,000 880.00 9,795.3 66.0
PRIN Common share of Premier Strakhovanie JSC 608,432 1,100.00 669.3 4.5
RAHT Common share of Rakhat JSC 3,600,000 1,250.00 4,500.0 30.3
RTCP Common share of RTS Decaux JSC 91,900 14,613.00 1,342.9 9.0
SAS_ Common share of S.A.S. JSC 88,708 – 0 0
SHMO Common share of Shymkent Munay Onimderi JSC 3,999,999 2,840.50 11,362.0 76.5
SNBN Common share of SENIM-BANK JSC 1,917,269 1,100.00 2,109.0 14.2
SUMB Common share of Sumbe JSC 182,000 300,000.00 54,600.0 367.8
TSNAp Preferred share of Corporation Tsesna JSC 1,250,000 1,000.00 0 0
UPDK Common share of Office for service of diplomatic corps JSC 214 – 0 0
UTMK Common share of Ust-Kamenogorsk titanium and magnesium combine JSC
1,942,380 29,000.00 56,922.5 383.4
UTMKp Preferred share of Ust-Kamenogorsk titanium and magnesium combine JSC
107,910 5,500.00
ZNGR Common share of KRTH ZANGAR JSC 19,909,800 – 0 0
ZNGRp Preferred share of KRTH ZANGAR JSC 3,482,480 1,250,000.00
Total of 39 stocks of 36 issuers 551,875,999 926,592.0 6,241.4
Sector “securities of investment funds”
REAMfv Unit of Interval unit investment fund FAVORIT –
VSTN Common share of Joint-stock real estate investment fund VELIKAYA STENA JSC
12,266 243,000.00 2,980.6 20.1

Section V. Factbook
51
Ticker Security name Paid-up shares Last price, KZT for instrument
Issuer market capitalization on KASE
m KZT m USD
Total of 2 denominations of securities of 2 issuers 12,266 2,980.6 20.1
Total for KASE official list 100 instruments of 75 issuers 10,797,306,205 8,509,219.2 57,316.6
Sector “Unlisted securities”
AMGZp Preferred share of CNPC - AMG JSC 943,955 18,000.00 0 0
BTAS Common share of BTA Bank JSC 33,616,968 1,907.03 64,108.5 431.8
DAMU Common share of Mortgage company DAMU JSC 300,000 1,130.00 339.0 2.3
KASE Common share of Kazakhstan Stock Exchange JSC 450,000 4,681.38 2,106.6 14.2
KZPC Common share of Kazakstan Processing centre JSC 750,000 1,240.00 930.0 6.3
KZPCp Preferred share of Kazakstan Processing centre JSC 250,000
Total in sector “Unlisted securities” 6 stocks of 5 issuers 36,310,923
Total 106 instruments of 80 issuers
Refer to Notes to Factbook
Table 9 (continuation)
Table 10
Changes in KASE lists in Y2009
Ticker Issuer Date:
listing delisting downgrade upgrade
STF RFCA official list
aALPL Insurance Company Altyn Polis JSC Jun 29, 2009
aASAV AZIA AVTO JSC Feb 12, 2009
aASBN Alliance Bank JSC Nov 2, 2009 Apr 24, 2009
aASBNp1 Alliance Bank JSC Nov 2, 2009 Apr 24, 2009
aASFI Astana-Finance JSC Nov 9, 2009 Aug 3, 2009
aEKTN ECOTON+ JSC Feb 12, 2009
aKY_RRF_ Russia Renaissance Fund SPC Jul 10, 2009
aKZIK Kazakhstan Mortgage Company JSC Sep 29, 2009
aKZVP Kazakhvzryvprom JSC Apr 23, 2009
aPRIN Premier Strakhovanie JSC Sep 29, 2009
aUTMK Ust-Kamenogrosk titanium and magnesium combine JSC Aug 3, 2009
aZERDp Kazcat JSC Mar 2, 2009
Total of new issuers and initial listings – 1 2 5 8 0
MTF KASE official list
ACCT Accept-Terminal JSC Jun 29, 2009
ALVZ Zhansaya-Producing JSC Sep 29, 2009
ALVZp Zhansaya-Producing JSC Sep 29, 2009
ASBN Alliance Bank JSC Nov 2, 2009 Aug 3, 2009
ASBNp1 Alliance Bank JSC Nov 2, 2009 Aug 3, 2009
ASFI Astana-Finance JSC Nov 9, 2009 Aug 3, 2009
ASFIp Astana-Finance JSC Nov 9, 2009 Aug 3, 2009
ASFL Leasing Company Astana-Finance JSC Feb 16, 2009
ASNDp Astana-Nedvizhimost JSC Feb 6, 2009
ASSA ASIA SAKHAR JSC Mar 27, 2009
ATFBp ATFBank JSC Mar 18, 2009
ATFBp8 ATFBank JSC Mar 18, 2009
ATOL Kazakhstan Petrochemical Industries JSC Jun 29, 2009
AZNO Aktobe Oil Equipment Plant JSC Sep 29, 2009
BTAS BTA Bank JSC Nov 2, 2009
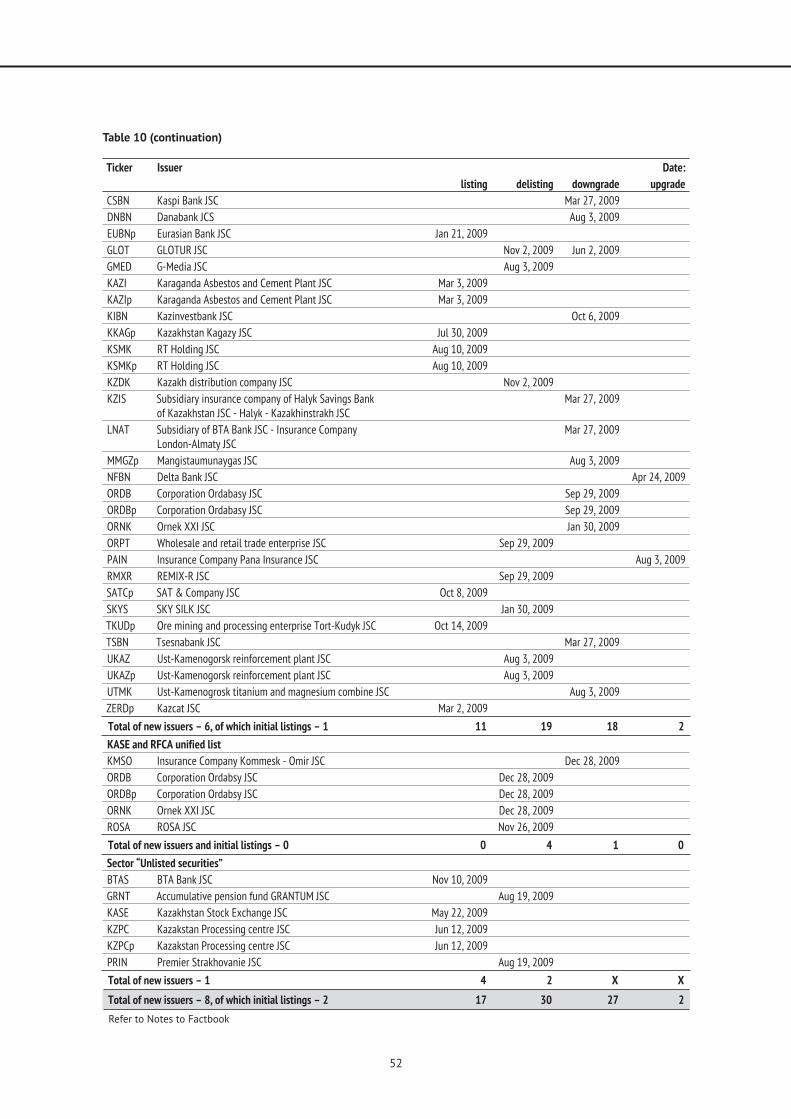
52
Ticker Issuer Date:
listing delisting downgrade upgrade
CSBN Kaspi Bank JSC Mar 27, 2009
DNBN Danabank JCS Aug 3, 2009
EUBNp Eurasian Bank JSC Jan 21, 2009
GLOT GLOTUR JSC Nov 2, 2009 Jun 2, 2009
GMED G-Media JSC Aug 3, 2009
KAZI Karaganda Asbestos and Cement Plant JSC Mar 3, 2009
KAZIp Karaganda Asbestos and Cement Plant JSC Mar 3, 2009
KIBN Kazinvestbank JSC Oct 6, 2009
KKAGp Kazakhstan Kagazy JSC Jul 30, 2009
KSMK RT Holding JSC Aug 10, 2009
KSMKp RT Holding JSC Aug 10, 2009
KZDK Kazakh distribution company JSC Nov 2, 2009
KZIS Subsidiary insurance company of Halyk Savings Bank Mar 27, 2009
LNAT Subsidiary of BTA Bank JSC - Insurance Company London-Almaty JSC
Mar 27, 2009
MMGZp Mangistaumunaygas JSC Aug 3, 2009
NFBN Delta Bank JSC Apr 24, 2009
ORDB Corporation Ordabasy JSC Sep 29, 2009
ORDBp Corporation Ordabasy JSC Sep 29, 2009
ORNK Ornek XXI JSC Jan 30, 2009
ORPT Wholesale and retail trade enterprise JSC Sep 29, 2009
PAIN Insurance Company Pana Insurance JSC Aug 3, 2009
RMXR REMIX-R JSC Sep 29, 2009
SATCp SAT & Company JSC Oct 8, 2009
SKYS SKY SILK JSC Jan 30, 2009
TKUDp Ore mining and processing enterprise Tort-Kudyk JSC Oct 14, 2009
TSBN Tsesnabank JSC Mar 27, 2009
UKAZ Ust-Kamenogorsk reinforcement plant JSC Aug 3, 2009
UKAZp Ust-Kamenogorsk reinforcement plant JSC Aug 3, 2009
UTMK Ust-Kamenogrosk titanium and magnesium combine JSC Aug 3, 2009
ZERDp Kazcat JSC Mar 2, 2009
Total of new issuers – 6, of which initial listings – 1 11 19 18 2
KASE and RFCA unified list
KMSO Insurance Company Kommesk - Omir JSC Dec 28, 2009
ORDB Corporation Ordabsy JSC Dec 28, 2009
ORDBp Corporation Ordabsy JSC Dec 28, 2009
ORNK Ornek XXI JSC Dec 28, 2009
ROSA ROSA JSC Nov 26, 2009
Total of new issuers and initial listings – 0 0 4 1 0
Sector “Unlisted securities”
BTAS BTA Bank JSC Nov 10, 2009
GRNT Accumulative pension fund GRANTUM JSC Aug 19, 2009
KASE Kazakhstan Stock Exchange JSC May 22, 2009
KZPC Kazakstan Processing centre JSC Jun 12, 2009
KZPCp Kazakstan Processing centre JSC Jun 12, 2009
PRIN Premier Strakhovanie JSC Aug 19, 2009
Total of new issuers – 1 4 2
Total of new issuers – 8, of which initial listings – 2 17 30 27 2
Refer to Notes to Factbook
Table 10 (continuation)

Section V. Factbook
53
Table 11
KASE list structure dynamics in Y2009 (as on January 1, 2010, changes for a year)
Sector,admission category
Stocks Issuers
number trend number trend
Sector “shares”:
first category 22 15
second category 37 26
third category 39 36
Sector “securities of investment funds” 2 0 2 0
Total for official list 100 75
Sector “Unlisted securities” 6 +2 5 +1
Total 106 80
Refer to Notes to Factbook
Table 12
KASE list industrial structure (shares at market value)
Industry As on January 1, 2010 As on January 1, 2009
bn KZT m USD share, % bn KZT m USD share, %
Mining 4,426.5 29,815.8 52.0 1,017.0 8,419.5 26.8
Energy 2,035.1 13,707.9 23.9 765.3 6,335.6 20.2
Finance 1,632.9 10,999.2 19.2 1,658.1 13,727.0 43.7
Telecommunications 199.3 1,342.4 2.3 171.8 1,422.0 4.5
Consumer staples 84.4 568.4 1.0 41.7 345.5 1.1
Consumer discretionary 83.6 563.2 1.0 86.0 711.7 2.3
Manufacturing 23.6 159.0 0.3 26.9 222.8 0.7
Utilities 13.3 89.5 0.2 16.3 135.0 0.4
Health care 7.6 51.0 0.1 4.2 35.1 0.1
IT 0 0 0 9.7 80.0 0.3
Total 8,506.2 57,296.5 100.0 3,796.9 31,434.1 100.0
Refer to Notes to Factbook
Month Type of trade Total
scheduled trade special trade on placement
other
th USD m KZT th USD m KZT th USD m KZT th USD m KZT
January 159,585.0 19,376.1 – – – – 159,585.0 19,376.1
February 360,506.9 53,574.8 – – 32,174.4 4,840.0 392,681.3 58,414.8
March 167,708.1 25,274.9 – – – – 167,708.1 25,274.9
I quarter 687,800.0 98,225.8 – – 32,174.4 4,840.0 719,974.4 103,065.8
April 173,779.9 26,169.9 – – – – 173,779.9 26,169.9
May 39,592.3 5,953.8 – – – – 39,592.3 5,953.8
June 51,117.9 7,682.6 – – – – 51,117.9 7,682.6
II quarter 264,490.1 39,806.3 – – – – 264,490.1 39,806.3
July 40,468.5 6,097.6 – – – – 40,468.5 6,097.6
August 177,516.1 26,764.3 – – – – 177,516.1 26,764.3
September 90,874.2 13,712.5 – – – – 90,874.2 13,712.5
III quarter 308,858.8 46,574.3 – – – – 308,858.8 46,574.3
Table 13
Equity traded value on KASE in Y2009 (in terms of months, quarters and sectors)

54
Table 14
Equity purchase and sale deals volume detailed by categories on KASE in Y2009
Month Share traded value in terms of categories and list sectors Total,m KZT
Trans-actionsShares Securities of
investment fundsUnlisted
securitiesFirst category Second category Third category
m KZT share,% m KZT share,% m KZT share,% m KZT share,% m KZT share,%
Jan 13,426.2 69.3 4,407.5 22.7 1,349.8 7.0 139.9 0.7 52.6 0.3 19,376.1 1,071
Feb 12,276.3 22.9 41,045.3 76.6 86.2 0.2 44.5 0.1 122.5 0.2 53,574.8 1,497
Mar 11,409.8 45.1 13,280.9 52.5 543.1 2.1 41.2 0.2 – X 25,274.9 849
Apr 20,373.7 77.9 3,732.4 14.3 1,931.8 7.4 111.2 0.4 20.8 0.1 26,169.9 1,489
May 4,618.1 77.6 1,263.0 21.2 2.6 0.0 19.2 0.3 50.9 0.9 5,953.8 1,858
Jun 2,949.9 38.4 4,351.8 56.6 108.7 1.4 238.5 3.1 33.7 0.4 7,682.6 1,225
Jul 4,730.2 77.6 878.9 14.4 456.6 7.5 6.7 0.1 25.1 0.4 6,097.6 935
Aug 1,790.4 6.7 231.0 0.9 24,732.7 92.4 10.1 <0.1 – X 26,764.3 1,127
Sept 8,566.9 62.5 4,111.8 30.0 1,017.0 7.4 – X 16.7 0.1 13,712.5 1,483
Oct 25,381.1 97.8 537.8 2.1 3.7 0.0 – X 32.7 0.1 25,955.3 1,626
Nov 4,395.7 88.6 509.1 10.3 43.3 0.9 – X 11.3 0.2 4,959.5 2,032
Dec 2,233.9 76.3 467.9 16.0 185.2 6.3 0.5 <0.1 39.6 1.4 2,927.1 1,321
Total 112,152.2 51.3 74,817.6 34.2 30,460.7 13.9 611.9 0.3 406.0 0.2 218,448.4 16,513
Refer to Notes to Factbook
Month Type of trade Total
scheduled trade special trade on placement
other
th USD m KZT th USD m KZT th USD m KZT th USD m KZT
October 172,115.0 25,955.3 – – – – 172,115.0 25,955.3
November 33,082.2 4,959.5 – – 2,602,163.9 387,566.3 2,635,246.1 392,525.8
December 19,678.0 2,927.1 – – 180,293.2 26,737.5 199,971.3 29,664.6
IV quarter 224,875.2 33,841.9 – – 2,782,457.2 414,303.8 3,007,332.4 448,145.7
Total for Y2009 1,486,024.0 218,448.4 – – 2,814,631.6 419,143.8 4,300,655.7 637,592.2
Structure 34.6 % 65.4 % 100.0 %
Y2008:
Total 3,202,717.7 385,567.0 22,480.5 2,712.3 600,738.6 72,025.7 3,825,936.9 460,305.0
Structure 83.7 % 0.6 % 15.7 % 100.0 %
Trend Y2009 to Y2008:
cash +2,213,893.0 +347,118.1 +474,718.8 +177,287.2
percent +368.5 +481.9 +12.4 +38.5
Refer to Notes to Factbook
Table 13 (continuation)

Section V. Factbook
55
Table 15
KASE equity market performance in Y2009 and Y2008
Indicator Measure Y2009 Y2008 Y2009 to Y2008
Trade days 249 249 0 %
Productive days 249 249 0 %
Productivity % 100.0 100.0 0 pp
I. Market transactions (except for transactions concluded at special trades)
total transaction value m KZT 205,366.5 368,548.5
m USD 1,398.1 3,061.3
transactions 16,357 17,260
share in traded value in purchase and sale sector % 94.0 95.6
share in number of transactions in purchase and sale sector % 99.1 97.9 +1.2 pp
average transaction value m KZT 12.6 21.4
th. USD 85.5 177.4
transactions on average per day 66 69
total traded value of such type of transactions m KZT 824.8 1,480.1
m USD 5.6 12.3
including transactions in KASE Index stocks
total transaction value m KZT 67,143.5 196,660.1
m USD 466.2 1,633.7
transactions 13,360 13,810
share in traded value of all market transactions % 32.7 53.4
share in number of all market transactions % 81.7 80.0 +1.7 pp
average transaction value m KZT 5.0 14.2
th. USD 34.9 118.3
transactions on average per day 54 55
total traded value of such type of transactions m KZT 269.7 789.8
m USD 1.9 6.6
II. Nego transactions
total transaction value m KZT 13,081.9 17,018.4
m USD 87.9 141.4
transactions 156 378
share in traded value in purchase and sale sector % 6.0 4.4 +1.6 pp
share in number of transactions in purchase and sale sector % 0.9 2.1
average transaction value m KZT 83.9 45.0 +86.3 %
th. USD 563.5 374.2 +50.6 %
transactions on average per day 1 2
total traded value of such type of transactions m KZT 52.5 68.3
m USD 0.4 0.6
III. Special trades
transactions 4 56
average transaction value m KZT 104,785.9 1,334.6 +7,751.4 %
th. USD 703,657.9 11,128.9 +6,222.8 %
total traded value of such type of transactions m KZT 419,143.8 74,738.0 +460.8 %
m USD 2,814.6 623.2 +351.6 %
including special trades on placement (IPO)
transactions 0 14 X
average transaction value m KZT X 193.7 X
th. USD X 1,605.8 X
total transaction value m KZT 0 2,712.3 X
m USD 0 22.5 X
Refer to Notes to Factbook

56
Picture 5
Exchange share market capitalization in Y2009 (bn USD)
Picture 4
KASE Index in Y2009
Picture 3
Volume and proportion of exchange equity deals in Y2009 in terms of types
Refer to Notes to Factbook
Table 16
Volume of shares traded on KASE in Y2009 and Y2008 in terms of industries
Industry Traded value and structure Official listindustrial
structure, %Y2009 Y2008
bn KZT m USD share, % bn KZT m USD share, %
Energy 109.8 736.3 50.2 89.6 743.6 23.2 23.9
Finance 54.0 381.5 24.7 216.8 1,801.3 56.2 19.2
Consumer staples 30.1 203.0 13.8 25.7 213.4 6.7 1.0
Mining 15.6 104.8 7.2 20.4 170.3 5.3 52.0
Telecommunications 4.4 29.7 2.0 24.4 202.4 6.3 2.3
Consumer discretionary 2.3 15.0 1.0 3.5 29.2 0.9 1.0
Manufacturing 1.7 11.4 0.8 2.3 19.1 0.6 0.3
Health care 0.4 2.6 0.2 <0.1 0.3 <0.1 0.1
IT 0.2 1.4 0.1 0.9 7.1 0.2 0
Utilities 0.1 0.4 <0.1 2.0 16.3 0.5 0.2
Total 218.5 1,486.1 100.0 385.6 3,203.1 100.0 100.0
Refer to Notes to Factbook

Section V. Factbook
57
Indexes on prices of Kazakhstan assets Global indexes:
KASE Index RENCASIA KTX (USD) S&P 500 FTSE 100 S&P Global
As on January 1, 2009 892.3 334.8 295.0 903.3 4,561.8 1,009.5
As on December 31, 2009 1,768.3 641.9 854.7 1,115.1 5,412.9 1,308.6
Change in bps +875.9 +307.1 +559.7 +211.9 +851.1 +299.1
Change in % +98.16 +91.74 +189.70 +23.45 +18.66 +29.63
Volatility ( 2) in % 33.41 31.45 36.45 12.16 11.40 13.69
Correlation table
KASE Index 1 0.9905 0.9790 0.9629 0.9538 0.9714
RENCASIA 0.9905 1 0.9867 0.9734 0.9506 0.9741
KTX (USD) 0.9790 0.9867 1 0.9556 0.9328 0.9475
S&P 500 0.9629 0.9734 0.9556 1 0.9742 0.9692
FTSE 100 0.9538 0.9506 0.9328 0.9742 1 0.9611
S&P Global 0.9714 0.9741 0.9475 0.9692 0.9611 1
Table 17
KASE Index vs. other indexes in Y2009
Table 18
Top ten liquid shares on KASE secondary market in Y2009
Table 19
Share traded gross turnover on KASE in Y2009 and Y2008 in terms of categories
Rank in Y2009
Rank in Y2008
Ticker Liquidity indicator (Kl)
Liquidity indicator calculation basis (Kl):
Transactionvalue, m KZT
Number of deals
KASEmembers
productive days
1 1 RDGZ 3.147 21,419.8 2,380 49 218
2 5 HSBK 2.759 3,654.8 2,366 48 236
3 2 CCBN 2.690 6,305.5 2,293 45 223
4 6 KZTK 2.392 3,339.9 1,630 47 226
5 3 BTAS 2.180 5,327.0 1,288 44 208
6 7 GB_KZMS 2.123 2,675.2 1,449 39 221
7 4 KKGB 2.081 2,387.7 1,319 42 207
8 10 GB_ENRC 1.788 679.4 938 37 210
9 9 KZTKp 1.379 758.1 549 33 154
10 8 KKGBp 0.965 514.6 206 32 72
Refer to Notes to Factbook
Investor categories Y2009 Y2008 Trend,
bn KZT share, % bn KZT share, % %
Brokerage and dealer companies 736.8 86.1 662.7 78.3 +11.2
including individuals 125.6 14.7 182.8 21.6
PAIMO at expense of PA 55.0 6.4 88.3 10.4
Brokerage and dealer companies 45.1 5.3 67.3 8.0
STBs 19.0 2.2 27.6 3.3
Total 855.9 100 845.9 100 +1.2
including non-residents 510.5 59.6 200.0 23.6 +155.3
Refer to Notes to Factbook
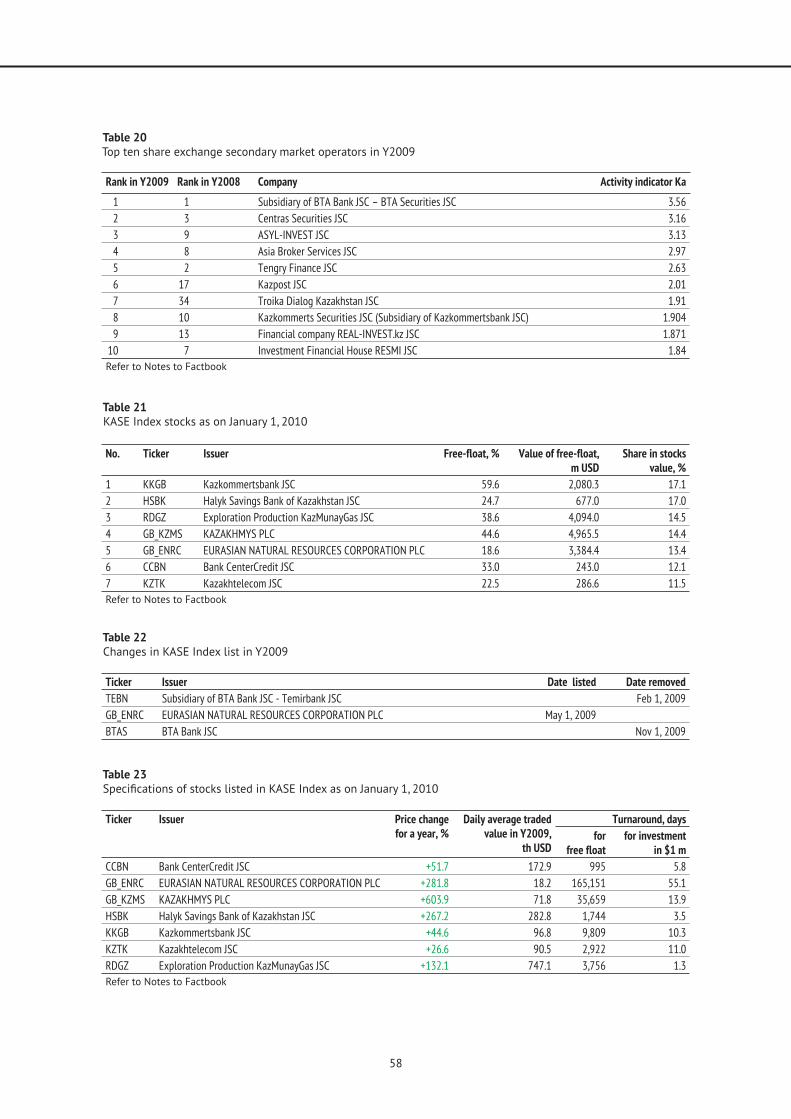
58
Table 20
Top ten share exchange secondary market operators in Y2009
Table 21
KASE Index stocks as on January 1, 2010
Table 22
Changes in KASE Index list in Y2009
Table 23
Rank in Y2009 Rank in Y2008 Company Activity indicator Ka
1 1 Subsidiary of BTA Bank JSC – BTA Securities JSC 3.56
2 3 Centras Securities JSC 3.16
3 9 ASYL-INVEST JSC 3.13
4 8 Asia Broker Services JSC 2.97
5 2 Tengry Finance JSC 2.63
6 17 Kazpost JSC 2.01
7 34 Troika Dialog Kazakhstan JSC 1.91
8 10 Kazkommerts Securities JSC (Subsidiary of Kazkommertsbank JSC) 1.904
9 13 Financial company REAL-INVEST.kz JSC 1.871
10 7 Investment Financial House RESMI JSC 1.84
Refer to Notes to Factbook
No. Ticker Issuer Free-float, % Value of free-float,m USD
Share in stocksvalue, %
1 KKGB Kazkommertsbank JSC 59.6 2,080.3 17.1
2 HSBK Halyk Savings Bank of Kazakhstan JSC 24.7 677.0 17.0
3 RDGZ Exploration Production KazMunayGas JSC 38.6 4,094.0 14.5
4 GB_KZMS 44.6 4,965.5 14.4
5 GB_ENRC EURASIAN NATURAL RESOURCES CORPORATION PLC 18.6 3,384.4 13.4
6 CCBN Bank CenterCredit JSC 33.0 243.0 12.1
7 KZTK Kazakhtelecom JSC 22.5 286.6 11.5
Refer to Notes to Factbook
Ticker Issuer Date listed Date removed
TEBN Subsidiary of BTA Bank JSC - Temirbank JSC Feb 1, 2009
GB_ENRC EURASIAN NATURAL RESOURCES CORPORATION PLC May 1, 2009
BTAS BTA Bank JSC Nov 1, 2009
Ticker Issuer Price changefor a year, %
Daily average traded value in Y2009,
th USD
Turnaround, days
forfree float
for investmentin $1 m
CCBN Bank CenterCredit JSC +51.7 172.9 995 5.8
GB_ENRC EURASIAN NATURAL RESOURCES CORPORATION PLC +281.8 18.2 165,151 55.1
GB_KZMS +603.9 71.8 35,659 13.9
HSBK Halyk Savings Bank of Kazakhstan JSC +267.2 282.8 1,744 3.5
KKGB Kazkommertsbank JSC +44.6 96.8 9,809 10.3
KZTK Kazakhtelecom JSC +26.6 90.5 2,922 11.0
RDGZ Exploration Production KazMunayGas JSC +132.1 747.1 3,756 1.3
Refer to Notes to Factbook
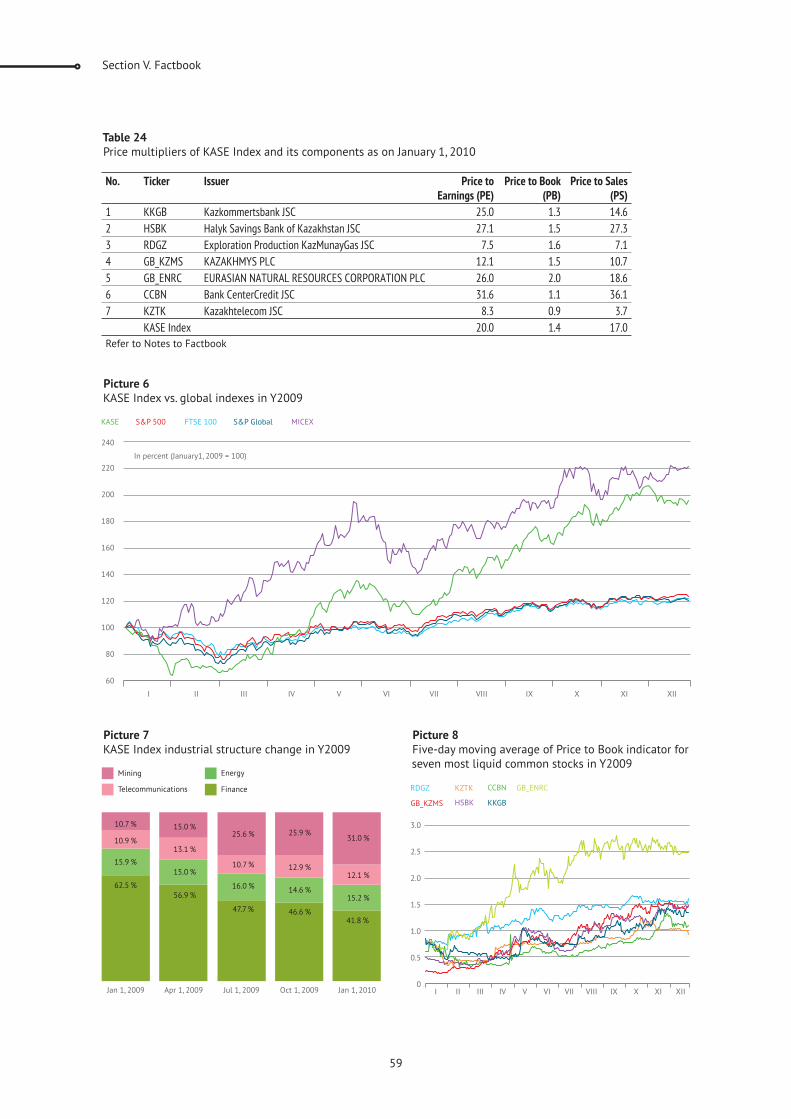
Section V. Factbook
59
No. Ticker Issuer Price to Earnings (PE)
Price to Book (PB)
Price to Sales (PS)
1 KKGB Kazkommertsbank JSC 25.0 1.3 14.6
2 HSBK Halyk Savings Bank of Kazakhstan JSC 27.1 1.5 27.3
3 RDGZ Exploration Production KazMunayGas JSC 7.5 1.6 7.1
4 GB_KZMS 12.1 1.5 10.7
5 GB_ENRC EURASIAN NATURAL RESOURCES CORPORATION PLC 26.0 2.0 18.6
6 CCBN Bank CenterCredit JSC 31.6 1.1 36.1
7 KZTK Kazakhtelecom JSC 8.3 0.9 3.7
KASE Index 20.0 1.4 17.0
Refer to Notes to Factbook
Table 24
Price multipliers of KASE Index and its components as on January 1, 2010
Picture 6
KASE Index vs. global indexes in Y2009
Picture 7
KASE Index industrial structure change in Y2009Picture 8
Five-day moving average of Price to Book indicator for seven most liquid common stocks in Y2009
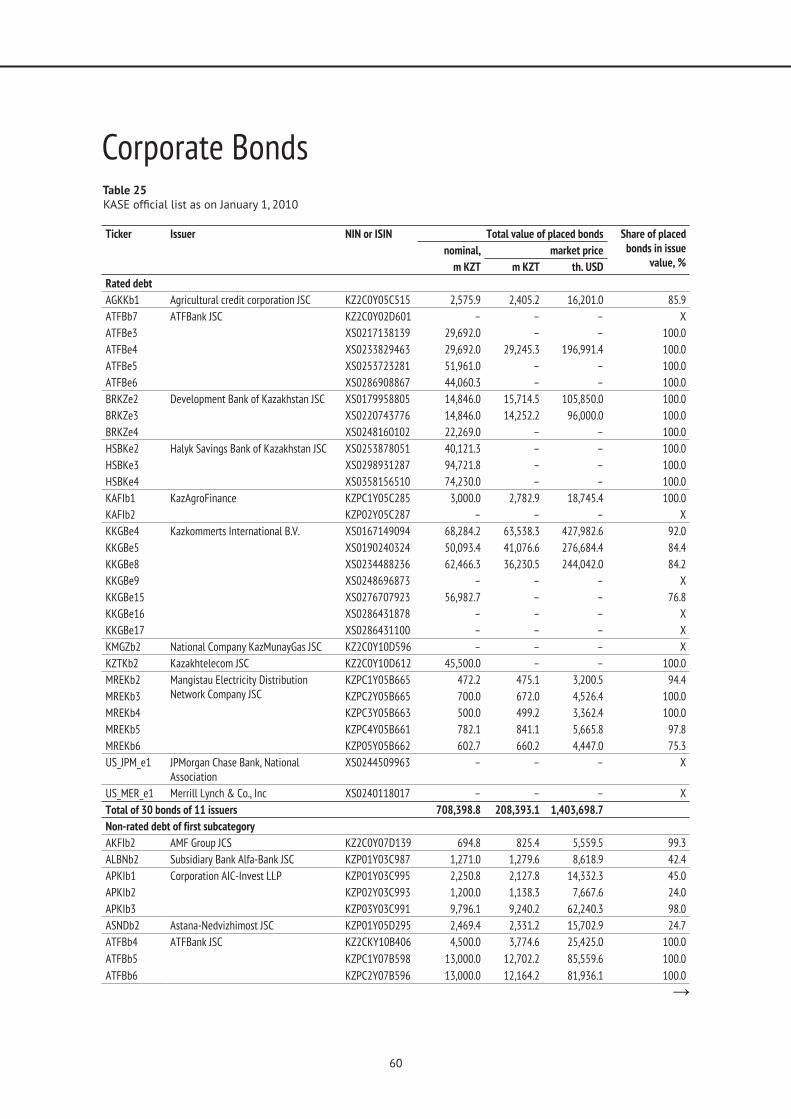
60
Table 25
Corporate Bonds
Ticker Issuer NIN or ISIN Total value of placed bonds Share of placed bonds in issue
value, %nominal, market price
m KZT m KZT th. USD
Rated debt
AGKKb1 Agricultural credit corporation JSC KZ2C0Y05C515 2,575.9 2,405.2 16,201.0 85.9
ATFBb7 ATFBank JSC KZ2C0Y02D601 – – – X
ATFBe3 XS0217138139 29,692.0 – – 100.0
ATFBe4 XS0233829463 29,692.0 29,245.3 196,991.4 100.0
ATFBe5 XS0253723281 51,961.0 – – 100.0
ATFBe6 XS0286908867 44,060.3 – – 100.0
BRKZe2 Development Bank of Kazakhstan JSC XS0179958805 14,846.0 15,714.5 105,850.0 100.0
BRKZe3 XS0220743776 14,846.0 14,252.2 96,000.0 100.0
BRKZe4 XS0248160102 22,269.0 – – 100.0
HSBKe2 Halyk Savings Bank of Kazakhstan JSC XS0253878051 40,121.3 – – 100.0
HSBKe3 XS0298931287 94,721.8 – – 100.0
HSBKe4 XS0358156510 74,230.0 – – 100.0
KAFIb1 KazAgroFinance KZPC1Y05C285 3,000.0 2,782.9 18,745.4 100.0
KAFIb2 KZP02Y05C287 – – – X
KKGBe4 Kazkommerts International B.V. XS0167149094 68,284.2 63,538.3 427,982.6 92.0
KKGBe5 XS0190240324 50,093.4 41,076.6 276,684.4 84.4
KKGBe8 XS0234488236 62,466.3 36,230.5 244,042.0 84.2
KKGBe9 XS0248696873 – – – X
KKGBe15 XS0276707923 56,982.7 – – 76.8
KKGBe16 XS0286431878 – – – X
KKGBe17 XS0286431100 – – – X
KMGZb2 National Company KazMunayGas JSC KZ2C0Y10D596 – – – X
KZTKb2 Kazakhtelecom JSC KZ2C0Y10D612 45,500.0 – – 100.0
MREKb2 Mangistau Electricity Distribution Network Company JSC
KZPC1Y05B665 472.2 475.1 3,200.5 94.4
MREKb3 KZPC2Y05B665 700.0 672.0 4,526.4 100.0
MREKb4 KZPC3Y05B663 500.0 499.2 3,362.4 100.0
MREKb5 KZPC4Y05B661 782.1 841.1 5,665.8 97.8
MREKb6 KZP05Y05B662 602.7 660.2 4,447.0 75.3
US_JPM_e1 JPMorgan Chase Bank, National Association
XS0244509963 – – – X
US_MER_e1 Merrill Lynch & Co., Inc XS0240118017 – – – X
Total of 30 bonds of 11 issuers 708,398.8 208,393.1 1,403,698.7
Non-rated debt of first subcategory
AKFIb2 AMF Group JCS KZ2C0Y07D139 694.8 825.4 5,559.5 99.3
ALBNb2 Subsidiary Bank Alfa-Bank JSC KZP01Y03C987 1,271.0 1,279.6 8,618.9 42.4
APKIb1 Corporation AIC-Invest LLP KZP01Y03C995 2,250.8 2,127.8 14,332.3 45.0
APKIb2 KZP02Y03C993 1,200.0 1,138.3 7,667.6 24.0
APKIb3 KZP03Y03C991 9,796.1 9,240.2 62,240.3 98.0
ASNDb2 Astana-Nedvizhimost JSC KZP01Y05D295 2,469.4 2,331.2 15,702.9 24.7
ATFBb4 ATFBank JSC KZ2CKY10B406 4,500.0 3,774.6 25,425.0 100.0
ATFBb5 KZPC1Y07B598 13,000.0 12,702.2 85,559.6 100.0
ATFBb6 KZPC2Y07B596 13,000.0 12,164.2 81,936.1 100.0

Section V. Factbook
61
Table 25 (continuation)
Ticker Issuer NIN or ISIN Total value of placed bonds Share of placed bonds in issue
value, %nominal, market price
m KZT m KZT th. USD
BTAIb1 Subsidiary hypothecary organization of BTA Bank JSC BTA Ipoteka JSC
KZ2C0Y07A861 500.0 435.0 2,930.1 100.0
BTAIb2 KZ2CKY10B257 1,500.0 480.3 3,235.3 100.0
BTAIb3 KZPC1Y07B335 1,641.2 1,641.2 11,054.7 82.1
BTAIb4 KZPC2Y05B335 1,946.1 1,167.7 7,865.2 97.3
BTAIb5 KZPC3Y10B333 4,000.0 1,173.6 7,905.2 100.0
BTAIb6 KZP04Y05B335 2,000.0 1,335.0 8,992.4 100.0
BTAIb7 KZPC1Y07B648 1,417.0 804.8 5,420.7 35.4
BTAIb8 KZPC2Y08B644 7,000.0 1,933.4 13,023.0 100.0
BTAIb9 KZPC3Y10B648 4,000.0 4,000.0 26,943.3 100.0
BTAIb11 KZPC1Y10C111 1,004.1 350.5 2,360.6 10.0
BTAIb12 KZP02Y10C113 4.1 1.9 12.9 0.4
BTAIb13 KZP03Y10C111 10.0 3.9 26.6 1.0
BTAIb14 KZP05Y07C112 3,895.5 2,830.5 19,065.7 39.0
BTAIb16 KZP07Y10C112 17.2 4.7 31.5 <0.1
CACMb1 Central Asia Cement JSC KZ2C0Y05C101 2,700.0 1,813.4 12,214.5 100.0
CCBNb3 Bank CenterCredit JSC KZ2CKY07A750 2,000.0 1,990.5 13,407.7 100.0
CCBNb4 KZ2CKY07B287 2,000.0 1,969.4 13,265.5 100.0
CCBNb6 KZ2CKY10B455 1,300.0 1,132.2 7,626.5 100.0
CCBNb7 KZ2CKY10B604 2,000.0 1,761.2 11,863.4 100.0
CCBNb8 KZPC1Y10B659 2,000.0 1,469.9 9,900.7 100.0
CCBNb9 KZPC2Y10B657 4,500.0 3,138.0 21,137.1 100.0
CCBNb10 KZPC3Y10B655 3,000.0 2,284.4 15,387.4 100.0
CCBNb11 KZPC4Y10B653 2,000.0 1,783.1 12,010.6 100.0
CCBNb12 KZPC5Y05B650 5,000.0 4,952.6 33,359.8 100.0
CCBNb13 KZPC6Y10B658 4,000.0 3,280.0 22,093.5 100.0
CCBNb14 KZPC7Y10B656 5,000.0 3,960.6 26,678.1 100.0
CCBNb15 KZPC8Y10B654 3,000.0 3,069.4 20,674.7 100.0
CCBNb16 KZPC9Y03B659 2,000.0 1,973.0 13,289.7 100.0
CCBNb17 KZPC0Y05B651 5,000.0 4,939.8 33,273.4 100.0
CCBNb18 KZP11Y15B651 5,000.0 4,997.5 33,662.0 100.0
CCBNb19 KZP12Y10B650 6,000.0 5,998.7 40,406.1 100.0
CCBNb20 KZP13Y15B657 3,500.0 3,267.0 22,006.1 100.0
CCBNb21 KZP01Y05D212 – – – X
CCBNb22 KZP02Y10D210 – – – X
CCBNb23 KZP03Y15D217 – – – X
CHFMb2 Chimpharm JSC KZ2C0Y05C481 – – – X
CSBNb2 Kaspi Bank JSC KZ2CKY07A743 3,092.0 3,019.3 20,337.3 99.7
CSBNb3 KZ2CKY07B014 7,515.9 7,115.9 47,931.2 98.3
CSBNb4 KZ2CKY07B204 6,909.1 6,021.6 40,560.6 98.7
CSBNb5 KZPC1Y07B465 3,437.5 2,937.6 19,787.3 98.2
CSBNb6 KZPC2Y10B467 8,257.8 6,561.2 44,195.1 82.6
CSBNb7 KZP03Y10B469 3,958.0 2,857.5 19,247.4 79.2
CSBNb8 KZP04Y10B467 – – – X
CSBNb9 KZP05Y03B469 – – – X
CTECb1 Central-Asian power-energy Company JSC
KZ2C0Y10D307 15,469.4 14,303.0 96,342.7 77.3
EKGSb1 Ekibastuz GRES-1 LLP KZ2P0Y05D650 – – – X
ERKAb1 ZHERSU POWER LLP KZ2P0Y05D171 – – – X

62
Table 25 (continuation)
Ticker Issuer NIN or ISIN Total value of placed bonds Share of placed bonds in issue
value, %nominal, market price
m KZT m KZT th. USD
EUBNb2 Eurasian Bank JSC KZ2CKY07B360 2,672.2 2,704.3 18,215.4 89.1
EUBNb3 KZ2CKY07B915 7,254.0 6,365.6 42,877.2 72.5
EUBNb4 KZPC1Y07C612 9,972.6 8,221.0 55,375.1 99.7
EUBNb5 KZP02Y15C617 7,137.5 6,395.5 43,079.3 71.4
EUBNb6 KZP03Y07C612 4.7 4.7 31.6 0.1
EUBNb7 KZP04Y10C614 – – – X
EUBNb8 KZP01Y15D252 791.2 968.5 6,523.7 52.7
EUBNb9 KZP02Y07D257 3,055.1 – – 13.9
EXBNb1 Eximbank Kazakhstan JSC KZPC1Y07C299 9,769.5 7,377.0 49,690.3 97.7
EXBNb2 KZP02Y05C295 6,712.1 5,673.8 38,217.8 67.1
EXBNb3 KZP03Y07C299 – – – X
HSBKb4 Halyk Savings Bank of Kazakhstan JSC KZPC2Y06B192 5,000.0 4,990.9 33,618.1 100.0
HSBKb7 KZPC4Y10B190 4,000.0 3,396.5 22,877.9 100.0
HSBKb8 KZPC5Y10B197 4,000.0 3,502.5 23,592.4 100.0
HSBKb9 KZPC6Y10B195 2,963.0 2,429.1 16,362.0 98.8
HSBKb10 KZPC7Y10B193 4,470.0 3,748.1 25,246.5 89.4
HSBKb11 KZPC3Y10C018 4,000.0 3,316.8 22,341.4 100.0
HSBKb12 KZPC1Y10C590 10,000.0 8,532.6 57,473.8 100.0
HSBKb13 KZP02Y10C592 5,000.0 4,770.0 32,129.9 100.0
HSBKb14 KZP03Y10C590 5,000.0 5,250.0 35,363.1 100.0
HSBKb15 KZP04Y03C593 5,726.2 – – 82.8
HSBKb16 KZP05Y03C590 2,041.6 – – 23.0
HSBKb17 KZP06Y10C593 – – – X
IMSKb1 Imstalkon JSC KZP01Y07D549 3,974.0 4,801.3 32,340.4 99.4
IMSKb2 KZP02Y07D547 962.0 – – 21.9
KASSb1 OGCC KazStroyService JSC KZ2CKY05B885 3,000.0 2,813.0 18,947.8 100.0
KASTb1 Holding KAZEXPORTASTYK JSC KZPC1Y05C053 4,000.0 4,278.8 28,821.4 100.0
KASTb2 KZPC2Y05C051 6,000.0 4,880.5 32,874.0 100.0
KAZIb2 Karaganda Asbestos and Cement Plant JSC
KZPC2Y05B806 1,500.0 946.5 6,375.7 100.0
KAZIb3 KZP03Y05B808 463.1 – – 23.2
KIBNb1 Kazinvestbank JSC KZ2CKY07B733 1,238.1 1,154.2 7,774.7 99.0
KIBNb3 KZ2C0Y03C692 5,140.2 4,921.3 33,149.2 84.3
KIBNb4 KZ2C0Y03C932 – – – X
KKAGb1 Kazakhstan Kagazy JSC KZ2CKY05B448 4,000.0 2,069.0 13,936.6 100.0
KKAGb2 KZPC1Y05C020 3,487.9 2,622.5 17,664.4 99.7
KKAGb3 KZPC2Y07C024 3,500.0 2,275.1 15,325.0 100.0
KKAGb4 KZ2C0Y05D117 4,888.3 5,071.5 34,161.0 40.7
KKGBb4 Kazkommertsbank JSC KZ2CKY10B513 6,996.2 5,477.0 36,892.2 99.9
KKGBb5 KZ2CKY10B695 5,500.0 6,039.3 40,679.7 100.0
KKGBb6 KZP01Y10C727 10,000.0 9,468.2 63,775.8 100.0
KKGBb7 KZP02Y10C725 10,000.0 9,137.3 61,547.1 100.0
KKGBb8 KZP03Y10C723 1,564.9 1,305.0 8,790.0 15.6
KKGBe19 Kazkommerts International B.V. XS0338078487 18,557.5 – – 100.0
KKGBe20 XS0366928397 34,145.8 – – 100.0
KKI_b1 HOMEBROKER JSC KZ2C0Y03C585 2,965.8 2,795.7 18,831.2 74.1
KMGZb1 National Company KazMunayGas JSC KZ2C0Y35D528 190,000.0 – – 100.0
KONDb1 Condensate JSC KZ2C0Y05C192 1,356.7 745.9 5,024.2 45.2
KZIKb2 Kazakhstan Mortgage Company JSC KZ2CKY10A853 1,200.0 983.1 6,622.1 40.0

Section V. Factbook
63
Ticker Issuer NIN or ISIN Total value of placed bonds Share of placed bonds in issue
value, %nominal, market price
m KZT m KZT th. USD
KZIKb3 KZ2CKY10A986 2,952.5 2,384.3 16,060.3 59.0
KZIKb4 KZ2CKY10B075 2,952.5 2,445.2 16,470.6 59.0
KZIKb6 KZ2CKY07B220 4,111.1 3,839.8 25,864.0 82.2
KZIKb7 KZ2CKY07B303 5,000.0 4,609.0 31,045.4 100.0
KZIKb8 KZ2CKY10B315 5,000.0 3,500.0 23,575.4 100.0
KZIKb10 KZPC2Y05B145 5,000.0 4,979.0 33,537.7 100.0
KZIKb11 KZPC1Y10B543 5,000.0 3,516.1 23,683.8 100.0
KZIKb12 KZPC2Y12B547 5,000.0 3,567.5 24,030.0 100.0
KZIKb16 KZPC4Y10B547 4,825.0 4,454.4 30,004.3 96.5
KZIKb17 KZP02Y09C495 10,000.0 6,411.0 43,183.5 100.0
KZIKb18 KZP03Y05C491 5,000.0 4,762.2 32,077.1 100.0
KZIKb19 KZP04Y04C492 5,000.0 5,179.5 34,888.2 100.0
KZTCb1 KazTransCom JSC KZ2CKY07A834 3,032.7 2,846.3 19,363.7 99.8
KZTCb2 KZ2C0Y03D492 1,297.2 1,189.2 8,010.0 43.2
LOGCb1 LOGYCOM JSC KZ2C0Y03C569 1,895.2 1,758.0 11,841.5 99.7
LOGCb2 KZ2C0Y05D281 137.6 121.3 817.0 8.1
NRBNb2 Nurbank JSC KZ2CKY08A774 3,909.7 3,581.6 24,124.7 98.0
NRBNb5 KZPC2Y10B426 4,995.3 3,650.6 24,589.5 99.9
NRBNb6 KZPC3Y07B420 4,556.7 4,372.7 29,454.0 91.1
NRBNb7 KZP04Y05B426 10,000.0 10,652.9 71,756.2 100.0
NRBNb8 KZ2C0Y01D629 16,000.0 15,999.8 107,772.0 100.0
PDENb1 PAVLODARENERGO JSC KZ2C0Y10C606 3,907.0 2,814.0 18,954.7 48.8
PRKRb2 National Company Food contract corporation JSC
KZ2CKY05B091 15,000.0 13,862.4 93,374.7 100.0
RESCb1 RESMI Group LLP KZ2P0Y07C187 4,598.0 4,262.0 28,708.2 38.3
RGBRb4 RG Brands JSC KZPC1Y05B980 1,500.0 1,331.9 8,971.2 100.0
RGBRb5 KZPC2Y05B988 1,500.0 1,463.2 9,856.1 100.0
RGBRb6 KZPC3Y07B982 2,000.0 1,589.7 10,708.1 100.0
SATCb1 SAT & Company JSC KZ2C0Y07C826 5,375.2 6,448.8 43,437.8 35.8
SKKZb1 National welfare fund Samruk-Kazyna JSC
KZP01Y06D392 40,500.0 – – 100.0
SKKZb2 KZP02Y07D398 40,500.0 – – 100.0
SKKZb3 KZP03Y08D394 40,500.0 – – 100.0
SKKZb4 KZP04Y09D390 40,500.0 – – 100.0
SKKZb5 KZP05Y10D395 40,500.0 – – 100.0
SKKZb6 KZP06Y11D391 40,500.0 – – 100.0
SKKZb7 KZP07Y12D397 40,500.0 – – 100.0
SKKZb8 KZP08Y13D393 40,500.0 – – 100.0
SKKZb9 KZP09Y14D399 40,500.0 – – 100.0
SKKZb10 KZP10Y15D394 40,500.0 – – 100.0
SKKZb11 KZP11Y06D391 34,500.0 – – 100.0
SKKZb12 KZP12Y07D397 34,500.0 – – 100.0
SKKZb13 KZP13Y08D393 34,500.0 – – 100.0
SKKZb14 KZP14Y09D399 34,500.0 – – 100.0
SKKZb15 KZP15Y10D394 34,500.0 – – 100.0
SKKZb16 KZP16Y11D390 34,500.0 – – 100.0
SKKZb17 KZP17Y12D396 34,500.0 – – 100.0
SKKZb18 KZP18Y13D392 34,500.0 – – 100.0
SKKZb19 KZP19Y14D398 34,500.0 – – 100.0
Table 25 (continuation)

64
Table 25 (continuation)
Ticker Issuer NIN or ISIN Total value of placed bonds Share of placed bonds in issue
value, %nominal, market price
m KZT m KZT th. USD
SKKZb20 KZP20Y15D393 34,500.0 – – 100.0
SKKZb21 KZ2C0Y35D510 190,000.0 – – 100.0
TEBNb3 Temirbank JSC KZ2CKY10A648 683.6 447.4 3,013.6 31.1
TEBNb4 KZPC1Y10B550 600.0 562.2 3,787.2 12.0
TEBNb6 KZPC3Y07B552 3,873.4 1,747.1 11,768.1 96.8
TEBNb7 KZPC4Y09B556 2,992.0 2,962.1 19,952.0 99.7
TEBNb8 KZPC5Y06B559 3,492.0 3,647.0 24,565.4 99.8
TEBNb10 KZPC7Y10B557 2,478.3 1,957.4 13,184.5 55.1
TEBNb11 KZPC8Y15B554 3,960.0 3,959.5 26,670.7 99.0
TEBNb12 KZPC1Y03C330 2,438.7 1,951.0 13,141.3 30.5
TEBNb13 KZPC2Y05C333 433.2 382.9 2,579.0 4.4
TEBNb14 KZPC3Y09C333 928.0 950.9 6,405.3 15.5
TEBNb15 KZPC4Y09C331 853.2 650.5 4,381.9 11.7
TEBNb16 KZPC5Y10C336 7,195.0 2,699.9 18,186.1 98.4
TEBNb17 KZPC6Y10C334 1,500.0 1,099.9 7,408.8 25.0
TEBNb18 KZP07Y10C336 – – – X
TSBNb2 Tsesnabank JSC KZ2CKY07B626 2,960.7 2,370.0 15,963.6 98.7
TSBNb4 KZPC2Y05B871 849.5 733.4 4,939.7 28.3
TSBNb5 KZPC3Y08B873 2,839.2 1,760.0 11,855.2 94.6
TSBNb6 KZPC4Y09B879 2,575.4 2,341.4 15,771.0 64.4
TSBNb7 KZPC1Y20C367 3,484.2 4,275.0 28,795.7 87.11
TXBNb2 Subsidiary Bank Sberbank of Russia JSC KZ2CKY07A792 3,000.0 3,016.2 20,316.3 100.0
TXBNb3 KZ2CKY07B352 2,419.4 2,261.6 15,233.5 80.6
ULBAb2 Ulba metallurgical plant JSC KZ2C0Y04C450 2,000.0 – – 100.0
VITAb5 VITA JSC KZ2CKY07B964 7,298.3 1,289.6 8,686.5 100.0
VMZVb1 Vostokmashzavod JSC 64.0 64.0 431.0 3.2
Total of 177 bonds of 43 issuers 1,748,230.5 474,496.0 3,196,311.7
Non-rated debt of second subcategory
ABDIb1 ABDI Company JSC KZ2C0Y05C804 7,470.0 4,419.9 29,771.8 83.0
AESOb1 Almatyenergosbyt LLP KZ2P0Y07D045 250.8 271.2 1,826.8 27.9
ALLZb1 Alternative Finance JSC KZPC1Y05C145 621.9 614.7 4,140.3 24.9
ASAVb1 AZIA AVTO JSC KZPC1Y03C348 1,000.0 989.3 6,663.8 100.0
ASAVb2 KZPC2Y03C346 1,321.6 1,210.6 8,154.4 66.1
ASZSb1 Astana Gas Service JSC KZ2CKY05B893 289.0 – – 100.0
BTTRb1 Batys tranzit JSC KZ2CKY13B996 17,671.3 17,203.5 115,880.0 93.8
CBH_b1 Caspian Beverage Holding JSC KZ2C0Y05C861 125.0 107.3 722.4 25.0
DNTLb1 Dent-Lux JSC KZ2CKY04B946 319.3 235.2 1,584.5 63.9
EKTNb1 ECOTON+ JSC KZ2C0405C218 983.9 919.4 6,193.2 98.4
JGOKb2 Zhairem GOK JSC KZ2CKY07B907 2,310.6 2,153.4 14,505.2 51.4
KATRb2 Atameken-Agro JSC KZP01Y10D329 2,964.6 3,099.0 20,874.2 27.0
KDTSb1 Kedentransservice JSC KZ2CKY05B976 1,686.5 1,025.2 6,905.8 33.7
KRZHb1 Karagandy Zharyk LLP KZPP1Y05B763 678.3 484.0 3,260.3 96.9
KSMKb1 RT Holding JSC KZ2P0Y05C439 774.1 366.5 2,468.8 59.5
KSMKb2 KZPP1Y05C357 1,295.4 837.6 5,642.0 99.6
MAG_b1 MAG JSC KZ2C0Y05C135 494.9 415.7 2,800.2 15.2
NFBNb1 Delta Bank JSC KZ2CKY07B717 1,957.6 1,033.6 6,962.1 65.3
OILAb1 Oilan Ltd. KZ2P0Y03C913 83.3 77.7 523.3 16.7
ORDKb2 Credit partnership ORDA credit LLP KZ2P0Y05C900 458.0 414.8 2,793.8 30.5

Section V. Factbook
65
Ticker Issuer NIN or ISIN Total value of placed bonds Share of placed bonds in issue
value, %nominal, market price
m KZT m KZT th. USD
PDESb1 Pavlodar Regional Electric Distribution Company JSC
KZ2CKY05B794 1,816.7 1,727.8 11,638.3 81.7
REALb1 Financial Company REAL-INVEST.kz KZ2C0Y05C747 1,901.4 1,901.8 12,810.3 38.0
SVMHb1 Svyazmontazh Holding LLP KZ2P0Y05D031 – – – X
TEMAb1 TEMA Ko. LLP KZ2P0Y03C673 293.8 264.2 1,779.9 29.4
TKUDb1 Ore mining and processing enterprise Tort-Kudyk JSC
KZ2C0Y05B830 558.8 565.4 3,808.7 27.9
TMLZb1 Temirleasing JSC KZ2C0Y05C465 500.0 234.1 1,576.6 100.0
TSASb1 Concern Tsesna-Astyk LLP KZ2PKY05C260 2,997.8 2,706.7 18,232.1 99.9
UKPFb2 Ust-Kamenogorsk poultry plant JSC KZP01Y05D154 214.3 188.7 1,271.3 10.7
VITAb4 VITA JSC KZ2CKY05B539 4,999.5 1,485.6 10,007.0 100.0
ZERDb1 Kazcat JSC KZ2C0Y05C622 2,989.9 2,989.9 20,139.3 59.8
Total of 30 bonds of 28 issuers 59,028.2 47,943.1 322,936.4
Debt in buffer category
AKKMb1 Akmola Kurlys Materialdary LLP KZ2P0Y03C665 2,607.9 2,536.1 17,082.7 52.2
ALTMb1 Almatytemir JSC KZ2C0Y05C788 500.0 – – 25.0
ASBNb3 Alliance Bank JSC KZ2CKY07B394 2,928.3 617.0 4,155.9 97.6
ASBNb7 KZPC4Y07B576 4,966.2 1,069.2 7,202.1 99.3
ASBNb8 KZPC5Y05B577 4,115.0 3,343.8 22,523.6 82.3
ASBNb9 KZPC6Y03B570 8,378.5 8,433.8 56,808.6 83.8
ASBNb10 KZPC7Y07B579 6,992.8 6,106.7 41,133.9 99.9
ASBNb12 KZP02Y07C960 152.4 – – 2.2
ASBNb13 KZP03Y02C969 7.4 – – 0.1
ASBNb14 KZP04Y10C960 2,645.4 2,246.7 15,133.1 17.6
ASBNb15 KZP01Y06D418 10,500.0 – – 100.0
ASBNb16 KZP02Y07D414 10,500.0 – – 100.0
ASBNb17 KZP03Y08D410 10,500.0 – – 100.0
ASBNb18 KZP04Y09D416 10,500.0 – – 100.0
ASBNb19 KZP05Y10D411 10,500.0 – – 100.0
ASBNb20 KZP06Y11D417 10,500.0 – – 100.0
ASBNb21 KZP07Y12D413 10,500.0 – – 100.0
ASBNb22 KZP08Y13D419 10,500.0 – – 100.0
ASBNb23 KZP09Y14D415 10,500.0 – – 100.0
ASBNb24 KZP10Y15D410 10,500.0 – – 100.0
ASBNe2 ALB Finance B.V. XS0234283264 29,692.0 8,600.6 57,932.0 100.0
ASBNe3 XS0251702618 22,269.0 – – 100.0
ASELb1 Asia-Electric JSC KZ2C0Y03C411 549.7 516.9 3,481.5 55.0
ASFIb4 Astana-Finance JSC KZ2CKY07B162 1,897.0 354.5 2,387.7 94.9
ASFIb5 KZPC1Y05D501 4,492.9 3,073.6 20,703.4 89.9
ASFIb6 KZPC2Y07B505 883.8 102.0 687.2 44.2
ASFIb7 KZPC1Y10B634 324.1 62.5 420.9 4.1
ASFIb8 KZPC1Y05B725 350.6 185.8 1,251.6 70.1
ASFIb9 KZPC2Y15B722 5,801.6 580.2 3,907.9 64.5
ASFIb10 KZPC3Y10B721 244.4 199.7 1,345.3 48.9
ASFIb11 KZPC1Y10C202 8,599.8 8,971.2 60,428.6 86.0
ASFIb12 KZPC3Y12C253 6,155.8 4,158.6 28,011.4 76.9
ASFIb13 KZPC1Y03C538 38,106.6 37,415.5 252,024.2 100.0
ASFIb15 KZPC2Y15C258 7,061.5 8,096.8 54,538.3 88.3
Table 25 (continuation)

66
Table 25 (continuation)
Ticker Issuer NIN or ISIN Total value of placed bonds Share of placed bonds in issue
value, %nominal, market price
m KZT m KZT th. USD
ASFIb16 KZP01Y15D013 18,817.6 1,881.8 12,675.2 62.7
ASFIb17 KZP03M42C539 25,824.6 25,818.4 173,908.3 95.9
ASFIb18 KZP04Y02C538 6,284.7 6,282.0 42,314.6 92.7
ASFIb19 KZP05Y02C535 – – – X
ASFIb21 KZP07Y02C531 1,537.0 1,536.8 10,351.4 100.0
ASFIb22 KZP08Y10C532 9,990.3 9,986.7 67,268.3 99.9
ASFIb23 KZP02Y03D017 3,929.3 4,096.4 27,592.6 78.6
ASFIb24 KZP03Y05D010 4,993.7 5,349.5 36,033.6 99.9
BTASb2 BTA Bank JSC KZ2CKY08A535 3,637.8 831.5 5,600.5 100.0
BTASb3 KZ2CKY10A887 7,500.0 2,668.0 17,971.3 100.0
BTASb4 KZ2CKY10B158 13,058.4 1,110.0 7,476.5 93.3
BTASb5 KZ2CKY10B828 2,559.2 197.1 1,327.4 12.8
BTASb7 KZ2C0Y30C125 96,414.5 1,446.2 9,741.5 77.1
BTASb9 KZ2C0Y10D067 40,757.5 40,765.2 274,586.8 40.8
BTASb10 KZ2C0Y07D147 – – – X
BTASb11 KZP01Y06D400 30,000.0 – – 100.0
BTASb12 KZP02Y07D406 30,000.0 – – 100.0
BTASb13 KZP03Y08D402 30,000.0 – – 100.0
BTASb14 KZP04Y09D408 30,000.0 – – 100.0
BTASb15 KZP05Y10D403 30,000.0 – – 100.0
BTASb16 KZP06Y11D409 30,000.0 – – 100.0
BTASb17 KZP07Y12D405 30,000.0 – – 100.0
BTASb18 KZP08Y13D401 30,000.0 – – 100.0
BTASb19 KZP09Y14D407 30,000.0 – – 100.0
BTASb20 KZP10Y15D402 30,000.0 – – 100.0
BTASb21 KZP01Y06D426 34,500.0 – – 100.0
BTASb22 KZP02Y07D422 34,500.0 – – 100.0
BTASb23 KZP03Y08D428 34,500.0 – – 100.0
BTASb24 KZP04Y09D424 34,500.0 – – 100.0
BTASb25 KZP05Y10D429 34,500.0 – – 100.0
BTASb26 KZP06Y11D425 34,500.0 – – 100.0
BTASb27 KZP07Y12D421 34,500.0 – – 100.0
BTASb28 KZP08Y13D427 34,500.0 – – 100.0
BTASb29 KZP09Y14D423 34,500.0 – – 100.0
BTASb30 KZP10Y15D428 34,500.0 – – 100.0
BTASe3 TuranAlem Finance B.V. XS0168848801 81,890.5 16,386.3 110,375.2 91.9
BTASe4 USN89065AF89 59,384.0 – – 100.0
BTASe5 US89989EAF43 51,961.0 – – 100.0
BTASe6 XS0251881289 37,115.0 – – 100.0
DNBNb1 Danabank JSC KZ2CKY05B752 200.0 – – 20.0
DNBNb2 KZ2CKY05B844 – – – X
DTJLb1 Doszhan temir zholy (DTZ) JSC KZ2CKY23B672 29,993.9 10,925.8 73,594.5 100.0
KSM2b1 Combine for construction materials and structures-2 LLP
KZ2P0Y03C772 1,362.2 1,298.9 8,748.9 90.8
KZNHb2 Kazneftehim JSC KZ2CKY05B273 4,566.2 4,281.5 28,839.6 100.0
Total of 78 bonds of 12 issuers 1,411,500.2 231,533.2 1,559,566.1
TOTAL OF 315 bonds of 90 issuers 3,927,157.7 962,365.4 6,482,512.8
Refer to Notes to Factbook
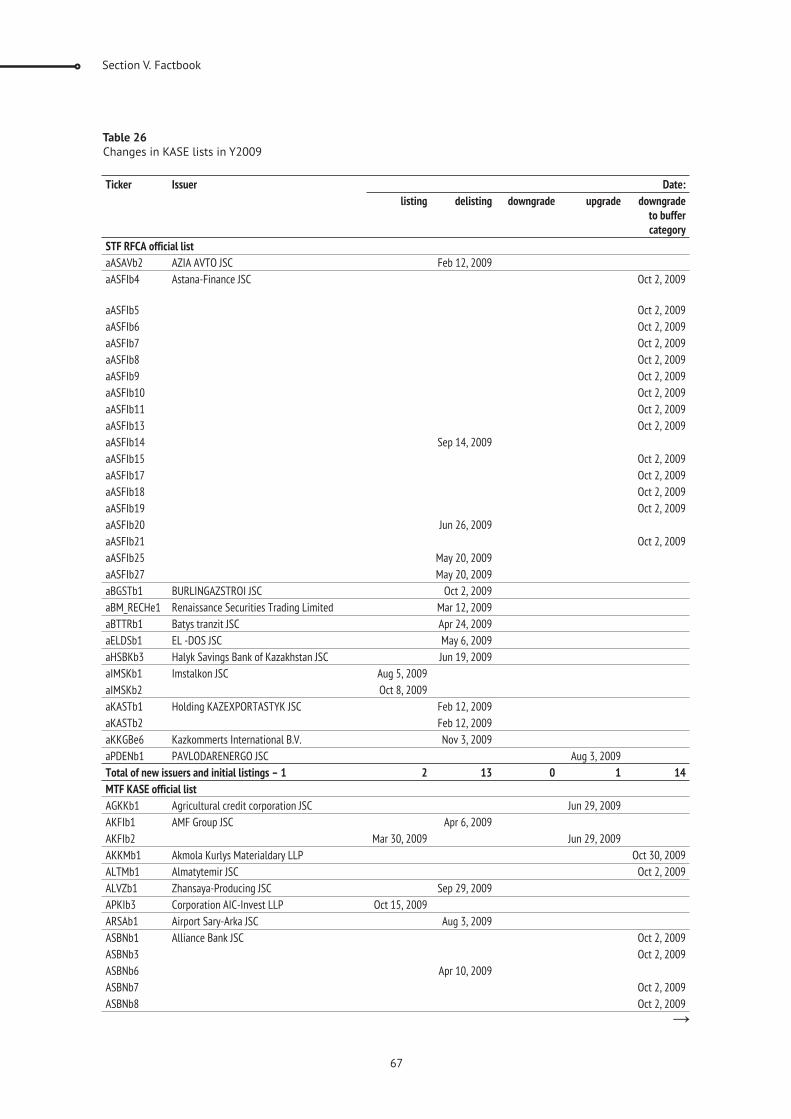
Section V. Factbook
67
Table 26
Changes in KASE lists in Y2009
Ticker Issuer Date:
listing delisting downgrade upgrade downgrade to buffer category
STF RFCA official list
aASAVb2 AZIA AVTO JSC Feb 12, 2009
aASFIb4 Astana-Finance JSC Oct 2, 2009
aASFIb5 Oct 2, 2009
aASFIb6 Oct 2, 2009
aASFIb7 Oct 2, 2009
aASFIb8 Oct 2, 2009
aASFIb9 Oct 2, 2009
aASFIb10 Oct 2, 2009
aASFIb11 Oct 2, 2009
aASFIb13 Oct 2, 2009
aASFIb14 Sep 14, 2009
aASFIb15 Oct 2, 2009
aASFIb17 Oct 2, 2009
aASFIb18 Oct 2, 2009
aASFIb19 Oct 2, 2009
aASFIb20 Jun 26, 2009
aASFIb21 Oct 2, 2009
aASFIb25 May 20, 2009
aASFIb27 May 20, 2009
BURLINGAZSTROI JSC Oct 2, 2009
aBM_RECHe1 Renaissance Securities Trading Limited Mar 12, 2009
aBTTRb1 Batys tranzit JSC Apr 24, 2009
aELDSb1 EL -DOS JSC May 6, 2009
aHSBKb3 Halyk Savings Bank of Kazakhstan JSC Jun 19, 2009
aIMSKb1 Imstalkon JSC Aug 5, 2009
aIMSKb2 Oct 8, 2009
aKASTb1 Holding KAZEXPORTASTYK JSC Feb 12, 2009
aKASTb2 Feb 12, 2009
aKKGBe6 Kazkommerts International B.V. Nov 3, 2009
aPDENb1 PAVLODARENERGO JSC Aug 3, 2009
Total of new issuers and initial listings – 1 2 13 0 1 14
MTF KASE official list
AGKKb1 Agricultural credit corporation JSC Jun 29, 2009
AKFIb1 AMF Group JSC Apr 6, 2009
AKFIb2 Mar 30, 2009 Jun 29, 2009
AKKMb1 Akmola Kurlys Materialdary LLP Oct 30, 2009
ALTMb1 Almatytemir JSC Oct 2, 2009
ALVZb1 Zhansaya-Producing JSC Sep 29, 2009
APKIb3 Corporation AIC-Invest LLP Oct 15, 2009
ARSAb1 Airport Sary-Arka JSC Aug 3, 2009
ASBNb1 Alliance Bank JSC Oct 2, 2009
ASBNb3 Oct 2, 2009
ASBNb6 Apr 10, 2009
ASBNb7 Oct 2, 2009
ASBNb8 Oct 2, 2009

68
Table 26 (continuation)
Ticker Issuer Date:
listing delisting downgrade upgrade downgrade to buffer category
ASBNb9 Oct 2, 2009
ASBNb10 Oct 2, 2009
ASBNb12 Oct 2, 2009
ASBNb13 Oct 2, 2009
ASBNb14 Oct 2, 2009
ASBNb15 Mar 18, 2009 Oct 2, 2009
ASBNb16 Mar 18, 2009 Oct 2, 2009
ASBNb17 Mar 18, 2009 Oct 2, 2009
ASBNb18 Mar 18, 2009 Oct 2, 2009
ASBNb19 Mar 18, 2009 Oct 2, 2009
ASBNb20 Mar 18, 2009 Oct 2, 2009
ASBNb21 Mar 18, 2009 Oct 2, 2009
ASBNb22 Mar 18, 2009 Oct 2, 2009
ASBNb23 Mar 18, 2009 Oct 2, 2009
ASBNb24 Mar 18, 2009 Oct 2, 2009
ASBNe2 ALB Finance B.V. Oct 2, 2009
ASBNe3 Oct 2, 2009
ASELb1 Asia-Electric JSC Oct 2, 2009
ASFIb4 Astana-Finance JSC Oct 2, 2009
ASFIb5 Oct 2, 2009
ASFIb6 Oct 2, 2009
ASFIb7 Oct 2, 2009
ASFIb8 Oct 2, 2009
ASFIb9 Oct 2, 2009
ASFIb10 Oct 2, 2009
ASFIb11 Oct 2, 2009
ASFIb12 Oct 2, 2009
ASFIb13 Oct 2, 2009
ASFIb14 Sep 14, 2009
ASFIb15 Oct 2, 2009
ASFIb16 Oct 2, 2009
ASFIb22 Oct 2, 2009
ASFIb23 Oct 2, 2009
ASFIb24 Oct 2, 2009
ATFBb7 ATFBank JSC Nov 4, 2009
ATFBe2 Nov 9, 2009
ATFBe3 Apr 1, 2009
BGSTb1 BURLINGAZSTROI JSC Oct 2, 2009
BIGRb1 BUILD INVESTMENTS GROUP JSC Jun 29, 2009
BTAIb10 Subsidiary hypothecary organization of BTA Bank JSC - BTA Ipoteka JSC
May 26, 2009
BTASb1 BTA Bank JSC Feb 19, 2009
BTASb2 Oct 2, 2009
BTASb3 Oct 2, 2009
BTASb4 Oct 2, 2009
BTASb5 Oct 2, 2009
BTASb7 Oct 2, 2009
BTASb9 Oct 2, 2009

Section V. Factbook
69
Ticker Issuer Date:
listing delisting downgrade upgrade downgrade to buffer category
BTASb10 Oct 2, 2009
BTASb11 Mar 6, 2009 Oct 2, 2009
BTASb12 Mar 6, 2009 Oct 2, 2009
BTASb13 Mar 6, 2009 Oct 2, 2009
BTASb14 Mar 6, 2009 Oct 2, 2009
BTASb15 Mar 6, 2009 Oct 2, 2009
BTASb16 Mar 6, 2009 Oct 2, 2009
BTASb17 Mar 6, 2009 Oct 2, 2009
BTASb18 Mar 6, 2009 Oct 2, 2009
BTASb19 Mar 6, 2009 Oct 2, 2009
BTASb20 Mar 6, 2009 Oct 2, 2009
BTASb21 Mar 19, 2009 Oct 2, 2009
BTASb22 Mar 19, 2009 Oct 2, 2009
BTASb23 Mar 19, 2009 Oct 2, 2009
BTASb24 Mar 19, 2009 Oct 2, 2009
BTASb25 Mar 19, 2009 Oct 2, 2009
BTASb26 Mar 19, 2009 Oct 2, 2009
BTASb27 Mar 19, 2009 Oct 2, 2009
BTASb28 Mar 19, 2009 Oct 2, 2009
BTASb29 Mar 19, 2009 Oct 2, 2009
BTASb30 Mar 19, 2009 Oct 2, 2009
BTASe3 TuranAlem Finance B.V. Oct 2, 2009
BTASe4 Oct 2, 2009
BTASe5 Oct 2, 2009
BTASe6 Oct 2, 2009
CCBNb2 Bank CenterCredit JSC Apr 1, 2009
CSBNb8 Kaspi Bank JSC Jun 30, 2009
CSBNb9 Jun 30, 2009
DNBNb1 Danabank JSC Oct 2, 2009
DNBNb2 Oct 2, 2009
DTJLb1 Doszhan temir zholy (DTZ) JSC Oct 2, 2009
ELDSb1 EL-DOS JSC May 6, 2009
ERKAb1 ZHERSU POWER LLP Jun 29, 2009
EUBNb7 Eurasian Bank JSC Jan 21, 2009
EUBNb8 Jan 21, 2009
EUBNb9 Jan 21, 2009
EXBNb3 Eximbank Kazakhstan JSC Oct 12, 2009
GLOTb2 GLOTUR JSC Jun 2, 2009
HSBKb3 Halyk Savings Bank of Kazakhstan JSC Jun 19, 2009
HSBKb15 Jul 24, 2009
HSBKb16 Jul 24, 2009
HSBKb17 Jul 24, 2009
HSBKe1 Oct 7, 2009
HSBKe4 May 12, 2009
ISKEb1 ISKE SAT COMPANY JSC Oct 2, 2009
KAFIb1 KazAgroFinance JSC Feb 27, 2009
KAFIb2 Mar 10, 2009
Table 26 (continuation)

70
Table 26 (continuation)
Ticker Issuer Date:
listing delisting downgrade upgrade downgrade to buffer category
KAZIb1 Karaganda Asbestos and Cement Plant JSC Feb 16, 2009
KAZIb2 Jun 29, 2009
KAZIb3 May 28, 2009 Jun 29, 2009
KKGBb8 Kazkommertsbank JSC Apr 23, 2009
KKGBe6 Kazkommerts International B.V. Nov 3, 2009
KKGBe9 Apr 29, 2009
KKGBe15 Apr 29, 2009
KKGBe16 Apr 29, 2009
KKGBe17 Apr 29, 2009
KKGBe18 Jun 3, 2009 Jul 7, 2009
KKGBe19 Jun 3, 2009
KKGBe20 Jun 3, 2009
KMGZb1 National Company KazMunayGas JSC Jul 3, 2009
KMGZb2 Oct 27, 2009
KMSBb1 KOMBISNAB JSC Oct 2, 2009
KSM2b1 Combine for construction materials and structures-2 LLP
Oct 2, 2009
KZASb2 KOSTANAY MINERALS JSC Jun 17, 2009
KZDKb1 Kazakh distribution company JSC Oct 2, 2009
KZIKb5 Kazakhstan Mortgage Company JSC Apr 1, 2009
KZIKb19 Sep 23, 2009
KZNHb2 Kazneftehim JSC Oct 2, 2009
KZTCb2 KazTransCom JSC Jul 1, 2009
KZTKb2 Kazakhtelecom JSC Oct 30, 2009
MREKb2 Mangistau Electricity Distribution Network Company JSC
Mar 27, 2009
MREKb3 Mar 27, 2009
MREKb4 Mar 27, 2009
MREKb5 Mar 27, 2009
MREKb6 Mar 30, 2009
ORDBb2 Corporation Ordabasy JSC Oct 6, 2009
ORDKb1 Credit partnership ORDA credit LLP Oct 26, 2009
ORNKb1 Ornek XXI JSC Jan 30, 2009
PRKRb1 National Company Food contract corporation JSC
May 18, 2009
RMXRb1 REMIX-R JSC Oct 2, 2009
ROSAb2 ROSA JSC Oct 2, 2009
SKKZb1 National welfare fund Samruk-Kazyna JSC Mar 13, 2009
SKKZb2 Mar 13, 2009
SKKZb3 Mar 13, 2009
SKKZb4 Mar 13, 2009
SKKZb5 Mar 13, 2009
SKKZb6 Mar 13, 2009
SKKZb7 Mar 13, 2009
SKKZb8 Mar 13, 2009
SKKZb9 Mar 13, 2009
SKKZb10 Mar 13, 2009
SKKZb11 Mar 18, 2009
SKKZb12 Mar 18, 2009

Section V. Factbook
71
Ticker Issuer Date:
listing delisting downgrade upgrade downgrade to buffer category
SKKZb13 Mar 18, 2009
SKKZb14 Mar 18, 2009
SKKZb15 Mar 18, 2009
SKKZb16 Mar 18, 2009
SKKZb17 Mar 18, 2009
SKKZb18 Mar 18, 2009
SKKZb19 Mar 18, 2009
SKKZb20 Mar 18, 2009
SKKZb21 Jul 3, 2009
TEBNb9 Temirbank JSC Jun 1, 2009
TEBNb18 Feb 4, 2009
TSBNb3 Tsesnabank JSC Feb 9, 2009
TSNAb1 Corporation Tsesna JSC Jun 15, 2009
TSSMb1 Transstroymost JSC Sep 29, 2009
VITAb5 VITA JSC Oct 6, 2009
Total of new issuers – 2, initial listings – 2 82 31 1 11 76
KASE and RFCA as merged
ASBNb1 Alliance Bank JSC Dec 23, 2009
ATFBe6 ATF Capital B.V. Dec 14, 2009
CCBNb21 Bank CenterCredit JSC Dec 30, 2009
CCBNb22 Dec 30, 2009
CCBNb23 Dec 30, 2009
EKGSb1 Ekibastuz GRES-1 LLP Dec 30, 2009
KKGBb2 Kazkommertsbank JSC Dec 1, 2009
KMSBb1 KOMBISNAB JSC Dec 28, 2009
NRBNb8 Nurbank JSC Nov 30, 2009
ORDBb2 Corporation Ordabasy JSC Dec 28, 2009
VMZVb1 Vostokmashzavod JSC Nov 26, 2009
Total of new issuers – 2, initial listings – 2 7 4 0 0 0
Total of new issuers – 5, initial listings – 5 91 48 1 12 90
Refer to Notes to Factbook
Table 26 (continuation)
Table 27
Admission category Securities Issuers
number trend number trend
Rated debt 30 +8 11 +1
Non-rated debt of first subcategory 177 43 +4
Non-rated debt of second subcategory 30 28
Debt of buffer category 78 12
Total 315 +51 90
Refer to Notes to Factbook

72
Table 28
Industry As on January 1, 2010 As on January 1, 2009
bn KZT m USD share, % bn KZT m USD share, %
Finance 2,954.9 19,904.0 94.1 1,344.4 11,129.7 87.6
Manufacturing 55.5 373.6 1.8 51.1 423.3 3.3
Consumer staples 48.6 327.4 1.5 48.2 399.2 3.1
Utilities 27.4 184.4 0.9 21.0 174.2 1.4
Mining 21.5 145.0 0.7 18.1 149.6 1.2
Energy 14.3 96.3 0.5 29.8 247.0 1.9
Consumer discretionary 12.9 86.9 0.4 7.6 63.3 0.5
Telecommunications 4.3 29.2 0.1 2.9 24.4 0.2
IT 1.9 12.8 0.1 10.7 88.6 0.7
Health care 0.3 2.2 <0.1 0.9 7.5 0.1
Total 3,141.7 21,161.7 100.0 1,534.9 12,706.9 100.0
Refer to Notes to Factbook
Month CS exchange sector Total
special trade on placement purchase and sale
th. USD m KZT th. USD m KZT th. USD m KZT
January 40,071.2 4,848.6 276,958.0 33,604.2 317,029.2 38,452.8
February – – 356,158.5 52,155.9 356,158.5 52,155.9
March – – 187,862.2 28,353.3 187,862.2 28,353.3
I quarter 40,071.2 4,848.6 820,978.6 114,113.4 861,049.9 118,962.1
April – – 116,262.9 17,514.3 116,262.9 17,514.3
May – – 215,655.6 32,428.8 215,655.6 32,428.8
June – – 383,510.9 57,661.7 383,510.9 57,661.7
II quarter – – 715,429.4 107,604.8 715,429.4 107,604.8
July 180.4 27.2 297,078.2 44,752.1 297,258.6 44,779.2
August 5,304.2 799.6 86,304.0 13,014.2 91,608.2 13,813.8
September – – 114,640.9 17,297.6 114,640.9 17,297.6
III quarter 5,484.6 826.8 498,023.2 75,063.8 503,507.8 75,890.6
October – – 212,900.3 32,097.9 212,900.3 32,097.9
November – – 171,070.2 25,685.1 171,070.2 25,685.1
December 8,712.0 1,293.2 164,979.6 24,521.8 173,691.6 25,815.0
IV quarter 8,712.0 1,293.2 548,950.0 82,304.8 557,662.1 83,598.0
Total in Y2009 54,267.9 6,968.6 2,583,381.2 379,086.9 2,637,649.1 386,055.5
Structure 2.1 % 97.9 % 100.0 %
Y2008:
Total 23,847.1 2,867.4 3,628,149.9 436,198.6 3,651,997.0 439,065.9
Structure 0.7 % 99.3 % 100.0 %
Trend Y2009 to Y2008:
cash +30,420.8 +4,101.2
percent +127.6 +143.0
Refer to Notes to Factbook
Table 29
Corporate bond traded value on KASE in Y2009 (in terms of months, quarters and sectors)

Section V. Factbook
73
Table 30
Corporate bond traded value industrial structure on KASE in Y2009 and Y2008
Industry Traded value and structure Structure of official list as on Jan 1, 2010,
%Y2009 Y2008
bn KZT m USD share, % bn KZT m USD share, %
Finance 290.5 1,985.4 76.6 333.0 2,769.7 76.3 94.1
Consumer staples 42.5 287.0 11.2 9.8 81.3 2.2 1.5
Manufacturing 14.0 96.0 3.7 62.4 518.7 14.3 1.8
Utilities 11.7 78.0 3.1 14.0 116.2 3.2 0.9
Energy 7.1 47.7 1.9 7.5 63.0 1.7 0.5
Mining 4.8 32.2 1.3 5.1 42.2 1.2 0.7
IT 3.9 26.5 1.0 1.7 14.3 0.4 0.1
Telecommunications 2.3 15.5 0.6 <0.1 0.1 <0.1 0.1
Consumer discretionary 2.1 14.9 0.6 2.1 17.4 0.5 0.4
Health care <0.1 0.2 <0.1 0.6 5.3 0.1 <0.1
Total 379.1 2,583.4 100.0 436.2 3,628.1 100.0 100.0
Refer to Notes to Factbook
Table 31
KASE corporate bond market performance in Y2009 vs. Y2008
Indicator Measure Y2009 Y2008 Y2009 vs Y2008
Trade days 249 249 0 %
Productive days 249 249 0 %
Productivity % 100.0 100.0 0 pp
I. Market transactions
total transaction value m KZT 371,612.9 431,698.2
m USD 2,532.5 3,590.7
transactions 8,226 5,043 +63.1 %
share in traded value in purchase and sale sector % 98.0 99.0
share in number of transactions in purchase and sale % 99.2 98.7 +0.6 pp
average transaction value m KZT 45.2 85.6
m USD 0.3 0.7
transactions on average per day 33 20 +63.1 %
average value of such type of transaction m KZT 1,492.4 1,733.7
m USD 10.2 14.4
II. Nego transactions
total transaction value m KZT 7,474.0 4,500.4 +66.1 %
m USD 50.9 37.5 +35.9 %
transactions 63 68
share in traded value in purchase and sale sector % 2.0 1.0 +0.9 pp
share in number of transactions in purchase and sale % 0.8 1.3
average transaction value m KZT 118.6 66.2 +79.3 %
m USD 0.8 0.6 +46.7 %
transactions on average per day <1 <1
average value of such type of transaction m KZT 30.0 18.1 +66.1 %
m USD 0.2 0.2 +35.9 %
III. Special trades on placement
transactions 7 5 +40.0 %
average transaction value m KZT 995.5 573.5 +73.6 %
m USD 7.8 4.8 +62.5 %

74
Table 32
Month Traded value in terms of categories Total, Trans-actionsRated Non-rated of I
subcategoryNon-rated of II
subcategoryBuffer category
m KZT share, % m KZT share, % m KZT share, % m KZT share, %
January 5,417.9 10.73 28,202.7 10.1 4,832.3 8.9 X X 38,452.8 904
February 3,090.1 6.12 37,829.8 13.5 11,235.9 20.7 X X 52,155.9 915
March 828.6 1.64 24,622.8 8.8 2,902.0 5.3 X X 28,353.3 910
April 2,708.1 5.36 7,229.9 2.6 7,576.3 13.9 X X 17,514.3 638
May 15,019.1 29.74 14,404.7 5.2 3,005.0 5.5 X X 32,428.8 657
June 9,679.7 19.17 44,119.6 15.8 3,862.4 7.1 X X 57,661.7 858
July 2,388.5 4.73 37,650.0 13.5 4,740.7 8.7 X X 44,779.2 644
August 1,091.3 2.16 12,228.7 4.4 493.8 0.9 X X 13,813.8 510
September 2,737.0 5.42 13,034.1 4.7 1,526.5 2.8 X X 17,297.6 684
October 2,004.0 3.97 26,923.4 9.6 3,170.5 5.8 0 0 32,097.9 614
November 3,839.9 7.60 13,887.9 5.0 6,763.4 12.4 1,193.9 73.6 25,685.1 541
December 1,699.6 3.37 19,431.4 7.0 4,255.7 7.8 428.3 26.4 25,815.0 421
Total 50,503.8 100.0 279,565.0 100.0 54,364.4 100.0 1,622.2 100.0 386,055.5 8,296
Refer to Notes to Factbook
Indicator Measure Y2009 Y2008 Y2009 vs Y2008
total value of such type of transactions m KZT 6,968.6 2,867.4 +143.0 %
m USD 54.3 23.8 +127.6 %
Refer to Notes to Factbook
Table 31 (continuation)
Table 33
Corporate bond trade turnover (gross) on KASE, Y2009 vs. Y2008 in terms of investor categories
Picture 9
Exchange corporate bond market capitalization in Y2009 (bn USD)
Investors Y2009 Y2008 Trend%bn
KZTshare,
%bn
KZTshare,
%
Clients of brokerage and dealer companies
363.4 47.5 537.5 61.4
includingindividuals
121.6 15.9 117.3 13.4 +3.7
PAIMO (PA) 253.0 33.1 153.7 17.6 +64.6
Brokerage and dealer companies
58.6 7.7 97.5 11.1
STBs 90.2 11.8 86.6 9.9 +4.2
Total 765.1 100 875.3 100
including non-residents
8.9 1.2 110.1 12.6
Refer to Notes to Factbook

Section V. Factbook
75
Picture 10
KASE_BC and weighted average corporate bond net price in Y2009
Picture 11
KASE_BY index dynamics in Y2009
Table 34
Top ten operators on secondary corporate bond market in Y2009
Rank in Y2009 Rank in Y2008 Company Activity indicator Ka
1 7 ASYL-INVEST JSC 3.64
2 1 BTA Securities JSC 2.64
3 2 Investment Financial House RESMI JSC 2.56
4 5 Asia Broker Services JSC 2.43
5 11 Centras Securities JSC 1.95
6 10 Kazkommerts Securities JSC (Subsidiary of Kazkommertsbank JSC) 1.86
7 4 BCC Invest JSC - Subsidiary of Bank CenterCredit JSC 1.78
8 3 Tengry Finance JSC 1.58
9 6 Astana-Finance JSC 1.35
10 28 Brokerage Company Astana-Finance JSC 1.34
Refer to Notes to Factbook

76
Table 35
GS traded value on KASE in Y2009 (in terms of months, quarters and sectors)
Treasury Bills
Month GS exchange market sector Total KASEproportion, %primary market secondary market
th. USD m KZT th. USD m KZT th. USD m KZT
January 72,366.9 8,797.6 270,830.7 32,866.3 343,197.6 41,663.9 24.1
February 204,626.6 30,613.7 192,571.1 28,067.1 397,197.7 58,680.9 25.8
March 403,614.4 60,840.0 143,036.4 21,559.5 546,650.8 82,399.5 46.3
I quarter 680,607.9 100,251.4 606,438.2 82,492.9 1,287,046.1 182,744.3 31.6
April 338,808.7 51,078.7 434,874.4 65,495.4 773,683.1 116,574.1 29.7
May 354,609.4 53,321.6 297,398.6 44,723.4 652,008.0 98,045.0 32.5
June 399,421.9 60,060.0 376,580.3 56,639.4 776,002.2 116,699.4 36.8
II quarter 1,092,840.0 164,460.2 1,108,853.3 166,858.2 2,201,693.3 331,318.4 32.7
July 428,809.2 64,600.0 610,630.1 91,991.6 1,039,439.4 156,591.6 36.9
August 490,438.4 73,956.7 591,246.7 89,152.0 1,081,685.1 163,108.6 31.6
September 491,417.8 74,148.1 433,535.7 65,426.7 924,953.5 139,574.9 77.3
III quarter 1,410,665.5 212,704.8 1,635,412.5 246,570.3 3,046,078.0 459,275.1 41.0
October 498,908.5 75,220.7 243,529.2 36,726.1 742,437.7 111,946.9 51.6
November 446,065.3 66,731.5 402,860.7 60,181.5 848,926.0 126,913.0 21.3
December 529,599.0 78,745.4 787,417.6 117,168.0 1,317,016.6 195,913.4 39.0
IV quarter 1,474,572.8 220,697.6 1,433,807.5 214,075.7 2,908,380.2 434,773.3 33.1
Total in Y2009 4,658,686.2 698,114.0 4,784,511.4 709,997.1 9,443,197.6 1,408,111.0 35.0
Structure 49.3 % 50.7 % 100.0 %
Y2008:
Total 3,868,939.4 465,162.1 3,935,877.7 473,237.1 7,804,817.2 938,399.2 24.1
Structure 49.6 % 50.4 % 100.0 %
Trend Y2009 to Y2008:
cash +789,746.8 +232,951.9 +848,633.7 +236,759.9 +1,638,380.4 +469,711.8
percent +20.4 +50.1 +21.6 +50.0 +21.0 +50.1
Refer to Notes to Factbook
Table 36
GS exchange market in Y2009 and Y2008
Indicator Measure Y2009 Y2008 Y2009 to Y2008
Trade days 249 249 0 %
Productive days 243 222 +9.5 %
Productivity % 97.6 89.2 +8.4 pp
I. Purchase and sale on secondary market
total value of such type of transactions m KZT 709,997.1 473,237.1 +50.0 %
m USD 4,784.5 3,935.9 +21.6 %
share in GS exchange traded value % 50.7 50.4 +0.2 pp
transactions 2,614 1,474 +77.3 %
average transaction value m KZT 271.6 321.1
m USD 1.8 2.7
transactions on average per day 11 7 +62.0 %
total value of such type of transactions m KZT 2,921.8 2,131.7 +37.1 %
m USD 19.7 17.7 +11.1 %

Section V. Factbook
77
Table 36 (continuation)
Indicator Measure Y2009 Y2008 Y2009 to Y2008
II. Special trade on placement
total value of transactions of such type m KZT 698,114.0 465,162.1 +50.1 %
m USD 4,658.7 3,868.9 +20.4 %
share in GS exchange traded value % 49.3 49.6
transactions 916 549 +66.8 %
average transaction value m KZT 762.1 847.3
m USD 5.1 7.0
Picture 12
Refer to Notes to Factbook

78
Tab
le 3
7
KM
F G
S p
lace
men
ts o
n K
ASE
in
Y2
00
9
Plac
emen
tm
etho
dPl
acem
ent
date
Trad
e su
bjec
tAc
tive
ord
ers
Acti
ve o
rder
s,m
teng
eBi
d to
ask
, %
Wei
ghte
dav
erag
e bi
dYi
eld
of b
id,
% A
PRVa
lue
ofbo
rrow
ing
Valu
e of
bo
rrow
ing,
Wei
ghte
dav
erag
e,%
of n
omin
al
Yiel
d at
tr
ade,
% A
PRIs
sue
valu
e (a
ccum
ulat
ed),
m te
nge
MKM
006_
0187
(KZK
1KY0
6187
3, 1
00 te
nge,
Sep
24,
200
9 –
Jun
17, 2
010,
act
ual/
actu
al),
Auct
ion
Sep
24, 2
009
bond
pric
e55
0,91
0,00
053
,542
.536
7.3
97.1
893
5.83
150,
200,
000
14,7
03.6
97.8
94.
3414
,703
.6
Repe
ated
auct
ion
Sep
28, 2
009
bond
pric
e13
2,12
0,00
012
,933
.926
4.2
97.8
913
4.44
110,
000,
000
10,7
73.3
97.9
44.
3425
,476
.9
MKM
006_
0188
(KZK
1KM
0618
81, 1
00 te
nge,
Nov
4, 2
009
– M
ay 4
, 201
0, a
ctua
l/ac
tual
),
Auct
ion
Nov
4, 2
009
bond
pric
e54
1,80
4,20
052
,925
.645
1.5
97.6
841
4.78
120,
000,
000
11,7
42.8
97.8
64.
4212
,000
.0
MKM
006_
0189
(KZK
1KY0
6189
9, 1
00 te
nge,
Dec
8, 2
009
– Ju
n 8,
201
0, a
ctua
l/ac
tual
),
Auct
ion
Dec
8, 2
009
bond
pric
e68
8,97
9,94
867
,602
.557
4.1
98.1
196
3.84
133,
333,
333
13,1
72.4
98.7
92.
4513
,172
.4
MKM
009_
0014
(KZK
1KM
0901
46, 1
00 te
nge,
Sep
17,
200
9 –
Jun
17, 2
010,
act
ual/
actu
al),
Auct
ion
Sep
17, 2
009
bond
pric
e21
3,08
0,00
020
,485
.514
2.1
96.1
399
5.37
74,5
80,0
007,
215.
796
.75
4.49
7,21
5.7
MKM
009_
0015
(KZK
1KM
0901
53, 1
00 te
nge,
Oct
1, 2
009
– Ju
l 1, 2
010,
act
ual/
actu
al),
Auct
ion
Oct
1, 2
009
bond
pric
e46
7,36
0,00
044
,864
.138
9.5
95.9
947
5.58
120,
000,
000
11,5
78.2
96.4
94.
8711
,578
.2
MKM
012_
0097
(KZK
1KY0
1097
6, 1
00 te
nge,
Jan
23, 2
009
– Ja
n 23
, 201
0, a
ctua
l/ac
tual
),
Auct
ion
Jan
23, 2
009
bond
pric
e41
,338
,680
3,78
7.1
41.3
91.6
107
9.16
2,48
3,33
323
1.0
93.0
27.
5023
1.0
MKM
012_
0098
(KZK
1KY0
1098
4, 1
00 te
nge,
Feb
11,
200
9 –
Feb
11,
201
0, a
ctua
l/ac
tual
),
Auct
ion
Feb
11, 2
009
bond
pric
e79
,520
,000
7,39
3.6
159.
092
.978
27.
5576
,720
,000
7,13
6.7
93.0
27.
507,
136.
8
MKM
012_
0099
(KZK
1KY0
1099
2, 1
00 te
nge,
Sep
16,
200
9 –
Sep
16,
201
0, a
ctua
l/ac
tual
),
Auct
ion
Sep
16, 2
009
bond
pric
e18
1,49
7,00
017
,279
.612
1.0
95.2
058
5.04
150,
000,
000
14,3
40.8
95.6
14.
6014
,340
.8
MKM
012_
0100
(KZK
1KY0
1100
8, 1
00 te
nge,
Oct
28,
200
9 –
Oct
28,
201
0, a
ctua
l/ac
tual
),
Auct
ion
Oct
28,
200
9bo
nd p
rice
510,
649,
900
48,4
45.2
425.
594
.869
75.
4125
0,14
5,00
023
,816
.895
.21
5.03
25,0
14.5
MKM
012_
0101
(KZK
1KY0
1101
6, 1
00 te
nge,
Nov
24,
200
9 –
Nov
24,
201
0, a
ctua
l/ac
tual
),
Auct
ion
Nov
24,
200
9bo
nd p
rice
862,
105,
800
82,0
09.2
718.
495
.126
65.
1212
0,00
0,00
011
,517
.095
.97
4.19
11,5
17.0
MKM
012_
0102
(KZK
1KY0
1102
4, 1
00 te
nge,
Dec
23,
200
9 –
Dec
23,
201
0, a
ctua
l/ac
tual
),
Auct
ion
Dec
23,
200
9bo
nd p
rice
452,
590,
000
43,4
93.6
348.
196
.099
54.
0620
8,00
0,00
020
,143
.096
.84
3.26
20,1
43.0
MO
M02
4_00
76 (K
ZK2K
Y020
768,
1,0
00 te
nge,
Mar
4, 2
009
– M
ar 4
, 201
1, s
emia
nnua
l cou
pon
8.0
0 %
APR
, 30/
360)
Auct
ion
Mar
4, 2
009
coup
on ra
te22
,690
,000
22,6
90.0
453.
88.
0963
8.10
15,0
00,0
0015
,000
.010
0.00
8.00
15,0
00.0
MO
M02
4_00
77 (K
ZK2K
Y020
776,
1,0
00 te
nge,
Jul 1
, 200
9 –
Jul 1
, 201
1, s
emia
nnua
l cou
pon
6.8
0 %
APR
, 30/
360)
Auct
ion
Jul 1
, 200
9co
upon
rate
64,8
39,0
0064
,839
.064
8.39
7.04
947.
0512
,000
,000
12,0
00.0
100.
006.
8012
,000
.0
MO
M02
4_00
78 (K
ZK2K
Y020
784,
1,0
00 te
nge,
Nov
12,
200
9 –
Nov
12,
201
1, s
emia
nnua
l cou
pon
5.2
0 %
APR
, 30/
360)
Auct
ion
Nov
12,
200
9co
upon
rate
64,9
55,0
0064
,955
.054
1.3
5.78
145.
7815
,725
,000
15,7
25.0
100.
005.
2015
,725
.0

Section V. Factbook
79
Tab
le 3
7 (
con
tin
uati
on
)
Plac
emen
tm
etho
dPl
acem
ent
date
Trad
e su
bjec
tAc
tive
ord
ers
Acti
ve o
rder
s,m
teng
eBi
d to
ask
, %
Wei
ghte
dav
erag
e bi
dYi
eld
of b
id,
% A
PRVa
lue
ofbo
rrow
ing
Valu
e of
bo
rrow
ing,
Wei
ghte
dav
erag
e,%
of n
omin
al
Yiel
d at
tr
ade,
% A
PRIs
sue
valu
e (a
ccum
ulat
ed),
m te
nge
MO
M03
6_00
69 (K
ZK2K
Y030
692,
1,0
00 te
nge,
Jan
8, 2
009
– Ja
n 8,
201
2, s
emia
nnua
l cou
pon
8.4
0 %
APR
, 30/
360)
Auct
ion
Jan
8, 2
009
coup
on ra
te1,
481,
600
1,48
1.6
14.8
8.40
898.
411,
466,
600
1,46
6.6
100.
008.
401,
466.
6
MO
M03
6_00
71 (K
ZK2K
Y030
718,
1,0
00 te
nge,
Mar
18,
200
9 –
Mar
18,
201
2, s
emia
nnua
l cou
pon
8.4
0 %
APR
, 30/
360)
Auct
ion
Mar
18,
200
9co
upon
rate
18,6
50,0
0018
,650
.037
38.
4052
8.41
15,0
00,0
0015
,000
.010
0.00
8.40
15,0
00.0
MO
M03
6_00
72 (K
ZK2K
Y030
726,
1,0
00 te
nge,
Apr
8, 2
009
– A
pr 8
, 201
2, s
emia
nnua
l cou
pon
8.0
9 %
APR
, 30/
360)
Auct
ion
Apr 8
, 200
9co
upon
rate
18,5
07,0
0018
,507
.037
0.1
8.00
008.
0013
,447
,000
13,4
47.0
100.
008.
0913
,447
.0
MO
M03
6_00
73 (K
ZK2K
Y030
734,
1,0
00 te
nge,
May
13,
200
9 –
May
13,
201
2, s
emia
nnua
l cou
pon
7.5
0 %
APR
, 30/
360)
Auct
ion
May
13,
200
9co
upon
rate
13,7
44,9
1813
,744
.927
4.9
7.67
277.
6710
,484
,918
10,4
84.9
100.
007.
5010
,484
.9
MO
M03
6_00
74 (K
ZK2K
Y030
742,
1,0
00 te
nge,
Jun
10, 2
009
– Ju
n 10
, 201
2, s
emia
nnua
l cou
pon
7.3
0 %
APR
, 30/
360)
Auct
ion
Jun
10, 2
009
coup
on ra
te31
,212
,000
31,2
12.0
312.
17.
5332
7.53
13,4
66,6
6613
,466
.710
0.00
7.30
13,4
66.7
MO
M03
6_00
75 (K
ZK2K
Y030
759,
1,0
00 te
nge,
Jul 1
5, 2
009
– Ju
l 15,
201
2, s
emia
nnua
l cou
pon
6.0
0 %
APR
, 30/
360)
Auct
ion
Jul 1
5, 2
009
coup
on ra
te51
,928
,600
51,9
28.6
519.
36.
1774
6.18
12,0
00,0
0012
,000
.010
0.00
6.00
12,0
00.0
MO
M03
6_00
76 (K
ZK2K
Y030
767,
1,0
00 te
nge,
Aug
5, 2
009
– A
ug 5
, 201
2, s
emia
nnua
l cou
pon
5.4
9 %
APR
, 30/
360)
Auct
ion
Aug
5, 2
009
coup
on ra
te44
,165
,780
44,1
65.8
368.
05.
6404
5.64
13,8
66,6
6613
,866
.710
0.00
5.49
13,8
66.7
MO
M03
6_00
77 (K
ZK2K
Y030
775,
1,0
00 te
nge,
Sep
2, 2
009
– S
ep 2
, 201
2, s
emia
nnua
l cou
pon
5.5
0 %
APR
, 30/
360)
Auct
ion
Sep
2, 2
009
coup
on ra
te19
,568
,000
19,5
68.0
130.
57.
0619
7.06
14,7
68,0
0014
,768
.010
0.00
5.50
14,7
68.0
MO
M03
6_00
78 (K
ZK2K
Y030
783,
1,0
00 te
nge,
Dec
2, 2
009
– D
ec 2
, 201
2, s
emia
nnua
l cou
pon
5.1
0 %
APR
, 30/
360)
Auct
ion
Dec
2, 2
009
coup
on ra
te65
,800
,000
65,8
00.0
548.
35.
5548
5.55
15,0
00,0
0015
,000
.010
0.00
5.10
15,0
00.0
MO
M04
8_00
38 (K
ZK2K
Y040
386,
1,0
00 te
nge,
Apr
29,
200
9 –
Apr
29,
201
3, s
emia
nnua
l cou
pon
7.8
0 %
APR
, 30/
360)
Auct
ion
Apr 2
9, 2
009
coup
on ra
te21
,568
,000
21,5
68.0
431.
48.
0408
8.04
5,00
0,00
05,
000.
010
0.00
7.80
5,00
0.0
MO
M04
8_00
39 (K
ZK2K
Y030
734,
1,0
00 te
nge,
May
27,
200
9 –
May
27,
201
3, s
emia
nnua
l cou
pon
7.5
0 %
APR
, 30/
360)
Auct
ion
May
27,
200
9co
upon
rate
21,7
18,0
0021
,718
.043
4.4
7.98
907.
997,
826,
666
7,82
6.7
100.
007.
507,
826.
7
MO
M04
8_00
40 (K
ZK2K
Y040
402,
1,0
00 te
nge,
Oct
14,
200
9 –
Oct
14,
201
3, s
emia
nnua
l cou
pon
6.0
0 %
APR
, 30/
360)
Auct
ion
Oct
14,
200
9co
upon
rate
30,8
93,0
0030
,893
.025
7.4
6.23
486.
2316
,909
,000
16,9
09.0
100.
006.
0016
,909
.0
MO
M04
8_00
41 (K
ZK2K
Y040
410,
1,0
00 te
nge,
Dec
15,
200
9 –
Dec
15,
201
3, s
emia
nnua
l cou
pon
5.2
0 %
APR
, 30/
360)
Auct
ion
Dec
15,
200
9co
upon
rate
29,9
60,0
0029
,960
.024
9.7
5.92
905.
9310
,260
,000
10,2
60.0
100.
005.
2010
,260
.0
MO
M06
0_00
29 (K
ZK2K
Y050
294,
1,0
00 te
nge,
Jan
28, 2
009
– Ja
n 28
, 201
4, s
emia
nnua
l cou
pon
8.7
0 %
APR
, 30/
360)
Auct
ion
Jan
28, 2
009
coup
on ra
te8,
620,
000
8,62
0.0
86.2
8.72
918.
736,
100,
000
6,10
0.0
100.
008.
706,
100.
0
MO
M06
0_00
30 (K
ZK2K
Y050
302,
1,0
00 te
nge,
Feb
18,
200
9 –
Feb
18,
201
4, s
emia
nnua
l cou
pon
8.7
0 %
APR
, 30/
360)
Auct
ion
Feb
18, 2
009
coup
on ra
te5,
250,
000
5,25
0.0
105.
08.
7749
8.77
4,20
0,00
04,
200.
010
0.00
8.70
4,20
0.0

80
Tab
le 3
7 (
con
tin
uati
on
)
Plac
emen
tm
etho
dPl
acem
ent
date
Trad
e su
bjec
tAc
tive
ord
ers
Acti
ve o
rder
s,m
teng
eBi
d to
ask
, %
Wei
ghte
dav
erag
e bi
dYi
eld
of b
id,
% A
PRVa
lue
ofbo
rrow
ing
Valu
e of
bo
rrow
ing,
Wei
ghte
dav
erag
e,%
of n
omin
al
Yiel
d at
tr
ade,
% A
PRIs
sue
valu
e (a
ccum
ulat
ed),
m te
nge
MO
M06
0_00
31 (K
ZK2K
Y050
310,
1,0
00 te
nge,
Aug
19,
200
9 –
Aug
19,
201
4, s
emia
nnua
l cou
pon
4.9
0 %
APR
, 30/
360)
Auct
ion
Aug
19, 2
009
coup
on ra
te18
,122
,529
18,1
22.5
151.
0210
755.
3309
5.33
12,2
23,3
3312
,223
.310
0.00
4.90
12,2
23.3
MU
M07
2_00
04 (K
ZKD
KY06
0041
, 1,0
00 te
nge,
Apr
1, 2
009
– A
pr 1
, 201
5, a
nnua
l cou
pon
8.20
% A
PR, 3
0/36
0)
Auct
ion
Apr 1
, 200
9co
upon
rate
14,7
04,0
0014
,704
.029
4.1
8.43
228.
433,
720,
000
3,72
0.0
100.
008.
203,
720.
0
MU
M08
4_00
03 (K
ZKD
KY07
0032
, 1,0
00 te
nge,
Feb
25,
200
9 –
Feb
25,
201
6, a
nnua
l cou
pon
8.75
% A
PR, 3
0/36
0)
Auct
ion
Feb
25, 2
009
coup
on ra
te13
,100
,000
13,1
00.0
262.
09.
2191
9.22
3,60
0,00
03,
600.
010
0.00
8.75
3,60
0.0
MU
M08
4_00
04 (K
ZKD
KY07
0040
, 1,0
00 te
nge,
Mar
11,
200
9 –
Mar
11,
201
6, a
nnua
l cou
pon
8.75
% A
PR, 3
0/36
0)
Auct
ion
Mar
11,
200
9co
upon
rate
18,1
70,0
0018
,170
.036
3.4
8.74
478.
7415
,000
,000
15,0
00.0
100.
008.
7515
,000
.0
MU
M08
4_00
05 (K
ZKD
KY07
0057
, 1,0
00 te
nge,
Jun
3, 2
009
– Ju
n 3,
201
6, a
nnua
l cou
pon
7.90
% A
PR, 3
0/36
0)
Auct
ion
Jun
3, 2
009
coup
on ra
te16
,806
,000
16,8
06.0
168.
17.
9212
7.92
9,26
0,00
09,
260.
010
0.00
7.90
9,26
0.0
MU
M08
4_00
06 (K
ZKD
KY07
0065
, 1,0
00 te
nge,
Sep
9, 2
009
– S
ep 9
, 201
6, a
nnua
l cou
pon
6.00
% A
PR, 3
0/36
0)
Auct
ion
Sep
9, 2
009
coup
on ra
te5,
480,
100
5,48
0.1
36.5
6.58
846.
592,
620,
100
2,62
0.1
100.
006.
002,
620.
1
MU
M08
4_00
07 (K
ZKD
KY07
0073
, 1,0
00 te
nge,
Oct
7, 2
009
– O
ct 7
, 201
6, a
nnua
l cou
pon
6.00
% A
PR, 3
0/36
0)
Auct
ion
Oct
7, 2
009
coup
on ra
te25
,756
,000
25,7
56.0
214.
67.
5442
7.54
1,66
6,66
61,
666.
710
0.00
6.00
1,66
6.7
MU
M09
6_00
02 (K
ZKD
KY08
0023
, 1,0
00 te
nge,
Mar
25,
200
9 –
Mar
25,
201
7, a
nnua
l cou
pon
8.20
% A
PR, 3
0/36
0)
Auct
ion
Mar
25,
200
9co
upon
rate
9,46
0,00
09,
460.
018
9.2
8.73
468.
7384
0,00
084
0.0
100.
008.
2084
0.0
MU
M09
6_00
03 (K
ZKD
KY08
0031
, 1,0
00 te
nge,
Apr
22,
200
9 –
Apr
22,
201
7, a
nnua
l cou
pon
8.10
% A
PR, 3
0/36
0)
Auct
ion
Apr 2
2, 2
009
coup
on ra
te21
,765
,000
21,7
65.0
435.
38.
2069
8.21
11,1
66,6
6611
,166
.710
0.00
8.10
11,1
66.7
MU
M09
6_00
04 (K
ZKD
KY08
0049
, 1,0
00 te
nge,
Jul 8
, 200
9 –
Jul 8
, 201
7, a
nnua
l cou
pon
7.10
% A
PR, 3
0/36
0)
Auct
ion
Jul 8
, 200
9co
upon
rate
28,8
50,0
0028
,850
.028
8.5
7.28
577.
2911
,000
,000
11,0
00.0
100.
007.
1011
,000
.0
MU
M09
6_00
05 (K
ZKD
KY08
0056
, 1,0
00 te
nge,
Aug
12,
200
9 –
Aug
12,
201
2, a
nnua
l cou
pon
5.20
% A
PR, 3
0/36
0)
Auct
ion
Aug
12, 2
009
coup
on ra
te75
,914
,000
75,9
14.0
632.
65.
5694
5.57
18,0
00,0
0018
,000
.010
0.00
5.20
18,0
00.0
MU
M09
6_00
06 (K
ZKD
KY08
0064
, 1,0
00 te
nge,
Nov
10,
200
9 –
Nov
10,
201
7, a
nnua
l cou
pon
6.50
% A
PR, 3
0/36
0)
Auct
ion
Nov
10,
200
9co
upon
rate
11,0
85,7
0011
,085
.792
.47.
6003
7.60
413,
333
413.
310
0.00
6.50
413.
3
MU
M10
8_00
01 (K
ZKD
KY09
0014
, 1,0
00 te
nge,
Jul 2
2, 2
009
– Ju
l 22,
201
8, a
nnua
l cou
pon
6.20
% A
PR, 3
0/36
0)
Auct
ion
Jul 2
2, 2
009
coup
on ra
te21
,453
,000
21,4
53.0
214.
56.
5293
6.53
14,6
00,0
0014
,600
.010
0.00
6.20
14,6
00.0
MU
M10
8_00
02 (K
ZKD
KY09
0022
, 1,0
00 te
nge,
Sep
23,
200
9 –
Sep
23,
201
8, a
nnua
l cou
pon
6.50
% A
PR, 3
0/36
0)
Auct
ion
Sep
23, 2
009
coup
on ra
te8,
516,
000
8,51
6.0
56.8
7.04
967.
054,
060,
000
4,06
0.0
100.
006.
504,
060.
0
MU
M10
8_00
03 (K
ZKD
KY09
0030
, 1,0
00 te
nge,
Nov
18,
200
9 –
Nov
18,
201
8, a
nnua
l cou
pon
6.50
% A
PR, 3
0/36
0)
Auct
ion
Nov
18,
200
9co
upon
rate
50,2
00,0
0050
,200
.041
8.3
7.77
747.
7815
,333
,333
15,3
33.3
100.
006.
5015
,333
.3

Section V. Factbook
81
Plac
emen
tm
etho
dPl
acem
ent
date
Trad
e su
bjec
tAc
tive
ord
ers
Acti
ve o
rder
s,m
teng
eBi
d to
ask
, %
Wei
ghte
dav
erag
e bi
dYi
eld
of b
id,
% A
PRVa
lue
ofbo
rrow
ing
Valu
e of
bo
rrow
ing,
Wei
ghte
dav
erag
e,%
of n
omin
al
Yiel
d at
tr
ade,
% A
PRIs
sue
valu
e (a
ccum
ulat
ed),
m te
nge
MU
M12
0_00
02 (K
ZKD
KY10
0029
, 1,0
00 te
nge,
Apr
15,
200
9 –
Apr
15,
201
9, a
nnua
l cou
pon
8.20
% A
PR, 3
0/36
0)
Auct
ion
Apr 1
5, 2
009
coup
on ra
te11
,545
,000
11,5
45.0
230.
98.
2344
8.23
7,74
5,00
07,
745.
010
0.00
8.20
7,74
5.0
MU
M12
0_00
03 (K
ZKD
KY10
0037
, 1,0
00 te
nge,
May
6, 2
009
– M
ay 6
, 201
9, a
nnua
l cou
pon
8.10
% A
PR, 3
0/36
0)
Auct
ion
May
6, 2
009
coup
on ra
te19
,510
,000
19,5
10.0
390.
28.
1245
8.12
16,0
60,0
0016
,060
.010
0.00
8.10
16,0
60.0
MU
M12
0_00
04 (K
ZKD
KY10
0045
, 1,0
00 te
nge,
Jun
17, 2
009
– Ju
n 17
, 201
9, a
nnua
l cou
pon
7.80
% A
PR, 3
0/36
0)
Auct
ion
Jun
17, 2
009
coup
on ra
te27
,534
,000
27,5
34.0
275.
37.
8952
7.90
15,0
00,0
0015
,000
.010
0.00
7.80
15,0
00.0
MU
M12
0_00
05 (K
ZKD
KY10
0052
, 1,0
00 te
nge,
Aug
26,
200
9 –
Aug
26,
201
9, a
nnua
l cou
pon
6.00
% A
PR, 3
0/36
0)
Auct
ion
Aug
26, 2
009
coup
on ra
te19
,195
,000
19,1
95.0
160.
09.
5191
9.52
10,8
66,6
6610
,866
.710
0.00
6.00
10,8
66.7
MU
M13
2_00
01 (K
ZKD
KY11
0010
, 1,0
00 te
nge,
Oct
21,
200
9 –
Oct
21,
202
0, a
nnua
l cou
pon
7.00
% A
PR, 3
0/36
0)
Auct
ion
Oct
21,
200
9co
upon
rate
8,82
0,00
08,
820.
073
.57.
6089
7.61
4,25
0,00
04,
250.
010
0.00
7.00
4,25
0.0
MU
M15
6_00
01 (K
ZKD
KY13
0018
, 1,0
00 te
nge,
Dec
11,
200
9 –
Dec
11,
202
2, a
nnua
l cou
pon
6.80
% A
PR, 3
0/36
0)
Auct
ion
Dec
11,
200
9co
upon
rate
11,4
10,0
0011
,410
.087
.86.
7276
6.73
7,07
0,00
07,
070.
010
0.00
6.80
7,07
0.0
MU
M18
0_00
01 (K
ZKD
KY15
0016
, 1,0
00 te
nge,
May
20,
200
9 –
May
20,
202
4, a
nnua
l cou
pon
8.05
% A
PR, 3
0/36
0)
Auct
ion
May
20,
200
9co
upon
rate
15,1
00,0
0015
,100
.030
2.0
8.16
608.
176,
950,
000
6,95
0.0
100.
008.
056,
950.
0
MU
M18
0_00
02 (K
ZKD
KY15
0024
, 1,0
00 te
nge,
Jun
24, 2
009
– Ju
n 24
, 202
4, a
nnua
l cou
pon
7.65
% A
PR, 3
0/36
0)
Auct
ion
Jun
24, 2
009
coup
on ra
te21
,550
,000
21,5
50.0
215.
57.
8203
7.82
10,3
33,3
3310
,333
.310
0.00
7.65
10,3
33.3
MU
J120
_000
6 (K
ZKAK
Y100
063,
1,0
00 te
nge,
Jan
29, 2
009
– Ja
n 29
, 201
9, a
nnua
l fix
ed c
oupo
n 0.
01 %
APR
+ in
flatio
n, 3
0/36
0)
Auct
ion
Jan
29, 2
009
coup
on ra
te6,
100,
000
6,10
0.0
50.8
3.93
0013
.41
1,00
0,00
01,
000.
010
0.00
*9.4
91,
000.
0
MU
J156
_000
1 (K
ZKAK
Y130
011,
1,0
00 te
nge,
Apr
29,
200
9 –
Apr
29,
202
2, a
nnua
l fix
ed c
oupo
n 0.
01 %
APR
+ in
flatio
n, 3
0/36
0)
Auct
ion
Apr 2
9, 2
009
coup
on ra
te25
,211
,000
25,2
11.0
252.
10.
0504
8.88
10,0
00,0
0010
,000
.010
0.00
*8.8
410
,000
.0
MU
J168
_000
2 (K
ZKAK
Y140
028,
1,0
00 te
nge,
Sep
29,
200
9 –
Sep
29,
202
3, a
nnua
l fix
ed c
oupo
n 0.
01 %
APR
+ in
flatio
n, 3
0/36
0)
Auct
ion
Sep
29, 2
009
coup
on ra
te52
,420
,000
52,4
20.0
349.
50.
0100
6.28
5,66
6,66
65,
666.
710
0.00
*6.2
85,
666.
7
MU
J180
_000
6 (K
ZKAK
Y150
068,
1,0
00 te
nge,
Feb
26,
200
9 –
Feb
26,
202
4, a
nnua
l fix
ed c
oupo
n 0.
01 %
APR
+ in
flatio
n, 3
0/36
0)
Auct
ion
Feb
26, 2
009
coup
on ra
te19
,677
,000
19,6
77.0
196.
80.
2621
8.88
15,6
77,0
0015
,677
.010
0.00
*8.6
315
,677
.0
MU
J192
_000
1 (K
ZKAK
Y160
018,
1,0
00 te
nge,
Mar
30,
200
9 –
Mar
30,
202
5, a
nnua
l fix
ed c
oupo
n 0.
01 %
APR
+ in
flatio
n, 3
0/36
0)
Auct
ion
Mar
30,
200
9co
upon
rate
19,1
30,0
0019
,130
.019
1.3
0.10
078.
7215
,000
,000
15,0
00.0
100.
00*8
.63
15,0
00.0
MU
J192
_000
2 (K
ZKAK
Y160
026,
1,0
00 te
nge,
Oct
29,
200
9 –
Oct
29,
202
5, a
nnua
l fix
ed c
oupo
n 0.
01 %
APR
+ in
flatio
n, 3
0/36
0)
Auct
ion
Oct
29,
200
9co
upon
rate
40,2
00,0
0040
,200
.033
5.0
0.01
006.
0717
,000
,000
17,0
00.0
100.
00*6
.07
17,0
00.0
MU
J204
_000
1 (K
ZKAK
Y170
017,
1,0
00 te
nge,
May
28,
200
9 –
May
28,
202
6, a
nnua
l fix
ed c
oupo
n 0.
01 %
APR
+ in
flatio
n, 3
0/36
0)
Auct
ion
May
28,
200
9co
upon
rate
31,2
45,0
0031
,245
.031
2.5
0.02
038.
7512
,000
,000
12,0
00.0
100.
00*8
.74
12,0
00.0
Tab
le 3
7 (
con
tin
uati
on
)

82
Tab
le 3
7 (
con
tin
uati
on
)
Plac
emen
tm
etho
dPl
acem
ent
date
Trad
e su
bjec
tAc
tive
ord
ers
Acti
ve o
rder
s,m
teng
eBi
d to
ask
, %
Wei
ghte
dav
erag
e bi
dYi
eld
of b
id,
% A
PRVa
lue
ofbo
rrow
ing
Valu
e of
bo
rrow
ing,
Wei
ghte
dav
erag
e,%
of n
omin
al
Yiel
d at
tr
ade,
% A
PRIs
sue
valu
e (a
ccum
ulat
ed),
m te
nge
MU
J204
_000
2 (K
ZKAK
Y170
025,
1,0
00 te
nge,
Jul 3
0, 2
009
– Ju
l 30,
202
6, a
nnua
l fix
ed c
oupo
n 0.
01 %
APR
+ in
flatio
n, 3
0/36
0)
Auct
ion
Jul 3
0, 2
009
coup
on ra
te53
,700
,000
53,7
00.0
537.
00.
0100
7.56
15,0
00,0
0015
,000
.010
0.00
*7.5
615
,000
.0
MU
J216
_000
1 (K
ZKAK
Y180
016,
1,0
00 te
nge,
Jun
29, 2
009
– Ju
n 29
, 202
7, a
nnua
l fix
ed c
oupo
n 0.
01 %
APR
+ in
flatio
n, 3
0/36
0)
Auct
ion
Jun
29, 2
009
coup
on ra
te28
,050
,000
28,0
50.0
280.
50.
0100
8.41
12,0
00,0
0012
,000
.010
0.00
*8.4
112
,000
.0
MU
J216
_000
2 (K
ZKAK
Y180
024,
1,0
00 te
nge,
Nov
26,
200
9 –
Nov
26,
202
7, a
nnua
l fix
ed c
oupo
n 0.
01 %
APR
+ in
flatio
n, 3
0/36
0)
Auct
ion
Nov
26,
200
9co
upon
rate
38,0
10,0
0038
,010
.031
6.8
0.01
005.
8612
,000
,000
12,0
00.0
100.
00*5
.86
12,0
00.0
MU
J228
_000
1 (K
ZKAK
Y190
015,
1,0
00 te
nge,
Aug
27,
200
9 –
Aug
27,
202
8, a
nnua
l fix
ed c
oupo
n 0.
01 %
APR
+ in
flatio
n, 3
0/36
0)
Auct
ion
Aug
27, 2
009
coup
on ra
te71
,230
,000
71,2
30.0
593.
60.
0100
6.92
19,0
00,0
0019
,000
.010
0.00
*6.9
219
,000
.0
MU
J228
_000
2 (K
ZKAK
Y190
023,
1,0
00 te
nge,
Dec
30,
200
9 –
Dec
30,
202
8, a
nnua
l fix
ed c
oupo
n 0.
01 %
APR
+ in
flatio
n, 3
0/36
0)
Auct
ion
Dec
30,
200
9co
upon
rate
44,0
00,0
0044
,000
.033
8.5
0.01
005.
9613
,100
,000
13,1
00.0
100.
00*5
.96
13,1
00.0
Refe
r to
No
tes
to F
actb
oo
k

Section V. Factbook
83
Table 38
GS exchange primary market turnover in Y2009 and Y2008 in terms of investor categories
Investor category Y2009 Y2008 Trend, %
bn KZT share, % bn KZT share, %
STBs 153.4 22.0 265.4 57.1
PAIMO (PA) 308.3 44.2 98.0 21.1 +214.6
STBs clients 181.1 25.9 56.7 12.2 +219.5
Clients of brokerage and dealer companies 40.9 5.9 32.8 7.1 +24.5
including individuals 4.5 0.6 1.1 0.2 +310.9
Brokerage and dealer companies 14.5 2.1 12.3 2.6 +17.9
Total 698.1 100.0 465.2 100.0 +50.1
including non-residents – – 0.2 <0.1
Picture 13
Weighted average yield and transaction value on GS primary market in Y2009
Picture 14
Weighted average yield and transaction value on GS secondary market in Y2009
Table 39
Traded value structure of GS exchange secondary market in Y2009
Month Traded value, m KZT Total
MEKKAM MEOKAM MEUJKAM MEUKAM MUIKAM NBK notes MAOKAM
January 603.0 8,579.3 3,233.8 10,783.2 2,964.0 6,703.0 32,866.3
February 1,523.0 12,114.2 – 11,522.7 1,111.0 1,796.4 28,067.1
March 5,126.4 3,153.1 – 8,886.9 1,230.3 3,162.8 21,559.5
April 35,660.5 9,090.6 – 13,028.7 – 7,715.7 65,495.4
May 6,602.0 10,935.1 – 16,837.9 – 10,348.4 44,723.4
June 2,340.3 15,551.5 – 35,616.9 396.4 2,734.2 56,639.4

84
Table 39 (continuation)
Month Traded value, m KZT Total
MEKKAM MEOKAM MEUJKAM MEUKAM MUIKAM NBK notes MAOKAM
July 480.5 26,475.2 – 59,312.1 281.7 5,442.0 91,991.6
August – 24,738.3 – 44,477.5 – 19,936.2 89,152.0
September 1,342.6 10,447.1 – 48,021.7 – 5,615.4 65,426.7
October 13,961.5 2,836.0 – 16,551.1 – 3,377.5 36,726.1
November 4,159.5 25,483.9 677.9 13,336.6 – 6,853.2 9,670.4 60,181.5
December 12,714.9 40,962.1 441.8 24,324.0 569.9 37,349.2 806.1 117,168.0
Total 84,514.1 190,366.3 4,353.5 302,699.2 6,553.3 111,034.0 10,476.5 709,997.1
Structure 11.9 % 26.8 % 0.6 % 42.6 % 0.9 % 15.6 % 1.5 % 100.0 %
Y2008:
Total 108,872.8 120,719.4 6,026 42,683.2 40,731 154,204.0 473,237.1
Structure 23.0 % 25.5 % 1.3 % 9.0 % 8.6 % 32.6 % 100.0 %
Trend Y2009 to Y2008
cash +69,647.0 +260,016.0 +236,759.9
percent +57.7 +609.2 +50.0
Refer to Notes to Factbook
Table 40
Exchange secondary market gross turnover in Y2009 and 2008 in terms of investor categories (without account
Investor category Y2009 Y2008 Trend, %
bn KZT share, % bn KZT share, %
STBs 430.5 31.4 482.3 58.8
Brokerage and dealer companies 812.7 59.2 213.6 26.0 +280.4
including individuals 476.0 34.7 105.8 12.9 +349.9
Pension market companies 129.3 9.4 124.4 15.2 +3.9
Total 1,372.4 100.0 820.3 100.0 +67.3
including non-residents 34.9 2.5 9.9 1.2 +253.3
Table 41
Top ten GS exchange secondary market operators in Y2009
Rank in Y2009
Rank in Y2008
Company Activityindicator Ka
1 1 Tengry Finance JSC 3.00
2 2 Halyk Savings Bank of Kazakhstan JSC 1.06
3 7 IFG CONTINENT JSC 0.74
4 3 Bank CenterCredit JSC 0.63
5 31 Eurasian Capital JSC 0.60
6 5 Subsidiary of BTA Bank JSC - BTA Securities JSC 0.522
7 19 ASYL-INVEST JSC 0.519
8 – Zurich Invest Management JSC 0.50
9 20 Kazpost JSC 0.31
10 6 Eurasian Bank JSC 0.30
Refer to Notes to Factbook
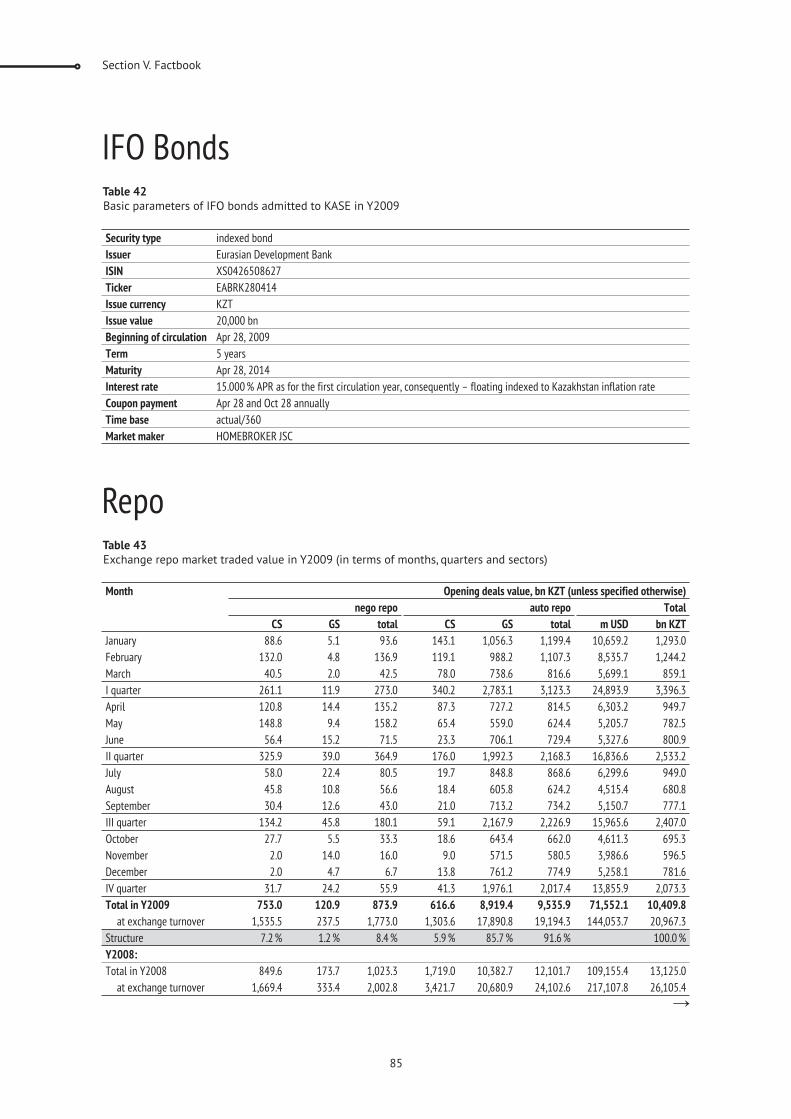
Section V. Factbook
85
Table 42
Basic parameters of IFO bonds admitted to KASE in Y2009
IFO Bonds
Security type indexed bond
Issuer Eurasian Development Bank
ISIN XS0426508627
Ticker EABRK280414
Issue currency KZT
Issue value 20,000 bn
Beginning of circulation Apr 28, 2009
Term 5 years
Maturity Apr 28, 2014
Interest rate 15.000 % APR as for the first circulation year, consequently – floating indexed to Kazakhstan inflation rate
Coupon payment Apr 28 and Oct 28 annually
Time base actual/360
Market maker HOMEBROKER JSC
Table 43
Exchange repo market traded value in Y2009 (in terms of months, quarters and sectors)
Repo
Month Opening deals value, bn KZT (unless specified otherwise)
nego repo auto repo Total
CS GS total CS GS total m USD bn KZT
January 88.6 5.1 93.6 143.1 1,056.3 1,199.4 10,659.2 1,293.0
February 132.0 4.8 136.9 119.1 988.2 1,107.3 8,535.7 1,244.2
March 40.5 2.0 42.5 78.0 738.6 816.6 5,699.1 859.1
I quarter 261.1 11.9 273.0 340.2 2,783.1 3,123.3 24,893.9 3,396.3
April 120.8 14.4 135.2 87.3 727.2 814.5 6,303.2 949.7
May 148.8 9.4 158.2 65.4 559.0 624.4 5,205.7 782.5
June 56.4 15.2 71.5 23.3 706.1 729.4 5,327.6 800.9
II quarter 325.9 39.0 364.9 176.0 1,992.3 2,168.3 16,836.6 2,533.2
July 58.0 22.4 80.5 19.7 848.8 868.6 6,299.6 949.0
August 45.8 10.8 56.6 18.4 605.8 624.2 4,515.4 680.8
September 30.4 12.6 43.0 21.0 713.2 734.2 5,150.7 777.1
III quarter 134.2 45.8 180.1 59.1 2,167.9 2,226.9 15,965.6 2,407.0
October 27.7 5.5 33.3 18.6 643.4 662.0 4,611.3 695.3
November 2.0 14.0 16.0 9.0 571.5 580.5 3,986.6 596.5
December 2.0 4.7 6.7 13.8 761.2 774.9 5,258.1 781.6
IV quarter 31.7 24.2 55.9 41.3 1,976.1 2,017.4 13,855.9 2,073.3
Total in Y2009 753.0 120.9 873.9 616.6 8,919.4 9,535.9 71,552.1 10,409.8
at exchange turnover 1,535.5 237.5 1,773.0 1,303.6 17,890.8 19,194.3 144,053.7 20,967.3
Structure 7.2 % 1.2 % 8.4 % 5.9 % 85.7 % 91.6 % 100.0 %
Y2008:
Total in Y2008 849.6 173.7 1,023.3 1,719.0 10,382.7 12,101.7 109,155.4 13,125.0
at exchange turnover 1,669.4 333.4 2,002.8 3,421.7 20,680.9 24,102.6 217,107.8 26,105.4

86
Table 43 (continuation)
Month Opening deals value, bn KZT (unless specified otherwise)
nego repo auto repo Total
CS GS total CS GS total m USD bn KZT
Structure 6.5 % 1.3 % 7.8 % 13.1 % 79.1 % 92.2 % 100.0 %
Trend Y2009 to Y2008:
cash
percent
Table 44
Exchange auto repo market in Y2009 and Y2008
Indicator Measure Y2009 Y2008 Y2009vs. Y2008GS CS total GS CS total
Trade days 249 249 249 249 249 249 0 %
Productive days 249 249 249 249 249 249 0 %
Productivity % 100 100 100 100 100 100 0 pp
Total traded value bn KZT 8,919.4 616.6 9,535.9 10,382.7 1,719.0 12,101.7
m USD 61,226.5 4,350.3 65,576.7 86,356.9 14,290.1 100,647.0
at exchange turnover bn KZT 17,890.8 1,303.6 19,194.3 20,680.9 3,421.7 24,102.6
m USD 122,750.5 9,170.7 131,921.3 172,011.0 28,445.4 200,456.4
Opening deals 25,598 3,674 29,272 23,434 6,925 30,359
Total of deals 51,277 7,452 58,729 46,788 13,872 60,660
Share of sector in traded value on repo market
% 85.7 5.9 91.6 79.1 13.1 92.2
Share (in number of opening deals) of sector on repo market
% 77.9 11.2 89.0 52.3 15.5 67.8 +21.2 pp
Average value of one transaction (deal) m KZT 348.9 174.9 326.8 442.0 246.7 397.3
m USD 2.4 1.2 2.2 3.7 2.1 3.3
Average daily value for a productive day m KZT 35,820.8 2,476.2 38,296.9 41,697.7 6,903.4 48,601.2
m USD 245.9 17.5 263.4 346.8 57.4 404.2
at daily average exchange turnover m KZT 71,850.6 5,235.2 77,085.7 83,055.8 13,741.7 96,797.5
m USD 493.0 36.8 529.8 690.8 114.2 805.0
Table 45
Exchange nego repo market in Y2009 and Y2008
Indicator Measure Y2009 Y2008 Y2009vs. Y2008GS CS total GS CS total
Trade days 249 249 249 249 249 249 0 %
Productive days 168 248 248 225 249 249
Productivity % 67.5 99.6 99.6 90.4 100.0 100.0
Total traded value bn KZT 120.9 753.0 873.9 173.7 849.6 1,023.3
m USD 813.1 5,162.3 5,975.4 1,444.3 7,064.0 8,508.4
at exchange turnover bn KZT 237.5 1,535.5 1,773.0 333.4 1,669.4 2,002.8
m USD 1,604.7 10,527.7 12,132.4 2,772.1 13,879.3 16,651.4
Opening deals 575 3,030 3,605 1,685 12,735 14,420
Total of deals 1,161 6,458 7,619 3,300 25,151 28,451
Share of sector in traded value on repo market
% 1.2 7.2 8.4 1.3 6.5 7.8 +0.6 pp
Share (in number of opening deals) of sector on repo market
% 1.7 9.2 11.0 3.8 28.4 32.2
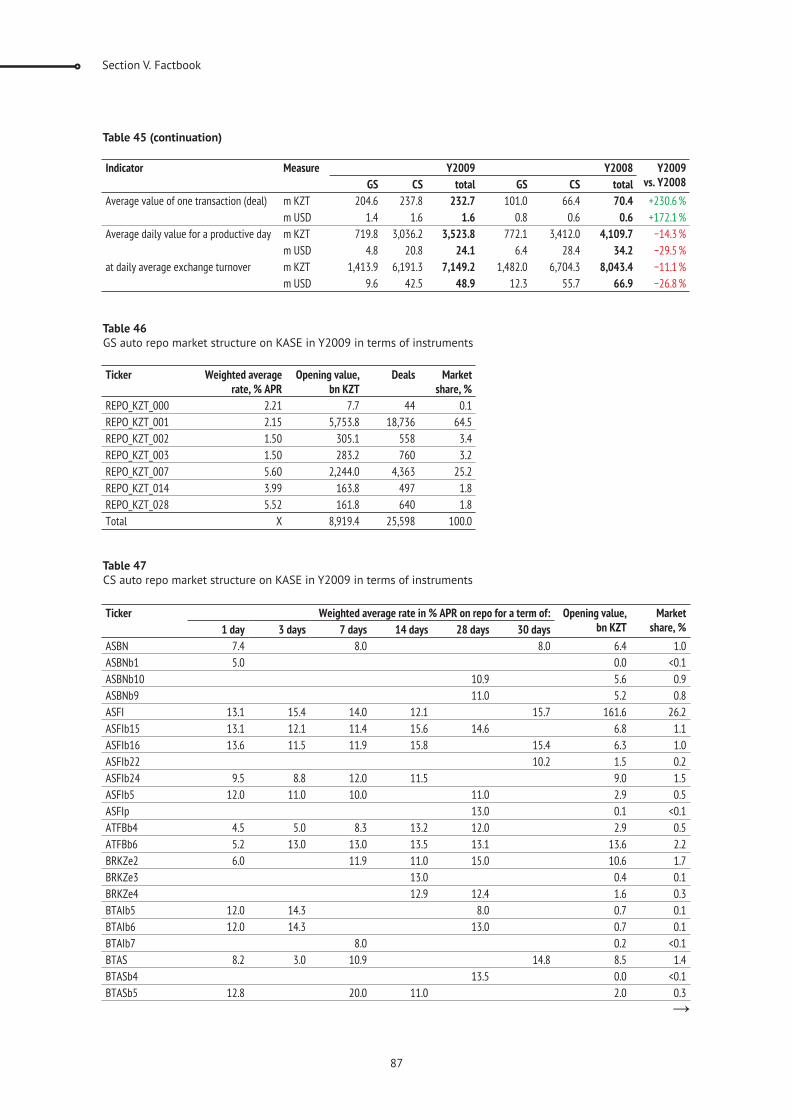
Section V. Factbook
87
Table 46
GS auto repo market structure on KASE in Y2009 in terms of instruments
Ticker Weighted average rate, % APR
Opening value, bn KZT
Deals Marketshare, %
REPO_KZT_000 2.21 7.7 44 0.1
REPO_KZT_001 2.15 5,753.8 18,736 64.5
REPO_KZT_002 1.50 305.1 558 3.4
REPO_KZT_003 1.50 283.2 760 3.2
REPO_KZT_007 5.60 2,244.0 4,363 25.2
REPO_KZT_014 3.99 163.8 497 1.8
REPO_KZT_028 5.52 161.8 640 1.8
Total 8,919.4 25,598 100.0
Indicator Measure Y2009 Y2008 Y2009vs. Y2008GS CS total GS CS total
Average value of one transaction (deal) m KZT 204.6 237.8 232.7 101.0 66.4 70.4 +230.6 %
m USD 1.4 1.6 1.6 0.8 0.6 0.6 +172.1 %
Average daily value for a productive day m KZT 719.8 3,036.2 3,523.8 772.1 3,412.0 4,109.7
m USD 4.8 20.8 24.1 6.4 28.4 34.2
at daily average exchange turnover m KZT 1,413.9 6,191.3 7,149.2 1,482.0 6,704.3 8,043.4
m USD 9.6 42.5 48.9 12.3 55.7 66.9
Table 45 (continuation)
Table 47
CS auto repo market structure on KASE in Y2009 in terms of instruments
Ticker Weighted average rate in % APR on repo for a term of: Opening value, bn KZT
Marketshare, %1 day 3 days 7 days 14 days 28 days 30 days
ASBN 7.4 8.0 8.0 6.4 1.0
ASBNb1 5.0 0.0 <0.1
ASBNb10 10.9 5.6 0.9
ASBNb9 11.0 5.2 0.8
ASFI 13.1 15.4 14.0 12.1 15.7 161.6 26.2
ASFIb15 13.1 12.1 11.4 15.6 14.6 6.8 1.1
ASFIb16 13.6 11.5 11.9 15.8 15.4 6.3 1.0
ASFIb22 10.2 1.5 0.2
ASFIb24 9.5 8.8 12.0 11.5 9.0 1.5
ASFIb5 12.0 11.0 10.0 11.0 2.9 0.5
ASFIp 13.0 0.1 <0.1
ATFBb4 4.5 5.0 8.3 13.2 12.0 2.9 0.5
ATFBb6 5.2 13.0 13.0 13.5 13.1 13.6 2.2
BRKZe2 6.0 11.9 11.0 15.0 10.6 1.7
BRKZe3 13.0 0.4 0.1
BRKZe4 12.9 12.4 1.6 0.3
BTAIb5 12.0 14.3 8.0 0.7 0.1
BTAIb6 12.0 14.3 13.0 0.7 0.1
BTAIb7 8.0 0.2 <0.1
BTAS 8.2 3.0 10.9 14.8 8.5 1.4
BTASb4 13.5 0.0 <0.1
BTASb5 12.8 20.0 11.0 2.0 0.3
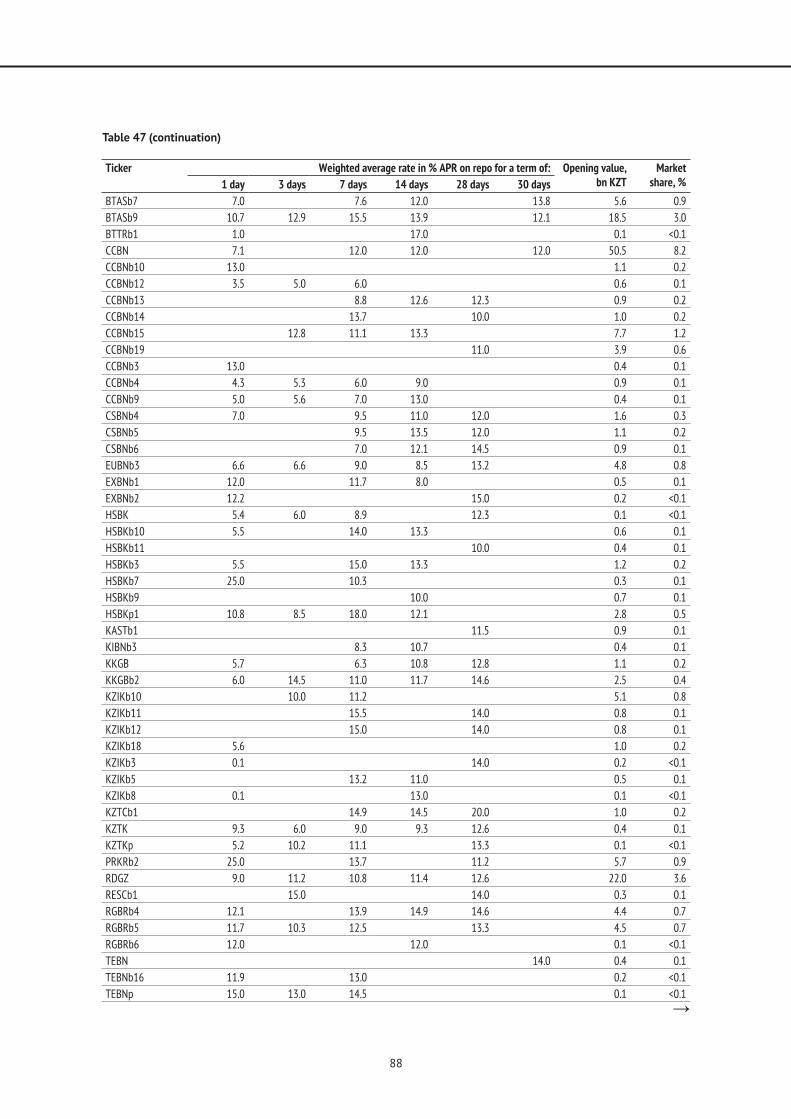
88
Table 47 (continuation)
Ticker Weighted average rate in % APR on repo for a term of: Opening value, bn KZT
Marketshare, %1 day 3 days 7 days 14 days 28 days 30 days
BTASb7 7.0 7.6 12.0 13.8 5.6 0.9
BTASb9 10.7 12.9 15.5 13.9 12.1 18.5 3.0
BTTRb1 1.0 17.0 0.1 <0.1
CCBN 7.1 12.0 12.0 12.0 50.5 8.2
CCBNb10 13.0 1.1 0.2
CCBNb12 3.5 5.0 6.0 0.6 0.1
CCBNb13 8.8 12.6 12.3 0.9 0.2
CCBNb14 13.7 10.0 1.0 0.2
CCBNb15 12.8 11.1 13.3 7.7 1.2
CCBNb19 11.0 3.9 0.6
CCBNb3 13.0 0.4 0.1
CCBNb4 4.3 5.3 6.0 9.0 0.9 0.1
CCBNb9 5.0 5.6 7.0 13.0 0.4 0.1
CSBNb4 7.0 9.5 11.0 12.0 1.6 0.3
CSBNb5 9.5 13.5 12.0 1.1 0.2
CSBNb6 7.0 12.1 14.5 0.9 0.1
EUBNb3 6.6 6.6 9.0 8.5 13.2 4.8 0.8
EXBNb1 12.0 11.7 8.0 0.5 0.1
EXBNb2 12.2 15.0 0.2 <0.1
HSBK 5.4 6.0 8.9 12.3 0.1 <0.1
HSBKb10 5.5 14.0 13.3 0.6 0.1
HSBKb11 10.0 0.4 0.1
HSBKb3 5.5 15.0 13.3 1.2 0.2
HSBKb7 25.0 10.3 0.3 0.1
HSBKb9 10.0 0.7 0.1
HSBKp1 10.8 8.5 18.0 12.1 2.8 0.5
KASTb1 11.5 0.9 0.1
KIBNb3 8.3 10.7 0.4 0.1
KKGB 5.7 6.3 10.8 12.8 1.1 0.2
KKGBb2 6.0 14.5 11.0 11.7 14.6 2.5 0.4
KZIKb10 10.0 11.2 5.1 0.8
KZIKb11 15.5 14.0 0.8 0.1
KZIKb12 15.0 14.0 0.8 0.1
KZIKb18 5.6 1.0 0.2
KZIKb3 0.1 14.0 0.2 <0.1
KZIKb5 13.2 11.0 0.5 0.1
KZIKb8 0.1 13.0 0.1 <0.1
KZTCb1 14.9 14.5 20.0 1.0 0.2
KZTK 9.3 6.0 9.0 9.3 12.6 0.4 0.1
KZTKp 5.2 10.2 11.1 13.3 0.1 <0.1
PRKRb2 25.0 13.7 11.2 5.7 0.9
RDGZ 9.0 11.2 10.8 11.4 12.6 22.0 3.6
RESCb1 15.0 14.0 0.3 0.1
RGBRb4 12.1 13.9 14.9 14.6 4.4 0.7
RGBRb5 11.7 10.3 12.5 13.3 4.5 0.7
RGBRb6 12.0 12.0 0.1 <0.1
TEBN 14.0 0.4 0.1
TEBNb16 11.9 13.0 0.2 <0.1
TEBNp 15.0 13.0 14.5 0.1 <0.1
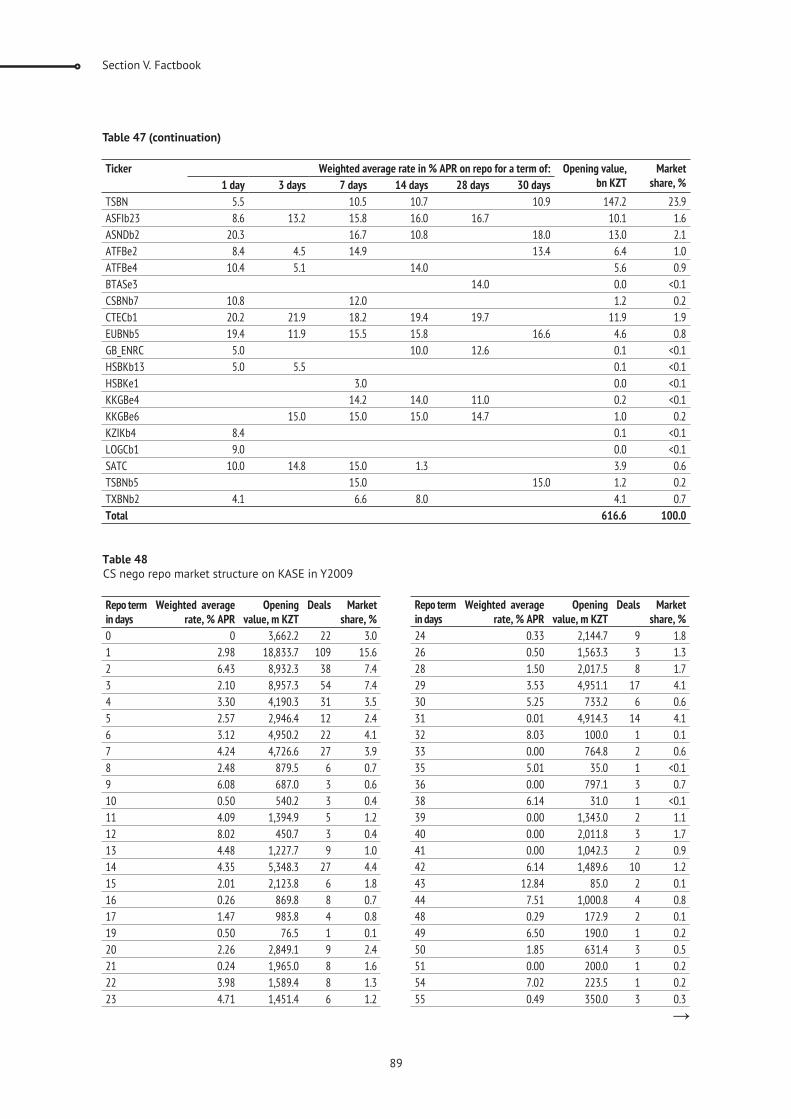
Section V. Factbook
89
Repo term in days
Weighted average rate, % APR
Openingvalue, m KZT
Deals Marketshare, %
24 0.33 2,144.7 9 1.8
26 0.50 1,563.3 3 1.3
28 1.50 2,017.5 8 1.7
29 3.53 4,951.1 17 4.1
30 5.25 733.2 6 0.6
31 0.01 4,914.3 14 4.1
32 8.03 100.0 1 0.1
33 0.00 764.8 2 0.6
35 5.01 35.0 1 <0.1
36 0.00 797.1 3 0.7
38 6.14 31.0 1 <0.1
39 0.00 1,343.0 2 1.1
40 0.00 2,011.8 3 1.7
41 0.00 1,042.3 2 0.9
42 6.14 1,489.6 10 1.2
43 12.84 85.0 2 0.1
44 7.51 1,000.8 4 0.8
48 0.29 172.9 2 0.1
49 6.50 190.0 1 0.2
50 1.85 631.4 3 0.5
51 0.00 200.0 1 0.2
54 7.02 223.5 1 0.2
55 0.49 350.0 3 0.3
Ticker Weighted average rate in % APR on repo for a term of: Opening value, bn KZT
Marketshare, %1 day 3 days 7 days 14 days 28 days 30 days
TSBN 5.5 10.5 10.7 10.9 147.2 23.9
ASFIb23 8.6 13.2 15.8 16.0 16.7 10.1 1.6
ASNDb2 20.3 16.7 10.8 18.0 13.0 2.1
ATFBe2 8.4 4.5 14.9 13.4 6.4 1.0
ATFBe4 10.4 5.1 14.0 5.6 0.9
BTASe3 14.0 0.0 <0.1
CSBNb7 10.8 12.0 1.2 0.2
CTECb1 20.2 21.9 18.2 19.4 19.7 11.9 1.9
EUBNb5 19.4 11.9 15.5 15.8 16.6 4.6 0.8
GB_ENRC 5.0 10.0 12.6 0.1 <0.1
HSBKb13 5.0 5.5 0.1 <0.1
HSBKe1 3.0 0.0 <0.1
KKGBe4 14.2 14.0 11.0 0.2 <0.1
KKGBe6 15.0 15.0 15.0 14.7 1.0 0.2
KZIKb4 8.4 0.1 <0.1
LOGCb1 9.0 0.0 <0.1
SATC 10.0 14.8 15.0 1.3 3.9 0.6
TSBNb5 15.0 15.0 1.2 0.2
TXBNb2 4.1 6.6 8.0 4.1 0.7
Total 616.6 100.0
Table 47 (continuation)
CS nego repo market structure on KASE in Y2009
Repo term in days
Weighted average rate, % APR
Openingvalue, m KZT
Deals Marketshare, %
0 0 3,662.2 22 3.0
1 2.98 18,833.7 109 15.6
2 6.43 8,932.3 38 7.4
3 2.10 8,957.3 54 7.4
4 3.30 4,190.3 31 3.5
5 2.57 2,946.4 12 2.4
6 3.12 4,950.2 22 4.1
7 4.24 4,726.6 27 3.9
8 2.48 879.5 6 0.7
9 6.08 687.0 3 0.6
10 0.50 540.2 3 0.4
11 4.09 1,394.9 5 1.2
12 8.02 450.7 3 0.4
13 4.48 1,227.7 9 1.0
14 4.35 5,348.3 27 4.4
15 2.01 2,123.8 6 1.8
16 0.26 869.8 8 0.7
17 1.47 983.8 4 0.8
19 0.50 76.5 1 0.1
20 2.26 2,849.1 9 2.4
21 0.24 1,965.0 8 1.6
22 3.98 1,589.4 8 1.3
23 4.71 1,451.4 6 1.2

90
Table 48 (continuation)
Repo term in days
Weighted average rate, % APR
Openingvalue, m KZT
Deals Marketshare, %
56 10.80 1,186.0 7 1.0
66 0.00 1,809.8 4 1.5
69 0.48 448.9 2 0.4
78 0.00 85.0 1 0.1
79 0.00 767.0 3 0.6
80 0.50 242.6 1 0.2
84 13.00 399.7 1 0.3
85 0.49 691.3 3 0.6
87 0.33 1,516.3 5 1.3
88 0.49 1,545.5 6 1.3
89 0.48 553.8 2 0.5
90 0.32 1,189.3 6 1.0
91 0.50 1,795.2 4 1.5
94 0.00 702.3 2 0.6
95 0.00 536.6 2 0.4
127 0.20 1,030.8 6 0.9
Total 120,928.2 575 100.0
Picture 15
Exchange auto repo market structure in 2009 (% of opening deals volume)
Picture 16
Weighted average rate weekly dynamics on auto repo exchange market for liquid instruments in Y2009 (% APR, left axis)
Picture 17
Weighted average overnight rate weekly dynamics (left axis) in sectors of exchange market and value

Section V. Factbook
91
Picture 18
Collateral in auto repo on KASE in Y2009Picture 19
Collateral in nego repo on KASE in Y2009
Table 49
Exchange repo market agents in Y2009 and Y2008
Table 50
Top ten repo market operators on KASE in Y2009
Category Y2009 Y2008 Trend, %
bn KZT share, % bn KZT share, %
STB 24,585.6 63.1 32,827.9 66.2
Brokerage and dealer companies 8,832.1 22.7 10,060.2 20.3
Pension market operators 5,504.0 14.1 6,659.6 13.4
Management companies 23.3 0.1 31.0 0.1
Total 38,945.0 100 49,578.7 100
Refer to Notes to Factbook
Rank in Y2009
Rank in Y2008
Company Activityindicator Ka
1 1 Halyk Savings Bank of Kazakhstan JSC 2.67
2 8 Bank CenterCredit JSC 2.47
3 5 Tengry Finance JSC 2.33
4 11 Eurasian Bank JSC 2.19
5 14 Kazpost JSC 2.02
6 17 ASYL-INVEST JSC 1.80
7 22 Accumulative pension fund of Halyk Bank of Kazakhstan JSC - Subsidiary of Halyk Bank of Kazakhstan JSC
1.70
8 34 Delta Bank JSC 1.65
9 4 Subsidiary of BTA Bank JSC - BTA Securities JSC 1.641
10 7 Alliance Bank JSC 1.638
Refer to Notes to Factbook

92
Picture 20
Kazakhstan currency market turnover in terms
CurrencyTable 51
EUR/KZT trade on KASE, Y2009 vs. Y2008
Table 52
RUB/KZT trade on KASE, Y2009 vs. Y2008
Indicator Measure Y2009 Y2008 Y2009 vs. Y2008
Trading days 243 241 +0.8 %
Productive days 99 150
Productivity % 40.7 62.2
Total transaction value m RUB 1,241.9 575.6 +115.8 %
Transactions 371 217 +71.0 %
Share in total currency traded value
% 0.06 0.02 +0.04 pp
Share in total number of currency transactions
% 0.76 0.15 +0.61 pp
Average transaction value
m RUB 3.347 2.653 +26.2 %
Transactions on average per day
4 1 +159.0 %
Daily average transaction value
m RUB 12.5 3.8 +226.9 %
Indicator Measure Y2009 Y2008 Y2009 vs. Y2008
Trading days 249 247 +0.8 %
Productive days 226 29 +679.3 %
Productivity % 90.8 11.7 +79.0 pp
Total transaction value m EUR 621.2 12.0 +5,098.7 %
Transactions 350 33 +960.6 %
Share in total currency traded value
% 1.36 0.01 +1.35 pp
Share in total number of currency transactions
% 0.72 0.02 +0.69 pp
Average transaction value
m EUR 1.775 0.362 +390.2 %
Transactions on average per day
2 1 +36.1 %
Daily average transaction value
m EUR 2.749 0.412 +567.1 %
Table 53
USD/KZT trade on KASE, Y2009 vs. Y2008
Market indicator Measure Y2009 Y2008 Y2009 vs. Y2008
Trading days 249 249 0 %
Productive days 249 249 0 %
Productivity % 100 100 0 pp
Total transaction value
m USD 66,760.0 138,832.9
at exchange turnover
m USD 84,312.5 138,837.9
Transactions 48,018 140,122
Share in total currency traded value
% 98.53 99.97
Share in total number of currency transactions
% 98.50 99.82
Averagetransaction value
m USD 1.390 0.991 +40.3 %
Transactions on average per day
193 563
Daily average transaction value
m USD 268.1 557.6
Refer to Notes to Factbook

Section V. Factbook
93
Table 54
Volume and currency trade structure on KASE in Y2009
Month Traded value Exchange (calculated) turnover,spot-market, swap-market,
th. USD/KZTtotal,
bn KZTtotal,
m USDth. USD/KZT th. EUR/KZT
th. EUR/USD
th. RUB/KZT
bn KZT m USD
January 7,868,930 500 72,300 85,100 965.7 7,956.9 976.0 8,042.0
February 8,853,540 2,430 20,700 767,650 1,378.1 9,624.9 1,492.9 10,392.5
March 3,760,320 6,300 40,800 2,067,450 880.1 5,837.4 1,191.7 7,904.8
I quarter 20,482,790 9,230 133,800 2,920,200 3,223.8 23,419.2 3,660.7 26,339.4
April 2,592,150 4,250 159,100 549,000 474.9 3,151.5 557.7 3,700.5
May 1,838,485 61,540 91,600 322,500 337.9 2,247.8 386.4 2,570.3
June 2,139,870 71,290 0 657,100 435.6 2,897.0 534.4 3,554.1
II quarter 6,570,505 137,080 250,700 1,528,600 1,248.4 8,296.3 1,478.5 9,824.9
July 3,277,490 73,300 0 1,274,000 701.3 4,655.1 893.3 5,929.1
August 3,589,230 84,800 0 2,954,000 1,004.9 6,664.4 1,450.3 9,618.4
September 2,556,165 106,300 16,400 2,274,200 752.3 4,985.7 1,095.4 7,259.9
III quarter 9,422,885 264,400 16,400 6,502,200 2,458.4 16,305.2 3,439.0 22,807.4
October 2,968,230 104,700 0 2,287,500 815.8 5,410.9 1,160.7 7,698.4
November 6,111,960 52,735 246,000 1,853,500 1,204.6 8,052.6 1,482.0 9,906.1
December 3,651,150 53,100 22,500 595,000 2,460,500 927.9 6,241.6 1,293.7 8,702.1
IV quarter 12,731,340 210,535 22,500 841,000 6,601,500 2,948.3 19,705.0 3,936.5 26,306.5
Total in Y2009 49,207,520 621,245 22,500 1,241,900 17,552,500 9,879.0 67,725.7 12,514.6 85,278.2
Structure 71.85 % 1.36 % 0.05 % 0.06 % 26.68 % 100.0 % 100.0 %
Y2008:
Total 138,827,860 11,950 n/t 575,600 5,000 16,708.7 138,874.0 16,709.3 138,879.0
Structure 99.97 % 0.01 % 0.02 % <0.01 % 100.0 % 100.0 %
Y2009 vs Y2008 trend:
cash +609,295 +666,300 +17,547,500
percent +5,098.7 +115.8 +350,950.0
Table 55
USD (settled in tenge) traded value on KASE spot-market in terms of sessions in Y2009
Session Share, % in total transaction value
Y2009 Y2008 Y2007 Y2006 Y2005
Morning (main) 56.9 27.9 45.6 73.6 61.9
Day (additional) 32.5 19.8 33.6 24.5 34.7
Evening (additional) 10.6 52.3 20.8 1.9 3.4
Total 100.0 100.0 100.0 100.0 100.0
Picture 21
Currency traded value (KASE spot-market) in Y2009 in terms of sessions

94
Tab
le 5
6
KA
SE
cu
rren
cy m
arke
t in
Y2
00
9 a
nd
Y2
00
8 i
n t
erm
s of
inst
rum
en
ts
Peri
odU
SD s
ettl
ed in
teng
eCu
rren
cy s
wap
sEu
ro s
ettl
ed in
teng
eEu
ro s
ettl
ed in
USD
RUR
sett
led
in te
nge
USD
KZT
_TO
DU
SDK
ZT_T
OM
USD
KZT
_SPT
USD
KZT
_0_0
01U
SDK
ZT_0
_002
USD
KZT
_1_0
02EU
RKZT
_TO
DEU
RKZT
_TO
MEU
RKZT
_SPT
EURU
SD_T
OD
EURU
SD_T
OM
RUBK
ZT_T
OD
Tran
sact
ions
:
Y200
942
,313
3,28
112
72,
200
943
296
531
111
371
Y200
810
7,11
521
,301
11,7
051
00
321
n/t
n/t
n/t
217
Tren
d, %
+219
,900
.0X
X+8
25.0
+5,2
00.0
+71.
0
Aver
age
tran
sact
ion
valu
e in
thou
sand
s of
cur
renc
y un
its
Y200
91,
015.
91,
489.
310
,518
.97,
347.
314
,111
.720
,666
.71,
802.
51,
560.
45,
000.
01,
954.
51,
000.
03,
347.
4
Y200
860
5.9
1,21
4.9
4,10
5.4
5,00
0.0
00
342.
21,
000.
0n/
tn/
tn/
t2,
652.
5
Tren
d, %
+67.
7+2
2.6
+156
.2+4
6.9
+426
.8+5
6.0
+26.
2
Aver
age
prod
ucti
ve d
ay v
alue
in th
ousa
nds
of c
urre
ncy
unit
s
Y200
917
9,10
5.4
20,3
59.7
31,8
07.1
73,4
72.7
39,0
14.7
31,0
00.0
2,85
3.2
1,53
1.5
5,00
0.0
2,38
8.9
1,00
0.0
12,5
44.4
Y200
813
5,20
0.4
103,
927.
823
7,88
9.5
5,00
0.0
00
331.
81,
000.
0n/
tn/
tn/
t3,
837.
3
Tren
d, %
+32.
5+1
,369
.5+7
59.9
+53.
1+2
26.9
Tota
l val
ue in
thou
sand
s of
cur
renc
y un
its
Y200
942
,985
,290
.04,
886,
330.
01,
335,
900.
016
,164
,000
.01,
326,
500.
062
,000
.053
3,54
5.0
82,7
00.0
5,00
0.0
21,5
00.0
1,00
0.0
1,24
1,90
0.0
Y200
864
,896
,170
.025
,878
,010
.048
,053
,680
.05,
000.
00
010
,950
.01,
000.
0n/
tn/
tn/
t57
5,60
0.0
Tren
d, %
+323
,180
.0+4
,772
.6+8
,170
.0+1
15.8
Refe
r to
No
tes
to F
actb
oo
k

Section V. Factbook
95
Picture 22
EUR/KZT exchange spot-market indicators in Y2009Picture 23
RUB/KZT exchange spot-market indicators in Y2009
Picture 24
USD/KZT exchange spot-market indicators in Y2009
Table 57
Top ten KASE currency market operators in Y2009
Rank in Y2009 Rank in Y2008 Company Activity indicator Ka
1 2 Kazkommertsbank JSC 1.65
2 1 Subsidiary Bank RBS (Kazakhstan) JSC 1.58
3 4 Halyk Savings Bank of Kazakhstan JSC 1.401
4 7 Subsidiary Bank HSBC Bank Kazakhstan JSC 1.400
5 3 Nurbank JSC 1.27
6 8 Citibank Kazakhstan JSC 1.16
7 21 Subsidiary of BTA Bank JSC - Temirbank JSC 1.11
8 5 BTA Bank JSC 1.06
9 9 Bank CenterCredit JSC 1.05
10 10 Subsidiary Bank Alfa-Bank JSC 1.02
Refer to Notes to Factbook

96
Picture 25
KIBOR, KazPrime and “overnight” repo in Y2009 (% APR)
Table 58
Monthly average values of interbank deposit market indicators in Y2009
Interbank Deposit Indicators
Month Indicator 7days
14days
Month 2months
3months
KIBOR 10.04 10.95 11.34 12.11 13.16
I KIBID 6.56 7.21 7.80 8.69 9.70
KIMEAN 8.30 9.08 9.57 10.40 11.43
KazPrime 12.62
KIBOR 18.95 19.08 14.35 18.63 18.39
II KIBID 9.10 9.33 9.74 10.53 13.05
KIMEAN 14.03 14.20 12.04 14.58 15.72
KazPrime 14.78
KIBOR 15.25 15.75 13.75 15.75 15.85
III KIBID 8.00 8.31 8.88 9.56 12.02
KIMEAN 11.63 12.03 11.31 12.66 13.94
KazPrime 14.76
KIBOR 8.98 10.13 11.07 12.19 13.24
IV KIBID 6.70 7.32 7.95 9.45 11.09
KIMEAN 7.84 8.72 9.51 10.83 12.16
KazPrime 12.90
KIBOR 7.89 8.55 9.21 10.61 11.99
V KIBID 4.82 5.53 6.25 7.58 9.01
KIMEAN 6.36 7.04 7.73 9.09 10.50
KazPrime 11.91
KIBOR 8.00 8.61 9.27 10.26 10.52
VI KIBID 4.00 4.63 5.47 6.39 7.44
KIMEAN 6.00 6.62 7.37 8.32 8.98
KazPrime 10.53
Month Indicator 7days
14days
Month 2months
3months
KIBOR 8.00 9.00 9.52 9.69 9.73
VII KIBID 3.98 4.89 5.91 6.98 7.89
KIMEAN 5.99 6.94 7.71 8.33 8.81
KazPrime 9.56
KIBOR 6.40 7.40 7.77 8.30 8.39
VIII KIBID 2.38 3.60 4.46 5.48 6.61
KIMEAN 4.39 5.50 6.11 6.89 7.50
KazPrime 7.02
KIBOR 5.18 6.64 6.89 8.68 9.53
IX KIBID 1.30 2.45 3.06 4.43 5.45
KIMEAN 3.24 4.55 4.97 6.56 7.49
KazPrime 6.33
KIBOR 4.84 5.63 6.41 7.25 8.02
X KIBID 1.06 2.00 2.83 3.64 5.06
KIMEAN 2.95 3.82 4.62 5.45 6.54
KazPrime 6.29
KIBOR 4.08 4.61 5.30 5.93 6.70
XI KIBID 0.46 0.92 1.89 2.60 4.17
KIMEAN 2.27 2.77 3.60 4.27 5.44
KazPrime 5.57
KIBOR 2.89 3.59 5.21 5.18 5.65
XII KIBID 0.23 0.51 0.90 1.64 2.34
KIMEAN 1.56 2.05 3.06 3.41 4.00
KazPrime 3.56

Section V. Factbook
97
Table 59
Basic listing requirements imposed by KASE
Reference Information
General listing requirements
Financial statements preparation of financial statements in accordance with IFRS or USA GAAP
Auditing organization financial statements are audited by an ARA RFCA requirements compliant company
Compliance with corporate governance norms
Kazakhstan issuers must comply with a corporate governance code approved by the general meeting
Foreign issuers must comply with a corporate governance code or other document identical in its content, if required by the legislation of the country where the issuer is registered as a legal entity
Operating market maker25 At admission to the Exchange – Exchange members submit applications to make market
When listing on the Exchange – there must be an operating market maker on the securities
Enforcement of investor rights26 No norms in founding documents and/or issuer prospectus infringing or restricting rights of securities holders for transfer (carve-out) thereof
Listing requirements imposed to shares
first (supreme) category second (supreme) category third category
Seasoning requirements at least three years (it is allowed to count the operation term
of reorganization of which
a smaller term may be allowed for the organization, whose only shareholder is the state, national holding or national management company)
at least two years (it is allowed to count the operation term
of reorganization of which
a smaller term may be allowed for the organization, whose only shareholder is the state, national holding or national management company)
not applicable
Audit issuer financial statements confirmed with an audit report must cover:
three recent ended financial years, if a share listing application request was submitted on expiry of four months after the latest financial year had ended
three successive ended financial years preceding the latest ended financial year, if a share listing application was submitted within four months after the latest financial year had ended
if a share listing application was submitted over six months later the date of preparation of an audit report on financial statements for the latest ended financial year, an audit report
issuer financial statements confirmed with an audit report must cover:
two recent ended financial years, if a share listing application request was submitted on expiry of four months after the latest financial year had ended
two successive ended financial years, preceding the latest ended financial year, if a share listing application was submitted within four months after the latest financial year had ended
if a share listing application was submitted over six months later the date of preparation of audit report on financial statements for the latest ended financial year, an audit report on interim financial statements or a report of an auditing organization
issuer financial statements confirmed with an audit report must be presented for the last ended financial year or the term of factual operation
within the four months after
be accepted without submission
confirmed with an audit report, provided the issuer has:
financial statements confirmed with an audit report, for
ended financial year, and
financial statements prepared
statements confirmed with
25 This requirement is not applied to the third category of the “shares” sector and the second subcategory of the “Non-rated Debt Securities”.
26 This requirement is not applied when listing index funds securities.

98
Table 59 (continuation)
Listing requirements imposed to shares
first (supreme) category second (supreme) category third category
or a report of an auditing organization on interim financial statements must be presented
the last submitted issuer financial statements, on which an audit
organization on issuer interim financial statements was compiled, had been prepared not more than six months before the submission of a share listing application
on interim financial statements must be presented
the last submitted issuer financial statements, on which an audit report or a report
interim financial statements was compiled had been prepared not more than six months before the submission of a share listing application
compiled not more than six months before the submission
Own capital at least 8,560,000 MCI,
during the listing in this category an issuer own capital may reduce down to 70 % of 8,560,000 MCI, however, not below
at least 171,000 MCI,
during the listing in this category an issuer own capital may
MCI, however, not below
at least 51,000 MCI
Market capitalization27 at least 8,560,000 MCI on expiry of six months from the opening of trade in the shares
at least 171,000 MCI on expiry not applicable
Net profit at least 85,600 MCI for each
during the listing the issuer must have net profit for two of three last years, at least 85,600 MCI
net profit for at least one not applicable
Free float28 at least 10 % of outstanding shares (except those redeemed, encumbered and (or) blocked) on expiry of six months from
15 % – on expiry of one year from the opening of trade
25 % – on expiry of two years from the opening of trade
for companies, with an over 50 %share, as on the listing date, belonging to the state, national holding or national management company, at least:
5 % of outstanding shares
at least 5 % of outstanding shares (except those redeemed, encumbered and (or) blocked) on expiry of six months
10 % – on expiry of one year from the opening of trade
15 % – on expiry of two years from the opening of trade
for companies, with an over 50 %share, as on the listing date, belonging to the state, national holding or national management company, at least 5 %
of six months from the opening of trade in the shares
not applicable
27 The requirement is applied when common shares listing.28
in compliance with article 64 of the Law of the Republic of Kazakhstan “On Joint Stock Companies” of May 13, 2003.
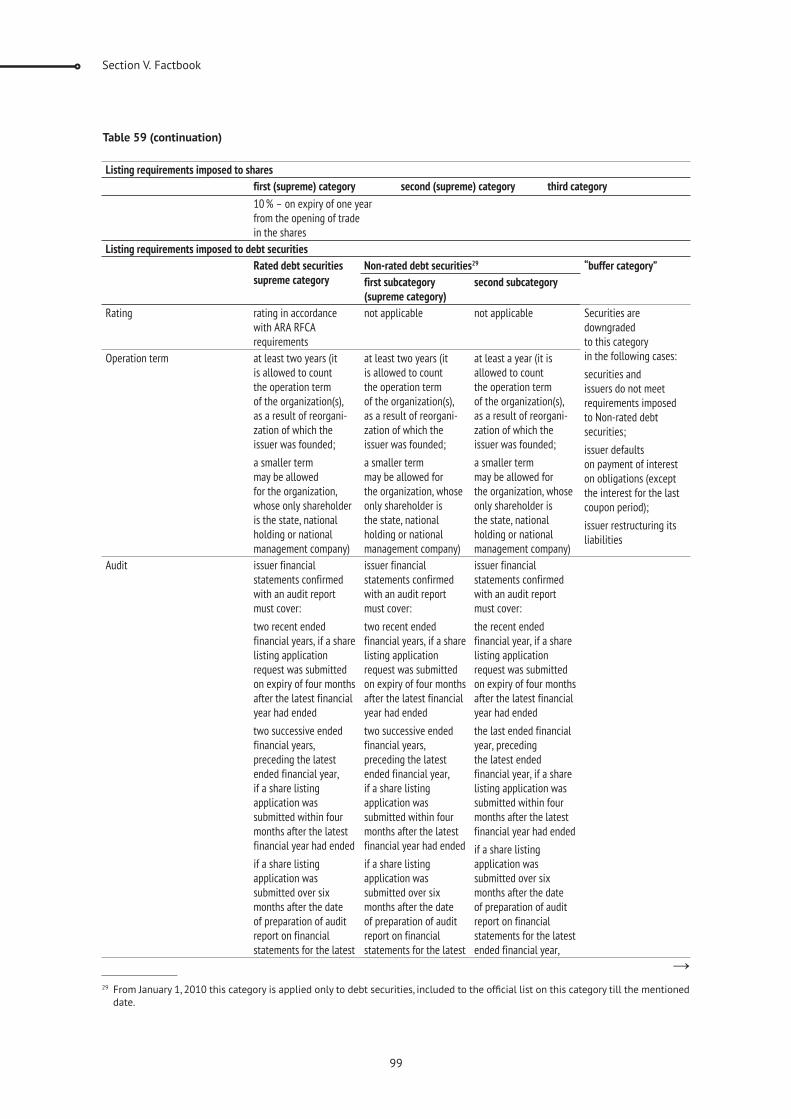
Section V. Factbook
99
Listing requirements imposed to shares
first (supreme) category second (supreme) category third category
10 % – on expiry of one year from the opening of trade
Listing requirements imposed to debt securities
Rated debt securitiessupreme category
Non-rated debt securities29 “buffer category”
first subcategory(supreme category)
second subcategory
Rating rating in accordance with ARA RFCA requirements
not applicable not applicable Securities are downgraded
securities and
requirements imposed to Non-rated debt securities;
issuer defaults
on obligations (except the interest for the last coupon period);
issuer restructuring its liabilities
Operation term at least two years (it is allowed to count
zation of which the issuer was founded;
a smaller term may be allowed
whose only shareholder is the state, national holding or national management company)
at least two years (it is allowed to count
issuer was founded;
a smaller term may be allowed for
only shareholder is
holding or national management company)
at least a year (it is allowed to count
as a result of reorgani-zation of which the issuer was founded;
a smaller term may be allowed for
only shareholder is
holding or national management company)
Audit issuer financial statements confirmed with an audit report must cover:
two recent ended
listing application request was submitted on expiry of four months after the latest financial year had ended
two successive ended financial years, preceding the latest ended financial year,
application was submitted within four months after the latest financial year had ended
if a share listing application was submitted over six months after the date of preparation of audit report on financial statements for the latest
issuer financial statements confirmed with an audit report must cover:
the recent ended financial year, if a share listing application request was submitted on expiry of four months after the latest financial year had ended
the last ended financial year, preceding
financial year, if a share listing application was submitted within four months after the latest financial year had ended
if a share listing application was submitted over six months after the date of preparation of audit report on financial statements for the latest ended financial year,
29
date.
Table 59 (continuation)
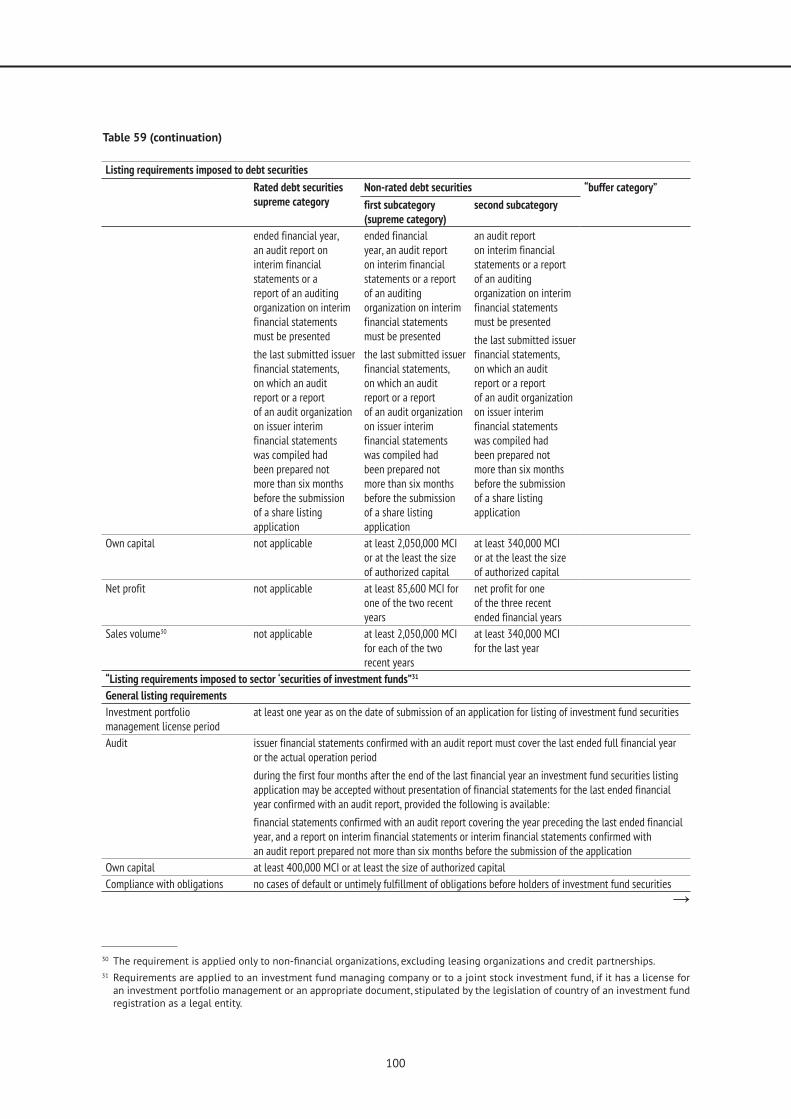
100
Table 59 (continuation)
Listing requirements imposed to debt securities
Rated debt securitiessupreme category
Non-rated debt securities “buffer category”
first subcategory(supreme category)
second subcategory
ended financial year,
interim financial statements or a
organization on interim financial statements must be presented
the last submitted issuer financial statements, on which an audit report or a report
on issuer interim financial statements was compiled had been prepared not more than six months
application
ended financial
organization on interim financial statements must be presented
the last submitted issuer financial statements, on which an audit report or a report
on issuer interim financial statements was compiled had been prepared not more than six months
application
an audit report
organization on interim financial statements must be presented
the last submitted issuer financial statements, on which an audit report or a report
on issuer interim financial statements was compiled had been prepared not more than six months
application
Own capital not applicable at least 2,050,000 MCI or at the least the size of authorized capital
at least 340,000 MCI or at the least the size
Net profit not applicable at least 85,600 MCI for one of the two recent years
net profit for one
ended financial years
Sales volume30 not applicable at least 2,050,000 MCI for each of the two recent years
at least 340,000 MCI
“Listing requirements imposed to sector ‘securities of investment funds”31
General listing requirements
Investment portfolio management license period
at least one year as on the date of submission of an application for listing of investment fund securities
Audit issuer financial statements confirmed with an audit report must cover the last ended full financial year or the actual operation period
during the first four months after the end of the last financial year an investment fund securities listing application may be accepted without presentation of financial statements for the last ended financial year confirmed with an audit report, provided the following is available:
financial statements confirmed with an audit report covering the year preceding the last ended financial year, and a report on interim financial statements or interim financial statements confirmed with
Own capital at least 400,000 MCI or at least the size of authorized capital
Compliance with obligations no cases of default or untimely fulfillment of obligations before holders of investment fund securities
30
31 Requirements are applied to an investment fund managing company or to a joint stock investment fund, if it has a license for
registration as a legal entity.

Section V. Factbook
101
“Listing requirements imposed to sector ‘securities of investment funds”
General listing requirements
Net asset value at least 215,000 MCI
if no investment fund securities are listing as on the date of admission of outstanding investment fund securities this requirement will be applicable in three months from the opening of trade in securities
Number of holders at least fifty within three months from the opening of trade in investment fund securities
Investment policy disclosure in accordance with Exchange internal documents
units of investment fund
shares of investment fund
shares of real estate fund
securities of index fund
Operation term32 not applicable joint-stock investment fund has been registered with the state at least a year before the submission of a listing application
not applicable
Valuation of assets not applicable joint-stock investment fund assets are appraised not applicable
Net profit not applicable joint-stock investment fund must have net profit not applicable
Placement and circulation in accordance with the legislation of the country that registered the issue of investment fund securities; the securities must be cleared for placement and circulation in the Exchange trading system
not applicable not applicable
Liabilities not applicable total liabilities do not exceed ten percent
capital
not applicable
Investment income32 not applicable at least seventy five percent of real estate fund investment income comes from lease of real estate
not applicable
Real estate listed as real estate fund assets
not applicable not acquired from affiliated persons
management company
not encumbered or transferred into trust management
the minimum real estate lease term, set with
one year
real estate in lease for two years by the date
listing application33
not applicable
Index stocks not applicable listed on the Exchange recognized by ARA RFCA
Refer to Notes to Factbook
Table 59 (continuation)
32 Requirements are not applied to a real estate fund, which is rated by one of ARA RFCA recognized rating agencies.33 Requirements in this paragraph are not applied to a real estate fund, which is rated by one of ARA RFCA recognized rating
agencies.

102
Ticker Default on Date Volume, m tenge Settled debt, m tenge
ALB Finance B.V.
ASBNe2 coupon Nov 22, 2009 1,338.1
ASBNe3 coupon Oct 19, 2009 1,060.2
Issuer total: 2,398.3
TuranAlem Finance B.V.
BTASe3 coupon Dec 2, 2009 3,231.8
BTASe4 coupon Sep 24, 2009 2,319.2
BTASe5 coupon Aug 10, 2009 2,242.9
BTASe6 coupon Oct 25, 2009 1,461.1
Issuer total: 9,255.0
GLOTUR JSC
GLOTb2 coupon Mar 20, 2009 946.2
GLOTb2 coupon Sep 20, 2009 448.9
Issuer total: 1,395.1
Alliance Bank JSC
ASBNb1 coupon Dec 23, 2009 135.0
ASBNb1 principal Dec 23, 2009 3,000.0
ASBNb10 coupon Nov 8, 2009 340.9
ASBNb12 coupon Sep 20, 2009 8.4
ASBNb13 coupon Sep 20, 2009 0.1
ASBNb14 coupon Sep 20, 2009 145.5
ASBNb3 coupon Oct 29, 2009 159.0
ASBNb6 principal Apr 10, 2009 6,990.7
ASBNb8 coupon Jun 26, 2009 189.8 174.9
ASBNb8 coupon Dec 26, 2009 174.9
Issuer total: 11,144.2 174.9
Astana-Finance JSC
ASFIb10 coupon Sep 28, 2009 9.2
ASFIb11 coupon Sep 28, 2009 322.5
ASFIb12 coupon Sep 29, 2009 240.1
ASFIb13 coupon Jun 7, 2009 3,308.8
ASFIb15 coupon Sep 25, 2009 423.7
ASFIb16 coupon Nov 19, 2009 1,129.1
ASFIb17 coupon Nov 14, 2009 953.8
ASFIb18 coupon Jun 6, 2009 626.5
ASFIb20 coupon Jun 26, 2009 58.6
ASFIb20 principal Jun 26, 2009 1,440.4
ASFIb21 coupon Jun 26, 2009 50.9
ASFIb21 coupon Dec 26, 2009 50.9
ASFIb22 coupon Aug 29, 2009 549.5
ASFIb23 coupon Aug 29, 2009 235.8
ASFIb24 coupon Aug 29, 2009 299.6
ASFIb4 coupon Nov 18, 2009 106.2
ASFIb6 coupon Dec 22, 2009 48.2
ASFIb7 coupon Dec 30, 2009 17.7
ASFIb9 coupon Nov 12, 2009 232.3
Issuer total: 10,103.5
BUILD INVESTMENTS GROUP JSC
BIGRb1 coupon Jun 28, 2009 90.0
Table 60
Companies that defaulted on debt securities in Y2009

Section V. Factbook
103
Ticker Default on Date Volume, m tenge Settled debt, m tenge
BIGRb1 principal Jun 28, 2009 2,001.0
Issuer total: 2,091.0
BTA Bank JSC
BTASb2 coupon Oct 29, 2009 168.8
BTASb3 coupon Nov 6, 2009 401.3
BTASb4 coupon Dec 10, 2009 711.7
BTASb5 coupon Dec 30, 2009 89.6
BTASb7 coupon Dec 29, 2009 3,374.5
BTASb9 coupon Dec 16, 2009 2,241.7
Issuer total: 6,987.4
BURLINGAZSTROI JSC
BGSTb1 coupon Aug 1, 2009 150.0
Issuer total: 150.0
Doszhan temir zholy (DTZ) JSC
DTJLb1 coupon Aug 1, 2009 5,983.8
Issuer total: 5,983.8
KOMBISNAB JSC
KMSBb1 coupon Mar 2, 2009 39.7
KMSBb1 coupon Jul 2, 2009 39.7
KMSBb1 coupon Nov 2, 2009 44.6
Issuer total: 124.0
Kazakh distribution company JSC
KZDKb1 coupon Mar 1, 2009 55.0 7.4
KZDKb1 coupon Sep 1, 2009 55.0
Issuer total: 110.0 7.4
Kazneftehim JSC
KZNHb2 coupon Feb 18, 2009 200.0 200.0
KZNHb2 coupon Aug 18, 2009 200.0
Issuer total: 400.0 200.0
Ornek XXI JSC
ORNKb1 coupon Mar 20, 2009 220.0
Issuer total: 220.0
ROSA JSC
ROSAb2 coupon May 18, 2009 86.3
Issuer total: 86.3
RT Holding JSC
KSMKb2 coupon Nov 6, 2009 71.2
Issuer total: 71.2
REMIX-R JSC
RMXRb1 coupon Jun 29, 2009 80.7
Issuer total: 80.7
Transstroimost JSC
TSSMb1 coupon Apr 6, 2009 224.7
Issuer total: 224.7
EL-DOS JSC
ELDSb1 coupon May 6, 2009 44.4 8.8
ELDSb1 principal May 6, 2009 592.4 8.8
Issuer total: 636.8 17.6
Subsidiary of BTA Bank JSC - Temirbank JSC
TEBNb10 coupon Nov 29, 2009 105.3
Table 60 (continuation)

104
Ticker Default on Date Volume, m tenge Settled debt, m tenge
TEBNb11 coupon Nov 29, 2009 142.4
TEBNb6 coupon Dec 30, 2009 182.0
TEBNb7 coupon Dec 1, 2009
TEBNb8 coupon Dec 1, 2009 171.2
Issuer total: 600.9
Akmola Kurlys Materialdary LLP
AKKMb1 coupon Jul 12, 2009 117.4
Issuer total: 117.4
Total on all issuers: 52,180.4 399.9
Refer to Notes to Factbook
Table 60 (continuation)

Section V. Factbook
105
Dat
eSh
ares
Corp
orat
e bo
nds
Repo
Curr
ency
Dep
osit
indi
cato
rsK
ASE
Inde
xca
pita
-liz
atio
ntr
aded
valu
eK
ASE_
BCK
ASE_
BPK
ASE_
BYca
pita
-liz
atio
ntr
aded
valu
eTO
NIA
wei
ghte
d av
erag
e of
teng
e to
:tr
aded
valu
e1
USD
1 EU
R1
RUB
Kaz
Prim
e-3M
m U
SDth
. USD
% A
PRm
USD
th. U
SD%
APR
teng
ete
nge
teng
eth
. USD
% A
PR
Jan
5, 2
009
892
30,9
50.0
8,75
1.4
145.
7424
3.85
10.3
912
,586
.911
,387
8.66
120.
86–
–40
8,04
0.0
12.0
1
Jan
6, 2
009
878
30,4
35.9
4,20
8.0
145.
0924
2.80
10.4
712
,543
.31,
727.
96.
9212
0.95
163.
73–
130,
026.
812
.03
Jan
8, 2
009
855
31,4
24.1
1,25
3.4
144.
7424
2.15
10.5
412
,541
.118
,880
.110
.16
120.
99–
–52
3,43
0.0
12.0
5
Jan
9, 2
009
873
31,1
76.9
4,65
1.0
139.
6523
5.03
12.5
912
,556
.274
,761
.27.
2512
1.00
––
181,
005.
012
.04
Jan
12, 2
009
886
31,0
38.4
4,88
1.0
146.
1324
3.62
12.4
712
,554
.06,
240.
65.
9212
1.04
–3.
9099
406,
072.
712
.04
Jan
13, 2
009
867
31,0
55.3
15,4
38.6
144.
5924
1.41
11.1
612
,605
.53,
364.
66.
2412
1.14
–3.
8889
279,
233.
112
.06
Jan
14, 2
009
869
31,1
94.3
2,19
6.3
145.
6124
2.51
11.0
712
,598
.81,
667.
06.
9912
1.26
–3.
8450
541,
485.
412
.05
Jan
15, 2
009
841
30,2
28.1
1,05
4.1
145.
1624
1.75
11.0
812
,597
.114
,629
.19.
8712
1.37
––
291,
385.
012
.07
Jan
16, 2
009
846
30,1
49.5
4,18
3.2
145.
2824
1.63
11.1
412
,644
.717
,830
.210
.12
121.
31–
3.76
2562
7,79
5.2
12.0
5
Jan
19, 2
009
838
30,1
99.2
1,86
9.4
142.
9323
8.12
11.9
512
,653
.59,
592.
511
.03
121.
29–
3.70
2335
8,41
2.1
12.2
2
Jan
20, 2
009
804
29,4
40.2
8,67
5.9
145.
4024
1.46
11.1
512
,652
.47,
746.
013
.66
121.
30–
–33
3,28
0.0
12.3
2
Jan
21, 2
009
783
28,9
56.6
1,14
5.1
145.
4624
1.46
11.1
312
,651
.83,
631.
615
.33
121.
31–
3.73
5038
5,13
6.9
12.5
0
Jan
22, 2
009
779
29,3
17.1
3,64
2.2
144.
6924
0.10
11.2
012
,661
.046
,469
.012
.54
121.
32–
3.72
3135
2,77
2.9
12.5
0
Jan
23, 2
009
772
28,3
08.0
26,2
30.5
146.
0224
1.46
11.1
712
,664
.812
,043
.515
.31
121.
60–
3.71
201,
281,
187.
712
.82
Jan
26, 2
009
726
28,4
19.1
13,8
91.7
145.
8424
1.23
11.1
512
,661
.414
,270
.912
.52
121.
65–
3.70
9020
7,01
4.9
13.5
0
Jan
27, 2
009
723
27,3
99.4
30,3
55.2
146.
4124
1.68
11.1
312
,657
.837
,730
.711
.48
121.
70–
3.68
4055
8,25
0.3
13.5
8
Jan
28, 2
009
694
27,7
39.3
3,25
4.1
147.
1824
2.64
11.0
912
,657
.32,
937.
417
.18
121.
71–
3.66
5230
9,01
6.6
13.7
6
Jan
29, 2
009
664
27,3
49.4
7,13
3.0
147.
0824
2.38
11.1
912
,665
.612
,296
.914
.58
121.
56–
3.50
2036
1,66
5.3
14.0
6
Jan
30, 2
009
622
26,6
62.0
11,5
72.5
145.
8524
0.26
11.2
712
,653
.612
,880
.312
.57
121.
47–
3.44
5833
6,61
1.1
14.1
8
Feb
2, 2
009
581
25,9
15.1
2,99
4.3
146.
1424
0.77
11.5
012
,631
.517
,383
.010
.20
121.
87–
–62
4,46
0.0
14.5
0
Feb
3, 2
009
577
25,8
26.8
304.
214
7.06
241.
7211
.47
12,6
07.2
11,7
97.3
11.8
612
2.32
––
1,57
0,12
0.0
14.5
0
Feb
4, 2
009
656
24,5
86.2
4,74
0.2
147.
2324
1.69
11.4
711
,629
.321
,266
.119
.82
143.
98–
–59
1,56
5.0
14.5
0
Feb
5, 2
009
665
24,1
95.1
3,34
1.8
142.
8023
5.21
12.0
311
,412
.025
,819
.18.
9414
9.97
––
348,
500.
014
.50
Feb
6, 2
009
673
24,1
30.2
1,89
7.9
145.
9623
9.52
11.5
711
,418
.935
,562
.77.
0114
9.54
191.
60–
197,
151.
914
.50
Feb
9, 2
009
687
25,1
54.8
10,0
04.7
142.
1223
3.93
11.9
411
,421
.913
,787
.44.
8514
8.50
––
73,8
45.0
14.5
0
Feb
10, 2
009
684
25,2
72.4
62,6
72.4
140.
6823
2.14
12.2
211
,429
.073
,990
.72.
4614
8.30
191.
10–
859,
078.
914
.50
Feb
11, 2
009
691
24,8
36.7
4,78
3.3
142.
2823
4.36
12.9
211
,435
.621
,896
.05.
0514
8.11
–4.
1550
101,
528.
214
.50
Feb
12, 2
009
682
25,0
49.7
15,9
92.6
140.
5923
1.53
13.3
911
,427
.051
,540
.24.
9914
8.39
192.
17–
225,
477.
014
.60
Feb
13, 2
009
632
24,4
58.5
7,72
8.5
143.
5323
5.12
13.3
411
,409
.13,
309.
87.
2814
8.90
–4.
3270
437,
355.
215
.00
Tab
le 6
1
KA
SE
mar
ket
ind
icat
ors
in
Y2
00
9

106
Tab
le 6
1 (
con
tin
uati
on
)
Dat
eSh
ares
Corp
orat
e bo
nds
Repo
Curr
ency
Dep
osit
indi
cato
rsK
ASE
Inde
xca
pita
-liz
atio
ntr
aded
valu
eK
ASE_
BCK
ASE_
BPK
ASE_
BYca
pita
-liz
atio
ntr
aded
valu
eTO
NIA
wei
ghte
d av
erag
e of
teng
e to
:tr
aded
valu
e1
USD
1 EU
R1
RUB
Kaz
Prim
e-3M
m U
SDth
. USD
% A
PRm
USD
th. U
SD%
APR
teng
ete
nge
teng
eth
. USD
% A
PR
Feb
16, 2
009
633
27,6
26.7
206,
979.
314
3.88
235.
6913
.28
11,3
98.4
6,63
9.6
6.38
149.
11–
4.29
2719
7,97
4.3
15.0
0
Feb
17, 2
009
638
27,3
18.8
2,72
7.9
143.
6323
4.97
13.1
911
,389
.913
,116
.56.
5614
9.28
–4.
1900
297,
669.
615
.00
Feb
18, 2
009
641
26,8
83.3
4,22
0.9
144.
7323
6.12
13.0
911
,449
.413
,680
.711
.37
149.
42–
–20
0,20
0.0
15.0
0
Feb
19, 2
009
621
26,9
84.2
4,73
6.5
143.
3923
4.25
13.1
611
,447
.82,
748.
18.
9614
9.00
187.
25–
171,
833.
715
.00
Feb
20, 2
009
643
26,5
79.9
5,47
2.6
144.
0023
4.62
13.1
311
,435
.119
,159
.92.
9814
9.36
––
421,
200.
015
.00
Feb
23, 2
009
641
26,3
43.2
5,20
0.2
142.
3823
2.05
13.3
811
,412
.74,
385.
81.
9115
0.00
––
265,
500.
015
.00
Feb
24, 2
009
633
25,9
85.4
330.
114
2.93
232.
4313
.51
11,4
06.1
5,71
1.9
2.08
150.
1919
1.40
–1,
002,
799.
915
.00
Feb
25, 2
009
639
26,3
15.3
562.
614
2.51
231.
4113
.50
11,4
02.5
644.
82.
2415
0.00
–4.
2100
554,
828.
115
.00
Feb
26, 2
009
640
26,1
13.6
732.
014
1.75
230.
4613
.52
11,3
93.5
8,05
6.1
3.40
150.
26–
–47
5,22
5.0
15.0
0
Feb
27, 2
009
627
26,0
69.8
916.
214
2.19
230.
8413
.60
11,3
87.3
5,65
0.8
2.63
150.
4319
1.00
4.22
7024
0,90
7.7
15.0
0
Mar
2, 2
009
621
26,1
92.7
219.
514
2.53
231.
0313
.60
11,3
81.5
1,67
5.2
1.80
150.
60–
–23
7,38
0.0
15.0
0
Mar
3, 2
009
598
25,5
50.5
218.
314
3.50
232.
1313
.44
11,3
83.5
1,54
4.7
2.16
150.
54–
4.16
0026
4,84
8.7
15.0
0
Mar
4, 2
009
595
25,1
92.8
2,15
4.9
146.
5423
6.78
12.1
211
,387
.74,
550.
22.
7915
0.42
––
210,
600.
015
.00
Mar
5, 2
009
614
23,4
16.7
260.
513
9.43
228.
7314
.09
11,4
22.6
1,39
5.9
2.06
150.
3118
9.85
4.18
5013
4,53
6.1
15.0
0
Mar
6, 2
009
603
23,3
42.6
225.
514
0.00
229.
2314
.41
11,4
16.3
11,4
80.5
2.38
150.
49–
–21
6,80
0.0
15.0
0
Mar
10,
200
960
423
,462
.326
1.0
139.
9922
9.19
14.3
111
,414
.93,
209.
02.
0915
0.53
–4.
2390
102,
355.
515
.00
Mar
11,
200
962
424
,253
.44,
662.
714
0.06
228.
6417
.65
11,4
15.3
7,78
7.8
2.83
150.
52–
–25
2,18
5.0
15.0
0
Mar
12,
200
962
123
,378
.634
,394
.414
0.10
228.
5917
.78
11,4
19.1
7,68
1.3
2.11
150.
48–
–11
5,66
0.0
15.0
0
Mar
13,
200
964
124
,858
.72,
592.
314
0.20
227.
8517
.82
11,4
25.7
7,56
6.3
1.36
150.
29–
4.33
1017
8,26
3.2
15.0
0
Mar
16,
200
964
924
,938
.857
,090
.214
0.16
228.
0217
.85
11,4
27.1
8,65
4.5
1.32
150.
2519
4.80
–10
7,52
9.7
15.0
4
Mar
17,
200
966
024
,703
.379
3.4
140.
0422
7.58
17.9
211
,555
.548
1.1
2.45
150.
3819
5.97
–65
,410
.914
.95
Mar
18,
200
967
424
,780
.21,
664.
213
9.96
227.
1418
.01
11,5
48.4
759.
22.
5115
0.58
195.
80–
187,
110.
114
.54
Mar
19,
200
968
324
,913
.13,
264.
714
2.13
228.
3317
.78
11,5
36.0
17,7
53.0
1.56
150.
93–
4.48
5039
6,10
8.9
14.5
0
Mar
20,
200
967
925
,524
.74,
613.
514
0.00
225.
7218
.12
11,5
30.0
61,6
05.8
1.12
151.
10–
–20
2,65
0.0
14.5
0
Mar
24,
200
971
826
,949
.82,
185.
114
0.73
226.
8218
.16
11,5
41.0
510.
20.
8715
1.31
206.
004.
5260
164,
077.
614
.50
Mar
25,
200
969
326
,321
.414
,152
.314
0.89
227.
0818
.26
11,5
38.5
852.
31.
0115
1.38
203.
83–
150,
182.
314
.50
Mar
26,
200
970
926
,733
.448
8.3
140.
0322
5.52
18.3
711
,539
.617
,423
.40.
6215
1.35
–4.
5370
99,6
15.0
14.5
0
Mar
27,
200
972
027
,908
.228
,612
.614
0.49
225.
9618
.41
11,5
39.6
7,77
4.4
0.42
151.
35–
4.54
5223
7,33
5.3
14.5
0
Mar
30,
200
970
426
,406
.25,
682.
713
9.82
225.
0518
.14
11,5
37.8
7,95
0.1
0.65
151.
4020
0.00
4.45
8018
6,15
2.5
14.5
0
Mar
31,
200
968
426
,203
.21,
216.
914
1.08
225.
7617
.90
11,5
49.1
17,0
86.1
1.37
151.
08–
4.46
7026
1,14
1.6
14.2
0

Section V. Factbook
107
Dat
eSh
ares
Corp
orat
e bo
nds
Repo
Curr
ency
Dep
osit
indi
cato
rsK
ASE
Inde
xca
pita
-liz
atio
ntr
aded
valu
eK
ASE_
BCK
ASE_
BPK
ASE_
BYca
pita
-liz
atio
ntr
aded
valu
eTO
NIA
wei
ghte
d av
erag
e of
teng
e to
:tr
aded
valu
e1
USD
1 EU
R1
RUB
Kaz
Prim
e-3M
m U
SDth
. USD
% A
PRm
USD
th. U
SD%
APR
teng
ete
nge
teng
eth
. USD
% A
PR
Apr 1
, 200
968
326
,201
.213
,241
.314
0.42
224.
3017
.82
11,5
09.2
3,71
2.6
0.78
150.
99–
4.45
5011
5,28
9.5
14.2
0
Apr 2
, 200
972
027
,734
.011
,584
.014
2.12
225.
2317
.49
11,5
06.8
751.
30.
7515
0.98
–4.
4900
84,0
14.2
13.0
0
Apr 3
, 200
974
828
,962
.03,
036.
613
9.84
222.
0417
.78
11,5
05.8
699.
00.
6015
1.01
–4.
5350
55,9
15.1
13.0
0
Apr 6
, 200
977
028
,914
.02,
264.
014
2.18
223.
4417
.81
11,4
93.5
572.
30.
3615
1.08
–4.
5675
77,6
76.3
13.0
0
Apr 7
, 200
972
927
,926
.71,
481.
114
1.12
221.
8217
.66
11,4
94.6
2,27
1.2
0.74
151.
0520
1.90
4.52
4112
0,92
1.6
13.0
0
Apr 8
, 200
972
127
,830
.078
6.1
141.
7622
1.57
17.6
511
,492
.917
,768
.01.
0415
1.00
199.
404.
4830
67,6
73.2
13.0
0
Apr 9
, 200
979
728
,424
.985
5.6
142.
0122
1.02
17.5
311
,500
.936
4.8
0.96
150.
77–
–80
,875
.013
.00
Apr 1
0, 2
009
839
30,1
63.5
698.
714
5.31
223.
6517
.31
11,4
54.8
5,40
6.2
0.45
150.
76–
4.50
5014
1,36
1.7
13.0
0
Apr 1
3, 2
009
813
30,3
98.5
896.
214
8.33
225.
3517
.19
11,4
50.6
7,35
2.8
0.76
150.
83–
4.51
5017
3,96
4.9
13.0
0
Apr 1
4, 2
009
840
30,9
37.3
3,58
6.0
148.
9622
5.30
17.2
311
,465
.745
6.5
1.38
150.
66–
4.51
7134
0,44
9.9
13.0
0
Apr 1
5, 2
009
847
31,5
97.7
24,3
41.8
148.
5422
4.11
17.3
711
,478
.012
,526
.41.
5715
0.31
199.
754.
5050
282,
465.
713
.00
Apr 1
6, 2
009
846
31,2
35.8
14,7
74.4
148.
1722
2.96
17.3
211
,482
.93,
210.
20.
9915
0.17
–4.
4915
75,7
49.9
13.0
0
Apr 1
7, 2
009
854
31,9
76.3
11,9
16.9
148.
1822
2.15
17.2
811
,483
.67,
867.
70.
5615
0.15
197.
004.
5047
79,7
74.4
13.0
0
Apr 2
0, 2
009
860
32,2
40.7
1,78
2.4
148.
0422
1.20
17.3
711
,477
.31,
925.
40.
3715
0.33
–4.
4962
97,9
86.9
13.0
0
Apr 2
1, 2
009
855
30,7
69.9
6,64
6.8
150.
0622
2.44
17.1
911
,471
.61,
455.
50.
4715
0.49
–4.
4200
80,3
19.3
12.9
9
Apr 2
2, 2
009
854
31,8
52.1
883.
814
9.68
221.
2217
.16
11,4
62.4
1,44
4.9
0.30
150.
76–
4.43
8022
0,41
3.9
12.5
0
Apr 2
3, 2
009
878
32,4
64.4
1,01
5.7
153.
9022
3.87
17.1
911
,468
.321
,156
.90.
5915
0.59
–4.
4700
75,2
27.5
12.5
0
Apr 2
4, 2
009
891
32,7
22.0
5,01
4.6
154.
5122
3.77
17.1
311
,468
.65,
619.
60.
6415
0.58
198.
504.
5100
70,4
58.9
12.5
0
Apr 2
7, 2
009
863
32,5
10.2
4,03
8.3
155.
2022
3.78
17.0
411
,465
.94,
971.
90.
4015
0.66
198.
154.
5220
47,5
74.9
12.5
0
Apr 2
8, 2
009
865
32,6
40.1
2,61
1.8
155.
4222
3.07
17.0
611
,465
.512
,612
.40.
5915
0.67
–4.
5029
98,3
02.3
12.5
0
Apr 2
9, 2
009
877
32,4
26.7
749.
315
5.71
222.
6717
.00
11,4
64.6
126.
40.
8415
0.72
–4.
5513
125,
670.
812
.50
Apr 3
0, 2
009
900
33,1
55.1
1,88
9.4
156.
0422
2.14
17.2
511
,467
.43,
866.
40.
6415
0.64
–4.
5840
90,4
27.3
12.5
0
May
4, 2
009
959
34,3
73.1
906.
015
6.09
221.
4917
.26
11,4
66.0
2,80
6.6
0.44
150.
6819
8.85
4.56
3378
,200
.212
.50
May
5, 2
009
983
35,8
84.2
1,61
5.6
155.
5622
0.07
17.3
811
,466
.780
2.5
0.28
150.
6620
2.00
4.61
2076
,363
.212
.50
May
6, 2
009
1,03
237
,050
.194
1.3
155.
7721
9.84
17.4
211
,484
.332
,714
.90.
6615
0.61
––
35,7
60.0
12.5
0
May
7, 2
009
1,05
339
,005
.02,
671.
615
5.55
218.
7317
.53
11,5
22.7
2,11
2.2
0.53
150.
46–
4.60
0090
,646
.712
.50
May
8, 2
009
1,07
438
,198
.71,
052.
915
6.31
218.
7217
.73
11,5
12.8
8,68
1.3
0.57
150.
46–
4.63
2189
,508
.312
.50
May
12,
200
91,
036
37,8
69.1
2,07
1.0
156.
6921
8.45
17.6
711
,520
.21,
751.
80.
5815
0.25
201.
504.
6755
66,7
18.2
12.5
0
May
13,
200
91,
025
37,5
67.6
2,74
6.6
159.
4222
0.27
17.5
511
,529
.14,
951.
80.
7415
0.00
204.
294.
7021
109,
492.
712
.50
May
14,
200
91,
004
36,3
62.5
600.
815
8.89
219.
1717
.63
11,6
02.3
3,01
3.5
0.74
149.
8220
4.10
4.68
0010
5,89
2.3
12.4
4
Tab
le 6
1 (
con
tin
uati
on
)
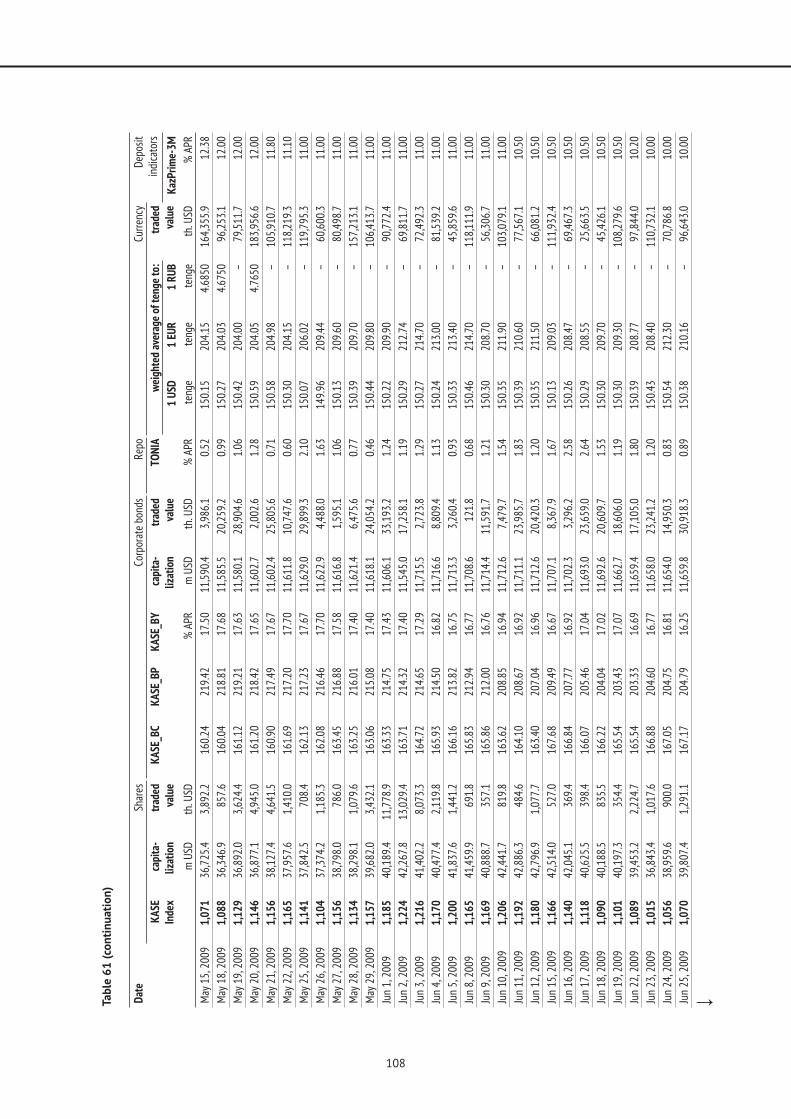
108
Tab
le 6
1 (
con
tin
uati
on
)
Dat
eSh
ares
Corp
orat
e bo
nds
Repo
Curr
ency
Dep
osit
indi
cato
rsK
ASE
Inde
xca
pita
-liz
atio
ntr
aded
valu
eK
ASE_
BCK
ASE_
BPK
ASE_
BYca
pita
-liz
atio
ntr
aded
valu
eTO
NIA
wei
ghte
d av
erag
e of
teng
e to
:tr
aded
valu
e1
USD
1 EU
R1
RUB
Kaz
Prim
e-3M
m U
SDth
. USD
% A
PRm
USD
th. U
SD%
APR
teng
ete
nge
teng
eth
. USD
% A
PR
May
15,
200
91,
071
36,7
25.4
3,89
2.2
160.
2421
9.42
17.5
011
,590
.43,
986.
10.
5215
0.15
204.
154.
6850
164,
355.
912
.38
May
18,
200
91,
088
36,3
46.9
857.
616
0.04
218.
8117
.68
11,5
85.5
20,2
59.2
0.99
150.
2720
4.03
4.67
5096
,253
.112
.00
May
19,
200
91,
129
36,8
92.0
3,62
4.4
161.
1221
9.21
17.6
311
,580
.128
,904
.61.
0615
0.42
204.
00–
79,5
11.7
12.0
0
May
20,
200
91,
146
36,8
77.1
4,94
5.0
161.
2021
8.42
17.6
511
,602
.72,
002.
61.
2815
0.59
204.
054.
7650
183,
956.
612
.00
May
21,
200
91,
156
38,1
27.4
4,64
1.5
160.
9021
7.49
17.6
711
,602
.425
,805
.60.
7115
0.58
204.
98–
105,
910.
711
.80
May
22,
200
91,
165
37,9
57.6
1,41
0.0
161.
6921
7.20
17.7
011
,611
.810
,747
.60.
6015
0.30
204.
15–
118,
219.
311
.10
May
25,
200
91,
141
37,8
42.5
708.
416
2.13
217.
2317
.67
11,6
29.0
29,8
99.3
2.10
150.
0720
6.02
–11
9,79
5.3
11.0
0
May
26,
200
91,
104
37,3
74.2
1,18
5.3
162.
0821
6.46
17.7
011
,622
.94,
488.
01.
6314
9.96
209.
44–
60,6
00.3
11.0
0
May
27,
200
91,
156
38,7
98.0
786.
016
3.45
216.
8817
.58
11,6
16.8
1,59
5.1
1.06
150.
1320
9.60
–80
,498
.711
.00
May
28,
200
91,
134
38,2
98.1
1,07
9.6
163.
2521
6.01
17.4
011
,621
.46,
475.
60.
7715
0.39
209.
70–
157,
213.
111
.00
May
29,
200
91,
157
39,6
82.0
3,43
2.1
163.
0621
5.08
17.4
011
,618
.124
,054
.20.
4615
0.44
209.
80–
106,
413.
711
.00
Jun
1, 2
009
1,18
540
,189
.411
,778
.916
3.33
214.
7517
.43
11,6
06.1
33,1
93.2
1.24
150.
2220
9.90
–90
,772
.411
.00
Jun
2, 2
009
1,22
442
,267
.813
,029
.416
3.71
214.
3217
.40
11,5
45.0
17,2
58.1
1.19
150.
2921
2.74
–69
,811
.711
.00
Jun
3, 2
009
1,21
641
,402
.28,
073.
316
4.72
214.
6517
.29
11,7
15.5
2,72
3.8
1.29
150.
2721
4.70
–72
,492
.311
.00
Jun
4, 2
009
1,17
040
,477
.42,
119.
816
5.93
214.
5016
.82
11,7
16.6
8,80
9.4
1.13
150.
2421
3.00
–81
,539
.211
.00
Jun
5, 2
009
1,20
041
,837
.61,
441.
216
6.16
213.
8216
.75
11,7
13.3
3,26
0.4
0.93
150.
3321
3.40
–45
,859
.611
.00
Jun
8, 2
009
1,16
541
,459
.969
1.8
165.
8321
2.94
16.7
711
,708
.612
1.8
0.68
150.
4621
4.70
–11
8,11
1.9
11.0
0
Jun
9, 2
009
1,16
940
,888
.735
7.1
165.
8621
2.00
16.7
611
,714
.411
,591
.71.
2115
0.30
208.
70–
56,3
06.7
11.0
0
Jun
10, 2
009
1,20
642
,441
.781
9.8
163.
6220
8.85
16.9
411
,712
.67,
479.
71.
5415
0.35
211.
90–
103,
079.
111
.00
Jun
11, 2
009
1,19
242
,886
.348
4.6
164.
1020
8.67
16.9
211
,711
.123
,985
.71.
8315
0.39
210.
60–
77,5
67.1
10.5
0
Jun
12, 2
009
1,18
042
,796
.91,
077.
716
3.40
207.
0416
.96
11,7
12.6
20,4
20.3
1.20
150.
3521
1.50
–66
,081
.210
.50
Jun
15, 2
009
1,16
642
,514
.052
7.0
167.
6820
9.49
16.6
711
,707
.18,
367.
91.
6715
0.13
209.
03–
111,
932.
410
.50
Jun
16, 2
009
1,14
042
,045
.136
9.4
166.
8420
7.77
16.9
211
,702
.33,
296.
22.
5815
0.26
208.
47–
69,4
67.3
10.5
0
Jun
17, 2
009
1,11
840
,625
.539
8.4
166.
0720
5.46
17.0
411
,693
.023
,659
.02.
6415
0.29
208.
55–
25,6
63.5
10.5
0
Jun
18, 2
009
1,09
040
,188
.583
5.5
166.
2220
4.04
17.0
211
,692
.620
,609
.71.
5315
0.30
209.
70–
45,4
26.1
10.5
0
Jun
19, 2
009
1,10
140
,197
.335
4.4
165.
5420
3.43
17.0
711
,662
.718
,606
.01.
1915
0.30
209.
30–
108,
279.
610
.50
Jun
22, 2
009
1,08
939
,453
.22,
224.
716
5.54
203.
3316
.69
11,6
59.4
17,1
05.0
1.80
150.
3920
8.77
–97
,844
.010
.20
Jun
23, 2
009
1,01
536
,843
.41,
017.
616
6.88
204.
6016
.77
11,6
58.0
23,2
41.2
1.20
150.
4320
8.40
–11
0,73
2.1
10.0
0
Jun
24, 2
009
1,05
638
,959
.690
0.0
167.
0520
4.75
16.8
111
,654
.014
,950
.30.
8315
0.54
212.
30–
70,7
86.8
10.0
0
Jun
25, 2
009
1,07
039
,807
.41,
291.
116
7.17
204.
7916
.25
11,6
59.8
30,9
18.3
0.89
150.
3821
0.16
–96
,643
.010
.00

Section V. Factbook
109
Tab
le 6
1 (
con
tin
uati
on
)
Dat
eSh
ares
Corp
orat
e bo
nds
Repo
Curr
ency
Dep
osit
indi
cato
rsK
ASE
Inde
xca
pita
-liz
atio
ntr
aded
valu
eK
ASE_
BCK
ASE_
BPK
ASE_
BYca
pita
-liz
atio
ntr
aded
valu
eTO
NIA
wei
ghte
d av
erag
e of
teng
e to
:tr
aded
valu
e1
USD
1 EU
R1
RUB
Kaz
Prim
e-3M
m U
SDth
. USD
% A
PRm
USD
th. U
SD%
APR
teng
ete
nge
teng
eth
. USD
% A
PR
Jun
26, 2
009
1,04
438
,593
.498
7.5
170.
3620
7.33
15.3
311
,658
.328
,629
.90.
7715
0.42
211.
28–
183,
240.
210
.00
Jun
29, 2
009
1,04
938
,272
.327
2.4
172.
2920
9.05
15.3
611
,645
.428
,770
.70.
7015
0.41
210.
80–
139,
705.
810
.00
Jun
30, 2
009
1,07
039
,886
.753
5.0
172.
2020
9.22
15.2
511
,644
.731
,260
.20.
7515
0.43
212.
47–
398,
536.
010
.00
Jul 1
, 200
91,
089
39,9
34.7
228.
017
1.66
208.
7515
.33
11,6
45.4
3,48
1.7
0.88
150.
4121
1.05
–14
0,38
3.2
10.0
0
Jul 2
, 200
91,
067
39,6
76.4
371.
617
1.27
208.
2914
.74
11,6
48.3
16,5
97.6
0.62
150.
3321
2.50
–15
6,61
7.1
10.0
0
Jul 3
, 200
91,
047
38,9
07.0
688.
517
1.89
209.
0214
.71
11,6
48.3
16,1
58.5
0.57
150.
3321
0.50
–19
0,47
0.8
10.0
0
Jul 7
, 200
91,
026
38,1
23.0
377.
816
7.20
205.
4416
.66
11,6
43.9
5,66
5.7
1.04
150.
4521
0.24
–12
6,09
4.8
10.0
0
Jul 8
, 200
91,
001
37,8
29.8
13,7
61.2
170.
3120
7.83
15.4
311
,637
.82,
612.
80.
9015
0.62
209.
69–
137,
894.
510
.00
Jul 9
, 200
999
437
,601
.259
7.2
168.
4120
6.33
15.9
011
,638
.911
,384
.90.
9715
0.53
––
93,3
00.0
9.90
Jul 1
0, 2
009
995
37,6
95.7
379.
816
8.66
206.
5016
.12
11,6
65.8
15,7
69.9
0.89
150.
5921
0.57
–73
,336
.39.
50
Jul 1
3, 2
009
991
36,9
17.8
300.
616
7.33
205.
4716
.21
11,6
56.0
19,8
04.5
1.22
150.
4420
9.39
–10
6,88
3.7
9.50
Jul 1
4, 2
009
1,01
538
,343
.444
3.2
166.
3320
4.77
16.8
911
,672
.213
,488
.20.
9515
0.65
––
153,
510.
09.
50
Jul 1
5, 2
009
1,03
339
,450
.34,
358.
716
3.44
202.
2717
.47
11,6
69.7
40,8
09.2
2.01
150.
72–
–43
1,77
5.0
9.50
Jul 1
6, 2
009
1,04
440
,310
.31,
502.
416
3.88
202.
7017
.12
11,6
68.6
7,78
6.1
2.20
150.
7521
2.31
–14
4,73
6.8
9.50
Jul 1
7, 2
009
1,05
741
,061
.05,
614.
417
3.30
209.
6214
.99
11,6
69.3
21,2
28.9
1.63
150.
73–
–17
8,96
0.0
9.50
Jul 2
0, 2
009
1,06
441
,080
.735
7.2
169.
4420
6.86
15.0
411
,667
.510
,625
.01.
8815
0.78
––
139,
855.
09.
50
Jul 2
1, 2
009
1,09
442
,965
.019
1.8
170.
1920
7.45
14.9
611
,664
.74,
485.
71.
3915
0.86
214.
40–
124,
135.
29.
50
Jul 2
2, 2
009
1,05
241
,040
.92,
310.
817
0.82
207.
8917
.42
11,6
68.6
16,4
29.7
1.19
150.
7521
4.13
–10
2,36
2.3
9.50
Jul 2
3, 2
009
1,06
541
,085
.390
2.5
171.
0420
7.70
17.5
411
,669
.342
,494
.70.
8315
0.73
214.
43–
197,
861.
59.
50
Jul 2
4, 2
009
1,09
843
,309
.482
9.0
172.
3520
8.98
17.4
211
,669
.75,
569.
30.
4115
0.72
214.
30–
98,1
12.1
9.50
Jul 2
7, 2
009
1,10
742
,674
.72,
591.
717
3.39
210.
0017
.51
11,6
67.9
3,45
3.1
0.40
150.
7721
4.76
–13
4,90
1.1
9.50
Jul 2
8, 2
009
1,14
044
,520
.51,
105.
917
3.59
210.
0417
.68
11,6
68.3
8,90
3.7
0.58
150.
7621
5.26
–10
8,96
5.9
9.50
Jul 2
9, 2
009
1,12
343
,651
.169
0.5
174.
8521
1.06
17.5
411
,671
.113
,936
.70.
8115
0.68
213.
50–
199,
692.
89.
44
Jul 3
0, 2
009
1,14
544
,211
.758
3.2
175.
5221
1.45
17.5
911
,670
.14,
179.
61.
2115
0.71
211.
99–
223,
918.
68.
93
Jul 3
1, 2
009
1,19
245
,619
.466
5.3
177.
5621
3.05
17.5
611
,670
.13,
996.
71.
2415
0.71
213.
07–
117,
301.
08.
52
Aug
3, 2
009
1,26
746
,814
.785
4.2
178.
5821
3.62
17.6
711
,668
.65,
572.
60.
9515
0.75
214.
81–
115,
592.
18.
05
Aug
4, 2
009
1,28
147
,881
.91,
870.
917
9.14
214.
1817
.65
11,6
66.8
7,14
5.4
0.80
150.
8021
7.09
–24
5,78
9.5
8.05
Aug
5, 2
009
1,29
748
,574
.650
2.4
180.
6421
5.26
17.6
411
,666
.12,
843.
80.
7615
0.82
217.
01–
323,
900.
58.
05
Aug
6, 2
009
1,29
749
,578
.981
1.6
182.
2621
6.48
17.6
611
,666
.53,
989.
91.
0215
0.81
217.
09–
215,
603.
88.
05
Aug
7, 2
009
1,28
847
,889
.71,
633.
318
3.18
217.
3317
.73
11,6
69.3
2,44
4.0
1.18
150.
7321
6.36
–14
1,17
0.1
8.13

110
Tab
le 6
1 (
con
tin
uati
on
)
Dat
eSh
ares
Corp
orat
e bo
nds
Repo
Curr
ency
Dep
osit
indi
cato
rsK
ASE
Inde
xca
pita
-liz
atio
ntr
aded
valu
eK
ASE_
BCK
ASE_
BPK
ASE_
BYca
pita
-liz
atio
ntr
aded
valu
eTO
NIA
wei
ghte
d av
erag
e of
teng
e to
:tr
aded
valu
e1
USD
1 EU
R1
RUB
Kaz
Prim
e-3M
m U
SDth
. USD
% A
PRm
USD
th. U
SD%
APR
teng
ete
nge
teng
eth
. USD
% A
PR
Aug
10, 2
009
1,32
149
,275
.045
9.7
184.
5521
8.45
17.7
111
,668
.61,
136.
11.
0015
0.75
214.
16–
203,
337.
48.
00
Aug
11, 2
009
1,31
648
,852
.251
8.6
185.
7321
9.39
17.7
211
,669
.759
3.1
0.74
150.
7221
3.73
–16
5,80
8.1
8.00
Aug
12, 2
009
1,26
946
,459
.027
1.2
186.
6522
0.02
17.6
911
,667
.535
4.2
0.94
150.
7821
2.97
–24
6,21
4.9
6.83
Aug
13, 2
009
1,29
547
,592
.358
4.9
187.
7922
0.71
17.6
711
,667
.917
,012
.90.
7415
0.77
215.
16–
177,
890.
66.
50
Aug
14, 2
009
1,30
447
,712
.820
2.6
189.
0522
1.70
17.6
411
,667
.26,
313.
30.
5915
0.79
215.
49–
205,
429.
16.
00
Aug
17, 2
009
1,23
845
,589
.526
3.2
190.
4222
2.92
17.6
111
,666
.86,
311.
00.
5415
0.80
213.
53–
171,
764.
06.
33
Aug
18, 2
009
1,26
646
,095
.489
0.8
191.
1722
3.48
17.7
111
,665
.43,
364.
70.
5315
0.84
213.
17–
140,
343.
86.
58
Aug
19, 2
009
1,28
246
,706
.236
2.8
192.
4722
4.73
17.6
711
,663
.93,
966.
80.
5415
0.88
212.
63–
210,
880.
76.
47
Aug
20, 2
009
1,31
647
,356
.545
6.7
193.
6022
5.60
17.7
611
,665
.75,
557.
40.
3815
0.83
214.
72–
175,
764.
66.
47
Aug
21, 2
009
1,33
747
,501
.992
6.2
195.
2922
6.97
17.7
111
,665
.03,
637.
90.
5315
0.85
214.
75–
152,
751.
86.
47
Aug
24, 2
009
1,38
249
,903
.81,
116.
219
6.25
227.
9917
.72
11,6
67.9
2,19
8.3
0.49
150.
7721
6.00
–15
9,68
4.0
6.47
Aug
25, 2
009
1,38
249
,671
.060
1.1
197.
1022
8.58
17.6
611
,671
.11,
634.
00.
8415
0.68
215.
11–
191,
193.
06.
47
Aug
26, 2
009
1,38
349
,902
.658
9.0
199.
0023
0.36
17.6
511
,616
.44,
248.
81.
2015
0.75
215.
99–
184,
539.
16.
47
Aug
27, 2
009
1,36
048
,244
.616
4,11
4.9
200.
4023
1.47
17.6
211
,615
.71,
225.
41.
0915
0.77
214.
81–
145,
628.
56.
47
Aug
28, 2
009
1,39
449
,346
.943
4.8
202.
2723
2.59
17.6
711
,614
.612
,058
.80.
5515
0.80
216.
50–
137,
120.
76.
47
Sep
1, 2
009
1,37
248
,736
.151
1.3
203.
7123
4.49
17.6
911
,616
.435
2.1
0.72
150.
7521
6.47
–11
7,37
8.9
6.47
Sep
2, 2
009
1,30
946
,580
.595
4.5
204.
7323
5.35
17.7
611
,617
.82,
140.
60.
8215
0.71
214.
534.
7280
98,6
31.9
6.47
Sep
3, 2
009
1,33
147
,942
.355
0.6
200.
2523
0.87
18.0
611
,616
.04,
049.
21.
0615
0.76
215.
37–
140,
199.
76.
47
Sep
4, 2
009
1,36
648
,321
.084
7.9
201.
4223
2.05
18.2
111
,614
.31,
493.
00.
8315
0.81
215.
464.
7600
177,
472.
86.
47
Sep
7, 2
009
1,36
348
,878
.418
0.0
202.
1523
2.64
18.6
911
,613
.25,
368.
00.
7515
0.84
216.
23–
115,
763.
56.
33
Sep
8, 2
009
1,39
650
,059
.293
8.5
203.
6223
3.92
18.1
611
,613
.25,
885.
20.
6115
0.84
215.
80–
67,8
53.3
6.30
Sep
9, 2
009
1,43
050
,507
.521
,811
.621
3.58
242.
5617
.61
11,6
13.9
25,8
50.6
0.82
150.
8221
8.56
4.86
5013
6,95
6.9
6.30
Sep
10, 2
009
1,45
551
,364
.62,
636.
921
1.52
240.
8017
.84
11,6
12.5
3,26
5.5
0.78
150.
8621
9.86
–13
0,06
4.2
6.30
Sep
11, 2
009
1,47
251
,682
.12,
219.
521
1.92
241.
0117
.83
11,6
11.4
3,03
4.2
0.59
150.
8922
0.26
–11
6,47
3.0
6.30
Sep
14, 2
009
1,42
149
,867
.750
7.0
213.
1924
2.02
17.9
611
,560
.35,
967.
90.
7915
0.92
219.
75–
139,
022.
56.
29
Sep
15, 2
009
1,45
250
,649
.782
7.9
215.
6224
4.08
17.4
111
,559
.34,
959.
20.
7615
0.95
220.
64–
135,
690.
16.
35
Sep
16, 2
009
1,50
051
,519
.41,
101.
321
8.24
245.
8417
.00
11,6
12.7
11,4
68.0
0.78
150.
9422
1.85
–84
,029
.56.
35
Sep
17, 2
009
1,51
452
,408
.24,
854.
321
9.43
246.
6917
.08
11,6
13.8
244.
40.
6715
0.91
222.
66–
93,2
73.0
6.29
Sep
18, 2
009
1,54
651
,779
.838
0.5
221.
3824
8.16
17.0
611
,613
.18,
092.
50.
4815
0.93
222.
22–
173,
913.
86.
29
Sep
21, 2
009
1,55
351
,984
.21,
439.
822
2.52
249.
1217
.11
11,6
14.9
2,74
9.58
0.74
150.
8822
1.30
–17
1,00
8.6
6.29

Section V. Factbook
111
Tab
le 6
1 (
con
tin
uati
on
)
Dat
eSh
ares
Corp
orat
e bo
nds
Repo
Curr
ency
Dep
osit
indi
cato
rsK
ASE
Inde
xca
pita
-liz
atio
ntr
aded
valu
eK
ASE_
BCK
ASE_
BPK
ASE_
BYca
pita
-liz
atio
ntr
aded
valu
eTO
NIA
wei
ghte
d av
erag
e of
teng
e to
:tr
aded
valu
e1
USD
1 EU
R1
RUB
Kaz
Prim
e-3M
m U
SDth
. USD
% A
PRm
USD
th. U
SD%
APR
teng
ete
nge
teng
eth
. USD
% A
PR
Sep
22, 2
009
1,56
851
,938
.53,
568.
922
4.83
250.
7917
.11
12,3
10.0
115.
80.
5815
0.90
222.
87–
106,
666.
66.
29
Sep
23, 2
009
1,58
952
,892
.499
4.8
226.
2725
1.84
17.1
612
,309
.144
7.3
0.55
150.
9222
3.72
–78
,932
.46.
29
Sep
24, 2
009
1,57
352
,233
.520
,862
.622
7.48
252.
6617
.04
12,3
08.7
1,47
0.4
0.57
150.
9322
2.24
–88
,888
.76.
29
Sep
25, 2
009
1,50
751
,191
.613
,352
.822
8.93
253.
8216
.97
12,3
07.9
5,33
2.7
0.45
150.
9522
1.78
–11
4,12
4.2
6.29
Sep
28, 2
009
1,49
049
,359
.37,
182.
623
1.04
255.
5316
.98
12,3
07.9
323.
91.
6015
0.95
220.
86–
109,
068.
76.
29
Sep
29, 2
009
1,51
050
,440
.61,
425.
323
1.19
255.
6717
.13
12,2
74.8
6,44
6.9
0.60
150.
9522
0.79
–11
7,70
6.0
6.29
Sep
30, 2
009
1,51
351
,160
.21,
609.
023
2.32
255.
9116
.50
12,2
74.8
15,1
57.0
0.50
150.
9522
0.76
–19
8,38
2.5
6.30
Oct
1, 2
009
1,53
951
,805
.71,
722.
823
3.55
256.
8916
.45
12,2
74.8
9,12
8.6
0.70
150.
9522
0.01
–11
9,26
9.5
6.29
Oct
2, 2
009
1,48
149
,457
.91,
341.
423
3.51
257.
2816
.45
12,2
21.6
4,00
1.5
0.90
150.
9721
9.84
–14
3,82
5.1
6.29
Oct
5, 2
009
1,47
149
,332
.312
1.6
234.
9925
8.63
16.5
212
,220
.817
9.6
0.74
150.
9922
1.06
–12
6,21
9.6
6.29
Oct
6, 2
009
1,50
550
,788
.113
,141
.123
6.48
259.
6816
.47
12,2
21.6
5,77
3.3
0.83
150.
9722
2.53
–10
0,87
2.0
6.29
Oct
7, 2
009
1,54
751
,530
.835
,236
.324
2.00
264.
5416
.73
12,0
23.1
6,72
8.1
0.51
150.
9422
1.81
–73
,884
.36.
30
Oct
8, 2
009
1,55
252
,926
.995
9.1
242.
8626
5.06
16.6
312
,028
.721
,629
.30.
5115
0.84
222.
70–
189,
382.
86.
29
Oct
9, 2
009
1,52
852
,506
.81,
009.
624
4.24
266.
1216
.60
12,0
32.7
3,48
6.5
0.55
150.
7422
2.10
–21
7,40
6.7
6.29
Oct
12,
200
91,
583
53,0
83.0
793.
324
4.88
266.
9316
.66
11,9
51.0
923.
30.
4515
0.67
221.
71–
59,4
35.7
6.30
Oct
13,
200
91,
595
53,5
78.9
676.
924
5.71
267.
3716
.27
11,9
47.7
9,96
7.3
0.61
150.
7522
2.90
–13
9,41
9.3
6.29
Oct
14,
200
91,
620
54,7
50.3
566.
424
6.91
268.
6416
.22
11,9
46.0
3,31
4.4
0.79
150.
7522
4.43
–79
,163
.86.
29
Oct
15,
200
91,
648
55,9
07.7
872.
424
8.50
270.
0016
.24
17,1
29.8
1,78
8.2
0.68
150.
7522
5.58
–11
3,96
3.2
6.29
Oct
16,
200
91,
663
55,7
56.8
841.
225
0.02
271.
0916
.21
17,6
53.2
2,75
6.0
0.41
150.
6922
5.07
–10
8,97
3.6
6.29
Oct
19,
200
91,
659
54,6
39.3
4,28
4.4
251.
4527
2.14
16.1
217
,595
.558
3.7
0.40
150.
7322
4.59
–12
1,91
0.4
6.29
Oct
20,
200
91,
693
56,6
08.4
539.
825
3.44
273.
5216
.11
17,6
21.5
14,2
29.0
0.50
150.
7822
5.56
–13
4,73
3.5
6.29
Oct
21,
200
91,
679
55,5
25.0
21,0
29.5
254.
2227
4.16
16.1
217
,622
.823
,181
.90.
4615
0.76
225.
50–
81,7
10.3
6.29
Oct
22,
200
91,
674
55,1
22.7
680.
425
6.16
275.
7016
.10
17,6
31.5
4,59
3.8
0.55
150.
6422
5.89
–15
6,10
6.5
6.29
Oct
23,
200
91,
739
57,1
47.4
3,42
2.5
258.
7327
7.27
16.0
618
,144
.05,
104.
80.
4915
0.64
226.
34–
217,
832.
56.
29
Oct
26,
200
91,
723
56,3
69.6
677.
225
9.35
277.
6316
.25
18,1
39.4
11,4
63.6
0.55
150.
6822
6.66
–21
5,22
8.4
6.29
Oct
27,
200
91,
700
55,4
70.8
2,13
2.3
259.
9727
8.50
16.0
919
,914
.241
,871
.40.
5115
0.71
225.
06–
189,
708.
26.
29
Oct
28,
200
91,
623
54,4
21.7
646.
826
5.43
282.
2716
.06
19,9
14.2
15,0
86.4
0.53
150.
7122
3.47
–15
5,09
2.4
6.29
Oct
29,
200
91,
599
53,3
09.7
26,8
33.1
266.
3628
2.85
16.0
819
,909
.44,
790.
00.
5915
0.74
222.
18–
128,
663.
96.
29
Oct
30,
200
91,
681
56,0
96.3
54,1
13.2
268.
4228
4.40
16.1
919
,893
.722
,319
.70.
3615
0.74
224.
01–
250,
575.
26.
29
Nov
2, 2
009
1,62
953
,134
.894
9.7
270.
8628
6.33
16.0
820
,091
.934
9.7
0.36
150.
7522
2.94
5.17
7018
2,60
1.6
6.29

112
Tab
le 6
1 (
con
tin
uati
on
)
Dat
eSh
ares
Corp
orat
e bo
nds
Repo
Curr
ency
Dep
osit
indi
cato
rsK
ASE
Inde
xca
pita
-liz
atio
ntr
aded
valu
eK
ASE_
BCK
ASE_
BPK
ASE_
BYca
pita
-liz
atio
ntr
aded
valu
eTO
NIA
wei
ghte
d av
erag
e of
teng
e to
:tr
aded
valu
e1
USD
1 EU
R1
RUB
Kaz
Prim
e-3M
m U
SDth
. USD
% A
PRm
USD
th. U
SD%
APR
teng
ete
nge
teng
eth
. USD
% A
PR
Nov
3, 2
009
1,59
952
,821
.049
5.1
271.
5728
6.54
16.1
719
,645
.121
,672
.90.
3615
0.85
223.
295.
1600
204,
474.
06.
29
Nov
4, 2
009
1,63
753
,455
.667
2.0
273.
9928
8.53
16.1
519
,648
.64,
610.
20.
3015
0.81
222.
70–
117,
135.
36.
29
Nov
5, 2
009
1,62
453
,846
.467
6.2
276.
4029
0.45
16.1
619
,568
.527
,182
.60.
2615
0.82
224.
28–
155,
737.
26.
29
Nov
6, 2
009
1,63
453
,576
.21,
762.
227
7.82
291.
7216
.14
19,5
69.4
25,0
06.2
0.29
150.
8222
4.36
–14
1,58
7.6
6.29
Nov
9, 2
009
1,66
553
,911
.183
9.2
279.
1029
2.68
16.0
719
,606
.421
8.9
0.16
150.
9022
5.74
5.22
5729
3,45
4.5
6.29
Nov
10,
200
91,
684
54,9
58.8
8,94
1.5
281.
6329
4.55
16.1
319
,696
.510
5.2
0.16
150.
7822
5.91
5.24
7584
,388
.96.
29
Nov
11,
200
91,
716
55,2
93.4
1,48
4.4
282.
5729
5.21
16.1
319
,743
.810
1.0
0.33
150.
6922
5.87
–13
9,57
1.4
6.30
Nov
12,
200
91,
720
54,9
07.2
1,10
4.3
282.
7529
5.80
16.1
919
,900
.91,
346.
40.
4915
0.43
225.
545.
2556
503,
723.
76.
25
Nov
13,
200
91,
698
54,3
16.1
1,40
9.9
288.
8929
8.87
15.8
319
,902
.23,
248.
70.
2114
9.95
222.
905.
2008
483,
871.
85.
48
Nov
16,
200
91,
743
55,5
30.9
1,85
4.4
291.
4930
0.97
15.8
020
,022
.61,
469.
00.
2114
9.50
223.
835.
2013
851,
574.
85.
55
Nov
17,
200
91,
765
56,1
72.2
1,05
9.7
290.
5230
0.81
15.7
220
,052
.61,
248.
20.
2014
9.17
223.
065.
2012
516,
313.
75.
10
Nov
18,
200
91,
807
56,3
08.5
969.
528
8.94
300.
0515
.73
20,0
55.3
6,76
7.4
0.34
149.
1422
2.35
5.19
7069
5,92
1.8
5.10
Nov
19,
200
91,
808
57,0
51.4
1,13
1.2
287.
8230
0.30
15.7
619
,998
.77,
141.
80.
5914
8.89
–5.
1806
330,
307.
45.
00
Nov
20,
200
91,
772
55,2
23.5
1,51
0.5
286.
5630
0.18
15.6
919
,998
.013
,623
.20.
5214
8.90
221.
935.
1751
303,
681.
05.
00
Nov
23,
200
91,
813
55,5
40.9
2,52
3.5
281.
9029
8.52
16.3
520
,007
.29,
359.
40.
5414
8.80
222.
895.
1634
476,
519.
94.
80
Nov
24,
200
91,
805
55,5
44.8
1,71
4.4
281.
1629
8.30
16.3
120
,016
.61,
645.
40.
4614
8.75
222.
415.
1640
225,
896.
84.
80
Nov
25,
200
91,
822
55,5
96.1
2,60
3,14
7.8
280.
1229
8.16
16.2
820
,060
.92,
285.
30.
7514
8.94
–5.
1814
186,
102.
04.
70
Nov
26,
200
91,
804
55,2
56.8
1,74
8.8
280.
9029
9.56
16.0
920
,001
.86,
873.
00.
4014
8.72
224.
495.
1517
193,
606.
34.
70
Nov
30,
200
91,
838
55,4
52.8
984.
528
0.72
300.
0516
.14
20,0
06.4
7,85
4.2
0.20
148.
6722
3.78
5.10
5211
2,60
3.8
4.60
Dec
1, 2
009
1,85
558
,968
.91,
046.
628
0.00
299.
9916
.13
19,9
88.9
9,46
6.4
0.21
148.
6822
3.29
5.10
0011
9,18
4.3
4.60
Dec
2, 2
009
1,86
259
,385
.652
8.0
281.
3030
1.04
15.9
120
,576
.359
4.7
0.16
148.
6922
4.20
5.11
0193
,515
.54.
60
Dec
3, 2
009
1,87
059
,060
.590
1.9
277.
9029
9.47
16.8
320
,565
.46,
276.
90.
1214
8.81
224.
995.
0916
76,7
76.2
4.55
Dec
4, 2
009
1,85
959
,070
.93,
293.
927
7.97
299.
9116
.72
20,5
71.8
2,33
8.4
0.21
148.
7422
4.00
5.09
7015
9,65
6.5
4.50
Dec
7, 2
009
1,83
559
,061
.11,
362.
927
8.11
300.
9716
.60
20,5
53.5
290.
60.
1914
8.94
220.
485.
0223
284,
408.
64.
33
Dec
8, 2
009
1,80
858
,427
.452
7.3
283.
5830
3.02
16.6
720
,545
.24,
425.
40.
1914
9.03
220.
944.
9698
182,
258.
84.
04
Dec
9, 2
009
1,76
356
,842
.853
7.1
283.
0830
2.81
16.6
820
,541
.432
,120
.70.
2714
9.08
219.
644.
8620
127,
833.
93.
98
Dec
10,
200
91,
791
57,6
48.3
862.
928
4.01
303.
9316
.60
20,5
44.5
3,39
3.3
0.18
149.
0821
9.70
4.89
0010
2,13
5.5
3.90
Dec
11,
200
91,
801
58,0
00.2
2,05
6.7
283.
0930
4.04
16.2
720
,571
.75,
866.
00.
7414
9.27
219.
554.
9396
221,
684.
63.
83
Dec
14,
200
91,
749
56,7
60.3
458.
028
1.53
303.
9116
.24
20,6
13.8
4,13
6.3
0.30
148.
80–
4.95
8123
7,55
9.8
3.63
Dec
15,
200
91,
772
56,9
20.0
1,55
1.1
286.
6130
5.86
16.2
420
,613
.879
5.2
0.29
148.
8021
7.90
4.93
8313
2,54
2.6
3.49
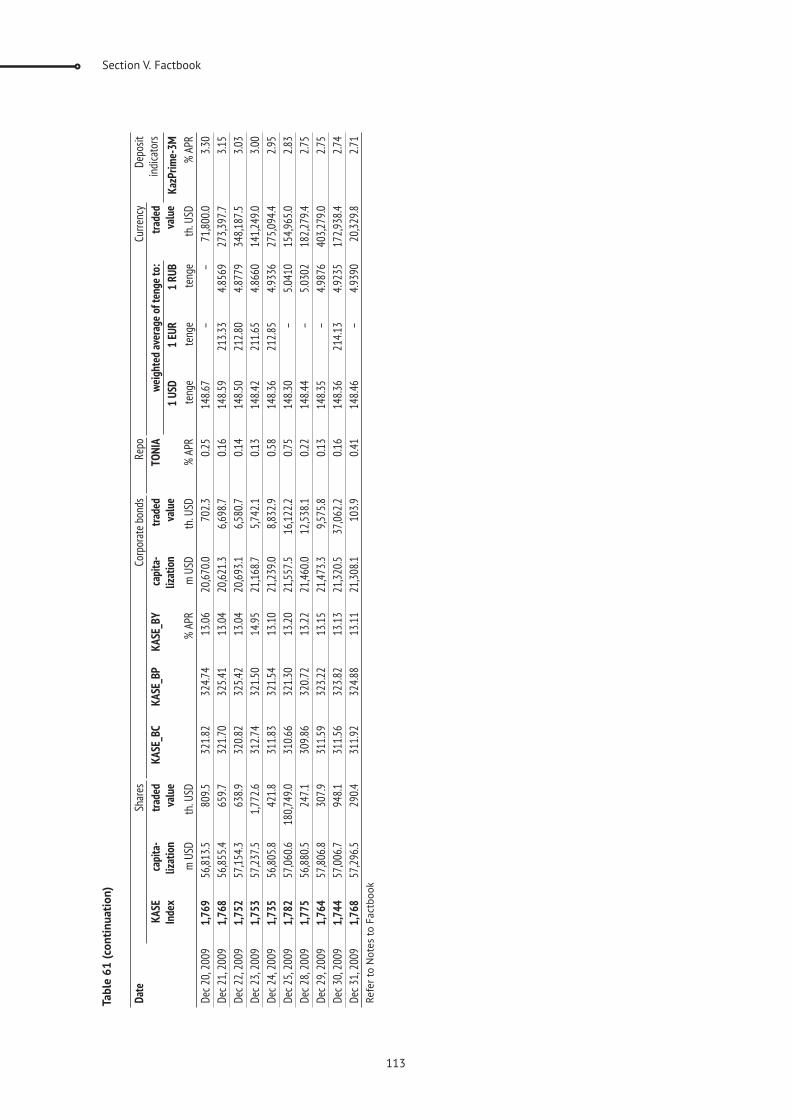
Section V. Factbook
113
Dat
eSh
ares
Corp
orat
e bo
nds
Repo
Curr
ency
Dep
osit
indi
cato
rsK
ASE
Inde
xca
pita
-liz
atio
ntr
aded
valu
eK
ASE_
BCK
ASE_
BPK
ASE_
BYca
pita
-liz
atio
ntr
aded
valu
eTO
NIA
wei
ghte
d av
erag
e of
teng
e to
:tr
aded
valu
e1
USD
1 EU
R1
RUB
Kaz
Prim
e-3M
m U
SDth
. USD
% A
PRm
USD
th. U
SD%
APR
teng
ete
nge
teng
eth
. USD
% A
PR
Dec
20,
200
91,
769
56,8
13.5
809.
532
1.82
324.
7413
.06
20,6
70.0
702.
30.
2514
8.67
––
71,8
00.0
3.30
Dec
21,
200
91,
768
56,8
55.4
659.
732
1.70
325.
4113
.04
20,6
21.3
6,69
8.7
0.16
148.
5921
3.33
4.85
6927
3,39
7.7
3.15
Dec
22,
200
91,
752
57,1
54.3
638.
932
0.82
325.
4213
.04
20,6
93.1
6,58
0.7
0.14
148.
5021
2.80
4.87
7934
8,18
7.5
3.03
Dec
23,
200
91,
753
57,2
37.5
1,77
2.6
312.
7432
1.50
14.9
521
,168
.75,
742.
10.
1314
8.42
211.
654.
8660
141,
249.
03.
00
Dec
24,
200
91,
735
56,8
05.8
421.
831
1.83
321.
5413
.10
21,2
39.0
8,83
2.9
0.58
148.
3621
2.85
4.93
3627
5,09
4.4
2.95
Dec
25,
200
91,
782
57,0
60.6
180,
749.
031
0.66
321.
3013
.20
21,5
57.5
16,1
22.2
0.75
148.
30–
5.04
1015
4,96
5.0
2.83
Dec
28,
200
91,
775
56,8
80.5
247.
130
9.86
320.
7213
.22
21,4
60.0
12,5
38.1
0.22
148.
44–
5.03
0218
2,27
9.4
2.75
Dec
29,
200
91,
764
57,8
06.8
307.
931
1.59
323.
2213
.15
21,4
73.3
9,57
5.8
0.13
148.
35–
4.98
7640
3,27
9.0
2.75
Dec
30,
200
91,
744
57,0
06.7
948.
131
1.56
323.
8213
.13
21,3
20.5
37,0
62.2
0.16
148.
3621
4.13
4.92
3517
2,93
8.4
2.74
Dec
31,
200
91,
768
57,2
96.5
290.
431
1.92
324.
8813
.11
21,3
08.1
103.
90.
4114
8.46
–4.
9390
20,3
29.8
2.71
Refe
r to
No
tes
to F
actb
oo
k
Tab
le 6
1 (
con
tin
uati
on
)
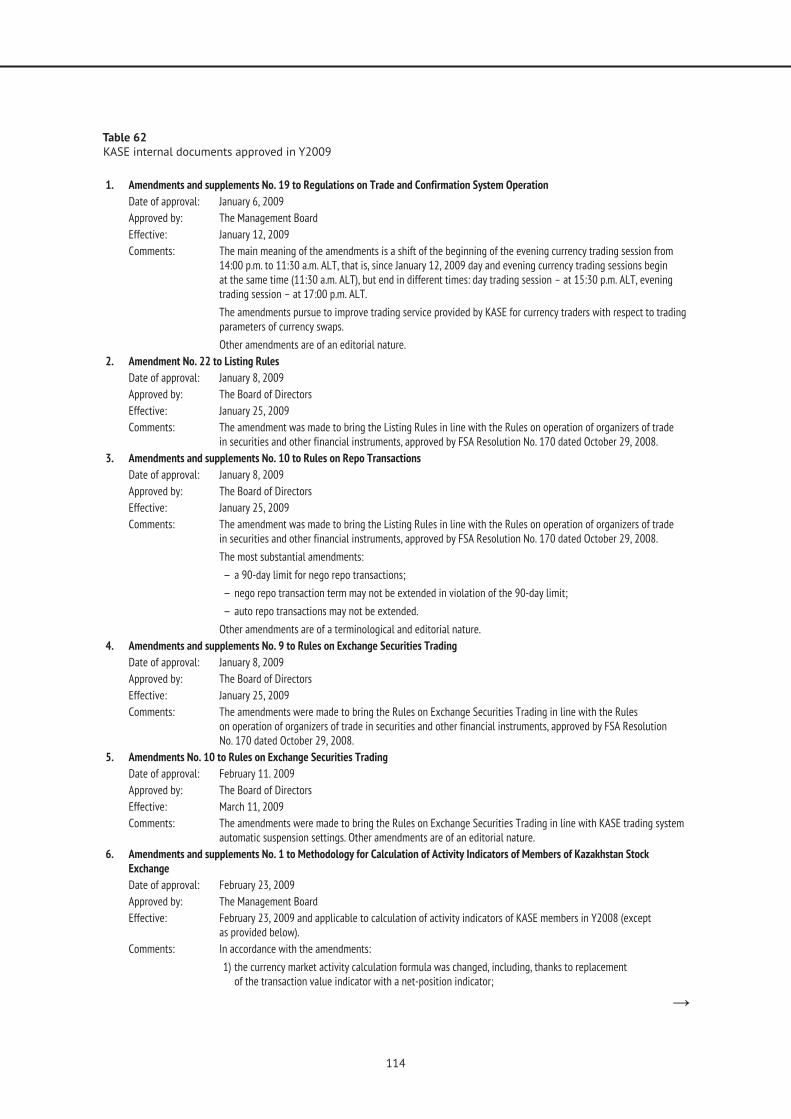
114
1. Amendments and supplements No. 19 to Regulations on Trade and Confirmation System Operation
Date of approval: January 6, 2009
Approved by: The Management Board
Effective: January 12, 2009
Comments: The main meaning of the amendments is a shift of the beginning of the evening currency trading session from 14:00 p.m. to 11:30 a.m. ALT, that is, since January 12, 2009 day and evening currency trading sessions begin at the same time (11:30 a.m. ALT), but end in different times: day trading session – at 15:30 p.m. ALT, evening trading session – at 17:00 p.m. ALT.
The amendments pursue to improve trading service provided by KASE for currency traders with respect to trading parameters of currency swaps.
Other amendments are of an editorial nature.
2. Amendment No. 22 to Listing Rules
Date of approval: January 8, 2009
Approved by: The Board of Directors
Effective: January 25, 2009
Comments: The amendment was made to bring the Listing Rules in line with the Rules on operation of organizers of trade
3. Amendments and supplements No. 10 to Rules on Repo Transactions
Date of approval: January 8, 2009
Approved by: The Board of Directors
Effective: January 25, 2009
Comments: The amendment was made to bring the Listing Rules in line with the Rules on operation of organizers of trade
The most substantial amendments:
a 90-day limit for nego repo transactions;
nego repo transaction term may not be extended in violation of the 90-day limit;
auto repo transactions may not be extended.
Other amendments are of a terminological and editorial nature.
4. Amendments and supplements No. 9 to Rules on Exchange Securities Trading
Date of approval: January 8, 2009
Approved by: The Board of Directors
Effective: January 25, 2009
Comments: The amendments were made to bring the Rules on Exchange Securities Trading in line with the Rules
5. Amendments No. 10 to Rules on Exchange Securities Trading
Date of approval: February 11. 2009
Approved by: The Board of Directors
Effective: March 11, 2009
Comments: The amendments were made to bring the Rules on Exchange Securities Trading in line with KASE trading system automatic suspension settings. Other amendments are of an editorial nature.
6. Amendments and supplements No. 1 to Methodology for Calculation of Activity Indicators of Members of Kazakhstan Stock Exchange
Date of approval: February 23, 2009
Approved by: The Management Board
Effective: February 23, 2009 and applicable to calculation of activity indicators of KASE members in Y2008 (except
Comments: In accordance with the amendments:
1) the currency market activity calculation formula was changed, including, thanks to replacement
Table 62
KASE internal documents approved in Y2009

Section V. Factbook
115
2) it was determined, at calculation of transaction value on the repo market, only value of executed closing deals related to repo transactions which had not been extended is taken into account;
3) it was determined, for purposes of minimization of impact of individual non-market transactions KASE may disregard, at calculation of activity indicator, transactions, which KASE deems:
at its core (including price level) not to be considered market transactions;
concluded for purposes of artificial (intended) overstatement of indicators of traded value, the number
concluded as a result of obvious technical errors conceded by trader;
4) a new procedural item was included, describing the order of fulfillment of KASE functions and authorities specified in the Methodology.
Other amendments are of an editorial nature.
7. Amendment No. 8 to Rules on Annual Rewarding of Best Performing Exchange Members
Date of approval: February 23, 2009
Approved by: The Management Board
Effective: February 23, 2009 and was applied to determine KASE members for purposes of rewarding for Y2008 performance.
Comments: A new order has been set for determination of KASE members for rewarding in nominations “Currency market leader”, “Government securities market leader”, “Share market leader”, “Corporate bond market leader” and “Repo market leader”.
The main meaning of the change is paying greater attention to an expert opinion at build up of the list
violated KASE internal documents and the trading system operation order, and KASE members, at whose fault transactions concluded on the organized finance market were not executed.
8. Amendments and supplements No. 2 to Rules on Annual Rewarding of Listing Companies
Date of approval: March 3, 2009
Approved by: The Management Board
Effective: March 3, 2009 and have been applied to determine listing companies to reward for Y2008 performance.
Comments: The amendments specified:
1) the following groups of listing companies will be rewarded – finance companies, listing companies
2) listing companies will be grouped in accordance with Global Industry Classification Standard (GICS);
3) two companies will be rewarded in each group.
9. Amendments and supplements No. 23 to Listing Rules
Date of approval: March 5, 2009
Approved by: The Board of Directors
Effective: March 6, 2009
Comments: The amendments specify in item 1 of article 21-2 “Listing fee calculation” of the Listing Rules a basis or accrual of admission listing fees was specified, and the article was supplemented with a new item saying:
at simultaneous admission of several stocks issued with the same issuer, the stocks will be considered
at simultaneous admission of bonds of several issues issued under the same bond program, admission listing fees will be accrued based on the total nominal value of bonds of all issues;
at simultaneous admission of bonds of several issues issued under the same bond program, the maximum admission listing fee will be increased from 4,000 to 10,000 MCI.
Other amendments are of an editorial nature.
10. Instruction on Preliminary Check of Securities Transactions Regarding Manipulative Nature
Date of approval: March 11, 2009
Approved by: The Management Board
Effective: March 12, 2009
Comments: The Instruction has been developed in accordance with:
the law of the Republic of Kazakhstan “On Securities Market” of July 2, 2003;
Table 62 (continuation)

116
Table 62 (continuation)
the Rules on operation of an Exchange unit supervising transactions in the trading system, approved with FSA Resolution No. 195 dated November 28, 2008;
the Rules on recognition of transactions, concluded on the organized securities market, for manipulative purposes, and establishment and operation of the Committee of the Exchange Board of Directors
with FSA Resolution No. 196 dated November 28, 2008;
Regulations on Surveillance division,
and defines the order of preliminary check of securities transactions regarding manipulative nature.
11. Supplements and amendments No. 24 to Listing Rules
Date of approval: March 16, 2009
Approved by: The Board of Directors
Effective: April 22, 2009
Comments:
2008 No. 77 and “On requirements to Exchange organizational structure and composition of Exchange listing commission, and on approval of the Rules on operation of an Exchange unit supervising transactions
Generally, the amendments regard the transfer of authorities of the KASE Board of Directors to the Listing commission regarding listing, delisting and change or category (subcategory), and setting listing requirements
Other amendments are of an editorial nature.
12. Supplements No. 10 to Specification of Auto Repo Market
Date of approval: March 19, 2009
Approved by: The Management Board
Effective: April 1, 2009
Comments: The amendments have been developed in pursuance of the decision of the Board of Directors dated March 5, 2009 on introduction of a system of bans for securities to be used as collateral in repo transactions.
13. Regulations on Surveillance Division
Date of approval: March 26, 2009
Approved by: The Board of Directors
Effective: May 21, 2009
Comments: the Regulations have been developed in accordance with:
the law of the Republic of Kazakhstan “On Securities Market” of July 2, 2003;
the law of the Republic of Kazakhstan “On Pension Benefits in Kazakhstan” of June 20, 1997;
the law of the Republic of Kazakhstan “On Investment Funds” of July 7, 2004;
the Rules on operation of an Exchange unit supervising transactions in the trading system, approved with FSA Resolution No. 195 dated November 28, 2008
the Rules on recognition of transactions, concluded on the organized securities market, as concluded for manipulative purposes, and establishment and operation of the Committee of the Exchange Board
composition, approved with FSA Resolution No. 196 dated November 28, 2008,
and defines the main tasks, functions, authorities, responsibility and operation of the KASE Surveillance Division.
14. Regulations on Expert Committee of the Board of Directors
Date of approval: March 26, 2009
Approved by: The Board of Directors
Effective: May 21, 2009
Comments:Market” of July 2, 2003 and the Rules on recognition of transactions, concluded on the organized securities market, as concluded for manipulative purposes, and establishment and operation of the Committee
and its composition, approved with FSA Resolution No. 196 dated November 28, 2008, and defines tasks, functions, structure, authorities, responsibility and operation of the Expert Committee of the Board of Directors.

Section V. Factbook
117
The Expert Committee of the Board of Directors regards securities transactions concluded for manipulative purposes; the committee has been established in accordance with article 56 of the law and item 8 of the Rules.
15. Supplements No. 11 to Rules on Repo Transactions
Date of approval: March 26, 2009
Approved by: The Board of Directors
Effective: April 1, 2009
Comments: The amendments have been developed in pursuance of the decision of the Board of Directors dated March 5, 2009 on introduction of a system of bans of securities to be used as collateral in repo transactions.
16. Amendment and supplement No. 2 to Methodology for Calculation of Stock Market Indicators
Date of approval: March 31, 2009
Approved by: The Management Board
Effective: April 1, 2009
Comments: The amendments specify when KASE should extraordinarily calculate restriction coefficients for KASE Index stocks.
17. Amendments and supplements No. 12 to Rules on Repo Transactions
Date of approval: April 23, 2009
Approved by: The Board of Directors
Effective: May 21, 2009
Comments: The amendments specify:
1) KASE stops to use term “redemption/buy back” regarding repo transactions, including, due to a reason
context;
2) the list of cases, when securities of the same issuer shall be banned to be used as collateral in nego repo, was supplemented with a default on payment of the par value on listed debt securities after maturity.
18. Supplement No. 11 to Specification of Auto Repo Market
Date of approval: April 28, 2009
Approved by: The Management Board
Effective: May 21, 2009
Comments: The amendment has been developed as the Board of Directors had approved on April 23, 2009 amendments and supplements No. 12 to Rules on Repo Transactions.
In accordance with the amendment securities listed in sub-item 2) of item 2 of the Specification, issued with the same issuer, are banned by the Management Board to be used as collateral in repo transactions if the issuer failed to timely pay face value of matured debt securities admitted to KASE.
19. Amendment No. 20 to Regulations on Trade and Confirmation System Operation
Date of approval: May 22, 2009
Approved by: The Management Board
Effective: May 25, 2009
Comments: Continuous counter-directed trading is transferred to stand-by mode to be held by Frankfurt trade, in case
of article 5 of the Regulations. Earlier this norm was only applicable for shares listing on KASE.
20. Amendment and supplement No. 2 to Specification of Status of Ruble Market Maker(Appendix 3–2 to Rules on Market Maker Operation)
Date of approval: May 25, 2009
Approved by: The Board of Directors
Effective: July 7, 2009
Comments: In accordance with the amendments:
1) at operation of ruble market maker, firm quotes may be set in the KASE trading system solely by a market maker;
2) if there is no ruble market maker operating, KASE members may set firm quotes and conclude transactions.
21. Amendment and supplements No. 25 to Listing Rules
Date of approval: May 28, 2009
Approved by: The Board of Directors
Table 62 (continuation)

118
Effective: May 29, 2009
Comments: The amendments have been made after exception of terms “resident” and “non-resident” having several meanings in the Kazakhstan legislation, and exception of references to non-existent items. Other amendments are of an editorial nature.
22. Supplements and amendments No. 13 to Rules on Repo Transactions
Date of approval: May 28, 2009
Approved by: The Board of Directors
Effective: May 4, 2010
Comments: In accordance with the amendments the Rules on Repo Transactions were supplemented with Appendix No. 1 “Agreement on general terms of nego repo transactions”, developed for purposes of mitigation of risk of default on closing deals of nego repo transactions.
The agreement is particularly specifying:
the order of calculation of nego repo transaction opening price, closing deal price and repo transaction rate;
the new order of settlement on nego repo transactions, including early execution of repo closing deal;
interaction of repo agents at issuer of collateralized securities carrying out corporate actions;
the order of revaluation of liabilities on repo transactions;
the new order of settlement of defaults of repo agents on closing deals.
In connection with the supplement of the agreement to the Rules, a number of amendments were made.
For purposes of compliance with item 38 of the Rules on Exchange Securities Trading with the Rules
not valued for more than two weeks in row in accordance with the Methodology for Valuation of Securities shall be banned by the Management Board to be used as collateral in nego repo transactions.
23. Amendments No. 21 to Regulations on Trade and Confirmation System Operation
Date of approval: May 29, 2009
Approved by: The Management Board
Effective: June 1, 2009
Comments: In accordance with the amendments to Appendix 1 to the Regulations “The list of shares and their tickers, for trading which Frankfurt trade” will not be applicable in case of matching or crossing of asks and bids will include shares, on which there is an operating specialist, or shares included in the KASE Index.
24. Amendment No. 22 to Regulations on Trade and Confirmation System Operation
Date of approval: June 5, 2009
Approved by: The Management Board
Effective: June 5, 2009
Comments: In accordance with the change preferred shares of Astana-Finance JSC (NIN – KZ1P37670117, ticker – ASFIp) were excluded from Appendix 1 to Regulations “The list of shares and their tickers, for trading which Frankfurt trade will not be applicable in case of matching and crossing of asks and bids”. In accordance with item 3
specialist for the securities. On June 4, 2009 Astana-Finance was stripped off the specialist status on the shares through disqualification thereof from trading on KASE on the indicated date.
25. Amendments No. 23 to Regulations on Trade and Confirmation System Operation
Date of approval: June 16, 2009
Approved by: The Management Board
Effective: June 16, 2009
Comments: In accordance with the changes the KASE trading system will automatically deny orders submitted by currency traders, if orders exceed the following deviation limits:
USD_TOD, USD_TOM and USD_SPT – 0.5 % of the last transaction (earlier the price deviation limit was only applicable to currency trading in the morning session);
EUR_TOD and EUR_TOM – 3 % of the last transactions;
Russian ruble – 3 % of the last transaction.
The indicated limits are surmountable. This means that any interested trader may contact an Exchange administrator with a request to remove or increase the limit.
Table 62 (continuation)

Section V. Factbook
119
Table 62 (continuation)
26. Supplement No. 11 to Regulations on Membership
Date of approval: June 18, 2009
Approved by: The Board of Directors
Effective: July 21, 2009
Comments: The supplement specifies should a trader concede an error, entailing suspension of trade in financial instruments, the trader may be sidelined from trading subject to the KASE Management Board decision.
27. Amendment and supplement No. 11 to Rules on Exchange Securities Trading
Date of approval: June 18, 2009
Approved by: The Board of Directors
Effective: July 21, 2009
Comments: The amendments regard resumption of the earlier suspended trade in securities; and made in connection with coming into effect on June 9, 2009 of FSA Resolution “On amendments and supplements to resolution of the Agency of the Republic of Kazakhstan on regulation and supervision of financial market and financial organizations of October 29, 2008 No. 170 ‘On approval of Rules on Exchange operation in part of part trading
28. Amendments and supplements No. 3 to Methodology for Calculation of Stock Market Indicators
Date of approval: June 30, 2009
Approved by: The Management Board
Effective: July 15, 2009
Comments: In accordance with the amendments the Methodology was supplemented with a new indicator – securities closing price, which will be calculated on a daily basis for all securities listing on KASE after close of business for such securities.
Security closing price is calculated as the price of the last transaction in a security concluded on the current trading day provided the transaction is executed or pending execution. If this security was not trading during
price for this security on this trading day was calculated on the basis the price of the transaction, which consequently was not executed in the order determined in KASE internal documents. The Methodology provides for the term and the order of such recalculation.
Other amendments are of an editorial nature.
29. Change No. 24 to Regulations on Trade and Confirmation System Operation
Date of approval: July 10, 2009
Approved by: The Management Board
Effective: July 10, 2009
Comments: In accordance with the change item 9 of article 10 currently reads:
„9. The peculiarity of trading in the Russian ruble is that at operating Russian ruble market maker transactions therein may be concluded at prices that are indicated in the orders submitted by a market maker;
transactions during the trade.“
The change was made to bring in compliance the Regulations to KASE internal document “Specification of Ruble Market Maker (Appendix 3–2 to Rules on Market Maker Operation)”.
30. Rules on Operation of Trading Floor of Kazakhstan Stock Exchange as a Special Trading Floor of the Regional Financial Center
Date of approval: July 30, 2009
Approved by: The Board of Directors
Effective: November 9, 2009
Comments: the Rules have been developed in accordance with:
the law of the Republic of Kazakhstan “On Regional Financial Center of Almaty” dated June 5, 2006;
order No. 74 of acting Chairman of ARA RFCA “On determination of Kazakhstan Stock Exchange as a special trading floor of the Regional Financial Center of Almaty” dated December 15, 2006;
and define certain terms of operation of the trading floor of KASE as a special trading floor of the Regional Financial Center of Almaty, not settled with KASE internal documents.
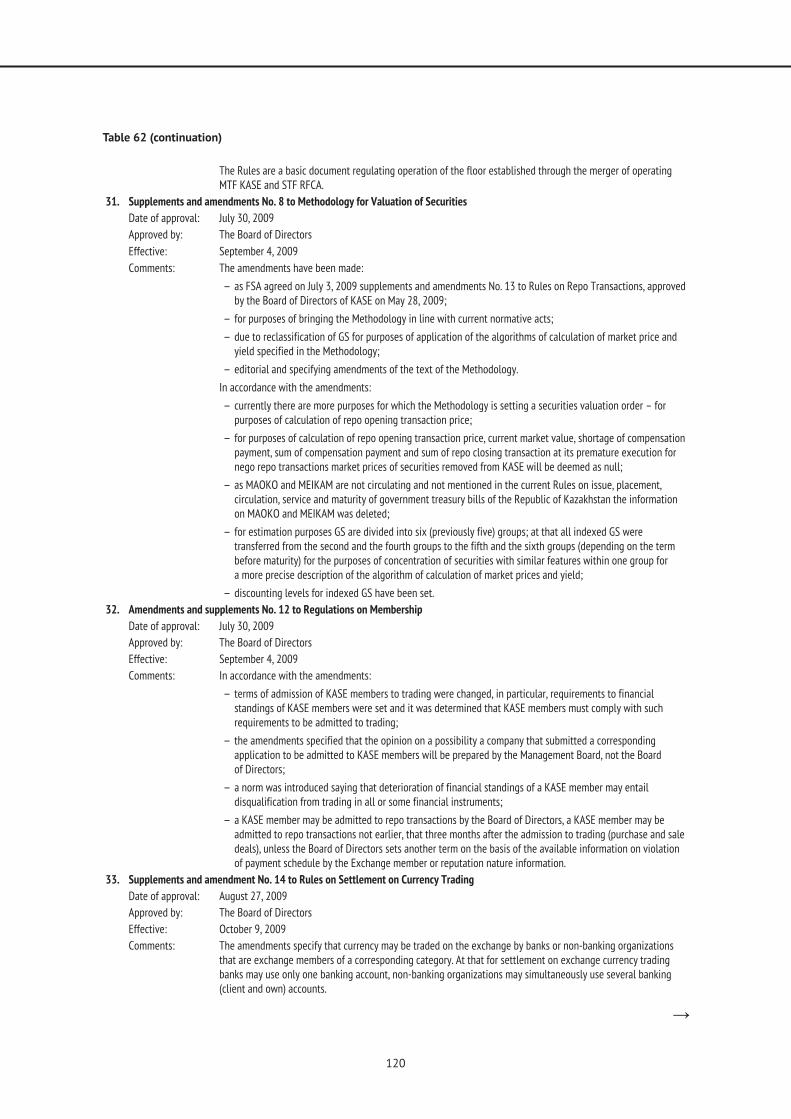
120
Table 62 (continuation)
The Rules are a basic document regulating operation of the floor established through the merger of operating MTF KASE and STF RFCA.
31. Supplements and amendments No. 8 to Methodology for Valuation of Securities
Date of approval: July 30, 2009
Approved by: The Board of Directors
Effective: September 4, 2009
Comments: The amendments have been made:
as FSA agreed on July 3, 2009 supplements and amendments No. 13 to Rules on Repo Transactions, approved by the Board of Directors of KASE on May 28, 2009;
for purposes of bringing the Methodology in line with current normative acts;
due to reclassification of GS for purposes of application of the algorithms of calculation of market price and yield specified in the Methodology;
editorial and specifying amendments of the text of the Methodology.
In accordance with the amendments:
currently there are more purposes for which the Methodology is setting a securities valuation order – for purposes of calculation of repo opening transaction price;
for purposes of calculation of repo opening transaction price, current market value, shortage of compensation payment, sum of compensation payment and sum of repo closing transaction at its premature execution for nego repo transactions market prices of securities removed from KASE will be deemed as null;
as MAOKO and MEIKAM are not circulating and not mentioned in the current Rules on issue, placement, circulation, service and maturity of government treasury bills of the Republic of Kazakhstan the information on MAOKO and MEIKAM was deleted;
for estimation purposes GS are divided into six (previously five) groups; at that all indexed GS were transferred from the second and the fourth groups to the fifth and the sixth groups (depending on the term before maturity) for the purposes of concentration of securities with similar features within one group for
discounting levels for indexed GS have been set.
32. Amendments and supplements No. 12 to Regulations on Membership
Date of approval: July 30, 2009
Approved by: The Board of Directors
Effective: September 4, 2009
Comments: In accordance with the amendments:
terms of admission of KASE members to trading were changed, in particular, requirements to financial standings of KASE members were set and it was determined that KASE members must comply with such requirements to be admitted to trading;
the amendments specified that the opinion on a possibility a company that submitted a corresponding application to be admitted to KASE members will be prepared by the Management Board, not the Board
a norm was introduced saying that deterioration of financial standings of a KASE member may entail disqualification from trading in all or some financial instruments;
a KASE member may be admitted to repo transactions by the Board of Directors, a KASE member may be admitted to repo transactions not earlier, that three months after the admission to trading (purchase and sale deals), unless the Board of Directors sets another term on the basis of the available information on violation of payment schedule by the Exchange member or reputation nature information.
33. Supplements and amendment No. 14 to Rules on Settlement on Currency Trading
Date of approval: August 27, 2009
Approved by: The Board of Directors
Effective: October 9, 2009
Comments: The amendments specify that currency may be traded on the exchange by banks or non-banking organizations that are exchange members of a corresponding category. At that for settlement on exchange currency trading banks may use only one banking account, non-banking organizations may simultaneously use several banking (client and own) accounts.

Section V. Factbook
121
Besides, the amendments specify that a trader – a non-banking organization when using several banking accounts for crediting of tenge from KASE in return for its net-obligations must submit to KASE a corresponding
34. Methodology for Calculation of Stock Market Indicators
Date of approval: September 29, 2009
Approved by: The Management Board
Effective: October 7, 2009
Comments: The Methodology is defining the list of currency market indicators, calculated by KASE, and the order
35. Supplement and amendments No. 25 to Regulations on Trade and Confirmation System Operation
Date of approval: September 29, 2009
Approved by: The Management Board
Effective: October 5, 2009
Comments: In accordance with the amendments article 5 of the Regulations was supplemented with item 5 which reads:
„5. At continuous counter-directed trading for individual groups of financial instruments the Regulations or trading system settings, several minutes before the trading day, may set an option of switch of trading
In case of a closing auction on individual groups of financial instruments:
1) such auction is executed on a daily basis (every business day) 15 minutes before the end of a trading day;
2) a closing auction may last 13 minutes at the minimum and 15 minutes at the maximum;
3) a closing auction ends at a random period of time as defined by the trading system from the 14th through 15th minute;
4) a trading day ends simultaneously with a closing auction;
5) the orders submitted before the beginning of a closing auction and during thereof may be annulled and
Besides, the text of the Regulations may be unified in part of description of examples of shares trading for both listing on KASE and those admitted to circulation in sector “Unlisted securities”.
36. Amendments No. 14 to Rules on Repo Transactions
Date of approval: October 1, 2009
Approved by: The Board of Directors
Effective: May 4, 2010
Comments: The amendments made in Appendix 1 “Agreement on general terms of nego repo transactions” to the Rules and specify distribution of duties, which arise or may arise between nego repo agents.
The amendments:
introduced term “Bilateral agreement”, which nego repo agents may enter into without using the KASE trading system, which will allow for settling relations of transaction parties at issuer, whose securities are loaned in a repo transaction, carrying out actions, which may give rise to additional rights or liabilities at repo agents;
changed the order of transfer of income to a repo seller, the order of calculation of income amount subject
trading system was introduced for a repo seller to deny the income at repo opening transaction; repo agents now may agree on the order of return and calculation of the income in the Bilateral agreement;
it has been established that if at the moment of compilation of the list of persons, entitled to attend
and the right of vote on repo loaned securities shall rest with the repo buyer, unless specified otherwise
securities to a repo seller the Bilateral agreement must specify that the repo buyer must provide a repo seller with a power of attorney to attend the GM and be entitled to vote on repo loaned securities;
it has been established that if during the repo transaction term the issuer of collateral decides on carrying out of other corporate actions, which give rise or may give rise to additional rights or obligations at agents of this repo transaction, the order of settlement of this situation will be determined by repo agents in the Bilateral agreement; if such settlement is impossible any repo agent may demand the repo closing transaction be executed early.
Table 62 (continuation)
122
37. Amendments No. 4 to Regulations on Trading Methods
Date of approval: October 1, 2009
Approved by: The Board of Directors
Effective: January 1, 2010
Comments: The amendments have been developed in accordance with the decision of the Board of Directors of August 27, 2009 on the method of use of Frankfurt trade, according to which:
1) this method will be used not at any attempt of transaction, but at substantial deviation of share price
2) it was decided to provide traders with a possibility during the standby mode remove orders submitted before the beginning thereof.
38. Amendments No. 26 to Regulations on Trade and Confirmation System Operation
Date of approval: October 5, 2009
Approved by: The Management Board
Effective: October 5, 2009
Comments: the changes specify the order of closing auctions.
39. Amendments and supplements No. 10 to Instruction on Coding of Members of Kazakhstan Stock Exchange, Financial Instruments and Issuers
Date of approval: October 16, 2009
Approved by: The Management Board
Effective: October 16, 2009
Comments: The amendments define the order of coding of MAOKAM.
The order of issue, placement, circulation, service and redemption of MAOKAM has been set with Resolution of the Government of the Republic of Kazakhstan “On amendments and supplements to resolution
service and redemption of government treasury bills of the Republic of Kazakhstan of April 3, 2009 No. 466’” dated September 1, 2009 No. 295.
Other amendments are of an editorial nature.
40. Amendments No. 9 to Methodology for Valuation of Securities
Date of approval: October 29, 2009
Approved by: The Board of Directors
Effective: December 9, 2009
Comments: The necessity for amendments was caused as the-then effective version of the Methodology did not allow for expressively interpreting cases when there is no market maker on a corporate bond, however, at that, Exchange members regularly submit orders for purchase and sale of the bond and transactions are carried out, which allow for valuating the bonds to market in accordance with the Methodology.
The amendments specified that for determination of corporate bond yield in case there is no market maker, orders of at least 2,000 MCI and transactions concluded on the basis thereof with aggregate value of at least 2,000 MCI will be selected for purposes of market valuation. In case of operating market maker, as before,
Other amendments are of an editorial nature.
41. Listing Rules
Date of approval: November 5, 2009
Approved by: The Board of Directors
Effective: November 9, 2009
Comments: The new edition of the Listing rules was developed on the basis of the current edition for the following purposes:
normative support of the upcoming merger of official lists of MTF KASE and STF RFCA; the new edition of the Listing Rules provides for unified procedures regarding listing of securities, change of categories (subcategories), delisting of securities, and unified terms of listing and sanctions for failure of admission initiators to comply with information disclosure obligations, set with the Listing Rules, without distinction between MTF KASE and STF RFCA;
bringing the Listing Rules in compliance with the current legislation;
Table 62 (continuation)
Section V. Factbook
123
generalization of expertise accumulated during the time of application of the current edition of the Listing rules, and decision of the most frequent issues related to listing procedures;
creation of the new version of the Listing rules, as the effective edition was frequently amended, which resulted in the necessity to change the document.
The new edition of the Listing Rules is universal, as it contains no description of the official list and listing requirements set with normative acts of FSA and ARA RFCA, but contain links to such normative acts.
Besides, the new edition of the Listing rules accounts for situations, not settled with the previous edition.
applications for consideration from admission initiators, transfer of securities from one category (subcategory)
terms of the opening of trade in securities.
42. Amendment No. 2 to Methodology of Calculation of Activity Indicators of Members of Kazakhstan Stock Exchange
Date of approval: November 9, 2009
Approved by: The Management Board
Effective: November 9, 2009
Comments: A norm on the basis of which at calculation of activity indicators transactions concluded on STF RFCA were not taken into account has been deleted from the Methodology.
43. Amendment and supplement No. 27 to Regulations on Trade and Confirmation System Operation
Date of approval: November 18, 2009
Approved by: The Management Board
Effective: November 18, 2009
Comments: The amendments specified the following lot at trading MAOKAM – the sum in the tenge, equivalent of USD10
44. Amendments No. 13 to Regulations on Membership
Date of approval: November 23, 2009
Approved by: The Board of Directors
Effective: January 13, 2010
Comments: The amendments have been developed in accordance with the Strategy of Development of Kazakhstan Stock Exchange for Y2007–Y2010 and in pursuance of the Exchange Master Plan for Y2009 and in connection with changes in the Exchange membership system.
In accordance with the changes Exchange members are divided into the following categories depending on types of financial instruments they are eligible to trade:
“stock market member” – with a right to trade securities circulating on the Exchange;
“currency market member” – with a right to trade currency;
“futures market member” – with a right to trade derivatives.
45. Amendments No. 14 to Regulations on Membership Fees and Exchange Dues
Date of approval: November 23, 2009
Approved by: The Board of Directors
Effective: January 13, 2010
Comments: The amendments have been developed in accordance with the Strategy of Development of Kazakhstan Stock Exchange for Y2007–Y2010 and in pursuance of the Exchange Master Plan for Y2009 and in connection with changes in the Exchange membership system.
46. Changes No. 1 to Rules on Placement of Government Treasury Bills of the Republic of Kazakhstan
Date of approval: November 23, 2009
Approved by: The Board of Directors
Effective: January 13, 2010
Comments: The amendments have been developed in accordance with the Strategy of Development of Kazakhstan Stock Exchange for Y2007–Y2010 and in pursuance to the Exchange Master Plan for Y2009 and in connection with changes in the Exchange membership system.
47. Amendment No. 4 to Rules on Admission of Securities to Sector “Unlisted securities”
Date of approval: November 23, 2009
Approved by: The Board of Directors
Effective: January 13, 2010
Table 62 (continuation)

124
Comments: The amendments have been developed in accordance with the Strategy of Development of Kazakhstan Stock Exchange for Y2007–Y2010 and in pursuance to the Exchange Master Plan for Y2009 and in connection with changes in the Exchange membership system.
48. Amendments No. 7 to Rules on Admission of Securities of International Financial Organizations
Date of approval: November 23, 2009
Approved by: The Board of Directors
Effective: January 13, 2010
Comments: The amendments have been developed in accordance with the Strategy of Development of Kazakhstan Stock Exchange for Y2007–Y2010 and in pursuance to the Exchange Master Plan for Y2009 and in connection with changes in the Exchange membership system.
49. Amendments and supplement No. 13 to Specification of Market Maker Status for Stock Market Members (Appendix 1 to Rules
Date of approval: November 23, 2009
Approved by: The Board of Directors
Effective: January 13, 2010
Comments: The amendments have been developed in accordance with the Strategy of Development of Kazakhstan Stock Exchange for Y2007–Y2010 and in pursuance to the Exchange Master Plan for Y2009 and in connection with changes in the Exchange membership system.
50. Supplement and amendments No. 3 to Regulations on Liability for Violation of Currency Trading Settlement
Date of approval: November 23, 2009
Approved by: The Board of Directors
Effective: January 13, 2010
Comments: The amendments have been developed in accordance with the Strategy of Development of Kazakhstan Stock Exchange for Y2007–Y2010 and in pursuance to the Exchange Master Plan for Y2009 and in connection with changes in the Exchange membership system.
51. Amendment No. 5 to Rules on Currency Trading
Date of approval: November 23, 2009
Approved by: The Board of Directors
Effective: January 13, 2010
Comments: The amendments have been developed in accordance with the Strategy of Development of Kazakhstan Stock Exchange for Y2007–Y2010 and in pursuance to the Exchange Master Plan for Y2009 and in connection with changes in the Exchange membership system.
52. Amendments No. 15 to Rules on Settlement of Currency Trading
Date of approval: November 23, 2009
Approved by: The Board of Directors
Effective: January 13, 2010
Comments: The amendments have been developed in accordance with the Strategy of Development of Kazakhstan Stock Exchange for Y2007–Y2010 and in pursuance to the Exchange Master Plan for Y2009 and in connection with changes in the Exchange membership system.
53. Amendments No. 9 to Rules on Exchange Trading and Settlement on Futures Contracts
Date of approval: November 23, 2009
Approved by: The Board of Directors
Effective: January 13, 2010
Comments: The amendments have been developed in accordance with the Strategy of Development of Kazakhstan Stock Exchange for Y2007–Y2010 and in pursuance to the Exchange Master Plan for Y2009 and in connection with changes in the Exchange membership system.
54. Amendments No. 4 to Rules on Exchange Note Trading
Date of approval: November 23, 2009
Approved by: The Board of Directors
Effective: January 13, 2010
Comments: The amendments have been developed in accordance with the Strategy of Development of Kazakhstan Stock Exchange for Y2007–Y2010 and in pursuance to the Exchange Master Plan for Y2009 and in connection with changes in the Exchange membership system.
Table 62 (continuation)

Section V. Factbook
125
55. Regulations on Commercial Terms of Real-Time Market Data Dissemination
Date of approval: November 26, 2009
Approved by: The Board of Directors
Effective: January 1, 2010
Comments: The Regulations have been developed for purposes of setting of unified fixed tariff rates for all distributors (vendors) of real-time market data and define the order, general terms and cost of provision of such data
56. Amendments and supplements No. 11 to Instruction on Coding of Members of Kazakhstan Stock Exchange, Financial Instruments and Issuers
Date of approval: December 1, 2009
Approved by: The Management Board
Effective: December 14, 2009
Comments: A necessity for the amendments was caused with:
1) a launch of a new instrument on the currency market – the euro settled in the dollar;
2) a launch of euro currency swaps;
3) introduction of KASE internal document “Rules on Operation of Trading Floor of Kazakhstan Stock Exchange as Special Trading Floor of the Regional Financial Center of Almaty”.
The amendments specify the following.
1. Abbreviated designations (tickers) of currencies trading on KASE that formerly consisted of the basis
2. Currency swap transaction ticker composition, which was supplemented with the basis of the settlement currency code, in which the currency swap is settled, was changed. The main changes were made in part
term; three consequent digits denote the number of working days between the day of conclusion of deals constituting the currency swaps transactions, and the day of execution of a deal with a later settlement term (for example, USDKZT_0_001 instead of USD_TOD_TOM, USDKZT_1_002 instead of USD_TOM_SPT).
3. Article 15-1 “Features of Coding of Financial Instruments on the Special Trading Floor of the Regional Financial Center of Almaty”.
Other amendments are of an editorial nature.
57. Amendment and supplement No. 28 to Regulation on Trade and Confirmation System Operation
Date of approval: December 1, 2009
Approved by: The Management Board
Effective: December 14, 2009
Comments: The amendments specify the following.
1) The list of cases for stand-by mode at share trading was amended and enlarged. In particular, share trading may be switched to stand-by and traded at Frankfurt method, at matching or crossing of ask and bids,
and 5 % on illiquid shares, or if no deals in such shares were made during 15 calendar days and more.
“Methodology for Calculation of Securities Liquidity Indicators”.
2)
3) A trade schedule on the following new financial instruments was set:
the euro settled in the tenge on the second business day after the transaction (EURKZT_SPT);
the euro settled in the dollar on the day of transaction (EURUSD_TOD);
the euro settled in the dollar on the next business day after the transaction (EURUSD_TOM);
the euro settled in the dollar on the second business day after the transaction (EURUSD_SPT).
Besides, specifying amendments were made to the Regulations on Trade and System Operation as the coding order of currencies trading on KASE, including in part of currency swaps, had been changed.
Table 62 (continuation)

126
58. Methodology for Calculation of Securities Liquidity Indicators
Date of approval: December 1, 2009
Approved by: The Management Board
Effective: December 14, 2009
Comments: The Methodology defines the order of calculation of a security liquidity indicator (for example, shares, and corporate bonds), listing on KASE, for purposes of determination of security liquidity degree as compared with other securities of this type listing on KASE.
Securities liquidity indicators will be calculated on the basis of traded values and the number of transactions in the securities, resultant days, and the number of KASE members that traded the securities. The Methodology provides for protection from affect on calculation results of large irregular transactions concluded in knowingly illiquid securities.
The Methodology will allow for KASE receiving a criterion, on which securities trading on KASE will be conditionally divided into liquid and illiquid for different purposes. The KASE Board of Directors on October 29 defined different trading schedules for liquid and illiquid shares, the lists of which will be revised on a quarterly basis.
59. Regulations on Committee for Currency Market
Date of approval: December 24, 2009
Approved by: The Board of Directors
Effective: February 9, 2010
Comments: The Regulations have been developed on request of the KASE Board of Directors for purposes of enhancement
and the order of operation of the Committee for currency market.
In accordance with the Regulations the Committee for Currency Market is a permanent non-structure unit, mainly engaged in study of solvency of currency market members, and, as may be required, making decisions on transfer thereof from urgent delivery to preliminary delivery of selling and/or payment of purchased currency. Besides, the Committee for Currency Market is responsible for other tasks related to currency trading which are not related to competency of other units of KASE.
60. Supplement and amendments No. 16 to Rules on Settlement of Currency Trading
Date of approval: December 24, 2009
Approved by: The Board of Directors
Effective: February 9, 2010
Comments: The amendments have been made after the KASE Board of Directors had approved on December 24, 2009
61. Regulations on Listing Commission
Date of approval: December 24, 2009
Approved by: The Board of Directors
Effective: February 8, 2010
Comments: The Regulations have been developed in accordance with the legislation of the Republic of Kazakhstan and define the structure, functions and the order of fulfillment of such functions, authorities and duties of the Listing commission.
In accordance with the Regulations the Listing commission is a permanent non-structure unit, mainly engaged
consent for listing of bonds supposed to be issued (issued) in accordance with the legislation of other, besides Kazakhstan, states.
62. Amendments and supplements No. 10 to Methodology for Valuation of Securities
Date of approval: December 24, 2009
Approved by: The Board of Directors
Effective: February 8, 2010
Comments: The amendments, along with editorial specifications, entitle FSA with a right to independently release market data on securities and/or data required for calculation of market valuation of securities at the KASE website. Besides, the amendments release KASE of responsibility for accuracy and timeliness of release of FSA data
Table 62 (continuation)
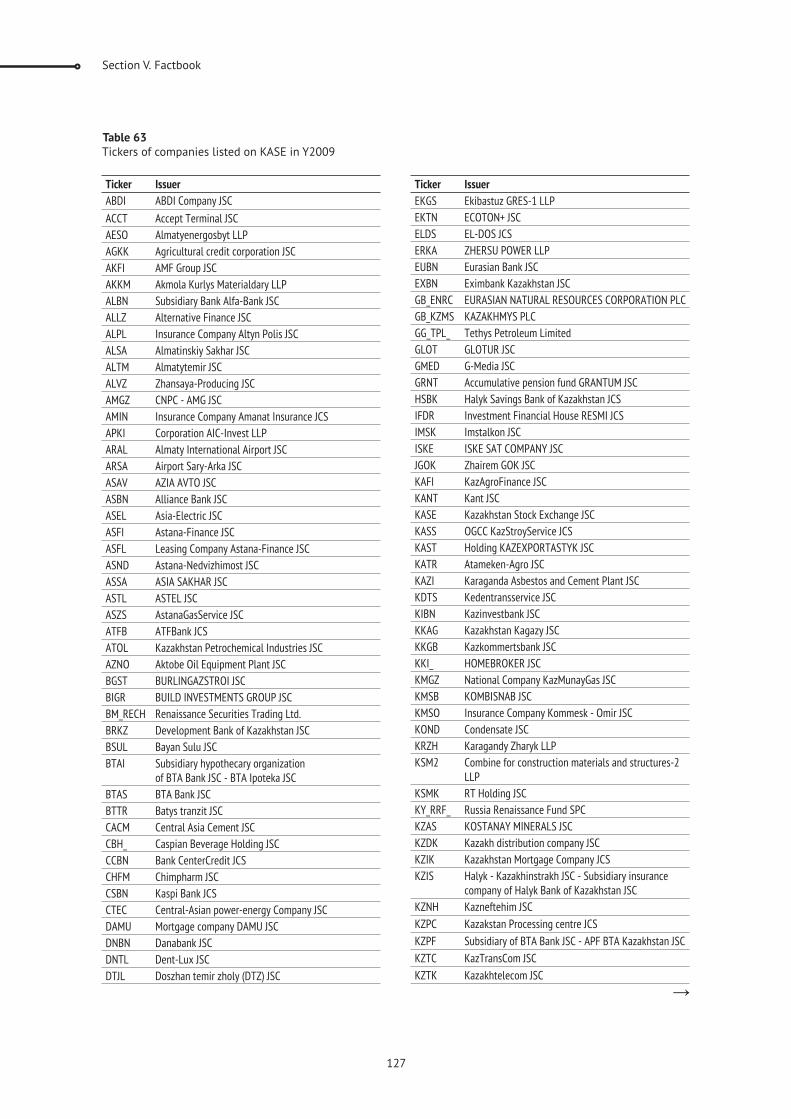
Section V. Factbook
127
Ticker Issuer
ABDI ABDI Company JSC
ACCT Accept Terminal JSC
AESO Almatyenergosbyt LLP
AGKK Agricultural credit corporation JSC
AKFI AMF Group JSC
AKKM Akmola Kurlys Materialdary LLP
ALBN Subsidiary Bank Alfa-Bank JSC
ALLZ Alternative Finance JSC
ALPL Insurance Company Altyn Polis JSC
ALSA Almatinskiy Sakhar JSC
ALTM Almatytemir JSC
ALVZ Zhansaya-Producing JSC
AMGZ CNPC - AMG JSC
AMIN Insurance Company Amanat Insurance JCS
APKI Corporation AIC-Invest LLP
ARAL Almaty International Airport JSC
ARSA Airport Sary-Arka JSC
ASAV AZIA AVTO JSC
ASBN Alliance Bank JSC
ASEL Asia-Electric JSC
ASFI Astana-Finance JSC
ASFL Leasing Company Astana-Finance JSC
ASND Astana-Nedvizhimost JSC
ASSA ASIA SAKHAR JSC
ASTL ASTEL JSC
ASZS AstanaGasService JSC
ATFB ATFBank JCS
ATOL Kazakhstan Petrochemical Industries JSC
AZNO Aktobe Oil Equipment Plant JSC
BGST BURLINGAZSTROI JSC
BIGR BUILD INVESTMENTS GROUP JSC
BM_RECH Renaissance Securities Trading Ltd.
BRKZ Development Bank of Kazakhstan JSC
BSUL Bayan Sulu JSC
BTAI Subsidiary hypothecary organization
BTAS BTA Bank JSC
BTTR Batys tranzit JSC
CACM Central Asia Cement JSC
CBH_ Caspian Beverage Holding JSC
CCBN Bank CenterCredit JCS
CHFM Chimpharm JSC
CSBN Kaspi Bank JCS
CTEC Central-Asian power-energy Company JSC
DAMU Mortgage company DAMU JSC
DNBN Danabank JSC
DNTL Dent-Lux JSC
DTJL Doszhan temir zholy (DTZ) JSC
Ticker Issuer
EKGS Ekibastuz GRES-1 LLP
EKTN ECOTON+ JSC
ELDS EL-DOS JCS
ERKA ZHERSU POWER LLP
EUBN Eurasian Bank JSC
EXBN Eximbank Kazakhstan JSC
GB_ENRC EURASIAN NATURAL RESOURCES CORPORATION PLC
GB_KZMS
GG_TPL_ Tethys Petroleum Limited
GLOT GLOTUR JSC
GMED G-Media JSC
GRNT Accumulative pension fund GRANTUM JSC
HSBK Halyk Savings Bank of Kazakhstan JCS
IFDR Investment Financial House RESMI JCS
IMSK Imstalkon JSC
ISKE ISKE SAT COMPANY JSC
JGOK Zhairem GOK JSC
KAFI KazAgroFinance JSC
KANT Kant JSC
KASE Kazakhstan Stock Exchange JSC
KASS OGCC KazStroyService JCS
KAST Holding KAZEXPORTASTYK JSC
KATR Atameken-Agro JSC
KAZI Karaganda Asbestos and Cement Plant JSC
KDTS Kedentransservice JSC
KIBN Kazinvestbank JSC
KKAG Kazakhstan Kagazy JSC
KKGB Kazkommertsbank JSC
KKI_ HOMEBROKER JSC
KMGZ National Company KazMunayGas JSC
KMSB KOMBISNAB JSC
KMSO Insurance Company Kommesk - Omir JSC
KOND Condensate JSC
KRZH Karagandy Zharyk LLP
KSM2 Combine for construction materials and structures-2 LLP
KSMK RT Holding JSC
KY_RRF_ Russia Renaissance Fund SPC
KZAS KOSTANAY MINERALS JSC
KZDK Kazakh distribution company JSC
KZIK Kazakhstan Mortgage Company JCS
KZIS Halyk - Kazakhinstrakh JSC - Subsidiary insurance company of Halyk Bank of Kazakhstan JSC
KZNH Kazneftehim JSC
KZPC Kazakstan Processing centre JCS
KZPF Subsidiary of BTA Bank JSC - APF BTA Kazakhstan JSC
KZTC KazTransCom JSC
KZTK Kazakhtelecom JSC
Table 63
Tickers of companies listed on KASE in Y2009

128
Ticker Issuer
KZVP Kazakhvzryvprom JSC
LNAT Subsidiary of BTA Bank JSC - Insurance Company London-Almaty JSC
LNPT Lancaster Petroleum JSC
LOGC LOGYCOM JSC
MAG_ MAG JSC
MMGZ Mangistaumunaygas JSC
MREK Mangistau Electricity Distribution Network Company JCS
NFBN Delta Bank JSC
NL_ASBN ALB Finance B.V.
NL_ATFB ATF Capital B.V.
NL_BTAS TuranAlem Finance B.V.
NL_HSBK HSBK (Europe) B.V.
NL_KKGB Kazkommerts International B.V.
NRBN Nurbank JSC
OILA Oilan Ltd.
ORDB Corporation Ordabasy JSC
ORDK Credit partnership ORDA credit LLP
ORNK Ornek XXI JCS
ORPT Wholesale and retail trade enterprise JSC
PAIN Insurance Company Pana Insurance JSC
PDEN PAVLODARENERGO JSC
PDES Pavlodar Regional Electric Distribution Company JSC
PNHZ Pavlodar Oil Chemistry Refinery JSC
PRIN Premier Strakhovanie JSC
PRKR National Company Food contract corporation JSC
RAHT Rakhat JSC
RDGZ Exploration Production KazMunayGas JSC
REAL Financial Company REAL-INVEST.kz JSC
REAM REAL ASSET MANAGEMENT JSC
RESC RESMI Group LLP
RGBR RG Brands JSC
RMXR REMIX-R JSC
Ticker Issuer
ROSA ROSA JSC
RTCP RTS Decaux JSC
SAS_ S.A.S. JSC
SATC SAT & Company JSC
SHMO Shymkent Munay Onimderi JSC
SHUK Shubarkol komir JSC
SKKZ National welfare fund Samruk-Kazyna JSC
SKYS SKY SILK JSC
SNBN SENIM-BANK JSC
SUMB Sumbe JSC
SVMH Svyazmontazh Holding LLP
TEBN Temirbank JSC
TEMA TEMA Ko. LLP
TKUD Ore mining and processing enterprise Tort-Kudyk JSC
TMLZ Temirleasing JSC
TSAS Concern Tsesna-Astyk LLP
TSBN Tsesnabank JSC
TSNA Corporation Tsesna JSC
TSSM Transstroymost JSC
TXBN Subsidiary Bank Sberbank of Russia JSC
UKAZ Ust-Kamenogorsk reinforcement plant JSC
UKPF Ust-Kamenogorsk poultry plant JSC
ULBA Ulba metallurgical plant JSC
UPDK Office for service of diplomatic corps JSC
US_JPM_ JPMorgan Chase Bank, National Association
US_MER_ Merrill Lynch & Co., Inc
UTMK Ust-Kamenogorsk titanium and magnesium plant JSC
VITA VITA JSC
VMZV Vostokmashzavod JSC
VSTN Joint-stock real estate investment fund Velikaya Stena JSC
ZERD Kazcat JSC
ZNGR Kazakh Republic Trade House ZANGAR JSC
Refer to Notes to Factbook
Table 63 (continuation)

Section V. Factbook
129
General Part
The following definitions are applicable to the Factbook (unless otherwise is specified with an individual note):
weighted average US dollar rate -plied to in accordance with KASE internal document “Methodology for Calculation of Currency Market Indicators” (http://www.kase.kz/files/normative_base/ind_currency_eng.pdf);
traded value -tions and currency swaps is calculated on the basis of opening deals;
exchange turnover
deals will be taken into account for calculating values of repo transactions and currency swaps.
Unless specified with an individual note, dollar equivalent of traded value and exchange turnover in different exchange market sectors has been calculated on the basis of weighted average dollar rate resulted in the KASE morning session as on the day of conclusion of each of the deals taken into account for calculation of the indicated values.
Shares and Shareholders
Table 1. KASE shareholders as on January 1, 2010
Companies that became KASE shareholders in Y2009 are checked.
As on January 1, 2010 the Exchange had 5.0 m authorized shares, of which 457,907 were outstanding.
Statistical Characteristics of Kazakhstan Exchange Financial Market in Y2009
Table 6. Exchange market structure in recent 10 Years (bn USD) and comparison of exchange traded value with
Kazakhstan GDP
The totals line shows a ratio of the total traded value for indicated years to the Kazakhstan GDP. Exchange
which released exchange turnover values only.
Table 8. Exchange traded value structure in Y2009 (m USD, %)
Traded value of secondary market of equity securities and debt securities theoretically may contain securi-ties placement traded value, if such transactions were concluded on KASE in the purchase and sale sector and not registered by traders as primary market transactions.
The table provides data in terms of traded value. Accordingly, repo transactions and currency swaps are accounted on the basis of opening deals.
Equity Market
In the heading and hereafter in this section equity securities mean securities that were listing as on the dates (peri-ods) indicated in Tables or pictures in sectors ‘shares’ and ‘securities’ of investment funds of the KASE official list, and admitted to circulation in sector ‘Unlisted securities’; unless specified otherwise with an individual note.
The last price of an equity security indicated in the table is a weighted average price calculated on the basis of transactions concluded in the Exchange trading system in this instrument during the last (before the date indicated in the table) productive trading day for this instrument.
Issuer market capitalization is calculated in the tenge in accordance with item 4 of article 3 of KASE internal document “Methodology for Calculation of Stock Market Indicators” (http://www.kase.kz/files/normative_base/indicators_met_eng.pdf). The received values have been recalculated into the US dollars
Notes to Factbook

130
in accordance with sub-item 1) of item 5 of article 3 of the same KASE internal document. At that, if only preferred shares of a certain issuer were listing on KASE, market capitalization for the issuer was not calculated.
Issuer market capitalization is released in the instruments’ line corresponding to common shares of the issuer.
Table 10. Changes in KASE lists in Y2009
A new issuer means a company, equities of which have never been listing on the KASE official list, the
Table 11. KASE list structure in Y2009 (as on January 1, 2010, changes for a year)
As STF RFCA and MTF KASE merged in Y2009, and taking into account that listing requirements to secu-rities listing on STF RFCA and MTF KASE and issuers thereof in fact had been unified in Y2008 (refer to Merger of trading floors on the basis of new listing requirements), trends in the table were calculated on the basis of aggregate data for STF RFCA and MTF KASE as on January 1, 2009.
Table 12. KASE list industrial structure (shares at market value)
Industrial classifier MSCI Barra and Standard & Poor’s Global Industry Classification Standard (GICS®) have been applied for the compilation of the table. Companies listing in sector “shares” as on the dates indicated in the table were classified to economy sectors in accordance with criteria of the classifiers mentioned above.
Total market value of all outstanding (net of those redeemed by issuer) shares of the companies were calculated for each economy sector. Calculations were made in the tenge in accordance with item 4 of article 3 of KASE internal document “Methodology for Calculation of Stock Market Indicators” (http://www.kase.kz/files/normative_base/indicators_met_eng.pdf). The received values have been trans-lated in the dollar in accordance with sub-item 1) of item 5 of article 3 of the same KASE internal docu-ment.
As STF RFCA and MTF KASE merged in Y2009, and taking into account that listing requirements to se-curities listing on STF RFCA and MTF KASE and issuers thereof in fact had been unified in Y2008 (refer to Merger of trading floors on the basis of new listing requirements), the table as on January 1, 2009 is providing aggregate data for STF RFCA and MTF KASE.
Table 13. Equity traded value on KASE in Y2009 (in terms of months, quarters and sectors)
trading system for unrestricted circles through a special trade. “Other special trade” may include executed transactions of the secondary market, concluded in the KASE trading system through a special trade. Columns “scheduled trades” indicate total value of executed transactions concluded in the KASE trading system through continuous counter-directed auction and nego transactions.
Table 14. Equity purchase and sale deals volume detailed by categories on KASE in Y2009
Transactions concluded at special trades held by the Exchange were not taken into account at compilation of the table.
Table 15. KASE equity market performance in Y2009 and Y2008
Section “Market transactions” provides data on executed transactions concluded on KASE in the purchase and sale sector (except transactions concluded at special trade on sale, placement and redemption of securities) through continuous counter-directed auction. This sector is normally used for trade on the secondary market. However, transactions on placement of securities could be also concluded in this sector. The Exchange could not classify such transactions as one statistical group if they had not been registered by traders as transactions of the primary market.
Section “Nego transactions” provides data on executed transactions concluded on KASE in the purchase and sale sector through nego transactions. This sector is normally used for trade on the secondary market. However, transactions on placement of securities could be also concluded in this sector. The Exchange could not classify such transactions as one statistical group if they had not been registered by traders as transactions of the primary market.
Section “Special trade” provides data on executed transactions concluded at special trades held

Section V. Factbook
131
Picture 3. Volume and proportion of exchange equity deals in Y2009 in terms of types
Picture 3 provides data on executed transactions without account of transactions concluded at special trades on sale, offering or redemption of securities.
Table 16. Volume of shares traded on KASE in Y2009 and Y2008 in terms of industries
Industrial classifier MSCI Barra and Standard & Poor’s “Global Industry Classification Standard” (GICS®) have been used for compilation of the table.
The Table has been compiled on the basis of the total value of executed share purchase and sale transac-tions concluded in the KASE trading system during corresponding periods (without account to transactions concluded at special trades).
Data have been sorted in the table on the basis of an industry share in the Y2009 share traded value. The KASE list industrial structure relevant as on January 1, 2010 has been given as a reference.
Table 18. Ten top liquid shares on KASE secondary market in Y2009
For compilation of the table liquidity indicator (Kl) has been used, which is calculated in accor-dance with KASE internal document “Methodology for Calculation of Securities Liquidity Indicators” (http://www.kase.kz/files/normative_base/metodika_liquid_eng.pdf) for each stock for the period indicated in table headings.
Data have been sorted in the descending order (the higher Kl, the higher is liquidity and, accordingly, the higher rank in the table).
Table 19. Y2009 vs. Y2008 gross traded value in terms of investor categories
Values indicated in the table have been calculated on the basis of value of executed share purchase and sale transactions, including transactions, concluded at special trades on sale, placement or redemption of shares. At that the position of the sole buyer (or seller)34 of shares at special trade has not been taken into account at calculation.
Table 20. Top ten exchange secondary share market operators in Y2009
Companies have been ranked in accordance with KASE internal document “Methodology for Calculation of Activity Indicators of Members of Kazakhstan Stock Exchange” (http://www.kase.kz/files/normative_base/members_activity_eng.pdf).
Table 21. KASE Index stocks as on January 1, 2010
in accordance with item 7 of article 5 of KASE internal document “Methodology for Calculation of Stock Market Indicators” (http://www.kase.kz/files/normative_base/indicators_met_eng.pdf).
heading. The indicator is expressed in the US dollar based on weighted average exchange rate of tenge to dollar, effective on the date.
KASE Index stocks, which, as may be required, is limited through a restricting coefficient (article 8 of KASE internal document “Methodology for Calculation of Stock Market Indicators”).
Table 23. Specifications of stocks listed in KASE Index as on January 1, 2010
trading day of Y2009 and Y2008 for each stock indicated in the table.
Turnaround for free float is a period in days, during which traded value of a stock could reach value of the stock in free float. The lower is the indicator, the higher is the turnaround.
Turnaround for investment in USD1 m is a number of days, which is on average required to an investor for acquisition of the stock worth USD1 m. The indicator is calculated as a ratio of 1,000 to average traded value per day in th. USD.
34 The term is used in the interpretation of item 1 of article 9 of KASE internal document “Regulations on Trading Methods”

132
Table 24. Price multipliers of KASE Index and its components as on January 1, 2010
KASE has computed the multipliers on the basis of the most recent issuer financial statements available on KASE on the date of preparation of the report. At calculation of PE and PS KASE has used data covering the last twelve-month period, preceding the date, as on which the last financial statements available to the Exchange had been prepared.
Picture 7. KASE Index change in Y2009 in terms of industries represented with stocks
Industrial classifier MSCI Barra and Standard & Poor’s “Global Industry Classification Standard” (GICS®) have been used for compilation of the table.
Companies, shares of which were representing the KASE Index as on the indicated dates, have been clas-sified to economy sectors in accordance with criteria of GICS. Afterwards total market values of all free-floating shares, issuers of which were related to the sector were computed for these dates in all sectors.
The Index total market value was calculated with account to a restricting coefficient in accordance with item 4 of article 5 of KASE internal document “Methodology for Calculation of Stock Market Indicators” (http://www.kase.kz/files/normative_base/indicators_met_eng.pdf).
Picture 8. Five-day moving average of Price to Book indicator for seven most liquid common shares in Y2009
At calculation of Price to Book KASE has used available share issuer financial statements relevant as on transaction dates. At that, preference has been given to audited financial statements.
Corporate Bond Market
Table 25. KASE official list as on January 1, 2010
The Exchange has determined the number of outstanding bonds of each denomination on the basis of the data provided by issuers or admission initiators on placement of bonds of this denomination or coupon payment thereon.
For purposes of calculation of total nominal value of outstanding bonds in millions of tenge the nominal value of dollar-denominated bonds was recalculated in the tenge based on weighted average rate of tenge to dollar that resulted in the morning (main) session on December 31, 2009; the nominal of bonds denominated in currencies other than tenge and dollar, has been recalculated in the tenge at the rate of a corresponding currency to tenge as set by the National Bank for December 31, 2009.
Total market value of placed bonds of each denomination is a product of their respective nominal value and net price of the last (as on January 1, 2010) executed transaction in bonds of this denomination.
The dollar equivalent of the value indicated in the previous passage has been calculated on the basis of weighted average rate of tenge to dollar that resulted in the morning (main) session on KASE on Decem-
Table 26. Changes in KASE lists for Y2009
A new issuer means a company, bonds of which have never been listing on the KASE official list, the initial
Besides, the Table contains data on de-listings of matured bonds.
Table 27. KASE official list structure dynamics in Y2009 (as on January 1, 2010, changes for a year)
Trends have been calculated with account to the number of securities and issuers listing in corresponding categories (subcategories) of STF RFCA and MTF KASE as on January 1, 2009.
Trends on bonds of buffer category can not be calculated as there was no such category in the structure of lists of STF RFCA and MTF KASE as on January 1, 2009.
Table 28. KASE official list industrial structure
Industrial classifier MSCI Barra and Standard & Poor’s “Global Industry Classification Standard” (GICS®) have been used to compile the table. Companies with bonds listing as on the dates indicated in the table have been related to economy sectors in line with the classifier.
Section V. Factbook
133
Market capitalization of the above mentioned sectors has been computed for the dates indicated in the table in accordance with Exchange internal document “Methodology for Calculation of Stock Market Indicators”.
The calculations have been made in the tenge and the received values have been translated in the US dol-lar on the basis of the weighted average rate of dollar to tenge as on the dates indicated in the table.
As STF RFCA and MTF KASE merged in Y2009 (refer to Merger of trading floors on the basis of new listing requirements), the table as on January 1, 2009 provides aggregate data of STF RFCA and MTF KASE.
Table 29. Corporate bond traded value on KASE in Y2009 (in terms of months, quarters and sectors)
Columns “purchase and sale” provide total value of executed transactions which were concluded: at continuous counter-directed auctions on the secondary and primary (which is possible) markets; through nego transactions (mainly on the secondary market, however, this may as well be the case of securities placement and redemption by issuer); through a special trade on the secondary market.
Table 30. Corporate bond traded value industrial structure on KASE in Y2009 and Y2008
Industrial classifier MSCI Barra and Standard & Poor’s “Global Industry Classification Standard” (GICS®) have been used to compile the table.
For purposes of compilation of the table companies with bonds listing on KASE as in the periods indi-cated in the table have been related to economy sectors in line with the classifier. Traded value has been computed for the periods indicated in the table for each sector. Transactions concluded at special trade for placement have not been taken into account.
-lar on the basis of the weighted average rate of dollar to tenge that resulted in the morning (main) trade session in currency on days of conclusion of the transactions.
Data have been sorted in the descending order on the basis of the industry value in the total corporate bond traded value for Y2009. As a reference the table provides data on breakdown of traded value among industries as on January 1, 2010.
Table 31. KASE corporate bond market performance in Y2009 vs. Y2008
Section “Market transactions” provides data on executed transactions, which were concluded on KASE in the purchase and sale sector at continuous counter-directed auctions. This sector is mainly used for trade on the secondary market. However, issuers could as well place their securities in this sector. The Exchange could not classify such transactions as an individual group if they had not been registered by traders as primary market transactions.
Section “Nego transactions” provides data on executed deals, which were concluded on KASE in the pur-chase and sale sector through nego transactions. The sector is normally used for trade on the secondary market. However, issuers could as well place securities in this sector. The Exchange could not classify such transactions as an individual group if they had not been registered by traders as primary market transactions.
At compilation of the table position of corporate bonds has been taken into account as on the date of conclusion of each transaction.
Table 33. Corporate bond trade turnover (gross) on KASE, Y2009 and Y2008 in terms of investor categories
The values indicated in the table have been computed on the basis of gross turnover (purchase value + sales value) of executed bond purchase and sale transactions, including transactions, concluded at special trades on their placement or redemption. At that a position of the sole seller (or buyer)35 of corporate bonds at special trades was excluded from calculation.
Table 34. Top ten operators on secondary corporate bond market in Y2009
Operators have been ranked in accordance with KASE internal document “Methodology for Calculation of Activity Indicators of Members of Kazakhstan Stock Exchange” (http://www.kase.kz/files/normative_base/members_activity_eng.pdf).
35 The term is used in the interpretation of item 1 of article 9 of KASE internal document “Regulations on Trading Methods” (http://

134
Government Securities (Treasury Bills)
Table 35. GS traded value on KASE in Y2009 (in terms of months, quarters and sectors)
Hereafter in this chapter GS shall mean the following government securities (unless specified otherwise): bonds of Kazakhstan Finance Ministry, including those issued in accordance with the legislation of other states; notes of the Kazakhstan National Bank; municipal bonds; foreign government securities.
Municipal bonds and foreign government securities were not listing on KASE in Y2009.
Picture 12. Kazakhstan government debt issued as GS in Y2000–Y2009
The tenge-denominated debt has been translated in the dollar on the basis of the rate of the National Bank as on the end of periods indicated at the schedule.
The picture shows nominal values without account of debt service.
The schedule has been prepared on the basis of KASE data bases conforming to the Central Securities Depository data. The data on the picture is not official statistics. However, the Exchange took all possible steps to display the most accurate figures independent of official sources.
Table 37. KMF GS placements on KASE in Y2009
Yield shall mean YTM for buyer.
Checked values show forecast YTM calculated on the basis of inflation rate known at the moment of trade.
Data have been sorted on the basis of GS tickers in the alphabetic order.
Table 39. Traded value structure of GS exchange secondary market in Y2009
The table data have been calculated on the basis of value of executed transactions in GS indicated in the table on the KASE secondary market.
Table 41. Top ten GS exchange secondary market operators in Y2009
Operators have been ranked in accordance with KASE internal document KASE “Methodology for Cal-culation of Activity Indicators of Members of Kazakhstan Stock Exchange” (http://www.kase.kz/files/normative_base/members_activity_eng.pdf).
Repo
Table 49. Exchange repo market agents in Y2009 and Y2008
The Table has been compiled without account of the National Bank.
Table 50. Top ten repo market operators on KASE in Y2009
Operators have been ranked in accordance with KASE internal document “Methodology for Calculation of Activity Indicators of Members of Kazakhstan Stock Exchange” (http://www.kase.kz/files/normative_base/members_activity_eng.pdf).
Currency
Table 53. USD/KZT trade on KASE, Y2009 vs. Y2008
The Table has been compiled with account to dollar currency swaps.
Table 56. KASE currency market in Y2009 and Y2008 in terms of instruments
Apart from instruments indicated in the table, EURUSD_SPT has been available for trade on KASE since December 14, 2009; however it was not trading in Y2009 on KASE. Euro currency swaps were no trading on KASE in Y2009.

Section V. Factbook
135
Table 57. Top ten KASE currency market operators in Y2009
Operators have been ranked in accordance with KASE internal document “Methodology for Calculation of Activity Indicators of Members of Kazakhstan Stock Exchange” (http://www.kase.kz/files/normative_base/members_activity_eng.pdf).
Reference Information
Table 59. Basic listing requirements imposed by KASE
At listings of bonds issued by a special enterprise under guarantee of its sole founder (member), listing requirements will be imposed on the guarantor, not the issuer.
At listings of DRs, the underlying asset of which are shares issued in accordance with the legislation
Listing requirements for derivatives are set with stock exchange rules as agreed with FSA and
Individual listing requirements are imposed to infrastructure and securitized bonds, securities of investment funds (and indexed funds) and international financial organizations, foreign government securities, and for purposes of simplified listing procedures by virtue of order of Chairman of ARA RFCA “On setting require-ments to issuers, securities of which are supposed for listing or listed on the special trading floor of the Regional Financial Center of Almaty, and to such securities” of May 8, 2008 No. 04.2-09/119 and resolution of the Management Board of FSA “On requirements to issuers and their securities admissible (admitted)
Table 60. Companies that defaulted on debt securities in Y2009
The table solely is covering companies that were listing on KASE as at the moment of default.
Traded values have been calculated by the Exchange on the basis of most recent information available on KASE on outstanding bonds.
Table 61. KASE market indicators in Y2009
Market capitalization indicators and stock indexes have been calculated in accordance with the KASE internal document “Methodology for Calculation of Stock Market Indicators”. Only executed transactions concluded in the purchase and sale sector at continuous counter-directed auctions have been taken into account for calculation of traded value. For the currency market the weighted average rate is provided as for the main session for this currency; the total traded value for the day comprising all sessions in all currency instruments, including currency swaps on opening deals is indicated as the traded value.
Table 63. Tickers of companies listed on KASE in Y2009
The coding order of members of Kazakhstan Stock Exchange, financial instruments and issuers is available at the KASE website at http://www.kase.kz/files/normative_base/code_fins_eng.pdf

Glatis Studio
www.glatis.kz
Design and layout Meru Bakasova
Illustrations Asiya Dzhaisheva
© KASE, 2010
ANNUAL REPORT 2009
Kazakhstan Stock Exchange
www.kase.kz