annual report 2018 - investor | royal unibrew a/s
TRANSCRIPT

Annual Report
2018Royal Unibrew A/S CVR no. 41 95 67 12
ContentsRoyal Unibrew at a Glance Royal Unibrew in brief 4Results for 2018 and Outlook for 2019 5Financial Highlights and Ratios 6CEO Letter 7
Strategy and targets Strategy 11Market outlook 12Our recent four acquisitions over the past 15 months broaden our product offering 13Consumer trends – searching for the good life 14Closeness to consumers 15Digitalization with our customers is gaining momentum 16Financial targets, capital structure and distribution policy 17Outlook for 2019 18
Performance Financial Review 21Western Europe 25Baltic Sea 28International 31
Governance Shareholder Information 34Corporate Governance 37Risk Management 40Remuneration 43Board of Directors and Executive Board 45
Corporate Social Responsibility Corporate Social Responsibility 49
Signatures and statements Management's Statement on the Annual Report 66Independent Auditor's Report 67
Consolidated Financial Statements Income Statement 71Statement of Comprehensive Income 71Balance Sheet 72Cash Flow Statement 73Statement of Changes in Equity 74Contents of Notes 76
Parent Company Financial StatementsIncome Statement 109Statement of Comprehensive Income 109Balance Sheet 110Cash Flow Statement 111Statement of Changes in Equity 112Contents of Notes 114
Other Information (part of management report)
Group Structure 126Quarterly Financial Highlights and Ratios 127Definitions of Financial Highlights and Ratios 128Disclaimer 129
StrategyPage 11
Corporate social responsibilityPage 49
CEO Letter Page 7
2ContentS MANAGEMENT REPORTROYAL UNIBREW ANNUAL REPORT 2018

Royal Unibrew at a Glance
Unibrew at a Glance
RoYAL UnIBReW ANNUAL REPORT 2018 3UnIBReW At A GLAnCe MANAGEMENT REPORT

12
43
45
2017
2018
38
51
11
2017
2018
52
408
2017
2018
67
312
2017
2018
Royal Unibrew in brief
Net revenue by brand category
EBIT by segment Net revenue by product category
2,416 employees
7,298 mDKK
Net revenue for 2018
Volume by segment
Baltic Sea44%
International9% Western europe
47%
Western europe 42%
Baltic Sea 50%
International 8%
Craft and specialty beer brands 3%
Mainstream brands68%
Premium/ super-premium brands 29%
non- alcoholic beverages 49%
other alcoholic beverages13%
Beer38%
Royal Unibrew is a leading beverage pro-vider in a number of markets – primarily in Northern Europe, Italy, France and in the international malt beverage markets.
We produce, market, sell and distribute qual-ity beverages with focus on branded products within beer, malt beverages and soft drinks as well as ciders and long drinks.
Our main markets are Denmark, Finland, Italy, France and Germany as well as Latvia, Lith-uania and Estonia. To these should be added the international markets comprising a num-ber of established markets in the Americas region and major cities in Europe and North America as well as emerging markets in for example Africa.
In all of our multi-beverage markets, we offer strong and locally anchored brands to our consumers and customers. Based on contin-uous ongoing development and innovation, it is our objective to meet consumer demands for quality beverages.
In addition to our own brands, we offer licence-based international brands of the PepsiCo and Heineken Groups in Northern Europe.
Western Europe: Denmark, Germany, Italy and FranceBaltic Sea: Finland, Lithuania, Latvia and EstoniaInternational: the export and license business to international markets outside Denmark, Finland, Italy, France and the Baltic countries. Sales outside Italy, the Balkan countries and France from the businesses Terme di Crodo and Lorina are included in the segment.
4ROYAL UNIBREW ANNUAL REPORT 2018 In BRIeF MANAGEMENT REPORT

2014 2015 2016 2017 201810
12
14
16
18
2014 2015 2016 2017 2018600
800
1000
1200
1400
2014 2015 2016 2017 2018900
1100
1300
1500
1700
2014 2015 2016 2017 20185500
6000
6500
7000
7500
Results for 2018 and outlook for 2019
Developments in 2018• Total net revenue increase of 14%• Solid organic improvement of topline (9%) and topline
improvement from acquisitions (5%)• Market shares generally increased • Both EBITDA margin and EBIT margin increased• Earnings per share up from DKK 16.0 to DKK 20.6 (+29%)• Expected distribution to shareholders of DKK 950 million
(2017: 870 million) allocated on• Dividend of DKK 10.80 per share (2017: DKK 8.90)• New share buy-back program of DKK 400 million
(2017: DKK 400 million)• Three acquisitions completed • Royal Unibrew maintains its strategic flexibility
Royal Unibrew achieved the best results ever due to strong execution boosted by a historically warm summer in 2018
EBIT-MARGIN (%)
EBIT (mDKK)
EBITDA (mDKK)
NET REVENUE (mDKK)
Outlook for 2019
Outlook Actual Actual mDKK 2019 2018 2017
Net revenue 7,400-7,650 7,298 6,384
EBIT 1,340-1,465 1,339 1,069
+25% EBIT INCREASE IN 2018 TO DKK 1,339 MILLION
+23% EBITDA INCREASE IN 2018 TO DKK 1,673 MILLION
+14% NET REVENUE INCREASE IN 2018 TO DKK 7,298 MILLION
18.4% EBIT-MARGIN IN 2018, AN INCREASE OF 1.7 PERCENTAGE POINT
5ReSULtS FoR 2018 And oUtLook FoR 2019 MANAGEMENT REPORTROYAL UNIBREW ANNUAL REPORT 2018

Financial Highlights and Ratios 2018 2017 2016 2015 2014
Volume (million hectolitres) 10.8 9.9 9.9 9.3 9.2
INCOME STATEMENT (MDKK) Net revenue 7,298 6,384 6,340 6,032 6,056
EBITDA 1,673 1,362 1,306 1,225 1,130
EBITDA margin (%) 22.9 21.3 20.6 20.3 18.7
Earnings before interest and tax (EBIT) 1,339 1,069 1,001 917 826
EBIT margin (%) 18.4 16.7 15.8 15.2 13.6
Income after tax from investments in associates 20 18 28 31 35
Other financial income and expenses, net -31 -31 -31 -46 -60
Profit before tax 1,328 1,056 998 902 801
Net profit for the year 1,040 831 784 711 624
Parent company shareholders' share of net profit 1,041 831 784 711 624
BALANCE SHEET (MDKK) Non-current assets 6,775 5,121 5,180 5,505 5,664
Total assets 8,062 6,778 6,076 6,748 7,024
Equity 2,908 2,814 2,911 2,935 2,818
Net interest-bearing debt 2,522 975 991 1,184 1,553
Net working capital -748 -957 -881 -990 -814
Invested capital 5,835 4,030 4,111 4,347 4,650
CASH FLOWS (MDKK)
Operating activities 1,214 1,168 985 1,160 895
Investing activities -1,622 -218 38 -123 -69
Free cash flow 942 950 1,022 1,032 824
SHARE RATIOS (DKK) Number of shares (million) 51.0 52.7 54.1 55.5 55.5
Earnings per share (EPS) 20.6 16.0 14.7 13.0 11.3
Diluted earnings per share 20.6 16.0 14.6 12.9 11.2
Free cash flow per share 18.7 17.8 18.7 18.6 14.9
Dividend per share 10.80 8.90 8.15 7.20 6.8
Year-end price per share 449.0 371.8 272.6 280.1 217.4
2018 2017 2016 2015 2014
EMPLOYEESAverage number of employees 2,416 2,299 2,350 2,314 2,374
FINANCIAL RATIOS (%) Return on invested capital including goodwill (ROIC) 21 21 18 16 13
Return on invested capital excluding goodwill (ROIC) 33 32 28 23 19
Free cash flow as a percentage of net revenue 13 15 16 17 14
Cash conversion 91 114 130 145 132
Net interest-bearing debt/EBITDA (times) 1.5 0.7 0.8 1.0 1.4
Equity ratio 36 42 48 43 40
Return on equity (ROE) 36 29 27 25 25
Dividend payout ratio (DPR) 53 56 56 56 60
Ratios comprised by the “Recommendations and Financial Ratios” issued by the Danish Society's Committee for accounting standards have been calculated according to the recommendations.
Definitions of financial highlights and ratios are provided on page 128.
Due to adoption of IFRS 16 (leases) using the modified retrospective approach the 2018 highlights and ratios are not comparable with those for 2014-2017.
6FInAnCIAL HIGHLIGHtS And RAtIoS MANAGEMENT REPORTROYAL UNIBREW ANNUAL REPORT 2018

During 2018, Royal Unibrew continued to see good mo-mentum in the business delivering a solid development in both net revenue and earnings – and we achieved our best results ever. Our performance is attributable to a solid organic development across markets, the acquisi-tions carried out in the course of the past year as well as a historically warm summer in Northern Europe. Noting the foundation of our earnings improvement and considering our future earnings potential, we increase our EBIT-margin target from around 17% to a range of 18-19%. At the same time, we launch a share buy-back program for 2019 of up to DKK 400 million and propose a distribution of ordinary dividend of DKK 10.80 per share (2017: DKK 8.90).
2018 has been another truly remarkable year for Royal Unibrew. Around the world we sold and delivered 10.8 million HL to mil-lions of consumers, our products were made available in more than 300,000 points of sale and we sold products worth DKK 7,298 million; a 14% increase vs. 2017. Our 2,416 valued em-ployees worked together to secure up to a 99.7% service level, and we brought a vast number of new products and varieties to the markets we serve.
A well-grounded strategy paired with dedicated execution, enhanced by favorable weather drives our continuous sustainable growth of topline and financial results
ROYAL UNIBREW ANNUAL REPORT 2018 7Ceo LetteR MANAGEMENT REPORT

Whereas in financial terms we improved our sales value by 14%, we increased our EBITDA by DKK 311 million and equals 22.9% of our net revenue, and we propose a dividend increase by 21% vs. last year.
The key factors driving our strong results in 2018 have been:
• Organic growth of 9% in our core business, also driven by extraordinarily good summer weather in the Nordic region
• Strong advances for many of our core local brand proposi-tions across regions
• Excellent in-outlet execution together with our valued customers
• Best in class appreciation by consumers of our innovation initiatives
• A continued strong discipline on the efficiency of our operations
• The first returns on our new acquisitions
Whereas our momentum was accelerated by the extraordinarily good summer weather in Northern Europe, our work and ac-tivities on our existing portfolio in a variety of channels secured growth throughout most of our markets. Further, and due to country and channel movements, we lifted our gross and op-erating margins. As a result of our 2018 earnings improvement and following an assessment of our capabilities and plans, we are resetting our EBIT-margin ambition to a range of 18-19% during the coming years. We continue our shareholder distribu-tion record by launching a new share buy-back program worth DKK 400 million as well as a 21% increase in our dividend per share vs. 2017 to DKK 10.80 per share. We are committed to maintain our strategic flexibility and plan our cash and capital structure with intensive care and focus.
Continuity with consumers and customers as our core focusThe pace of change in the world of refreshment is accelerating day by day thus forcing us to update our understanding of the new needs and opportunities. Whereas consumers experiment ever more across categories and customers focus on rotation and service, we aim to match these opportunities with new, digital solutions that connect us with our customers aiming to improve our service levels and responsiveness and provide ‘real live’ insights into the preferences and passions of consumers across our core territories.
Hence, we invest in our digital toolbox in order to enable our teams to connect faster and more continuously with our con-sumers, shoppers and business partners.
Local refreshment brands closer to the communities we serveOur strategy is based on a combination of few internationally anchored unique brand bundles and many strong local brands that have a more intimate relation to the local consumers and their tastes. Heineken, PepsiCo and Terme di Crodo are solid examples of these international anchors. Our Hartwall Origi-nal Long drink and Faxe Kondi are good examples of the local heroes that maintain an original and unique relationship with consumers and customers, who become more and more fo-cused on regional and tailored solutions. We are convinced that these local connections prove a great platform for new and innovative tastes and concepts.
Health and "good for you"As this core consumer desire is here to stay, we consider the increased awareness of consumers of - what is good - a clear opportunity. Our portfolio with some strong, great tasting low and 0,0% alcohol and ditto low/no sugar beverage alternatives
offer consumers and customers viable and attractive options supported by partly proprietary technology.
The launch of Royal Organic 2.3% Let Pilsner in Denmark, the great momentum of Heineken 0.0% and Hartwall Jaffa Sok-eriton in Finland are just a few of the inspiring examples that enthuse consumers and customers across our markets.
Whereas concerns of consumers, customers and authorities change behaviors and drive legal frameworks in parallel, we take the challenge to lead our industry in harmony with the need for ever-lasting improvement with great commitment to do better, every day.
Craft and speciality productsAs consumers and customers increasingly look for special and more authentic experiences, we have successfully enhanced our portfolios with artisanal, craft beverages that demand smaller scale platforms to create unique experiences.
Our craft brewery investments demand a high human factor, special packaging, unique ingredients in order to serve the de-mand for special products which lead to more premium pricing.
Our newly acquired Nohrlund and Lorina brands are great ex-amples of a unique, artisanal and authentic way of connecting to the ‘millennial’ consumer with tailored, crafty and unique beverages that offer a great taste experience.
Executional excellence creating value for our customersThroughout most of our business, our route to the soul and stomach of our consumers leads via partners that play a pivotal role. Supporting these customers and partners with best quality products and service, creation of in-outlet experiences that drive rotation and by growing our categories through relevant
8ROYAL UNIBREW ANNUAL REPORT 2018 Ceo LetteR MANAGEMENT REPORT

innovation and pervasive presence are core capabilities of our customer teams. A relentless eye for detail and an energetic ‘can-do‘-attitude are core to our salesteams that aim to be the preferred partner to our valued consumers and customers. We constantly monitor the quality and effectivity of what we create in-outlet and pursue better ways of delivery. Our new Royal Unibrew ’tap-wall’ that allows restaurants and bars to a new, fresher and more diverse offer, is a great example of our constant drive to create value for our customers.
Continued quality and efficiency improvements that serve also the communities of which we are a partAs noted above, our beverage landscape gets more complex. In order to match that complexity and the costs that come with it, we apply new technologies in combination with better-trained and more experienced employees. We strive to get ever-in-creasing returns on the time, material and packaging we use.
As the communities in which we live become increasingly con-cerned about the future, we work together on all fronts with consumers and stakeholders to create a sustainable future. As a good example of our ever-growing concern and the sustaina-bility of our industry and operations, we mention the continuous decrease of waste, energy usage and material usage per pro-duced unit. In partnership with our suppliers we implement new solutions based on lower material usage as well as increased usage of recycled and biodegradable material constantly.
The first returns of our 2018 acquisitionsAlready during the first twelve months of ownership, we have taken major steps to form a new future for Terme di Crodo in Italy. We have implemented massive changes in the Supply Chain and we adjusted some of our price/pack strategies to better respond to the occasions our Terme di Crodo is best suited for, something the brand had not seen over a longer period. The commercial development was soft in the beginning of 2018, but fairly strong in the fourth quarter.
Where Terme di Crodo was a carve-out, with the complexity that follows that kind of deal, the acquisition of Lorina, the artisanal authentic French lemonade business, was more straightfor-ward. The Lorina company is a growing business, but also a business where uncontrolled growth has led to high degree of complexity. We are focusing our efforts on simplifying things and to prepare for controlled growth.
What is to comeWe enter into 2019 with a solid business platform, strong brand propositions and a vigorous commitment to deliver on our stra-tegic priorities that lead to great financial results.
I want to thank everyone around Royal Unibrew for his/her great dedication and contribution to our 2018 performance. It is the talent and passion of people, our ability to cooperate and a flexible consumer- and customer-focused mindset that pave the way for our good results.
I also want to express my appreciation to our consumers, cus-tomers and business partners for their trust, co-operation and involvement and, last but not least, our shareholders for their support of Royal Unibrew.
Hans Savonije President & CEO
9ROYAL UNIBREW ANNUAL REPORT 2018 Ceo LetteR MANAGEMENT REPORT

Strategy and targets
Strategy and targetsRoYAL UnIBReW ANNUAL REPORT 2018 StRAteGY And tARGetS MANAGEMENT REPORT 10

Operational
efficiency
Financial
flexibility
Sign
ifica
nt
mar
ket p
osit
ions
Talent and
people
Locally based
Innovationand developm
ent
Strategy
Royal Unibrew’s overall strategy is confirmed to be a strong regional beverage provider in selected core mar-kets and outside the core regions to establish and cement strong niche positions. The implementation of the strat-egy has led to continuous improvement of our earnings capacity, margins and free cash flow.
Overall strategyRoyal Unibrew strives to grow through two supplementary strategies:
1) Being a strong multi beverage provider in core markets offer-ing a diverse portfolio, which is relevant for consumers and
customers (e.g. beer, cider, long drinks (RTD), ready-made cocktails, soft drinks, waters and fruit juices).
2) Establishing leading and scalable niche positions through a combination of locally and anchored brands and unique export propositions (e.g. Ceres, Tempt, Faxe, Vitamalt and recently added Terme di Crodo, Lorina and Nohrlund prod-ucts).
With as well own brands as strong international licence brands our objective is to achieve leading positions in the markets or the segments in which we operate.
In the coming years, we will scale up our sales and market-ing efforts with a view to reinforcing our market positions in the individual markets and increasing the total business of the Group – thus ensuring the long-term value of our many brands.
Our strategy has been "designed" taking into account that Royal Uni-brew operates in diverse mar-kets that are characterised by different dynamics.
Main elements of the overall strategy
Key market positionsFocus on markets and segments in which Royal Unibrew holds or may achieve a considerable positionRoyal Unibrew focuses on further developing es-tablished market and segment positions where we hold either a leading position, such as in Denmark, Finland and the Baltic countries, or considerable and scalable niche positions, such as in Italy or France and in selected international markets. For main-stream market positions in consolidated markets, it should be possible to achieve a role as a leading player to create attractive profitability.
Royal Unibrew’s core market area is characterised by considerable industry concentration.
To the extent that structural growth opportunities arise for example through acquisitions or by enter-ing into partnerships, which might reinforce existing
market positions or create new market positions, these will be assessed, whether there is a strate-gic match and long-term shareholder value can be created.
We will reinforce our market positions through focus on a broader beverage portfolio in order for Royal Unibrew’s customers to benefit further from the partnerships.
Talent and peopleDeveloping alert and diverse talentInsight and strong competences are required to reach our ambitious strategic targets and to navigate in markets characterised by rapid change. We therefore give high priority to retaining experienced employ-ees and recruiting new employees who bring new momentum and knowledge, and to strengthening core competences through development and training.
Innovation, development and local rootsFocus on innovation and development of Royal Unibrew’s products and local brand positions Royal Unibrew’s strong position as a regional bever-age provider builds on strong local market positions established on the basis of well-known local brand portfolios is subject to continuous further develop-ment. The product portfolio development includes our own development of new line extensions, prod-ucts and brands within existing and new beverage categories as well as the conclusion of licence agree-ments both as a licensee and a licensor. A Growth Leadership Team facilitates the development and implementation of the Royal Unibrew Best Practice and knowledge sharing across the entire Group.
Operational efficiencyFocus on operational efficiencyRoyal Unibrew will continue focusing on pursuing opportunities to continuously enhancing the efficien-cy of all links in our value chain – at the same time considering how to reduce our environmental impact and ensure sufficient production capacity.
Financial flexibilityMaintaining Royal Unibrew’s financial flexibility, competitive power and scope for strategic maneuver-ability through an appropriate capital structureRoyal Unibrew is continuously considering its capital structure with a view to adjust it as to support the realization of the strategic and financial targets in the best possible way.
11StRAteGY MANAGEMENT REPORTROYAL UNIBREW ANNUAL REPORT 2018

Market outlook
Western Europe
Baltic sea International
In Denmark – apart from a relatively tough 2018 weather driven com-parison - we foresee the beverage market to be relatively stable, as beer and soft drinks will continue their shift into ‘better for you” territory. Low and non-alcohol beers will gain ground as a new generation of full tasting variants takes stage, well demonstrated by the recent succesful launches of products such as Royal Organic 2,3 % Let Pilsner and Heineken 0.0%.
The relatively recent boom in speciality and craft beer consumption will continue, albeit at a pace that illustrates the trade reality that has set in. The abundance of choice that confronts consumers leads to signals of confusion and may well drive the value chain to some in- outlet ra-tionalization.
In CSD’s the low-sugar and non-sugar segments will continue to grow, as will the indulgence and organic sectors: We are confident our Royal Unibrew portfolio that includes numerous great tasting variants from Novelle to Pepsi Max offers attractive propositions to both consumers and our business partners.
With the lowest beer per capita in Europe and an average soft drink con-sumption the Italian market has a record mineral water consumption, albeit at moderate consumer pricing.
With an outspoken ‘Restaurant and Bar ‘ culture we expect some mod-eration and shifts towards ‘in home’ consumption, yet we are confident that our innovation minded and -insight based Terme di Crodo portfolio adjustments will connect positively with consumers and customer across the entire peninsula. Focus on top quality and locally anchored propo-sitions, satisfying prevailing needs for local pride and a strong match of the famed local culinary traditions seem to compliment our strong beer foundation well.
The market for dark malt beverages is geographically fragmented, and consumer preference for these is rooted in tradition. The markets for dark malt beverages in established economies such as Europe, the U.S. and the Caribbean are expected to be structurally stable in the coming years. Demand for beer and dark malt beverages is expected to show a slight structural increase in a number of devel- oping countries. The slight growth should be viewed in light of the macroeconomic challenges facing many countries in Africa and the Americas, whose development is affected to a large extent by the development in raw materials prices (oil, gas, metals), the level of foreign investments and thus the availability of “hard” currencies. The market for soft drinks with artisanal, authentic, high quality ingredients and strong local heritage is expected to grow in West-/ Central Europe, North America and selective Asian markets.
Despite the fact that Royal Unibrew is primarily operating in Europe, our individual markets are characterised by many different development trends and market dynamics. Our strategy has been determined based on market-by-market considerations. Royal Unibrew’s outlook for the individual markets is as follows:
2018:Revenue 3,338 mDKK EBIT margin 18.0 %
2018:Revenue 3,378 mDKK EBIT margin 19.1 %
Finland, the beverage market forms a patchwork of influences from macro-economic improvement, legal liberation, fiscal tightening and health concern, all of these built on a culture where intimate moments are often celebrated with some form of alcohol consumption.
The moderate employment rate improvements seen over the past period have an impact on the the relative consumption of discounted alcohol vs premium alcohol, with beer being the most significant category.
The more global trend of mainstream-beer volumes gradually loosing territory to craft and specialty beers persists also in Finland, just as the growth of low- and non-alcoholic beer.
In CSD’s, we expect the current migration towards no- and low sugar products to continue.
2018:Revenue 582 mDKK EBIT margin 21.9 %
In France we note a clear shift away from mainstream softdrinks and beers towards more artisanal, local brands and more special products that also concur a more premium place in the heart of the consumer and customer. On top, we note a clear drive towards more “better for you” concepts driving a rapid growth of organic and functional segments. All this in combination with a life-long tradition of culinary and gastronomic indulgence makes us see a shift out of mainstream towards a bit “less is more”, premium consumption.
In the Baltic countries the demographic pull of the workforce towards Europe and the UK in particular is expected to moderate, and the first returners are noted. The challenges of increasing energy prices and pressure from salary increases put demands on businesses and, com-bined with ever increasing excise taxes and sales restrictions. Consumer pricing for beer and ciders is at relatively high levels already and further tax hikes may drive consumption towards ‘tax-free’ and grey imports.
The non-alcoholic beverage segment is expected to have further growth potential.
12MARket oUtLook MANAGEMENT REPORTROYAL UNIBREW ANNUAL REPORT 2018

With a selective and critical approach, we are always looking for attractive new busi-ness opportunities matching our strategy of being a focused and strong regional multi beverage provider holding market-leading positions within beverages in the Nordic and Baltic countries supplemented by strong niche positions.
Three acquisitions in 2018….The level of activity within acquisitions was exceptionally high during 2018 – we succeed-ed to acquire three businesses: the non-al-coholic beverage business, Terme di Crodo in Italy, the lemonade business Etablisse-ment Geyer Frères in France and Nohrlund ApS producing ready-made organic cocktails for the Danish market. We also entered an agreement to acquire Bev. Con ApS, which owns a.o. the brands CULT Energy, SHAKER and MOKAÏ. The acquisition was completed 28 February 2019 following a long approval process from the Danish competition au-thorities.
The above new businesses fit well the grow-ing opportunity for beverages that serve the core trends we observe across markets. "Better for you", authentic, local and arti-sanal and with ever growing care for choice, including organic variants in the offerings.
Our recent four acquisitions over the past 15 months broaden our product offering
The acquired businesses all bring attractive, iconic brands in their segments to our portfolio... With the acquisition of Terme di Crodo and its strong LemonSoda brand we have more than doubled our business volume in Italy – and with two unique brand portfolios we are now able to meet consumers’ demand for a broader portfolio of high-quality products.
The acquisition of Etablissement Geyer Frères and the Lorina artisanal French lemonade brand has given Royal Unibrew a niche platform in France similar to our Ital-ian business – and it will further strengthen our export portfolio.
Moreover, through the acquisition of a ma-jority interest in Nohrlund, Royal Unibrew has entered into a strategic alliance on the distribution of ready-made organic cocktails with focus on the On-Trade segment – and through our broad distribution channel, we can offer consumers some very appealing, innovative organic drinks created by a mod-ern beverage start-up.
The integration of the three new businesses is progressing well and we are now focused on creating commercial synergies – by join-ing forces to vitalize the acquired brands.
... and one more acquisition in Q1 2019The acquisition of Bev.Con ApS (CULT) was concluded 28 February 2019 and adds strong brands like CULT Energy, MOKAÏ and SHAK-ER to the Danish portfolio of brands. MOKAÏ and SHAKER are both brands strongly con-nected to the night life occasion and close a portfolio gap. Integration has been initiated immediately.
13oUR ReCent FoUR ACqUISItIonS oVeR tHe PASt 15 MontHS BRoAden oUR PRodUCt oFFeRInG MANAGEMENT REPORTROYAL UNIBREW ANNUAL REPORT 2018

Consumer trends compose a constantly changing varicolored patchwork. We spend many resources trying to read and predict the landscape forming consumer trends – with an aim to create the best possible match between consumer demands and our products.
What do consumers want? These years, consumers especially focus on authenticity, health & quality and expe-riences, and they are to an increasing ex-tend searching for the good life. This trend is expressed in a number of different ways. It is fine to drink a beer or a soft drink, but the beverages should be of higher quality. Moderation is also part of this trend, imply-ing that consumers focus more and more on the content of sugar and alcohol. In ad-dition, they focus on ingredients, production methods, including the heritage and history of the products.
At the same time, consumer behavior is characterized by a high degree of situation-al consumption, implying that consumers prefer to enjoy different products in different situations. Often consumers also prefer to compose their own portfolio of beverages across different brands – and they are con-stantly influenced by a wide range of media channels.
Beverage portfolio meeting consumer demands At Royal Unibrew, these trends are continu-ously turned into specific portfolio and brand development. During recent years, we have for example developed an attractive and in-novative portfolio of craft and specialty beer – and this fits very well with consumers’ de-mand for local products, high quality and something new and sustainable. We have also built a portfolio of organic beers, beers with a low content of alcohol and soft drinks with reduced/no sugar. This matches con-sumers’ focus on health and moderation.
Our endeavors to meet consumer demands have resulted in a larger, broader and more dynamic portfolio of high-quality beverages.
Consumer trends – searching for the good life
“It is key to us to have in-depth knowledge about consumer preferences – and to turn this knowledge into a high-quality, innovative portfolio of beverages within the different drinking categories.”
14ConSUMeR tRendS – SeARCHInG FoR tHe Good LIFe MANAGEMENT REPORTROYAL UNIBREW ANNUAL REPORT 2018

In all of our markets, we have a long tradi-tion for being close to consumers. We actively strive to be part of social life and good expe-riences.
The closeness to our consumers is a natural element of the local rooting of a large number of our products – and of our persistent efforts to build a solid platform for our ongoing inno-vation and product launches.
We involve and touch consumers in numerous different ways and through different channels – at concerts and festivals, at sports events, at tasting events and not least through the social media where we are continuously increasing our presence and communicating with our consumers in new ways. Often, we cooperate with our customers and business partners to create the best possible drinking occasions and experiences for the consumers. Flow Festival Finland
For a number of years, we have been a part of the Flow Festival, a leading European mu-sic and arts boutique festival, taking place in a historic power plant area in the capital of Finland, Helsinki. Beyond the music, Flow offers an exceptional array of world spanning cuisine – and beverages. Over the years, we have offered a still broader brand portfolio to the festival guests – matching the changes in composition of the festival and its many guests.
Closeness to consumers
The Anarkist brew pubIn 2018, we opened the Anarkist brew pub, which is a part of the micro-brewery in Odense, Denmark. The pub is a lab for the wonderful and amazing world of beer and food. At the pub, our craft brewers are pas-sionate about exploring new flavor territories, and we enjoy to invite other talented brewers onboard in our processes and development. The opening of the pub has been a success, and we will dynamically develop our facilities to host relevant beer and music events.
Royal ArenaRoyal Arena is a modern multifunctional arena located just a few kilometers from the Copen-hagen city centre. Since the opening in 2016, the arena has hosted a wide range of events featuring the biggest Danish and international artists, musicals, and TV shows as well as in-ternational sporting events. Our Royal brand is not only a fantastic match to the Arena, the quality of our brands pay a fitting tribute to the soul and pride of Danish culture and its strive for the best.
15CLoSeneSS to ConSUMeRS MANAGEMENT REPORTROYAL UNIBREW ANNUAL REPORT 2018

We consider digitalization an integrated part of our continuous work with efficien-cy improvement across Royal Unibrew. In a still more complex business environment, it is pivotal to keep working smarter and at the same time increase the quality of our processes. Therefore, for us digitalization is mainly about developing tools to create better experiences for our consumers, to strengthen customer relations, to optimize our supply chain management and to sup-port innovation.
Our work on digitalization progresses well in all parts of our business and we foresee an acceleration in the coming years.
New CRM and e-contract platformOur digital journey really began to gain mo-mentum in 2017 with the project “Mission No Paper”. The project has included a number of initiatives. We have introduced a.o. a new CRM system and an e-contract system. These sys-tems are already paying off leading to more effective meeting planning, more professional customer meetings, more effective identifica-tion and onboarding of new customers and better insight into commercial activities. In addition, all contracts are placed in the CRM system, giving us a better overview, higher degree of standardization and a more effi-cient follow-up on contracts. All in all, the new modern systems provide us with better
tools to partner up with our customers and to develop business activities – to the bene-fit of both customers, consumers and Royal Unibrew.
Gradually roll-out of e-commerceTo improve our service to customers we are also gradually developing our Busi-ness-to-Business e-commerce platform. Initially, the platform was launched in Fin-land, and will eventually be implemented in other markets. With the e-commerce plat-form in place we can service our customers
Digitalization with our customers is gaining momentum
simultaneously via our call-centre, our field sales-staff or directly on-line.
Craft Makers Collective – a new webshopTo meet consumers’ demand for inspiration and easy access to interesting, high-quali-ty products we are searching for intelligent ways to offer web-based solutions. One of the latest initiatives is the web shop Craft Makers Collective established by Royal Unibrew and Nordic Spirits in collabora-tion. However, the Craft Makers Collective is also a cooperation with many passionate
craft makers in Denmark and abroad – all offering their products in the web shop with the aim to spread knowledge of craft bev-erages through inspiring personal stories and carefully selected products. In the web shop we aim to guide, inform and inspire consumers – under the headline “Constantly Staying Relevant”.
The initiative reflects our belief in the value of cooperation among like-minded people and businesses – all working dedicated to bring the best to the consumers.
16dIGItALIzAtIon WItH oUR CUStoMeRS IS GAInInG MoMentUM MANAGEMENT REPORTROYAL UNIBREW ANNUAL REPORT 2018

EBIT-margin
2014 2015 2016 2017 2018
13.6% 15.2% 15.8% 16.7% 18.4%
NIBD / EBITDA
2014 2015 2016 2017 2018
1.4 1.0 0.8 0.7 1.5
Equity ratio
2014 2015 2016 2017 2018
40% 43% 48% 42% 36%
Dividend
2014 2015 2016 2017 2018
60% 56% 56% 56% 53%
18-19%
<2,5times
At least
30%
40-60%of consolidated
profit for the year
Financial targets, capital structure and distribution policy
Royal Unibrew currently publishes targets for EBIT margin, indebtedness and distribution policy. The ca-pability of achieving the financial targets is conditional on continuous business development through focus on growth opportunities, partnerships, innovation, sales and marketing, and on continuous efficiency measures. The positive development in recent years has enabled us to increase our EBIT margin target and to make consider-able distributions to our shareholders. Our EBIT margin target is increased from about 17% to a 18-19% range, whereas the capital structure and dividend targets are maintained.
EBIT marginBecause of continued strong momentum in our business and following the acquisition of four businesses with growth and earnings potential, we increase our EBIT margin target from about 17% to a 18-19% range for the coming years. The target increase should be seen in light of a.o. the planned development of our product portfolio and our expectation to generate synergies and obtain additional operational effi-ciency in connection with the acquisitions. The EBIT margin target of 18-19% is considered ambitious when comparing to the margins of international and regional beverage providers in Europe.
IndebtednessIt is Royal Unibrew’s objective to maintain its indebtedness at a level, which reflects our aim for flexibility with respect to acting on business opportunities and maintaining solid relationships with the Group’s bankers, while also ensuring that Royal Unibrew is not heavily over-capitalized.
It remains the target that net interest-bearing debt should not exceed 2.5 times EBITDA and that an equity ratio of at least 30% should be maintained at year-end. Royal Unibrew may depart from the targeted ratios for a certain period if structural business opportunities arise.
Royal Unibrew’s annual investments including operational leasing (IFRS 16 implemented in 2018) are expected to be just below 5% of net revenue.
Distribution policyRoyal Unibrew is expected to be able to generate a rather sig-nificant liquidity surplus going forward; it therefore remains the intention currently to make distributions to shareholders through a combination of dividend and share buy-backs taking into account the targets for the equity ratio and indebtedness, annual earnings and cash flows as well as Royal Unibrew’s strategic position in general.
It remains Royal Unibrew’s intention to distribute ordinary dividend of 40-60% of consolidated profit for the year and to launch share buy-back programs when it is considered appro-priate in order to optimise the Company’s capital structure. It is generally the intention that shares bought back will be cancelled.
17FInAnCIAL tARGetS, CAPItAL StRUCtURe And dIStRIBUtIon PoLICY MANAGEMENT REPORTROYAL UNIBREW ANNUAL REPORT 2018

Outlook for 2019
The outlook for Royal Unibrew’s financial development in 2019 has been prepared taking into account a number of circumstances, including how the Company’s markets are expected to be affected by general economic activity, fiscal developments and consumer sentiment. Moreover, specific assumptions relating to the development in ma-terial expense categories as well as the effect of initia-tives completed and initiated are taken into account.
The Board of Directors has decided to initiate as soon as possible a share buy-back program of up to DKK 400 million covering the period until end October 2019. The Board of Directors will recommend to the AGM in 2019 a distribution of ordinary dividend of DKK 10.80 per share. Hence, DKK 950 million is expected to be distributed based on the Financial Statements for 2018. With this distribution of a total of DKK 950 million we maintain our strategic flexibility.
Assumptions about markets and main priorities for 2019The markets in which Royal Unibrew offers a broad beverage portfolio are generally expected to see a small decline in total demand in 2019 as the extraordinary good summer weather
increased consumption of beverages in 2018. Our efforts to defend and expand Royal Unibrew’s market positions and to further strengthen customer partnerships will continue through focus on innovation and value management. At the same time, our broad beverage portfolio supports the pos-sibilities of obtaining continued operational efficiency at all organizational levels. Our targeted efforts to create further improvements will be a core priority, including our efforts directed at investment-driven initiatives, which will contribute towards achieving both efficiency and commercial improve-ments. Generally, Royal Unibrew’s market shares on branded products are expected to be maintained or solidified.
We expect two key consumer trends to continue in 2019: On the one hand, consumers focus on more healthy or functional products and on the other hand on more authentic, local and indulgence-oriented products. For certain product categories we see the two trends melting together creating even stronger propositions. We expect growth in e.g. low and non alcoholic beer, waters and non-sugar carbonated soft drinks, and as for the functional products we expect to see growth in enhanced products, including energy drinks. For the craft/artisanal,
local and indulgence products we see growth opportunities for brands such as e.g. Lorina, Terme di Crodo, Nohrlund, Kissmeyer, Aura and Lahden Erikois as they all connect to special drinking occasions where you prefer to serve products that really make people feel good.
Overall, in the multi beverage markets we will continue our efforts to create value across categories, a.o. through our price/pack strategies that focus on consumers’ drinking and shopping occasions. For parts of our product range we see opportunities for improving the distribution in selected channels.
In the niche markets, which cover Italy, France and Interna-tional, we continue to focus on increasing our presence in already established markets. We highly emphasize to estab-lish and retain our relationships and partnerships through consumer- and customer-oriented marketing investments with a view to strengthen our brand positions. For our newly acquired businesses we will focus on increasing the distribu-tion and activation, while optimizing our price/pack strategies to secure value and premiumization of our offerings.
OUTLOOK FOR 2019
mDKK Outlook 2019 Actual 2018 Actual 2017
Net revenue 7,400-7,650 7.298 6,384
EBIT 1,340-1,465 1,339 1,069
18oUtLook FoR 2019 MANAGEMENT REPORTROYAL UNIBREW ANNUAL REPORT 2018

Financial assumptions
• 2018 was positively affected by very good summer weather in North Europe, which lead to a higher EBIT of between DKK 70 and 90 million net of higher com-mercial spending. Our 2019 outlook is based on normal weather and thereby a normalized level of net revenue and EBIT.
• Net selling prices are assumed to be slightly increasing during 2019 as a result of higher input prices, which, however, will be reflected in selling prices on an average basis. Our efforts to improve the product mix will contin-ue unchanged with focus on all product categories and channels.
• While the acquisitions of Lorina and CULT are expected to affect net revenue positively, the planned and expect-ed closing down of the production of certain of Cam-pari’s products will affect revenue negatively. In total, we expect a positive effect of about DKK 300 million.
• Generally, costs are expected to follow inflation in 2019. Commercial costs are expected to increase in con-nection with growth initiatives and investments in the existing business, while our assumption of a normal summer will lead to adjusted commercial spending.
• We will continue our focus on generating continuous improvements and enhancing efficiency across the business and in all entities.
• Royal Unibrew has entered into hedging agreements for a large part of the expected consumption of key raw and packaging materials for 2019.
• Exchange rates between DKK and other currencies are expected to remain unchanged as compared to the end of February 2019.
• Gross investments, including operating leases (IFRS 16 implemented already in 2018) are expected to stay around 4.7% of net revenue.
• Corporate income tax rate is expected to amount to about 22.5% of profit before tax excluding income after tax from investments in associates. DKK 36 million of the deferred tax is expected to be due for payment in 2019.
TOTAL DISTRIBUTION FOR THE YEAR
mDKK 2014 2015 2016 2017 2018
Dividend - 374 386 426 451
Share buy-back - 293 443 508 484
Total distribution - 667 829 934 935
as a % of prior year consolidated profit - 107 117 119 113
19oUtLook FoR 2019 MANAGEMENT REPORTROYAL UNIBREW ANNUAL REPORT 2018

Performance
RoYAL UnIBReW ANNUAL REPORT 2018 20PeRFoRMAnCe MANAGEMENT REPORT

40004500500055006000650070007500
Q1 Q2 Q3 Q4 Q1 Q2 Q3 Q42017 2018
15.015.516.016.517.017.518.018.5
Financial review
RUNNING 12-MONTH DEVELOPMENT (mDKK) (%)
Net revenue EBIT margin
Royal Unibrew achieved its best results ever in 2018 re-flecting the good momentum in the business and a strong execution. Our earnings guidance was increased several times during the year due to solid organic development, three acquisitions completed in the course of the year as well as a historically warm summer in Northern Europe, which contributed to increased consumption of bever-ages. Many innovative initiatives across the business reinforced Royal Unibrew’s position and contributed to the good result. Royal Unibrew generally increased its market shares slightly based on market share gains in second half 2018.
Business development Royal Unibrew generally increased its market shares in 2018. The volumes sold increased 9%, while the net revenue showed a 14% increase. The highest net revenue growth was achieved in the Western Europe and the International segments, in which net revenue increased by 19% and 22% respectively on 2017. The positive development in the two segments is partly due to the acquisitions of Terme di Crodo, Etablissement Geyer Frères (Lorina) and Nohrlund. Organically (excluding the acquisitions) volumes and net revenue increased in all segments due to
investment in a number of commercial initiatives and a strong execution. In total, volumes increased organically by 3% and the net revenue by 9%.
In 2018, Royal Unibrew improved its earnings compared to last year. Besides the good summer weather and the acquisitions, earnings were positively affected by the outcome of signifi-cant higher and focused investments in sales and marketing among others to sustain the “share-of-voice” and to support the commercial agenda across products and sales channels. Furthermore, an improved product mix contributed to the higher earnings. Exchange rate developments only affected earnings to a limited extent as purchases were mainly made in the Group’s revenue currencies.
Earnings before interest and tax (EBIT) amounted to DKK 1,339 million, which is DKK 270 million above the 2017 figure. EBIT increased in all segments compared to 2017, and the acquisi-tions contributed positively. The profit before tax amounting to DKK 1,328 million for 2018 was DKK 272 million above the 2017 figure. Free cash flow for 2018 as well as for Q4 was as expected negatively impacted of approx DKK 100 million from ending of the high campaign activity in Finland and amounted to DKK 942
AS COMPARED TO THE OUTLOOKS ANNOUNCED DURING 2018, ACTUAL NET REVENUE, EBITDA AND EBIT WERE AS FOLLOWS:
Actual Outlook Outlook Outlook Outlook Outlook mDKK 2018 November 2018 August 2018 July 2018 June 2018 March 2018
Net revenue 7,298 7,200-7,300 7,000-7,200 6,900-7,100 6,800-7,000 6,650-6,900
EBITDA 1,673 1,660-1,685 1,625-1,675 1,560-1,635 1,550-1,625 1,450-1,550
EBIT 1,339 1,315-1,340 1,275-1,325 1,200-1,275 1,190-1,265 1,090-1,190
million compared to DKK 950 million for 2017. In 2018, dividend distribution and share buy-backs totaling DKK 935 million were made, while net interest-bearing debt increased by DKK 1,547 million to DKK 2,522 million primarily due to the completed acquisitions. The NIBD/EBITDA debt multiple increased from 0.7 to 1.5 in 2018.
AcquisitionsOn 2 January 2018, the acquisition of the Italian soft drink busi-ness Terme di Crodo was closed. Terme di Crodo owns the brands LemonSoda, OranSoda, PelmoSoda, Crodo Lisiel and Crodo Chinotto as well as production facilities in Crodo in the north-western part of Italy. On 14 June 2018, a majority interest of the Danish company, Nohrlund ApS, which produces and sells ready-made organic cocktails, was acquired, and on 12 July 2018, the French company, Etablissement Geyer Frères, which produces and owns the brands Lorina, PureThé and InFreshhh was acquired. The aquisition of Bev.Con ApS was concluded 28 February 2019 and includes brands like CULT Energ, MOKAÏ and SHAKER. For further information on the
21FInAnCIAL ReVIeW MANAGEMENT REPORTROYAL UNIBREW ANNUAL REPORT 2018

2014 2015 2016 2017 2018700800900
10001100120013001400
1213141516171819
2014 2015 2016 2017 2018300500700900
1100130015001700
1617181920212223
EBIT AND EBIT MARGIN (mDKK) (%)
EBIT EBIT margin
EBITDA AND EBITDA MARGIN (mDKK) (%)
EBITDA EBITDA margin
acquisitions we refer to page 13 under Strategy and targets, to page 27 re the performance in the Western Europe segment and to the Consolidated Financial Statements, note 25, page 104.
Status on share buy-back programOn 6 March 2018, we launched a share buy-back program car-ried out in accordance with the “Safe Harbour” method for the period to 22 February 2019 with a view to adjusting the capital structure of Royal Unibrew A/S. The share buy-back program was completed in January 2019 at which time Royal Unibrew had bought back 867,562 shares representing a total market value of DKK 400 million. At 31 December 2018, Royal Unibrew had bought back 1,119,910 shares representing a market value of DKK 484 million under this program and under the program initiated in 2017 and held a total of 923,397 treasury shares, corresponding to 1.8% of the share capital. As resolved at the Annual General Meeting of Royal Unibrew in April 2018, the capital was reduced by DKK 3.4 million in 2018 and 1,700,000 shares were cancelled. As of today, Royal Unibrew holds 993,509 treasury shares, 90,500 of which are expected to be used for share-based payments to the Executive Board in the period 2017-2020, whereas 900,000 of the remaining shares are ex-pected to be cancelled following the Annual General Meeting of the Company in April 2019.
Income statementVolumes for 2018 aggregated 10.8 million hectolitres of beer, malt beverages and soft drinks, which is approx 9% above the 2017 figure. The development from 2017 to 2018 was positively affected by solid organic growth, the acquisitions in 2018 and the extraordinarily good weather in Northern Europe, but nega-tively affected by a lower campaign activity in Finland. Volumes related to the acquisitions aggregated 0.6 million hectolitres.
Net revenue for 2018 showed a 14% increase and amounted to DKK 7,298 million (beverages accounting for DKK 7,189 mil-lion) compared to DKK 6,384 million (beverages accounting for DKK 6,293 million) in 2017. The acquisitions contributed a 5% net revenue increase (Q4: 6%), whereas the main part of the remaining increase was due to solid organic growth, including the effect from product and market mix and the extraordinarily good weather. Net revenue for Q4 2018 was 10% above the figure for the corresponding period of 2017, whereas average net selling price per volume unit was 6% higher.
Gross profit for 2018 was DKK 527 million above the 2017 fig-ure and amounted to DKK 3,827 million. Gross margin was 0.7 percentage point above the 2017 margin and represented 52.4% compared to 51.7% in 2017. Gross profit per volume unit
DEVELOPMENTS IN ACTIVITIES FOR 2018 BROKEN DOWN ON MARKET SEGMENTS
Western Baltic Inter- Unallo- Group Group Europe Sea national* cated 2018 2017
Volume (thousand hectolitres) 4,536 5,441 828 - 10,805 9,912Growth (%) 16.8 1.6 17.3 9.0 -7.7Share of sales (%) 42 50 8 - Net revenue (mDKK) 3,378 3,338 582 - 7,298 6,384Growth (%) 19.4 8.5 21.5 14.3 0.7Share of net revenue (%) 46 46 8 - EBIT (mDKK) 645 599 127 -32 1,339 1,069EBIT margin (%) 19.1 18.0 21.9 18.4 16.7
* The Malt Beverages and Export segment has been renamed to International
22FInAnCIAL ReVIeW MANAGEMENT REPORTROYAL UNIBREW ANNUAL REPORT 2018

2014 2015 2016 2017 2018500800
110014001700200023002600
0.00.40.81.21.62.02.42.8
2014 2015 2016 2017 20183300
4300
5300
6300
7300
NIBD AND NIBD/EBITDA (mDKK) (times)
NET REVENUE (mDKK)
NIBD NIBD/EBITDA
was higher than in 2017 and positively affected by the changed product and market mix. Measured as an average per volume unit, net selling prices increased by 6.3%, while production costs increased by 3%.
Sales and distribution expenses for 2018 were DKK 211 million above the 2017 figure and amounted to DKK 2,167 million com-pared to DKK 1,956 million in 2017. As planned, both sales and marketing expenses for 2018 were significantly higher due to a number of growth initiatives and increased support of the estab-lished business in order to sustain “share-of-voice” levels. DKK 50 million of the higher expenses relates to the acquisitions.
Administrative expenses for 2018 were DKK 45 million above the 2017 figure, DKK 20 million of which related to the acquisi-tions, and amounted to DKK 320 million compared to DKK 275 million in 2017. The organic development is due to employee incentives, the impact from implementing IFRS 16 (lease) and costs related to the acquisitions.
Earnings before interest, tax, depreciation and amortization (EBITDA) for 2018 showed a DKK 311 million increase and amounted to DKK 1,673 million compared to DKK 1,362 million in 2017. The higher organic driven earnings are primarily at-tributable to the Western Europe and Baltic Sea segments. The implementation of IFRS 16 (leases) increased EBITDA by approx DKK 60 million as, under IFRS 16, certain lease payments are no longer included in the income statement as operating expenses, but as interest on and repayments of lease obligations. Due to depreciation of leased assets, EBIT is only marginally affected by IFRS 16. EBIT amounted to DKK 1,339 million, which is DKK 270 million above the 2017 figure. As in the case of EBITDA, the improvement is primarily attributable to the Western Europe and Baltic Sea segments. EBITDA for Q4 2018 amounted to DKK 330 million, which was DKK 56 million above the figure for the corresponding period of 2017.
The EBIT margin increased by 1.7 percentage point from 16.7% to 18.4%. The improved product mix, operational leverage and
the extraordinarily good summer weather in Northern Europe were the primary reasons for the higher EBIT margin. The EBIT margin for 2018 was higher in the Baltic Sea segment, whereas it was, as expected, marginally lower than in 2017 in the Western Europe and International segments due to average lower mar-gins on the acquired soft drink products than on beer products. The EBIT margin for Q4 2018 showed a 1.1 percentage points increase on the corresponding period of 2017.
Net financials for 2018 were DKK 2 million lower than in 2017 aggregating a net expense of DKK 11 million. Interest expenses were DKK 31 million and at the same level as in 2017, while income after tax from investments in associates aggregated an income of DKK 20 million, DKK 2 million above the income in 2017.
Profit before tax for 2018 showed a DKK 272 million increase amounting to DKK 1,328 million compared to DKK 1,056 million for 2017.
Tax on the profit for 2018 was an expense of DKK 288 million, which is as expected and corresponds to a tax rate of 22% on the profit excluding income after tax from investments in as-sociates.
Net profit for the year amounted to DKK 1,040 million, which is a DKK 209 million improvement on the net profit of DKK 831 million realized for 2017.
The Parent Company’s profit for the year amounted to DKK 899 million compared to DKK 834 million for 2017. Dividend income from subsidiaries and associates amounted to DKK 379 million compared to DKK 382 million for 2017.
Balance sheetRoyal Unibrew’s balance sheet at 31 December 2018 amounted to DKK 8,062 million, which is DKK 1,284 million above the fig-ure at 31 December 2017. DKK 1,245 million of the increase is attributable to the acquisitions and adopting of IFRS 16 (leases),
23FInAnCIAL ReVIeW MANAGEMENT REPORTROYAL UNIBREW ANNUAL REPORT 2018

while the balance sheet organically increased approx DKK 40 million, primarily related to inventories and receivables.
Invested capital increased by DKK 1.8 billion in 2018, DKK 1.3 billion of which was related to the acquisitions. ROIC excluding goodwill increased by one percentage point to 33%. ROIC in-cluding goodwill was 21 % and unchanged from 2017 although EBIT relating to two of the acquisitions has not been recognized in the full 12-month period.
Compared to 2017 the equity ratio decreased by six percentage points representing 36% at 31 December 2018. The acquisitions cause a decrease of 14 percentage point. Equity at the end of 2018 amounted to DKK 2,908 million compared to DKK 2,814 million at the end of 2017. The DKK 94 million increase com-prised the positive comprehensive income for the year of DKK 1,037 million (2017: DKK 829 million) added the value of share-based payments to the Executive Board of DKK 8 million (2016: DKK 6 million) and tax of DKK 3 million (2017: DKK 2 million) related thereto, and deducted distribution to shareholders of DKK 935 million (2017: DKK 934 million) by way of dividend and share buy-backs. Moreover, the equity was reduced by DKK 19 million related to minority shareholders. The comprehensive income comprises the profit for the period of DKK 1,040 million plus DKK 10 million exchange rate adjustments of foreign group enterprises and less a negative development of DKK 13 million in the value after tax of hedging instruments.
Net interest-bearing debt was increased by DKK 1,547 million in 2018 and amounted to DKK 2,522 million at 31 December 2018 compared to DKK 975 million at the end of 2017. The increase in net interest-bearing debt was as expected and comprised the positive free cash flow of DKK 942 million less distribu-tion to shareholders of DKK 935 million by way of dividend and share buy-backs, the acquisition price of DKK 1,349 million paid for the acquired activities as well as the lease obligation at 1 January 2018 of DKK 205 million relating to leases due to the implementation of IFRS 16. The net interest-bearing debt
to EBITDA ratio was 1.5. Net interest-bearing debt is expected to increase by approx DKK 350 million due to the acquisition of CULT completed 28 February 2019.
Funds tied up in working capital showed a negative DKK 748 million (2017: negative DKK 957 million) at the end of 2018. Thus, funds tied up in working capital increased as expected by net DKK 209 million (2017: reduced by DKK 76 million). Funds tied up in inventories, trade receivables and trade payables increased by DKK 225 million (2017: decreased DKK 123 mil-lion) of which approx DKK 100 million relate to ending the high campaign activity in Finland in Q3 and DKK 40 million relate to acquisitions, whereas the other elements of working capital decreased by DKK 16 million (2017: increased DKK 47 million).
Cash flow statement Cash flows from operating activities for 2018 were DKK 46 mil-lion above the 2017 figure and amounted to DKK 1,214 million (2017: DKK 1,168 million). Cash flows comprised the profit for the period adjusted for non-cash operating items of DKK 1,681 million (2017: DKK 1,367 million), negative working capital cash flow of DKK 185 million (2017: positive DKK 76 million), net interest paid of DKK 31 million (2017: DKK 29 million) and taxes paid of DKK 251 million (2017: DKK 246 million).
Free cash flow for 2018 amounted to DKK 942 million (2017: DKK 950 million) and was below that for 2017 due to the expect-ed increase in working capital following the completion in Q3 of the high campaign activity in Finland. Cash flows from oper-ating activities and dividend from associates increased by DKK 41 million, and investments in property, plant and equipment showed a net increase of DKK 49 million on 2017. As planned, gross investments were higher than those of 2017 and amount-ed to DKK 321 million compared to DKK 254 million for 2017. Free cash flow for Q4 2018 was DKK -92 million (2017: DKK 239 million) and thus DKK 331 million below the 2017 figure, where the negative effect primarily steams from the closure of the high beer campaign activity in Finland and the summer.
24FInAnCIAL ReVIeW MANAGEMENT REPORTROYAL UNIBREW ANNUAL REPORT 2018

2016400
450
500
550
600
650
700
2014 2015 2017 2018 201617.0
17.5
18.0
18.5
19.0
19.5
20.0
2014 2015 2017 20182014 2015 2016 2017 20182800
3100
3400
3700
4000
4300
4600
20161800
2100
2400
2700
3000
3300
3600
2014 2015 2017 2018
Western Europe
EBIT (mDKK)
EBIT-MARGIN (%)
VOLUMES t.HL
NET REVENUE (mDKK)
WESTERN EUROPE
2018 2017 2018 2017 Q1-Q4 Q1-Q4 % changes Q4 Q4 % changes
Volume (thousand hectoliters) 4,536 3,852 18 1,062 900 18
Net revenue, beverages (mDKK) 3,269 2,738 19 757 629 20
Net revenue (mDKK)) 3,378 2,829 19 789 656 20
EBIT (mDKK) 645 563 119 114
EBIT margin (%) 19.1 19.9 15.0 17.5
Development in 2018
In Western Europe, total volumes showed a 18% increase for 2018.
Net revenue from beverages was 19% higher than in 2017, and the average net selling price per volume unit remained unchanged in spite of dilution from acquisitions. A changed product and sales channel mix affected net selling prices pos-itively in Denmark and Germany, while the soft drink portfolio in Italy affected negatively.
Earnings before interest and tax (EBIT) for 2018 showed a DKK 82 million increase from DKK 563 million in 2017 to DKK 645 million in 2018. The EBIT increase was due to a strengthening of the market position as well as a favorable development of the product mix in Denmark and Germany. The EBIT margin decreased by 0.8 percentage points to 19.1%, caused by a negative mix effect from the companies acquired during the year.
The Western Europe segment comprises the markets Denmark and Germany, as well as Italy and France. Western Europe accounted for 46% of the Group’s net revenue for 2018 and for 47% of allocated EBIT (2017: 44% and 51%, respectively).
• 19% net revenue increase on solid baseline development, acquisitions and extraordinarily good weather
• Market share growth in Denmark and Germany
• Launch of a number of new craft and specialty products
• Integration of the Italian soft drinks business Terme di Crodo progressed as planned
• Acquisition of the French lemonade business Etablissements Geyer Frères (Lorina)
• Acquisition of a majority interest in Nohrlund ApS
25FInAnCIAL ReVIeW MANAGEMENT REPORTRoYAL UnIBReW ANNUAL REPORT 2018

Denmark and Germany Profile
Royal Unibrew is the second largest provider of beer and soft drinks to Danish consumers; furthermore, Faxe beer is sold to the German consumers.
We offer a combination of strong local, national and in-ternational beer brands. Royal Beer, Schiøtz, Lottrup, Kissmeyer, Anarkist and the international license brand Heineken are offered to all Danish consumers, whereas our other brands, such as Albani, Ceres and Thor, are primarily offered in areas with strong local connection/heritage.
Within soft drinks, we offer our own brands as well as license-based brands of PepsiCo. Our own brands com-prise Faxe Kondi, which is the leading brand in the lem-on/lime segment, and Nikoline. The portfolio includes Pepsi, Pepsi Max, 7UP, Mountain Dew and Mirinda. With-in spring water and natural mineral water, Egekilde is a leading Danish brand, which is offered in a number of taste varieties, still as well as sparkling. Moreover, we offer the Faxe Kondi Booster energy drink as well as a number of cider, ready-to-drink and shots products under the Tempt brand.
Our beverage offer is supplemented by a selection of strong PepsiCo snack brands - and products.
Royal Unibrew has two production facilities in Denmark – one in Faxe and one in Odense, which also include the Anarkist Beer and Food Lab and Craft brewery.
Both Off-Trade and On-Trade channel customers are served with an industry Best in Class direct delivery operation.
Development in 2018
For Denmark and Germany, it is estimated that the under-lying Danish consumption of branded beer and soft drinks remained unchanged in 2018 adjusting for the positive effect in the peak season due to the extraordinarily good summer weather in 2018 – which had a very positive impact on all categories, particularly on the non-alcoholic segment.
Royal Unibrew’s volumes showed a 5% increase for 2018. It is estimated that Royal Unibrew increased its market shares across categories, due to, among other factors, focus on value creation by matching consumer demands for more special-ised, organic and healthy products. PepsiCo snack products sales developed as planned, contributing an additional 1% net revenue increase.
In 2018, Royal Unibrew carried out a wide range of commer-cial activities in Denmark both on the product side and the event side. These activities played an important role in pre-senting and positioning a broader portfolio of beverages. In 2018, Royal Unibrew opened its first brewpub, Anarkist Beer & Food Lab, which is a part of the micro-brewery in Odense, Denmark. The brewery and the brewpub are essential for our
development and marketing of craft and specialty beers. As health and wellness play an increasingly more important role we continue to develop the organic and low/non-alcoholic portfolio. During the year, we added the Royal Organic 2.3% Let Pilsner to the organic Royal portfolio, and Pepsi Max Lime was successfully introduced into the market in the non-sugar soft drink category. Furthermore, Royal Unibrew announced a strategic alliance with Nohrlund, through an acquisition of 50,5% of the company, with focus on selling organic cocktails. As previous years, Royal Unibrew took part in a large number of events, including the Skanderborg festival, Tivoli concerts and events in the Royal Arena – creating great attention to Royal Unibrew products.
DENMARK AND GERMANY
2018 2017 2018 2017 Q1-Q4 Q1-Q4 % changes Q4 Q4 % changes
Volume (thousand hectoliters) 3,596 3,441 5 857 822 4
Net revenue, beverages (mDKK) 2,381 2,162 10 562 518 9
Net revenue (mDKK)) 2,490 2,253 11 594 545 9
26denMARk And GeRMAnY MANAGEMENT REPORTROYAL UNIBREW ANNUAL REPORT 2018

Southern Europe Profile
ITALYCeres Strong Ale is among the market leaders in the super-pre-mium beer segment, and Royal Unibrew holds a considerable market share in this segment. We also offer Ceres Red Erik in the super-premium segment, Nørden and Polar Monkey in the craft and specialty beer segment as well as lager type Ceres Top Pilsner and Faxe in the premium segment.
LemonSoda from Terme di Crodo is sold in a niche part of the soft drinks segment. Moreover, we offer the products OranSoda, PelmoSoda, TonicSoda, Crodo Lisiel and Crodo Chinotto.
The Italian beer market is supplied through exports from our Danish breweries, whereas the soft drinks market is supplied from Terme di Crodo’s production facilities in Italy.
FRANCELorina artisanal French lemonade is market leading in the growing lemonade category which generates growing interest of its authentic roots with consumers, not only in France.
Lorina also offers brands as PureThé and InFreshhh – with a focus on organic, artisanal products.
Products are produced at the production facilities in Munster in the North-Eastern part of France.
Development in 2018
Southern Europe comprises Italy, the Lorina business in France and the Terme di Crodo business in the Balkan countries. The acquisition of the Italian soft drink business Terme di Crodo was completed in January 2018, whereas the acquisition of Etablissement Geyer Frères, which markets the unique artisanal French lemonade brand Lorina, was completed during July 2018.
The market environment in Southern Europe has been chal-lenging with increased Italian consumer cautiousness and poor weather compared to last year, whereas, the business in France was positively impacted by good weather.
Royal Unibrew’s volumes for 2018 showed a 129% increase on 2017, whereas net revenue showed a 54% increase. The selling price per volume unit was lower than in 2017 due to lower price per volume for the acquired soft drink portfolios compared to the product portfolio in 2017 consisting of only beer products.
In Italy our business received a major boost with the Terme di Crodo and Ceres integration that comprises of two of the top 10 "must have" SKUs for a wholesale governed marketplace.
SOUTHERN EUROPE
2018 2017 2018 2017 Q1-Q4 Q1-Q4 % changes Q4 Q4 % changes
Volume (thousand hectoliters) 940 411 129 205 78 163
Net revenue (mDKK) 888 576 54 195 111 76
Tracking on the brands and commercial performances, we see continuous improvements, which add additional value to consumers and customers. During the year, we introduced, among other things, new packaging formats as well as new products such as TonicSoda.
In France, the integration of the Lorina business into Royal Unibrew whilst preserving its strong and proud local artisanal edge, goes according to plan. We are re-setting some impor-tant routines, focusing on customer continuity and identifying opportunities to better, every day. The Supply Chain offers identified potential for efficiencies and priorities have been set accordingly.
27SoUtHeRn eURoPe MANAGEMENT REPORTROYAL UNIBREW ANNUAL REPORT 2018
20163700
4000
4300
4600
4900
5200
5500
2014 2015 2017 2018 20161500
1800
2100
2400
2700
3000
3300
2014 2015 2017 2018 2016300
350
400
450
500
550
600
2014 2015 2017 2018 20169.0
10.5
12.0
13.5
15.0
16.5
18.0
2014 2015 2017 2018
Baltic Sea
VOLUMES t.HL
NET REVENUE (mDKK)
EBIT (mDKK)
EBIT-MARGIN (%)
Baltic Sea
BALTIC SEA
2018 2017 2018 2017 Q1-Q4 Q1-Q4 % changes Q4 Q4 % changes
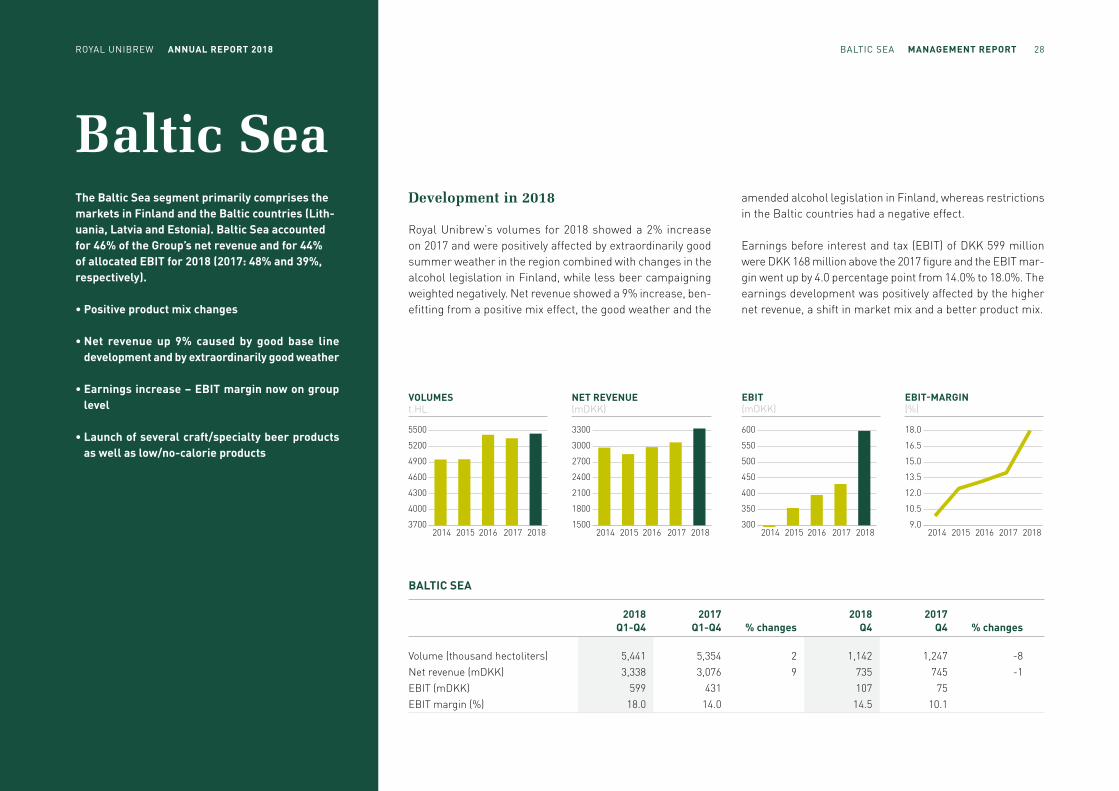
Volume (thousand hectoliters) 5,441 5,354 2 1,142 1,247 -8
Net revenue (mDKK) 3,338 3,076 9 735 745 -1
EBIT (mDKK) 599 431 107 75
EBIT margin (%) 18.0 14.0 14.5 10.1
Development in 2018
Royal Unibrew’s volumes for 2018 showed a 2% increase on 2017 and were positively affected by extraordinarily good summer weather in the region combined with changes in the alcohol legislation in Finland, while less beer campaigning weighted negatively. Net revenue showed a 9% increase, ben-efitting from a positive mix effect, the good weather and the
amended alcohol legislation in Finland, whereas restrictions in the Baltic countries had a negative effect.
Earnings before interest and tax (EBIT) of DKK 599 million were DKK 168 million above the 2017 figure and the EBIT mar-gin went up by 4.0 percentage point from 14.0% to 18.0%. The earnings development was positively affected by the higher net revenue, a shift in market mix and a better product mix.
The Baltic Sea segment primarily comprises the markets in Finland and the Baltic countries (Lith-uania, Latvia and Estonia). Baltic Sea accounted for 46% of the Group’s net revenue and for 44% of allocated EBIT for 2018 (2017: 48% and 39%, respectively).
• Positive product mix changes
• Net revenue up 9% caused by good base line development and by extraordinarily good weather
• Earnings increase – EBIT margin now on group level
• Launch of several craft/specialty beer products as well as low/no-calorie products
28BALtIC SeA MANAGEMENT REPORTRoYAL UnIBReW ANNUAL REPORT 2018

Finland Profile
Hartwall is a beverage provider with a broad product range holding a clear runner-up position in Finland. In the Finnish beer and soft drinks market, we offer a com-bination of our own strong local and national brands and international brands as well as a number of international spirits and wine brands.
In the beer segment, we offer our own brands such as Karjala, Lapin Kulta, Aura, Lahden Erikois and Polar Monkey (specialty beer) as well as the international port-folio from Heineken. Moreover, we offer a number of al-coholic products rooted in Finland such as Original Long Drink in the RTD category as well as Upcider and Happy Joe in the cider category. In the CSD category, we offer our own brands such as Jaffa, ED within energy drinks, Novelle in the mineral water category and international brands from the PepsiCo product portfolio. Hartwall offers a number of international spirits and wine brands such as Johnny Walker, Captain Morgan, Lanson, Baileys and JP. Chenet on an agency basis.
Hartwall has two production facilities in Finland – one in Lahti producing all products but mineral water, and one in Karijoki producing mineral water. A craft/special-ty beer brewery was established adjacent to the Lahti brewery in 2017.
A highly effective and efficient national distribution net-work serves our customers with Best in Class service levels.
Other key focus areas have been increased involvement and communication with consumers, including introducing new Novelle marketing platform that better resonates to the con-sumers, as well as large events as the Flow Festival support-ing this agenda. One of the biggest activations introduced in 2018 was the introduction of a new event “Greyest Day of the Year” to the Finnish consumers build around Original Long Drink.
Development in 2018
The Finnish market for beer, soft drinks, wine and spirits products was positively affected by extraordinarily good sum-mer weather and the amended alcohol legislation with effect from 1 January 2018, while less beer campaigning affected negatively. According to the new legislation, retail businesses are now allowed to sell certain products that only the Alko monopoly was previously allowed to sell.
Volumes for 2018 showed a 1% increase and were positively impacted by a higher market share within branded products, but negatively impacted by lower beer campaign sales than in 2017. Net revenue for 2018 showed a 10% increase, ben-efitting from a positive mix effect due to legislative changes, significantly intensified marketing investment and the warm summer.
In 2018, Hartwall maintained a high level of innovation in order to continuously being able to offer the strongest product port-folio in the market based on trends demanded by consumers and customers. Focus has been on specialty beer brands as Aura and Lahden Erikois, and soft drinks products with lower or no sugar content as the new Jaffa sugar fee.
FINLAND
2018 2017 2018 2017 Q1-Q4 Q1-Q4 % changes Q4 Q4 % changes
Volume (thousand hectoliters) 3,113 3,094 1 623 719 -13
Net revenue (mDKK) 2,612 2,380 10 574 587 -2
29FInLAnd MANAGEMENT REPORTROYAL UNIBREW ANNUAL REPORT 2018

The Baltic countries Profile
Royal Unibrew is a significant beverage provider in the Baltic countries, and we offer a combination of own strong national brands as well as international Heineken and PepsiCo brands.
Our brewery business Kalnapilio-Tauro Grupe is the sec-ond largest in Lithuania with the national beer brands Kalnapilis and Taurus, the Vilkmerges craft beer brand as well as Faxe and Heineken as international brands. In the soft drinks category, our offerings comprise Cido, which is the second largest fruit juice brand, PepsiCo products and Kalnapilis Norte in waters.
The Cido Grupa in Latvia is the second largest beverage provider in Latvia. We offer a complete portfolio of fruit juice products under the Cido brand, mineral water un-der the Mangali brand and nectar drinks under the Fruts brand as well as PepsiCo soft drinks. Our beer offerings comprise the national beer brands Lacplesa Alus and Livu Alus, the Lielvardes craft beer brand as well as Heineken as an international brand.
The primary brands in Estonia are Cido and Pepsi in the soft drinks category as well as Meistriti Gildi, Faxe and Heineken in the beer category.
Royal Unibrew has two production facilities in the Baltic countries – one in Lithuania producing beer, and in Latvia one producing soft drinks.
Sales are made business-to-business, and distribution is made directly to the individual Off-Trade and On-Trade customers from own terminals.
Development in 2018
The Baltic market continued to be volatile in 2018. Beer consumption declined as alcoholic beverage sales in both Latvia and Lithuania were negatively affected by legislative changes such as increased excise duties, advertising ban and packaging restrictions. Beer consumption is estimated to have shown a decline of about 6% in 2018 and Royal Unibrew is estimated to have maintained its market shares in beer, whereas it is estimated that we have gained market shares in the non-alcoholic segment.
Royal Unibrew’s volumes increased by 3% in 2018. As expect-ed, soft drinks sales increased, whereas total beer products sales decreased as a consequence of the declining beer consumption. Net revenue showed a 4% increase and was positively affected by the development in craft and specialty beer sales as well as soft drinks sales. Net revenue per volume unit for 2018 improved 1% to 2017 due to a changed product and packaging mix.
Many new products were launched during 2018 in both Lith-uania and Latvia, focusing on the craft/specialty beer seg-ment and the non-alcoholic beer and radlers assortment. An example of the new innovative products is the Kalnapilis
Lite Radler. In the soft drinks segment, we have seen very good performance from a mix of products from the PepsiCo portfolio supplemented by local brand flavors. On the event side in Latvia, Royal Unibrew refreshed over 50,000 enthused consumers during the Positivus Festival – a festival present-ing a large number of artists from the Baltic.
BALTIC COUNTRIES
2018 2017 2018 2017 Q1-Q4 Q1-Q4 % changes Q4 Q4 % changes
Volume (thousand hectoliters) 2,328 2,260 3 519 528 -2
Net revenue (mDKK) 726 696 4 161 158 2
30tHe BALtIC CoUntRIeS MANAGEMENT REPORTROYAL UNIBREW ANNUAL REPORT 2018

International Inter- national The International segment (renamed from Malt Beverages and Exports) comprises the export and license business to international markets outside Denmark, Finland, Italy, France and the Baltic countries. Sales outside Italy, the Balkan countries and France from the businesses Terme di Crodo and Lorina are included in the segment. International accounted for 8% of the Group’s net revenue and for 9% of allocated EBIT for 2018 (2017: 8% and 10%, respectively).
• Net revenue supported by brands from new acquisitions
• Focus on strengthening presence in core markets
• Net revenue and earnings negatively affected by exchange rate development
• Continued high EBIT margin
RoYAL UnIBReW ANNUAL REPORT 2018 31InteRnAtIonAL MANAGEMENT REPORT

201620.0
20.5
21.0
21.5
22.0
22.5
23.0
2014 2015 2017 2018
20160
150
300
450
600
750
900
2014 2015 2017 2018
201660
75
90
105
120
135
150
2014 2015 2017 2018
2016300
350
400
450
500
550
600
2014 2015 2017 2018
VOLUMES t.HL
EBIT (mDKK)
EBIT-MARGIN (%)
NET REVENUE (mDKK)
Development in 2018
Volumes for 2018 showed a 17% increase and net revenue increased by 22%. The positive development is partly due to Terme di Crodo being new in this segment as well as products from the Lorina portfolio. Furthermore, the revenue increase was supported by growth in North America as well as Africa, whereas, the sugar tax and the Brexit process caused headwind for the UK organisation. Exchange rate developments affected net revenue negatively by approx DKK 13 million in 2018. Net revenue per volume unit was unchanged compared to 2017.
Sales in the segment are characterised by large volumes be-ing exported to distributors at a time, meaning that inventory changes should be taken into account when comparing peri-ods. It is estimated that distributors’ organic sales to custom-ers increased by a high single-digit percentage in 2018. Dis-tributors’ sales to consumers correspond to Royal Unibrew’s deliveries for the year as a whole, but with market differences. The shortage of ”hard currency” continues to present a chal-lenge, especially in the African continent.
Earnings before interest and tax (EBIT) for 2018 amounted to DKK 127 million, which is DKK 21 million above the 2017 figure. Exchange rate developments affected EBIT negatively by approx DKK 9 million. The EBIT margin for 2018 was 21.9%, and adjusted for the negative exchange rate effect, the margin was 22.9% compared to 22.2% for 2017.
INTERNATIONAL
2018 2017 2018 2017 Q1-Q4 Q1-Q4 % changes Q4 Q4 % changes
Volume (thousand hectoliters) 828 706 17 200 166 20
Net revenue (mDKK) 582 479 22 150 114 32
EBIT (mDKK) 127 106 29 26
EBIT margin (%) 21.9 22.2 19.5 22.8
Profile
The business area International comprises the export and license business to international markets outside Denmark, Finland, Italy, France and the Baltic countries. From 2018, sales outside Italy, the Balkan countries and France from the newly acquired businesses Terme di Crodo and Lorina have been included in the segment. The business is relating to non-alcoholic malt beverag-es, beer under the Faxe brand as well as the new soft drink products from Lorina and Terme di Crodo.
The key market areas for our malt beverages and Faxe exports are countries in the Americas and Africa as well as, in the case of malt beverages, among ethnic groups from these areas living in and around major cities in Eu-rope and the US. We have several internationally strong dark malt beverage brands, which are sold in the premi-um segment. Vitamalt is assessed to be the malt brand with the broadest global distribution, whereas Supermalt and Powermalt hold strong regional positions.
The key market areas for the soft drinks from Terme de Crodo and the Lorina craft lemonade are Central Europe and the Americas.
The International markets are primarily supplied by ex-ports from our Danish breweries, but also in certain cases on the basis of license agreements with local breweries, whereas, Terme di Crodo and Lorina prod-ucts are delivered from the factories in Italy and France.
The sales organisation, which to a large extent is locat-ed in the individual markets, cooperates closely with our distribution partners on commercial priorities and marketing initiatives.
32InteRnAtIonAL MANAGEMENT REPORTROYAL UNIBREW ANNUAL REPORT 2018

Governance
RoYAL UnIBReW ANNUAL REPORT 2018 33GoVeRnAnCe MANAGEMENT REPORT

Shareholder information
Royal Unibrew wants an open dialogue with its share-holders and wants to keep them continuously up-to-date on the Company’s development. Therefore, Royal Uni-brew emphazises providing timely and adequate infor-mation on its objectives and strategy, business activities, the development in the Company’s markets as well as the financial results.
DEVELOPMENT IN ROYAL UNIBREW’S SHARE CAPITAL
DKK ‘000 2018 2017 2016 2015 2014
Share capital 1/1 105,400 108,200 110,985 110,985 110,985
Capital reduction -3,400 -2,800 -2,785
Capital increase
Share capital 31/12 102,000 105,400 108,200 110,985 110,985
Share informationThe Royal Unibrew share is listed on Nasdaq Copenhagen A/S, and Royal Unibrew is included in the LargeCap index and since June 2018 also in the C25 index.
In 2018, a total of 40,978,928 (2017: 28,440,762) shares were traded, corresponding to 80% (2017: 54%) of the total number of shares traded (at year end), through Nasdaq Copenhagen A/S (source: Bloomberg). The trading value amounted to DKK 18,858 million (2017: DKK 8.831 million) representing a 114% increase.
At the end of 2018, the price of the Royal Unibrew share was 449.0 compared to 371.8 per share of DKK 2 at the end of 2017. Royal Unibrew’s market capitalization amounted to DKK 22,899 million at the end of 2018 compared to DKK 19,594 million at the end of 2017. Each share carries one vote, and all shareholders registered in the Company’s register of share-holders are entitled to vote.
The Board of Directors has been authorized to increase the Company’s share capital on one or several occasions by up to a total nominal amount of DKK 10,000,000 in the period up to and including 23 April 2023.
BASIC INFORMATION
Share capital, DKK 102,000,000
Number of shares 51,000,000
Denomination DKK2
Number of share classes 1
Restriction of voting right None
Place of listing Nasdaq Copenhagen A/S
Short name RBREW
ISIN code DK0060634707
Bloomberg code RBREW DC
Reuter code RBREW.CO
Index LargeCap
Change of controlThe realization of a takeover bid resulting in change of control of the Company will entitle a few trading partners and lenders to terminate trading agreements made. For a description of agreements with Company Management, reference is made to the section Remuneration.
Treasury shares in 2018At the AGM on 27 April 2017, the Board of Directors was authorized to acquire treasury shares for up to 10% of the total share capital in the period up until the AGM on 24 April 2018, at which a new authorization was granted for the period until the AGM in 2023.
On 6 March 2018, the Board of Directors initiated a share buy-back program of a maximum market value of DKK 400 million and for a term to 22 February 2019. At 31 December 2018, Royal Unibrew had bought back 797.450 shares representing a market value of DKK 367 million, and in 2019 additionally 70,112 shares have been bought back representing a market value of DKK 33 million. Thus, the initiated share buy-back program, which has been carried out in accordance with the “Safe Harbour” method, has been completed.
Royal Unibrew has in 2018 bought back a total of 1,119,910 shares at a market value of DKK 484 million, and at 31 De-cember held 923.397 treasury shares of a nominal value of DKK 2 each, corresponding to 1.8% of the Company’s share capital, 90,500 of which are for the purpose of covering the incentive program offered to the Executive Board. In 2018, 1,700,000 shares were cancelled. The total number of shares of the Company is 51,000,000, including treasury shares.
34SHAReHoLdeR InFoRMAtIon MANAGEMENT REPORTROYAL UNIBREW ANNUAL REPORT 2018

51%
35%
2%
12%
Foreign Investors
Danish Investors
Not registered Danish and foreign investors
Royal Unibrew
2017
2018
40
45
12
3
OwnershipAt the end of 2018, Royal Unibrew had approx 18,600 registered shareholders holding together 81% of the total share capital.
According to the latest Company Announcements or other public announcements, the following shareholders hold more than 5% of the share capital:
Shareholder End of February 2019
Chr. Augustinus Fabrikker A/S, 15.02%
Denmark
(reported on 22 September 2017)
BlackRock, Inc. 5.02%
USA
(reported on 10 January 2019)
Members of the Board of Directors and the Executive Board are governed by Royal Unibrew’s insider rules, and their share transactions as well as those of their connected persons are subject to a notification requirement according to the Market Abuse Regulation. Individuals on Royal Unibrew’s insider lists as well as their spouses and children below the age of 18 may trade Royal Unibrew shares only when the Board of Directors has announced that the window for trading shares is open (and provided that they do not have inside information). This normally applies for a period of four weeks following an an-nouncement of financial results.
At 31 December 2018, board members held 20,940 shares of the Company, and members of the Executive Board held 234,464 shares, corresponding to a total of 0.5% of the share capital.
AGMThe Company’s AGM will be held on 25 April 2019, at 5 pm at Odense Congress Center in Odense.
The AGM will be convened electronically, and information on the registration for electronic communication is provided at Royal Unibrew’s website www.royalunibrew.com under “Investor”.
Registration of shareholder’s name is effected by contacting the bank holding the shares in safe custody.
Board of Directors’ resolutions and proposed resolutions for the AGM The Board of Directors will propose:• that the AGM authorizes the Board of Directors to
acquire shares for treasury corresponding to up to 10% of the share capital, such authorization being in force for the period up until the next AGM
• that the AGM authorizes the Board of Directors to increase the Company's share capital on one or several occasions by up to a total nominal amount of DKK 20 million in the period through 29 April 2023
• the distribution of dividend of DKK 10.80 per share of DKK 2 for the 2018 financial year as well as the cancellation of 900,000 of the shares bought back in 2016 and 2017
• the election of two new candidates to the Board of Directors:
Heidi Kleinbach-Sauter German American, a.o. BSc, MSc and PhD in Food Science
and Food Technology. More than 25 years of international experience within R&D and QM. Latest employment as Sen-ior Vice President of Global R&D at PepsiCo.
Catharina Stackelberg-Hammarén Finnish, MSc in Economics. CEO & Founder of Marketing
Clinic, consultancy in strategy and performance marketing. Prior to Marketing Clinic, various leadership positions at The Coca-Cola Company in the Nordic and Baltic regions.
BREAK-DOWN OF SHAREHOLDERS AT THE END OF 2018
DIVIDEND DATES FOR 2019
25 April 2019 Resolution at AGM
25 April 2019 Last trading date with right to dividend for 2018
26 April 2019 First trading date without right to dividend for 2018
30 April 2019 Distribution of dividend
Investor relations activitiesRoyal Unibrew aims at ensuring open and timely information to its shareholders and other stakeholders.
A number of activities are carried out continuously to ensure good contacts with the Company’s stakeholders. In 2018, among other things, Royal Unibrew held three audio casts in connection with the publication of the Annual Report 2017 as well as the H1 Report and Q3 Report 2018.
Moreover, Royal Unibrew holds analyst and investor meetings in both Denmark and abroad in connection with the pub-lication of Interim and Annual Reports. In total about 230 individual meetings were held with investors in 2018.
35SHAReHoLdeR InFoRMAtIon MANAGEMENT REPORTROYAL UNIBREW ANNUAL REPORT 2018

40
70
100
130
160
jan feb mar apr may jun jul aug sep okt nov dec
Royal Unibrew OMX C 25 Peer group
Royal Unibrew OMX C25 Peer group
FINANCIAL CALENDAR FOR 2019
25 April 2019 Interim Report for the period
1 January - 31 March 2018
25 April 2019 Annual General Meeting at
Odense Congress Center in Odense
27 August 2019 Interim Report for the period
1 January - 30 June 2018
13 November 2019 Interim Report for the period
1 January - 30 September 2018
SHARE PERFORMANCE 2018 (index)
Note: The peer group consists of Anheuser-Busch InBev, Carlsberg, Heineken, Molson Coors Brewing Company, Britvic, Olvi and AG Barr (Source: Bloomberg)
SHARE RATIOS
Per share of DKK 2 – DKK 2018 2017 2016 2015 2014
Parent Company shareholders’ share of earnings per share 20.6 16.0 14.7 13.0 11.3Parent Company shareholders’ diluted share of earnings per share 20.6 16.0 14.6 12.9 11.2Free cash flow per share 18.5 22.5 19.2 18.9 14.9Year-end price per share 449.0 371.80 272.6 280.1 217.4Dividend per share 10.80 8.90 8.15 7.20 6.80
Number of shares 51,000,000 52,700,000 54,100,000 55,492,500 55,492,500
The share denomination was changed from DKK 10 to DKK 2 in 2015. Comparative figures for 2014 are stated per share of DKK 2.
IR CONTACT IN 2018, ROYAL UNIBREW PARTICIPATED IN
• SEB Nordic Seminar in Copenhagen
• SEB Nordic Market Day in New York
• SEB Northern European Conference in Boston
• Handelsbanken’s Nordic Mid/Small Cap Seminar in Stockholm
• Deutsche Bank’s Access Global Consumer Conference in Paris
• J.P. Morgan Pan-European Small/Mid Cap Conference in London
• Bryan, Garnier & Co. 4th Consumer, Brands & Retail Conference in Paris
• Danske Bank’s Copenhagen Winter Seminar in Copenhagen
Audio casts and presentations from audio casts and seminars are accessible at Royal Unibrew’s website, www.royalunibrew.com under ”Investor”.
THE ROYAL UNIBREW SHARE IS FOLLOWED BY:
Company Analyst
ABG Sundal Collier Michael Vitfell-Rasmussen
Bryan, Garnier & Co Nikolaas Faes
Carnegie Lars Topholm
Danske Bank Jonas Guldborg Hansen
Deutsche Bank Constantin Hesse
Handelsbanken Karri Rinta
Jefferies Elsa Hannar
Kepler Cheuvreux Richard Withagen
Nordea Bank Hans Gregersen
SEB Enskilda Søren Samsøe
ContactsLars Jensen, CFO(responsible for IR)[email protected]
Stine Felten(daily IR contact)[email protected] +45 29 23 04 93
Shareholders, analysts, investors, stockbrokers and other stakeholders who have questions concerning Royal Unibrew may contact:
Royal Unibrew A/SFaxe Alle 1DK-4640 Faxe
36SHAReHoLdeR InFoRMAtIon MANAGEMENT REPORTROYAL UNIBREW ANNUAL REPORT 2018

Corporate governance
Royal Unibrew has focus on running its business and designing its management systems in accordance with the updated Recommendations for Corporate Governance of 23 November 2017. The objective is to ensure that Royal Unibrew meets its obligations to shareholders, customers, employees, authorities and other stakeholders in the best possible way and that long-term value creation is pursued.
The recommendations of the Committee on Corporate Gov-ernance, current legislation and regulation in the area, best practice and internal rules provide the framework for Royal Unibrew’s corporate governance in a transparent and respon-sible fashion.
Royal Unibrew complies with the Corporate Governance Rec-ommendations with two exceptions as described below.
Royal Unibrew’s website http://investor.royalunibrew.com/corporate-governance provides a detailed description of the Board of Directors’ approach to the Corporate Governance Recommendations issued by the Committee on Corporate Governance.
DiversityA statement is made in accordance with section 99 b of the Danish Financial Statements Act.
Royal Unibrew aims to promote diversity from a conviction that diversity leads to cohesion. This includes an equitable representation of both genders, both within the Board of Di-rectors as well as in our respective Management Teams and our workforce in general. This is based on a wish to strengthen
Royal Unibrew complies with the Corporate Governance Recommendations issued by the Committee on Corporate Governance with two exceptions:
Disclosure of the remuneration policy (recommenda-tion 4.2):The Committee recommends that the total remuneration granted to each member of the Board of Directors and the Executive Board by the company and other compa-nies in the group, including information on the most im-portant contents of retention and retirement/resignation schemes, be disclosed in the annual report and that the linkage with the remuneration policy be explained. Fur-ther, it is recommended to disclose a remuneration report on the company’s website.
The remuneration of members of the Board of Directors is disclosed in the section ”Remuneration”. Disclosure of the remuneration of the individual members of the Executive Board is not at present considered material to stakeholders’ assessment. For detailed information on the Remuneration Policy of the Board of Directors and the Executive Management, we refer to pages 43 and 44 of this Annual Report as well as Note 5. The remuneration of the Executive Board is considered in line with that of peer companies. The remuneration of the Executive Board is in accordance with the remuneration policy.
Whistleblower scheme (recommendation 5.2):The Committee recommends the Board of Directors to establish a whistleblower scheme for expedient and con-fidential notification of possible or suspected wrong doing.
As part of Royal Unibrew’s Ethics Policy, employees have been given the opportunity to report violations or suspi-cion of violations confidentially to the Legal Department.
the versatility and total competences of the business and to improve decision-making processes.
The international management team of Royal Unibrew – a total of 120 leaders – comprises 69% (2017: 70%) men and 31% (2017: 30%) women. Our target is a more balanced gender representation of at least 40% of each gender. When recruiting new executives, we prioritize identifying candidates of both genders without discrimination and see to encourage female candidates’ interest in taking on managerial tasks.
Currently, the Board of Directors consists of three male Board members elected by the Denmark based employees and seven Board members elected by the Annual General Meeting. Five of those are Danish, two are non-Danish. It is the intend to nominate two selected female, non-Danish Board members during our upcoming Annual General Meeting on 25 April 2019 in order to enhance our Board of Directors forum with qualified talent and more diverse expertise. Hemming Van, who has served our Board of Directors since 2004 with great energy and commitment, has decided not to run for re-election during our 2019 AGM and hence will leave our Board of Directors at that occasion.
We aim for the Board of Directors to consist of expert members who should, to the widest extent possible, complement each other in terms of age, background, nationality, gender, etc. with a view to ensuring a competent and versatile contribution to the board duties at Royal Unibrew. These matters are assessed when the Nomination and Remuneration Committee identifies new candidates for the Board of Directors, and it is an objective of the committee to identify both male and female candidates.
37CoRPoRAte GoVeRnAnCe MANAGEMENT REPORTROYAL UNIBREW ANNUAL REPORT 2018

However, recommendation of candidates will always be based on an assessment of the individual candidates’ competences and how they match Royal Unibrew’s needs and contribute to the overall efficiency of the Board.
Shareholder and stakeholder relationsRoyal Unibrew’s Management wants and works actively to maintain good and transparent communication and dialogue with its shareholders and other stakeholders. The Company believes that a high level of transparency in the communication of information on the Company’s development supports the Company’s work and a fair valuation of the Company’s shares. The Group‘s openness is limited only by the duties of disclosure of Nasdaq Copenhagen A/S and by competitive considerations.
The dialogue with and communication to shareholders and other stakeholders take place by the issuing of Annual and In-terim Reports and other announcements communicated by the Company via audio casts, meetings with investors, analysts and the press. Annual and Interim Reports and other announce-ments are available at Royal Unibrew’s website immediately after being published. Our website also includes material used in connection with investor presentations and audio casts.
According to the Articles of Association of the Company, Gen-eral Meetings shall be convened not more than five weeks and not less than three weeks prior to the General Meeting. It is an objective to formulate the notice convening the meeting and the agenda and to give shareholders an adequate presentation of the business to be transacted at the General Meeting. Proxies are limited to a specific General Meeting and are formulated also to allow absent shareholders to give specific proxies for individual items of the agenda – either to the Board of Directors or to a person attending the General Meeting. All documents relating to General Meetings are published at Royal Unibrew’s website.
Each share of a nominal value of DKK 2 entitles the holder to one vote. Royal Unibrew’s shares are not subject to any restrictions of voting rights, and the Company has only one class of shares.
All shareholders may submit proposals for resolutions to the Board of Directors to be considered at the Annual General Meeting; such proposals for resolutions are to be received by the Board of Directors no later than six weeks prior to the date of the Annual General Meeting.
Board of DirectorsThe Board of Directors oversees the company's overall strategy and supervises the organizational, financial and performance management of the Company as well as continuously evaluates the work performed by the Executive Board on behalf of the shareholders.
The Board of Directors performs its tasks in accordance with the Rules of Procedure of the Company governing the Board of Directors and the Executive Board. These Rules of Proce-dure are reviewed and updated regularly by the full Board of Directors.
The Board of Directors usually meets for six annual ordinary board meetings, of which at least one focuses on the Compa-ny’s strategy and prospects and one takes place in a market in which the Company operates. In addition, the Board members meet when required. In 2018, nine board meetings were held and the following absentees were noted:
Ingrid Jonasson Blank 1 time absent
Hemming Van 1 time absent
The Board of Directors has established the following com-mittees:
Nomination and Remuneration CommitteeThe committee consists of the Chairman and the Deputy Chair-man of the Board of Directors. In 2018, the primary activities of the committee were the preparation of the annual evaluation of the Board of Directors, the selection and nomination of po-tential new candidates for the Board of Directors, the overall succession planning of the Board of Directors and the Exec-utive Board as well as the assessment and recommendation of remuneration of the Board of Directors and the Executive Board. The committee held nine meetings in 2018.
Audit CommitteeUntil August 2018, the collective Board of Directors had under-taken the Audit Committee tasks jointly. This should be viewed in light of the Company’s size and complexity until then. In the light of the growth of the company and in the context of increas-ing demands on reporting, governance and compliance, it was decided to install an Audit Committee. Hence, Royal Unibrew now complies with recommendation 3.4 from the Committee on Corporate Governance. The committee consists of a Chair-man (Lars Vestergaard) and a member (Christian Sagild). It is the Audit Committee's objective to secure quality and integrity in the Company’s presentation of Financial Statements, audit and financial reporting. Further, the Audit Committee monitors accounting and reporting processes, the audit of the Compa-ny’s financial reporting, risk issues and the external auditor’s performance and independence.
Moreover, the Audit Committee will assess and recommend to the Board of Directors re-election of external auditors. The external auditor has participated in three meetings of the Board of Directors in connection with the Board of Directors’ performance of Audit Committee tasks. The committee held one meeting in 2018.
38CoRPoRAte GoVeRnAnCe MANAGEMENT REPORTROYAL UNIBREW ANNUAL REPORT 2018

Evaluation of the work of the Board of DirectorsEvaluation of the work of the Board of Directors takes place annually. The evaluation focuses on ensuring that the Board of Directors (as a body) has expertise and experience within Fast Moving Consumer Goods (FMCG), production, sales and marketing of brands globally and in business-to-business mar-kets, strategic and general management and within economic, financial and capital market issues including those relating to listed companies. The evaluation is facilitated by the Chair-man of the Board of Directors. For this purpose, the Chairman receives written replies to a questionnaire distributed to all members of the Board. The findings of the evaluation are pre-sented and discussed at a meeting of the Board of Directors.
Going forward, the Board of Directors has decided to have an external consultant involved in the evaluation at least every third year.
Both the performance of the Executive Board and the cooper-ation between the Board of Directors and the Executive Board are evaluated annually as a minimum.
Composition of the Board of DirectorsWhen composing the Board of Directors, we emphasize that the members have the competences required. The Board of Directors assesses its composition annually, ensuring that the combined competences and diversity of the members match the Group’s activities.
Candidates for the Board of Directors are recommended for election by the General Meeting supported by motivation in writing by the Board of Directors as well as a description of the recruiting criteria. The individual members’ competences and credentials are described in the below section on the Board of Directors and the Executive Board. In the section above on the Board of Directors’ resolutions and proposed resolutions for the AGM is a description of the qualifications relating to the two candidates for the Board of Directors that will be proposed for election by the Annual General Meeting. During the year 2018 an exceptional five new Board members were elected, two thereof by the Denmark based employees and three were elected by the shareholders during the 2018 Annual General Meeting. Upon their election, the new Board members are introduced to the company through a focused program.
At present, the Board of Directors consists of seven members elected by the General Meeting and three members elected by the employees. Election of members by the employees takes place in compliance with the company law rules described at the Company’s website. When joining the Board of Directors, the members elected by the employees are offered relevant training in serving on a board.
ROYAL UNIBREW ANNUAL REPORT 2018 39CoRPoRAte GoVeRnAnCe MANAGEMENT REPORT

Risk management
Risk management plays a key role at Royal Unibrew, and it is Management’s aim that the Group’s risks should be adequately disclosed at all times. Policies and proce-dures have been determined to ensure efficient man-agement, to the widest extent possible, of the identified risks.
At Royal Unibrew risk management is an integrated part of the operational activities with a view to reducing the uncer-tainty of the Group’s strategic objectives being met.
The key risks related to Royal Unibrew’s activities are sum-marized by the following main areas:
• Market risks• Industry and partnership• Exposure hazard and third-party risks• Financial risks (currency, interest rates, liquidity, credit
and commodity risk)
A detailed description of the Company’s financial risks is provided in note 2.
Risk management structureRoyal Unibrew’s risk management structure is based on a systematic process of risk identification, risk analysis and risk assessment. This structure provides a detailed overview of the key risks relating to the realization of strategies in the short and long term and enables the taking of required measures to address the risks.
The overall risk management structure is outlined below.
RISK MANAGEMENT STRUCTURE
BOARD OF DIRECTORSApproves the
overall risk policy and reviews the findings reported by the executive
Board.
AUDIT COMMITTEEMonitors the development in the total strategic
risk exposures and the individual risk factors and verifies compliance with the overall risk policy.
EXECUTIVE BOARDdetermines risk management policies and strategies
for the individual risks and ensures implementation of these.
ensures consistency between the risk management policy and the business objectives.
Monitors risk management and the development in key risks.
ensures that adequate resources are available to implement efficient risk management.
STAFF FUNCTIONS AND BUSINESS UNITSIdentify, assess, quantify and record risks.
Make suggestions for addressing risks.
Monitor risk management activities initiated.
Report regularly to the executive Board.
40RISk MAnAGeMent MANAGEMENT REPORTROYAL UNIBREW ANNUAL REPORT 2018

Key risk factors in 2019 In addition to financial risks, the following risk factors are considered key risks in 2019:
Area Description Risk mitigation
Commodity prices
The prices of a large number of key commodities fluctuate in line with world market prices. To the extent that higher unit cost cannot be compensated for by higher selling prices per unit or in other ways increasing the average selling price per unit correspondingly, Royal Unibrew’s earnings will decrease. In order to maintain EBIT margin, selling prices per unit must increase more than the unit cost increase.
Royal Unibrew monitors the trend in commodity prices hedging against short-term price increases through agreements with suppliers and through commodity hedges if considered essential and economical. The Group’s policy for hedging commodity risks involves a smooth and time-differentiated effect of commodity price increases. Moreover, there is systematic focus throughout the Group on streamlining the production and distribution process and on increasing net selling prices per unit.
Industry In most markets, the product category beer and soft drinks is characterized by tough price competition and intensive marketing from a number of suppliers. At the same time, continuous consolidation is seen among customers who handle the distribution of products to consumers and are to an increasing extent also centralizing internal distribution and product range decisions. Furthermore, Royal Unibrew’s market area is characterized by considerable industry concentration on the supplier side.
Royal Unibrew’s earnings and competitiveness are ensured through constant focus on markets and segments in which Royal Unibrew holds or may achieve a significant position. Moreover, the Company focuses on value management through the development of products, containers and packaging, cooperation with customers and communication with consumers.
The efforts directed at continuous improvements across the business will contribute towards limiting the negative effect of industry concentration.
IT risks Royal Unibrew’s activities are to a large extent dependent on the use of the established IT systems and IT security. A prolonged breakdown, unintended maloperation or an unauthorized break-in into the systems supporting sales and supply processes as well as internal information systems may involve a significant risk of interruption of Royal Unibrew’s activities.
Royal Unibrew has established procedures to ensure:
• day-to-day operation of the IT systems supporting the key business processes, • protection against data loss,• protection against unauthorized access to and distribution of confidential data,• general protection against cybercrime.
Macro-economicuncertainty
Royal Unibrew’s product portfolio is sold in markets and market areas where market developments are usually determined by long-cycle trends. Macroeconomic uncertainty and low growth of long duration may affect earnings negatively. This could happen due to declining consumption or shifts in product mix towards products with lower earnings.
By focusing on flexibility in its action plans, Royal Unibrew is seeking to secure leeway for reducing the effect of macroeconomic uncertainty and changes to consumption patterns.
The efforts directed at continuous improvements across the business will contribute towards limiting the negative effect of macroeconomic changes.
Partnership Royal Unibrew cooperate with different partners in each of the product categories. Changes to the relationship may affect the Group’s sales and net revenue, and thus earnings.
Royal Unibrew have a long history with our partners and mitigate the risk by having long term agreements and deliver adequate business results.
Statutory restrictions
Royal Unibrew’s activities are subject to national legislation in the markets in which Royal Unibrew op-erates. Any legislative changes may impact the ability to operate, e.g. by way of restrictions in respect of the sale, marketing and production of Royal Unibrew’s products or due to increasing consumption taxes. Such restrictions may affect the Group’s sales and earnings significantly.
Royal Unibrew participates in local and international cooperation fora within the brewery industry with a view to influencing legislative decision makers to ensure that conditions for producing and marketing beer and soft drinks do not deteriorate, and that consumption taxes are applied in a balanced manner.
Weather Usually, the consumption of Royal Unibrew’s products is high in the summer months. However, this presupposes dry and fair weather. In the summer months of 2018, the weather in Royal Unibrew’s markets in Northern Europe was exceptionally good, which was favorable to the consumption of beer and soft drinks. This affected the Group’s sales and net revenue, and thus earnings, positively.
Through focus on flexibility of action plans, Royal Unibrew aims at securing leeway to respond to lower earnings caused by unfavorable weather conditions in the summer months, and at the same time secure the agility to support the customers in years with favorable weather.
41RISk MAnAGeMent MANAGEMENT REPORTROYAL UNIBREW ANNUAL REPORT 2018
Risk management and management structureAt least once a year, the Board of Directors assesses the overall risk factors relating to Royal Unibrew’s activities. Risks are assessed under a two-dimensional “heat map” assess-ment system which estimates the significance of the risk in relation to EBITDA, damage to Royal Unibrew’s reputation, violation of legislation or environmental implications as well as the probability of the risk resulting in an incident. Based on this assessment, the existing ”heat map” is updated so as to reflect changes in the understanding of business risks. Following this registration of risks relating to Royal Unibrew’s activities, the risks which may materially impact the strategic objectives in the short and long term are identified.
Royal Unibrew’s Treasury and Group Accounting is respon-sible for facilitating and for continuously following up and reporting on risk-mitigating activities/action plans for the key risks in accordance with the decisions made by the Board of Directors and the Executive Board.
Risk assessment in 2018In 2018, Royal Unibrew’s Executive Board closely monitored the development in market-related risks and made the nec-essary changes to risk-mitigating activities to secure budg-eted earnings. Moreover, the organization has implemented procedure and guidelines to comply with the General Data Protection Regulation (GDPR) Centrally, the identified risks and proposed action plans were reviewed and assessed by the Company’s Executive Board, whereas, the Audit Commit-tee reviewed the adequacy and the effectiveness of the risk management system. Based on this, the Executive Board presented the key risks to the Board of Directors and rec-ommended the necessary risk-mitigating activities/action plans for approval. The Board of Directors then resolved to implement the necessary risk-mitigating measures with a view to ensuring optimum realization of Royal Unibrew’s stra-tegic objectives.
Control and risk management activities relating to the financial reporting process Royal Unibrew’s internal control and risk management sys-tems relating to the financial reporting process are described below.
Control activitiesRoyal Unibrew has established a formalized group report-ing process comprising monthly reporting, including budget follow-up, assessment of performance and achievement of established targets.
Moreover, a central corporate function is responsible for con-trolling the financial reporting from the subsidiaries, which also includes a statement from each reporting group entity in relation to compliance with adopted group policies and internal control measures. In 2018, controlling visits were paid to the key subsidiaries. In 2018, the Board of Directors has also assessed that establishment of an actual internal audit department is not required at this time considering the moderate complexity of the Group and the transparency of its reporting.
Information and communicationThe Board of Directors emphasizes the importance of the Group communicating openly, with due regard to the confi-dentiality required for listed companies, and of the individual knowing his/her role with respect to internal control.
The individual business areas of the Group have been es-tablished as business units with responsibility for their own strategies, action plans and budgets. This division results in efficient follow-up and distribution of responsibilities in the Group.
Royal Unibrew’s accounting manual as well as other reporting instructions are continuously updated and are available at Royal Unibrew’s intranet, where they can be accessed by all relevant employees. The instructions include account coding instructions and procedures for financial reconciliation and analyses, verifying the existence of assets as well as policy for credit granting and approval of fixed asset investments. The responsible finance officers of the group enterprises are informed in writing of changes. Moreover, internal update courses are organized for accounting staff.
Royal Unibrew’s information systems are designed with a view to continuously, with due regard to the confidentiality required for listed companies, identifying, capturing and com-municating at relevant levels relevant information, reports, etc which enable the individual to perform tasks and controls efficiently and reliably.
MonitoringMonitoring is affected by continuous assessments and con-trols at all group levels. The scope and frequency of the pe-riodic assessments depend primarily on a risk assessment and the efficiency of the continuous controls.
The auditors appointed by the general meeting report in the Auditor’s Long-form Report to the Board of Directors material weaknesses in the Group’s internal control systems in con-nection with the financial reporting process. Less material issues are reported in management letters to the Executive Board, after which the Executive Board informs the Board of Directors of the issues reported.
The Board of Directors meets three times annually with the auditors without the Executive Board attending.
42RISk MAnAGeMent MANAGEMENT REPORTROYAL UNIBREW ANNUAL REPORT 2018

RemunerationThe remuneration policy applying to Royal Unibrew’s Board of Directors and Executive Board has been de-signed to reflect shareholder and company interests. Moreover, the remuneration policy is intended to support the realization of the Company’s long-term objectives.
The following is a brief description of the elements of the re-muneration and severance programs as well as other benefits offered to the Board of Directors and the Executive Board.
The complete Remuneration Policy for the Board of Directors and the Executive Board is disclosed at the Company’s website at http://investor.royalunibrew.com/corporate-governance.
The Overall Guidelines for Incentive Pay adopted at the Com-pany’s Annual General Meeting are available at http://investor.royalunibrew.com/corporate-governance.
Board of Directors The remuneration of the Board of Directors is evaluated and benchmarked to ensure accommodation of the requirements relating to members’ competences, performance and scope of board work including the number of meetings.
The annual remuneration of the Board of Directors compris-es a fixed fee of DKK 300,000. The Chairman and the Deputy Chairman receive remuneration of 2.5 times (DKK 750,000) and 1.75 times (DKK 525,500) of the base fee. Further, the Chairmen and members of the committees receive remuneration of 50% and 33 % respectively of the base fee. The total remuneration of the Board of Directors in 2018 amounted to DKK 4.0 million.
The Board of Directors does not participate in any incentive programs.
The remuneration for the financial year in progress will be sub-mitted for approval at the company's Annual General Meeting in April 2019.
Executive Board The Board of Directors believes that a combination of fixed and performance-driven remuneration to the Executive Board will ensure that Royal Unibrew can attract and retain the right ex-ecutives. A partially incentive- based remuneration is designed to serve the short- and long-term objectives of the Company in a sustainable way.
The Executive Board members are employed on individual service contracts on terms decided by the Nomination and Remuneration Committee within the framework, see below.
The Nomination and Remuneration Committee assesses the Executive Board’s remuneration annually against relevant benchmarks.
The Executive Board is remunerated by a market-conform-ing and competitive remuneration package comprising four elements:
• Fixed salary based on market level• Ordinary bonus, cf. the overall guidelines for incentive pay• Long-term bonus, cf. the overall guidelines for incentive
pay• Extraordinary bonus, cf. the overall guidelines for incen-
tive pay.
As part of Royal Unibrew’s continued efforts to focus on value creation for the company's shareholders, the Executive Board was offered restricted (conditional) shares for no consideration as part of the long-term incentive plan in 2017. A restricted
share entitles the holder to receive one Royal Unibrew share of a nominal value of DKK 2 for no consideration. The number of shares depends on the extent to which the EBIT and free cash flow targets defined by the Board of Directors are achieved in the vesting period. The maximum number of restricted shares is expected to be approx. 90,500 shares, corresponding to a value of DKK 17 million for 64,200 restricted shares offered on 17 January 2017 and a value of DKK 10 million for 26,300 restricted shares offered on 6 March 2018.
For the vesting period 2017-2019 approx. 72,500 shares are expected to be granted upon publication of the Company’s 2019 Annual Report in March 2020. For the vesting period 2020 approx. 18,000 shares are expected to be granted upon pub-lication of the Company’s 2020 Annual Report in March 2021.
The total remuneration of the Executive Board amounted to DKK 23 million in 2018. See also note 5.
In addition, the Executive Board receives benefits such as company cars, phones etc. and is covered by Royal Unibrew’s insurance schemes e.g. accident and life insurance.
Royal Unibrew A/S may terminate the employment of a mem-ber of the Executive Board with 12 months’ written notice. However, during the period until 31 December 2019 the notice period of the CEO, Johannes F.C.M. Savonije, is extended to 24 months. Severance pay in the case of a termination by Royal Unibrew A/S cannot exceed 2 years’ remuneration in accord-ance with the remuneration policy.
In case of a full or partial takeover of Royal Unibrew A/S, the Executive Board will receive no compensation. However, a member of the Executive Board may choose to consider him-self dismissed in such event.
43ReMUneRAtIon MANAGEMENT REPORTROYAL UNIBREW ANNUAL REPORT 2018

REMUNERATION POLICY FOR THE EXECUTIVE BOARD
Remuneration component Purpose Level of granting Granting criteria
Fixed salary Attract and retain the right Executive Board members by offering a salary that reflects their competences and experience.
Must reflect the level of peer companies. Assessed annually based on individual responsibilities, qualifications and results.
Benefits Offer a competitive package that supports attraction and retention.
Benefits corresponding to market practice. N/A
Pension The Executive Board members make their own pension contributions.
N/A N/A
Ordinary bonus Ensure the achievement of Royal Unibrew’s short-term
targets.
May not exceed 60% of the fixed salary (gross salary). Bonus grants and their size depend on the achievement of targets agreed for one year at a time - primarily relating to Royal Unibrew’s budgeted targets and results, financial key figures or other measurable individual results.
Long-term bonus Ensure the achievement of Royal Unibrew’s long-term
targets.
For the period 2017-2019, the total number of restrict-ed shares is expected not to exceed 72,500 shares granted in connection with the publication of Royal Unibrew’s Annual Report for 2019 in March 2020. The number of shares will be adjusted in proportion to the dividend distribution in the vesting period.
For the period 2020, the total number of restricted shares is expected not to exceed 18,000 shares granted in connection with the publication of Royal Unibrew’s Annual Report for 2020 in March 2021. The number of shares will be adjusted in proportion to the dividend distribution in the vesting period.
The number of shares granted will be subject to the level of achievement in the vesting period of the EBIT and free cash flow targets determined by the Board of Directors for financial years 2017-2019 respectively 2020.
Extraordinary bonus Ensure the objectives of attracting and retaining key executives are met and secure shareholder value
May not exceed 100% of the fixed salary (gross salary), e.g. in the form of a retention bonus, loyalty bonus, restricted shares or bonus.
The bonus is granted to remunerate a special effort.
BOARD OF DIRECTORS REMUNERATION
Base fee, DKK ‘000 Additional fee, % of base fee
All members of the Board 300 Chairman of the Board 150%Deputy Chairman of the Board 75%Nomination- and remuneration committee and audit committee:Chairmen 50 %Members 33 %
44ReMUneRAtIon MANAGEMENT REPORTROYAL UNIBREW ANNUAL REPORT 2018

Board of Directors and Executive Board
Board of Directors
PositionProfessional board member in a number of enterprises
Special competencesSpecial expertise in general management with experi-ence from both Denmark and abroad as well as sales and marketing expertise, especial-ly in the business to business market
IndependenceConsidered independent
Chairman of the board of directorsSonion Holding A/SKartago Development ApS
Member of the board of directorsGerman High Street Properties A/S (GHSP)
Walther ThygesenChairman of the Board Chairman of the nomination and remuneration committee
PositionGroup CEO of Danish Crown
Special competencesSpecial expertise in general management of international enterprises within FMCG (Fast Moving Consumer Goods)
IndependenceConsidered independent
Member of the board of directorsFoss A/S
Jais ValeurDeputy Chairman of the Board Member of the nomination and remuneration committee
Martin AlsøElected by the employees
Einar Esbensen Nielsen Elected by the employees
PositionTerminal worker
PositionBusiness Unit Manager
45BoARd oF dIReCtoRS And exeCUtIVe BoARd MANAGEMENT REPORTROYAL UNIBREW ANNUAL REPORT 2018

Board of Directors (continued)
PositionProfessional board member in a number of enterprises, pri-marily in Finland and Sweden
Special competencesSpecial expertise in general management, including of in-ternational enterprises within FMCG (Fast Moving Consumer Goods)
IndependenceConsidered independent
Member of the board of directorsRatos Ab (publ), Sweden Scandi Standard Ab (publ),SwedenConficap Oy, Finland Antti Alström Perilliset Oy, Finland Finsk-Svenska Handels-Kammaren
Karsten Mattias SlotteMember of the Board
PositionProfessional board member
Special competencesSpecial expertise within general management of listed enterprises, including in-depth insight within finance and risk management
IndependenceConsidered independent
Member of the board of directorsAmbu A/SBlue Ocean Robotics ApS
Chairman of the board of directorsNordic Solar Energy A/S Nordic Solar Global A/S
Christian Sagild Member of the Board Member of the Audit Committee
Claus KærgaardElected by the employees
PositionSales Development Manager
46BoARd oF dIReCtoRS And exeCUtIVe BoARd MANAGEMENT REPORTROYAL UNIBREW ANNUAL REPORT 2018

Board of Directors (continued)
THE BOARD OF DIRECTORS OF ROYAL UNIBREW
Number of Royal Year Initially Term of Unibrew shares held Change from Name of birth elected office Position at 1 January 2019 1 January 2018
Walther Thygesen 1950 2010 2018-2019 Chairman 9,500 2,000Jais Valeur 1962 2013 2018-2019 Deputy Chairman - -Martin Alsø 1974 2014 2018-2022 Board member elected by the employees 1,900 -Einar Esbensen Nielsen 1954 2018 2018-2022 Board member elected by the employees 20 20Claus Kærgaard 1968 2018 2018-2022 Board member elected by the employees - -Christian Sagild 1959 2018 2018-2019 Board member 1,500 1,500Karsten Mattias Slotte 1953 2013 2018-2019 Board member - -Hemming Van 1956 2004 2018-2019 Board member 6,605 -Lars Vestergaard 1974 2018 2018-2019 Board member 415 415Floris van Woerkom 1963 2018 2018-2019 Board member 1,000 1,000
Hemming VanMember of the Board
PositionGroup EVP and CFO of FLSmidth & Co. A/S
Special competencesSpecial expertise within IT, M&A as well as finance and
risk management in interna-tional corporations, including experience within FMCG (Fast Moving Consumer Goods)
IndependenceConsidered independent
PositionSelf-employed / independent consultant
IndependenceConsidered independent
Special competencesBroad international experience, including experience within FMCG (Fast Moving Consumer Goods) as well as special ex-pertise within finance, strategy and management of interna-tional corporations.
Lars VestergaardMember of the Board. Chairman of the Audit Committee
Floris van Woerkom Member of the Board
PositionExecutive Officer of HV Invest ApS
Special competences:Special expertise in retail-ing and marketing as well as production and general management
IndependenceNot considered independent due to length of service
Executive board service CEO of Easyholding ApS, CEO of HV Holding ApS, Chri
Van ApS, Ka Van ApS, Se Van ApS and The Van ApS
Chairman of the board of directorsEasyfood A/SGOG Holding A/SHalberg A/SHV Holding (Thailand) Co., Ltd.
Member of the board of directorsGreat Dane A/SHV Invest ApS Pro Natural Harvest Co., Ltd. eHUBnordic ApSNORD Gourmet ApS
Hemming Van is not available for election at the AGM in 2019
47BoARd oF dIReCtoRS And exeCUtIVe BoARd MANAGEMENT REPORTROYAL UNIBREW ANNUAL REPORT 2018

Executive Board
QualificationsBA Business Administration
Chairman of the board of directorsAdvantage/Smollan, the Uk
Member of the board of directorsDansk Retursystem Holding A/S including subsidiariesHansa Borg Holding AS in-cluding subsidiaries, Norway
QualificationsDiploma in business econom-ics, informatics and manage-ment accounting, Copenhagen Business School
Member of the board of directorsHansa Borg Holding AS includingsubsidiaries, Norway
Johannes F.C.M. SavonijePresident and CEO as of September 2017
Lars JensenCFO as of November 2011
THE EXECUTIVE BOARD OF ROYAL UNIBREW
Number of Royal Year Unibrew shares held Change from Navn of birth Position at 1 January 2019 1 January 2018
Johannes F.C.M. Savonije 1956 CEO 192,889 -
Lars Jensen 1973 CFO 41,575 -
48BoARd oF dIReCtoRS And exeCUtIVe BoARd MANAGEMENT REPORTROYAL UNIBREW ANNUAL REPORT 2018

Corporate social responsibility
ROYAL UNIBREW’S VALUE CHAIN/PROCESS FLOW
TRANSPORTATIONBOTTLING/CANNINGFERMENTATION/STORING
RAW MATERIALS
ENERGY/WASTE/RECYCLINGCLIENT/END USER
PRODUCTION FACILITY
Corporate social responsi- bilityCorporate social responsibility report under section 99A of the Danish Financial Statements Act
We take our social responsibility seriouslyAt Royal Unibrew, we are very aware of our role and of our responsibility to our surroundings as a considerable beverage provider with operations in many countries. We want to con-tribute positively to the development in the areas in which we operate to limit our environmental impact, to establish safe and good working conditions for our employees and to deliver high quality products to consumers.
Therefore, our CSR work is an integrated part of our business and a natural part of our day-to-day operations.
”Our continuous improvements agenda focusing on sustainable and long-term value creation has also in 2018 delivered good and improved results”
During 2019, we commit our selves to joining the UN Glob-al Compact and the UN Guiding Principles on Business and Human Rights. Further, during 2019 we will establish a baseline for our total greenhouse gas emission in order to set targets for our journey towards a neutral carbon footprint.
In the second half 2018, we have gone through a materi-ality analysis covering more than 75% of our operational footprint to assess and identify further focus areas within the CSR framework. The process revealed many excellent examples of local improvements within health and safety, environment, and reduction of material consumption, a few of them is shared in this document in order to show how many smaller initiatives all together make a differ-ence in total.
Circular economy – a framework for our environmen-tal management effortsUnder the heading ”Circular Economy”, a focus area in recent years has been how to reduce our material con-sumption and at the same time reuse/recycle material as much as possible to keep materials circulating in order to leverage their value for as long as possible. In June 2017, the Danish Government’s Advisory Board for Circu-lar Economy published a vision for Denmark’s transition to a circular economy and formulated specific objectives and recommendations for efforts to support the transition to a circular economy. Moreover, the UN has adopted 17 sustainable development goals for the world in relation to which circular economy is a crucial element in generating more sustainable economic growth.
49CoRPoRAte SoCIAL ReSPonSIBILItY MANAGEMENT REPORTRoYAL UnIBReW ANNUAL REPORT 2018

CSR
ROYAL UNIBREW CSR MATERIALITY OVERVIEW
Impa
ct o
n R
oyal
Uni
brew
sta
keho
lder
s'
deci
sion
s to
war
ds R
oyal
Uni
brew
1 2 3 4 5
Impacts: Economically, environmentally and socially (on Royal Unibrew and surroundings)
1
5
High
4
3
2
Society Employees Environment
Customers, consumers, products
Organization, ethics, conducts
Suppliers Management and communications
1 Reuse/recycle material and scraps
2 Communicate CSR performance
3 Local sourcing4 Water usage5 Waste6 Tax behavior7 Responsible
communications8 Participate in public
debate on CSR9 Human rights in
business10 Stakeholder dialogue11 Anti-corruption12 Packaging footprint13 Energy consumptions14 Consumer health and
wellbeing15 CSR goals in incentive
metrics
16 Responsible procurement management
17 Environmental damage18 Workspace health and
safety19 CSR at sales agents20 Employee competence
development21 Sustainability
requirements for equipment
22 Employee satisfaction23 Dangerous substances24 Local community
engagement25 Climate impacts26 Customers CSR focal
points27 Transportations and
logistics28 Trainees and students29 Data security
30 Equal opportunities and diversity
31 Inclusion32 Sustainability as part of
decision processes33 CSR partnerships34 Water discharge35 Code of Conduct36 Our sustainability
governance37 Food waste38 Overall environmental
manufacturing optimizations
39 CSR at customers40 Sustainable farming41 Engage directly in
renewable energy production
42 Deforestation and preservation of natural resources
262 18
12 2714
372319 2931
17
42
8 24
39
3613 1532
7
16
5
2211
38256 9 35
1
21 33
4 20
412810
3 30
34 40
High
Royal Unibrew’s corporate social responsibility (CSR) work is based on our shared values and Royal Unibrew’s Code of Ethics. Moreover, a number of guidelines have been defined for Royal Unibrew’s corporate social responsibility in our quality, food safety and environmental policies. Our CSR work includes most of the themes comprised in the four international CSR guideline sets: The OECD Guide-lines for Multinational Enterprises, the ISO 26000 guid-ance on social responsibility, the UN Global Compact and the UN Guiding Principles on Business and Human Rights.
Royal Unibrew operates in compliance with European and in-ternational legislation and regulations as to labor and human rights, and it is our aim that our suppliers should do the same.
It is our objective that Royal Unibrew’s production sites should be safe and healthy places to work for its employees. Royal Uni-brew’s health policy therefore focuses on preventive measures to avoid employees being worn out and incurring work-relat-ed injuries and on actively promoting safety, job satisfaction and efficiency. Our main focus is on reducing the number of occupational accidents and on improving our employees’ job satisfaction.
We feel a special social responsibility in relation to the local areas in which we operate. It is therefore Royal Unibrew’s aim to have a good dialogue with local/municipal authorities on the issues of current interest in the local areas; we make an active effort to assume responsibility for these, for example in relation to activating citizens balancing on the edge of the labor market and to integrating refugees.
Royal Unibrew operates in highly competitive markets, which necessitates a strong focus on product costs and optimization. This is supported by our policy of acting responsibly towards
the climate and the environment through careful control and continuous ongoing optimization of our resource consumption.
Royal Unibrew works against all forms of corruption, including extortion and bribery, and our activities must always be in full compliance with anti-corruption legislation irrespective of the place of operation being our European home markets or our export markets.
Through many years Royal Unibrew has chosen to focus on continuous improvements, which is a very hands-on method for the individual employee in terms of achieving sustainable long-term results. It is the objective to be able to deliver at all times strong quality products with due consideration of our employees and Royal Unibrew’s surroundings. This approach has resulted in satisfactory improvements in a number of areas for several years and will also form the basis of our future CSR work.
Our actual performance in 2018 includes the acquired busi-nesses called a.a. in the tables, whereas b.a. is reported num-bers excluding the acquisitions. Further, we have decided to include all sites (offices, terminals etc) in the 2018 reporting, which form the new benchmark.
Our overall strategy for our CSR priorities and future commit- ments are connected to the materiality assessment conducted in 2018. During the process we identified 10 key areas with the highest impact as illustrated in the table. On top of already prioritized areas we identified communication efforts as a new focus area and consumer health and well-being (consumer affairs) as topics to be enhanced. Communication efforts are centered around sharing what we do, how we do it and what we want to achieve on a corporate level, thus these areas will be included in the CSR reporting for 2019.
How do we work with CSR
50CSR MANAGEMENT REPORTROYAL UNIBREW ANNUAL REPORT 2018

Human rights (labour rights and competence development)
Policy
Royal Unibrew complies with existing labor legislation and collective agreements including enforcement of the freedom of association and assembly, the elimination of forced and compulsory labor and the use of child labor as well as the elimination of discrimination in respect of the employee’s gender, race, religious beliefs or political affiliation.
Within the broad area of human rights, Royal Unibrew has chosen to focus specifically on diversity among its own em-ployees and on labor rights at Royal Unibrew and with trading partners as well as on competence development of its own employees.
Royal Unibrew has an ongoing dialogue with its stakeholders and the public on this responsibility and seeks to keep focus on these areas through continuous improvements.
It is Royal Unibrew’s goal to attract and retain competent and talented people who are results-oriented, adaptable, innovative, creative and having the right mindset/DNA of the company. This is a prerequisite for realizing our ambitious business objectives.
We are therefore investing in our employees – both by way of learning and by upgrading of skills, and by empowering them to have influence on their jobs and by listening to their ideas and wishes for the future.
We believe that we need to foster an agile, flexible and fast organization to adapt to the changing needs of our consumers and customers. We change, re-organize and fine-tune our internal structures and processes on an ongoing basis and
of courses that give the individual concrete tools to handle a more complex and changeable workday, as well as on-the-job training that plays a pivotal role.
In 2018 we initiated a range of activities focusing on develop-ing our talent pool and succession management which will have a continued focus in the coming years. Various lead-ership competence development activities have been put in place focusing on developing the basic leadership skills, cross-organizational collaboration as well as building high performing leadership teams. Our establishment of a growth leadership team end 2017 has strengthened our results within this important topic in 2018.
A mentor program was launched in 2017 and executed in 2018, under which e.g. young/inexperienced managers and key employees were assigned an older/experienced manager as a mentor in order to leverage the knowledge and expe-rience existing within our organization. The mentor project is evaluated to be very valuable for us and a great tool for competence development, knowledge transfer and building network and will be continued in the future.
The acquisitions completed in 2018 have played an important role for the competence development in Royal Unibrew as many employees have developed their abilities and compe-tences towards integrating the new companies into Royal Unibrew.
In 2018 we had a strong focus on the awareness and com-pliance towards GDPR (General Data Protection Regulation)to secure our employees’ rights regarding the rules and that our employees working with personal information are aware of how to comply with GDPR.
expect our employees to adapt to new methods and tasks quickly. It puts demands on the individual and to our ability to collaborate across the organization while at the same time it offers opportunities for new assignments and/or responsibil-ities within or outside the business area. We believe that trust and responsibility foster great results. As Royal Unibrew has become more international during recent years, cross cultur-al learning and knowledge sharing have become more vital
Activities
Continuous efforts are made to ensure workplace diversity. Traditionally, the beverage industry is relatively male-dom-inated, but Royal Unibrew works continuously to ensure a more equal gender representation.
It is Royal Unibrew’s aim that suppliers and partners should comply with Royal Unibrew’s ethical guidelines which de-scribe how human rights apply to Royal Unibrew’s business, and that these should be incorporated into the terms of trad-ing with key suppliers.
As part of our dialogue with suppliers, we collect information from them to ensure that Royal Unibrew is not brought into conflict with its ethical guidelines. A supplier evaluation took place in 2018.
Royal Unibrew thrives to develop great leaders who empower their employees and secure that we have a strong collabo-ration across functional areas and business units. We are working continuously at raising the level of the individual employee’s competences and at strengthening our manag-ers’ ability to drive changes and to support their employees’ development. Every year, our employees are offered a number
51CSR MANAGEMENT REPORTROYAL UNIBREW ANNUAL REPORT 2018

Human rights (labour rights and competence development) (continued)
Risk
There is a risk of ”biased” recruitment as compared to the demographic development, thus creating a corporate cul-ture that does not reflect the surrounding world. This applies at all organizational levels. In the recruiting process, Royal Unibrew always aims at attracting and recruiting a diverse labor force. Historically, however, the beverage industry is a male-dominated industry within a number of functions, which challenges our diversity target.
Outside Royal Unibrew, but in relation to Royal Unibrew’s operations, there is a risk of purchasing goods or services from suppliers who do not live up to Royal Unibrew’s ethical guidelines for respecting human rights.
Royal Unibrew operates in a highly competitive market, and inability to attract and develop the right people to launch and promote new products at an ever-increasing pace con-stitutes a risk to the continued success of the Company. We also strive to recruit employees through different sources, as we have had great success with various methods, meeting the organizations' need of new employees. Royal Unibrew’s competitiveness also depends on close cooperation between the individual business areas in order to ensure a strong value chain and avoid a silo mentality.
KPI
A target has been defined for the promotion of diversity at Royal Unibrew including the achievement of a reasonable gender representation at the level of the top management team comprising the Executive Board and the executives just below, in order to achieve at least 40% representation of each gender.
Performance
The management teams and employees in leading positions comprised 69% (2017: 70%) men and 31% (2017: 30%) women in 2018.
GENDER REPRESENTATION ON THE INTERNATIONAL MANAGEMENT TEAM
2018 2017
Women 31% 30 %
Men 69% 70 %
We have been focusing on getting more trainees into 2018.
The collection of information from Royal Unibrew’s suppliers in 2018 did not reveal any non-compliance with Royal Uni-brew’s ethical guidelines for respecting human rights.
52CSR MANAGEMENT REPORTROYAL UNIBREW ANNUAL REPORT 2018

Throughout our group we focus on developing each employee’s competences and skills in line with what is relevant for the current job position, future job opportu-nities and asked for by the employees.
Among our employee development initiatives are a number of mentoring programs which are defined and executed to support and fit each business unit.
During 2018 our business unit in Finland has performed a mentoring program with the participation of app. 20 young-er employees as mentees and a similar number of experi-enced colleagues and managers as mentors, including rep-resentatives from the management team. The program has comprised a structured initiation process, four scheduled development meetings and a set of systematic follow up pro-cedures. Each mentee has defined own goals in cooperation with the mentor. The overall mentee evaluation was 4,6 at a scale up to 5,0, which demonstrate that the program has been a success.
Mentoring programs are important to us
Examples of quotes from the mentee evaluations are “The objectives were to clarify the “big goal” on my career, outline a realistic and motivating career path, and to determine key skills I should develop in the next few year” (Sanna Valtan-an, junior business controller) and “We had open and direct discussions where I got concrete tips, readings and set of approaches which I have taken into practice and proved to be efficient” (David Traclet, innovation manager).
Human rights (labor rights and competence development) (continued)
In Denmark a similar program with a total of 26 mentee and mentor participants has been performed during the year. This program also focuses on offering a structured approach, with a number of meetings and clear methods for exchanging knowledge and transferring concrete and relevant learning to the mentees. A certified personality profile test was one of the tools used in the program, and the evaluations show us that this was a clearly appreciated development method.
53CSR MANAGEMENT REPORTROYAL UNIBREW ANNUAL REPORT 2018

0
5
10
15
20
2013 2014 2015 2016 2018a.a
2018all
sites
2018b.a
2017
Working conditions (safety at work)
WORKING ACCIDENTS
Policy
Royal Unibrew must be a safe and healthy place to work for its employees; the Group focuses on preventive measures to avoid employees being worn out and incurring work-related injuries and works actively to promote job satisfaction.
Activities
In most production sites and representing more than 75% of produced volume near-accidents are registered and followed up daily with a view to establishing preventive measures as quickly as possible in order to avoid accidents.
At all production sites, health & safety activities are carried out adapted to the local production site and work area. In Denmark, for example, joint health & safety discussions, a health & safety day as well as courses with focus on tools to reduce daily peak loads were organized in 2018.
Also, in 2018, follow-up was performed on the findings of a job satisfaction measurement made in the period from December 2016 to February 2017 among all employees, and measures have been taken locally to identify factors that may contribute towards higher job satisfaction.
Based on the job satisfaction measurement and the report-ing on near-accidents in 2018, investments have been made in technical aids and measures to prevent e.g. heavy lifting and harmful movements. Financial resources are specifically allocated for this, as an example for ladders, platforms and protective equipment.
Risks
The key risks especially relate to working accidents or em-ployees being worn out due to physically demanding jobs and job dissatisfaction.
KPI
Having set a target on the maximum number of working ac-cidents per million working hours as well as on the minimum number of near-accidents reported per year and thereby fo-cusing on eliminating risk areas before they turn into acci-dents has proven a successful strategy for reducing number of working accidents. These targets are set by the individual sites to reflect their individual safety awareness.
A job satisfaction survey is regularly carried out among all employees. The survey results in an overall job satisfaction score and provides us with the possibility of monitoring de-velopments in the area.
Accidents per million work hours*
It is highly satisfactory to note that working accidents are at its lowest ever
frequency which is attributed to the focused activities in eliminating risk factors
in production prior to them developing into accidents. The positive development
has mainly taken place in our Danish and Baltic production sites and as
illustrated, the safety culture of our 2018 acquisitions needs to be addressed.
Focus in coming years will be on gaining most possible insights from our near-
accidents by using root causes analysis to decrease the number of accidents and
especially to enforce same focus at our acquired businesses in France and Italy.
Reported numbers do not include accidents in the sales
organization, as these are not registered structurally like in the
producttion area. This will be changed during 2019.
Performance
54CSR MANAGEMENT REPORTROYAL UNIBREW ANNUAL REPORT 2018

Policy
It has always been in the DNA of Royal Unibrew to reduce environmental and climate impact as much as possible and to be fully compliant with environmental legislation. We do that by closely following both legislation and stakeholders’ requirements, and by developing and improving our products and production, by training our employees and through a dialogue with our stakeholders.
The major production sites of the Group must be certified under the ISO 14001 environmental management standard.
Activities
In 2018, we continued our efforts to continuously reduce Royal Unibrew’s environmental footprint, primarily targeted by:
• Reduction of energy and water consumption and waste water discharge
• Reduction of wastage of raw materials, semi-manufac-tured products, containers and packaging
• Waste recycling and reduction of resource consumption• Decreasing usage of packaging materials and increase
of usage of recycled materials• Increase of utilization rates on both primary and sec-
ondary transportation• Reduction overall CO2 footprint
In spring 2018 Terme di Crodo was ISO 14001 certified as an independent entity.
Royal Unibrew’s compliance with environmental legislation is regularly verified, including legislation relating to waste water discharge, noise reduction and waste management. Environ-mental risks factors are monitored locally at our production sites to ensure compliance with standards and to ensure fast and efficient corrective actions if required.
Risk
The key environmental risks derived from Royal Unibrew’s production are unintentional discharge of waste water/chemicals or coolants as well as high CO2 emission due to non-optimal operations.
The packaging materials and in particular containers used for our products are generally the largest contributor to our cli-mate impact (the carbon footprint), thus we constantly strive to optimize our containers. For PET bottles that means reduc-ing weight of each container as well as increasing amount of recycle PET used (thereby minimizing amount of virgin PET used). Remembering that full returnable systems are on place in all our Northern European operation.
Moreover, there is a risk of local water resources being ex-ploited beyond their capacity.
KPI
Total energy and water consumption per hectoliter production is measured and reported on a monthly basis. Based on the development in these KPIs, the effect of our environmental work is monitored and our efforts in the individual areas are adjusted.
With respect to packaging materials we constantly monitor quantities and challenge our selves and suppliers’ feasible improvements. E.g. we are steadily increasing usage of re-cycled PET in our PET bottles, and from a base of 19,2% in 2018 of recycled PET in the Danish production we are aiming for a recycle PET fraction of at least 50% on average of our PET bottles in 2021.
Environmental and climate impact
55CSR MANAGEMENT REPORTROYAL UNIBREW ANNUAL REPORT 2018

Environmental and climate issues (continued)
50
75
100
125
2013 2014 2015 2016 2018a.a
2018all
sites
2018b.a
2017
2013 2014 2015 2016 2018a.a
2018all
sites
2018b.a
20172,0
2,5
3,0
3,5
4,0
ENERGY CONSUMPTION (MJ/hl)
WATER CONSUMPTION (hl/hl)
Performance
Excluding the companies acquired in 2018, the results on both specific energy and water consumption continued to develop satisfactory. However, when including Lorina and Terme di Crodo performance is not positive compared to 2017.
In 2019, there will be strong focus on the newly acquired busi-nesses, among other things, through a significant upgrade of the waste water systems in France. Having said that, also Albani Brewery in Denmark has seen an increased water consumption, which primarily is derived from higher com-plexity caused by the micro-brewery as batches are smaller and thereby require more water per hectoliter than normal mainstream batch sizes. In 2019, the focus will unchanged be on a like for like comparison to reduce energy and water consumption per produced HL.
Energy: 75.4 MJ per hectoliter before considering acquisitions is 3.3% lower than the level in 2017. When we include the new sites, the improvement is reduced to 2,1% in the overall energy con-sumption with 76.4 MJ per hectoliter produced. Continues im-provement and installation of new and less energy consuming equipment is the key reason for the development. For 2019, we will strive to reduce relative consumption even further.
Water: Excluding acquisitions made in 2018 we improved perfor-mance on water consumption by realizing a 1.3% reduction to 3.07 hectoliters per hectoliter produced. When including acquisitions water consumption become 3.27 hectoliters per hectoliter produced.
Many projects have supported our strong focus on reducing our carbon footprint development in 2018 and more to come in 2019:
• New can filler at Faxe, Denmark (2018)• Weight reduction of cans (Starcan) (2018)• Weight reduction of PET-bottles and short capping
(in 2018 and to be continued in 2019)• Increase fraction of recycle material in PET bottles
(in 2018 and to be continued in 2019)• Installation of filter line in Faxe, Denmark (2018)• Optimization of product changeovers and CIP-processes
(to be continued in 2019)• Installation of new CIP system, Italy (2019)• New can filler and seamer, Italy (2019)• New glass bottle filler at Albani, Denmark (2019)• Replacement of older distribution vehicles classified at
EURO 3 and 4 levels by new ones classified at EURO 6 level, Denmark (In 2018 and to be continued in 2019)
• Replacement of old light sources by new energy- efficient LED light sources (in 2018 and to be continued in 2019)
• Insourcing of warehousing activities, France (2019)
The positive development in energy consumption is mainly driven
by our lage production units in Faxe and Lahti, but even when
including new acquisitions performance is record low.
56CSR MANAGEMENT REPORTROYAL UNIBREW ANNUAL REPORT 2018

During 2019, we will replace large parts of our group IT infrastructure with the newest available technology, which will create significant developments benefiting both Royal Unibrew and the environment.
Already from the beginning of the project it was decided that our new servers, storages, cooling equipment, network and UPS should contribute to minimizing our carbon footprint via low energy consumptions as well meeting both financial and technical performance requirements – and our decision criteria included all these aspects.
Saved electricity consumption is at least 200.000 kWh per year, and calculations have been done and verified by external certified energy consultants. The reduced energy consump-tion equals 39 tons of CO2 per year – that is in level with the emissions from 20 private cars.
Forward-looking we will aim at upgrading our IT infrastruc-ture at least once every four to five years, as this supports further reductions of our energy consumptions.
We will save 75% of energy consumptions for IT infrastructure in Faxe
Environmental and climate issues (continued)
57CSR MANAGEMENT REPORTROYAL UNIBREW ANNUAL REPORT 2018

At Royal Unibrew we have always been aware that the sourcing, production and logistic processes in our industry contain clear opportunities for minimizing and optimizing our potential negative footprints on our near-by surroundings, on climate change, on environmental issues and on other parameters.
During many years we have been addressing these issues and we have made continuous improvements – which have bene-fited all stakeholders to whom Royal Unibrew have relations.
The excess materials from the beer brewing process like spent grain and surplus yeast, are sold to business partners, to be used as basic animal food. Both spent grain and excess
All material and waste streams are fully utilized
yeast contains large amounts of e.g. proteins, minerals and vitamins which forms basis for nutritious feeding for animals. Royal Unibrew is always looking for the most optimal way of using these by-products.
While always striving to minimize extract losses, our waste water unavoidably contains lesser amounts of extract which at our larger breweries is used in anaerobic waste water plants to generate biogas and ultimately electricity, being exported and replacing fossil fuel-based electricity.
During beer production, the sweet wort is boiled for a period – traditionally wort boiling has been one of the big consumers of energy in the brewery. Over the years much effort has been
done to minimize amount of boiling while at the same time optimizing the recovery of energy contained in the water va-pors being boiled off. This recovered energy is used internally for room heating, process heating, or it is exported to the municipality driven district heating systems – this contributes positively to addressing the fight against climate change as it reduces the need for separate additional heating production.
In the level of 2/3 of the needed amount of CO2 for infusion into beverage products in our Faxe/Denmark manufacturing site is recovered from our own manufacturing installations, which also in this case reduces the need for producing CO2 separately for this purpose.
Environmental and climate issues (continued)
58CSR MANAGEMENT REPORTROYAL UNIBREW ANNUAL REPORT 2018

Light-weighting packaging materials is an on-going journey in our industry. In Royal Unibrew we see light-weighting as one of our important contributions to ensuring a reduced environmental footprint.
Light-weighting our product packaging
The benefits of light-weighting our finished product packaging (as e.g. cans, glass bottles and plastic bottles) is twofold. The less material volumes we can use in each finished product packaging, the less we, as a responsible brewery, are im-pacting the environment, alongside that by lower weight the more we can put on the distribution vehicles
Environmental and climate issues (continued)
Using less raw materials is an area of continuous efforts for both us and our suppliers. Some initiatives are initiated by us, some in close cooperation with the suppliers, and some initiatives are initiated solely by the suppliers.
Less raw material volumes typically lead to thinner material for the finished products packaging, which decreases the ma-terial tolerances together with increasing the requirements for calibrating and controlling the production process, logistic installations, transportations etc.
Examples of the results from our light-weighting initiatives are:
- Plastic bottles (raw material PET): Each bottle light-weight-ed app. 20 % during last ten years avoiding app. 2,000 tons of raw materials per year in 2018.
- Cans (raw material aluminum): Each can light-weighted app. 4.5 % during last ten years avoiding app. 769 tons of raw materials per year in 2018.
59CSR MANAGEMENT REPORTROYAL UNIBREW ANNUAL REPORT 2018
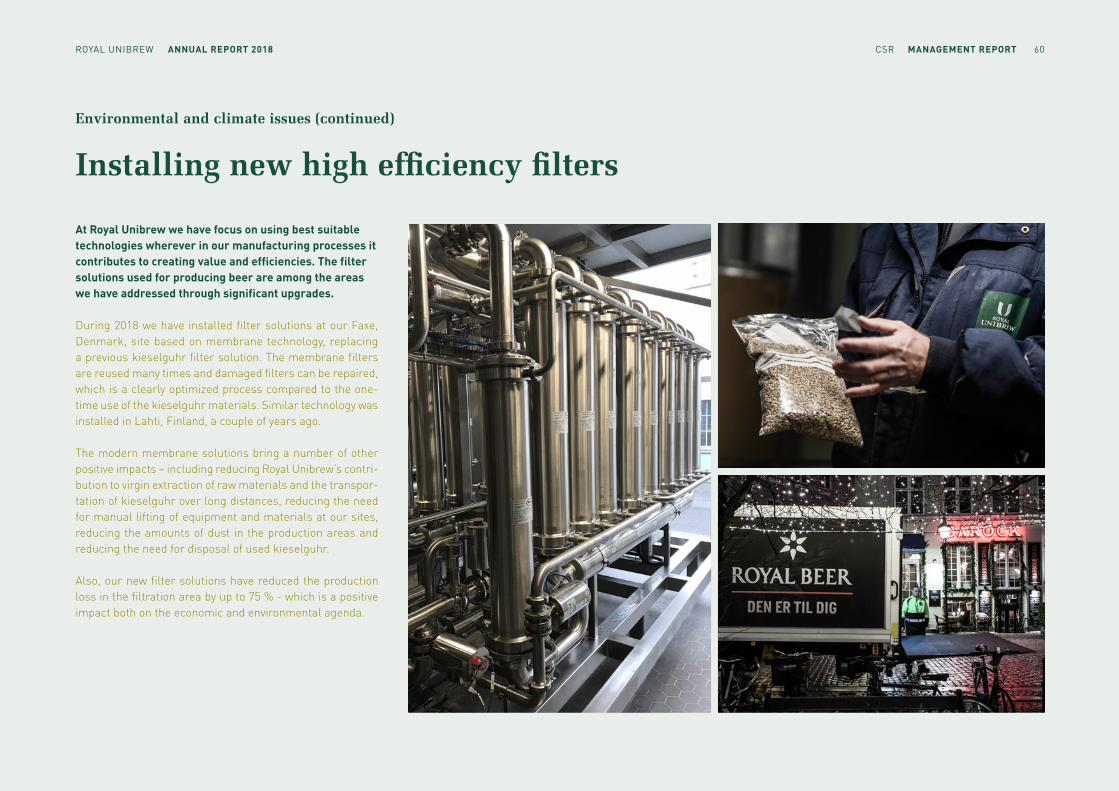
At Royal Unibrew we have focus on using best suitable technologies wherever in our manufacturing processes it contributes to creating value and efficiencies. The filter solutions used for producing beer are among the areas we have addressed through significant upgrades.
During 2018 we have installed filter solutions at our Faxe, Denmark, site based on membrane technology, replacing a previous kieselguhr filter solution. The membrane filters are reused many times and damaged filters can be repaired, which is a clearly optimized process compared to the one-time use of the kieselguhr materials. Similar technology was installed in Lahti, Finland, a couple of years ago.
The modern membrane solutions bring a number of other positive impacts – including reducing Royal Unibrew’s contri-bution to virgin extraction of raw materials and the transpor-tation of kieselguhr over long distances, reducing the need for manual lifting of equipment and materials at our sites, reducing the amounts of dust in the production areas and reducing the need for disposal of used kieselguhr.
Also, our new filter solutions have reduced the production loss in the filtration area by up to 75 % - which is a positive impact both on the economic and environmental agenda.
Installing new high efficiency filters
Environmental and climate issues (continued)
60CSR MANAGEMENT REPORTROYAL UNIBREW ANNUAL REPORT 2018
Financial and business matters
Anti-corruption
Policy
Royal Unibrew works against all forms of corruption, including extortion and bribery. Our activities must always be in compli-ance with existing anti-corruption legislation, irrespective of geographical area.
According to Royal Unibrew’s Ethics Policy, our employees are not allowed to offer or accept bribes or any improper payments for personal or corporate gain. Disciplinary actions will be taken if an employee is involved in bribery.
Royal Unibrew’s business relations with key suppliers and partners are subject to requirements for compliance with an-ti-corruption legislation at the same level as Royal Unibrew’s compliance.
Activities
All new employees receive Royal Unibrew’s Ethics Policy in connection with their introduction to Royal Unibrew. In 2018, all employees with responsibility for sales in areas outside the EU were individually trained in Royal Unibrew’s Ethics Policy when joining the Company, and annual training is made of all these employees.
Requirements for compliance with anti-corruption rules corre-sponding to Royal Unibrew’s Ethics Policy have been incorpo-rated into all new agreements with distributors and key suppli-ers in 2018, who are required to comply herewith. Follow-up on
the compliance with the anti-corruption rules was performed at status meetings with distributors and key suppliers.
Risk
Royal Unibrew is exposed to non-compliance with anti-corrup-tion legislation through employees’, suppliers’ and partners’ violations, and is also exposed to potential legal and financial implications of such non-compliance.
KPI
It is Royal Unibrew’s objective to avoid any violation of the anti-corruption rules internally as well as with its external partners.
Performance
Royal Unibrew did not note any violations of Royal Unibrew’s anti-corruption rules in 2018.
ROYAL UNIBREW ANNUAL REPORT 2018 61CSR MANAGEMENT REPORT

Financial and business matters (continued)
Competition
Policy
Royal Unibrew’s business must always be conducted in full compliance with existing local and international competition law; irrespective of the place of operation.
Royal Unibrew’s competition law compliance program com-prises a manual and guidelines, and includes regular train-ing and follow-up towards relevant employees, e.g. through regular internal controls.
Activities
As part of Royal Unibrew’s competition law compliance pro-gram, we continued monitoring developments in competition law and updated our compliance program in 2018. Moreover, in 2018 we carried on our continuous training of executives and sales and purchasing staff in applicable rules, performed regular, internal controls and ensured compliance with the competition rules in connection with negotiating and entering into contracts.
Risk
Royal Unibrew is exposed to non-compliance with competition law through employees’ violations of the competition rules in the countries in which Royal Unibrew sells and distributes its products.
KPI
It is Royal Unibrew’s objective to avoid any violation of the competition rules.
Performance
Royal Unibrew did not note any violations of competition law in 2018.
ROYAL UNIBREW ANNUAL REPORT 2018 62CSR MANAGEMENT REPORT

2018
6%
30% 58%
6%
Financial and business matters (continued)
Excise duties
VAT
Personal taxes and social security contributions
Company Income Taxes
TOTAL TAX CONTRIBUTION 2018
The total contribution through taxes in 2018 amounted to DKK 5.0 billion (2017: 4.7 billion). Primarily, the increase in tax contribution relates to changes in excise duties and VAT.
Moreover, the acquisitions and the positive result for the group also resulted in higher company income taxes.
Tax policy and tax payment
Policy
Royal Unibrew operates in a number of predominately Eu-ropean countries and is therefore subject to both national and international tax rules. At the same time, the nature of Royal Unibrew’s business implies that both direct and excise duties are paid in the individual markets. Through its tax pay-ments, Royal Unibrew contributes positively to society in the respective countries – as it does by creating jobs and using predominately local suppliers.
The following general principles apply to Royal Unibrew’s management of tax issues:
• Royal Unibrew pays taxes on its activities in the coun-tries in which the activities are carried out, and no special tax structures for the purpose of tax optimization are applied.
• Royal Unibrew always endeavors to live up to national and international tax legislation and sets out to enter into an open and constructive dialogue with the tax authorities.
• Royal Unibrew has an internal organization which moni-tor, and control procedures designed to ensure compli-ance with tax legislation.
• Royal Unibrew wants to communicate openly and fairly about its tax policy and tax payments.
Risk
Mismanagement of tax issues may lead to a negative image with investors and business partners in general and may lead to higher tax costs.
Activities
In 2018, Royal Unibrew updated its processes and documenta-tion of tax legislation compliance in all the countries in which the Company operates.
Performance
Royal Unibrew was not involved in any cases of non-compli-ance with tax legislation in 2018.
In 2018, the effective tax rate was 22% of profit for the year (2017: 21%). Royal Unibrew paid corporation tax of DKK 251 million on its operating activities (2017: DKK 246 million). In addition to that, Royal Unibrew’s activities generate other considerable tax payments, including excise duties on beer, mineral water and other items, VAT, personal taxes and social security contributions. The total contribution through taxes in 2018 amounted to DKK 5.0 billion (2017: 4.7. billion). Primarily, the increase in tax contribution relates to changes in excise duties and VAT. Moreover, the acquisitions and the positive result for the group also resulted in higher company taxes.
BREAKDOWN OF TAXES
63CSR MANAGEMENT REPORTROYAL UNIBREW ANNUAL REPORT 2018

Consumer affairs
Policy
In countries where Royal Unibrew holds significant market positions and where beverage associations are well function-ing we are active members in those. Among others, we sup-port The Brewers of Europe’s views and initiatives concerning responsible alcohol consumption and complies with the rules on responsible marketing and consumption of beverages. We are very aware of the risk, internally and with our customers, of our alcoholic and/or calorie rich products being abused or over-consumed.
Royal Unibrew wants to offer a wide range of products in-cluding no sugar/low sugar and no/low alcohol content al-ternatives.
Activities
Royal Unibrew contributed actively towards responsible mar-keting and consumption of beverages in 2018.
In 2018, Royal Unibrew continued its existing practice of sub-jecting marketing material to the approval of the Company’s in-house counsel and of including requirements for compliance with marketing rules in all agreements with external partners such as distributors and advertising agencies. Moreover, em-ployees engaged in the marketing of the Group’s products were trained in existing marketing legislation in 2018.
Royal Unibrew continued in 2018 to assume responsibility for preventing abuse problems among its employees and, through sponsorships, supports a large variety of sports and health initiatives nationally, regionally as well as locally. In 2018, we launched many new products with a low alcohol content like Royal Organic 2,3%, Heineken 0,0% as well as low alco craft beer. Within the soft drink space we launched many new products with lower calorie content or no calories like for Hartwall Jaffa. Our sold calories per liter to the Danish consumers have e.g. declined 13% during the last 10 years.
Risk
Any non-compliance with the legislation governing the mar-keting of its products continuously exposes Royal Unibrew to criticism from regulatory authorities, adverse press coverage, fines, etc.
KPI
It is Royal Unibrew’s objective to avoid any violation of mar-keting legislation.
We will monitor average calorie per liter and secure an ongo-ing decline without suffering on the taste promise.
Performance
No violations of marketing legislation were noted in 2018.
64CSR MANAGEMENT REPORTROYAL UNIBREW ANNUAL REPORT 2018

Påtegninger og erklæringer
Signatures and statements
65SIGnAtUReS SIGNATURESROYAL UNIBREW ANNUAL REPORT 2018 65SIGnAtUReS MANAGEMENT REPORTRoYAL UnIBReW ANNUAL REPORT 2018

Management's Statement on the Annual Report
The Board of Directors and the Executive Board have today considered and adopted the Annual Report of Royal Unibrew A/S for 1 January - 31 December 2018.
The Annual Report is prepared in accordance with Interna-tional Financial Reporting Standards as adopted by the EU and Danish disclosure requirements for annual reports of listed companies.
Copenhagen, 6 March 2019
Executive Board
Johannes F.C.M. Savonije Lars JensenPresident & CEO CFO
Board of Directors
Walther Thygesen Jais ValeurChairman Deputy Chairman
Martin Alsø Einar Esbensen Nielsen Claus Kærgaard
Christian Sagild Karsten Mattias Slotte Hemming Van
Lars Vestergaard Floris van Woerkom
In our opinion, the Consolidated Financial Statements and the Parent Company Financial Statements give a true and fair view of the financial position of the Group and the Parent Company at 31 December 2018 as well as of the results of the Group and Parent Company operations and cash flows for the financial year 1 January - 31 December 2018.
In our opinion, Management’s Review gives a true and fair account of the development in the operations and financial circumstances of the Group and the Parent Company, of the results for the year, cash flows and of the Parent Company's financial position, as well as a description of the key risks and uncertainties facing the Group and the Parent Company.
We recommend that the Annual Report be adopted at the Annual General Meeting.
66ROYAL UNIBREW ANNUAL REPORT 2018 MAnAGeMent'S StAteMent on tHe AnnUAL RePoRt SIGNATURES

Independent auditor's report
To the shareholders of Royal Unibrew A/S
Opinion In our opinion, the consolidated financial statements and the Parent Company financial statements give a true and fair view of the Group's and the Parent Company's assets, liabilities and financial position at 31 December 2018 and of the results of the Group's and Parent Company's operations and cash flows for the financial year 1 January – 31 December 2018 in accordance with the International Financial Reporting Standards as adopted by the EU and additional requirements in the Danish Financial Statements Act.
Our opinion is consistent with our long-form audit report to the Board or Directors and the Audit Committee.
Audited financial statementsRoyal Unibrew A/S' consolidated financial statements and separate financial statements for the financial year 1 January – 31 December 2018 comprise the income statement, state-ment of comprehensive income, balance sheet, statement of changes in equity, statement of cash flows and notes, includ-ing summary of significant accounting policies, for the Group as well as for the Parent Company (the financial statements). The financial statements are prepared in accordance with the International Financial Reporting Standards as adopted by the EU and additional requirements in the Danish Financial Statements Act.
Basis for opinionWe conducted our audit in accordance with International Standards on Auditing (ISAs) and the additional requirements applicable in Denmark.
Our responsibilities under those standards and requirements are further described in the "Auditor's responsibilities for the audit of the financial statements" section of our report.
We believe that the audit evidence we have obtained is suf-ficient and appropriate to provide a basis for our opinion.
IndependenceWe are independent of the Group in accordance with the In-ternational Ethics Standards Board for Accountants' Code of Ethics for Professional Accountants (IESBA Code) and the additional requirements applicable in Denmark, and we have fulfilled our other ethical responsibilities in accordance with these rules and requirements.
We declare, to the best of our knowledge and belief, that we have not provided any prohibited non-audit services, as referred to in Article 5(1) of the Regulation (EU) 537/2014 and that we remained independent in conducting the audit.
Appointment as auditorsWe were appointed auditors of Royal Unibrew A/S for the first time on 24 April 2018 for the financial year 2018.
Statement on the Management's reviewManagement is responsible for the Management's review.
Our opinion on the financial statements does not cover the Management's review, and we do not express any form of assurance conclusion thereon.
In connection with our audit of the financial statements, our responsibility is to read the Management's review and,
in doing so, consider whether the Management's review is materially inconsistent with the financial statements or our knowledge obtained during the audit, or otherwise appears to be materially misstated.
Moreover, it is our responsibility to consider whether the Man-agement's review provides the information required under the Danish Financial Statements Act.
Based on the work we have performed, we conclude that the Management's review is in accordance with the financial statements and has been prepared in accordance with the requirements of the Danish Financial Statement Act. We did not identify any material misstatement of the Management's review.
Management's responsibility for the financial statementsManagement is responsible for the preparation of financial statements that give a true and fair view in accordance with the International Financial Reporting Standards as adopted by the EU and additional requirements in the Danish Financial Statements Act and for such internal control that Manage-ment determines is necessary to enable the preparation of financial statements that are free from material misstate-ment, whether due to fraud or error.
In preparing the financial statements, Management is respon-sible for assessing the Group's and the Parent Company's ability to continue as a going concern, disclosing, as applicable, matters related to going concern and using the going concern basis of accounting unless Management either intends to liqui-date the Group or the Parent Company or to cease operations, or has no realistic alternative but to do so.
67IndePendent AUdItoR'S RePoRt SIGNATURESROYAL UNIBREW ANNUAL REPORT 2018

Key audit matters How our audit addressed the key audit matter
Valuation of intangible assets Goodwill and trademarks represent 48% of the Group's assets. Management conducts annual impairment test to determine whether the carrying values of recognized goodwill and trademarks are considered to be impaired and, hence, should be written down to the recoverable amount.
Management determines the recoverable amount of the Cash Generating Unit's (CGU) using a discounted cash flow model (value in use). Management uses key assumptions in respect of market and country risks, revenue and margin development and discount rate for the CGU's.
The audit of the recoverable amount has been considered a key audit matter as the determination of the recoverable value is associated with significant estimation uncertainty.
The carrying amount of investments in subsidiaries in the parent company financial statements and the values of intangible assets contained therein is also tested to identify any impairment. This is the same test as described above.
Reference is made to note 11 in the consolidated financial statement and note 11 in the Parent Company financial statements.
For the purpose of our audit, the procedures we carried out included the following:
• We have discussed with Management and evaluated the internal controls and procedures for preparing impairment test and the budget and forecasts.
• We have focused our audit on the model and the appropriateness of key assumptions used by Management to calculate the value in use, as well as assessed the consistency of the assumptions applied.
• We have assessed the appropriateness of the discount rate applied and underlying assumptions, as well as benchmarking to market data and external information.
• Our internal valuations specialists have supported the audit where relevant.• In addition, we have assessed the disclosures; Note 11 Intangible Assets in the consolidated
financial statements meet the requirements of IFRS.
Revenue recognitionThere are a significant number of transactions and contracts with customers. In 2018, IFRS 15 Revenue from Contracts from Customers has been implemented.
Sales contracts with customers are relatively complex with discounts and agreements with marketing contributions etc.
Furthermore locally imposed duties and fees are complex.
Overall this introduce an inherent risk to revenue recognition process. Therefore we have considered this as a key audit matter.
Reference is made to note 4 in the consolidated financial statements.
For the purpose of our audit, the procedures we carried out included the following:
• We have considered the appropriateness of the Group's revenue recognition policy and assessed Managements documentation for the effect of implementing IFRS 15 Revenue from Contracts with Customers.
• We have evaluated the systems and key controls, designed and implemented by Management, related to revenue recognition.
• We have discussed with Management the key assumptions related to recognition, measurement and classification of revenue
• In addition, we have performed substantive procedures. We have discussed significant and complex customer contracts, local imposed duties and fees and the development in discounts and the treatment of marketing contribution to ensure that accounting policies are applied correctly.
• We have performed journalentries testing and verification of proper cut-off at year-end.
Purchase price allocation In 2018, the Group has acquired Terme di Crodo, Italy, Etablissements Geyer Frères, France and 51% of Nohrlund ApS, Denmark.
Acquisitions including the required purchase price allocation have a significant impact on the consolidated financial statements for 2018.
The purchase price allocations are based on a number of management assumptions and estimates related to measurement of all acquired assets and liabilities at fair value.
Due to the significant impact on the consolidated financial statement and allocation based on management assumption, we have considered this as a key audit matter.
Reference is made to note 25 in the consolidated financial statements.
For the purpose of our audit, the procedures we carried out included the following:
• We have assessed the purchase price allocations made including assessing whether the assumptions and estimates made by Management are reasonable and documented.
• We have reconciled the purchase price allocation to supporting documentation including share purchase agreements, calculations of fair value of brands and other intangibles, and opening balances from the acquired entities.
• In assessing the assumptions and estimates as well as the fair value calculations, we have involved our internal valuation specialists.
• In addition, we have assessed the appropriateness of the disclosures; Note 25 Acquisition of subsidiaries.
Key audit mattersKey audit matters are those matters that, in our professional judgement, were of most significance in our audit of the financial statements for the 2018 financial year. These matters were addressed in the context of our audit of the financial statements as a whole, and in the forming of our opinion thereon. We do not provide a separate opinion on these matters.
68IndePendent AUdItoR'S RePoRt SIGNATURESROYAL UNIBREW ANNUAL REPORT 2018

Auditor's responsibilities for the audit of the financial statementsOur objectives are to obtain reasonable assurance as to whether the financial statements as a whole are free from material misstatement, whether due to fraud or error, and to issue an auditor's report that includes our opinion. Reasona-ble assurance is a high level of assurance but is not a guaran-tee that an audit conducted in accordance with ISAs and the additional requirements applicable in Denmark will always detect a material misstatement when it exists. Misstatements may arise from fraud or error and are considered material if, individually or in the aggregate, they could reasonably be expected to influence the economic decisions of users taken on the basis of these financial statements.
As part of an audit conducted in accordance with ISAs and the additional requirements applicable in Denmark, we exercise professional judgement and maintain professional scepticism throughout the audit. We also:
• identify and assess the risks of material misstatement of the financial statements, whether due to fraud or er-ror, design and perform audit procedures responsive to those risks, and obtain audit evidence that is sufficient and appropriate to provide a basis for our opinion. The risk of not detecting a material misstatement resulting from fraud is higher than for one resulting from error as fraud may involve collusion, forgery, intentional omis-sions, misrepresentations or the override of internal control.
• obtain an understanding of internal control relevant to the audit in order to design audit procedures that are appropriate in the circumstances, but not for the pur-pose of expressing an opinion on the effectiveness of the Group's and the Parent Company's internal control.
• evaluate the appropriateness of accounting policies used and the reasonableness of accounting estimates and related disclosures made by Management.
• conclude on the appropriateness of Management's use of the going concern basis of accounting and, based on the audit evidence obtained, whether a material uncertainty exists related to events or conditions that may cast significant doubt on the Group's and the Par-ent Company's ability to continue as a going concern. If we conclude that a material uncertainty exists, we are required to draw attention in our auditor's report to the related disclosures in the financial statements or, if such disclosures are inadequate, to modify our opin-ion. Our conclusions are based on the audit evidence obtained up to the date of our auditor's report. However, future events or conditions may cause the Group and the Parent Company to cease to continue as a going concern.
• evaluate the overall presentation, structure and con-tents of the financial statements, including the disclo-sures, and whether the financial statements represent the underlying transactions and events in a manner that gives a true and fair view.
• obtain sufficient appropriate audit evidence regarding the financial information of the entities or business activities within the Group to express an opinion on the consolidated financial statements. We are responsible for the direction, supervision and performance of the group audit. We remain solely responsible for our audit opinion.
We communicate with those charged with governance re-garding, among other matters, the planned scope and tim-ing of the audit and significant audit findings, including any significant deficiencies in internal control that we identify during our audit.
We also provide those charged with government with a state-ment that we have complied with relevant ethical require-ments regarding independence, and communicate to them all relationships and other matters that may reasonably be thought to bear on our independence, and where applicable, related safeguards.
From the matters communicated to those charged with governance, we determine those matters that were of most significance in the audit of the financial statements of the current period and therefore the key audit matters. We de-scribe these matters in our auditor's report unless law or regulation precludes public disclosure about the matter or when, in extremely rare circumstances, we determined that a matter should not be communicated in our report because the adverse consequences of doing so would reasonably be expected to outweigh the public interest benefits of such communication.
Copenhagen, 6 March 2019
KPMGStatsautoriseret RevisionspartnerselskabCVR no. 25 57 81 98
Lau Bent Baun Niels VendelboState Authorised State AuthorisedPublic Accountant Public AccountantMNE no. 26708 MNE no. 34532
69IndePendent AUdItoR'S RePoRt SIGNATURESROYAL UNIBREW ANNUAL REPORT 2018

Consolidated financial statements
2018
RoYAL UnIBReW ANNUAL REPORT 2018 70CONSOLIDATED FINANCIAL STATEMENTS
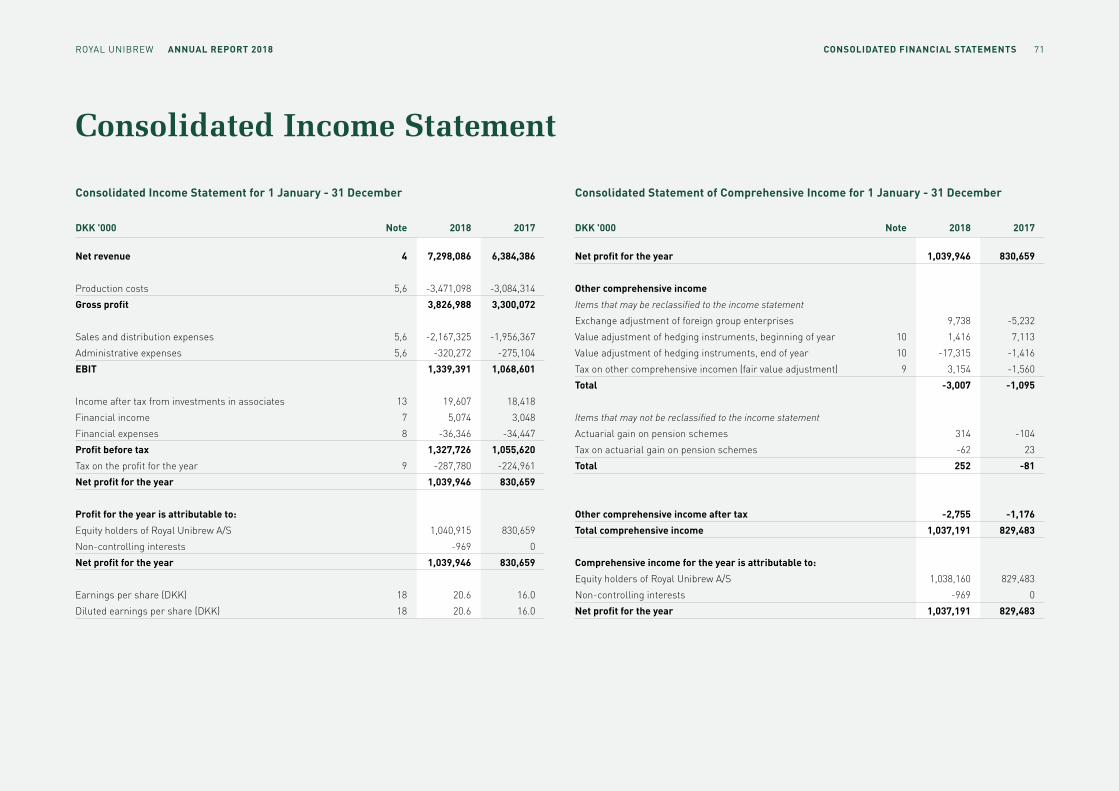
Consolidated Income Statement
DKK '000 Note 2018 2017
Net revenue 4 7,298,086 6,384,386
Production costs 5,6 -3,471,098 -3,084,314
Gross profit 3,826,988 3,300,072
Sales and distribution expenses 5,6 -2,167,325 -1,956,367
Administrative expenses 5,6 -320,272 -275,104
EBIT 1,339,391 1,068,601
Income after tax from investments in associates 13 19,607 18,418
Financial income 7 5,074 3,048
Financial expenses 8 -36,346 -34,447
Profit before tax 1,327,726 1,055,620
Tax on the profit for the year 9 -287,780 -224,961
Net profit for the year 1,039,946 830,659
Profit for the year is attributable to:
Equity holders of Royal Unibrew A/S 1,040,915 830,659
Non-controlling interests -969 0
Net profit for the year 1,039,946 830,659
Earnings per share (DKK) 18 20.6 16.0
Diluted earnings per share (DKK) 18 20.6 16.0
DKK '000 Note 2018 2017
Net profit for the year 1,039,946 830,659
Other comprehensive income
Items that may be reclassified to the income statement
Exchange adjustment of foreign group enterprises 9,738 -5,232
Value adjustment of hedging instruments, beginning of year 10 1,416 7,113
Value adjustment of hedging instruments, end of year 10 -17,315 -1,416
Tax on other comprehensive incomen (fair value adjustment) 9 3,154 -1,560
Total -3,007 -1,095
Items that may not be reclassified to the income statement
Actuarial gain on pension schemes 314 -104
Tax on actuarial gain on pension schemes -62 23
Total 252 -81
Other comprehensive income after tax -2,755 -1,176
Total comprehensive income 1,037,191 829,483
Comprehensive income for the year is attributable to:
Equity holders of Royal Unibrew A/S 1,038,160 829,483
Non-controlling interests -969 0
Net profit for the year 1,037,191 829,483
Consolidated Income Statement for 1 January - 31 December Consolidated Statement of Comprehensive Income for 1 January - 31 December
71CONSOLIDATED FINANCIAL STATEMENTSROYAL UNIBREW ANNUAL REPORT 2018

Consolidated Balance Sheet
Assets at 31 December Liabilities and Equity at 31 December
Note 2018 2017
NON-CURRENT ASSETS
Intangible assets 11 4,107,884 2,862,066
Property, plant and equipment 12 2,529,777 2,121,551
Investments in associates 13 124,462 127,911
Other fixed asset investments 14 12,390 9,618
Non-current assets 6,774,513 5,121,146
CURRENT ASSETS
Inventories 15 439,676 335,338
Receivables 16 666,478 587,441
Corporation tax 9 0 16,164
Prepayments 17 35,842 33,693
Cash at bank and in hand 145,151 684,626
Current assets 1,287,417 1,657,262
Assets 8,061,660 6,778,408
Note 2018 2017
EQUITY
Share capital 18 102,000 105,400
Other reserves 738,082 770,138
Retained earnings 1,508,191 1,469,583
Proposed dividend 550,800 469,030
Equity contributable to equity holders of Royal Unibrew A/S 2,899,073 2,814,151
Non-controlling interests 9,083 0
Equity 2,908,156 2,814,151
LIABILITIES
NON-CURRENT LIABILITIES
Deferred tax 19 542,328 378,231
Mortgage debt 2,21 855,347 858,328
Credit institutions 2,21 1,709,582 381,179
Other payables 44,485 12,960
Non-current liabilities 3,151,742 1,630,698
CURRENT LIABILITIES
Mortgage debt 2,21 3,572 3,720
Credit institutions 2,21 98,383 416,369
Trade payables 974,930 1,025,688
Provisions 16,428 20,846
Corporation tax 9 9,761 0
Other payables 20 898,688 866,936
Current liabilities 2,001,762 2,333,559
Liabilities 23 5,153,504 3,964,257
Liabilities and equity 8,061,660 6,778,408
72CONSOLIDATED FINANCIAL STATEMENTSROYAL UNIBREW ANNUAL REPORT 2018

Consolidated Cash Flow Statement
Note 2018 2017
Business acquisitions 25 -1,327,395 0
Acquisition/sale of intangible assets and fixed asset investments -21,863 456
Cash flows from investing activities -1,621,524 -218,026
Debt financing:
Proceeds from increased drawdown on credit facilities 1,215,548 901,274
New leasing facilities 60,250
Repayment on credit facilities -421,559 -240,000
Repayment on leasing facilities -55,601
Shareholders:
Dividends paid to shareholders -450,874 -426,527
Acquisition of shares for treasury -484,090 -507,589
Cash flows from financing activities -136,326 -272,842
Change in cash and cash equivalents -543,593 677,356
Cash and cash equivalents at 1 January 684,626 6,917
Exchange adjustment 4,118 353
Cash and cash equivalents at 31 December 145,151 684,626
Note 2018 2017
Net profit for the year 1,039,946 830,659
Adjustments for non-cash operating items 22 641,052 536,784
1,680,998 1,367,443
Change in working capital:
Receivables 15,855 -71,496
Inventories -27,599 863
Payables -173,082 146,616
Cash flows from operating activities before financial income and expenses 1,496,172 1,443,426
Financial income 5,074 3,048
Financial expenses -33,774 -31,832
Financial expenses related to leasing -2,095
Cash flows from operating activities 1,465,377 1,414,642
Corporation tax paid -251,120 -246,418
Cash flows from operating activities 1,214,257 1,168,224
Dividends received from associates 21,412 26,735
Sale of property, plant and equipment 27,199 8,554
Purchase of property, plant and equipment* -320,877 -253,771
Free cash flow 941,991 949,742
* inclusive DKK 60,3 million additions from leasing (IFRS 16)
for 1 January - 31 December
73CONSOLIDATED FINANCIAL STATEMENTSROYAL UNIBREW ANNUAL REPORT 2018

Consolidated Statement of Changes in Equity
Parents Share Proposed company Share premium Translation Hedging Total other Retained dividend share of Minority DKK '000 capital account reserve reserve reserves earnings for the year equity share Total
Equity at 31 December 2017 105,400 812,771 -41,217 -1,416 770,138 1,469,583 469,030 2,814,151 0 2,814,151
Changes in equity in 2018
Net profit for the year 0 1,040,915 1,040,915 -969 1,039,946
Other comprehensive income 10,061 -15,899 -5,838 -9 -5,847 -5,847
Tax on other comprehensive income 0 3,092 3,092 3,092
Total comprehensive income 0 0 10,061 -15,899 -5,838 1,043,998 0 1,038,160 -969 1,037,191
Minority shareholders' share of acquired businesses 0 10,052 10,052
Liability upon acquisition 0 -29,000 -29,000 -29,000
Dividends paid to shareholders 0 -450,874 -450,874 -450,874
Dividend on treasury shares 0 18,156 -18,156 0 0
Acquisition of shares for treasury 0 -484,090 -484,090 -484,090
Proposed dividend 0 -550,800 550,800 0 0
Capital reduction -3,400 -26,218 -26,218 29,618 0 0
Share-based payments 0 7,700 7,700 7,700
Tax on changes in equity, shareholders 0 3,026 3,026 3,026
Total shareholders -3,400 -26,218 0 0 -26,218 -1,005,390 81,770 -953,238 10,052 -943,186
Total changes in equity in 2018 -3,400 -26,218 10,061 -15,899 -32,056 38,608 81,770 84,922 9,083 94,005
Equity at 31 December 2018 102,000 786,553 -31,156 -17,315 738,082 1,508,191 550,800 2,899,073 9,083 2,908,156
The share capital at 31 December 2018 amounts to DKK 102,000,000 (2017: DKK 105,400,000) and is distributed on shares of DKK 2 each.
Proposed dividend for the year amounts to DKK 10.80 per share (2017: DKK 8.90 per share).
for 1 January - 31 December 2018
74CONSOLIDATED FINANCIAL STATEMENTSROYAL UNIBREW ANNUAL REPORT 2018

Consolidated Statement of Changes in Equity
for 1 January - 31 December 2017
Parents Share Proposed company Share premium Translation Hedging Total other Retained dividend share of Minority DKK '000 capital account reserve reserve reserves earnings for the year equity share Total
Equity at 31 December 2016 108,200 834,363 -36,442 -7,113 790,808 1,571,454 440,915 2,911,377 0 2,911,377
Changes in equity in 2017
Net profit for the year 0 830,659 830,659 830,659
Other comprehensive income -4,775 5,697 922 -561 361 361
Tax on other comprehensive income 0 -1,537 -1,537 -1,537
Total comprehensive income 0 0 -4,775 5,697 922 828,561 0 829,483 0 829,483
Dividends paid to shareholders 0 -426,527 -426,527 -426,527
Dividend on treasury shares 0 14,388 -14,388 0 0
Acquisition of shares for treasury 0 -507,589 -507,589 -507,589
Proposed dividend 0 -469,030 469,030 0 0
Capital reduction -2,800 -21,592 -21,592 24,392 0 0
Share-based payments 0 5,651 5,651 5,651
Tax on changes in equity, shareholders 0 1,756 1,756 1,756
Total shareholders -2,800 -21,592 0 0 -21,592 -930,432 28,115 -926,709 0 -926,709
Total changes in equity in 2017 -2,800 -21,592 -4,775 5,697 -20,670 -101,871 28,115 -97,226 0 -97,226
Equity at 31 December 2017 105,400 812,771 -41,217 -1,416 770,138 1,469,583 469,030 2,814,151 0 2,814,151
75CONSOLIDATED FINANCIAL STATEMENTSROYAL UNIBREW ANNUAL REPORT 2018
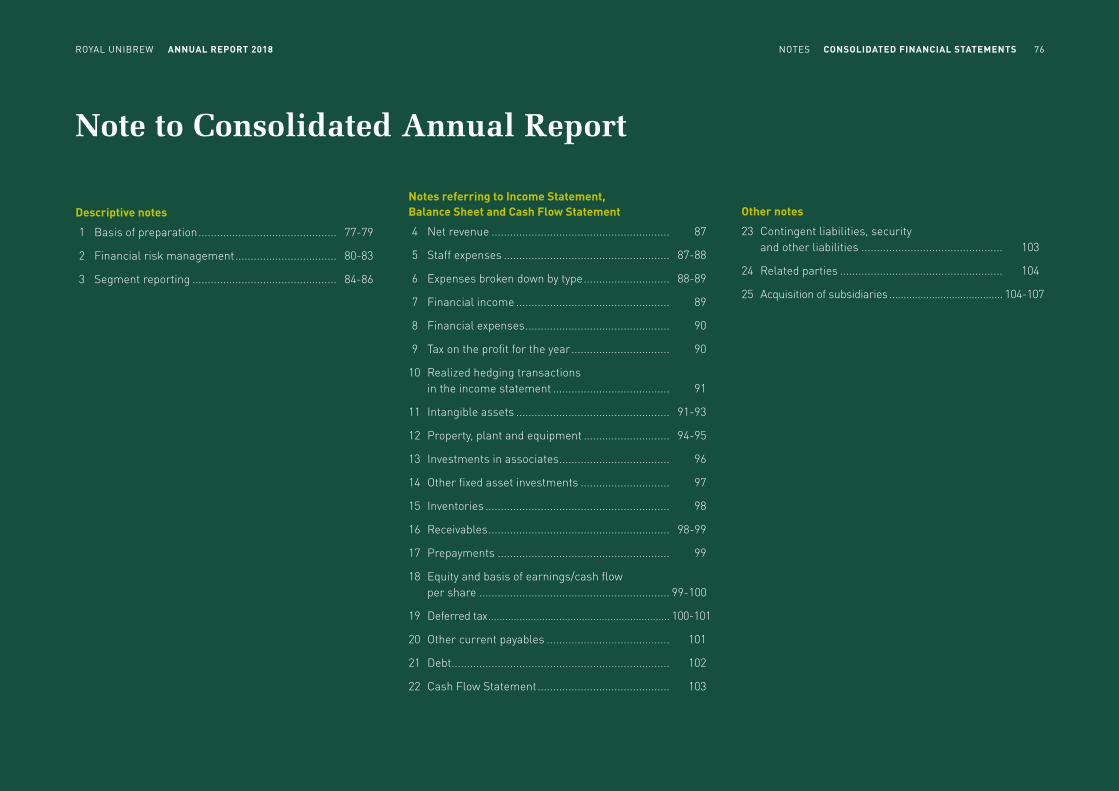
Note to Consolidated Annual Report
Descriptive notes
1 Basis of preparation ............................................. 77-79
2 Financial risk management ................................. 80-83
3 Segment reporting ............................................... 84-86
Notes referring to Income Statement, Balance Sheet and Cash Flow Statement
4 Net revenue .......................................................... 87
5 Staff expenses ...................................................... 87-88
6 Expenses broken down by type ............................ 88-89
7 Financial income .................................................. 89
8 Financial expenses ............................................... 90
9 Tax on the profit for the year ................................ 90
10 Realized hedging transactions in the income statement ...................................... 91
11 Intangible assets .................................................. 91-93
12 Property, plant and equipment ............................ 94-95
13 Investments in associates .................................... 96
14 Other fixed asset investments ............................. 97
15 Inventories ............................................................ 98
16 Receivables ........................................................... 98-99
17 Prepayments ........................................................ 99
18 Equity and basis of earnings/cash flow per share .............................................................. 99-100
19 Deferred tax ................................................................ 100-101
20 Other current payables ........................................ 101
21 Debt ....................................................................... 102
22 Cash Flow Statement ........................................... 103
Other notes
23 Contingent liabilities, security and other liabilities .............................................. 103
24 Related parties ..................................................... 104
25 Acquisition of subsidiaries ........................................ 104-107
RoYAL UnIBReW ANNUAL REPORT 2018 76noteS CONSOLIDATED FINANCIAL STATEMENTS

Descriptive notes to Consolidated Annual Report
Note 1 Basis of preparation of Consolidated Annual Report
Basis of preparationRoyal Unibrew A/S is a limited liability company registered in Denmark. The Financial Statements for the period 1 January - 31 December 2018 presented in the Annual Report comprise both Consolidated Financial Statements of Royal Unibrew A/S and its subsidiaries (Group) and sep-arate Parent Company Financial Statements.
The Financial Statements of Royal Unibrew for 2018 have been prepared in accordance with International Financial Reporting Standards (IFRS) as adopted by the EU and additional Danish disclosure requirements for financial statements, cf the Danish Statutory Order on Adoption of IFRS issued pursuant to the Danish Financial Statements Act.
The Board of Directors and the Executive Board considered and adopted the Annual Report of Royal Unibrew A/S for 2018 on 6 March 2019. The Annual Report will be submitted for adoption by the shareholders of Royal Unibrew A/S at the Annual General Meeting on 25 April 2019.
The Financial Statements are presented in Danish kroner (DKK).
Significant accounting policies
This section describes the general accounting policies applied and critical accounting estimates made by Royal Unibrew. A detailed de-scription of the accounting policies applied and critical estimates made with respect to specific reported amounts is presented in the relevant notes. The purpose of this is to create full transparency of the disclosed amounts by providing a total description of the relevant accounting pol-icy, the critical estimates and the numerical information for each note.
The description of accounting policies in the notes constitutes part of the overall description of Royal Unibrew's accounting policies.
New and amended standards and interpretations that have taken effectRoyal Unibrew has adopted the following new or amended standards and interpretations from 1 January 2018:
IFRS 9IFRS 9 - 'Financial Instruments: Classification and Measurement of Financial Assets and Financial Liabilities' contains requirements for the classification and measurement of financial assets and liabilities, impairment methodology and general hedge accounting. The imple-mentation of IFRS 9 has had an insignificant impact on the consolidated financial statements. The implementation has resulted in additional disclosures; see Notes 2 and 16. The basis for calculating the allowance for doubtful receivables has been changed from incurred losses to expected losses. However, this has had only an insignificant impact on the allowances and thereby the consolidated financial statements. The standard has been implemented retrospective using 1 January 2018 as the date of initial application. Royal Unibrew has made use of the relief from restating comparative figures.
IFRS 15IFRS 15 - 'Revenue from Contracts with Customers' establishes a single comprehensive framework for revenue recognition. The implementation of IFRS 15 has had an insignificant impact on the income statement and the related key ratios in the consolidated financial statements due to the current product mix and contract types. The standard was implemented using the modified retrospective method. Royal Unibrew made use of the relief from restating comparative figures and applied IFRS 15 only to contracts that were not completed as of 1 January 2018.
IFRS 16IFRS 16 - 'Leases' Royal Unibrew has implemented IFRS 16 one year ahead of its effective date and has consequently recognized lease as-
sets (Right of Use-asset) and lease liabilities in the balance sheet. The implementation of IFRS 16 has had the following impact:
mDKK Group Parent
Rental and operating lease commitments 31 December 2017 145.3 72.6
Adjustment at initial application of IFRS 16 89.8 17.1
Service commitments excluded -5.7 -5.4
Short term lease excluded (less 12 months) -9.0 -3.5
Low value lease commitments (less 5,000 EUR) excluded -7.4 -7.3
Initial application at 1 January 2018 213.0 73.5
Discounting (1%) -7.7 -2.5
Lease liability recognized in statement of financial position at 1 January 205.3 71.0
Lease liabilities are recognized in the line item 'credit institutions'.
The discounting rate of 1% is determined based on the Groups incre-mental borrowing rate at 1 January 2018.
Early application of IFRS 16 is only possible because Royal Unibrew also applies IFRS 15 ‘Revenue from Contracts with Customers’ (see above). Royal Unibrew has elected not to implement regarding intan-gible assets and service, short term and low value lease contracts. The total impact 1 January 2018, using the modified retrospective approach was:
77NOTES CONSOLIDATED FINANCIAL STATEMENTSROYAL UNIBREW ANNUAL REPORT 2018

Profit and Loss mDKK Group Parent
EBITDA 60.2 18.7
EBIT 2.1 0.7
Assets mDKK
Leasing of property, plant and equipment (note 12) 205.3 71.0
Total assets 205.3 71.0
Equity and liabilities mDKK
Total debt 205.3 71.0
Total equity and liability 205.3 71.0
At the time of publication of this Annual Report, the IASB has issued the new and amended financial reporting standards and interpretations which are potentially relevant, but not mandatory, for Royal Unibrew A/S at the time of preparation of the Annual Report for 2018.
The adopted, not yet effective standards and interpretations will be implemented as they become mandatory for Royal Unibrew A/S. None of the new standards or interpretations are expected to have a signif-icant impact on recognition and measurement for Royal Unibrew A/S.
Consolidated Financial StatementsThe Consolidated Financial Statements comprise Royal Unibrew A/S (the Parent Company) and enterprises in which the Parent Company exercises control (subsidiaries).
Enterprises in which the Group holds between 20% and 50% of the votes and exercises significant influence but not control are classified as associates.
The Consolidated Financial Statements are prepared on the basis of Financial Statements of all group enterprises prepared under the Group's accounting policies by combining accounting items of a uniform nature. Elimination is made of intercompany income and expenses, unrealized intercompany profits and losses, balances and sharehold-ings. Comparative figures are not adjusted for newly acquired, sold or wound-up enterprises.
Acquired enterprises are recognized as of the date of acquisition. Enter-prises disposed of are recognized in the consolidated income statement up until the date of disposal.
Translation policiesFor each of the reporting entities of the Group, a functional currency is determined. The functional currency is the currency of the primary economic environment in which the reporting entity operates. Transac-tions in other currencies than the functional currency are transactions in foreign currencies.
Transactions in other currencies than the functional currency are ini-tially translated into Danish kroner at the exchange rates at the dates of transaction. Receivables, payables and other monetary items in foreign currencies not settled at the balance sheet date are translated at the exchange rates at the balance sheet date. Exchange adjustments arising due to differences between the transaction date rates and the rates at the dates of payment or the rates at the balance sheet date, respectively, are recognized in financial income and expenses in the income state-ment. Property, plant and equipment and intangible assets, inventories
and other non-monetary assets purchased in foreign currencies and measured at historical cost are translated at the transaction date rates.
On recognition in the Consolidated Financial Statements of enterprises with another functional currency than Danish kroner (DKK), income statements are translated at average annual exchange rates. Balance sheet items are translated at the exchange rates at the balance sheet date.
Exchange adjustments arising on the translation of the opening balance sheet items of foreign enterprises at exchange rates at the balance sheet date and on the translation of income statements from average exchange rates to exchange rates at the balance sheet date are recog-nized in other comprehensive income. Similarly, exchange adjustments arising due to changes made directly in equity of foreign enterprises are recognized in other comprehensive income.
On recognition in the Consolidated Financial Statements of associates with a functional currency that differs from the presentation currency of the Parent Company, the share of results for the year is translated at average exchange rates, and the share of equity including goodwill is translated at the exchange rates at the balance sheet date. Exchange adjustments arising on the translation of the share of the opening equity of foreign associates at exchange rates at the balance sheet date and on the translation of the share of results for the year from average exchange rates to exchange rates at the balance sheet date are recognized in other comprehensive income and classified in equity under a separate translation reserve.
Note 1 Basis of preparation of Consolidated Annual Report (continued)
78NOTES CONSOLIDATED FINANCIAL STATEMENTSROYAL UNIBREW ANNUAL REPORT 2018

Critical accounting estimates and judgementsIn connection with the preparation of the Parent Company and Con-solidated Financial Statements, Management makes estimates and judgements as to how recognition and measurement of assets and liabilities should take place based on the accounting policies applied.
Judgements as an element in significant accounting policies
The calculation of carrying amounts of certain assets and liabilities requires judgement as to how assets and liabilities should be classified in the Financial Statements and how future events will affect the value of these assets and liabilities at the balance sheet date. In connection with the financial reporting for 2018, the following judgments have been made materially affecting the related items as described in relevant notes, see list below.
Critical accounting estimates
Management's estimates are based on assumptions which Manage-ment considers reasonable but which are inherently uncertain and unpredictable. In connection with the financial reporting for 2018, the following critical estimates have been made as desribed in the notes, see list below.
Accounting policies , judgements as an element in significant ac-counting policies as well as critical accounting estimates are described in the notes:
Note
Derivative financial instruments 2
Segment reporting 3
Net revenue 4
Share-based payments 5
Expenses 6
Financial income and expenses 8
Corporation tax 9
Intangible assets 11
Property, plant and equipment 12
Investments in associates 13
Other fixed asset investments 14
Inventories 15
Receivables 16
Prepayments 17
Equity 18
Deferred tax 19
Deposit returnable packaging 20
Debt 21
Cash Flow Statement 22
Purchase Price Allocation (PPA) 25
LEGEND
Significant accounting policies
Judgements as an element in significant accounting policies
Critical accounting estimates
Comments to the note
Note 1 Basis of preparation of Consolidated Annual Report (continued)
79NOTES CONSOLIDATED FINANCIAL STATEMENTSROYAL UNIBREW ANNUAL REPORT 2018

The Group's financial risks are managed centrally according to the Treasury Policy approved by the Board of Directors, which includes guidelines for the handling of currency, interest rate, liquidity and credit risks. Commodity risks are also managed under a commodity risk policy approved by the Board of Directors.
Currency riskRoyal Unibrew is exposed to currency risks through the geographic spread of the Group's activities. This currency exposure is reflected through the activities in the subsidiaries and the Parent Company's export activities where cash flows are earned in foreign currencies, and in connection with the purchase of raw materials primarily in EUR and USD, including purchases which involve an indirect USD risk on the part of the purchase price related to the raw material element. Purchases are in all materiality made in the currencies in which the Group has income, which results in a total reduction of the currency risk. Furthermore, the translation of loans to/from subsidiaries as well as the Group's net debt is subject to currency risk where these are not established in DKK.
The above describes Royal Unibrew's transaction risks, which are hedged actively according to the Treasury Policy. EUR is not hedged as the risk is immaterial provided that the existing 0.5% band of DKK to EUR under Denmark's monetary policy is maintained. The objective is to reduce negative effects on the Group's profit and cash flows. The risk is therefore monitored and hedged continually. The Group's cash flows are primarily in EUR, USD, CAD and GBP.
The total gross currency risk (before hedging) on the balance sheet items was calculated at 31 December 2018. The following table shows the sensitivity to a positive change in the cross rates at 31 December 2018 with all other variables remaining unchanged. A negative change has a corresponding effect merely with the sign reversed.
Note 2 Financial risk management
Earnings impact Earnings impact Equity Equity impact DKK '000 Change before tax 2018 before tax 2017 impact 2018 2017
EUR 0.1% -645 -531 -645 -531
USD 10% 2,315 1,582 2,315 -795
GBP 10% 318 -305 318 -305
CAD 10% 1,002 - 1,002 -
Royal Unibrews translation risk relates primarily to France, Italy, Fin-land, Latvia as well as Lithuania (EUR). The translation risk related to Royal Unibrew's investments in foreign subsidiaries is, as a general rule, not hedged.
Financial risks such as the loss of competitive strength due to long-term exchange rate changes are not hedged by financial instruments but are included in Royal Unibrew's strategic considerations and risk management.
Interest rate riskRoyal Unibrew's interest rate risk is substantially related to the Group's loan portfolio which is primarily denominated in DKK and EUR. Interest rate changes will affect the market value of fixed-interest loans as well as interest payments on floating-rate liabilities. Debt is established only in currencies in which the Group has commercial activities.
In Royal Unibrew's assessment, the key interest rate risk is related to the immediate effect of interest rate changes on the Group's interest payment flows and Royal Unibrew focuses only secondarily on changes in the market value of the debt. It is group policy to limit the effect of interest rate changes on profit and cash flows while, within this framework, also achieving the lowest possible financing cost. At the end of 2018, mortgage debt amounted to DKK 859 million (2017: DKK 862 million) with an average term to maturity of 10,8 years (2017: 11 years). Bank debt comprises committed bank credit facilities and long term loan with an agreed term to maturity between 3 to 7 years (2017: 2 years). 47% (2017: 37%) of the mortgage and bank debt is fixed-interest through the Group's hedging of interest rate risk and fixed rate loans with a fixed-interest period between 2-7 years (2017: 3 years). A one percentage point interest rate change will affect the Group's interest
expenses by approx +/- DKK 10 million (2017: approx +/- DKK 3 million), and the interest expenses of the Parent Company by approx +/- DKK 6 million (2017: approx +/- DKK 2 million).
Credit risksThe Group’s credit risks relate primarily to trade receivables and coun-terparty risks.
The Group's counterparty risks comprise both commercial and financial counterparty risk. The commercial counterparty risk relates primarily to business agreements with a built-in element of firm rate/price. The financial counterparty risk relates to hedging agreements as well as net bank deposits. The financial counterparty risk is actively reduced by distributing net bank deposits on banks in accordance with the credit rating criteria determined in the Treasury Policy.
Royal Unibrew seeks to limit risks relating to credit granting to cus-tomers in export markets through extensive use of insurance cover and other types of hedging of payments. Where effective hedges cannot be established, Royal Unibrew has established procedures for approval of such risks. There are no material credit risks on individual customers. The credit risk is generally higher relating to customers in the on-trade sales channel than relating to off-trade customers. This difference in credit risk is addressed through various approval procedures and credit granting conditions for customers in the two sales channels. In Finland, risks on major single receivables from customers are reduced through sale of the receivables. Credit risks relating to trade receivables are reduced by setting off accrued bonus. At 31 December 2018, accrued bonus amounts to DKK 232 million (2017: DKK 194 million) set off against trade receivables.
The maximum credit risk corresponds to the carrying amount of the financial assets.
Liquidity risksIt is group policy that its cash resources should be adequate to meet the expected liquidity requirements in the current and next financial year. The cash resources may be bank deposits, short-term bonds and unutilised credit facilities.
80NOTES CONSOLIDATED FINANCIAL STATEMENTSROYAL UNIBREW ANNUAL REPORT 2018

Capital managementRoyal Unibrew wants to ensure structural and financial flexibility as well as competitive power. To ensure this, continuous assessment is made to determine the appropriate capital structure of Royal Unibrew. It is the target that the Group's net interest-bearing debt should not exceed 2.5 x EBITDA and that an equity ratio of at least 30% should be maintained at year end.
At the operational level, continuous efforts are directed at optimising working capital investments. Subject to adequate capacity and capabil-ity, investments in production facilities will be limited to replacement of individual components, related to specific products or to optimization of selected processes as well as maintenance.
Commodity risksThe commodity risk relates primarily to the purchasing of cans (alu-minium), malt (barley), hops and packaging materials (cardboard) as well as energy. The commodity risk is actively hedged commercially and financially in accordance with the Group's Treasury Policy.
The objective of managing Royal Unibrew's commodity risk is to achieve a smooth and time-differentiated effect of commodity price increases, which is primarily achieved by entering into fixed-price agreements with the relevant suppliers. As regards to the Group's purchase of cans, financial contracts have been made to hedge the risk of aluminium price increases. Exchange rate changes with respect to the settlement currency of aluminium (USD) are an element of the overall currency risk management.
The most significant part of purchases for the next 12 months has, in accordance with Royal Unibrew's policy, been hedged by entering into supplier agreements and financial contracts. A +/-10% change in the price of aluminium would have a P/L effect at Group level of approx +/- DKK 2 million (2017: DKK 11 million).
Note 2 Financial risk management (continued)
81NOTES CONSOLIDATED FINANCIAL STATEMENTSROYAL UNIBREW ANNUAL REPORT 2018

Currency and interest rate risks and use of derivative financial instrumentsDerivative financial instruments entered into to hedge expected future transactions and qualifying as hedge accounting under IFRS 9:
Group (DKK '000) 2018 2017
Deferred Deferred gain (+) gain (+) Period / loss (-) / loss (-)
Forward contracts:
USD 0 - 1 year 0 -65
Total 0 -65
Commodity hedge:
Mainly aluminium 0 - 1 year -11,109 5,993
Total -11,109 5,993
Deferred Deferred gain (+) gain (+) Maturity / loss (-) / loss (-)
Interest rate swaps:
Mortgage and bank loans 0 - 2 year -6,206 -7,344
Total hedging instruments -17,315 -1,416
The derivative financial instruments applied in 2018 and 2017 may all be classified as level-2 instruments in the IFRS fair value hierarchy.
The determined fair value of derivative financial instruments is based on observable market data such as yield curves or forward rates.
Financial liabilities
Maturity Group Contractual Maturity > 1 year Maturity Carrying (DKK '000) cash flows < 1 year < 5 years > 5 years amount
31/12 2018
Non-derivative financial instruments:
Financial debt, gross 2,526,065 64,347 1,597,436 864,282 2,441,892
Leasing 233,391 59,487 173,904 224,991
Trade payables 974,930 974,930 974,930
Other payables 489,566 445,081 44,485 489,566
Total 4,223,952 1,543,845 1,815,825 864,282 4,131,379
The debt is broken down in the categories "debt at amortised cost" with DKK 4.124 million and "debt at fair value" with DKK 7 million.
31/12 2017
Non-derivative financial instruments:
Financial debt, gross 1,659,596 420,089 484,570 754,937 1,659,596
Interest expenses on financial debt 99,065 12,313 33,141 53,611
Trade payables 1,025,688 1,025,688 1,025,688
Other payables 363,333 350,373 12,960 363,333
Total 3,147,682 1,808,463 530,671 808,548 3,048,617
The debt is broken down in the categories "debt at amortised cost" with DKK 3,042 million and "debt at fair value" with DKK 7 million.
The fair value of the total debt is assessed to equal carrying amount.
Note 2 Financial risk management (continued)
82NOTES CONSOLIDATED FINANCIAL STATEMENTSROYAL UNIBREW ANNUAL REPORT 2018
Derivative financial instruments
Derivative financial instruments are initially recognized in the balance sheet at fair value and are subsequently remeasured at their fair values. Positive and negative fair values of derivative financial instruments are included as other receivables and other payables, respectively.
Changes in the fair values of derivative financial instruments that are designated and qualify as fair value hedges of a recognized asset or a recognized liability are recognized in the income statement as are any changes in the value of the hedged asset or the hedged liability.
Changes in the fair values of derivative financial instruments that are designated and qualify as hedges of future cash flows are recognized in other comprehensive income. Income and expenses relating to such hedging transactions are transferred from other comprehensive income on realization of the hedged item and are recognized in the same entry as the hedged item.
For derivative financial instruments which do not meet the criteria for hedge accounting, changes in fair values are recognized on a current basis in financial income and expenses in the income statement.
Derivative financial instruments
When entering into derivative financial instruments, Management exercises judgement to determine whether the instrument qualifies as effective hedging of recognized assets or liabilities or expected future cash flows. Derivative financial instruments recognized are tested for effectiveness at least quarterly, and any ineffective-ness identified is recognized in the income statement.
Note 2 Financial risk management (continued)
83NOTES CONSOLIDATED FINANCIAL STATEMENTSROYAL UNIBREW ANNUAL REPORT 2018

The Group’s results, assets and liabilities break down as follows on segments:
Western Inter- mDKK Europe Baltic Sea national Unallocated Total
2018
Net revenue* 3,378.1 3,338.0 582.0 7,298.1
Amortization and depreciation 137.5 176.8 17.3 2.4 334.0
Earnings before interest and tax (EBIT) 644.9 599.4 127.2 -32.1 1,339.4
Financial income 0.2 1.0 3.9 5.1
Financial cost -3.3 -11.3 -0.6 -21.1 -36.3
Share of income from associates 19.6 19.6
Profit/loss before tax 661.4 589.0 126.6 -49.3 1,327.7
Tax -287.8 -287.8
Profit/loss for the year 661.4 589.0 126.6 -337.1 1,039.9
Assets 2,690.8 5,166.2 80.2 0.0 7,937.2
Associates 124.5 124.5
Total assets 2,815.3 5,166.2 80.2 0.0 8,061.7
Additions of property, plant and equipment 206.8 113.9 0.2 0.0 320.9
Additions by change in accounting policy 73.2 132.0 0.1 205.3
Additions by acquisitions 206.5 6.6 213.1
Liabilities** 976.0 1,719.4 27.5 2,430.6 5,153.5
Sales (million hectolitres) 4.5 5.5 0.8 10.8
* all goods sold in International are produced by group entities in Western Europe
** Unallocated liabilities include the Parent Company's net interest-bearing debt.
Western Inter- mDKK Europe Baltic Sea national Unallocated Total
2017
Net revenue 2,829.0 3,076.0 479.4 6,384.4
Amortization and depreciation 83.9 193.6 13.3 2.4 293.2
Earnings before interest and tax (EBIT) 563.4 430.6 106.4 -31.8 1,068.6
Financial income 1.1 1.9 3.0
Financial cost -0,2 -14,3 -0,1 -19,8 -34,4
Share of income from associates 18.4 18.4
Profit/loss before tax 581.6 417.4 106.3 -49.7 1,055.6
Tax -224.9 -224.9
Profit/loss for the year 581.6 417.4 106.3 -274.6 830.7
Assets * 1,605.4 5,005.9 39.2 0.0 6,650.5
Associates 127.9 127.9
Total assets 1,733.3 5,005.9 39.2 0.0 6,778.4
Purchase of property, plant and equipment 139.9 113.8 0.1 253.8
Liabilities** 771.0 1,710.7 7.2 1,475.3 3,964.2
Sales (million hectolitres) 3.9 5.3 0.7 9.9
* Unallocated assets include project development properties.
** Unallocated liabilities include the Parent Company's interest-bearing debt.
Note 3 Segment reporting
84NOTES CONSOLIDATED FINANCIAL STATEMENTSROYAL UNIBREW ANNUAL REPORT 2018

Geographically, revenue and non-current assets break down as follows:
2018 2017 Net Non-current Net Non-current mDKK revenue assets revenue assets
Denmark 1,921.2 1,154.2 1,702.8 1,044.1
Italy 819.0 678.4 575.6 24.7
Finland 2,612.2 3,550.0 2,380.2 3,486.4
Other countries 1,945.7 1,391.9 1,725.8 566.0
Total 7,298.1 6,774.5 6,384.4 5,121.1
The geographic breakdown is based on the geographic location of the Group's external customers and com-prises countries that individually account for more than 10% of the Group's net revenue as well as the country in which the Group is headquartered.
No single customer accounts for revenue in excess of 10% of the Group's net revenue.
Note 3 Segment reporting (continued)
85NOTES CONSOLIDATED FINANCIAL STATEMENTSROYAL UNIBREW ANNUAL REPORT 2018

Note 3 Segment reporting (continued)
Segment reporting 2014 - 2018The Group’s activities break down as follows on segments: Western Inter- Un- mDKK Europe Baltic Sea national allocated Group
2018
Net revenue 3,378.1 3,338.0 582.0 7,298.1
Earnings before interest and tax (EBIT) 644.9 599.4 127.2 -32.1 1,339.4
Assets 2,815.3 5,166.2 80.2 8,061.7
Liabilities 976.0 1,719.4 27.5 2,430.6 5,153.5
Sales (million hectolitres) 4.5 5.5 0.8 10.8
2017
Net revenue 2,829.0 3,076.0 479.4 6,384.4
Earnings before interest and tax (EBIT) 563.4 430.6 106.4 -31.8 1,068.6
Assets 1,733.3 5,005.9 0.0 39.2 6,778.4
Liabilities 771.0 1,710.7 7.2 1,475.3 3,964.2
Sales (million hectolitres) 3.9 5.3 0.7 9.9
2016
Net revenue 2,870.3 2,986.0 484.1 6,340.4
Earnings before interest and tax (EBIT) 526.8 395.5 107.8 -29.4 1,000.7
Assets 1,051.5 4,985.9 0.0 38.6 6,076.0
Liabilities 248.6 1,697.4 6.2 1,212.3 3,164.5
Sales (million hectolitres) 3.8 5.4 0.7 9.9
Western Inter- Un- mDKK Europe Baltic Sea national allocated Group
2015
Net revenue 2,727.9 2,852.5 451.7 6,032.1
Earnings before interest and tax (EBIT) 493.3 355.4 101.8 -33.6 916.9
Assets 1,420.5 5,090.6 38.9 197.5 6,747.5
Liabilities 804.9 1,825.9 6.3 1,175.6 3,812.7
Sales (million hectolitres) 3.6 5.0 0.7 9.3
2014
Net revenue 2,674.6 2,974.8 406.5 6,055.9
Earnings before interest and tax (EBIT) 483.7 295.3 83.9 -36.7 826.2
Assets 1,688.8 5,064.3 32.3 238.4 7,023.8
Liabilities 883.9 1,816.7 4.7 1,500.2 4,205.5
Sales (million hectolitres) 3.7 4.9 0.6 9.2
Segment reporting
The Group’s business segment is beverage sales. Reporting on the business segment is by geographical mar-kets. Segment reporting is based on the Group’s returns and risks and its internal financial reporting system.
Items included in net profit for the year, including income from investments in associates and financial income and expenses, are allocated to the extent that the items are directly or indirectly attributable to the markets.
Items allocated both by direct and indirect computation comprise “production costs” and “administrative expenses”, which are allocated by indirect computation based on allocation keys determined on the basis of the market’s drain on key resources. Administrative expenses incurred in the group functions of the Parent Company are partly allocated.
Non-current assets comprise the non-current assets that are directly or indirectly used in connection with activities in the markets.
Segment liabilities comprise liabilities derived from activities in the market, including provisions, trade pay-ables, VAT, excise duties and other payables.
86NOTES CONSOLIDATED FINANCIAL STATEMENTSROYAL UNIBREW ANNUAL REPORT 2018

Note 4 Net revenue
DKK '000 2018 2017
Denmark and Germany 2,489,836 2,253,177
Southern Europe 888,301 575,566
Finland 2,612,150 2,380,234
Baltic countries 726,018 695,745
International 581,781 479,664
Total beverages sales and complementary goods* 7,298,086 6,384,386
* Including royalty income DKK 17 million (2017: DKK 17 million) equally allocated to Baltic countries and International.
Net revenue
Net revenue from the sale of goods is recognized in the income statement if delivery has been made by the balance sheet date, and if revenues can be measured reliably and are expected to be received.
Net revenue is measured exclusive of VAT and net of discounts as well as excise duties on beer and mineral water. Discounts comprise unit price reductions as well as contributions to promotional activities and product promotion based on volumes or value of purchases. The discounts are either granted as deductions from the invoice amount or are earned as a bonus paid at the end of the bonus period. All types of discounts granted are recognized in net revenue.
Note 5 Staff expenses
Staff expenses are included in production costs, sales and distribution expenses as well as administrative expenses and break down as follows:
DKK '000 2018 2017
Fixed salaries to Executive Board 10,203 22,994
Short-term bonus scheme for Executive Board 5,000 3,753
Share-based payments to Executive Board (restricted shares) 7,700 5,651
Remuneration of Executive Board 22,903 32,398
Remuneration of Board of Directors 3,945 3,977
26,848 36,375
Wages and salaries 875,781 767,050
Contributions to pension schemes 122,439 104,607
998,220 871,657
Other social security expenses 12,636 12,502
Other staff expenses 51,779 38,400
Total 1,089,483 958,934
Average number of employees 2,416 2,299
Comment
The share-based payments to the Executive Board in 2018 comprise a program of maximum of approx. 72.500 restricted (conditional) shares allotted for no consideration vesting in the period 1 January 2018 to 31 December 2019.
The number of shares is conditional on the extent to which the EBIT and free cash flow targets for the financial years 2017-2019 defined by the Board of Directors are achieved.
87NOTES CONSOLIDATED FINANCIAL STATEMENTSROYAL UNIBREW ANNUAL REPORT 2018

Note 5 Staff expenses (continued)
Share-based payments
The Group only has schemes classified as equity-settled schemes. Restricted shares are measured at fair value at the time of granting and are recognized in staff expenses in the income statement over the vesting period. The counter item is recognized directly in equity.
At the initial recognition of the restricted shares, the number of shares expected to vest is estimated. Sub-sequently, the estimate of the number of restricted shares is revised so that the total recognition is based on the actual number of shares allotted.
Share-based payments
The fair value of the expected allotment of restricted shares is estimated under the Black-Scholes model. In determining fair value, conditions and terms related to the restricted shares are taken into account.
The market value of program applying to 2017-2019 has been calculated under the Black-Scholes model partly at DKK 264 per share of DKK 2 and partly at DKK 370 per share of DKK 2, which is equal to the Royal Unibrew A/S market price at the time of allotments respectively 17 January 2017 and 6 March 2018. The market price is DKK 20 million for the maximum number of shares. The market value is charged to the income statement on a straight-line basis over the vesting period, corresponding to the rate at which the conditions for the allotment of the shares are expected to be met. The conditions are expected to be fully (100%) met at 31 December 2018.
Note 6 Expenses broken down by type
DKK '000 2018 2017
Aggregated
Production costs 3,471,098 3,084,314
Sales and distribution expenses 2,167,325 1,956,367
Administrative expenses 320,272 275,104
Total 5,958,695 5,315,785
break down by type as follows:
Raw materials and consumables 2,723,440 2,404,418
Wages, salaries and other staff expenses 1,089,483 958,934
Operating and maintenance expenses* 256,937 293,570
Intangible assets, low value and short term lease commitments* 21,703
Distribution expenses and carriage 460,060 412,034
Sales and marketing expenses 885,811 774,188
Bad trade debts 3,964 13,521
Office supplies etc 183,390 165,928
Amortization and depreciation* 333,907 293,192
Total 5,958,695 5,315,785
* The comparatives has not been adjusted for IFRS 16 implementation. Cost related to service, low value and short term lease commitments (2018: 21.7 million) was last year included in operating and maintenance expenses. Additional amortization and depreciation (2018: 58.1 million) was in the comparatives costs included in operating and maintenance expenses.
88NOTES CONSOLIDATED FINANCIAL STATEMENTSROYAL UNIBREW ANNUAL REPORT 2018

Note 6 Expenses broken down by type (continued)
Total amortization and depreciation are included in the following items in the income statement:
DKK '000 2018 2017
Production costs 173,001 192,479
Sales and distribution expenses 135,147 84,044
Administrative expenses 25,759 16,669
Total 333,907 293,192
Fee to auditors
Fee for the audit of the Annual Report:
KPMG (2017: Ernst & Young) 1,656 1,621
Total 1,656 1,621
KPMG (2017: Ernst & Young) fee for non-audit services:
Tax assistance 168
Other assistance* 2,285 673
Total 2,285 841
* Fees for other assistance than statutory audit of the financial statements provided by KPMG primarily comprise services relating to financial due dilligence.
Expenses
Production costsProduction costs comprise direct and indirect expenses incurred to manufacture the finished goods repre-senting revenue for the year, including expenses for raw materials and consumables purchases, salaries and wages, renting and leasing as well as depreciation of and impairment losses on plant and machinery.
Production costs also include development costs that do not meet the criteria for capitalization.
Sales and distribution expensesSales and distribution expenses comprise expenses for distribution and sales campaigns relating to goods sold during the year, including expenses for sales personnel, marketing, depreciation and amortization as well as losses on trade receivables.
Administrative expensesAdministrative expenses comprise expenses for management and administration of the Group, including ex-penses for administrative personnel, management, office supplies, insurance, depreciation and amortization.
Leases
The Group has applied IFRS 16 using the modified retrospective approach. Previously, the Group determined at contract inception whether an arrangement is or contains a lease under IFRIC 4. Under IFRS 16, the Group assesses whether a contract is or contains a lease based on the definition of a lease based on the assessment of whether:
• fulfilment of the arrangement was dependent on the use of a specific asset or assets; and
• the arrangement had conveyed a right to use the asset. An arrangement conveyed the right to use the
asset if one of the following was met:
• the purchaser had the ability or right to operate the asset while obtaining or controlling more than an
insignificant amount of the output;
• the purchaser had the ability or right to control physical access to the asset while obtaining or con-
trolling more than an insignificant amount of the output; or
• facts and circumstances indicated that it was remote that other parties would take more than an insig-
nificant amount of the output, and the price per unit was neither fixed per unit of output nor equal to the
current market price per unit of output.
On transition to IFRS 16, the Group elected to apply the practical expedient to grandfather the assessment of which transactions are leases. The Group applied the definition of a lease under IFRS 16 to contracts entered into or changed on or after 1 January 2018.
Note 7 Financial income
DKK '000 2018 2017
Finance income
Trade receivables 1,257 1,148
Other financial income 493 19
Exchange adjustments
Trade receivables 1,447
Trade payables 551
Intercompany loans 194 333
Forward contracts 1,683 997
Total 5,074 3,048
89NOTES CONSOLIDATED FINANCIAL STATEMENTSROYAL UNIBREW ANNUAL REPORT 2018

Note 8 Financial expenses
DKK '000 2018 2017
Finance costs
Mortgage debt 8,168 13,614
Credit institutions 20,013 12,201
Leasing 2,095
Finance cost on liabilities at amortised cost 30,276 25,815
Other financial expenses 2,763 2,911
Exchange adjustments
Cash at bank and in hand and external loans 2,319 1,888
Trade receivables 3,624
Trade payables 832
Forward contracts 156 209
Total 36,346 34,447
Financial income and expenses
Financial income and financial expenses comprise interest, capital gains and losses on investments, balances and transactions in foreign currencies, amortization of financial assets and liabilities, fair value adjustments of derivative financial instruments that do not qualify as hedge accounting as well as extra payments and repayment under the on-account taxation scheme, etc.
Note 9 Tax on the profit for the year
DKK '000 2018 2017
Tax on the taxable income for the year 276,642 209,133
Adjustment of previous year -261 -1,300
Adjustment of deferred tax 5,281 16,909
Total 281,662 224,742
which breaks down as follows:
Tax on profit for the year 287,780 224,961
Tax on other comprehensive income -3,092 1,537
Tax on changes in equity, shareholders -3,026 -1,756
Total 281,662 224,742
Current Danish tax rate 22.0 22.0
Adjustment of previous year 0.0 0.1
Income from associates after tax -0.3 -0.4
Effect on tax rate of permanent differences 0.6 0.5
Differences in effective tax rates of foreign subsidiaries -0.6 -0.9
Effective tax rate 21.7 21.3
Tax on the profit for the year
Tax for the year consists of current tax for the year and movements in deferred tax for the year. The tax at-tributable to the profit for the year is recognized in the income statement and other comprehensive income, respectively, whereas the tax attributable to equity entries is recognized directly in equity.
The Parent Company is jointly taxed with its Danish subsidiaries. The Danish current tax for the year is allo-cated to the jointly taxed Danish enterprises in proportion to their taxable incomes (full allocation with credit for tax losses).
Corporation tax
Current tax liabilities are recognized in the balance sheet as calculated tax on the expected taxable income for the year adjusted for tax on taxable incomes for previous years and for tax paid on account.
90NOTES CONSOLIDATED FINANCIAL STATEMENTSROYAL UNIBREW ANNUAL REPORT 2018

Note 11 Intangible assets
Distribution Customer DKK '000 Goodwill Trademarks rights relations Total
2018
Cost at 1 January 2018 1,451,150 1,238,132 234,536 67,606 2,991,424
Exchange adjustment 5,625 4,901 653 125 11,304
Additions 20,860 20,860
Addition by acquisition 668,116 511,283 60,000 1,239,399
Cost at 31 December 2018 2,124,891 1,775,176 235,189 127,731 4,262,987
Amortization and impairment losses at 1 January 2018 0 -6,065 -64,444 -58,849 -129,358
Exchange adjustment -21 -79 -59 -159
Amortization for the year -10,907 -14,678 -25,585
Amortization and impairment losses at 31 December 2018 0 -6,086 -75,430 -73,586 -155,102
Carrying amount at 31 December 2018 2,124,891 1,769,089 159,759 54,145 4,107,884
2017
Cost at 1 January 2017 1,449,465 1,236,535 234,222 67,511 2,987,733
Exchange adjustment 1,685 1,597 314 95 3,691
Cost at 31 December 2017 1,451,150 1,238,132 234,536 67,606 2,991,424
Amortization and impairment losses at 1 January 2017 0 -6,205 -52,139 -45,268 -103,612
Exchange adjustment 140 -139 -72 -71
Amortization for the year -12,166 -13,509 -25,675
Amortization and impairment losses at 31 December 2017 0 -6,065 -64,444 -58,849 -129,358
Carrying amount at 31 December 2017 1,451,150 1,232,067 170,092 8,757 2,862,066
Note 10 Realized hedging transactions in the income statement
DKK '000 2018 2017
Realized hedging transactions are included in the income statement as follows:
Net revenue includes currency hedges of -3,754 -1,829
Production costs include foreign currency and commodity hedges of 7,206 21,267
Financial income and expenses include currency, commodity and interest rate hedges of -4,218 -7,269
Total -766 12,169
Hedging of currency, commodity and Interest riskThe risk is managed by entering into derivatives such as forward contracts and SWAPS.
Hedge effectiveness is assessed on a regular basis by comparing changes in the value and timing of the underlaying exposure, with the value and timing of the designated hedging transaction.
91NOTES CONSOLIDATED FINANCIAL STATEMENTSROYAL UNIBREW ANNUAL REPORT 2018

Impairment test of goodwill and trademarks
2018As in 2017, the impairment test in 2018 did not give rise to recognizing any impairment losses.
The carrying amount of goodwill and trademarks with indefinite useful lives at 31 December is related to the cash-generating operational units and breaks down as follows:
DKK '000 Goodwill Trademarks Total Share
2018
Western Europe 750,380 534,821 1,285,201 33%
Baltic Sea* 1,367,781 1,234,268 2,602,049 67%
International 6,740 6,740 0%
Total 2,124,901 1,769,089 3,893,990 100%
*the most significant value relates to Finland
The recoverable amount is based on value in use, which is calculated by means of expected net cash flows on the basis of budgets and forecasts for 2019-2021 approved by Management as well as estimated market driven discount rates and growth rates.
Only limited revenue growth is expected in the medium term as consumption in the total beverage market in several of Royal Unibrew's markets is not expected to increase significantly. In Western Europe the danish consumption of Royal Unibrews beverage categories is expected to be stagnant in the coming years. In the Baltic Sea segment Royal Unibrew expect unchanged Finnish consumption for 2019 not taking the weather impact into consideration, while the consumption in the Baltic countries will still be negatively affected by legislative changes and the demographic development. Through continued focus on exploiting commercial opportunities and innovation following the consumer trends, Royal Unibrew expects to be able to maintain or increase the revenue and earnings from the core brands and business areas. Gross margins are expected to remain stable at the present level through continuous focus on value management and continuous efficiency improvements. The key assumptions for the calculation of recoverable amount are shown below.
Western Inter- Europe Baltic Sea national
Growth rate 2022-2025 0-1% 0-1% 0%
Growth rate on terminal value 1,5-2% 1,5-1,8% 2%
Discount rate pre tax 5,9-8,6% 6,0-7,6% 15.3%
Note 11 Intangible assets (continued)
Comment
Goodwill and trademarks with indefinite useful lives relating to Hartwall (Finland) represents more than 10% of the total value of goodwill and trademarks.
Development costs incurred are immaterial and have been recognized in production costs.
Goodwill
Goodwill is initially recognized in the balance sheet at cost. Subsequently, goodwill is measured at cost less accumulated impairment losses.
The carrying amount of goodwill is allocated to the Group's cash-generating units at the time of acquisition. The determination of cash-generating units is based on management structure and internal financial management.
Trademarks, distribution rights and customer relations
Trademarks, distribution rights and customer relations are initially recognized in the balance sheet at cost. Subsequently, they are measured at cost less accumulated amortization and less any accumulated impair-ment losses. Distribution rights and customer relations are amortised on a straight-line basis over their estimated useful lives.
Trademarks are not amortised as they are all well-established, old and profitable trademark designs which customers are expected to continue demanding unabatedly, other things being equal, and which Management is not planning to stop selling and marketing.
Distribution rights are amortised on a straight-line basis over their estimated useful lives, maximum 20 years. Customer relations are amortised on a straigt-line basis over their estimated useful lives, maximum 5 years.
Goodwill and trademarks with indefinite useful lives are not amortised but are tested annually for impairment. It is the Group's strategy to maintain trademarks and their value.
92NOTES CONSOLIDATED FINANCIAL STATEMENTSROYAL UNIBREW ANNUAL REPORT 2018

The forecasted results approved by Management are based on previously achieved results and expected market developments, see above. The average growth rates applied are in accordance with Management's expectations taking into account industry conditions in the individual markets. The discount rates applied are before tax and reflect current specific risks in the individual market. In Baltic Sea, the lowest point of the range indicated for the growth rates of terminal value and discount rate relates to Finland. The assumptions applied by Management are inherently subject to uncertainty and unpredictability. Reasonably probable changes will not lead to recognition of impairment losses, consequently no sensitivity analysis has been disclosed.
Impairment
The carrying amounts of intangible assets and property, plant and equipment are reviewed on an annual basis to determine whether impairment has incurred other than that expressed by normal amortization and depreciation. If so, the asset is written down to the higher of net selling price and value in use. Goodwill and other assets for which a value in use cannot be determined as the asset does not on an individual basis generate future cash flows are reviewed for impairment together with the group of assets (cash-generating units) to which they are attributable.
The carrying amount of goodwill and trademarks with indefinite useful lives is tested for impairment at least on an annual basis, together with the other non-current assets of the cash-generating unit to which goodwill has been allocated, and is written down to recoverable amount in the income statement if the carrying amount exceeds the recoverable amount.
The carrying amount of financial assets measured at cost or amortised cost is written down for impairment if, due to changed expected net payments, the net present value is lower than the carrying amount.
Intangible assets
In relation to trademarks, Management makes an annual judgement to determine whether the current market situation has reduced the value or affected the useful life of the trademarks, including whether past estimates of indefinite useful lives may be maintained.
An annual impairment test is made of the values recognized in the Financial Statements of goodwill and trade-marks assessed to have indefinite lives which are therefore not amortised. For a description of the discount rates and growth rates applied in connection with the impairment test of goodwill and trademarks as well as other assumptions of the impairment test, reference is made to the above note.
Note 11 Intangible assets (continued)
The forecasted results approved by Management are based on previously achieved results and expected market developments, see above. The average growth rates applied are in accordance with Management's expectations taking into account industry conditions in the individual markets. The discount rates applied are before tax and reflect current specific risks in the individual market. External consultants have advised how to determin the discount rates. In Western Europe, the highest point of the range indicated for the discount rate relates to Italy. In Baltic Sea, the lowest point of the range indicated for the growth rates of terminal value and discount rate relate to Finland. The assumptions applied by Management are inherently subject to uncertainty and unpredictability. Reasonably probable changes will not lead to recognition of impairment losses, consequently no sensitivity analysis has been disclosed.
2017DKK '000 Goodwill Trademarks Total Share
2017
Western Europe 80,645 1,500 82,145 3%
Baltic Sea* 1,363,668 1,230,567 2,594,235 97%
International 6,837 6,837 0%
Total 1,451,150 1,232,067 2,683,217 100%
*the most significant value relates to Finland
The recoverable amount is based on value in use, which is calculated by means of expected net cash flows on the basis of budgets and forecasts for 2018-2020 approved by Management as well as estimated market driven discount rates and growth rates.
Only limited revenue growth is expected in the medium term as consumption in the total beverage market in several of Royal Unibrew's markets is not expected to increase significantly. In the Baltic Sea segment unchanged consumption is expected for 2018 and 2019 in both Finland and the Baltic countries disregard-ing the effect of summer weather variations. Through continued focus on exploiting commercial opportu-nities and innovation, Royal Unibrew expects to be able to maintain its revenue and earnings at the present level excluding extraordinary campaigns in Finland. Slightly increasing revenue and earnings are expected for the Baltic countries as compared to the present level. Gross margins are expected to remain stable at the present level through continuous focus on value management and continuous efficiency improvements. The key assumptions for the calculation of recoverable amount are shown below.
Western Inter- Europe Baltic Sea national
Growth rate 2021-2024 1% 0-1% 0%
Growth rate on terminal value 2% 1,5-1,8% 2%
Discount rate pre tax 6.6% 6,6-7,9% 15.3%
93NOTES CONSOLIDATED FINANCIAL STATEMENTSROYAL UNIBREW ANNUAL REPORT 2018

Other fixtures Property, Leasing of Total and fittings, plant and property, property, 2018 Land and Plant and tools and equipment plant and plant and DKK '000 buildings machinery equipment in progress equipment equipment
Cost at 1 January 2018 1,739,975 2,286,795 819,657 72,795 4,919,222Exchange adjustment 3,561 3,889 1,142 99 534 9,225Additions 16,535 70,698 102,345 70,840 60,459 320,877Additions by change in accounting policy 205,301 205,301Additions by acquisitions 63,077 83,846 6,598 42,337 17,278 213,136Disposals -2,097 -21,486 -38,335 -3,048 -64,966Transfers for the year 20,482 15,681 8,815 -44,978 0Cost at 31 December 2018 1,841,533 2,439,423 900,222 141,093 280,524 5,602,795
Depreciation, revaluation and impairment losses at 1 January 2018 -675,048 -1,539,499 -583,124 0 0 -2,797,671Exchange adjustment -1,217 -2,723 -918 68 -4,790Depreciation for the year -52,503 -112,831 -97,146 -58,094 -320,574Reversal of depreciation of assets sold 1,350 19,595 28,818 254 50,017Depreciation, revaluation and impairment losses at 31 December 2018 -727,418 -1,635,458 -652,370 0 -57,772 -3,073,018
Carrying amount at 31 December 2018 1,114,115 803,965 247,852 141,093 222,752 2,529,777
Leasing of property, plant and equipment: Cost at 31 December 2018 162,549 117,974 280,524
Depreciation, revaluation and impairment losses at 31 December 2018 -28,262 -29,510 -57,772 Carrying amount per asset type 134,287 88,464 222,752
Land and buildings at a carrying amount of DKK 932 million have been provided as security for mortgage debt of DKK 857 million.
Contracts for the delivery of property, plant and equipment in 2019 have been entered into only to an imma-terial extent.
Note 12 Property, plant and equipment
Other fixtures Property, Total and fittings, plant and property, 2017 Land and Plant and tools and equipment plant and DKK '000 buildings machinery equipment in progress equipment
Cost at 1 January 2017 1,728,267 2,151,258 769,934 94,068 4,743,527
Exchange adjustment 1,484 1,347 381 20 3,232
Additions 12,024 99,231 93,930 48,586 253,771
Disposals -4,726 -17,996 -58,586 -81,308
Transfers for the year 2,926 52,955 13,998 -69,879 0
Cost at 31 December 2017 1,739,975 2,286,795 819,657 72,795 4,919,222
Depreciation, revaluation and impairment losses at 1 January 2017 -621,860 -1,431,900 -547,593 0 -2,601,353
Exchange adjustment -382 -815 -308 -1,505
Depreciation for the year -55,039 -124,354 -91,597 -270,990
Reversal of depreciation of assets sold 2,233 17,570 56,374 76,177
Depreciation, revaluation and impairment losses at 31 December 2017 -675,048 -1,539,499 -583,124 0 -2,797,671
Carrying amount at 31 December 2017 1,064,927 747,296 236,533 72,795 2,121,551
Land and buildings at a carrying amount of DKK 932 million have been provided as security for mortgage debt of DKK 862 million.
Contracts for the delivery of property, plant and equipment in 2018 have been entered into only to an imma-terial extent.
94NOTES CONSOLIDATED FINANCIAL STATEMENTSROYAL UNIBREW ANNUAL REPORT 2018

Property, plant and equipment (continued)
Land and buildings, plant and machinery and other fixtures and fittings, tools and equipment are measured at cost less accumulated depreciation and less any accumulated impairment losses. Borrowing costs relating to the acquisition of property, plant and equipment are capitalized.
Depreciation is calculated on a straight-line basis over the useful lives of the assets.
Profits and losses on the disposal of property, plant and equipment are calculated as the difference between the sales sum less the expenses necessary to make the sale and the carrying amount at the time of sale. Profits or losses were immaterial in both 2018 and 2017 and have been recognized in the income statement as an adjustment to depreciation in production costs, sales or distribution expenses or administrative expenses, respectively.
Property, plant and equipment
The expected useful lives of the assets remain unchanged from 2018 and are as follows:
Buildings and installations, 25-40 years
Leasing of propoperty, plant and equipment over the term of the lease
Plant and machinery, 10-15 years
Other fixtures and fittings, tools and equipment, 5-8 years
Vehicles 4-5 years
IT hardware and software 3 years
Returnable packaging, 3-10 years
Management updates its estimate of the useful lives of property, plant and equipment annually.
Leases
We have applied IFRS 16 with a date of initial application of 1 January 2018. As a result, the Group has changed its accounting policy for lease contracts. As a lessee, the Group previously classified leases as operating or finance leases based on its assessment of whether the lease transferred significantly all of the risks and rewards incidental to ownership of the underlying asset to the Group. Under IFRS 16, the Group recognizes right-of-use assets and lease liabilities for most leases – i.e. these leases are on-balance sheet. The Group decided to apply the recognition exemptions to short-term and low value leases. For leases of other assets, which were classified as operating under IAS 17, the Group recognized right-of-use assets and lease liabil-ities. For leases that were not covered by the recognition exemptions under IFRS 16, the Group recognized right-of-use assets and lease liabilities measured under IFRS 16.The Group also tested right-of-use assets for impairment, and did not recognized an impairment loss for some assets in 2018.
Note 12 Property, plant and equipment
95NOTES CONSOLIDATED FINANCIAL STATEMENTSROYAL UNIBREW ANNUAL REPORT 2018

Investments DKK '000 in associates
Cost at 1 January 2018 75,748
Cost at 31 December 2018 75,748
Value adjustments at 1 January 2018 52,163
Exchange adjustment -2,083
Dividend, net -21,412
Share of profit for the year 19,607
Other comprehensive income 439
Value adjustments at 31 December 2018 48,714
Carrying amount at 31 December 2018 124,462
Cost at 1 January 2017 75,748
Cost at 31 December 2017 75,748
Value adjustments at 1 January 2017 68,230
Exchange adjustment -8,156
Dividend, net -26,735
Share of profit for the year 18,418
Other comprehensive income 406
Value adjustments at 31 December 2017 52,163
Carrying amount at 31 December 2017 127,911
Financial disclosures on associates
Financial disclosures are provided on an aggregated basis for all associates as none of Royal Unibrew's shares of net revenue or balance sheet total constitute more than 5% in proportion to the Consolidated Financial Statements; therefore, it is not considered essential to provide disclosures separately for each associate.
Royal Unibrew's share of:
DKK '000 2018 2017
Profit from continuing operations for the year 19,607 18,418
Other comprehensive income 439 406
Comprehensive income 20,046 18,824
Total carrying amount at 31 December of the Group's total investments in associates, share of equity 124,462 127,911
Investments in associates in the Consolidated Financial Statements
Investments in associates are measured in the balance sheet at the proportionate share of the net asset value of the enterprises calculated under the accounting policies of the Group with deduction or addition of the proportionate share of unrealized intercompany profits and losses and with addition of the carrying amount of goodwill.
Associates with a negative net asset value are measured at DKK 0. If the Group has a legal or constructive obligation to cover the negative balance of the associate, this obligation is recognized in liabilities.
The proportionate share of the results of associates is recognized in the income statement of the Group after adjusting for impairment losses on goodwill and eliminating the proportionate share of unrealized intercom-pany gains and losses.
Note 13 Investments in associates
96NOTES CONSOLIDATED FINANCIAL STATEMENTSROYAL UNIBREW ANNUAL REPORT 2018

Other Other Total other invest- recei- fixed asset DKK '000 ments vables investments
Cost at 1 January 2018 59,622 2,243 61,865
Exchange adjustment 15 -1 14
Additions 2,812 2,812
Disposals -20 -34 -54
Cost at 31 December 2018 59,617 5,020 64,637
Value adjustments at 1 January 2018 -51,884 -363 -52,247
Value adjustments at 31 December 2018 -51,884 -363 -52,247
Carrying amount at 31 December 2018 7,733 4,657 12,390
Cost at 1 January 2017 56,788 2,703 59,491
Exchange adjustment 2,836 -19 2,817
Additions 32 32
Disposals -2 -473 -475
Cost at 31 December 2017 59,622 2,243 61,865
Value adjustments at 1 January 2017 -49,054 -363 -49,417
Exchange adjustment -2,830 0 -2,830
Value adjustments at 31 December 2017 -51,884 -363 -52,247
Carrying amount at 31 December 2017 7,738 1,880 9,618
Other investments
Other investments not included in the Group's trading portfolio are recognized in non-current assets at fair value at the trading date and are subsequently measured at fair value equal to the market price as regards listed securities and at estimated fair value calculated on the basis of market data and recognized valuation methods as regards to unlisted securities. Value adjustments and impairment losses and reversal of im-pairment losses are recognized in other comprehensive income without recycling to profit and loss. Other investments may be classified as level-3 instruments.
Other receivables
Other receivables under fixed asset investments held to maturity are initially recognized at fair value and are subsequently measured at amortised cost or an estimated lower value at the balance sheet date.
Other investments
In connection with the presentation of the Financial Statements for 2011, Management estimated the fair value of its investments (48% of the share capital) in the Polish brewery company Perla Browary Lubelskie at DKK 0 due to governance issues. Since 2011, Management has maintained its fair value estimate of DKK 0 as these issues have not subsequently been resolved. The consolidated financial statements of Perla Browary Lubelskie S.A. for 2017 have been prepared on the basis of Polish accounting law and show a profit after tax of PLN 62 million (DKK 107 million) and equity of PLN 287 million (DKK 498 million). The fair value measurement of the investments in Perla Browary Lubelskie is classified in level 3 of the fair value hierarchy.
Note 14 Other fixed asset investments
97NOTES CONSOLIDATED FINANCIAL STATEMENTSROYAL UNIBREW ANNUAL REPORT 2018

DKK '000 2018 2017
Raw materials and consumables 202,658 134,563
Work in progress 21,809 21,808
Finished goods and goods for resale 215,209 178,967
Inventories 439,676 335,338
Inventories
Indirect production costs are recognized in the value of work in progress and finished goods at DKK 17 million (2017: DKK 19 million). As in 2017, write down of inventories is an insignifcant amount.
Inventories
Inventories are measured at the lower of cost under the FIFO method and net realisable value of individual product groups. The net realisable value of inventories is calculated at the amount of future sales revenues expected to be generated by inventories at the balance sheet date in the process of normal operations and determined allowing for marketability, obsolescence and development in expected sales sum with deduction of calculated selling expenses.
The cost of raw materials, consumables, goods for resale and purchased finished goods comprises invoiced price plus expenses directly attributable to the acquisition.
The cost of work in progress and finished goods comprises the cost of materials and direct labour with addi-tion of indirect production costs. Indirect production costs comprise the cost of indirect materials and labour as well as maintenance and depreciation of and impairment losses on the machinery, factory buildings and equipment used in the manufacturing process as well as costs of factory administration and management.
DKK '000 2018 2017
Trade receivables 626,975 558,409
Other receivables 39,503 29,032
Receivables 666,478 587,441
The total receivables belong to the category "assets measured at amortised cost".
Trade receivables fall due as follows:
Not due and Due Due Due > prepaid bonus 1-15 days 16-90 days 90 days Total
2018 Trade receivables 470,144 116,504 38,946 39,851 665,445 Impairment provision* -11,082** -5,652 -5,089 -16,647 -38,470 Impairment provision % *** -2.4% -4.9% -13.1% -41.8% -5.8%
Provisions for bad debts, beginning of year -37,533Bad debts realized during the year 1,914Provision for the year -2,851Total -38,470
* Lifetime expected credit loss.
** Hereof TDKK 9.861 (2.1%) relates to prepaid bonus
*** Historical average loss rate is approx. 1%
2017Trade receivables 463,674 83,268 16,666 32,334 595,942Impairment provision -11,168* -3,017 -3,338 -20,010 -37,533 Impairment provision %** -2.4% -3.6% -20.0% -61.9% -6.3%
Provisions for bad debts, beginning of year -30,988Bad debts realized during the year 5,249Provision for the year -11,794
Total -37,533
* Hereof TDKK 11.168 (2.4%) relates to prepaid bonus
** Historical average loss rate is approx. 1,2%
Current receivables, other than trade receivables, all fall due for payment in 2018.
Note 15 Inventories Note 16 Receivables
98NOTES CONSOLIDATED FINANCIAL STATEMENTSROYAL UNIBREW ANNUAL REPORT 2018

Receivables
Trade receivables and contract assets are measured at amortized cost less allowance for lifetime expected credit losses.
To measure the expected credit losses, trade receivables have been grouped based on shared credit risk characteristics and the days past due. Furthermore, an allowance for lifetime expected credit losses for trade receivables is recognized on initial recognition.
Trade receivables and contract assets are written off when all possible options have been exhausted and there is no reasonable expectation of recovery.
The cost of allowances for expected credit losses and write-offs for trade receivables and contract assets are included in Sales and distribution costs.
Trade receivables
In 2018, allowances have been recognized according to the lifetime expected credit loss method, whereas the allowances in 2017 were recognized according to the incurred loss method. The transition to lifetime expected credit losses has had only an insignificant impact on allowances as of 1 January 2018.
Note 17 Prepayments
DKK '000 2018 2017
Prepayments 35,842 33,693
Prepayments
Prepayments recognized in assets comprise expenses incurred in respect of subsequent financial years.
Treasury shares held by the Parent Company:
DKK '000 Number Nom. value % of capital
Portfolio at 1 January 2018 1,503,487 3,007 2.9
Additions 1,119,910 2,240 2.2
Capital reduction -1,700,000 -3,400 -3.3
Portfolio at 31 December 2018 923,397 1,847 1.8
Portfolio at 1 January 2017 1,603,107 3,206 3.0
Additions 1,600,380 3,201 3.2
Capital reduction -1,400,000 -2,800 -2.7
Used for incentive pay -300,000 -600 -0.6
Portfolio at 31 December 2017 1,503,487 3,007 2.9
The Group holds no other treasury shares.
Basis of calculation of earnings and cash flow per share
2018 2017
The Parent Company shareholders' share of profit for the year amounts to (DKK '000) 1,040,915 830,659
The average number of treasury shares amounted to (number, DKK 2 each) 1,165,153 1,276,331
The average number of shares in circulation amounted to (number) 50,472,347 51,948,669
The average number of shares in circulation incl restricted shares amounted to (number) 50,562,847 52,012,869
Cost of share buy-backs during the year 484,090 507,589
The share capital has been fully paid.
Diluted earnings and cash flow per share have been calculated on the basis of the Parent Company shareholders' share of profit/loss for the year.
Comment
Shares were bought back during the year as an element in the optimization of the Company's capital structure. It is the intention to cancel the bought-back shares to the extent that they are not to be used for share-based payment to the Executive Board.
Note 16 Receivables (continued) Note 18 Equity and basis of earnings/cash flow per share
99NOTES CONSOLIDATED FINANCIAL STATEMENTSROYAL UNIBREW ANNUAL REPORT 2018
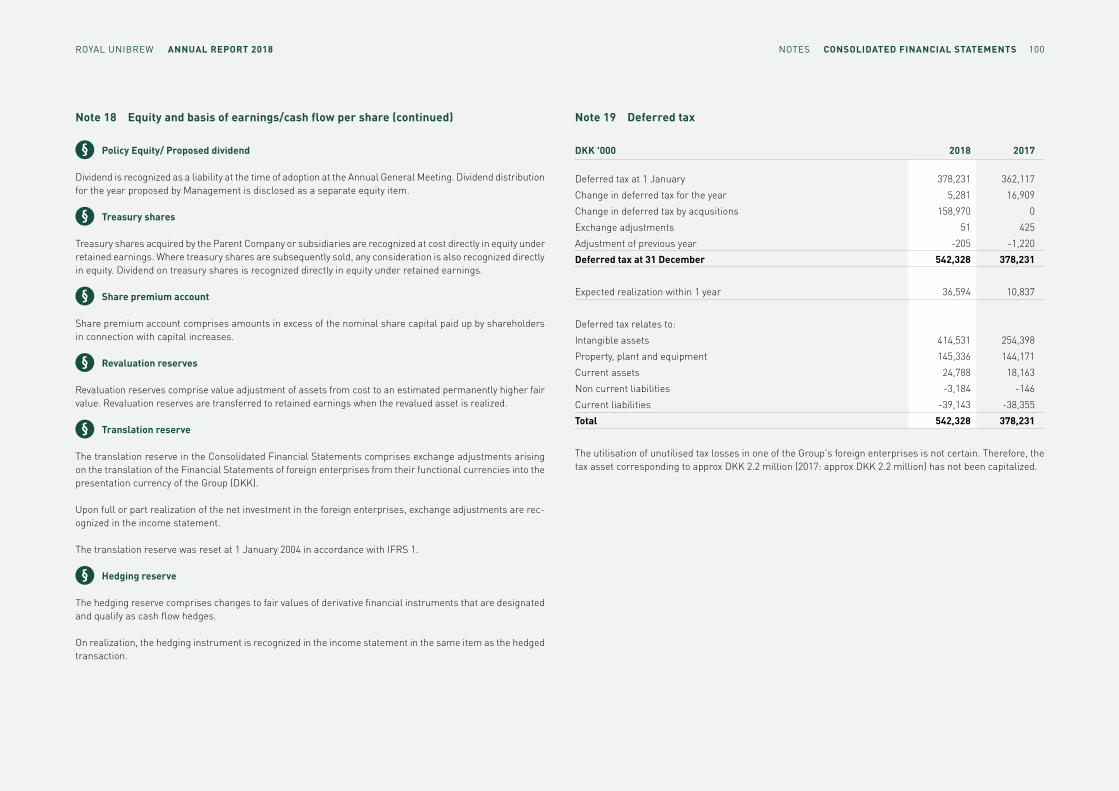
DKK '000 2018 2017
Deferred tax at 1 January 378,231 362,117
Change in deferred tax for the year 5,281 16,909
Change in deferred tax by acqusitions 158,970 0
Exchange adjustments 51 425
Adjustment of previous year -205 -1,220
Deferred tax at 31 December 542,328 378,231
Expected realization within 1 year 36,594 10,837
Deferred tax relates to:
Intangible assets 414,531 254,398
Property, plant and equipment 145,336 144,171
Current assets 24,788 18,163
Non current liabilities -3,184 -146
Current liabilities -39,143 -38,355
Total 542,328 378,231
The utilisation of unutilised tax losses in one of the Group's foreign enterprises is not certain. Therefore, the tax asset corresponding to approx DKK 2.2 million (2017: approx DKK 2.2 million) has not been capitalized.
Policy Equity/ Proposed dividend
Dividend is recognized as a liability at the time of adoption at the Annual General Meeting. Dividend distribution for the year proposed by Management is disclosed as a separate equity item.
Treasury shares
Treasury shares acquired by the Parent Company or subsidiaries are recognized at cost directly in equity under retained earnings. Where treasury shares are subsequently sold, any consideration is also recognized directly in equity. Dividend on treasury shares is recognized directly in equity under retained earnings.
Share premium account
Share premium account comprises amounts in excess of the nominal share capital paid up by shareholders in connection with capital increases.
Revaluation reserves
Revaluation reserves comprise value adjustment of assets from cost to an estimated permanently higher fair value. Revaluation reserves are transferred to retained earnings when the revalued asset is realized.
Translation reserve
The translation reserve in the Consolidated Financial Statements comprises exchange adjustments arising on the translation of the Financial Statements of foreign enterprises from their functional currencies into the presentation currency of the Group (DKK).
Upon full or part realization of the net investment in the foreign enterprises, exchange adjustments are rec-ognized in the income statement.
The translation reserve was reset at 1 January 2004 in accordance with IFRS 1.
Hedging reserve
The hedging reserve comprises changes to fair values of derivative financial instruments that are designated and qualify as cash flow hedges.
On realization, the hedging instrument is recognized in the income statement in the same item as the hedged transaction.
Note 19 Deferred taxNote 18 Equity and basis of earnings/cash flow per share (continued)
100NOTES CONSOLIDATED FINANCIAL STATEMENTSROYAL UNIBREW ANNUAL REPORT 2018

Deferred tax
Deferred tax is recognized in respect of all temporary differences between the carrying amounts and the tax base of assets and liabilities except for temporary differences arising at the time of acquisition that do not affect the profit for the year or the taxable income and temporary differences concerning goodwill. In cases where the computation of the tax base may be made according to alternative tax rules, deferred tax is measured on the basis of the intended use of the asset or settlement of the liability, respectively.
Deferred tax assets are recognized at the value at which they are expected to be realized, either by elimination in tax on future earnings or by set-off against deferred tax liabilities.
Deferred tax is measured on the basis of the tax rules and tax rates expected under the legislation at the balance sheet date to be effective when the deferred tax crystallises as current tax.
In the balance sheet, set-off is made between deferred tax assets and deferred tax liabilities within the same legal tax entity and jurisdiction.
DKK '000 2018 2017
VAT, excise duties, etc. 324,808 388,339
Other payables 445,081 350,373
Deposit, returnable packaging 128,799 128,224
Total other current payables 898,688 866,936
Deposit, returnable packaging is specified as follows:
Balance at 1 January 128,224 125,725
Adjustment for the year 575 2,499
Balance at 31 December 128,799 128,224
Comment
The change in the deposit on returnable packaging for the year reflects the net exchange with customers of returnable packaging for the year less estimated wastage of returnable packaging in circulation.
The payable relating to deposit on returnable packaging is calculated on the basis of the estimated total packaging volume less packaging held in inventory.
Deposit, returnable packaging
Plastic crates, bottles and kegs in circulation and held in inventory are recognized in property, plant and equip-ment, and the obligation to repay the deposit when the packaging in circulation is taken back on inventory is recognized in other payables.
Note 19 Deferred tax (continued) Note 20 Other current payables
101NOTES CONSOLIDATED FINANCIAL STATEMENTSROYAL UNIBREW ANNUAL REPORT 2018

DKK '000 2018 2017
Mortgage debt 858,919 862,048 Credit institutions 1,807,965 797,548 Other debts 1,927,864 1,905,584 Debts 4,594,748 3,565,180
Note 21 Debts
Changes to interest-bearing debts 1/1 2018 Additions by Exchange 31/12 2017 IFRS 16 acquisitions Repayment New facilities adjustment 31/12 2018
Interest-bearing long-term debts 1,239,507 54,898 1,099,917 3,103 2,397,425Interest-bearing short-term debts 420,089 45,693 -421,559 245 44,468Total interest-bearing debt, mortgage and credit institutions 1,659,596 100,591 -421,559 1,099,917 3,348 2,441,893Interest-bearing long-term leasing debt 154,447 11,656 -55,601 57,002 167,504Interest-bearing short-term leasing debt 50,853 3,386 3,248 57,487Total interest-bearing leasing debt 205,300 15,042 -55,601 60,250 0 224,991Total 1,659,596 205,300 115,633 -477,160 1,160,167 3,348 2,666,884
Exchange 31/12 2016 Repayment New facilities adjustment 31/12 2017
Interest-bearing long-term debts 859,220 -240,000 619,897 390 1,239,507Interest-bearing short-term debts 138,736 281,377 -24 420,089Total 997,956 -240,000 901,274 366 1,659,596
Debts
Mortgage loans and loans from credit institutions are recognized initially at fair values. Subsequently, the financial obligations are measured at amortised cost equal to the capitalized value using the effective interest method; the difference between the proceeds and the nominal value is recognized in financial income and expenses in the income statement over the loan period.
Other debts, comprising trade payables, payables to subsidiaries and associates, VAT, excise duties, etc as well as other payables, are measured at amortised cost, substantially corresponding to the nominal debt.
Debts
In connection with the acquisition of Hartwall in 2013, defined benefit liabilities were acquired relating to a pension scheme which has not been offered to new employees for a number of years. At 31 December 2018, the net liability amounted to approx DKK 8.6 million (2017: approx DKK 8.5 million). Taking into account the amount of the liability, that it has been at the same level in recent years and that it is being phased out, Management does not consider it material to provide the disclosures on the composition of the liability required by IAS 19.
102NOTES CONSOLIDATED FINANCIAL STATEMENTSROYAL UNIBREW ANNUAL REPORT 2018

mDKK 2018 2017
Rental and operating lease commitments
Total future payments:
Within 1 year 11.0 52.2
Between 1 and 5 years 16.4 91.1
Beyond 5 years 0.5 2.0
Total 27.9 145.3
Rental and operating lease commitments relate to low value assets and service not included under IFRS 16.
Third-party guarantees 26.5 12.0
SecurityNo security has been provided in respect of loan agreements with credit institutions.
As regards security for loan agreements with mortgage credit institutes, reference is made to note 12.
Contingent liabilitiesThe outcome of pending legal actions is not expected to have any material impact on the financial position of the Group.
Note 23 Contingent liabilities, security and other liabilities
Adjustments for non-cash operating items:
DKK '000 2018 2017
Adjustments for non-cash operating items:Financial income -5,074 -3,048Financial expenses 36,346 34,447Amortization, depreciation and impairment of intangible assets and property, plant and equipment (see note 12 re leasing part) 346,160 296,665Tax on the profit for the year 287,780 224,961Income from investments in associates -19,607 -18,418Profit and loss from sale of property, plant and equipment -12,253 -3,474
Share-based payments and remuneration 7,700 5,651
Total 641,052 536,784
Cash flow statement
The consolidated cash flow statement is presented under the indirect method based on the net profit for the year. The statement shows cash flows for the year, changes for the year in cash and cash equivalents as well as the Group’s cash and cash equivalents at the beginning and end of the year.
Cash flows from operating activities are calculated as the net profit/loss for the year adjusted for non-cash operating items, changes in working capital, financial income and financial expenses, and corporation tax paid.
Cash flows from investing activities comprise acquisitions and disposals of property, plant and equipment and fixed asset investments as well as dividend received from associates. Cost is measured inclusive of expenses necessary to make the acquisition and sales prices after deduction of transaction expenses.
Cash flows from financing activities comprise changes to the amount or composition of the Group’s share capital, payment of dividend as well as borrowing and repayment of interest-bearing debt.
Cash and cash equivalents include securities with a maturity of less than 3 months that can readily be turned into cash and are only subject to an insignificant risk of value changes.
Note 22 Cash Flow Statement
103NOTES CONSOLIDATED FINANCIAL STATEMENTSROYAL UNIBREW ANNUAL REPORT 2018

Acquisition of Terme di Crodo S.r.l.On 4 October 2017, Royal Unibrew entered into an agreement with Gruppo Campari to acquire the company Terme di Crodo S.r.l. The company was acquired on 2 January 2018.
Terme di Crodo owns brands such as LemonSoda, OranSoda, PelmoSoda, Crodo Lisiel and Crodo Chinotto as well as production facilities in Crodo in the north-western parts of Italy close to Lago Maggiore. About 2/3 of the net revenue is generated by LemonSoda, whereas OranSoda is the second-strongest brand in the portfolio. The distribution of the products to the On-Trade channel is made through distributors or cash&carry customers who are also customers of Royal Unibrew’s distribution company Ceres S.p.A.; sales to the Off-Trade channel are made directly to customers. The distribution rate of LemonSoda in the On-Trade channel is approx 55%, whereas it is more than 95% in the Off-Trade channel.
The production facility in Crodo are modern and hold capacity for producing cans, glass and PET bottles; most recently, a new canning line was installed in 2016.
The company has approx 70 employees related to production and internal logistics, whereas external logistics and commercial activities are undertaken by Royal Unibrew’s Italian distribution company Ceres S.p.A., or in cooperation with external partners.
The acquisition is part of Royal Unibrew’s strategy to be a focused and strong regional beverage provider holding market-leading positions within beer, malt beverages and soft drinks in the Nordic and Baltic coun-tries, supplemented by strong niche positions in eg the Italian super-premium market and the international malt beverage markets.
Royal Unibrew expects the acquisition to increase revenue in Italy significantly, corresponding to a net revenue of DKK 245 million, whereas volumes will more than double. The acquisition is moreover expected to reinforce the existing commercial platform in all sales channels, and as the route-to-market is the same as for Royal Unibrew’s existing beer business in Italy, operational synergies are expected to be reaped for the benefit of existing product portfolios as well as that acquired.
The acquisition price of DKK 607 million, which has been paid in cash, is based on an enterprise value of DKK 598 million. The valuation of Terme di Crodo has been based on the multiples applicable to leading, national beverage positions.
The acquisition is expected to generate value for Royal Unibrew’s shareholders by reinforcing the total Italian business, and by leveraging optimization potential across the Group’s operations. On that basis, the acquisition has increased Royal Unibrew’s profit and earnings per share already in 2018.
Royal Unibrew A/S has incurred transaction costs relating to the acquisition of approx DKK 10 million for legal, financial and commercial advisers in connection with the realization of the transaction. The costs were recognized as administrative expenses in the Annual Report for 2017.
Note 25 Acquisition of subsidiaries
Related parties comprise the Board of Directors and the Executive Board as well as subsidiaries and asso-ciates, see the sections on Board of Directors and Executive Board on page 45 and Group Structure on page 126. No shareholder exercises control.
All transactions, including lending, are carried out on an arm's length basis.
The following transactions have been made with related parties:
Group DKK '000 2018 2017
Revenue
Sales to associates 11,723 5,868
Financial income and expenses
Dividends received from associates 21,412 26,735
Executive Board
Remuneration paid 13,956 29,744
Debt re cash-based bonus schemes 5,000 3,753
Debt re share-based bonus scheme 13,351 5,651
Board of Directors
Remuneration 3,945 3,977
Transactions with subsidiaries are eliminated in the Consolidated Financial Statements in accordance with the accounting policies applied.
Note 24 Related parties
104NOTES CONSOLIDATED FINANCIAL STATEMENTSROYAL UNIBREW ANNUAL REPORT 2018

Acquisition of Nohrlund ApSOn 14 June 2018, Royal Unibrew entered into an agreement to acquire 50.5% of the share capital of Nohrlund ApS at a price of DKK 10 million.
The shares were acquired on 2 July 2018, and the company has been included in the Consolidated Financial Statements of Royal Unibrew as of that date.
The acquisition price agreed upon is based on an enterprise value of DKK 25 million (100%).
As part of the acquisition the minority shareholders have been granted an option after a three years period to put their shares to Royal Unibrew A/S. The liability for this has been recognized as a debt in Royal Unibrew A/S's Financial Statements.
Nohrlund produces and sells RTD (Ready-To-Drink) organic cocktails with focus on the On-Trade segment. Royal Unibrew A/S has incurred transaction costs relating to the acquisition of less than DKK 1 million for legal, financial and commercial advisers in connection with the realization of the transaction. The costs were recognized in the Interim Report for 1 January - 30 June 2018.
Royal Unibrew has made the following interim calculation of the fair value of the acquired net assets and of goodwill at the time of acquisition.
DKK '000
Trademark 26,045
Property, plant and equipment 2,788
Other fixed assets 179
Inventories 2,673
Receivables 1,326
Prepayments 275
Deferred tax -5,727
Trade payables -1,015
Other payables -752
Acquired net assets 25,792
Goodwill 0
Estimated fair value of the business 25,792
Acquired cash at bank and in hand -5,740
Minorities part of the fair value of the business -10,052
Cash consideration 10,000
Note 25 Acquisition of subsidiaries (continued)
The company is included in the Consolidated Financial Statements of Royal Unibrew as of the date of acqui-sition, 2 January 2018.
Royal Unibrew has made the following calculation of the fair value of the acquired net assets and of goodwill at the time of acquisition.
DKK '000
Trademark 238,237
Property, plant and equipment 82,797
Inventories 34,595
Receivables 17
Deferred tax -58,951
Other payables -7,784
Acquired net assets 288,911
Goodwill 308,631
Estimated fair value of the business 597,542
Acquired cash at bank and in hand 9,588
Cash consideration 607,130
No trade receivables were acquired. Goodwill relates to synergies and the potential for development of the acquired activities and is not deductible for tax purposes.
105NOTES CONSOLIDATED FINANCIAL STATEMENTSROYAL UNIBREW ANNUAL REPORT 2018
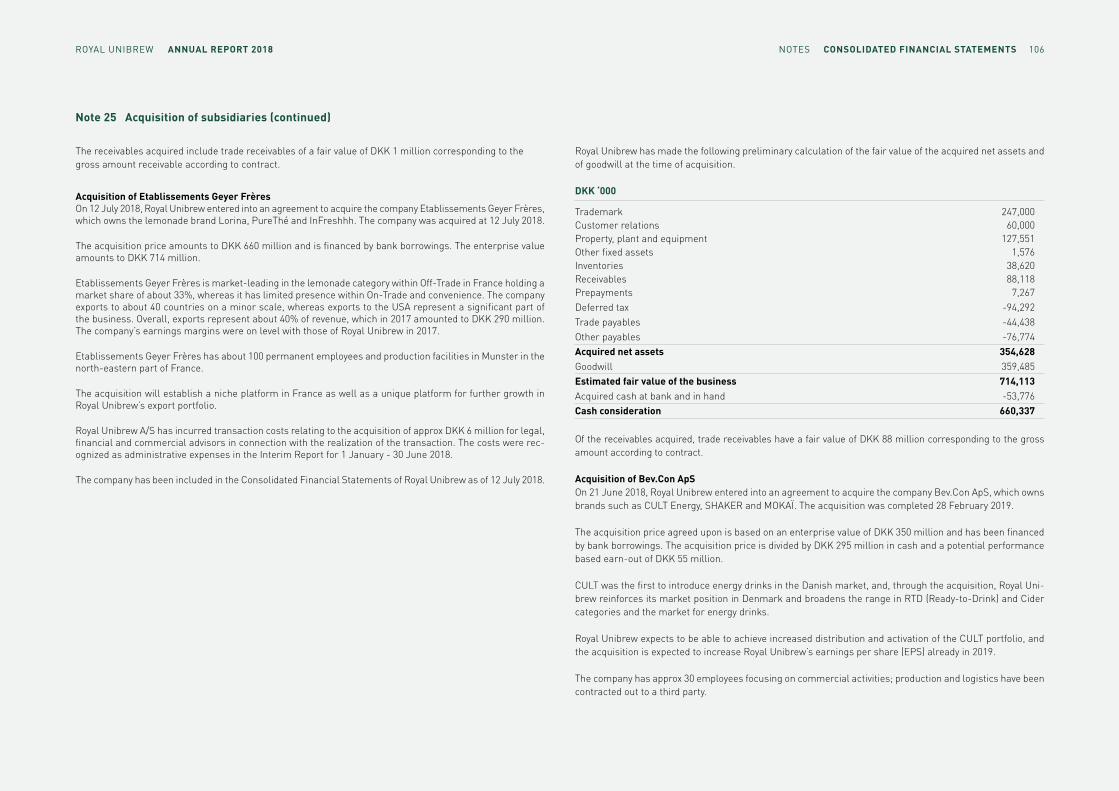
Royal Unibrew has made the following preliminary calculation of the fair value of the acquired net assets and of goodwill at the time of acquisition.
DKK ‘000
Trademark 247,000 Customer relations 60,000 Property, plant and equipment 127,551 Other fixed assets 1,576 Inventories 38,620 Receivables 88,118 Prepayments 7,267 Deferred tax -94,292Trade payables -44,438 Other payables -76,774 Acquired net assets 354,628 Goodwill 359,485 Estimated fair value of the business 714,113 Acquired cash at bank and in hand -53,776 Cash consideration 660,337
Of the receivables acquired, trade receivables have a fair value of DKK 88 million corresponding to the gross amount according to contract.
Acquisition of Bev.Con ApSOn 21 June 2018, Royal Unibrew entered into an agreement to acquire the company Bev.Con ApS, which owns brands such as CULT Energy, SHAKER and MOKAÏ. The acquisition was completed 28 February 2019.
The acquisition price agreed upon is based on an enterprise value of DKK 350 million and has been financed by bank borrowings. The acquisition price is divided by DKK 295 million in cash and a potential performance based earn-out of DKK 55 million.
CULT was the first to introduce energy drinks in the Danish market, and, through the acquisition, Royal Uni-brew reinforces its market position in Denmark and broadens the range in RTD (Ready-to-Drink) and Cider categories and the market for energy drinks.
Royal Unibrew expects to be able to achieve increased distribution and activation of the CULT portfolio, and the acquisition is expected to increase Royal Unibrew’s earnings per share (EPS) already in 2019.
The company has approx 30 employees focusing on commercial activities; production and logistics have been contracted out to a third party.
Note 25 Acquisition of subsidiaries (continued)
The receivables acquired include trade receivables of a fair value of DKK 1 million corresponding to the gross amount receivable according to contract.
Acquisition of Etablissements Geyer FrèresOn 12 July 2018, Royal Unibrew entered into an agreement to acquire the company Etablissements Geyer Frères, which owns the lemonade brand Lorina, PureThé and InFreshhh. The company was acquired at 12 July 2018.
The acquisition price amounts to DKK 660 million and is financed by bank borrowings. The enterprise value amounts to DKK 714 million.
Etablissements Geyer Frères is market-leading in the lemonade category within Off-Trade in France holding a market share of about 33%, whereas it has limited presence within On-Trade and convenience. The company exports to about 40 countries on a minor scale, whereas exports to the USA represent a significant part of the business. Overall, exports represent about 40% of revenue, which in 2017 amounted to DKK 290 million. The company’s earnings margins were on level with those of Royal Unibrew in 2017.
Etablissements Geyer Frères has about 100 permanent employees and production facilities in Munster in the north-eastern part of France.
The acquisition will establish a niche platform in France as well as a unique platform for further growth in Royal Unibrew’s export portfolio.
Royal Unibrew A/S has incurred transaction costs relating to the acquisition of approx DKK 6 million for legal, financial and commercial advisors in connection with the realization of the transaction. The costs were rec-ognized as administrative expenses in the Interim Report for 1 January - 30 June 2018.
The company has been included in the Consolidated Financial Statements of Royal Unibrew as of 12 July 2018.
106NOTES CONSOLIDATED FINANCIAL STATEMENTSROYAL UNIBREW ANNUAL REPORT 2018

Royal Unibrew A/S has incurred transaction costs relating to the acquisition of approx DKK 6 million for le-gal, financial and commercial advisers in connection with the realization of the transaction. The costs were recognized as administrative expenses in the Annual Report for 2018.
The company will be included in the Consolidated Financial Statements of Royal Unibrew as of the date of acquisition in 2019.
Due to the recent completion of the acquisition, Royal Unibrew has not received information of Bev.Con ApS' net booked values of assets and liabilities in the company's balance as per 28 February 2019 as basis for calculating a fair value of the acquired net assets. Based on knowledge of the historical structure of the company's balance it is expected that the balance as per 28 February 2019 will not include material amounts of non current assets or liabilities but mostly current assets and liabilities. Further, it is expected, that a material part of the acquisition price will be allocated to the fair value of trademarks and customer relations and less than one third to goodwill.
A preliminary calculation of the fair value of the acquired net assets will be disclosed in Royal Unibrews Interim Report for 1 January - 31 March 2019.
Business combinations
On acquisition of new enterprises the purchase method is applied, under which the identifiable assets and liabilities of newly acquired enterprises are measured at fair value at the time of acquisition.
Upon business combinations, positive differences between cost and fair value of identifiable assets and liabilities acquired are recognized as goodwill in intangible assets. At the time of acquisition, goodwill is allocated to the cash-generating units that subsequently form the basis of impairment tests. Goodwill and fair value adjust-ments in connection with the acquisition of a foreign enterprise with a functional currency that differs from the presentation currency of the Group are treated as assets and liabilities belonging to the foreign entity and are translated to the functional currency of the foreign entity at the exchange rates at the dates of transaction.
Gains or losses on disposal of subsidiaries and associates are calculated as the difference between the sales sum and the carrying amount of net assets at the time of sale (including the carrying amount of goodwill) net of expected expenses and adjusted for exchange adjustments previously recognized in equity.
Note 25 Acquisition of subsidiaries (continued)
Recognition of acquisition of subsidiary
Royal Unibrew acquired in 2018 three businesses,Terme di Crodo S.r.l., Etablissement Geyer Frères and Nohr-lund ApS by purchasing shares in the companies wherein the businesses were established. The businesses' assets, liabilities and contingent liabilities have been recognized under the purchase method in the Financial Statements of Royal Unibrew. The key assets of the businesses are goodwill, trademarks, customer relations, property, plant and equipment, inventories, receivables, deferred tax and payables. Especially with regard to the intangible assets acquired, there are no efficient markets to be used to determine fair value. Management has therefore made an estimate in connection with the calculation of the fair value of the acquired assets and liabilities at the date of acquisition and has allocated the purchase price on that basis. The fair value calculation is subject to uncertainty and will subsequently be adjusted within a 12 month period from the acquisition date if a need to do so is identified. The unallocated part of the purchase price has been recognized as goodwill related to synergies and the development potential of the activities acquired.
107NOTES CONSOLIDATED FINANCIAL STATEMENTSROYAL UNIBREW ANNUAL REPORT 2018

Parent Company Annual Report
2018
RoYAL UnIBReW ANNUAL REPORT 2018 108PARENT COMPANY

Parent Company Income Statement
DKK '000 Note 2018 2017
Net revenue 3,487,410 3,167,525
Production costs 3,4 -1,683,155 -1,537,006
Gross profit 1,804,255 1,630,519
Sales and distribution expenses 3,4 -913,850 -856,223
Administrative expenses 3,4 -198,089 -172,091
EBIT 692,316 602,205
Dividends received from subsidiaries and associates 378,733 381,522
Financial income 5 5,577 7,403
Financial expenses 6 -22,648 -24,738
Profit before tax 1,053,978 966,392
Tax on the profit for the year 7 -154,924 -132,029
Net profit for the year 899,054 834,363
Earnings per share (DKK) 20.6 16.0
Diluted earnings per share (DKK) 20.6 16.0
DKK '000 Note 2018 2017
Net profit for the year 899,054 834,363
Other comprehensive income
Items that may be reclassified to the income statement
Value adjustment of hedging instruments, beginning of year 8 1,030 7,927
Value adjustment of hedging instruments, end of year 8 -11,332 -1,030
Tax on other comprehensive income 7 2,266 -1,517
Total -8,036 5,380
Other comprehensive income after tax -8,036 5,380
Total comprehensive income 891,018 839,743
Income Statement for 1 January - 31 December Statement of Comprehensive Income for 1 January - 31 December
109ROYAL UNIBREW ANNUAL REPORT 2018 PARENT COMPANY
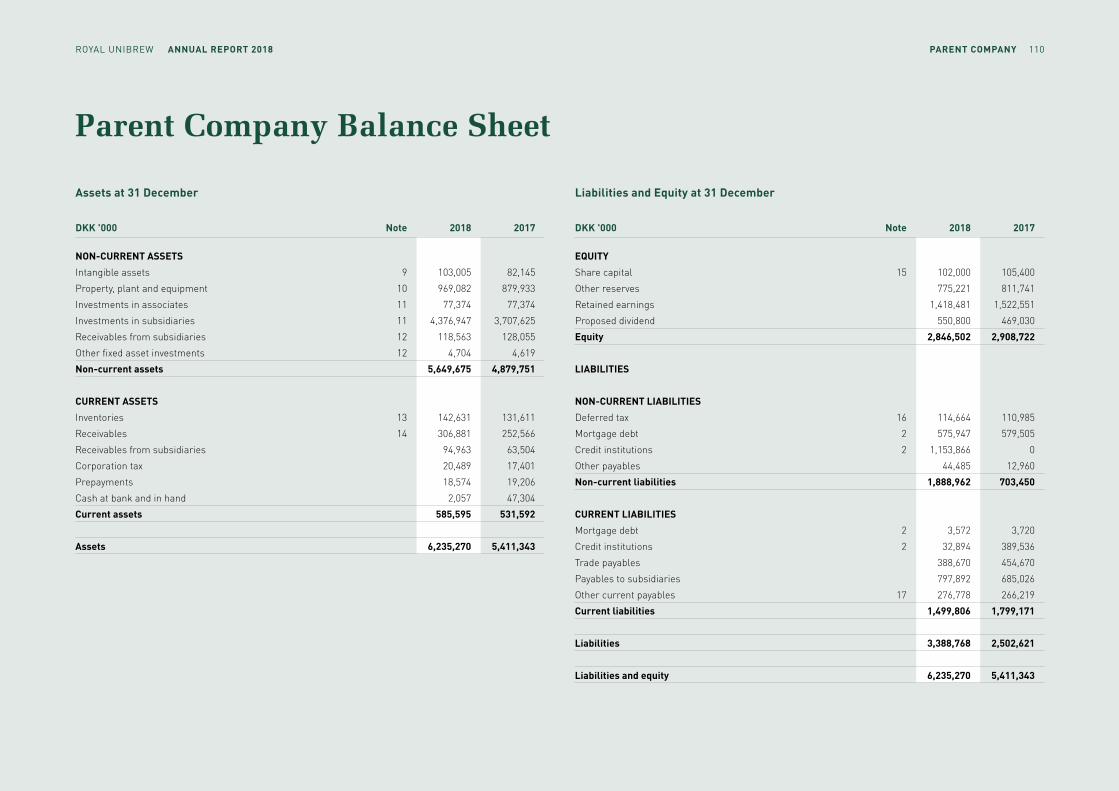
Parent Company Balance Sheet
Assets at 31 December Liabilities and Equity at 31 December
DKK '000 Note 2018 2017
NON-CURRENT ASSETS
Intangible assets 9 103,005 82,145
Property, plant and equipment 10 969,082 879,933
Investments in associates 11 77,374 77,374
Investments in subsidiaries 11 4,376,947 3,707,625
Receivables from subsidiaries 12 118,563 128,055
Other fixed asset investments 12 4,704 4,619
Non-current assets 5,649,675 4,879,751
CURRENT ASSETS
Inventories 13 142,631 131,611
Receivables 14 306,881 252,566
Receivables from subsidiaries 94,963 63,504
Corporation tax 20,489 17,401
Prepayments 18,574 19,206
Cash at bank and in hand 2,057 47,304
Current assets 585,595 531,592
Assets 6,235,270 5,411,343
DKK '000 Note 2018 2017
EQUITY
Share capital 15 102,000 105,400
Other reserves 775,221 811,741
Retained earnings 1,418,481 1,522,551
Proposed dividend 550,800 469,030
Equity 2,846,502 2,908,722
LIABILITIES
NON-CURRENT LIABILITIES
Deferred tax 16 114,664 110,985
Mortgage debt 2 575,947 579,505
Credit institutions 2 1,153,866 0
Other payables 44,485 12,960
Non-current liabilities 1,888,962 703,450
CURRENT LIABILITIES
Mortgage debt 2 3,572 3,720
Credit institutions 2 32,894 389,536
Trade payables 388,670 454,670
Payables to subsidiaries 797,892 685,026
Other current payables 17 276,778 266,219
Current liabilities 1,499,806 1,799,171
Liabilities 3,388,768 2,502,621
Liabilities and equity 6,235,270 5,411,343
110ROYAL UNIBREW ANNUAL REPORT 2018 PARENT COMPANY

Parent Company Cash Flow Statement
DKK '000 2018 2017
Increase of capital/Business acquisitions -670,337 -223,260
Acquisition/sale of intangible assets and fixed asset investments -20,945 317
Cash flows from investing activities -467,630 23,263
Debt financing:
Proceeds from increased drawdown on credit facilities 992,242 552,389
New leasing facilities 22,694
Repayment on credit facilities -270,631 -240,000
Repayment on leasing facilities -21,787
Change in financing of subsidiaries 116,586 1,205
Shareholders:
Dividends paid to shareholders -450,874 -426,527
Acquisition of shares for treasury -484,090 -507,589
Cash flows from financing activities -95,860 -620,522
Change in cash and cash equivalents -45,247 47,186
Cash and cash equivalents at 1 January 47,304 118
Cash and cash equivalents at 31 December 2,057 47,304
DKK '000 Note 2018 2017
Net profit for the year 899,054 834,363
Adjustments for non-cash operating items 18 -62,106 -121,989
836,948 712,374
Change in working capital:
Receivables -86,693 -40,172
Inventories -11,020 9,847
Payables -53,988 102,412
Cash flows from operating activities before financial income and expenses 685,247 784,461
Financial income 6,592 7,403
Financial expenses -23,824 -22,389
Financial expenses related to leasing -731
Cash flows from operating activities 667,284 769,475
Corporation tax paid -149,041 -125,030
Cash flows from operating activities 518,243 644,445
Dividends received from subsidiaries and associates 378,733 381,522
Sale of property, plant and equipment 5,266 4,580
Purchase of property, plant and equipment* -160,347 -139,896
Free cash flow 741,895 890,651
*inclusive DKK 22,7 million additions from leasing (IFRS 16)
for 1 January - 31 December
111ROYAL UNIBREW ANNUAL REPORT 2018 PARENT COMPANY

Parent Company Statement of Changes in Equity
Share Proposed Share premium Hedging Total other Retained dividend DKK '000 capital account reserve reserves earnings for the year Total
Equity at 31 December 2017 105,400 812,771 -1,030 811,741 1,522,551 469,030 2,908,722
Changes in equity in 2018
Profit for the year 0 899,054 899,054
Other comprehensive income -10,302 -10,302 -10,302
Tax on other comprehensive income 0 2,266 2,266
Total comprehensive income 0 0 -10,302 -10,302 901,320 0 891,018Liability upon acquisition 0 -29,000 -29,000
Dividends paid to shareholders 0 -450,874 -450,874
Dividend on treasury shares 0 18,156 -18,156 0
Acquisition of shares for treasury 0 -484,090 -484,090
Proposed dividend 0 -550,800 550,800 0
Capital reduction -3,400 -26,218 -26,218 29,618 0
Share-based payments 0 7,700 7,700
Tax on changes in equity, shareholders 0 3,026 3,026
Total shareholders -3,400 -26,218 0 -26,218 -1,005,390 81,770 -953,238Total changes in equity in 2018 -3,400 -26,218 -10,302 -36,520 -104,070 81,770 -62,220Equity at 31 December 2018 102,000 786,553 -11,332 775,221 1,418,481 550,800 2,846,502
Share premium account, hedging reserve and retained earnings may be applied for distribution of dividend to the Parent Company shareholders.
The share capital at 31 December 2018 amounts to DKK 102,000,000 and is distributed on shares of DKK 2 each.
Proposed dividend for the year is DKK 10.80 per share (2017: DKK 8.90 per share).
for 1 January - 31 December 2018
112ROYAL UNIBREW ANNUAL REPORT 2018 PARENT COMPANY

Parent Company Statement of Changes in Equity
for 1 January - 31 December 2017
Share Proposed Share premium Hedging Total other Retained dividend DKK '000 capital account reserve reserves earnings for the year Total
Egenkapital 31. december 2016 108,200 834,363 -7,927 826,436 1,620,137 440,915 2,995,688
Changes in equity in 2017
Profit for the year 0 834,363 834,363
Other comprehensive income 6,897 6,897 6,897
Tax on other comprehensive income 0 -1,517 (1,517)
Total comprehensive income 0 0 6,897 6,897 832,846 0 839,743
Dividends paid to shareholders 0 (426,527) (426,527)
Dividend on treasury shares 0 14,388 (14,388) 0
Acquisition of shares for treasury 0 -507,589 (507,589)
Proposed dividend 0 -469,030 469,030 0
Capital reduction -2,800 -21,592 -21,592 24,392 0
Share-based payments 0 5,651 5,651
Tax on changes in equity, shareholders 0 1,756 1,756
Total shareholders -2,800 -21,592 0 -21,592 -930,432 28,115 -926,709
Total changes in equity in 2017 -2,800 -21,592 6,897 -14,695 -97,586 28,115 -86,966
Equity at 31 December 2017 105,400 812,771 -1,030 811,741 1,522,551 469,030 2,908,722
113ROYAL UNIBREW ANNUAL REPORT 2018 PARENT COMPANY

Note to Parent Company Annual Report
Descriptive notes
1 Basis of preparation ....................................... 115
2 Financial risk management ........................... 116
Notes referring to Income Statement, Balance Sheet and Cash Flow Statement
3 Staff expenses ................................................ 116
4 Expenses broken down by type ...................... 117
5 Financial income ............................................ 118
6 Financial expenses ......................................... 118
7 Tax on the profit for the year .......................... 118
8 Realized hedging transactions ...................... 118
9 Intangible assets ............................................ 119
10 Property, plant and equipment ...................... 120
11 Investments in subsidiaries and associates ................................................ 121
12 Receivables from subsidiaries and other fixed asset investments ................. 121
13 Inventories ...................................................... 122
14 Receivables ..................................................... 122
15 Share capital ................................................... 122
16 Deferred tax .................................................... 123
17 Other current payables .................................. 123
18 Cash Flow Statement ..................................... 124
Other notes
19 Contingent liabilities, security and other liabilities ........................................ 124
20 Related parties ............................................... 125
RoYAL UnIBReW ANNUAL REPORT 2018 noteS PARENT COMPANY 114

Basis of preparation
Significant accounting policies
The Parent Company's accounting policies remain unchanged from last year. Significant accounting policies are identical to those applied by the Royal Unibrew Group except for those mentioned below.
Translation policiesExchange adjustment of balances regarded as part of the total net investment in enterprises with another functional currency than DKK is recognized in financial income and expenses in the Parent Company income statement.
New and amended standards and interpretations that have taken effectReference is made to note 1 to the Consolidated Financial Statements.
Critical judgements and accounting estimatesIn connection with the preparation of the Parent Company and Con-solidated Financial Statements, Management makes estimates and judgements as to how recognition and measurement of assets and liabilities should take place based on the accounting policies applied.
Judgements as an element in significant accounting policies
The calculation of carrying amounts of certain assets and liabilities requires judgement as to how assets and liabilities should be classified in the Financial Statements and how future events will affect the value of these assets and liabilities at the balance sheet date. In connection with the financial reporting for 2017, the following judgments have been made materially affecting the related items as described in relevant notes, see list below.
Critical accounting estimates
Management's estimates are based on assumptions which Manage-ment considers reasonable but which are inherently uncertain and unpredictable. In connection with the financial reporting for 2017, the following critical estimates have been made as desribed in relevant notes, see list below.
Accounting policies, judgements as an element in significant accounting policies as well as critical accounting estimates are described in the notes:
Consolidated Parent Company FS note FS note
Derivative financial instruments 2
Segment reporting 3
Net revenue 4
Share-based payments 5
Expenses 6
Financial income and expenses 8
Corporation tax 9
Intangible assets 11
Property, plant and equipment 12
Investments in associates 13 11Investments in subsidiaries 11Other fixed asset investments 14
Inventories 15
Receivables 16
Prepayments 17
Equity 18
Deferred tax 19
Deposit returnable packaging 20
Debt 21
Cash Flow Statement 22
LEGENDS
Significant accounting policies
Judgements as an element in significant accounting policies
Critical accounting estimates
Comments to the note
Note 1 Basis of preparation of Parent Company Annual Report
115ROYAL UNIBREW ANNUAL REPORT 2018 NOTES PARENT COMPANY

Financial liabilities Maturity Contractual Maturity > 1 year Maturity Carrying DKK '000 cash flows < 1 year < 5 years > 5 years amount
31/12 2018
Non-derivative financial instruments:
Financial debt, debt financing, gross 1,754,997 32,791 1,092,989 629,217 1,694,372
Financial debt, subsidiaries 797,892 797,892 797,892
Leasing 74,207 18,641 55,566 71,907
Trade payables 388,670 388,670 388,670
Other payables 256,139 211,654 44,485 256,139
Total 3,271,905 1,449,648 1,193,040 629,217 3,208,980
The debt is broken down in the categories "debt at amortised cost" with DKK 3.205 million and "debt at fair value" with DKK 4 million. The fair value of the total debt is assessed to equal carrying amount.
31/12 2017
Non-derivative financial instruments:
Financial debt, debt financing, gross 972,761 393,256 100,253 479,252 972,761
Financial debt, subsidiaries 685,026 685,026 685,026
Interest expenses on financial debt 28,182 6,789 13,927 7,466
Trade payables 454,670 454,670 454,670
Other payables 201,103 188,143 12,960 201,103
Total 2,341,742 1,727,884 127,140 486,718 2,313,560
The debt is broken down in the categories "debt at amortised cost" with DKK 2,309 million and "debt at fair value" with DKK 5 million.
The fair value of the total debt is assessed to equal carrying amount.
For a description of the Parent Company's and the Group's currency, interest rate, credit, commodity and other risks as well as capital management, reference is made to note 2 to the Consolidated Financial Statements.
Staff expenses are included in production costs, sales and distribution expenses as well as administrative expenses and break down as follows:
DKK '000 2018 2017
Fixed salaries to Executive Board 10,203 22,994
Ordinary bonus scheme for Executive Board 5,000 3,753
Share-based payments to Executive Board (restricted shares) 7,700 5,651
Remuneration of Executive Board 22,903 32,398
Remuneration of Board of Directors 3,945 3,977
26,848 36,375
Wages and salaries 451,559 406,185
Contributions to pension schemes 38,744 36,801
490,303 442,986
Other social security expenses 6,059 5,238
Other staff expenses 24,701 20,002
Total 547,911 504,601
Average number of employees 907 906
Reference is made to note 5 to the Consolidated Financial Statements for a description of share-based payments to the Executive Board.
Note 2 Financial risk management Note 3 Staff expenses
116ROYAL UNIBREW ANNUAL REPORT 2018 NOTES PARENT COMPANY

DKK '000 2018 2017
Aggregated
production costs 1,683,155 1,537,006
Sales and distribution expenses 913,850 856,223
Administrative expenses 198,089 172,091
Total 2,795,094 2,565,320
break down by type as follows:
Raw materials and consumables 1,331,385 1,213,857
Wages, salaries and other staff expenses 547,911 504,601
Operating and maintenance expenses* 116,022 143,456
Low value and short term lease commitments* 18,025
Distribution expenses and carriage 133,727 128,631
Sales and marketing expenses 407,476 367,591
Bad trade debts 3,770 2,233
Office supplies etc 99,846 100,433
Amortization and depreciation* 136,932 104,518
Total 2,795,094 2,565,320
* The comparatives has not been adjusted for IFRS 16 implementation. Cost related to service, low value and short term lease commitments (2018: 18.0 million) was last year included in operating and maintenance expenses. Additional amortization and depreciation (2018: 21.2 million) was in the comparatives costs included in operating and maintenance expenses.
Note 4 Expenses broken down by type
Total amortization and depreciation are included in the following items in the income statement:
DKK '000 2018 2017
Production costs 80,374 69,940
Sales and distribution expenses 39,745 20,213
Administrative expenses 16,813 14,365
Total 136,932 104,518
Fee to auditors
Fee for the audit of the Annual Report:
KPMG (2017: Ernst & Young) 490 715
Total 490 715
KPMG (2017: Ernst & Young) fee for non-audit services:
Tax assistance 94
Other assistance* 2,128 461
Total 2,128 630
* Fees for other services than statutory audit of the financial statements provided by KPMG Statsautoriseret Revisionspartnerskab primarily comprise services relating to financial due dilligence.
117ROYAL UNIBREW ANNUAL REPORT 2018 NOTES PARENT COMPANY

DKK '000 2018 2017
Finance income
Cash at bank and in hand 323 7
Trade receivables 4
Receivables from subsidiaries 2,031 2,273
Other financial income 25 6
Exchange adjustments
Trade receivables 1,506
Trade payables
Intercompany loans 194 333
Forward contracts 4,780
Income liquidation of subsiduary 1,497
Total 5,576 7,403
Note 6 Financial expenses
DKK '000 2018 2017
Finance costs
Mortgage debt 5,346 10,717
Credit institutions 9,491 7,078
Other financial expenses 3,518 1,598
Leasing 731
Exchange adjustments
Cash at bank and in hand and external loans 1,966 1,725
Trade receivables 3,600
Trade payables 432 20
Forward contracts 1,163
Total 22,648 24,738
Note 5 Financial income Note 7 Tax on the profit for the year
DKK '000 2018 2017
Tax on the taxable income for the year 143,307 112,128
Adjustment of previous year 2,646 -1,257
Adjustment of deferred tax 3,679 20,919
Total 149,632 131,790
which breaks down as follows:
Tax on profit for the year 154,924 132,029
Tax on other comprehensive income -2,266 1,517
Tax on equity entries -3,026 -1,756
Total 149,632 131,790
Current Danish tax rate 22.0 22.0
Dividends received from subsidiaries and associates -7.9 -8.7
Effect on tax rate of permanent differences 0.4 0.5
Adjustment of previous year 0.2 -0.1
Effective tax rate 14.7 13.7
Note 8 Realized hedging transactions
DKK '000 2018 2017
Realized hedging transactions are included in the income statement as follows:
Net revenue includes currency hedges of -3,754 -1,829
Production costs include foreign currency and commodity hedges of 5,377 13,183
Financial income and expenses include currency, commodity and interest rate hedges of -2,729 -6,223
Total -1,106 5,131
118ROYAL UNIBREW ANNUAL REPORT 2018 NOTES PARENT COMPANY

Distribution DKK '000 Goodwill Trademarks rights Total
Cost at 1 January 2018 80,645 4,490 11,828 96,963
Additions 20,860 20,860
Cost at 31 December 2018 80,645 25,350 11,828 117,823
Amortization and impairment losses at 1 January 2018 0 -2,990 -11,828 -14,818
Amortization for the year 0
Amortization and impairment losses at 31 December 2018 0 -2,990 -11,828 -14,818
Carrying amount at 31 December 2018 80,645 22,360 0 103,005
Cost at 1 January 2017 80,645 4,490 11,828 96,963
Cost at 31 December 2017 80,645 4,490 11,828 96,963
Amortization and impairment losses at 1 January 2016 0 -2,990 -11,828 -14,818
Amortization for the year 0 0
Amortization and impairment losses at 31 December 2017 0 -2,990 -11,828 -14,818
Carrying amount at 31 December 2017 80,645 1,500 0 82,145
Trademarks
Trademarks are not amortised as they are all well-established, old and profitable trademarks which custom-ers are expected to continue demanding unabatedly, other things being equal, and which Management is not planning to stop selling and marketing.
Reference is made to note 11 to the Consolidated Financial Statements for a description of impairment test.
Note 9 Intangible assets
119ROYAL UNIBREW ANNUAL REPORT 2018 NOTES PARENT COMPANY

Other fixtures Property, Leasing of Total other and fittings, plant and property, property, 2017 Land and Plant and tools and equipment plant and plant and DKK '000 buildings machinery equipment in progress equipment equipment
Cost at 1 January 2017 686,221 1,191,133 467,313 79,639 2,424,306
Additions 11,079 40,672 41,751 46,394 139,896
Disposals -4,738 -10,671 -55,047 -70,456
Transfers for the year 2,762 42,901 13,515 -59,178 0
Cost at 31 December 2017 695,324 1,264,035 467,532 66,855 2,493,746
Depreciation, revaluation and impairment losses at 1 January 2017 -378,161 -855,010 -342,000 0 -1,575,171
Depreciation for the year -13,913 -44,579 -46,476 -104,968
Reversal of depreciation and impairment of assets sold 2,232 10,522 53,572 66,326
Depreciation, revaluation and impairment losses at 31 December 2017 -389,842 -889,067 -334,904 0 -1,613,813
Carrying amount at 31 December 2017 305,482 374,968 132,628 66,855 879,933
Land and buildings including plant and machinery at a carrying amount of DKK 680 million have been provided as security for mortgage debt of DKK 583.2 million.
Contracts for the delivery of property, plant and equipment in 2018 have been entered into only to an imma-terial extent.
Note 10 Property, plant and equipment
Other fixtures Property, Leasing of Total other and fittings, plant and property, property, 2018 Land and Plant and tools and equipment plant and plant and DKK '000 buildings machinery equipment in progress equipment equipment
Cost at 1 January 2018 695,324 1,264,035 467,532 66,855 2,493,746
Additions 13,722 48,435 48,677 25,040 24,473 160,347
Additions by change in accounting policy 71,001 71,001
Disposals -1,245 -15,215 -25,580 -1,780 -43,820
Transfers for the year 20,392 10,684 8,815 -39,891 0
Cost at 31 December 2018 728,193 1,307,939 499,444 52,004 93,694 2,681,274
Depreciation, revaluation and impairment losses at 1 January 2018 -389,842 -889,067 -334,904 0 -1,613,813Depreciation for the year -14,477 -50,745 -50,452 -21,402 -137,076
Reversal of depreciation and impairment of assets sold 807 13,527 24,129 236 38,699
Depreciation, revaluation and impairment losses at 31 December 2018 -403,512 -926,285 -361,227 0 -21,166 -1,712,191
Carrying amount at 31 December 2018 324,681 381,654 138,217 52,004 72,528 969,083
Leasing of property, plant and equipment:
Cost at 31 December 2018 31,257 62,437 93,694
Depreciation, revaluation and impairment losses at 31 December 2018 -6,443 -14,723 -21,166
Carrying amount per asset type 24,814 47,714 72,528
Land and buildings including plant and machinery at a carrying amount of DKK 318 million have been provided as security for mortgage debt of DKK 578 million.
Contracts for the delivery of property, plant and equipment in 2019 have been entered into only to an imma-terial extent.
120ROYAL UNIBREW ANNUAL REPORT 2018 NOTES PARENT COMPANY

Investments Investments DKK '000 in subsidiaries in associates
Cost at 1 January 2018 3,796,660 77,374
Additions 670,337
Disposals -1,015
Cost at 31 December 2018 4,465,982 77,374
Impairment losses at 1 January 2018 -89,035 0
Impairment losses at 31 December 2018 -89,035 0
Carrying amount at 31 December 2018 4,376,947 77,374
Cost at 1 January 2017 3,796,660 77,374
Cost at 31 December 2017 3,796,660 77,374
Impairment losses at 1 January 2017 -89,035 0
Impairment losses at 31 December 2017 -89,035 0
Carrying amount at 31 December 2017 3,707,625 77,374
Dividend on investments in subsidiaries and associates
Dividend on investments in subsidiaries and associates is recognized in the Parent Company's income state-ment in the financial year in which dividend is declared.
Investments in subsidiaries and associates in the Parent Company Financial Statements
Investments in subsidiaries and associates are measured at cost and tested in the event of indication of impairment. Where cost exceeds the recoverable amount, the investment is written down to its lower recov-erable amount.
Estimate
The carrying amount of investments in subsidiaries and the values of intangible assets contained therein is tested to identify any impairment. Reference is made to note 11 to the Consolidated Financial Statements.
Receivables Total other from Other Other fixed asset DKK '000 subsidiaries investments receivables investments
Cost at 1 January 2018 128,055 54,833 1,812 56,645
Exchange adjustment 396 0
Additions 94,173 85 85
Disposals -104,061 0
Cost at 31 December 2018 118,563 54,833 1,897 56,730
Revaluations and impairment losses at 1 January 2018 0 -52,026 0 -52,026
Revaluations and impairment losses at 31 December 2018 0 -52,026 0 -52,026
Carrying amount at 31 December 2018 118,563 2,807 1,897 4,704
Cost at 1 January 2017 120,624 54,833 2,129 56,962
Exchange adjustment 156 0
Additions 14,207 0
Disposals -6,932 -317 -317
Cost at 31 December 2017 128,055 54,833 1,812 56,645
Revaluations and impairment losses at 1 January 2017 0 -52,073 0 -52,073
Exchange adjustment 47 47
Revaluations and impairment losses at 31 December 2017 0 -52,026 0 -52,026
Carrying amount at 31 December 2017 128,055 2,807 1,812 4,619
Note 11 Investments in subsidiaries and associates Note 12 Receivables from subsidiaries and Other fixed asset investments
121ROYAL UNIBREW ANNUAL REPORT 2018 NOTES PARENT COMPANY

DKK '000 2018 2017
Raw materials and consumables 65,524 56,056
Work in progress 10,471 12,179
Finished goods and goods for resale 66,636 63,376
Total inventories 142,631 131,611
Inventories
Indirect production costs are recognized in the value of work in progress and finished goods at DKK 8 million (2017: DKK 9 million). As in 2017, inventories have not been written down materially.
Note 14 Receivables
DKK '000 2018 2017
Trade receivables 293,794 244,397
Other receivables 13,086 8,169
Total receivables 306,880 252,566
Note 13 Inventories Note 14 Receivables (continued)
Trade receivables fall due as follows:
Not due and prepaid Due Due Due > bonus 1-15 days 16-90 days 90 days Total
2018
Trade receivables 227,312 39,750 18,642 19,391 305,095
Impairment provision* -556 -2,100 -2,468 -6,177 -11,301
Impairment provision % ** -0.2% -5.3% -13.2% -31.9% -3.7%
Provisions for bad debts, beginning of year -8,435
Bad debts realized during the year 910
Provision for the year -3,776
Total -11,301
* Lifetime expected credit loss.
** Historical average loss rate is approx. 0.6%
2017
Trade receivables 187,182 33,885 11,549 20,216 252,832
Impairment provision - -927 -639 -6,869 -8,435
Impairment provision %* 0.0% -2.7% -5.5% -34.0% -3.3%
Provisions for bad debts, beginning of year -6,551
Bad debts realized during the year 389
Provision for the year -2,273
Total -8,435
* Historical average loss rate is approx. 0.7%.
Current receivables, other than trade receivables, all fall due for payment in 2019.Reference is made to note 2 to the Consolidated Financial Statements.
Note 15 Share capital
Reference is made to note 18 to the Consolidated Financial Statements.
122ROYAL UNIBREW ANNUAL REPORT 2018 NOTES PARENT COMPANY

Note 16 Deferred tax
DKK '000 2018 2017
Deferred tax at 1 January 110,985 91,286
Change in deferred tax for the year 3,679 20,919
Adjustment of previous year -1,220
Deferred tax at 31 December 114,664 110,985
Due within 1 year 1,303 3,804
Deferred tax relates to:
Intangible assets 797 94
Property, plant and equipment 97,544 93,152
Fixed asset investments 18,170 15,052
Current assets 10,563 9,334
Current liabilities -12,410 -6,647
Total 114,664 110,985
Note 17 Other current payables
DKK '000 2018 2017
VAT, excise duties, etc 27,230 43,087
Other payables 211,654 188,144
Deposit, returnable packaging 37,894 34,988
Total other current payables 276,778 266,219
Deposit, returnable packaging is specified as follows:
Balance at 1 January 34,988 32,518
Adjustment for the year 2,906 2,470
Balance at 31 December 37,894 34,988
Comment
The change in the deposit on returnable packaging for the year reflects the net exchange with customers of returnable packaging for the year less estimated wastage of returnable packaging in circulation.
123ROYAL UNIBREW ANNUAL REPORT 2018 NOTES PARENT COMPANY

Note 18 Cash Flow Statement
Adjustments for non-cash operating items:
DKK '000 2018 2017
Dividends received from subsidiaries and associates -378,733 -381,522Financial income -5,577 -7,403Financial expenses 22,648 24,738Amortization, depreciation and impairment of intangible assets and property, plant and equipment (see note 10 re leasing part) 137,076 104,968Tax on the profit for the year 154,924 132,029Profit and loss from sale of property, plant and equipment -144 -450
Share-based payments and remuneration 7,700 5,651
Total -62,106 -121,989
Changes to interest-bearing debts
1/1 2018 New Exchange 31/12 2017 IFRS 16 Repayment facilities adjustment 31/12 2018
Interest-bearing long-term debts 579,505 1,096,442 1,675,947Interest-bearing short-term debts 1,075,555 -270,631 804,924Total interest-bearing debt, mortgage and credit institutions 1,655,060 -270,631 1,096,442 0 2,480,871Interest-bearing long-term leasingdebt 51,047 -19,875 22,694 53,866Interest-bearing short-term leasing debt 19,953 -1,912 18,041Total interest- bearing leasing debt 71,000 -21,787 22,694 0 71,907Total 1,655,060 71,000 -292,418 1,119,136 0 2,552,778
New Exchange 31/12 2016 Repayment facilities adjustment 31/12 2017
Interest-bearing long-term debts 580,858 -1,353 579,505
Interest-bearing short-term debts 104,287 -238,647 1,209,915 1,075,555
Total 685,145 -240,000 1,209,915 0 1,655,060
mDKK 2018 2017
Guarantees
Guarantees relating to subsidiaries 758.9 461.4
Other guarantees
Total 758.9 461.4
The change in guarantees relating to subsidiaries relates to the Parent Company's guarantee with respect to mortgage loan in the Finnish subsidiary.
Rental and operating lease commitments
Total future payments:
Within 1 year 9.6 25.2
Between 1 and 5 years 11.3 46.7
Beyond 5 years 0.5 0.7
Total 21.4 72.6
Rental and operating lease commitments relate to low value assets and
service not included under IFRS16.
Third-party guarantees 11.6 12.0
SecurityNo security has been provided in respect of the Group's loan agreements with credit institutions other than the Parent Company's liability for the amounts drawn by subsidiaries on group credit facilities.
As regards security for loan agreements with mortgage credit institutes, reference is made to note 10.
Contingent liabilitiesThe outcome of pending legal actions is not expected to have any material impact on the financial position of the Parent Company or the Group.
Note 19 Contingent liabilities, security and other liabilities
124ROYAL UNIBREW ANNUAL REPORT 2018 NOTES PARENT COMPANY

Related parties comprise the Board of Directors and the Executive Board as well as subsidiaries and asso-ciates, see the sections on Board of Directors and Executive Board on page 45 and Group Structure on page 126. No shareholder exercises control.
All transactions, including lending, are carried out on an arm's length basis.
The following transactions have been made with related parties:
t.DKK 2018 2017
Revenue
Sales to subsidiaries 546,882 520,788
Sales to associates 11,723 5,868
Costs
Purchases from subsidiaries 21,116 11,088
Financial income and expenses
Dividends received from associates 21,412 26,735
Dividends received from subsidiaries 357,321 354,787
Interest received from subsidiaries 2,512 2,425
Interest paid to subsidiaries 481 189
Executive Board
Remuneration paid 13,956 29,744
Debt re cash-based bonus schemes 5,000 3,753
Debt re share-based bonus scheme 13,351 5,651
t.DKK 2018 2017
Board of Directors
Remuneration 3,945 3,977
Intercompany balances at 31 December
Loans to subsidiaries 120,086 132,472
Receivables from subsidiaries 93,440 59,087
Loans from subsidiaries 786,499 682,299
Payables to subsidiaries 11,393 2,727
Capital contributed to subsidiaries 223,260
Guarantees and security
Guarantee for subsidiaries 758,905 464,785
Note 20 Related parties
125ROYAL UNIBREW ANNUAL REPORT 2018 NOTES PARENT COMPANY

Group Structure
Segment Ownership Currency Capital
Parent Company
Royal Unibrew A/S, Denmark DKK 102,000,000
WESTERN EUROPE
Subsidiaries
Aktieselskabet Cerekem International Ltd., Denmark* 100% DKK 1,000,000
Albani Sverige AB, Sweden* 100% SEK 305,000
Ceres S.p.A., Italy 100% EUR 206,400
The Curious Company A/S, Denmark* 100% DKK 550,000
Etablissement Geyer-Frères S.A., France 100% EUR 159,687
Lorina Inc., USA* 100% USD 947,203
Nohrlund ApS, Denmark 51% DKK 85,714
Terme di Crodo S.r.l. 100% EUR 19,000,000
Associates
Grønlandskonsortiet I/S, Denmark 50% DKK
Hansa Borg Holding AS, Norway 25% NOK 54,600,000
Nuuk Imeq A/S, Nuuk, Greenland 32% DKK 38,000,000
BALTIC SEA
Subsidiaries
AB Kalnapilio-Tauro Grupe, Lithuania 100% EUR 1,153,337
Oy Hartwall Ab 100% EUR 13,240,140
Lapin Kulta Oy 100% EUR 16,819
Royal Unibrew Services UAB, Lithuania 100% EUR 43,500
SIA "Cido Grupa", Latvia 100% EUR 1,117,060
OÜ Royal Unibrew Eesti, Estonia 100% EUR 2,000,000
Segment Ownership Currency Capital
INTERNATIONAL
Subsidiaries
Centre Nordique d'Alimentation EURL, France* 100% EUR 131,000
Ferell sp. z o.o.* 100% PLN 120,200
Supermalt UK Ltd., UK 100% GBP 9,700,000
Vitamalt (West Africa) Ltd., UK 100% GBP 10,000
Royal Unibrew Nigeria Ltd. 100% NGN 10,000,000
The Danish Brewery Group Inc., USA* 100% USD 100,000
* not audited as not mandatory audit
Activity
Production, sales and distribution
Sales and distribution
Holding company
Other
126 OTHER INFORMATIONROYAL UNIBREW ANNUAL REPORT 2018

Quarterly Financial Highlights and Ratios (Group) Q1 Q2 Q3 Q4mDKK (unaudited) 2018 2017 2018 2017 2018 2017 2018 2017
Sales (million hectolitres) 2.1 2.2 3.1 2.8 3.2 2.6 2.4 2.3
Income StatementNet revenue 1,452 1,354 2,066 1,828 2,106 1,686 1,674 1,516EBITDA 274 224 526 419 543 433 330 286EBITDA margin (%) 18.9 16.5 25.5 22.9 25.8 25.7 19.7 18.9Earnings before interest and tax (EBIT) 194 151 447 351 451 359 247 208EBIT margin (%) 13.4 11.2 21.6 19.2 21.3 21.3 14.8 13.7Income from investments in associates -3 -2 12 12 0 5 11 3Financial income and expenses -10 -6 -4 -8 -7 -10 -10 -8Profit before tax 181 143 455 355 444 355 248 203Net profit for the period 142 110 359 280 351 278 188 163
Balance SheetNon-current assets 5,909 5,138 5,920 5,148 6,753 5,115 6,775 5,121Total assets 7,347 6,294 7,445 6,405 8,161 6,130 8,062 6,778Equity 2,791 2,935 2,554 2,637 2,776 2,800 2,908 2,814Net interest-bearing debt 2,224 1,142 1,956 1,158 2,397 1,062 2,522 975Net working capital -488 -690 -927 -949 -895 -802 -748 -957Invested capital 5,324 4,316 4,814 4,041 5,588 4,103 5,835 4,030
Cash FlowsFrom operating activities -249 -24 949 622 493 247 21 323From investing activities -626 -29 -78 -72 -820 -32 -98 -85Free cash flow -278 -54 892 551 420 214 -92 239
Financial Ratios (%)Free cash flow as a percentage of net revenue -19 -4 43 30 20 13 5 16Cash conversion -196 -49 248 197 120 77 -49 147Net interest-bearing debt/EBITDA (running 12 months) 1.6 0.9 1.3 0.9 1.5 0.8 1.5 0.7Equity ratio 38 47 34 41 34 46 36 42
Ratios comprised by the “Recommendations and Financial Ratios” issued by the Danish Society's Committee of Accounting Standards have been calculated according to the recommendations.
Definitions of financial highlights and ratios are provided on page 128.
Due to adoption of IFRS 16 (leases) using the modified retrospective approach the 2018 highlights and ratios are not comparable with those for 2017.
127 OTHER INFORMATIONROYAL UNIBREW ANNUAL REPORT 2018
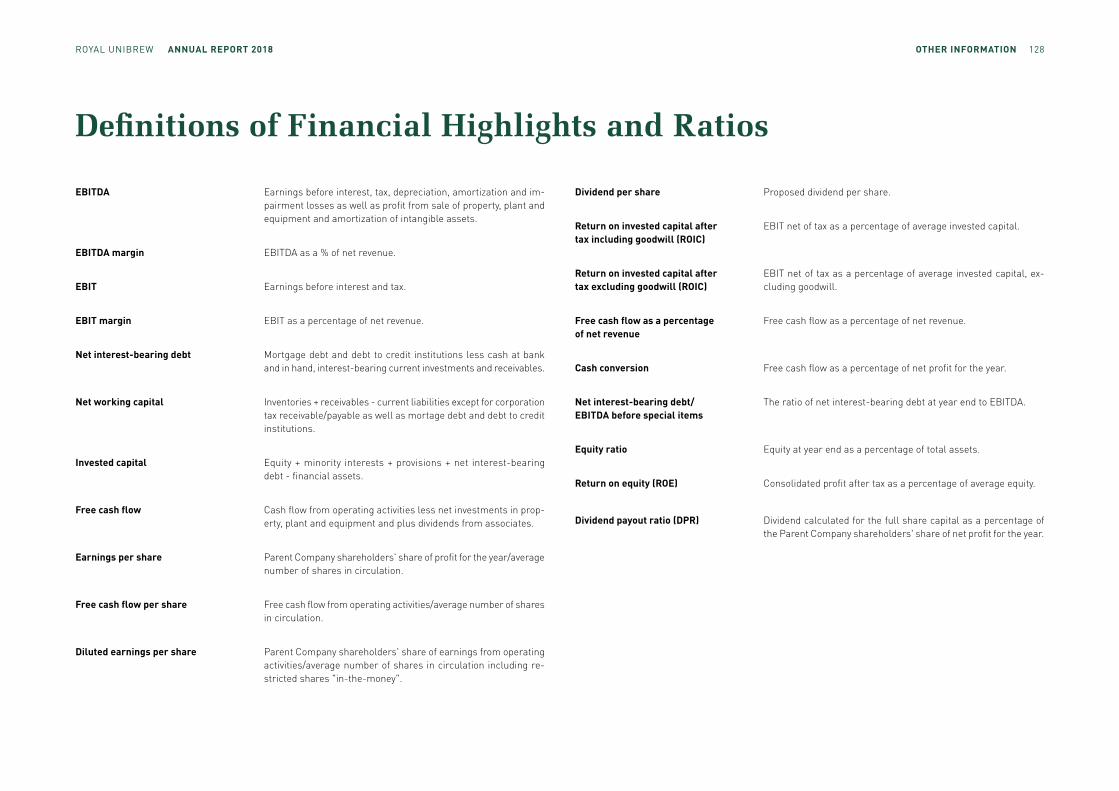
Definitions of Financial Highlights and Ratios
EBITDA Earnings before interest, tax, depreciation, amortization and im-pairment losses as well as profit from sale of property, plant and equipment and amortization of intangible assets.
EBITDA margin EBITDA as a % of net revenue.
EBIT Earnings before interest and tax.
EBIT margin EBIT as a percentage of net revenue.
Net interest-bearing debt Mortgage debt and debt to credit institutions less cash at bank and in hand, interest-bearing current investments and receivables.
Net working capital Inventories + receivables - current liabilities except for corporation tax receivable/payable as well as mortage debt and debt to credit institutions.
Invested capital Equity + minority interests + provisions + net interest-bearing debt - financial assets.
Free cash flow Cash flow from operating activities less net investments in prop-erty, plant and equipment and plus dividends from associates.
Earnings per share Parent Company shareholders' share of profit for the year/average number of shares in circulation.
Free cash flow per share Free cash flow from operating activities/average number of shares in circulation.
Diluted earnings per share Parent Company shareholders' share of earnings from operating activities/average number of shares in circulation including re-stricted shares "in-the-money".
Dividend per share Proposed dividend per share.
Return on invested capital after tax including goodwill (ROIC)
EBIT net of tax as a percentage of average invested capital.
Return on invested capital after tax excluding goodwill (ROIC)
EBIT net of tax as a percentage of average invested capital, ex-cluding goodwill.
Free cash flow as a percentage of net revenue
Free cash flow as a percentage of net revenue.
Cash conversion Free cash flow as a percentage of net profit for the year.
Net interest-bearing debt/EBITDA before special items
The ratio of net interest-bearing debt at year end to EBITDA.
Equity ratio Equity at year end as a percentage of total assets.
Return on equity (ROE) Consolidated profit after tax as a percentage of average equity.
Dividend payout ratio (DPR) Dividend calculated for the full share capital as a percentage of the Parent Company shareholders' share of net profit for the year.
128 OTHER INFORMATIONROYAL UNIBREW ANNUAL REPORT 2018

DisclaimerForward-looking statementsThis Annual Report contains forward-looking statements, including
statements about the Group’s sales, revenue, earnings, spending,
margins, cash flows, inventories, products, actions, plans, strategies,
objectives and guidance with respect to the Group’s future operating
results. Forward-looking statements include, without limitation, any
statement that may predict, forecast, indicate or imply future re-
sults, performance or achievements, and may contain the following
words or phrases “believe, anticipate, expect, estimate, intend, plan,
project, will be, will continue, likely to result, could, may, might”, or
any variations of such words or other words with similar meanings.
Any such statements involve known and unknown risks, estimates,
assumptions and uncertainties that could cause the Group’s actual
results, performance or industry results to differ materially from the
results expressed or implied in such forward-looking statements.
Royal Unibrew assumes no obligation to update or adjust any such
forward-looking statements (except for as required under the dis-
closure requirements for listed companies) to reflect actual results,
changes in assumptions or changes in other factors affecting such
forward-looking statements.
Some important risk factors that may have direct bearing on the
Group’s actual results include, but are not limited to: economic and
political uncertainty (including interest rates and exchange rates), fi-
nancial and regulatory developments, development in the demand for
the Group’s products, introduction of and demand for new products,
changes in the competitive environment and the industry in which
the Group operates, changes in consumer preferences, increasing
industry consolidation, the availability and pricing of raw materials
and packaging materials, cost of energy, production- and distribu-
tion-related issues, information technology failures, breach
or unexpected termination of contracts, price reductions re-
sulting from market-driven price reductions, determination
of fair value in the opening balance sheet of acquired entities,
litigation, environmental issues and other unforeseen factors.
New risk factors may emerge in the future, which the Group
cannot predict. Furthermore, the Group cannot assess the
impact of each factor on the Group’s business or the extent
to which any individual risk factor, or combination of factors,
may cause results to differ materially from those contained in
any forward-looking statement. Accordingly, forward-looking
statements should not be relied on as a prediction of actual
results.
129 OTHER INFORMATIONRoYAL UnIBReW ANNUAL REPORT 2018

Royal Unibrew A/S
Royal Unibrew A/SFaxe Alle 1DK-4640 FaxeTel +45 56 77 15 00
CVR No.: 41 95 67 12Financial year: 1 January – 31 December Registered municipality: Faxe
Homepage: www.royalunibrew.com E-mail: [email protected]
Design and production: N
oted
130 OTHER INFORMATIONROYAL UNIBREW ANNUAL REPORT 2018