royal unibrew a/s annual report 2015 -...
TRANSCRIPT

Royal Unibrew A/S
Annual Report 2015

Operational
ef
ficiency
Financial
flexibility
Sign
ifica
nt
mar
ket p
ositi
ons
Locally based
Innovation
and development
Royal Unibrew is a leading regional beverage provider in a num-ber of markets – primarily in Northern Europe, Italy and in the international malt beverage markets.
We produce, market, sell and distribute quality beverages with focus on branded products within beer, malt beverages and soft drinks as well as cider and long drinks.
Our marketsOur main markets are Denmark, Fin-land, Italy and Germany as well as Latvia, Lithuania and Estonia. To these should be added the international markets com-prising a number of established markets in the Americas region and major cities in Europe and North America as well as emerging markets in for example Africa.
Denmark – the number two provider of beer and soft drinks with a number of strong brands
Finland – the number two provider of beer and soft drinks with a number of strong brands, as well as international spirits and wine brands
The Baltic countries – among the lead-ing providers of beer and soft drinks holding considerable market positions
Italy – among the market leaders in the super premium segment for beer with Ceres Strong Ale
International markets – among the market leaders in the premium seg-ment for dark malt beverages, whereas the beer category is covered by the Faxe brand
Our brandsIn all of our markets, we offer our cus-tomers strong and locally based brands.
Based on continuous development and innovation, it is our objective to meet customer demand for quality beverages.
In addition to our own brands, we offer li-cence-based international brands of the PepsiCo and Heineken Groups.
Our financial targetsOur medium-term financial targets:
EBIT margin: 15%NIBD/EBITDA: Max 2.5 timesEquity ratio: at least 30% at year end
Distribution policyRoyal Unibrew is expected to continue generating a rather significant liquidity surplus in the future, and it remains the intention currently to make distributions to shareholders.
Dividend: 40-60% of net profit for the year
Share buy-backs will be considered cur-rently taking into account optimisation of the capital structure.
Our strategy It is our strategy to be a focused, regional beverage provider within beer, malt bev-erages and soft drinks – and to achieve leading positions in the markets or the segments in which we operate.
The main elements of our strategy are as follows:
Royal Unibrew in Brief

1184
2011
631
321
2379
1553
2012 2013 2014 2015
7,3
2011
8,9
12,5
16,2
21,2
2012 2013 2014 2015
6,4
2011
7,1
9,2
11,313,0
2012 2013 2014 2015
Net revenue in 2015 at same level as 2014
mDKK
6,032
EBIT margin in 2015 1,6 percentage points higher than in 2014
%
15.2
Net profit for 2015 14 % higher than in 2014
mDKK
711Net revenue in 2015 allocated by segment
%
EBIT in 2015 allocated by segment*
%
2015 was a good year for Royal Unibrew.
Solid market positions and Hartwall integration resulted in the best perfor-mance ever
Net interest – bearing debt
mDKK
Cash flow per share
DKK per share of DKK 2
Earnings per share (EPS)
DKK per share of DKK 2
EBITDA in 2015 8 % higher than in 2014
DKK mio.
1,225
* -4% not allocated
Malt Beverages and Export 8%
Baltic Sea 47%
Western Europe 45%
Malt Beverages and Export 11%
Baltic Sea 39%
Western Europe 54%
Results 2015
ROYAL UNIBREW ANNUAL REPORT 2015 3
4 ANNUAL REPORT 2015 ROYAL UNIBREW

ReviewsRoyal Unibrew in Brief 2Results 2015 3CEO Letter 6Financial Highlights and Ratios 9Strategy 11Outlook 14Financial Review 16Western Europe 20Baltic Sea 24Malt and Exports 28Shareholder Information 31Corporate Governance 35Risk Management 38Remuneration 42Board of Directors and Executive Board 44Organisation and Employees 49Corporate Social Responsibility 51
Management's Statement and Auditor's ReportManagement's Statement on the Annual Report 56Independent Auditor's Report 57
Consolidated Financial Statements Income Statement 59Statement of Comprehensive Income 59Assets 60Liabilities and Equity 60Cash Flow Statement 61Statement of Changes in Equity 62Contents of Notes 63Notes 64
Parent Company Financial Statements Content 97Income Statement 98Statement of Comprehensive Income 98Assets 99Liabilities and Equity 99Cash Flow Statement 100Statement of Changes in Equity 101Notes 102
Other Information Quarterly Financial Highlights and Ratios 116Definitions of Financial Highlights and Ratios 117Group Structure 118
Content
The Annual Report has been prepared in Danish and English. In case of discrepancy the Danish version shall prevail.
ROYAL UNIBREW ANNUAL REPORT 2015 5

We achieved satisfactory earnings for 2015 The earnings were above expecta-tions at the beginning of the year and were achieved in spite of poor summer weather as well as continuing challenging market conditions and a small revenue decline. Throughout 2015, we saw a continuing difficult macroeconomic situation in Fin-land alongside weaker demand within our product categories in the other Euro-pean markets, except for Denmark where we saw good progress.
The positive development is due to our focused commercial agenda, the many innovative initiatives in all of our markets as well as continuous efficiency improve-ment throughout our business. We are directing targeted efforts at maintain-ing and further developing our market positions, products and brands and at strengthening our partnerships. We cooperate closely with our customers, which enables us to continuously adapt our product portfolio to the needs of lo-cal consumers and customers.
Also, in our opinion, a considerable part of the explanation of our positive
momentum in recent years lies in our shared values and our leadership within Royal Unibrew, and in the continuity seen among our employees.
Reinforced position in DenmarkThe Danish part of our business devel-oped very satisfactorily in 2015. Across channels and categories, we are seeing increasing consumer demand for our products. Our progress in the Danish market also reflects the priority we give to ensuring cooperation with our con-sumers. This is effected eg through lo-cally based sponsorships for eg the Dan-ish football club AGF and more national concepts such as ”Tak Rock” (Thank You, Rock). We have also launched the organ-ic beer ROYAL Økologisk (Royal Organ-ic) and the new, interesting craft beers Schiøtz and Lottrup, which have been re-ceived very well by consumers. Schiøtz and Lottrup achieved a top 3 position in their categories in the European Beer Star and the International Food Contest, 2015. Moreover, we consider it a recog-nition of our work that, also in 2015, we achieved very high scores in third-party
measurements of our customers’ satis-faction with their suppliers.
Considerable headway with the Hartwall integrationSince acquiring Hartwall in 2013, we have directed targeted efforts at ensur-ing successful integration of Hartwall into Royal Unibrew. We have followed our ambitious plan, and significant changes have been made to simplify and optimise. With the change to a common SAP plat-form during Q1 2016, we achieved yet another key integration milestone. As in the rest of our business, we will focus on continuous improvement measures going forward.
Alongside the integration, we have been working under difficult market conditions at reinforcing Hartwall’s commercial position as a market-leading beverage provider in Finland – and we are moving in the right direction in this multiannual effort. We focus on strengthening part-nerships and increasing our presence with our customers. Through continuous innovation, we are striving to meet the changed consumer and customer needs
Solid market positions and Hartwall integration generate additional earnings increase2015 was a good year for Royal Unibrew. We improved our earnings and cash flow, and also reinforced our market positions. At the same time, we have made considerable headway with the Hartwall integration. Following a year of dividend pause in 2014 and a significant debt reduction, Royal Unibrew again has satisfactory financial and strategic flexibility. Therefore, as planned, we resumed dividend distribution and share buy-backs in 2015. We also increased our medium-term EBIT margin target from 14% to 15%. The good performance is due to our regional beverage strategy with local closeness to our consumers combined with strong customer relations as well as committed and competent employees throughout our organisation.
6 ANNUAL REPORT 2015 ROYAL UNIBREW
in the wake of the challenging macroe-conomic situation in Finland, and, as in 2014, we succeeded in maintaining our market shares in 2015. At the same time, we are pleased to note that our score in third-party measurements of our cus-tomers’ satisfaction with their suppliers is significantly higher than before we ac-quired Hartwall.
Continued strong growth in Malt Beverages and ExportsIn recent years, we have increased our investments in establishing and develop-ing Faxe beer brand and our strong malt beverage brands internationally. Also in 2015, we saw good progress, which was achieved in spite of reduced growth rates as a result of the macroeconomic devel-opment in the economies relying on raw materials and the development in the lo-cal currencies in several markets in Af-rica and the Americas. The high growth was primarily generated in Africa. We intend to continue increasing our market investments as long as we identify attrac-tive growth opportunities. We expect con-tinued growth in this part of our business,
albeit at a lower level than in recent years due to the weaker macroeconomic devel-opment in a number of markets.
Expanded cooperation with PepsiCoIt is important for us continuously to further develop our business and es-tablish a basis for future growth. We are therefore pleased that in 2015 we had the opportunity of further reinforcing our long-standing, good cooperation with PepsiCo in Denmark and Finland. As of 1 January 2016, the cooperation with PepsiCo will be expanded to include the production, sale and distribution of a number of PepsiCo soft drinks products in Latvia, Lithuania and Estonia. This will complement our product portfolio in the Baltic countries and strengthen Royal Unibrew’s customer relations. Moreo-ver, we will take over the sale of Pepsi-Co’s snack products under brands such as Lay's and Bugles in Denmark. These are a good match for our beverage port-folio as consumers often buy and enjoy snacks and beverages together. We are pleased that in 2015, as in 2013, PepsiCo
singled out Royal Unibrew as “Bottler of the Year” in the EMEA region.
EBIT margin target increased to 15%Based on our good results in 2015 and our expected future development, at the end of 2015 we increased our me-dium-term EBIT margin target to about 15% compared to the previous target of about 14%. We consider the 15% target ambitious – both compared to interna-tional and regional beverage providers in Europe. This should also be viewed in light of continuously challenged Europe-an markets, expected lower growth in the malt business than in previous years, smaller efficiency gains than achieved in recent years as well as increased invest-ments in market positions and brands in our key markets.
Dividend distribution resumed in 2015Our targets for indebtedness and capital structure on the one hand and distribu-tion policy on the other have remained unchanged for several years.
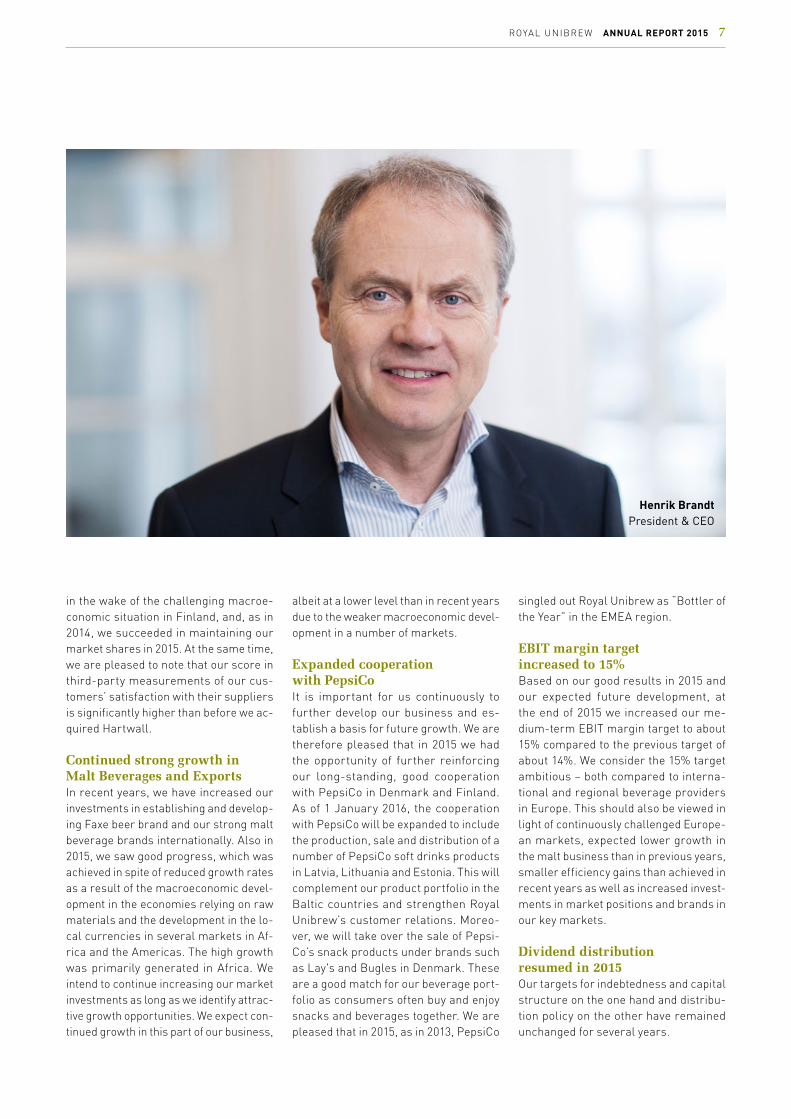
Henrik BrandtPresident & CEO
ROYAL UNIBREW ANNUAL REPORT 2015 7

However, as we all know, with the ac-quisition of Hartwall in August 2013, we decided temporarily to increase our in-debtedness beyond the targeted frame-work while putting our distribution policy on hold until 2015. It was our objective to reduce our debt fast and to restore our financial strength in order to resume div-idend distribution. We have succeeded in these efforts due to our good results and strong cash flow. Therefore, as planned, we resumed dividend distribution in 2015, while launching in March 2015 a considerable DKK 350 million share buy-back programme. The programme was completed in February 2016.
Based on the results for 2015, the Board of Directors has decided to recommend the distribution of dividend of DKK 7.20 per share and the launch, as soon as possible, of a new share buy-back pro-gramme of up to DKK 450 million cov-ering the period to 28 February 2017 at the latest.
We want the Royal Unibrew share to be accessible to all types of investors; therefore, it was resolved at the Annual General Meeting in 2015 to implement a share split. The denomination of the Royal Unibrew share was subsequently reduced from DKK 10 to DKK 2.
The last part of the brewery site in Aarhus soldIn addition to the positive cash flow from the underlying business, also the gradu-al sale of the brewery site in Aarhus con-tributed considerably to Royal Unibrew’s total cash flow. We have now sold the last part of the site for take-over during 2016, and the sale yielded a total net cash flow after tax of about DKK 470 million.
It is very positive to see the impressive transformation of the Ceres Byen (Ceres City) area into a modern urban district in the centre of Aarhus, and we have great-ly appreciated the local support demon-strated throughout the process.
Good opportunities of leveraging our strong local baseThe development in 2015 was yet an-other important step in the develop-ment which has enabled Royal Unibrew to reinforce its position as a regional beverage provider in Europe in recent years in a very consolidated industry with global competitors. Our main focus area is Europe, but we also operate out-side Europe through our considerable export of non-alcoholic malt beverages and Faxe beer. Our strategy in Europe is to build strong local brand portfolios – preferably supplemented by interna-tional brands through strategic bottling agreements such as our agreement with Heineken and PepsiCo. We have proved that this strategy works vis-à-vis our lo-cal consumers and customers and that ir yields satisfactory financial results.
Our strong regional base and our local brands are key strengths of ours. Among other things, we are witnessing a trend of consumers to an increasing extent de-manding greater originality and locally produced products; moreover, the health trend and the trend towards functional beverages have become more wide-spread. We are able to accommodate these trends due to our rich history and through our closeness to the markets.
We do, however, also expect the primary markets in which we operate to continue being characterised by challenging mar-
ket conditions and tough competition in the coming years. Therefore, there will be a constant need for commercial flex-ibility and innovation in order for us to maintain and strengthen our market po-sitions. In spite of that, we see opportuni-ties of developing our business through the multi- beverage mindset and strong partnerships that generate value to all parties.
Acquisitions are still part of our strategy, and we will carefully consider any acqui-sition opportunities that may generate added value for our shareholders. It is, however, our assessment that at present there is a relatively low probability that opportunities of realising major, signifi-cant acquisitions will arise.
I take this opportunity to thank sincerely everyone at Royal Unibrew for their great and dedicated efforts in 2015, which created good results and reinforced our base in markets subject to constant change. It gives me great confidence that we will continue to be able to further de-velop Royal Unibrew to the benefit of our employees, consumers, customers and shareholders.
I also take the opportunity to thank our customers profoundly for yet another year of good partnerships and, finally, our shareholders for their support of Royal Unibrew.
Henrik BrandtPresident & CEO
8 ANNUAL REPORT 2015 ROYAL UNIBREW

Financial Highlights and Ratios 2015 2014 2013 2012 2011
Sales (million hectolitres) 9.1 9.0 7.0 5.4 5.7
INCOME STATEMENT (MDKK) Net revenue 6,032 6,056 4,481 3,430 3,431EBITDA 1,225 1,130 732 611 601EBITDA margin (%) 20.3 18.7 16.3 17.8 17.5Earnings before interest and tax (EBIT) 917 826 560 485 474EBIT margin (%) 15.2 13.6 12.5 14.1 13.8Income after tax from investments in associates 31 35 34 34 14Other financial income and expenses, net -46 -60 -46 -38 -27Profit before tax 902 801 548 481 461Net profit for the year 711 624 480 373 351
BALANCE SHEET (MDKK) Non-current assets 5,505 5,664 5,810 1,992 2,291Total assets 6,748 7,024 6,925 2,848 2,890Equity 2,935 2,818 2,133 1,348 1,321Net interest-bearing debt 1,184 1,553 2,379 321 631Net working capital -990 -814 -834 -179 -149
CASH FLOWS (MDKK) Operating activities 1,160 895 653 497 398Investing activities -123 -69 -2,837 192 3Free cash flow 1,032 824 598 476 384
SHARE RATIOS (DKK) Earnings per share (EPS) 13.0 11.3 9.2 7.1 6.4Diluted earnings per share 12.9 11.2 9.2 7.1 6.4Cash flow per share 21.2 16.2 12.5 8.9 7.3Dividend per share 7.2 6.8 0.0 4.8 3.4Year-end price per share 280.1 217.4 147.2 98.4 64.3
EMPLOYEES Average number of employees 2,314 2,374 1,935 1,635 1,785
FINANCIAL RATIOS (%) Return on invested capital including goodwill (ROIC) 16 13 13 21 18Return on invested capital excluding goodwill (ROIC) 23 19 18 24 22Free cash flow as a percentage of net revenue 17 14 13 14 11Cash conversion 145 132 125 128 110Net interest-bearing debt/EBITDA (times) 1.0 1.4 2,3* 0.5 1.0Equity ratio 43 40 31 47 46Return on equity (ROE) 25 25 28 28 27Dividend payout ratio (DPR) 58 60 0 68 55
* calculated proforma with Hartwall's realised full-year EBITDA
Ratios comprised by the “Recommendations and Financial Ratios 2015” issued by the Danish Society of Financial Analysts have been calculated according to the recommendations.
Definitions of financial highlights and ratios are provided on page 117.
ROYAL UNIBREW ANNUAL REPORT 2015 9


Strategy
Royal Unibrew’s overall strategy remains unchanged and is a continuation of pri-or years’ targeted efforts as a regional beverage provid-er. In November 2015, the results of the strategy creat-ed the basis for increasing the medium-term EBIT mar-gin target to 15%. The cap-ital structure and dividend targets are maintained.
Overall strategy It is Royal Unibrew’s strategy to be a focused, strong regional beverage pro-vider within beer, malt and soft drinks, including soda water, mineral water and fruit juices as well as cider and long drinks (RTD) holding leading positions in the markets or the segments in which we operate.
Based on our good results in 2015 and our expected future development, at the end of 2015 we increased our me-dium-term EBIT margin target to about 15% compared to the previous target of about 14%. We consider the 15% target ambitious – both compared to interna-tional and regional beverage providers in Europe. This should also be viewed in light of continuously challenged Europe-an markets, expected lower growth in the malt business than in previous years, smaller efficiency gains than achieved in recent years as well as increased invest-ments in market positions and brands in our key markets.
Royal Unibrew operates in markets that are characterised by different dynam-ics. This has been taken into account
when determining the strategy market by market.
Royal Unibrew expects developments in the individual markets to be as follows:
Western europe The Danish consumer market is ex-pected continuously to be affected by a minor structural consumption decline in the coming years. The beer category will be the primary driver of the struc-tural decline resulting from consumers increasing their consumption of other al-coholic beverages. In the beer category, the current trend for craft/special brews is expected to continue and enhance the opportunities of added value in the beer market. Within the soft drinks and mineral water categories, new product sub-categories are still expected to be developed driven by, among other things, health trends and the need for function-al beverages, which is expected to curb the decline in the total beverage market. Consumer demand for a broader product range and innovative products will con-tinue to affect complexity, and thus the need to be flexible in the face of change.
The Italian beer market, which is char-acterised by a low per capita consump-tion compared to other “wine countries”, consumption is expected to remain un-changed due to the economic challenges faced by Italy and the Italian consumers. In the medium term, the beer market is expected to show a slight structural in-crease. The economic challenges faced by Italy are expected to reduce growth opportunities within the super premium segment due to, among other things, con-sumption pattern changes which imply a shift of sales from on-trade to off-trade.
Baltic seaIn Finland the total beverage market in which Hartwall operates is expected
to show a slight structural decline in the coming years, due to, among other things, the high indirect tax level. The Finnish macroeconomy is challenged, which will affect total beverage con-sumption negatively in the coming years. On-trade is still expected to be hit in a higher degree by the negative develop-ment than off-trade, and within off-trade a slight increase in sales in the discount segment is expected. Innovation will continue to be an important element in developing the overall beverage mar-ket. Consumer demand for a broader product range and innovative products will continue to affect complexity, and thus the need to be flexible in the face of change.
The total beverage market in the Bal-tic countries is expected structurally to have a larger overall potential in the long term than today. The potential will be closely related to the macroeconomic conditions, including spending power de-velopment, unemployment, and emigra-tion as well as indirect tax issues.
Malt beverages and exportsThe market for dark malt beverages is geographically fragmented, and con-sumer preference for dark malt bever-ages is rooted in tradition. The markets for dark malt beverages in established economies in Europe and the Caribbean are expected to be structurally stable. Demand for beer and dark malt bever-ages is expected to show a structural increase in a number of developing coun-tries, albeit at a lower level than seen in recent years. The lower growth should be viewed in light of the macroeconomic development in a number of countries in Africa and the Americas – a development with is to a large extent characterised by declining raw materials prices, lower foreign investments and a shortage of “hard” currencies.
ROYAL UNIBREW ANNUAL REPORT 2015 11

Main elements of the overall strategy
Distribution policy
Focus on markets and segments in which Royal Unibrew holds or may achieve a considerable position• Royal Unibrew focuses on further devel-
oping established market and segment positions where the Company holds ei-ther a leading position, such as in Den-mark, Finland and the Baltic countries, or considerable and leading niche positions, such as in Italy and in the international malt beverage markets to which beer is also exported. As regards mainstream market positions in consolidated markets, it must be possible to achieve a role as a leading player to create attractive profit-ability.
• Royal Unibrew’s natural market area is characterised by considerable industry concentration. To the extent that structur-al growth opportunities arise, including opportunities of acquisition or of entering into partnerships, which might reinforce existing market positions or create new
market positions, these will be assessed if there is a clear strategic match and long-term shareholder value can be cre-ated.
• Efforts will be made to reinforce main-stream market positions in smaller mar-kets through focus on a broader beverage portfolio to leverage partnerships with our customers and the entire infrastruc-ture.
Focus on innovation and development of Royal Unibrew’s products and local brand positions • Royal Unibrew’s strong position as a re-
gional brewer builds on strong local mar-ket positions established on the basis of well-known local brand portfolios subject to continuous further development. The product portfolio development includes the Group’s own development of new taste varieties, products and brands with-in existing and new beverage categories
as well as the conclusion of new licence agreements both as a licensee and a li-censor. For example, Royal Unibrew has enjoyed long-standing cooperation with PepsiCo and Heineken as a licensee in Denmark, Finland and the Baltic coun-tries (as of 2016) – cooperation through which the local brand portfolios are ex-panded with well-known international brands.
Focus on operational efficiency • Royal Unibrew will continue its focus on
pursuing all opportunities of continuously enhancing the efficiency of all links in the Company’s value chain. Following several years of significant improvements, the ef-ficiency-enhancing opportunities are ex-pected to be limited in the coming years.
Focus on maintaining Royal Unibrew’s financial flexibility, competitive power and scope for strategic manoeuvrability through an appropriate capital structure
As Royal Unibrew is still expected to gen-erate a rather significant liquidity surplus going forward, it remains the intention cur-rently to make distributions to shareholders through a combination of annual dividend and share buy-backs taking into account the mentioned targets for equity ratio and
indebtedness, annual earnings and cash flows as well as Royal Unibrew’s strategic position in general.
It remains Royal Unibrew’s intention to dis-tribute dividend of 40-60% of net profit for the year and to launch share buy-back pro-
grammes when it is considered appropriate to optimise the Company’s capital structure. It is the intention that shares bought back will be cancelled.
Further development of Royal Unibrew and achievement of the financial targets are generally conditional on continuous busi-ness development through continued fo-cus on growth opportunities, partnerships, innovation, sales and marketing, and on continuous efforts to improve, optimise and enhance efficiency.
EBIT marginFollowing the most recent update in Novem-ber 2015, the medium-term EBIT margin target is about 15%.
Indebtedness It is Royal Unibrew’s objective to maintain its indebtedness at a level which, on the one hand, satisfies the request for flexibility with respect to acting on business opportunities and maintaining independence in relation to the Group’s bankers, and, on the other hand, ensures that Royal Unibrew is not heavily overcapitalised. The objective is assessed in view of Royal Unibrew’s wish to keep its ”investment grade” classification.
It remains the target that net interest-bear-ing debt should not exceed 2.5 times EBIT-DA, and that an equity ratio of at least 30% should be maintained at year end. Royal Uni-brew may depart from the targeted ratios for a certain period if structural business opportunities arise as was the case in the period following the acquisition of Hartwall.
Royal Unibrew’s annual investments are expected to be at the level of about 4% of net revenue.
Financial targets and capital structure
12 ANNUAL REPORT 2015 ROYAL UNIBREW

Outlook
The outlook for Royal Unibrew’s financial development in 2016 has been prepared taking into account a number of circumstances, including how the Company’s markets are expected to be affected by general economic activity, fiscal measures and consumer uncertainty. Moreover, the outlook has been prepared taking into account the development in material expense categories as well as the effect of initiatives completed and initiated.
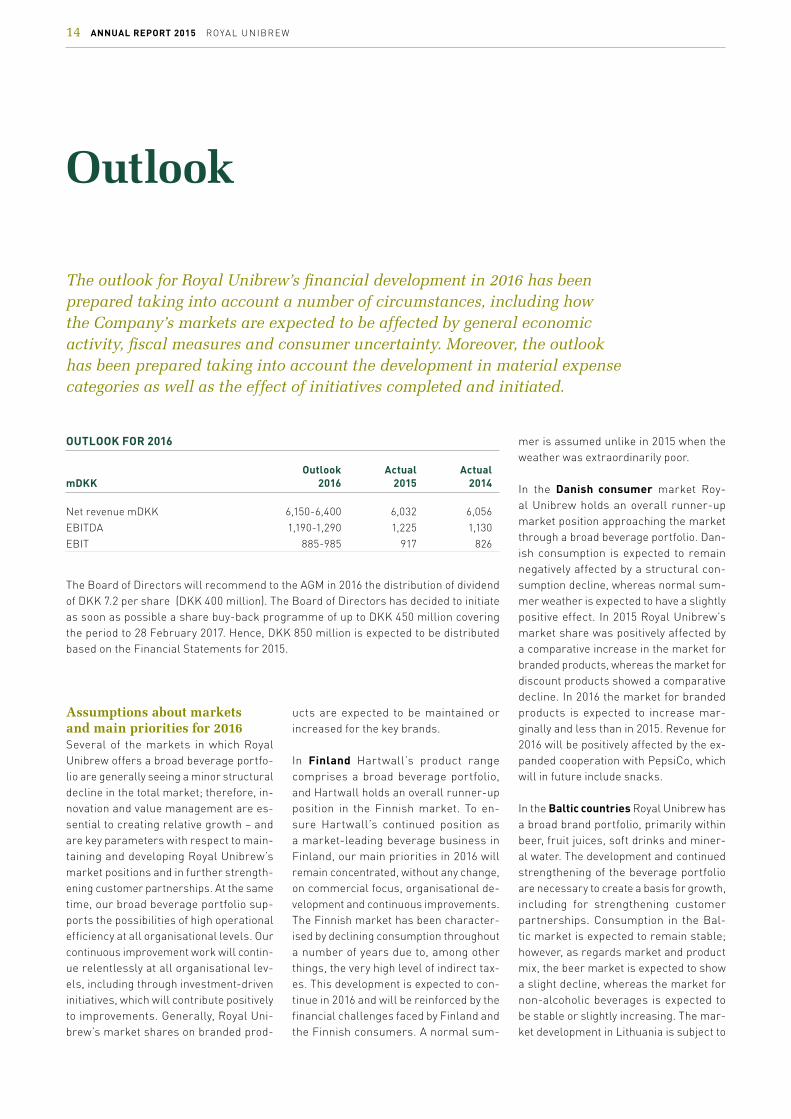
OUTLOOK FOR 2016
Outlook Actual Actual mDKK 2016 2015 2014
Net revenue mDKK 6,150-6,400 6,032 6,056
EBITDA 1,190-1,290 1,225 1,130
EBIT 885-985 917 826
The Board of Directors will recommend to the AGM in 2016 the distribution of dividend of DKK 7.2 per share (DKK 400 million). The Board of Directors has decided to initiate as soon as possible a share buy-back programme of up to DKK 450 million covering the period to 28 February 2017. Hence, DKK 850 million is expected to be distributed based on the Financial Statements for 2015.
Assumptions about markets and main priorities for 2016Several of the markets in which Royal Unibrew offers a broad beverage portfo-lio are generally seeing a minor structural decline in the total market; therefore, in-novation and value management are es-sential to creating relative growth – and are key parameters with respect to main-taining and developing Royal Unibrew’s market positions and in further strength-ening customer partnerships. At the same time, our broad beverage portfolio sup-ports the possibilities of high operational efficiency at all organisational levels. Our continuous improvement work will contin-ue relentlessly at all organisational lev-els, including through investment-driven initiatives, which will contribute positively to improvements. Generally, Royal Uni-brew’s market shares on branded prod-
ucts are expected to be maintained or increased for the key brands.
In Finland Hartwall’s product range comprises a broad beverage portfolio, and Hartwall holds an overall runner-up position in the Finnish market. To en-sure Hartwall’s continued position as a market-leading beverage business in Finland, our main priorities in 2016 will remain concentrated, without any change, on commercial focus, organisational de-velopment and continuous improvements. The Finnish market has been character-ised by declining consumption throughout a number of years due to, among other things, the very high level of indirect tax-es. This development is expected to con-tinue in 2016 and will be reinforced by the financial challenges faced by Finland and the Finnish consumers. A normal sum-
mer is assumed unlike in 2015 when the weather was extraordinarily poor.
In the Danish consumer market Roy-al Unibrew holds an overall runner-up market position approaching the market through a broad beverage portfolio. Dan-ish consumption is expected to remain negatively affected by a structural con-sumption decline, whereas normal sum-mer weather is expected to have a slightly positive effect. In 2015 Royal Unibrew’s market share was positively affected by a comparative increase in the market for branded products, whereas the market for discount products showed a comparative decline. In 2016 the market for branded products is expected to increase mar-ginally and less than in 2015. Revenue for 2016 will be positively affected by the ex-panded cooperation with PepsiCo, which will in future include snacks.
In the Baltic countries Royal Unibrew has a broad brand portfolio, primarily within beer, fruit juices, soft drinks and miner-al water. The development and continued strengthening of the beverage portfolio are necessary to create a basis for growth, including for strengthening customer partnerships. Consumption in the Bal-tic market is expected to remain stable; however, as regards market and product mix, the beer market is expected to show a slight decline, whereas the market for non-alcoholic beverages is expected to be stable or slightly increasing. The mar-ket development in Lithuania is subject to
14 ANNUAL REPORT 2015 ROYAL UNIBREW
great uncertainty due to an indirect tax increase and the introduction of a depos-it, both measures taking effect during Q1. Revenue for 2016 will be positively affected by the expanded cooperation with Pepsi-Co – a licence agreement has been made comprising, among other products, Pepsi, Pepsi Max and 7up.
In Italy, where Royal Unibrew holds a strong position in the super premium seg-ment with Ceres Strong Ale, the market is expected to show a low single-digit per-centage decline due to extraordinarily fine
summer weather in 2015. Disregarding the “summer effect”, the market is expected to remain stable. We plan to expand our cooperation with the many wholesalers and cash & carry customers, and our co-operation with off-trade customers will be supported by consumer activation.
In the Malt Beverages and Exports seg-ment we continue our focus on a larger presence in already established markets and in the new markets penetrated in the past years. Great emphasis is placed on selecting and retaining our cooperation
through customer- and consumer-ori-ented marketing investments with a view to establishing and reinforcing brand positions. The malt beverage markets in Europe and the Caribbean are expected to remain unchanged. However, the malt beverage and beer markets in Africa and Central America are expected to show slight increases, primarily driven by popu-lation growth, but the rate of increase will be reduced as a number of these markets will continue to be negatively affected by the macroeconomic development and de-valuation of local currencies.
FINANCIAL ASSUMPTIONS
• Unchanged or slightly decreasing net selling prices are assumed as a result of, among other things, price pressure in a number of the Group’s key markets.
• The expanded cooperation with Pepsi-Co with effect from 1 January 2016 is expected to increase revenue for 2016 by approx 2% as compared to 2015. The expanded cooperation comprises a li-cence agreement for a number of Pep-siCo beverages in the Baltic countries and a distribution and sales agreement for PepsiCo snack products in Den-mark. 2016 will be a start-up year, and this, combined with the fact that the snack agreement is in the nature of goods for resale, will imply dilution of the Group’s EBIT margin.
• A normal summer is assumed, where 2015 was negatively affected by poor summer weather in Northern Europe and very fine summer weather in Italy.
• Generally speaking, costs are expected to follow inflation in 2016. Organically,
costs are expected to show a slight de-cline, whereas increased expenses for growth initiatives and support of the ex-isting business are expected to increase costs correspondingly. The growth initi-atives relate primarily to the Malt Bever-ages and Exports segment and the two new cooperation agreements with Pep-siCo. Our efforts to support our exist-ing business relate to our strong brand portfolio in key markets for which we expect to increase marketing expenses. We will continue our focus on generating continuous improvements and enhanc-ing efficiency across the business and in all entities, albeit at a lower level than that achieved in previous years.
• Taking into account exchange rates at the end of February 2016, the prices of the key raw materials categories are expected to remain unchanged in 2016. Royal Unibrew has entered into hedg-ing agreements for the majority of key consumption categories in 2016. The development comprises geographic as well as product- related differences,
with some categories being expected to increase whereas others are expected to decline.
• Exchange rates between DKK and oth-er currencies are expected to remain unchanged as compared to the end of February 2016.
• Gross investments are expected to amount to DKK 230-250 million.
• Tax is expected to amount to 21-22% of profit before tax excluding income after tax from investments in associates.
• Special circumstances are expected to have at total positive effect of approx DKK 35 million on free cash flow: A cash flow after tax of approx DKK 195 million is expected from the remain-ing sale of the brewery site in Aarhus in 2016, whereas current liabilities are expected to be reduced by DKK 160 million as compared to the end of 2015 due to expected termination of an extra-ordinary campaign in Finland.
FORWARD-LOOKING STATEMENTS
This Announcement contains “forward- looking statements”. Undue reliance should not be placed on forward-look-ing statements because they relate to and depend on circumstances that may or may not occur in the future and ac-tual results may differ materially from
those in forward-looking statements. Forward-looking statements include, without limitation, statements regarding our business, financial circumstances, strategy, results of operations, financing and other plans, objectives, assumptions, expectations, prospects, beliefs and oth-
er future events and prospects. We un-dertake no obligation, and do not intend to publicly update or revise any of these forward-looking statements, unless prescribed by law or by stock exchange regulations.
ROYAL UNIBREW ANNUAL REPORT 2015 15

2011 2012 2013 2014 20150
200400600800100012001400
1516171819202122
Q1 Q2 Q3 Q4 Q1 Q2 Q3 Q42014 2015
3000
4000
5000
6000
7000
0
4
8
12
16
Financial review
Royal Unibrew achieved satisfactory earnings for 2015 – earnings which were above expectations at the beginning of the year. The earnings increase was achieved in spite of poorer summer weather in our key markets, Denmark and Finland, than in 2014. Generally, but particularly in Den-mark and Germany and in the malt and export markets, Royal Unibrew’s market positions developed positively.
Business development Overall, Royal Unibrew’s market shares increased in 2015. Sales showed a 1% increase for 2015, whereas net revenue was at the 2014 level in spite of poorer summer weather and a consumption de-cline in Finland. The highest growth was achieved in the Malt Beverages and Ex-ports segment, in which sales increased by 7% and net revenue by 11% on 2014 despite negative macroeconomic devel-opments and reduced access to “hard” currencies in several markets.
In 2015 Royal Unibrew improved its earnings considerably as compared to last year. Operating profit was positively affected by higher efficiency as well as targeted value management of products and strengthening of customer partner-ships, and a changed market mix in the
Baltic Sea segment and product mix in sales to Danish consumers affected earnings positively. Exchange rate de-velopments only affected earnings to a limited extent as purchases were mainly made in the Group’s revenue currencies.
Earnings before interest and tax (EBIT) amounted to DKK 917 million, which is DKK 91 million above the 2014 figure, which included non-recurring costs of DKK 50 million for restructuring Hart-wall. The profit before tax amounting to DKK 902 million for 2015 was DKK 101 million above the 2014 figure. Free cash flow for 2015 amounted to DKK 1,032 million compared to DKK 824 million for 2014 and was extraordinarily positively affected by approx DKK 160 million by a campaign activity in Finland in Q4. In 2015 dividend distribution and share buy-backs
totalling DKK 666 million were made, while net interest-bearing debt was re-duced by DKK 369 million to DKK 1,184 million. The NIBD/EBITDA debt multiple decreased from 1.4 to 1.0 in 2015.
In 2015, 18,900 square metres of building rights at the brewery site in Aarhus were sold, and A. Enggaard A/S has notified Royal Unibrew (see Company Announce-ment No 32/2015 of 10 August 2015) of its intention to exercise its option to pur-chase the remaining 35,625 square me-tres of building rights in 2016. All 140,000 square metres of building rights are thus expected sold at the end of 2016. The sale of the remaining part of the brewery site is expected to have a net cash flow ef-fect after tax of approx DKK 155 million comprising a negative effect of approx DKK 40 million from tax payment in 2015
EBITDA (mDKK) (%)
CURRENT 12 MONTHS DEVELOPMENT (%) (mDKK)
EBITDA margin EBIT margin Net revenue
16 ANNUAL REPORT 2015 ROYAL UNIBREW

2011 2012 2013 2014 201511
12
13
14
15
16
17
2011 2012 2013 2014 20153000
4000
5000
6000
7000
2011 2012 2013 2014 20150
200
400
600
800
1000
1200
and a positive effect of approx DKK 195 million in 2016.
A share buy-back programme carried out in accordance with the “Safe Har-bour” method for the period to 1 March 2016 was initiated in March 2015 with a view to adjusting the capital structure of Royal Unibrew A/S (see Company Announcement No 2/2015 of 10 March 2015). The share buy-back programme was completed in February 2016 at which time Royal Unibrew had bought back X shares representing a total market val-ue of DKK 350 million. At 31 December 2015, Royal Unibrew had bought back 1,192,118 shares representing a market value of DKK 292 million and held a to-tal of 1,492,118 treasury shares, corre-sponding to 2.7% of the share capital.
Expanded cooperation with PepsiCoRoyal Unibrew has entered into an agree-ment to produce, sell and distribute a number of PepsiCo soft drinks products such as Pepsi, Pepsi Max and Mirinda in Latvia, Lithuania and Estonia as of 1 Jan-uary 2016. This will complement Royal Unibrew’s product portfolio in the Baltic countries and will also strengthen Royal Unibrew’s customer relations.
Moreover, Royal Unibrew is reinforcing its long-standing and good cooperation with PepsiCo by, also as of 1 January 2016, tak-ing over the sale and distribution of Pep-siCo snack products under brands such as Lay's and Bugles in Denmark. Con-sumers often buy and enjoy snacks and beverages together, and therefore snacks products complement and strengthen Royal Unibrew’s beverage sales.
Income statementBeer and soft drinks consumption in Royal Unibrew’s markets in Italy, in the Baltic Sea segment and especially in Finland continues to be affected by con-sumer restraint. Furthermore, the poor summer weather reduced consumption in Northern Europe in 2015, whereas the extraordinarily fine summer weather in Italy resulted in unchanged consumption as compared to 2014.
Sales for 2015 aggregated 9.1 million hectolitres of beer, malt beverages and soft drinks, which is approx 1% above the 2014 figure. Sales for Q4 2015 were 9% above the figure for the corresponding period of 2014 and primarily related to a campaign activity in Finland.
Net revenue for 2015 was at the 2014 level and amounted to DKK 6,032 million compared to DKK 6,056 million in 2014. Average net selling prices per volume unit were 1.8% lower than in 2014, pri-marily due to a changed segment mix and an increased campaign share in Finland. Net revenue for Q4 2015 was 5% above the figure for the corresponding period of 2014, whereas average net selling prices per volume unit were 3.3% lower due to a campaign activity in Finland.
2014 figures included costs of DKK 50 million for restructuring the Finnish brewery Hartwall comprising produc-tion costs of DKK 17 million, sales and distribution expenses of DKK 21 million as well as administrative expenses of DKK 12 million. The below comments on cost developments from 2014 to 2015 are exclusive of the effect of restructuring costs in 2014.
Gross profit for 2015 was DKK 8 million above the 2014 figure and amounted to DKK 3,175 million. Gross profit was positively affected by higher efficiency, whereas the lower net selling prices per volume unit had a negative effect. Gross margin was 0.3 percentage point above the 2014 margin and amounted to 52.6%
AS COMPARED TO THE OUTLOOK ANNOUNCED IN MARCH AND NOVEMBER, ACTUAL NET REVENUE EBITDA AND EBIT WERE AS FOLLOWS
Actual Outlook Outlook mDKK 2015 November 2015 March 2015
Net revenue 6,032 5,950-6,050 5,900-6,100
EBITDA 1,225 1,195-1,235 1,100-1,200
EBIT 917 885-925 790-890
EBIT (mDKK)
EBIT MARGIN (%)
NET REVENUE (mDKK)
ROYAL UNIBREW ANNUAL REPORT 2015 17
compared to 52.3% in 2014. Measured as an average per volume unit, net selling prices decreased by 1.8% and production costs by 2.5%.
Sales and distribution expenses for 2015 were DKK 44 million below the 2014 figure and amounted to DKK 1,922 million. Sales and distribution expenses per volume unit were 4% lower. The re-structuring of Hartwall and the efficien-cy-enhancing activities in 2014 affected the development in distribution expenses positively. Sales and marketing expenses were at the 2014 level.
Administrative expenses for 2015 were DKK 11 million above the 2014 figure and amounted to DKK 335 million. The higher expenses related to, among other things, the implementation of the Group’s ERP system in Finland.
Earnings before interest, tax, deprecia-tion and amortisation (EBITDA) showed a DKK 45 million increase for 2015 and amounted to DKK 1,225 million com-pared to DKK 1,180 million in 2014 (be-fore deducting restructuring costs of DKK 50 million in 2014). The EBITDA increase related primarily to lower ex-penses, but also the value management initiatives contributed to the develop-ment. EBITDA for Q4 2015 amounted to DKK 223 million, which was DKK 25 mil-lion above the figure for the correspond-ing period of 2014.
Earnings before interest and tax (EBIT) for 2015 amounted to DKK 917 million,
which is, on a comparable basis, DKK 41 million above the 2014 figure of DKK 876 million (before deducting restructuring costs of DKK 50 million in 2014). EBIT for Q4 2015 amounted to DKK 142 million compared to DKK 114 million for the cor-responding period of 2014.
EBIT margin for 2015 was 15.2% and, as expected, higher than in 2014 when it was 14.5% (13.6% after deducting 0.9 percentage point related to restructur-ing costs). EBIT margin for 2015 was higher in both the Baltic Sea and the Malt Beverages and Exports segments, whereas it remained unchanged in the Western Europe segment as compared to 2014. EBIT margin for Q4 showed at 1.6 percentage point increase on the cor-responding period of 2014.
Net financials for 2015 showed a net ex-pense of DKK 15 million, which is DKK 10 million below the 2014 figure. Interest expenses amounted to DKK 46 million and were DKK 14 million below the 2014 figure due to lower interest-bearing debt. Oppositely, income after tax from invest-ments in associates was DKK 4 million below the 2014 figure and amounted to DKK 31 million. The figures were nega-tively affected by both the NOK exchange rate development and lower results of Hansa Borg Bryggerierne.
Profit before tax for 2015 showed a DKK 101 million increase amounting to DKK 902 million compared to DKK 801 million in 2014.
Tax on the profit for 2015 was an expense of DKK 191 million, which corresponds to a tax rate of 22 on the profit exclud-ing income after tax from investments in associates.
Net profit for the year amounted to DKK 711 million, which is a DKK 87 million im-provement on the net profit of DKK 624 million realised in 2014.
The Parent Company’s profit for the year amounted to DKK 691 million compared to DKK 630 million in 2014. Dividend in-come from subsidiaries and associates amounted to DKK 297 million compared to DKK 272 million in 2014. The brewery site in Aarhus was revalued by DKK 39 million in 2015.
Balance sheetRoyal Unibrew’s balance sheet at 31 December 2015 amounted to DKK 6,748 million, which is DKK 276 million below the figure at 31 December 2014. The low-er balance sheet total is primarily due to a DKK 158 million reduction of cash at bank and in hand as well as to depre-ciation and amortisation of non-current assets exceeding net investments by DKK 119 million. The sale less revalu-ation for the year of DKK 39 million of the brewery site in Aarhus reduced the balance sheet total by DKK 40 million. Oppositely, inventories and receivables were DKK 40 million above those at 31 December 2014. Invested capital was re-duced by approx DKK 300 million in 2015, which, combined with a higher EBIT, im-proved ROIC excluding goodwill with a
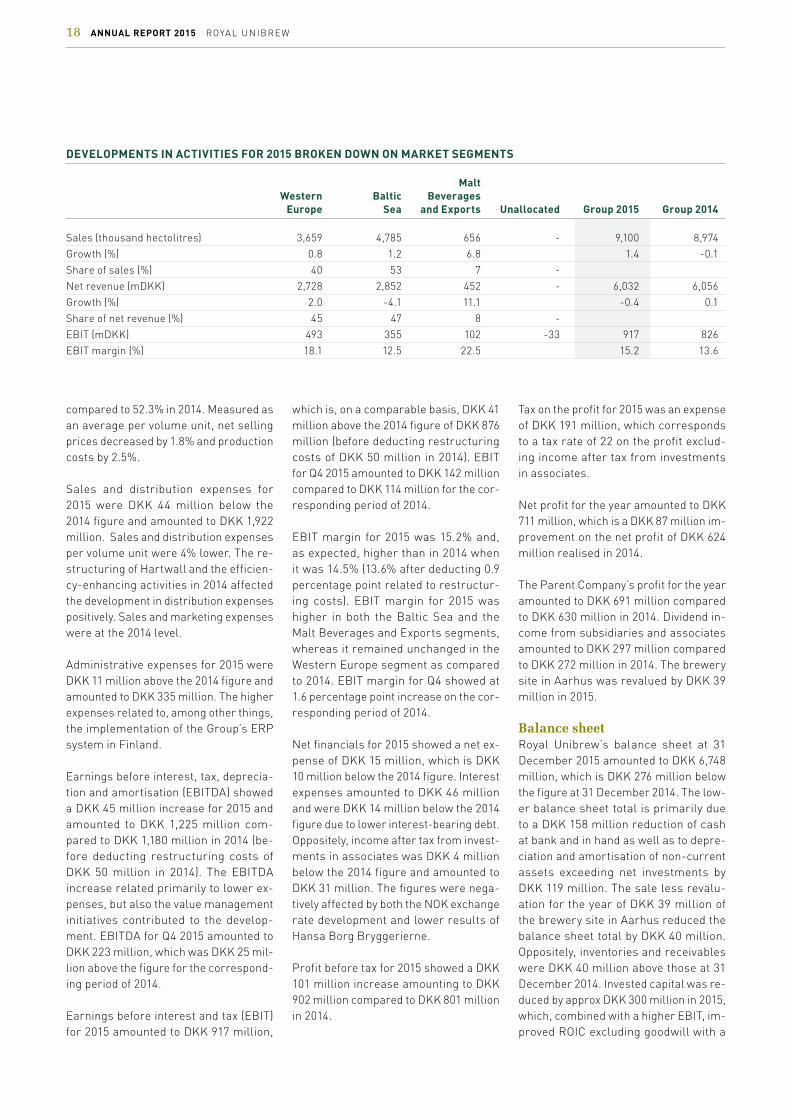
DEVELOPMENTS IN ACTIVITIES FOR 2015 BROKEN DOWN ON MARKET SEGMENTS
Malt Western Baltic Beverages Europe Sea and Exports Unallocated Group 2015 Group 2014
Sales (thousand hectolitres) 3,659 4,785 656 - 9,100 8,974
Growth (%) 0.8 1.2 6.8 1.4 -0.1
Share of sales (%) 40 53 7 -
Net revenue (mDKK) 2,728 2,852 452 - 6,032 6,056
Growth (%) 2.0 -4.1 11.1 -0.4 0.1
Share of net revenue (%) 45 47 8 -
EBIT (mDKK) 493 355 102 -33 917 826
EBIT margin (%) 18.1 12.5 22.5 15.2 13.6
18 ANNUAL REPORT 2015 ROYAL UNIBREW

4 percentage point to 23%, which is at the same level as before the acquisition of Hartwall. ROIC including goodwill in-creased from 13% in 2014 to 16% in 2015.
The equity ratio increased by 3 percent-age points and represented 43% at 31 December 2015 compared to 40% at the end of 2014. Equity at the end of 2015 amounted to DKK 2,935 million com-pared to DKK 2,818 million at the end of 2014. The DKK 117 million change comprised the positive comprehensive income for the year of DKK 766 million added the value after tax of share-based payments of DKK 17 million and deducted distribution to shareholders of DKK 666 million by way of dividend and share buy-backs. The comprehen-sive income comprises the profit for the period of DKK 711 million, revaluation of the brewery site in Aarhus of DKK 39 million, positive exchange rate and oth-er adjustments relating to foreign group enterprises of DKK 13 million, a positive development in the value of hedging in-struments of DKK 5 million and deduc-tion of tax on comprehensive income of DKK 2 million.
Net interest-bearing debt for 2015 was reduced by DKK 369 million and amount-
ed to DKK 1,184 million at 31 December 2015 compared to DKK 1,553 million at the end of 2014. As expected in Novem-ber when the Interim Report for the pe-riod 1 January - 30 September 2015 was published, the development in net inter-est-bearing debt was positively affected by campaign activity in Q4. The change in net interest-bearing debt equalled the free cash flow less distribution to share-holders.
Funds tied up in working capital showed a negative DKK 990 million at the end of 2015 compared to a negative DKK 814 million at the end of 2014. Funds tied up in working capital were reduced by DKK 176 million, net, including DKK 160 million relating to a timing difference be-tween 2015 and 2016 of current liabilities relating to campaign activity in Finland in Q4 2015. Funds tied up in inventories, trade receivables and trade payables de-creased by DKK 54 million, whereas the other elements of working capital de-creased by DKK 122 million. All entities continue their strong focus on managing inventories, trade receivables and trade payables.
Cash flow statement Cash flows from operating activities for 2015 were DKK 265 above the 2014 figure and amounted to DKK 1,160 million (2014: DKK 895 million). Cash flows comprised the profit for the period adjusted for non-cash operating items of DKK 1,235 million (2014: DKK 1,140 million), posi-tive working capital cash flow of DKK 169 million (2014: negative DKK 34 million), net interest paid of DKK 47 million (2014: DKK 60 million) and taxes paid of DKK 197 million (2014: DKK 151 million).
Free cash flow for 2015 showed an in-crease of DKK 208 million to DKK 1,032 million (2014: DKK 824 million). Cash flows from operating activities and dividend from associates increased by DKK 267 million, and investments in property, plant and equipment showed a net increase of DKK 59 million on 2014. Revenues from asset divestments, substantially relating to the brewery site in Aarhus, were DKK 66 million lower, and investments were DKK 7 million lower. The free cash flow for Q4 2015 amounted to DKK 239 million (2014: DKK 52 million) and was, as ex-pected, positively affected, as compared to the corresponding period of 2014, by an extraordinarily low level of funds tied up in working capital, see above.
ROYAL UNIBREW ANNUAL REPORT 2015 19

2013 2014 2015
13
14
15
16
17
18
19
2013 2014 2015
0
700
1400
2100
2800
3500
4200
2013 2014 2015
0
500
1000
1500
2000
2500
3000
2013 2014 2015
0
90
180
270
360
450
540
Western Europe
The Western Europe segment comprises pri-marily the markets for beer and soft drinks in Denmark and Germany as well as Italy. Western Europe accounted for 45% of the Group’s net revenue for 2015 and for 54% of EBIT (2014: 44% and 59%, respectively).
Sales in Western Europe for 2015 were 1% above sales for 2014. An increase in Royal Unibrew’s market shares on branded beer and soft drinks is estimated from 2014.
Net revenue was 2% above the 2014 fig-ure. A shift towards both products and sales channels in Denmark and Germany
with higher net selling prices per volume unit had a positive effect on the revenue development, whereas the shift in Italy had a negative effect.
Earnings before interest and tax (EBIT) for 2015 showed a DKK 9 million increase from DKK 484 million in 2014 to DKK 493
million in 2015. The EBIT increase was due to a strengthening of the market po-sition in Denmark and Germany as well as a favourable development of the prod-uct mix. EBIT margin was unchanged at 18.1%. The increases in EBIT and EBIT margin for Q4 were due to a better prod-uct and market mix in 2015 than in 2014.
SALES (thousand hectolitres)
EBIT (mDKK)
EBIT MARGIN (%)
NET REVENUE (mDKK)
WESTERN EUROPE
Q1-Q4 2015 Q1-Q4 2014 % change Q4 2015 Q4 2014 % change
Sales (thousand hectolitres) 3,659 3,630 1 880 854 3
Net revenue (mDKK) 2,728 2,674 2 632 595 6
EBIT (mDKK) 493 484 86 78
EBIT margin (%) 18.1 18.1 13.5 13.1
20 ANNUAL REPORT 2015 ROYAL UNIBREW

Denmark and Germany
Royal Unibrew is the second largest provider of beer and soft drinks to Danish consumers. Fur-thermore, Faxe beer is sold to the German market.
Royal Unibrew offers a combina-tion of strong local, national and international beer brands. Royal Beer and the international licence brand Heineken are offered to the entire Danish market, where-as other brands, such as Albani, Ceres and Thor, are offered in ar-eas with strong local bases.
Within soft drinks, Royal Unibrew offers its own brands as well as li-cence-based brands of the PepsiCo Group. Own brands comprise Faxe Kondi, which is the leading brand in the lemon/lime segment, as well as Nikoline. The Pepsi products include Pepsi, Pepsi Max, 7UP and Mirinda.
Within spring water and natural mineral water, Egekilde is a lead-ing Danish brand which comes in a number of taste varieties, still as well as sparkling. Moreover, Roy-al Unibrew offers the Faxe Kondi Booster energy drink as well as a
number of cider, ready-to-drink and shots products under the Tempt brand.
As of 2016, the beverage range of-fered will be supplemented by the PepsiCo Lay's and Bugles snack products.
Royal Unibrew has two produc-tion facilities in Denmark – one in Faxe and one in Odense.
Both off-trade and on-trade cus-tomers are serviced through direct distribution from own terminals.
For Denmark and Germany it is esti-mated that Danish consumption of beer and soft drinks for 2015 was below that of 2014 due to the poor summer weath-er, which makes it difficult to assess the development in the underlying con-sumption. The consumption of branded products increased to the detriment of discount products.
Royal Unibrew’s sales for 2015 showed a 1% increase on 2014, and net revenue showed a 2% increase. The higher net revenue per volume unit was due to both a high level of innovation and a number of commercial initiatives, which resulted
in a favourable shift in the mix of prod-ucts and sales channels. It is estimated that Royal Unibrew’s market shares in-creased – primarily due to a continued consumption shift towards branded products.
The level of innovation was high in 2015 with several successful launches of new products. Royal Unibrew was first to the market with an organic beer, Royal Økologisk, which meets increasing con-sumer demand for organic products. Moreover, Royal Unibrew launched its first proprietary products in the craft beer category under the brand names
Lottrup and Schiøtz, as well as new product varieties of Royal Shandy, Faxe Kondi Booster and the Egekilde brand. Danish consumers received the new products well. Schiøtz Gylden IPA was ranked at the top in a Danish consumer test and won the gold medal in the Inter-national Food Contest, and Royal Shandy has achieved a clear market leader po-sition in the beer mix category. The Faxe Kondi communication platform ”Når der går sport i den” (Becoming a sport) was further developed, and the ”Tak Rock” (Thank You, Rock) concept was support-ed by cooperation with the legendary rock band Dizzy Mizz Lizzy.
Development in 2015
DENMARK AND GERMANY
Q1-Q4 2015 Q1-Q4 2014 % change Q4 2015 Q4 2014 % change
Sales (thousand hecto-litres) 3,257 3,236 1 806 783 3
Net revenue (mDKK) 2,141 2.093 2 520 491 6
ROYAL UNIBREW ANNUAL REPORT 2015 21

Italy
Ceres Strong Ale is among the market leaders in the super pre-mium beer segment and holds a considerable market share in this segment.
It is assessed that about 70% of Ceres Strong Ale is consumed out of home, whereas the rest is consumed at home. The general breakdown of the beer market in Italy is 40% out of home and 60% at home. Ceres Strong Ale has
achieved a very high distribution in the on-trade channel, where the product has one of the broadest distributions within the beer cat-egory.
Moreover, Royal Unibrew sells Ceres Red Erik in the super pre-mium segment as well as the lager types Ceres Top Pilsner and Faxe in the premium segment.
Distribution in the on-trade chan-nel takes place through many wholesalers who service and supply customers or through a number of cash & carry locations where on-trade customers them-selves pick up the goods. Retail customers are serviced either di-rectly to outlets or through distri-bution centres. All goods in Italy are delivered through third-party suppliers.
The market situation in Italy remains marked by consumer restraint. 2015 consumption in both the on-trade and the off-trade sales channels is estimat-ed to have been at the 2014 level. The extraordinarily fine summer weather, which continued all the way into Q4, af-fected consumption positively. The con-sumption of premium and super premi-um products in off-trade is estimated to have increased marginally, whereas the consumption of economy products de-clined marginally in 2015.
Royal Unibrew’s sales for 2015 showed a 2% increase, whereas net revenue showed a 1% increase. In Q4, there seems to have been some stock build-ing at the distributors. Sales and net rev-enue showed increases of 4% and 8%, respectively. Developments for both the full year and for Q4 are, furthermore, due to a changed product and sales channel mix. It is assessed that Royal Unibrew has maintained its market shares in the premium and super premium segments in 2015.
In Italy consumer engagement and development of the communication platform for Ceres Strong Ale are key priorities. In 2015 marketing shifted further away from TV towards the so-cial media, and high growth has been achieved in the target group for Ceres product sales, who are consumers aged between 18 and 35. Moreover, focus was directed in 2015 at further strengthening the commercial customer partnerships in the on-trade channel, eg through the launch of Faxe 10%.
Development in 2015
ITALY
Q1-Q4 2015 Q1-Q4 2014 % change Q4 2015 Q4 2014 % change
Sales (thousand hecto-litres) 402 394 2 74 71 4
Net revenue (mDKK) 587 581 1 112 104 8
22 ANNUAL REPORT 2015 ROYAL UNIBREW


2013* 2014 2015
0
800
1600
2400
3200
4000
4800
2013* 2014 2015
0
600
1200
1800
2400
3000
3600
2013* 2014 2015
8
9
10
11
12
13
14
2013* 2014 2015
0
60
120
180
240
300
360
Baltic Sea
The Baltic Sea segment primarily comprises the markets for beer, fruit juices and soft drinks in Finland and the Baltic countries (Lithuania, Latvia and Estonia) and in Finland also wine and spirits brands. Baltic Sea accounted for 53% of the Group’s net revenue and for 39% of EBIT for 2015 (2014: 49% and 36%, respectively).
Royal Unibrew’s sales increased by 1%, whereas net revenue was 4% below the 2014 figure. It is estimated that Royal Uni-brew’s market share on branded beer and soft drinks products has shown an overall increase. In Finland, which for Royal Uni-brew constitutes by far the largest part of the Baltic Sea segment, consumption continued to decline due to consumer restraint and, moreover, due to extra-ordinarily poor summer weather. These circumstances as well as price pressure
have had a significant negative impact on the developments in Royal Unibrew’s sales and net revenue for 2015. The posi-tive development in Q4 is related to a cam-paign activity in Finland which more than offset the negative development in sales in the first three quarters of the year. The average net revenue per volume unit for Q4 was 4.7% below that of the full year.
Earnings before interest and tax (EBIT) were DKK 60 million above the 2014 fig-
ure, which was affected by non-recurring costs of DKK 50 million for restructuring the Finnish brewery Hartwall. The full-year effect of the restructuring and effi-ciency improvement of Hartwall affected earnings positively, whereas a changed product and channel mix affected earn-ings for 2015 negatively. EBIT margin went up by 2.6 percentage points from 9.9% to 12.5%. The campaign activity in Finland affected full-year EBIT margin negatively.
BALTIC SEA
Q1-Q4 2015 Q1-Q4 2014 % change Q4 2015 Q4 2014 % change
Sales (thousand hectolitres) 4,785 4,730 1 1,225 1,060 16
Net revenue (mDKK) 2,852 2,975 -4 697 666 5
EBIT (mDKK) 355 295 45 29
EBIT margin (%) 12.5 9.9 6.4 4.3
SALES (thousand hectolitres)
EBIT (mDKK)
EBIT MARGIN (%)
NET REVENUE (mDKK)
* Including pro forma figures for Finland for the period 1 January – 22 August 2013
24 ANNUAL REPORT 2015 ROYAL UNIBREW

Finland
Hartwall is a beverage provider with a broad product range hold-ing a clear runner-up position in Finland. In the Finnish market, Royal Unibrew offers a combina-tion of its own strong local and na-tional brands, international Pepsi and Heineken brands as well as a number of international wine and spirits brands.
With a range of own brands such as the Karjala and Lapin Kulta
beer brands, Jaffa (soft drinks), Original (RTD), Upcider (cider), ED (energy drink) and Novelle (min-eral water) as well as international brands such as Fosters, Heineken and Pepsi, Hartwall is the market leader in the categories of miner-al water, cider and ready-to drink (RTD) and a strong runner-up in the categories of branded beer, soft drinks and energy drinks. The trading company Hartwa-Trade operates agencies for a number
of international wine and spirits brands and contributes a minor part of Hartwall’s revenue.
Hartwall operates two production facilities in Lahti (produces all products but mineral water) and Karijoki (mineral water), respec-tively.
A distribution network of own terminals supplies off-trade and on-trade customers directly.
As expected, the Finnish market for beer, soft drinks, wine and spirits prod-ucts was affected by consumer restraint, and this situation is not expected to change in the short and medium term. The extraordinarily poor summer weath-er intensified the declining consumption trend. A medium single-digit percentage decline in the consumption of branded products is estimated. The decline is due partly to increased consumption of private label products, partly to a shift in sales channel mix from on-trade to-wards off-trade.
Sales in Finland were declining in 2015, except for Q4 when a campaign activity more than offset the effect of the con-tinuously declining consumption. Hart-wall’s overall market shares on branded
products are estimated to be unchanged when adjusting for the campaign activi-ty. The generally declining price level, a changed sales channel and product mix but primarily the campaign activity re-sulted in a lower net revenue per volume unit for 2015.
With focus on strengthening partner-ships and increasing the presence and sale of Hartwall products with custom-ers, efforts were directed in 2015 at re-inforcing Hartwall’s commercial position as a market-leading beverage provider in Finland. These efforts are expected to continue in the coming years.
The high level of innovation in Finland continued in 2015 with focus on meet-ing changed consumer and customer
demands. The first proprietary prod-uct in the craft beer category, Hartwall Classic, was successfully launched, and Hartwall also launched the first natural energy drink, Novelle Vire, in the market. Lapin Kulta and Aura were succesfully relaunched in the beer category.
Following the restructuring and organ-isational changes in 2014, efforts were directed in 2015 at continuingly creating greater agility in order to continuously improve work processes and organisa-tional flexibility with a view to increasing efficiency. In Q1 2016, the Group’s SAP platform was implemented in Hartwall, thus completing the last major single el-ement in the integration of Hartwall into Royal Unibrew.
FINLAND
Q1-Q4 2015 Q1-Q4 2014 % change Q4 2015 Q4 2014 % change
Sales (thousand hecto-litres) 2,929 2,910 1 826 653 26
Net revenue (mDKK) 2,212 2,321 -5 562 526 7
Development in 2015
ROYAL UNIBREW ANNUAL REPORT 2015 25

The Baltic countries
Royal Unibrew is a significant beverage provider in the Baltic countries offering a combination of own strong national brands as well as international Heineken brands and, as of 2016, also a num-ber of PepsiCo soft drinks brands.
Royal Unibrew’s brewery business Kalnapilio-Tauro Grupe is the sec-ond largest in Lithuania with the national beer brands Kalnapilis and Taurus and the Vilkmerges craft beer brand, as well as Faxe and Heineken as international brands. Cido is the number two fruit juice brand in terms of size.
With a complete portfolio of fruit juice products under the Cido brand, mineral water under the Mangali brand and nectar drinks under the Fruts brand, Royal Uni-brew’s Cido Grupa in Latvia is the leading provider of fruit juices and mineral water. With the national beer brands Lacplesa Alus and Livu Alus and the Vilkmerges mi-crobrew brand as well as Heinek-en as an international brand, Cido Grupa holds a number three posi-tion within beer.
The primary brands in Estonia are Cido in the soft drinks cate-gory and Meistriti Gildi, Faxe and Heineken in the beer category.
Royal Unibrew has three produc-tion facilities in the Baltic coun-tries – one in Lithuania producing beer, and two in Latvia producing beer and soft drinks, respectively.
Sales are made business-to-busi-ness, and distribution is made di-rectly to the individual off-trade and on-trade customers from own terminals.
Beer and soft drinks consumption in the Baltic countries increased marginally in 2015. The overall development was as expected. The summer weather affected consumption positively as compared to 2014. It is estimated that Royal Unibrew’s market shares on branded products were maintained.
Royal Unibrew’s sales showed a 2% in-crease for 2015, whereas net revenue declined by 2% as a result of a gener-al decline in beer prices. Beer prices in Lithuania declined in H2 2014 and have declined further in 2015 due to price competition in the off-trade sales chan-
nel. Moreover, a large increase in beer taxes in Latvia in the middle of Q3 2015 resulted in increased price competition and a reduction in total consumption in the remaining months of the year. Both of these circumstances explain why net revenue per volume unit was lower in 2015 than in 2014.
In the Baltic countries as in the other group entities, Royal Unibrew has focus on continuous optimisation, and in 2015 focus was directed at increasing flexibil-ity in the total supply chain across the operating units.
The level of innovation was high in the Baltic countries in 2015 with many launches in both Lithuania and Latvia of beer as well as soft drinks products. Mangali Active, Royal Unibrew’s first proprietary product in the functional wa-ter category, was successfully launched in Lithuania and Latvia; in the craft beer category, Vilkmerges Kriek with cherry flavor was launched in Lithuania and became the best-selling product in the category. Additionally, extra aged beer types were launched under the Kalnapi-lis and Lacplesis brands.
Development in 2015
THE BALTIC COUNTRIES
Q1-Q4 2015 Q1-Q4 2014 % change Q4 2015 Q4 2014 % change
Sales (thousand hecto-litres) 1,856 1,820 2 399 407 -2
Net revenue (mDKK) 640 654 -2 135 140 -4
26 ANNUAL REPORT 2015 ROYAL UNIBREW


2013 2014 2015
0
80
160
240
320
400
480
2013 2014 2015
0
150
300
450
600
750
900
2013 2014 2015
0
20
40
60
80
100
120
2013 2014 2015
18
19
20
21
22
23
24
Malt Beverages and ExportsThe Malt Beverages and Exports segment comprises the export and licence business for malt beverages and beer exports to other markets. Malt Beverages and Exports ac-counted for 8% of the Group’s net revenue and for 11% of EBIT for 2015 (2014: 7% and 10%, respectively).
The business area Malt Beverages and Exports comprises an export and licence business, primarily re-lating to non-alcoholic malt bever-ages but also to beer exports under the Faxe brand.
Royal Unibrew has several inter-nationally strong dark malt bev-erage brands which are sold in the premium segment. Vitamalt is assessed to be the malt brand with the broadest global distri-bution, whereas Supermalt and Powermalt hold strong regional positions.
The key market areas for Roy-al Unibrew’s malt beverages are countries in the Americas region and Africa as well as among eth-nic groups from these areas living in and around major cities in Eu-rope and the USA.
The malt beverages and exports markets are primarily supplied by exports from Royal Unibrew’s Danish breweries, but also in cer-tain cases on the basis of licence agreements with local breweries.
The sales organisation, which is to a large extent located in the indi-vidual markets, cooperates closely with our distribution partners on commercial priorities and market-ing initiatives.
SALES (thousand hectolitres)
EBIT (mDKK)
EBIT MARGIN (%)
NET REVENUE (mDKK)
28 ANNUAL REPORT 2015 ROYAL UNIBREW

Sales for 2015 showed a 7% increase and net revenue an 11% increase. The growth is primarily related to the African mar-kets and primarily to the beer category. USD and GBP exchange rate develop-ments affected net revenue positively by approx DKK 22 million. The lower net revenue per volume unit is primarily due to a changed market mix.
Sales in the segment are character-ised by large volumes being exported to distributors at a time, which means that inventory changes should be taken into account when comparing periods. It is the assessment that inventories had
been built up with distributors at the end of Q3 2015, which affected Q4 sales neg-atively. Distributors’ sales to customers and consumers were as expected.
Earnings before interest and tax (EBIT) for 2015 amounted to DKK 102 million, which is DKK 18 million above the 2014 figure, including approx DKK 14 million from exchange rate developments. Ad-justed for the positive exchange rate effect, EBIT margin for 2015 was 19.8% and, as expected, lower than in 2014 due to higher investments made in marketing and penetration of markets with a lower selling price.
In the Americas a changed market mix was seen for 2015 as compared to 2014, which, combined with the exchange rate developments, contributed towards con-siderable net revenue growth.
The development in the business in EMEAA was as expected for 2015. The macroeconomic development in the economies relying on raw materials and the development in the local currencies of a number of markets in Africa have re-duced growth rates in a number of coun-tries. In spite of this, Royal Unibrew’s sales in Africa showed high growth, as expected.
MALT BEVERAGES AND EXPORTS
Q1-Q4 2015 Q1-Q4 2014 % change Q4 2015 Q4 2014 % change
Sales (thousand hectolitres) 656 614 7 130 139 -6
Net revenue (mDKK) 452 407 11 94 90 5
EBIT (mDKK) 102 84 19 16
EBIT margin (%) 22.5 20.7 20.3 17.7
Development in 2015
ROYAL UNIBREW ANNUAL REPORT 2015 29


Shareholder informationRoyal Unibrew wants an open dialogue with its sharehold-ers and also wants to keep them continuously up-to-date on the Company’s development. Therefore, Royal Unibrew em-phasises providing timely and adequate information on its objectives and strategy, business activities, the development in the Company’s markets as well as the financial results.
Share capital, DKK 110,985,000
Number of shares 55,492,500
Denomination DKK 2
Number of share classes 1
Restriction of voting right None
Place of listing Nasdaq Copenhagen A/S
Short name RBREW
ISIN code DK0060634707
Bloomberg code RBREW DC
Reuter code RBREW.CO
Index LargeCap
Share informationThe Royal Unibrew share is listed on Nasdaq Copenhagen A/S, and Royal Uni-brew is included in the LargeCap index.
In 2015 a total of 23,056,784 shares were traded, corresponding to 41.5% of the total number of shares traded (at year end) through Nasdaq Copenhagen A/S (source: Bloomberg). The trading value amounted to DKK 5,541 million (2014: DKK 4,759 million).
To ensure that the Royal Unibrew share is accessible to all types of investors and to align the price level per share with market practice, the AGM in April 2015 resolved to implement a 5:1 share split following which the share denomination was changed from DKK 10 to DKK 2 per share with effect as of 5 May 2015.
At the end of 2015, the price of the Royal Unibrew share was 280.1 compared to 217.4 per share of DKK 2 (correspond-ing to 1,087 per share of DKK 10 before the share split) at the end of 2014. Royal Unibrew’s market capitalisation amount-ed to DKK 15,543 million at the end of 2015 compared to DKK 12,064 million at the end of 2014. Each share carries one vote, and all shareholders registered in the Company’s register of shareholders is entitled to vote.
The Board of Directors has been author-ised to increase the Company’s share capital on one or several occasions by up to a total nominal amount of DKK 11,000,000 in the period to 30 April 2019.
Change of controlThe realisation of a takeover bid result-ing in change of control of the Company will entitle a few trading partners and lenders to terminate trading agreements made. For a description of agreements with Company Management, reference is made to the section Remuneration.
Treasury shares in 2015At the AGM on 29 April 2014, the Board of Directors was authorised to acquire treas-ury shares for up to 10% of the total share capital in the period up until the AGM on 29 April 2015, at which the authorisation was extended until the AGM in 2016.
On 11 March 2015, the Board of Directors initiated a share buy-back programme of a maximum market value of DKK 350 million for the period to 1 March 2016. At 31 December 2015, Royal Unibrew had bought back 1,192,118 shares represent-ing a market value of DKK 292 million, and in 2016 additionally 212,223 shares have been bought back representing a market value of DKK 58 million. Thus, the initi-
DEVELOPMENT IN ROYAL UNIBREW’S SHARE CAPITAL
DKK ‘000 2015 2014 2013 2012 2011
Share capital 1/1 110,985 110,985 105,700 111,865 111,865
Capital reduction -4,800 -6,165
Capital increase 10,085
Share capital 31/12 110,985 110,985 110,985 105,700 111,865
ROYAL UNIBREW ANNUAL REPORT 2015 31

47%
3% 1%
28%
15%
6%
ated share buy-back programme, which has been carried out in accordance with the “Safe Harbour” method, has been completed.
Royal Unibrew holds a total of 1,704,341 treasury shares of a nominal value of DKK 2 each, corresponding to 3.1% of the Company’s share capital, 300,000 of which are for the purpose of cover-ing the incentive programme offered to the Executive Board. The total number of shares of the Company is 55,492,500 including treasury shares.
OwnershipAt the end of 2015, Royal Unibrew had ap-prox 15,000 registered shareholders hold-ing together 94% of the total share capital.
Members of the Board of Directors and the Executive Board are governed by Royal Unibrew’s insider rules, and their share transactions are subject to a noti-fication requirement. Individuals with in-side information as well as their spous-es and children below the age of 18 may trade Royal Unibrew shares only when the Board of Directors has announced that the window for trading shares is open (and provided that they do not have inside information). This normally ap-plies for a period of four weeks following an announcement of financial results.
At 31 December 2015, directors held 18,605 shares of the Company, and members of the Executive Board held
Foreign Investors Royal Unibrew Foundations and Funds Danish Institutional Investors Individual Danish Investors Non-registrered Danish and
foreign investors
BREAK-DOWN OF SHAREHOLDERS AT THE END OF 2015
520,830 shares, corresponding to a total of 1% of the share capital.
AGMThe Company’s AGM will be held on 27 April 2016, at 5 pm at the Radisson Blu H. C. Andersen Hotel in Odense.
The AGM will be convened electronical-ly, and information on the registration for electronic communication is pro-vided at Royal Unibrew’s website www.royalunibrew.com under “Investor”.
Registration of shareholder’s name is effected by contacting the bank holding the shares in safe custody.
Board of Directors’ resolutions and proposed resolutions for the AGMThe Board of Directors will propose that the AGM authorise the Board of Di-rectors to acquire shares for treasury corresponding to up to 10% of the share capital, such authorisation being in force for the period up until the next AGM.
Moreover, the Board of Directors pro-poses the distribution of dividend of DKK 7.2 per share of DKK 2 for the 2015 financial year as well as the cancellation of 1,392,500 of the shares bought back under the share buy-back programme initiated in 2015.
SHARE RATIOS
Per share of DKK 2 – DKK 2015 2014 2013 2012 2011
Parent Company shareholders’ share of earnings per share 13.0 11.3 9.2 7,1 6,4
Parent Company shareholders’ diluted share of earnings per share 12.9 11.2 9.2 7,1 6,4
Cash flow per share 21.2 16.2 12.5 8.8 7.3
Diluted cash flow per share 21.1 16.1 12.4 8.8 7.3
Year-end price per share 280.1 217.4 147.2 98.4 64.3
Dividend per share 7.2 6.8 0.0 4.8 3.4
Number of shares 55,492,500 55,492,500 55,492,500 52,850,000 55,932,490
The share denomination was changed from DKK 10 to DKK 2 in 2015. Comparative figures for the period 2011-2014 are stated per share of DKK 2.
According to the latest Company Announcements or other public announcements, the following shareholders hold more than 5% of the share capital:
Shareholder End of February 2016
Chr. Augustinus Fabrikker A/S, Denmark 10.4% (reported on 11 December 2009)
HC Royal Holding OY Ab, Finland 7.1% (reported on 6 May 2015)
BlackRock Investment Management (UK) Limited 5.03% (reported on 10 July 2015)
32 ANNUAL REPORT 2015 ROYAL UNIBREW

80
100
120
140
160
jan feb mar apr maj jun jul aug sep okt nov dec
Investor relations activitiesRoyal Unibrew aims at ensuring open and timely information to its sharehold-ers and other stakeholders.
A number of activities are carried out continuously to ensure good contacts with the Company’s stakeholders. In 2015, among other things, Royal Unibrew held four audio casts in connection with the publication of the Annual Report 2014, the Q1 Report, H1 Report and Q3 Report 2015, respectively. Moreover, Royal Unibrew holds analyst and investor meetings in both Denmark and abroad in connection with the publication of In-terim and Annual Reports. In total about 200 individual meetings were held with investors and analysts in 2015.
Among other events in 2015, Royal Uni-brew participated in the SEB Nordic Seminar in Copenhagen, in the Capital Market Day in Finland, in the DAF Vests-jælland members’ meeting at the Faxe brewery, in the Jyske Bank’s Company Day, in the SEB Nordic Market Day in New York, in the Deutsche Bank Access Glob-al Consumer Conference in Paris, in the Nomuras West Coast Consumer Confer-ence in San Francisco and in the Danske Bank Copenhagen Winter Seminar.
Audio casts and presentations from au-dio casts and seminars are accessible at Royal Unibrew’s website, www.royaluni-brew.com under ”Investor”.
Royal Unibrew OMX Copenhagen 20 CAP Peer group
SHARE PERFORMANCE 2015 (index)
Note: The peer group consists of Carlsberg, Heineken, SABMiller and Anheuser-Busch InBev. (source: Bloomberg)
DIVIDEND DATES FOR 2016
27 April 2016 Resolution at AGM
27 April 2016 Last trading date with right to dividend for 2015
28 April 2016 First trading date without right to dividend for 2015
2 May 2016 Distribution of dividend
THE ROYAL UNIBREW SHARE IS FOLLOWED BY
Company Analyst
ABG Sundal Collier Michael Rasmussen
Bank of America Merrill Lynch Ian Wood
Carnegie Jonas Guldborg Hansen
Danske Bank Tobias C. Björklund
Deutsche Bank Tristan Van Strien
Handelsbanken Karri Rinta
Jyske Bank Frans Høyer
Nomura International plc Elsa Hannar
Nordea Bank Hans Gregersen
SEB Enskilda Søren Samsøe
FINANCIAL CALENDAR FOR 2016
27 April 2016 Interim Report for the period 1 January - 31 March 2016
27 April 2016 Annual General Meeting at the Radisson Blu H. C. Andersen Hotel in Odense
24 August 2016 Interim Report for the period 1 January - 30 June 2016
23 November 2016 Interim Report for the period 1 January - 30 September 2016
IR CONTACT
Shareholders, analysts, investors, stock-brokers and other stakeholders who have questions concerning Royal Unibrew may contact:
Royal Unibrew A/SFaxe Alle 1DK-4640 Faxe
ContactsLars Jensen, CFO (responsible for IR)[email protected]
Ginette Maasbøl (daily IR contact)[email protected] +45 56 77 15 12
ROYAL UNIBREW ANNUAL REPORT 2015 33


Corporate governance
The recommendations of the Committee on Corporate Governance, current leg-islation and regulation in the area, best practice and internal rules provide the framework for Royal Unibrew’s corpo-rate governance.
Royal Unibrew complies with the Corpo-rate Governance Recommendations with very few exceptions which are described below.
Royal Unibrew’s website http://investor.dk.royalunibrew.com/governance.cfm
provides a detailed description of the Board of Directors’ approach to the Cor-porate Governance Recommendations issued by the Committee on Corporate Governance.
DiversityA statement is made in accordance with section 99 b of the Danish Financial Statements Act.
Royal Unibrew aims at promoting diver-sity, which includes achieving a reasona-ble representation of both genders, both
on the Board of Directors and on the top management team. This is based on a wish to strengthen the versatility and total competences of the business and to improve decision-making processes.
The international management team of Royal Unibrew – comprising the Execu-tive Board and the executives just below – comprises 65% (2014: 63%) men and 35% (2014: 37%) women. The target is at least 40% representation of each gen-der. When new executives are recruited, emphasis is placed on identifying candi-
Royal Unibrew complies with the Corporate Governance Recommendations issued by the Committee on Corporate Governance with the following two exceptions:
Board committees (recommendation 3.4):The Committee recommends that the board of directors establish an actual audit committee composed so that the chairman of the board of directors is not the chairman of the audit committee.
• The Board of Directors of Royal Uni-brew has decided to take on the audit committee tasks jointly. As a result of this, the chairman of the Board of Di-rectors is as the law allows also the chairman of the audit committee. The Board’s decision to take on the audit committee tasks jointly should be viewed in light of the Company’s size,
transparency of reporting and clear procedures, due to which the Compa-ny’s Board of Directors finds no need for a separate audit committee.
Disclosure of the remuneration policy, (recommendation 4.2):The Committee recommends that the to-tal remuneration granted to each mem-ber of the board of directors and the ex-ecutive board by the company and other companies in the group, including infor-mation on the most important contents of retention and retirement/resignation schemes, be disclosed in the annual re-port and that the linkage with the remu-neration policy be explained.
• The remuneration of members of the Board of Directors is disclosed in the section ”Remuneration”. Disclosure of the remuneration of the individu-al members of the Executive Board is not at present considered materi-al to stakeholders’ assessment. The total remuneration of the Executive Board is disclosed in note 5. The re-muneration of the Executive Board is considered in line with that of peer companies. The remuneration of the Executive Board is in accordance with the remuneration policy.
Royal Unibrew has focus on running its business and de-signing its management systems in accordance with the corporate governance principles. The objective is to ensure that Royal Unibrew meets its obligations to shareholders, customers, employees, authorities and other stakeholders in the best possible way and that long-term value creation is supported.
ROYAL UNIBREW ANNUAL REPORT 2015 35
dates of both genders without discrimi-nation, and Royal Unibrew is seeking to encourage female candidates’ interest in taking on managerial tasks.
At present, six of the directors of Royal Unibrew elected by the general meeting are men and one is a woman, while the directors elected by the employees are three men and one woman. Since 2014 the Board of Directors has had two in-ternational members and five Danish members elected by the general meet-ing. The target is an approximate 20% share of female directors within four years. No directors elected by the gen-eral meeting have been replaced in 2015; therefore, the target of 20% has not yet been reached.
It is the Board of Directors’ objective that its members should, to the widest extent possible, complement each other in terms of age, background, nationali-ty, gender, etc with a view to ensuring a competent and versatile contribution to the board duties at Royal Unibrew. These matters are assessed when the nomina-tion committee identifies new candidates for the Board of Directors, and it is an objective of the committee to identify both male and female candidates. How-ever, recommendation of candidates will always be based on an assessment of the individual candidates’ competences and how they match Royal Unibrew’s needs and contribute to the overall efficiency of the Board.
Shareholder and stakeholder relationsRoyal Unibrew’s Management wants and works actively to maintain good and open communication and dialogue with its shareholders and other stakeholders. The Company believes that a high level of openness in the communication of infor-mation on the Company’s development supports the Company’s work and a fair valuation of the Company’s shares. The Group‘s openness is limited only by the duties of disclosure of Nasdaq Copen-hagen A/S and by competitive consider-ations.
The dialogue with and communication to shareholders and other stakeholders take place by the issuing of Interim Re-ports and other announcements by the Company, via audio casts, meetings with investors, analysts and the press. Inter-im Reports and other announcements are accessible at Royal Unibrew’s web-site immediately after being published. Our website also includes material used in connection with investor presenta-tions and audio casts.
According to the Articles of Association of the Company, general meetings shall be convened not more than five weeks and not less than three weeks prior to the general meeting. It is an objective to formulate the notice convening the meeting and the agenda so as to give shareholders an adequate presentation of the business to be transacted at the general meeting. Proxies are limited to a specific general meeting and are for-mulated in such a way as to allow absent shareholders to give specific proxies for individual items of the agenda – either to the Board of Directors or to a person attending the general meeting. All doc-uments relating to general meetings are published at Royal Unibrew’s website.
Each share of a nominal value of DKK 2 entitles the holder to one vote. Roy-al Unibrew’s shares are not subject to any restrictions of voting rights, and the Company has only one class of shares.
All shareholders may submit proposals for resolutions to the Board of Directors to be considered at the general meeting; such proposals for resolutions are to be received by the Board of Directors not later than six weeks prior to the date of the general meeting.
Work of the Board of DirectorsThe Board of Directors handles overall strategic management, financial and managerial supervision of the Company as well as continuous evaluation of the work performed by the Executive Board on behalf of the shareholders.
The Board of Directors performs its work in accordance with the Rules of
Procedure of the Company governing the Board of Directors and the Execu-tive Board. These Rules of Procedure are reviewed and updated regularly by the full Board of Directors.
The directors usually meet for five annu-al ordinary board meetings, one of which focuses on the Company’s strategic sit-uation and prospects. In addition, the directors meet when required. In 2015 six board meetings were held and three absentees were noted.
The Board of Directors has established the following committees: Nomination committeeThe nomination committee consists of the Chairman and Deputy Chairman of the Board of Directors. In 2015 the pri-mary activity of the nomination commit-tee was the preparation of the evaluation of the Board of Directors. The committee held one meeting in 2015.
Remuneration committeeThe remuneration committee consists of the Chairman and Deputy Chairman of the Board of Directors. In 2015 the primary activities of the remuneration committee were the assessment and recommendation of remuneration of the Board of Directors and the Executive Board. The committee held one meeting in 2015.
Audit committee The Board of Directors of Royal Unibrew has decided to take on the audit commit-tee tasks jointly. This should be viewed in light of the Company’s size, transpar-ency of reporting and clear procedures. Consequently, the Company’s Board of Directors finds no need for a separate audit committee. It is the Board of Direc-tors’ objective to secure quality and in-tegrity in the Company’s presentation of Financial Statements, audit and financial reporting. At the same time, the Board of Directors monitors accounting and re-porting processes, the audit of the Com-pany’s financial reporting, risk issues and the external auditors’ performance and independence. The external auditors have participated in two meetings of the
36 ANNUAL REPORT 2015 ROYAL UNIBREW

Board of Directors in connection with the Board of Directors’ performance of audit committee tasks.
Evaluation of the work of the Board of DirectorsAnnual evaluation of the work of the Board of Directors is performed. The evaluation is made by the Chairman of the Board of Directors. For this purpose the Chairman receives written replies to a questionnaire distributed to all mem-bers of the Board. The findings of the evaluation are presented and discussed at a meeting of the Board of Directors.
The evaluation in 2015 did not give rise to changing the composition of the Board of Directors as the necessary competences are considered to be in place. Moreover, the evaluation did not give rise to chang-ing the working method of the Board of Directors.
The Executive Board and the coopera-tion between the Board of Directors and the Executive Board are evaluated on an annual basis as a minimum.
Composition of the Board of DirectorsWhen composing the Board of Directors, we emphasise that the members have the competences required to solve the tasks. The Board of Directors assesses its composition annually, including en-suring that the combined competences and diversity of the members match the Group’s activities.
Candidates for the Board of Directors are recommended for election by the gen-eral meeting supported by motivation in writing by the Board of Directors as well as a description of the recruiting criteria. The individual members’ competences are described in the below section on
the Board of Directors and the Executive Board. When joining Royal Unibrew, new members of the Board of Directors are given an introduction to the Group and to the markets in which it operates.
At present, the Board of Directors consists of seven members elected by the gener-al meeting and four members elected by the employees. Election of members by the employees takes place in compliance with the company law rules described at the Company’s website. When joining the Board of Directors, the members elect-ed by the employees are offered relevant training in serving on a board.
All members of the Board of Directors elected by the general meeting are con-sidered independent in accordance with the Corporate Governance Recommen-dations issued by the Committee on Cor-porate Governance.
ROYAL UNIBREW ANNUAL REPORT 2015 37
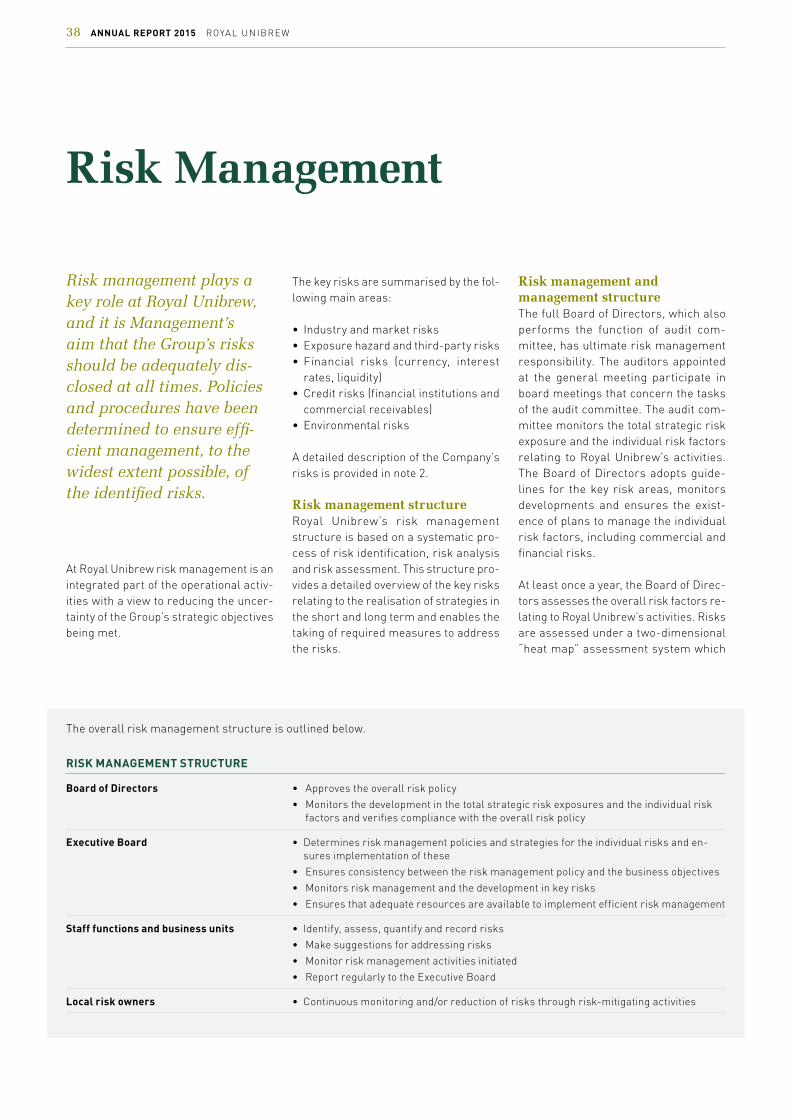
Risk Management
Risk management plays a key role at Royal Unibrew, and it is Management’s aim that the Group’s risks should be adequately dis-closed at all times. Policies and procedures have been determined to ensure effi-cient management, to the widest extent possible, of the identified risks.
At Royal Unibrew risk management is an integrated part of the operational activ-ities with a view to reducing the uncer-tainty of the Group’s strategic objectives being met.
The key risks are summarised by the fol-lowing main areas:
• Industry and market risks• Exposure hazard and third-party risks• Financial risks (currency, interest
rates, liquidity)• Credit risks (financial institutions and
commercial receivables)• Environmental risks
A detailed description of the Company’s risks is provided in note 2.
Risk management structureRoyal Unibrew’s risk management structure is based on a systematic pro-cess of risk identification, risk analysis and risk assessment. This structure pro-vides a detailed overview of the key risks relating to the realisation of strategies in the short and long term and enables the taking of required measures to address the risks.
Risk management and management structureThe full Board of Directors, which also performs the function of audit com-mittee, has ultimate risk management responsibility. The auditors appointed at the general meeting participate in board meetings that concern the tasks of the audit committee. The audit com-mittee monitors the total strategic risk exposure and the individual risk factors relating to Royal Unibrew’s activities. The Board of Directors adopts guide-lines for the key risk areas, monitors developments and ensures the exist-ence of plans to manage the individual risk factors, including commercial and financial risks.
At least once a year, the Board of Direc-tors assesses the overall risk factors re-lating to Royal Unibrew’s activities. Risks are assessed under a two-dimensional “heat map” assessment system which
The overall risk management structure is outlined below.
RISK MANAGEMENT STRUCTURE
Board of Directors • Approves the overall risk policy
• Monitors the development in the total strategic risk exposures and the individual risk factors and verifies compliance with the overall risk policy
Executive Board • Determines risk management policies and strategies for the individual risks and en-sures implementation of these
• Ensures consistency between the risk management policy and the business objectives
• Monitors risk management and the development in key risks
• Ensures that adequate resources are available to implement efficient risk management
Staff functions and business units • Identify, assess, quantify and record risks
• Make suggestions for addressing risks
• Monitor risk management activities initiated
• Report regularly to the Executive Board
Local risk owners • Continuous monitoring and/or reduction of risks through risk-mitigating activities
38 ANNUAL REPORT 2015 ROYAL UNIBREW
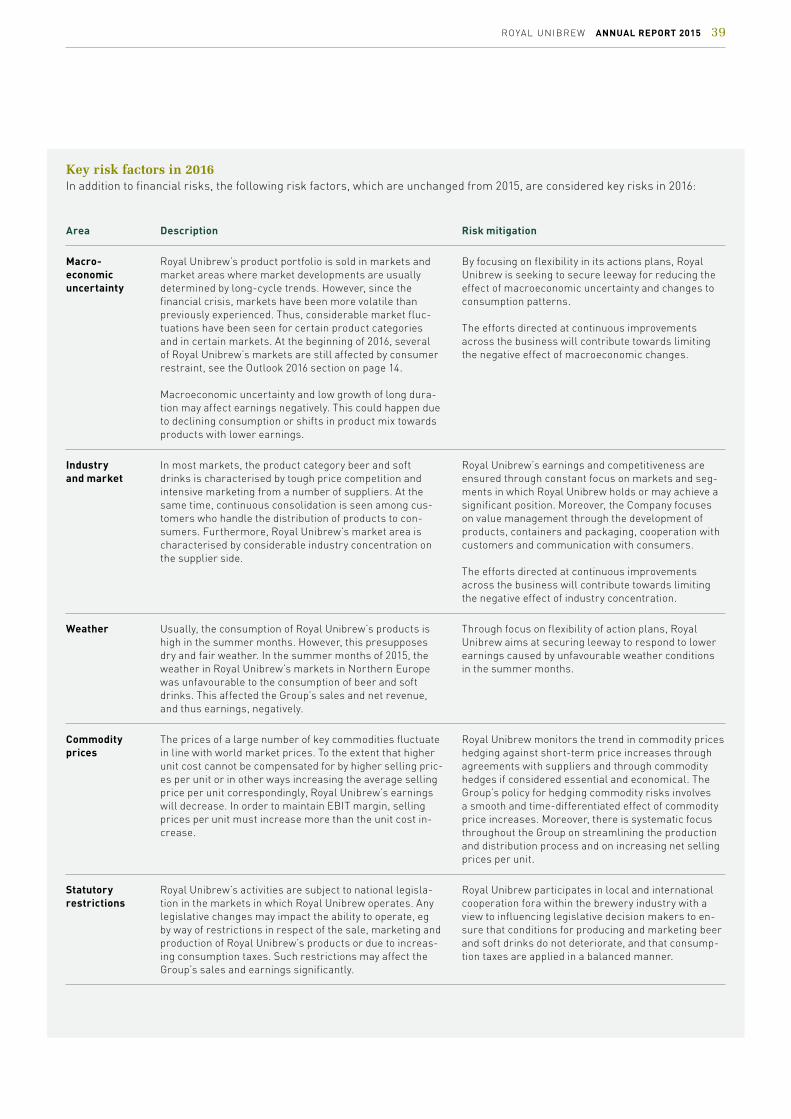
Key risk factors in 2016In addition to financial risks, the following risk factors, which are unchanged from 2015, are considered key risks in 2016:
Area Description Risk mitigation
Macro-economic uncertainty
Royal Unibrew’s product portfolio is sold in markets and market areas where market developments are usually determined by long-cycle trends. However, since the financial crisis, markets have been more volatile than previously experienced. Thus, considerable market fluc-tuations have been seen for certain product categories and in certain markets. At the beginning of 2016, several of Royal Unibrew’s markets are still affected by consumer restraint, see the Outlook 2016 section on page 14.
Macroeconomic uncertainty and low growth of long dura-tion may affect earnings negatively. This could happen due to declining consumption or shifts in product mix towards products with lower earnings.
By focusing on flexibility in its actions plans, Royal Unibrew is seeking to secure leeway for reducing the effect of macroeconomic uncertainty and changes to consumption patterns.
The efforts directed at continuous improvements across the business will contribute towards limiting the negative effect of macroeconomic changes.
Industry and market
In most markets, the product category beer and soft drinks is characterised by tough price competition and intensive marketing from a number of suppliers. At the same time, continuous consolidation is seen among cus-tomers who handle the distribution of products to con-sumers. Furthermore, Royal Unibrew’s market area is characterised by considerable industry concentration on the supplier side.
Royal Unibrew’s earnings and competitiveness are ensured through constant focus on markets and seg-ments in which Royal Unibrew holds or may achieve a significant position. Moreover, the Company focuses on value management through the development of products, containers and packaging, cooperation with customers and communication with consumers.
The efforts directed at continuous improvements across the business will contribute towards limiting the negative effect of industry concentration.
Weather Usually, the consumption of Royal Unibrew’s products is high in the summer months. However, this presupposes dry and fair weather. In the summer months of 2015, the weather in Royal Unibrew’s markets in Northern Europe was unfavourable to the consumption of beer and soft drinks. This affected the Group’s sales and net revenue, and thus earnings, negatively.
Through focus on flexibility of action plans, Royal Unibrew aims at securing leeway to respond to lower earnings caused by unfavourable weather conditions in the summer months.
Commodity prices
The prices of a large number of key commodities fluctuate in line with world market prices. To the extent that higher unit cost cannot be compensated for by higher selling pric-es per unit or in other ways increasing the average selling price per unit correspondingly, Royal Unibrew’s earnings will decrease. In order to maintain EBIT margin, selling prices per unit must increase more than the unit cost in-crease.
Royal Unibrew monitors the trend in commodity prices hedging against short-term price increases through agreements with suppliers and through commodity hedges if considered essential and economical. The Group’s policy for hedging commodity risks involves a smooth and time-differentiated effect of commodity price increases. Moreover, there is systematic focus throughout the Group on streamlining the production and distribution process and on increasing net selling prices per unit.
Statutory restrictions
Royal Unibrew’s activities are subject to national legisla-tion in the markets in which Royal Unibrew operates. Any legislative changes may impact the ability to operate, eg by way of restrictions in respect of the sale, marketing and production of Royal Unibrew’s products or due to increas-ing consumption taxes. Such restrictions may affect the Group’s sales and earnings significantly.
Royal Unibrew participates in local and international cooperation fora within the brewery industry with a view to influencing legislative decision makers to en-sure that conditions for producing and marketing beer and soft drinks do not deteriorate, and that consump-tion taxes are applied in a balanced manner.
ROYAL UNIBREW ANNUAL REPORT 2015 39

estimates the significance of the risk in relation to EBITDA, damage to Royal Uni-brew’s reputation, violation of legislation or environmental implications as well as the probability of the risk resulting in an incident. Based on this assessment, the existing ”heat map” is updated so as to reflect changes in the understanding of business risks. Following this registra-tion of risks relating to Royal Unibrew’s activities, the risks which may material-ly impact the strategic objectives in the short and long term are identified.
Local entities (staff functions and busi-ness units) are responsible for identify-ing, assessing, quantifying and recording risks as well as for reporting how risks are managed locally. The local-level risk assessment follows the same principles as the group-level assessment based on the ”heat map” assessment system. Lo-cal risk owners have been appointed with responsibility for currently monitoring and/or reducing risks through risk-mit-igating activities.
Royal Unibrew’s Group Accounting is re-sponsible for facilitating and following up on risk-mitigating activities/action plans for the key risks in accordance with the decisions made by the Board of Directors and the Executive Board.
Risk assessment in 2015In 2015 Royal Unibrew’s Executive Board closely monitored the development in market-related risks and made the nec-essary changes to risk-mitigating activi-ties to secure budgeted earnings. More-over, local risk management workshops were held with participation by risk owners and other executives. Centrally, the identified risks and proposed action plans were reviewed and assessed by the Company’s Executive Board. Based on this, the Executive Board present-ed the key risks to the Board of Direc-tors and recommended the necessary risk-mitigating activities/action plans for approval by the Board of Directors.
The Board of Directors then resolved to implement the necessary risk-mitigat-ing measures with a view to ensuring optimum realisation of Royal Unibrew’s strategic objectives.
Control and risk management activities relating to the financial reporting processRoyal Unibrew’s internal control and risk management systems relating to the fi-nancial reporting process are described below.
Control activitiesRoyal Unibrew has established a formal-ised group reporting process compris-ing monthly reporting, including budget follow-up, assessment of performance and achievement of established targets.
Moreover, a central corporate function is responsible for controlling the finan-cial reporting from the subsidiaries, which also includes a statement from each reporting group entity in relation to compliance with adopted group pol-icies and internal control measures. In 2015 controlling visits were paid to the key subsidiaries. The Board of Directors has assessed that establishment of an actual internal audit department is not required at this time considering the moderate complexity of the Group and the transparency of its reporting.
Information and communicationThe Board of Directors emphasises the importance of the Group communicating openly, with due regard to the confiden-tiality required for listed companies, and of the individual knowing his/her role with respect to internal control.
The individual business areas of the Group have been established as busi-ness units with responsibility for their own strategies, action plans and budg-ets. This division results in efficient fol-low-up and distribution of responsibili-ties in the Group.
Royal Unibrew’s accounting manual as well as other reporting instructions are continuously updated and are available at Royal Unibrew’s intranet, where they can be accessed by all relevant employ-ees. The instructions include account coding instructions and procedures for financial reconciliation and analyses, verifying the existence of assets as well as policy for credit granting and approval of fixed asset investments. In the event of major changes, all responsible finance officers of the group enterprises are in-formed in writing of the key changes. Moreover, internal update courses are organised for accounting staff.
Royal Unibrew’s information systems are designed with a view to continuous-ly, with due regard to the confidentiality required for listed companies, identi-fying, capturing and communicating at relevant levels relevant information, reports, etc which enable the individual to perform tasks and controls efficiently and reliably.
MonitoringMonitoring is effected by continuous assessments and controls at all group levels. The scope and frequency of the periodic assessments depend primarily on a risk assessment and the efficiency of the continuous controls.
The auditors appointed by the general meeting report in the Auditor’s Long-form Report to the Board of Directors material weaknesses in the Group’s internal control systems in connection with the financial reporting process. Less material issues are reported in management letters to the Executive Board, after which the Executive Board informs the Board of Directors of the is-sues reported.
The Board of Directors meets twice an-nually with the auditors without the Ex-ecutive Board attending.
40 ANNUAL REPORT 2015 ROYAL UNIBREW


Remuneration
The remuneration policy applying to Royal Unibrew’s Board of Directors and Executive Board has been formu-lated so as to reflect shareholder and company interests. Moreover, the remuneration policy is intended to support the realisation of the Company’s long-term objectives.
The following is a brief description of the elements of the remuneration, pen-sion plans and severance programmes as well as other benefits offered to the Board of Directors and the Executive Board.
The complete remuneration policy for the Board of Directors and the Execu-tive Board is disclosed at the Company’s website http://investor.royalunibrew.com/documentdisplay.cfm?Documen-tID=11831.
For a description of incentive pay, refer-ence is made to the Overall Guidelines for Incentive Pay adopted at the Com-pany’s general meeting, which may be downloaded from http://investor.royal-unibrew.com/payprogram.cfm.
Board of Directors remunerationEfforts are made to ensure that the Board of Directors remuneration match-es the level of peer companies and to ac-commodate the requirements relating to members’ competences, performance and scope of board work, including the number of meetings.
The annual remuneration paid to ordi-nary board members amounts to DKK 300,000. The Chairman and Deputy Chairman receive remuneration of 2.5 times (DKK 750,000) and 1.75 times (DKK 525,500) the remuneration paid to ordi-nary members. The total remuneration paid to the Board of Directors in 2015 amounted to DKK 4.0 million.
The Board of Directors remuneration is fixed and no remuneration is paid for participation in the committees set up by the Board of Directors.
The Board of Directors does not partici-pate in any incentive schemes.
The remuneration for the financial year in progress is submitted for approval at the AGM.
Executive Board remunerationThe Board of Directors believes that a combination of fixed and perfor-mance-driven remuneration to the Ex-ecutive Board contributes towards en-suring that Royal Unibrew can attract and retain the right employees. At the same time, the Executive Board is given an incentive to create shareholder value through partially incentive-based remu-neration.
The Executive Board members are em-ployed on individual service contracts, and the terms are fixed by the remuner-ation committee within the framework laid down in the contracts, see below.
The remuneration committee assesses the Executive Board remuneration an-nually to ensure that the remuneration matches the situation at peer companies.
The Executive Board is remunerated by a market-conforming and competitive remuneration package comprising four elements:
• Fixed salary based on market level;
• Ordinary bonus, see overall guide-lines for incentive pay;
• Long-term bonus, see overall guide-lines for incentive pay;
• Extraordinary bonus, see overall guidelines for incentive pay.
As part of Royal Unibrew’s continued efforts to focus on value creation for shareholders, the Executive Board was in 2013 offered restricted (conditional) shares for no consideration. The pro-gramme replaced the previous cash-based, long-term bonus scheme and entered into force on 1 September 2013. A restricted share entitles the holder to receive one Royal Unibrew share of a nominal value of DKK 2 for no considera-tion when the Company’s Annual Report for 2016 has been published in March 2017. The receipt of shares is conditional on continued employment in the period up to the Board of Directors’ adoption of the Annual Report for 2016 and on the employee not having handed in notice. The number of shares depends on the extent to which the EBIT and free cash flow targets for the financial years 2013-2016 defined by the Board of Directors are achieved in the vesting period. The maximum number of restricted shares is 300,000 shares, corresponding to a value of DKK 33 million at the time of granting, 28 August 2013.
42 ANNUAL REPORT 2015 ROYAL UNIBREW
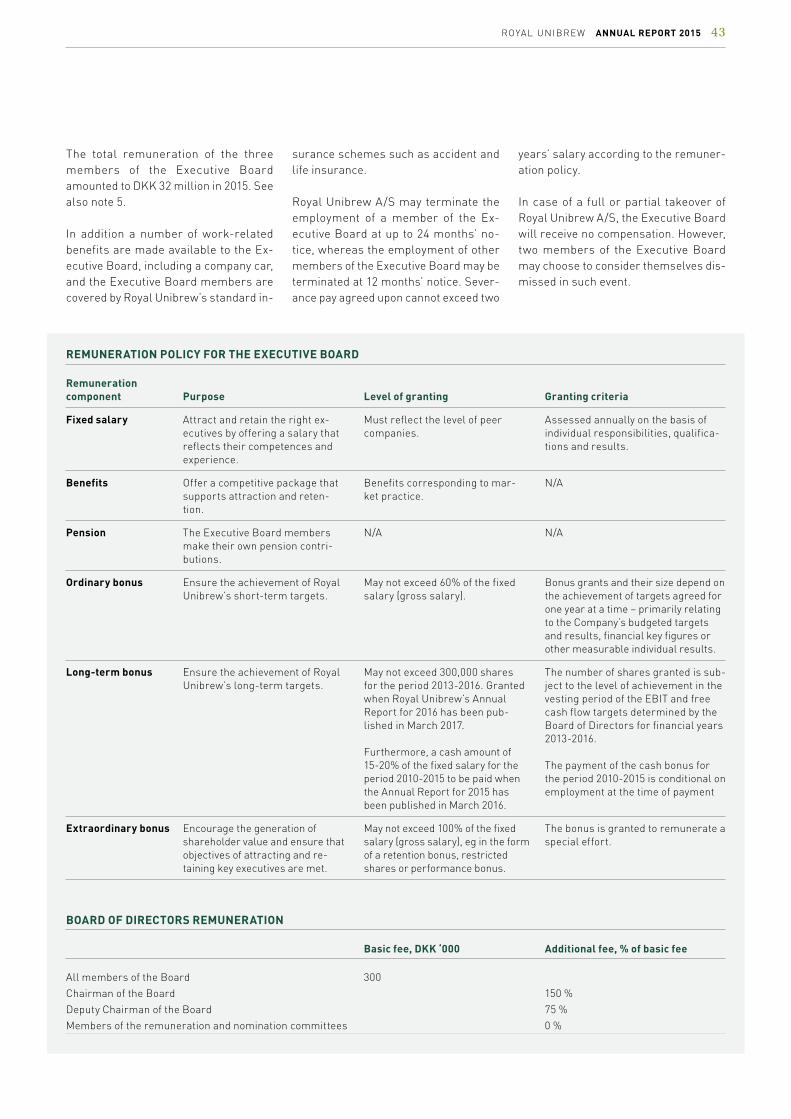
The total remuneration of the three members of the Executive Board amounted to DKK 32 million in 2015. See also note 5.
In addition a number of work-related benefits are made available to the Ex-ecutive Board, including a company car, and the Executive Board members are covered by Royal Unibrew’s standard in-
surance schemes such as accident and life insurance.
Royal Unibrew A/S may terminate the employment of a member of the Ex-ecutive Board at up to 24 months’ no-tice, whereas the employment of other members of the Executive Board may be terminated at 12 months’ notice. Sever-ance pay agreed upon cannot exceed two
years’ salary according to the remuner-ation policy.
In case of a full or partial takeover of Royal Unibrew A/S, the Executive Board will receive no compensation. However, two members of the Executive Board may choose to consider themselves dis-missed in such event.
REMUNERATION POLICY FOR THE EXECUTIVE BOARD
Remuneration component Purpose Level of granting Granting criteria
Fixed salary Attract and retain the right ex-ecutives by offering a salary that reflects their competences and experience.
Must reflect the level of peer companies.
Assessed annually on the basis of individual responsibilities, qualifica-tions and results.
Benefits Offer a competitive package that supports attraction and reten-tion.
Benefits corresponding to mar-ket practice.
N/A
Pension The Executive Board members make their own pension contri-butions.
N/A N/A
Ordinary bonus Ensure the achievement of Royal Unibrew’s short-term targets.
May not exceed 60% of the fixed salary (gross salary).
Bonus grants and their size depend on the achievement of targets agreed for one year at a time – primarily relating to the Company’s budgeted targets and results, financial key figures or other measurable individual results.
Long-term bonus Ensure the achievement of Royal Unibrew’s long-term targets.
May not exceed 300,000 shares for the period 2013-2016. Granted when Royal Unibrew’s Annual Report for 2016 has been pub-lished in March 2017.
Furthermore, a cash amount of 15-20% of the fixed salary for the period 2010-2015 to be paid when the Annual Report for 2015 has been published in March 2016.
The number of shares granted is sub-ject to the level of achievement in the vesting period of the EBIT and free cash flow targets determined by the Board of Directors for financial years 2013-2016.
The payment of the cash bonus for the period 2010-2015 is conditional on employment at the time of payment
Extraordinary bonus Encourage the generation of shareholder value and ensure that objectives of attracting and re-taining key executives are met.
May not exceed 100% of the fixed salary (gross salary), eg in the form of a retention bonus, restricted shares or performance bonus.
The bonus is granted to remunerate a special effort.
BOARD OF DIRECTORS REMUNERATION
Basic fee, DKK ‘000 Additional fee, % of basic fee
All members of the Board 300
Chairman of the Board 150 %
Deputy Chairman of the Board 75 %
Members of the remuneration and nomination committees 0 %
ROYAL UNIBREW ANNUAL REPORT 2015 43

Board of Directors and Executive Board
PositionCEO of H. Lundbeck A/S since May 2015
Special competencesSpecial expertise in strategic management as well as experience of production, sales and marketing of brands on a global scale
IndependenceConsidered independent
Member of the board of directorsLEGO A/S
PositionProfessional board member in a number of enterprises since 2014
Special competencesSpecial expertise in general management with experience from both Denmark and abroad as well as sales and marketing expertise, especially in the business to business market
IndependenceConsidered independent
Chairman of the board of directorsAlectia A/SXilco Holding AG, Switzerland
Member of the board of directorsGerman High Street Properties A/S (GERHSP)
PositionProfessional board member in a number of Nordic enterprises since 2010
Special competencesSpecial expertise in general management, including of international enterprises in the convenience goods and retail areas as well as FMCG (Fast Moving Consumer Goods)
IndependenceConsidered independent
Member of the board of directorsAmbea Sweden Group AB, Sweden Bilia AB, SwedenFiskars Ojy, FinlandMartin & Servera AB, SwedenMatas A/S, DenmarkMusti ja Mirri Grp Oy, FinlandOrkla ASA, NorwayZetaDisplay AB, Sweden
Kåre SchultzChairman of the Board Chairman of the nomination committee and the remuneration committee
Walther ThygesenDeputy Chairman of the BoardDeputy Chairman of the nomination com-mittee and the remuneration committee
Ingrid Jonasson BlankBoard member
Board of Directors
44 ANNUAL REPORT 2015 ROYAL UNIBREW

PositionProfessional board member in a number of Danish enterprises since 2008Temporary CFO of Auris III Luxembourg S.A. since January 2016
Special competencesSpecial expertise in economic, financial and capital market aspects as well as gen-eral management with experience from a variety of industries IndependenceConsidered independent Chairman of the board of directorsAuris III Luxembourg S.A., LuxemburgBladt Industries A/SThe foundation BørneBasketFonden (non-profit organisation)
NKT Holding A/S
Deputy chairman of the board of directorsPFA Pension A/S Member of the board of directorsCryptomathic A/SGyldendal A/SHeptagon Advanced Micro Optics Inc.Pierre.dk A/S Other offices heldMember of investment committee of LD Equity 2 K/SMember of the Committee on Corporate Governance
PositionProfessional board member in a number of enterprises, primarily in Finland, since 2013
Special competencesSpecial expertise in general management, including of international enterprises with-in FMCG (Fast Moving Consumer Goods)
IndependenceConsidered independent
Member of the board of directorsFiskars Oyj, FinlandOnninen Oy, FinlandOnvest Oy, FinlandRATOS AB, SwedenScandi Standard Ab (publ), Sweden
PositionGroup CEO of Danish Crown since Novem-ber 2015
Special competencesSpecial expertise in general management of international enterprises within FMCG (Fast Moving Consumer Goods)
IndependenceConsidered independent
Member of the board of directorsFoss A/S
Jens Due OlsenBoard member
Karsten Mattias SlotteBoard member
Jais ValeurBoard member
PositionExecutive officer of HV Invest A/S
Special competencesSpecial expertise in retailing and mar-keting as well as production and general management IndependenceConsidered independent
Executive board serviceCEO of Easy Holding A/SExecutive officer of HV Holding ApS, Chri Van ApS, Ka Van ApS, Se Van ApS, The Van ApS
Chairman of the board of directorsEasyfood A/SFHØ af 27.05.2011 A/SGOG Holding A/SHalberg A/SMac Baren Tobacco Co. A/S
Member of the board of directorsEasy Holding A/SGreat Dane A/SHV Invest ApS
Hemming VanBoard member
Board of Directors, continued
ROYAL UNIBREW ANNUAL REPORT 2015 45

Martin AlsøElected by the employees
PositionBusiness Unit Manager
Jørgen-Anker IpsenElected by the employees
PositionExport Area Manager
Kirsten Wendelboe LiisbergElected by the employees
PositionBrewery Hand
Søren LorentzenElected by the employees
PositionBrewery Hand
BOARD OF DIRECTORS IN ROYAL UNIBREW
Number of Initially Royal Unibrew shares held Change from Name Year of birth elected Term of office Position at 1 January 2016 1 January 2015
Kåre Schultz 1961 2010 2015 Chairman - -
Walther Thygesen 1950 2010 2015 Deputy Chairman 5,500 -
Martin Alsø 1974 2014 2014-2018 Board member elected by the employees 4,600 +200
Ingrid Jonasson Blank 1962 2013 2015 Board member - -
Jørgen-Anker Ipsen 1958 2014 2014-2018 Board member elected by the employees 230 -
Kirsten Wendelboe Liisberg 1956 2006 2014-2018 Board member elected by the employees 810 -
Søren Lorentzen 1964 2010 2014-2018 Board member elected by the employees 860 -
Jens Due Olsen 1963 2010 2015 Board member - -
Karsten Mattias Slotte 1953 2013 2015 Board member -
Jais Valeur 1962 2013 2015 Board member - -
Hemming Van 1956 2004 2015 Board member 6,605 -
Board of Directors, continued
46 ANNUAL REPORT 2015 ROYAL UNIBREW
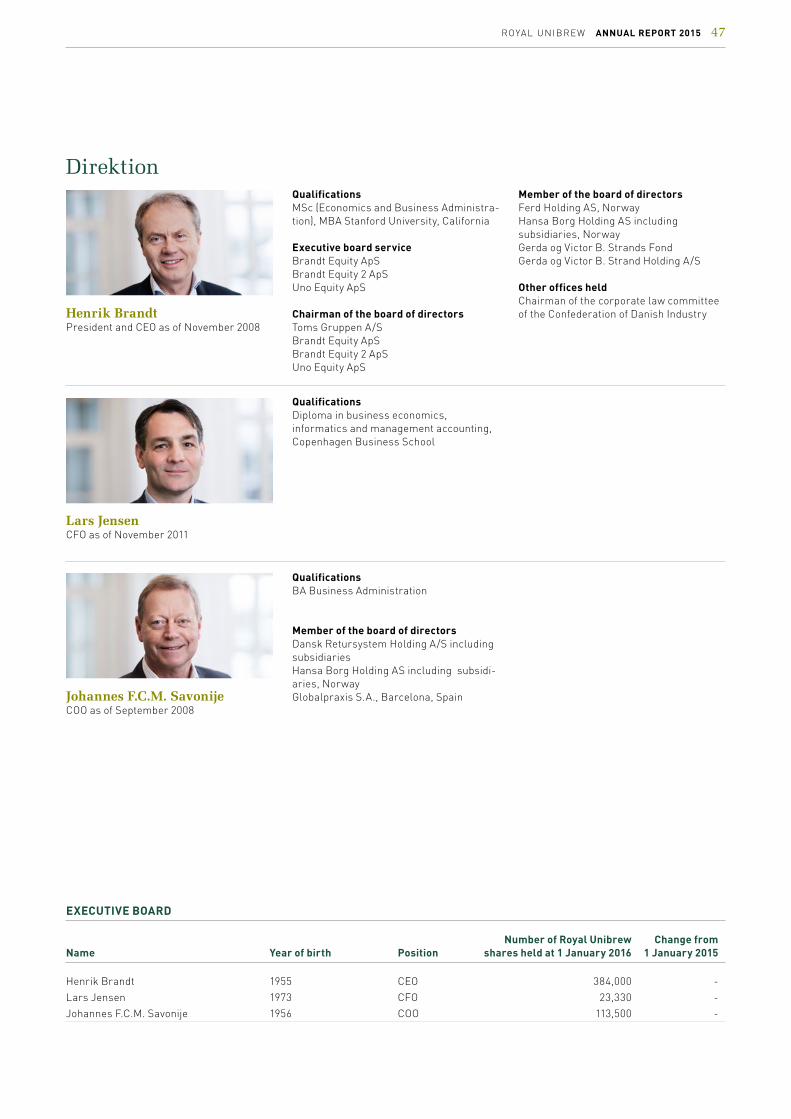
EXECUTIVE BOARD
Number of Royal Unibrew Change from Name Year of birth Position shares held at 1 January 2016 1 January 2015
Henrik Brandt 1955 CEO 384,000 -
Lars Jensen 1973 CFO 23,330 -
Johannes F.C.M. Savonije 1956 COO 113,500 -
QualificationsMSc (Economics and Business Administra-tion), MBA Stanford University, California
Executive board serviceBrandt Equity ApSBrandt Equity 2 ApSUno Equity ApS
Chairman of the board of directorsToms Gruppen A/SBrandt Equity ApSBrandt Equity 2 ApSUno Equity ApS
Member of the board of directorsFerd Holding AS, NorwayHansa Borg Holding AS including subsidiaries, NorwayGerda og Victor B. Strands FondGerda og Victor B. Strand Holding A/S
Other offices heldChairman of the corporate law committee of the Confederation of Danish Industry
QualificationsBA Business Administration
Member of the board of directorsDansk Retursystem Holding A/S including subsidiariesHansa Borg Holding AS including subsidi-aries, NorwayGlobalpraxis S.A., Barcelona, Spain
QualificationsDiploma in business economics, informatics and management accounting, Copenhagen Business School
Henrik BrandtPresident and CEO as of November 2008
Johannes F.C.M. SavonijeCOO as of September 2008
Lars JensenCFO as of November 2011
Direktion
ROYAL UNIBREW ANNUAL REPORT 2015 47

Organisation and Employees
Royal Unibrew works strategically at de-veloping our employees’ competences to ensure that the overall organisation re-mains competitive and is capable of ex-ploiting development opportunities and reading market trends. It is therefore important that our employees have job satisfaction and are proud ambassadors of Royal Unibrew.
Targeted competence development of managers and employeesOptimisation and integration of the total organisation are high on Royal Unibrew’s agenda. This requires managers who are able to manage and implement strate-gies across countries and cultures. Roy-al Unibrew managers receive continuous management training, and the funda-mental management principles of the business are adjusted currently to match business developments and changes in external demands. This ensures that the management culture is always based on the principles that can take the business further.
In 2015 manager development initiatives focused on the management and value DNA of Royal Unibrew – the platform ensuring that managers have a shared language and a common understanding of what it takes to practise good man-agement.
Moreover, efforts were directed at strengthening organisational execution capabilities and willingness to change. The ever increasing pace of market changes requires that both the individ-ual employee and the organisation as a whole are capable of adapting. It is crucial to ensure that our managers are prepared to take the lead and address changes in the best possible way. There-fore, continuous efforts are made to strengthen our managers’ competenc-es in these areas. One of the important things is that our managers have a clear understanding of the positive correlation between productivity and job satisfaction among our employees and the pivotal role the manager plays in this.
In Denmark efforts were directed in 2015 at developing broader competenc-es among hourly-paid employees with a view to creating increased flexibility in the day-to-day work to enable em-ployees to handle several functions and more readily replace each other. This is ensured through structured mapping of the individual employee’s competenc-es during appraisal interviews. In that connection, a pilot project with autono-mous teams was furthermore initiated. Moreover, a number of industry instruc-tors were trained with responsibility for, among other things, standardisation of the introductory process for new em-
ployees to ensure even better integration and training of these.
In 2015 the sales competences of the sales organisation within both on-trade and off-trade were strengthened through structured development programmes. Within on-trade, training focused on the psychology of sales with a view to ensuring efficient sales processes in markets characterised by tough com-petition and significant consolidation. The efforts within off-trade included individual coaching of managers with focus on sales management as well as sales training for the individual sales employee.
In Finland the organisation also directed efforts at creating broader competences. The work of implementing the Group’s shared ERP-system, which is integrat-ed across functions and processes to a much larger extent than Hartwall’s previous system, contributed towards enhancing employees’ knowledge of links between processes and their un-derstanding of tasks throughout the organisation. In production, the compe-tences of hourly-paid employees were developed enabling them to perform more functions.
In the Baltic countries efforts were di-rected at, among other things, Lean and
Royal Unibrew directs targeted efforts at developing managers and employees to create the best possible basis for realising the strategy laid down and achieving our business objectives. Focus in 2015 has been on strengthening execution capabilities and willingness to change to enable the business as a whole to meet future challenges in the best possible way, including the ever intensifying competi-tion in the individual markets and the need for innovation.
ROYAL UNIBREW ANNUAL REPORT 2015 49

6sigma principles to ensure uniform and more productive work processes in the logistics area.
In Italy Royal Unibrew continued working with ”Ceres Academy” in 2015, which is a platform for corporate culture training. Employees from all parts of the Italian organisation participated in the training, and subjects included marketing, cost accounting, IT as well as beer knowledge
Malt Beverages and Exports, which besides the general management team situated in Denmark comprises sales offices situated close to the local mar-kets in the Americas, Africa, the UK and France, worked with understanding of local cultures and training in negotiating skills adapted to local conditions in 2015.
Performance managementAs part of the overall competence de-velopment work, Royal Unibrew carries out a systematic performance manage-ment process every year with focus on identifying and developing employee and manager potential. The primary purpose is to identify high performers in all parts of the organisation and to consider the potential among these employees in re-lation to both specialist roles and man-agement positions. At the same time, the efforts in this area contribute towards retaining talents and key employees and ensuring that they are offered the right challenges and competence devel-opment.
As an element of the efforts to retain and develop employees, Royal Unibrew focuses on creating career development and career paths for the individual em-ployees. Emphasis is on, among other things, job rotation and internal recruit-ing for key positions. This ensures root-ing of knowledge of activities as well as optimisation of cooperation across the business.
Moreover, efforts are directed through-out the Group at ensuring that the incen-
tive structure supports Royal Unibrew’s strategy and business objectives.
Sourcing and onboardingIn a market with increasing demand for the best talent, it is important for Royal Unibrew to onboard new employees in the best possible way. Therefore, Royal Unibrew directed efforts at improving the introduction of new employees to the organisation in 2015. In Italy efforts were directed at, among other things, im-proved introduction and training of new employees within sales and marketing; in the Baltic countries a new structured introductory programme was developed for new employees. In Denmark efforts are directed at, among other things, standardising the introduction of new hourly-paid employees.
Employee survey To ensure great commitment among Royal Unibrew’s employees, employee surveys are conducted throughout the Group every two years. The purpose of the survey is to create a forum for dia-logue between managers and employ-ees and to highlight the areas that leave room for improvement in order for Royal Unibrew to become an even better work-place. The follow-up work is performed locally with focus on local job satisfac-tion and health & safety at work, and in-itiatives and targets are also determined and initiated locally.
The 2015 survey was generally highly supported. The results of the survey are very positive as the scores for all coun-tries and regions, except for Finland, are above benchmark, whereas Finland is at benchmark level. Moreover, the sur-vey indicates that, as in the survey two years ago, Royal Unibrew employees exceed the employees of peer compa-nies when it comes to loyalty, pride in being an employee of the company and the inclination to recommend the com-pany as a workplace to others. Moreover, good customer service, diversified tasks and departmental cooperation are areas emphasised by employees in the survey.
The focus areas identified by the survey vary from area to area. Therefore, the follow-up work based on the results of the survey was performed locally in 2015 with a number of initiatives being carried out in the individual subsidiaries and de-partments.
UniWorldThe autumn of 2014 saw the launch of a new intranet, UniWorld, which is a gen-eral platform for communication, knowl-edge sharing and document manage-ment across the entire Royal Unibrew organisation. The intranet is an impor-tant tool to strengthen the integration between the various entities, including to support a shared culture to form the basis of continued strengthening of Roy-al Unibrew. UniWorld has become an im-portant part of the business and commu-nication across Royal Unibrew through which Management communicates on new initiatives and results within the Group and employees share knowledge daily and communicate on local activities and success stories.
IT initiatives and systemsRoyal Unibrew has continuous focus on implementing new and improving exist-ing IT systems to increase the efficiency and to align business processes across the Group.
I 2015 the main priority was project One-SAP, which comprises development of a common SAP platform for the entire Royal Unibrew Group and the prepara-tion for implementation of the platform in Hartwall.
As planned, the Group’s common SAP platform was implemented in Hartwall in first quarter of 2016, after which all group entities use the same SAP plat-form. The common platform will create synergies through process standardi-sation as well as consolidation and op-timisation of the Group’s overall IT op-erations.
50 ANNUAL REPORT 2015 ROYAL UNIBREW

Corporate Social Responsibility
A statement is made in accordance with section 99A of the Danish Financial Statements Act.
Our corporate social responsibility (CSR) work is an integrated part of Royal Uni-brew’s business approach, and our ef-forts in this area are based on our val-ues and the ten principles of the United Nations Global Compact in respect of human rights, labour standards, envi-ronment and anti-corruption as well as other relevant internationally recognised principles.
“Royal Unibrew’s Code of Ethics” is Man-agement’s guidance to employees on ethical issues, including issues relating to corruption, human rights and environ-mental accountability.
Royal Unibrew has chosen to focus on continuous improvements rather than long-term objectives in relation to which focus and compliance by the individual employee in the day-to-day work may be difficult. It is the objective to be able at all times to deliver strong quality products with due consideration of our employees and Royal Unibrew’s surroundings. This approach has resulted in satisfactory improvements in a number of areas for several years and will also form the ba-sis of our future corporate social respon-sibility work.
At Royal Unibrew, we want to make a positive difference for our consum-ers and to create value for our stakeholders. In order to do that, we must apply clear principles and strategies to the management of our business. Consumers in all our markets must be able to rely on our products being of a very high quality and produced under safe conditions. At the same time, we must continuously seek to reduce our environmental impact and contribute positively to the overall development of society.
FOCUS AREAS OF OUR CORPORATE SOCIAL RESPONSIBILITY WORK
Environment
Responsible consumption
Royal Unibrew’s
ethical guide-lines
Competence development
Occupational health & safety
Food safety & quality
Anti-corruption & competition
CORPORATE SOCIAL
RESPONSIBILITY
The areas which we have selected as the focus areas of our social responsibility work are shown in the figure below.
Our CSR work supports a good dia-logue with consumers, customers and suppliers, which contributes towards increasing production efficiency and decreasing wastage and towards re-ducing non- financial risks and creating and sustaining a strong corporate iden-tity and culture. At the same time, these
efforts contribute towards creating new business opportunities.
Ethical values and guidelinesRoyal Unibrew’s values and ethical guidelines are included as an integrat-ed part of the employment relationship agreed with the individual employee. Our ethical guidelines imply, among oth-er things, that Royal Unibrew does not tolerate discrimination of its employees
ROYAL UNIBREW ANNUAL REPORT 2015 51
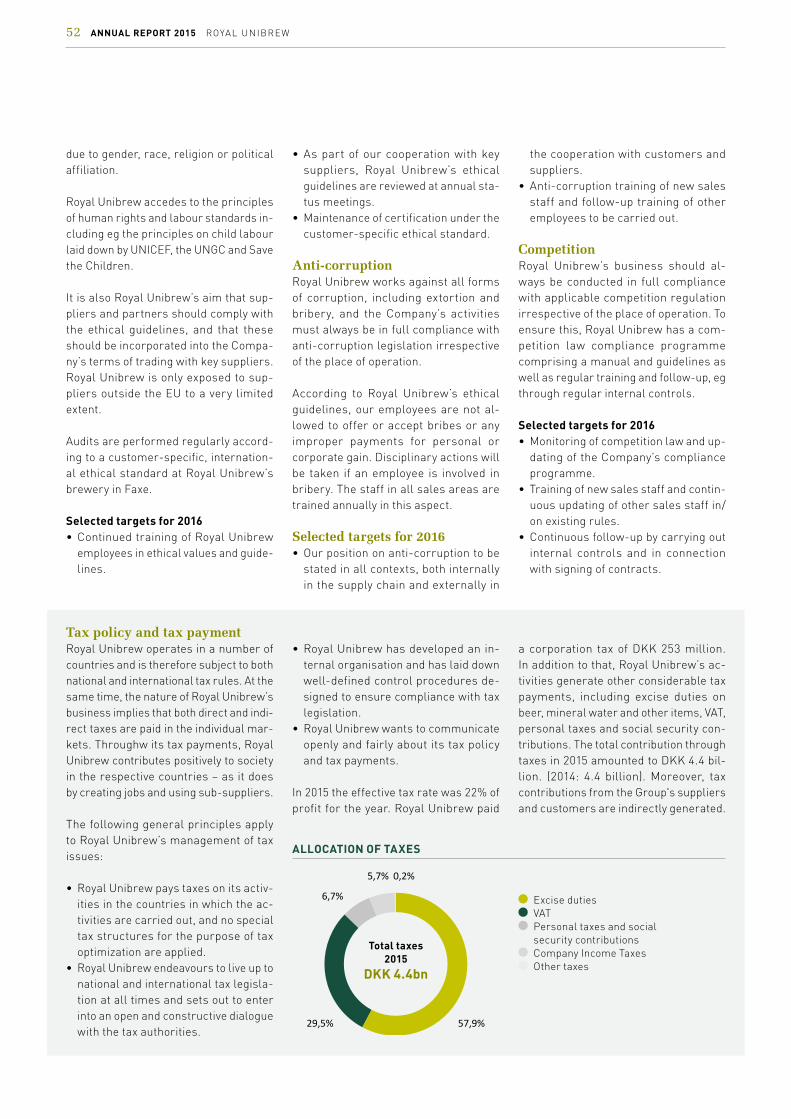
57,9%29,5%
6,7%
5,7% 0,2%
due to gender, race, religion or political affiliation.
Royal Unibrew accedes to the principles of human rights and labour standards in-cluding eg the principles on child labour laid down by UNICEF, the UNGC and Save the Children.
It is also Royal Unibrew’s aim that sup-pliers and partners should comply with the ethical guidelines, and that these should be incorporated into the Compa-ny’s terms of trading with key suppliers. Royal Unibrew is only exposed to sup-pliers outside the EU to a very limited extent.
Audits are performed regularly accord-ing to a customer-specific, internation-al ethical standard at Royal Unibrew’s brewery in Faxe.
Selected targets for 2016• Continued training of Royal Unibrew
employees in ethical values and guide-lines.
• As part of our cooperation with key suppliers, Royal Unibrew’s ethical guidelines are reviewed at annual sta-tus meetings.
• Maintenance of certification under the customer-specific ethical standard.
Anti-corruptionRoyal Unibrew works against all forms of corruption, including extortion and bribery, and the Company’s activities must always be in full compliance with anti-corruption legislation irrespective of the place of operation.
According to Royal Unibrew’s ethical guidelines, our employees are not al-lowed to offer or accept bribes or any improper payments for personal or corporate gain. Disciplinary actions will be taken if an employee is involved in bribery. The staff in all sales areas are trained annually in this aspect.
Selected targets for 2016• Our position on anti-corruption to be
stated in all contexts, both internally in the supply chain and externally in
the cooperation with customers and suppliers.
• Anti-corruption training of new sales staff and follow-up training of other employees to be carried out.
Competition Royal Unibrew’s business should al-ways be conducted in full compliance with applicable competition regulation irrespective of the place of operation. To ensure this, Royal Unibrew has a com-petition law compliance programme comprising a manual and guidelines as well as regular training and follow-up, eg through regular internal controls.
Selected targets for 2016• Monitoring of competition law and up-
dating of the Company’s compliance programme.
• Training of new sales staff and contin-uous updating of other sales staff in/on existing rules.
• Continuous follow-up by carrying out internal controls and in connection with signing of contracts.
Excise duties VAT Personal taxes and social
security contributions Company Income Taxes Other taxes
ALLOCATION OF TAXES
Total taxes 2015
DKK 4.4bn
Tax policy and tax paymentRoyal Unibrew operates in a number of countries and is therefore subject to both national and international tax rules. At the same time, the nature of Royal Unibrew’s business implies that both direct and indi-rect taxes are paid in the individual mar-kets. Throughw its tax payments, Royal Unibrew contributes positively to society in the respective countries – as it does by creating jobs and using sub-suppliers.
The following general principles apply to Royal Unibrew’s management of tax issues:
• Royal Unibrew pays taxes on its activ-ities in the countries in which the ac-tivities are carried out, and no special tax structures for the purpose of tax optimization are applied.
• Royal Unibrew endeavours to live up to national and international tax legisla-tion at all times and sets out to enter into an open and constructive dialogue with the tax authorities.
• Royal Unibrew has developed an in-ternal organisation and has laid down well-defined control procedures de-signed to ensure compliance with tax legislation.
• Royal Unibrew wants to communicate openly and fairly about its tax policy and tax payments.
In 2015 the effective tax rate was 22% of profit for the year. Royal Unibrew paid
a corporation tax of DKK 253 million. In addition to that, Royal Unibrew’s ac-tivities generate other considerable tax payments, including excise duties on beer, mineral water and other items, VAT, personal taxes and social security con-tributions. The total contribution through taxes in 2015 amounted to DKK 4.4 bil-lion. (2014: 4.4 billion). Moreover, tax contributions from the Group's suppliers and customers are indirectly generated.
52 ANNUAL REPORT 2015 ROYAL UNIBREW
Responsible alcoholic beverage and soft drinks consumptionRoyal Unibrew’s commitment to re-sponsible marketing and consumption of beverages is rooted in the following core principles:
• We engage consumers and stakehold-ers and work collectively with them to promote responsible enjoyment of our products.
• We respect that beer consumption is for adults only and is a matter of indi-vidual choice and accountability.
• We ensure that our marketing practic-es are in compliance, at all times, with the marketing legislation in the areas in which our products are sold.
• We value responsibility in our corporate culture and expect our employees to demonstrate such responsibility in the day-to-day handling of our products.
Royal Unibrew supports The Brewers of Europe campaigns on responsible alco-hol consumption and attaches great im-portance to responsible drinking.
Royal Unibrew employees engaged in product marketing are currently trained and instructed in compliance with exist-ing marketing legislation. Compliance with existing marketing legislation is part of Royal Unibrew’s agreements with customers and partners, eg in the on-trade segment.
In addition to complying with marketing legislation and the above-mentioned guidelines, Royal Unibrew gets involved in customers’ communication on con-sumption of the Company’s products in relation to advertising, sponsorships and campaigns.
Royal Unibrew also has a responsibil-ity for preventing any abuse problems among its employees. In Denmark and Finland, a number of key individu-als across the organisation have been trained in supporting colleagues with a potential over-consumption of alcohol/intoxicants, including encouraging treat-ment, and in helping their colleagues get back to work again as easily as possible following treatment.
In Latvia Royal Unibrew along with oth-er soft drinks producers supported the preparation of a joint code for responsi-ble marketing of soft drinks, and in 2015 campaigns on balanced consumption of beverages were conducted.
Moreover, the Baltic countries have fo-cus on promoting beer with a lower al-cohol content, and non-alcoholic beer sales have gone up.
As an element in Royal Unibrew’s re-sponsibility with respect to reducing the consumption of soft drinks containing sugar, efforts are continuously directed at promoting calorie-reduced products such as Nikoline with 30% less sugar or sugar-free alternatives such as Jaffa Light, Faxe Kondi Free, Pepsi Next and Pepsi Max and a generally increasing range of water products.
Through a variety of sponsorships, Roy-al Unibrew supports sports and health initiatives at both national, regional and local level.
Selected targets for 2016• Participation in and development of
”Responsible beer and soft drinks consumption” in cooperation with local industry organisations and The Brew-ers of Europe.
• Annual training of all relevant employ-ees in responsible marketing of bev-erages and continuous monitoring of compliance with existing rules as well as activities in new marketing media.
• Workshop for in-house ”alcohol and drug consultants”.
• Continuation of sponsorship efforts.
Competence developmentRoyal Unibrew works in a targeted and structured manner to develop employee competences. These efforts are further described in the section ”Organisation and Employees”.
Occupational health & safetyRoyal Unibrew must be a safe and healthy place to work for its employees, and Royal Unibrew’s health policy there-fore focuses on preventive measures to avoid employees being worn out and in-
curring work-related injuries and on ac-tively promoting safety, job satisfaction and efficiency.
The preventive measures at the brewer-ies in 2015 included the following:
Denmark• In 2014 a comprehensive training pro-
gramme on behavioural safety for all operators and salaried employees at Faxe was initiated. Moreover, a group of employees have been trained as ”ambassadors” with responsibility for unfolding the health & safety dialogue in the organisation. Efforts in this area continued in 2015.
• All safety groups participated in a joint health & safety day.
• A workplace assessment was carried out among all employees in Denmark, and based on this action plans are be-ing prepared.
• All employees who work night shifts have been offered a health check.
• Continuous focus is directed at near-accidents, and all employees are encouraged to report near-accidents with a view to addressing and reducing the number of such incidents.
Baltic countries• In the Baltic countries working condi-
tions at the distribution warehouses were considerably improved. Palleti-sation and order picking are now car-ried out far more efficiently and safely than previously by means of safe and ergonomic lifting equipment.
Finland• Hartwall’s alcohol awareness policy
as well as equal opportunity guidelines were updated and implemented.
• Hartwall implemented a no-smoking policy in order to further improve and support its employees’ well-being and working capacity.
• Hartwall registers near-accidents cur-rently with a view to observing, discuss-ing and supporting safe behaviour.
Royal Unibrew’s increased focus on oc-cupational accidents has also resulted in greater openness when it comes to reporting injuries. Consequently, the
ROYAL UNIBREW ANNUAL REPORT 2015 53

0
1
2
3
4
5
2010 2011 2012 2013 2014
0
25
50
75
100
125
2011 2012 2013 2014 2015
total number of registered accidents in-creased to a higher level in 2015 than in 2014; however, the number is still lower than in the years before 2014. Obviously, this is not an acceptable development, but it does, however, probably to some extent reflect the great focus on the area. Significant efforts will be direct-ed at preventing occupational accidents also going forward.
Selected targets for 2016• It remains our vision to reduce the
number of occupational accidents to zero and to continue the focused safety efforts in all parts of our business.
• In Denmark all employees at the Al-bani brewery must participate in a course on behavioural safety, report-ing of near-accidents will continue and the ambassador role must be profiled at all locations.
• The Danish safety groups will also in 2016 organise a joint health & safety discussion as well as a joint health & safety day.
• Action plans relating to workplace assessment will be completed and implemented.
• In Finland there is a target of reducing the number of occupational accidents by 10% in 2016, eg through monthly safety checks in production areas and by continuously following up on the agreed measures.
Food safety and qualityRoyal Unibrew’s breweries have certifi-cation under the international standards. The efforts within quality and food safety also comprise requirements from cus-tomers and licensors, including Heinek-
ENERGY CONSUMPTION (Mega Joules per produced hectoliter)
en and PepsiCo. Moreover, applicable HACCP (Hazard Analysis and Critical Control Points) rules have been imple-mented.
BREWERY CERTIFICATION
Cido, ISO22000 Latvia
Lacplesis, ISO22000 Latvia
Kalnapilis, ISO22000 Lithuania
Faxe, FSSC22000, ISO9001, Denmark ISO14001
Albani, FSSC22000, ISO9001, Denmark ISO14001
Lahti, FSSC22000, ISO9001, Finland ISO14001, OHSAS 18001
Karijoki, FSSC22000, ISO9001, Finland ISO14001, OHSAS 18001
The focus on and interest in food safety and quality among consumers, custom-ers and the media are on the increase, which is also reflected in Royal Unibrew’s efforts in the area. Among other things, a customer-specific quality standard for analysis work at the laboratories in Faxe was introduced in 2015.
Royal Unibrew assesses on a current basis how most appropriately to take responsibility for identifying and pre-venting risks relating to food safety and quality and how to communicate this. The priorities set are aligned with those of industry associations and Royal Uni-brew’s licensors.
Selected targets for 2016• FSSC22000 certification of the Cido
brewery is expected during 2016.
• Continuation of the efforts relating to quality assurance of the Company’s quality analyses according to Heinek-en standards, including implementa-tion of the laboratory standard at the Albani brewery.
EnvironmentRoyal Unibrew has always worked deter-minedly to limit the environmental im-pacts of the Company’s production. As a result, Royal Unibrew is today among the industry’s front-runners, when it comes to resource-efficient beverage production.
Our efforts to reduce the environmental footprint of our production will continue, primarily targeted at:
• Reduction of energy consumption.• Reduction of water consumption and
of waste water discharge.• Reduction of wastage of raw materials
and semi-manufactured products.• Waste recycling and reduction of re-
source consumption.• CO2-neutral production of selected
products.
EnergyIn 2015 energy consumption developed satisfactorily for Royal Unibrew as a whole. Energy consumption per unit produced decreased by 2.4% to 84.6 MJ/hl. The reduced consumption is the re-sulting effect of measures implemented in 2015, especially at the Lahti brewery in Finland and the Kalnapilis brewery in Lithuania, as well as of a number of new measures introduced in 2015.
At the Faxe brewery replacement of all light sources with LED lights was com-menced, and the wort separation pro-cess was changed to achieve savings in terms of heating and cooling. Both of these measures resulted in energy sav-ings, but as there was a simultaneous opposite effect from the packaging mix, energy consumption per unit produced showed a small increase on a total basis.
In the Baltic countries the installation of a new energy-efficient cooling system reduced the energy consumption of the system by 11% as compared to 2014.
WATER CONSUMPTION (Hectorliter per produced hectoliter)
54 ANNUAL REPORT 2015 ROYAL UNIBREW

At the Hartwall brewery in Finland a new unit for filling beer on kegs was estab-lished which consumes less energy, beer filtration units were replaced by more modern and energy-efficient units and energy-optimisation of the production of PET bottles was implemented. Moreover, an electricity-saving project of replac-ing 10,000 light sources with LED lights continued.
Selected targets for 20162015 was to a certain extent affected by preparation for future, major invest-ments in energy-conserving measures which will be implemented in 2016. These include:
• In Denmark the Faxe brewery will complete two initiatives under the ”Green Industrial Symbiosis” project - one concerning energy sharing among enterprises in Faxe and another con-cerning the use of non-drinking water.
• In the Baltic countries a hot-air mixer will be installed at the warehouses to reduce gas consumption for heating purposes.
• The Baltic countries have a target of increasing order size by 10% on aver-age to further increase fuel efficiency.
• The Finnish Lahti brewery must imple-ment several energy-saving projects.
• Investment funds have been allocated to implementing minor energy pro-jects with a view to achieving continu-ous reduction of energy and resource consumption.
Water consumption and waste water discharge Water is an important constituent of Royal Unibrew’s production, and we are therefore always on the lookout for new methods to reduce our water consump-tion. For our business as a whole, wa-ter consumption in 2015 was marginally lower than in 2014.
This was achieved through, among oth-er measures, improved control of the crate washer at the Faxe brewery in Denmark as well as optimisation of the CIP processes in Finland (CIP: Cleaning In Place) with a view to reducing the use of chemicals in water. Total water con-
sumption and waste water discharge (m3 per hectolitre produced) were reduced by 1% in 2015 (in Finland 3%).
Recycling and reduction of consumption of resourcesAll production sites have strong, contin-uous focus on consumption, including recycling, of raw materials and other resources. Efforts are made to ensure the best possible utilisation of the raw materials and resources used in order to avoid unnecessary wastage. This ap-plies to production as well as to the other parts of the supply chain.
Initiatives in 2015 included:• In 2015 the replacement of the distri-
bution vehicles in Denmark with new vehicles complying with the Euro 6 requirements (the most eco-friendly lorries in the market) continued. This replacement is expected to continue in future years. The replacement implies savings in terms of diesel oil consump-tion and represents future-proofing in relation to the increasingly stringent environmental requirements expected in Denmark.
• In Finland the beer filtration units were replaced by modern membrane filtration technology.
• In Latvia the rolling stock was upgrad-ed, which reduces CO2 emissions.
• In the Baltic countries the order size of direct deliveries was increased by 4% in Lithuania and by 2% in Latvia re-sulting in lower fuel consumption per hectolitre distributed.
• In Latvia wood pallets are current-ly being replaced by plastic pallets which are of a better quality and have a longer life cycle.
Selected for 2016• All production sites will in 2016 continue
working at identifying and implement-ing environmental improvement meas-ures. Targets and improvements will be realised locally at the production sites to ensure the most optimum implemen-tation. Initiatives are focused on:
– Optimum utilisation of raw materials – Minimisation of wastage from all
process levels
– Energy and water consumption re-ductions
– Increased rate of waste recycling – Increased utilisation of transport
capacity
• Indirect environmental impacts will be sought reduced through choice of raw materials, eg by using thinner plastic materials for packaging purposes.
• Continuous efforts are directed at re-ducing consumption of materials for glass bottles, cans and plastic con-tainers.
• In the Baltic countries investments are made in equipment for recycling heat from compressors. This heat may be used for heating of buildings, thus re-sulting in reduced gas consumption.
CO2 neutral production of selected products Back in 2012 the carbon footprint of the Egekilde products was mapped through-out the chain from raw materials to de-livery to Royal Unibrew’s customers, and the Egekilde brand was launched as the first Danish CO2 neutral mineral water product.
CO2 neutrality is an ongoing process achieved by investing in environmental-ly sound energy through UN-certified carbon credits and by means of plastic containing up to 50% recycled material. This knowledge is also applied generally in making continuous efforts directed at reducing energy and resource consump-tion with suppliers and within production and logistics. Our efforts in this area are continuously optimised in coopera-tion with suppliers and other business partners.
CO2 neutrality contributed towards Egekilde becoming the market leader in 2015. Egekilde’s CO2 neutrality provides consumers with a climate-friendly pur-chasing option.
Selected targets for 2016• Updating of carbon footprint of pack-
aging, containers and resources in the Egekilde production.
ROYAL UNIBREW ANNUAL REPORT 2015 55

Management's Statement on the Annual ReportThe Board of Directors and the Executive Board have today considered and adopt-ed the Annual Report of Royal Unibrew A/S for 1 January - 31 December 2015.
The Annual Report is prepared in ac-cordance with International Financial Reporting Standards as adopted by the EU and Danish disclosure requirements for annual reports of listed companies.
In our opinion, the Consolidated Finan-cial Statements and the Parent Company
Financial Statements give a true and fair view of the financial position of the Group and the Parent Company at 31 Decem-ber 2015 as well as of the results of the Group and Company operations and cash flows for the financial year 1 January - 31 December 2015.
In our opinion, Management’s Review gives a true and fair account of the de-velopment in the activities and financial circumstances of the Group and the Par-ent Company, of results of operations for
the year, of the Parent Company's finan-cial position and of the overall financial position of the enterprises comprised by the Consolidated Financial Statements, as well as a description of the key risks and uncertainties facing the Group and the Parent Company.
We recommend that the Annual Report be adopted at the Annual General Meeting.
Faxe, 1 March 2016
Executive Board
Henrik Brandt Lars Jensen Johannes F.C.M. SavonijePresident & CEO CFO COO
Board of Directors
Kåre Schultz Walther ThygesenChairman Deputy Chairman
Martin Alsø Ingrid Jonasson Blank Jørgen-Anker Ipsen
Kirsten Liisberg Søren Lorentzen Jens Due Olsen
Karsten Mattias Slotte Jais Valeur Hemming Van
56 ANNUAL REPORT 2015 ROYAL UNIBREW

Independent Auditor's ReportTo the Shareholders of Royal Unibrew A/S
Report on Consolidated Financial Statements and Parent Company Financial StatementsWe have audited the Consolidated Finan-cial Statements and the Parent Company Financial Statements of Royal Unibrew A/S for the financial year 1 January - 31 December 2015, which comprise income statement, statement of comprehensive income, balance sheet, statement of changes in equity, cash flow statement and notes, including summary of signifi-cant accounting policies, for the Group as well as for the Parent Company. The Con-solidated Financial Statements and the Parent Company Financial Statements are prepared in accordance with Interna-tional Financial Reporting Standards as adopted by the EU and Danish disclosure requirements for listed companies.
Management's Responsibility for the Consolidated Financial Statements and the Parent Company Financial StatementsManagement is responsible for the preparation of Consolidated Financial Statements and Parent Company Fi-nancial Statements that give a true and fair view in accordance with Interna-tional Financial Reporting Standards as adopted by the EU and Danish disclosure requirements for listed companies, and for such internal control as Management determines is necessary to enable the preparation of Consolidated Financial Statements and Parent Company Fi-nancial Statements that are free from material misstatement, whether due to fraud or error.
Auditor's Responsibility and Basis of OpinionOur responsibility is to express an opin-ion on the Consolidated Financial State-
ments and the Parent Company Finan-cial Statements based on our audit. We conducted our audit in accordance with International Standards on Auditing and additional requirements under Danish audit regulation. This requires that we comply with ethical requirements and plan and perform the audit to obtain reasonable assurance whether the Con-solidated Financial Statements and the Parent Company Financial Statements are free from material misstatement.
An audit involves performing proce-dures to obtain audit evidence about the amounts and disclosures in the Con-solidated Financial Statements and the Parent Company Financial Statements. The procedures selected depend on the auditor’s judgment, including the as-sessment of the risks of material mis-statement of the Consolidated Financial Statements and the Parent Company Financial Statements, whether due to fraud or error. In making those risk as-sessments, the auditor considers inter-nal control relevant to the Company’s preparation of Consolidated Financial Statements and Parent Company Finan-cial Statements that give a true and fair view in order to design audit procedures that are appropriate in the circumstanc-es, but not for the purpose of express-ing an opinion on the effectiveness of the Company’s internal control. An audit also includes evaluating the appropri-ateness of accounting policies used and the reasonableness of accounting esti-mates made by Management, as well as evaluating the overall presentation of the Consolidated Financial Statements and the Parent Company Financial Statements.
We believe that the audit evidence we have obtained is sufficient and appro-priate to provide a basis for our audit opinion.
The audit has not resulted in any qual-ification.
OpinionIn our opinion, the Consolidated Finan-cial Statements and the Parent Compa-ny Financial Statements give a true and fair view of the financial position at 31 December 2015 of the Group and the Parent Company and of the results of the Group and Parent Company oper-ations and cash flows for the financial year 1 January - 31 December 2015 in accordance with International Financial Reporting Standards as adopted by the EU and Danish disclosure requirements for listed companies.
Statement on Management's ReviewWe have read Management’s Review in accordance with the Danish Financial Statements Act. We have not performed any procedures additional to the audit of the Consolidated Financial Statements and the Parent Company Financial State-ments. On this basis, in our opinion, the information provided in Management’s Review is consistent with the Consolidat-ed Financial Statements and the Parent Company Financial Statements.
Faxe, 1 March 2016
Ernst & YoungCVR No 30700228Godkendt Revisionspartnerselskab
Eskild N. JakobsenState Authorised Public Accountant
Niels-Jørgen AndersenState Authorised Public Accountant
ROYAL UNIBREW ANNUAL REPORT 2015 57

Consolidated Financial Statements

Consolidated Income Statement for 1 January – 31 DecemberDKK '000 Note 2015 2014
Net revenue 4 6,032,115 6,055,898 Production costs 5,6 -2,857,459 -2,906,089Gross profit 3,174,656 3,149,809 Sales and distribution expenses 5,6 -1,922,282 -1,987,350Administrative expenses 5,6 -335,418 -336,241EBIT 916,956 826,218 Income after tax from investments in associates 13 31,061 34,808Financial income 7 8,759 8,174Financial expenses 8 -54,470 -68,596 Profit before tax 902,306 800,604 Tax on the profit for the year 9 -190,879 -176,439 Net profit for the year 711,427 624,165 Earnings per share (DKK) 18 13.0 11.3Diluted earnings per share (DKK) 18 12.9 11.2
Consolidated Statement of Comprehensive Income for 1 January - 31 DecemberDKK '000 Note 2015 2014
Net profit for the year 711,427 624,165 Other comprehensive income Items that may be reclassified to the income statementExchange adjustment of foreign group enterprises 5,374 -14,184Value adjustment of hedging instruments, beginning of year 2 32,677 46,039Value adjustment of hedging instruments, end of year 2 -27,839 -32,677Tax on other comprehensive income 9 -3,097 -2,336Total 10 7,115 -3,158 Items that may not be reclassified to the income statementRevaluation of non-current assets 39,000 70,000Tax on revaluation of non-current assets 9 2,461 -16,100Actuarial gain on pension schemes 7,398 -2,791Tax on actuarial gain on pension schemes 9 -1,544 558Total 47,315 51,667 Other comprehensive income after tax 54,430 48,509 Total comprehensive income 765,857 672,674
ROYAL UNIBREW ANNUAL REPORT 2015 59

Consolidated Balance SheetDKK '000 Note 2015 2014
ASSETS AT 31 DECEMBER
NON-CURRENT ASSETS Intangible assets 11 2,920,162 2,941,247Project development properties 12 197,506 238,439Other property, plant and equipment 12 2,240,718 2,331,310Investments in associates 13 135,371 136,249Other fixed asset investments 14 11,725 16,768Non-current assets 5,505,482 5,664,013 CURRENT ASSETS Inventories 15 316,708 312,041Receivables 16 570,438 536,320 Prepayments 17 21,714 20,011Cash at bank and in hand 333,185 491,453Current assets 1,242,045 1,359,825 Assets 6,747,527 7,023,838 LIABILITIES AND EQUITY AT 31 DECEMBER EQUITY Share capital 18 110,985 110,985Other reserves 902,938 917,142Retained earnings 1,521,336 1,412,875Proposed dividend 399,546 377,349Equity 2,934,805 2,818,351 LIABILITIES NON-CURRENT LIABILITIES Deferred tax 19 375,396 431,774Mortgage debt 2 1,000,325 1,012,807Credit institutions 2 461,675 859,108Other payables 14,164 24,713Non-current liabilities 1,851,560 2,328,402 CURRENT LIABILITIES 3,327,724 4,225,030Mortgage debt 2 14,203 164,480Credit institutions 2 40,934 7,649Trade payables 913,762 810,529Corporation tax 9 7,044 22,156Other payables 20 985,219 872,271 Current liabilities 1,961,162 1,877,085 Liabilities 23 3,812,722 4,205,487 Liabilities and equity 6,747,527 7,023,838
60 ANNUAL REPORT 2015 ROYAL UNIBREW
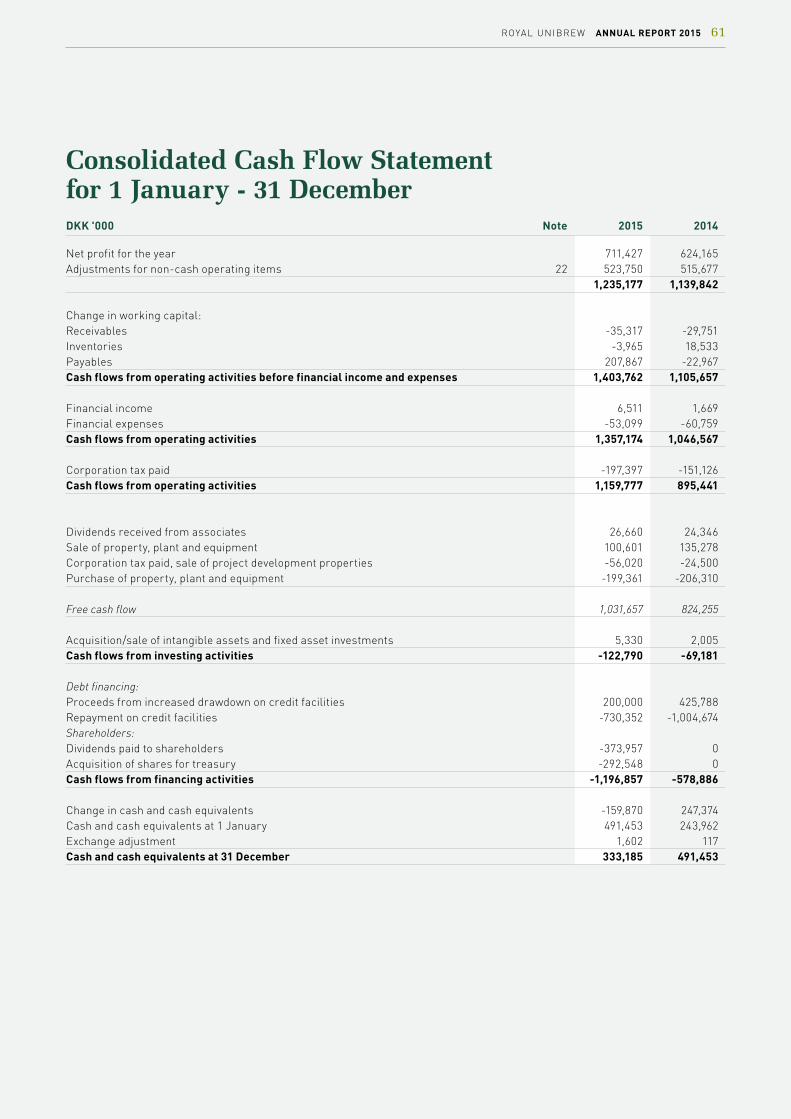
Consolidated Cash Flow Statement for 1 January - 31 December DKK '000 Note 2015 2014
Net profit for the year 711,427 624,165Adjustments for non-cash operating items 22 523,750 515,677 1,235,177 1,139,842 Change in working capital: Receivables -35,317 -29,751Inventories -3,965 18,533Payables 207,867 -22,967Cash flows from operating activities before financial income and expenses 1,403,762 1,105,657 Financial income 6,511 1,669Financial expenses -53,099 -60,759Cash flows from operating activities 1,357,174 1,046,567 Corporation tax paid -197,397 -151,126Cash flows from operating activities 1,159,777 895,441 Dividends received from associates 26,660 24,346Sale of property, plant and equipment 100,601 135,278Corporation tax paid, sale of project development properties -56,020 -24,500Purchase of property, plant and equipment -199,361 -206,310 Free cash flow 1,031,657 824,255 Acquisition/sale of intangible assets and fixed asset investments 5,330 2,005Cash flows from investing activities -122,790 -69,181 Debt financing: Proceeds from increased drawdown on credit facilities 200,000 425,788Repayment on credit facilities -730,352 -1,004,674Shareholders: Dividends paid to shareholders -373,957 0Acquisition of shares for treasury -292,548 0Cash flows from financing activities -1,196,857 -578,886 Change in cash and cash equivalents -159,870 247,374Cash and cash equivalents at 1 January 491,453 243,962Exchange adjustment 1,602 117Cash and cash equivalents at 31 December 333,185 491,453
ROYAL UNIBREW ANNUAL REPORT 2015 61

Consolidated Statement of Changes in Equity for 1 January - 31 December Proposed Share Reva- Total dividend Share premium luation Translation Hedging other Retained for DKK '000 capital account reserves reserve reserve reserves earnings the year Total
Equity at 31 December 2014 110,985 855,839 126,616 -32,636 -32,677 917,142 1,412,875 377,349 2,818,351
Changes in equity in 2015
Net profit for the year 711,427 711,427
Other comprehensive income 39,000 5,374 4,838 49,212 7,398 56,610
Tax on other comprehensive income 2,461 2,461 -4,641 -2,180
Revaluation reserves realised -65,877 -65,877 65,877 0
Total comprehensive income 0 0 -24,416 5,374 4,838 -14,204 780,061 0 765,857
Dividends paid to shareholders -373,957 -373,957
Dividend on treasury shares 3,392 -3,392 0
Acquisition of shares for treasury -292,548 -292,548
Share-based payments 9,900 9,900
Tax on changes in equity, shareholders 7,202 7,202
Proposed dividend -399,546 399,546 0
Total shareholders 0 0 0 0 0 -671,600 22,197 -649,403
Total changes in equity in 2015 0 0 -24,416 5,374 4,838 -14,204 108,461 22,197 116,454
Equity at 31 December 2015 110,985 855,839 102,200 -27,262 -27,839 902,938 1,521,336 399,546 2,934,805 The share capital at 31 December 2015 amounts to DKK 110,985,000 and is distributed on shares of DKK 2 each.
Equity at 31 December 2013 110,985 855,839 136,505 -18,970 -46,039 927,335 1,094,657 0 2,132,977
Changes in equity in 2014
Net profit for the year 624,165 624,165
Other comprehensive income 70,000 -13,666 13,362 69,696 -5,087 64,609
Tax on other comprehensive income -16,100 -16,100 -16,100
Revaluation reserves realised -63,789 -63,789 63,789 0
Total comprehensive income 0 0 -9,889 -13,666 13,362 -10,193 682,867 0 672,674
Share-based payments 9,900 9,900
Tax on changes in equity, shareholders 2,800 2,800
Proposed dividend -377,349 377,349 0
Total shareholders 0 0 0 0 0 0 -364,649 377,349 12,700
Total changes in equity in 2014 0 0 -9,889 -13,666 13,362 -10,193 318,218 377,349 685,374
Equity at 31 December 2014 110,985 855,839 126,616 -32,636 -32,677 917,142 1,412,875 377,349 2,818,351
62 ANNUAL REPORT 2015 ROYAL UNIBREW

Notes to Consolidated Annual Report
Note Side
Descriptive notes1 Basis of preparation 63-66
2 Financial risk management 67-72
3 Segment reporting 73-76
Notes referring to Income Statement, Balance Sheet and Cash Flow Statement
4 Net revenue 77
5 Staff expenses 77-78
6 Expenses broken down by type 79-80
7 Financial income 81
8 Financial expenses 81
9 Tax on the profit for the year 82
10 Realised hedging transactions in the income statement 83
11 Intangible assets 84-86
12 Property, plant and equipment 87-90
13 Investments in associates 91-92
14 Other fixed asset investments 93-94
15 Inventories 95
16 Receivables 96
17 Prepayments 97
18 Equity and basis of earnings/cash flow per share 98
19 Deferred tax 99
20 Other current payables 100
21 Debt 101
22 Cash Flow Statement 102
Other notes23 Contingent liabilities and security 103
24 Related parties 104
CONSOLIDATED ANNUAL REPORT ROYAL UNIBREW ANNUAL REPORT 2015 63
Descriptive notes to Consolidated Annual ReportNote 1 Basis of preparation of Consolidated Annual Report
Basis of preparationRoyal Unibrew A/S is a limited liability company registered in Denmark. The Financial Statements for the period 1 January - 31 December 2015 presented in the Annual Report comprise both Con-solidated Financial Statements of Royal Unibrew A/S and its subsidiaries (Group) and separate Parent Company Financial Statements.
The Financial Statements of Royal Uni-brew for 2015 have been prepared in accordance with International Financial Reporting Standards (IFRS) as adopted by the EU and additional Danish disclosure requirements for financial statements, cf the Danish Statutory Order on Adoption of IFRS issued pursuant to the Danish Fi-nancial Statements Act.
The Board of Directors and the Executive Board considered and adopted the Annual Report of Royal Unibrew A/S for 2015 on 1 March 2016. The Annual Report will be submitted for adoption by the sharehold-ers of Royal Unibrew A/S at the Annual General Meeting on 27 April 2016.
The Financial Statements are presented in Danish kroner (DKK).
Significant accounting policies
This section describes the general ac-counting policies applied and critical accounting estimates made by Royal Unibrew. A detailed description of the accounting policies applied and critical estimates made with respect to specif-ic reported amounts is presented in the relevant notes. The purpose of this is to create full transparency of the disclosed amounts by providing a total description of the relevant accounting policy, the criti-cal estimates and the numerical informa-tion for each note.
The description of accounting policies in the notes constitutes part of the overall description of Royal Unibrew's accounting policies.
New and amended standards and interpretations that have taken effect Royal Unibrew has during the year imple-mented all new IFRSs, amendments to existing standards and IFRICs adopted by the EU which take effect for the financial
year 2015. There were no amendments in the financial year 2015.
New and amended standards and interpretations that have not yet taken effect At the time of publication of this Annual Report, the IASB has issued the follow-ing new and amended financial reporting standards and interpretations which are not mandatory for Royal Unibrew A/S at the time of preparation of the Annual Re-port for 2015:
• IFRS 9 Financial Instruments and sub-sequent amendments to IFRS 9, IFRS 7 and IAS 39
• IFRS 15 Revenue from Contracts with Customers
• IFRS 16 Leases • IAS 16 and IAS 38 Clarification of Ac-
ceptable Methods of Depreciation and Amortisation – Amendments to IAS 16 and IAS 38
• IAS 27 Equity Method in Separate Fi-nancial Statements – Amendments to IAS 27
• IFRS 10, IFRS 12 and IAS 28 Investment Entities: Applying the Consolidation Ex-ception – Amendments to IFRS 10, IFRS 12 and IAS 28
• IFRS 10 and IAS 28 Sale of Contribution of Assets between an Investor and its Associate or Joint Venture – Amend-ments to IFRS 10 and IAS 28
• IAS 1 Disclosure Initiative – Amend-ments to IAS 1
• Annual improvements to IFRSs 2012-2014 Cycle
Amendments to IAS 16 and IAS 38, Amend-ments to IAS 16 and IAS 41, Amendments to IAS 27, Amendments to IFRS 11, Amend-ments to IAS 1 and Annual Improvements to IFRSs 2012-2014 Cycle have been adopt-ed by the EU.
The adopted, not yet effective standards and interpretations will be implemented as they become mandatory for Royal Uni-brew A/S. None of the new standards or interpretations are expected to have a sig-nificant impact on recognition and meas-urement for Royal Unibrew A/S; however, the analysis of the expected impact of the implementation of IFRS 9 and IFRS 15 has not yet been completed, see below.
IFRS 15 "Revenue from Contracts with Customers", which replaces the existing
revenue standards (IAS 11 and IAS 18) and interpretations, introduces a new model for recognising and measuring revenue from sales contracts with customers. The standard takes effect for financial years beginning on or after 1 January 2017. The IASB has, however, issued an exposure draft for amendment of IFRS 15 proposing a deferral of the effective date to financial years beginning on or after 1 January 2018.
The new model is based on a five-step process to be followed for all sales con-tracts with customers to determine when and how revenue is to be recognised in the income statement.
The key amendments to IFRS 15 as com-pared to the existing principles are:
• A sales transaction is to be recognised as revenue in the income statement when (or as) control of the good or ser-vice transfers (either at a point in time or over time) to the customer (the exist-ing “risk and rewards” concept is thus replaced by a control concept).
• New and more detailed guidance on how to identify separate transaction components (performance obligations) of a sales contract, and how to recog-nise and measure the individual com-ponents.
• New and more detailed guidance on recognition of revenue over time.
Royal Unibrew A/S has not yet made an in-depth analysis of the implications of the new standard to the Group; however, based on preliminary analyses, the im-pact on recognition and measurement is assessed as immaterial given the current product mix and contract types.
IFRS 9 "Financial Instruments", which re-places IAS 39, changes the classification and, thus, the measurement of financial assets and liabilities
A more logical approach to the classifi-cation of financial assets is introduced driven by an entity’s business model and underlying cash flow characteristics. At the same time, a new impairment model is introduced for all financial assets.
The so-called "expected loss" model will require more timely recognition of ex-
64 ANNUAL REPORT 2015 ROYAL UNIBREW

Descriptive notes to Consolidated Annual ReportNote 1 Basis of preparation of Consolidated Annual Report (continued)
pected losses, both at inception and sub-sequently, than the existing model under which an impairment loss is not recog-nised until there are indications of a loss (incurred loss model).
Finally, new hedge accounting rules are introduced which, as compared to the existing rules, will make it possible to reflect in the accounting an entity’s oper-ational hedging strategy.
To entities that measure their financial li-abilities at fair value, IFRS 9 implies that, going forward, fair value changes due to changes in the entity’s own credit risk are no longer to be recognised in the income statement, but in other comprehensive income.
Royal Unibrew A/S expects the standard to have minor implications to the Group. The standard is expected to be mandatory for financial years beginning on or after 1 January 2018.
IFRS 16 ”Leases” was issued in mid-Jan-uary 2016. The standard, which takes effect for financial years beginning on or after 1 January 2019, implies a significant change to the accounting treatment of the leases that are now treated as operating leases. Thus, the standard requires that all leases irrespective of type – with few exceptions – should be recognised as an asset in the lessee’s balance sheet with a corresponding lease liability. At the same time, the lessee’s income statement will be affected as, going forward, the annu-al lease expense will comprise two ele-ments — partly depreciation and partly an interest expense – as opposed to the current principle of recognising the annu-al operating lease expense as one amount in operating expenses.
Royal Unibrew A/S has not yet made an in-depth analysis of the implications of the new standard to the Group. It is, howev-er, expected to have some impact as in 2015 the Group has operating leases with minimum lease payments in the order of DKK 151 million, corresponding to approx 2% of the balance sheet total, which will potentially have to be recognised in the balance sheet going forward.
Recognition and measurement Assets are recognised in the balance
sheet when it is probable that future economic benefits attributable to the asset will flow to the Group, and the value of the asset can be measured reliably.
Liabilities are recognised in the balance sheet when they are probable and can be measured reliably. Assets and liabilities are initially measured at cost. Subsequently, assets and liabilities are measured as described for each item below.
Recognition and measurement take into account losses and risks occurring be-fore the presentation of the Annual Report which confirm or invalidate affairs and con-ditions existing at the balance sheet date.
Revenues are recognised in the income statement as earned. Furthermore, value adjustments of financial assets and lia-bilities measured at fair value or amor-tised cost are recognised. Moreover, all expenses incurred to achieve the earnings for the year are recognised, including depreciation, amortisation, impairment losses and provisions as well as reversals due to changed accounting estimates in the income statement.
Consolidated Financial StatementsThe Consolidated Financial Statements comprise Royal Unibrew A/S (the Parent Company) and enterprises in which the Parent Company exercises control (sub-sidiaries).
Enterprises in which the Group holds be-tween 20% and 50% of the votes and exer-cises significant influence but not control are classified as associates.
The Consolidated Financial Statements are prepared on the basis of Financial Statements of all group enterprises pre-pared under the Group's accounting pol-icies by combining accounting items of a uniform nature. Elimination is made of intercompany income and expenses, un-realised intercompany profits and losses, balances and shareholdings. Compara-tive figures are not adjusted for newly acquired, sold or wound-up enterprises.
Acquired enterprises are recognised as of the date of acquisition. Enterprises dis-posed of are recognised in the consolidat-
ed income statement up until the date of disposal.
Translation policies For each of the reporting entities of the Group, a functional currency is deter-mined. The functional currency is the currency of the primary economic envi-ronment in which the reporting entity op-erates. Transactions in other currencies than the functional currency are transac-tions in foreign currencies.
Transactions in other currencies than the functional currency are initially translated into Danish kroner at the exchange rates at the dates of transaction. Receivables, payables and other monetary items in for-eign currencies not settled at the balance sheet date are translated at the exchange rates at the balance sheet date. Exchange adjustments arising due to differences between the transaction date rates and the rates at the dates of payment or the rates at the balance sheet date, respec-tively, are recognised in financial income and expenses in the income statement. Property, plant and equipment and in-tangible assets, inventories and other non-monetary assets purchased in for-eign currencies and measured at histori-cal cost are translated at the transaction date rates.
On recognition in the Consolidated Finan-cial Statements of enterprises with anoth-er functional currency than Danish kroner (DKK), income statements are translated at average annual exchange rates. Bal-ance sheet items are translated at the exchange rates at the balance sheet date.
Exchange adjustments arising on the translation of the opening balance sheet items of foreign enterprises at exchange rates at the balance sheet date and on the translation of income statements from av-erage exchange rates to exchange rates at the balance sheet date are recognised in other comprehensive income. Similar-ly, exchange adjustments arising due to changes made directly in equity of foreign enterprises are recognised in other com-prehensive income.
On recognition in the Consolidated Fi-nancial Statements of associates with a functional currency that differs from the presentation currency of the Parent
ROYAL UNIBREW ANNUAL REPORT 2015 65

Descriptive notes to Consolidated Annual ReportNote 1 Basis of preparation of Consolidated Annual Report (continued)
Company, the share of results for the year is translated at average exchange rates, and the share of equity including good-will is translated at the exchange rates at the balance sheet date. Exchange ad-justments arising on the translation of the share of the opening equity of foreign as-sociates at exchange rates at the balance sheet date and on the translation of the share of results for the year from aver-age exchange rates to exchange rates at the balance sheet date are recognised in other comprehensive income and classi-fied in equity under a separate translation reserve.
Critical accounting estimates and judgementsIn connection with the preparation of the Parent Company and Consolidated Fi-nancial Statements, Management makes estimates and judgements as to how rec-ognition and measurement of assets and liabilities should take place based on the accounting policies applied.
Judgements as an element in significant accounting policies
The calculation of carrying amounts of certain assets and liabilities requires judgement as to how assets and liabili-ties should be classified in the Financial Statements and how future events will affect the value of these assets and lia-bilities at the balance sheet date. In con-nection with the financial reporting for
2015, the following judgments have been made materially affecting the related items as described in relevant notes, see list below.
Critical accounting estimates
Management's estimates are based on assumptions which Management consid-ers reasonable but which are inherently uncertain and unpredictable. In connec-tion with the financial reporting for 2015, the following critical estimates have been made as desribed in the notes, see list below.
Accounting policies, judgements as an el-ement in significant accounting policies as well as critical accounting estimates are described in the notes:
Note
Derivative financial instruments 2Segment reporting 3Net revenue 4Share-based payments 5Expenses 6Financial income and expenses 8Corporation tax 9Intangible assets 11Property, plant and equipment 12Investments in associates 13Other fixed asset investments 14Inventories 15Receivables 16Prepayments 17Equity 18Deferred tax 19Repurchase obligation packaging in circulation 20Debt 21Cash Flow Statement 22Business combinations 25
Comments to the note =
66 ANNUAL REPORT 2015 ROYAL UNIBREW

Descriptive notes to Consolidated Annual ReportNote 2 Financial risk management
The Group's financial risks are managed centrally according to the Treasury Policy approved by the Board of Directors, which includes guidelines for the handling of currency, interest rate, liquidity and credit risks. Commodity risks are also managed under a commodity risk policy approved by the Board of Directors.
Currency riskRoyal Unibrew is exposed to currency risks through the geographic spread of the Group's activities. This currency ex-posure is reflected through the activities in the subsidiaries and the Parent Compa-ny's export activities where cash flows are earned in foreign currencies, and in con-nection with the purchase of raw materi-als in EUR and USD, including purchases
which involve an indirect USD risk on the part of the purchase price related to the raw material element. Purchases are in all materiality made in the currencies in which the Group has income, which re-sults in a total reduction of the currency risk. Furthermore, the translation of loans to/from subsidiaries as well as the Group's net debt is subject to currency risk where these are not established in DKK.
The above describes Royal Unibrew's transaction risks, which are hedged ac-tively according to the Treasury Policy. EUR is not hedged as the risk is immate-rial provided that the existing 0.5% band of DKK to EUR under Denmark's mone-tary policy is maintained. The objective is to reduce negative effects on the Group's
profit and cash flows. The risk is therefore monitored and hedged continually. The Group's cash flows are primarily in EUR, USD and GBP. The key currency risks are related to GBP and USD.
The total gross currency risk (before hedging) on the balance sheet items was calculated at 31 December 2015. The fol-lowing table shows the sensitivity to a positive change in the cross rates at 31 December 2015 with all other variables remaining unchanged. A negative change has a corresponding effect merely with the sign reversed.
Earnings Earnings impact impact Equity Equity before tax before tax impact impact DKK '000 Change 2015 2014 2015 2014
EUR 0.1% -347 -676 2,936 2,586USD 10% 1,301 2,008 2,191 2,763GBP 10% -157 5 1,995 2,015
Royal Unibrews translation risk relates primarily to Finland, Latvia as well as Lithuania (EUR). The translation risk re-lated to Royal Unibrew's investments in foreign subsidiaries is, as a general rule, not hedged.
Financial risks such as the loss of com-petitive strength due to long-term ex-change rate changes are not hedged by financial instruments but are included in Royal Unibrew's strategic considerations.
Interest rate riskRoyal Unibrew's interest rate risk is substantially related to the Group's loan portfolio which is primarily denominated in DKK and EUR. Interest rate changes will affect the market value of fixed-in-terest loans as well as interest payments on floating-rate liabilities. Debt is es-tablished only in currencies in which the Group has commercial activities.
In Royal Unibrew's assessment, the key interest rate risk is related to the imme-diate effect of interest rate changes on
the Group's interest payment flows and Royal Unibrew focuses only secondarily on changes in the market value of the debt. It is group policy to limit the effect of interest rate changes on profit and cash flows while, within this framework, also achieving the lowest possible financing cost. At the end of 2015, mortgage debt amounted to DKK 1,015 million (2014: DKK 1,157 million) with an average term to ma-turity of 13 years (2014: 13 years). Bank debt comprises committed bank credit facilities with an agreed term to maturity of up to 24 months (2014: 37 months). A one percentage point interest rate change will affect the Group's interest expenses by approx +/- DKK 6 million (2014: approx. +/- DKK 9 million), and the interest ex-penses of the Parent Company by approx +/- DKK 3 million (2014: approx +/- DKK 4 million).
Credit risksThe Group’s credit risks relate primari-ly to trade receivables and counterparty risks.
The Group's counterparty risks comprise both commercial and financial counter-party risk. The commercial counterparty risk relates primarily to business agree-ments with a built-in element of firm rate/price. The financial counterparty risk relates to hedging agreements as well as net bank deposits. The financial counterparty risk is actively reduced by distributing net bank deposits on banks in accordance with the credit rating criteria determined in the Treasury Policy.
Royal Unibrew seeks to limit risks relating to credit granting to customers in export markets through extensive use of insur-ance cover and other types of hedging of payments. Where effective hedges cannot be established, Royal Unibrew has estab-lished procedures for approval of such risks. There are no material credit risks on individual customers. In Finland, risks of individual large trade receivables are reduced by sale of the receivables. Credit risks relating to trade receivables are re-duced by setting off accrued bonus. At 31 December 2015, accrued bonus amounts
ROYAL UNIBREW ANNUAL REPORT 2015 67

Descriptive notes to Consolidated Annual ReportNote 2 Financial risk management (continued)
to DKK 168 million (2014: DKK 152 million) set off against trade receivables.
The maximum credit risk corresponds to the carrying amount of the financial assets.
Liquidity risksIt is group policy that its cash resources should be adequate to meet the expected liquidity requirements in the current and next financial year. The cash resources may be bank deposits, short-term bonds and unutilised credit facilities.
Capital managementRoyal Unibrew wants to ensure struc-tural and financial flexibility as well as competitive power. To ensure this, con-tinuous assessment is made to determine the appropriate capital structure of Royal Unibrew. At the end of 2015, it is assessed that the Group's net interest-bearing debt should not exceed 2.5 times EBITDA and that the equity ratio at year end should be 30%.
At the operational level, continuous ef-forts are directed at optimising working capital investments. Subject to adequate capacity, investments in production fa-cilities will be limited to replacement of individual components, related to specif-ic products or to optimisation of selected processes as well as maintenance.
Commodity risksThe commodity risk relates primarily to the purchasing of cans (aluminium), malt (barley), hops and packaging materials (cardboard) as well as energy. The com-modity risk is actively hedged commer-
cially and financially in accordance with the Group's Treasury Policy.
The objective of managing Royal Uni-brew's commodity risk is to achieve a smooth and time-differentiated effect of commodity price increases, which is primarily achieved by entering into fixed-price agreements with the relevant sup-pliers. As regards the Group's purchase of cans, financial contracts have been made to hedge the risk of aluminium price increases. Exchange rate changes with respect to the settlement currency of aluminium (USD) are an element of the overall currency risk management.
The most significant part of purchases for the next 12 months has, in accordance with Royal Unibrew's policy, been hedged by entering into supplier agreements and financial contracts. A +/-10% change in the price of aluminium would have a P/L effect at group level of approx +/- DKK 3 million.
Other risksMarket risks have in 2015 affected Royal Unibrew's results materially, which may also be the case in future years. Currently, the economic development in many of the Group's markets and the resulting con-sumer reluctance have affected volume sales of the Group's products, and thus also earnings, negatively. Furthermore, competition has intensified resulting in limited possibilities of realising sales price increases.
Royal Unibrew has significant revenue in the Danish, Finnish and Italian markets. Finland is the single key market. In 2015
these markets accounted for 72% (2014: 73%) of consolidated revenue. Changes to the competitive situation in these markets could therefore influence Royal Unibrew's results materially. Changes to consump-tion patterns in the Group's markets, eg changed views on alcohol consumption and consumption of soft drinks, may also affect Royal Unibrew's development and results materially.
As a producer of alcoholic products, Roy-al Unibrew is sensitive to changes in the public alcohol policy – including indirect tax policies in the Group’s respective mar-kets. For example, a change of the Danish and Finnish indirect tax policy as com-pared to those of neighbouring countries could lead to a change of cross-border trading patterns. This applies primarily to Germany and Estonia.
Legislative changes with respect to per-mitted types of containers and returning of containers could also result in signif-icant changes to consumption patterns. In Germany large parts of the Group’s products are sold in cans, whereas sales in Italy are primarily related to products in non-returnable glass bottles.
The Group's Insurance Guidelines de-termine the framework of covering risks in general insurance areas (buildings, movables and trading losses) The risks are covered through insurance. The total risks are assessed by the Board of Direc-tors on an annual basis and external spe-cialists review the breweries for relevant risks on a regular basis.
68 ANNUAL REPORT 2015 ROYAL UNIBREW

Descriptive notes to Consolidated Annual ReportNote 2 Financial risk management (continued)
Currency and interest rate risks and use of derivative financial instruments Derivative financial instruments entered into to hedge expected future transactions and qualifying as hedge accounting under IAS 39:
2015 2014
Deferred Deferred gain (+) gain (+) Period / loss (-) / loss (-)
Forward contracts: GBP 0 - 1 year -475Total 0 -475 Commodity hedge: 0 - 1 year -18,041 -3,898 > 1 year -1,060 0Total -19,101 -3,898 Interest rate swaps: Mortgage and bank loans 2016-2017 -8,738 -28,304Total -8,738 -28,304 Total hedging instruments -27,839 -32,677 The derivative financial instruments applied in 2015 and 2014 may all be classified as level-2 instruments in the IFRS fair value hierarchy.
The determined fair value of derivative financial instruments is based on observable market data such as yield curves or forward rates.
ROYAL UNIBREW ANNUAL REPORT 2015 69

Financial liabilities 31/12 2015
Maturity Contractual Maturity > 1 year Maturity Carrying (DKK '000) cash flows < 1 year < 5 years > 5 years amount
Non-derivative financial instruments: Financial debt, gross 1,517,137 55,137 637,048 824,952 1,517,137Interest expenses 91,894 17,493 36,514 37,887 Trade payables 913,762 913,762 913,762Other payables 999,383 985,219 14,164 999,383Total 3,522,176 1,971,611 687,726 862,839 3,430,282 The debt breaks down on the categories "debt at amortised cost" with DKK 3,421 million and "debt at fair value" with DKK 9 million. The fair value of the total debt is assessed to equal carrying amount.
31/12 2014
Maturity Contractual Maturity > 1 year Maturity Carrying (DKK '000) cash flows < 1 year < 5 years > 5 years amount
Non-derivative financial instruments: Financial debt, gross 2,044,044 173,010 993,102 877,932 2,044,044Interest expenses 214,354 41,439 70,228 102,687 Trade payables 810,529 810,529 810,529Other payables 916,640 891,927 24,713 916,640Total 3,985,567 1,916,905 1,088,043 980,619 3,771,213 The debt breaks down on the categories "debt at amortised cost" with DKK 3,738 million and "debt at fair value" with DKK 33 million.The fair value of the total debt is assessed to equal carrying amount.
Derivative financial instruments
Derivative financial instruments are initially recognised in the balance sheet at fair value and are subsequently remeasured at their fair values. Positive and negative fair values of derivative financial instruments are included as other receivables and other payables, respectively.
Changes in the fair values of derivative financial instruments that are designated and qualify as fair value hedges of a recognised asset or a recognised liability are recognised in the income statement as are any changes in the value of the hedged asset or the hedged liability.
Changes in the fair values of derivative financial instruments that are designated and qualify as hedges of future cash flows are recognised in other comprehensive income. Income and expenses relating to such hedging transactions are transferred from other comprehensive income on realisation of the hedged item and are recognised in the same entry as the hedged item.
For derivative financial instruments which do not meet the criteria for hedge accounting, changes in fair values are recognised on a current basis in financial income and expenses in the income statement.
Derivative financial instruments
When entering into derivative financial instruments, Management exercises judgement to determine whether the instrument qualifies as effective hedging of recognised assets or liabilities or expected future cash flows. Derivative financial instruments recognised are tested for effectiveness at least quarterly, and any ineffectiveness identified is recognised in the income statement.
Descriptive notes to Consolidated Annual ReportNote 2 Financial risk management (continued)
70 ANNUAL REPORT 2015 ROYAL UNIBREW

Descriptive notes to Consolidated Annual ReportNote 3 Segment reporting
The Group’s results, assets and liabilities break down as follows on segments: Malt Western Beverages mDKK Europe Baltic Sea and Exports Unallocated Total
2015 Net revenue 2,727.9 2,852.5 451.7 6,032.1Earnings before interest and tax (EBIT) 493.3 355.4 101.8 -33.6 916.9Net financials -0.5 -10.2 -0.3 -34.7 -45.7Share of income from associates 31.1 31.1Profit/loss before tax 523.9 345.2 101.5 -68.3 902.3Tax -190.9 -190.9Profit/loss for the year 523.9 345.2 101.5 -259.2 711.4 Assets * 1,285.1 5,090.6 38.9 197.5 6,612.1Associates 135.4 135.4Total assets 1,420.5 5,090.6 38.9 197.5 6,747.5 Purchase of property, plant and equipment 101.2 98.2 199.4 Liabilities** 804.9 1,825.9 6.3 1,175.6 3,812.7 Sales (million hectolitres) 3.6 4.8 0.7 9.1
* I ikke fordelte aktiver indgår projektudviklingsejendomme.
** I ikke fordelte forpligtelser indgår moderselskabets rentebærende gæld. Malt Western Beverages mDKK Europe Baltic Sea and Exports Unallocated Total
2014 Net revenue 2,674.6 2,974.8 406.5 6,055.9Earnings before interest and tax (EBIT) 483.7 295.3 83.9 -36.7 826.2Net financials -0.7 -15.4 -0.2 -44.1 -60.4Share of income from associates 34.8 34.8Profit/loss before tax 517.8 279.9 83.7 -80.8 800.6Tax -176.4 -176.4Profit/loss for the year 517.8 279.9 83.7 -257.2 624.2 Assets * 1,552.6 5,064.3 32.3 238.4 6,887.6Associates 136.2 136.2Total assets 1,688.8 5,064.3 32.3 238.4 7,023.8 Purchase of property, plant and equipment 133.6 72.3 0.4 206.3Purchase of property, plant and equipment on acquisition Purchase of intangible assets on acquisitiion 0.0 Liabilities** 883.9 1,816.7 4.7 1,500.2 4,205.5 Sales (million hectolitres) 3.7 4.7 0.6 9.0 t
* Unallocated assets include project development properties.
** Unallocated liabilities include the Parent Company's interest-bearing debt.
ROYAL UNIBREW ANNUAL REPORT 2015 71

Descriptive notes to Consolidated Annual ReportNote 3 Segment reporting (continued)
Geographically, revenue and non-current assets break down as follows: 2015 2014
Non-current Non-current mDKK Net revenue assets Net revenue assets
Denmark 1,541.5 1,005.8 1,492.8 1,101.8Finland 2,211.7 3,638.6 2,320.5 3,829.0Other countries 2,278.9 663.6 2,242.6 494.8Unallocated 197.5 238.4Total 6,032.1 5,505.5 6,055.9 5,664.0 The geographic breakdown is based on the geographic location of the Group's external customers and comprises countries that individually account for more than 10% of the Group's net revenue as well as the country in which the Group is headquartered.
No single customer accounts for revenue in excess of 10% of the Group's net revenue.
72 ANNUAL REPORT 2015 ROYAL UNIBREW

Descriptive notes to Consolidated Annual ReportNote 3 Segment reporting (continued)
Segment reporting 2011 - 2015The Group’s activities break down as follows on segments: Malt Western Beverages mDKK Europe Baltic Sea and Exports Unallocated Total
2015 Net revenue 2,727.9 2,852.5 451.7 6,032.1Operating profit/loss 493.3 355.4 101.8 -33.6 916.9Assets 1,420.5 5,090.6 38.9 197.5 6,747.5Liabilities 804.9 1,825.9 6.3 1,175.6 3,812.7Sales (million hectolitres) 3.6 4.8 0.7 9.1 2014 Net revenue 2,674.6 2,974.8 406.5 6,055.9Operating profit/loss 483.7 295.3 83.9 -36.7 826.2Assets 1,688.8 5,064.3 32.3 238.4 7,023.8Liabilities 883.9 1,816.7 4.7 1,500.2 4,205.5Sales (million hectolitres) 3.7 4.7 0.6 9.0 2013 Net revenue 2,650.3 1,450.2 380.5 4,481.0Operating profit/loss 424.0 101.6 81.3 -46.8 560.1Assets 1,605.0 4,986.2 42.8 290.5 6,924.5Liabilities 898.0 1,371.4 6.2 2,515.9 4,791.5Sales (million hectolitres) 3.6 2.8 0.6 7.0 2012 Net revenue 2,429.9 585.1 415.0 3,430.0Operating profit/loss 408.2 27.3 83.9 -34.4 485.0Assets 1,974.9 559.4 37.5 276.3 2,848.1Liabilities 791.4 106.1 8.7 594.3 1,500.5Sales (million hectolitres) 3.3 1.6 0.5 5.4 2011 Net revenue 2,410.1 629.1 391.4 3,430.6Operating profit/loss 405.0 45.1 53.3 -29.2 474.2Assets 1,688.1 701.0 89.7 411.5 2,890.3Liabilities 790.2 133.9 33.3 611.7 1,569.1Sales (million hectolitres) 3.3 2.0 0.4 5.7
Segment reporting
The Group’s business segment is beer and soft drinks sales. Reporting on the business segment is by geographical markets. Seg-ment reporting is based on the Group’s returns and risks and its internal financial reporting system.
Items included in net profit for the year, including income from investments in associates and financial income and expenses, are allocated to the extent that the items are directly or indirectly attributable to the markets.
Items allocated both by direct and indirect computation comprise “production costs” and “administrative expenses”, which are allocated by indirect computation based on allocation keys determined on the basis of the market’s drain on key resources. Admin-istrative expenses incurred in the group functions of the Parent Company are partly allocated.
Non-current assets comprise the non-current assets that are directly or indirectly used in connection with activities in the markets.
Segment liabilities comprise liabilities derived from activities in the market, including provisions, trade payables, VAT, excise duties and other payables.
ROYAL UNIBREW ANNUAL REPORT 2015 73
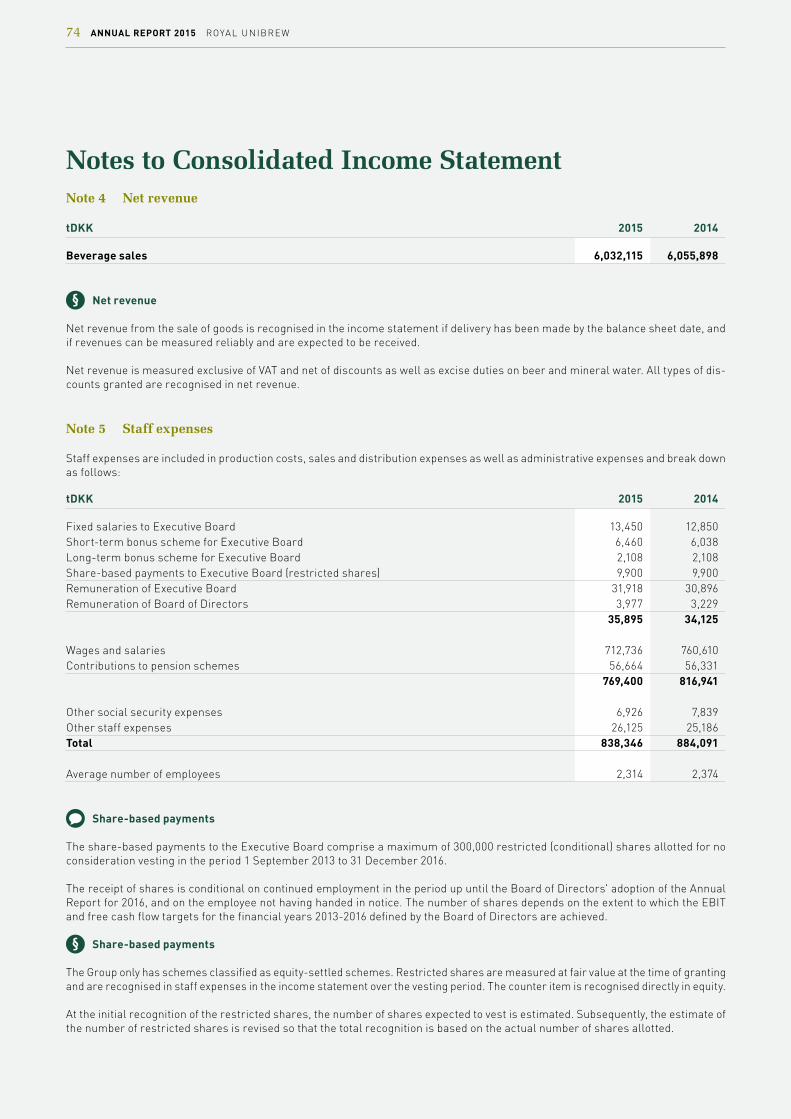
Notes to Consolidated Income StatementNote 4 Net revenue
tDKK 2015 2014
Beverage sales 6,032,115 6,055,898
Net revenue
Net revenue from the sale of goods is recognised in the income statement if delivery has been made by the balance sheet date, and if revenues can be measured reliably and are expected to be received.
Net revenue is measured exclusive of VAT and net of discounts as well as excise duties on beer and mineral water. All types of dis-counts granted are recognised in net revenue.
Note 5 Staff expenses
Staff expenses are included in production costs, sales and distribution expenses as well as administrative expenses and break down as follows:
tDKK 2015 2014
Fixed salaries to Executive Board 13,450 12,850 Short-term bonus scheme for Executive Board 6,460 6,038 Long-term bonus scheme for Executive Board 2,108 2,108 Share-based payments to Executive Board (restricted shares) 9,900 9,900 Remuneration of Executive Board 31,918 30,896 Remuneration of Board of Directors 3,977 3,229 35,895 34,125 Wages and salaries 712,736 760,610 Contributions to pension schemes 56,664 56,331 769,400 816,941 Other social security expenses 6,926 7,839 Other staff expenses 26,125 25,186 Total 838,346 884,091 Average number of employees 2,314 2,374
Share-based payments
The share-based payments to the Executive Board comprise a maximum of 300,000 restricted (conditional) shares allotted for no consideration vesting in the period 1 September 2013 to 31 December 2016.
The receipt of shares is conditional on continued employment in the period up until the Board of Directors' adoption of the Annual Report for 2016, and on the employee not having handed in notice. The number of shares depends on the extent to which the EBIT and free cash flow targets for the financial years 2013-2016 defined by the Board of Directors are achieved.
Share-based payments
The Group only has schemes classified as equity-settled schemes. Restricted shares are measured at fair value at the time of granting and are recognised in staff expenses in the income statement over the vesting period. The counter item is recognised directly in equity.
At the initial recognition of the restricted shares, the number of shares expected to vest is estimated. Subsequently, the estimate of the number of restricted shares is revised so that the total recognition is based on the actual number of shares allotted.
74 ANNUAL REPORT 2015 ROYAL UNIBREW
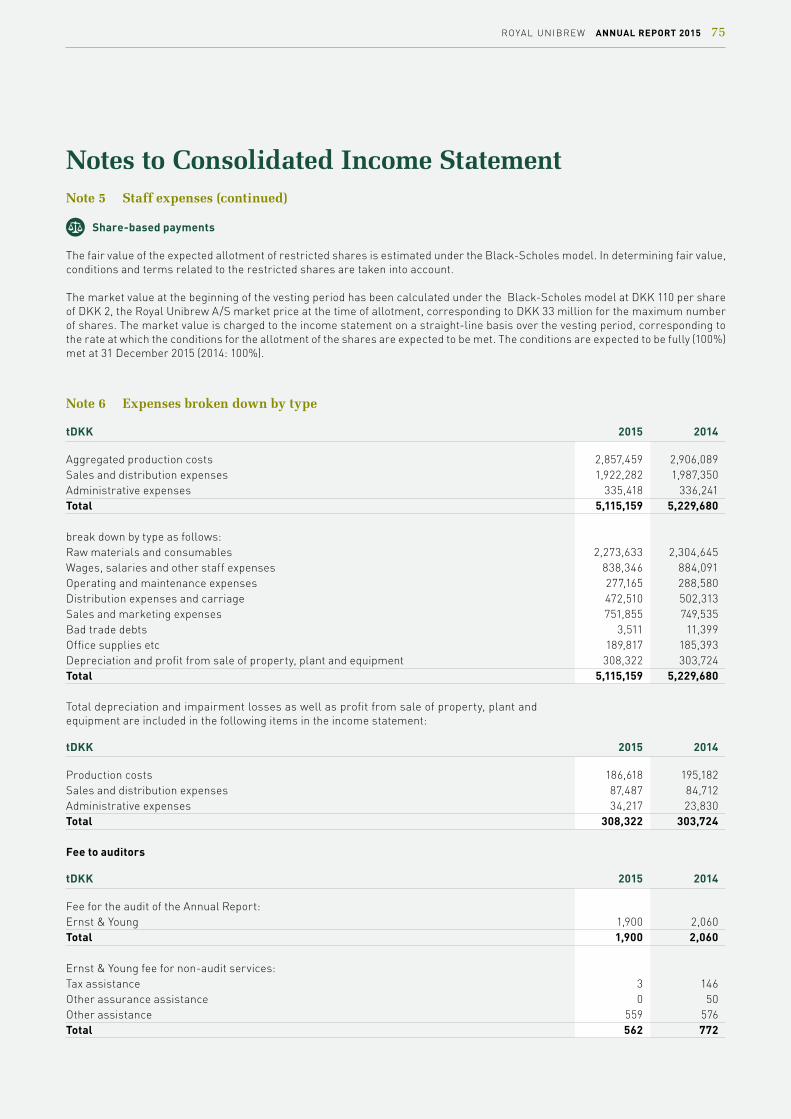
Notes to Consolidated Income StatementNote 5 Staff expenses (continued)
Share-based payments
The fair value of the expected allotment of restricted shares is estimated under the Black-Scholes model. In determining fair value, conditions and terms related to the restricted shares are taken into account.
The market value at the beginning of the vesting period has been calculated under the Black-Scholes model at DKK 110 per share of DKK 2, the Royal Unibrew A/S market price at the time of allotment, corresponding to DKK 33 million for the maximum number of shares. The market value is charged to the income statement on a straight-line basis over the vesting period, corresponding to the rate at which the conditions for the allotment of the shares are expected to be met. The conditions are expected to be fully (100%) met at 31 December 2015 (2014: 100%).
Note 6 Expenses broken down by type
tDKK 2015 2014
Aggregated production costs 2,857,459 2,906,089Sales and distribution expenses 1,922,282 1,987,350Administrative expenses 335,418 336,241Total 5,115,159 5,229,680 break down by type as follows: Raw materials and consumables 2,273,633 2,304,645Wages, salaries and other staff expenses 838,346 884,091Operating and maintenance expenses 277,165 288,580Distribution expenses and carriage 472,510 502,313Sales and marketing expenses 751,855 749,535Bad trade debts 3,511 11,399Office supplies etc 189,817 185,393Depreciation and profit from sale of property, plant and equipment 308,322 303,724Total 5,115,159 5,229,680 Total depreciation and impairment losses as well as profit from sale of property, plant and equipment are included in the following items in the income statement:
tDKK 2015 2014
Production costs 186,618 195,182Sales and distribution expenses 87,487 84,712Administrative expenses 34,217 23,830Total 308,322 303,724 Fee to auditors tDKK 2015 2014
Fee for the audit of the Annual Report: Ernst & Young 1,900 2,060 Total 1,900 2,060 Ernst & Young fee for non-audit services:Tax assistance 3 146 Other assurance assistance 0 50 Other assistance 559 576 Total 562 772
ROYAL UNIBREW ANNUAL REPORT 2015 75

Notes to Consolidated Income Statement
Expenses
Production costs Production costs comprise direct and indirect expenses incurred to manufacture the finished goods representing revenue for the year, including expenses for raw materials and consumables purchases, salaries and wages, renting and leasing as well as depre-ciation of and impairment losses on plant and machinery.
Production costs also include development costs that do not meet the criteria for capitalisation.
Sales and distribution expensesSales and distribution expenses comprise expenses for distribution and sales campaigns relating to goods sold during the year, including expenses for sales personnel, marketing, depreciation and amortisation as well as losses on trade receivables.
Administrative expensesAdministrative expenses comprise expenses for management and administration of the Group, including expenses for administrative personnel, management, office supplies, insurance, depreciation and amortisation.
Leases
When entering into leases, Management makes a judgement based on the following factors in order to identify whether the leases should be classified as finance or operating leases.
• The characteristics of the assets to which the leases relate• The term of the leases as compared to the useful lives of the assets• The amount of the minimum lease payments over the term of the leases• Matters concerning purchase obligations and ownership of the assets in question
At this time, Royal Unibrew has both finance and operating leases.
Note 6 Expenses broken down by type (continued)
76 ANNUAL REPORT 2015 ROYAL UNIBREW
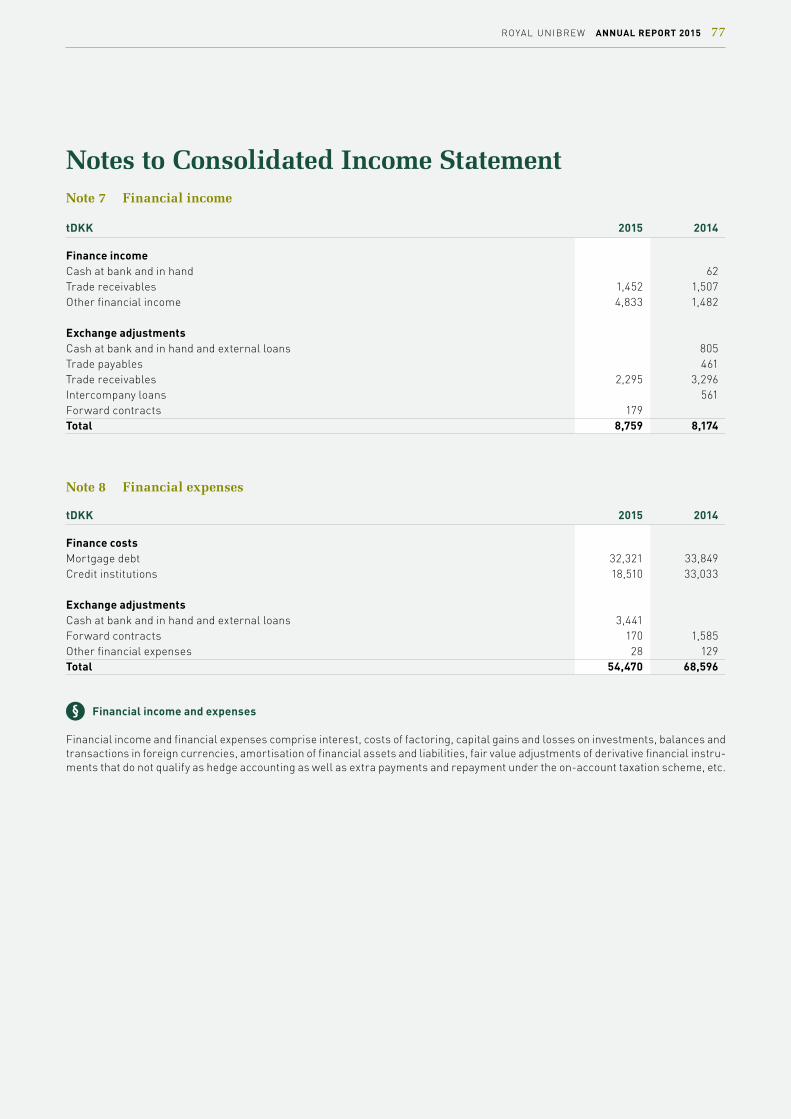
Notes to Consolidated Income StatementNote 7 Financial income
tDKK 2015 2014
Finance income Cash at bank and in hand 62 Trade receivables 1,452 1,507 Other financial income 4,833 1,482 Exchange adjustments Cash at bank and in hand and external loans 805 Trade payables 461 Trade receivables 2,295 3,296 Intercompany loans 561 Forward contracts 179 Total 8,759 8,174
Note 8 Financial expenses
tDKK 2015 2014
Finance costs Mortgage debt 32,321 33,849Credit institutions 18,510 33,033 Exchange adjustments Cash at bank and in hand and external loans 3,441 Forward contracts 170 1,585Other financial expenses 28 129Total 54,470 68,596
Financial income and expenses
Financial income and financial expenses comprise interest, costs of factoring, capital gains and losses on investments, balances and transactions in foreign currencies, amortisation of financial assets and liabilities, fair value adjustments of derivative financial instru-ments that do not qualify as hedge accounting as well as extra payments and repayment under the on-account taxation scheme, etc.
ROYAL UNIBREW ANNUAL REPORT 2015 77

Notes to Consolidated Income StatementNote 9 Tax on the profit for the year
tDKK 2015 2014
Tax on the taxable income for the year 197,559 208,968Adjustment of previous year -13,505 2,580Adjustment of deferred tax 1,803 -20,031Total 185,857 191,517 which breaks down as follows: Tax on profit for the year 190,879 176,439Tax on other comprehensive income 2,180 17,878Tax on changes in equity, shareholders -7,202 -2,800Total 185,857 191,517 Current Danish tax rate 23.5 24.5Adjustment of previous year -0.4 0.3Income from associates after tax -0.8 -1.0Effect on tax rate of permanent differences 0.3 0.1Changes to tax rates -0.6Differences in effective tax rates of foreign subsidiaries -1.5 -1.3Effective tax rate 21.1 22.0
Tax on the profit for the year
Tax for the year consists of current tax for the year and movements in deferred tax for the year. The tax attributable to the profit for the year is recognised in the income statement, whereas the tax attributable to equity entries is recognised directly in equity.
The Parent Company is jointly taxed with its Danish subsidiaries. The Danish current tax for the year is allocated to the jointly taxed Danish enterprises in proportion to their taxable incomes (full allocation with credit for tax losses).
Corporation tax
Current tax liabilities are recognised in the balance sheet as calculated tax on the expected taxable income for the year adjusted for tax on taxable incomes for previous years and for tax paid on account.
Note 10 Realised hedging transactions in the income statement
tDKK 2015 2014
Realised hedging transactions are included in the income statement as follows: Net revenue includes currency hedges of -13,821 -4,697Production costs include foreign currency and commodity hedges of -6,495 764Financial income and expenses include currency, commodity and interest rate hedges of -20,810 -15,941Total -41,126 -19,874
78 ANNUAL REPORT 2015 ROYAL UNIBREW

Notes to Consolidated Balance SheetNote 11 Intangible assets
Distribution Customer tDKK Goodwill Trademarks rights relations Total
Cost at 1 January 2015 1,451,828 1,236,779 234,498 67,595 2,990,700Exchange adjustment 3,948 3,422 565 172 8,107Cost at 31 December 2015 1,455,776 1,240,201 235,063 67,767 2,998,807 Amortisation and impairment losses at 1 January 2015 0 -3,438 -27,730 -18,285 -49,453Exchange adjustment -298 -46 -54 -398Amortisation for the year -2,990 -12,257 -13,547 -28,794Amortisation and impairment losses at 31 December 2015 0 -6,726 -40,033 -31,886 -78,645 Carrying amount at 31 December 2015 1,455,776 1,233,475 195,030 35,881 2,920,162
Cost at 1 January 2014 1,430,378 1,239,438 229,776 67,747 2,967,339Exchange adjustment -2,550 -2,659 -501 -152 -5,862Additions 24,000 24,000Additions on acquisition, see note 25 5,223 5,223Cost at 31 December 2014 1,451,828 1,236,779 234,498 67,595 2,990,700 Amortisation and impairment losses at 1 January 2014 0 -3,336 -15,184 -4,777 -23,297Amortisation for the year -102 139 33 70Disposals -12,685 -13,541 -26,226Amortisation and impairment losses at 31 December 2014 0 -3,438 -27,730 -18,285 -49,453 Carrying amount at 31 December 2014 1,451,828 1,233,341 206,768 49,310 2,941,247
Goodwill and trademarks
Goodwill and trademarks with indefinite useful lives relating to Hartwall (Finland) and to Cido and Kalnapilis (the Baltic countries) each represents more than 10% of the total value of goodwill and trademarks.
Goodwill
Goodwill is initially recognised in the balance sheet at cost. Subsequently, goodwill is measured at cost less accumulated impair-ment losses.
The carrying amount of goodwill is allocated to the Group's cash-generating units at the time of acquisition. The determination of cash-generating units is based on management structure and internal financial management.
Trademarks, distribution rights and customer relations
Trademarks, distribution rights and customer relations are initially recognised in the balance sheet at cost. Subsequently, they are measured at cost less accumulated amortisation and less any accumulated impairment losses. Trademarks, distribution rights and customer relations are amortised on a straight-line basis over their estimated useful lives.
Trademarks are not amortised as they are all well-established, old and profitable trademarks which customers are expected to continue demanding unabatedly, other things being equal, and which Management is not planning to stop selling and marketing.
Distribution rights are amortised on a straight-line basis over their estimated useful lives, maximum 20 years. Customer relations are amortised on a straigt-line basis over their estimated useful lives, maximum 5 years.
Goodwill and trademarks with indefinite useful lives are not amortised but are tested annually for impairment. It is the Group's strategy to maintain trademarks and their value.
ROYAL UNIBREW ANNUAL REPORT 2015 79

Notes to Consolidated Balance SheetNote 11 Intangible assets (continued)
Impairment test of goodwill and trademarksAs in 2014, the impairment test in 2015 did not give rise to recognising any impairment losses.
The carrying amount of goodwill and trademarks with indefinite useful lives at 31 December is related to the cash-generating op-erational units and breaks down as follows:
tDKK Goodwill Trademarks Total Share
2015 Western Europe 80,645 80,645 3%Baltic Sea* 1,366,892 1,233,475 2,600,367 97%Malt Beverages and Exports 8,239 8,239 0%Total 1,455,776 1,233,475 2,689,251 100%
* the most significant value relates to Finlandd The recoverable amount is based on value in use, which is calculated by means of expected net cash flows on the basis of budgets and forecasts for 2016-2018 approved by Management as well as estimated market driven discount rates and growth rates.
Only limited revenue growth is expected in the medium term as several of Royal Unibrew's markets are generally seeing minor structural declines in the total beverage market. The Baltic Sea segment is expected to see continuously declining consumption in Finland and stable consumption in the Baltic countries. Through increased focus on exploiting commercial opportunities and inno-vation, Royal Unibrew expects to be able to maintain its revenue at the current level in Finland and to realise limited revenue growth in the Baltic countries. Gross margins are assumed to remain stable at the current level through continued focus on continuous efficiency enhancement. The key assumptions underlying the calculation of recoverable amount are as indicated below.
Malt Western Beverages Europe Baltic Sea and Exports
Growth rate 2019-2022 1% 0-4% 0%Growth rate on terminal value 1% 1% 2%Discount rate (WACC) 7.3% 7.2-8.4% 18.9% The forecasted results approved by Management are based on previously achieved results and expected market developments, see above. The average growth rates applied are in accordance with Management's expectations taking into account industry conditions in the individual markets. The discount rates applied are before tax and reflect current specific risks in the individual market. In Baltic Sea, the lowest point of the range indicated for the discount rate relates to Finland. The assumptions applied by Management are inherently subject to uncertainty and unpredictability. Reasonably probable changes will not lead to recognition of impairment losses.
80 ANNUAL REPORT 2015 ROYAL UNIBREW

Notes to Consolidated Balance SheetNote 11 Intangible assets (continued)
tDKK Goodwill Trademarks Total Share
2014 Western Europe 80,645 2,990 83,635 3%North Eastern Europe (from 2014: Baltic Sea) 1,363,431 1,230,351 2,593,782 97%Malt Beverages and Exports 7,752 7,752 0%Total 1,451,828 1,233,341 2,685,169 100% The key assumptions underlying the calculation of recoverable amount in 2014 were:
Malt Western Beverages Europe Baltic Sea and Exports
Growth rate 2018-2021 1% 0-4% 0%Growth rate on terminal value 1% 1% 2%Discount rate (WACC) 7.9% 7.9-9.9% 18.9% The forecasted results approved by Management are based on previously achieved results and expected market developments, see above. The average growth rates applied are in accordance with Management's expectations taking into account industry conditions in the individual markets. The discount rates applied are before tax and reflect current specific risks in the individual market. In Baltic Sea, the lowest point of the range indicated for the discount rate relates to Finland. The assumptions applied by Management are inherently subject to uncertainty and unpredictability. Reasonably probable changes will not lead to recognition of impairment losses.
Impairment
The carrying amounts of intangible assets and property, plant and equipment are reviewed on an annual basis to determine whether impairment has incurred other than that expressed by normal amortisation and depreciation. If so, the asset is written down to the higher of net selling price and value in use. Goodwill and other assets for which a value in use cannot be determined as the asset does not on an individual basis generate future cash flows are reviewed for impairment together with the group of assets (cash-gen-erating units) to which they are attributable.
The carrying amount of goodwill and trademarks with indefinite useful lives is tested for impairment at least on an annual basis, together with the other non-current assets of the cash-generating unit to which goodwill has been allocated, and is written down to recoverable amount in the income statement if the carrying amount exceeds the recoverable amount.
The carrying amount of financial assets measured at cost or amortised cost is written down for impairment if, due to changed ex-pected net payments, the net present value is lower than the carrying amount.
Intangible assets
In relation to trademarks, Management makes an annual judgement to determine whether the current market situation has reduced the value or affected the useful life of the trademarks, including whether past estimates of indefinite useful lives may be maintained.
An annual impairment test is made of the values recognised in the Financial Statements of goodwill and trademarks assessed to have indefinite lives which are therefore not amortised. For a description of the discount rates and growth rates applied in connec-tion with the impairment test of goodwill and trademarks as well as other assumptions of the impairment test, reference is made to the above note.
ROYAL UNIBREW ANNUAL REPORT 2015 81
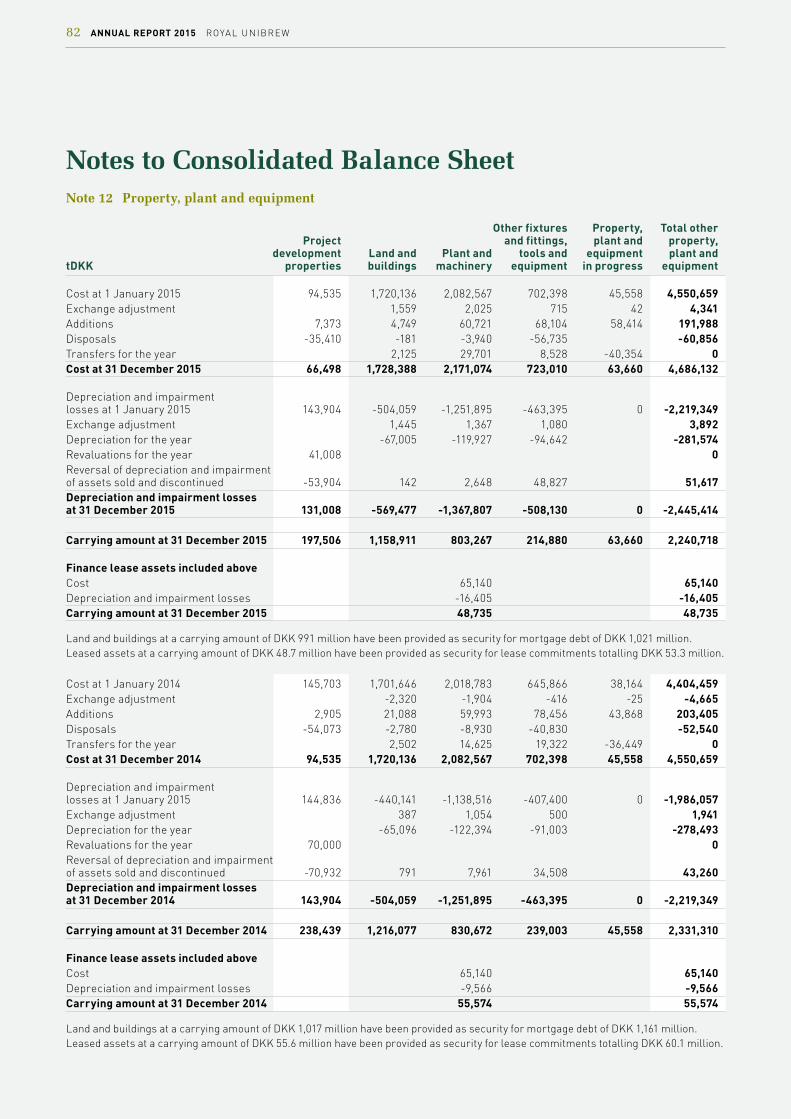
Notes to Consolidated Balance SheetNote 12 Property, plant and equipment
Other fixtures Property, Total other Project and fittings, plant and property, development Land and Plant and tools and equipment plant and tDKK properties buildings machinery equipment in progress equipment
Cost at 1 January 2015 94,535 1,720,136 2,082,567 702,398 45,558 4,550,659Exchange adjustment 1,559 2,025 715 42 4,341Additions 7,373 4,749 60,721 68,104 58,414 191,988Disposals -35,410 -181 -3,940 -56,735 -60,856Transfers for the year 2,125 29,701 8,528 -40,354 0Cost at 31 December 2015 66,498 1,728,388 2,171,074 723,010 63,660 4,686,132 Depreciation and impairment losses at 1 January 2015 143,904 -504,059 -1,251,895 -463,395 0 -2,219,349Exchange adjustment 1,445 1,367 1,080 3,892Depreciation for the year -67,005 -119,927 -94,642 -281,574Revaluations for the year 41,008 0Reversal of depreciation and impairment of assets sold and discontinued -53,904 142 2,648 48,827 51,617Depreciation and impairment losses at 31 December 2015 131,008 -569,477 -1,367,807 -508,130 0 -2,445,414 Carrying amount at 31 December 2015 197,506 1,158,911 803,267 214,880 63,660 2,240,718 Finance lease assets included above Cost 65,140 65,140Depreciation and impairment losses -16,405 -16,405Carrying amount at 31 December 2015 48,735 48,735
Land and buildings at a carrying amount of DKK 991 million have been provided as security for mortgage debt of DKK 1,021 million.Leased assets at a carrying amount of DKK 48.7 million have been provided as security for lease commitments totalling DKK 53.3 million.
Cost at 1 January 2014 145,703 1,701,646 2,018,783 645,866 38,164 4,404,459Exchange adjustment -2,320 -1,904 -416 -25 -4,665Additions 2,905 21,088 59,993 78,456 43,868 203,405Disposals -54,073 -2,780 -8,930 -40,830 -52,540Transfers for the year 2,502 14,625 19,322 -36,449 0Cost at 31 December 2014 94,535 1,720,136 2,082,567 702,398 45,558 4,550,659 Depreciation and impairment losses at 1 January 2015 144,836 -440,141 -1,138,516 -407,400 0 -1,986,057Exchange adjustment 387 1,054 500 1,941Depreciation for the year -65,096 -122,394 -91,003 -278,493Revaluations for the year 70,000 0Reversal of depreciation and impairment of assets sold and discontinued -70,932 791 7,961 34,508 43,260Depreciation and impairment losses at 31 December 2014 143,904 -504,059 -1,251,895 -463,395 0 -2,219,349 Carrying amount at 31 December 2014 238,439 1,216,077 830,672 239,003 45,558 2,331,310 Finance lease assets included above Cost 65,140 65,140Depreciation and impairment losses -9,566 -9,566Carrying amount at 31 December 2014 55,574 55,574
Land and buildings at a carrying amount of DKK 1,017 million have been provided as security for mortgage debt of DKK 1,161 million. Leased assets at a carrying amount of DKK 55.6 million have been provided as security for lease commitments totalling DKK 60.1 million.
82 ANNUAL REPORT 2015 ROYAL UNIBREW
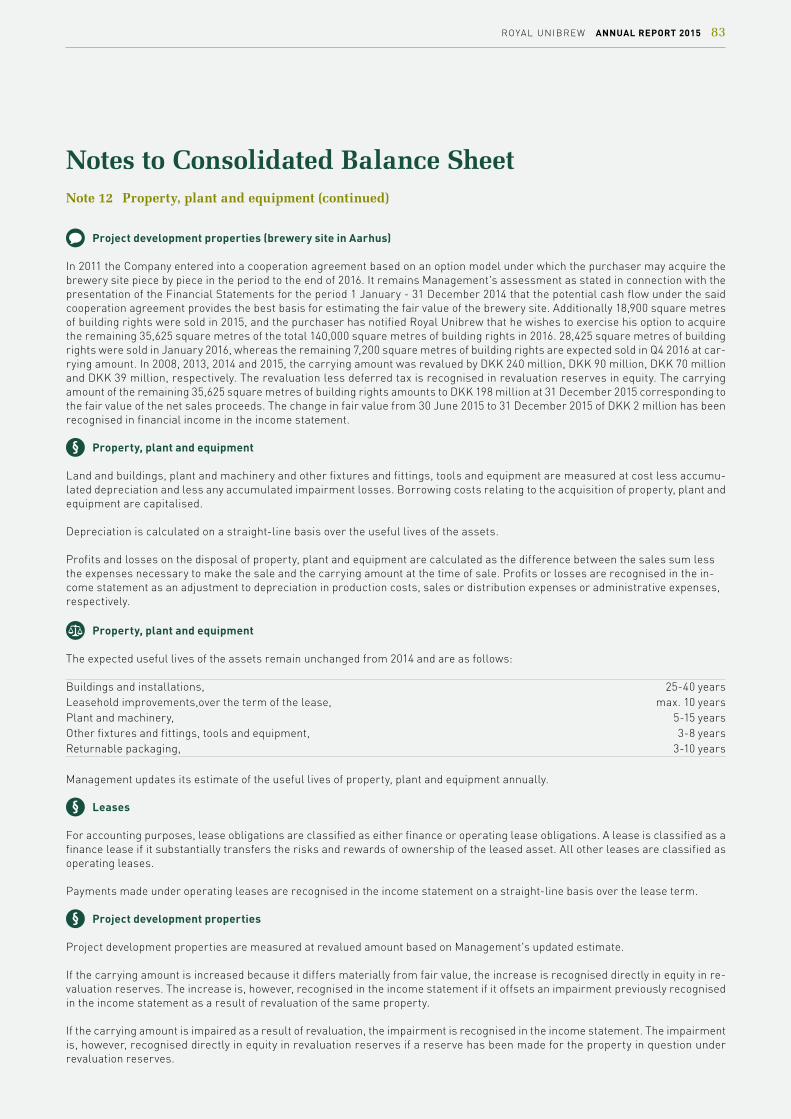
Notes to Consolidated Balance SheetNote 12 Property, plant and equipment (continued)
Project development properties (brewery site in Aarhus)
In 2011 the Company entered into a cooperation agreement based on an option model under which the purchaser may acquire the brewery site piece by piece in the period to the end of 2016. It remains Management's assessment as stated in connection with the presentation of the Financial Statements for the period 1 January - 31 December 2014 that the potential cash flow under the said cooperation agreement provides the best basis for estimating the fair value of the brewery site. Additionally 18,900 square metres of building rights were sold in 2015, and the purchaser has notified Royal Unibrew that he wishes to exercise his option to acquire the remaining 35,625 square metres of the total 140,000 square metres of building rights in 2016. 28,425 square metres of building rights were sold in January 2016, whereas the remaining 7,200 square metres of building rights are expected sold in Q4 2016 at car-rying amount. In 2008, 2013, 2014 and 2015, the carrying amount was revalued by DKK 240 million, DKK 90 million, DKK 70 million and DKK 39 million, respectively. The revaluation less deferred tax is recognised in revaluation reserves in equity. The carrying amount of the remaining 35,625 square metres of building rights amounts to DKK 198 million at 31 December 2015 corresponding to the fair value of the net sales proceeds. The change in fair value from 30 June 2015 to 31 December 2015 of DKK 2 million has been recognised in financial income in the income statement.
Property, plant and equipment
Land and buildings, plant and machinery and other fixtures and fittings, tools and equipment are measured at cost less accumu-lated depreciation and less any accumulated impairment losses. Borrowing costs relating to the acquisition of property, plant and equipment are capitalised.
Depreciation is calculated on a straight-line basis over the useful lives of the assets.
Profits and losses on the disposal of property, plant and equipment are calculated as the difference between the sales sum less the expenses necessary to make the sale and the carrying amount at the time of sale. Profits or losses are recognised in the in-come statement as an adjustment to depreciation in production costs, sales or distribution expenses or administrative expenses, respectively.
Property, plant and equipment
The expected useful lives of the assets remain unchanged from 2014 and are as follows:
Buildings and installations, 25-40 yearsLeasehold improvements, over the term of the lease, max. 10 yearsPlant and machinery, 5-15 yearsOther fixtures and fittings, tools and equipment, 3-8 yearsReturnable packaging, 3-10 years
Management updates its estimate of the useful lives of property, plant and equipment annually.
Leases
For accounting purposes, lease obligations are classified as either finance or operating lease obligations. A lease is classified as a finance lease if it substantially transfers the risks and rewards of ownership of the leased asset. All other leases are classified as operating leases.
Payments made under operating leases are recognised in the income statement on a straight-line basis over the lease term.
Project development properties
Project development properties are measured at revalued amount based on Management's updated estimate.
If the carrying amount is increased because it differs materially from fair value, the increase is recognised directly in equity in re-valuation reserves. The increase is, however, recognised in the income statement if it offsets an impairment previously recognised in the income statement as a result of revaluation of the same property.
If the carrying amount is impaired as a result of revaluation, the impairment is recognised in the income statement. The impairment is, however, recognised directly in equity in revaluation reserves if a reserve has been made for the property in question under revaluation reserves.
ROYAL UNIBREW ANNUAL REPORT 2015 83

Notes to Consolidated Balance Sheet
Project development properties
With a view to ensuring adequate disclosure of the value of the brewery site in Aarhus, Management has chosen to apply the ex-emption provision of IAS 16 which allows separate recognition of an item of property, plant and equipment as well as revaluation of the asset to fair value.
Recognition of project development properties
In connection with estimating whether project development properties should be revalued, Management has also in 2015 based its esti-mate of the fair value on a calculation of the present value of the cash flows expected to be generated under the agreements entered into.
The key elements of the calculation of the fair value of the brewery site are estimated selling prices and milestone dates under the cooperation agreement, estimated costs up until the date of sale (property taxes, project and selling costs) and the discount rate. The fair value measurement is classified in level 3 of the fair value hierarchy. At 31 December 2015, Management estimates the fair value per square metre of building rights at nominally approx DKK 5,500 (2014: DKK 5,000) based on average sales proceeds (selling price less costs), an average vacancy period of below 1 year (2014: 1-2 years) and a discount rate of 2% (2014: 6.5%) for the 35,625 square metres of building rights comprised by the unsold part of the site according to the existing local plan.
As the acquisition dates and selling price have been agreed in connection with the purchaser's notification of his wish to exercise his purchase option, the timing is not assessed to be subject to uncertainty; therefore, the currently estimated fair value is not expected to differ materially, as a result of this, from carrying amount at 31 December 2015.
Note 12 Property, plant and equipment (continued)
Note 13 Investments in associates Investments in tDKK associates
Cost at 1 January 2015 43,066Reclassification, beginning of year 32,682Cost at 31 December 2015 75,748 Value adjustments at 1 January 2015 93,183Reclassification, beginning of year -32,682Exchange adjustment -5,178Dividend, net -26,660Share of profit for the year 31,061Other comprehensive income -101Value adjustments at 31 December 2015 59,623 Carrying amount at 31 December 2015 135,371 Cost at 1 January 2014 44,688Exchange adjustment -1,622Cost at 31 December 2014 43,066 Value adjustments at 1 January 2014 87,835Exchange adjustment -5,648Dividend, net -24,345Share of profit for the year 34,808Other comprehensive income 533Value adjustments at 31 December 2014 93,183 Carrying amount at 31 December 2014 136,249
84 ANNUAL REPORT 2015 ROYAL UNIBREW

Notes to Consolidated Balance SheetNote 13 Investments in associates (continued)
Financial disclosures on associates
Financial disclosures are provided on an aggregated basis for all associates as none of Royal Unibrew's shares of net revenue or balance sheet total constitute more than 5% in proportion to the Consolidated Financial Statements; therefore, it is not considered essential to provide disclosures separately for each associate.
Royal Unibrew's share of:
tDKK 2015 2014
Profit from continuing operations for the year 31,061 34,808Other comprehensive income -101 533Comprehensive income 30,960 35,341 Total carrying amount at 31 December of the Group's total investments in associates, share of equity 135,371 136,249
Investments in associates in the Consolidated Financial Statements
Investments in associates are measured in the balance sheet at the proportionate share of the net asset value of the enterprises calculated under the accounting policies of the Group with deduction or addition of the proportionate share of unrealised intercom-pany profits and losses and with addition of the carrying amount of goodwill.
Associates with a negative net asset value are measured at DKK 0. If the Group has a legal or constructive obligation to cover the negative balance of the associate, this obligation is recognised in liabilities.
The proportionate share of the results of associates is recognised in the income statement of the Group after adjusting for impair-ment losses on goodwill and eliminating the proportionate share of unrealised intercompany gains and losses.
ROYAL UNIBREW ANNUAL REPORT 2015 85

Notes to Consolidated Balance SheetNote 14 Other fixed asset investments
Total other Other Other fixed asset t.DKK investments receivables investments
Cost at 1 January 2015 66,704 2,682 69,386Exchange adjustment 1,004 18 1,022Additions 1,762 1,762Disposals -8,729 -77 -8,806Cost at 31 December 2015 58,979 4,385 63,364 Value adjustments at 1 January 2015 -52,255 -363 -52,618Exchange adjustment -973 -1 -974Disposals 1,715 1,715Revaluations and impairment losses for the year 238 238Value adjustments at 31 December 2015 -51,275 -364 -51,639 Carrying amount at 31 December 2015 7,704 4,021 11,725 Cost at 1 January 2014 68,503 8,718 77,221Exchange adjustment -1,799 94 -1,705Disposals -6,130 -6,130Cost at 31 December 2014 66,704 2,682 69,386 Value adjustments at 1 January 2014 -52,772 -364 -53,136Exchange adjustment 1,770 1 1,771Revaluations and impairment losses for the year -1,253 -1,253Value adjustments at 31 December 2014 -52,255 -363 -52,618 Carrying amount at 31 December 2014 14,449 2,319 16,768
Other investments
Other investments not included in the Group's trading portfolio (available for sale) are recognised in non-current assets at fair value at the trading date and are subsequently measured at fair value equal to the market price as regards listed securities and at estimated fair value calculated on the basis of market data and recognised valuation methods as regards unlisted securities. Unre-alised value adjustments are recognised in other comprehensive income except for impairment losses and reversal of impairment losses which are recognised in financial income and expenses in the income statement. Upon realisation, the accumulated value adjustment recognised in other comprehensive income is transferred to financial income and expenses in the income statement. Other investments may be classified as level-3 instruments.
Other receivables
Other receivables under fixed asset investments held to maturity are initially recognised at fair value and are subsequently measured at amortised cost or an estimated lower value at the balance sheet date.
Other investments
In connection with the presentation of the Financial Statements for 2011, Management estimated the fair value of its investments in the Polish brewery company Perla Browary Lubelskie at DKK 0 due to governance issues. Since 2011, Management has maintained its fair value estimate of DKK 0 as these issues have not subsequently been resolved. The fair value measurement of the investments in Perla Browary Lubelskie is classified in level 3 of the fair value hierarchy.
86 ANNUAL REPORT 2015 ROYAL UNIBREW
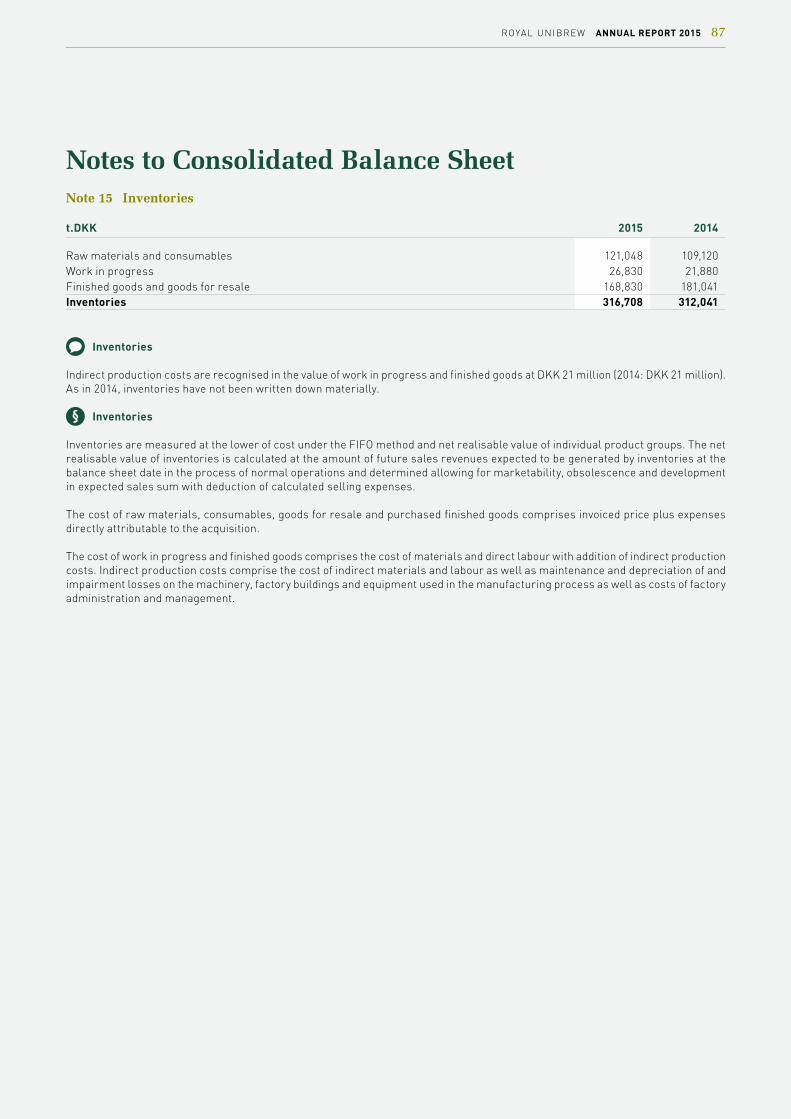
Notes to Consolidated Balance SheetNote 15 Inventories
t.DKK 2015 2014
Raw materials and consumables 121,048 109,120Work in progress 26,830 21,880Finished goods and goods for resale 168,830 181,041Inventories 316,708 312,041
Inventories
Indirect production costs are recognised in the value of work in progress and finished goods at DKK 21 million (2014: DKK 21 million). As in 2014, inventories have not been written down materially.
Inventories
Inventories are measured at the lower of cost under the FIFO method and net realisable value of individual product groups. The net realisable value of inventories is calculated at the amount of future sales revenues expected to be generated by inventories at the balance sheet date in the process of normal operations and determined allowing for marketability, obsolescence and development in expected sales sum with deduction of calculated selling expenses.
The cost of raw materials, consumables, goods for resale and purchased finished goods comprises invoiced price plus expenses directly attributable to the acquisition.
The cost of work in progress and finished goods comprises the cost of materials and direct labour with addition of indirect production costs. Indirect production costs comprise the cost of indirect materials and labour as well as maintenance and depreciation of and impairment losses on the machinery, factory buildings and equipment used in the manufacturing process as well as costs of factory administration and management.
ROYAL UNIBREW ANNUAL REPORT 2015 87

Notes to Consolidated Balance Sheet
tDKK 2015 2014
Trade receivables 516,953 473,569Other receivables 53,485 62,751Receivables 570,438 536,320 The total receivables belong to the category "assets measured at amortised cost".
Trade receivables fall due as follows:
tDKK 2015 2014
Not due 424,746 410,077 Due: From 1-15 days 86,998 65,036 From 16-90 days 12,981 7,636 More than 90 days 19,221 119,200 21,473 94,145 Provisions for bad debts, not due -6,202 -9,080 Provisions for bad debts, 1-15 days -535 -543 Provisions for bad debts, 16-90 days -1,599 -2,098 Provisions for bad debts, more than 90 days -18,657 -26,993 -18,932 -30,653Total 516,953 473,569 Provisions for bad debts, beginning of year -30,653 -30,334Bad debts realised during the year 3,669 9,773Provision for the year -9 -10,092Total -26,993 -30,653 Current receivables, other than trade receivables, all fall due for payment in 2016.
Receivables
Receivables are initially measured at cost and are subsequently measured at amortised cost or an estimated lower value at the balance sheet date. This lower value is calculated where there is an objective indication that an individual receivable or a portfolio of receivables has been impaired.
Receivables with no objective indication of impairment on an individual basis are assessed for objective indication of impairment on a portfolio basis. The portfolios are primarily based on the debtors' registered offices and credit rating in accordance with the Group's policy for credit risk management. The objective indicators used in connection with portfolios are determined based on Management's assessment and knowledge of the individual portfolios.
If there is an objective indication of impairment of a portfolio, an impairment test is made in connection with which the expected future cash flows are estimated based on the historical loss record adjusted for current market conditions and individual factors relating to the portfolio in question.
Write-downs are calculated as the difference between the carrying amount of the receivable and the present value of the expected cash flows, including the realisable value of any collateral received.
Trade receivables
Receivables are written down on the basis of an individual assessment of the loss risk relating to the receivables or groups of re-ceivables, including their maturity profiles and the current credit standing of the debtors.
Note 16 Receivables
88 ANNUAL REPORT 2015 ROYAL UNIBREW

Notes to Consolidated Balance SheetNote 17 Prepayments
tDKK 2015 2014
Prepayments 21,714 20,011
Prepayments
Prepayments recognised in assets comprise expenses incurred in respect of subsequent financial years.
Note 18 Equity and basis of earnings/cash flow per share
Treasury shares held by the Parent Company:
tDKK Number Nom. value % of capital
Portfolio at 1 January 2015 300,000 600 0.5Acqusition for share buy-back programme 1,192,118 2,384 2.1Portfolio at 31 December 2015 1,492,118 2,984 2.7 Portfolio at 1 January 2014 300,000 600 0.5Portfolio at 31 December 2014 300,000 600 0.5 The Group holds no other treasury shares. 300,000 of the treasury shares has been acquired for a bonus scheme, while the residual number of shares relates to the share buy-back programme.
Basis of calculation of earnings and cash flow per share 2015 2014
The Parent Company shareholders' share of profit for the year amounts to (DKK '000) 711,427 624,165Cash flow from operating activities 1,159,777 895,441The average number of treasury shares amounted to (number, DKK 2 each) 777,421 300,000The average number of shares in circulation amounted to (number) 54,715,079 55,192,500The average number of shares in circulation incl restricted shares amounted to (number) 55,015,079 55,492,500
Equity/Proposed dividend
Dividend is recognised as a liability at the time of adoption at the Annual General Meeting. Dividend distribution for the year proposed by Management is disclosed as a separate equity item.
Treasury shares
Treasury shares acquired by the Parent Company or subsidiaries are recognised at cost directly in equity under retained earnings. Where treasury shares are subsequently sold, any consideration is also recognised directly in equity. Dividend on treasury shares is recognised directly in equity under retained earnings.
Share premium account
Share premium account comprises amounts in excess of the nominal share capital paid up by shareholders in connection with capital increases.
ROYAL UNIBREW ANNUAL REPORT 2015 89

Notes to Consolidated Balance SheetNote 18 Equity and basis of earnings/cash flow per share (continued)
Revaluation reserves
Revaluation reserves comprise value adjustment of assets from cost to an estimated permanently higher fair value. Revaluation reserves are transferred to retained earnings when the revalued asset is realised.
Translation reserve
The translation reserve in the Consolidated Financial Statements comprises exchange adjustments arising on the translation of the Financial Statements of foreign enterprises from their functional currencies into the presentation currency of the Group (DKK).
Upon full or part realisation of the net investment in the foreign enterprises, exchange adjustments are recognised in the income statement.
The translation reserve was reset at 1 January 2004 in accordance with IFRS 1.
Hedging reserve
The hedging reserve comprises changes to fair values of derivative financial instruments that are designated and qualify as cash flow hedges.
On realisation, the hedging instrument is recognised in the income statement in the same item as the hedged transaction.
Note 19 Deferred tax
tDKK 2015 2014
Deferred tax at 1 January 431,774 457,571Additions on acquisition -6,000Change in deferred tax for the year -1,093 -9,469Change sale of project development property -56,020 -24,500Exchange adjustment 710 -1,201Changes to tax rates -5,000Adjustment of previous year -2.161 1,435Deferred tax at 31 December 375,396 431,774 Expected realisation within 1 year 33,957 14,239 Deferred tax relates to: Intangible assets 264,274 267,952Property, plant and equipment 157,767 185,583Current assets 20,002 -161Non current liabilities -15,922 -5,800Current liabilities -50,725 -15,800Total 375,396 431,774 The utilisation of unutilised tax losses in one of the Group's foreign enterprises is not certain. Therefore, the tax asset corresponding to approx DKK 2.4 million (2014: approx DKK 2.5 million) has not been capitalised.
90 ANNUAL REPORT 2015 ROYAL UNIBREW

Notes to Consolidated Balance SheetNote 19 Deferred tax (continued)
Deferred tax
Deferred tax is recognised in respect of all temporary differences between the carrying amounts and the tax base of assets and liabilities except for temporary differences arising at the time of acquisition that do not affect the profit for the year or the taxable income and temporary differences concerning goodwill. In cases where the computation of the tax base may be made according to alternative tax rules, deferred tax is measured on the basis of the intended use of the asset or settlement of the liability, respectively.
Deferred tax assets are recognised at the value at which they are expected to be realised, either by elimination in tax on future earnings or by set-off against deferred tax liabilities.
Deferred tax is measured on the basis of the tax rules and tax rates expected under the legislation at the balance sheet date to be effective when the deferred tax crystallises as current tax.
In the balance sheet, set-off is made between deferred tax assets and deferred tax liabilities within the same legal tax entity and jurisdiction.
Deferred tax
Deferred tax assets, including the value of tax losses that may be carried forward for set-off against positive taxable incomes in future years, are recognised if, in Management's judgement, the possibility hereof exists. The judgement is made annually.
Note 20 Other current payables
tDKK 2015 2014
VAT, excise duties, etc 457,645 339,481Other payables 397,824 399,848Repurchase obligation, returnable packaging 129,750 132,942Total other current payables 985,219 872,271 Repurchase obligation, returnable packaging is specified as follows: Balance at 1 January 132,942 103,938Additions on acquisition 30,000Adjustment for the year -3,192 -996Balance at 31 December 129,750 132,942
The change in the repurchase obligation for the year reflects net sales of returnable packaging for the year less estimated wastage of returnable packaging in circulation.
Repurchase obligation relating to packaging in circulation
Plastic crates, bottles and kegs in circulation and held in inventory are recognised in property, plant and equipment, and the obligation to repurchase returnable packaging in circulation for which a deposit has been paid is recognised in provisions.
Repurchase obligation relating to packaging in circulation
The repurchase obligation relating to packaging in circulation is calculated on the basis of the estimated total packaging volume less packaging held in inventory.
ROYAL UNIBREW ANNUAL REPORT 2015 91
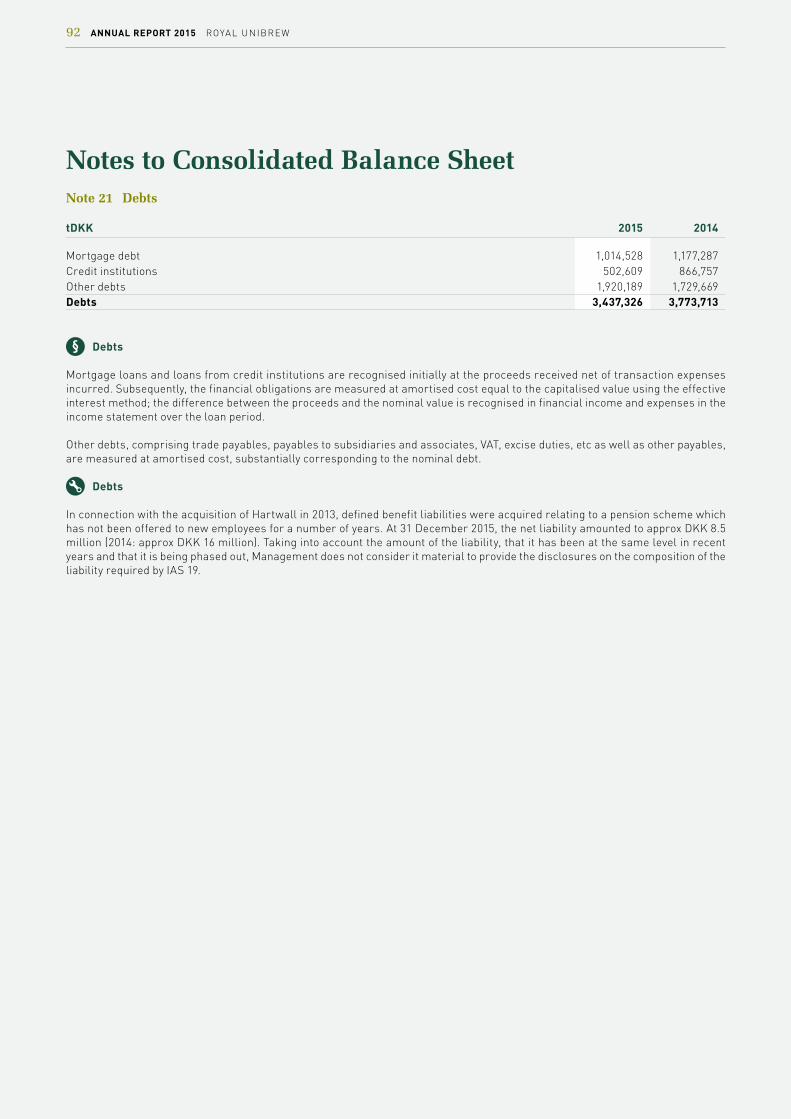
Notes to Consolidated Balance SheetNote 21 Debts
tDKK 2015 2014
Mortgage debt 1,014,528 1,177,287 Credit institutions 502,609 866,757 Other debts 1,920,189 1,729,669 Debts 3,437,326 3,773,713
Debts
Mortgage loans and loans from credit institutions are recognised initially at the proceeds received net of transaction expenses incurred. Subsequently, the financial obligations are measured at amortised cost equal to the capitalised value using the effective interest method; the difference between the proceeds and the nominal value is recognised in financial income and expenses in the income statement over the loan period.
Other debts, comprising trade payables, payables to subsidiaries and associates, VAT, excise duties, etc as well as other payables, are measured at amortised cost, substantially corresponding to the nominal debt.
Debts
In connection with the acquisition of Hartwall in 2013, defined benefit liabilities were acquired relating to a pension scheme which has not been offered to new employees for a number of years. At 31 December 2015, the net liability amounted to approx DKK 8.5 million (2014: approx DKK 16 million). Taking into account the amount of the liability, that it has been at the same level in recent years and that it is being phased out, Management does not consider it material to provide the disclosures on the composition of the liability required by IAS 19.
92 ANNUAL REPORT 2015 ROYAL UNIBREW

Notes to Consolidated Cash Flow StatementNote 22 Cash Flow Statement
Adjustments for non-cash operating items:
tDKK 2015 2014
Dividends received from associates Financial income -8,759 -8,174Financial expenses 54,470 68,596Amortisation, depreciation and impairment of intangible assets and property, plant and equipment 310,368 304,719Tax on the profit for the year 190,879 176,439Income from investments in associates -31,061 -34,808Profit and loss from sale of property, plant and equipment -2,047 -995Share-based payments and remuneration 9,900 9,900Total 523,750 515,677
Cash flow statement
The consolidated cash flow statement is presented under the indirect method based on the net profit for the year. The statement shows cash flows for the year, changes for the year in cash and cash equivalents as well as the Group’s cash and cash equivalents at the beginning and end of the year.
Cash flows from operating activities are calculated as the net profit/loss for the year adjusted for non-cash operating items, changes in working capital, financial income and financial expenses, and corporation tax paid.
Cash flows from investing activities comprise acquisitions and disposals of property, plant and equipment and fixed asset investments as well as dividend received from associates. Cost is measured inclusive of expenses necessary to make the acquisition and sales prices after deduction of transaction expenses.
Cash flows from financing activities comprise changes to the amount or composition of the Group’s share capital, payment of dividend as well as borrowing and repayment of interest-bearing debt.
Cash and cash equivalents include securities with a maturity of less than 3 months that can readily be turned into cash and are only subject to an insignificant risk of value changes.
ROYAL UNIBREW ANNUAL REPORT 2015 93

Other notes to Consolidated Annual ReportNote 23 Contingent liabilities, security and other liabilities
mDKK 2015 2014
Rental and operating lease commitmentsTotal future payments: Within 1 year 47.0 48.4 Between 1 and 5 years 91.0 89.3 Beyond 5 years 8.5 7.7 Total 146.5 145.4 Rental and operating lease commitments relate to properties and operating equipment, including cars and IT equipment.
Third-party guarantees 12.1 11.0 Finance lease commitments Total future payments: Within 1 year 8.1 7.9 Between 1 and 5 years 45.3 53.5 Total 53.4 61.4 The finance lease commitments relate to finance leases of plant and machinery.
SecurityNo security has been provided in respect of loan agreements with credit institutions. As regards security for loan agreements with mortgage credit institutes, reference is made to note 12.
Contingent liabilities The outcome of pending legal actions is not expected to have any material impact on the financial position of the Group.
94 ANNUAL REPORT 2015 ROYAL UNIBREW
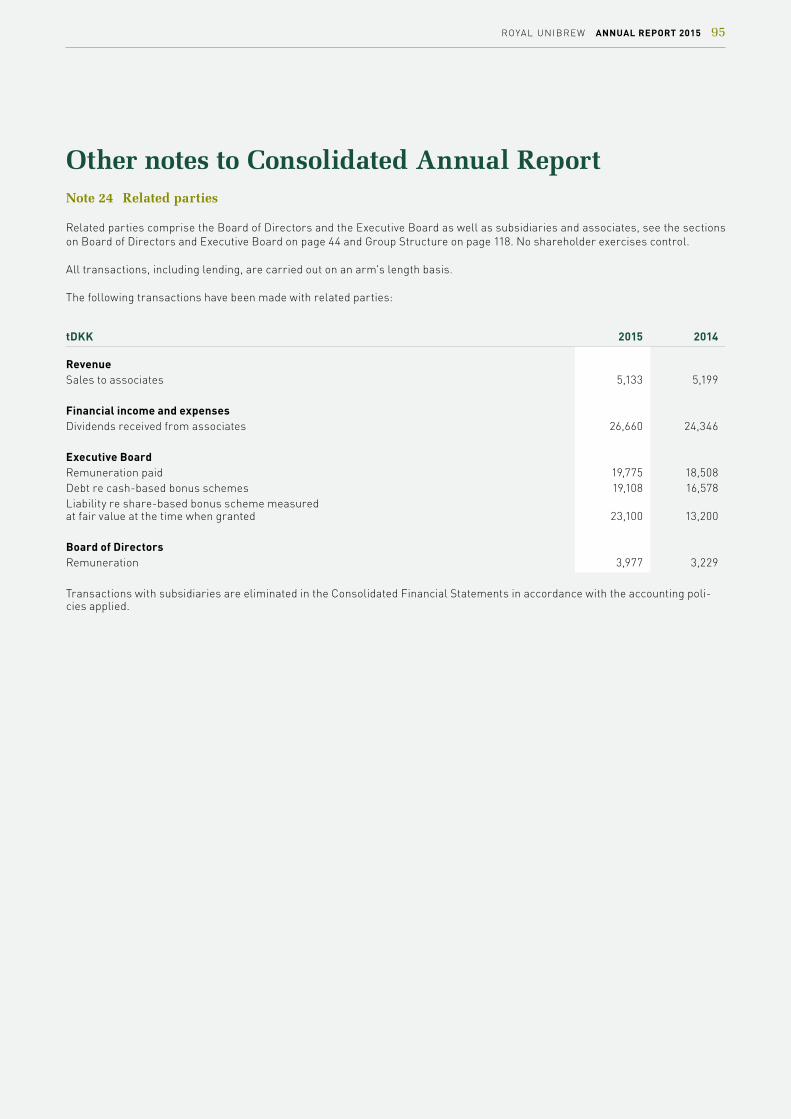
Other notes to Consolidated Annual ReportNote 24 Related parties
Related parties comprise the Board of Directors and the Executive Board as well as subsidiaries and associates, see the sections on Board of Directors and Executive Board on page 44 and Group Structure on page 118. No shareholder exercises control.
All transactions, including lending, are carried out on an arm's length basis.
The following transactions have been made with related parties:
tDKK 2015 2014
Revenue Sales to associates 5,133 5,199 Financial income and expenses Dividends received from associates 26,660 24,346 Executive Board Remuneration paid 19,775 18,508Debt re cash-based bonus schemes 19,108 16,578Liability re share-based bonus scheme measured at fair value at the time when granted 23,100 13,200 Board of Directors Remuneration 3,977 3,229
Transactions with subsidiaries are eliminated in the Consolidated Financial Statements in accordance with the accounting poli-cies applied.
ROYAL UNIBREW ANNUAL REPORT 2015 95

Parent Company Annual Report

Contents, Parent Company Annual Report Page
Income Statement 109
Statement of Comprehensive Income 109
Assets 110
Liabilities and Equity 110
Cash Flow Statement 111
Statement of Changes in Equity 112
Notes
Descriptive notes1 Basis of preparation 113-114
2 Financial risk management 115
Notes referring to Income Statement, Balance Sheet and Cash Flow Statement
3 Staff expenses 116
4 Expenses broken down by type 117
5 Financial income 118
6 Financial expenses 118
7 Tax on the profit for the year 119
8 Realised hedging transactions 120
9 Intangible assets 121
10 Property, plant and equipment 122
11 Investments in subsidiaries and associates 123
12 Receivables from subsidiaries and other fixed asset investments 124
13 Inventories 125
14 Receivables 125
15 Share capital 125
16 Deferred tax 126
17 Other current payables 126
18 Cash Flow Statement 127
Other notes19 Contingent liabilities and security 128
20 Related parties 129
PARENT COMPANY ROYAL UNIBREW ANNUAL REPORT 2015 97
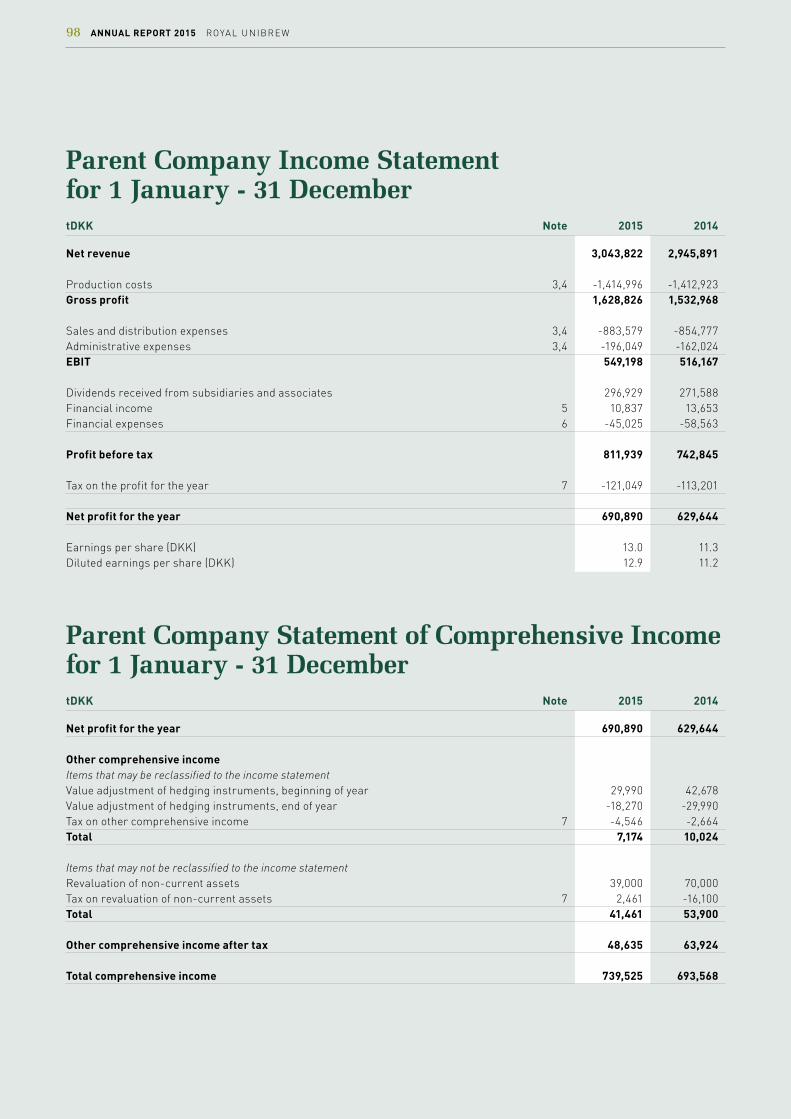
Parent Company Income Statement for 1 January - 31 DecembertDKK Note 2015 2014
Net revenue 3,043,822 2,945,891 Production costs 3,4 -1,414,996 -1,412,923Gross profit 1,628,826 1,532,968 Sales and distribution expenses 3,4 -883,579 -854,777Administrative expenses 3,4 -196,049 -162,024EBIT 549,198 516,167 Dividends received from subsidiaries and associates 296,929 271,588Financial income 5 10,837 13,653Financial expenses 6 -45,025 -58,563 Profit before tax 811,939 742,845 Tax on the profit for the year 7 -121,049 -113,201 Net profit for the year 690,890 629,644 Earnings per share (DKK) 13.0 11.3Diluted earnings per share (DKK) 12.9 11.2
Parent Company Statement of Comprehensive Income for 1 January - 31 DecembertDKK Note 2015 2014
Net profit for the year 690,890 629,644 Other comprehensive income Items that may be reclassified to the income statement Value adjustment of hedging instruments, beginning of year 29,990 42,678Value adjustment of hedging instruments, end of year -18,270 -29,990Tax on other comprehensive income 7 -4,546 -2,664Total 7,174 10,024 Items that may not be reclassified to the income statement Revaluation of non-current assets 39,000 70,000Tax on revaluation of non-current assets 7 2,461 -16,100Total 41,461 53,900 Other comprehensive income after tax 48,635 63,924 Total comprehensive income 739,525 693,568
98 ANNUAL REPORT 2015 ROYAL UNIBREW

Parent Company Balance SheettDKK Note 2015 2014
ASSETS AT 31 DECEMBER
NON-CURRENT ASSETS Intangible assets 9 80,697 83,744Project development properties 10 197,506 238,439Other property, plant and equipment 10 841,121 849,801Investments in associates 11 77,374 77,374Investments in subsidiaries 11 3,484,365 3,484,159Receivables from subsidiaries 12 164,125 163,709Other fixed asset investments 12 6,574 4,642Non-current assets 4,851,762 4,901,868 CURRENT ASSETS Inventories 13 123,049 115,029Receivables 14 253,740 221,026Receivables from subsidiaries 85,928 102,320Corporation tax 1,069 25Prepayments 19,185 18,238Cash at bank and in hand 8,865 53,628Current assets 491,836 510,266 Assets 5,343,598 5,412,134
LIABILITIES AND EQUITY AT 31 DECEMBER EQUITY Share capital 15 110,985 110,985Other reserves 939,769 952,465Retained earnings 1,603,943 1,523,322Proposed dividend 399,546 377,349Equity 3,054,243 2,964,121 LIABILITIES NON-CURRENT LIABILITIES Deferred tax 16 95,991 151,852Mortgage debt 2 720,979 733,672Credit institutions 2 416,412 806,076Other payables 14,164 24,713Non-current liabilities 1,247,546 1,716,313 CURRENT LIABILITIES Mortgage debt 2 14,203 14,106Credit institutions 2 32,877 5Trade payables 325,754 341,032Payables to subsidiaries 363,312 111,466Other current payables 17 305,663 265,091Current liabilities 1,041,809 731,700 Liabilities 2,289,355 2,448,013 Liabilities and equity 5,343,598 5,412,134
ROYAL UNIBREW ANNUAL REPORT 2015 99
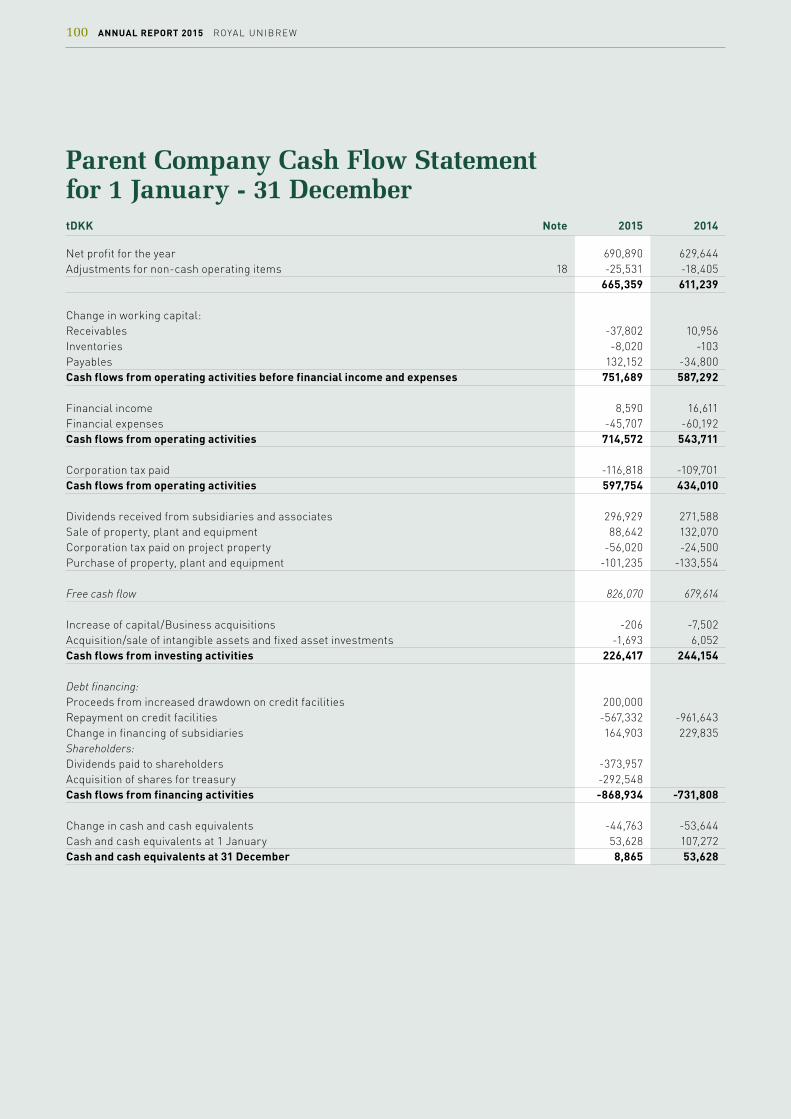
Parent Company Cash Flow Statement for 1 January - 31 December tDKK Note 2015 2014
Net profit for the year 690,890 629,644Adjustments for non-cash operating items 18 -25,531 -18,405 665,359 611,239
Change in working capital: Receivables -37,802 10,956Inventories -8,020 -103Payables 132,152 -34,800Cash flows from operating activities before financial income and expenses 751,689 587,292 Financial income 8,590 16,611Financial expenses -45,707 -60,192Cash flows from operating activities 714,572 543,711 Corporation tax paid -116,818 -109,701Cash flows from operating activities 597,754 434,010 Dividends received from subsidiaries and associates 296,929 271,588Sale of property, plant and equipment 88,642 132,070Corporation tax paid on project property -56,020 -24,500Purchase of property, plant and equipment -101,235 -133,554 Free cash flow 826,070 679,614 Increase of capital/Business acquisitions -206 -7,502Acquisition/sale of intangible assets and fixed asset investments -1,693 6,052Cash flows from investing activities 226,417 244,154 Debt financing: Proceeds from increased drawdown on credit facilities 200,000 Repayment on credit facilities -567,332 -961,643Change in financing of subsidiaries 164,903 229,835Shareholders: Dividends paid to shareholders -373,957 Acquisition of shares for treasury -292,548 Cash flows from financing activities -868,934 -731,808 Change in cash and cash equivalents -44,763 -53,644Cash and cash equivalents at 1 January 53,628 107,272Cash and cash equivalents at 31 December 8,865 53,628
100 ANNUAL REPORT 2015 ROYAL UNIBREW

Parent Company Statement of Changes in Equity for 1 January - 31 December Proposed Share Reva- Total dividend Share premium luation Hedging other Retained for DKK '000 capital account reserves reserve reserves earnings the year Total
Equity at 31 December 2014 110,985 855,839 126,616 -29,990 952,465 1,523,322 377,349 2,964,121
Changes in equity in 2015
Profit for the year 690,890 690,890
Other comprehensive income 39,000 11,720 50,720 -4,546 46,174
Tax on other comprehensive income 2,461 2,461 2,461
Revaluation reserves realised -65,877 -65,877 65,877 0
Total comprehensive income 0 0 -24,416 11,720 -12,696 752,221 0 739,525
Dividends paid to shareholders -373,957 -373,957
Dividend on treasury shares 3,392 -3,392 0
Acquisition of shares for treasury -292,548 -292,548
Share-based payments 9,900 9,900
Tax on changes in equity, shareholders 7,202 7,202
Proposed dividend -399,546 399,546 0
Total shareholders 0 0 0 0 0 -671,600 22,197 -649,403
Total changes in equity in 2015 0 0 -24,416 11,720 -12,696 80,621 22,197 90,122
Equity at 31 December 2015 110,985 855,839 102,200 -18,270 939,769 1,603,943 399,546 3,054,243 Share premium account, hedging reserve and retained earnings may be applied for distribution of dividend to the Parent Company shareholders. The share capital at 31 December 2015 amounts to DKK 110,985,000 and is distributed on shares of DKK 2 each. Proposed dividend for the year is DKK 7.40 per share.
Equity at 31 December 2013 110,985 855,839 136,505 -42,678 949,666 1,197,202 0 2,257,853
Changes in equity in 2014
Profit for the year 0 629,644 629,644
Other comprehensive income 53,900 12,688 66,588 -2,664 63,924
Revaluation reserves realised -63,789 -63,789 63,789 0
Total comprehensive income 0 0 -9,889 12,688 2,799 690,769 0 693,568
Share-based payments 0 9,900 9,900
Tax on changes in equity, shareholders 0 2,800 0 2,800
Proposed dividend 0 -377,349 377,349 0
Total shareholders 0 0 0 0 0 -364,649 377,349 12,700
Total changes in equity in 2014 0 0 -9,889 12,688 2,799 326,120 377,349 706,268
Equity at 31 December 2014 110,985 855,839 126,616 -29,990 952,465 1,523,322 377,349 2,964,121
ROYAL UNIBREW ANNUAL REPORT 2015 101

Descriptive notes to Parent Company Annual ReportNote 1 Basis of preparation of Parent Company
BASIS OF PREPARATION
Significant accounting policies
The Parent Company's accounting pol-icies remain unchanged from last year.
Significant accounting policies are iden-tical to those applied by the Royal Uni-brew Group except for those mentioned below.
Translation policiesExchange adjustment of balances regard-ed as part of the total net investment in enterprises with another functional cur-rency than DKK is recognised in financial income and expenses in the Parent Com-pany income statement.
Dividend on investments in subsidiaries and associates is recognised in the Parent Company income statement in the finan-cial year in which dividend is declared.
New and amended standards and interpre-tations that have taken effectReference is made to note 1 to the Consolidated Financial Statements.
Critical judgements and accounting estimatesIn connection with the preparation of the Parent Company and Consolidated Fi-nancial Statements, Management makes estimates and judgements as to how rec-ognition and measurement of assets and liabilities should take place based on the accounting policies applied.
Judgements as an element in significant accounting policies
The calculation of carrying amounts of certain assets and liabilities requires judgement as to how assets and liabili-ties should be classified in the Financial Statements and how future events will affect the value of these assets and lia-
bilities at the balance sheet date. In con-nection with the financial reporting for 2015, the following judgments have been made materially affecting the related items as described in relevant notes, see list below.
Critical accounting estimates
Management's estimates are based on assumptions which Management consid-ers reasonable but which are inherently uncertain and unpredictable. In connec-tion with the financial reporting for 2015, the following critical estimates have been made as desribed in relevant notes, see list below.
Accounting policies, judgements as an el-ement in significant accounting policies as well as critical accounting estimates are described in the notes:
Consolidated Parent company FS note FS note
Derivative financial instruments 2 Segment reporting 3 Net revenue 4 Share-based payments 5 Expenses 6 Financial income and expenses 8 Corporation tax 9 Intangible assets 11 Property, plant and equipment 12 Investments in associates 13 11Investments in subsidiaries 11Other fixed asset investments 14 Inventories 15 Receivables 16 Prepayments 17 Equity 18 Deferred tax 19 Repurchase obligation packaging in circulation 20 Debt 21 Cash Flow Statement 22
Comments to the note =
102 ANNUAL REPORT 2015 ROYAL UNIBREW

Descriptive notes to Parent Company Annual ReportNote 2 Financial risk management
Note 2 Financial risk management 31/12 2015
Maturity Contractual Maturity > 1 year Maturity Carrying tDKK cash flows < 1 year < 5 years > 5 years amount
Non-derivative financial instruments: Financial debt, debt financing, gross 1,184,471 47,080 591,786 545,605 1,184,471Financial debt, subsidiaries 348,822 348,822 348,822Interest expenses 73,364 15,342 28,911 29,111 Trade payables and repayment obligation re packaging 340,243 340,243 340,243Other payables 319,827 305,663 14,164 319,827Total 2,266,727 1,057,150 634,861 574,716 2,193,363
The debt breaks down on the categories "debt at amortised cost" with DKK 2,184 million and "debt at fair value" with DKK 9 million. The fair value of the total debt is assessed to equal carrying amount.
31/12 2014
Maturity Contractual Maturity > 1 year Maturity Carrying tDKK cash flows < 1 year < 5 years > 5 years amount
Non-derivative financial instruments: Financial debt, debt financing, gross 1,553,859 14,111 940,070 599,678 1,553,859Financial debt, subsidiaries 105,605 105,605 105,605Interest expenses 167,431 36,541 53,619 77,271 Trade payables and repayment obligation re packaging 346,893 346,893 346,893Other payables 289,804 265,091 24,713 289,804Total 2,463,592 768,241 1,018,402 676,949 2,296,161 The debt breaks down on the categories "debt at amortised cost" with DKK 2,266 million and "debt at fair value" with DKK 30 million.The fair value of the total debt is assessed to equal carrying amount.
For a description of the Parent Company's and the Group's currency, interest rate, credit, commodity and other risks as well as capital management, reference is made to note 2 to the Consolidated Financial Statements.
ROYAL UNIBREW ANNUAL REPORT 2015 103

Notes to Parent Company Income StatementNote 3 Staff expenses
Staff expenses are included in production costs, sales and distribution expenses as well as administrative expenses and break down as follows:
tDKK 2015 2014
Fixed salaries to Executive Board 13,450 12,850 Ordinary bonus scheme for Executive Board 6,460 6,038 Long-term bonus scheme for Executive Board 2,108 2,108 Share-based payments to Executive Board (restricted shares) 9,900 9,900 Remuneration of Executive Board 31,918 30,896 Remuneration of Board of Directors 3,977 3,229 35,895 34,125 Wages and salaries 403,803 387,944 Contributions to pension schemes 31,563 30,999 435,366 418,943 Other social security expenses 5,542 6,418 Other staff expenses 19,352 18,631 Total 496,155 478,117 Average number of employees 872 867 Reference is made to note 5 to the Consolidated Financial Statements for a description of share-based payments to the Executive Board.
104 ANNUAL REPORT 2015 ROYAL UNIBREW

Notes to Parent Company Income StatementNote 4 Expenses broken down by type
tDKK 2015 2014
Aggregated production costs 1.414.996 1.412.923Sales and distribution expenses 883.579 854.777Administrative expenses 196.049 162.024Total 2.494.624 2.429.724 break down by type as follows: Raw materials and consumables 1.101.146 1.115.049Wages, salaries and other staff expenses 496.155 478.117Operating and maintenance expenses 141.343 136.880Distribution expenses and carriage 114.796 105.600Sales and marketing expenses 442.265 426.629Bad trade debts -1.183 3.709Office supplies etc 93.842 78.568Depreciation and profit from sale of property, plant and equipment 106.260 85.172Total 2.494.624 2.429.724
Total depreciation and impairment losses as well as profit from sale of property, plant and equipment are included in the follow-ing items in the income statement:
tDKK 2015 2014
Production costs 65,202 56,528Sales and distribution expenses 23,177 18,632Administrative expenses 17,881 10,012Total 106,260 85,172 Fee to auditors tDKK 2015 2014
Fee for the audit of the Annual Report: Ernst & Young 700 800 Total 700 800 Ernst & Young fee for non-audit services:Tax assistance 3 47 Other assurance assistance 50 Other assistance 171 216 Total 174 313
ROYAL UNIBREW ANNUAL REPORT 2015 105

Notes to Parent Company Income StatementNote 5 Financial income
tDKK 2015 2014
Finance income Cash at bank and in hand 1 20Trade receivables 40 5Receivables from subsidiaries 5,298 6,724Other financial income 2,997 13 Exchange adjustments Cash at bank and in hand and external loans 2,422Trade payables 611Trade receivables 2,295 3,297Intercompany loans 561Forward contracts 206 Total 10,837 13,653
Note 6 Financial expenses
tDKK 2015 2014
Finance costs Mortgage debt 29,404 27,977Credit institutions 11,281 27,030Payables to subsidiaries 143 124 Exchange adjustments Cash at bank and in hand and external loans 1,967 Trade payables 442 Intercompany loans 592 Forward contracts 481 1,656Other financial expenses 715 1,776Total 45,025 58,563
106 ANNUAL REPORT 2015 ROYAL UNIBREW
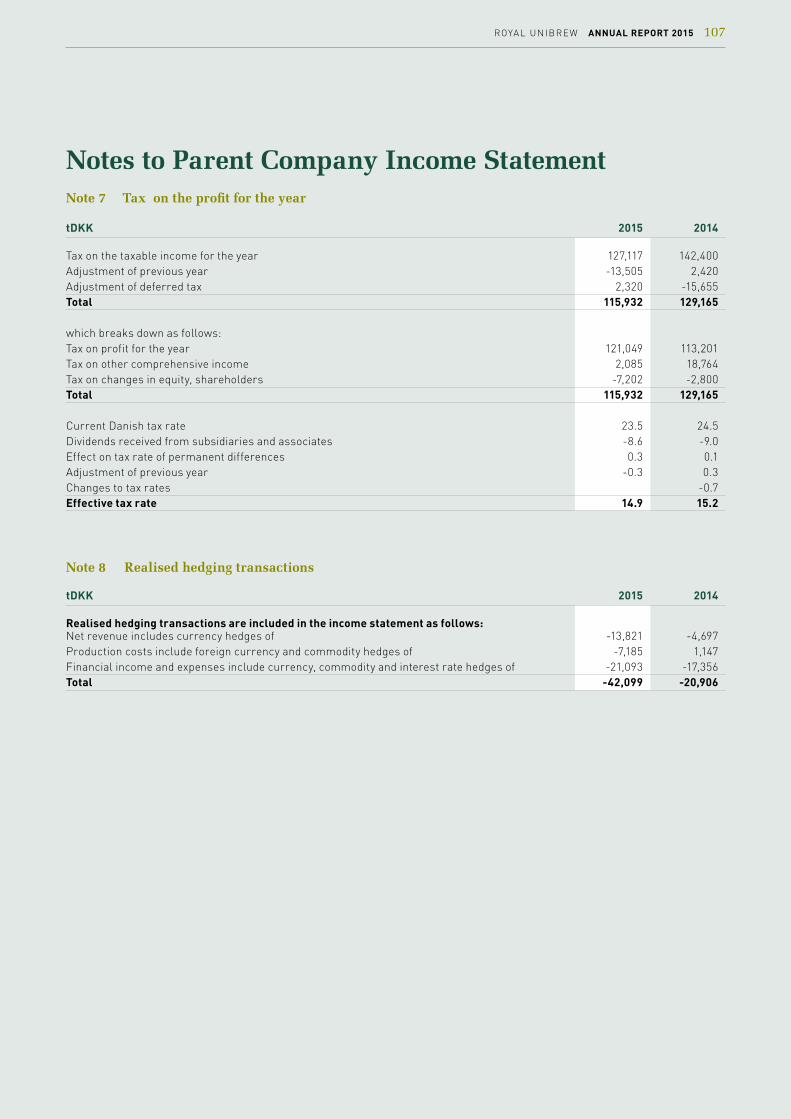
Notes to Parent Company Income StatementNote 7 Tax on the profit for the year
tDKK 2015 2014
Tax on the taxable income for the year 127,117 142,400Adjustment of previous year -13,505 2,420Adjustment of deferred tax 2,320 -15,655Total 115,932 129,165 which breaks down as follows: Tax on profit for the year 121,049 113,201Tax on other comprehensive income 2,085 18,764Tax on changes in equity, shareholders -7,202 -2,800Total 115,932 129,165 Current Danish tax rate 23.5 24.5Dividends received from subsidiaries and associates -8.6 -9.0Effect on tax rate of permanent differences 0.3 0.1Adjustment of previous year -0.3 0.3Changes to tax rates -0.7Effective tax rate 14.9 15.2
Note 8 Realised hedging transactions
tDKK 2015 2014
Realised hedging transactions are included in the income statement as follows: Net revenue includes currency hedges of -13,821 -4,697Production costs include foreign currency and commodity hedges of -7,185 1,147Financial income and expenses include currency, commodity and interest rate hedges of -21,093 -17,356Total -42,099 -20,906
ROYAL UNIBREW ANNUAL REPORT 2015 107

Notes to Parent Company Balance SheetNote 9 Intangible assets
Distribution tDKK Goodwill Trademarks rights Total
Cost at 1 January 2015 80,645 2,990 11,828 95,463Cost at 31 December 2015 80,645 2,990 11,828 95,463 Amortisation and impairment losses at 1 January 2015 0 0 -11,719 -11,719Amortisation for the year -2,990 -57 -3,047Amortisation and impairment losses at 31 December 2015 0 -2,990 -11,776 -14,766 Carrying amount at 31 December 2015 80,645 0 52 80,697
Cost at 1 January 2014 80,645 2,990 11,828 95,463Cost at 31 December 2014 80,645 2,990 11,828 95,463 Amortisation and impairment losses at 1 January 2014 0 0 -11,339 -11,339Amortisation for the year -380 -380Amortisation and impairment losses at 31 December 2014 0 0 -11,719 -11,719 Carrying amount at 31 December 2014 80,645 2,990 109 83,744
Impairment
Reference is made to note 11 to the Consolidated Financial Statements for a description of impairment test.
108 ANNUAL REPORT 2015 ROYAL UNIBREW
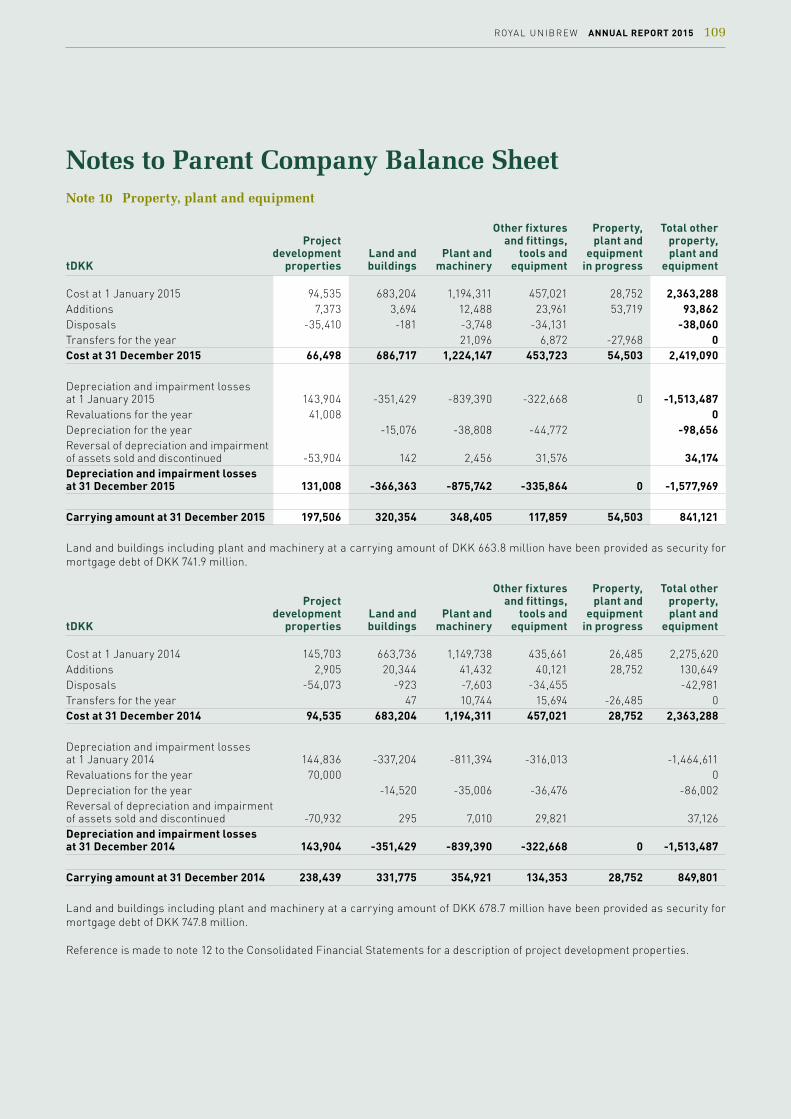
Notes to Parent Company Balance SheetNote 10 Property, plant and equipment
Other fixtures Property, Total other Project and fittings, plant and property, development Land and Plant and tools and equipment plant and tDKK properties buildings machinery equipment in progress equipment
Cost at 1 January 2015 94,535 683,204 1,194,311 457,021 28,752 2,363,288Additions 7,373 3,694 12,488 23,961 53,719 93,862Disposals -35,410 -181 -3,748 -34,131 -38,060Transfers for the year 21,096 6,872 -27,968 0Cost at 31 December 2015 66,498 686,717 1,224,147 453,723 54,503 2,419,090 Depreciation and impairment losses at 1 January 2015 143,904 -351,429 -839,390 -322,668 0 -1,513,487Revaluations for the year 41,008 0Depreciation for the year -15,076 -38,808 -44,772 -98,656Reversal of depreciation and impairment of assets sold and discontinued -53,904 142 2,456 31,576 34,174Depreciation and impairment losses at 31 December 2015 131,008 -366,363 -875,742 -335,864 0 -1,577,969 Carrying amount at 31 December 2015 197,506 320,354 348,405 117,859 54,503 841,121
Land and buildings including plant and machinery at a carrying amount of DKK 663.8 million have been provided as security for mortgage debt of DKK 741.9 million.
Other fixtures Property, Total other Project and fittings, plant and property, development Land and Plant and tools and equipment plant and tDKK properties buildings machinery equipment in progress equipment
Cost at 1 January 2014 145,703 663,736 1,149,738 435,661 26,485 2,275,620Additions 2,905 20,344 41,432 40,121 28,752 130,649Disposals -54,073 -923 -7,603 -34,455 -42,981Transfers for the year 47 10,744 15,694 -26,485 0Cost at 31 December 2014 94,535 683,204 1,194,311 457,021 28,752 2,363,288 Depreciation and impairment losses at 1 January 2014 144,836 -337,204 -811,394 -316,013 -1,464,611Revaluations for the year 70,000 0Depreciation for the year -14,520 -35,006 -36,476 -86,002Reversal of depreciation and impairment of assets sold and discontinued -70,932 295 7,010 29,821 37,126Depreciation and impairment losses at 31 December 2014 143,904 -351,429 -839,390 -322,668 0 -1,513,487
Carrying amount at 31 December 2014 238,439 331,775 354,921 134,353 28,752 849,801
Land and buildings including plant and machinery at a carrying amount of DKK 678.7 million have been provided as security for mortgage debt of DKK 747.8 million.
Reference is made to note 12 to the Consolidated Financial Statements for a description of project development properties.
ROYAL UNIBREW ANNUAL REPORT 2015 109

Notes to Parent Company Balance SheetNote 11 Investments in subsidiaries and associates
Investments Investments tDKK in subsidiaries in associates
Cost at 1 January 2015 3,573,194 77,374Additions 206 Cost at 31 December 2015 3,573,400 77,374 Revaluations and impairment losses at 1 January 2015 -89,035 0Revaluations and impairment losses at 31 December 2015 -89,035 0 Carrying amount at 31 December 2015 3,484,365 77,374 Cost at 1 January 2014 3,565,692 75,931 Reclassification, beginning of year 1,443 Additions 7,502 Cost at 31 December 2014 3,573,194 77,374 Revaluations and impairment losses at 1 January 2014 -89,035 0 Revaluations and impairment losses at 31 December 2014 -89,035 0 Carrying amount at 31 December 2014 3,484,159 77,374
Dividend on investments in subsidiaries and associates
Dividend on investments in subsidiaries and associates is recognised in the Parent Company's income statement in the financial year in which dividend is declared.
Investments in subsidiaries and associates in the Parent Company Financial Statements
Investments in subsidiaries and associates are measured at cost and tested in the event of indication of impairment. Where cost exceeds the recoverable amount, the investment is written down to its lower recoverable amount.
Investments in subsidiaries
The carrying amount of investments in subsidiaries and the values of intangible assets contained therein is tested to identify any impairment. Reference is made to note 11 to the Consolidated Financial Statements.
110 ANNUAL REPORT 2015 ROYAL UNIBREW

Notes to Parent Company Balance SheetNote 12 Receivables from subsidiaries and Other fixed asset investments
Receivables Total other from Other Other fixed asset tDKK subsidiaries investments receivables investments
Cost at 1 January 2015 163,709 54,833 2,121 56,954Exchange adjustment 416 0Additions 1,762 1,762Disposals -69 -69Cost at 31 December 2015 164,125 54,833 3,814 58,647 Revaluations and impairment losses at 1 January 2015 0 -52,312 0 -52,312Revaluations and impairment losses for the year 239 239Revaluations and impairment losses at 31 December 2015 0 -52,073 0 -52,073 Carrying amount at 31 December 2015 164,125 2,760 3,814 6,574
Cost at 1 January 2014 155,428 54,833 8,173 63,006Exchange adjustment -367 0Additions 8,648 78 78Disposals -6,130 -6,130Cost at 31 December 2014 163,709 54,833 2,121 56,954 Revaluations and impairment losses at 1 January 2014 0 -52,312 0 -52,312Revaluations and impairment losses at 31 December 2014 0 -52,312 0 -52,312 Carrying amount at 31 December 2014 163,709 2,521 2,121 4,642
Note 13 Inventories
tDKK 2015 2014
Raw materials and consumables 50,025 42,291Work in progress 14,611 12,872Finished goods and goods for resale 58,413 59,866Inventories 123,049 115,029
Inventories
Indirect production costs are recognised in the value of work in progress and finished goods at DKK 9 million (2014: DKK 8 million). As in 2014, inventories have not been written down materially.
Note 14 Receivables
tDKK 2015 2014
Trade receivables 243,484 213,615Other receivables 10,256 7,411Total receivables 253,740 221,026
Reference is made to notes 2 and 16 to the Consolidated Financial Statements for a description of receivables.
ROYAL UNIBREW ANNUAL REPORT 2015 111

Notes to Parent Company Balance SheetNote 15 Share capital
Reference is made to note 18 to the Consolidated Financial Statements.
Note 16 Deferred tax
tDKK 2015 2014
Deferred tax at 1 January 151,852 166,072Change in deferred tax for the year 2,320 13,845Change sale of project development property -56,020 -24,500Changes to tax rates -5,000Adjustment of previous year -2,161 1,435Deferred tax at 31 December 95,991 151,852 Due within 1 year 25,136 30,111 Deferred tax relates to: Intangible assets 43 44Property, plant and equipment 90,700 135,701Fixed asset investments 15,052 18,996Current assets 9,688 4,749Non-current liabilities -12,940 -2,800Current liabilities -6,552 -4,838Total 95,991 151,852
Note 17 Other current payables
tDKK 2015 2014
VAT, excise duties, etc 50,601 40,855Other payables 225,375 197,153Repurchase obligation, returnable packaging 29,687 27,083Total other current payables 305,663 265,091 Repurchase obligation, returnable packaging is specified as follows: Balance at 1 January 27,083 31,998Adjustment for the year 2,604 -4,915Balance at 31 December 29,687 27,083
The change in the repurchase obligation for the year reflects net sales of returnable packaging for the year less estimated wastage of returnable packaging in circulation.
112 ANNUAL REPORT 2015 ROYAL UNIBREW

Noter til moderselskabets pengestrømsopgørelseNote 18 Cash Flow Statement
Adjustments for non-cash operating items:
tDKK 2015 2014
Dividends received from subsidiaries and associates -296,929 -271,588 Financial income -10,837 -13,653Financial expenses 45,025 58,563Amortisation, depreciation and impairment of intangible assets and property, plant and equipment 101,703 86,382Tax on the profit for the year 121,049 113,201Profit and loss from sale of property, plant and equipment 4,558 -1,210Share-based payments and remuneration 9,900 9,900Total -25,531 -18,405
ROYAL UNIBREW ANNUAL REPORT 2015 113

Other notes to Parent Company Annual ReportNote 19 Contingent liabilities, security and other liabilities
mDKK 2015 2014
Guarantees Guarantees relating to subsidiaries 528.6 703.6 Total 528.6 703.6 Rental and operating lease commitments Total future payments:
mDKK 2015 2014
Within 1 year 24.8 25.2 Between 1 and 5 years 48.2 35.0 Beyond 5 years 5.6 4.6 Total 78.6 64.8 Rental and operating lease commitments relate to properties and operating equipment, including cars and IT equipment. Third-party guarantees 12.1 11.0
Security No security has been provided in respect of the Group's loan agreements with credit institutions other than the Parent Company's liability for the amounts drawn by subsidiaries on group credit facilities.
As regards security for loan agreements with mortgage credit institutes, reference is made to note 10.
Contingent liabilities The outcome of pending legal actions is not expected to have any material impact on the financial position of the Parent Company or the Group.
114 ANNUAL REPORT 2015 ROYAL UNIBREW

Other notes to Parent Company Annual ReportNote 20 Related parties
Related parties comprise the Board of Directors and the Executive Board as well as subsidiaries and associates, see the sections on Board of Directors and Executive Board on page 44 and Group Structure on page 118. No shareholder exercises control.
All transactions, including lending, are carried out on an arm's length basis.
The following transactions have been made with related parties:
tDKK 2015 2014
Revenue Sales to subsidiaries 533,981 504,069Sales to associates 5,133 5,199 Costs Purchases from subsidiaries 16,439 27,542 Financial income and expenses Dividends received from associates 26,660 24,346Dividends received from subsidiaries 270,269 247,242Interest received from subsidiaries 5,298 6,724 Interest paid to subsidiaries 143 124 Executive Board Remuneration paid 19,775 18,508Debt re cash-based bonus schemes 19,108 16,578Liability re share-based bonus scheme measured at fair value at the time when granted 23,100 13,200 Board of Directors Remuneration 3,977 3,229 Intercompany balances at 31 December Loans to subsidiaries 186,651 205,314Receivables from subsidiaries 63,402 60,715Loans from subsidiaries 342,410 105,605Payables to subsidiaries 902 5,861 Capital contributed to subsidiaries 206 7,502 Guarantees and security Guarantee for subsidiaries 528,600 703,590
ROYAL UNIBREW ANNUAL REPORT 2015 115

Quarterly Financial Highlights and Ratios (Group) Q1 Q2 Q3 Q4
mDKK (unaudited) 2015 2014 2015 2014 2015 2014 2015 2014
Sales (million hectolitres) 1.9 1.8 2.5 2.6 2.5 2.5 2.2 2.1 Income Statement Net revenue 1,290 1,267 1,633 1,725 1,686 1,713 1,423 1,351Production costs -632 -634 -745 -800 -760 -779 -720 -693Gross profit 658 633 888 925 926 934 703 658Gross margin ratio (%) 51.0 50.0 54.4 53.6 54.9 54.5 49.4 48.7Sales and distribution expenses -451 -493 -510 -530 -496 -506 -465 -458Administrative expenses -76 -97 -84 -77 -80 -76 -95 -86EBITDA 204 110 370 394 428 428 223 198EBITDA margin (%) 15.8 8.7 22.7 22.8 25.4 25.0 15.7 14.7Earnings before interest and tax (EBIT) 131 43 294 318 350 352 143 114EBIT margin (%) 10.2 3.4 18.0 18.4 20.8 20.5 10.1 8.5Income from investments in associates 1 -1 11 19 6 9 13 8Financial income and expenses -13 -22 -11 -14 -13 -8 -9 -16Profit before tax 119 20 294 323 343 353 147 106Net profit for the period 92 14 229 252 267 273 123 85 Balance Sheet Non-current assets 5,641 5,800 5,552 5,744 5,505 5,652 5,505 5,664Total assets 6,768 6,995 6,910 7,282 6,728 7,068 6,748 7,024Equity 2,900 2,157 2,724 2,440 2,896 2,717 2,935 2,818Net interest-bearing debt 1,710 2,638 1,627 2,042 1,323 1,606 1,184 1,553Net working capital -555 -567 -721 -756 -742 -757 -990 -814 Cash Flows From operating activities -96 -207 472 568 422 390 362 144From investing activities -27 -52 54 29 -27 48 -123 -94Free cash flow -122 -254 521 594 394 432 239 53 Financial Ratios (%) Free cash flow as a percentage of net revenue -9 -20 32 34 23 25 17 4Cash conversion -133 -1,814 228 236 148 158 194 61Equity ratio 43 31 39 34 43 38 43 40
Ratios comprised by the “Recommendations and Financial Ratios 2015” issued by the Danish Society of Financial Analysts have been calculated according to the recommendations.
Definitions of financial highlights and ratios are provided on page 117.
116 ANNUAL REPORT 2015 ROYAL UNIBREW
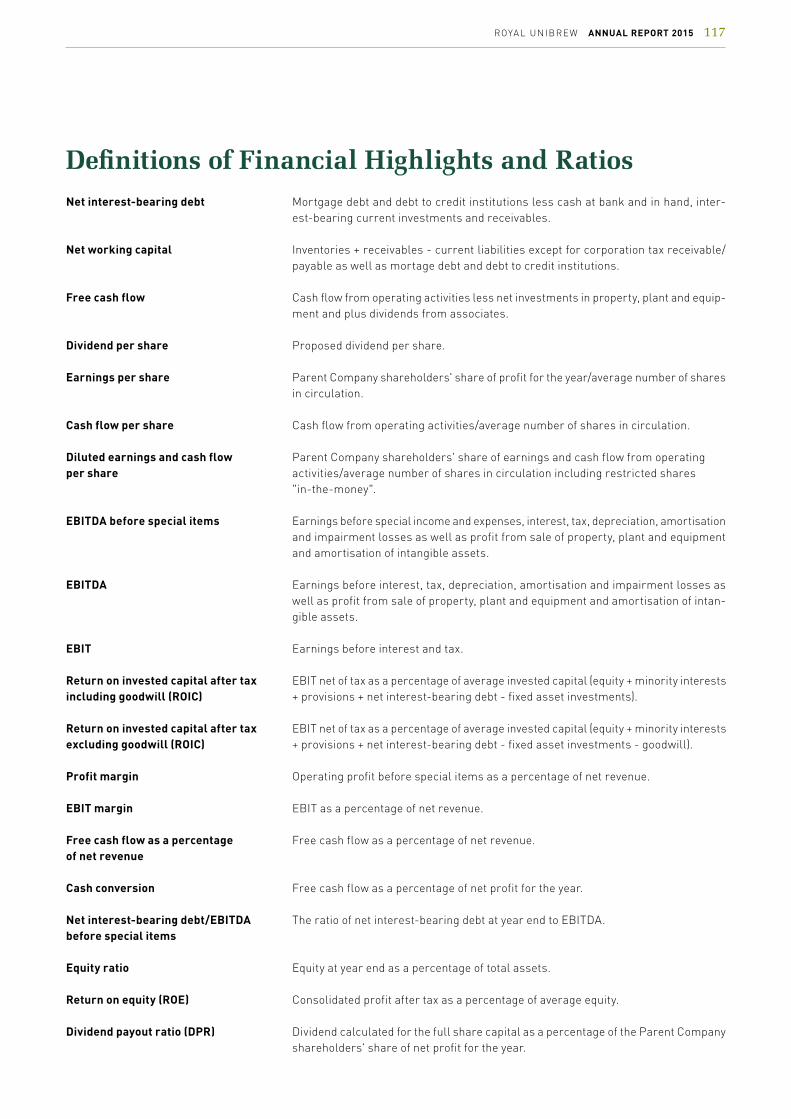
Definitions of Financial Highlights and RatiosNet interest-bearing debt Mortgage debt and debt to credit institutions less cash at bank and in hand, inter-
est-bearing current investments and receivables.
Net working capital Inventories + receivables - current liabilities except for corporation tax receivable/payable as well as mortage debt and debt to credit institutions.
Free cash flow Cash flow from operating activities less net investments in property, plant and equip-ment and plus dividends from associates.
Dividend per share Proposed dividend per share.
Earnings per share Parent Company shareholders' share of profit for the year/average number of shares in circulation.
Cash flow per share Cash flow from operating activities/average number of shares in circulation.
Diluted earnings and cash flow Parent Company shareholders' share of earnings and cash flow from operatingper share activities/average number of shares in circulation including restricted shares "in-the-money".
EBITDA before special items Earnings before special income and expenses, interest, tax, depreciation, amortisation and impairment losses as well as profit from sale of property, plant and equipment and amortisation of intangible assets.
EBITDA Earnings before interest, tax, depreciation, amortisation and impairment losses as well as profit from sale of property, plant and equipment and amortisation of intan-gible assets.
EBIT Earnings before interest and tax.
Return on invested capital after tax EBIT net of tax as a percentage of average invested capital (equity + minority interests including goodwill (ROIC) + provisions + net interest-bearing debt - fixed asset investments).
Return on invested capital after tax EBIT net of tax as a percentage of average invested capital (equity + minority interests excluding goodwill (ROIC) + provisions + net interest-bearing debt - fixed asset investments - goodwill).
Profit margin Operating profit before special items as a percentage of net revenue.
EBIT margin EBIT as a percentage of net revenue.
Free cash flow as a percentage Free cash flow as a percentage of net revenue.of net revenue
Cash conversion Free cash flow as a percentage of net profit for the year.
Net interest-bearing debt/EBITDA The ratio of net interest-bearing debt at year end to EBITDA.before special items
Equity ratio Equity at year end as a percentage of total assets.
Return on equity (ROE) Consolidated profit after tax as a percentage of average equity.
Dividend payout ratio (DPR) Dividend calculated for the full share capital as a percentage of the Parent Company shareholders' share of net profit for the year.
ROYAL UNIBREW ANNUAL REPORT 2015 117

Group StructureSegment Ownership Currency Capital
Parent CompanyRoyal Unibrew A/S, Denmark DKK 110,985,000
WESTERN EUROPESubsidiariesAktieselskabet Cerekem International Ltd., Denmark 100% DKK 1,000,000 Albani Sverige AB, Sweden 100% SEK 305,000 Ceres S.p.A., Italy 100% EUR 206,400 The Curious Company A/S, Denmark 100% DKK 550,000
AssociatesGrønlandskonsortiet I/S, Denmark 50% DKK Hansa Borg Holding AS, Norway 25% NOK 54,600,000 Nuuk Imeq A/S, Godthåb, Greenland 32% DKK 38,000,000
BALTIC SEASubsidiariesAB Kalnapilio-Tauro Grupe, Lithuania 100% EUR 1,153,337 Oy Hartwall Ab 100% EUR 13,240,140 Hartwa-Trade Oy Ab 100% EUR 168,188 Helepark Oy 100% EUR 6,761 Lapin Kulta Oy 100% EUR 16,819 Royal Unibrew Services UAB, Lithuania 100% EUR 43,500 SIA ”Cido Grupa”, Latvia 100% EUR 1,117,060 OÜ Royal Unibrew Eesti, Estonia 100% EUR 2,000,000
Ferell sp. Z o.o., Poland 100% PLN 120,200
MALT BEVERAGES AND EXPORTSSubsidiariesCentre Nordique d’Alimentation EURL, France 100% EUR 131,000 Royal Unibrew Caribbean Ltd., Puerto Rico 100% USD 200,000 Supermalt UK Ltd., the UK 100% GBP 9,700,000 Vitamalt (West Africa) Ltd., the UK 100% GBP 10,000 Royal Unibrew Nigeria Ltd., Nigeria 100% NGN 10,000,000 The Danish Brewery Group Inc., USA 100% USD 100,000
Activity Production, sales and distribution Sales and distribution Holding company Other
118 ANNUAL REPORT 2015 ROYAL UNIBREW


Royal Unibrew A/SFaxe Alle 1DK-4640 FaxeTel +45 56 77 15 00Fax +45 56 71 47 64
CVR No. 41 95 67 12Financial year: 1 January – 31 DecemberRegistered municipality: Faxe
Homepage: www.royalunibrew.comE-mail: [email protected]