royal unibrew a/s annual report 2013
TRANSCRIPT
Royal Unibrew A/S
Annual Report 2013

Royal Unibrew produces, markets, sells and distributes quality beverages. We focus on branded products within beer, malt beverages and soft drinks, including soda water, mineral water and fruit juices as well as cider and long drinks (RTD).
Royal Unibrew is as a leading regional player in a number of markets in West-ern and Eastern Europe and in the inter-national malt beverages markets.
Our main markets comprise primarily Denmark, Finland, Italy and Germany as well as Latvia, Lithuania and Estonia. The international malt beverages markets comprise a number of established mar-kets in the Caribbean and major cities in Europe and North America with high concentration of inhabitants from the Caribbean and African areas in which malt beverages are popular as well as emerging markets in Africa, Central America and South America.
In Denmark we are a leading supplier of beer and soft drinks with a number of strong brands.
In Finland Royal Unibrew is a leading beverage player through the acquisition of Hartwall with a number of strong brands within primarily beer, soft drinks, long drinks and cider.
In Italy we are among the market leaders in the super premium segment with Ceres Strong Ale.
In both Latvia and Lithuania, we are among the two leading beverage busi-nesses holding considerable market positions within beer and soft drinks, including fruit juices. Our activities in Estonia are being developed organically.
In the international malt beverages mar-kets, we are among the market leaders in the premium segment with Vitamalt, Supermalt and Powermalt.
2 Royal UnibRew annual report 2013

reviews Significant strengthening of Royal Unibrew’s position 4Financial Highlights and Ratios 6Highlights 2013 7Strategy 9Financial Review 13Outlook 17Western Europe 20North Eastern Europe 23Malt Beverages 26Shareholder Information 31Corporate Governance 35Risk Management 38Remuneration 42Board of Directors and Executive Board 44Organisation and Employees 49Corporate Social Responsibility 51 ManageMent’s stateMent and auditor’s report Management’s Statement on the Annual Report 56Independent Auditor’s Report 57 Financial stateMents Income Statement 59Statement of Comprehensive Income 60Assets 61Liabilities and Equity 62Cash Flow Statement 63Statement of Changes in Equity 64Contents of Notes 66Notes 67 other inForMation Quarterly Financial Highlights and Ratios 114Definitions of Financial Highlights and Ratios 115Group Structure 116
Contents
The Annual Report has been prepared in Danish and English. In case of discrepancy the Danish version shall prevail.
annual report 2013 Royal UnibRew 3
Royal Unibrew’s position significantly strengthened
”2013 was a good and important year to Royal Unibrew, in which we succeeded in realising an attractive acquisition. Over the past years, we have implemented comprehensive changes, including strategic refocusing, restructuring, simplification and debt reduction. Our many initiatives have resulted in strong cash flow, paving the way for an attractive distribution policy and a healthy capital structure – and thus considerable financial and strategic flexibility. This, combined with continued momentum in 2013, enabled us to acquire Hartwall in Finland with moderate borrowing and significantly expand our position as the second-largest brewery group in the Nordic and Baltic countries – thus creating a broader and stronger earnings base.”
an important step for Royal Unibrew. Hartwall is a multi-beverage business with a broad, attractive product range holding a clear runner-up position in Finland. Hartwall has a strong local brand portfolio and international brands within beer, soft drinks, mineral water, RTD, cider and energy drinks and furthermore operates agencies for a number of well-known wine and spirits brands. Hartwall operates two production facilities – a modern brewery constructed in 2002 and a mineral water plant.
The Hartwall acquisition further consoli-dated our relationship with PepsiCo since for a number of years both Hartwall and Royal Unibrew have been licence-produc-ing Pepsi, which holds a strong market position in both Denmark and Finland. Also the partnership with Heineken was strengthened since, as part of the agree-ment, we entered into a long-term bot-tling agreement for the Heineken brand in both Finland and the Baltic countries.
In connection with the acquisition, we entered into new long-term credit agree-ments on satisfactory terms to fund the acquisition, and in the context of the di-rected issue we were pleased to welcome the Hartwall family as a Royal Unibrew shareholder with an equity interest of just below 10%. Accordingly, we will have a shareholder with unique knowledge of Hartwall, the local market as well as the Finnish business sector in a broad sense. Our new Finnish member of the Board of Directors as well as our Finnish Advisory Board will also support us in our efforts to operate Hartwall successfully.
We see a number of opportunities of strengthening Hartwall’s business and
I am pleased with the strong results that we have delivered in 2013. Our continued focus on further developing market and segment positions, products and brands as well as a high efficiency and a good summer are the reasons that – in spite of still challenging market conditions – we strengthened our market positions and market shares. We realised better results – in organic terms – than expected at the beginning of the year and consid-erably better results than in 2012. We maintained a high organic EBIT margin of 14.1% while achieving continued high cash flow from our operations.
our strategy as a regional bever-age playerIt is our strategy to be a regional bever-age player with strong local brands – preferably supplemented by interna-tional brands through strategic bottling agreements – and strong local customer relations. Through strong local leader-ship we will develop this position with continuous focus on consumers, good customer partnerships, agility and in-novative initiatives.
In Europe where several market seg-ments are showing a flat development or a structural decline, it is important to achieve a significant position in the local markets when operating in the main-stream segment. The flat to negative market development also implies a need for continuous improvements across our business.
royal unibrew strategically and Financially strengthened through the hartwall acquisitionIn July 2013 we acquired the Finnish beverage business Hartwall. This was
4 Royal UnibRew annual report 2013

operations and expect the Hartwall ac-quisition to result in higher earnings per share (before integration costs) already in 2014.
Financial targets and capital structureIt is our aim to quickly reduce the debt from the Hartwall acquisition; it was therefore announced in connection with the acquisition that the Board of Direc-tors recommends that dividend distribu-tion and share buy-backs to be tempo-rarily put on hold. It is our intention to resume dividend distribution in 2015 from a stronger earnings and cash flow base. Our policy for dividend and share buy-back remains unchanged.
Our policy for debt and capital structure also remains unchanged; our targets are, however, temporarily exceeded until the debt reduction has taken place.
Our earnings target of a medium-term EBIT margin of 14% was changed due to the acquisition and replaced by an EBIT margin target of 13% compared to a pro forma EBIT margin of 12% in 2013. The target of 13% remains ambitious compar-ing to the performance of international and regional breweries in Europe.
growth and reinForced Market positions despite challenging Markets2013 was a challenging year for the Eu-ropean beverage industry with a general market decline driven by changed con-sumption habits, consumer restraint and fiscal measures. The decline was partly offset by a really good summer in the North Western European markets.
At Royal Unibrew (excluding Hartwall) we achieved, however, organic growth in all of our market areas, and our market positions and market shares were in general significantly reinforced. This is the result of considerable investments in our commercial activities, in innovation and in our brand portfolios. Trading chal-lenges for certain competing products in the off-trade channel in Denmark from the spring to the end of 2013 contributed
temporarily and extraordinarily to our revenue growth.
We give high priority to strengthening the partnerships with our customers through an understanding of joint value creation, and it is therefore with great pleasure that we note again in 2013 the high score of our North Western Euro-pean business in third-party measure-ments of customer satisfaction with their suppliers – across categories. We will continue our focus on joint value creation and our aspiration of being a preferred business partner.
growth strategy For the Malt area beginning to bear FruitThe dark malt market is a small and fragmented market with pockets of opportunities in Africa, the Caribbean as well as Central and South America. These areas are generally characterised by an increasing population and rising living standards, but in 2013, however, the markets were affected by the global growth pause.
Whereas the vast majority of our mar-kets in Europe are mature, the malt busi-ness constitutes our exposure against Emerging Markets. We have worked in these markets for 40-50 years and thus accumulated considerable knowledge of the product area and the markets. At the same time, we have a strong premium brand portfolio comprising Vitamalt, Supermalt and Powermalt. In 2013 we decided to focus on this business area and to invest considerably in sales and marketing as well as in organisational expansion. At the same time, we estab-lished a target of average annual organic revenue growth of 10-15% in the medium term with an average EBIT margin of 20%.
In that respect, 2013 was a satisfactory year for us. We reinforced our position in existing markets and penetrated new markets, and the foundations for the realisation of our growth strategy are being laid.
consuMer sentiMent in europe still requires strong leadership and Flexibility oF plansContinued consumer restraint in Europe, especially in Finland and Italy, combined with general, structural declines in cer-tain segments of the beverage industry requires strong leadership, flexible plans and an organisation ready to embrace changes.
In 2014 we will therefore still need to manage Royal Unibrew with flexibility and great adaptability, while retaining the focus and the momentum developed. To that end, our leadership values play a very important part, and the focus of our leadership is to manage an organisation driven by consumer and customer in-sight. A clear strategy, a holistic mindset, simplification and constant learning are crucial to us. In 2014 we will also focus strongly on the continued integration of Hartwall, and we are looking forward to strengthening Hartwall commercially and operationally in cooperation with our employees.
I would like to thank everyone at Royal Unibrew for their great performance in a very busy year. Through great market and customer insight, commitment, energy and persistent efforts our em-ployees have created results of which we can be proud. I also take the opportunity to thank profoundly our customers for another year of good partnership and, finally, our shareholders for supporting our plans in 2013.
Henrik BrandtCEO
annual report 2013 Royal UnibRew 5

Financial Highlights and Ratios 2013 2012 2011 2010 2009
Sales (million hectolitres) 7.0 5.4 5.7 6.6 6.6
incoMe stateMent (Mdkk)Net revenue 4,481 3,430 3,431 3,775 3,816EBITDA before special items 732 611 601 601 461Operating profit before special items 560 485 474 417 243Profit margin (%) 12.5 14.1 13.8 11.0 6.4Special items (expenses) 0 0 0 0 -50EBITDA 732 611 601 601 411Special items (depr./amort. and impair.; profit/loss) 0 0 0 0 15Nedskrivning for impairment 0 0 0 0 0Earnings before interest and tax (EBIT) 560 485 474 417 208EBIT margin (%) 12.5 14.1 13.8 11.0 5.5Income after tax from investments in associates 0 0 0 0 0Income after tax from investments in associates 34 34 14 31 26Other financial income and expenses, net -46 -38 -27 -73 -157Profit/loss before tax 548 481 461 375 77Net profit/loss for the year 480 373 351 278 53Parent Company shareholders’ share of profit/loss 480 371 348 278 47
balance sheet (Mdkk)Non-current assets 5,810 1,992 2,291 2,375 2,674Total assets 6,925 2,848 2,890 3,057 3,490Equity 2,133 1,348 1,321 1,281 995Net interest-bearing debt 2,379 321 631 770 1,416Net working capital -834 -179 -149 -134 -85
cash Flows (Mdkk)Operating activities 653 497 398 492 513Investing activities -2,945 192 3 160 -112Free cash flow 598 476 384 463 374
share ratios (dkk)Parent Company shareholders' share of earnings per share 46.0 35.6 31.8 25.1 5.8Parent Company shareholders' diluted share of earnings per share 46.0 35.6 31.8 25.1 5.8Cash flow per share 62.6 44.2 36.4 44.4 62.0Diluted cash flow per share 62.6 44.2 36.4 44.4 62.0Dividend per share 0.0 24.0 17.0 12.5 0.0Year-end price per share 736.0 492.0 321.5 332.0 139.0
eMployeesAverage number of employees 1,935 1,635 1,785 2,210 2,498
Financial ratios (%))Return on invested capital (ROIC) 13 21 18 14 6Free cash flow as a percentage of net revenue 13 14 11 12 10Cash conversion 125 128 110 167 714Net interest-bearing debt/EBITDA before special items 2.3* 0.5 1.0 1.3 3.1Equity ratio 31 47 46 42 29Return on equity (ROE) 28 28 27 24 5Dividend payout ratio (DPR) 0 68 55 50 0* calculated pro forma with Hartwall’s realised full-year EBITDA
Ratios comprised by the “Recommendations and Financial Ratios 2010” issued by the Danish Society of Financial Analysts have been calculated according to the recommendations.
6 Royal UnibRew annual report 2013

Highlights 2013
net revenue went up by 31%, 11 percentage points attributable to organic growth
cash Flow FroM operating activities went up by dkk 156 Million
ebit increased by dkk 75 Million, hartwall contributing dkk 38 Million
royal unibrew signiFicantly reinForced its Market position in 2013
hartwall integration progressing as planned
the hartwall acquisition on 23 august 2013 reinForced royal unibrew’s position signiFicantly
DEVELOPMENTS IN 2013
• Royal Unibrew increased its market shares on branded beer as well as soft drinks and malt beverages in all markets except for the Finnish market, where its market share was lower than in 2012.
• Net revenue went up by DKK 1,051 mil-lion to DKK 4,481 million. Adjusted for the acquisition of Hartwall in 2013 and the divestment of Impec in 2012, net rev-enue increased by 11% in organic terms.
• EBITDA increased by DKK 121 million and amounted to DKK 732 million. In organic terms, EBITDA increased by DKK 32 million.
• Earnings before interest and tax (EBIT) went up by DKK 75 million and amounted to DKK 560 million, includ-ing DKK 38 million attributable to Hartwall. In organic terms, EBIT went up by DKK 43 million.
• As expected, the EBIT margin of 12.5% was due to the acquisition of Hartwall lower than the margin of 14.1% in 2012.
• Profit before tax amounted to DKK 548 million compared to DKK 481 million in 2012.
• Free cash flow went up by DKK 122 mil-lion and amounted to DKK 598 million compared to DKK 476 million in 2012.
• In 2013 dividend of DKK 352 million was distributed to shareholders (2012: DKK 379 million), including DKK 110 million through share buy-backs (2012: DKK 200 million).
• The equity ratio was 31% at the end of 2013, and NIBD was 2.3 times pro forma EBITDA.
• Net revenue increased by 88% in Q4 and amounted to DKK 1,425 million. In organic terms, net revenue increased by 9% over 2012.
• EBIT for Q4 amounted to DKK 111 million compared to DKK 85 million in 2012. In organic terms, EBIT was DKK 2 million below the 2012 figure, and EBIT margin was 7.8% compared to 11.2% in 2012.
debt reduction Following the hartwall acquisition progressing as planned
OUTLOOK FOR 2014
Calculated on a pro forma basis with Hartwall’s realised net revenue and re-sults for all of 2013, net revenue amount-ed to DKK 6,050 million, EBITDA to DKK 1,015 million and EBIT margin was 12.0%.
In consequence of the expectations of the development in consumption and Royal Unibrew’s market shares, including the normalisation of volumes and the termi-nation of a private label contract in North Western Europe, net revenue for 2014 is expected to show a low one-digit percent-age point decline as compared to the pro forma net revenue calculated for 2013.
EBITDA is expected realised slightly higher than the pro forma EBITDA calculated for 2013. The outlook for 2014 will be updated when the restructuring negotiations with the employees at Hartwall and the conclusions have been completed in ac-cordance with the procedures laid down.
It remains the Group’s target to increase EBIT margin to 13% in the medium term.
Due to the priority given to debt reduc-tion, the Board of Directors recommends that no dividend be distributed in 2014; moreover, the Board of Directors does
not expect to initiate any share buy-backs in 2014. proforma actual realised 2013* 2013**
Net revenue (mDKK) 4,481 6,050EBITDA (mDKK) 732 1,015EBIT (mDKK) 560 730
* In 2013, Hartwall was included in results for the period 23 August – 31 December with net revenue of DKK 787 million, EBITDA of DKK 94 million and EBIT of DKK 38 million after deduct-ing transaction costs of DKK 15 million.
** Pro forma realised 2013 is calculated with Hart-wall’s realised net revenue and full-year results before deducting transaction costs.
annual report 2013 Royal UnibRew 7

8 Royal UnibRew annual report 2013

Strategy
Royal Unibrew’s overall strategy and medium-term financial targets remain unchanged after being updated in August 2013 in connection with the acquisition of Hartwall. The medium-term financial target is to achieve an EBIT margin of approx 13%. The capital structure target also remains unchanged and in the coming year focus will be on debt reduction.
growth initiative was the Hartwall ac-quisition. At the same time, continuous improvements were pursued in all parts of the business, which has supported the ambition of reducing resource consump-tion in the business in a broad sense. Fi-nancially, cash flow generation remained a high priority, and strong cash flows were created through earnings improve-
ment, tight management and control of working capital elements, a balanced investment level as well as divestment of non-strategic assets.
Royal Unibrew’s efforts in respect of the main priorities established resulted in achievement of the targets set for 2013 as expected.
outlook outlook november 2013 March 2013 incl. hartwall excl. actual 23/8 – 31/12 hartwall
Net revenue (mDKK) 4,481 4,340-4,425 3,325-3450EBITDA (mDKK) 732 695-735 575-625EBIT (mDKK) 560 510-550 450-500Profit before tax (mDKK) 548 Net interest-bearing debt (mDKK) 2,379 NIBD/EBITDA (pro forma) 2.3x Distribution to shareholders (mDKK) 352
* calculated with Hartwall’s realised EBITDA of EUR 51 million for the full year 2013. In 2013 Hartwall was included in results for the period 23 August – 31 December with net revenue of DKK 787 million, EBITDA of DKK 94 million and EBIT of DKK 38 million after deducting transaction costs of DKK 15 million.
OVERALL STRATEGY
It is Royal Unibrew’s strategy to be a focused, strong regional brewer within beer, malt beverages and soft drinks, including soda water, mineral water and fruit juices as well as cider and long drinks (RTD) holding leading positions in the markets or the segments in which we operate. This overall strategy was defined in connection with the capital increase at the end of 2009.
Our medium-term financial targets were updated in August 2013 in connec-tion with the acquisition of Hartwall. The medium-term financial target is to
achieve an EBIT margin of 13%. The target remains ambitious in a European indus-try context and in light of the expected economic situation in Europe in future years, but also in light of the planned in-vestments in creating long-term organic growth, including particularly in the malt segment.
Royal Unibrew operates in markets that are characterised by different dynamics. This has been taken into account when determining the strategy market by market.
The Danish consumer market is ex-pected generally and continuously to be
MAIN PRIORITIES FOR 2013
The main priorities for 2013 were:
• Focus on markets and segments in which Royal Unibrew holds or may achieve a considerable position.
• Focus on innovation and development of Royal Unibrew’s products and local brand positions.
• Focus on operational efficiency. • Focus on maintaining Royal Unibrew’s
financial flexibility, competitive power and scope for strategic manoeuvrabil-ity through an appropriate capital structure.
A number of growth initiatives were implemented in 2013, including the launching of new products and cam-paigns with a view to maintaining and expanding Royal Unibrew’s market positions. However, the most significant
annual report 2013 Royal UnibRew 9
affected by a minor structural consump-tion decline in the coming years. The beer category will be the primary driver of the structural decline resulting from consumers increasing consuming other alcoholic beverages. Within the classic soft drinks and mineral water categories new product sub-categories are still ex-pected to be developed driven by, among other things, health trends and the need for functional beverages.
In Finland the total beverage market in which Hartwall operates is expected to show a slight structural decline in the coming years, eg due to increas-ing indirect taxes shifting sales to the tax-free and cross-border trade. The Finnish macroeconomy is challenged, which will affect the mix between on-trade, expected to decline, and off-trade, expected to maintain volumes, in the coming years. Innovation will continue to be an important element in developing the overall beverage market.
The Italian beer market has a low per capita consumption since, historically, consumers also have a number of other beverage preferences. In the long term, the beer market is expected to show a slight increase generally and structurally; however, in the near future it will be af-fected by the economic challenges faced by Italy and Italian consumers.
The market for beer, fruit juices, soft drinks and mineral water in the Baltic countries is expected to have a stronger potential, structurally, in the long term than today as macroeconomic condi-tions and spending power improve and unemployment is reduced.
The market for dark malt beverages is ge-ographically fragmented, and consumer preference for dark malt drinks is rooted in tradition. The markets for dark malt beverages in established economies like Europe and the Caribbean are expected to be stable generally and structurally, whereas the markets in a number of de-velopment and growth economies in eg Africa and Central and South America are generally growing driven by improved
macroeconomic conditions and popula-tion growth.
The overall strategy has the following main elements:
• Focus on markets and segments in which Royal Unibrew holds or may achieve a considerable position. Royal Unibrew will focus on further develop-ing established market and segment positions where the Company holds either a leading position, such as in Denmark or the Baltic countries, or considerable and leading niche positions, such as in Italy or in the international malt beverages mar-kets. Mainstream market positions in consolidated markets must lead to, or hold prospects of leading to, a role as a leading player to create attrac-tive profitability. Mainstream market positions in smaller markets may often be reinforced through focus on a broader beverage portfolio to lever-age customer relations and the entire infrastructure. Royal Unibrew’s natural market area is characterised by considerable industry concentration. To the extent that structural growth opportunities might reinforce existing market positions or create new market positions, these will be assessed provided that there is a clear strategic match and that long-term shareholder value can be created.
• Focus on innovation and develop-ment of Royal Unibrew’s products and local brand positions. Royal Unibrew’s strong position as a regional brewer builds on strong local market positions established on the basis of well-known local brands subject to continuous further development. The product portfolio development includes the Group’s own development of new taste varieties, products and brands for existing and new beverage catego-ries as well as the conclusion of new licence agreements both as a licensee and a licensor. For example, Royal Uni-brew benefits from a long-standing co-operation with PepsiCo and Heineken as a licensee in Denmark and Finland –
a cooperation through which the local brand portfolios are expanded with well-known international brands.
• Focus on operational efficiency. Royal Unibrew will continue its focus on pursuing all opportunities of enhanc-ing the efficiency of all links in the Company’s value chain.
• Focus on maintaining Royal Unibrew’s financial flexibility, competitive power and scope for strategic manoeuvrabil-ity through an appropriate capital structure.
MAIN PRIORITIES FOR 2014
In North Western Europe Royal Unibrew holds a number two market position approaching the market with a broad beverage portfolio. In light of the minor structural market decline, innovation and value management are essential to creating growth – and are key elements in developing and maintaining Royal Unibrew’s position in the individual markets and in extending customer cooperation. At the same time, our broad beverage portfolio supports high op-erational efficiency at all organisational levels. Our continuous improvement work will continue determinedly at all organisational levels, including through investment-driven initiatives, which will also contribute positively to improve-ments.
To secure Hartwall’s continued position as a market-leading beverage provider in Finland where consumption is declining and competition has intensified due to, among other things, increasing indirect taxes and increased private import, our main priority in 2014 will be to create a more flexible and customer- and market-oriented business. The integration of the export business will be implemented during the first months of the year, while the IT integration will continue through-out the year. Efforts will be directed at continuous improvements with focus on creating a competitive business with strong local brands. Commercially, value management and development of the
10 Royal UnibRew annual report 2013

Forward-looking stateMents
This Annual Report contains forward-looking statements. Undue reliance should not be placed on forward-looking statements because they relate to and depend on circumstances that may or may not occur in the future and actual results may differ materially from those in forward-looking statements. Forward-looking statements include, without limitation, statements regarding our business, financial circumstances, strategy, results of operations, financing and other plans, objectives, assumptions, expectations, prospects, beliefs and other future events and prospects. We undertake no obligation, and do not intend to publicly update or revise any of these forward-looking statements, unless prescribed by law or by stock exchange regulations.
business-to-business cooperation will have high priority.
In Italy Royal Unibrew has invested in building up an innovative and engaging communication platform to ensure a high presence in the social media and on TV. This market approach has been sat-isfactory, and in 2014 marketing through this platform will be further embedded. We plan to intensify our cooperation with the many distributors and cash & carry customers, and our cooperation with off-trade customers will be sup-ported by consumer-activating activities.
In Eastern Europe, Royal Unibrew operates with a broad brand portfolio, primarily within beer, fruit juices, soft drinks and mineral water. The develop-ment and continued strengthening of the beverage portfolio are necessary to create a basis for growth, including for extending customer cooperation. With the investment in both capacity and competences within cans, a solid basis for leveraging the new commercial initia-tives has been created.
In the Malt Beverages area, we focus on establishing a strong growth platform. We will focus on both a deeper presence in already established markets and on establishment in new markets through cooperation with distributors in the case of exports, or through breweries in the case of licence sales. Great emphasis is placed on selecting and retaining our business partners and on supporting our cooperation through customer- and consumer-oriented marketing invest-ments with a view to establishing and reinforcing brand positions. Continued reinforcement of the field organisation is
key to realising our growth strategy for the business area.
Financial targets and capital structureIn 2013 cash flows and net interest-bearing debt were positively affected, extraordinarily, by the sale of parts of the brewery site in Aarhus and the Hartwall acquisition. In the coming years cash flows are expected to be further positively affected, extraordinarily, by the sale of the remaining part of the brewery site in Aarhus.
The starting point for Royal Unibrew’s further development and achievement of the financial targets is an effort that will be characterised by business development through continued focus on growth opportunities, innovation, sales and marketing, and by continuous efforts to improve, optimise and enhance the efficiency of Royal Unibrew. Against this background the framework for real-ising the financial targets is considered intact.
ebit MarginThe medium-term EBIT margin target is about 13%.
indebtednessIt remains Royal Unibrew’s objective to maintain its indebtedness at a level which, on the one hand, satisfies the request for flexibility with respect to acting on business opportunities and maintaining independence in relation to the Group’s bankers, and, on the other hand, ensures that Royal Unibrew is not heavily overcapitalised.
It remains Royal Unibrew’s target that net interest-bearing debt should not
exceed 2.5 times EBITDA and that an equity ratio of at least 30% should be maintained at year end.
Royal Unibrew’s annual investments are still expected to be at the level of 4-6% of net revenue depending on the need for maintenance and efficiency-enhancing investments or capacity investments.
distribution policyORdinaRy distRiBUtiOnAs Royal Unibrew is still expected to gen-erate a rather significant liquidity surplus going forward, it remains the intention currently to make distributions to share-holders through a combination of annual dividend and share buy-backs taking into account the mentioned targets for equity ratio and indebtedness, annual earnings and cash flows as well as Royal Unibrew’s strategic position in general.
It remains Royal Unibrew’s intention to distribute dividend of 40-60% of net profit for the year and to launch share buy-back programmes if it is considered appropriate to optimise the Company’s capital structure. It is the intention that shares bought back will be cancelled. In addition to adjusting the Company’s capital structure, share buy-backs are also expected to increase the liquidity of the Royal Unibrew share to the benefit of all shareholders.
Royal Unibrew gives high priority to realising the NIBD/EBITDA ratio target and thus to reducing debt. Therefore, the Board of Directors will recommend to the AGM in 2014 that no dividend be distrib-uted for 2013, and no share buy-backs are expected to be made in 2014.
annual report 2013 Royal UnibRew 11

12 Royal UnibRew annual report 2013

Financial Review
Continued focus on further developing market and segment positions, products and brands as well as a high efficiency and a good summer resulted in a performance above expectations at the beginning of the year and significantly above that of 2012 in spite of continuously challenging market conditions in 2013. Moreover, the Hartwall acquisition is expected already as of 2014 to lead to increased earnings per share before integration costs.
BUSINESS CHANGES
The acquisition of the Finnish brewery business Oy Hartwall Ab was realised on 23 August 2013 (see Company Announce-ment No 38/2013 of 23 August 2013). At the same time, Royal Unibrew A/S car-ried out a directed issue and sold 37,500 treasury shares to the Finnish invest-ment company Hartwall Capital (HC 7 Holding Oy Ab) (see Company Announce-ment No 36/2013 of 23 August 2013).
At Royal Unibrew’s extraordinary general meeting on 26 September 2013, Karsten M. Slotte was elected to the Board of Di-
rectors of Royal Unibrew A/S in order to add to the Board competences relating to Finnish FMCG business.
In December 2013 additionally 19,600 square metres of the total 140,000 square metres of building rights relat-ing to the brewery site in Aarhus were sold, after which 55,100 square metres of building rights in total have been sold (see Company Announcement No 57/2013 of 2 December 2013). The sale was made in accordance with the option-based cooperation agreement entered into with A. Enggaard Entreprenør- og Byggefirma A/S, and cash flow after tax
from the sale amounted to approx DKK 60 million. The selling price corresponds to the carrying amount of the building rights; therefore, Royal Unibrew’s profit and equity are not affected by the sale.
BUSINESS DEVELOPMENT
Royal Unibrew has acquired the Finnish brewery business Hartwall, thus signifi-cantly reinforcing its market position in the North East European region and expanding its position as the second-largest brewery group in the Nordic and Baltic countries. The acquisition is part of the realisation of Royal Unibrew’s overall strategy, including the focus on markets and segments in which Royal Unibrew may achieve a considerable position. In addition to the Hartwall acquisition, Royal Unibrew reinforced its market posi-tion in 2013, and generally the Group’s branded products increased their market shares in the main markets.
In 2013 Royal Unibrew improved its earn-ings considerably over 2012. Earnings before interest and tax (EBIT) amounted to DKK 560 million, which is DKK 75 mil-
ebitda (mDKK)
2009 2010 2011 2012 20130
200
400
600
800
1,000
current 12-Month developMent* (%) (mDKK)
Q1 Q2 Q3 Q4 Q1 Q2 Q3 Q42012 2013
0
1,000
2,000
3,000
4,000
5,000
10
11
12
13
14
15
EBIT margin Net revenue
* excl divestments and acquisitions in the period
annual report 2013 Royal UnibRew 13

lion above the 2012 figure. Profit before tax for the year amounted to DKK 548 million, which is DKK 67 million above the 2012 figure. Free cash flow of DKK 598 million showed a DKK 122 million improvement on 2012, to which Hartwall contributed DKK 83 million. Deducting the proceeds from the share issue and the sale of treasury shares relating to the Hartwall acquisition, the acquisition increased net interest-bearing debt by DKK 2,302 million. Net interest-bearing debt at the end of 2013 amounted to DKK 2,379 million.
INCOME STATEMENT
Beer and soft drinks consumption in Royal Unibrew’s markets in Western Europe and North East Europe contin-ued to decline in 2013 due to consumer restraint. On the other hand, a good
developMents in activities in 2013 broken down on Market segMents
north western east Malt un- europe europe beverages allocated group
2013 2012
Sales (thousand hectolitres) 3,680 2,791 562 - 7,033 5,443Growth (%) 10.7 67.7 23.2 29.2 -4.0Share of sales (%) 52 40 8 - 100 -Net revenue (mDKK) 2,650 1,450 381 - 4,481 3,430Growth (%) 9.1 147.9 -8.3 30.6 -0.0Share of net revenue (%) 59 32 9 - 100 -EBIT (mDKK) 424.0 101.6 81.3 -46.8 560.1 485EBIT margin (%) 16.0 7.0 21.4 12.5 14.1
summer in North Western Europe and the Baltic countries resulted in increased consumption as compared to 2012. Royal Unibrew’s branded products generally increased their market shares in the main markets.
Sales for 2013 aggregated 7.0 million hectolitres of beer, malt beverages and soft drinks, which is 29% above the 2012 figure. In organic terms (adjusted for divestment of Impec in 2012 and the Hartwall acquisition in 2013), sales were 12% higher. Q4 2013 sales showed organic growth of 15%.
Net revenue for 2013 showed a 30% increase over 2012 and amounted to DKK 4,481 million (2012: DKK 3,430 million). In organic terms, net revenue was 11% above the 2012 figure. Net revenue was positively affected by the higher sales in the summer season and by value
management measures, and trading challenges in the Danish off-trade sales channel for a number of competing products from May to the end of 2013 contributed to the net revenue growth. On the other hand, consumer restraint affected net revenue development negatively. Q4 2013 net revenue showed organic growth of 15%.
Gross profit amounted to DKK 2,285 million compared to DKK 1,716 million in 2012. In organic terms, gross profit increased by DKK 193 million. The higher gross profit relates to the net revenue in-crease and to an improved gross margin. Gross margin went up by 0.9 percentage point from 50.0% to 50.9%. In organic terms, gross margin went up by 0.1 percentage point. Gross profit was posi-tively affected by higher efficiency at the breweries. The average net selling price per volume unit increased in 2013 due
ebit (mDKK)
ebit Margin (%)
result beFore tax (mDKK)
2009 2010 2011 2012 20130
100
200
300
400
500
600
2009 2010 2011 2012 20130
3
6
9
12
15
2009 2010 2011 2012 20130
100
200
300
400
500
600
14 Royal UnibRew annual report 2013

to, among other factors, the Hartwall acquisition, whereas an additional sales channel shift from on-trade towards off-trade affected net selling price and thus gross margin negatively.
Sales and distribution expenses for 2013 amounted to DKK 1,449 million, which is DKK 386 million above the 2012 figure (in organic terms, DKK 120 million above the 2012 figure). The greater part of the in-crease is directly related to the increased sales. Investments in the market in 2013 remained at a high level by way of increased sales and marketing expenses for both new and existing brands. Op-positely, higher efficiency in distribu-tion reduced distribution expenses per volume unit.
Administrative expenses for 2013 were DKK 91 million higher amounting to DKK 264 million compared to DKK 173 million in 2012. In organic terms, expenses were DKK 26 million higher due to, among other factors, expenses for consulting as-sistance and performance-related bonus schemes for 2013.
Earnings before interest, tax, deprecia-tion and amortisation (EBITDA) increased by DKK 121 million in 2013 amounting to DKK 732 million compared to DKK 611 mil-lion in 2012. As expected, EBITDA relating to Hartwall amounted to DKK 94 million in the period from the acquisition on 23 August 2013. In organic terms, EBITDA increased by DKK 32 million over 2012. Q4 2013 EBITDA amounted to DKK 187 mil-lion, whereas, in organic terms, EBITDA was marginally lower than in 2012.
Earnings before interest and tax (EBIT) were DKK 75 million above the 2012 figure and amounted to DKK 560 million, including DKK 38 million relating to Hart-wall, which was DKK 13 million above expectations. As expected, transaction costs amounted to DKK 15 million. In organic terms, EBIT for 2013 amounted to DKK 522 million, which was as expected. Q4 2013 EBIT amounted to DKK 111 mil-lion compared to DKK 85 million in 2012.
As expected, the 2013 EBIT margin of 12.5% was lower than in 2012 due to the Hartwall acquisition and the related amortisation of intangible assets of Hartwall. Excluding Hartwall, EBIT mar-gin was 14.1% as in 2012. The unchanged EBIT margin comprises a lower margin in Western Europe due to a sales shift towards the off-trade sales channel, whereas EBIT margins in the Baltic coun-tries and in the malt beverages segment increased. Q4 2013 EBIT margin was 7.8% and as expected lower than in 2012, partly for the same reasons as for the full year and partly due to a shift in 2013, as compared to 2012, of maintenance, sales and marketing activities towards Q4.
Net financials for 2013 showed a net expense of DKK 12 million, which is a DKK 8 million improvement on 2012. Net financials in the period were DKK 7 million higher. DKK 13 million related to the funding of the Hartwall acquisi-tion. Income after tax from investments in associates was DKK 1 million below the 2012 figure, which was positively af-fected by a non-recurring income of DKK 8 million.
Profit before tax increased by DKK 67 million in 2013 amounting to DKK 548 million compared to DKK 481 million in 2012.
Tax on the profit for 2013 was an expense of DKK 68 million, corresponding to a tax rate of approx 13% of profit before tax. The tax expense for the year is positively affected by an adjustment of the provi-sion for deferred tax of DKK 60 million due to changed corporation tax rates primarily at Hartwall. Eliminated for this and calculated net of income from asso-ciates, the tax rate was 25% as expected. The tax recognised in other comprehen-sive income was an expense of DKK 4 million in 2013 (2012: DKK 0 million).
Net profit for the year amounted to DKK 480 million, which is a DKK 107 million improvement on the profit of DKK 373 million realised in 2012.
The Parent Company’s profit for the year amounted to DKK 462 million compared to DKK 383 million in 2012. Dividend income from subsidiaries and associates amounted to DKK 153 million compared to DKK 65 million in 2012.
BALANCE SHEET
Royal Unibrew’s balance sheet amounted to DKK 6,925 million at 31 December 2013, which is DKK 4,077 million above the figure at 31 December 2012. The Hartwall acquisition increased the balance sheet by DKK 4 billion, compris-ing intangible assets of DKK 2.6 billion,
net interest-bearing debt (mDKK)
net interest-bearing debt / ebitda (Times)
Free cash Flow (mDKK)
2009 2010 2011 2012 20130
500
1,000
1,500
2,000
2,500
2009 2010 2011 2012 2013*0,00,51,01,52,02,53,03,5
2009 2010 2011 2012 20130
100
200
300
400
500
600
* Calculated pro forma with Hartwalls realised full-year EBITDA.
annual report 2013 Royal UnibRew 15

property, plant and equipment of DKK 1.2 billion, and inventories and receivables of DKK 0.2 billion.
Through tight inventory and trade receivables control, the increase in funds tied up in working capital was kept at only approx DKK 40 million in spite of higher raw materials prices and higher net revenue than in 2012.
The equity ratio represented 30.8% at 31 December 2013 compared to 47.3% at the end of 2012. The reduced equity ratio is related to the Hartwall acquisi-tion. Equity at the end of December 2013 amounted to DKK 2,133 million compared to DKK 1,348 million at the end of 2012 and was increased in 2013 by the proceeds from the share issue and the sale of treasury shares of DKK 582 million in connection with the Hartwall acquisition, by the positive comprehen-sive income of DKK 548 million for the period and by DKK 3 million relating to the share-based bonus scheme, whereas distribution of dividend of DKK 242 mil-lion and net share buy-backs of DKK 106 million reduced equity. The comprehen-sive income comprised the profit for the period of 480 million, revaluation of the brewery site in Aarhus of DKK 71 million (after tax), a positive development in the value of hedging instruments of DKK 10 million (after tax) and negative exchange rate adjustments of foreign group enter-prises of DKK 13 million.
Net interest-bearing debt increased by DKK 2,058 million in 2013 to DKK 2,379 million. The Hartwall acquisition less proceeds from the share issue and the sale of treasury shares increased interest-bearing debt by DKK 2,302 million; moreover, DKK 352 million was distributed to shareholders by way of dividend and share buy-backs (2012: DKK 379 million). On the other hand, free cash flow for the year reduced net interest-bearing debt by DKK 598 million, including additional sale of parts of the brewery site in Aarhus of approx DKK 60 million (2012: approx DKK 110 million).
Funds tied up in working capital showed a negative DKK 834 million at the end of 2013, including a negative amount of DKK 619 million attributable to Hartwall. Hartwall’s funds tied up in working capi-tal are positively affected by large parts of the trade receivables being realised at the time of invoicing. Excluding Hartwall, funds tied up in working capital showed a negative DKK 215 million, which is a DKK 36 million improvement from the end of 2012 when working capital amounted to a negative DKK 179 million. Funds tied up in inventories, trade re-ceivables and trade payables were DKK 12 million higher in 2013, whereas the other elements of working capital were DKK 48 million lower than at the end of 2012. All entities continue their strong focus on managing inventories, trade receivables and trade payables.
CASH FLOW STATEMENT
Cash flow from operating activities showed a DKK 156 million improvement on 2012 amounting to DKK 653 million for 2013 (2012: DKK 497 million). Cash flow comprised the profit for the period adjusted for non-cash operating items of DKK 735 million (2012: DKK 611 million), positive working capital cash flow of DKK 91 million (2012: DKK 22 million), net interest paid of DKK 55 million (2012: DKK 31 million) and taxes paid of DKK 118 million (2012: DKK 105 million). Interest paid in 2013 was affected by loans raised to fund the Hartwall acquisition of DKK 13 million and by prepayments on these of DKK 11 million. Hartwall contributed DKK 98 million to cash flow from operat-ing activities, including DKK 81 million attributable to profit for the period and DKK 41 million attributable to the posi-tive development in working capital less interest paid of DKK 15 million and tax payments of DKK 9 million.
Free cash flow amounted to DKK 598 million for 2013 compared to DKK 476 million for 2012. The DKK 122 million increase in free cash flow comprised DKK 83 million relating to Hartwall, a DKK
64 million improvement of operating cash flow and dividend from associ-ates with deduction of DKK 25 million higher net investments in property, plant and equipment. Gross investments in property, plant and equipment for 2013 amounted to DKK 143 million, including DKK 15 million relating to Hartwall, com-pared to DKK 154 million in 2012, whereas sale of property, plant and equipment net of tax amounted to DKK 68 million compared to DKK 119 million in 2012. The key part, approx DKK 60 million, of the cash flow from the sale of assets in 2013 related to the sale of an additional part of the brewery site in Aarhus.
BREWERY SITE IN AARHUS
In accordance with the cooperation agreement, A. Enggaard Entreprenør- og Byggefirma A/S has options to purchase building rights for a total of 140,000 square metres at the brewery site in Aarhus in the period to the end of 2016. At the end of 2013 building rights for a total of 55,100 square metres have been sold, and at the end of 2013 A. Enggaard Entreprenør- og Byggefirma A/S notified Royal Unibrew that he wishes to acquire additionally 8,775 square metres. This sale is expected realised in Q2 2014, after which an option for 76,125 square metres of building rights will remain. The realisation and timing of the total sale of the brewery site in Aarhus are subject to uncertainty. In Royal Unibrew’s opinion – given market conditions – the cooperation model adopted creates a good basis for realising the value of the total brewery site. The carrying amount of the remaining building rights at 31 De-cember 2013 was DKK 291 million, which corresponds to the estimated fair value calculated by applying unchanged as-sumptions as compared to 30 June 2013 in respect of estimated selling prices and milestone dates under the cooperation agreement, estimated costs up until the date of sale (property taxes, project and selling costs) and the discount rate. A sale at carrying amount will trigger a tax payment of approx DKK 60 million.
16 Royal UnibRew annual report 2013

Outlook
The outlook for Royal Unibrew’s financial development in 2014 has been prepared taking into account a number of circumstances, including how the Company’s markets are expected to be affected by general economic activity, fiscal measures and the consumer uncertainty which is directly affected by the macroeconomic sentiment and development. Moreover, the outlook has been prepared taking into account the development in material expense categories as well as the effect of initiatives initiated.
Management’s financial performance outlook for 2014 is based on the follow-ing main assumptions:
• Consumption in the North Western Eu-ropean market is expected to show a slight decline, partly due to a structur-al market decline, partly due to the ex-pectation of a normal summer. In the Finnish market and for the premium/super premium category in Italy, a low single-digit percentage consumption decline is expected. Both Finland and Italy are generally expected to see a volatile and declining market due to negative economic growth, low con-sumer confidence and fiscal measures implemented and expected. Consump-tion in the Baltic markets is expected to be stable, but with a market and product mix in which the beer market is expected to decline slightly, whereas the fruit juice/soft drinks market is expected to increase slightly. The market for malt beverages in Europe and the Caribbean is expected to remain unchanged, whereas moder-ately increasing markets are expected in a number of African and Central American countries driven by slightly
improved macroeconomic conditions and population growth.
• Royal Unibrew’s market shares on branded products in Europe are gener-ally expected to be maintained or increased for the key brands in main markets, except for the market target-ing Danish consumers. This market is expected to normalise as parts of 2013 were characterised by temporar-ily high market shares due to trading challenges in the Danish off-trade sales channel for a number of compet-ing products. The previously men-tioned private label agreement in Den-mark which Royal Unibrew has held for the past two years has not been extended, which is expected to affect both revenue and sales negatively. Royal Unibrew’s market shares in the Malt Beverages segment are expected to increase due to increased market penetration in existing markets and expansion into new markets.
• The main focus of the integration work at Hartwall is to strengthen com-petitive power in both the short and long term. These efforts are pursued
against the backdrop of a challenging macroeconomic situation in Finland, increased competitive pressures which have caused Hartwall to lose market shares for several years as well as increasing indirect taxes and, con-sequently, increased private import. In the efforts to improve Hartwall’s competitive power, restructuring ne-gotiations have been conducted with the employees since mid-January in accordance with procedures laid down. The negotiations and conclusions are expected completed within a short time. The restructuring topics com-prise both staff reduction and an or-ganisational change – with the aim of increasing market and customer focus and creating greater organisational agility and flexibility. Independently of the staff-related restructuring negotia-tions, cross-organisational efforts are directed at increasing efficiency and in-tegrating the export and IT functions.
• Unchanged net selling price increases are assumed.
• It is estimated that the cost develop-ment in a number of indirect cost categories noted during 2013 will continue in 2014.
• The continuous efficiency improve-ment in all parts of the business will continue in 2014.
• As in 2013, increased investments are expected in organisation, sales and marketing in the Malt Beverages seg-ment with a view to strengthening the business area in the medium term.
annual report 2013 Royal UnibRew 17

• The prices of the key raw materials cat-egories are expected to show a stable to slightly declining in 2014. In 2013 Royal Unibrew entered into hedging agreements covering the greater part of estimated consumption in 2014. The development comprises geographic as well as product-related differences, with some categories being expected to increase whereas others are ex-pected to decline.
• The Malt Beverages segment is still ex-pected in the medium term (measured at unchanged exchange rates) to hold potential for an average annual rev-enue growth of 10-15%, whereas, with the existing market mix, EBIT margin is expected to be at the level of 20%.
• Exchange rates between DKK and other currencies are expected to
remain unchanged as compared to the end of 2013.
• Gross investments are expected to amount to DKK 230-250 million.
• Tax is expected to amount to approx 23% of profit before tax excluding income after tax from investments in associates.
OUTLOOK FOR 2014
Calculated on a pro forma basis with Hartwall’s realised net revenue and re-sults for all of 2013, net revenue amount-ed to DKK 6,050 million, EBITDA to DKK 1,015 million and EBIT margin was 12.0%.
In consequence of the above-mentioned expectations of the development in consumption and Royal Unibrew’s market shares, including the normalisa-tion of volumes and the termination of a private label contract in North Western Europe, net revenue for 2014 is expected to show a low one-digit percentage point decline as compared to the pro forma net revenue calculated for 2013. EBITDA is ex-
pected realised slightly higher than the pro forma EBITDA calculated for 2013. The outlook for 2014 will be updated when the restructuring negotiations with the employees at Hartwall and conclusions have been completed in accordance with the procedures laid down.
It remains the Group’s target to increase EBIT margin to 13% in the medium term.
Due to the priority given to debt reduc-tion, the Board of Directors recommends that no dividend be distributed in 2014; moreover, the Board of Directors does
not expect to initiate any share buy-backs in 2014. proforma actual realised 2013* 2013**
Net revenue (mDKK) 4,481 6,050EBITDA (mDKK) 732 1,015EBIT (mDKK) 560 730
* In 2013, Hartwall was included in results for the period 23 August – 31 December with net revenue of DKK 787 million, EBITDA of DKK 94 million and EBIT of DKK 38 million after deduct-ing transaction costs of DKK 15 million.
** Pro forma realised 2013 is calculated with Hart-wall’s realised net revenue and full-year results before deducting transaction costs.
18 Royal UnibRew annual report 2013

annual report 2013 Royal UnibRew 19

Royal Unibrew’s market shares increased both in Northern Europe and in Italy in 2013. Focus on value management and a good summer ensured increasing net revenue and earnings in spite of consumer restraint.
shifts in market and channel mix and intensified competition in North Western Europe affected net revenue negatively.
Earnings before interest and tax (EBIT) increased by DKK 16 million in 2013 amounting to DKK 424 million. EBIT margin was 16.0% compared to 16.8% in 2012. Q4 2013 EBIT was DKK 12 million lower than in 2012, and EBIT margin was 4 percentage points lower. EBIT was positively affected by the higher sales, whereas both EBIT and EBIT margin were negatively affected by the shift from on-trade towards off-trade, a shift in main-tenance expenses as well as increased investments in sales and marketing activities to create future earnings. This was especially the case in Q4.
and for 76% of EBIT (2012: 71% and 84%, respectively).
Sales in Western Europe for the full year as well as in Q4 2013 were signifi-cantly higher than in 2012. Royal Unibrew generally increased its market shares on branded beer and soft drinks. The posi-tive sales development is due to a good summer in North Western Europe and to the market situation in the Danish off-trade channel in the last eight months of the year. These factors more than offset the continued consumer restraint. Net revenue for the full year went up by 9% and for Q4 by 15% as compared to 2012. Other than the effect of higher sales, net revenue was positively affected by value management measures, whereas
The Western Europe segment comprises the markets for beer and soft drinks in North Western Europe (Denmark, other Nordic countries and Germany) as well as in Italy. In 2013 Western Europe account-ed for 59% of the Group’s net revenue
Western Europe
sales (thousand hectolitres)
2011 2012 20130
600
1,200
1,800
2,400
3,000
3,600
ebit (mDKK)
2011 2012 20130
100
200
300
400
500
600
ebit Margin (%)
2011 2012 20130
5
10
15
20
25
30
net revenue (mDKK)
2011 2012 20130
600
1,200
1,800
2,400
3,000
3,600
western europe
2013 2012 2013 2012 q1-q4 q1-q4 change q4 q4 change
Sales (thousand hectolitres) 3,680 3,323 10% 924 787 17%Net revenue (mDKK) 2,650 2,430 9% 635 550 15%EBIT (mDKK) 424.0 408.2 76.6 88.5 EBIT margin (%) 16.0 16.8 12.1 16.1
20 Royal UnibRew annual report 2013

DEVELOPMENTS IN 2013
It is estimated that north Western Europe has seen unchanged consump-tion of beer and soft drinks among Dan-ish consumers in 2013. Different sum-mer weather and indirect tax changes – increase in 2012 and reduction in 2013 -, however, make it difficult to make a valid comparison of market developments from 2012 to 2013.
Royal Unibrew’s sales for 2013 increased by 12% over 2012, and net revenue in-creased by 11%. The good summer weath-er and temporary trading challenges for a number of competing products with a major Danish retail chain in 2013 af-fected sales and net revenue positively as compared to 2012. It is estimated that the market share for branded beer and soft drinks products increased in 2013. In early 2013 selective net selling price increases were introduced to compen-sate partly for the higher raw materials prices, which also affected net revenue positively.
In 2013 Royal Unibrew continued focus-ing on value management, commercial
Royal Unibrew is the number two provider of beer and soft drinks to Danish consumers in terms of size.
Within beer, Royal Unibrew offers a combination of strong international, national and local brands. Royal Beer and the international licence brand Heineken are offered to the entire Danish market, whereas other brands are offered in areas with strong local rooting.
Within soft drinks, Royal Unibrew offers its own brands as well as licence-based brands of the Pepsi Group. Own brands comprise Faxe Kondi, which is the lead-ing brand in the lemon/lime segment, as well as Nikoline. The Pepsi products include Pepsi, Pepsi Max, 7UP and Mirinda.
Within spring water and natural mineral water, Egekilde is marketed in a num-ber of taste varieties, still as well as sparkling.
Within related categories, Royal Unibrew offers Faxe Kondi Booster in the energy drink segment as well as a number of products in the cider and ready-to-drink segments.
Sales take place business-to-business, whereas the Group’s products are pri-marily distributed through the Group’s own distribution system to the individu-al business-to-business customer within both on-trade and off-trade.
innovation, including campaigns/prod-uct activation and product development as well as marketing investments. There-fore, expenses have gone up. New taste varieties of Faxe Kondi Booster, Nikoline, Egekilde and within the RTD segment with Tempt Blue Desire were launched, which have already contributed towards reinforcing Royal Unibrew’s market posi-tion. And with the investment in a new canning unit, Royal Unibrew continued its strong focus on innovation of con-
tainer and packaging varieties. Through sponsoring of the SMUK Festival at-tended by more than 50,000 people, ”Tak Rock” (Thank you, Rock) concerts at Tivoli as well as a major joint “bottle top hunt” campaign for all of Royal Unibrew’s soft drinks products, Royal Unibrew contin-ued its focus on consumer-engaging activities.
In Germany Faxe sales continued to increase.
North Western Europe
Profile
north western europe
2013 2012 2013 2012 q1-q4 q1-q4 change q4 q4 change
Sales (thousand hectolitres) 3,271 2,919 12% 853 718 19%Net revenue (mDKK) 2,043 1,833 11% 528 442 19%
annual report 2013 Royal UnibRew 21

DEVELOPMENTS IN 2013
The market situation in italy remains characterised by economic uncertainty, consumer restraint and downtrading, which, as expected, affected total beer consumption negatively. Consumption declined in the off-trade channel as well as in the on-trade channel, whereas the premium and super premium segment maintained its market share.
Royal Unibrew’s sales and net revenue which primarily relate to the super pre-mium brand Ceres Strong Ale increased in 2013. Net revenue increased by 2% partly due to increased Ceres Strong Ale sales, partly due to an improved channel mix. Isolated in Q4 2013 the product mix shifted as compared to 2012 towards products with a lower net selling price per volume unit. It is assessed that Royal Unibrew has increased its market share in the premium and super premium segment.
Investments in the consumer commu-nication platform for Ceres Strong Ale, with a broad coverage from social media
Ceres Strong Ale is among the market leaders in the beer super premium seg-ment and holds a considerable market share in this segment
It is assessed that about 75% of Ceres Strong Ale is consumed out of home, whereas the rest is consumed at home, which is the opposite of the general beer market in Italy. Ceres Strong Ale has achieved a very high distribution in the on-trade channel, where the product has one of the broadest distributions across categories.
Moreover, Royal Unibrew sells Ceres Red Erik in the super premium segment as well as the lager types Ceres Top Pilsner and Faxe in the premium segment.
Distribution takes place through wholesalers who service and supply custom-ers in the on-trade channel, to a number of cash & carry customers where on-trade customers themselves pick up the goods and to retail customers where Royal Unibrew delivers the goods directly through third-party suppliers. Sales efforts in the on-trade channel are primarily directed at business-to-business as well as at selected outlets.
to TV commercials, continue. With more than 600,000 fans on facebook, Ceres Strong Ale has proved its appeal to the younger consumer segment. Investment in marketing of Ceres Strong Ale is a key priority and was at a high level also in 2013.
Italy
Profile
italy
2013 2012 2013 2012 q1-q4 q1-q4 change q4 q4 change
Sales (thousand hectolitres) 409 404 1% 71 69 3%Net revenue (mDKK) 607 597 2% 107 108 -1%
22 Royal UnibRew annual report 2013

The Hartwall acquisition significantly reinforced Royal Unibrew’s market position in the region. Hartwall’s sales and net revenue for 2013 were as expected. A consumption decline in the Baltic countries due to continued consumer restraint was offset by higher market shares and a favourable development in the consumption of branded products.
sales by 58% and net revenue by 135%. In organic terms (in the Baltic countries), sales thus increased by 10%, whereas net revenue increased by 13% over 2012. Q4 2013 sales increased by 11% and net revenue by 12% in organic terms. Royal Unibrew increased its market shares.
Earnings before interest and tax (EBIT) for 2013 were DKK 74 million above the 2012 figure and amounted to DKK 102 million. In organic terms (in the Baltic countries), EBIT increased by DKK 22 million to DKK 49 million. The favourable development is caused by a combination of higher supply chain efficiency, a fa-vourable development towards branded products and increased market shares. EBIT margin increased by 2.6 percentage points from 4.7% to 7.3% in organic terms (in the Baltic countries).
The north East Europe segment primar-ily comprises the markets for beer, fruit juices and soft drinks in the Baltic coun-tries (Lithuania, Latvia and Estonia) and with the acquisition of Hartwall as of 23 August 2013 also Finland. In 2013 North East Europe accounted for 32% of the Group’s net revenue and for 18% of EBIT (2012: 17% and 6%, respectively).
The summer was better in 2013 than in 2012 in the North East European region, which affected beer, fruit juice and soft drinks consumption positively, whereas consumer restraint in Royal Unibrew’s North East European markets resulted in lower consumption than in 2012 in both the Baltic countries and Finland.
Sales and net revenue increased by 68% and 148%, respectively, in 2013. The Hart-wall acquisition in August 2013 increased
North East Europe
north east europe
2013 2012 2013 2012 q1-q4 q1-q4 change q4 q4 change
Sales (thousand hectolitres) 2,791 1,664 68% 1.094 361 204%Net revenue (mDKK) 1,450 585 148% 708 128 454%EBIT (mDKK) 101.6 27.3 32.1 -5.5 EBIT margin (%) 7.0 4.7 4.5 -4.3
* Including the Polish subsidiary sold in March 2011.** Including Hartwall acquired on 23 August 2013.
sales (thousand hectolitres)
2011* 2012 2013**0
500
1,000
1,500
2,000
2,500
3,000
ebit (mDKK)
2011* 2012 2013**0
20
40
60
80
100
120
ebit Margin (%)
2011 2012 20130
2
4
6
8
10
12
net revenue (mDKK)
2011* 2012 2013**0
500
1,000
1,500
2,000
2,500
3,000
annual report 2013 Royal UnibRew 23

DEVELOPMENTS IN 2013
In spite of a continued positive devel-opment in the Baltic economies, total consumption of beer, fruit juices and soft drinks declined in the Baltic markets due to consumer restraint. A good summer partly compensated for the effect of the continued consumer restraint.
Sales and net revenue increased by 10% and 13%, respectively, in 2013. Q4 2013 sales increased by 10% and net revenue by 12%. Net revenue per volume unit increased as Royal Unibrew has con-centrated its activities on the market for branded products. The total Baltic market for branded products grew in 2013, whereas the economy segment declined. The start-up of activities in Es-tonia and of the distribution of Heineken in the Baltic countries contributed to the market share development to a smaller extent and progressed as planned. The net revenue increase is thus caused by a combination of favourable product mix and increased market shares.
The level of innovation has been high in 2013 for beer products with the launch in Lithuania and Latvia of new Kalnapilis and Lacplesis product varieties with new
In the Baltic countries, Royal Unibrew offers a combination of its own strong national and regional brands as well as international Heineken brands.
Royal Unibrew’s brewery business Kalnapilio-Tauro Grupe is the second largest in Lithuania. Within beer, the national brands are Kalnapilis and Taurus, and Faxe is a leading international brand. Cido is the number two fruit juice brand in terms of size.
In Latvia Royal Unibrew’s Cido Grupa is the largest provider of fruit juices and soft drinks as well as the number three provider of beer. Within beer, the national brands Lacplesa Alus and Livu Alus are offered, and within soft drinks a complete portfolio of fruit juice products is offered under the Cido brand. Mineral water is sold under the Mangali brand and nectar drinks are sold under the Fruts brand.
The primary brands in Estonia are Cido in the soft drinks category and Meistriti Gildi and Faxe in the beer category.
taste and in exclusive profile bottles, as well as for soft drinks products with the launch of a new strawberry-flavoured va-riety of Cido Enjoy and SunSet Cranberry, a soft drink for adults.
The Baltic countries
Profile
baltic countries
2013 2012 2013 2012 q1-q4 q1-q4 change q4 q4 change
Sales (thousand hectolitres) 1,830 1,664 10% 398 361 10%Net revenue (mDKK) 663 585 13% 144 128 12%
24 Royal UnibRew annual report 2013

DEVELOPMENTS IN 2013
Prior to the Hartwall acquisition on 23 August 2013, Royal Unibrew did not oper-ate in the Finnish market.
As expected, the Finnish market for beer, soft drinks, wine and spirits products was characterised by consumer restraint due to negative economic growth in 2013.
Sales and net revenue in the period from Royal Unibrew’s acquisition of Hartwall in August 2013 were as expected and at the level of the results realised by Hart-wall in the same period of 2012. Indirect tax increases per 1 January 2014 affected sales in fourth quarter positively.
The integration of Hartwall into the Group was commenced immediately after the acquisition when an activ-ity plan and timetable were prepared. Integration is progressing as planned. A key element of the integration plan is to ensure Hartwall’s continued position as a market-leading beverage business in Finland. Therefore, the market conditions and the business were thoroughly ana-lysed in 2013 with a view to identifying the need for organisational changes and for adjustment of the existing compe-tences of Hartwall. In January 2014 nego-
In Finland Royal Unibrew offers a combination of its own strong national brands, international Pepsi and Heineken brands as well as a number of inter-national wine and spirits brands.
Royal Unibrew’s activities are carried out through Hartwall, a multi-beverage business with a broad product range holding a clear runner-up position in Fin-land. With its own brands such as the Karjala and Lapin Kulta beer brands, Jaffa (soft drinks), Original (RTD), Upcider (cider), ED (energy drink) and Novelle (min-eral water) as well as international brands such as Fosters, Heineken and Pepsi, Hartwall is the market leader in the categories of mineral water, cider and ready-to drink (RTD) and a strong runner-up in the categories of branded beer, soft drinks and energy drinks. The trading company Hartwa-Trade operates agencies for a number of international wine and spirits brands and contributes 13% of Hartwall’s revenue.
Hartwall is headquartered in Helsinki and operates two modern production fa-cilities in Lahti (produces all products but mineral water) and Karijoki (produces mineral water). A distribution network of 21 terminals supplies approx 15,000 off-trade and on-trade Hartwall customers directly. Hartwall sells about 90% of its production in its domestic market and the rest is exported, especially for cross-border trade in the Baltic countries.
tiations on organisational restructuring of Hartwall were initiated. The nego-tiations and conclusions are expected completed within a short time in accord-ance with the procedures laid down. At the time of the acquisition, Hartwall’s IT platform was integrated in Heineken’s IT
platform; as part of the integration plan, migration to Royal Unibrew’s IT platform has commenced. Similarly, export sales and the purchasing function, which have so far been handled by Heineken, will be insourced.
Finland
Profile
Finland
2013 2012 2013 2012 q1-q4 q1-q4 change q4 q4 change
Sales (thousand hectolitres) 961 - - 696 - -Net revenue (mDKK) 787 - - 564 - -
ebitda (mDKK)
2011 2012 20130
100
200
300
400
500
600
net revenue (mDKK)
2011 2012 20130
500
1,000
1,500
2,000
2,500
3,000
Hartwall’s historical development
annual report 2013 Royal UnibRew 25

Higher sales in existing markets and market coverage expansion resulted in a considerable sales increase in 2013. As expected, net revenue and earnings developments were affected by the sale of Impec in November 2012 and by investment in developing new markets and sales organisation.
The Malt Beverages segment comprises the export and licence business for malt beverages and beer exports to other mar-kets. In 2013 malt beverages accounted for 9% of the Group’s net revenue and for 15% of EBIT (2012: 12% and 17%, respec-tively).
Sales increased by 23% in 2013, whereas net revenue declined by 8%. Q4 sales increased by 13% and net revenue by 1%. In organic terms (eliminated for divest-ment of the Group’s Caribbean distribu-tion company in November 2012), sales increased by 25% and net revenue by 21%
Malt Beverages
Malt beverages
2013 2012 2013 2012 q1-q4 q1-q4 change q4 q4 change
Sales (thousand hectolitres) 562 456 23% 118 105 13%Net revenue (mDKK) 381 415 -8% 83 82 1%EBIT (mDKK) 81.3 83.9 13.2 14.8 EBIT margin (%) 21.4 20.2 15.9 18.2
sales (thousand hectolitres)
2011 2012 20130
100
200
300
400
500
600
ebit (mDKK)
2011 2012 20130
20
40
60
80
100
120
ebit Margin (%)
2011 2012 20130
5
10
15
20
25
30
net revenue (mDKK)
2011 2012 20130
100
200
300
400
500
600
26 Royal UnibRew annual report 2013

in 2013. Q4 2013 sales and net revenue increased by 15% and 16%, respectively, in organic terms.
Sales in the segment are characterised by large volumes being exported to distributors at a time, which means that inventory changes should be taken into account when comparing periods.
Earnings before interest and tax (EBIT) for 2013 amounted to DKK 81 million, which is DKK 3 million below the 2012 figure. EBIT margin was 21.4% in 2013 compared to 25% for the continuing operations in 2012. Lower USD and GBP rates affected EBIT negatively by approx DKK 5 mil-lion as compared to 2012. Moreover, as planned, investments were made in marketing in existing and new markets as well as in the development of the sales organisation in 2013.
The business in the Americas comprising the Caribbean, Central America, the USA
The business area Malt Beverages comprises an export and licence business, primarily relating to non-alcoholic malt beverages but also to beer exports under the Faxe brand.
Royal Unibrew has several internationally strong malt beverages brands, which are sold in the premium segment. Vitamalt is assessed to be the malt brand with the broadest global distribution, whereas Supermalt and Powermalt hold strong regional positions.
The key market areas for Royal Unibrew’s malt beverages are countries in the Americas region and Africa as well as among ethnic groups from these areas living in and around major cities in Europe and the USA.
The malt beverages markets are primarily supplied by exports from Royal Unibrew’s Danish breweries, but also in certain cases on the basis of licence agreements with local breweries.
The sales organisation, which is to a large extent located in the individual markets, cooperates closely with our partners on commercial priorities and marketing initiatives.
Profile
and Canada developed positively in 2013 with double-digit sales and net revenue growth. The positive development is due to a combination of increased sales in existing markets and market expansion.
As expected, the business in EMEAA com-prising Europe, the Middle East, Africa and Asia also developed satisfactorily
in 2013 recording double-digit sales and net revenue growth. The highest growth was achieved in the markets in Africa and Asia, whereas growth in the European markets was lower as expected.
annual report 2013 Royal UnibRew 27

The Most Important BrandsWESTERN EUROPE
MALT BEVERAGES
28 Royal UnibRew annual report 2013

NORTH EAST EUROPE
annual report 2013 Royal UnibRew 29

30 Royal UnibRew annual report 2013

Shareholder InformationRoyal Unibrew wants to keep its shareholders continuously up-to-date on the Company’s development and also to increase interest in the Company on the stock market. Therefore, Royal Unibrew emphasises providing timely and adequate information on its objectives and strategy, business activities and the development in the Company’s markets.
Share capital, DKK 110,985,000Number of shares 11,098,500Denomination DKK 10 Number of share classes 1Restriction of voting right NonePlace of listing NASDAQ OMX Copenhagen A/SShort name RBREWISIN code DK10242999Bloomberg code RBREW DCReuter code RBREW.CO Index MidCap
SHARE INFORMATION
The Board of Directors has been author-ised to increase the Company’s share capital on one or several occasions by up to a nominal amount of DKK 915,000 in the period to 30 April 2017 following a share capital increase of DKK 10,085,000 in 2013.
developMent in royal unibrew’s share capital
dkk ‘000 2013 2012 2011 2010 2009
Share capital 1/1 105,700 111,865 111,865 111,865 56,000Capital reduction -4,800 -6,165 Capital increase 10,085 55,865share capital 31/12 110,985 105,700 111,865 111,865 111,865
The Board of Directors cannot without prior adoption at the general meeting decide to acquire shares for treasury. At the AGM in 2013, the Board of Directors was authorised to acquire shares for treasury of up to 10% of the share capital in the period to the AGM in 2014.
Each share of DKK 10 carries one vote. Any shareholder registered in the Com-pany’s register of shareholders is entitled to vote.
The shares are listed on NASDAQ OMX Copenhagen A/S, and Royal Unibrew is included in the Midcap index.
At the end of 2013, the price of the Royal Unibrew share was 736 compared to 492 at the end of 2012. Royal Unibrew’s mar-ket capitalisation amounted to DKK 8,168 million at the end of 2013 compared to DKK 5,200 million at the end of 2012.
change oF controlThe realisation of a takeover bid result-ing in change of control of the Company will entitle a few trading partners and lenders to terminate trading agreements made. For a description of agreements with Company Management, reference is made to the section Remuneration.
treasury shares in 2013At the AGM on 29 April 2013, the Board of Directors was authorised to acquire shares for treasury of up to 10% of the total share capital.
At the end of April 2013, the Board of Di-rectors of Royal Unibrew initiated a share buy-back of up to a market value of DKK 210 million in the period to 25 April 2014. However, in connection with the acquisi-tion of Hartwall the Board of Directors of Royal Unibrew A/S decided in July 2013 to close the ongoing share buy-back programme. In September 2013 the Board of Directors initiated a new share buy-back programme with a view to buy-ing back 21,988 of the Company’s shares in the period from 17 September 2013 to 20 November 2013 for the purpose of covering an incentive programme for the Executive Board.
The share buy-back programmes were established and structured in accordance with the so-called Safe Harbour method,
annual report 2013 Royal UnibRew 31

which ensures that the Company is pro-tected against violation of insider legisla-tion during the buy-back process.
Royal Unibrew’s total share buy-back in 2013 comprised 206,638 shares of a total market value of DKK 110 million. The Company’s AGM in April 2013 resolved to reduce the share capital by DKK 4.8 mil-lion by cancellation of 480,000 shares.
In relation to option schemes concerning 2007, 12,086 treasury shares were sold in 2013 for DKK 4 million, and 37,500 treas-ury shares were sold to HC 7 Holding Oy Ab (wholly-owned subsidiary of Hartwall Capital Oy Ab) for DKK 21 million.
Royal Unibrew now holds a total of 60,000 treasury shares of a nominal value of DKK 10 each, corresponding to 0.5% of the Company’s share capital. The total number of shares of the Company is 11,098,500 including treasury shares.
ownershipAt the end of 2013, Royal Unibrew had approx 15,500 registered shareholders holding together 93% of the total share capital.
According to the latest Company An-nouncements or other public announce-ments, the following shareholders hold more than 5% of the share capital:
end of end of February February shareholder 2014 2013
Chr. Augustinus Fabrikker, Denmark 11.5 % 11.0 %HC 7 Holding Oy Ab, Finland 9.4 % -SKAGEN Fondene AS, Norway 7.5 % 8.9 %ATP, Denmark 5.0 % 5.2 %
Members of the Board of Directors and the Executive Board are governed by Roy-al Unibrew’s insider rules, and their share transactions are subject to a notification requirement. Individuals with inside information as well as their spouses and children below the age of 18 may trade Royal Unibrew shares only when the Board of Directors has announced that the window for trading shares is open
(and provided that they do not have in-side information). This normally applies for a period of four weeks following an announcement of financial results.
At 31 December 2013, directors held 2,755 shares of the Company, and members of the Executive Board held 103,694 shares, corresponding to a total of 1% of the share capital.
general MeetingThe Company’s AGM will be held on 29 April 2014, at 4 pm at NRGi Arena in Aarhus.
The AGM will be convened electronically, and information on the registration for electronic communication is provided at Royal Unibrew’s website www.royaluni-brew.com under investor.
Registration of shareholder’s name is effected by contacting the bank holding the shares in safe custody.
board oF directors resolutions and proposed resolutions For the agMThe Board of Directors will propose that the AGM authorise the Board of Directors to acquire shares for treasury corresponding to up to 10% of the share capital, such authorisation being in force for the period up until the next AGM. The Board will also propose that the AGM authorise the Board of Directors to realise capital increases up to a nominal amount of DKK 11 million correspond-ing to approx 10% of the share capital in the period to 30 April 2019, and that the Company’s Articles of Association be amended accordingly.
Moreover, the Board of Directors will propose that no dividend be distributed for the financial year 2013.
investor relations activitiesRoyal Unibrew aims at ensuring open and timely information to its sharehold-ers and other stakeholders.
A number of activities are carried out continuously to ensure good contacts with the Company’s stakeholders. In 2013 Royal Unibrew held five audio casts in connection with the publication of the Annual Report 2012, the Q1 Report, H1 Report and Q3 Report 2013, respectively, and in connection with the Hartwall acquisition. Moreover, Royal Unibrew holds analyst and investor meetings in both Denmark and abroad in connection with the publication of Interim and An-nual Reports. Furthermore, X individual meetings were held with investors and analysts in 2013.
Among other events, Royal Unibrew participated in January 2013 in SEB En-skilda’s Annual Nordic Seminar in Copen-hagen, in June 2013 in Handelsbanken’s Mid & Small Cap Seminar in Stockholm and in December 2013 in Danske Bank’s Winter Seminar in Copenhagen, Nordea’s Investor Meeting, ”Brewing & Retail Field Trip 2013” in London and SEB Enskilda’s Investor Meeting ”The Best of Denmark” in London, respectively.
Audio casts and presentations from au-dio casts and seminars are accessible at Royal Unibrew’s website, www.royaluni-brew.com under investor.
break-down oF shareholders at the end oF 2013
36%
9%1%33%
14%
7%
Foreign Investors Royal Unibrew Foundations and Funds Danish Institutional Investors Individual Danish Investors Non-registrered
32 Royal UnibRew annual report 2013
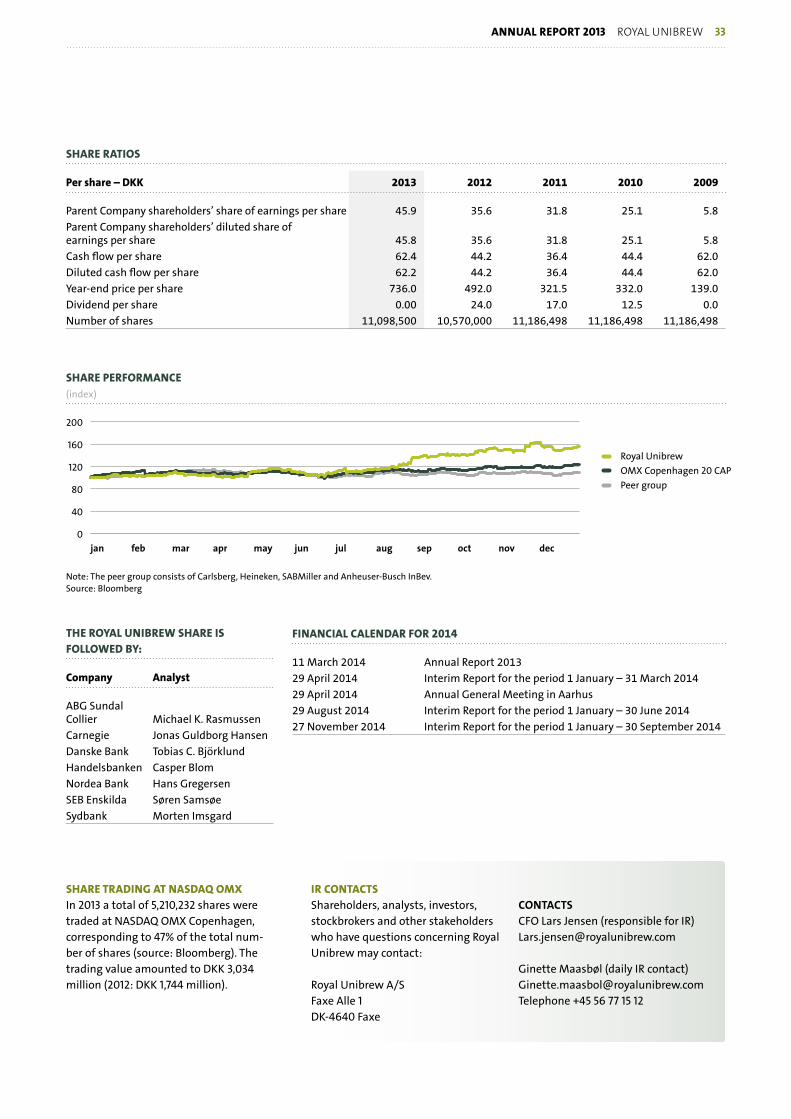
Financial calendar For 2014
11 March 2014 Annual Report 201329 April 2014 Interim Report for the period 1 January – 31 March 201429 April 2014 Annual General Meeting in Aarhus29 August 2014 Interim Report for the period 1 January – 30 June 201427 November 2014 Interim Report for the period 1 January – 30 September 2014
share ratios
per share – dkk 2013 2012 2011 2010 2009
Parent Company shareholders’ share of earnings per share 45.9 35.6 31.8 25.1 5.8Parent Company shareholders’ diluted share of earnings per share 45.8 35.6 31.8 25.1 5.8Cash flow per share 62.4 44.2 36.4 44.4 62.0Diluted cash flow per share 62.2 44.2 36.4 44.4 62.0Year-end price per share 736.0 492.0 321.5 332.0 139.0Dividend per share 0.00 24.0 17.0 12.5 0.0Number of shares 11,098,500 10,570,000 11,186,498 11,186,498 11,186,498
ir contactsShareholders, analysts, investors, stockbrokers and other stakeholders who have questions concerning Royal Unibrew may contact:
Royal Unibrew A/SFaxe Alle 1DK-4640 Faxe
share trading at nasdaq oMx In 2013 a total of 5,210,232 shares were traded at NASDAQ OMX Copenhagen, corresponding to 47% of the total num-ber of shares (source: Bloomberg). The trading value amounted to DKK 3,034 million (2012: DKK 1,744 million).
COntaCtsCFO Lars Jensen (responsible for IR)[email protected]
Ginette Maasbøl (daily IR contact)[email protected] +45 56 77 15 12
share perForMance (index)
Royal Unibrew OMX Copenhagen 20 CAP Peer group
0
40
80
120
160
200
jan feb mar apr may jun jul aug sep oct nov dec
Note: The peer group consists of Carlsberg, Heineken, SABMiller and Anheuser-Busch InBev. Source: Bloomberg
the royal unibrew share is Followed by:
company analyst
ABG Sundal Collier Michael K. RasmussenCarnegie Jonas Guldborg HansenDanske Bank Tobias C. BjörklundHandelsbanken Casper BlomNordea Bank Hans GregersenSEB Enskilda Søren SamsøeSydbank Morten Imsgard
annual report 2013 Royal UnibRew 33

34 Royal UnibRew annual report 2013

Corporate GovernanceRoyal Unibrew Management emphasises corporate governance, and the Company’s management systems are continuously assessed and developed. The objective is to ensure that Royal Unibrew meets its obligations to shareholders, customers, employees, authorities and other stakeholders in the best possible way and that long-term value creation is supported.
Royal Unibrew complies with the Corporate Governance Recommendations issued by NASDAQ OMX Copenhagen with the following few exceptions:
board coMMittees (recoMMendation 3.4):The Committee recommends that the board of directors establish an actual audit committee composed so that the chairman of the board of directors is not the chairman of the audit committee.
• The Board of Directors of Royal Unibrew has decided to take on the audit committee tasks jointly. As a result of this, the chairman of the supreme governing body is also the chairman of the audit committee. The Board’s decision to take on the audit committee tasks jointly should be viewed in light of the Company’s size, transparency of reporting and clear procedures, due to which the Company’s Board of Directors finds no need for a separate audit committee.
disclosure oF the reMuneration policy, (recoMMendation 4.2):The Committee recommends that the total remuneration granted to each member of the board of directors and the executive board by the company and other companies in the group, including information on the most important contents of retention and retirement/resignation schemes, be disclosed in the annual report and that the linkage with the remuneration policy be explained.
• The remuneration of members of the Board of Directors is disclosed in the section ”Remuneration”. Disclosure of the remuneration of the individual members of the Executive Board is not at present considered material to stakeholders’ assessment. The total remuneration of the Executive Board is disclosed in note 4. The remuneration of the Executive Board is considered in line with that of peer companies. The remuneration of the Executive Board is in accordance with the remuneration policy.
In 2013 NASDAQ OMX Copenhagen incorporated the recommendations of the Committee on Corporate Governance in “Rules for Issuers of Shares”. The Cor-porate Governance Recommendations, current legislation and regulation in the area, best practice and internal rules pro-vide the framework for Royal Unibrew’s corporate governance.
Royal Unibrew complies with the Corpo-rate Governance Recommendations with very few exceptions which are described below.
The Company’s website http://investor.royalunibrew.com/governance.cfm pro-vides a detailed description of the Board of Directors’ approach to the Corporate Governance Recommendations issued by the Committee on Corporate Govern-ance.
DIVERSITY
Statement is in accordance with the Dan-ish Financial Statements Act, Article 99B.
Royal Unibrew aims at promoting diver-sity, which includes achieving a reason-able representation of both genders, both on the Board of Directors and on the top management team, based on a
wish to strengthen the versatility and total competences of the business and to improve decision-making processes.
The international management team of Royal Unibrew – comprising the Executive Board and the executives just below – comprises 59% (2012: 63%) men and 41% (2012:37%) women, which is an increase in the share of women com-
annual report 2013 Royal UnibRew 35

pared to 2012. When new executives are recruited, emphasis is placed on identify-ing candidates of both genders without discrimination, and Royal Unibrew is seeking to encourage female candidates’ interest in taking on managerial tasks.
At present, six of the directors of Royal Unibrew elected by the general meeting are men and one is a woman, while the directors elected by the employees are two men and one woman. Two of the directors elected by the general meeting are foreigners.
It is the Board of Directors’ objective that its members should, to the widest extent possible, complement each other in terms of age, background, national-ity, gender, etc with a view to ensuring a competent and versatile contribution to the board duties at Royal Unibrew. These matters are assessed when the nomina-tion committee identifies new candi-dates for the Board of Directors, and it is an objective of the committee to identify both male and female candidates. How-ever, recommendation of candidates will always be based on an assessment of the individual candidates’ competences and how they match Royal Unibrew’s needs and contribute to the overall efficiency of the Board.
The target is that the share of women on the management team will be 40% and on the Board of Directors 20%.
SHAREHOLDER AND STAKEHOLDER RELATIONS
Royal Unibrew’s Management wants and works actively to maintain good and open communication and dialogue with its shareholders and other stakeholders. The Company believes that a high level of openness in the communication of information on the Company’s develop-ment supports the Company’s work and a fair valuation of the Company’s shares. The Group‘s openness is limited only by the duties of disclosure of NASDAQ OMX Copenhagen and by competitive considerations.
The dialogue with and communication to shareholders and other stakeholders take place by the issuing of Interim Re-ports and other announcements by the Company, via audio casts, meetings with investors, analysts and the press. Interim Reports and other announcements are accessible at Royal Unibrew’s website immediately after being published. Our website also includes material used in connection with investor presentations and audio casts.
According to the Articles of Association of the Company, general meetings shall be convened not more than five weeks and not less than three weeks prior to the general meeting. It is an objective to formulate the notice convening the meeting and the agenda so as to give shareholders an adequate presentation of the business to be transacted at the general meeting. Proxies are limited to a specific general meeting and are formu-lated in such a way as to allow absent shareholders to give specific proxies for individual items of the agenda. All docu-ments relating to general meetings are published at Royal Unibrew’s website.
Each share denomination of DKK 10 entitles the holder to one vote. Royal Unibrew’s shares are not subject to any restrictions of voting rights, and the Company has only one class of shares.
WORK OF THE BOARD OF DIRECTORS
The Board of Directors handles overall strategic management, financial and managerial supervision of the Company as well as continuous evaluation of the work performed by the Executive Board on behalf of the shareholders.
The Board of Directors performs its work in accordance with the Rules of Procedure of the Company governing the Board of Directors and the Execu-tive Board. These Rules of Procedure are reviewed and updated regularly by the full Board of Directors.
The directors usually meet for five annu-al ordinary board meetings, one of which focuses on the Company’s strategic situation and prospects. In addition, the directors meet when required. In 2013 twelve board meetings were held and three absentees were noted. The number of meetings held in 2013 was higher than usual due to the Hartwall acquisition.
The Board of Directors has established the following committees:
noMination coMMitteeThe nomination committee consists of the Chairman and Deputy Chairman of the Board of Directors. In 2013 the pri-mary activity of the nomination commit-tee was the assessment of the composi-tion of the Board of Directors, including recruitment of two new members for the Board. The committee members meet on an ad hoc basis and held one meeting in 2013.
reMuneration coMMitteeThe remuneration committee consists of the Chairman and Deputy Chairman of the Board of Directors. In 2013 the primary activities of the remuneration committee were the assessment and recommendation of remuneration of the Board of Directors and the Executive Board. The committee members meet on an ad hoc basis and held four meetings in 2013.
audit coMMittee The Board of Directors of Royal Uni-brew has decided to take on the audit committee tasks jointly. This should be viewed in light of the Company’s size, transparency of reporting and clear procedures, due to which the Company’s Board of Directors finds no need for a separate audit committee. It is the Board of Directors’ objective to secure quality and integrity in the Company’s presenta-tion of Financial Statements, audit and financial reporting. At the same time, the Board of Directors monitors accounting and reporting processes, the audit of the Company’s financial reporting, risk issues and the external auditors’ performance and independence.
36 Royal UnibRew annual report 2013

evaluation oF the work oF the board oF directorsAnnual evaluation of the work of the Board of Directors is performed. The evaluation is made by the Chairman of the Board of Directors. For this purpose the Chairman receives written replies to a questionnaire distributed to all mem-bers of the Board. The findings of the evaluation are presented and discussed at a meeting of the Board of Direc-tors. The evaluation in 2013 gave rise to changing the composition of the Board of Directors with a view to strengthening competences within FMCG (Fast Moving Consumer Goods) and knowledge of the Finnish market. The evaluation did not give rise to changing the working method of the Board of Directors.
The Executive Board and the cooperation between the Board of Directors and the Executive Board are evaluated on an an-nual basis as a minimum.
COMPOSITION OF THE BOARD OF DIRECTORS
When composing the Board of Directors, we emphasise that the members have the competences required to solve the tasks. The Board of Directors assesses its composition annually, including ensur-ing that the combined competences and diversity of the members match the Company’s activities. The Board of Directors strives to achieve a composi-tion so that its members, to the widest extent possible, complement each other in terms of age, background, gender, etc with a view to ensuring a competent and versatile contribution to the board duties at Royal Unibrew.
Candidates for the Board of Directors are recommended for election by the general meeting supported by motivation in writing by the Board of Directors as well as a description of the recruiting criteria. The individual members’ competences are described in the below section on
the Board of Directors and the Executive Board. When joining Royal Unibrew, new members of the Board of Directors are given an introduction to the Company and to the markets in which it operates.
At present, the Board of Directors con-sists of seven members elected by the general meeting and three members elected by the employees. Before the AGM in 2014, the employees will elect another member to the Board of Direc-tors. Election of members by the em-ployees takes place in compliance with the company law rules described at the Company’s website. When joining the Board of Directors, the members elected by the employees are offered relevant training in serving on a board.
All members of the Board of Directors elected by the general meeting are con-sidered independent in accordance with the Corporate Governance Recommenda-tions included in the “Rules for Issuers of Shares” of NASDAQ OMX Copenhagen.
annual report 2013 Royal UnibRew 37

Risk Management
Risk management plays a key role at Royal Unibrew, and policies and procedures have been determined to ensure efficient management, to the widest extent possible, of the identified risks.
At Royal Unibrew risk management is an integrated part of the operational activi-ties with a view to reducing the uncer-tainty of the Group’s strategic objectives being met.
The key risks are summarised by the fol-lowing main areas:
• Industry and market risks• Exposure hazard and third-party risks• Financial risks (currency, interest rates,
liquidity)• Credit risks (financial institutions and
commercial receivables)• Environmental risks
A detailed description of the Company’s risks is provided in note 2.
RISK MANAGEMENT STRUCTURE
Royal Unibrew’s risk management struc-ture is based on a systematic process of risk identification, risk analysis and risk assessment. This structure provides a detailed overview of the key risks relat-ing to the realisation of strategies in the short and long term and enables the taking of required measures to address the risks.
RISK MANAGEMENT AND MANAGEMENT STRUCTURE
The full Board of Directors, which also performs the function of audit com-mittee, has ultimate risk management responsibility. The audit committee monitors the total strategic risk exposure and the individual risk factors relating to Royal Unibrew’s activities. The Board of Directors adopts guidelines for the key risk areas, monitors developments and ensures the existence of plans to man-age the individual risk factors, including commercial and financial risks.
EFFICIENT RISK MANAGEMENT
At least once a year the Board of Direc-tors assesses the overall risk factors re-lating to Royal Unibrew’s activities. Risks are assessed under a two-dimensional “heat map” assessment system which estimates the significance of the risk in relation to EBITDA, damage to Royal Uni-brew’s reputation, violation of legislation or environmental implications as well as the probability of the risk resulting in an incident. Based on this assessment, the existing ”heat map” is updated so as to reflect changes in the understanding of business risks. Following this registra-tion of risks relating to Royal Unibrew’s activities, the risks which may materially impact the strategic objectives in the short and long term are identified.
Local entities (staff functions and busi-ness units) are responsible for identify-ing, assessing, quantifying and recording risks as well as for reporting how risks are managed locally. The local-level risk assessment follows the same principles as the group-level assessment based on the ”heat map” assessment system described above. Local risk owners have been appointed with responsibility for currently monitoring and/or reducing risks through risk-mitigating activities. Changes to risks and incidents related to the individual risks are reported quar-terly to the Company’s Executive Board, which also monitors the development in market-related risks on a current basis.
Royal Unibrew’s Group Accounting is responsible for facilitating and following up on risk-mitigating activities/action plans for the key risks in accordance with the decisions made by the Board of Directors and the Executive Board.
RISK ASSESSMENT IN 2013
In 2013 Royal Unibrew’s Executive Board closely monitored the development in market-related risks and made the nec-essary changes to risk-mitigating activi-ties to secure planned earnings. Moreo-ver, as in 2012, local risk management workshops were held with participation by risk owners and other executives. Cen-trally, the identified risks and proposed action plans were reviewed and assessed by the Company’s Executive Board. Based on this, the Executive Board presented the key risks to the Board of Directors and recommended the necessary risk-mitigating activities/action plans for approval by the Board of Directors. The
38 Royal UnibRew annual report 2013

Board of Directors then resolved at a meeting in November 2013 to implement the necessary risk-mitigating meas-ures with a view to ensuring optimum realisation of Royal Unibrew’s strategic objectives.
KEY RISK FACTORS IN 2014
In addition to financial risks, the follow-ing risk factors are considered key risks in 2014:
MacroeconoMic uncertaintydEsCRiptiOnRoyal Unibrew’s product portfolio is sold in markets and market areas where market developments are usually deter-mined by long-cycle trends. However, in connection with the financial crisis and the resulting economic effects, markets have been more volatile than previously experienced. Thus, considerable market fluctuations have been seen for certain product categories and in certain mar-kets. At the beginning of 2014, several of Royal Unibrew’s markets are still affected by consumer restraint, see the Outlook 2014 section on page 17.
The acquisition of the Finnish brewery Hartwall has increased Royal Unibrew’s exposure against Europe, and therefore macroeconomic uncertainty and low growth of long duration may affect earnings negatively. This could happen due to declining consumption or shifts in product mix towards products with lower earnings.
Risk MitigatiOnBy focusing on flexibility in its actions plans, Royal Unibrew is seeking to secure leeway for reducing the effect of macro-economic uncertainty.
industry and MarketdEsCRiptiOnIn most markets, the product category beer and soft drinks is characterised by tough price competition and intensive marketing from a number of suppliers. At the same time, continuous customer consolidation is seen, which secures dis-tribution of products to consumers. Fur-
thermore, Royal Unibrew’s market area is characterised by considerable industry concentration on the supplier side.
Risk MitigatiOnRoyal Unibrew’s earnings and competi-tiveness are ensured through constant focus on markets and segments in which Royal Unibrew holds or may achieve a significant position. Moreover, the Company focuses on value management through the development of products, containers and packaging, cooperation with customers and communication with consumers.
weatherdEsCRiptiOnUsually, the consumption of Royal Uni-brew’s products is high in the summer months. However, this presupposes dry and fair weather. In 2013 - unlike in 2011 and 2012 - the weather in the summer months in Royal Unibrew’s main markets in Western and Eastern Europe was favourable to the usually high consump-tion of beer and soft drinks. This affected the Group’s sales and net revenue, and thus earnings, positively.
Risk MitigatiOnThrough focus on flexibility of action plans, Royal Unibrew aims at securing leeway in responding to lower earnings caused by unfavourable weather condi-tions in the summer months.
coMModity pricesdEsCRiptiOnThe prices of a large number of key commodities fluctuate in line with world market prices. To the extent that higher unit cost cannot be compensated for by higher selling prices per unit or in other ways increasing the average selling price per unit correspondingly, Royal Unibrew’s earnings will decrease. In order to main-tain EBIT margin, selling prices per unit must increase more than the unit cost increase.
Risk MitigatiOnRoyal Unibrew monitors the trend in commodity prices hedging against short-term price increases through agreements with suppliers and through commodity
hedges if considered essential and eco-nomical. The Group’s policy for hedging commodity risks involves a smooth and time-differentiated effect of commod-ity price increases. Moreover, there is systematic focus throughout the Group on streamlining the production and dis-tribution process and on increasing net selling prices per unit.
indirect taxesdEsCRiptiOnRoyal Unibrew’s products are subject to considerable consumer taxes in all markets. Consumer taxes are still being imposed by regulators for the purpose of regulating consumption or changing tax revenue mix. Indirect taxes on beer and soft drinks products are generally in-creasing as, through increasing consum-er prices, regulators want both to limit the consumption of beverages contain-ing alcohol and sugar and to compensate for lower direct taxes through higher indirect taxes. Increasing indirect taxes affect Royal Unibrew’s sales and earnings negatively.
Risk MitigatiOnThe risk of changes in the indirect tax area is monitored and the implications to Royal Unibrew’s earnings and pos-sible measures to minimise any nega-tive effect are assessed. Royal Unibrew participates actively in local brewers’ associations’ efforts to encourage a responsible approach among consumers to consumption of beverages contain-ing alcohol and sugar and to influence political decision makers to ensure that consumer taxes are applied in a balanced manner.
statutory restrictionsdEsCRiptiOnRoyal Unibrew’s activities are subject to national legislation in the markets in which Royal Unibrew operates. Any leg-islative changes may impact the ability to operate, eg restrictions in respect of the sale and marketing of Royal Uni-brew’s products or their production. Such restrictions may affect the Group’s sales and earnings significantly.
annual report 2013 Royal UnibRew 39
Risk MitigatiOnRoyal Unibrew participates in local and international cooperation with custom-ers within the brewery industry with a view to influencing legislative decision makers to ensure that conditions for producing and marketing beer and soft drinks do not deteriorate.
CONTROL AND RISK MANAGEMENT ACTIVITIES RELATING TO THE FINANCIAL REPORTING PROCESS
Royal Unibrew’s internal control and risk management systems relating to the financial reporting process are described below.
control activitiesRoyal Unibrew has established a formal-ised group reporting process comprising monthly reporting, including budget follow-up, assessment of performance and achievement of established targets.
Moreover, a central corporate function is responsible for controlling the financial reporting from the subsidiaries, which also includes a statement from each reporting group entity in relation to compliance with adopted group policies and internal control measures. In 2013
controlling visits were paid to the key subsidiaries. The Board of Directors has assessed that establishment of an actual internal audit department is not required at this time considering the moderate complexity of the Group.
inForMation and coMMunicationThe Board of Directors emphasises that the Group communicates openly, with due regard to the confidentiality required for listed companies, and that the indi-vidual knows his/her role with respect to internal control.
The individual business areas of the Group have been established as business units with responsibility for their own strategies, action plans and budgets. This division results in efficient follow-up and distribution of responsibilities in the Group.
Royal Unibrew’s accounting manual as well as other reporting instructions are continuously updated and are available at Royal Unibrew’s intranet, where they can be accessed by all relevant employ-ees. The instructions include account coding instructions and procedures for financial reconciliation and analyses, verifying the existence of assets as well as policy for credit granting and approval of fixed asset investments. In the event of major changes, all responsible finance
officers of the group enterprises are informed in writing of the key changes. Moreover, internal update courses are organised for accounting staff.
Royal Unibrew’s information systems are designed with a view to continuously, with due regard to the confidentiality required for listed companies, identify-ing, capturing and communicating at relevant levels relevant information, reports, etc which enable the individual to perform tasks and controls efficiently and reliably.
MonitoringMonitoring is effected by continuous assessments and controls at all group levels. The scope and frequency of the periodic assessments depend primarily on a risk assessment and the efficiency of the continuous controls.
The auditors elected by the general meeting report in the Auditor’s Long-form Report to the Board of Directors material weaknesses in the Group’s internal control systems in connection with the financial reporting process. Less material issues are reported in manage-ment letters to the Executive Board.
The Board of Directors meets annually with the auditors without the Executive Board being present.
40 Royal UnibRew annual report 2013

CMYK 0/30/100/0
CMYK 0/0/0/100
CMYK 0/0/0/0
annual report 2013 Royal UnibRew 41

Remuneration
The remuneration policy applying to Royal Unibrew’s Board of Directors and Executive Board has been formulated so as to reflect shareholder and company interests. Moreover, the remuneration policy is intended to support the realisation of the Company’s long-term objectives.
The following is a brief description of the elements of the remuneration, pension plans and severance programmes as well as other benefits offered to the Board of Directors and the Executive Board.
The complete remuneration policy for the Board of Directors and the Executive Board is disclosed at the Company’s website http://investor.royalunibrew.com/documentdisplay.cfm?DocumentID=11831.
For a description of incentive pay, refer-ence is made to the Overall Guide-lines for Incentive Pay adopted at the Company’s general meeting, which may be downloaded from http://investor.royalunibrew.com/payprogram.cfm.
BOARD OF DIRECTORS REMUNERATION
Efforts are made to ensure that the Board of Directors remuneration match-
es the level of peer companies and to accommodate the requirements relating to members’ competences, performance and scope of board work, including the number of meetings.
The annual remuneration paid to ordinary board members amounts to DKK 250,000. The Chairman and Deputy Chairman receive remuneration of 2.5 times (DKK 625,000) and 1.75 times (DKK 437,500) the remuneration paid to ordi-nary members. The total remuneration paid to the Board of Directors in 2013 amounted to DKK 2.9 million.
The Board of Directors remuneration is fixed and no remuneration is paid for participation in the committees set up by the Board of Directors. The remunera-tion for the financial year in progress is submitted for approval at the AGM. The Board of Directors does not participate in any incentive schemes.
EXECUTIVE BOARD REMUNERATION
The Board of Directors believes that a combination of fixed and performance-driven remuneration to the Executive Board contributes towards ensuring that Royal Unibrew can attract and retain the right employees. At the same time, the Executive Board is given an incentive to create shareholder value through par-tially incentive-based remuneration.
The Executive Board members are em-ployed on individual service contracts, and the terms are fixed by the remunera-
tion committee within the framework laid down in the contracts, see below.
The remuneration committee assesses the Executive Board remuneration an-nually to ensure that the remuneration matches the situation at peer compa-nies.
The Executive Board is remunerated by a market-conforming and competitive remuneration package comprising four elements:
• Fixed salary based on market level;• Ordinary bonus, see overall guidelines
for incentive pay;• Long-term bonus, see overall guide-
lines for incentive pay;• Extraordinary bonus, see overall guide-
lines for incentive pay.
As part of Royal Unibrew’s continued ef-forts to focus on adding value for share-holders, the Board of Directors decided in August 2013 to offer the Executive Board conditional shares for no consideration. The programme replaces the previous cash-based, long-term bonus scheme and entered into force on 1 September 2013. A conditional share entitles the holder to receive one Royal Unibrew share of a nominal value of DKK 10 for no consideration when the Company’s An-nual Report for 2016 has been published in March 2017. The receipt of shares is conditional on continued employment in the period up to the Board of Directors’ adoption of the Annual Report for 2016 and on the employee not having handed in notice. The number of shares depends on the extent to which the EBIT and free
42 Royal UnibRew annual report 2013

cash flow targets for the financial years 2013-2016 defined by the Board of Direc-tors are achieved in the vesting period. The maximum number of conditional shares is 60,000 shares, corresponding to a value of DKK 33 million at the time of granting, 28 August 2013.
The total remuneration of the three members of the Executive Board amounted to DKK 28 million in 2013. See also note 4. The Board of Directors considers the information on the total remuneration of the Executive Board
sufficient for shareholders to be able to assess the level of remuneration.
In addition a number of work-related benefits are made available to the Executive Board, including a company car, and the Executive Board members are covered by Royal Unibrew’s standard insurance schemes such as accident and life insurance.
Royal Unibrew A/S may terminate the employment at up to 24 months’ notice. A member of the Executive Board may
terminate the employment with Royal Unibrew A/S at six months’ notice. Sev-erance pay agreed upon cannot exceed two years’ salary according to the remu-neration policy.
In case of a full or partial takeover of Royal Unibrew A/S, the Executive Board will receive no compensation. However, two members of the Executive Board may choose to consider themselves dismissed in such event.
annual report 2013 Royal UnibRew 43

Board of Directors and Executive Board
kåre schultzChairman of the nomination committee and the remuneration committee
pOsitiOnPresident and COO of Novo Nordisk A/S since January 2014
spECiaL COMpEtEnCEsSpecial expertise in strategic manage-ment as well as experience of produc-tion, sales and marketing of brands on a global scale
indEpEndEnCEConsidered independent
MEMBER OF tHE BOaRd OF diRECtORsLEGO A/S
walther thygesenDeputy Chairman of the nomination committee and the remuneration com-mittee
pOsitiOnCEO of Thrane & Thrane A/S since Sep-tember 2007 and Senior Vice President of Cobham plc since 2012 when Cobham acquired Thrane & Thrane
spECiaL COMpEtEnCEsSpecial expertise in general manage-ment with experience from both Denmark and abroad as well as sales and marketing expertise, especially in the business to business market
indEpEndEnCEConsidered independent
CHaiRMan OF tHE BOaRd OF diRECtORsAlectia A/S
MEMBER OF tHE BOaRd OF diRECtORsThrane og Thrane A/S
ingrid Jonasson blankpOsitiOnProfessional board member in a number of Nordic enterprises since 2010
spECiaL COMpEtEnCEsSpecial expertise in general manage-ment, including of international enter-prises in the convenience goods and retail areas as well as FMCG (Fast Moving Consumer Goods)
indEpEndEnCEConsidered independent
CHaiRMan OF tHE BOaRd OF diRECtORsMusti ja Mirri Grp Oy, Finland
MEMBER OF tHE BOaRd OF diRECtORsAmbea, Finland Orkla ASA, NorwayFiskars Oyj, FinlandScandinavian Studios AB, SwedenZetaDisplay AB, SwedenTravel Support & Services Nordic AB, SwedenBilia AB, Sweden
Board of Directors
44 Royal UnibRew annual report 2013

lars poul christiansenBrewery Hand, elected by the employees
Jens due olsenpOsitiOnProfessional board member in a number of Danish enterprises since 2008
spECiaL COMpEtEnCEsSpecial expertise in economic, financial and capital market aspects as well as general management with experience from a variety of industries
indEpEndEnCEConsidered independent
CHaiRMan OF tHE BOaRd OF diRECtORsNKT Holding A/SAtchikRealtime A/SKompan A/SPierre.dk A/SAmrop A/SAuriga Industries A/S
dEpUty CHaiRMan OF tHE BOaRd OF diRECtORs Bladt Industries A/S
MEMBER OF tHE BOaRd OF diRECtORsCryptomathic A/SGyldendal A/SIndustriens Pensionsforsikring A/SHeptagon Advanced Micro Optics Inc.
OtHER OFFiCEs HELdMember of investment committee of LD Equity 2 K/S
søren lorentzenBrewery Hand, elected by the employees
Jais valeurpOsitiOnExecutive Vice President Global Cat-egories & Operations with Arla Foods, holding, since being employed in 2000, leading roles at home and abroad
spECiaL COMpEtEnCEsSpecial expertise in general manage-ment of international enterprises within FMCG (Fast Moving Consumer Goods)
indEpEndEnCEConsidered independent
CHaiRMan OF tHE BOaRd OF diRECtORsSFK Food A/S
MEMBER OF tHE BOaRd OF diRECtORsFOSS A/SMejeriforeningen Amba
kirsten wendelboe liisbergBrewery Hand, elected by the employees
karsten Mattias slottepOsitiOnProfessional board member in a number of enterprises, primarily in Finland, since 2013. President and CEO of Oy Karl Fazer Ab, Finland until 2013, holding in the period 1997-2013 a number of executive positions
spECiaL COMpEtEnCEsSpecial expertise in general man-agement, including of international enterprises within FMCG (Fast Moving Consumer Goods)
indEpEndEnCEConsidered independent
MEMBER OF tHE BOaRd OF diRECtORsOnninen Oy, FinlandOnvest Oy, FinlandFiskars Oyj, FinlandVarma Mutual Pension Insurance Com-pany, FinlandRegistered Association Finnish-Russian Chamber of Commerce (FRCC)Oriola-KD Oyj, Finland
annual report 2013 Royal UnibRew 45

heMMing vanpOsitiOnCEO of Daloon A/S
spECiaL COMpEtEnCEs:Special expertise in retailing and market-ing as well as production and general management
indEpEndEnCEConsidered independent
ExECUtivE BOaRd sERviCECEO of Easy Holding A/SDirector of HV Invest ApSDirector of HV Holding Aps, Chri Van Aps, Ka Van Aps, Se Van Aps, The Van Aps
board MeMbers in royal unibrew
number of royal year of initially term of unibrew shares held change from name birth elected office position at 1 Januar 2014 1 Januar 2013
Kåre Schultz 1961 2010 2013 Chairman - -Walther Thygesen 1950 2010 2013 Deputy Chairman 1,100 -Ingrid Jonasson Blank 1962 2013 2013 Board member - -Lars Poul Christiansen 1964 2010 2010-2014 Board member - - elected by the employeesKirsten Wendelboe Liisberg 1956 2006 2010-2014 Board member 162 - elected by the employeesSøren Lorentzen 1964 2010 2010-2014 Board member 172 - elected by the employeesJens Due Olsen 1963 2010 2013 Board member - -Karsten Mattias Slotte 1953 2013 2013 Board member - -Jais Valeur 1962 2013 2013 Board member - -Hemming Van 1956 2004 2013 Board member 1,321 -
CHaiRMan OF tHE BOaRd OF diRECtORsEasyfood A/SFHØ af 27.05.2011 A/SGOG Holding A/SHalberg A/SMacBaren Tobacco Co. A/SMacBaren Production A/SHarald Halberg Export A/S
MEMBER OF tHE BOaRd OF diRECtORsDaloon A/SEasy Holding A/SHV Invest ApS
46 Royal UnibRew annual report 2013

henrik brandtCEO as of November 2008
QUaLiFiCatiOnsMSc (Economics and Business Admin-istration), MBA Stanford University, California
ExECUtivE BOaRd sERviCEBrandt Equity ApSBrandt Equity 2 ApSUno Equity ApS
CHaiRMan OF tHE BOaRd OF diRECtORsBrandt Equity ApSBrandt Equity 2 ApSUno Equity ApS
dEpUty CHaiRMan OF tHE BOaRd OF diRECtORsToms Gruppen A/S
MEMBER OF tHE BOaRd OF diRECtORsFerd Holding AS, NorwayHansa Borg Holding AS including subsidiaries, Norway
OtHER OFFiCEs HELdMember of the Corporate Governance CommitteeChairman of the corporate law com-mittee of the Confederation of Danish Industry
lars JensenCFO as of November 2011
QUaLiFiCatiOnsDiploma in business economics, infor-matics and management accounting, Copenhagen Business School
Johannes F.c.M. savoniJeCOO as of September 2008
QUaLiFiCatiOnsBA Business Administration
MEMBER OF tHE BOaRd OF diRECtORsDansk Retursystem Holding A/S includ-ing subsidiariesHansa Borg Holding AS including subsidi-aries, NorwayGlobal Sports Marketing S.A., Zürich, SwitzerlandGlobalpraxis S.A., Barcelona, Spain
Executive Board
executive board in royal unibrew
number of royal year of unibrew shares held change from name birth position at 1 Januar 2014 1 Januar 2013
Henrik Brandt 1955 CEO 76,800 -Lars Jensen 1973 CFO 4,194 -Johannes F.C.M. Savonije 1956 COO 22,700 -
annual report 2013 Royal UnibRew 47

48 Royal UnibRew annual report 2013

Organisation and EmployeesRoyal Unibrew has focus on recruiting and retaining talent and on continuously developing employee and management competences. In 2013 Royal Unibrew continued a number of development initiatives to strengthen employees’ and management’s – and thus the Company’s – ability to operate in competitive markets subject to continuous change.
oriented and holistic approach and our employees show a high level of commit-ment through ambitious, creative and open dialogue across the organisation.
When attracting and employing new em-ployees, Royal Unibrew emphasises the importance of presenting the Company as an attractive workplace where the individual employee is able to influence an interesting development.
TARGETED COMPETENCE AND CAREER DEVELOPMENT
Royal Unibrew works in a targeted and structured manner to develop employee and management competences and knowledge.
Optimisation and integration of the total organisation are also high on Royal Uni-brew’s agenda. This requires managers who are able to manage and implement strategies across countries and cultures. Royal Unibrew managers receive contin-uous management training, and the fun-damental management principles of the business are adjusted currently to match business developments and changes in external demands. This ensures that the management culture is always based on the principles that can take the business further. In 2013 a management develop-ment programme was launched across the Danish organisation with focus on good management, a common manage-ment language as well as motivation and communication.
Royal Unibrew focuses on creating career development and career paths for the
individual employee. As part of these ef-forts, emphasis is on, among other things, job rotation and internal recruiting for key positions. This ensures rooting of knowl-edge of activities as well as optimisation of cooperation across the business.
Furthermore, in 2013 a number of development activities were launched for various groups of employees based on the annual job appraisal interviews, including IT courses, language courses and coaching.
In 2011 Royal Unibrew in Faxe signed up for the project ”Medarbejdere i Verden-sklasse” (World-class employees), which is an EU-backed 3-year cooperation be-tween six enterprises on skills develop-ment of employees at all organisational levels. In 2013 Royal Unibrew of its own accord expanded the project to include the rest of the Danish employees in distribution and at Albani. The purpose of the project is general development of employees’ skills to increase the individ-ual’s ability to handle several job func-tions, to provide both the individual and Royal Unibrew with tools to meet future requirements and to create increased in-centive and participation among employ-ees. The project focuses on professional, personal as well as cross-organisational competence development. 265 Royal Uni-brew employees have attended courses in improvement culture, business sense, professional management, communica-tion, innovation and other subjects. Since project start-up employees from Royal Unibrew in Denmark have been offered 3,800 course days, and the course evalua-tions show that our employees benefited through increased motivation and job
Staement is in accordance with the Dan-ish Financial Statements Act, Article 99A.
The employees of Royal Unibrew pos-sess crucial knowledge of consumers, markets and customers serviced by the Group, including supply and distribution issues within the product categories. This knowledge secures and expands our competitive position and forms the basis of realising the Group’s strategies and objectives.
Entities across the Group focus on devel-oping and retaining existing employees and managers with the right compe-tences and on attracting and developing new talent. Moreover, being a business with activities in many countries, it is important that Royal Unibrew has a strong corporate culture that unites the business. The corporate culture of Royal Unibrew is embedded in a results-
annual report 2013 Royal UnibRew 49
satisfaction. Royal Unibrew is seeing a more stable, flexible and mobile work-force and an improved working climate, which has reflected on the Company’s employee survey.
The other group entities also work con-tinuously to develop competences, and a number of local activities have been launched in the individual countries. In 2013 Royal Unibrew’s subsidiary in Italy implemented a major management development project with focus on team development and awareness as well as individual development through coach-ing. In the Baltic countries, activities in 2013 concentrated on follow-up on the employee survey in 2012, including employee interviews and management training. As an element in the integra-tion plan for Hartwall, focus is directed at supporting and further equipping managers for managing change in Finland.
EMPLOYEE SURVEY
At the end of 2012 Royal Unibrew carried out an employee survey among employ-ees throughout the Group. 92% of all employees participated in the survey. The survey results are very positive as the results for all countries and regions are on or above benchmark. The survey also shows that Royal Unibrew employees exceed the employees of peer companies when it comes to loyalty, pride in being an employee of the company and the inclination to recommend the company as a workplace to others. Moreover, good customer service, diversified tasks and departmental cooperation are areas emphasised by employees in the survey. Royal Unibrew’s focus areas in continua-tion of the survey are personal develop-ment and support from the immediate superior. In 2013 a number of initiatives were taken based on the survey, includ-ing a general management development programme. Furthermore, the individual subsidiaries and departments have
worked locally with a number of initia-tives.
IT SYSTEMS
Royal Unibrew has continuous focus on implementing new and improving exist-ing IT systems to increase the efficiency and to align business processes across the Group. In 2013, among other things, new sales management systems were implemented in Denmark and the Baltic countries, and the logistics process in the Baltic countries was optimised by imple-menting a shared IT platform.
As an element in Royal Unibrew’s IT strat-egy and the integration plan launched for Hartwall, a project was launched in 2013 with a view to consolidating and optimising the total IT operations of the Group. According to plan, Hartwall will then be integrated fully in the Group’s shared SAP platform over the next couple of years.
50 Royal UnibRew annual report 2013

Royal Unibrew’s corporate social respon-sibility work is based on our values and the ten principles of the United Nations Global Compact in respect of human rights, labour standards, environment and anti-corruption.
Royal Unibrew has prepared a set of ethical guidelines providing the over-all framework for the corporate social responsibility work.
it aLsO appLiEs tHat:• Royal Unibrew’s products and produc-
tion should always meet consumer ex-pectations and customer requirements and must, from time to time, comply with international standards for qual-ity, food safety, environment, working environment and human rights.
• Royal Unibrew engages in open dia-logue with customers and consumers on its corporate social responsibility.
• There is focus on the efforts made by Royal Unibrew suppliers to improve quality, the environment, etc, see re-lated UN Global Compact principles.
• Royal Unibrew generally follows and supports The Brewers of Europe’s ef-forts to advocate responsible beer and soft drinks consumption.
Royal Unibrew’s CSR efforts are an important element in protecting the Company’s brands as consumers must be given certainty that Royal Unibrew’s
products have been manufactured in a satisfactory manner using materi-als from suppliers who also operate responsibly and meet the Company’s requirements with respect to the Global Compact elements.
The CSR efforts support a good dialogue with consumers, customers and suppli-ers that contributes towards increasing production efficiency and decreasing wastage and towards reducing non-financial risks and strengthening the Company’s identity and culture.
At Royal Unibrew, corporate social responsibility (CSR) work is an integrated part of our business approach. The CSR efforts are also an important element in developing the Company’s brands and maintaining good relations with the Company’s key stakeholders.
Corporate Social Responsibility
FOCUS AREAS OF OUR CORPORATE SOCIAL RESPONSIBILITY WORK
Environment
Responsible beer and
soft drinks consumption
Royal Unibrew’s
ethical guidelines
Competence development
Occupational health
& safety
Food safety & quality
Anti- corruption & competition
CORPORATE SOCIAL
RESPONSIBILITy
annual report 2013 Royal UnibRew 51

OCCUPATIONAL HEALTH & SAFETY
Royal Unibrew aims at creating a safe and healthy working environment for its employees.
Royal Unibrew’s health policy focuses on preventive measures to avoid employees being worn out and incurring work-relat-ed injuries and on actively promoting job satisfaction and efficiency.
Our preventive measures in 2013 in-cluded the following:
• In Denmark and Finland, the interdis-ciplinary cooperation within the safety organisations was further strength-ened by including the retail area in the safety organisation. This enables best-practice and experience sharing.
• The supply chain in Denmark has increased focus on occupational health and safety, including focus on near-accidents and employees’ own responsibility for accidents. This is done to sustain the positive develop-ment recorded in recent years. In order to further induce employees to take occupational health and safety seri-ously, daily target monitoring has been introduced to track and draw attention to days without any accidents.
• In 2013 Hartwall was certified un-der OHSAS 1800, the international standard for occupational health and safety. Work performed include causal analyses with a view to reduc-ing occupational health and safety risks; moreover, sales employees were trained in prevention of occupational accidents, eg fall and slip accidents in the winter.
• In the Baltic countries, several automa-tion projects were implemented to improve the working environment and prevent occupational injuries. The projects comprise modernisation of malt and barley handling at Lacplesis’s brewhouse and establishment of a new canning unit at Kalnapilis.
taRgEts FOR 2014• In Denmark efforts will be directed at
behavioural safety, and in Finland fo-cus will be on risk analyses and safety culture.
• Reduction of accident frequency at the Danish breweries.
• In Finland a senior policy will be actively pursued to ensure that senior employees may continue to contribute positively to the Company’s develop-ment with due regard to their physical capacity.
• The Baltic entities will continue their efforts to increase occupational safety and to develop ergonomic workplaces through automation. It is the target that 30% of the warehouse equipment should be upgraded to more modern, safe and ergonomically correct equip-ment, eg by replacing trucks. Another target is that 80% of all palletisation should be automatic.
RESPONSIBLE ALCOHOLIC BEVERAGE AND SOFT DRINKS CONSUMPTIONRoyal Unibrew wants to contribute to the responsible and prudent consumption of its products.
As a beer and alcoholic beverage maker, Royal Unibrew has a special responsibil-ity in relation to the social and health aspects of alcohol consumption.
Royal Unibrew supports The Brewers of Europe campaigns on responsible alcohol consumption.
Royal Unibrew employees engaged in product marketing are currently trained and instructed in compliance with exist-ing marketing legislation. In Italy and Denmark, employees also learn about local industry codes, eg the guidelines of the Danish advertising standards authority for soft drinks and alcoholic beverages (Læske-drik- og Alkoholreklamenævnet), and zero tolerance is pursued when it comes to non-compliance with the guidelines.
Moreover, in the Baltic countries Royal Unibrew has also participated in cam-paigns on a balanced diet, healthy life style and responsible beer consumption.
In addition to complying with marketing legislation and the above-mentioned guidelines, Royal Unibrew gets involved in customers’ communication on con-sumption of the Company’s products in relation to advertising, sponsorships and campaigns. Compliance with marketing legislation and certain guidelines are included in Royal Unibrew’s cooperation agreements with customers in Denmark and abroad.
Moreover, Royal Unibrew cooperates with and supports the work performed by “Natteravnene” (Night Owls) in Denmark.
Royal Unibrew also has a responsibil-ity for preventing any abuse problems among its employees.
In Denmark a number of key individu-als across the organisation have been trained in supporting colleagues with a potential over-consumption of alcohol/intoxicants, including encouraging treat-ment, and in helping their colleagues get back to work again as easily as possible following treatment. In February 2013 a workshop was held focusing on the onwards process of ensuring that these key individuals come more into play in the organisation, and how colleagues may to a higher extent make use of their knowledge. All things considered, this programme has been successful and contributes towards our ability to make a proactive effort.
In Latvia Royal Unibrew along with other soft drinks producers supported the preparation of a joint code for respon-sible marketing of soft drinks, and in 2013 campaigns on balanced consump-tion of beverages were prepared. In the Baltic countries Royal Unibrew supports training in health and a balanced diet in cooperation with fruit and vegetable pro-ducers. There is a ”5-a-day” organisation which promotes the benefits of including fruit, vegetables and fruit juices in your daily diet.
52 Royal UnibRew annual report 2013

As an element in Royal Unibrew’s re-sponsibility with respect to reducing the consumption of soft drinks containing sugar, efforts are continuously directed at promoting calorie-reducing products such as Nikoline with 30% less sugar or sugar-free alternatives such as Faxe Kondi Free and Pepsi Max.
taRgEts FOR 2014• Participation in and development
of ”Responsible beer and soft drinks consumption” in cooperation with local industry organisations and The Brewers of Europe.
• Annual training of all relevant em-ployees in responsible marketing of beverages.
• Workshop for in-house ”alcohol and drug consultants”.
• Continued participation in the Baltic countries in educating young people on the importance of a balanced diet as well as participation in the ”5-a-day” programme.
COMPETENCE DEVELOPMENT
Royal Unibrew works in a targeted and structured manner to develop employee competences. These efforts are further described in the section ”Organisation and Employees”.
VALUES AND ETHICAL GUIDELINES
Royal Unibrew’s values and ethical guidelines are included as an inte-grated part of the employment of Royal Unibrew people. Our ethical guidelines imply, among other things, that Royal Unibrew does not tolerate discrimination of its employees due to gender, race or religion.
Royal Unibrew accedes to the principles of human rights and labour standards in-cluding eg the principles on child labour laid down by UNICEF, the UNGC and Save the Children.
It is also Royal Unibrew’s aim that suppli-ers and partners should comply with the ethical guidelines, and that these should be incorporated into the Company’s terms of trading with key suppliers.
In 2013 Royal Unibrew’s production in Faxe was certified under a customer-specific, international ethical standard. In connection with this work, Danish managers and employees were trained in Royal Unibrew’s ethical guidelines, describing, among other things, rules on human rights, responsible alcohol consumption, bribery, gifts, conflicts of interests, confidentiality, competition and environmental responsibility.
taRgEts FOR 2014• As part of our cooperation with key
suppliers, Royal Unibrew’s ethical guidelines are reviewed at annual status meetings.
• Maintenance of certification under the customer-specific ethical standard.
ENVIRONMENT
All Royal Unibrew production units focus on continuously limiting the envi-ronmental impacts of the Company’s production. The result of the various initiatives in recent years has been a very positive development in key areas.
Environmental efforts are still primarily targeted at:
• Reduction of energy consumption
• Reduction of water consumption and of waste water discharge
• Waste recycling and reduction of con-sumption of materials
• CO2-neutral production of all Egekilde products
• Food safety and quality
ENERGY
In 2013 all Royal Unibrew production units saw higher production output than in 2012, which contributed to a favour-able development in all environmental ratios. Total energy consumption per unit produced decreased by 7.5% to 95.1 MJ/hl, to which the two Danish breweries contributed a reduction of 9.8% from 2012. Energy consumption at the Danish breweries was 74.7 MJ/hl in 2013.
The targeted 8% energy consumption reduction in 2013 was thus more or less achieved at group level, whereas both of the Danish breweries achieved the target.
At the Albani brewery in Denmark, ef-forts were directed in 2013 at optimising wort boiling resulting in less and more homogeneous evaporation when boiling wort at the brewhouse. Moreover, the Albani brewery installed an air preheater on the gas boiler to the effect that the energy in the hot exhaust waste gas is transferred to the air intake for the com-bustion process.
In the Baltic countries, a brewhouse optimisation project reduced energy consumption at the Lacplesis brewery, whereas a new cooling system at the Cido soft drinks factory had the same effect. At the end of 2013, the Kalnapilis brewery implemented an energy man-agement system to monitor and reduce energy consumption, which will have full effect in 2014.
energy consuMption (Mega Joules per produced hectoliter)
0
25
50
75
100
125
2009 2010 2011 2012 2013
annual report 2013 Royal UnibRew 53
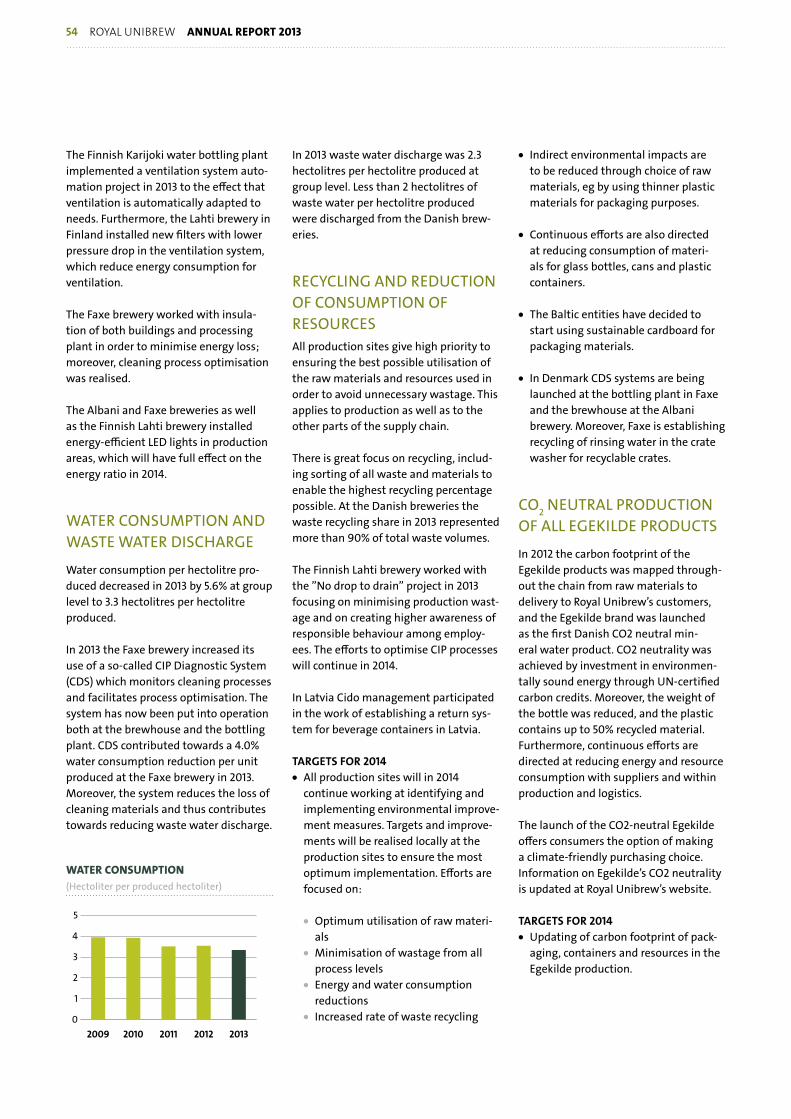
The Finnish Karijoki water bottling plant implemented a ventilation system auto-mation project in 2013 to the effect that ventilation is automatically adapted to needs. Furthermore, the Lahti brewery in Finland installed new filters with lower pressure drop in the ventilation system, which reduce energy consumption for ventilation.
The Faxe brewery worked with insula-tion of both buildings and processing plant in order to minimise energy loss; moreover, cleaning process optimisation was realised.
The Albani and Faxe breweries as well as the Finnish Lahti brewery installed energy-efficient LED lights in production areas, which will have full effect on the energy ratio in 2014.
WATER CONSUMPTION AND WASTE WATER DISCHARGE
Water consumption per hectolitre pro-duced decreased in 2013 by 5.6% at group level to 3.3 hectolitres per hectolitre produced.
In 2013 the Faxe brewery increased its use of a so-called CIP Diagnostic System (CDS) which monitors cleaning processes and facilitates process optimisation. The system has now been put into operation both at the brewhouse and the bottling plant. CDS contributed towards a 4.0% water consumption reduction per unit produced at the Faxe brewery in 2013. Moreover, the system reduces the loss of cleaning materials and thus contributes towards reducing waste water discharge.
In 2013 waste water discharge was 2.3 hectolitres per hectolitre produced at group level. Less than 2 hectolitres of waste water per hectolitre produced were discharged from the Danish brew-eries.
RECYCLING AND REDUCTION OF CONSUMPTION OF RESOURCESAll production sites give high priority to ensuring the best possible utilisation of the raw materials and resources used in order to avoid unnecessary wastage. This applies to production as well as to the other parts of the supply chain.
There is great focus on recycling, includ-ing sorting of all waste and materials to enable the highest recycling percentage possible. At the Danish breweries the waste recycling share in 2013 represented more than 90% of total waste volumes.
The Finnish Lahti brewery worked with the ”No drop to drain” project in 2013 focusing on minimising production wast-age and on creating higher awareness of responsible behaviour among employ-ees. The efforts to optimise CIP processes will continue in 2014.
In Latvia Cido management participated in the work of establishing a return sys-tem for beverage containers in Latvia.
taRgEts FOR 2014• All production sites will in 2014
continue working at identifying and implementing environmental improve-ment measures. Targets and improve-ments will be realised locally at the production sites to ensure the most optimum implementation. Efforts are focused on:
• Optimum utilisation of raw materi-als
• Minimisation of wastage from all process levels
• Energy and water consumption reductions
• Increased rate of waste recycling
• Indirect environmental impacts are to be reduced through choice of raw materials, eg by using thinner plastic materials for packaging purposes.
• Continuous efforts are also directed at reducing consumption of materi-als for glass bottles, cans and plastic containers.
• The Baltic entities have decided to start using sustainable cardboard for packaging materials.
• In Denmark CDS systems are being launched at the bottling plant in Faxe and the brewhouse at the Albani brewery. Moreover, Faxe is establishing recycling of rinsing water in the crate washer for recyclable crates.
CO2 NEUTRAL PRODUCTION OF ALL EGEKILDE PRODUCTS
In 2012 the carbon footprint of the Egekilde products was mapped through-out the chain from raw materials to delivery to Royal Unibrew’s customers, and the Egekilde brand was launched as the first Danish CO2 neutral min-eral water product. CO2 neutrality was achieved by investment in environmen-tally sound energy through UN-certified carbon credits. Moreover, the weight of the bottle was reduced, and the plastic contains up to 50% recycled material. Furthermore, continuous efforts are directed at reducing energy and resource consumption with suppliers and within production and logistics.
The launch of the CO2-neutral Egekilde offers consumers the option of making a climate-friendly purchasing choice. Information on Egekilde’s CO2 neutrality is updated at Royal Unibrew’s website.
taRgEts FOR 2014• Updating of carbon footprint of pack-
aging, containers and resources in the Egekilde production.
water consuMption (Hectoliter per produced hectoliter)
0
1
2
3
4
5
2009 2010 2011 2012 2013
54 Royal UnibRew annual report 2013

• Reduction of consumption of packag-ing materials. For example, the PET line is being reconstructed so as to match bottles with shorter bottle tops.
• The Egekilde range to be extended with more CO2 neutral varieties.
FOOD SAFETY AND QUALITY
Royal Unibrew’s breweries have certifica-tion under the international standards. The efforts within quality and food safety also comprise requirements from customers and licensors. Applicable HAC-CP (Hazard Analysis and Critical Control Points) rules have been implemented.
brewery certification
Cido ISO22000 Lacplesis ISO22000Kalnapilis Preparing for ISO22000Faxe ISO22000/FSSC, ISO9001,
ISO14001Albani ISO22000, ISO9001,
ISO14001Lahti ISO22000, ISO9001,
ISO14001, OHSAS 18001Karijoki ISO22000, ISO9001,
ISO14001, OHSAS 18001
New intensified quality management requirements from licensors include traceability and prevention of sabo-tage. Therefore, efforts were directed at enhancing the effectiveness of trace-ability in 2013. Moreover, testing of new raw materials and packaging materials was extended so as to be implemented throughout the supply chain to ensure efficiency and the prevention of errors.
In 2013 production and distribution at Faxe were certified under a Supply Chain Security standard. In that connection, the Danish supply chain was reviewed in terms of product safety; several improve-
ments were made, eg access control with photo ID, systematic screening of employees before their employment in terms of background, checking of sub-suppliers operating in critical areas as well as IT security verification.
Due to the development and interest in food safety and quality among consum-ers, customers and the media, new “critical” topics to be addressed by Royal Unibrew emerge continuously. Royal Unibrew assesses on a current basis how most appropriately to take responsibility for preventing risks and how to commu-nicate this. The priorities set are aligned with those of industry associations and Royal Unibrew’s licensors. Royal Unibrew aims at communicating openly and honestly and has, as an element in these efforts, prepared a list of frequently asked questions and Royal Unibrew’s replies to these (FAQ). This FAQ list covers areas such as GMO, allergenes, caramel colouring agents, Bisphenol A, etc.
In 2013 Royal Unibrew contributed, through the Danish Brewers’ Association and The Brewers of Europe, to legisla-tive work and review in relevant areas, eg product contact materials, caramel colouring agents and Bisphenol A.
taRgEts FOR 2014• ISO 22000 certification of the Kalna-
plilis brewery and FSSC certification of the Albani, Lahti and Karijoki brewer-ies.
• Implementation of new requirements from licensors with respect to preven-tion of sabotage at all levels and qual-ity assurance of the quality analysis process.
• Development and testing of crisis management.
ANTI-CORRUPTION
Royal Unibrew works against all forms of corruption including extortion and brib-ery and the Company’s business practice must always be in full compliance with anti-corruption legislation irrespective of the place of operation.
According to Royal Unibrew’s ethical guidelines our employees are not al-lowed to offer or accept bribes or any improper payments for personal or corporate gain. Disciplinary actions will be taken if an employee is involved in bribery. The sales staff in all sales areas are trained annually in this aspect.
taRgEts FOR 2014• Position on anti-corruption to be
stated in all contexts, internally in the supply chain and in the cooperation with Royal Unibrew’s customers and suppliers.
• Anti-corruption training of new sales staff and follow-up training of other employees.
COMPETITION
Royal Unibrew’s business practice should always comply fully with applicable com-petition regulation irrespective of the place of operation. To ensure this, Royal Unibrew has implemented a competition compliance programme comprising a manual and guidelines as well as regular training and follow-up in the area. Moreover, internal controls are carried out regularly in the area.
taRgEt FOR 2014• Competition law training of all new
sales staff.
• Competition law updating of other sales staff.
annual report 2013 Royal UnibRew 55

The Board of Directors and the Executive Board have today considered and adopt-ed the Annual Report of Royal Unibrew A/S for 1 January - 31 December 2013.
The Annual Report is prepared in ac-cordance with International Financial Reporting Standards as adopted by the EU and Danish disclosure requirements for annual reports of listed companies.
In our opinion, the Consolidated Finan-cial Statements and the Parent Company
Financial Statements give a true and fair view of the financial position of the Group and the Parent Company at 31 De-cember 2013 as well as of the results of the Group and Company operations and cash flows for the financial year 1 January – 31 December 2013.
In our opinion, Management’s Review gives a true and fair account of the devel-opment in the activities and financial cir-cumstances of the Group and the Parent Company, of results of operations for the
year, of the Parent Company’s financial position and of the overall financial posi-tion of the enterprises comprised by the Consolidated Financial Statements, as well as a description of the key risks and uncertainties facing the Group and the Parent Company.
We recommend that the Annual Report be adopted at the Annual General Meet-ing.
Management’s Statement on the Annual Report
Faxe, 10 March 2014
executive board
Henrik Brandt Lars Jensen Johannes F.C.M. SavonijeCEO CFO COO
board oF directors
Kåre Schultz Walther ThygesenChairman Deputy Chairman
Ingrid Jonasson Blank Lars P. Christiansen Kirsten Liisberg Søren Lorentzen
Jens Due Olsen Karsten Mattias Slotte Jais Valeur Hemming Van
56 Royal UnibRew annual report 2013

Independent Auditor’s Report
TO THE SHAREHOLDERS OF ROYAL UNIBREW A/Sreport on consolidated Financial stateMents and parent coMpany Financial stateMentsWe have audited the Consolidated Finan-cial Statements and the Parent Company Financial Statements of Royal Unibrew A/S for the financial year 1 January – 31 December 2013, which comprise income statement, statement of comprehensive income, balance sheet, statement of changes in equity, cash flow statement and notes, including summary of signifi-cant accounting policies, for the Group as well as for the Parent Company. The Consolidated Financial Statements and the Parent Company Financial Statements are prepared in accordance with International Financial Reporting Standards as adopted by the EU and Danish disclosure require-ments for listed companies.
ManageMent’s responsibility For the consolidated Financial state-Ments and the parent coMpany Financial stateMentsManagement is responsible for the preparation of Consolidated Financial Statements and Parent Company Financial Statements that give a true and fair view in accordance with International Financial Reporting Standards as adopted by the EU and Danish disclosure requirements for listed companies, and for such internal control as Management determines is necessary to enable the preparation of Consolidated Financial Statements and Parent Company Financial Statements
that are free from material misstatement, whether due to fraud or error.
auditor’s responsibility and basis oF opinionOur responsibility is to express an opinion on the Consolidated Financial Statements and the Parent Company Financial State-ments based on our audit. We conducted our audit in accordance with International Standards on Auditing and additional re-quirements under Danish audit regulation. This requires that we comply with ethical requirements and plan and perform the audit to obtain reasonable assurance whether the Consolidated Financial State-ments and the Parent Company Financial Statements are free from material mis-statement.
An audit involves performing procedures to obtain audit evidence about the amounts and disclosures in the Consolidated Finan-cial Statements and the Parent Company Financial Statements. The procedures selected depend on the auditor’s judgment, including the assessment of the risks of material misstatement of the Consoli-dated Financial Statements and the Parent Company Financial Statements, whether due to fraud or error. In making those risk assessments, the auditor considers internal control relevant to the Company’s prepara-tion of Consolidated Financial Statements and Parent Company Financial Statements that give a true and fair view in order to design audit procedures that are appropri-ate in the circumstances, but not for the purpose of expressing an opinion on the effectiveness of the Company’s internal control. An audit also includes evaluating
the appropriateness of accounting policies used and the reasonableness of accounting estimates made by Management, as well as evaluating the overall presentation of the Consolidated Financial Statements and the Parent Company Financial Statements.
We believe that the audit evidence we have obtained is sufficient and appropriate to provide a basis for our audit opinion.
The audit has not resulted in any qualifica-tion.
opinionIn our opinion, the Consolidated Financial Statements and the Parent Company Financial Statements give a true and fair view of the financial position at 31 De-cember 2013 of the Group and the Parent Company and of the results of the Group and Parent Company operations and cash flows for the financial year 1 January - 31 December 2013 in accordance with Inter-national Financial Reporting Standards as adopted by the EU and Danish disclosure requirements for listed companies.
stateMent on ManageMent’s reviewWe have read Management’s Review in accordance with the Danish Financial Statements Act. We have not performed any procedures additional to the audit of the Consolidated Financial Statements and the Parent Company Financial Statements. On this basis, in our opinion, the informa-tion provided in Management’s Review is consistent with the Consolidated Financial Statements and the Parent Company Financial Statements.
Faxe, 10 March 2014
ernst & youngGodkendt Revisionspartnerselskab
Henrik O. Larsen Eskild N. JakobsenState Authorised Public Accountants State Authorised Public Accountants
annual report 2013 Royal UnibRew 57

Financial Statements
58 Royal UnibRew annual report 2013

Income Statement for 1 January - 31 December parent coMpany group
2012 2013 note dkk ‘000 2013 2012
2,608,354 2,906,378 net revenue 4,480,998 3,430,008 -1,294,022 -1,426,457 4,5 Production costs -2,195,788 -1,714,265 1,314,332 1,479,921 gross profit 2,285,210 1,715,743 -738,801 -839,316 4,5 Sales and distribution expenses -1,448,530 -1,062,453 -136,681 -165,445 4,5 Administrative expenses -264,090 -173,136 4,843 2,642 Other operating income 2,642 4,843 -15,161 23 Other operating expenses -15,161 443,693 462,641 EBit 560,071 484,997 Income after tax from investments 15 in associates 33,552 34,263 65,079 153,189 Dividend from subsidiaries and associates 9,885 11,629 6 Financial income 4,345 6,195 -36,768 -46,341 7 Financial expenses -49,685 -44,434 481,889 581,118 profit before tax 548,283 481,021 -99,288 -119,435 8 Tax on the profit for the year -68,707 -108,217 382,601 461,683 net profit for the year 479,576 372,804 distributed as follows: Parent Company shareholders’ share of net profit 479,576 371,192 Minority shareholders’ share of net profit 1,612 net profit for the year 479,576 372,804 16 Parent Company shareholders’ share
of earnings per share (DKK) 45.9 35.6 16 Parent Company shareholders’ share
of diluted earnings per share (DKK) 45.8 35.6
annual report 2013 Royal UnibRew 59

Statement of Comprehensive Income for 1 January - 31 December parent coMpany group
2012 2013 note dkk ‘000 2013 2012
382,601 461,683 net profit for the year 479,576 372,804
Other comprehensive income Items that may be reclassified to the income statement Exchange adjustment of foreign group enterprises -11,638 29,853 73,806 56,886 Value adjustment of hedging instruments, beginning of year 59,239 76,995 -56,886 -42,678 Value adjustment of hedging instruments, end of year -46,039 -59,239 -209 -4,429 8 Tax on hedging instruments, (interest-rate hedging) -4,105 -209 16,711 9,779 total -2,543 47,400
Items that may not be reclassified to the income statement 90,000 Revaluation of non-current assets 90,000 -19,000 Tax on equity entries -19,000 0 71,000 total 71,000 0 16,711 80,779 9 Other comprehensive income after tax 68,457 47,400 399,312 542,462 total comprehensive income 548,033 420,204
distributed as follows: Parent Company shareholders’ share
of comprehensive income 548,033 418,549 Minority shareholders’ share of comprehensive income 1,655 548,033 420,204
60 Royal UnibRew annual report 2013

Assets at 31 December parent coMpany group
2012 2013 note dkk ‘000 2013 2012
nOn-CURREnt assEts 80,645 80,645 11 Goodwill 1,430,378 244,882 2,990 2,990 11 Trademarks 1,236,102 124,069 1,672 489 Distribution rights 214,592 1,672 Customer relations 62,970 85,307 84,124 10 intangible assets 2,944,042 370,623
330,291 326,532 Land and buildings 1,261,505 559,200 276,338 290,539 14 Project development properties 290,539 276,338 275,556 338,344 Plant and machinery 880,267 433,369 121,858 119,648 Other fixtures and fittings, tools and equipment 238,466 142,903 64,839 26,485 Property, plant and equipment in progress 38,164 67,531 1,068,882 1,101,548 12 property, plant and equipment 2,708,941 1,479,341
701,533 3,476,657 Investments in subsidiaries 75,931 77,374 15 Investments in associates 132,523 129,782 155,414 155,428 Receivables from subsidiaries 2,510 2,521 Other investments 15,731 2,620 9,454 8,173 Other receivables 8,354 9,645 944,842 3,720,153 13 Fixed asset investments 156,608 142,047
2,099,031 4,905,825 non-current assets 5,809,591 1,992,011
CURREnt assEts 45,919 38,045 Raw materials and consumables 106,709 65,208 15,704 13,943 Work in progress 24,016 21,062 58,309 62,938 Finished goods and purchased finished goods 199,734 94,072 119,932 114,926 Inventories 330,459 180,342
185,693 220,696 Trade receivables 449,228 365,286 135,930 243,229 Receivables from subsidiaries 1,444 Receivables from associates 1,444 3,299 9,209 Corporation tax 11,754 8,855 8,804 9,816 Other receivables 56,496 12,138 13,470 21,196 Prepayments 23,022 14,253 348,640 504,146 Receivables 540,500 401,976
263,226 107,272 Cash at bank and in hand 243,962 273,775
731,798 726,344 Current assets 1,114,921 856,093
2,830,829 5,632,169 assets 6,924,512 2,848,104
annual report 2013 Royal UnibRew 61

Liabilities and Equity at 31 December parent coMpany group
2012 2013 note dkk ‘000 2013 2012
EQUity 105,700 110,985 16 Share capital 110,985 105,700 319,205 855,839 Share premium account 855,839 319,205 112,320 136,505 Revaluation reserves 136,505 112,320 Translation reserve -18,970 -5,719 -56,886 -42,678 Hedging reserve -46,039 -59,239 744,023 1,197,202 Retained earnings 1,094,657 621,648 253,680 0 Proposed dividend 0 253,680
1,478,042 2,257,853 Equity 2,132,977 1,347,595
144,192 166,072 17 Deferred tax 457,571 144,795 591,680 747,742 2 Mortgage debt 747,742 591,680 1,036,326 2 Credit institutions 1,097,291 9,121 17,318 Other payables 17,318 9,121 744,993 1,967,458 non-current liabilities 2,319,922 745,596
2,010 14,159 2 Mortgage debt 14,159 2,010 634 717,275 2 Credit institutions 763,978 634 34,841 31,998 18 Repurchase obligation, returnable packaging 103,938 36,211 320,545 340,614 Trade payables 807,486 430,852 6,999 6,928 Payables to subsidiaries 53,380 84,004 VAT, excise duties, etc 370,737 65,115 189,385 211,880 Other payables 411,315 220,091 607,794 1,406,858 Current liabilities 2,471,613 754,913
1,352,787 3,374,316 Liabilities 4,791,535 1,500,509
2,830,829 5,632,169 Liabilities and equity 6,924,512 2,848,104
62 Royal UnibRew annual report 2013

Cash Flow Statement for 1 January - 31 December parent coMpany group
2012 2013 note dkk ‘000 2013 2012
382,601 461,683 Net profit for the year 479,576 372,804 150,677 88,611 19 Adjustments for non-cash operating items 255,576 238,280 533,278 550,294 735,152 611,084 Change in working capital: -22,348 -139,567 +/- change in receivables -176 1,692 -23,407 5,006 +/- change in inventories 34,518 -43,167 42,678 91,153 +/- change in payables 56,587 63,531 Cash flows from operating activities 530,201 506,886 before financial income and expenses 826,081 633,140
7,139 11,629 Financial income 4,345 1,069 -32,989 -56,298 Financial expenses -59,635 -31,713 504,351 462,217 Cash flows from operating activities 770,791 602,496
-96,224 -107,726 Corporation tax paid -117,976 -105,097 408,127 354,491 Cash flows from operating activities 652,815 497,399
65,079 153,189 Dividends received from subsidiaries and associates 20,474 13,442 151,031 86,049 Sale of property, plant and equipment 87,546 152,565 -33,172 -19,168 Corporation tax paid -19,168 -33,172 -121,151 -111,885 Purchase of property, plant and equipment -143,394 -154,376 469,914 462,676 Free cash flow 598,273 475,858
33,559 Sale of subsidiary 15,701 202,353 Sale of associates 202,353 -7,460 -2,775,124 23 Increase of capital/acquisition of subsidiaries -2,775,124 Acquisition/sale of intangible assets -4,915 1,281 and fixed asset investments -7,023 -4,519 285,324 -2,665,658 Cash flows from investing activities -2,836,689 191,994
1,589,928 Proceeds from non-current borrowing 1,589,928 -2,281 -195,338 Repayment of non-current debt -195,338 -2,281 -15,086 526,588 Change in current debt to credit institutions 525,546 -52,990 -80,834 -14 Change in financing of subsidiaries -179,328 -242,107 Dividends paid to shareholders -242,107 -179,328 -200,405 -110,189 Acquisition of shares for treasury -110,189 -200,405 561,214 Proceeds from share issue 561,214 463 25,131 Sale of treasury shares 25,131 463 -477,471 2,155,213 Cash flows from financing activities 2,154,185 -434,541
215,980 -155,954 Change in cash and cash equivalents -29,689 254,852 47,246 263,226 Cash and cash equivalents at 1 January 273,775 18,773 Exchange adjustment -124 150 263,226 107,272 Cash and cash equivalents at 31 december 243,962 273,775
annual report 2013 Royal UnibRew 63

Statement of Changes in Equity for 1 January - 31 Decembergroup share proposed Minority premium revaluation translation hedging retained dividend interests’ dkk ‘000 share capital account reserves reserve reserve earnings for the year share total
Equity at 31 december 2011 111,865 337,825 180,000 -31,811 -76,995 597,262 190,170 12,869 1,321,185
Changes in equity in 2012 Profit for the year 371,192 1,612 372,804Other comprehensive income 26,092 17,756 3,509 43 47,400Revaluation reserves realised -67,680 67,680 0total comprehensive income 0 0 -67,680 26,092 17,756 442,381 0 1,655 420,204Minority shareholders’ share of subsidiaries sold -14,524 -14,524Proposed dividend -253,680 253,680 0Dividends paid to shareholders -179,328 -179,328Dividend on treasury shares 10,842 -10,842 0Acquisition of shares for treasury -200,405 -200,405Sale of treasury shares 463 463Reduction of capital -6,165 -18,620 24,785 0total shareholders -6,165 -18,620 0 0 0 -417,995 63,510 -14,524 -393,794total changes in equity in 2012 -6,165 -18,620 -67,680 26,092 17,756 24,386 63,510 -12,869 26,410Equity at 31 december 2012 105,700 319,205 112,320 -5,719 -59,239 621,648 253,680 0 1,347,595
Changes in equity in 2013 Profit for the year 479,576 479,576Other comprehensive income 71,000 -13,251 13,200 -2,492 68,457Revaluation reserves realised -46,815 46,815 0total comprehensive income 0 0 24,185 -13,251 13,200 523,899 0 0 548,033Increase of capital 10,085 551,129 561,214Proposed dividend 0 0 0Dividends paid to shareholders -242,107 -242,107Dividend on treasury shares 11,573 -11,573 0Acquisition of shares for treasury -110,189 -110,189Sale of treasury shares 25,131 25,131Share-based payments 3,300 3,300Reduction of capital -4,800 -14,495 19,295 0total shareholders 5,285 536,634 0 0 0 -50,890 -253,680 0 237,349total changes in equity in 2013 5,285 536,634 24,185 -13,251 13,200 473,009 -253,680 0 785,382Equity at 31 december 2013 110,985 855,839 136,505 -18,970 -46,039 1,094,657 0 0 2,132,977
The share capital at 31 December 2013 amounts to DKK 110,985,000 and is distributed on shares of DKK 10 each.
64 Royal UnibRew annual report 2013

Statement of Changes in Equity for 1 January - 31 Decemberparent coMpany
share proposed premium revaluation hedging retained dividend dkk ‘000 share capital account reserves reserve earnings for the year total
Equity at 31 december 2011 111,865 337,825 180,000 -73,806 711,947 190,170 1,458,001
Changes in equity in 2012 Profit for the year 382,601 382,601Other comprehensive income 16,920 -210 16,710Revaluation reserves realised -67,680 67,680 0total comprehensive income 0 0 -67,680 16,920 450,071 0 399,311Dividends paid to shareholders -179,328 -179,328Dividend on treasury shares 10,842 -10,842 0Acquisition of shares for treasury -200,405 -200,405Sale of treasury shares 463 463Reduction of capital -6,165 -18,620 24,785 0Proposed dividend -253,680 253,680 0total shareholders -6,165 -18,620 0 0 -417,995 63,510 -379,270total changes in equity in 2012 -6,165 -18,620 -67,680 16,920 32,076 63,510 20,041Equity at 31 december 2012 105,700 319,205 112,320 -56,886 744,023 253,680 1,478,042 Changes in equity in 2013 Profit for the year 461,683 461,683Other comprehensive income 71,000 14,208 -4,429 80,779Revaluation reserves realised -46,815 46,815 0total comprehensive income 0 0 24,185 14,208 504,069 0 542,462Increase of capital 10,085 551,129 561,214Dividends paid to shareholders -242,107 -242,107Dividend on treasury shares 11,573 -11,573 0Acquisition of shares for treasury -110,189 -110,189Sale of treasury shares 25,131 25,131Share-based payments 3,300 3,300Reduction of capital -4,800 -14,495 19,295 0total shareholders 5,285 536,634 0 0 -50,890 -253,680 237,349total changes in equity in 2013 5,285 536,634 24,185 14,208 453,179 -253,680 779,811Equity at 31 december 2013 110,985 855,839 136,505 -42,678 1,197,202 0 2,257,853
Share premium account, hedging reserve and retained earnings may be distributed as dividends to the Parent Company’s shareholders.
The share capital at 31 December 2013 amounts to DKK 110,985,000 and is distributed on shares of DKK 10 each.
annual report 2013 Royal UnibRew 65

Contents
note page
descriptive notes 1 Critical accounting estimates and judgements 67-68
2 Financial risk management 69-73
3 Segment reporting 74-76
notes reFerring to incoMe stateMent, balance sheet and cash Flow stateMent
4 Staff expenses 77-78
5 Expenses broken down by type 79
6 Financial income 80
7 Financial expenses 80
8 Tax on the profit for the year 81
9 Comprehensive income 81
10 Intangible assets 82-83
11 Impairment tests 84-85
12 Property, plant and equipment 86-88
13 Fixed asset investments 89-90
14 Project development properties 91
15 Investments in associates 92
16 Portfolio of treasury shares and basis of earnings/cash flow per share 93
17 Deferred tax 94
18 Repurchase obligation, returnable packaging 94
19 Cash Flow Statement 95
other notes 20 Fee to auditors 96
21 Contingent liabilities and security 96
22 Related parties 97
23 Acquisitions and sales 98-99
24 Significant accounting policies 100-105
66 Royal UnibRew annual report 2013

In connection with the preparation of the Parent Company and Consolidated Fi-nancial Statements, Management makes estimates and judgements as to how recognition and measurement of assets and liabilities should take place based on the accounting policies applied.
critical accounting estiMatesManagement’s estimates are based on assumptions which Management consid-ers reasonable but which are inherently uncertain and unpredictable. In connec-tion with the financial reporting for 2013, the following critical estimates have been made.
recognition of acquisition of subsidiary In 2013 Royal Unibrew acquired Oy Hartwall Ab by purchasing 100% of the outstanding shares. Hartwall’s assets, liabilities and contingent liabilities have been recognised under the purchase method in the Financial Statements of Royal Unibrew. The key assets of Hartwall are goodwill, trademarks, distribution rights, customer relations, property, plant and equipment, inventories and trade receivables. Especially with regard to the intangible assets acquired, there are no efficient markets to be used to determine fair value. Management has therefore made an estimate in connection with the calculation of the fair value of the acquired assets and liabilities at the date of acquisition and has allocated the pur-chase price on that basis, see note 23. The fair value calculation is subject to uncer-tainty and may be adjusted subsequently. The unallocated part of the purchase price has been recognised as goodwill related to synergies and the development potential of the activities acquired.
intangible assetsIn relation to trademarks, Management assesses annually whether the current market situation has reduced the value or affected the useful life of the trademarks, including whether past assessments of an indefinite useful life may be maintained.
An annual impairment test is made of the values of goodwill and trademarks recog-nised in the Financial Statements which are based on an indefinite useful life and
are therefore not amortised. As regards the discount and growth rates applied in connection with impairment tests of goodwill and trademarks as well as other assumptions underlying the impairment tests, reference is made to the description in note 11 and to note 24 “Significant ac-counting policies”.
property, plant and equipmentWhen estimating whether project devel-opment properties, see below, should be revalued, Management has also in 2013 based its fair value estimate on a calcula-tion of the present value of the cash flow expected under the agreements made. Reference is made to note 14 for a detailed description of Management’s method of estimating fair value in connection with the preparation of the Financial State-ments for 2013.
Note 24 “Significant accounting poli-cies” describes the estimated useful lives applied when calculating depreciation of property, plant and equipment.
Management updates its estimate of the useful lives of property, plant and equip-ment on an annual basis.
other equity investmentsWhen presenting the Financial State-ments for 2011, Management estimated the fair value of its investments in the Polish brewery company Perla Browary Lubelskie at DKK 0 due to governance is-sues arisen. In 2012 and 2013 Management has maintained its fair value estimate of DKK 0 as these issues have not subse-quently been resolved. The measurement of the fair value of the equity investments in Perla Browary Lubelskie has been classi-fied in level 3 of the fair value hierarchy.
trade receivablesProvisions for bad debts are made on the basis of an individual assessment of the risk of incurring losses on the receivables or groups of receivables, including the maturity profile of the receivables and debtors’ current credit rating. Reference is made to note 2 for a summary of trade receivables due.
deferred taxDeferred tax assets, including the value of tax losses to be carried forward for set-off against positive taxable income in later years, are recognised if, based on Management’s assessment, utilisation of the assets is considered possible. The as-sessment is made annually, see note 17.
repurchase obligation, returnable packagingThe repurchase obligation in respect of re-turnable packaging in circulation has been recognised in the Financial Statements on the basis of the estimated total volumes of packaging less packaging in inventory, see note 18.
JudgeMents as an eleMent in signiFicant accounting policiesThe calculation of carrying amounts of certain assets and liabilities requires judgement as to how assets and liabilities should be classified in the Financial State-ments and how future events will affect the value of these assets and liabilities at the balance sheet date. In connection with the financial reporting for 2013, the following judgments have been made materially affecting the related items.
derivative financial instrumentsWhen entering into derivative financial instruments, Management assesses whether the instrument qualifies as effec-tive hedging of recognised assets or liabili-ties or expected future cash flows. Deriva-tive financial instruments recognised are tested for effectiveness at least quarterly, and any ineffectiveness identified is recog-nised in the income statement.
recognition of project development property With a view to ensuring adequate dis-closures on the value of the brewery site in Aarhus, Management chose to apply the exemption provision of IAS 16 which allows separate recognition of an item of property, plant and equipment as well as revaluation of the asset to fair value. The basis of Management’s fair value estimate and revaluation, if any, is described in note 14.
Descriptive notes
Note1–CritiCalaCCouNtiNgestimatesaNdjudgemeNts
annual report 2013 Royal UnibRew 67

disclosures on divestmentsWhen activities are divested, Manage-ment assesses whether the divested entities constitute a significant business or geographic area and should therefore be presented separately in the Financial Statements. In connection with the divest-ment in 2012 of the Caribbean distribution company Impec, it was Management’s assessment that this was not a signifi-cant divestment as net revenue in 2012 amounted to DKK 116 million (3.4%) and EBIT to DKK 5 million (1.0%).
leases“When leases are entered into, an as-sessment is made based on the factors mentioned below in order to determine whether the agreements should be classi-fied as finance or operating leases.
• The characteristics of the assets to which the agreements relate;
• The term of the agreements measured against the useful life of the assets;
• The amount of minimum lease pay-ments over the term of the agreements;
• Matters relating to purchase obliga-tions and ownership of the assets in question.
At this time, Royal Unibrew has both finance and operating leases.”
pension obligationsIn connection with the acquisition of Hartwall, defined benefit liabilities were acquired relating to a pension scheme which has not been offered to new employees for a number of years. At 31 De-cember 2013, the net liability amounted to approx DKK 13 million. Taking into account the amount of the liability, that it has been at the same level in recent years and that it is being phased out, Management does not consider it material to provide the disclosures on the composition of the liability required by IAS 19.
68 Royal UnibRew annual report 2013

The Group’s financial risks are managed centrally according to the Treasury Policy approved by the Board of Directors, which includes guidelines for the han-dling of currency, interest rate, liquidity and credit risks. Commodity risks are also managed under a commodity risk policy approved by the Board of Directors.
currency riskRoyal Unibrew is exposed to currency risks through the geographic spread of the Group’s activities. This currency ex-posure is particularly reflected through the Parent Company’s export activities where cash flows are earned in foreign currencies, and in connection with the purchase of raw materials, which in-volves an indirect USD risk on the part of the purchase price related to the raw ma-terial element. Purchases are in all ma-teriality made in the currencies in which the Group has income, which results in a total reduction of the currency risk. Furthermore, the translation of loans to/from subsidiaries as well as the Group’s net debt is subject to currency risk where these are not established in DKK.
The above describes Royal Unibrew’s transaction risks, which are hedged actively according to the Treasury Policy. EUR is not hedged. The objective is to reduce negative effects on the Group’s profit and cash flows. The risk is there-fore monitored and hedged continually. The Group’s cash flows are primarily in CAD, EUR, GBP, LTL and USD. The key
currency risks are related to GBP, LTL and USD.
The total gross currency risk (before hedging) on the balance sheet items was calculated at 31 December 2013. The following table shows the sensitivity to a positive change in the cross rates at 31 December 2013 with all other vari-ables remaining unchanged. A negative change has a corresponding effect merely with the sign reversed.
Moreover, Royal Unibrew has a transla-tion risk primarily related to Finland, Latvia and Lithuania. The translation risk related to Royal Unibrew’s investments in foreign subsidiaries is, as a general rule, not hedged.
Financial risks such as the loss of com-petitive strength due to long-term ex-change rate changes are not hedged by financial instruments but are included in Royal Unibrew’s strategic considerations.
interest rate riskRoyal Unibrew’s interest rate risk is substantially related to the Group’s loan portfolio. Interest rate changes will affect the market value of fixed-interest loans as well as interest payments on floating-rate liabilities. Debt is established only in currencies in which the Group has com-mercial activities.
In Royal Unibrew’s assessment, the key interest rate risk is related to the imme-diate effect of interest rate changes on
the Group’s interest payment flows and Royal Unibrew focuses only secondarily on changes in the market value of the debt. It is group policy to limit the effect of interest rate changes on profit and cash flows while, within this frame-work, also achieving the lowest pos-sible financing cost. At the end of 2013, mortgage debt amounted to DKK 762 million with an average term to maturity of 15 years. 72% is fixed-interest through the Group’s hedging of interest rate risk with a fixed-interest period of up to 4 years. Bank debt comprises committed bank credit facilities with an agreed term to maturity of up to 54 months. A one percentage point interest rate change will affect the Group’s interest expenses by approx +/- DKK 20 million (Parent Company: +/- DKK 19 million).
credit risksThe Group’s credit risks relate primarily to trade receivables and counterparty risks.
The Group’s counterparty risks comprise both commercial and financial counter-party risk. The commercial counterparty risk relates primarily to business agree-ments with a built-in element of firm rate/price. The financial counterparty risk relates to hedging agreements as well as net bank deposits. The financial counterparty risk is actively reduced by distributing net bank deposits on banks in accordance with the credit rating crite-ria determined in the Treasury Policy.
earnings impact earnings impact equity impact equity impact dkk ‘000 change before tax 2013 before tax 2012 2013 2012
EUR 0.1 % -1,861 57 -1,124 75GBP 10 % 1,350 140 3,060 1,850LTL 0.5 % 142 647 313 995USD 10 % 1,870 1,470 2,490 2,790
Descriptive notes
Note2–FiNaNCialriskmaNagemeNt
annual report 2013 Royal UnibRew 69

Royal Unibrew seeks to limit risks relat-ing to credit granting to customers in export markets through extensive use of insurance cover and other types of hedg-ing of payments. Where effective hedges cannot be established, Royal Unibrew has established procedures for approval of such risks. There are no material credit risks on individual customers. Credit risks relating to trade receivables are reduced by setting off accrued bonus. At 31 De-cember 2013 accrued bonus amounts to DKK 169 million (31/12 2012: DKK 78 mil-lion) set off against trade receivables.
Current receivables, other than trade receivables, all fall due for payment in 2014.
The total receivables of DKK 541 million (Parent: DKK 504 million) belong to the category “assets measured at amortised cost”.
The maximum credit risk corresponds to the carrying amount of the financial assets.
liquidity risksIt is group policy that its cash resources should be adequate to meet the ex-pected liquidity requirements in the current and next financial year. The cash resources may be bank deposits, short-term bonds and unutilised credit facilities.
capital ManageMentRoyal Unibrew wants to ensure struc-tural and financial flexibility as well as competitive power. To ensure this, continuous assessment is made to deter-mine the appropriate capital structure of Royal Unibrew. At the end of 2013, it is assessed that the Group’s net interest-bearing debt should not exceed 2.5 times EBITDA and that the equity ratio at year end should be 30%.
At the operational level, continuous ef-forts are directed at optimising working capital investments. Subject to adequate capacity, investments in production fa-cilities will be limited to replacement of individual components, related to specif-
ic products or to optimisation of selected processes as well as maintenance.
coMModity risksThe commodity risk relates primarily to the purchasing of cans (aluminium), malt (barley), hops and packaging materials (cardboard) as well as energy. The com-modity risk is actively hedged commer-cially and financially in accordance with the Group’s Treasury Policy.
The objective of managing Royal Uni-brew’s commodity risk is to achieve a smooth and time-differentiated effect of commodity price increases, which is primarily achieved by entering into fixed-price agreements with the relevant sup-pliers. As regards the Group’s purchase of cans, financial contracts have been made to hedge the risk of aluminium price increases. Exchange rate changes with respect to the settlement currency of aluminium (USD) are an element of the overall currency risk management.
Trade receivables fall due as follows:
dkk ‘000 31/12 2013 31/12 2012
Not due 357,240 284,478Due: From 1-15 days 84,076 72,180 From 16-90 days 18,680 11,794 More than 90 days 19,566 122,322 27,270 111,244
Provisions for bad debts, not due -6,177 -1,976 Provisions for bad debts, 1-15 days -4,263 -325 Provisions for bad debts, 16-90 days -2,256 -865 Provisions for bad debts, more than 90 days -17,638 -30,334 -27,270 -30,436total 449,228 365,286
Provisions for bad debts, beginning of year -30,436 -40,955Additions on acquisition -2,490 Bad debts realised during the year 560 5,044Adjustment upon sale of subsidiaries 0 8,313Provision for the year 2,032 -2,838total -30,334 -30,436
Descriptive notes
Note2–FiNaNCialriskmaNagemeNt(CoNtiNued)
70 Royal UnibRew annual report 2013

The most significant part of purchases for the next 12 months has, in accordance with Royal Unibrew’s policy, been hedged by entering into supplier agreements and financial contracts. A +/-1% change in the price of aluminium would have a P/L effect at group level of approx +/- DKK 0.5 million.
other risksMarket risks have in 2013 affected Royal Unibrew’s results materially, which may also be the case in future years. Current-ly, the economic development in many of the Group’s markets and the result-ing consumer reluctance have affected volume sales of the Group’s products, and thus also earnings, negatively. Furthermore, competition has intensified resulting in limited possibilities of realis-ing sales price increases.
For quite a number of years, Royal Uni-brew has recorded significant revenue in
the Danish and Italian markets and with the acquisition of Hartwall, Finland will be the single key market. In 2013 these markets accounted for 63 % (2012: 53 %) of consolidated revenue and going forward the three markets combined are expected to account for more than 75 % of consolidated revenue. Changes to consumption patterns or the competitive situation in these markets could there-fore influence Royal Unibrew’s results materially. Changes to consumption patterns in the Group’s other markets, eg changed views on alcohol consumption and consumption of soft drinks, may also affect Royal Unibrew’s development and results materially.
As a producer of alcoholic products, Royal Unibrew is sensitive to changes in the public alcohol policy - including indirect tax policies in the Group’s respective markets. For example, a change of the Danish and Finish indirect tax policy
as compared to those of neighbouring countries could lead to a change of cross-border trading patterns. This applies primarily to Germany, Norway, Sweden and Estonia.
Legislative changes with respect to per-mitted types of containers and returning of containers could also result in signifi-cant changes to consumption patterns. In Germany large parts of the Group’s products are sold in cans, whereas sales in Italy are primarily related to products in non-returnable glass bottles.
The Group’s Insurance Guidelines deter-mine the framework of covering risks in general insurance areas (buildings, movables and trading losses) The risks are covered through insurance. The total risks are assessed by the Board of Direc-tors on an annual basis and external spe-cialists review the breweries for relevant risks on a regular basis.
Descriptive notes
Note2–FiNaNCialriskmaNagemeNt(CoNtiNued)
Currency and interest rate risks and use of derivative financial instruments Derivative financial instruments entered into to hedge expected future transactions and qualifying as hedge accounting under IAS 39:
group and parent coMpany 2013 2012
deferred deferred contract Market gain (+) contract Market gain (+) period amount value / loss (-) amount value / loss (-)
Forward contracts:GBP 0 - 1 år 16,936 17,105 -169 20,026 19,586 440CAD 0 - 1 år 6,169 5,896 273SEK 0 - 1 år 7,451 7,488 -37 total 24,387 24,593 -206 26,195 25,482 713
annual report 2013 Royal UnibRew 71

Descriptive notes
Note2–FiNaNCialriskmaNagemeNt(CoNtiNued)
2013 2012
deferred deferred contract Market gain (+) contract Market gain (+) Maturity amount value / loss (-) amount value / loss (-)
Interest rate swaps:Nykredit 2015 271,117 -16,792 -16,792 271,117 -25,339 -25,339Nykredit 2015 194,970 -11,361 -11,361 194,970 -17,283 -17,283Nykredit 2017 84,064 -10,302 -10,302 84,064 -14,036 -14,036Nykredit 2013 384,670 488 488 550,151 -38,455 -38,455 934,821 -56,170 -56,170
The derivative financial instruments applied in 2013 and 2012 may all be classified as level-2 instruments in the IFRS fair value hierarchy.
The determined fair value of derivative financial instruments is based on observable market data such as yield curves or forward rates.
groupFinancial liabilities
31/12 2013
Maturity contractual Maturity > 1 year Maturity carrying cash flows < 1 year < 5 years > 5 years amount
non-derivative financial instruments:Financial debt, gross 2,623,170 778,137 967,790 877,243 2,623,170Interest expenses 183,349 37,948 76,275 69,126 Trade payables and repayment obligation re packaging 911,424 911,424 911,424Other payables 799,370 782,052 17,318 799,370total 4,517,313 2,509,561 1,061,383 946,369 4,333,964
The debt breaks down on the categories “debt at amortised cost” with DKK 4,296 million and “debt at fair value” with DKK 38 million.The fair value of the total debt is assessed to equal carrying amount.
31/12 2012
Maturity contractual Maturity > 1 year Maturity carrying cash flows < 1 year < 5 years > 5 years amount
non-derivative financial instruments:Financial debt, gross 594,324 2,644 12,606 579,074 594,324Interest expenses 331,506 29,948 119,361 182,197 Trade payables and repayment obligation re packaging 467,063 467,063 467,063Other payables 294,327 285,206 9,121 294,327total 1,687,220 784,861 141,088 761,271 1,355,714
The debt breaks down on the categories “debt at amortised cost” with DKK 1,298 million and “debt at fair value” with DKK 58 million.The fair value of the total debt is assessed to equal carrying amount.
72 Royal UnibRew annual report 2013

Descriptive notes
Note2–FiNaNCialriskmaNagemeNt(CoNtiNued)
parent coMpanyFinancial liabilities
31/12 2013
Maturity contractual Maturity > 1 year Maturity carrying cash flows < 1 year < 5 years > 5 years amount
non-derivative financial instruments: Financial debt, gross 2,515,502 731,434 942,729 841,339 2,515,502Interest expenses 181,923 37,400 75,397 69,126 Trade payables and repayment obligation re packaging 372,612 372,612 372,612Other payables 320,130 302,812 17,318 320,130total 3,390,167 1,444,258 1,035,444 910,465 3,208,244
The debt breaks down on the categories “debt at amortised cost” with DKK 3,170 million and “debt at fair value” with DKK 38 million.The fair value of the total debt is assessed to equal carrying amount.
31/12 2012
Maturity contractual Maturity > 1 year Maturity carrying cash flows < 1 year < 5 years > 5 years amount
non-derivative financial instruments: Financial debt, gross 594,324 2,644 12,606 579,074 594,324Interest expenses 331,308 30,050 119,061 182,197 Trade payables and repayment obligation re packaging 355,386 355,386 355,386Other payables 258,885 249,764 9,121 258,885total 1,539,903 637,844 140,788 761,271 1,208,595
The debt breaks down on the categories “debt at amortised cost” with DKK 1,150 million and “debt at fair value” with DKK 58 million.The fair value of the total debt is assessed to equal carrying amount.
annual report 2013 Royal UnibRew 73

Descriptive notes
Note3–segmeNtreportiNg
The Group’s results, assets and liabilities break down as follows on segments: north western east Malt mdkk europe europe beverages unallocated total
2013Net revenue 2,650.3 1,450.2 380.5 4,481.0Earnings before interest and tax (EBIT) 424.0 101.6 81.3 -46.8 560.1Net financials -0.2 -9.9 -0.4 -34.8 -45.3Share of income from associates 33.5 33.5Profit/loss before tax 457.3 91.7 80.9 -81.6 548.3Tax -68.7 -68.7Profit/loss for the year 457.3 91.7 80.9 -150.3 479.6
Assets * 1,472.5 4,986.2 42.8 290.5 6,792.0Associates 132.5 132.5total assets 1,605.0 4,986.2 42.8 290.5 6,924.5
Purchase of property, plant and equipment 111.9 31.5 143.4Purchase of property, plant and equipment on acquisition 1,245.4 1,245.4Purchase of intangible assets on acquisitiion 2,582.9 2,582.9
Liabilities** 898.0 1,371.4 6.2 2,515.9 4,791.5
Sales (million hectolitres) 3.6 2.8 0.6 7.0
* Unallocated assets include project development properties.** Unallocated liabilities include the Parent Company’s interest-bearing debt.
74 Royal UnibRew annual report 2013

Descriptive notes
Note3–segmeNtreportiNg(CoNtiNued)
The Group’s results, assets and liabilities break down as follows on segments:
north western east Malt mdkk europe europe beverages unallocated total
2012 Net revenue 2,429.9 585.1 415.0 3,430.0Earnings before interest and tax (EBIT) 408.2 27.3 83.9 -34.4 485.0Net financials -0.6 -5.0 -0.2 -32.4 -38.2Share of income from associates 32.1 2.1 34.2Profit/loss before tax 439.7 24.4 83.7 -66.8 481.0Tax -108.2 -108.2Profit/loss for the year 439.7 24.4 83.7 -175.0 372.8 Assets * 1,845.1 559.4 37.5 276.3 2,718.3Associates 129.8 129.8total assets 1,974.9 559.4 37.5 276.3 2,848.1
Purchase of property, plant and equipment 121.2 32.9 0.3 154.4
Liabilities** 791.4 106.1 8.7 594.3 1,500.5
Sales (million hectolitres) 3.3 1.6 0.5 5.4
* Unallocated assets include project development properties.** Unallocated liabilities include the Parent Company’s interest-bearing debt.
Geographically, revenue and non-current assets break down as follows: 2013 2012
net non-current net non-current mdkk revenue assets revenue assets
Denmark 1,450.8 905.8 1,237.2 889.8Finland 786.6 3,800.1 Italy 606.6 26.4 596.9 26.4Germany 564.9 571.4 Other countries 1,072.1 786.7 1,024.5 799.5Unallocated 290.5 276.3total 4,481.0 5,809.6 3,430.0 1,992.0
The geographic breakdown is based on the geographic location of the Group’s external customers and comprises countries that indi-vidually account for more than 10% of the Group’s net revenue as well as the country in which the Group is headquartered.
No single customer accounts for revenue in excess of 10% of the Group’s net revenue.
annual report 2013 Royal UnibRew 75

Descriptive notes
Note3–segmeNtreportiNg(CoNtiNued)
segMent reporting 2009 - 2013The Group’s activities break down as follows on segments: north western east Malt mdkk europe europe beverages unallocated group
2013Net revenue 2,650.3 1,450.2 380.5 4,481.0Operating profit/loss 424.0 101.6 81.3 -46.8 560.1Assets 1,605.0 4,986.2 42.8 290.5 6,924.5Liabilities 898.0 1,371.4 6.2 2,515.9 4,791.5
Sales (million hectolitres) 3.6 2.8 0.6 7.0
2012Net revenue 2,429.9 585.1 415.0 3,430.0Operating profit/loss 408.2 27.3 83.9 -34.4 485.0Assets 1,731.1 799.9 40.8 276.3 2,848.1Liabilities 791.4 106.1 8.7 594.3 1,500.5
Sales (million hectolitres) 3.3 1.6 0.5 5.4
2011Net revenue 2,410.1 629.1 391.4 3,430.6Operating profit/loss 405.0 45.1 53.3 -29.2 474.2Assets 1,688.1 701.0 89.7 411.5 2,890.3Liabilities 790.2 133.9 33.3 611.7 1,569.1
Sales (million hectolitres) 3.3 2.0 0.4 5.7
2010Net revenue 2,424.5 941.7 409.2 3,775.4Operating profit/loss 365.3 45.9 48.2 -42.5 416.9Assets 1,503.3 996.9 150.2 406.4 3,056.8Liabilities 742.8 217.6 38.9 770.0 1,769.3
Sales (million hectolitres) 3.2 2.9 0.5 6.6
2009Net revenue 2,418.2 909.3 488.9 3,816.4Operating profit/loss 274.6 -5.2 37.5 -63.6 243.3Assets 1,657.4 1,058.2 370.5 403,6 3,489.7Liabilities 781.8 414.2 113.9 1,184.6 2,494.5
Sales (million hectolitres) 3.3 2.8 0.5 6.6
76 Royal UnibRew annual report 2013

Staff expenses are included in production costs, sales and distribution expenses as well as administrative expenses and break down as follows:
parent coMpany group
2012 2013 dkk ‘000 2013 2012
13,641 17,668 Salary and short-term bonus scheme for Executive Board 17,668 13,641 7,245 6,981 Long-term bonus scheme for Executive Board 6,981 7,245 3,300 Share-based payments to Executive Board (restricted shares) 3,300 20,886 27,949 Remuneration of Executive Board 27,949 20,886 2,813 2,875 Remuneration of Board of Directors 2,875 2,813 23,699 30,824 30,824 23,699 357,274 385,551 Wages and salaries 590,374 459,207 29,721 30,025 Contributions to pension schemes 53,207 52,227 386,995 415,576 643,581 511,434 6,703 6,845 Other social security expenses 8,193 10,252 19,716 21,773 Other staff expenses 27,042 24,864 437,113 475,018 total 709,640 570,249 876 884 Average number of employees 1,935 1,635 The share-based payments to the Executive Board comprise a maximum of 60,000 no-consideration conditional shares vesting in the period 1 September 2013 to 31 December 2016. The receipt of the shares is conditional on continued employment in the period up to the Board of Directors’ adoption of the Annual Report for 2016 and on the employee not having handed in notice. The number of shares depends on the extent to which the EBIT and free cash flow targets for the financial years 2013-2016 defined by the Board of Directors are achieved. The market value at the beginning of the vesting period has been calculated under the Black-Scholes model at DKK 550 per share corresponding to DKK 33 million for the maximum number of shares. The market value is expensed on a straight-line basis over the vesting period corresponding to the rate at which the conditions for the share grant are met. At 31 December 2013 the conditions are expected to be fully met.
Notes to Income Statement
Note4–staFFexpeNses
annual report 2013 Royal UnibRew 77

Notes to Income Statement
Note4–staFFexpeNses(CoNtiNued)
The following share option scheme was established until 2008 for the Executive Board and certain employees. Each option carried a right to acquire 1 share of DKK 10.
certain executive other board employees total exercise exercise number number number price period
Unexercised at 31 december 2012 Granted re 2007 13,219 13,219 350 4/2011-4/2013 Exercised in 2013 -12,086 -12,086 350 Expired in 2013 -1,133 -1,133 Unexercised at 31 december 2013 0 0 0 Market value at 31 december 2013 0 0 Market value at 31 december 2012 1.9 million 1.9 million
Based on a share price of the Royal Unibrew share of 492.0 at 31 December 2012, the market value of the options was calculated by means of the Black-Scholes model.
The calculation was based on an assumption of 15% volatility, a risk-free interest rate of 0.2-0.5% and annual dividend per share of DKK 150%.
78 Royal UnibRew annual report 2013

parent coMpany group
2012 2013 dkk ‘000 2013 2012
Aggregated 1,294,022 1,426,457 production costs 2,195,788 1,714,265 738,801 839,316 Sales and distribution expenses 1,448,530 1,062,453 136,681 165,445 Administrative expenses 264,090 173,136 2,169,504 2,431,218 total 3,908,408 2,949,854
break down by type as follows: 1,001,404 1,129,828 Raw materials and consumables 1,777,950 1,351,568 437,113 475,018 Wages, salaries and other staff expenses 709,640 570,249 125,490 127,859 Operating and maintenance expenses 203,274 166,309 98,286 110,660 Distribution expenses and carriage 276,552 176,209 348,931 424,399 Sales and marketing expenses 617,801 468,749 -538 1,383 Bad trade debts 8,004 2,673 70,860 77,718 Office supplies etc 143,407 89,912 87,958 84,353 Depreciation and profit from sale of property, plant and equipment 171,780 124,185 2,169,504 2,431,218 total 3,908,408 2,949,854
Total depreciation and impairment losses as well as profit from sale of property, plant and equipment are included in the following items in the income statement:
parent coMpany group
2012 2013 dkk ‘000 2013 2012
57,964 54,025 Production costs 104,358 87,268 19,639 18,541 Sales and distribution expenses 54,039 22,214 10,355 11,787 Administrative expenses 13,383 14,703 87,958 84,353 total 171,780 124,185
Notes to Income Statement
Note5–expeNsesbrokeNdowNbytype
annual report 2013 Royal UnibRew 79
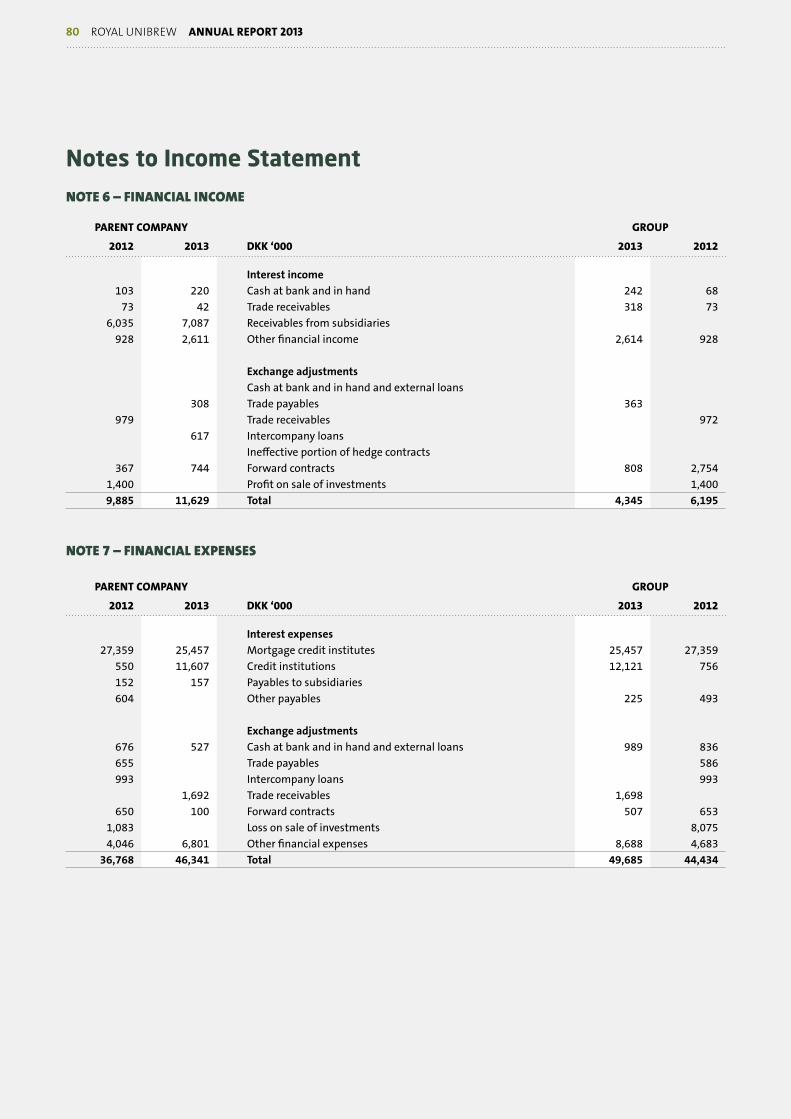
parent coMpany group
2012 2013 dkk ‘000 2013 2012
interest income 103 220 Cash at bank and in hand 242 68 73 42 Trade receivables 318 73 6,035 7,087 Receivables from subsidiaries 928 2,611 Other financial income 2,614 928 Exchange adjustments Cash at bank and in hand and external loans 308 Trade payables 363 979 Trade receivables 972 617 Intercompany loans Ineffective portion of hedge contracts 367 744 Forward contracts 808 2,754 1,400 Profit on sale of investments 1,400 9,885 11,629 total 4,345 6,195
Note7–FiNaNCialexpeNses
parent coMpany group
2012 2013 dkk ‘000 2013 2012
interest expenses 27,359 25,457 Mortgage credit institutes 25,457 27,359 550 11,607 Credit institutions 12,121 756 152 157 Payables to subsidiaries 604 Other payables 225 493
Exchange adjustments 676 527 Cash at bank and in hand and external loans 989 836 655 Trade payables 586 993 Intercompany loans 993 1,692 Trade receivables 1,698 650 100 Forward contracts 507 653 1,083 Loss on sale of investments 8,075 4,046 6,801 Other financial expenses 8,688 4,683 36,768 46,341 total 49,685 44,434
Notes to Income Statement
Note6–FiNaNCialiNCome
80 Royal UnibRew annual report 2013
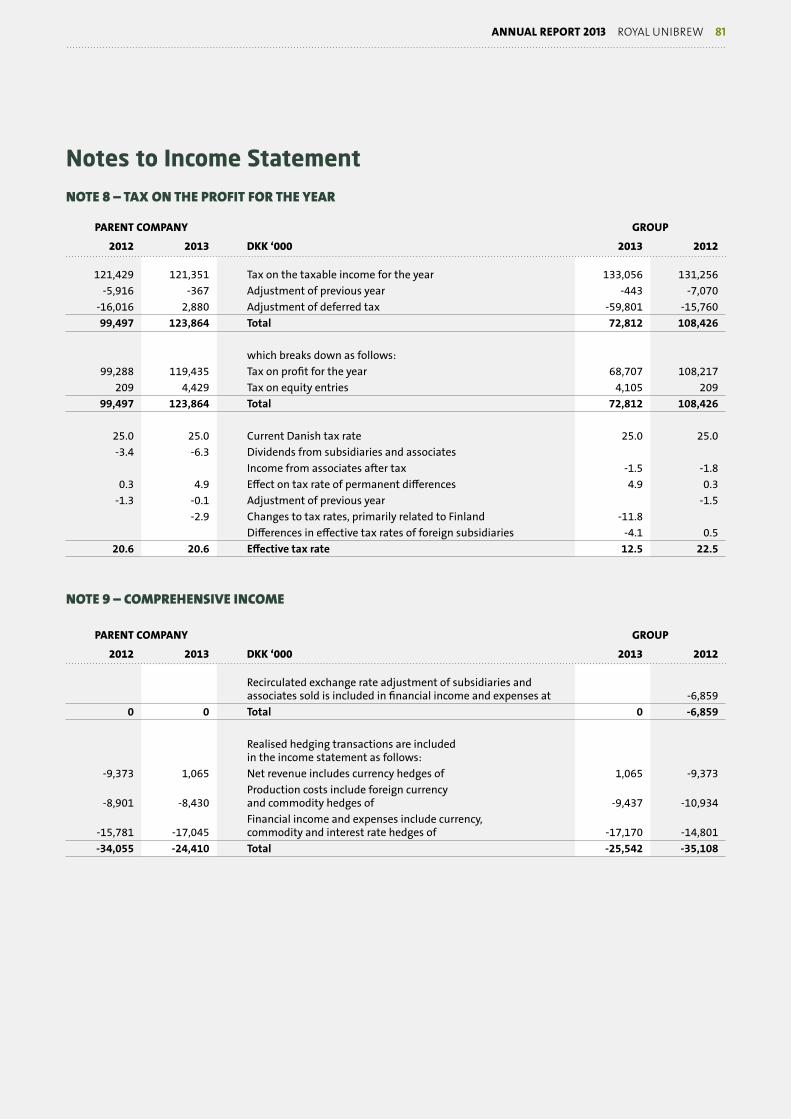
parent coMpany group
2012 2013 dkk ‘000 2013 2012
121,429 121,351 Tax on the taxable income for the year 133,056 131,256 -5,916 -367 Adjustment of previous year -443 -7,070 -16,016 2,880 Adjustment of deferred tax -59,801 -15,760 99,497 123,864 total 72,812 108,426 which breaks down as follows: 99,288 119,435 Tax on profit for the year 68,707 108,217 209 4,429 Tax on equity entries 4,105 209 99,497 123,864 total 72,812 108,426 25.0 25.0 Current Danish tax rate 25.0 25.0 -3.4 -6.3 Dividends from subsidiaries and associates Income from associates after tax -1.5 -1.8 0.3 4.9 Effect on tax rate of permanent differences 4.9 0.3 -1.3 -0.1 Adjustment of previous year -1.5 -2.9 Changes to tax rates, primarily related to Finland -11.8 Differences in effective tax rates of foreign subsidiaries -4.1 0.5 20.6 20.6 Effective tax rate 12.5 22.5
Note9–CompreheNsiveiNCome
parent coMpany group
2012 2013 dkk ‘000 2013 2012
Recirculated exchange rate adjustment of subsidiaries and associates sold is included in financial income and expenses at -6,859 0 0 total 0 -6,859
Realised hedging transactions are included in the income statement as follows: -9,373 1,065 Net revenue includes currency hedges of 1,065 -9,373 Production costs include foreign currency -8,901 -8,430 and commodity hedges of -9,437 -10,934 Financial income and expenses include currency, -15,781 -17,045 commodity and interest rate hedges of -17,170 -14,801 -34,055 -24,410 total -25,542 -35,108
Notes to Income Statement
Note8–taxoNtheproFitFortheyear
annual report 2013 Royal UnibRew 81

Notes to Balance Sheet
Note10–iNtaNgibleassets
group distribution customer dkk ‘000 goodwill trademarks rights relations total
Cost at 1 January 2012 263,733 127,436 13,236 404,405Exchange adjustment 768 49 5 822Disposals on sale/reclassification -19,619 -1,410 -21,029Cost at 31 december 2012 244,882 127,485 11,831 0 384,198
Amortisation and impairment losses at 1 January 2012 0 -3,250 -10,061 -13,311Exchange adjustment -166 -5 -171Amortisation for the year -1,311 -1,311Disposals 1,218 1,218amortisation and impairment losses at 31 december 2012 0 -3,416 -10,159 0 -13,575 Carrying amount at 31 december 2012 244,882 124,069 1,672 0 370,623
Cost at 1 January 2013 244,882 127,485 11,831 384,198Exchange adjustment 64 130 41 13 248Additions on acquisition 1,185,432 1,111,823 217,904 67,734 2,582,893Cost at 31 december 2013 1,430,378 1,239,438 229,776 67,747 2,967,339
Amortisation and impairment losses at 1 January 2013 0 -3,416 -10,159 -13,575Exchange adjustment 80 -1 -1 78Amortisation for the year -5,024 -4,776 -9,800Disposals 0amortisation and impairment losses at 31 december 2013 0 -3,336 -15,184 -4,777 -23,297
Carrying amount at 31 december 2013 1,430,378 1,236,102 214,592 62,970 2,944,042
Trademarks are not amortised as they are all well-established, old and profitable trademarks which customers are expected to continue demanding unabatedly, other things being equal, and which Management is not planning to stop selling and marketing.
Goodwill and trademarks with an indefinite useful life related to Hartwall (Finland) and to Cido and Kalnapilis (Baltic countries) each represents more than 10% of the total value of goodwill and trademarks.
Reference is made to note 11 for impairment tests.
82 Royal UnibRew annual report 2013

Notes to Balance Sheet
Note10–iNtaNgibleassets(CoNtiNued)
parent coMpany distribution dkk ‘000 goodwill trademarks rights total
Cost at 1 January 2012 80,645 2,990 11,828 95,463Cost at 31 december 2012 80,645 2,990 11,828 95,463
Amortisation and impairment losses at 1 January 2012 0 0 -8,972 -8,972Amortisation for the year -1,184 -1,184amortisation and impairment losses at 31 december 2012 0 0 -10,156 -10,156
Carrying amount at 31 december 2012 80,645 2,990 1,672 85,307
Cost at 1 January 2013 80,645 2,990 11,828 95,463Cost at 31 January 2013 80,645 2,990 11,828 95,463
Amortisation and impairment losses at 1 January 2013 0 0 -10,156 -10,156Amortisation for the year -1,183 -1,183amortisation and impairment losses at 31 december 2013 0 0 -11,339 -11,339
Carrying amount at 31 december 2013 80,645 2,990 489 84,124
Trademarks are not amortised as they are all well-established, old and profitable trademarks which customers are expected to continue demanding unabatedly, other things being equal, and which Management is not planning to stop selling and marketing.
Reference is made to note 11 for impairment tests.
annual report 2013 Royal UnibRew 83

Notes to Balance Sheet
Note11–impairmeNttests
impairment tests of goodwill and trademarksAnnual impairment tests are carried out of the carrying amount of goodwill and trademarks with indefinite useful lives. The impairment test in 2013 did not give rise to recognising any impairment losses.
The carrying amount of goodwill and trademarks at 31 December is related to the cash-generating operational units and breaks down as follows:
dkk ‘000 goodwill trademarks total share
2013 Western Europe 80,645 2,990 83,635 3%North East Europe 1,342,466 1,233,112 2,575,578 97%Malt Beverages 7,267 7,267 0%total 1,430,378 1,236,102 2,666,480 100%
The recoverable amount is based on value in use, which is calculated by means of expected net cash flows on the basis of budgets and forecasts for 2014-2016 approved by Management as well as estimated market driven discount rates and growth rates.
Generally only limited revenue growth is expected. Gross margins are assumed to remain stable. The key assumptions underlying the calculation of recoverable amount are as indicated below.
western north east Malt europe europe beverages
Growth rate 2017-2020 1% 0-4% 2%Growth rate on terminal value 1% 1% 2%Discount rate (WACC) 6.0% 5,7-9,5% 15.5%
The forecasted results approved by Management are based on results achieved previously and expected market developments. The average growth rates applied are in accordance with Management’s expectations taking into account industry conditions in the indi-vidual markets. The discount rates applied are before tax and reflect current specific risks in the individual market. In North East Europe, the lowest point of the ranges indicated for growth rate 2017-2020 and discount rate relates to Finland. The assumptions applied by Management are inherently subject to uncertainty and unpredictability. Reasonably probable changes will not lead to recognition of impairment losses.
84 Royal UnibRew annual report 2013

Notes to Balance Sheet
Note11–impairmeNttests(CoNtiNued)
dkk ‘000 goodwill trademarks total share
2012 Western Europe 80,645 2,990 83,635 23%North East Europe 156,796 121,079 277,875 74%Malt Beverages 7,441 7,441 2%total 244,882 124,069 368,951 100%
The key assumptions underlying the calculation of recoverable amount in 2012 were:
western north east Malt europe europe beverages
Growth rate 2016-2019 1% 4% 2%Growth rate on terminal value 1% 1% 2%Discount rate (WACC) 5.5% 9.2-9.5% 16%
The forecasted results approved by Management are based on results achieved previously and expected market developments. The av-erage growth rates applied are in accordance with Management’s expectations taking into account industry conditions in the individu-al markets. The discount rates applied are before tax and reflect current specific risks in the individual market. The assumptions applied by Management are inherently subject to uncertainty and unpredictability. Reasonably probable changes will not lead to recognition of impairment losses.
annual report 2013 Royal UnibRew 85

Notes to Balance Sheet
Note12–property,plaNtaNdequipmeNt
group
other fixtures and property, project fittings, plant and land and development plant and tools and equipment dkk ‘000 buildings properties machinery equipment in progress total
Cost at 1 January 2012 967,609 203,714 1,521,981 542,445 30,623 3,266,372Exchange adjustment 307 539 227 4 1,077Additions 4,444 32,965 38,499 78,468 154,376Disposals -9,137 -49,332 -56,322 -53,715 -168,506Disposals on sale of activities -5,692 -5,692Transfers for the year 9,704 16 13,007 18,837 -41,564 0Cost at 31 december 2012 968,483 158,842 1,512,170 540,601 67,531 3,247,627
Depreciation and impairment losses at 1 January 2012 -383,489 207,736 -1,079,198 -410,147 0 -1,665,098Exchange adjustment -80 101 -170 -149Reversal of depr. and impairment on sale 5,205 5,205Depreciation for the year -32,547 -48,447 -40,409 -121,403Depreciation and impairment of assets sold and discontinued 6,833 -90,240 48,743 47,823 13,159depreciation and impairment losses at 31 december 2012 -409,283 117,496 -1,078,801 -397,698 0 -1,768,286 Carrying amount at 31 december 2012 559,200 276,338 433,369 142,903 67,531 1,479,341
Land and buildings and Plant and machinery at a carrying amount of DKK 605,9 million have been provided as security for mortgage debt of DKK 593.7 million.
86 Royal UnibRew annual report 2013

Notes to Balance Sheet
Note12–property,plaNtaNdequipmeNt(CoNtiNued)
group
other fixtures and property, project fittings, plant and land and development plant and tools and equipment dkk ‘000 buildings properties machinery equipment in progress total
Cost at 1 January 2013 968,483 158,842 1,512,170 540,601 67,531 3,247,627Exchange adjustment 312 340 -4 3 651Additions 2,882 2,901 57,271 44,432 35,908 143,394Additions on acquisition 720,988 402,974 112,487 8,901 1,245,350Disposals -52 -16,040 -14,243 -56,525 -86,860Transfers for the year 9,033 60,271 4,875 -74,179 0Cost at 31 december 2013 1,701,646 145,703 2,018,783 645,866 38,164 4,550,162
Depreciation and impairment losses at 1 January 2013 -409,283 117,496 -1,078,801 -397,698 0 -1,768,286Exchange adjustment -9 -42 -224 -275Depreciation for the year -30,901 -71,219 -58,523 -160,643Revaluations for the year 90,000 90,000Depreciation and impairment of assets sold and discontinued 52 -62,660 11,546 49,045 -2,017depreciation and impairment losses at 31 december 2013 -440,141 144,836 -1,138,516 -407,400 0 -1,841,221
Carrying amount at 31 december 2013 1,261,505 290,539 880,267 238,466 38,164 2,708,941
Finance lease assets included above Cost 117,774 117,774Depreciation and impairment losses -4,430 -4,430Carrying amount at 31 december 2013 113,344 113,344
Land and buildings and Plant and machinery at a carrying amount of DKK 656,5 million have been provided as security for mortgage debt of DKK 761.9 million.Leased assets at a carrying amount of DKK 113.3 million have been provided as security for lease commitments totalling DKK 109 mil-lion.
annual report 2013 Royal UnibRew 87

Notes to Balance Sheet
Note12–property,plaNtaNdequipmeNt(CoNtiNued)
parent coMpany
other fixtures and property, project fittings, plant and land and development plant and tools and equipment dkk ‘000 buildings properties machinery equipment in progress total
Cost at 1 January 2012 653,951 203,714 1,096,621 433,079 26,947 2,414,312Additions 4,444 13,509 33,736 69,463 121,152Disposals -9,116 -49,332 -50,373 -42,265 -151,086Transfers for the year 7,884 16 4,733 18,938 -31,571 0Cost at 31 december 2012 652,719 158,842 1,064,490 443,488 64,839 2,384,378
Depreciation and impairment losses at 1 January 2012 -308,616 207,736 -799,763 -326,854 0 -1,227,497Depreciation for the year -20,635 -31,329 -33,751 -85,715Depreciation and impairment of assets sold and discontinued 6,823 -90,240 42,158 38,975 -2,284depreciation and impairment losses at 31 december 2012 -322,428 117,496 -788,934 -321,630 0 -1,315,496 Carrying amount at 31 december 2012 330,291 276,338 275,556 121,858 64,839 1,068,882
Land and buildings and Plant and machinery at a carrying amount of DKK 605,9 million have been provided as security for mortgage debt of DKK 593.7 million.
other fixtures and property, project fittings, plant and land and development plant and tools and equipment dkk ‘000 buildings properties machinery equipment in progress total
Cost at 1 January 2013 652,719 158,842 1,064,490 443,488 64,839 2,384,378Additions 2,124 2,901 47,534 33,978 25,348 111,885Disposals -52 -16,040 -13,582 -45,266 -74,940Transfers for the year 8,945 51,296 3,461 -63,702 0Cost at 31 december 2013 663,736 145,703 1,149,738 435,661 26,485 2,421,323
Depreciation and impairment losses at 1 January 2013 -322,428 117,496 -788,934 -321,630 0 -1,315,496Revaluation for the year 90,000 90,000Depreciation for the year -14,828 -33,454 -34,312 -82,594Depreciation and impairment of assets sold and discontinued 52 -62,660 10,994 39,929 -11,685depreciation and impairment losses at 31 december 2013 -337,204 144,836 -811,394 -316,013 0 -1,319,775
Carrying amount at 31 december 2013 326,532 290,539 338,344 119,648 26,485 1,101,548
Land and buildings and Plant and machinery at a carrying amount of DKK 656,5 million have been provided as security for mortgage debt of DKK 761.9 million.
88 Royal UnibRew annual report 2013

Notes to Balance Sheet
Note13–FixedassetiNvestmeNts
group
investments other other dkk ‘000 in associates investments receivables total
Cost at 1 January 2012 230,681 58,279 5,235 294,195Reclassification, beginning of year -7,309 -7,309Exchange adjustment 17,963 4,891 -1 22,853Additions 40 6,302 6,342Disposals -202,026 -83 -1,527 -203,636Cost at 31 december 2012 46,618 55,818 10,009 112,445
Value adjustments at 1 January 2012 60,031 -55,666 -121 4,244Reclassification, beginning of year 7,309 7,309Exchange adjustment 3,614 -4,891 -1 -1,278Disposals -326 -326Dividend -13,442 -13,442Share of profit for the year 41,469 41,469Other comprehensive income -976 -976Impairment losses for the year -7,206 50 -242 -7,398value adjustments at 31 december 2012 83,164 -53,198 -364 29,602 Carrying amount at 31 december 2012 129,782 2,620 9,645 142,047
investments other other dkk ‘000 in associates investments receivables total
Cost at 1 January 2013 46,618 55,818 10,009 112,445Reclassification, beginning of year 1,444 1,444Exchange adjustment -3,374 -873 -5 -4,252Additions 8,683 8,683Additions on acquisition 4,875 4,875Disposals -1,286 -1,286Cost at 31 december 2013 44,688 68,503 8,718 121,909 Value adjustments at 1 January 2013 83,164 -53,198 -364 29,602Exchange adjustment -9,187 874 -8,313Dividend, net -20,474 -20,474Share of profit for the year 33,552 33,552Other comprehensive income 780 780Revaluations and impairment losses for the year -448 -448value adjustments at 31 december 2013 87,835 -52,772 -364 34,699 Carrying amount at 31 december 2013 132,523 15,731 8,354 156,608
annual report 2013 Royal UnibRew 89

Notes to Balance Sheet
Note13–FixedassetiNvestmeNts(CoNtiNued)
parent coMpany
invest- invest- receivables other ments in ments in from invest- other dkk ‘000 subsidiaries associates subsidiaries ments receivables total
Cost at 1 January 2012 811,161 284,873 0 51,943 4,538 1,152,515Reclassification, beginning of year -1,126 -1,126Exchange adjustment 4,891 4,891Additions 7,460 155,414 6,302 169,176Disposals -28,053 -208,942 -1,386 -238,381Cost at 31 december 2012 790,568 75,931 155,414 55,708 9,454 1,087,075 Revaluations and impairment losses at 1 January 2012 -89,035 0 0 -49,483 0 -138,518Reclassification, beginning of year 1,126 1,126Exchange adjustment -4,891 -4,891Revaluations and impairment losses for the year 50 50Revaluations and impairment losses at 31 december 2012 -89,035 0 0 -53,198 0 -142,233 Carrying amount at 31 december 2012 701,533 75,931 155,414 2,510 9,454 944,842
invest- invest- receivables other ments in ments in from invest- other dkk ‘000 subsidiaries associates subsidiaries ments receivables total
Cost at 1 January 2013 790,568 75,931 155,414 55,708 9,454 1,087,075Reclassification, beginning of year 1,443 1,443Exchange adjustment 14 -875 -861Disposals 2,775,124 2,775,124Additions -1,281 -1,281Cost at 31 december 2013 3,565,692 77,374 155,428 54,833 8,173 3,861,500 Revaluations and impairment losses at 1 January 2013 -89,035 0 0 -53,198 0 -142,233Exchange adjustment 875 875Revaluations and impairment losses for the year 11 11Revaluations and impairment losses at 31 december 2013 -89,035 0 0 -52,312 0 -141,347 Carrying amount at 31 december 2013 3,476,657 77,374 155,428 2,521 8,173 3,720,153
90 Royal UnibRew annual report 2013

Notes to Balance Sheet
Note14–NoN-CurreNtassetsmeasuredatFairvalue
proJect developMent properties (brewery site in aarhus)In 2011 the Company entered into a co-operation agreement based on an option model under which the purchaser may acquire the brewery site piece by piece in the period to the end of 2016. It remains Management’s assessment as stated in connection with the presentation of the Financial Statements for the period 1 Janu-ary - 31 December 2012 that the potential cash flow under the said cooperation agreement provides the best basis for estimating the fair value of the brewery site. Building rights for 55,100 square metres of the total 140,000 square metres of building rights at the brewery site were sold in 2012 and 2013 at carrying amount. In 2008 and 2013 the carrying amount was revalued by DKK 240 million and DKK 90 million, respectively. The revaluation is less deferred tax recognised in revaluation reserves in equity. The carrying amount of the remaining 84,900 square metres
of building rights amounts to DKK 291 million at 31 December 2013 and does not differ materially from the currently estimated fair value. The purchaser has notified Royal Unibrew that he wishes to acquire building rights for additionally 8,775 square metres. The acquisition will be made at a value corresponding to the carrying amount at 31 December 2013.
The key elements of the calculation of the fair value of the brewery site are estimat-ed selling prices and milestone dates un-der the cooperation agreement, estimated costs up until the date of sale (property taxes, project and selling costs) and the discount rate. The fair value measurement is classified in level 3 of the fair value hier-archy. At 31 December 2013 Management estimates the fair value per square metre of building rights at nominally approx DKK 4,200 (2012: DKK 4,000) based on average sales proceeds (selling price less costs), an average vacancy period of 2-3
years (2012: 3-4 years) and a discount rate of 6.5% (2012: 6.5%) for the 84,900 square metres of building rights comprised by the unsold part of the site according to the existing local plan.
As the agreement is an option-based agreement, the disposal of the brew-ery site, including the related timing, is subject to uncertainty, and the value at the time of disposal may differ materially from the currently estimated fair value, which does not differ materially from car-rying amount at 31 December 2013.
The currently estimated fair value changes by approx DKK 6 million (2012: DKK 9 million) per DKK 100 change of the square metre price, by approx DKK 13 million (2012: DKK 18 million) per yearly change of the average vacancy period and by approx DKK 5 million (2012: DKK 8 million) per percentage point change of the discount rate.
annual report 2013 Royal UnibRew 91

Notes to Balance Sheet
Note15–iNvestmeNtsiNassoCiates
parent coMpany group
2012 2013 dkk ‘000 2013 2012
284,873 75,931 Balance at 1 January 129,782 290,712 Exchange adjustment -12,561 21,577 1,443 Reclassification 1,444 -208,942 Disposals -202,352 Share of profit for the year 33,552 41,469 Other comprehensive income 780 -976 Impairment losses -7,206 Dividend, net -20,474 -13,442 75,931 77,374 Balance at 31 december 132,523 129,782
Stated on a pro rata basis, the Parent Company’s and the Group’s shares of assets, liabilities, revenue and profit basis break down on segments as follows:
2012 revenue profit assets liabilities
Western Europe 450,026 21,587 325,701 323,959North East Europe 143,798 9,342 parent Company and group 593,824 30,929 325,701 323,959
2013 revenue profit assets liabilities
Western Europe 461,113 33,552 303,106 190,486parent Company and group 461,113 33,552 303,106 190,486
92 Royal UnibRew annual report 2013

Notes to Balance Sheet
Note16–portFoliooFtreasurysharesaNdbasisoFearNiNgs/CashFlowpershare
Treasury shares held by the Parent Company:
dkk ‘000 number nom. value % of capital
Portfolio at 1 January 2012 500,820 5,008 4.5Additions 499,950 4,999 4.7Reduction of capital -616,498 -6,165 -5.6Disposals -1,324 -13 0.0portfolio at 31 december 2012 382,948 3,829 3.6
Portfolio at 1 January 2013 382,948 3,829 3.6Additions 206,638 2,067 1.9Reduction of capital -480,000 -4,800 -4.1Disposals -49,586 -496 -0.4portfolio at 31 december 2013 60,000 600 0.5
The Group holds no other treasury shares.
Basis of calculation of earnings and cash flow per shareThe Parent Company shareholders’ share of profit for the year amounts to DKK 479,576k (2012: DKK 371,192k).The average number of treasury shares amounted to 203,812 shares (2012: 335,693).The average number of shares in circulation amounted to 10,458,688 shares (2012: 10,419,806).The average number of shares in circulation incl conditional shares amounted to 10,478,688 shares (2012: 10,444,724).Diluted earnings and cash flow per share have been calculated on the basis of the Parent Company shareholders’ share of profit/loss for the year.
annual report 2013 Royal UnibRew 93

Notes to Balance Sheet
Note17–deFerredtax
parent coMpany group
2012 2013 dkk ‘000 2013 2012
166,192 144,192 Deferred tax at 1 January 144,795 166,539 Additions on acquisition 353,180 17,156 34,841 Change in deferred tax for the year 38,565 17,412 -33,172 -19,168 Change sale of project development property -19,168 -33,172 6,207 Changes to tax rates -59,801 -5,984 Adjustment of previous year -5,984 144,192 166,072 deferred tax at 31 december 457,571 144,795 3,882 7,866 Due within 1 year -36,134 1,657 Deferred tax relates to: 418 131 Intangible assets 272,446 418 142,368 143,003 Property, plant and equipment 207,971 145,196 1,903 9,468 Current assets 7,521 286 -497 -5,526 Current liabilities -49,363 -1,105 0 18,996 Non-current assets 18,996 144,192 166,072 total 457,571 144,795
The utilisation of unutilised tax losses in one of the Group’s foreign enterprises is not certain. Therefore, the tax asset corresponding to approx DKK 2.5 million (2012: approx DKK 2.5 million) has not been capitalised.
Note18–repurChaseobligatioN,returNablepaCkagiNg
parent coMpany group
2012 2013 dkk ‘000 2013 2012
39,429 34,841 Balance at 1 January 36,211 42,241 Additions on acquisition 68,612 -4,588 -2,843 Adjustment for the year -885 -6,030 34,841 31,998 Balance at 31 december 103,938 36,211
The change in the repurchase obligation for the year reflects net sales of returnable packaging for the year less estimated wastage of returnable packaging in circulation.
The reduction in the repurchase obligation is primarily due to beer and soft drinks in Denmark now to a greater extent being sold in recyclable disposable containers whereas previously they were sold in returnable containers.
94 Royal UnibRew annual report 2013

Notes to Cash Flow Statement
Note19–CashFlowstatemeNt
Adjustments for non-cash operating items:
parent coMpany group
2012 2013 dkk ‘000 2013 2012
-65,079 -153,189 Dividends from subsidiaries and associates -9,885 -11,629 Financial income -4,345 -6,195 36,768 46,341 Financial expenses 49,685 44,434 Amortisation, depreciation and impairment of intangible assets 86,899 83,777 and property, plant and equipment 170,443 122,956 99,288 119,435 Tax on the profit for the year 68,707 108,217 Income from investments in associates -33,552 -34,263 2,337 576 Profit and loss from sale of property, plant and equipment 1,338 2,782 3,300 Share-based payments and remuneration 3,300 349 Other adjustments 349 150,677 88,611 total 255,576 238,280
annual report 2013 Royal UnibRew 95

Other notes
Note20–Feetoauditors
parent coMpany group
2012 2013 dkk ‘000 2013 2012
Fee for the audit of the Annual Report: 760 775 Ernst & Young 1,988 1,334 760 775 total 1,988 1,334
Ernst & Young fee for non-audit services: 144 221 Tax assistance 221 144 60 277 Other assurance assistance 277 60 199 341 Other assistance 717 283 403 839 total 1,215 487
Note21–CoNtiNgeNtliabilities,seCurityaNdotherliabilities
parent coMpany group
2012 2013 dkk ‘000 2013 2012
guarantees 86.5 253.3 Guarantees relating to subsidiaries 86.5 253.3 total 0.0 0.0
Rental and operating lease commitments Total future payments: 19.6 18.5 Within 1 year 40.8 31.5 33.6 24.1 Between 1 and 5 years 42.5 42.0 Beyond 5 years 53.2 42.6 total 83.3 73.5
The operating lease commitments relate to operating leases of production machinery, operating equipment and IT equipment.
Rental obligations 4.3 4.2 Within 1 year 19.6 5.1 8.0 5.6 Between 1 and 5 years 28.7 11.1 Beyond 5 years 1.6 12.3 9.8 total 48.3 17.8
Finance lease commitments Total future payments: Within 1 year 46.8 Between 1 and 5 years 61.8 Beyond 5 years 0.0 0.0 total 108.6 0.0
The finance lease commitments relate to finance leases of production machinery.
securityNo security has been provided in respect of the Group’s loan agreements with credit institutions other than the Parent Company’s li-ability for the amounts drawn by subsidiaries on group credit facilities.
The outcome of pending legal actions is not expected to have any material impact on the financial position of the Parent Company or the Group.
96 Royal UnibRew annual report 2013

Other notes
Note22–relatedparties
Related parties comprise the Board of Directors and the Executive Board as well as subsidiaries and associates, see the sections on Board of Directors and Executive Board on page X and Group Structure on page X. No shareholder exercises control.
All transactions, including lending, are carried out on an arm’s length basis.
The following transactions have been made with related parties:
parent coMpany group
2012 2013 dkk ‘000 2013 2012
Revenue 626,436 555,389 Sales to subsidiaries 12,847 6,056 Sales to associates 6,056 12,847
Costs 4,959 18,036 Purchases from subsidiaries
Financial income and expenses 13,442 20,474 Dividends from associates 20,474 13,442 51,637 132,715 Dividends from subsidiaries 6,035 7,087 Interest received from subsidiaries
152 157 Interest paid to subsidiaries
Executive Board 20,886 22,541 Remuneration 22,541 20,886
Board of directors 2,813 2,875 Remuneration 2,875 2,813
intercompany balances at 31 december 226,983 336,472 Loans to subsidiaries
65,798 62,061 Receivables from subsidiaries 1,444 Receivables from associates 1,444
8,256 6,804 Loans from subsidiaries 1,645 Debt to subsidiaries
property, plant and equipment 3,283 Sales to subsidiaries
7,460 Capital contributed to subsidiaries
guarantees and security 86,500 253,300 Guarantee for subsidiaries
Transactions with subsidiaries are eliminated in the Consolidated Financial Statements in accordance with the accounting policies ap-plied.
annual report 2013 Royal UnibRew 97
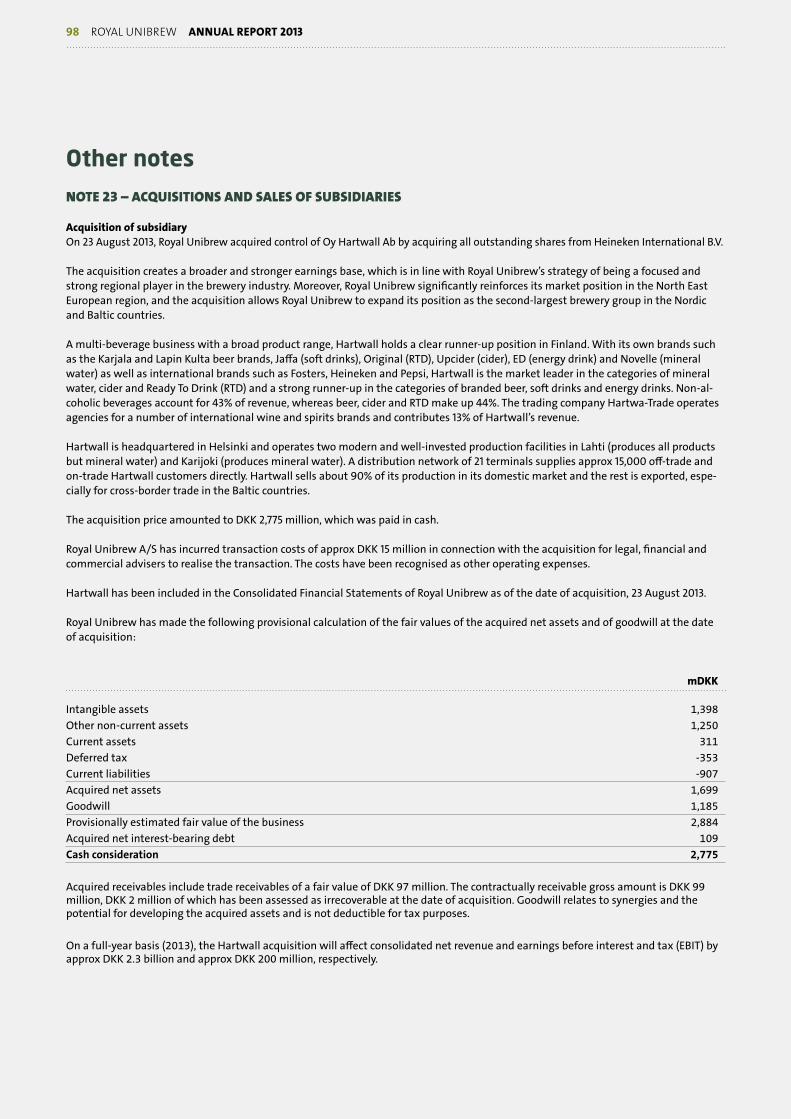
Other notes
Note23–aCquisitioNsaNdsalesoFsubsidiaries
acquisition of subsidiaryOn 23 August 2013, Royal Unibrew acquired control of Oy Hartwall Ab by acquiring all outstanding shares from Heineken International B.V.
The acquisition creates a broader and stronger earnings base, which is in line with Royal Unibrew’s strategy of being a focused and strong regional player in the brewery industry. Moreover, Royal Unibrew significantly reinforces its market position in the North East European region, and the acquisition allows Royal Unibrew to expand its position as the second-largest brewery group in the Nordic and Baltic countries.
A multi-beverage business with a broad product range, Hartwall holds a clear runner-up position in Finland. With its own brands such as the Karjala and Lapin Kulta beer brands, Jaffa (soft drinks), Original (RTD), Upcider (cider), ED (energy drink) and Novelle (mineral water) as well as international brands such as Fosters, Heineken and Pepsi, Hartwall is the market leader in the categories of mineral water, cider and Ready To Drink (RTD) and a strong runner-up in the categories of branded beer, soft drinks and energy drinks. Non-al-coholic beverages account for 43% of revenue, whereas beer, cider and RTD make up 44%. The trading company Hartwa-Trade operates agencies for a number of international wine and spirits brands and contributes 13% of Hartwall’s revenue.
Hartwall is headquartered in Helsinki and operates two modern and well-invested production facilities in Lahti (produces all products but mineral water) and Karijoki (produces mineral water). A distribution network of 21 terminals supplies approx 15,000 off-trade and on-trade Hartwall customers directly. Hartwall sells about 90% of its production in its domestic market and the rest is exported, espe-cially for cross-border trade in the Baltic countries.
The acquisition price amounted to DKK 2,775 million, which was paid in cash.
Royal Unibrew A/S has incurred transaction costs of approx DKK 15 million in connection with the acquisition for legal, financial and commercial advisers to realise the transaction. The costs have been recognised as other operating expenses.
Hartwall has been included in the Consolidated Financial Statements of Royal Unibrew as of the date of acquisition, 23 August 2013.
Royal Unibrew has made the following provisional calculation of the fair values of the acquired net assets and of goodwill at the date of acquisition:
mdkk
Intangible assets 1,398Other non-current assets 1,250Current assets 311Deferred tax -353Current liabilities -907Acquired net assets 1,699Goodwill 1,185Provisionally estimated fair value of the business 2,884Acquired net interest-bearing debt 109Cash consideration 2,775
Acquired receivables include trade receivables of a fair value of DKK 97 million. The contractually receivable gross amount is DKK 99 million, DKK 2 million of which has been assessed as irrecoverable at the date of acquisition. Goodwill relates to synergies and the potential for developing the acquired assets and is not deductible for tax purposes.
On a full-year basis (2013), the Hartwall acquisition will affect consolidated net revenue and earnings before interest and tax (EBIT) by approx DKK 2.3 billion and approx DKK 200 million, respectively.
98 Royal UnibRew annual report 2013
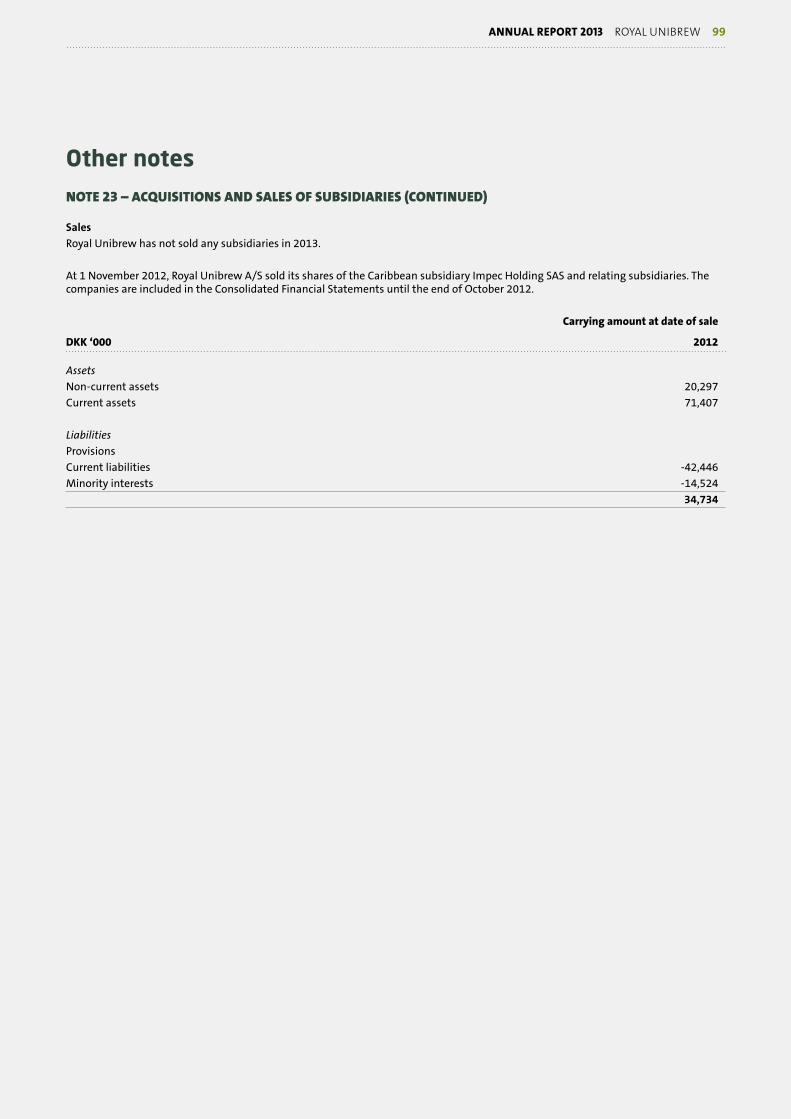
Other notes
Note23–aCquisitioNsaNdsalesoFsubsidiaries(CoNtiNued)
salesRoyal Unibrew has not sold any subsidiaries in 2013.
At 1 November 2012, Royal Unibrew A/S sold its shares of the Caribbean subsidiary Impec Holding SAS and relating subsidiaries. The companies are included in the Consolidated Financial Statements until the end of October 2012.
carrying amount at date of sale
dkk ‘000 2012
AssetsNon-current assets 20,297Current assets 71,407
LiabilitiesProvisionsCurrent liabilities -42,446Minority interests -14,524 34,734
annual report 2013 Royal UnibRew 99

Other notes
Note24–sigNiFiCaNtaCCouNtiNgpoliCies
general
The Financial Statements of Royal Unibrew for 2013 have been prepared in accordance with International Financial Reporting Standards (IFRS) as adopted by the EU and additional Danish disclosure requirements for financial statements, cf the reporting requirements for listed companies laid down by NASDAQ OMX Copenhagen A/S and the Danish Statutory Order on Adoption of IFRS issued pursuant to the Danish Financial Statements Act.
The Financial Statements are presented in Danish kroner (DKK).
new and amended standards and interpretations that have taken effectRoyal Unibrew has during the year imple-mented all new IFRSs, amendments to existing standards and IFRICs adopted by the EU which take effect for the financial year 2013. These comprise:
• Amendment of IAS 1 concerning group-ing of comprehensive income items
• IFRS 13, Fair Value Measurement
Standards and interpretations adopted by the IASB and the EU which take effect for the financial year 2013 have not impacted the Annual Report other than in the form of a few additional disclosures.
new and amended standards and inter-pretations that have not yet taken effectThe IASB has adopted a number of new standards and amendments to existing standards and interpretations which have not yet taken effect but will take effect in the financial year 2014 or later. The follow-ing standards, amendments and interpre-tations are relevant for Royal Unibrew:
• IFRS 9, Financial Instruments• IFRS 10, Consolidated Financial State-
ments• Amendment of IFRS 11, Joint Arrange-
ments, to the effect that joint ventures are recognised at equity value
• Amendment of IFRS 12 concerning ad-ditional disclosures of interests in other entities
The above standards, amendments and interpretations are not expected to im-pact recognition and measurement, only the extent of disclosures in the Annual Report.
Royal Unibrew expects to implement the above when they take effect. Where the effective date of the EU differs from that of the IASB, Royal Unibrew will follow the effective date of the EU.
Moreover, the IASB has adopted a number of other new and amended standards and interpretations which are not relevant to the Company and are not expected to impact future Financial Statements.
recognition and measurementAssets are recognised in the balance sheet when it is probable that future economic benefits attributable to the asset will flow to the Group, and the value of the asset can be measured reliably.
Liabilities are recognised in the balance sheet when they are probable and can be measured reliably. Assets and liabilities are initially measured at cost. Subse-quently, assets and liabilities are meas-ured as described for each item below.
Recognition and measurement take into account gains, losses and risks occurring before the presentation of the Annual Report which confirm or invalidate affairs and conditions existing at the balance sheet date.
Revenues are recognised in the income statement as earned. Furthermore, value adjustments of financial assets and liabilities measured at fair value or amortised cost are recognised. Moreover, all expenses incurred to achieve the earn-ings for the year are recognised, including depreciation, amortisation, impairment losses and provisions as well as reversals due to changed accounting estimates in the income statement.
consolidated Financial statementsThe Consolidated Financial Statements comprise Royal Unibrew A/S (the Parent Company) and enterprises in which the
Parent Company exercises control (sub-sidiaries).
Enterprises in which the Group holds between 20% and 50% of the votes and exercises significant influence but not control are classified as associates.
The Consolidated Financial Statements are prepared on the basis of Financial State-ments of all group enterprises prepared under the Group’s accounting policies by combining accounting items of a uniform nature. Elimination is made of intercom-pany income and expenses, unrealised intercompany profits and losses, balances and shareholdings. Comparative figures are not adjusted for newly acquired, sold or wound-up enterprises.
Enterprises acquired are recognised as of the date of acquisition. Enterprises disposed of are recognised in the consoli-dated income statement up until the date of disposal.
business combinationsOn acquisition of new enterprises the pur-chase method is applied, under which the identifiable assets and liabilities of newly acquired enterprises are measured at fair value at the time of acquisition.
Upon business combinations, positive differences between cost and fair value of identifiable assets and liabilities acquired are recognised as goodwill in intangible assets. At the time of acquisition, good-will is allocated to the cash-generating units that subsequently form the basis of impairment tests. Goodwill and fair value adjustments in connection with the acquisition of a foreign enterprise with a functional currency that differs from the presentation currency of the Group are treated as assets and liabilities belonging to the foreign entity and are translated to the functional currency of the foreign entity at the exchange rates at the dates of transaction.
Gains or losses on disposal of subsidiar-ies and associates are calculated as the difference between the sales sum and the carrying amount of net assets at the time of sale (including the carrying amount of
100 Royal UnibRew annual report 2013

Other notes
Note24–sigNiFiCaNtaCCouNtiNgpoliCies(CoNtiNued)
goodwill) net of expected expenses and adjusted for exchange adjustments previ-ously recognised in equity.
Minority interestsMinority interests are initially recognised on the basis of fair values of the assets, liabilities and contingent liabilities of the acquired enterprise at the time of acquisi-tion.
The accounting items of subsidiaries are recognised fully in the Consolidated Financial Statements. Minority interests’ proportionate share of results of subsidi-aries is shown as a separate item under distribution of profit. In the balance sheet, minority interests are recognised as part of equity but are shown separately from Parent Company shareholders’ share of equity.
translation policiesFor each of the reporting entities of the Group, a functional currency is deter-mined. The functional currency is the currency of the primary economic environ-ment in which the reporting entity oper-ates. Transactions in other currencies than the functional currency are transactions in foreign currencies.
Transactions in other currencies than the functional currency are initially translated into Danish kroner at the exchange rates at the dates of transaction. Receivables, payables and other monetary items in for-eign currencies not settled at the balance sheet date are translated at the exchange rates at the balance sheet date. Exchange adjustments arising due to differences be-tween the transaction date rates and the rates at the dates of payment or the rates at the balance sheet date, respectively, are recognised in financial income and ex-penses in the income statement. Property, plant and equipment and intangible as-sets, inventories and other non-monetary assets purchased in foreign currencies and measured at historical cost are translated at the transaction date rates.
On recognition in the Consolidated Financial Statements of enterprises with another functional currency than Danish
kroner (DKK), income statements are translated at average annual exchange rates. Balance sheet items are translated at the exchange rates at the balance sheet date.
Exchange adjustments arising on the translation of the opening balance sheet items of foreign enterprises at exchange rates at the balance sheet date and on the translation of income statements from average exchange rates to exchange rates at the balance sheet date are recognised in other comprehensive income. Similarly, exchange adjustments arising due to changes made directly in equity of foreign enterprises are recognised in other com-prehensive income.
On recognition in the Consolidated Financial Statements of associates with a functional currency that differs from the presentation currency of the Parent Company, the share of results for the year is translated at average exchange rates, and the share of equity including goodwill is translated at the exchange rates at the balance sheet date. Exchange adjustments arising on the translation of the share of the opening equity of foreign associates at exchange rates at the bal-ance sheet date and on the translation of the share of results for the year from average exchange rates to exchange rates at the balance sheet date are recognised in other comprehensive income and classi-fied in equity under a separate translation reserve.
derivative financial instrumentsDerivative financial instruments are initially recognised in the balance sheet at cost and are subsequently remeasured at their fair values. Positive and negative fair values of derivative financial instruments are included as other receivables and other payables, respectively.
Changes in the fair values of derivative financial instruments that are designated and qualify as fair value hedges of a rec-ognised asset or a recognised liability are recognised in the income statement as are any changes in the value of the hedged asset or the hedged liability.
Changes in the fair values of derivative financial instruments that are designated and qualify as hedges of future cash flows are recognised in other comprehensive income. Income and expenses relating to such hedging transactions are trans-ferred from other comprehensive income on realisation of the hedged item and are recognised in the same entry as the hedged item.
For derivative financial instruments which do not meet the criteria for hedge accounting, changes in fair values are recognised on a current basis in financial income and expenses in the income state-ment.
leasesFor accounting purposes, lease obligations are classified as either financial or operat-ing lease obligations. A lease is classified as a finance lease if it substantially trans-fers the risks and rewards of ownership of the leased asset. All other leases are classified as operating leases.
Payments made under operating leases are recognised in the income statement on a straight-line basis over the lease term.
share-based payments The Group only has schemes classified as equity-settled schemes. Conditional shares are measured at fair value at the time of granting and are recognised in staff expenses in the income statement over the vesting period. The counter item is recognised directly in equity.
At the initial recognition of the condition-al shares, the number of shares expected to vest is estimated. Subsequently, the estimate of the number of conditional shares is revised so that the total recogni-tion is based on the actual share grant expected.
The fair value of the actual conditional share grant expected is estimated on the basis of the Black-Scholes model. In deter-mining fair value, conditions and terms related to the conditional shares are taken into account. In the event of an increase or
annual report 2013 Royal UnibRew 101

Other notes
Note24–sigNiFiCaNtaCCouNtiNgpoliCies(CoNtiNued)
reduction of capital, the allocated, unex-ercised options are adjusted with a view to eliminating the effect of the Company’s capital transaction.
impairmentThe carrying amounts of intangible assets and property, plant and equipment are reviewed on an annual basis to determine whether impairment has incurred other than that expressed by normal amortisa-tion and depreciation. If so, the asset is written down to the higher of net selling price and value in use. Goodwill and other assets for which a value in use cannot be determined as the asset does not on an in-dividual basis generate future cash flows are reviewed for impairment together with the group of assets (cash-generating units) to which they are attributable.
The carrying amount of goodwill and trademarks with indefinite useful lives is tested for impairment at least on an an-nual basis, together with the other non-current assets of the cash-generating unit to which goodwill has been allocated, and is written down to recoverable amount in the income statement if the carrying amount exceeds the recoverable amount.
The carrying amount of financial assets measured at cost or amortised cost is written down for impairment if, due to changed expected net payments, the net present value is lower than the carrying amount.
assets held for saleAssets held for sale comprise assets held for sale. Assets are classified as “held for sale” if their carrying amount will principally be recovered through a sales transaction within 12 months according to a formalised plan.
Assets held for sale are measured at the date of classification at the lower of carrying amount and fair value less costs to sell. Subsequently, the assets are measured at fair value less costs to sell; however, any subsequent unrealised gain cannot exceed the accumulated impair-ment loss. Depreciation of assets ceases
as of the date when they are classified as “held for sale”.
Impairment losses arising on the initial classification as “held for sale” and subsequent losses or reversal of losses are recognised in the income statement in the items to which they relate. Gains and losses are disclosed in the notes. Assets held for sale are shown in a separate line in the balance sheet.
incoMe stateMent
revenueNet revenue from the sale of goods is recognised in the income statement if delivery has been made before year end, and if revenues can be measured reliably and are expected to be received.
Net revenue is measured exclusive of VAT and net of discounts as well as excise du-ties on beer and mineral water. All types of discounts granted are recognised in net revenue.
production costsProduction costs comprise direct and in-direct expenses incurred to manufacture the finished goods representing revenue for the year, including expenses for raw materials and consumables purchases, salaries and wages, renting and leasing as well as depreciation of and impairment losses on plant and machinery.
Production costs also include develop-ment costs that do not meet the criteria for capitalisation.
sales and distribution expensesSales and distribution expenses com-prise expenses for distribution and sales campaigns relating to goods sold during the year, including expenses for sales personnel, marketing, depreciation and amortisation as well as losses on trade receivables.
administrative expensesAdministrative expenses comprise ex-penses for management and administra-tion of the Group, including expenses for
administrative personnel, management, office supplies, insurance, depreciation and amortisation.
other operating income and other operating expensesOther operating income and other operating expenses comprise income or expenses of a secondary nature compared to the core activities of the Company, including renting of property, plant and equipment, acquisition costs, etc.
special income and expensesSpecial income and expenses comprise material non-recurring income and expenses. These items are presented separately with a view to comparability in the income statement.
income from investments in associates in the consolidated Financial statementsThe proportionate share of the results of associates is recognised in the income statement of the Group after adjusting for impairment losses on goodwill and eliminating the proportionate share of un-realised intercompany gains and losses.
dividend on investments in subsidiaries and associates in the parent company Financial statementsDividend on investments in subsidiaries and associates is recognised in the Parent Company’s income statement in the fi-nancial year in which dividend is declared.
Financial income and expensesFinancial income and financial expenses comprise interest, costs of factoring, capital gains and losses on investments, balances and transactions in foreign cur-rencies, amortisation of financial assets and liabilities, fair value adjustments of derivative financial instruments that do not qualify as hedge accounting as well as extra payments and repayment under the on-account taxation scheme, etc.
taxTax for the year consists of current tax for the year and movements in deferred tax for the year. The tax attributable to the profit for the year is recognised in the income statement, whereas the tax
102 Royal UnibRew annual report 2013

Other notes
Note24–sigNiFiCaNtaCCouNtiNgpoliCies(CoNtiNued)
attributable to equity entries is recognised directly in equity.
The Parent Company is jointly taxed with its Danish subsidiaries. The Danish current tax for the year is allocated to the jointly taxed Danish enterprises in proportion to their taxable incomes (full allocation with credit for tax losses).
balance sheet
intangible assets
goodwillGoodwill is initially recognised in the balance sheet at cost as described under “Business combinations”. Subsequently, goodwill is measured at cost less accumu-lated impairment losses.
The carrying amount of goodwill is al-located to the Group’s cash-generating units at the time of acquisition. The determination of cash-generating units is based on management structure and internal financial management.
trademarks, distribution rights and customer relationsTrademarks, distribution rights and cus-tomer relations are initially recognised in the balance sheet at cost. Subsequently, they are measured at cost less accumu-lated amortisation and less any accu-mulated impairment losses. Trademarks and distribution rights are amortised on a straight-line basis over their estimated useful lives, maximum 20 years. Customer relations are amortised on a straight-line basis over their estimated useful life, maximum 5 years.
Trademarks with indefinite useful lives are, however, not amortised but are tested annually for impairment. It is the Group’s strategy to maintain trademarks and their value.
property, plant and equipmentLand and buildings, plant and machinery and other fixtures and fittings, tools and equipment are measured at cost less accumulated depreciation and less any ac-
cumulated impairment losses. Borrowing costs relating to the acquisition of prop-erty, plant and equipment are expensed.
Depreciation is calculated on a straight-line basis over the following useful lives of the assets, which are unchanged from 2012:
Buildings and installations, 25-40 years Leasehold improvements over the term of the lease, maximum 10 years Plant and machinery, 5-15 years Other fixtures and fittings, tools and equipment, 3-8 yearsReturnable packaging, 3-10 years
Profits and losses on the disposal of prop-erty, plant and equipment are calculated as the difference between the sales sum less the expenses necessary to make the sale and the carrying amount at the time of sale. Profits or losses are recognised in the income statement as an adjustment to depreciation in production costs, sales or distribution expenses or administrative expenses, respectively.
project development propertiesProject development properties are measured at revalued amount based on Management’s updated estimate.
If the carrying amount is increased because it differs materially from fair value, the increase is recognised directly in equity in revaluation reserves. The increase is, however, recognised in the income statement if it offsets an impair-ment previously recognised in the income statement as a result of revaluation of the same property.
If the carrying amount is impaired as a result of revaluation, the impairment is recognised in the income statement. The impairment is, however, recognised directly in equity in revaluation reserves if a reserve has been made for the property in question under revaluation reserves.
Fixed asset investments
investments in associates in the consoli-dated Financial statementsInvestments in associates are measured in the balance sheet at the proportion-ate share of the net asset value of the enterprises calculated under the account-ing policies of the Group with deduction or addition of the proportionate share of unrealised intercompany profits and losses and with addition of the carrying amount of goodwill.
Associates with a negative net asset value are measured at DKK 0. If the Group has a legal or constructive obligation to cover the negative balance of the associate, this obligation is recognised in liabilities.
investments in subsidiaries and associates in the parent company Financial statementsInvestments in subsidiaries and associates are measured at cost and tested in the event of indication of impairment. Where cost exceeds the recoverable amount, the investment is written down to its lower recoverable amount.
other investmentsOther investments not included in the Group’s trading portfolio (available for sale) are recognised in non-current as-sets at cost at the trading date and are subsequently measured at fair value equal to the market price as regards listed securities and at estimated fair value calculated on the basis of market data and recognised valuation methods as regards unlisted securities. Unrealised value adjustments are recognised in other com-prehensive income except for impairment losses and reversal of impairment losses which are recognised in financial income and expenses in the income statement. Upon realisation, the accumulated value adjustment recognised in other compre-hensive income is transferred to financial income and expenses in the income statement. Other investments may be classified as level-3 instruments.
annual report 2013 Royal UnibRew 103

Other notes
Note24–sigNiFiCaNtaCCouNtiNgpoliCies(CoNtiNued)
other receivablesOther receivables under fixed asset investments held to maturity are initially recognised at cost and are subsequently measured at amortised cost or an estimat-ed lower value at the balance sheet date.
current assets
inventoriesInventories are measured at the lower of cost under the FIFO method and net real-isable value of individual product groups. The net realisable value of inventories is calculated at the amount of future sales revenues expected to be generated by inventories at the balance sheet date in the process of normal operations and determined allowing for marketability, ob-solescence and development in expected sales sum with deduction of calculated selling expenses.
The cost of raw materials, consumables, goods for resale and purchased finished goods comprises invoiced price plus expenses directly attributable to the acquisition.
The cost of work in progress and finished goods comprises the cost of materials and direct labour with addition of indirect production costs. Indirect production costs comprise the cost of indirect materials and labour as well as maintenance and depreciation of and impairment losses on the machinery, factory buildings and equipment used in the manufacturing process as well as costs of factory admin-istration and management.
receivablesReceivables are initially measured at cost and are subsequently measured at amor-tised cost or an estimated lower value at the balance sheet date. This lower value is calculated where there is an objective in-dication that an individual receivable or a portfolio of receivables has been impaired.
Receivables with no objective indication of impairment on an individual basis are assessed for objective indication of impairment on a portfolio basis. The port-
folios are primarily based on the debtors’ registered offices and credit rating in ac-cordance with the Group’s policy for credit risk management. The objective indicators used in connection with portfolios are determined based on Management’s as-sessment and knowledge of the individual portfolios.
If there is an objective indication of impairment of a portfolio, an impairment test is made in connection with which the expected future cash flows are estimated based on the historical loss record ad-justed for current market conditions and individual factors relating to the portfolio in question.
Write-downs are calculated as the differ-ence between the carrying amount of the receivable and the present value of the ex-pected cash flows, including the realisable value of any collateral received. The effec-tive interest rate used at the time of initial recognition is used as the discount rate for the individual receivable or portfolio.
prepaymentsPrepayments recognised in assets comprise expenses incurred in respect of subsequent financial years.
equityproposed dividendDividend is recognised as a liability at the time of adoption at the Annual General Meeting. Dividend distribution for the year proposed by Management is dis-closed as a separate equity item.
treasury sharesTreasury shares acquired by the Parent Company or subsidiaries are recognised at cost directly in equity under retained earnings. Where treasury shares are sub-sequently sold, any consideration is also recognised directly in equity. Dividend on treasury shares is recognised directly in equity under retained earnings.
translation reserveThe translation reserve in the Consoli-dated Financial Statements comprises exchange adjustments arising on the
translation of the Financial Statements of foreign enterprises from their functional currencies into the presentation currency of the Group (DKK).
Upon full or part realisation of the net investment in the foreign enterprises, exchange adjustments are recognised in the income statement.
The translation reserve was reset at 1 January 2004 in accordance with IFRS 1.
hedging reserveThe hedging reserve comprises changes to fair values of derivative financial instru-ments that are designated and qualify as cash flow hedges.
On realisation, the hedging instrument is recognised in the income statement in the same item as the hedged transaction.
deferred taxDeferred tax is recognised in respect of all temporary differences between the car-rying amounts and the tax base of assets and liabilities except for temporary dif-ferences arising at the time of acquisition that do not affect the profit for the year or the taxable income and temporary differ-ences concerning goodwill. In cases where the computation of the tax base may be made according to alternative tax rules, deferred tax is measured on the basis of the intended use of the asset or settle-ment of the liability, respectively.
Deferred tax assets are recognised at the value at which they are expected to be realised, either by elimination in tax on future earnings or by set-off against deferred tax liabilities.
Deferred tax is measured on the basis of the tax rules and tax rates expected under the legislation at the balance sheet date to be effective when the deferred tax crystallises as current tax.
In the balance sheet, set-off is made between deferred tax assets and deferred tax liabilities within the same legal tax entity and jurisdiction.
104 Royal UnibRew annual report 2013

Other notes
Note24–sigNiFiCaNtaCCouNtiNgpoliCies(CoNtiNued)
repurchase obligation relating to packaging in circulationPlastic crates, bottles and kegs in circula-tion and held in inventory are recognised in property, plant and equipment, and the obligation to repurchase returnable pack-aging in circulation for which a deposit has been paid is recognised in provisions.
The repurchase obligation relating to packaging in circulation is calculated on the basis of estimated total volumes of packaging less packaging held in inven-tory.
corporation taxCurrent tax liabilities are recognised in the balance sheet as calculated tax on the expected taxable income for the year ad-justed for tax on taxable incomes for pre-vious years and for tax paid on account.
debtsMortgage loans and loans from credit institutions are recognised initially at the proceeds received net of transaction expenses incurred. Subsequently, the financial obligations are measured at am-ortised cost equal to the capitalised value using the effective interest method; the difference between the proceeds and the nominal value is recognised in financial income and expenses in the income state-ment over the loan period.
Other debts, comprising trade payables, payables to subsidiaries and associates, VAT, excise duties, etc as well as other payables, are measured at amortised cost, substantially corresponding to the nominal debt.
cash Flow stateMent
The consolidated cash flow statement is presented under the indirect method based on the net profit for the year. The statement shows cash flows for the year, changes for the year in cash and cash equivalents as well as the Group’s cash and cash equivalents at the beginning and end of the year.
Cash flows from operating activities are calculated as the net profit/loss for the year adjusted for non-cash operating items, changes in working capital, finan-cial income and financial expenses, and corporation tax paid.
Cash flows from investing activities comprise acquisitions and disposals of property, plant and equipment and fixed asset investments as well as dividend received from associates. Cost is measured inclusive of expenses necessary to make the acquisition and sales prices after deduction of transaction expenses.
Cash flows from financing activities com-prise changes to the amount or composi-tion of the Group’s share capital, payment of dividend as well as borrowing and repayment of interest-bearing debt.
Cash and cash equivalents include securi-ties with a maturity of less than 3 months that can readily be turned into cash and are only subject to an insignificant risk of value changes.
segMent reporting
The Group’s business segment is beer and soft drinks sales. Reporting on the busi-ness segment is by geographical mar-
kets. Segment reporting is based on the Group’s returns and risks and its internal financial reporting system.
Items included in net profit for the year, including income from investments in associates and financial income and expenses, are allocated to the extent that the items are directly or indirectly attrib-utable to the markets.
Items allocated both by direct and indirect computation comprise “production costs” and “administrative expenses”, which are allocated by indirect computation based on allocation keys determined on the ba-sis of the market’s drain on key resources. Administrative expenses incurred in the group functions of the Parent Company are partly allocated.
Non-current assets comprise the non-cur-rent assets that are directly or indirectly used in connection with activities in the markets.
Segment liabilities comprise liabilities derived from activities in the market, including provisions, trade payables, VAT, excise duties and other payables.
Financial highlights and ratios
The Group’s key figures and ratios have been calculated in accordance with the “Recommendations and Financial Ratios 2010” issued by the Danish Society of Financial Analysts where comprised by the “Recommendations and Financial Ratios 2010”.
Definitions of financial highlights and ratios are provided on page 107.
annual report 2013 Royal UnibRew 105
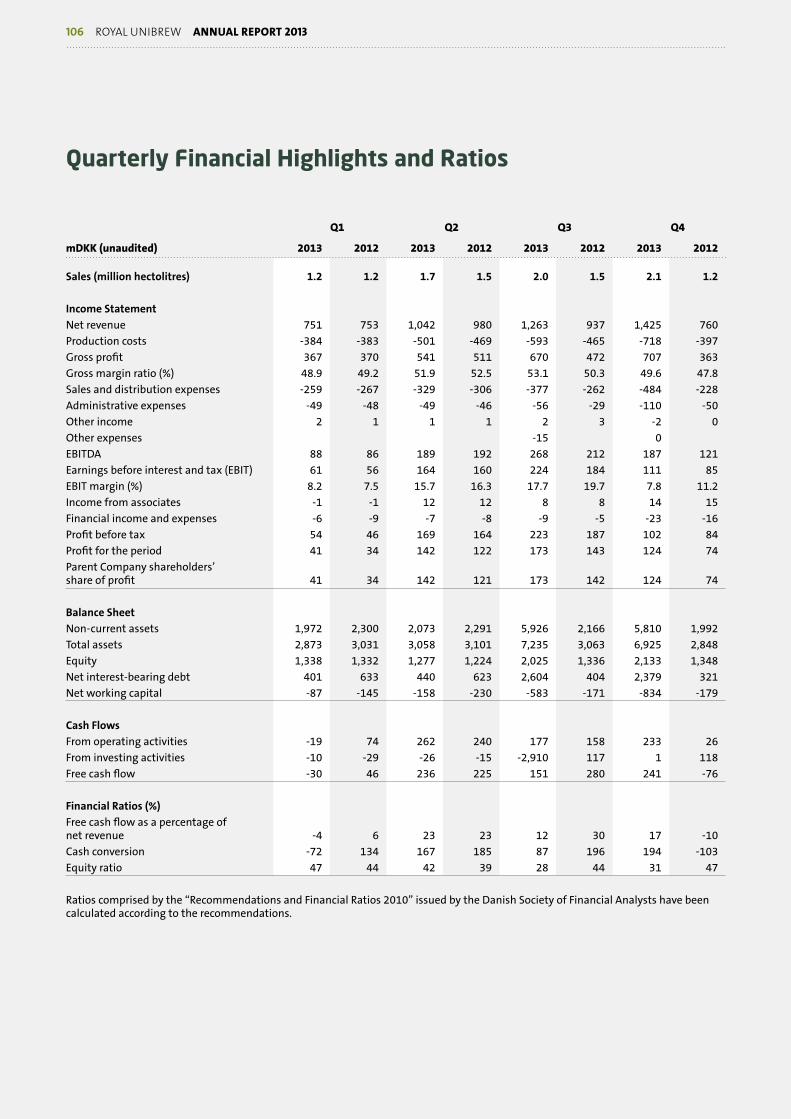
Quarterly Financial Highlights and Ratios
q1 q2 q3 q4
mdkk (unaudited) 2013 2012 2013 2012 2013 2012 2013 2012
sales (million hectolitres) 1.2 1.2 1.7 1.5 2.0 1.5 2.1 1.2
income statementNet revenue 751 753 1,042 980 1,263 937 1,425 760Production costs -384 -383 -501 -469 -593 -465 -718 -397Gross profit 367 370 541 511 670 472 707 363Gross margin ratio (%) 48.9 49.2 51.9 52.5 53.1 50.3 49.6 47.8Sales and distribution expenses -259 -267 -329 -306 -377 -262 -484 -228Administrative expenses -49 -48 -49 -46 -56 -29 -110 -50Other income 2 1 1 1 2 3 -2 0Other expenses -15 0 EBITDA 88 86 189 192 268 212 187 121Earnings before interest and tax (EBIT) 61 56 164 160 224 184 111 85EBIT margin (%) 8.2 7.5 15.7 16.3 17.7 19.7 7.8 11.2Income from associates -1 -1 12 12 8 8 14 15Financial income and expenses -6 -9 -7 -8 -9 -5 -23 -16Profit before tax 54 46 169 164 223 187 102 84Profit for the period 41 34 142 122 173 143 124 74Parent Company shareholders’ share of profit 41 34 142 121 173 142 124 74
Balance sheetNon-current assets 1,972 2,300 2,073 2,291 5,926 2,166 5,810 1,992Total assets 2,873 3,031 3,058 3,101 7,235 3,063 6,925 2,848Equity 1,338 1,332 1,277 1,224 2,025 1,336 2,133 1,348Net interest-bearing debt 401 633 440 623 2,604 404 2,379 321Net working capital -87 -145 -158 -230 -583 -171 -834 -179
Cash FlowsFrom operating activities -19 74 262 240 177 158 233 26From investing activities -10 -29 -26 -15 -2,910 117 1 118Free cash flow -30 46 236 225 151 280 241 -76
Financial Ratios (%)Free cash flow as a percentage of net revenue -4 6 23 23 12 30 17 -10Cash conversion -72 134 167 185 87 196 194 -103Equity ratio 47 44 42 39 28 44 31 47
Ratios comprised by the “Recommendations and Financial Ratios 2010” issued by the Danish Society of Financial Analysts have been calculated according to the recommendations.
106 Royal UnibRew annual report 2013

Definitions of Financial Highlights and Ratios
net interest-bearing debt Mortgage debt and debt to credit institutions less cash at bank and in hand, interest-bearing current investments and receivables.
net working capital Inventories + receivables - current liabilities except for corporation tax receivable/pay-able as well as mortage debt and debt to credit institutions.
Free cash flow Cash flow from operating activities less net investments in property, plant and equip-ment and plus dividends from associates.
dividend per share Proposed dividend per share.
Earnings per share Parent Company shareholders’ share of profit for the year/average number of shares in circulation.
Cash flow per share Cash flow from operating activities/average number of shares in circulation.
diluted earnings and cash flow per share Parent Company shareholders’ share of earnings and cash flow from operating activities/average number of shares in circulation including share options “in-the-money”.
EBitda before special items Earnings before special income and expenses, interest, tax, depreciation, amortisation and impairment losses as well as profit from sale of property, plant and equipment and amortisation of intangible assets.
EBitda Earnings before interest, tax, depreciation, amortisation and impairment losses as well as profit from sale of property, plant and equipment and amortisation of intangible assets.
EBit Earnings before interest and tax.
Return on invested capital after tax Operating profit before special items net of tax as a percentage of average invested including goodwill (ROiC) capital (equity + minority interests + non-current provisions + net interest-bearing debt -
fixed asset investments).
profit margin Operating profit before special items as a percentage of net revenue.
EBit margin EBIT as a percentage of net revenue.
Free cash flow as a percentage of net revenue Free cash flow as a percentage of net revenue.
Cash conversion Free cash flow as a percentage of net profit for the year.
net interest-bearing debt/EBitda The ratio of net interest-bearing debt at year end to EBITDA before special items. before special items
Equity ratio Equity at year end as a percentage of total assets.
Return on equity (ROE) Consolidated profit after tax as a percentage of average equity.
dividend payout ratio (dpR) Dividend calculated for the full share capital as a percentage of the Parent Company shareholders’ share of net profit for the year.
annual report 2013 Royal UnibRew 107

Group Structure
segment ownership currency capital
parent CompanyRoyal Unibrew A/S, Denmark DKK 110,985,000
WEstERn EUROpEsubsidiariesAktieselskabet Cerekem International Ltd., Denmark 100% DKK 1,000,000 Albani Sverige AB, Sweden 100% SEK 305,000 Ceres S.p.A., Italy 100% EUR 206,400 The Curious Company A/S, Denmark 100% DKK 550,000
associatesHansa Borg Holding AS, Norway 25% NOK 54,600,000 Nuuk Imeq A/S, Nuuk, Greenland 32% DKK 38,000,000 Grønlandskonsortiet I/S, Denmark 50% DKK
nORtH East EUROpEsubsidiariesAB Kalnapilio-Tauro Grupe, Lithuania 100% LTL 23,752,553 UAB Vilkmerges Alus, Lithuania 100% LTL 3,570,000 Royal Unibrew Services UAB, Lithuania 100% LTL 150,000 SIA “Cido Grupa”, Latvia 100% LVL 785,074 OÜ Royal Unibrew Eesti, Estonia 100% EUR 1,000,000 Oy Hartwall Ab 100% EUR 13,240,140 Hartwa-Trade Oy Ab 100% EUR 168,188 Helepark Oy 100% EUR 6,761 Lapin Kulta Oy 100% EUR 16,819
MaLt BEvERagEssubsidiariesCentre Nordique d’Alimentation EURL, France 100% EUR 131,000 Supermalt UK Ltd., the UK 100% GBP 9,700,000 Vitamalt (West Africa) Ltd., the UK 100% GBP 10,000 The Danish Brewery Group Inc., USA 100% USD 100,000 Royal Unibrew Caribbean Ltd., Puerto Rico 100% USD 200,000
activity Production, sales and distribution Sales and distribution Holding company Other
108 Royal UnibRew annual report 2013

Royal Unibrew a/sFaxe Alle 1DK-4640 FaxeTel +45 56 77 15 00Fax +45 56 71 47 64
CVR 41 95 67 12Financial year: 1 January – 31 DecemberHead office: Faxe
Homepage: www.royalunibrew.comE-mail: [email protected] de
sign
and
gra
phic
al p
rodu
ctio
n: m
eyer
& b
ukda
hl a
s