annual report - hse...• the business report of the company hse and the hse group for the year 2008...
TRANSCRIPT
ANNUAL REPORT
The endless circle of energy.

3
ANNUAL REPORT
The endless circle of energy.
Jože Zagožen, Ph.D.
Managing Director of HSE
Viljem Pozeb, M.Sc.
Managing Director of HSE
of the company HSE and HSE Group


5
Energy circulates.
Within us and between us.
It remains with us like a fair memory.
Flowing between us like a sincere wish.
Bringing opportunity and carrying away monotony.
Driving us from one goal to the next.
Connecting us like an experience.
It guides our efforts.
Changing with us.
Time and again.
And again.

6

7
AN
NU
AL
RE
PO
RT
HS
E |
MA
NA
GE
ME
NT
’S S
TAT
EM
EN
T
Management’s statement
In accordance with Article 60a of the Companies Act,
the managing directors of the company Holding Slo-
venske elektrarne d.o.o. confi rm that the annual re-
port of the company HSE and the HSE Group for the
year 2008, together with the corporate governance
statement, has been prepared and published in accor-
dance with the Companies Act and Slovene Accoun-
ting Standards.
The managing directors confi rm that the appropriate
accounting policies have been applied consistently in
the preparation of the fi nancial statements and that
the accounting estimates have been prepared based
on the principle of prudence and good management.
The fi nancial statements have been prepared on the
going concern basis.
The managing directors of Holding Slovenske elek-
trarne d.o.o. declare that to their best knowledge:
• the fi nancial report of the company HSE and the HSE
Group for the year 2008 gives a true and fair view of
the assets and liabilities, fi nancial position and fi -
nancial performance of the company HSE and other
consolidated companies as a whole;
• the business report of the company HSE and the
HSE Group for the year 2008 presents fairly the de-
velopment and operating results of the company
and its fi nancial position, including the description
of signifi cant risks.
Viljem Pozeb, M.Sc. Jože Zagožen, Ph.D.
Managing Director of HSE Managing Director of HSE
Ljubljana, 22/05/2009

8
AN
NU
AL
RE
PO
RT
HS
E |
TA
BL
E O
F C
ON
TE
NT
S
1 INTRODUCTION 101.1 OPERATING HIGHLIGHTS OF THE COMPANY AND THE HSE GROUP IN 2008 15
1.2 LETTER FROM THE MANAGEMENT 20
1.3 REPORT OF THE SUPERVISORY BOARD 22
1.4 CHRONOLOGY OF MAJOR EVENTS IN THE HSE GROUP IN 2008 25
2 BUSINESS REPORT 302.1 THE CONTROLLING COMPANY 30
2.1.1 Profi le of the controlling company 30
2.1.2 Organisational structure of the controlling company 32
2.1.3 Management of the controlling company 33
2.1.4 Corporate governance statement 34
2.2 PROFILE OF THE HSE GROUP 36
2.2.1 Management of the HSE Group 41
2.3 BUSINESS POLICY OF THE HSE GROUP 44
2.4 STRATEGIC ORIENTATIONS OF THE HSE GROUP 45
2.5 QUALITY MANAGEMENT SYSTEM POLICY 45
2.5.1 Achieving objectives regarding quality 46
2.5.2 Achieving environment management objectives 46
2.5.3 Achieving occupational health and safety objectives 46
2.5.4 Achieving information security objectives 46
2.5.5 Certifi cates obtained by HSE Group production companies 47
2.6 MARKET POSITION 48
2.6.1 Characteristics of the economic environment in 2008 48
2.6.2 Market environment of the electricity industry 49
2.6.3 Situation on electricity markets in 2008 50
2.7 SALES AND CUSTOMERS 53
2.7.1 Electricity 53
2.7.2 Other activities 54
2.8 PURCHASING AND SUPPLIERS 55
2.8.1 Electricity 55
2.9 INVESTMENTS 58
2.10 INFORMATICS 64
2.11 FINANCIAL OPERATIONS 64
2.11.1 The controlling company’s ratios 70
2.11.2 The HSE Group’s ratios 73
2.12 RISK MANAGEMENT 77
2.13 EXTERNAL COMMUNICATION 81
2.14 RESEARCH AND DEVELOPMENT 81
2.15 PLANS FOR THE FUTURE 83
2.16 IMPORTANT EVENTS AFTER THE END OF THE PERIOD 85
Table of contents00

9
3 SOCIAL RESPONSIBILITY REPORT 883.1 RESPONSIBILITY TO EMPLOYEES 88
3.1.1 Employees in the controlling company 89
3.1.2 Employees in the HSE Group 92
3.2 RESPONSIBILITY TO THE NATURAL ENVIRONMENT 93
3.3 RESPONSIBILITY TO THE BROADER SOCIAL COMMUNITY 94
4 FINANCIAL REPORT OF THE COMPANY HSE 984.1 INTRODUCTORY NOTES 98
4.2 MANAGEMENT’S STATEMENT 104
4.3 AUDITOR’S REPORT 105
4.4 BALANCE SHEET 107
4.5 INCOME STATEMENT 109
4.6 CASH FLOW STATEMENT 110
4.7 STATEMENT OF CHANGES IN EQUITY 111
4.8 NOTES TO THE FINANCIAL STATEMENTS 113
4.8.1 Balance sheet 113
4.8.2 Income statement 128
4.8.3 Cash fl ow statement 131
4.8.4 Statement of changes in equity 132
4.8.5 Other notes 133
5 FINANCIAL REPORT OF THE HSE GROUP 1365.1 INTRODUCTORY NOTES 136
5.2 AUDITOR’S REPORT 145
5.3 CONSOLIDATED BALANCE SHEET 147
5.4 CONSOLIDATED INCOME STATEMENT 149
5.5 CONSOLIDATED CASH FLOW STATEMENT 150
5.6 CONSOLIDATED STATEMENT OF CHANGES IN EQUITY 151
5.7 NOTES TO THE CONSOLIDATED FINANCIAL STATEMENTS 153
5.7.1 Consolidated balance sheet 153
5.7.2 Consolidated income statement 162
5.7.3 Consolidated cash fl ow statement 166
5.7.4 Consolidated statement of changes in equity 166
5.7.5 Other notes 167
6 CONTACT INFORMATION 170
AN
NU
AL
RE
PO
RT
HS
E |
TA
BL
E O
F C
ON
TE
NT
S

10
01 Introduction
is the number of markets in Western, Central and SE Europe that we
were present in at the end of 2008. Operations in international electricity
markets represent our basic activity and as a result we are constantly
expanding our presence there.
Slovenia
18
Germany
France
Switzerland
Italy
Albania
Macedonia
Montenegro
Serbia
Bulgaria
Romania
Hungary
Croatia
B&H
Slovakia
Czech Republic
Austria
AN
NU
AL
RE
PO
RT
HS
E |
IN
TR
OD
UC
TIO
N

11
The HSE Group is the largest Slovene organisation op-
erating in the fi eld of electricity, and the largest elec-
tricity producer and trader in Slovenia’s wholesale
market.
United under a single brand – the HSE Group – hydro
power plants, thermal power plants and a coalmine
together produce a large portion of the electricity in
Slovenia. Through distribution, which consists of a
combination of various resources, HSE plays a key
role in ensuring a secure, reliable and high-quality
supply to domestic customers.
The HSE Group in Slovenia
Controlling company
Subsidiaries
Hydro power plants
Hydro power plants under construction
Thermal power plants
Coalmine
Dravske elektrarne Maribor (DEM)
HSE Invest
PPE KidričevoTermoelektrarna Soštanj (TEŠ)
Premogovnik Velenje (PV)
Termoelektrarna Trbovlje (TET)
Hidroelektrarne na spodnji Savi (HESS)
Holding Slovenske elektrarne
Soške elektrarne Nova Gorica (SENG)
AN
NU
AL
RE
PO
RT
HS
E |
IN
TR
OD
UC
TIO
N

12
HO
LDIN
G SL
OVEN
SKE
ELEK
TRAR
NE
d.o.
o
Div
isio
n 2
Inte
rnat
iona
l net
wor
k
HS
E I
tali
a S
.r.l
.
10
0.0
%
HS
E B
alk
an
En
erg
y d
.o.o
.
10
0.0
%
HS
E H
un
ga
ry K
ft.
10
0.0
%
HS
E A
dri
a d
.o.o
.
10
0.0
%
HS
E B
ulg
ari
a E
OO
D
10
0.0
%
Top
lofi
ka
tsia
- R
use
AD
51
.0%
HS
E P
rag
ue
bra
nch
offi
ce
HS
E B
rati
sla
va
bra
nch
offi
ce
HS
E B
elg
rad
e
rep
rese
nta
tive
offi
ce
HS
E B
uch
are
st
rep
rese
nta
tive
offi
ce
Div
isio
n 3
Inve
stm
ents
HS
E I
nve
st
d.o
.o.
(HS
E,
DE
M,
SE
NG
,
25
.0%
ea
ch
)
Hid
ro M
oćn
ost
Ma
ke
do
nij
a d
.o.o
.
33
.0%
Div
isio
n 4
Mul
ti-U
tility
Ste
lko
m d
.o.o
.
19
.0%
PV
Su
bsid
iari
es
Div
isio
n 1
Prod
uctio
n
Hyd
ro p
rod
ucti
on
Dra
vsk
e e
lek
tra
rne
Ma
rib
or
d.o
.o.
10
0.0
%
So
šk
e e
lek
tra
rne
No
va G
ori
ca
d.o
.o.
10
0.0
%
Hid
roe
letr
arn
e n
a
Sp
od
nji
Sa
vi d
.o.o
.
51
.0%
Th
erm
al
pro
du
cti
on
Te
rmo
ele
ktr
arn
a
Šo
šta
nj
d.o
.o.
10
0.0
%
Te
rmo
ele
ktr
arn
a
Trb
ovl
je d
.o.o
.
81
.3%
PP
E d
.o.o
.,
Kid
riče
vo
45
.0%
Pri
ma
ry s
ou
rce
s
Pre
mo
go
vnik
Ve
len
je d
.d.
77
.7%
Eld
om
d.o
.o.
50
.0%
Elp
rom
d.o
.o.
10
0.0
%
30
.8%
2.8
%
ER
ICo
d.o
.o.
Ro
bin
ok
s d
.o.o
.
21
.0%
Sip
ote
h d
.o.o
.
42
.0%
PL
P d
.o.o
.
26
.0%
PU
P P
V d
.o.o
.
26
.0%
TR
C J
eze
ro d
.o.o
.
16
.7%
Ka
rbo
n d
.o.o
.
11
.0%
HT
Z I
P d
.o.o
.
10
0.0
%
Go
st
d.o
.o.
10
0.0
%
PV
In
vest
d.o
.o.
10
0.0
%
RG
P d
.o.o
.
64
.0%
Ja
ma
Šk
ale
v za
pir
an
ju d
.o.o
.
10
0.0
%
Go
lte
d.o
.o.
SA
ŠA
Ink
ub
ato
r d
.o.o
.
60
.0%
50
.0%
15
.7%
36
.0%
HS
E G
rou
p a
s a
t 3
1/1
2/2
00
8
26
.0%
23
.0%
AN
NU
AL
RE
PO
RT
HS
E |
IN
TR
OD
UC
TIO
N

13
The HSE Group in the markets of Western, Eastern and South-Eastern Europe
* Electricity production and trading by the HSE Group in 2008.
HSE’s companies, branch offi ces and representative
offi ces are located in Slovenia, Croatia, Serbia, Italy,
Hungary, Bulgaria, the Czech Republic, Slovakia, Ro-
mania, and Macedonia. HSE is a member of the Ger-
man energy exchange EEX, Austrian energy exchange
EXAA, French power exchange Powernext, Italian
power exchange IPEX, Czech energy exchange OTE
and in 2008 became a member of the Prague power
exchange PXE and the regional energy exchange
Southpool.
The HSE Group’s other trading markets include:
• Albania,
• Bosnia and Herzegovina,
• Montenegro,
• Switzerland, and
• Kosovo.
SOUTHPOOL *
HSE Prague Branch Offi ce
HSE Bratislava Branch Offi ce
HSE Bucharest Representative Offi ce
HSE Belgrade Representative Offi ce
AN
NU
AL
RE
PO
RT
HS
E |
IN
TR
OD
UC
TIO
N

14
Electricity production and trading by the HSE Group in 2008
THERMAL COAL MINEHYDRO
FOREIGNSALES
3,183
GWh
23 %
of sales
OWN PRODUCTIONSOURCES
2,638
empl. on
avg.
7,771 GWh
1591-1681
MW
57 %
of
sources
OTHER PURCHASES ON THE MARKET
5,941 GWh 43 %
of sources
COMPANY HSE
111
empl. on avg.
13,712
GWh
100 %
owned by RS
DOMESTICSALES
10,529
GWh
77 %
of sales
42 % of sources 58 % of sources
410 employees on average
3,270 GWh produced
765-771 MW of capacity
65 turbines
1,504 employees on average
43,928 TJ produced
724 employees on average
4,501 GWh produced
826-910 MW of capacity
7 units in 2 gas turbines
DEM282
empl.
on avg.
2,565 GWh
576-582
MW
24 turbines
100 %
HSE
TEŠ504
empl.
on avg.
3,850 GWh
658-742
MW
4 units
and 2 gas
turbines
100 %
HSE
PV1,504
empl.
on avg.
43,928
TJ
77.7 %
HSE
SENG128
empl.
on avg.
576 GWh
155 MW
38 turbines
100 %
HSE
TET220
empl.
on avg.
651 GWh
168 MW
3 units
81.3 %
HSE
HESS0
empl.
on avg.
129 GWh
34 MW
3 turbines
84.6 %
HSE
AN
NU
AL
RE
PO
RT
HS
E |
IN
TR
OD
UC
TIO
N

15
The operations of the company and the HSE Group were
successful also in 2008. HSE further pursued the set de-
velopment path of a strong electricity producer and trad-
er in the domestic and wider regional energy market.
In 2008 HSE established its balancing group GEN
energija on the Slovene electricity market. Thus, the
HSE balancing group became smaller, as TEB, SEL
and NEK left it. In addition, other foreign traders en-
tered the Slovene wholesale market, since the legis-
lative amendments no longer required that in order
to trade in Slovenia a company must be founded in
Slovenia. Furthermore, in 2008 HSE had no long-term
allocated capacities for electricity export to Italy and
for electricity import from Austria. These are the main
reasons for HSE recording lower electricity trading
volumes and turnover compared to 2007.
Nevertheless, compared to 2007, the HSE Group gen-
erated:
• 76% higher EBIT in the amount of € 116.7 million,
• 11% higher electricity production,
• 11% lower net operating result (the Group achieved
a 12% higher total operating profi t, but due to tax li-
abilities the net operating result was lower),
• 7% higher assets, which as at 31 December 2008
stood at € 1,748 million,
• 9% higher equity, which as at 31 December 2008
stood at € 1,128 million,
• 16% higher added value, and
• 70% higher cash fl ow from operating activities.
In spite of the good business results in 2008, the HSE
Group is aware that it has only started implement-
ing its ambitious long-term development plans and
that it should continue with its well-started activities.
The year 2009 brings numerous business challenges
for which the HSE Group is prepared. Our priorities
remain responsible operation, provision of funds for
development investments and realisation of invest-
ments, and further streamlining of operations.
HSE Group 2008 2007 IND 08/07
Net sales revenue in € 872,762,328 982,333,321 89
Revenue in € 920,705,280 1,044,723,446 88
EBIT in € 116,771,920 66,499,803 176
EBITDA in € 191,130,415 138,540,433 138
Net profi t or loss in € 74,515,214 84,071,741 89
Assets in € 1,747,710,783 1,628,551,663 107
Equity in € 1,127,608,615 1,037,374,202 109
Cash fl ows from operating activities in € 201,464,315 118,254,485 170
Added value in € 334,139,771 286,961,958 116
Electricity production in GWh 7,771 7,019 111
Electricity sales in GWh 13,705 17,084 80
Number of employees as at 31/12 3,897 4,025 97
Number of group companies as at 31/12 26 24 108
1.1 Operating highlights of the Company and the HSE Group in 2008
AN
NU
AL
RE
PO
RT
HS
E |
IN
TR
OD
UC
TIO
N

16
COMPANY HSE D.O.O. 2008 2007 IND 08/07
Net sales revenue in € 819,264,527 921,176,077 89
Revenue in € 856,652,784 943,961,613 91
EBIT in € 35,126,795 2,482,997 1,415
EBDITA in € 36,585,337 4,719,460 775
Net profi t or loss in € 53,756,215 12,411,197 433
Assets in € 1,158,781,276 1,141,859,460 101
Equity in € 798,817,478 757,166,486 106
Cash fl ows from operating activities in € 53,356,324 30,695,629 174
Added value in € 43,165,180 25,418,714 170
Electricity sales in GWh 13,712 16,894 81
Number of employees as at 31/12 112 109 103
1,000,000
800,000
600,000
400,000
200,000
0
The Group The Company
Total revenue in € thousand
2008 2007
2008 2007
1,000,000
800,000
600,000
400,000
200,000
0
Net sales revenue in € thousand
872,762
982,333
819,265921,176
The Group The Company
AN
NU
AL
RE
PO
RT
HS
E |
IN
TR
OD
UC
TIO
N
920,705
1,044,723
856,653943,962

17
2008 2007
100,000
80,000
60,000
40,000
20,000
0
Net profit or loss in € thousand
120,000
100,000
80,000
60,000
40,000
20,000
0
EBIT in € thousand
2008 2007
116,772
66,500
35,127
2,483
74,51584,072
53,756
12,411
2,000,000
1,500,000
1,000,000
500,000
0
Assets in € thousand
2008 2007
1,628,5521,747,711
1,158,781 1,141,859
The Group The Company
The Group The Company
The Group The Company
AN
NU
AL
RE
PO
RT
HS
E |
IN
TR
OD
UC
TIO
N

18
350,000
300,000
250,000
200,000
150,000
100,000
50,000
0
Added value in € thousand
2008 2007
1,200,000
1,000,000
800,000
600,000
400,000
200,000
0
Equity in € thousand
2008 2007
2008 2007
200,000
150,000
100,000
50,000
0
Cash flows from operating activities in € thousand
1,037,3741,127,609
798,817 757,166
118,254
201,464
53,35630,696
286,962
334,140
43,16525,419
The Group The Company
The Group The Company
The Group The Company
AN
NU
AL
RE
PO
RT
HS
E |
IN
TR
OD
UC
TIO
N

19
5,000
4,000
3,000
2,000
1,000
0
Employees
2008 2007
8,000
7,000
6,000
5,000
4,000
3,000
2,000
1,000
0
Production of HSE Group companies in GWh
2008 2007
The Group
7,0197,771
4,0253,897
112 109
The Group The Company
AN
NU
AL
RE
PO
RT
HS
E |
IN
TR
OD
UC
TIO
N

20
1.2 Letter from the management
Milestones and building blocks of infi nity
The year 2008 was also concluded with an open end:
projects, plans and opportunities, which granted are
not infi nite, but long-term and lasting. Such that they
simply cannot be presented in a single annual report
nor can a line be drawn under them. Everything we
We meaningfully entered the year 2008 with the number eight turned on its
side – the symbol of infi nity, which is in a way connected with us. Namely,
it is connected with electricity, a limited resource, which nevertheless is
permanent, irreplaceable and has a future. In many respects it is infi nite.
started in the past year – and the years before – we are
still bravely continuing today. The growth, develop-
ment and expansion of Holding Slovenske elektrarne,
one of the largest Slovene electricity producers and
traders, are based on successfully set goals and on
capable, motivated employees who can and want to
deliver results. In spite of the stringent operating con-
ditions, the 2008 operating results again exceeded the
set goals and expectations. They are presented fur-
AN
NU
AL
RE
PO
RT
HS
E |
IN
TR
OD
UC
TIO
N
21
ther in this Annual Report. What was it that ultimately
translated into success and how did we achieve the
desired result?
Without a doubt this is hugely owing to HSE’s activi-
ties in international electricity trading, which is our
core activity. Successful trading is further boosted by
a widespread network of companies, representative
offi ces and branch offi ces of HSE abroad, enabling us
to establish important business contacts and fi nd the
paths through which electricity can be transported,
with benefi ts for both parties: the seller and the buyer.
Naturally, we are investing in new production capaci-
ties, which will ensure successful operations in the
long run. Namely, we are aware that having our own
production sources is a key competitive advantage,
and electricity should mainly be produced in-house. In
2008 our investments again focused on modernisation
of our existing thermal energy and hydro energy ca-
pacities and the construction of new energy facilities,
whereby we will upgrade the already good structure
of production sources and ensure that all our sub-
systems are competitive in the long run. Of particular
importance for the HSE Group is further investment in
the priority project involving the construction of Unit
6 at Termoelektrarna Šoštanj, which in the past year
received much of our attention as well.
Of course, along with the above, we foster a positive
attitude toward the wider community that we operate
in. The nature of our activity is to be as environmental-
ly friendly as possible. But not always. Therefore, we
pay a lot of attention to new, "green" and alternative
energy sources, and to the application of new tech-
nologies through specifi c pilot projects. Blue Energy
celebrated its fourth birthday in 2008, servicing more
than 2,000 loyal customers, to whom it matters what
kind of environment we leave behind for future gener-
ations. In addition to production-oriented projects, we
invest in projects whose effect should be observed in
reduced costs of maintenance, operation and environ-
mental care. In 2009 we thus continue investing in the
construction of a hydro power plant on the lower Sava
River, a project whose concession was transferred to
a new company by HSE in 2008, but in which HSE nev-
ertheless remains an important player, and the con-
struction of PSP Avče and Kozjak. There is yet another
great challenge ahead of us: the construction of hydro
power plants on the central Sava River, for which HSE
already won the concession in 2008. We are waiting for
the concession agreement to be signed. With this proj-
ect HSE will continue the construction of production
capacities using renewable energy sources, which is
consistent with the sustainable electricity consump-
tion objective and the National Energy Programme as
well as the requirement to increase the share of elec-
tricity produced from renewable energy sources.
The period which the Slovene electricity production
industry is entering along with the entire Slovene
economy is uncertain. The end of 2008 was marked by
the global fi nancial and economic crisis, which is still
present and will be impossible to completely avoid in
the long run. We already know for certain that the op-
erating strategy of the HSE Group is outlined so that
the crisis and stringent conditions on the global ene-
rgy markets do not jeopardise our long-term goals –
and will not, as long as we act with due diligence in all
operating segments. We are certain that is something
we know how to do, as we have proven numerous times
that our actions are not merely focused on market
penetration, but also on rational business manage-
ment. The combination of the two is what guarantees
our future and within it business success to infi nity.
The infi nity of knowledge, experience, willpower, mo-
tivation and loyalty of all those who contributed to this
year's Annual Report once again portraying our excel-
lence. Strategic, operational and fi nancial.
That is why we want to sincerely thank you, our own-
ers, for helping us fi nd the right paths and methods to
achieve our goals in 2008. And our employees, for the
knowledge and willpower to transform these goals
into fi gures, evolve building blocks into projects and
attach a reputation to the name of HSE. We also thank
our business partners for trusting us and choosing us.
Without any of you, infi nity would be merely a word on
paper, instead of a notion that gains new dimensions
every year. Infi nite dimensions.
Viljem Pozeb, M.Sc. Jože Zagožen, Ph.D.
Managing Director of HSE Managing Director of HSE
Ljubljana, 31/03/2009
AN
NU
AL
RE
PO
RT
HS
E |
IN
TR
OD
UC
TIO
N
22
1.3 Report of the Supervisory Board
In accordance with provisions of Article 282 of the
Companies Act (ZGD-1b), the Supervisory Board of
Holding Slovenske elektrarne d.o.o. hereby informs
the General Meeting of the following:
• the method and extent of the examination of the
company’s operations in the fi nancial year 2008,
• the examination and confi rmation of the annual
report of the company HSE and the HSE Group for
2008,
• the examination of the proposal for the allocation of
accumulated profi t,
• the Supervisory Board’s position on the auditor’s re-
ports.
Until 14/10/2008, the company’s Supervisory Board
was comprised of Alojz Stana, M.Sc. (president), An-
drej Aplenc, M.Sc. (vice-president), France Križanič,
Ph.D., Franc Bogovič, Franc Ervin Janežič and Janez
Požar, all serving as owner’s representatives. The
members Boštjan Jančar, Branko Sevčnikar and
Miran Božič served as employee representatives until
01/10/2008.
On 14/10/2008, the Government of the Republic of Slo-
venia, being the company's founder, relieved France
Križanič, Ph.D. and Franc Bogovič of their posts as
Supervisory Board members, replacing them with Sil-
vester Jeršič and Viktorija Komavec, M.Sc., for the pe-
riod until the end of their predecessors' term of offi ce.
The employee representative Branko Sevčnikar was
replaced by Silvester Medvešček on 01/10/2008.
Until the end of 2008, the Supervisory Board consisted
of the following members:
• owner’s representatives: Alojz Stana, M.Sc. (presi-
dent), Andrej Aplenc, M.Sc. (vice-president), Franc
Ervin Janežič, Janez Požar, Silvester Jeršič, Viktorija
Komavec, M.Sc.;
• employee representatives: Boštjan Jančar, Miran
Božič and Silvester Medvešček.
Until 14/10/2008, the Supervisory Board's audit com-
mittee was comprised of the Supervisory Board mem-
bers Franci Križanič, Ph.D. (president), Alojz Stana,
M.Sc., Andrej Aplenc, M.Sc., and Branko Sevčnikar, as
well as of Alenka Podbevšek, who was appointed to
the audit committee as an independent expert in the
fi eld of accounting and taxes, in accordance with Ar-
ticle 280 of the Companies Act.
Because of the end of Branko Sevčnikar's term of of-
fi ce as a Supervisory Board member, his appointment
to the audit committee also ceased to be effective.
That is why the Supervisory Board appointed Boštjan
Jančar to the audit committee on 14/10/2008. Because
of the end of France Križanič’s, Ph.D. term of offi ce
as a Supervisory Board member, his appointment as
member and president of the audit committee also
ceased to be effective. That is why the Supervisory
Board appointed Franc Ervin Janežič to the audit com-
mittee, nominating him chairman of the committee.
Until the end of 2008, the audit committee had the fol-
lowing members:
• members of the Supervisory Board: Franc Er-
vin Janežič (chairman), Alojz Stana, M.Sc., Andrej
Aplenc, M.Sc., and Boštjan Jančar;
• independent expert in the fi eld of accounting and
taxes in accordance with Article 280 of the Compa-
nies Act: Alenka Podbevšek.
Monitoring and supervision of the company's operationsThe company's Supervisory Board held twenty-fi ve
meetings in 2008, of which thirteen were regular meet-
ings and eleven were correspondence meetings. In
addition to obtaining information about the company’s
operations and discussing legal transactions requiring
its preliminary approval, the Supervisory Board was
also brought up to date in all areas that signifi cantly
affect the company’s long-term interests, the imple-
mentation of its development strategy and socially re-
sponsible improvements to its economic effi ciency.
In accordance with Article 17 of the Articles of Incor-
poration, the company's management needs to seek
a preliminary approval from the Supervisory Board
to enter into any legal transaction exceeding EUR
2,955,000 in value, which also includes electricity trad-
ing transactions. Because these transactions are con-
cluded on a daily basis, a large number of Supervisory
Board meetings were required to enable the company
to operate smoothly. On 22/12/2008, the president of
AN
NU
AL
RE
PO
RT
HS
E |
IN
TR
OD
UC
TIO
N

23
the company’s Supervisory Board addressed to the
Government of the Republic of Slovenia, which is the
legal representative of the Republic of Slovenia, a writ-
ten proposal to amend the company’s Articles of Incor-
poration by excluding electricity trading transactions
and related transactions from the limitations under
Article 17. This amendment would enable the compa-
ny's management to work smoothly and without inter-
ruptions as well as decrease the burden on the Super-
visory Board, which would no longer have to consider
preliminary approvals so frequently. The company's
Supervisory Board and management have sought and
will continue to seek to establish such a comprehen-
sive trading risk management model that would pro-
vide the same quality of control while decreasing the
number of Supervisory Board meetings required. The
Supervisory Board adopted the electricity trading risk
management model at its meeting held on 18/02/2009,
while the amendments to Article 17 of the Articles of
Incorporation were adopted on 04/06/2009.
The meetings of the Supervisory Board were attended
by management members Jože Zagožen, Ph.D. and
Damijan Koletnik, who was replaced by Viljem Pozeb
on 28/06/2008.
Important matters and issues discussed by the compa-
ny’s Supervisory Board in 2008 are presented below:
• the Supervisory Board adopted the business plan of
HSE d.o.o. for 2008;
• it was acquainted with the interim unaudited fi nan-
cial report of the company for the year 2007 and
supported the management’s proposal that half of
the net profi t for 2007 should be allocated to other
revenue reserves;
• it confi rmed the annual report of the company HSE
and the HSE Group for 2007 together with auditor’s
reports;
• it discussed the materials for the company’s General
Meeting and approved the management’s decisions
prepared for the founder;
• it proposed to the founder that the auditing company
Deloitte revizija d.o.o. should be appointed to audit
the fi nancial statements and the annual report of
the company HSE and the HSE Group for the years
2009 and 2010;
• it was informed of the basis for the preparation of
the company’s business plan and of the procedures
for the preparation of the 2009 business plans of
HSE group companies;
• it approved the proposal of the company's manage-
ment to carry out a public call for applications for
the position of the company's managing director and
management member, appointing to this end a four-
member selection committee which monitored the
activities related to the call for applications. Based
on the presentations by all candidates, it appointed
Viljem Pozeb, M.Sc., as the company's managing di-
rector and management member;
• it adopted amendments to the Rules governing the
work of the company's management and the Rules
governing the work of the company's Supervisory
Board, and the consolidated text thereof;
• it discussed periodic reports on the operations of the
company and the group, and was also acquainted
with how the HSE's international network functions;
• it was informed about the projects for the construc-
tion and refurbishment of HSE Group’s production
facilities;
• it discussed and approved the EUR 15,794,000.00
increase in the capital of Termoelektrarna Šoštanj
d.o.o.;
• it was acquainted with and approved the process of
transforming the joint venture for the construction
of HPPs on the lower Sava RIver into the company
Hidroelektrarne na Spodnji Savi d.o.o.;
• in accordance with provisions of the Articles of In-
corporations, it discussed and issued preliminary
approvals for trading and other legal transactions
and for the establishment of new companies and
branch offi ces;
• it was acquainted with the strategy for selling the
energy produced and with the comprehensive trad-
ing risk management model, and also approved the
model;
• it was acquainted with development projects of HSE
Group companies and instructed the management
to complete them;
• it approved the signing of the contract for a EUR
74 million long-term loan from the EIB to fi nance
HPP Blanca and HPP Krško, and issued preliminary
approvals for short-term deposits of surplus cash
made subject to observing the principle of the diver-
sifi cation of deposits with individual banks.
In 2008 the Supervisory Board’s audit committee held
twelve regular meetings and one extraordinary meet-
ing at which it discussed the matters prescribed by
law as well as the following issues and matters for
which it is responsible in accordance with the special
decisions of the Supervisory Board: technical and fi -
nancial information in connection with the projects for
AN
NU
AL
RE
PO
RT
HS
E |
IN
TR
OD
UC
TIO
N

24
the construction and refurbishment of HSE Group's
production facilities, Rules governing the work of the
company’s management, Rules governing the work of
the company’s Supervisory Board, strategy for selling
the energy produced and the comprehensive trading
risk management model.
Owing to the company's strategy to intensify its pres-
ence in the energy market and the changed market
conditions, the work of the Supervisory Board and
audit committee was extensive in 2008. The Super-
visory Board estimates that the reports, information
and analyses prepared by the management were ap-
propriate and accurate, and they were also further
explained by the management, or occasionally by
preparers, at the meetings. The Supervisory Board
thus obtained the necessary insight into all important
areas of operations, enabling it to perform, without
interruptions, its functions of monitoring and con-
trolling the handling of transactions and operations
of the company within the scope of its powers and
competences laid down in the Articles of Incorpora-
tion.
Examination of the annual report and position on the audit reportFrom the independent auditor's report on the 2008
annual report it is evident that the fi nancial state-
ments present fairly, in all material respects, the fi -
nancial position of the company and its fi nancial per-
formance and cash fl ows for the year 2008. Based on
the examination of audit reports, the assessment of
the Supervisory Board’s audit committee and expla-
nations given at the Supervisory Board meeting, the
Supervisory Board of the company HSE raised no ob-
jections to the audit reports. Given the regular moni-
toring of HSE’s operations, unqualifi ed audit opinions,
good operating results of the company HSE and the
HSE Group, and exceeded business plan for 2008, the
Supervisory Board of the company HSE, in line with its
competences and after the fi nal examination, raised
no objections to the annual report of the company HSE
and the HSE Group for the year 2008 and confi rmed
the annual report on 10/06/2009.
At its meeting held on 10/06/2009, the Supervisory
Board was also informed of the convening of the com-
pany’s General Meeting and examined the proposal
for the allocation of accumulated profi t as determined
in the annual accounts.
Determination and proposed allocation of accumulated profi tThe company Holding Slovenske elektrarne d.o.o.
ended the fi nancial year 2008 with a net profi t of EUR
53,756,215.01.
At its 38th regular meeting held on 18/02/2009, the Su-
pervisory Board agreed with the management's pro-
posal that half of the net profi t of EUR 26,878,107.50
should be allocated to other revenue reserves already
during the preparation of the fi nancial statements for
the year 2008.
The remaining net profi t represents the accumu-
lated profi t for the year 2008 and amounts to EUR
26,878,107.51.
Based on the strategic objectives and investment poli-
cy, the Supervisory Board of HSE d.o.o. agrees with the
management's proposal submitted to the founder that
the entire accumulated profi t of EUR 26,878,107.51
should be allocated to other revenue reserves. Fur-
ther on, the Supervisory Board proposes to the Gen-
eral Meeting that a discharge from liability should
be granted to the management and the Supervisory
Board as regards the operations in the year 2008.
The company’s Supervisory Board prepared the report
in accordance with Article 282 of the Companies Act.
The report of the Supervisory Board is intended for the
company’s General Meeting.
Alojz Stana, M.Sc.
President of the Supervisory Board
Holding Slovenske elektrarne d.o.o.
Ljubljana, 10/06/2009
AN
NU
AL
RE
PO
RT
HS
E |
IN
TR
OD
UC
TIO
N

25
1.4 Chronology of major events in the HSE Group in 2008
January• The Supervisory Board of HSE adopted the business
plan of HSE for 2008.
• At HPP Zlatoličje, DEM installed a new driver, around
a 90-tonne component of the new turbine, which was
by means of a special lift lowered to the lower part
of the turbine 2 shaft. This installation is one of the
most demanding and important renovation phases
of this turbine in the largest Slovene HPP.
• After concluding the contract to sell and purchase
SEL’s interest in a joint venture, GEN energija joined
the joint venture for HPP construction on the lower
Sava River.
• TEŠ started combusting wood biomass, which will
contribute to the fulfi lment of the EU requirements re-
lated to greenhouse gas emissions and the produced
primary energy from renewable energy sources.
• DEM and the Austrian company KELAG signed the
Data Exchange Agreement referring to mutual ener-
gy impacts on account of an upgrade of the pumping
unit for pumping water from the Drava River to the
reservoir lake of HPP Golica in the Koroška region
in Austria.
February• The Supervisory Boards/General Meetings of sub-
sidiaries adopted the business plans of DEM, SENG,
TET, PV and HSE Invest for 2008.
• At the end of February, the Minister of the Environ-
ment and Spatial Planning, Janez Podobnik, and his
colleagues inspected the entire construction site next
to the reservoir of HPP Blanca and the dam facility.
• DEM selected the company HSE Invest as the lead
designer and manager of construction investment
engineering at PSP Kozjak and of the transmission
line between the pumped storage plant and DTS
Maribor.
• Articles of Association were signed on the foundation
of Hidroelektrarna na Spodnji Savi d.o.o. (HESS).
• SENG obtained a partial building permit for the con-
struction of the connecting transmission line and
110 kV cable line for PSP Avče.
March• Three contracts were signed with designers on the
production of project and technical documentation
for the NPP Krško reservoir.
• The 11th Strategic Conference of the PV Group took
place.

26
• SENG acquired the building permit for the gravel
barrier on the Soča River above HPP Doblar.
April• On 4 April, DEM started the completely renovated
driver of turbine 2 at HPP Zlatoličje for the fi rst time.
• Thorsten Diercks, Ph.D., Secretary General of the
European Association for Coal and Lignite − Eura-
coal came to the Šalek Valley in early April for a two-
day visit. He visited PV and TEŠ, and learned about
the technological achievements and plans of both
companies.
• DEM was ranked second among the TOP 101 Slo-
vene companies in 2007 based on two indicators:
added value per employee and the operating profi t/
operating revenues ratio.
• After replacing the hydro-mechanical and electrical
equipment, SENG began trial operations at SHPP
Jelenk.
May• The Supervisory Board of HSE approved the Annual
Report of the Company and the HSE Group for 2007.
• The members of the HSE Supervisory Board ap-
pointed Viljem Pozeb, M.Sc., the then Assistant Di-
rector, new director of the company. Together with
Jože Zagožen, Ph.D., he constitutes the HSE man-
agement.
• DEM celebrated the 90th anniversary of HPP Fala.
• TEŠ held a ceremonial opening of the fi rst 42 MW
gas turbine for producing electricity and introduced
natural gas in addition to coal.
• SENG signed a contract on BPP, PT and WEP docu-
mentation for the reconstruction of HPP Doblar 1,
phase II.
• The company TEŠ gained accreditation from the coal
and desulphurisation testing laboratory.
• PV created the Energy Offi ce, tasked with constant care
for rational and optimal use of energy in the PV Group.
• TEŠ adopted the 2008 Business Plan.
June• An annex was signed to the Concession Contract on
utilisation of the energy potential of the lower Sava
River, enabling the transfer of the concession right
to HESS.
• TEŠ signed a contract on the supply of main 600 MW
technological equipment for Unit 6.
• In co-operation with partners from the Pomurje re-
gion, DEM founded the Pomurje Development Insti-
tute (PRI), which is, in addition to expert tasks, also
assigned an important role in bringing the project
for constructing an HPP on the Mura River closer to
the interested public.
• After the reconstruction of HPP Ajba1 and success-
ful initial trial start-up, SENG successfully passed
the technical inspection.
• HSE increased the capital of the subsidiary TEŠ to
€ 15,794,000.
• PV hosted the international workshop "Mine Green-
house Gases CO2 and CH
4 – Safety, Prevention, Man-
agement and Utilisation".
• PV organised events on Miner's Day. At the 48th
"Jump over the skin", 51 novices took on the mining
profession and the honorary jumper was Uroš Rot-
nik, Ph.D., Managing director of TEŠ. Moreover, the
best colleague and working group were announced.
July• The subsidiary HSE Bratislava was established in
Slovakia on 23 July 2008.
• On 1 July 2008, the joint venture was transferred to
the newly founded company HESS.
• The General Meeting of HSE Invest re-appointed the
current members of the Supervisory Board for an-
other 4-year term, as their term of offi ce expired.
August• PV witnessed a record daily progression entailing an
8.5-metre G2/B excavation in the northern branch of
the Preloge pit.
• HESS became a concessionaire on the lower Sava
River.
• As the sole owner of DEM and TEŠ, HSE passed a
resolution of the payment of accumulated profi t in
the amount of € 24 million for DEM and € 2.8 million
for TEŠ.
September• HSE drew a long-term loan from the EIB in the
amount of € 74 million, granted for fi nancing the
investments in HPP Blanca and HPP Krško for the
period of 20 years.
• The company Hidro Moćnost Makedonija d.o.o., in
which HSE holds a 33% stake, was founded in Skopje
on 16 September 2008.
AN
NU
AL
RE
PO
RT
HS
E |
IN
TR
OD
UC
TIO
N

27
• TET organised a celebration on the 40th anniversary
of the 125 MW unit.
• TEŠ successfully synchronised the second 42 MW
gas turbine.
• The HSE Group sees great potential for Slovene min-
ing knowledge to penetrate SE Europe. As a result of
looking for new business opportunities, PV applied
to the international tender for knowledge transfer,
start-up of new production and introduction of new
technology in the Mramor coalmine in the frame-
work of the Kreka coalmine in Tuzla, Bosnia and
Herzegovina. In September, the Mramor coalmine
celebrated the start of trial operations.
October• The Government of the RS acknowledged the Annual
Report of the Company and the HSE Group for 2007
and granted a discharge from liability to the man-
agement and the Supervisory Board of the company
for the 2007 fi nancial year.
• Viktorija Komavec, M.Sc., Silvester Jeršič and Sil-
vester Medvešček became new members of HSE's
Supervisory Board.
• At a ceremony in the scope of the 11th Conference
on Human Resources Management, SENG was
awarded second prize for the best HRM project in
2008, namely the "Project for combining hydro pow-
er plant teams on the Soča River". The prize recog-
nises SENG's innovative practice for connecting the
organisation and training of employees for transition
to new working methods.
November• The General Meeting of TEŠ appointed Jože Zagožen,
Ph.D., new member of the Supervisory Board.
• On 12 November 2008, at 10 a.m., PV for the fi rst time
in the history of Slovenia and, according to data from
the Guinness Book of Records, for the fi rst time in the
world, broadcast live the longest excavation ever, 210
metres. The longest excavation in the history of the
coalmine is important as it will provide the necessary
quantity of competitive coal in the long run, reduce
excavation losses and optimise the technological coal
extraction process as well as offer great streamlin-
ing possibilities for the production process.
December• The Government of the RS passed a decision to bring
the share capital and founding stakes of HSE in line
with the amounts recorded in the Companies Regis-
ter, and adjusted the wording of the company's Ar-
ticles of Association with Companies Register.
• The General Meeting of DEM appointed Viljem Pozeb,
M.Sc., and Ladislav Tomšič, M.Sc., new members of
the Supervisory Board.
• Tomaž Štokelj, Ph.D., and Irena Stare became new
supervisors at SENG.
• In 2008 TEŠ supplied 3,850 GWh of electricity to the
network, thus recording the second highest produc-
tion in the entire history of TEŠ. More electricity was
generated only in 1983, i.e. 4,077 GWh.
• DEM also generated a record amount of electricity in
2008, namely 2,565 GWh, which was 19% more than
planned.
AN
NU
AL
RE
PO
RT
HS
E |
IN
TR
OD
UC
TIO
N

We
teac
h
Knowledge creates opportunities
Op
po
rtu
nit
ies a
re e
nh
an
ce
d t
hro
ug
h e
xp
eri
en
ce
Experience le
ads to w
isdom
Wisdom
needs to be shared


30
AN
NU
AL
RE
PO
RT
HS
E |
BU
SIN
ES
S R
EP
OR
T
02 Business report
is the percentage of the increase in the HSE Group's operating profi t,
which stood at € 117 million at the end of 2008. Growth, development
and expansion of HSE, the leading Slovene electricity producer and
trader, rely on ambitious goals and competent, motivated employees
who aim to achieve them.
2.1 The controlling company
2.1.1 Profi le of the controlling company
The Government of the Republic of Slovenia adopted
the Articles of Incorporation of the limited liability
company Holding Slovenske elektrarne d.o.o., which
100% owned by the Republic of Slovenia, at its 38th
meeting held on 26 June 2001.
The holding company was established to ensure a uni-
form market appearance of its companies in the area
of electricity sales, to improve the competitiveness of
Slovene production companies, and carry out the proj-
ect for the construction of hydropower plants on the
lower Sava River.
76

31
COMPANY PROFILE OF HOLDING SLOVENSKE ELEKTRARNE D.O.O.
Full company name Holding Slovenske elektrarne d.o.o.
Abbreviated name HSE d.o.o.
Legal form limited liability company
Address Koprska ulica 92,1000 Ljubljana, Slovenija
Telephone 01 470 41 00
Fax 01 470 41 01
Entry No. 1/35036/00, registered with the District Court in Ljubljana
Nominal capital 29,558,789.00 €
Size large company
Ownership structure 100%, Republic of Slovenia
Year of establishment 2001
Transaction accounts NKBM: SI56 0430 2000 0317 271
UNICREDIT BANKA: SI56 2900 0005 5093 917
HYPO ALPE ADRIA: SI56 3300 0000 2191 609
NLB: SI56 0292 4025 4805 996
SKB: SI56 0316 0100 0590 766
Tax number 99666189
VAT ID number SI99666189
Registration number 1662970
Main activity 35.140 Electricity trading
Website www.hse.si
E-mail [email protected]; [email protected]
The company's management Jože Zagožen, Ph.D., Viljem Pozeb, M.Sc.
President of the Supervisory Board Alojz Stana, M.Sc.
AN
NU
AL
RE
PO
RT
HS
E |
BU
SIN
ES
S R
EP
OR
T

32
2.1.2 Organisational structure of the controlling company
HSE d.o.o. is the controlling company of the HSE
Group. It is based in Ljubljana and has business es-
tablishments in Maribor, Velenje and Nova Gorica. Its
business functions are divided depending on where
various advantages can best be used. The manage-
ment, sales and marketing division, research and de-
velopment division, general division, and the depart-
ments of internal audit, communications, legal affairs,
controlling, fi nance and accounting are located in Lju-
bljana. The production control, investment manage-
ment and telecommunications centre is in Maribor.
The business establishment in Velenje is responsible
for the domestic market, trade relations between
group companies, monitoring and calculation of de-
viations, long-term planning and electricity accounts.
The establishment in Nova Gorica is responsible for
foreign markets.
MANAGEMENT
Business secretary
Communications
department
Internal audit department
Legal department
Contolling department
Finance department
Accounting department
Quality and environment
manager
Sales and marketing division
Productiondivision
Research and development division
Generaldivision
Market analyses
department
Trading
department
Accounts
departments
Operations
department
Electrical engineering
department
Maintenance
department
Development
department
Research department
International relations
department
Project management
and evaluation
department
Human resources
department
IT department
Purchasing department
Investment monitoring
department
AN
NU
AL
RE
PO
RT
HS
E |
BU
SIN
ES
S R
EP
OR
T

33
2.1.3 Management of the controlling company
As the sole owner, the Republic of Slovenia manages
the controlling company both directly and through the
Supervisory Board and the management.
Governing bodies of the controlling company as at 31/12/2008
GENERAL MEETING SUPERVISORY BOARD AUDIT COMMITTEE MANAGEMENT
GENERAL MEETING SUPERVISORY BOARD AUDIT COMMITTEE MANAGEMENT
To ensure even greater transparency of operations of
the company HSE and the HSE Group, the company’s
Supervisory Board appointed at its 5th regular meet-
ing of 9 June 2006 an audit committee which was
charged with the following tasks:
• to review periodic reports and prepare opinions,
• to review the annual report of the company HSE and
the HSE Group and prepare opinions,
• to cooperate with auditors during the audit of the
fi nancial statements and annual reports of the com-
pany HSE and the HSE Group,
• to carry out other tasks proposed by the Supervisory
Board.
Governing bodies of the controlling company as at 01/01/2008
Company members
Republic of Slovenia
(100% stake)
Company membersRepublic of Slovenia
(100% stake)
Owner's representatives
Alojz Stana, M.Sc.
(president)
Andrej Aplenc, M.Sc.
(vice-president)
France Križanič, Ph.D.
Franci Bogovič
Franc Ervin Janežič
Janez Požar
Employee representatives
Branko Sevčnikar
Miran Božič
Boštjan Jančar
Owner's representatives
Alojz Stana, M.Sc.
(president)
Andrej Aplenc, M.Sc.
(vice-president)
Silvester Jeršič
Viktorija Komavec, M.Sc.
Franc Ervin Janežič
Janez Požar
Employee representatives
Silvester Medvešček
Miran Božič
Boštjan Jančar
France Križanič, Ph.D.
(chairman)
Alojz Stana, M.Sc.
Andrej Aplenc, M.Sc.
Branko Sevčnikar
Alenka Podbevšek
(external member)
Franc Ervin Janežič
(chairman)
Alojz Stana, M.Sc.
Andrej Aplenc, M.Sc.
Boštjan Jančar
Alenka Podbevšek
(external member)
Jože Zagožen, Ph.D.
Damijan Koletnik
(until 27/06/2008)
Jože Zagožen, Ph.D.
Viljem Pozeb, M.Sc.
AN
NU
AL
RE
PO
RT
HS
E |
BU
SIN
ES
S R
EP
OR
T

34
2.1.4 Corporate governance statement
The managing directors of the company HSE declare
that the company has been managed in accordance
with applicable legal standards and the Articles of
Incorporation of the limited liability company Hold-
ing Slovenske elektrarne d.o.o., which were adopted
by the Republic of Slovenia as the founder and sole
member of Holding Slovenske elektrarne d.o.o., as
well as in conformity with good business practice.
As laid down in the Articles of Incorporation, the com-
pany is managed directly through the founder and
company bodies, i.e. the Supervisory Board and the
management.
The founder independently decides on the following
matters:
• changes and amendments to the Articles of Incor-
poration,
• adoption of business policy bases and development
plan of the company,
• adoption of the annual report when the Supervisory
Board has not confi rmed it and when the manage-
ment and the Supervisory Board leave the decision
on the adoption of the annual report to the founder,
• allocation of accumulated profi t,
• granting a discharge from liability to the manage-
ment and the Supervisory Board,
• division and termination of ownership interests,
• changes in the nominal capital of the company,
• status changes and dissolution of the company,
• election and dismissal of members of the company’s
Supervisory Board,
• appointment of auditors,
• appointment of procurators and other authorised
persons,
• other matters in accordance with regulations and
the Articles of Incorporation.
Pursuant to Article 526 of the Companies Act, the
founder enters its decisions in the register of deci-
sions.
The Supervisory Board consists of nine members,
of which six members represent the interests of the
owner and are appointed and removed by the owner,
while three members represent the interests of em-
ployees and are appointed under the Worker Partici-
pation in Management Act. Supervisory Board mem-
bers are appointed for a term of four years and can be
re-appointed when their term of offi ce expires. Under
AN
NU
AL
RE
PO
RT
HS
E |
BU
SIN
ES
S R
EP
OR
T

35
the Articles of Incorporation, the Supervisory Board
has the following powers:
• it supervises the management of the company,
• it examines the structure of the annual report and the
proposal for the allocation of accumulated profi t,
• it prepares a report on the results of the examina-
tion of the annual report for the founder,
• it confi rms the annual report or makes comments
thereon,
• it gives an opinion on the business policy bases and
development plan of the company,
• it approves the business plan of the company,
• it proposes to the founder the decisions falling with-
in its area of competence or gives opinions on the
proposals made by the management in connection
with the decisions to be accepted by the founder,
• it appoints or removes the management,
• it concludes employment contracts with the man-
agement,
• it authorises the management to take decisions at
the general meetings of subsidiaries when there are
changes in the status or equity structure,
• it adopts the Rules governing the work of the Super-
visory Board,
• it may request reports on other matters,
• it issues preliminary approvals for legal transac-
tions such as acquiring, disposing of and pledging
the shares and interests in subsidiaries, estab-
lishing or winding up other companies, branch of-
fi ces and plants, acquiring, exchanging or pledging
the property owned by the company, and any legal
transactions exceeding 10% of the company’s nomi-
nal capital other than electricity trading transac-
tions executed via trading portals and commodity
exchanges.
The Supervisory Board may also carry out other tasks
laid down in regulations, the company’s governing
documents and the founder’s decisions.
The Supervisory Board appointed an audit committee
to ensure even greater transparency of the company’s
and the Group’s operations.
The company is run and represented by the manage-
ment, which is comprised of two members – manag-
ing directors. Managing directors are appointed by
the Supervisory Board. After the expiry of their term
of offi ce, managing directors can be re-appointed. In
accordance with provisions of the Articles of Incor-
poration, the management represents and runs the
company on its own responsibility in line with the
goals, strategy and guidelines. The division of re-
sponsibilities for individual business fi elds between
management members, the management’s activities,
competences and work and decision-making methods
are determined in accordance with the rules govern-
ing the work of the management as adopted by the
Supervisory Board.
As regards the fi nancial reporting procedure, the com-
pany's internal control and risk management system
focuses in particular on the following:
• identifi cation of important business events which di-
rectly and signifi cantly affect the fi nancial reporting
process;
• accounting categories, individual accounts and re-
lated processes;
• updating of records concerned with the performance
of business processes;
• evaluation of results and elimination of weaknesses
in the planned and existing internal controls.
The company Holding Slovenske elektrarne d.o.o. fol-
lows no particular code in its operation.
Viljem Pozeb, M.Sc. Jože Zagožen, Ph.D.
Managing Director of HSE Managing Director of HSE
Ljubljana, 31/03/2009
AN
NU
AL
RE
PO
RT
HS
E |
BU
SIN
ES
S R
EP
OR
T

36
2.2 Profi le of the
HSE GroupThe uniform market appearance of HSE Group compa-
nies provides improved competitiveness in the market,
optimum use of production capacities given the exist-
ing market conditions, mitigation of negative fi nancial
effects of production shortfalls, more comprehensive
supply of all types of electricity, fewer risks when en-
tering into long-term contracts and better chances for
penetrating foreign markets. Since its establishment,
HSE has been a driving force in the development of the
Slovene electricity industry, and through its constant
growth and expansion to European markets it has
been on a par with the largest and the best competi-
tors in the industry.
Main activity of the GroupThe HSE Group is primarily engaged in the manage-
ment of energy and the environment, and in the con-
trolling of related processes and risks. This broad
range of its activities can be grouped into the following
main categories:
• production of electricity and heat,
• lignite extraction,
• electricity and heat sales and trading, electricity for-
ward contracts, CO2 emission coupons, RECS certifi -
cates and gas,
• optimisation of HSE Group’s production,
• provision of ancillary services necessary for the op-
eration of the electricity system,
• management and implementation of energy and en-
vironmental projects.
The Group’s main activity is the production of electric-
ity and electricity trading, which is why the HSE Group
seeks to take advantage of the synergies associated
with the wide spectrum of production capacities to
maximise its operating effi ciency. Because differ-
ent production units have different operational and
cost characteristics, a more cost-effective electricity
supply can be achieved through an appropriate com-
bination of production units. And because electricity
market prices fl uctuate over time, the planning and
optimisation of production units, while observing the
technical criteria and conditions in the electricity
market, is all the more important.
HSE GroupIn 2008 the HSE Group was comprised of the following
companies:
• Holding Slovenske elektrarne d.o.o. as the control-
ling company,
• Dravske elektrarne Maribor d.o.o. with a subsidiary,
• Soške elektrarne Nova Gorica d.o.o. with a subsidiary,
• Hidroelektrarne na Spodnji Savi, d.o.o.,
• Termoelektrarna Šoštanj d.o.o. with an associate,
• Termoelektrarna Trbovlje d.o.o.,
• Premogovnik Velenje d.d. with fi ve subsidiaries and
fi ve associates,
• Plinsko parna elektrarna d.o.o. Kidričevo as an as-
sociate,
• HSE Invest d.o.o.,
• HSE Italia S.r.l.,
• HSE Balkan Energy d.o.o.,
• HSE Hungary Kft,
• HSE Adria d.o.o.,
• HSE Bulgaria EOOD,
• Toplofi katsia-Ruse AD,
• Hidro Moćnost Makedonija d.o.o. as an associate,
• HSE Prague branch offi ce,
• HSE Bratislava branch offi ce,
• HSE Belgrade representative offi ce,
• HSE Bucharest representative offi ce.
A more detailed organisational chart of the HSE Group
is provided in the introduction.
was the number of HSE Group companies at the end of 2008. The HSE
Group seeks to further maintain its leading role in the domestic market
and take on a more prominent role in the markets of SE Europe. In light
of these objectives, we constantly expand our network of group companies.
26
AN
NU
AL
RE
PO
RT
HS
E |
BU
SIN
ES
S R
EP
OR
T

37
Companies excluded from the consolidated fi nancial statementsThe HSE Group subsidiaries Elprom d.o.o., Golte
d.o.o., Jama Škale v zapiranju d.o.o. and SAŠA Inkuba-
tor d.o.o. are dormant companies and have not been
consolidated either at the level of their controlling
companies or at the Group level due to their imma-
teriality. These companies are not material for a true
and fair presentation of the Group’s operations.
In 2007 the controlling company purchased a 100%
stake in the Bulgarian company Toplofi katsia-Ruse
AD, selling 49% of it in the same year. The company
still holds 51% of voting rights for the remaining 51%
stake, but because a higher majority is required in
order for general meeting decisions to be valid, the
company cannot make strategic decisions without the
approval of the other owner. The same decision-mak-
ing conditions also apply to the other owner. The con-
trolling company has already reached an agreement
with the other partner to transfer its 51% stake by the
end of 2010, meaning that the controlling company no
longer has a right to receive its share of profi t. Due to
the above facts, the company Toplofi katsia-Ruse AD
has not been included in the consolidated fi nancial
statements. Also, the equity method was not used in
connection with the above company in the consolidat-
ed fi nancial statements for the same reason.
Although the company DEM has a 50% interest in the
company Eldom d.o.o., the controlling company did
not consolidate Eldom due to its material insignifi -
cance and the lack of a controlling infl uence on its op-
erations. In 2008 DEM established a private institution
called Pomurje Development Institute Murska Sobota.
This institution is not considered a company, and be-
cause it is not signifi cant from the perspective of the
HSE Group, it is not consolidated either at the level of
the controlling company or at the Group level.
Hydro productionDravske elektrarne Maribor d.o.o. (DEM) 100.0 %
The company DEM is the largest Slovene producer of
electricity from renewable sources and a centre for
operational control of the HSE Group’s overall elec-
tricity production. Its average annual output amounts
to 25% of total electricity produced in Slovenia.
With eight hydropower plants on the Drava River and
two small hydropower plants, the company produces
as much as 80% of Slovenia’s electricity, which satis-
fi es the criteria set out for renewable energy sources
and the standards of the internationally recognised
RECS certifi cate. High-quality hydrology is ensured in
an environmentally friendly way and in line with the
principles of sustainable development.
Eldom d.o.o. is a subsidiary of DEM. The company’s
main activity is property management, organisation
of meals in restaurants and management of holiday
facilities for Slovenia’s electricity industry.
Soške elektrarne Nova Gorica d.o.o. (SENG) 100.0 %
The company SENG ensures that the water potential
of the Soča River, its tributaries and other renewable
sources are optimally exploited while considering the
environmental conditions and demands of users in the
area. At the level of the HSE Group, the control cen-
tre in Nova Gorica is responsible for ensuring optimal
and high-quality production at all power plants on the
Soča River.
Elprom d.o.o. is a subsidiary of SENG. It was estab-
lished for the purpose of trading in electricity. This is
a dormant company.
Hidroelektrarne na Spodnji Savi, d.o.o. (HESS) 51.0 %
In 2003 the companies HSE, DEM, SEL, SENG and TEB
signed a joint venture agreement for the construc-
tion of HPPs on the lower Sava River. The joint ven-
ture operated successfully within the HSE Group. The
fi rst hydropower plant, HPP Boštanj, was constructed
within the deadline, and the construction of HPP Blan-
ca and HPP Krško began as planned. To improve the
transparency of investments, the venturers decided to
transform the joint venture into a separate legal entity
whose priority would still be the construction of the
remaining HPPs on the lower Sava River. In December
2007, the venturers (HSE, DEM, GEN energija (which
AN
NU
AL
RE
PO
RT
HS
E |
BU
SIN
ES
S R
EP
OR
T

38
joined the joint venture on 1 January 2008 to replace
SEL), SENG and TEB) signed a letter of intent to es-
tablish the company Hidroelektrarne na Spodnji Savi
(HESS) and transfer the joint venture to the new com-
pany. HESS was entered into the Companies Register
on 1 April 2008. Because the venturers set 31/12/2007
as the cut-off date, all economic effects of the joint ven-
ture's operations have been attributed to the company
HESS since 1 January 2008. The transfer of the joint
venture's in-kind contribution (previous investments in
the joint venture) to the company HESS was carried out
on 1 July 2008 in the form of a capital increase.
The company members are as follows: STAKEHolding Slovenske elektrarne d.o.o. 51.0 %
Dravske elektrarne Maribor d.o.o. 30.8 %
Soške elektrarne Nova Gorica d.o.o. 2.8 %
Termoelektrarna Brestanica d.o.o. 2.8 %
GEN energija, d.o.o. 12.6 %
Thermal productionTermoelektrarna Šoštanj d.o.o. (TEŠ) 100.0 %
TEŠ is the largest production facility in the HSE Group.
It produces approximately a third of energy in the
country, and in critical periods it can meet more than
half of the national demand. Besides electricity, it also
produces heat which is then supplied to the major
part of the Šalek Valley. The power plant, which uses
lignite from the nearby Velenje coal mine as the basic
fuel, has four production units and two gas turbines.
In terms of its output, the operation of TEŠ is compa-
rable to similar thermal power plants in Europe, but it
exceeds their operating unit availability.
Termoelektrarna Trbovlje d.o.o. (TET) 81.3 %
TET is one of the two power plants in Slovenia which
produce electricity from domestic coal. It has a long
tradition and experience, with the fi rst kilowatt hours
of electricity produced there dating back to 1906. TET
is the largest energy production plant in the Zasavje
region. The thermal power plant has three production
units: a steam turbine unit, which uses brown coal from
Zasavje coal mines as fuel, and two gas turbine units,
which use extra light heating oil and serve as a backup
for the Slovene energy system.
Plinsko parna elektrarna d.o.o. Kidričevo (PPE) 45.0 %The companies HSE, Verbund and Talum established
PPE to construct an 800 MW gas and steam power
plant in Kidričevo. The project is currently in the pre-
investment stage. The power plant is to be fi tted with
the latest technology that would ensure low NOx emis-
sions. Because natural gas will be used as fuel, the
plant would also emit low CO2 emissions, which is in
conformity with international criteria for environment
friendly operation required by the Kyoto protocol.
Primary sourcesPremogovnik Velenje d.d. (PV) 77.7 %
PV is a technologically advanced coal mine which ranks
among the top mines in Europe as far as equipment and
safety are concerned. Its particularity – the “Velenje
long wall method” – is known all over the world. Owing
to its productivity, this method is the most effi cient for
extraction of thick coal layers, but it also enables fi lling
and consolidation of the extraction area.
The quantity of the coal extracted by PV depends on
the plans of the Slovene electricity sector. Annually,
it amounts to approximately 4 million tons of lignite
on average, and the entire quantity is intended for the
needs of TEŠ. In addition to coal extraction, PV pur-
sues numerous other activities, such as underground
and aboveground extraction planning for mining,
machinery and electricity purposes, construction of
all types of underground structures, drilling, geome-
chanical research, cave surveying, hydrogeological
and technological services. Modern equipment and
high technical expertise of staff ensure the safety of
employees and high productivity, which serves as a
basis for a competitive price of coal and, consequently,
AN
NU
AL
RE
PO
RT
HS
E |
BU
SIN
ES
S R
EP
OR
T

39
for competitively priced TEŠ electricity and competi-
tiveness of the entire HSE Group.
Subsidiaries and associates of PVHTZ I.P. d.o.o. is the largest disability company in Slo-
venia. It is engaged in the production, servicing and
maintenance of products, equipment and installa-
tions. It is particularly distinguished by its rich experi-
ence and expertise in the maintenance and servicing
of various coal mining devices. The company plays an
important role in the training and employment of dis-
abled persons.
PLP d.o.o. supplies the coal mine with timber prod-
ucts. To ensure maximum safety, the products sup-
plied have to meet the highest quality standards.
PUP PV d.o.o. is engaged in cleaning and landscaping.
Karbon d.o.o. Karbon, čiste tehnologije d.o.o., was
founded in 2002 and is engaged in the carbonisation
of lignite, production of coal briquettes and active
charcoal. The company is also establishing itself as a
centre for clean coal technologies.
Jama Škale v zapiranju d.o.o. was established for the
purpose of closing down the Škale pit.
PV Invest d.o.o. The company is engaged in two major
lines of business: investment and property business,
and construction engineering business. The invest-
ment and property business comprises leasing and
selling of apartments, business premises and garag-
es, and the facilitation and co-funding of implemen-
tation of business ideas and enterprise development
with surplus cash fl ows from property sales and leas-
ing. The construction engineering business consists
of extraction area development, investment engineer-
ing, cave surveying and geodesy.
RGP d.o.o. is engaged in the construction of head-
race tunnels, shafts, underground garages and un-
derground excavation as well as in the structural and
static reinforcement of high-rise buildings, specialist
mining-related construction, project engineering and
rendering of geometric and geomechanical services.
Gost d.o.o. was initially engaged only in the restaurant
business and catering but has gradually expanded its
activities to the area of tourism.
Sipoteh d.o.o. is engaged in the machinery and produc-
tion equipment business and in the production of metal
structures and their components.
TRC Jezero d.o.o. aims to establish recognisable tour-
ist and recreational facilities within the thermal water
park in the area of the recreational centre that is being
established on the degraded land of the Šalek Valley.
Robinoks d.o.o. is engaged in the production of stain-
less steel products.
ERICo d.o.o. The company’s main activity is the per-
formance of environment management services
required under the Environment Protection Act, Na-
tional Environmental Action Programme, legislation
concerning water, air, soil, waste, etc. Its services also
include laboratory analysis and services, monitoring,
various types of environmental research, environment
protection programmes, restoration programmes,
environmental and occupational training, services re-
lated to environmental issues and problems, sustain-
able development, and other services.
Golte d.o.o. The company Golte d.o.o., a winter and
summer resort, was established in 2003. Its main
activity comprises ski resort services. The company
consists of four divisions: the technical division, which
is responsible for the operation and maintenance of
cable car facilities, the hotel as an accommodation fa-
cility, the restaurant and the tourist agency.
SAŠA Inkubator d.o.o. SAŠA inkubator, d.o.o. is a
business incubator based in Velenje and operating in
the Savinja and Šalek region (SAŠA). It is aimed at fa-
cilitating the establishment of new and accelerating
the development of existing innovative businesses.
By providing excellent services, the incubator aims
to support individuals with good business ideas and
enable them to develop their business faster and in a
more successful way.
International networkHSE Italia S.r.l. 100.0 %The subsidiary company HSE Italia provides support to
electricity trading activities in the Italian market and
acts as a link between HSE and its partners to facilitate
potential investments in Italy. Before Slovenia’s entry
AN
NU
AL
RE
PO
RT
HS
E |
BU
SIN
ES
S R
EP
OR
T

40
into the EU, the company served as a basis for the es-
tablishment of balancing groups in the EU.
HSE Balkan Energy d.o.o. 100.0 %The company HSE Balkan Energy, which is based in
Belgrade, was established as result of HSE’s expan-
sion to SE Europe. Serbia plays an important geo-
graphical and energy role in its region. It also has a
developed electricity system and important resources
such as water, coal and geothermal energy. The com-
pany trades in electricity and assists the HSE Group in
its expansion to SE Europe.
HSE Hungary Kft. 100.0 %The company HSE Hungary helps establish links with
the markets of central and eastern Europe, mainly
with Poland, the Czech Republic and Slovakia. It is en-
gaged in electricity trading.
HSE Adria d.o.o. 100.0 %HSE Adria, which is based in Zagreb, is engaged in cross-
border electricity trade, entering into electricity sales
and purchase contracts, and technical consulting.
HSE Bulgaria EOOD 100.0 %The subsidiary HSE Bulgaria was established to trade
in electricity produced by the company Toplofi katsia-
Ruse AD and to expand business operations to the
markets of Greece, Macedonia and Romania.
Toplofi katsia-Ruse AD 51.0 %By acquiring the company Toplofi katsia-Ruse AD, HSE
increased the assortment of its production sources by
400 MW. Having its own production source in Bulgaria
facilitates a quicker expansion of electricity trading
volume in this part of the region and the transmission
of electricity to Slovenia. Toplofi katsia-Ruse produces
electricity, industrial steam and heat.
HSE Prague branch offi ceThe Prague branch offi ce is engaged in the purchase of
electricity from qualifi ed producers, sale of electricity
to authorised consumers and other electricity traders
in an organised Czech market of which it is a member.
It also makes it possible to participate in auctions for
the allocation of cross-border transfer capacities.
HSE Bratislava branch offi ceThe Slovak branch offi ce was established to participate
in auctions for the allocation of cross-border transfer
capacities on the Slovak and Hungarian border.
HSE Belgrade representative offi ceHSE's own representative offi ce in Belgrade is one of
the bases for the expansion of activities to the markets
of former Yugoslavia and the wider area of SE Europe.
HSE Bucharest representative offi ceAfter Bulgaria joined the EU and two reactors at NPP
Kozloduy were closed, Romania became the main
electricity exporter in the region. Romania also has
the largest power exchange in SE Europe and a lib-
eralised market. For these reasons, HSE decided to
open a representative offi ce in Bucharest and obtain
an electricity trading licence.
InvestmentsHSE Invest d.o.o. HSE, DEM, SENG each 25.0 %The company’s most important activity is the manage-
ment of development projects in pre-investment stag-
es, construction of new and refurbishment of existing
power plants. The company plays an important role
in the construction of the chain of hydropower plants
on the lower Sava River, the construction of PSP Avče,
refurbishment of HPP Zlatoličje and in other major
projects of the HSE Group.
Hidro Moćnost Makedonija d.o.o. 33.3 %The company was established in 2008 by a consortium
of RWE Power from Germany and HSE, which jointly re-
sponded to the Macedonian government's call for ten-
ders to construct HPP Čebren and HPP Galište on the
Crna River in Macedonia. The call requires the selected
tenderer to establish a company together with ELEM,
the Macedonian electricity producer, to construct the
above HPPs. In November 2008, the Macedonian gov-
ernment decided to cancel the call for tenders without
any explanation. In December 2008, a prequalifi cation
call for tenders was again published, but it did not dif-
fer from the call published in June 2006.
Multi-utilityStelkom d.o.o. 19.0 %Stelkom is a provider of telecommunication and con-
nection services, and offers its services using the tele-
communication infrastructure of companies from the
electricity industry. The infrastructure is based on a
widely distributed optical network of more than 2,500
km in total length.
AN
NU
AL
RE
PO
RT
HS
E |
BU
SIN
ES
S R
EP
OR
T
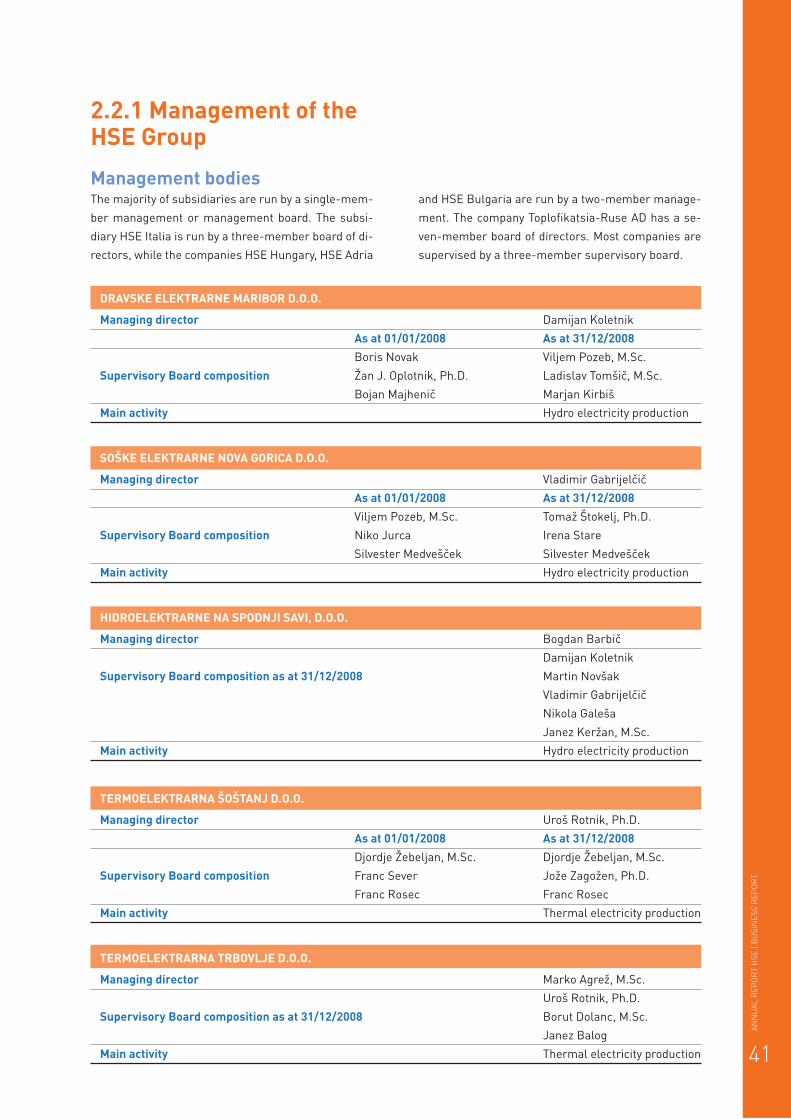
41
2.2.1 Management of the HSE Group
Management bodiesThe majority of subsidiaries are run by a single-mem-
ber management or management board. The subsi-
diary HSE Italia is run by a three-member board of di-
rectors, while the companies HSE Hungary, HSE Adria
DRAVSKE ELEKTRARNE MARIBOR D.O.O.
Managing director Damijan Koletnik
As at 01/01/2008 As at 31/12/2008 Boris Novak Viljem Pozeb, M.Sc.
Supervisory Board composition Žan J. Oplotnik, Ph.D. Ladislav Tomšič, M.Sc.
Bojan Majhenič Marjan Kirbiš
Main activity Hydro electricity production
SOŠKE ELEKTRARNE NOVA GORICA D.O.O.
Managing director Vladimir Gabrijelčič
As at 01/01/2008 As at 31/12/2008 Viljem Pozeb, M.Sc. Tomaž Štokelj, Ph.D.
Supervisory Board composition Niko Jurca Irena Stare
Silvester Medvešček Silvester Medvešček
Main activity Hydro electricity production
HIDROELEKTRARNE NA SPODNJI SAVI, D.O.O.
Managing director Bogdan Barbič
Damijan Koletnik
Supervisory Board composition as at 31/12/2008 Martin Novšak
Vladimir Gabrijelčič
Nikola Galeša
Janez Keržan, M.Sc.
Main activity Hydro electricity production
TERMOELEKTRARNA ŠOŠTANJ D.O.O.
Managing director Uroš Rotnik, Ph.D.
As at 01/01/2008 As at 31/12/2008 Djordje Žebeljan, M.Sc. Djordje Žebeljan, M.Sc.
Supervisory Board composition Franc Sever Jože Zagožen, Ph.D.
Franc Rosec Franc Rosec
Main activity Thermal electricity production
TERMOELEKTRARNA TRBOVLJE D.O.O.
Managing director Marko Agrež, M.Sc.
Uroš Rotnik, Ph.D.
Supervisory Board composition as at 31/12/2008 Borut Dolanc, M.Sc.
Janez Balog
Main activity Thermal electricity production
and HSE Bulgaria are run by a two-member manage-
ment. The company Toplofi katsia-Ruse AD has a se-
ven-member board of directors. Most companies are
supervised by a three-member supervisory board.
AN
NU
AL
RE
PO
RT
HS
E |
BU
SIN
ES
S R
EP
OR
T

42
PREMOGOVNIK VELENJE D.D.
Managing director Milan Medved, Ph.D.
Simon Tot
Supervisory Board composition as at 31/12/2008 Vida Lorber
Branko Mlinšek
Main activity Mining and agglomeration of lignite
PLINSKO PARNA ELEKTRARNA D.O.O., KIDRIČEVO
Managing director Branko Kožuh
Metod Podkrižnik, M.Sc.
Supervisory Board composition as at 31/12/2008 Anton Smolak
Zlatko Čuš, Ph.D.
Main activity Other electricity production
(in pre-investment stage)
HSE ITALIA S.R.L.
Board of directors as at 31/12/2008 Tomaž Štokelj, Ph.D.
Viljem Pozeb, M.Sc.
Damjan Lipušček
Main activity Electricity trading
HSE BALKAN ENERGY D.O.O.
Managing director of the company as at 31/12/2008 Boris Mezgec, M.Sc.
Main activity Electricity trading
HSE HUNGARY KFT.
As at 01/01/2008 As at 31/12/2008Managing director Tomaž Štokelj, Ph.D. Tomaž Štokelj, Ph.D.
Irena Stare
Main activity Electricity trading
HSE ADRIA D.O.O.
As at 01/01/2008 As at 31/12/2008Managing director Tomaž Štokelj, Ph.D. Tomaž Štokelj, Ph.D.
Irena Stare
Main activity Electricity trading
HSE BULGARIA EOOD
As at 01/01/2008 As at 31/12/2008Managing director Drago Skornšek Viljem Pozeb, M.Sc.
Drago Skornšek
Main activity Electricity trading
AN
NU
AL
RE
PO
RT
HS
E |
BU
SIN
ES
S R
EP
OR
T

43
TOPLOFIKATSIA-RUSE AD
Managing director Andrey Nikolaev
Georgiy Kutovoy (president)
Board of directors of the company as at 31/12/2008 Irena Stare
Tomaž Štokelj, Ph.D.
Alexey Ivanushkin
Valeriy Ovseychuk
Victor Tolokolnikov
Andrey Nikolaev
Main activity Production and cogeneration of electricity
and heat, transmission of heat
HSE PRAGUE BRANCH OFFICE
Head of Branch offi ce as at 31/12/2008 Tomaž Štokelj, Ph.D.
Main activity Electricity trading
HSE BRATISLAVA BRANCH OFFICE
Head of Branch offi ce as at 31/12/2008 Tomaž Štokelj, Ph.D.
Main activity Electricity trading
HSE BELGRADE REPRESENTATIVE OFFICE
Head of Representative offi ce as at 31/12/2008 Boris Mezgec, M.Sc.
Main activity Internationalisation of HSE's operations
(expansion of operations in SE Europe)
HSE BUCHAREST REPRESENTATIVE OFFICE
Head of Representative offi ce as at 31/12/2008 Drago Skornšek
Main activity Electricity trading
HSE INVEST D.O.O.
Managing director Miran Žgajner
Irena Šlemic
Supervisory Board composition as at 31/12/2008 Alida Rejec, M.Sc.
Jožef Hebar
Drago Polak
Main activity Other project engineering and technical consulting
HIDRO MOĆNOST MAKEDONIJA D.O.O.
Managing director of the company as at 31/12/2008 Eberhard Bulling
Main activity Other business activities
AN
NU
AL
RE
PO
RT
HS
E |
BU
SIN
ES
S R
EP
OR
T

44
Trade union activities and workers' council activities Employees exercise their rights through trade unions,
workers’ councils and representatives in the Supervi-
sory Board.
Regular and close cooperation with trade unions and
workers’ councils of the HSE Group is a practice that
was introduced together with the establishment of the
HSE Group. Such method of cooperation ensures a
balance between various interests and, consequently,
a broad consensus regarding the Group's develop-
ment plans and provision of social security.
Trade union activitiesTrade union activities at DEM, SENG, TET and TEŠ are
co-ordinated by Sindikat delavcev dejavnosti energet-
ike Slovenije (SDE – the Slovene Power Sector Union),
one of the strongest within Zveza svobodnih sindikatov
Slovenije (ZSSS – the Association of Free Trade Unions
of Slovenia), while at the companies HSE and HSE In-
vest activities are currently underway to establish
union representation.
The SDE’s Electrical Energy Sector Conference en-
compasses the Coordination of union activities of the
HSE Group, which is comprised of trade union repre-
sentatives of DEM, SENG, TET and TEŠ. The Coordina-
tion communicates directly with HSE’s management
as well as with the managing directors of individual
companies, thus ensuring that problems are ad-
dressed in due time. Such cooperation also extends to
the Joint Workers’ Council of the HSE Group.
Operating within the HSE Group there are also the
trade unions Neodvisnost and Sindikat pridobivan-
ja energetskih surovin Slovenije (SPESS – Union of
Coalminers), which is operates within the PV Group.
The actions of the SDE Coordination and other trade
unions operating within the HSE Group have a cohe-
sive function.
HSE Joint Workers’ CouncilHSE Group employees exercise their statutory right
to participate in management through the workers’
councils of individual companies. Among other things,
the councils elect staff representatives to the Super-
visory Board.
In 2008 a new agreement for the establishment of
the Joint Workers' Council (JWC) for related compa-
nies was signed, which takes into account the recent
changes and governs the areas that are necessary for
the functioning of the JWC within the HSE Group.
2.3 Business policy of the HSE GroupMissionThe HSE Group’s mission is to maintain its leading po-
sition in the domestic market an take a leading role
in the markets of SE Europe as well as to develop the
Slovene energy sector and science, establishing them
in an international context.
VisionThe vision of the HSE Group is to ensure optimum
utilisation of Slovene energy sources and professional
potential while establishing partnerships abroad –
especially in SE Europe – and thus ensure long-term
competitive advantage of the Group in the global ene-
rgy market and expand its business operations to cre-
ate additional synergy effects for the Group and Slove-
nia as a whole.
Values The values of the HSE Group are refl ected in the Group’s
attitude towards customers, the community, employ-
ees, business partners and owners. We focus on:
• satisfaction of service users,
• building responsible, long-term partnerships with
business partners,
• environment protection and RES,
• achieving professional competence,
• continuous training and establishment of a motivat-
ing working environment for employees,
• providing secure and stable jobs and creative work-
ing environment,
• effi cient operation and creation of profi t for the ow-
ners,
• continuous improvement of the management sys-
tem.
AN
NU
AL
RE
PO
RT
HS
E |
BU
SIN
ES
S R
EP
OR
T

45
2.4 Strategic orientations of the HSE GroupEuropean energy policyWith the adoption of the climate and energy package,
the future European energy policy was given a formal
legal framework at the end of 2008. To ensure sus-
tainable future, the EU set itself the following binding
goals for the period of up to 2020:
• to decrease the envisaged energy consumption by 20%,
• to increase the share of RES in total energy con-
sumption to 20%,
• to reduce greenhouse gas emissions by at least 20%,
• to increase the share of biofuels to at least 10% of
total motor fuel consumption.
New energy production methods will decrease the
EU's dependence on the imports of fossil fuels, but
oil, natural gas and coal will probably remain an im-
portant part of the fuel mix for a few more decades.
The EU supports this energy policy through additional
investments, extensive research and development
funding, and development and transfer of new tech-
nologies into general use.
HSE Group’s orientationsThe HSE Group is facing a period in which adjusting to
the European energy policy will be a priority strategic
area of business.
Its conduct of business will have to be adapted to the
changed legislative framework, structural challenges
and rapidly changing market conditions. The latter
are mainly affected by changes in the markets of SE
Europe, Slovenia’s and EU's increasing energy depen-
dence on imports, and the calls for improved environ-
mental responsibility.
Ensuring the production of electricity from RES and
lowering greenhouse emissions in the production of
electricity from fossil fuels play an important role in
meeting the requirements of a sustainable energy pol-
icy. Such orientation of the production capacities of the
HSE Group has already been laid down in the develop-
ment plan of the HSE Group for the period 2006-2015.
The conditions brought about by the global fi nancial and
economic crisis require the HSE Group to reconsider its
investments in the new production capacities in light of
changed electricity prices and devote even more attention
to obtaining suffi cient funds for the implementation of
HSE Group’s development projects. The basic guidelines
for the future development are expected to be defi ned at
the 6th Strategic Conference of the HSE Group in the fi rst
half of 2009, when the bases for supplementing the al-
ready adopted development plans will also be known.
A balanced combination of production sources with
emphasis on RES, use of domestic energy sources
and integration of the European energy market laid
down in the third energy legislation package repre-
sent a foundation for the future strategic orientation
of HSE's operations.
In implementing its business policy, HSE will continue
to strive for maintaining the leading position of the HSE
Group within the Slovene energy system, thus responsibly
ensuring secure and reliable electricity supply in Slove-
nia. It will maintain the planned growth of the company's
and group's operations to the extent and at the speed at
which growth and development were pursued until now,
and achieve operating results that will benefi t all our key
stakeholders: the owner, employees, business partners,
and the community into which it is integrated.
2.5 Quality management system policyThe quality management system policy combines
quality, environmental management and occupational
health and safety. The management system man-
ual complies with the standards ISO 9001:2000, ISO
14001:2004 and OHSAS 18001:1999.
The overall system is based on the following principles:
• responsibility for the execution of specifi c tasks and
the related clearly established authorisations,
• responsibility for the achievement of objectives con-
cerning quality, environmental management and oc-
cupational safety,
• each individual, irrespective of their position, is
responsible for the implementation of objectives
concerning quality, environmental management,
occupational safety and information security in ac-
cordance with their responsibilities and authorisa-
tions.
AN
NU
AL
RE
PO
RT
HS
E |
BU
SIN
ES
S R
EP
OR
T

46
2.5.1 Achieving objectives regarding quality
Our permanent objectives regarding quality are as fol-
lows:
• to meet customer demands,
• to achieve the strategic and tactical business objec-
tives,
• to attain an optimal organisation structure and
transparency of business operations,
• to operate in accordance with applicable regula-
tions, and
• to exercise permanent control over the economic
aspects of business to ensure successful perfor-
mance.
The objectives set for the year 2008 were achieved.
System procedures were amended and supplement-
ed. The management system documentation was in-
tegrated into the ODOS computerised document sys-
tem. The training of employees in the fi eld of quality
and organisation of work continued.
In the previous year, internal and external recertifi ca-
tion audits were carried out and successfully com-
pleted, as was the external audit of RES production at
DEM and SENG HPP chains against the criteria of EE
TÜV 08/02 and RECS.
2.5.2 Achieving environment management objectivesThe HSE Group is an environmentally conscious
group, which provides its employees with a pleasant
and healthy working environment and fosters good re-
lations with its neighbours. Intensive efforts towards
sustainable development are being made on the local
as well as national level. The Group strives for a con-
tinuous improvement of working and living conditions
of employees and population residing in the vicinity of
HSE companies. For this reason, our environmental
policy was harmonised with the requirements of the
ISO 14001:2004 standard. In 2008 an internal recertifi -
cation audit of environment protection was carried out
and successfully completed based on the ISO 14001
standard.
The key objective of the environmental policy is to
establish a permanent balance, which is achieved by
the HSE Group by implementing preventive measures,
preventing any environmental contamination, sharing
responsibility and by including environmental man-
agement in individual business processes.
2.5.3 Achieving occupational health and safety objectivesCaring for the improvement of occupational health and
safety conditions in the working environment while
taking into account the specifi cs of processes of HSE
Group companies is an integral part of the Group’s
culture and refl ects our care for our employees and
the Group’s attitude towards the social environment in
which we live and operate. For the HSE Group, com-
pliance with relevant legislation represents merely a
minimum level which is observed and supplemented
with the requirements of the OHSAS 18001 standard.
After the internal and external recertifi cation audit
was carried out and successfully completed, the audi-
tors determined that the area of occupational health
and safety is managed in accordance with the stan-
dard.
2.5.4 Achieving information security objectivesIn 2008 the progressive implementation of informa-
tion security management measures continued in ac-
cordance with the ISO 27001 standard as follows:
• a basic questionnaire was drawn up for the purpose
of gap analysis, and the gap analysis was carried out
at TEŠ, which served as a model company. Because
of the shared IT, this also largely concerns HSE;
• the core methodology for assessing risks in the area
of information security was also prepared;
• the fi nal inventory count of information resources
was performed within individual systems at TEŠ and
HSE;
• the procedures for the monitoring of events in the
area of information security and business IT were
AN
NU
AL
RE
PO
RT
HS
E |
BU
SIN
ES
S R
EP
OR
T

47
prepared, as were the methods for their classifi ca-
tion based on changes, possible incidents and actual
incidents, and for their appropriate allocation and
resolution.
Work was carried out on the information centre back-
up location, and a trial operation of the centre was
launched.
The procedure for verifying the methodology for the
introduction of the ISO 27001 standard at TEŠ was
continued and all workers received data protection
training.
2.5.5 Certifi cates obtained by HSE Group production companiesOpen market conditions in the Slovene electricity
market and especially in foreign markets necessitates
certifi ed quality in terms of system and environmental
management, as well as an appropriate approach to
the production of electricity and other energy prod-
ucts. Appropriately certifi ed products result in an
improved sales performance, and sometimes certain
markets can only be penetrated if products have been
appropriately certifi ed.
EE TÜV Organisation for technical control of RES
RECS Renewable energy certifi cate system
HACCP Hazard analysis and critical control points
Measurement laboratory standard
USP S10 USP Institute learning enterprise standard
OHSAS COMPANY ISO 9001 ISO 14001 18001 EE TÜV RECS HACCP USP S10
HSE • • • • •
DEM • • • • •
SENG • • • • •
TEŠ • • • •
TET • • •
PV • • • •
AN
NU
AL
RE
PO
RT
HS
E |
BU
SIN
ES
S R
EP
OR
T

48
2.6 Market position
2.6.1 Characteristics of the economic environment in 20081
In 2008 the international fi nancial crisis deepened,
which led to the projected risk of a slowdown in eco-
nomic growth becoming a reality. Data about domestic
activity and mainly the indicators of expected trends
reveal that the changes in the international environ-
ment were, through smaller demand and signifi cantly
more stringent fi nancing conditions, transferred to
the Slovene economy.
4.1% economic growthPrimarily on account of poorer conditions in the inter-
national environment, estimated economic growth in
2008 was 4.1%, which is 2.7% less than in 2007 (6.8%).
GDP at current prices was € 37,403 million in 2007 or
€ 18,329 per capita.
Real growth in exports decreased and imports increasedReal growth in exports for 2008 is estimated at 5.8%,
whereas in 2007 it stood at 13%. Real growth in exports
decreased compared to 2007 due to a drop in foreign
demand, resulting in a major impact on reduced car
industry production and consequently vehicle export.
On the other hand, imports in real terms increased
by 6.5% in 2008. According to estimates, imports rose
slightly more than exports in real terms, which is why
the foreign trade balance had a negative infl uence on
economic growth, i.e. –0.6 percentage points.
Slowdown in domestic banks' credit activityWhile the credit activity of domestic banks gradually
slowed down in the fi rst ten months of 2008, it nearly
stopped in November on account of ever more strin-
gent conditions on international inter-bank markets
and reached the deepest trough since March 2005.
Only loans to the state somewhat increased, as in No-
vember the state borrowed € 80 million net, whereas
the corporate sector recorded a modest positive net
credit fl ow, while the retail sector even repaid loans on
a net basis. Banks partly compensated for the loss of
funds from inter-bank markets with deposits made by
domestic clients who at the end of 2008 withdrew funds
from capital markets where negative trends persisted.
Growth in added value still the highest in the construction sectorAdded value in 2008 again rose most in the construc-
tion sector, which was the fastest growing activity,
contributing 15.5% to the total increase in added val-
ue. The high increase in added value was in 2008 seen
only in fi nancial intermediation (11.4%).
Increase in unemployment rateThe indicators on the labour market are gradually de-
teriorating, as in December 2008 the number of reg-
istered unemployed was for the third month in a row
higher than the month before. According to SORS data,
the unemployment rate climbed to 7.0% by the end
of 2008, this being equal to 66,239 persons. The most
apparent were the consequences of layoffs in sectors
where production volume had to be reduced on account
of fewer and cancelled orders. The greatest rise was
recorded in the number of unemployed persons aged
30–50, predominantly men. Of the total 946,491 active
population, 880,252 were employed at the end of 2008.
2.1% growth in consumer pricesAt 2008 year-end, infl ation was considerably lower
than the year before. Year-on-year infl ation further
decreased in December (2.1%) and infl ation in 2008
averaged 5.7%. Similarly as in the past fi ve months,
1 Source: SORS, IMAD, MF
GWh of electricity were sold by the HSE Group on the domestic
and foreign markets. Of these, 7,771 GWh were produced in
the HSE Group, meaning that the Group has preserved the
leading position among electricity producers in Slovenia.
13,705
AN
NU
AL
RE
PO
RT
HS
E |
BU
SIN
ES
S R
EP
OR
T

49
price movements were characterised chiefl y by lower
prices of liquid fuels resulting from a downward trend
in oil prices on the global markets. In addition to the
lower prices of raw materials, the decrease in infl ation
was also infl uenced by subsided economic activity and
expectations. The same reasons lead to a continued
slowdown in infl ation in the entire euro area, where it
equalled 1.6% in December.
Negative net balance of the national budgetAt the end of 2008, the Slovene national budget re-
corded a negative net position compared to the EU
budget in the amount of € 64.7 million. As a result of
new statistical aggregate estimates, total payments to
the EU budget in 2008 exceeded the funds allocated
for this purpose in the scope of the 2008 budget by
almost 10%, whereas less than half the funds were
drawn (44.4%).
Infl ation movement in Slovenia and the euro area in the 2000–2008 period2
The movements on the international fi nancial markets
had a strong impact also on domestic exchange move-
ments, as the SBI20 index dropped by nearly 70%. The
index thus reached the lowest level since 2003. Ac-
cording to the exchange rate as at 31 December 2008,
1 euro equalled 1.2591 US dollars.
Another signifi cant event occurring in the energy sec-
tor in 2008 was without a doubt the gas crisis, origi-
2 Source: SORS, EUROSTAT
nating from the dispute between Russia and Ukraine.
The crisis demonstrated the importance of domestic
energy products for energy supply.
In the past year, electricity production grew consid-
erably (+9.7%), whereas consumption decreased
(–5.4%). Net electricity export rose, accounting for
10.6% of total electricity consumption, which was the
highest fi gure since 2001.
2.6.2 Market environmentof the electricity industryIn the past year, the market environment of the elec-
tricity industry was hugely characterised by extensive
electricity price changes. The major reasons for the
situation at hand should be sought in the global eco-
nomic conditions and the international fi nancial crisis,
which towards the end of the year evolved into a general
economic crisis. The altered economic conditions were
greatly refl ected in the prices of primary energy prod-
ucts such as oil, coal and natural gas, and consequently
also in the prices of electricity. Until mid 2008 we re-
corded high growth in the prices of energy products and
thus in the prices of electricity, however, in the second
half of the year the situation was substantially different.
Prices started plummeting from the record levels, and
still experienced a downward trend at the end of 2008.
According to the European directive on the cross-
border transmission capacity allocation, the Slovene
transmission network operator in 2008 continued al-
locating its cross-border transmission capacities at
the Slovene borders on a market basis.
One of the major factors greatly infl uencing the elec-
tricity market is the emission coupon market. In 2008
we entered a new fi ve-year Kyoto period, lasting until
2012, during which an even greater focus on the re-
duction of greenhouse gas emissions is projected. The
number of emission coupons allocated for this period
points to the fact that the protocol signatories are
striving to prevent the pre-Kyoto situation from recur-
ring. Namely, in the last year of the 2005¬–2007 period
it became clear that there had been too many coupons
distributed. This was refl ected in their price. In 2008
the coupon price mimicked energy product prices – oil
in particular, which means that prices slumped in the
second half of 2008. Nevertheless, emission coupons
remain at price levels which still greatly infl uence how
12
10
8
6
4
2
0
Slovenia
Euro area
An
nu
al
infl
ati
on
in
%
Ja
n 0
0
Ja
n 0
1
Ja
n 0
2
Ja
n 0
3
Ja
n 0
4
Ja
n 0
5
Ja
n 0
6
Ja
n 0
7
Ja
n 0
8
Ja
n 0
9
AN
NU
AL
RE
PO
RT
HS
E |
BU
SIN
ES
S R
EP
OR
T

50
facilities that use fossil fuels as the primary source
offer electricity. Currently, procedures are underway
and regulatory frameworks are being formulated for
the third trading period, which is projected to last
from 2013 to 2020. In this period electricity producers
in most European countries will have to purchase the
entire volume of emission coupons at auctions. This
will represent a high cost item to all of them.
2.6.3 Situation on electricity markets in 20083
SloveniaIn 2008 the situation on the electricity market was
characterised by a smaller energy price difference
between SE European markets and continental mar-
kets. The reasons include the recovery of the economy
and thus the consumption of electricity in SE Europe,
which along with the lack of production units led to
higher electricity prices. Still evident is the effect of
the discontinued supply from the Bulgarian nuclear
power plant, which represented an important produc-
tion source for the entire region, before this country
entered the EU. Due to the resulting situation, the
energy fl ows from SE Europe to Continental Europe
and Italy greatly decreased. The Hungarian market
last year represented an important source of energy
for Slovenia and SE Europe. The price of cross-border
transmission capacities for transmitting energy from
Croatia to Slovenia last year averaged a quarter of a
euro.
The Continental European market and partly the Ital-
ian market, from which Slovenia received electricity
mostly during the night and at weekends, were signifi -
cant import markets for Slovenia in 2008. The prices
of cross-border transmission capacities for importing
energy from Austria and Italy fl uctuated accordingly,
reaching the highest levels outside the peak period.
HPPs made a major contribution to the energy balance
sheet of Slovenia in 2008. The hydrology in 2008 great-
ly exceeded the historical average, as HPPs produced
a quarter more energy than in 2007. As production is
fl exible, the energy generated from hydro potential
was mostly placed to more expensive peak hours.
Where so allowed by technical capacities, the price
differences between peak and off-peak energy were
also exploited in TPPs. Predominantly during the
night, when the price of electricity and cross-border
transmission capacities was lower than the variable
TPP costs, the production units operated at a mini-
mum or were shut off. When profi table, they operated
at maximum capacity during peak hours. In 2008 TEŠ
produced 2.5% more electricity than in 2007, whereas
TET exceeded the 2007 level by 3.3%.
Consumption from the transmission network de-
creased by 722 GWh or 5.4%. The greatest fall was
seen in consumption by direct consumers, which can
be mostly attributed to a production cut in Talum and
TDR-Metalurgija. Also, after many years' rise, con-
sumption from the distribution network shrank, which
was contrary to the projected energy balance.
Balance of European electricity markets in 2008 in TWh
3 All data about electricity production in Slovenia include production only by the Slovene part of the Krško Nuclear Power Plant.
AN
NU
AL
RE
PO
RT
HS
E |
BU
SIN
ES
S R
EP
OR
T
+ 54.6
+ 14.8- 8.8
- 8.8
- 16
+ 30.1
+ 1.6
+ 11.9
- 1.6
- 0.3
- 3.9
+ 4.6
+ 2.5
- 32.4
+ 6.1
+ 0.4+ 1.6
- 3.5- 1.5
- 2.8
- 4.4

51
12,000
10,000
8,000
6,000
4,000
2,000
0
Slovene electricity market in 2008 and 2007*
Share of the HSE Group's production in total electricity production in Slovenia in 2008 and 2007
2008 2007
Produced by HSE Produced by others
15,000
12,000
9,000
6,000
3,000
0
Produced Used Imported Exported
in GWh
2008 2007
in GWh
* Source: ELES
Source for production is ELES.
11,33010,341
12,79813,496
6,142 6,146 4,751
3,023
7,771 69 %
3,559
7,019 68 %
3,322
8,000
7,000
6,000
5,000
4,000
3,000
2,000
1,000
0
Production of threshold electricity in the HSE Group in 2008 and 2007
2008 2007
DEM SENG HESS* TEŠ TET TOTAL
in GWh
2,565
576129
3,850
651
7,771
2,153
380 100
3,756
630
7,019
Note: * In 2007 the production of HPP Boštanj was
presented within the joint venture.
AN
NU
AL
RE
PO
RT
HS
E |
BU
SIN
ES
S R
EP
OR
T

52
Continental EuropeCharacteristic of the year 2008 were extremely quickly
growing prices of oil and other energy products in the
fi rst half of the year. The price of oil in July reached
$145 per barrel. Consequently, the prices of electricity
and CO2 coupons followed the upward trend.
In 2008 the transmission capacities between Slo-
venia and Italy were leased at extremely favourable
conditions at the annual level. During the year, HSE
also successfully participated in monthly auctions to
secure transmission paths from the same direction,
but was less successful in acquiring transmission ca-
pacities at other Italian borders, as the prices were
extremely high. In December, trading on the French-
Italian border opened.
In 2008 a signifi cant novelty in Continental Europe was
the foundation of a branch offi ce in Slovakia. The main
purpose of this foundation was to fi ll the gap between
the Czech Republic and Hungary, thus enabling energy
fl ow from the Czech Republic, which will remain a net
exporter of electricity for a number of years, through
Slovakia and Hungary to SE Europe, which is already a
net importer of electricity.
Towards the end of 2008 it turned out that the decision
to establish the HSE Bratislava Branch Offi ce was the
right one, as HSE exploited a number of trading op-
portunities.
In 2008 trading on the Czech market was more mod-
erate on account of an unfavourable relationship
between the Czech and German electricity prices.
In February, the company became a member of the
Prague power exchange PXE, thus gaining mainly the
possibility to purchase and sell electricity for a longer
period. The downside of the said exchange is the still
relatively poor liquidity. However, the power exchange
provided for the possibility of trading in the Slovakian
market, which will become interesting once Slovakia
cancels the export fee hindering a greater expansion
of trading on this market.
SE EuropeIn the past year both the prices of short-term and long-
term electricity supply grew in SE Europe. Coinciding
with the closure of two reactors at a Bulgarian nuclear
plant at the end of 2006, Bulgaria cut electricity exports
and in early 2008 prohibited the export of electricity to
the region, despite suffi cient surplus production ca-
pacities, in order to maintain low prices in the domestic
market. The ban on export lasted for two months, but
introduced uncertainty about the source of cheap en-
ergy from Bulgaria, which was refl ected in a rapid price
increase of supply in other countries of the region.
In the past year HSE took part in auctions for cross-
border transmission capacities in most SE European
countries, which contributed to greater trading vol-
ume in those markets. The exception was Bosnia and
Herzegovina, where a registered licensed company is
now required for participation in auctions. This condi-
tion did not exist before. Trading in SE Europe in 2008
was infl uenced by the events in the Hungarian market.
Trading in this market became more transparent and
liquidity is rising, also due to the providers of trading
via portals. The Hungarian market was still very im-
portant for HSE, however, trading volumes were below
last year's level as a result of the inability to create a
long-term electricity portfolio, restrictions on the sale
of electricity placed by the Hungarian Energy Agency
(MVM), and the introduction of an export fee in the
amount of approximately €17/MWh.
The rise in trading volumes in this area at the start of
2008 was still impeded by various costs and restric-
tions of electricity transit, which were, contrary to the
European practice, imposed by transmission network
system operators on electricity traders. In mid 2007,
most SE European countries signed the ITC mecha-
nism, which abolished the majority of transit duties.
Certain countries have maintained some of the du-
ties, but have done so under different names and to
a smaller extent. The trend to close the markets and
restrict trading by means of duties and other instru-
ments escalated further in the second half of 2008.
Owing to high economic growth in the region, far higher
than in western Europe, consumption also grew faster
in this area. The relatively old and poorly maintained
production facilities, in which hydro production ac-
counts for a large share, heighten the volatility of sup-
ply prices in this area. Accompanied by poor hydrology,
the prices of long-term contracts in the SE markets
last year substantially exceeded those in Continental
Europe and in the Italian market in spite of the fact that
some producers in this part of Europe are not involved
in the CO2 trading scheme (only producers with their
own production units in EU member states participate
in the scheme).
AN
NU
AL
RE
PO
RT
HS
E |
BU
SIN
ES
S R
EP
OR
T

53
2.7 Sales and customers
2.7.1 ElectricityPrice of electricityAs in previous years, the consumptions of electricity in
Slovenia was subject to numerous factors in 2008, of
which the most important were the structure and size
of economic growth, demographic changes, overall
development of the society, the level of technological
development, climate change, environmental aware-
ness, sustainable development, changes in energy
prices and the parity of energy prices.
In Slovenia, GDP is still the factor with the biggest im-
pact on the amount of electricity consumption. In 2008
the companies belonging to the second energy pillar
established their own balancing group, thus increas-
ing their active participation in the market. This, how-
ever, did not give rise to an increase in the quantity of
energy produced by these companies.
In 2008 HSE sought to ensure effi cient and secure
supply of electricity to its customers. To this end, it
strengthened its activities to provide for effi cient sep-
aration between trading, production and transmission
of electricity.
In 2008 the price of electricity was again determined
on the basis of market prices, with the margin price
being determined based on the engagement of the
most expensive unit at a specifi c moment.
To maximise the company’s operating results at ac-
ceptable risk exposure, the HSE Group coordinated
activities in connection with the sale of electricity gen-
erated by HSE Group companies, trading in electricity
from other sources and management of production
plants of HSE Group companies.
Sales volume and structureIn 2008 the HSE Group sold 13,705 GWh of electric-
ity in both domestic and foreign markets. The most
important was the domestic market, which accounted
for 76% of total sales, of which 58% to fi ve distribu-
tion companies and 15% to other direct consumers,
while 3% of domestic sales related to sales to other
customers and ELES (tertiary and secondary control
energy and deviations). Exports account for 24% of the
sales.
Structure of electricity sales in 2008 and 2007 in MWh
18 %
24 % 58 %
Domestic market - others
Domestic market - others
Foreign market
Foreign market
Distribution
Distribution
17 %
27 % 56 %
2008
2007
AN
NU
AL
RE
PO
RT
HS
E |
BU
SIN
ES
S R
EP
OR
T

54
Long-term contracts and day-ahead marketThe bulk of the sales were generated through long-
term contracts. The trading in day-ahead markets was
carried out to match contractual obligations with the
production capacities of HSE Group companies and to
optimise the company’s portfolio and take advantage
of market opportunities. Electricity surpluses gener-
ated at the time of high water levels and availability
of additional electricity produced during periods when
market price exceeded the cost of extra production
were sold in day-ahead markets.
Ancillary servicesIn addition to electricity, the following contractually re-
quired ancillary services were provided in 2008:
• secondary frequency control in the range of ± 77 MW,
• tertiary frequency control with the inclusion of non-
spinning and spinning reserves of 92 MW,
• black start capability;
• reactive power support,
• secondary control services.
2.7.2 Other activitiesNet sales revenue structureThe HSE Group generated more than € 872 million in
net sales revenue in 2008. Accounting for 96%, elec-
tricity was by far the most important in the structure
of the HSE Group’s net sales revenue, with sales of
other products and services amounting to 4%.
Other products and servicesOther revenue from the sale of products and services
includes revenue from the sale of apartments and
rents, revenue from construction and hospitality servic-
es, revenue from repair and maintenance services, rev-
enue from the sale of heat and revenue from services
of disposing of powdered animal by-products through
incineration. The bulk of revenue from the sale of other
products and services was generated by the PV Group.
HeatIn 2008 the sales of heat totalled 408.8 GWh, which is
13% more than planned.
Structure of net sales revenue in 2008 and 2007
2008
2007
4 %
3 %
96 %
97 %
Other revenue
Other revenue
Revenue from the sale of electricity
Revenue from the sale of electricity
AN
NU
AL
RE
PO
RT
HS
E |
BU
SIN
ES
S R
EP
OR
T

55
2.8 Purchasing and suppliers
2.8.1 Electricity
DEM Dravograd Vuzenica Vuhred Ožbalt Fala MB otok Zlatoličje Zlatoličje Formin Small HE TOTAL
Period Jan-Jun Jul-Dec
Turbines 3 3 3 3 1+2 3 2+1 2+1 2 1
Net output MW 26 56 72 73 58 60 114 120 116 0.7 576 / 582
Rated
generation MVA 36 78 90 90 74 78 148 159 148 0.9 743 / 754
capacity
Gross head m 8.9 13.7 17.4 17.4 14.6 14.2 33 33 29 105
Rated
fl ow Qi m3/s 405 550 550 550 505 550 463 463 500
HESS Boštanj TOTAL
Turbines 3
Net output MW 34 34
Rated generation capacity MVA 43,5 43,5
Gross head m 7.6 7.6
Rated fl ow Qi m3/s 500
SENG Doblar I. Doblar II. Plave I. Plave II. Solkan Zadlaščica Small HE TOTAL
Turbines 3 1 2 1 3 2 26
Net output MW 30 40 15 19 32 8 11.4 155.4
Rated generation capacity MVA 48 50 22 23 39 10 15.6 207.6
Gross head m 47.2 48.5 27.5 27.5 23 173.7
Rated fl ow Qi m3/s 90 105 75 105 180 2.2
HSE Group’s electricity production units in 2008
SynergyTo maximise effi ciency, HSE seeks to take advantage of
synergies associated with a wide spectrum of produc-
tion units within the Group. Because different produc-
tion units have different operational and cost charac-
teristics, a more cost-effective electricity production
can be achieved through an appropriate combination of
production schedules. And because electricity market
prices fl uctuate over time, the economical dispatching
of production units, while observing technical criteria,
is all the more important.
TEŠ GT 51 GT 52 Unit 1 Unit 2 Unit 3 Unit 4 Unit 5 TOTAL
Period Apr-Dec Sep-Dec Jan-Oct
Net output MW 42 42 25 25 55 248 305 658 / 700 / 742 / 717
Rated generation capacity MVA 56.25 56.25 37.5 37.5 94 324 377 870 / 926 / 982 / 945
TEŠ's Units 1 and 2: Available capacity was reduced to 25 MW due to wear of units. TEŠ's Unit 5: Generator output is 377 MVA at 3 bars of hydrogen pressure. TEŠ's Unit 2: No longer operational/used as a non-spinning reserve since 17/10/2008.
TET GU I. GU II. Unit 4 TOTAL
Net output MW 29 29 110 168
Rated generation capacity MVA 34 34 156 224 AN
NU
AL
RE
PO
RT
HS
E |
BU
SIN
ES
S R
EP
OR
T

56
Structure of electricity purchases in 2008 and 2007
15 % 16 %
28 % 43 %57 %
41 %
Other purchases in the domestic market Other purchases in the domestic market
Purchases in foreign markets Purchases in foreign markets
HSE Group companies HSE Group companies
2008 2007
Structure of sourcesThe electricity supplied by the HSE Group to its cus-
tomers in 2008 was mainly purchased from subsidiar-
ies (57%) and in foreign markets (28%). A large part
of the remaining electricity purchases in the domestic
market (15%) relates to purchases from GEN energija.
To offset shortfalls arising from supply failures or poor
hydrology, HSE purchased electricity in the day-ahead
electricity market.
AN
NU
AL
RE
PO
RT
HS
E |
BU
SIN
ES
S R
EP
OR
T

57
Primary raw materials used in electricity production in 2008 and 2007
1 %
42 %
38 %
57 % 62 %
Water potential Water potential
Coal Coal
2008 2007
Purchase priceIn 2008 the purchase price of electricity was mostly
affected by the following factors:
• favourable hydrology, which resulted in a production
of cheaper hydropower by HSE Group companies
and was 12.9% higher than planned,
• energy production at TEŠ, which was 4.3% higher
than planned,
• energy production at TET, which was 3.3% higher
than planned,
• conditions in the electricity market.
CoalAt TEŠ, 44,207 TJ of coal were used in the production
of electricity and heat, while at TET, 6,802 TJ of coal
were used in the production of electricity.
Coal stocksOn 31/12/2008, PV’s coal stocks totalled 3,700 TJ while
at TET they stood at 2,318 TJ.
Natural gas and liquid fuel
Primary raw materialsIn 2008 primary raw materials used in the produc-
tion of electricity included coal (57%), water potential
(42%) and natural gas and extra light heating oil (1%
each).
AN
NU
AL
RE
PO
RT
HS
E |
BU
SIN
ES
S R
EP
OR
T

58
LE
TN
O P
OR
OČ
ILO
HS
E |
NA
LO
ŽB
E
million euros were invested by the end of 2008 in the HPP construction on the
lower Sava River. Besides further additional electricity production of 721 GWh
and the compliance with the EU guidelines, the project provides for better
development of the local communities in the area of new hydro power plants,
improved environmental protection and boosted regional development.
2.9 Investments
Electricity consumption has been constantly on the
rise on the domestic and global level, which is why the
HSE Group is seeking new, additional projects and in-
vestments to secure a safe, reliable, competitive and
environmentally-friendly supply of electricity to Slove-
nia. Namely, the Group is aware that:
• its customers depend on the quality of electricity;
• in electricity production it is necessary to ensure
optimal use of domestic sources, thus decreasing
dependence on imports;
• operations have to be expanded and active participa-
tion is needed on the common European and inter-
national market, while at the same time it is nec-
essary to look for sources, also outside Slovenia, to
compensate for the gap in the domestic supply;
• great effi ciency can only be achieved through effi -
cient utilisation of primary sources, as a result of
which the HSE Group constantly keeps up with the
technological development and modernisation of its
production facilities;
• a high degree of supply reliability can only be achieved
through appropriate diversifi cation of sources;
• new sources and know-how should be developed
continuously.
The investments of the HSE Group are aimed at mod-
ernising the existing thermal power plants and hydro-
electrical capacities, and constructing new power
facilities. Thus, the HSE Group pursues the following
major objectives:
• boosting the share of renewable energy sources;
• applying new technologies in fossil fuel utilisation;
• reducing greenhouse gas emissions;
• increasing energy effi ciency;
• ensuring sustainable, environmentally-friendly use
of sources; and
• searching for and exploiting investments abroad.
Below we present the major investments made by the
HSE Group in 2008 in property, plant and equipment,
and intangible assets.
HPPs on the lower Sava RiverHPPs Boštanj, Blanca, Krško, Brežice and Mokrice
will more than double the electricity production on
the Sava River – a river with the least utilised energy
potential. The electricity generated by the new power
plants, which will be gradually constructed until 2015,
will account for 21% of Slovene HPP production and is
believed to cover 6% of the total electricity consump-
tion of Slovenia.
In addition to 189 MW of additional installed power
and 721 GWh of extra annual production, better de-
velopment of the local communities in the area of the
new HPPs, improved environmental protection and
boosted regional development are enabled.
HPP BoštanjThe threshold power of HPP Boštanj is 34 MW and its
mean annual production is 115 GWh. The HPP is in
176

LE
TN
O P
OR
OČ
ILO
HS
E |
NA
SL
OV
PO
GL
AV
JA
59
trial operation, during which the equipment is being
monitored.
HPP BlancaHPP Blanca witnessed the following signifi cant events
in 2008:
• construction work on the dam facility was fi nalised;
• the Sava River was redirected to the spillways;
• the internal technical inspection for elevating the
reservoir to an intermediate level was successfully
conducted;
• turbine 1 was installed and synchronised, and is
ready for a trial run;
• installation of electrical and other equipment at the
HPP was carried out; and
• the 110 kV cable line was connected and hooked up.
In 2009 HPP Blanca will be put into trial operation.
HPP KrškoThe following major events took place at HPP Krško
in 2008:
• preparatory work was completed to protect the 1st
construction pit;
• a bridge was constructed downstream from the HPP;
• the spillways were concreted;
• the installation and concreting of guides for hydro-
mechanical spillway equipment commenced;
• the Agreement on By-Pass Financing was signed;
• the Protocol and Agreement on road deviation at
HPP Krško were concluded.
HPP Brežice and HPP MokriceAt HPP Brežice and HPP Mokrice, the following im-
portant events took place in 2008:
• the procedure and preparation of national spatial
development plans were carried out (NSP);
• expert bases were produced for the NSP;
• technical and spatial documentation was prepared.
Project investors are HSE, DEM, SENG, TEB and GEN
energija, fi nancing the HPP construction on the lower
Sava River in proportion to their equity stakes in HESS
and in line with the investment payment plans. In Sep-
tember 2008, HSE drew a long-term loan from the EIB
in the amount of € 74 million for fi nancing the invest-
ments in HPP Blanca and HPP Krško.
PSP AvčePSP Avče will be the fi rst pumped storage hydro power
plant, contributing to the higher production of peak
electricity required by the Slovene energy system, and
the existing production capacity of SENG and HSE. In
addition to the above advantages, PSP Avče plays an
important role in the regional and urban development
of the area, and in ensuring higher employment rates in
the economic sector, promoting the economic develop-
ment of the area, and developing the Banjšice Plateau
through the promotion of tourism at Kanalski Vrh.
In periods of low electricity prices (at night and on
weekends), the PSP uses electricity to pump water
to the reservoir, whereas in periods of high electric-
ity prices (work-day peaks), the accumulated water
is used for electricity production. The investment in
this plant has been under way since 2003. The facil-
ity’s construction started when the building permit
was obtained in September 2004. The developments
on site commenced in December 2004.
Technical data of PSP Avče: maximum gross head: Hb = 521.00 m
useful water volume: Vk = 2,170,000 m3
rated fl ow (turbine regime): Qi = 40 m3/s
rated fl ow (pumping regime): Qč = 34 m3/s
rated turbine power: Pi = 185 MW
rated pumping capacity: Pč = 180 MW
annual electricity production: El = 426 GWh
annual energy consumption for pumping: Eč = 553 GWh
In 2008 the following important events took place at
PSP Avče:
• the upper reservoir and the intake facility were con-
structed, work was carried out on the refl ective and
protective barrier next to the reservoir, and work in-
volving landscaping of areas, biotope and info point
facility construction commenced;

LE
TN
O P
OR
OČ
ILO
HS
E |
NA
SL
OV
PO
GL
AV
JA
60
• the concrete lining was concreted, a 100 m steel lin-
ing was installed by concreting, which means that the
surge facility, including the throttle, was fi nalised;
• the initial phase of the barrier chamber was com-
pleted and the connection between the chamber and
the intake tunnel is being built;
• the pressure pipeline installation at section T1–T5
was completed and the route between T5 and T12 is
undergoing intensive installation of a steel pressure
pipeline by casting of encasing concrete;
• construction work ended on the machinery building
and a 35 kV connection cable line was installed;
• electrical equipment and machinery was delivered and
installed in line with the adopted operational plans;
all elements were made for installing the pump-
turbine into the free shaft; all stationary elements
were installed, encased with concrete and machine-
processed; the installation of moveable pump compo-
nents (turbine) started; all elements were manufac-
tured for auxiliary systems of the pump-turbine; the
stator casing was produced, along with stator package
and stator winding; rotor assembly commenced;
• February 2008 saw the start of work on the connecting
2 x 2 x 110 kV transmission line; the access roads and
the excavation of the cable line route were complet-
ed; concreting was fi nalised at all standing positions,
all earthings were laid, most pillars were assembled
and installed, and the cable was partly fi lled in.
The investment is projected to be fi nalised in 2009.
The project investor is SENG.
Refurbishment of HPP ZlatoličjeHPP Zlatoličje, the largest channel power plant in Slo-
venia, has been operating reliably since 1969, produc-
ing more than 5% of the total electricity in Slovenia
per year. Its renovation is urgent due to the deterio-
ration of unit and turbine equipment. The renovation
will also result in increased electricity production and
increased safety for people and the environment.
Basic data about the renovation of HPP Zlatoličje:• renovation completion scheduled for: 2009;
• power increase: +24 MW;
• higher total fl ow with which the run-of-river capac-
ity of the power plant chain will be harmonised.
Work on the Melje dam and its direct surroundings:• increased stability and strength of the Melje dam;
• restoration and additional arrangement of the pro-
tective and spillway wall;
• upgrade of the SHPP on the Melje dam;
• upgrade and replacement of electrical equipment
and machinery of the dam.
Main events involved in the renovation of HPP Zlatoličje in 2008 were:• work started on the assembly of the turbine unit
equipment;
• activities were underway to assemble the stator and
the collection system of the unit, including all per-
taining equipment;
• systems were installed and equipment tested;
• functional tests of the unit and all pertaining equip-
ment were conducted; turbine 2 was successfully
synchronised, whereby the turbine was put into a
primary network testing phase;
• the unit underwent an expert technical inspection;
thus, the conditions of trial operation, which will
start in 2009, were offi cially fulfi lled;
• in early 2008, major construction work was for the
most part completed on the Melje dam and the
SHPP; turbine, unit and pertaining electrical equip-
ment and machinery started being installed; fi nal
installation work was carried out on the dam for
the 10 kV switchyard; an internal technical inspec-
tion was conducted along with an inspection based
on which the 10 kV switchyard was put into regular
operation; work was conducted on the primary and
secondary equipment of the SHPP;
• all the necessary documentation has nearly been
obtained, this being a condition for the technical in-
spection and further procedures to acquire an oper-
ating permit.
The project investor is DEM.

61
TEŠ's Unit 6, 600 MWConsidering the requirements for increasing electric-
ity production due to ever greater consumption by end
users, the existing units of TEŠ will be upgraded by
additional production capacity – Unit 6 with projected
power of 600 MW. Parallel to that, older units whose
life span is nearing the end or which are technologi-
cally obsolete will be replaced.
The importance of this project not only for the company
but also for Slovenia is demonstrated by the fact that
the project has been included in the National Devel-
opment Project Resolution 2007–2023. Using 4 million
tonnes of coal, TEŠ’s annual electricity output, which
now amounts to 3,600 GWh, would increase to 4,700
GWh if the project is implemented. The fact that the im-
pact on the environment is reduced thanks to the im-
proved effi ciency of modern plants is also signifi cant.
The main advantage of new technology is better utili-
sation of the energy source. Unit 6 will instead of 4 use
3 million tonnes of lignite to produce the same quan-
tity of electricity as generated by Units 1–5 in 2007.
CO2 emissions per unit of energy produced will be re-
duced from 1.2 kg/kWh to 0.85 kg/kWh. Owing to even
more effi cient fl ue gas desulphurisation devices, SO2
emissions will be reduced by two thirds, amounting to
less than 2,000 tonnes per year, whereas NOx emis-
sions will equal no more than one fourth of the cur-
rent fi gure, also not exceeding 2,000 tonnes per year.
The consumption of process water will almost halve,
resulting in smaller fl uctuation of the water level in
Družmir Lake. Noise levels in the environment will go
down by as much as 70%. Moreover, less ash will be
generated per unit of electricity produced.
As the construction will be complex and extensive, it
will be divided into several phases. The construction
work is planned to start with the demolition of the
cooling towers of Units 1–2 and 3 in 2010. Unit 6 is
projected to start operating on a trial basis in 2014.
Planned construction schedule:
• 2009 – construction of the new telecommunications
centre;
• 2010 – demolition of cooling towers 1–2 and 3;
• 2010 – start of Unit 6 construction;
• 2012 – installation of equipment;
• 2014 – trial operation;
• 2015 – regular operation.
The construction of Unit 6 is planned to be fi nanced
from several sources. In September 2007, an agree-
ment was signed with the EIB on a long-term loan of
€ 350 million.
The Offi cial Journal of the EU in March 2008 published
a tender for supply of a fl ue gas desulphurisation de-
vice and in September 2008 a tender for the supply
and installation of a 400 kV GIS switchyard. Tender
documentation for the supply of a cooling water sys-
tem is being prepared – construction and preparatory
work – for the purpose of setting up the cooling tower
and implementing other preparatory work. In June
2008 an agreement was signed on the supply of the
main technological equipment.
The project investor is TEŠ.
Upgrade of TEŠ's Units 4 and 5The installation of two gas turbines at Units 4 and 5 in-
creased the rated capacity of the units by a total of 84
MW. The investment resulted in higher electricity pro-
duction, while consuming the entire planned quantity
of coal, and a lower CO2 emission factor per kWh.
Work on the project to upgrade Units 4 and 5 through
the installation of gas turbines progressed as planned.
AN
NU
AL
RE
PO
RT
HS
E |
BU
SIN
ES
S R
EP
OR
T

62
All project construction work was carried out. The
drive facility was constructed and the machinery in-
stallation was fi nalised within this facility and the elec-
tricity equipment facility. The second gas turbine was
supplied and the installation of machinery, electrical
equipment and gas turbine control was completed. All
the necessary equipment was delivered and installed,
and all electrical installations were completed. The
connecting pipeline was supplied and installed from
the MDS to the gas turbines.
In mid July, a technical inspection was carried out for
the issue of an operating permit for the gas turbine
and the pipelines connected to Unit 4, and for start-up
of a trial run. The operating permit for the two tur-
bines is expected to be acquired in April 2009.
The project investor is TEŠ.
PSP KozjakPSP Kozjak will increase the competitive strength of
DEM and HSE in terms of production and economy.
It will enable the pumping of water during periods of
low electricity prices, and the generation of electricity
during periods of higher electricity prices. The higher
reliability of electricity supply will result in favourable
economic effects for HSE and DEM.
In 2008 various scientifi c bases, which are required to
amend the NSP programme, prepare technical docu-
mentation, and facilitate decisions by project engi-
neers, planners and the investor, were commissioned
and prepared. Scientifi c bases required in connection
with NSP-related documents have been fi nalised.
Additional bases were prepared according to the re-
quirements stated at the public presentation. Also
drafted were impact assessments, an assessment of
the plant's impact on the development of the environ-
ment, a traffi c study, geomechanical conditions, and a
study of the electricity market.
The investment programme, revised and approved by
the Review Committee, was produced based on the
supplemented preliminary design project.
The project investor is DEM.
Middle Sava RiverHSE was appointed concessionaire for the construction
of an HPP on the middle Sava River at the end of 2004.
Nine HPPs are planned to be constructed on the mid-
dle Sava River's section between Tacen and Suhadol
with a total rated power of 304 MW. The purpose of the
project is to boost the utilisation of the Sava River's
hydro potential and increase the power and produc-
tion of the HSE Group.
In 2008 the concession contract continued to be co-
ordinated and further preparatory work was carried
out for research, measurements and the necessary
technical documentation.
The project investor is HSE.
Other investments of the HSE Group
Termoelektrarna TrbovljeIn June 2008 a contract was signed through a tender
on the supply of equipment and services for a loading
station for TET coal. The delivery date for the entire
coal loading station based on the turn-key principle,
including spare parts and successfully completed trial
operation, is within 18 months of signing the contract.
Technologically, this involves a double front-tipping
device and the use of Eas series wagons allowing for
the possibility of wagons fi tted for bottom emptying,
as the feeding chute will be covered by a steel grid.
The bulk of funds allocated in 2008 to investments in
reliable operation went for increasing the power of
the turbo aggregate, retrofi tting of the low-pressure
section, purchase of a Taprogge fi lter for water cool-
ing, replacement of the electrical protection of the 125
MW unit, renovation of the ground foundations of the
large-scale rotating excavator line, the acquisition of
a dust distribution measurement device, and the pur-
chase of the most needed machinery and tools for the
mechanical and electrical service.
Among environmental investments, most funds were
invested in the disposal of waste products – the pro-
gramme for adaptation of the Prapretno non-hazard-
AN
NU
AL
RE
PO
RT
HS
E |
BU
SIN
ES
S R
EP
OR
T

63
ous waste disposal site – to the northern disposal site
and the start of the expansion of this disposal site due
south. The 1st phase was completed, i.e. excavation at
the disposal site, construction work, and drafting of a
safety plan.
Premogovnik VelenjeThe majority of funds were spent on excavation equip-
ment, namely: excavation and directional chain con-
veyor, extraction machine, control excavation equip-
ment, energy and other cables, and a high-pressure
pumping site pump. Two diesel-powered rack-and-
pinion locomotives were purchased, in addition to
two pneumatic shunting trains, tracks and transport
units.

64
2.10 Informatics
UPIS management information systemThe system was upgraded to a new platform, which
brings an updated user interface, shorter system re-
sponse times and more of useful functions. The sys-
tem captures all necessary production unit measure-
ments, including the status of measurement reliability
and point of measurement characteristics, which pro-
vides insight into the state of measurements before
their completion.
ODOS document management systemThe implementation of individual processes, optimis-
ation and improvement of the existing processes, and
general improvements to the system's functionality
continued. These included the opening of the docu-
ment management system to the external internet
environment, subject to embedded restrictions. A
training module was prepared for the purpose of em-
ployee training, and an INFOS services system was set
up. The ODOS system also records all contracts deal-
ing with electricity as well as contractor agreements,
outsourcing agreements and other documents.
ISO processesWithin the framework ISO 9001 standard, all neces-
sary procedures were prescribed in accordance with
the ITIL standard.
System softwareSystem capacities were upgraded, facilitating the in-
stallation of new servers, the capacity of which can be
increased on-line if necessary. Among other things, do-
main servers were upgraded and secure internet e-mail
access provided. A common access point was estab-
lished for the reporting of hardware and software mal-
functions. The management of changes, confi gurations
and updates of the system software and applications is
conducted using workfl ows in the ODOS environment.
The IT infrastructure management application was
upgraded with the possibility of monitoring and re-
porting daily, monthly and yearly availability of inter-
net access, functioning of e-mail, access to databases
and wireless network connections.
2.11 Financial operations
Main activitiesIn 2008 the fi nancial operations of the HSE Group were
primarily aimed at:
• ensuring solvency and optimising liquidity of the
HSE Group,
• implementing fi nancial policy in relation to banks
and other fi nancial institutions,
• managing related risks.
Ensuring solvencyThe basic function of fi nancial operations is to en-
sure solvency of the HSE Group and, consequently,
undisturbed performance of other business activi-
ties. In 2008 short-term solvency of the HSE Group
was ensured through the monitoring and optimisa-
tion of short-term cash surpluses and defi cits of HSE
Group companies. In addition, cash fl ows were man-
aged through liquidity reserves in the form credit lines
granted by domestic and foreign banks, diversifi cation
of investments and liabilities, maturity matching of
receivables and liabilities, and consistent collection of
receivables.
Ensuring necessary fi nancial sourcesIn 2008 both the controlling company and the entire
HSE Group were very active in the fi eld of fi nancing,
particularly as regards securing necessary fi nancial
sources under favourable terms for the implementa-
tion of investments, including the investments in the
construction of HPPs on the lower Sava River. Group
companies borrow funds independently in accordance
with the conditions and procedures laid down in the
Decree on the Terms and Conditions and Methods of
Borrowing under Article 87 of the Public Finance Act.
The HSE Group carefully examines various fi nancing
options, and by choosing the most favourable fi nan-
cial sources reduces the amount of necessary invest-
ments and the costs of fi nancing. In 2008 HSE and the
AN
NU
AL
RE
PO
RT
HS
E |
BU
SIN
ES
S R
EP
OR
T

65
European Investment Bank (EIB) signed a € 74 million
loan agreement for the fi nancing of the construction
of HPP Blanca and HPP Krško.
At the end of the fi nancial year 2008, the HSE Group’s
fi nancial liabilities totalled € 335.8 million, of which
long-term fi nancial liabilities accounted for 86% and
short-term fi nancial liabilities for 14%. The long-term
fi nancing to assets ratio of the HSE Group stood at
108%. Loans were taken out in the national currency
and were thus not exposed to the currency risk. The
majority of the loans have a variable interest rate.
Management of fi nancial risksIn the risk management process, particular attention
was paid to the interest rate risk, credit risk, currency
risk and solvency risk. Liquidity risk was effectively
managed by monitoring and optimising short-term
cash surpluses and defi cits of HSE Group companies.
As part of the interest rate risk management, deriva-
tive fi nancial instruments offered by banks were used
to change a portion of variable interest rates on long-
term loans into fi xed interest rates. Due to changes
in the money market brought about by the global fi -
nancial crisis, most interest rate hedging contracts
were cancelled early in 2008. The company's largest
net currency exposure is the exposure to the euro.
The volume of transactions in other currencies is
negligible, so the currency risk is very small. Interest
rate and currency risk are also managed through the
constant monitoring of developments in the European
and global money market.
Current
Long-term
100
80
60
40
20
0
Balance sheet structure of the HSE Group and the controlling company as at 31/12/2008
HSE group
Assets Liabilities
18 %
82 %
12 %
88 %
AN
NU
AL
RE
PO
RT
HS
E |
BU
SIN
ES
S R
EP
OR
T

66
100
80
60
40
20
0
Current
Long-term
Controlling company
Assets Liabilities
Capital adequacyEnsuring capital adequacy is one the most important
responsibilities of managers of HSE Group companies.
Information from the fi nancial reports of the company
HSE and the HSE group (presented below) shows that
HSE Group companies complied with capital adequacy
requirements as the amount of their capital was ade-
quate considering the volume and type of transactions
and the risks to which they are exposed in executing
those transactions.
The HSE Group also acknowledges the fact that non-
fi nancial elements – the so-called soft factors, such
as staff, information etc. – are increasingly being
treated as part of companies’ capital. This, in addi-
tion to fi nancially responsible management, requires
managers of HSE Group companies to pursue socially
responsible management as far as capital adequacy
is concerned.
Debt ratioThe debt ratio is an important indicator of the busi-
ness and fi nancial situation. The analysis of the fi -
nancial position of HSE Group companies reveals that
from the perspective of debt the business and fi nan-
cial position of HSE Group companies is under control,
with the debt ratios not exceeding the thresholds of
safe operation.
The share of debt (as per long-term and short-term li-
abilities presented in the balance sheet) in the parent
company’s and the Group’s fi nancing amounts to 30%.
In the debt structure of the parent company and the
Group, fi nancial liabilities account for 51% and 69%,
respectively. A more detailed structure of liabilities
is presented in the fi nancial report of the controlling
company HSE and the HSE Group.
Goals achievedThe analysis of fi nancial operations of HSE Group com-
panies in 2008 reveals that all goals were achieved as
there were no problems with solvency and there were
suffi cient fi nancial assets to implement the invest-
ments. What is more, surplus cash provided adequate
return while the principles of safety and diversifi cation
were also observed.
18 %
82 %
15 %
85 %
AN
NU
AL
RE
PO
RT
HS
E |
BU
SIN
ES
S R
EP
OR
T

67
HSE Group’s equity-to-debt ratio
2008
2007
30 %
32 %
31 %
37 %
70 %
68 %
69 %
63 %
Equity
Equity
Operating liabilities
Operating liabilities
Liabilities
Liabilities
Financial liabilities
Financial liabilities
AN
NU
AL
RE
PO
RT
HS
E |
BU
SIN
ES
S R
EP
OR
T
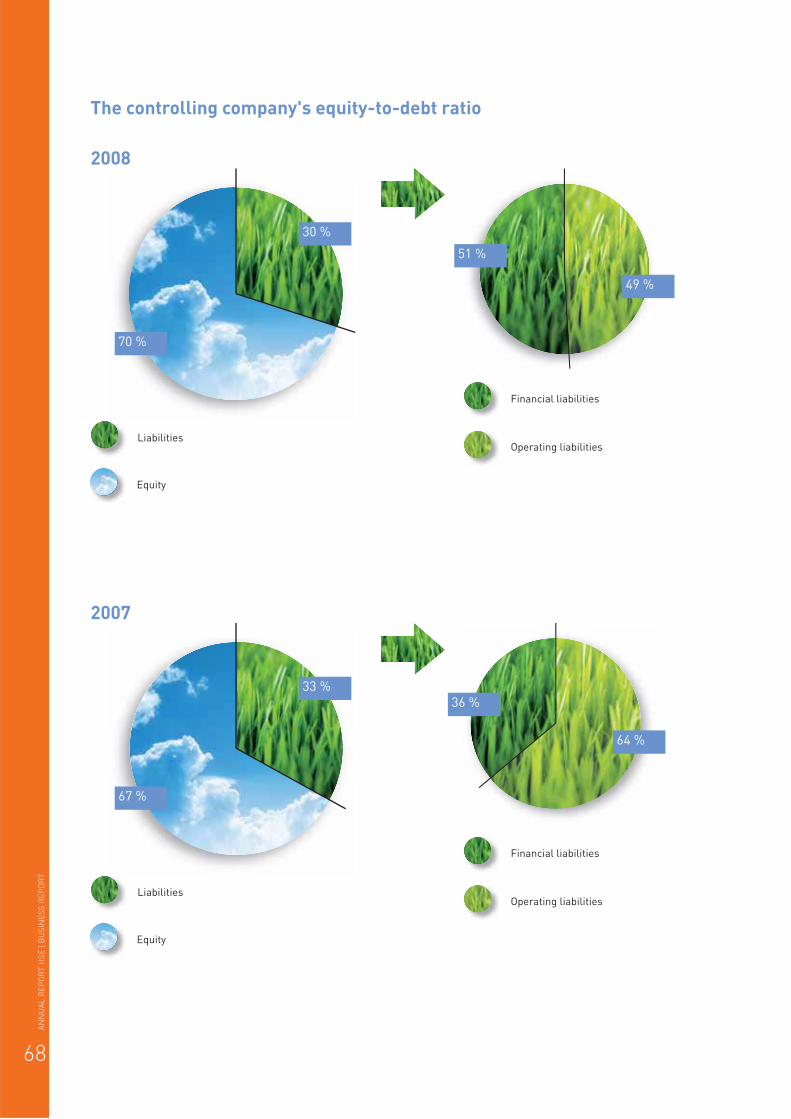
68
The controlling company's equity-to-debt ratio
2008
2007
30 %
33 %
49 %
36 %
70 %
67 %
51 %
64 %
Equity
Equity
Operating liabilities
Operating liabilities
Liabilities
Liabilities
Financial liabilities
Financial liabilities
AN
NU
AL
RE
PO
RT
HS
E |
BU
SIN
ES
S R
EP
OR
T

69
The value of assets and total equity as at 31/12/2008 and operating results of HSE Group companies in 2008
HOLDING SLOVENSKE ELEKTRARNE d.o.o.
Assets in € 1,158,781,276
Total equity in € 798,817,478
Net profi t or loss in € 53,756,215
DRAVSKE ELEKTRARNE MARIBOR d.o.o.
HSE's stake 100%
Assets in € 520,780,642
Total equity in € 502,691,265
Net profi t or loss in € 15,442,181
SOŠKE ELEKTRARNE NOVA GORICA d.o.o.
HSE's stake 100%
Assets in € 256,019,321
Total equity in € 162,448,132
Net profi t or loss in € 10,079,588
HIDROELEKTRARNE NA SPODNJI SAVI, d.o.o.
Direct HSE's stake 51%
Indirect HSE's stake 84.6%
Assets in € 205,185,396
Total equity in € 187,751,171
Net profi t or loss in € 939,971
TERMOELEKTRARNA ŠOŠTANJ d.o.o.
HSE's stake 100%
Assets in € 404,351,280
Total equity in € 258,858,911
Net profi t or loss in € 18,037,177
TERMOELEKTRARNA TRBOVLJE d.o.o.
HSE's stake 81.33%
Assets in € 57,091,946
Total equity in € 34,101,843
Net profi t or loss in € 2,169,256
PREMOGOVNIK VELENJE d.d.
HSE's stake 77.73%
Assets in € 208,113,705
Total equity in € 109,714,170
Net profi t or loss in € 403,385
HSE INVEST d.o.o.
Direct HSE's stake 25%
Indirect HSE's stake 75%
Assets in € 1,418,535
Total equity in € 530,205
Net profi t or loss in € 164,055
PPE d.o.o., KIDRIČEVO
HSE's stake 45%
Assets in € 1,227,583
Total equity in € 1,223,482
Net profi t or loss in € 14,840
ABROAD
SLOVENIA
HSE ITALIA S.r.l.
HSE's stake 100%
Assets in € 52,690
Total equity in € 46,247
Net profi t or loss in € 5,238
HSE ADRIA d.o.o.
HSE's stake 100%
Assets in € 4,901,281
Total equity in € 684,919
Total equity in HRK 5,037,925
Net profi t or loss in € 361,419
Net profi t or loss in HRK 2,654,934
TOPLOFIKATSIA - RUSE AD
HSE's stake 51%
Assets in € 59,006,962
Total equity in € 24,094,819
Total equity in BGN 47,124,646
Net profi t or loss in € 1,313,316
Net profi t or loss in BGN 2,568,583
HSE HUNGARY Kft.
HSE's stake 100%
Assets in € 8,100,934
Total equity in € 5,466,448
Total equity in HUF 1,457,901,661
Net profi t or loss in € 506,220
Net profi t or loss in HUF 131,596,475
HSE BULGARIA EOOD
HSE's stake 100%
Assets in € 484,969
Total equity in € 443,951
Total equity in BGN 868,280
Net profi t or loss in €* -61,485
Net profi t or loss in BGN -120,256
HSE BALKAN ENERGY d.o.o.
HSE's stake 100%
Assets in € 989,485
Total equity in € 908,190
Total equity in RSD 81,166,543
Net profi t or loss in € 1,637
Net profi t or loss in RSD 138,199
HIDRO MOĆNOST MAKEDONIJA d.o.o.
HSE's stake 33%
Assets in € 5,067
Total equity in € 5,067
Total equity in MKD 307,062
Net profi t or loss in €** -
Net profi t or loss in MKD -
* HSE Bulgaria EOOD was not operational in 2008.
** Hidro Moćnost Makedonija d.o.o. has only just been
established and was not operational in 2008.
AN
NU
AL
RE
PO
RT
HS
E |
BU
SIN
ES
S R
EP
OR
T

70
2.11.1 The controlling company’s ratios
EQUITY FINANCING RATE 31/12/2008 31/12/2007
1. Liabilities in € 1,158,781,276 1,141,859,460
2. Equity in € 798,817,478 757,166,486
Equity fi nancing rate = 2 / 1 68.94 66.31
At the end of 2008, the company’s equity amounted to 69% of its total liabilities. Compared with the end of 2007, the
equity fi nancing rate increased mainly due to higher net profi t for the year 2008.
LONG-TERM FINANCING RATE 31/12/2008 31/12/2007
1. Equity in € 798,817,478 757,166,486
2. Long-term liabilities in € 161,302,465 156,475,386
3. Provisions and Long-term accrued costs and deferred revenue in € 19,175,683 7,943,631
4. Total (1 + 2 + 3) 979,295,626 921,585,503
5. Liabilities in € 1,158,781,276 1,141,859,460
Long-term fi nancing rate = 4 / 5 84.51 80.71
The company fi nanced 85% of its assets from long-term sources and 15% from short-term sources. Compared with
the end of 2007, the long-term fi nancing rate increased by 4 percentage points due to an increase in equity and long-
term liabilities and a decrease in short-term fi nancial liabilities.
OPERATING FIXED ASSETS RATE 31/12/2008 31/12/2007
1. Property, plant and equipment in € 6,774,756 127,881,827
2. Intangible assets and Long-term accrued revenue and deferred costs in € 8,178,427 8,430,458
3. Total fi xed assets at carrying amount in € (1 + 2) 14,953,183 136,312,285
4. Assets in € 1,158,781,276 1,141,859,460
Operating fi xed assets rate = 3 / 4 1.29 11.94
The share of property, plant and equipment and intangible assets in the company's assets amounts to 1% and has
decreased compared with the end of 2007 due to the transfer of the joint venture for the construction of HPPs on the
lower Sava River to the new company HESS. All of the company's investments in the joint venture were transferred
to long-term investments.
LONG-TERM ASSETS RATE 31/12/2008 31/12/2007
1. Property, plant and equipment in € 6,774,756 127,881,827
2. Intangible assets and Long-term accrued revenue and deferred costs in € 8,178,427 8,430,458
4. Long-term investments in € 929,662,269 819,063,439
5. Long-term operating receivables in € 2,715,058 125,188
6. Total (1 + 2 + 4 + 5) 947,330,510 955,500,912
7. Assets in € 1,158,781,276 1,141,859,460
Long-term assets rate = 6 / 7 81.75 83.68
The company’s long-term assets account for 82% of its total assets. The ratio decreased compared with the end of
2007 mainly due to an increase in current assets.
AN
NU
AL
RE
PO
RT
HS
E |
BU
SIN
ES
S R
EP
OR
T

71
EQUITY TO FIXED ASSETS RATIO 31/12/2008 31/12/2007
1. Equity in € 798,817,478 757,166,486
2. Property, plant and equipment in € 6,774,756 127,881,827
3. Intangible assets and Long-term accrued revenue and deferred costs in € 8,178,427 8,430,458
4. Total fi xed assets at carrying amount in € (2 + 3) 14,953,183 136,312,285
Equity to operating fi xed assets ratio = 1 / 4 53.42 5.55
The ratio represents the relationship between equity and fi xed assets. The ratio stood at 53 at the end of 2008,
meaning that all of the company’s most illiquid assets were fi nanced from equity. The ratio increased compared
with 2007 due to the transfer of the joint venture for the construction of HPPs on the lower Sava River to the new
company HESS.
ACID TEST RATIO 31/12/2008 31/12/2007
1. Cash in € 6,374,755 3,839,722
2. Short-term investments in € 68,242,000 16,909,850
3. Total liquid assets in € (1 + 2) 74,616,755 20,749,572
4. Short-term liabilities in € 173,979,273 214,764,190
Acid test ratio = 3 / 4 0.43 0.10
The acid test ratio describes the relationship between liquid assets and short-term liabilities. At the end of 2008,
it stood at 0.4, meaning that almost half of the company’s short-term liabilities were covered by liquid assets. The
ratio improved considerably from 2007 thanks to an increase in short-term investments and decrease in short-term
liabilities.
QUICK RATIO 31/12/2008 31/12/2007
1. Cash in € 6,374,755 3,839,722
2. Short-term investments in € 68,242,000 16,909,850
3. Short-term operating receivables in € 127,497,862 155,083,914
4. Total (1 + 2 + 3) 202,114,617 175,833,486
5. Short-term liabilities in € 173,979,273 214,764,190
Quick ratio = 4 / 5 1.16 0.82
The quick ratio stood at 1.2 at the end of 2008, meaning that the company fi nances a part of its current assets from
long-term liabilities. The ratio improved compared with 2007.
CURRENT RATIO 31/12/2008 31/12/2007
1. Current assets in € 202,115,396 175,916,067
2. Short-term accrued revenue and deferred costs in € 5,146,178 6,082,027
3. Total (1 + 2) 207,261,574 181,998,094
4. Short-term liabilities in € 173,979,273 214,764,190
Current ratio = 3 / 4 1.19 0.85
The current ratio amounted to 1.2 at the end of 2008, which indicates the company’s solvency as it was able to cover
all its short-term liabilities by its current assets.
AN
NU
AL
RE
PO
RT
HS
E |
BU
SIN
ES
S R
EP
OR
T

72
OPERATING EFFICIENCY RATIO 2008 2007
1. Operating revenue in € 820,305,717 923,302,179
2. Costs of goods, materials and services in € 766,089,817 895,889,987
3. Labour costs in € 6,545,268 5,950,139
4. Write-downs in value in € 1,493,117 16,985,578
5. Other operating expenses in € 11,050,720 1,993,478
6. Total operating expenses in € (2 + 3 + 4 + 5) 785,178,922 920,819,182
Operating effi ciency ratio = 1 / 6 1.04 1.00
The company's operating revenue exceeded its operating expenses by 4% in 2008. The ratio has improved compared
with 2007 as there was a bigger decrease in operating expenses than in operating revenue.
NET RETURN ON EQUITY 2008 2007
1. Net profi t or loss for the accounting period in € 53,756,215 12,411,197
2. Average equity in € 777,991,982 736,094,110
Net return on equity = 1 / 2 0.07 0.02
In 2008 the company generated € 7 of net profi t per € 100 of equity invested. The ratio increased by 5 percentage
points from 2007, mostly due to an increase in the company's net profi t or loss.
TOTAL FINANCIAL LIABILITIES / EBITDA 31/12/2008 31/12/2007
1. Long-term fi nancial liabilities in € 161,267,186 96,929,963
2. Short-term fi nancial liabilities in € 9,811,956 35,374,714
3. Total fi nancial liabilities in € (1 + 2) 171,079,142 132,304,677
4. Operating profi t or loss in € 35,126,795 2,482,997
5. Depreciation and amortisation in € 1,458,542 2,236,463
6. EBITDA in € (4 + 5) 36,585,337 4,719,460
Total fi nancial liabilities / EBITDA = 3 / 6 4.68 28.03
The ratio shows the relationship between the company's debt and EBITDA. The ratio improved considerably compared
with the end of 2007 due to higher operating profi t or loss for the year 2008
TOTAL FINANCIAL LIABILITIES / EQUITY 31/12/2008 31/12/2007
1. Long-term fi nancial liabilities in € 161,267,186 96,929,963
2. Short-term fi nancial liabilities in € 9,811,956 35,374,714
3. Total fi nancial liabilities in € (1 + 2) 171,079,142 132,304,677
4. Equity in € 798,817,478 757,166,486
Total fi nancial liabilities / Equity = 3 / 4 0.21 0.17
The ratio shows the relationship between the company's debt and equity. The ratio increased compared with the end
of 2007 due to a higher indebtedness of the company.
AN
NU
AL
RE
PO
RT
HS
E |
BU
SIN
ES
S R
EP
OR
T

73
EBITDA / FINANCE EXPENSES FOR LOANS 2008 2007
1. Operating profi t or loss in € 35,126,795 2,482,997
2. Depreciation and amortisation in € 1,458,542 2,236,463
3. EBITDA in € (1 + 2) 36,585,337 4,719,460
4. Finance expenses for loans in € 7,993,672 5,880,334
EBITDA / Finance expenses for loans = 3 / 4 4.58 0.80
The ratio increased from 2007 mainly thanks to the higher operating profi t or loss of the company.
TOTAL FINANCIAL LIABILITIES / ASSETS 31/12/2008 31/12/2007
1. Long-term fi nancial liabilities in € 161,267,186 96,929,963
2. Short-term fi nancial liabilities in € 9,811,956 35,374,714
3. Total fi nancial liabilities in € (1 + 2) 171,079,142 132,304,677
4. Assets in € 1,158,781,276 1,141,859,460
Total fi nancial liabilities / Assets = 3 / 4 0.15 0.12
The total fi nancial liabilities to assets ratio increased somewhat relative to the end of 2007 because the company took
out an additional long-term loan of € 74 million in 2008.
2.11.2 The HSE Group’s ratios
EQUITY FINANCING RATE 31/12/2008 31/12/2007
1. Liabilities in € 1,747,710,783 1,628,551,663
2. Equity in € 1,127,608,615 1,037,374,202
Equity fi nancing rate = 2 / 1 64.52 63.70
At the end of 2008, the Group’s equity amounted to 65% of its total liabilities. Compared with the end of 2007, the
equity fi nancing rate increased mainly due to higher net profi t for the year 2008 and lower short-term liabilities to
banks.
LONG-TERM FINANCING RATE 31/12/2008 31/12/2007
1. Equity in € 1,127,608,615 1,037,374,202
2. Long-term liabilities in € 292,685,262 244,554,162
3. Provisions and Long-term accrued costs and deferred revenue in € 118,046,869 95,148,216
4. Total (1 + 2 + 3) 1,538,340,746 1,377,076,580
5. Liabilities in € 1,747,710,783 1,628,551,663
Long-term fi nancing rate = 4 / 5 88.02 84.56
The Group fi nanced 88% of its assets from long-term sources and 12% from short-term sources. Compared with the
end of 2007, the long-term fi nancing rate increased by 4 percentage points. At the end of 2008, the Group improved
the quality of fi nancing sources, with short-term liabilities to banks decreasing by 45% and long-term liabilities to
banks increasing by 29% compared with the end of 2007.
AN
NU
AL
RE
PO
RT
HS
E |
BU
SIN
ES
S R
EP
OR
T

74
OPERATING FIXED ASSETS RATE 31/12/2008 31/12/2007
1. Property, plant and equipment in € 1,301,732,514 1,189,336,408
2. Intangible assets and Long-term accrued revenue and deferred costs in € 48,274,010 27,874,726
3. Total fi xed assets at carrying amount in € (1 + 2) 1,350,006,524 1,217,211,134
4. Assets in € 1,747,710,783 1,628,551,663
Operating fi xed assets rate = 3 / 4 77.24 74.74
The share of property, plant and equipment and intangible assets in the Group's total assets stood at 77% at the end
of 2008. The operating fi xed assets rate increased compared with the end of 2007 as a result of higher investments in
property, plant and equipment, intangible assets and long-term investments.
LONG-TERM ASSETS RATE 31/12/2008 31/12/2007
1. Property, plant and equipment in € 1,301,732,514 1,189,336,408
2. Intangible assets and Long-term accrued revenue and deferred costs in € 48,274,010 27,874,726
3. Investment property in € 922,758 936,992
4. Long-term investments in € 51,541,008 49,870,537
5. Long-term operating receivables in € 3,131,217 692,280
6. Total (1 + 2 + 3 + 4 + 5) 1,405,601,507 1,268,710,943
7. Assets in € 1,747,710,783 1,628,551,663
Long-term assets rate = 6 / 7 80.43 77.90
The Group’s total long-term assets account for 80% of its total assets. The rate increased relative to 2007, mainly due
to an increase in property, plant and equipment, intangible assets and long-term investments.
EQUITY TO FIXED ASSETS RATIO 31/12/2008 31/12/2007
1. Equity in € 1,127,608,615 1,037,374,202
2. Property, plant and equipment in € 1,301,732,514 1,189,336,408
3. Intangible assets and Long-term accrued revenue and deferred costs in € 48,274,010 27,874,726
4. Total fi xed assets at carrying amount in € (2 + 3) 1,350,006,524 1,217,211,134
Equity to operating fi xed assets ratio = 1 / 4 0.84 0.85
The ratio represents the relationship between equity and fi xed assets. The ratio stood at 0.8 at the end of 2008,
meaning that the majority of the Group’s most illiquid assets were fi nanced from equity.
ACID TEST RATIO 31/12/2008 31/12/2007
1. Cash in € 13,453,168 15,297,292
2. Short-term investments in € 116,375,273 103,505,751
3. Total liquid assets in € (1 + 2) 129,828,441 118,803,043
4. Short-term liabilities in € 194,052,222 241,650,620
Acid test ratio = 3 / 4 0.67 0.49
The acid test ratio describes the relationship between liquid assets and short-term liabilities. At the end of 2008,
it stood at 0.7, meaning that almost three quarters of the company’s short-term liabilities were covered by liquid
assets. The ratio improved compared with the end of 2007.
AN
NU
AL
RE
PO
RT
HS
E |
BU
SIN
ES
S R
EP
OR
T

75
QUICK RATIO 31/12/2008 31/12/2007
1. Cash in € 13,453,168 15,297,292
2. Short-term investments in € 116,375,273 103,505,751
3. Short-term operating receivables in € 153,746,979 180,592,264
4. Total (1 + 2 + 3) 283,575,420 299,395,307
5. Short-term liabilities in € 194,052,222 241,650,620
Quick ratio = 4 / 5 1.46 1.24
The quick ratio stood at 1.5 at the end of 2008, meaning that in addition to inventories the Group also fi nances other
current assets from long-term sources. The ratio improved compared with the end of 2007.
CURRENT RATIO 31/12/2008 31/12/2007
1. Current assets in € 316,850,737 328,928,916
2. Short-term accrued revenue and deferred costs in € 5,958,343 6,944,133
3. Total (1 + 2) 322,809,080 335,873,049
4. Short-term liabilities in € 194,052,222 241,650,620
Current ratio = 3 / 4 1.66 1.39
The current ratio amounted to 1.7 at the end of 2008, which is an indication of the Group's solvency considering that
short-term liabilities were fully covered by current assets. The ratio improved compared with the end of 2007.
OPERATING EFFICIENCY RATIO 2008 2007
1. Operating revenue in € 903,420,050 1,011,617,008
2. Costs of goods, materials and services in € 508,120,674 681,696,549
3. Labour costs in € 137,687,403 123,900,511
4. Write-downs in value in € 79,680,448 96,561,644
5. Other operating expenses in € 61,159,605 42,958,501
6. Total operating expenses in € (2 + 3 + 4 + 5) 786,648,130 945,117,205
Operating effi ciency ratio = 1 / 6 1.15 1.07
The Group's operating revenue exceeded its operating expenses by 15% in 2008. Because the decrease in expenses
was higher than the decrease in revenue, the ratio increased.
NET RETURN ON EQUITY 2008 2007
1. Net profi t or loss for the accounting period in € 74,515,214 84,071,741
2. Average equity in € 1,082,491,409 915,450,501
Net return on equity = 1 / 2 0.07 0.09
In 2008 the Group generated € 7 of net profi t per € 100 of equity invested. The ratio increased relative to 2007, mostly
due to an increase in the Group's average equity in 2008.
AN
NU
AL
RE
PO
RT
HS
E |
BU
SIN
ES
S R
EP
OR
T

76
TOTAL FINANCIAL LIABILITIES / EBITDA 31/12/2008 31/12/2007
1. Long-term fi nancial liabilities in € 290,364,661 224,606,377
2. Short-term fi nancial liabilities in € 45,481,809 82,545,085
3. Total fi nancial liabilities in € (1 + 2) 335,846,470 307,151,462
4. Operating profi t or loss in € 116,771,920 66,499,803
5. Depreciation and amortisation in € 74,358,495 72,040,630
6. EBITDA in € (4 + 5) 191,130,415 138,540,433
Total fi nancial liabilities / EBITDA = 3 / 6 1.76 2.22
The ratio shows the relationship between the Group’s debt and EBITDA. The ratio improved compared with the end of
2007 due to higher operating profi t or loss for the year 2008.
TOTAL FINANCIAL LIABILITIES / EQUITY 31/12/2008 31/12/2007
1. Long-term fi nancial liabilities in € 290,364,661 224,606,377
2. Short-term fi nancial liabilities in € 45,481,809 82,545,085
3. Total fi nancial liabilities in € (1 + 2) 335,846,470 307,151,462
4. Equity in € 1,127,608,615 1,037,374,202
Total fi nancial liabilities / Equity = 3 / 4 0.30 0.30
Although the Group's debt ratio was higher at the end of 2008, the share of total fi nancial liabilities in equity was on
a par with the previous year because the Group's equity also increased, mainly thanks to the net profi t for the year
2008.
EBITDA / FINANCE EXPENSES FOR LOANS 2008 2007
1. Operating profi t or loss in € 116,771,920 66,499,803
2. Depreciation and amortisation in € 74,358,495 72,040,630
3. EBITDA in € (1 + 2) 191,130,415 138,540,433
4. Finance expenses for loans in € 16,771,877 12,492,692
EBITDA / Finance expenses for loans = 3 / 4 11.40 11.09
The ratio increased compared with the end of 2007 mainly as a result of higher operating profi t or loss.
TOTAL FINANCIAL LIABILITIES / ASSETS 31/12/2008 31/12/2007
1. Long-term fi nancial liabilities in € 290,364,661 224,606,377
2. Short-term fi nancial liabilities in € 45,481,809 82,545,085
3. Total fi nancial liabilities in € (1 + 2) 335,846,470 307,151,462
4. Assets in € 1,747,710,783 1,628,551,663
Total fi nancial liabilities / Assets = 3 / 4 0.19 0.19
Although the Group's debt ratio was higher at the end of 2008, the share of total fi nancial liabilities in assets was
similar to the one at the end of 2007.
The notes to the items constituting the ratios are explained in more detail in the fi nancial report of the company HSE
and the HSE Group.
AN
NU
AL
RE
PO
RT
HS
E |
BU
SIN
ES
S R
EP
OR
T

77
was the volume of PV's lignite stocks in TJ as at 31/12/2008.
At the HSE Group, we know that risk management is crucial
to successful operation. One of the risks is associated with
the extraction of lignite, which is used as a primary fuel
in the production of electricity at TEŠ. To control the risk
of lignite production failures, the HSE Group established
appropriate stocks.
2.12 Risk management
In the time when both the banking and the real sec-
tor are dealing with the consequences of the fi nancial
crisis, the HSE Group devotes even more attention to
risk management. In 2008 we therefore continued the
process of comprehensive risk management by:
• appropriately managing all key risks identifi ed,
• identifying new risks.
The HSE Group encounters risks in all areas of its op-
eration, particularly in electricity production and trad-
ing and, consequently, in the area of fi nance. Risks can
be classifi ed into the following broad categories:
• market risks,
• quantity risk,
• fi nancial risks,
• human resources risk,
• information system risks and
• regulatory risks.
Based on the analysis of the HSE Group's operations
in 2008 we estimate that the risks were successfully
managed.
Market risksThe HSE Group is mainly exposed to market risks,
which mostly arise from uncertainties about changes
in the prices of electricity, cross-border transmission
capacities, CO2 emission permits and natural gas.
In 2008 the controlling company HSE continued to de-
velop its price and market risk management model. The
all year round optimisation of the Group’s production
units was carried out on a daily basis, and the Group's
open position, the company's trading activities, price
fl uctuations and volatility in wholesale electricity mar-
kets, CO2 emission coupons, other energy products and
the exposure of the company’s trading portfolio to mar-
ket risks were monitored in terms of value and quan-
tity. To measure the exposure of the company’s trading
portfolio to market risks, standard risk assessments
methods, such as the Monte Carlo VaR method, were
used with a 95% confi dence level, based on which the
risk value of the portfolio and year-on-year changes in
probability distribution of the portfolio’s value were ob-
served. The portfolio’s sensitivity to price changes was
monitored using the delta/gamma analysis.
In 2008 all models supporting the calculation of HSE's
exposure were adjusted so that they could be used
over a longer period. Production optimisation models,
price curve models and the model for monitoring the
exposure of the CO2 emission coupon trading portfolio
can now be used for periods in which the company's
energy sales are conducted.
In the area of optimisation models, methodological
improvements to their performance were carried out,
which enabled a better-quality simulation of the ac-
tual operation of turbines, thus contributing to a more
accurate picture of the company's exposure, espe-
cially at the level of daily and hourly time intervals. In
the area of production, an optimisation model of the
simulation of the PSP's operation was prepared. To be
able to estimate Slovenia's exposure more accurately,
a price optimisation model of the Slovene electricity
market was prepared, which serves as a basis for the
model of Slovenia's long-term price curve.
The company's exposure analysis was adjusted to re-
fl ect the updated structure of individual trading port-
3,700
AN
NU
AL
RE
PO
RT
HS
E |
BU
SIN
ES
S R
EP
OR
T

78
folios. In addition, the scope of stress testing was ex-
panded in 2008. Stress testing is a risk management
tool which is used in particular to analyse a potential
negative impact of an extreme change in the value of
a variable or a group of variables on the company’s
operations.
In the previous year, price risks were also controlled
by means of hedging a large share of the trading vol-
ume by a counter-transaction, by purchasing deriva-
tives and by introducing new technologies, which were
adopted as part of the development plan of the HSE
Group and outline measures for improving environ-
ment protection and people's health.
Quantity risksQuantity risk comprises the risks arising from produc-
tion uncertainty, consumption uncertainty and energy
supply uncertainty.
Production uncertainty is mainly associated with the
question whether energy will be available on the mar-
ket. It is also linked to operational risk, which aims to
assess the probability and effect of a turbine or any oth-
er production unit failing. Particularly important is the
impact of uncertain hydrology because a large share of
electricity is supplied from hydropower plants.
Consumption uncertainty arises from the impact of
weather and temperature, load fl exibility, seasonal
cycles and impact of the recession.
Energy supply uncertainty arises from random fail-
ures of power lines and other equipment, or from
interventions by the power transmission network op-
erator due to transmission line overload.
Electricity production is exposed to the following risks
of deviation from the planned supply:
• the risk of non-supply of electricity from hydropower
plants due to hydrological and meteorological con-
ditions;
• the risk of non-supply of electricity from thermal
power plants due to outages or technological and
ecological limitations of production;
• the risk of non-supply of coal from the Velenje coal
mine due to production hold-ups caused by outages,
failures of technological systems, accidents or other
disturbances;
• in periods of increased TPP production, economic
limitations or any changes in the overall method
of CO2 tax payments and in trading in CO
2 emission
coupons should also be considered.
In 2008 the production at hydropower plants within the
HSE Group was 375 GWh higher than planned, where-
as at TEŠ the plan was exceeded by 158 GWh and at
TET by 21 GWh. The deviations of actual daily fl ow of
water from daily forecasts are also refl ected in devia-
tions of hydropower production from the forecasted
schedules. To the extent possible, the deviations were
balanced out by adjusting production at TPP and by
increasing sales and purchases.
At the thermal power plants, a 2 to 4% unexpected
production outage has to be considered in addition to
the planned shutdowns due to overhauls. This per-
centage corresponds to ten to twelve daily production
outages, which can be offset by starting up gas-fi red
power plants, but only for short periods. Alternatively,
to the extent possible, outages can be offset by real-
locating the use of HPP accumulation and purchasing
electricity on the market. In 2008 TEŠ's unexpected
production outage stood at 1%. This unfavourable out-
come is primarily the result of Unit 3 breaking down.
TET's outage rate stood at 2.4%.
Thanks to a less complex production process, HPPs
are more reliable. The unexpected production outage
at DEM stood at 1.2%, at SENG at 2.4% and at HPP
Boštanj at 33.8%, in the latter case mainly due to the
failure of generator 2.
Coal supply may be interrupted due to breakdowns of
technological systems and accidents or other distur-
bances affecting the extraction of coal. According to an
assessment of the coal mine’s technical management,
the majority of potential outages could be remedied
without signifi cant production interruptions, and rare-
ly would such breakdowns result in 14 to 20 days of
interrupted supply. There is relatively low probability
of a major breakdown that would require a six-month
shutdown. Based on the above assessment, minimum
joint coal stocks of the HSE Group have been deter-
mined. They stand at 3,000 TJ (February–October) and
4,000 TJ (November–January).
The HSE Group's electricity production is managed
from the control centre in Maribor. The main objec-
tives of production management are as follows:
AN
NU
AL
RE
PO
RT
HS
E |
BU
SIN
ES
S R
EP
OR
T

79
• to ensure minimum deviations of production and of
the balancing group from schedules,
• to ensure an optimal distribution of power between
available turbines,
• to promptly activate reserve capacities in emergency
situations.
The quality of the management of the HSE balanc-
ing group is refl ected in the minimisation of devia-
tion costs thanks to the deviations of balancing group
members being reduced through the adjustment of
their production. In 2008 the HSE balancing group
was comprised of the Group's production units, in-
cluding small HPPs, PV and balancing subgroups of
four distribution companies, Elektroprodaja and a few
smaller consumers. The balancing group’s deviations
include all production and consumption deviations
from forecasted schedules. The HSE Group estimates
that the management of the HSE balancing group was
successful in 2008.
Financial risksAt the HSE Group, special attention is given to the fi -
nancial risks to which the Group is exposed in its ope-
rations and to adopting measures for managing such
risks.
Solvency risk is the risk associated with insuffi cient
fi nancial sources and the resulting inability of the
company to meet its commitments in due time. In the
situation of the fi nancial crisis, the solvency risk is a
risk the management of which is one of the most im-
portant for the company. Short-term solvency is en-
sured by continuous matching and planning of cash
fl ows. The HSE Group has established the monitoring
and optimisation of short-term cash surpluses and
defi cits of group companies. The above system, the
diversifi cation of investments and liabilities, matu-
rity matching of receivables and liabilities, consistent
collection of receivables and a liquidity reserve in the
form of credit lines granted by domestic and foreign
banks facilitate the management of cash fl ows, which
ensures the company’s and the Group’s payment ca-
pacity and a low level of short-term solvency risk.
Moreover, good access to fi nancing and markets, a
high credit rating of the company thanks to its suc-
cessful operations and the ability to keep generating
cash fl ows from operating activities ensure that the
solvency risk is estimated as moderate.
In light of the conditions in the fi nancial markets, the
company also began to manage the risks of fi nancial
indiscipline of banks and fi nancial institutions arising
from investing of surplus cash. The risk is managed
by observing the principle of dispersing deposits with
individual banks and by monitoring information on the
current operations of banks with which the company
occasionally deposits surplus cash.
The solvency risk is reduced by the high credit rating
of the company which stems from its successful oper-
ations and by its ability to keep generating cash fl ows
from operating activities.
Credit risk represents the possibility that receivables
will be settled only in part or will not be settled at all.
The HSE Group manages credit risk through a thor-
ough verifi cation of customers' credit ratings, setting
of limits, monitoring and managing of the credit expo-
sure of individual partners with regard to their limits,
and control over outstanding receivables.
The controlling company has in place strategies and
rules for the measurement and control of the compa-
ny’s exposure to credit risks. The need for collaterals
in respect of individual partners is determined based
on rules which, among other things, lay down the set-
ting of limits and monitoring of their utilisation. The
electricity transactions that are based on annual con-
tracts are mostly secured through bills of exchange or
bank guarantees, with issuing banks having to satisfy
strict credit rating criteria. Transactions with some
partners are regulated in detail using EFET agree-
ments. Short-term electricity trading transactions
that are carried out on power exchanges are already
secured through the obligatory membership system.
Interest rate risk exposure comprises the possibility
of an increase in the costs of variable interest rate fi -
nancing at the source as a result of changing interest
rates in the market. A portion of interest rates charged
on long-term loans is hedged using appropriate de-
rivatives through which a portion of variable interest
rates is changed to fi xed rates. The appropriateness
and correctness of contracts aimed at hedging against
interest rate risks is managed through the monitoring
of developments in the European and global money
market. Due to changes in the money market brought
about by the global fi nancial crisis, most interest rate
hedging contracts were cancelled early in 2008. We
estimate that thanks to the above measures regarding
AN
NU
AL
RE
PO
RT
HS
E |
BU
SIN
ES
S R
EP
OR
T

80
interest rate risk management, large share of equity
and low level of indebtedness (14.8% of the company's
assets and 19% of the Group's assets) interest rate
risk is low.
Currency risks associated with conducting business
in foreign currencies are insignifi cant. The company's
largest net currency exposure is the exposure to the
euro, which arises both from domestic and foreign
receivables. The volume of operations in other cur-
rencies is negligible, so the risk associated with these
currencies is very small.
Human resources riskThe company’s activities, its intensive growth and the
implementation of strategic plans require its employ-
ees to steadily improve their existing knowledge, ac-
quire new skills and competences, and demonstrate
a dynamic, multidisciplinary approach, self-initiative
and the ability to work in a team.
The potential loss of key employees is considered the
main human resources risk. This can only be pre-
vented through good management and communica-
tions with/among employees, continuous professional
growth and motivation, and through stimulating work-
ing conditions and environment. The exposure to hu-
man resources risk is estimated as low.
Information system risksThe management of IT risks is aimed at enabling the
HSE Group achieve its plans on the basis of better se-
curity of IT systems which store, process and transmit
the Group's data.
IT risk management is integrated into all levels of software and hardware use.The following IT risks were identifi ed as having an im-
pact on operations:
• internet access failure,
• e-mail failure,
• grid power supply interruption,
• failure of the Endur application,
• introduction of a virus.
The HSE Group estimates that IT risks were success-
fully managed in 2008.
Regulatory risksRegulatory risks arise from changes in market rules
or legislation in the Slovene and foreign electricity
markets which affect business results. The HSE Group
constantly monitors the development of the Slovene
and foreign electricity markets and the accompanying
regulations, and responds to changes by adjusting its
trading strategies.
Due to constant legislative changes, the company en-
sures proper application of regulations through con-
stant functional and professional training performed
by authorised and qualifi ed institutions.
Explanation of crisis management after 01/01/2009 In the fi rst quarter of 2009, the fi nancial crisis deep-
ened and spread to the real sector. Despite that, HSE
recorded good operating results, with electricity sales
exceeding the plan by 34%, while production at HPP
and TPP was almost 13% higher than planned.
The fi nancial crisis began to manifest itself mostly in
liquidity problems of some of our customers. In such
conditions, liquidity management is of exceptional im-
portance, which is why additional attention was devot-
ed to bad debt insurance. HSE estimates that the risks
are appropriately managed through suitable fi nancial
risk management measures also in the situation of
the fi nancial crisis.
The operations of the company HSE are adapted to the
strategic orientations of the Government of the Re-
public of Slovenia aimed at alleviating the conditions
caused by the global fi nancial and economic crisis.
Signifi cant attention is still given to the management
of all types of risks, to ensuring adequate short-term
and long-term solvency of the HSE Group and to the
continuation of procedures aimed at obtaining suffi -
cient funding for the implementation of all vitaly im-
portant development projects of the HSE Group.
Our short-term and long-term goals are being adap-
ted to the new economic situation which indicates great
challenges that the HSE Group will face in the future.
AN
NU
AL
RE
PO
RT
HS
E |
BU
SIN
ES
S R
EP
OR
T

81
2.13 External communication
In 2008 external communication revolved around
several key topics: electricity price rises, construc-
tion of new electricity production capacities, with the
construction of TEŠ's Unit 6 and the related activities
being the focus of attention, construction of HPPs on
the lower Sava River, HPP projects on the middle Sava
River, promotion of Blue Energy and effi cient energy
use, the “Energija si – be effi cient” campaign, which
are the fi rst two projects of this kind in Slovenia.
by signing an agreement, started producing an Action
Plan to achieve the target share of renewable energy
sources in total fi nal consumption by 2020.
The Action Plan represents a voluntary commitment
to implement measures aimed at realising the objec-
tives imposed on Slovenia by the draft Directive of the
European Parliament and Council on the promotion of
the use of energy from renewable sources, which will
be adopted by energy companies which are members
of the EZS (Electrotechnical Association of Slovenia).
Formulation of sustainable criteria for the use of renewable energy sourcesThrough the Certifi cation for HydrO: Improving Clean
is the most important energy guideline in the EU. As the HSE
Group has been operating in a very volatile environment, it is
necessary for it to adjust to the changes and follow the common
EU guidelines. Being the largest electricity producer in Slovenia
and aiming for expansion, we have to devote attention to
research and development that will open new promising areas
and indicate new directions for successful operation of the HSE
Group in the future. The HSE Group operates proactively and
therefore pays special attention to "3 x 20" R&D goals.
The area of external communication activities was
also marked by organisational and personnel chang-
es within HSE. The HSE Group was joined by the new
company Hidro Moćnost Makedonija d.o.o. and the
branch offi ce HSE Bratislava, and a new managing di-
rector and management member was appointed.
Press releases and statements for the media, the
company magazine Energija and the company's web-
site served as the main communication tools through
which internal and external public were informed of
the above changes and other events and circumstances
within the HSE Group that affected its performance.
2.14 Research and developmentThe events in the European energy market nothing but
underlined the critical points of European energy: too
great a dependence on imports, insuffi cient produc-
tion and transmission capacities, and the burden of
solving issues related to climate change.
The HSE Group devotes a lot of attention to studying
the direct impacts of presented legislative proposals
on the Slovene energy sector and the HSE Group.
Action planIn order to promote the use of energy obtained from
renewable energy sources, HSE and its subsidiaries,
3x20
AN
NU
AL
RE
PO
RT
HS
E |
BU
SIN
ES
S R
EP
OR
T

82
Energy − CH2OICE project, HSE is taking part in for-
mulating sustainable criteria for the use of renewable
energy sources. The project is co-fi nanced via the In-
telligent Energy Europe programme. Its goal is to set
up a suitable HPP certifi cation procedure aligned with
the Water Directive and the Directive on the promotion
of electricity produced from renewable sources in the
internal electricity market. The formulated certifi ca-
tion procedure will be tested on actual hydro power
plants in Slovenia and Italy. The ultimate project ob-
jective is to formulate a certifi cation procedure which
could then be implemented at the EU level.
Technological developmentTechnological development plays an important role in
further energy development. Research and develop-
ment in the fi eld of new technologies and new energy
sources receive more attention and funds. The devel-
opment policy focuses on closer integration of all Eu-
ropean and global research potential and co-operation
of industry. As a partner, HSE is involved in various re-
search projects and strives to additionally consolidate
the activities in this area, thus securing itself privileged
access to important information about new technolo-
gies which would at a given moment represent a major
competitive advantage. The development activities of
the HSE Group are oriented towards monitoring the
development of CO2 capture, transport and storage
technologies, the development of "clean" coal technol-
ogies, efforts to distribute the burden originating from
greenhouse gas emission reductions, and the produc-
tion of electricity from renewable energy sources.
Greenhouse gas emission reduction projectThe project "Greenhouse gas emission reduction in the
Slovene energy sector in the post-Kyoto period" is in
the fi nal phase. In addition to HSE, nearly all Slovene
thermal energy companies joined the project, which
enjoys the support of the Ministry of the Economy and
the Ministry of the Environment and Spatial Planning.
The project represents the basis for implementing the
requirements of the climate-energy package in the
Slovene thermal energy sector.
For HSE, the goal of participating in such projects is
the transfer of new knowledge and technologies which
the company can transpose into its operations. Also
signifi cant are the strengthening of HSE's reputation
as a company investing in knowledge, caring for the
environment and implementing socially accountable
actions, and establishing HSE's role as a responsible
player solving the energy challenges of the future.
Energy ActImportant legislative amendments were also intro-
duced in the Slovene energy legislation. The entry into
force of the draft amendments and supplements to the
Energy Act resulted in harmonisation of the Slovene
energy legislation with its European counterpart.
The amended act stipulates a new method for provid-
ing and allocating support to qualifi ed electricity pro-
ducers and to producers of electricity from domestic
energy sources, which affected the operations of HSE
and its subsidiaries TET and TEŠ. Owing to the result-
ing changes, HSE carefully considered the planned
investments to re-evaluate their justifi ability.
Co-operation with expert associationsThrough active participation in professional associations
of electricity producers and consultative bodies of the
EU, HSE takes part in the preparation of energy policy
and, by presenting its proposals and views, infl uences
the drawing up of energy legislation, which has an im-
portant impact on the operations of the HSE Group.
Future development activitiesCompany co-operation, joint investments in R&D, and
other joint investments can strengthen the European
energy industry and thus ensure the suitable competi-
tiveness of the entire sector. That is why HSE assigns
great importance to timely co-operation and entry into
various forms of partnerships, both in technological
research – involving mainly technologies related to
the use of existing fuels in thermal power facilities –
and investments in the production of electricity from
renewable energy sources.
Development projects of the HSE GroupIn order to optimally implement and prepare all de-
velopment activities and individual projects, the HSE
Group introduced a method of early identifi cation of
AN
NU
AL
RE
PO
RT
HS
E |
BU
SIN
ES
S R
EP
OR
T

83
potential development projects, including potential
new investments and projects involving the renovation
of existing facilities and devices. Timely identifi cation
of development projects will enable these projects
to be incorporated in strategic national development
programmes and other project schemes at an oppor-
tune time.
2.15 Plans for the futureStructure of development projectsThe HSE Group will in the future pursue goals in the
following areas:
• development of the European and Slovene electricity
market;
• safe and reliable electricity production and con-
struction of new capacities;
• consolidation and streamlining of operations;
• human resources management;
• fi nancial resources management; and
• research and development.
Goals related to the development of the European and Slovene marketThe main objectives pursued by the HSE Group in the
development of the European and Slovene market are
the following:
• to become the leading player in the electricity mar-
kets in SE Europe;
• to expand trading in geographical terms;
• to increase trading volumes in SE European mar-
kets; and
• to expand operations to other energy-related activi-
ties.
The HSE Group will continue with activities in SE Eu-
rope, to which the policy of investing, obtaining fi nan-
cial and other resources and concluding useful busi-
ness partnerships has been adjusted.
The set energy-climate goals can also be achieved
by the implementation of joint intercountry projects,
which represents a special challenge for HSE specifi -
cally in SE Europe, where most countries are already
in the EU accession phase.
Good knowledge of the conditions on these markets
and previous co-operation are the advantages en-
abling HSE to participate in the realisation of such
joint projects. The construction and purchase of new
production capacities, along with international trade
in electricity, signifi cantly contribute to the sustain-
able supply of Slovenia, its reduced dependence on
imports, lower exposure to geopolitical risks, and
the generation of good business results. Last but not
least, through its activities in this region HSE is con-
stantly consolidating its market position and its repu-
tation as a major regional player.
Safe and reliable production of electricitySafe and secure production of electricity involves the
following main goals:
• provision of optimal power distribution;
• optimisation of the stocks of coal, gas and water
reservoirs;
• pursuit of an optimal and joint maintenance policy;
• reducing the environmental impact of energy pro-
duction and consumption;
• implementing the joint environmental policy;
• saving energy and using it effi ciently;
• increasing the production of clean forms of energy;
• boosting the utilisation rates of existing units;
• ensuring competitiveness by cutting maintenance
and operating costs;
• rationally using the hydro energy potential of the
SHPP;
• formulating and introducing the HPP maintenance
standard already in 2009;
• caring for sustainable development;
• increasing the thermal power capacity by means of
domestic energy products;
• obtaining concessions for using the hydro power po-
tential; and
• carrying out the planned investments in new pro-
duction capacities according to the schedule and
within the budget.
The HSE Group will in the future continue planning and
implementing projects that contribute to the achieve-
ment of the set goals to reduce greenhouse gas emis-
sions and increase renewable sources, namely:
AN
NU
AL
RE
PO
RT
HS
E |
BU
SIN
ES
S R
EP
OR
T

84
• HPP projects on the lower and central Sava River;
• the possibility of the Mura and Idrijca Rivers being
used for generation of electricity;
• projects for using other renewable energy sources
(biogas, solar energy, wind energy);
• modernising technologies at thermal facilities and
realisation of investment in the construction of
TEŠ's Unit 6;
• preserving of energy locations and activities in the
Zasavje region, where HSE pursues a healthy eco-
nomic, environmental, technical and human re-
sources policy, at the same time complying with the
RS’s commitments to the EU and respecting the jus-
tifi ed interests of the local community in which the
TPP operates; and
• actively participating in technological development
in the fi eld of CSS (carbon capture and storage)
and ZEPP (zero or very low greenhouse gas emis-
sion power plant); to this end HSE proposed to the
Government of the RS to classify the TET location as
one of the possible locations for pilot CCS technol-
ogy projects.
By implementing these projects we could greatly re-
duce the import dependence of Slovenia in the future.
Being aware that merely the increase of production ca-
pacities is not a sustainable solution in the long run,
as the approach to safer and above all effi cient use of
electricity is also important, HSE will in the future con-
duct Pan-Slovene campaigns to promote effi cient use
of energy among industrial and household consumers.
Consolidation and streamlining of operationsThe main goals in the consolidation and streamlining
of operations are:
• providing competitiveness by reducing operating
costs;
• reorganising the organisational structure of the HSE
Group and individual companies;
• eliminating unnecessary assets and activities;
• consolidating supplier chains;
• redesigning business processes; and
• effi ciently managing all types of risks.
Human resources managementIn human resources management the HSE Group has
chiefl y been in pursuit of the following goals:
• providing training − investing in developing employ-
ee skills;
• competence, enthusiasm, satisfaction and motiva-
tion of employees;
• reducing the number of employees in electricity pro-
duction, while creating jobs for complementary ser-
vices within energy and environmental activities;
• ensuring continued (re)training; and
• providing a quality working life.
Financial resources managementIn the area of fi nancial resources management the
major goals are:
• assurance of short and long-term liquidity;
• fi nancial risk management;
• provision of optimal fi nancing sources;
• managing an optimal fi nancial policy; and
• optimal structure of fi nancing sources and capital
composition.
The fact is that investments in new capacities for elec-
tricity production are ever more demanding in terms
of organisation and fi nance. The HSE Group is aware
of that fact and through an active policy for searching
for suitable fi nancing sources and fl exible organisa-
tion makes sure that the projects which are of strate-
gic importance for it are carried out in due time and
within the set framework in spite of changed circum-
stances.
Research and developmentIn research and development the HSE Group will pro-
vide for:
• acceleration of strategic projects in the fi elds of:
creation of value for the Company, implementation
of projects to avoid risks, increase performance and
seize opportunities to expand the HSE Group and
promote innovation and know-how, while complying
with legal and other binding requirements of the RS
and the EU; and
• monitoring and supervision of studies made by other
research institutions.
The HSE Group strives to actively participate in the
drafting of expert bases for the adoption of suitable
implementation plans to meet the commitments with
the RS also as regards energy policy.
AN
NU
AL
RE
PO
RT
HS
E |
BU
SIN
ES
S R
EP
OR
T

85
2.16 Important events after the end of the periodOn 14 January 2009 the Supervisory Board of HSE ad-
opted the Business Plan of HSE for 2009. In February,
the Supervisory Boards/General Meetings of subsid-
iaries adopted the 2009 business plans of DEM, SENG,
TET, PV, HSE Invest and HESS.
DEM impaired a loan in the amount of € 18,600,000
based on the estimate of the recoverable principal
amount arising from a mortgage-backed loan. The
impaired value of the loan is thus € 2,400,000. The
said change has already been considered in the fi nan-
cial statements of the HSE Group for 2008.
AN
NU
AL
RE
PO
RT
HS
E |
BU
SIN
ES
S R
EP
OR
T

We
enjo
y na
ture
We clean up behind us
We
ke
ep
na
ture
pri
sti
neNature charm
s us by its beauty
We w
ish to relax


88
03 Social responsibility report
3.1 Responsibility to employeesIn 2008 we maintained the planned growth of the com-
pany's and the group's operations, achieving operating
results that benefi t all our key stakeholders: the ow-
ner, employees, business partners and the community
into which we are integrated. We showed once again
that we were successful in combining the policies and
sources in individual areas and that we keep track of
the present and play an active role in creating the fu-
ture. We became partners with all major stakeholders
in the society, and this is our source of strength, com-
petitive edge and a catalyst for change which brings
new challenges and opportunities and provides pos-
sibilities to progress and develop as planned.
We respond to global change by increasingly focusing
on employees and by constantly raising awareness not
only about our own but also broader social respon-
sibility. We can boast that the HSE Group is distin-
guished by employees with a broad range of interests,
skills, good manners and acceptance who are impor-
tant “architects” of the Group’s organisational culture
and our spokespersons both inwards and outwards.
was the number of HSE Group employees at the end of 2008. We
realise that the Group's strength derives from its employees, who are
important promoters of knowledge and values, key “architects” of the
organisational culture and, consequently, the source of competitive
advantage, as well as our spokespersons both inwards and outwards.
3,897
AN
NU
AL
RE
PO
RT
HS
E |
SO
CIA
L R
ES
PO
NS
IBIL
ITY R
EP
OR
T
89
HR policy Our human resources policy can be briefl y sum-
marised as follows: “We have come to terms with
change and adapted to it, which is why we are always
ready to start fresh and share our knowledge and ex-
perience as this enables us to strengthen our advan-
tages even further.”
One of the sources of our advantage is also the cre-
ation and provision of conditions and environment
which help our employees achieve their personal
ambitions, and we also encourage taking reasonable
risks, which is a precondition for further development
and build up of strength in uncertain situations as well
as for achieving the strategic goals of the HSE Group.
Systematic human resources management and an
orientation towards training and motivation ensure
the satisfaction of employees, their confi dence and
commitment, and their loyalty to the Group, which in
turn ensures our future development and success.
We need individuals who are willing to fully commit
to achieving noticeable and measurable operating
results and who are dedicated to implementing busi-
ness visions and strategies. We are aware that strate-
gies alone do not lead to success. Success is achieved
by people and the values guiding them.
The key elements of our human resources manage-
ment strategy remain as follows:
• to support business and strategic goals of the Group,
• to employ highly qualifi ed staff and improve the edu-
cational structure,
• to maintain an optimal number of employees,
• to invest in the development of knowledge and com-
petences of employees, focusing on the development
of own knowledge and training of team leaders,
• to set up a fl exible remuneration and promotion sys-
tem,
• to invest in high-quality and healthy working envi-
ronment and to continue a programme for the pro-
tection and strengthening of health in the working
and living environments.
3.1.1 Employees in the controlling company
The leading position of the HSE Group in the Slovene
energy system, which also means being the main
promoter of secure and reliable electricity supply in
Slovenia, makes us a very attractive employer: job
applications are received both from applicants with
established careers as well as those at the beginning
of their careers. The recruitment policy is based on a
combination of:
• recruitment from within the HSE Group or the in-
ternal labour market, which offers highly qualifi ed
experts of various profi les and with a wide range of
general and specifi c competences; for staff being
transferred to the parent company, such recruit-
ment represents promotion, career prospects and a
reward for successful performance;
• the external labour market, by means of which an
infl ow of fresh ideas, energy, different views and ex-
perience is ensured.
As regards executives and experts, the policy of train-
ing own staff prevailed.
All of the above is also refl ected in recruitment. In
the period from January to December 2008, the num-
ber of employees increased by three compared with
31/12/2007. The company thus had 112 employees as
at 31/12/2008.
The actual number of employees is by 7% or 8 employ-
ees short of the number envisaged in the 2008 busi-
ness plan, in particular due to the following reasons:
• three employees left the company;
• a call for applications was published in the last
quarter of 2008 but the selection process was not
completed before the beginning of 2009;
• employment of a scholarship recipient in January
2009;
• due to changed conditions, some of the calls for ap-
plications to fi ll positions in administration support,
internal audit, marketing and sales, and production,
and to hire an intern were not carried out.
The recruitment dynamics was spread evenly between
both halves of the year, with three workers being em-
ployed in each half.
NUMBER OF HSE D.O.O. EMPLOYEES
01/01/2008 109
31/12/2008 112
AN
NU
AL
RE
PO
RT
HS
E |
SO
CIA
L R
ES
PO
NS
IBIL
ITY R
EP
OR
T

90
Voluntary pension insuranceHSE has had its pension plan or a voluntary supple-
mentary pension insurance programme in place since
2002 when the fi rst workers were transferred to HSE
from its subsidiaries. The programme is operated by
Kapitalska družba d.d. and the majority of employees
contribute to it. Offering a long-term form of saving in
each individual’s personal account, the company aims
to provide its employees with an additional pension and
a higher quality of life when they end their careers.
Employees and the communityEmployees have obligations not only to their employ-
er and themselves but also to the wider community.
For this reason, they actively participate in numerous
business, professional and sports associations.
Developments in the business environment and ambi-
tions to create new, added value for the widest range of
users require HSE to pursue systematic training activi-
ties and employees to continually participate in edu-
cation and training and to demonstrate new ways of
thinking and innovativeness. Knowledge has become a
key asset. This is also evident from data on investments
in knowledge, since a signifi cant part of investments
by companies in the developed world is comprised of
investments in the improvement of knowledge, which
is the main source of business success.
Breakdown of training in 2008 and 2007
2008 2007
60
50
40
30
20
10
0
Management Professional Foreign Computer Occupational
training languages skills safety and health
8 %
58 %
12 %16 %
6 %
5 %
42 % 42 %
6 %5 %
TrainingConsidering that training favourably affects perfor-
mance, the company does not perceive it merely as
cost or an expenditure item; rather training repre-
sents a long-term investment or capital. In 2008 the
company allocated 0.01% of its net sales revenue to
training and education. The breakdown of training by
the number of hours reveals that 2,000 hours were al-
located to professional training in 2008.
All types of training were attended by 80% of em-
ployees, and 3,477 hours were used for this purpose,
which is 932 hours less than in 2007. On average, 31
hours of training were carried out per employee (part-
time studies are not included in this fi gure). In some
segments of education, employees already reached
the highest possible level in the previous years.
In addition to the development of knowledge and em-
ployee training, HSE’s education activities also com-
prised part-time studies and scholarships.
Part-time studiesIn the period from 2002 to the end of 2008, 20 em-
ployees completed their part-time studies, of which
10 obtained a master’s degree, 5 a university degree,
4 completed a 3-year undergraduate programme, and
1 completed a 2-year undergraduate programme. As
AN
NU
AL
RE
PO
RT
HS
E |
SO
CIA
L R
ES
PO
NS
IBIL
ITY R
EP
OR
T
91
for course type, electrical engineering and economics
courses were the most common.
In accordance with education agreements, HSE cur-
rently co-fi nances the studies of 13 employees or 62%
of all part-time students in the company. The com-
pany also keeps track of employees who are involved
in education at their own initiative. In accordance with
the collective labour agreement, HSE grants this last
group 7 days of study leave per calendar year. Employ-
ees are only entitled to receive fi nancial assistance
once they have completed their fi rst year of studies.
At the moment, 21 employees or slightly less than a
fi fth of all employees are involved in part-time studies.
This fi gure includes employees who have an educa-
tion agreement with HSE and those who are engaged
in the studies at their own initiative. The structure of
part-time studies shows that two employees are in-
volved in postgraduate doctorate studies, nine are
involved in postgraduate masters studies, fi ve are en-
gaged in masters studies under the Bologna system,
four are engaged in undergraduate studies to obtain a
bachelor’s degree in economics, and one takes part in
undergraduate studies to become a business admin-
istrator.
In accordance with the business plan, education
agreements were concluded with fi ve employees in
2008, as follows:
• two education agreements for the acquisition of spe-
cialist knowledge following the university studies;
• two education agreements for the fi nancing of mas-
ters studies under the Bologna system, specifi cally
the course Sales and Marketing provided by the
School of Commercial and Business Sciences Celje
and the course Organisation and Management of
Information Systems provided by the Faculty of Or-
ganisational Sciences Kranj;
• one education agreement for the fi nancing of under-
graduate higher education studies, specifi cally the
Business School Programme, the course Manage-
ment, provided by the Faculty of Economics in Lju-
bljana.
ScholarshipsThe students involved in development activities con-
tribute new ideas and views on solving work-related
problems. HSE provides support to students of tech-
nical, social and natural sciences both in the form of
fi nancing as well as practical training and gradual in-
tegration into the organisational environment.
In 2008 the company renewed a scholarship contract
with a student engaged in university electrical engi-
neering studies. The total number of scholarship-re-
ceiving students was two as at 31/12/2008.
AN
NU
AL
RE
PO
RT
HS
E |
SO
CIA
L R
ES
PO
NS
IBIL
ITY R
EP
OR
T

92
3.1.2 Employees in the HSE Group
At the end of 2008, the HSE Group had 3,897 employ-
ees, which is 3% less than on 31/12/2007.
Education structure The employee education structure of the HSE Group
has been improving over the years.
COMPANY 31/12/2008 % 31/12/2007 % IND 08 / 07
HSE 112 2.9 109 2.7 103DEM 279 7.2 277 6.9 101SENG 126 3.2 125 3.1 101TEŠ 490 12.6 508 12.6 96TET 220 5.6 225 5.6 98PV Group 2,619 67.2 2,736 68.0 96HSE Invest 49 1.3 42 1.0 117HESS 0 0.0 0 0.0 0HSE Italia 0 0.0 0 0.0 0HSE Balkan Energy 1 0.0 2 0.0 50HSE Hungary 0 0.0 0 0.0 0HSE Adria 1 0.0 1 0.0 100HSE Bulgaria 0 0.0 0 0.0 0TOTAL 3,897 100.0 4,025 100.0 97
Number of employees as at 31/12/2008 Average number of employees in 2008
Number of HSE Group employees
Number of employees as at 31/12/2008 and average number of employees in 2008 by education level
Education level Controlling company HSE Group Controlling company HSE Group
I. 0 285 0 304
II. 0 193 0 206
III. 0 16 0 16
IV. 1 1,587 1 1,637
V. 12 1,052 12 1,056
VI. 14 324 15 314
VII. 65 407 64 397
VIII. in IX. 20 33 20 34
TOTAL 112 3,897 111 3,962
Thematic workshopsOf course, investments in education alone do not guar-
antee success of a company or a group. That is why the
HSE Group has been organising thematic workshops
at multiple levels for the entire Group since 2004. The
workshops have become an effi cient part of the HSE
Group’s training system.
In 2008 the seminars New Provisions in the Financial
Operations, Insolvency Proceedings and Compulsory
Dissolution Act (ZFPPZIPP) and Management and
Supervisory Bodies' Liability for Damages were or-
ganised for the HSE Group.
AN
NU
AL
RE
PO
RT
HS
E |
SO
CIA
L R
ES
PO
NS
IBIL
ITY R
EP
OR
T

93
3.2 Responsibility to the natural environment
Environment-friendlySlovenia entered the EU with a comparatively well pre-
served natural environment and with the awareness that
the environment is one of the pillars of future sustain-
able development.
The HSE Group designed its environmental policy at the
very beginning of its operations. Its basic components
can be summarised as follows:
• to produce electricity with a minimum impact on the
environment,
• to observe all legal standards and recommendations,
• to introduce the best technologies available in order to
minimise the impact on the environment,
• to promote the development of RES,
• to achieve a partnership with local communities and
jointly solve environmental issues and plan for the sus-
tainable development of electricity production,
• to achieve sustainable operation and development of
energy capacities.
All electricity-producing companies in the HSE Group
and the controlling company have the ISO 9001 interna-
tional quality certifi cate and the ISO 14001 international
environmental certifi cate. Through consistent obser-
vance of these standards, the companies ensure safe
and environment-friendly production of electricity at all
hydropower plants. Thanks to environmental rehabilita-
tion and modernisation, both thermal power plants also
introduced more environment-friendly technologies,
while PV was among the fi rst coalmines in the world to
demonstrate comprehensive and responsible environ-
mental management in compliance with the require-
ments of the respective standard.
Renewable energy sourcesFollowing the example of European countries, the area
of RES is developing quickly in Slovenia. Under the
Slovene Energy Act, renewable energy sources are the
sources that are entirely or predominantly renewable
in the natural environment. These primarily include hy-
dropower, wind, biomass, geothermal and unaccumu-
lated solar energy. The Act is based on guidelines from
EU directives, and being an EU member state Slovenia
is obliged to increase the use of E-RES from 29.9% in
1999 to 33.6% until 2010. In December 2008, the fi nal
text of the new EU directive on RES was adopted. The
directive prescribes for each EU country a general goal
regarding the share of RES in the ultimate energy con-
sumption for the year 2020. For Slovenia, this share
amounts to 25%.
In terms of volume, energy from hydropower plants is
the most important source of electricity from renew-
able sources in Slovenia. The area of renewable en-
ergy sources is therefore highly important, both for the
operation and the future external image of the Group.
In the area of energy supply from renewable sources,
activities were launched in the second half of 2004 in
connection with the establishment of the domestic E-
RES market (Blue Energy), participation in the drawing
up of implementing regulations covering this area and
international activities relating to the sale of renew-
able certifi cates abroad.
Modra energija (Blue Energy)HSE set up the Modra energija (Blue Energy) project in
2004 in collaboration with distribution companies. The
project is aimed at encouraging the development of
energy production from renewable sources, establish-
ing the market in such energy and selling this energy
in Slovenia. The sales of Modra energija (Blue Energy)
began in January 2005. Since 1 July 2007, i.e. from the
full liberalisation of the electricity market onwards,
Modra energija (Blue Energy) has become available
to business as well household customers. In 2008 the
number of customers and the volume of the Modra
energija (Blue Energy) sold increased signifi cantly – to
2,189 and 36 GWh, respectively.
In accordance with the contract entered into by Modra
energija (Blue Energy) project partners, the majority of
proceeds from the sale of Modra energija (Blue Ener-
gy) (60%) goes into the Modri sklad (Blue Fund), which
AN
NU
AL
RE
PO
RT
HS
E |
SO
CIA
L R
ES
PO
NS
IBIL
ITY R
EP
OR
T

94
emission thresholds at all large combustion plants.
All large combustion plants operated within the toler-
ance margin of 120 hours (the so-called purifi cation
plant shutdown status). In 2008 TEŠ also produced
3.3% of electricity from CO2-neutral biomass. Owing
to the use of gas and biomass in the production of
electricity, CO2 emissions were cut by 46,686 tons and
137,975 tons, respectively, in the period concerned.
The overall decrease in CO2 emissions thus stood at
184,661 tons. Further investments (upgrading of Units
4 and 5, construction of the 600 MW Unit 6) will help
decrease the impact on the environment even further.
This is explained in more detail in chapter 2.9 Invest-
ments.
In conformity with its vision, the company TET con-
tinuously monitors the appropriateness and effi ciency
of the quality and environment management system
to ensure ongoing improvements. In addition to the
automated measurement of fl ue gases, the quality
of cooling water and the measurements at six immi-
sion sites, laboratory measurements were set up as
part of TET's environmental information system. TET
also set up precipitation collectors at all six immision
sites. Based on monthly precipitation and sediment
samples it then determines their acidity, electrocon-
ductivity and the content of sulphates, nitrates, chlo-
rides, ammonia and the metals Na3, K, MG and Ca.
In accordance with its development strategy, TET has
also provided for the restoration of the landscape, i.e.
the greening of the south bank and of the fl at part of
the disposal site, and the greening of the north bank
once the depositing has ended. The greening of ash-
covered surfaces protects the soil against water and
wind erosion. Ash and slag deposits are covered in
their entirety with around 20 cm of soil. The surfaces
are planted with trees, various types of grass and oat,
which germinates and grows relatively quickly, thus
providing shadow for slower growing plants. Thanks
to the dampening and greening of ash deposits, dust
emissions were reduced completely.
Over the last decade, DEM's environmental projects
focused mainly on the clean-up of reservoirs and,
through this, the revitalisation and maintenance of
embankments. Appropriate maintenance of reser-
voirs and embankments is also the basis for the de-
velopment of tourist and recreational activities.
In addition to energy exploitation planning, SENG
is intended to promote the production of E-RES, re-
search aimed at accelerating the production of E-RES
and development, and refurbishment and construc-
tion of E-RES facilities. All hydropower plants of the
HSE Group holding the international RECS certifi cate
take part in the Modra energija (Blue Energy) project.
In Slovenia, HSE and distribution companies sell the
energy produced from renewable sources under the
Modra energija (Blue Energy). HSE guarantees the re-
newability of the energy to the project partners by re-
alising an appropriate number of RECS certifi cates on
their behalf. Modra energija (Blue Energy) is uniformly
priced at 0.00417 €/kWh. The brand is owned by HSE,
which coordinates the project and takes care of commu-
nication with the public and of the promotion of Modra
energija (Blue Energy). The brand and the logo that were
designed as part of the project are protected.
3.3 Responsibility to the broader social communityThe HSE Group operates and does business not only
by observing the principles of good management but
also by considering the lives and activities of people
living in the environment in which the Group operates.
The responsibility to the community is a guideline
which directs us towards a society which is friendly in
more than one way.
The HSE Group makes various contributions to the
community in which it is situated. To some extent, it
makes up for its activities by constructing buildings
which use natural resources to produce electricity,
thus supporting the development of tourism, and by
introducing new and cleaner technologies, restor-
ing roads and watercourses, and maintaining public
infrastructure and facilities. The responsibility to the
community is also demonstrated through compensa-
tion paid to the affected parties.
The successful implementation of environment pro-
tection measures in previous years enabled TEŠ to
further reduce emissions from fl ue gases at most of
its combustion plants. Thanks to the measures taken
so far, it managed to keep annual and monthly averag-
es of pollutants, such as NOx, CO, SO
2 and dust, below
AN
NU
AL
RE
PO
RT
HS
E |
SO
CIA
L R
ES
PO
NS
IBIL
ITY R
EP
OR
T

95
combines various interests in its area by seeking op-
portunities to exploit the area for multiple purposes,
such as water management, water supply, fi sh farm-
ing, fi shing, tourism and recreational activities. The
combination and harmonisation of all interests not
only brings improvement to the wider area but above
all provides opportunities for a comprehensive demo-
graphic and environmental development. Local com-
munities thus enjoy more opportunities to undertake
additional activities, improved public infrastructure,
better landscaping and stable slopes.
The number of supporters of the "Energija si – be effi -
cient" campaign increased once again in the past year.
The campaign is joined every day by established and
AN
NU
AL
RE
PO
RT
HS
E |
SO
CIA
L R
ES
PO
NS
IBIL
ITY R
EP
OR
T
large Slovene companies that wish to contribute to
raising awareness about electricity effi ciency, which is
a precondition for sustainable development and lower
costs. The fact that we no longer have to encourage
companies to take part in the campaign but instead
the companies do so at their own initiative further
demonstrates that we are on the right path, the path
which, like a chain reaction, paves the way for a posi-
tive attitude towards the environment and people who
live in it.
The HSE Group supports numerous associations and
institutions which require additional funding to oper-
ate. The sponsoring of sports clubs and donations to
educational, science, arts and humanitarian institu-
tions, individuals and associations which are the most
in need of support are an integral part of our social
responsibility.
We are pleased and proud to be able to contribute to
the development of Slovenia's messengers at home
and abroad, and at the same time these activities cer-
tainly effectively contribute to HSE's promotion.

Insp
irat
ion
Idea
Exa
min
ati
on
Implementatio
nObservation


98
AN
NU
AL
RE
PO
RT
HS
E |
FIN
AN
CIA
L R
EP
OR
T O
F T
HE
CO
MP
AN
Y H
SE
4.1 Introductory notes
Basis of preparationThe fi nancial statements and the notes thereto have
been prepared in accordance with provisions of the
Companies Act (ZGD-1) and the Slovene Accounting
Standards 2006 (SAS 2008) in the fi nancial year 2008,
which corresponds to the calendar year.
The fi nancial statements have been presented in euros.
Signifi cant accounting assumptions and qualitative characteristics of fi nancial statements The fi nancial statements have been prepared by ob-
serving the following signifi cant accounting assump-
tions:
• accrual basis,
• going concern,
Financial report of the company HSE
Was HSE’s ranking on Delo FT’s list of the largest Slovene companies in
terms of net profi t, which stood at € 53,756,215. HSE was thus once again
ranked as one of the most successful Slovene companies, improving its
ranking by 41 places compared with 2007.
04
5
99
AN
NU
AL
RE
PO
RT
HS
E |
FIN
AN
CIA
L R
EP
OR
T O
F T
HE
CO
MP
AN
Y H
SE
and required qualitative characteristics:
• going concern,
• consistency of valuation methods,
• prudence,
• recognition of revenue and expenses irrespective of
their payment,
• individual valuation of assets and liabilities.
Foreign exchange rate and method of conversion to the national currency In the income statement, the fi nancial statement items
denominated in foreign currencies were translated
into the local currency on the day of accrual using the
exchange rate of the Bank of Slovenia applicable on
that day.
The balance of assets and liabilities expressed in a
foreign currency was translated on 31/12/2008 at the
exchange rate of the Bank of Slovenia. The resulting
foreign exchange differences have been carried as fi -
nance income or fi nance expenses.
The following exchange rates were used for the con-
version of assets and liabilities expressed in a foreign
currency:
• € as at 31/12/2008 = USD 1.3917 (USA),
• € as at 31/12/2008 = CZK 26.875 (the Czech Republic),
• € as at 31/12/2008 = HRK 7.3555 (Croatia),
• € as at 31/12/2008 = HUF 266.70 (Hungary),
• € as at 31/12/2008 = CHF 1.485 (Switzerland),
• € as at 31/12/2008 = BGN 1.9558 (Bulgaria),
• € as in December 2008 = RSD 89.3718 (Serbia).
• € as in December 2008 = MKD 60.5996 (Macedonia),
• € as at 31/12/2008 = RON 4.0225 (Romania),
• € as at 31/12/2008 = SKK 30.126 (Slovakia).
Accounting policiesIn the recording and valuation of fi nancial statement
items, SAS (2006) stipulations have been followed di-
rectly, except in the valuation of items for which SAS
(2006) allow different methods. In such cases, the
company applies valuation methods that comply with
its own Accounting Rules or management decisions.
Transfer of project “Joint venture for the construction of HPPs on the lower Sava River” to the company HESSThe investment in the construction of HPPs on the
lower Sava River, which had been part of the joint ven-
ture, i.e. the project of the construction of HPPs on the
lower Sava River (hereinafter: the joint venture) and
had been carried at its full amount in the company's
books of account until 31/12/2007, was transferred to
HESS as in-kind contribution in 2008 (for more details
on the transfer of the joint venture for the construc-
tion of HPPs on the lower Sava River see chapter Pre-
sentation of the HSE Group).
The company HESS was entered in the Compa-
nies Register on 1 April 2008, with its initial capital
amounting to € 200,000. The capital increase made by
means of an in-kind contribution was entered in the
Companies Register on 1 July 2008. This was accom-
panied by the transfer of the concession right to HESS.
Given the agreed cut-off date on which the in-kind
contribution to the company HESS (31/12/2007) was
accounted for, all economic impacts of the joint ven-
ture's operations have been attributed to the company
HESS since 01/01/2008. This was done in accordance
with Interpretation 1 of SAS 22 (Management of books
of account in mergers and divisions). Consequently,
all revenue and expenses for 2008 were posted to the
company HESS together with relevant assets and lia-
bilities, while a long-term investments in the company
HESS was recorded to refl ect the net value of the joint
venture's assets and liabilities attributable to HSE ac-
cording to its books of account as at 31/12/2007. Like
in the joint venture, HSE's interest in the company
HESS amounts to 51%.
Company branch offi cesThe company has two foreign branch offi ces - in the
Czech Republic and in Slovakia. The results of their
operations have been included in the company's fi -
nancial statements.
Intangible assetsIntangible assets are long-term assets enabling the per-
formance of the company’s registered activities, while
physically they do not exist. The company's intangible
assets comprise property rights with fi nite useful lives.

100
AN
NU
AL
RE
PO
RT
HS
E |
FIN
AN
CIA
L R
EP
OR
T O
F T
HE
CO
MP
AN
Y H
SE
An item of intangible fi xed assets is initially carried at
cost. The cost also includes import duties and non-
refundable purchase taxes. The cost does not include
interest incurred prior to the origination of an intan-
gible asset.
After recognition, intangible assets are measured us-
ing the cost model.
Their value is subsequently lowered by the amount of
amortisation recorded in the accumulated amortisa-
tion account. In the balance sheet, intangible assets
are recorded at the carrying amount, i.e. as the dif-
ference between the cost and accumulated amortisa-
tion.
An item of intangible assets is amortised individually
using the straight-line amortisation method. Amorti-
sation begins when an intangible asset is available for
use. The amortisation rates applied to individual types
of intangible assets are based on their envisaged use-
ful lives.
Property, plant and equipmentProperty, plant and equipment are part of long-term
assets owned by the company and used for the perfor-
mance of its registered activities.
An item of property, plant and equipment is initially
recognised at cost, which comprises its purchase
price, import duties and non-refundable purchase
taxes, as well as directly attributable costs of bring-
ing the asset to working condition for its intended use.
The cost does not include the borrowing costs related
to the acquisition of an item of property, plant and
equipment to bring the asset to its working condition.
The cost does not include costs incurred upon the dis-
mantling or removing of the items of property, plant
and equipment.
The spare parts of higher value are recorded as prop-
erty, plant and equipment and depreciated over the
useful life of the related asset.
Following recognition, the items of property, plant and
equipment are measured using the cost model.
In the bookkeeping records the cost and accumulated
depreciation of items of property, plant and equip-
ment are recorded separately, whereas in the balance
sheet they are recorded at carrying amount, i.e. as a
difference between the cost and accumulated depre-
ciation.
Subsequent expenditure on an item of property, plant
and equipment increases its cost when it increases
its future economic benefi ts in excess of the originally
assessed future economic benefi ts.
Recognition of an item of property, plant and equip-
ment in the bookkeeping records and the balance
sheet is reversed if an asset is disposed of. The dif-
ference between the net selling price and the carrying
amount of a disposed of item of property, plant and
equipment is recorded as revaluation operating rev-
enue or expense.
The depreciation of property, plant and equipment
items begins on the fi rst day of the month following
the month in which an item becomes available for its
intended use. Depreciation is accounted for individu-
ally on a straight-line basis. The depreciation rates
applied to the individual types of property, plant and
equipment are based on their envisaged useful lives.
InvestmentsInvestments are considered as the company's assets,
the return on which is used to increase the company's
fi nance income. Upon initial recognition, investments
are recorded at historical cost plus the costs attribut-
able directly to the transaction (except for investments
measured at fair value through profi t and loss).
In the company's books of account, investments are
recognised based on their settlement date (payment
date).
After initial recognition, investments are carried at
cost in the company’s fi nancial statements (which
also includes investments in subsidiaries and associ-
ates) and are recorded as available-for-sale fi nancial
assets. Because their fair value cannot be determined
(this is not the case with derivatives), they are not re-
valued and, consequently, do not affect revaluation
surplus. Any indications of their impairment are de-
termined on an annual basis.
Based on the envisaged settlement or the reason for

101
AN
NU
AL
RE
PO
RT
HS
E |
FIN
AN
CIA
L R
EP
OR
T O
F T
HE
CO
MP
AN
Y H
SE
holding an investment, investments are recorded as
long-term or current assets in the balance sheet.
InventoriesInventories, being part of the company's current as-
sets, are initially recognised at cost, which comprises
their purchase price, import duties and other non-
refundable purchase taxes, as well as direct costs of
purchasing. The purchase price is decreased by the
discounts obtained.
If the prices of the items that are purchased anew
in the accounting period differ from the prices of in-
ventory items of the same class, the fi rst-in fi rst-out
(FIFO) method is applied to decrease the quantities of
inventories during the year.
ReceivablesThe company’s assets include receivables as the rights
arising from property and other legal relationships to
demand the settlement of a debt or delivery of items or
services from a specifi c person. All receivables are ini-
tially recognised at amounts recorded in relevant docu-
ments on the assumption that they will be collected.
In the balance sheet, receivables are disclosed in their
net amounts, meaning they are reduced by any allow-
ances for disputed and doubtful receivables. The al-
lowances for receivables are made on an individual
basis. If receivables are not collected in a certain pe-
riod, they are considered doubtful. If legal proceed-
ings have been initiated in relation to them, they are
considered disputed.
Receivables of smaller values are written off based on
a management's decision if it is determined that the
costs of collection of such overdue receivables exceed
the amount of the receivables, making a further col-
lection economically unviable.
Depending on their maturity, receivables are carried
as long-term or current assets in the balance sheet.
CashCash represents deposit money, i.e. cash in bank ac-
counts that can be used for payments. It comprises
cash in accounts and cash available at notice.
The carrying amount of an item of cash equals its ini-
tial nominal value, which can change due to changes
in foreign exchange rates if cash is denominated in
foreign currencies.
Short-term accrued revenue and deferred costsShort-term accrued revenue and deferred cost items
comprise short-term deferred costs and short-term
accrued revenue.
Short-term deferred costs include amounts incurred
but not yet charged against the company's profi t or
loss.
Short-term accrued revenue represents amounts that
have been included in profi t or loss but have not yet
been charged.
EquityTotal equity is defi ned by the amounts invested by
owners and the amounts generated during operation
and belonging to the owners.
Nominal capital is carried in the national currency.
Nominal capital and capital surplus represent owner’s
cash contributions and contributions in kind.
Other revenue reserves are set aside on the basis of
decisions adopted by the Supervisory Board and the
General Meeting.
Net profi t or loss represents the undistributed por-
tion of the company's net profi t or loss for the current
year.
Revaluation surplus includes the value of hedging de-
rivatives.
Provisions and long-term accrued costs and deferred revenueProvisions are created for obligations that are expect-
ed to arise from obligating past events in the coming
periods and the value of which is based on the esti-
mated present value of expenses that are expected to
be required to settle such obligations. The amount of
provisions for jubilee benefi ts and termination ben-

102
AN
NU
AL
RE
PO
RT
HS
E |
FIN
AN
CIA
L R
EP
OR
T O
F T
HE
CO
MP
AN
Y H
SE
efi ts was estimated on the basis of an actuarial cal-
culation. More detailed disclosures on the creation of
provisions are available in the fi nancial report of the
HSE Group.
Long-term accrued cost and deferred revenue items
relate to long-term accrued costs.
Long-term liabilitiesLong-term liabilities are recognised obligations asso-
ciated with the fi nancing of own assets that need to be
settled in cash in a period of more than one year. They
are measured at cost.
The portion of long-term liabilities that is due to be
settled within a year of the balance sheet date is re-
corded as a short-term liability.
Long-term fi nancial liabilities are long-term loans re-
ceived on the basis of loan contracts repayable in a
period longer than one year. They are initially recog-
nised in the amounts of cash received. Subsequently,
they are decreased by the repayments of principal
amounts. Accounted for but not yet due interest on
long-term fi nancial liabilities is recorded as other
short-term operating liabilities.
Long-term operating liabilities arise from relations
between the company and business partners based
on the contracts concluded.
Short-term liabilitiesShort-term liabilities are recognised obligations as-
sociated with the fi nancing of own assets that need to
be settled in cash in a period of less than a year. They
are measured at cost.
Short-term fi nancial liabilities include a portion of
long-term fi nancial liabilities that falls due within a
year of the balance sheet date. Accounted for but not
yet due interest on short-term fi nancial liabilities is
recorded as other short-term operating liabilities.
The carrying amount of short-term operating liabili-
ties equals the amount recorded in relevant docu-
ments containing information about their inception.
Short-term accrued costs and deferred revenue Short-term accrued cost and deferred revenue items
comprise short-term accrued costs and value added
tax on advance payments made. To be able to charge
them evenly against profi t or loss, the costs that have
not yet occurred but are expected to arise are record-
ed as accrued costs.
DerivativesDerivatives are fi nancial instruments, the value of
which changes in response to a change in an interest
rate or commodity or security price and which require
no initial net investment.
The company uses derivatives for trading (futures on
electricity and CO2 emission coupons) and hedging
purposes (interest rate swaps, futures on electricity
and CO2 emission coupons).
The gains and losses on fi nancial instruments held for
trading are recognised directly in the income statement.
Hedging derivatives are used for cash fl ow hedging;
hence a portion of the gain or loss on hedging that is
considered as effective is recognised in equity, with
the difference being recognised in profi t or loss.
The gain or loss that is recognised in equity is trans-
ferred to profi t or loss in the period in which the profi t
or loss is affected by the hedged item.
In the books of account, futures are recorded using
the ‘net’ principle, which means that the value of fu-
tures is recorded as an off-balance sheet item.
Off-balance sheet recordsOff-balance sheet records show business events that
have no direct impact on the items in the fi nancial
statements but are signifi cant in terms of informing
fi nancial report users.
RevenueRevenue is recognised if an increase in economic ben-
efi ts during an accounting period is related to an in-
crease in assets or a decrease in liabilities and those
increases can be measured reliably.

103
AN
NU
AL
RE
PO
RT
HS
E |
FIN
AN
CIA
L R
EP
OR
T O
F T
HE
CO
MP
AN
Y H
SE
Revenue is recognised when it can be reasonably ex-
pected it will result in receipts, unless such receipts
arose when the revenue was recorded.
Revenue from the sale of services and merchandise
is measured at selling prices indicated in invoices and
other documents.
Revaluation operating revenue is revenue arising from
the disposal of property, plant and equipment, revenue
from the reversal of provisions, and revenue from the
reversed impairment of investments. It is recognised
on the basis of issued invoices or other relevant docu-
ments.
Finance income arises in connection with long-term
and short-term investments and in connection with
receivables and short-term liabilities. Finance income
is recognised upon the settlement of accounts irre-
spective of receipts, unless there is reasonable doubt
as to their amount, maturity and recoverability. Inter-
est is accounted for in proportion to the previous year,
outstanding amount of the principal and the agreed-
upon interest rate.
Other revenue is comprised of extraordinary items.
They are disclosed in actual amounts.
ExpensesExpenses are recognised if decreases in economic
benefi ts during an accounting period are associated
with decreases in assets or increases in liabilities and
such decreases can be reliably measured.
Operating expenses are recognised upon the purchase
of merchandise or the completion of services. Amor-
tisation and depreciation are accounted for at agreed-
upon rates based on the estimated use of intangible
assets and property, plant and equipment.
Revaluation operating expenses comprise the excess
of the carrying amount over the selling price of prop-
erty, plant and equipment, write-off of property, plant
and equipment, and write-off of doubtful receivables.
Finance expenses arise in connection with liabilities,
intangible assets and short-term receivables. They
are recognised when the statements of account are
prepared, regardless of the payments associated with
them. Interest is recognised in proportion to the past
year and based on the outstanding amount of the prin-
cipal balance and an agreed-upon interest rate.
Other expenses are comprised of extraordinary items.
They are disclosed in actual amounts.
Reporting by business and geographical segmentsThe company divides its net sales revenue by two geo-
graphical segments, i.e. domestic market and foreign
market. Foreign markets and profi ts or losses on
those markets have not been presented in more detail
because the company estimates that the disclosure
of such information might be detrimental to the com-
pany. As far as geographical segments are concerned,
the company’s assets and liabilities represent an in-
divisible unit.
Because operating conditions and risks of individual
groups of products are similar, the company does not
break down operations by business segment.
TaxationThe company is liable to pay tax under the Value Added
Tax Act, the Excise Duty Act, and the Corporate Income
Tax Act. The branch offi ces in the Czech Republic and
in Slovakia are liable to pay corporate income tax and
value added tax.
Deferred taxesDeferred taxes are intended for covering temporary
differences between the carrying amount and tax val-
ues of assets and liabilities. Deferred tax assets rep-
resent the assessed amount of corporate income tax
and deductible temporary differences, which results
in lower tax payable in future periods.

104
AN
NU
AL
RE
PO
RT
HS
E |
FIN
AN
CIA
L R
EP
OR
T O
F T
HE
CO
MP
AN
Y H
SE
As Managing Directors of Holding Slovenske elek-
trarne d.o.o. we hereby confi rm the fi nancial state-
ments of HSE for the fi nancial year 2008, the notes
thereto, and the accounting policies applied.
We confi rm that the accounting policies have been
applied consistently during the preparation of the fi -
nancial statements, that the accounting estimates
were prepared on the principles of prudence and good
management and that the annual report gives a true
and fair view of the fi nancial position of the company
and the results of its operations in the year 2008.
We confi rm that the fi nancial statements have been
prepared in accordance with provisions of the Com-
panies Act, Slovene Accounting Standards and other
regulations governing the area of accounting. The fi -
nancial statements were prepared on a going concern
basis.
Viljem Pozeb, M.Sc. Jože Zagožen, Ph.D.
Managing Director of HSE Managing Director of HSE
Ljubljana, 31/03/2009
4.2 Management’s statement

105
AN
NU
AL
RE
PO
RT
HS
E |
FIN
AN
CIA
L R
EP
OR
T O
F T
HE
CO
MP
AN
Y H
SE
4.3 Auditor’s report

106
AN
NU
AL
RE
PO
RT
HS
E |
FIN
AN
CIA
L R
EP
OR
T O
F T
HE
CO
MP
AN
Y H
SE

107
AN
NU
AL
RE
PO
RT
HS
E |
FIN
AN
CIA
L R
EP
OR
T O
F T
HE
CO
MP
AN
Y H
SE
4.4 Balance sheet in €
ITEM NOTE 31/12/08 31/12/07ASSETS 1,158,781,276 1,141,859,460
A. LONG-TERM ASSETS 951,519,702 959,861,366 I. Intangible assets and long-term
accrued revenue and deferred costs 1 8,178,427 8,430,458
1. Long-term property rights 8,178,427 8,430,458
II. Property, plant and equipment 2 6,774,756 127,881,827 1. Land and buildings 1,737,447 34,366,074
b) Buildings 1,737,447 34,366,074
2. Production plant and equipment 0 32,135,455
3. Other plant and equipment 2,613,773 2,978,545
4. Property, plant and equipment being acquired 2,423,536 58,401,753
a) Property, plant and equipment
in the course of construction 2,423,536 50,225,843
b) Advances for acquisition of property,
plant and equipment 0 8,175,910
IV. Long-term investments 3 929,662,269 819,063,439 1. Long-term investments, excluding loans 929,662,269 819,063,439
a) Shares and interests in group companies 885,578,229 774,510,519
b) Shares and interests in associates 545,500 543,850
c) Other shares and interests 43,536,871 43,536,871
d) Other long-term investments 1,669 472,199
V. Long-term operating receivables 4 2,715,058 125,188 3. Long-term operating receivables from others 2,715,058 125,188
VI. Deferred tax assets 5 4,189,192 4,360,454 B. CURRENT ASSETS 202,115,396 175,916,067 II. Inventories 779 82,581 1. Materials 779 1,897
4. Advances for inventories 0 80,684
III. Short-term investments 6 68,242,000 16,909,850 2. Short-term loans 68,242,000 16,909,850
a) Short-term loans to group companies 0 3,246,850
b) Short-term loans to others 68,242,000 13,663,000
IV. Short-term operating receivables 7 127,497,862 155,083,914 1. Short-term operating receivables from group companies 1,615,189 2,934,124
2. Short-term operating trade receivables 97,575,738 120,300,699
3. Short-term operating receivables from others 28,306,935 31,849,091
V. Cash 8 6,374,755 3,839,722 C. SHORT-TERM ACCRUED REVENUE
AND DEFERRED COSTS 9 5,146,178 6,082,027
OFF-BALANCE SHEET RECORDS 15 238,366,872 225,623,904

108
AN
NU
AL
RE
PO
RT
HS
E |
FIN
AN
CIA
L R
EP
OR
T O
F T
HE
CO
MP
AN
Y H
SE
BALANCE SHEET (continued) in €
ITEM NOTE 31/12/08 31/12/07
LIABILITIES 1,158,781,276 1,141,859,460 A. EQUITY 10 798,817,478 757,166,486 I. Called-up capital 29,558,789 29,558,789 1. Nominal capital 29,558,789 29,558,789
II. Capital surplus 561,243,185 561,243,185 III. Revenue reserves 169,502,829 138,319,123 5. Other revenue reserves 169,502,829 138,319,123
IV. Revaluation surplus 11,634,567 21,839,790 VI. Net profi t or loss for the period 26,878,108 6,205,599 B. PROVISIONS AND LONG-TERM ACCRUED
COSTS AND DEFERRED REVENUE 11 19,175,683 7,943,631
1. Provisions for pensions and similar liabilities 431,612 410,915
2. Other provisions 17,272,737 7,532,716
3. Long-term accrued costs and deferred revenue 1,471,334 0
C. LONG-TERM LIABILITIES 12 161,302,465 156,475,386 I. Long-term fi nancial liabilities 161,267,186 96,929,963 2. Long-term fi nancial liabilities to banks 161,118,007 96,929,963
4. Other long-term fi nancial liabilities 149,179 0
II. Long-term operating liabilities 35,279 59,545,423 1. Long-term operating liabilities to group companies 0 39,960,823
2. Long-term operating trade liabilities 35,279 1,269,223
5. Other long-term operating liabilities 0 18,315,377
D. SHORT-TERM LIABILITIES 13 173,979,273 214,764,190 II. Short-term fi nancial liabilities 9,811,956 35,374,714 2. Short-term fi nancial liabilities to banks 9,811,956 35,374,714
III. Short-term operating liabilities 164,167,317 179,389,476 1. Short-term operating liabilities to group companies 130,737,900 103,187,424
2. Short-term operating trade liabilities 28,959,611 66,676,371
4. Short-term operating liabilities from advances 0 38,939
5. Other short-term operating liabilities 4,469,806 9,486,742
E. SHORT-TERM ACCRUED COSTS AND DEFERRED REVENUE
14 5,506,377 5,509,767
OFF-BALANCE SHEET RECORDS 15 238,366,872 225,623,904
* The accompanying notes are an integral part of the fi nancial statements and should be read in conjunction with them.

109
AN
NU
AL
RE
PO
RT
HS
E |
FIN
AN
CIA
L R
EP
OR
T O
F T
HE
CO
MP
AN
Y H
SE
4.5 Income statement in €
ITEM 2008 2007
1. Net sales revenue 819,264,527 921,176,077a) Domestic market 578,426,525 677,506,544
- from relations with group companies 4,827,794 3,854,709
- from relations with others 573,598,731 673,651,835
b) Foreign market 240,838,002 243,669,533
- from relations with group companies 5,022,245 6,365,151
- from relations with others 235,815,757 237,304,382
3. Capitalised own products and own services 0 151,3414. Other operating revenue (including revaluation operating revenue) 1,041,190 1,974,761GROSS RETURN ON OPERATIONS 820,305,717 923,302,1795. Costs of goods, materials and services 766,089,817 895,889,987a) Cost of goods and materials sold and costs of materials used 759,887,952 888,484,123
b) Costs of services 6,201,865 7,405,864
6. Labour costs 6,545,268 5,950,139a) Payroll costs 4,884,574 4,332,453
b) Social security costs 981,354 870,592
- of which pension insurance costs 611,140 534,097
c) Other labour costs 679,340 747,094
7. Write-downs in value 1,493,117 16,985,578a) Depreciation and amortisation 1,458,542 2,236,463
b) Revaluation operating expenses associated with IA and PPE 7,893 37,792
c) Revaluation operating expenses associated with operating current assets
26,682 14,711,323
8. Other operating expenses 11,050,720 1,993,478TOTAL OPERATING EXPENSES 785,178,922 920,819,182OPERATING PROFIT OR LOSS 35,126,795 2,482,9979. Finance income from interests 28,017,618 17,852,896a) Finance income from interests in group companies 27,800,000 8,502,104
c) Finance income from interests in other companies 0 6,129,694
d) Finance income from other investments 217,618 3,221,098
10. Finance income from loans given 2,037,012 1,673,799a) Finance income from loans to group companies 12,260 278,603
b) Finance income from loans to others 2,024,752 1,395,196
11. Finance income from operating receivables 1,622,351 1,050,952a) Finance income from operating receivables
due from group companies 0 3,797
b) Finance income from operating receivables due from others 1,622,351 1,047,155
TOTAL FINANCE INCOME 31,676,981 20,577,64713. Finance expenses for fi nancial liabilities 9,088,733 5,885,832b) Finance expenses for loans received from banks 7,993,672 5,880,334
d) Finance expenses for other fi nancial liabilities 1,095,061 5,498
14. Finance expenses for operating liabilities 776,715 426,706b) Finance expenses for trade liabilities and bills payable 71,577 6,732
c) Finance expenses for other operating liabilities 705,138 419,974
TOTAL FINANCE EXPENSES 9,865,448 6,312,538PROFIT OR LOSS ON ORDINARY ACTIVITIES 56,938,328 16,748,10615. Other revenue 4,670,086 81,78716. Other expenses 3 234PROFIT OR LOSS ON EXTRAORDINARY ACTIVITIES 4,670,083 81,553TOTAL PROFIT OR LOSS 61,608,411 16,829,65917. Corporate income tax 7,649,606 6,858,65618. Deferred taxes 202,590 -2,440,19419. NET PROFIT OR LOSS FOR THE ACCOUNTING PERIOD 53,756,215 12,411,197
* The accompanying notes are an integral part of the fi nancial statements and should be read in conjunction with them.

110
AN
NU
AL
RE
PO
RT
HS
E |
FIN
AN
CIA
L R
EP
OR
T O
F T
HE
CO
MP
AN
Y H
SE
4.6 Cash fl ow statement in €
ITEMS 2008 2007
A. CASH FLOWS FROM OPERATING ACTIVITIES a) Items of income statement 36,072,591 24,112,591
Operating revenue (except from revaluation)
and fi nance income from operating receivables 825,179,356 922,010,409
Operating expenses without depreciation or amortisation (except
from revaluation) and fi nance expenses for operating liabilities (782,819,664) (888,847,981)
Income taxes and other taxes not included in operating expenses (6,287,101) (9,049,837)
b) Changes in net operating assets in balance sheet items (including accruals and deferrals, provisions 17,283,733 6,583,038 and deferred tax assets and liabilities)
Opening less closing operating receivables 22,731,312 (50,367,368)
Opening less closing accrued revenue and deferred costs 935,849 (4,919,277)
Opening less closing deferred tax assets 202,590 (2,440,194)
Opening less closing inventories 81,802 (79,306)
Closing less opening operating liabilities (8,008,971) 61,359,423
Closing less opening accrued costs and
deferred revenue, and provisions 1,341,151 3,029,760
c) Net cash from operating activities (a + b) 53,356,324 30,695,629 B. CASH FLOWS FROM INVESTING ACTIVITIES a) Cash receipts from investing activities 857,726,055 1,622,429,706 Interest and dividends received from investing activities 30,054,630 19,486,880
Cash receipts from disposal of intangible assets 6,789,804 192,631
Cash receipts from disposal of property, plant and equipment 16,771 27,107
Cash receipts from disposal of short-term investments 820,864,850 1,602,723,088
b) Cash disbursements from investing activities (938,112,626) (1,728,586,504) Cash disbursements to acquire intangible assets (5,643,872) (644,989)
Cash disbursements to acquire property, plant and equipment (1,607,210) (29,389,211)
Cash disbursements to acquire long-term investments (50,414,544) (112,169,375)
Cash disbursements to acquire short-term investments (880,447,000) (1,586,382,929)
c) Net cash from investing activities (a + b) (80,386,571) (106,156,798)C. CASH FLOWS FROM FINANCING ACTIVITIES a) Cash receipts from fi nancing activities 161,000,000 227,191,555 Cash proceeds from increase in long-term fi nancial liabilities 74,000,000 64,091,555 Cash proceeds from increase in short-term fi nancial liabilities 87,000,000 163,100,000 b) Cash disbursements from fi nancing activities (131,434,720) (152,071,090) Interest paid on fi nancing activities (7,160,006) (4,855,133)
Cash repayments of long-term fi nancial liabilities (6,374,714) 0
Cash repayments of short-term fi nancial liabilities (116,000,000) (138,265,103)
Dividends and other profi t shares paid (1,900,000) (8,950,854)
c) Net cash from fi nancing activities (a + b) 29,565,280 75,120,465D. CLOSING BALANCE OF CASH 6,374,755 3,839,722 x) Net cash fl ow for the period 2,535,033 (340,704) y) Opening balance of cash 3,839,722 4,180,426
* The accompanying notes are an integral part of the fi nancial statements and should be read in conjunction with them.

111
AN
NU
AL
RE
PO
RT
HS
E |
FIN
AN
CIA
L R
EP
OR
T O
F T
HE
CO
MP
AN
Y H
SE
4.7
Sta
tem
en
t o
f ch
an
ge
s i
n e
qu
ity
For
the
year
200
8
* T
he
acc
om
pa
nyi
ng
no
tes a
re a
n in
teg
ral
pa
rt o
f th
e fi
na
ncia
l sta
tem
en
ts a
nd
sh
ou
ld b
e r
ea
d in
co
nju
ncti
on
wit
h t
he
m.
in
€
ITEM
S Ca
lled-
up
Capi
tal
Rev
enue
Rev
alua
tion
Ret
aine
d ne
t N
et p
rofi t
TOTA
L
capi
tal
surp
lus
rese
rves
s
urpl
us
pr
ofi t
or
loss
o
r lo
ss
fo
r th
e pe
riod
N
omin
al
O
ther
rev
enue
Ret
aine
d N
et p
rofi t
ca
pita
l
rese
rves
earn
ings
fo
r th
e ye
ar
A. A
s at
01/
01/2
008
29,5
58,7
89
561,
243,
185
13
8,31
9,12
3
21,8
39,7
90
6,20
5,59
9
0
757,
166,
486
B. M
ovem
ents
to e
quity
0
0
0
62
,261
,577
0
53
,756
,215
11
6,01
7,79
2
e)
Ne
t p
rofi
t o
r lo
ss f
or
the
pe
rio
d
5
3,7
56
,21
5
53
,75
6,2
15
g)
Oth
er
incre
ase
s i
n c
om
po
ne
nts
of
eq
uit
y
62
,26
1,5
77
6
2,2
61
,57
7
C. M
ovem
ents
with
in e
quity
0
0
31
,183
,706
0
(4
,305
,599
) (2
6,87
8,10
7)
0
a) A
llo
ca
tio
n o
f n
et
pro
fi t
as a
co
mp
on
en
t o
f e
qu
ity
in a
cco
rda
nce
wit
h a
ma
na
ge
me
nt
2
6,8
78
,10
7
(26
,87
8,1
07
) 0
an
d s
up
erv
iso
ry b
oa
rd d
ecis
ion
b) A
llo
ca
tio
n o
f n
et
pro
fi t
to a
dd
itio
na
l re
se
rve
s
in a
cco
rda
nce
wit
h a
ge
ne
ral
me
eti
ng
re
so
luti
on
4
,30
5,5
99
(4,3
05
,59
9)
0
D. M
ovem
ents
from
equ
ity
0
0
0
(72,
466,
800)
(1
,900
,000
) 0
(7
4,36
6,80
0)
a)
Pa
yme
nt
of
div
ide
nd
s
0
(1
,90
0,0
00
)
(1,9
00
,00
0)
d)
Tra
nsfe
r o
f re
valu
ati
on
su
rplu
s
(to
op
era
tin
g r
eve
nu
e o
r fi
na
nce
in
co
me
)
(3,1
53
,07
1)
(3,1
53
,07
1)
e)
Oth
er
de
cre
ase
s i
n c
om
po
ne
nts
of
eq
uit
y
(69
,31
3,7
29
)
(6
9,3
13
,72
9)
E. C
losi
ng b
alan
ce fo
r th
e pe
riod
29
,558
,789
56
1,24
3,18
5
169,
502,
829
11
,634
,567
0
26
,878
,108
79
8,81
7,47
8
ACCU
MU
LATE
D P
RO
FIT
0
0
0
0
0
26,8
78,1
08
26,8
78,1
08

112
AN
NU
AL
RE
PO
RT
HS
E |
FIN
AN
CIA
L R
EP
OR
T O
F T
HE
CO
MP
AN
Y H
SE
in
€
ITEM
S Ca
lled-
up
Capi
tal
Rev
enue
Rev
alua
tion
Ret
aine
d ne
t N
et p
rofi t
TOTA
L
capi
tal
surp
lus
rese
rves
s
urpl
us
pr
ofi t
or
loss
o
r lo
ss
fo
r th
e pe
riod
N
omin
al
O
ther
rev
enue
Ret
aine
d N
et p
rofi t
ca
pita
l
rese
rves
earn
ings
fo
r th
e ye
ar
As a
t 01/
01/2
007
4,82
4,80
7
692,
999,
922
12
3,16
2,67
0
7,90
8,71
4
17,9
01,7
09
0
846,
797,
822
Spin
-off
on
01/0
1/20
07
0
(131
,756
,737
) 0
(1
9,35
2)
0 0
(131
,776
,089
)
A. A
s at
01/
01/2
007
afte
r th
e sp
in-o
ff
4,82
4,80
7
561,
243,
185
12
3,16
2,67
0
7,88
9,36
2
17,9
01,7
09
0
715,
021,
733
B. M
ovem
ents
to e
quity
24
,733
,982
0
0
26
,836
,141
0
12
,411
,197
63
,981
,320
a)
Su
bscri
pti
on
of
ca
lle
d-u
p n
om
ina
l ca
pit
al
24
,73
3,9
82
24
,73
3,9
82
e)
Ne
t p
rofi
t o
r lo
ss f
or
the
pe
rio
d
1
2,4
11
,19
7
12
,41
1,1
97
g)
Oth
er
incre
ase
s i
n c
om
po
ne
nts
of
eq
uit
y
26
,83
6,1
41
2
6,8
36
,14
1
C. M
ovem
ents
with
in e
quity
0
0
15
,156
,453
0
(8,9
50,8
55)
(6,2
05,5
98)
0
a)
All
oca
tio
n o
f n
et
pro
fi t
as a
co
mp
on
en
t o
f e
qu
ity
in a
cco
rda
nce
wit
h a
ma
na
ge
me
nt
6
,20
5,5
98
(6
,20
5,5
98
) 0
an
d s
up
erv
iso
ry b
oa
rd d
ecis
ion
b)
All
oca
tio
n o
f n
et
pro
fi t
to a
dd
itio
na
l re
se
rve
s
in a
cco
rda
nce
wit
h a
ge
ne
ral
me
eti
ng
re
so
luti
on
8
,95
0,8
55
(8,9
50
,85
5)
0
D. M
ovem
ents
from
equ
ity
0
0
0
(12,
885,
713)
(8
,950
,854
) 0
(2
1,83
6,56
7)
a)
Pa
yme
nt
of
div
ide
nd
s
(8,9
50
,85
4)
(8
,95
0,8
54
)
d)
Tra
nsfe
r o
f re
valu
ati
on
su
rplu
s (
to o
pe
rati
ng
reve
nu
e o
r fi
na
nce
in
co
me
)
13
,27
8,0
34
1
3,2
78
,03
4
e)
Oth
er
de
cre
ase
s i
n c
om
po
ne
nts
of
eq
uit
y
(26
,16
3,7
47
)
(2
6,1
63
,74
7)
E. C
losi
ng b
alan
ce fo
r th
e pe
riod
29
,558
,789
56
1,24
3,18
5
138,
319,
123
21
,839
,790
0
6,
205,
599
75
7,16
6,48
6
ACCU
MU
LATE
D P
RO
FIT
0
0
0
0
0
6,20
5,59
9
6,20
5,59
9
For
the
year
200
7
* T
he
acc
om
pa
nyi
ng
no
tes a
re a
n in
teg
ral
pa
rt o
f th
e fi
na
ncia
l sta
tem
en
ts a
nd
sh
ou
ld b
e r
ea
d in
co
nju
ncti
on
wit
h t
he
m.

113
AN
NU
AL
RE
PO
RT
HS
E |
FIN
AN
CIA
L R
EP
OR
T O
F T
HE
CO
MP
AN
Y H
SE
4.8 Notes to the fi nancial statements
4.8.1 Balance sheetGeneralInformation on the basis for the preparation of the
balance sheet and on specifi c accounting policies and
methods selected and applied to the company’s sig-
nifi cant transactions and other business events are
presented in notes pertaining to individual assets and
liabilities.
Value of in-kind contribution
The company has no additional information that does
not have to be disclosed in the balance sheet but is
deemed signifi cant for a true and fair presentation of
the company’s operations.
In accordance with HESS’s contract of members, a capi-
tal increase was made by means of an in-kind contribu-
tion on 1 July 2008 (transfer of the project of joint venture
for the construction of HPPs on the lower Sava River).
The value of the in-kind contribution is shown in the ta-
ble below. In the balance sheet of the company HSE, the
assets decreased by € 132,247,935, with liabilities de-
creasing by € 71,593,119. The difference of € 60,654,816
is the value of HSE’s long-term investment in the com-
pany HESS. The transfer of the in-kind contribution did
not affect the company’s income statement.
in €
ASSETS (132,247,935)
A. LONG-TERM ASSETS (121,732,611)II. Property, plant and equipment (121,732,611)1. Land and buildings (32,586,595)
b) Buildings (32,586,595)
2. Production plant and equipment (32,135,455)
3. Other plant and equipment (106,495)
4. Property, plant and equipment being acquired (56,904,066)
a) Property, plant and equipment in the course of construction (48,728,156)
b) Advances for acquisition of property, plant and equipment (8,175,910)
B. CURRENT ASSETS (10,515,324)III. Short-term investments (8,250,000)2. Short-term loans (8,250,000)
b) Short-term loans to others (8,250,000)
IV. Short-term operating receivables (2,263,067)3. Short-term operating receivables from others (2,263,067)
V. Cash (2,257)
LIABILITIES (71,593,119)
C. LONG-TERM LIABILITIES (59,545,423)II. Long-term operating liabilities (59,545,423)1. Long-term operating liabilities to group companies (39,960,823)
2. Long-term operating trade liabilities (1,269,223)
5. Other long-term operating liabilities (18,315,377)
III. Deferred tax liabilities 0 D. SHORT-TERM LIABILITIES (10,862,278)III. Short-term operating liabilities (10,862,278)1. Short-term operating liabilities to group companies (364,283)
2. Short-term operating trade liabilities (10,497,995)
E. SHORT-TERM ACCRUED COSTS AND DEFERRED REVENUE (1,185,418)

114
AN
NU
AL
RE
PO
RT
HS
E |
FIN
AN
CIA
L R
EP
OR
T O
F T
HE
CO
MP
AN
Y H
SE
Exposure to risks associated with individual types
of assets and liabilities and their management have
been disclosed in the business report.
Assets and liabilities are carried at fair value unless
the fair value of an asset or liability cannot be deter-
mined. In this case, they are carried at historical cost.
Below we provide the disclosures of individual balance
sheet items as at 31/12/2008.
(1) Intangible assets € 8,178,427Long-term property rights include the following in-
tangible assets:
• software under development or in use,
• CO2 emission coupons (for trading) and
• investments in other entities’ fi xed assets.
The software in use comprises various computer ap-
plications (ENDUR – for electricity trading, UPIS –
management information system, etc.).
Software is amortised at rates ranging from 4.56 to
33.33%, depending on the envisaged useful life.
In 2008 the company reviewed the useful lives of im-
portant software items, determining that the useful
lives were appropriate given the current expectations
regarding the usability of these assets.
In 2008 the company transferred, for a consideration,
a concession right associated with HPP Boštanj and
HPP Blanca to HESS.
At the beginning of 2008, the company had 729,560
CO2 emission coupons. In 2008 it purchased 489,338
and sold 843,898 CO2 emission coupons. On the bal-
ance sheet date, the company’s stock of CO2 emission
coupons (valid for the period 2008-2012) amounted to
375,000 coupons. During the year, the company used
the moving average price method to reduce value of
the stock, which was impaired by € 509,780 at the end
of 2008 based on an agreement for the sale of the en-
tire stock of coupons.
Cost and accumulated amortisation of intangible assets as at 31/12/2007
Cost and accumulated amortisation of intangible assets as at 31/12/2008
in €
AS AT 31/12/2007 PROPERTY RIGHTS CO2 EMISSION COUPONS TOTAL
Cost 6,179,572 3,538,366 9,717,938
Accumulated amortisation 1,287,480 0 1,287,480
Carrying amount 4,892,092 3,538,366 8,430,458
in €
AS AT 31/12/2008 PROPERTY RIGHTS CO2 EMISSION COUPONS TOTAL
Cost 4,081,609 6,457,280 10,538,889
Accumulated amortisation 1,850,682 509,780 2,360,462
Carrying amount 2,230,927 5,947,500 8,178,427

115
AN
NU
AL
RE
PO
RT
HS
E |
FIN
AN
CIA
L R
EP
OR
T O
F T
HE
CO
MP
AN
Y H
SE
Changes in intangible assets
Property, plant and equipment depreciation categories
in €
LONG-TERM PROPERTY INTANGIBLE RIGHTS (excluding CO2 EMISSION ASSETS emission coupons) COUPONS TOTAL
Carrying amount as at 31/12/2007 4,892,092 3,538,366 8,430,458
Acquisitions 90,683 7,081,428 7,172,111
*Transfers 99,482 0 99,482
Decreases (2,208,167) (4,162,514) (6,370,681)
Amortisation (643,163) 0 (643,163)
Revaluation 0 (509,780) (509,780)
Carrying amount as at 31/12/2008 2,230,927 5,947,500 8,178,427
in €
CATEGORY OF PROPERTY, PLANT AND EQUIPMENT DEPRECIATION RATE USEFUL LIFE
Buildings 2% - 3% 33 - 50 years
Furniture 10% - 25% 4 - 10 years
Computer equipment 10% - 50% 2 - 10 years
Small tools 25% - 33.33% 3 - 4 years
Cars 12.5% - 20% 5 - 8 years
Other equipment 15% - 25% 4 - 6,7 years
(2) Property, plant and equipment € 6,774,756The value of buildings relates to business premises in
Ljubljana and Sevnica.
The company’s other plant and equipment include
equipment for the collection of data about electricity
production at the Group level, telecommunication net-
work equipment, computer equipment, offi ce equip-
ment and means of transport.
Property, plant and equipment in the course of con-struction mainly include initial investments in HPPs on
the middle Sava River.
In 2008 the software used in the balancing group con-
trol centre was transferred from property, plant and
equipment in the course of construction to intangible
assets in the amount of € 99,482.
The decrease in the value of property, plant and equip-
ment arising from the in-kind contribution associated
with the joint venture for the construction of HPPs on
the lower Sava River totalled € 121,732,611.
The company does not have any items of property, plant
and equipment held under fi nance lease or mortgage.
The company checked whether there were any reasons
for the impairment of property, plant and equipment,
determining there were none.
* Note to property, plant and equipment.
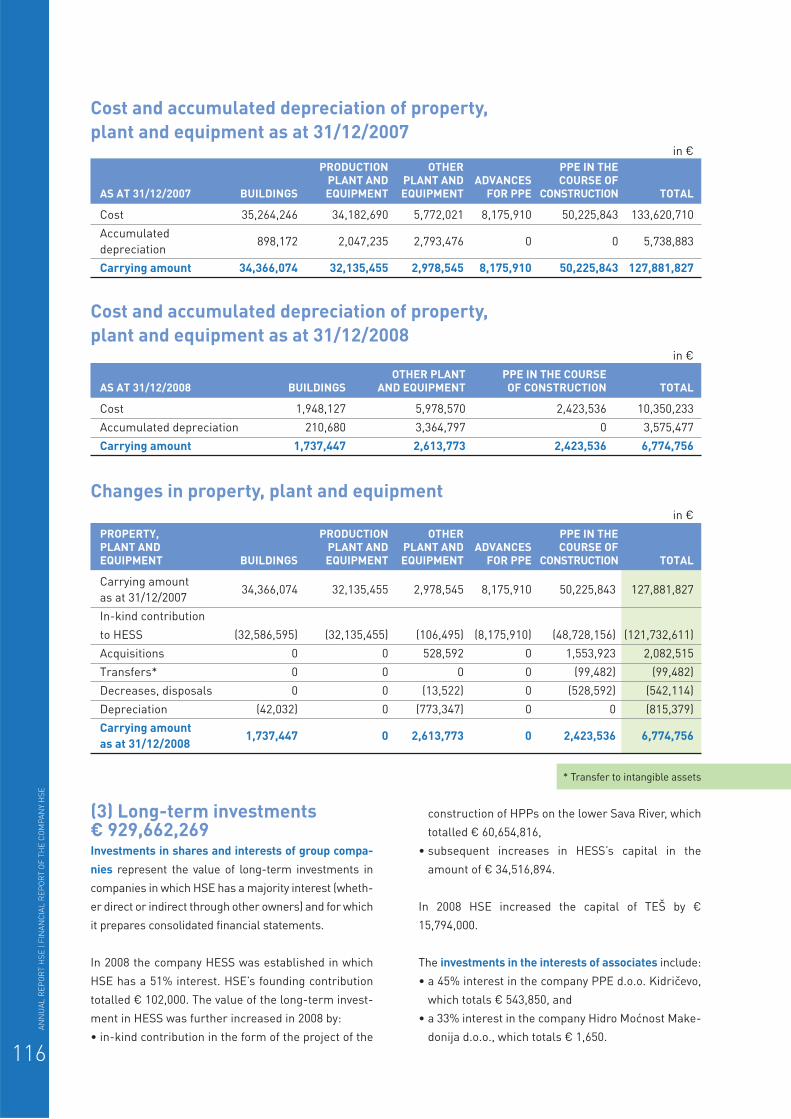
116
AN
NU
AL
RE
PO
RT
HS
E |
FIN
AN
CIA
L R
EP
OR
T O
F T
HE
CO
MP
AN
Y H
SE
Cost and accumulated depreciation of property, plant and equipment as at 31/12/2007
Cost and accumulated depreciation of property, plant and equipment as at 31/12/2008
Changes in property, plant and equipment
in €
PRODUCTION OTHER PPE IN THE PLANT AND PLANT AND ADVANCES COURSE OF AS AT 31/12/2007 BUILDINGS EQUIPMENT EQUIPMENT FOR PPE CONSTRUCTION TOTAL
Cost 35,264,246 34,182,690 5,772,021 8,175,910 50,225,843 133,620,710
Accumulated
depreciation 898,172 2,047,235 2,793,476 0 0 5,738,883
Carrying amount 34,366,074 32,135,455 2,978,545 8,175,910 50,225,843 127,881,827
in €
OTHER PLANT PPE IN THE COURSEAS AT 31/12/2008 BUILDINGS AND EQUIPMENT OF CONSTRUCTION TOTAL
Cost 1,948,127 5,978,570 2,423,536 10,350,233
Accumulated depreciation 210,680 3,364,797 0 3,575,477
Carrying amount 1,737,447 2,613,773 2,423,536 6,774,756
in €
PROPERTY, PRODUCTION OTHER PPE IN THE PLANT AND PLANT AND PLANT AND ADVANCES COURSE OF EQUIPMENT BUILDINGS EQUIPMENT EQUIPMENT FOR PPE CONSTRUCTION TOTAL
Carrying amount
as at 31/12/2007 34,366,074 32,135,455 2,978,545 8,175,910 50,225,843 127,881,827
In-kind contribution
to HESS (32,586,595) (32,135,455) (106,495) (8,175,910) (48,728,156) (121,732,611)
Acquisitions 0 0 528,592 0 1,553,923 2,082,515
Transfers* 0 0 0 0 (99,482) (99,482)
Decreases, disposals 0 0 (13,522) 0 (528,592) (542,114)
Depreciation (42,032) 0 (773,347) 0 0 (815,379)
Carrying amount as at 31/12/2008
1,737,447 0 2,613,773 0 2,423,536 6,774,756
(3) Long-term investments€ 929,662,269Investments in shares and interests of group compa-nies represent the value of long-term investments in
companies in which HSE has a majority interest (wheth-
er direct or indirect through other owners) and for which
it prepares consolidated fi nancial statements.
In 2008 the company HESS was established in which
HSE has a 51% interest. HSE’s founding contribution
totalled € 102,000. The value of the long-term invest-
ment in HESS was further increased in 2008 by:
• in-kind contribution in the form of the project of the
construction of HPPs on the lower Sava River, which
totalled € 60,654,816,
• subsequent increases in HESS’s capital in the
amount of € 34,516,894.
In 2008 HSE increased the capital of TEŠ by €
15,794,000.
The investments in the interests of associates include:
• a 45% interest in the company PPE d.o.o. Kidričevo,
which totals € 543,850, and
• a 33% interest in the company Hidro Moćnost Make-
donija d.o.o., which totals € 1,650.
* Transfer to intangible assets

117
AN
NU
AL
RE
PO
RT
HS
E |
FIN
AN
CIA
L R
EP
OR
T O
F T
HE
CO
MP
AN
Y H
SE
Cost and revaluation of long-term investments
Changes in long-term investments
in €
INVESTMENTS IN INVESTMENTS OTHER SHARES AND IN SHARES INVESTMENTS INTERESTS OF AND IN SHARES OTHER GROUP COMPANIES INTERESTS OF AND LONG-TERM AS AT 31/12/2008 EXCEPT ASSOCIATES ASSOCIATES INTERESTS INVESTMENTS TOTAL
Cost 969,378,441 545,500 43,536,871 1,669 1,013,462,481
*Revaluation 83,800,212 0 0 0 83,800,212
Carrying amount 885,578,229 545,500 43,536,871 1,669 929,662,269
in €
INVESTMENTS IN INVESTMENTS OTHER SHARES AND IN SHARES INVESTMENTS INTERESTS OF AND IN SHARES OTHER GROUP COMPANIES INTERESTS OF AND LONG-TERM INVESTMENTS EXCEPT ASSOCIATES ASSOCIATES INTERESTS INVESTMENTS TOTAL
Carrying amount
as at 31/12/2007 774,510,519 543,850 43,536,871 472,199 819,063,439
In-kind contribution to HESS 60,654,816 0 0 0 60,654,816
Acquisitions 0 1,650 0 0 1,650
Increase 50,412,894 0 0 0 50,412,894
Reversal of enhancement 0 0 0 (470,530) (470,530)
Carrying amount as at 31/12/2008
885,578,229 545,500 43,536,871 1,669 929,662,269
Other shares and interests include investments in
the company Toplofi katsia-Ruse AD amounting to €
43,425,871 and in the company Stelkom (19% interest)
amounting to € 111,000.
The company has a 51% interest in Toplofi katsia-Ruse
AD and holds 51% of voting rights. But because a
higher majority is required in order for general meet-
ing decisions to be valid, HSE cannot make strategic
decisions without the approval of the other owner. The
same decision-making conditions also apply to the
other owner. The company has already reached an
agreement with the other partner to transfer its 51%
interest by the end of 2010, meaning that the company
no longer has a right to receive its share of profi t. Due
to the above facts, the company Toplofi katsia-Ruse
AD has not been included in the consolidated fi nancial
statements of the HSE Group. The investment is val-
ued at cost in the company’s separate fi nancial state-
ments and the consolidated fi nancial statements of
the HSE Group. The company considers more detailed
disclosures to be a business secret.
The investment in Technological Centre for Research
and Experimental Development (Tehnološki center za
raziskave in eksperimentalni razvoj) amounting to €
1,669 was recorded as other long-term investments.
Due to a negative fair value of interest rate swaps, the
company no longer recorded those as other long-term
investments in 2008 but as other long-term fi nancial
liabilities.
None of the companies which are solely or partly
owned by the company are listed. Consequently, it
was not possible to determine the reasons for a po-
tential impairment based on stock market prices as
laid down in Interpretation 1 of SAS 3 Impairment of
Investments issued by the Slovene Institute of Audi-
tors. But the company did check potential reasons for
impairment by comparing the difference between the
carrying amount of the company’s long-term invest-
ments with the proportionate share of the carrying
amount of subsidiaries’ and associates’ total equity.
No reasons for impairment were determined.
* Revaluation of investments relates to the impairment of investments in HSE Group companies in previous years.

118
AN
NU
AL
RE
PO
RT
HS
E |
FIN
AN
CIA
L R
EP
OR
T O
F T
HE
CO
MP
AN
Y H
SE
Changes in long-term investments in group companies
Long-term investments in group companies
in €
GROUP COMPANIES 2008
Increase in investment in TEŠ 15,794,000
In-kind contribution to HESS 60,654,816
Increase in long-term investment in HESS 34,618,894
Total changes in long-term investments 111,067,710
in €
GROUP COMPANIES 31/12/08 31/12/07
Dravske elektrarne Maribor d.o.o. 387,058,979 387,058,979
Soške elektrarne Nova Gorica d.o.o. 152,692,249 152,692,249
Termoelektrarna Šoštanj d.o.o. 130,658,977 114,864,977
Premogovnik Velenje d.d. 89,635,483 89,635,483
HSE Invest d.o.o. 80,000 80,000
HSE Italia S.r.l. 29,690 29,690
HSE Hungary Kft. 4,004,965 4,004,965
HSE Balkan Energy d.o.o. 1,025,063 1,025,063
HSE Adria d.o.o. 102,553 102,553
Termoelektrarna Trbovlje d.o.o. 24,503,340 24,503,340
HESS d.o.o. 95,273,710 0
HSE Bulgaria EOOD 513,220 513,220
Total long-term investments in group companies 885,578,229 774,510,519
Long-term investments in group companies
DRAVSKE ELEKTRARNE MARIBOR d.o.o., Obrežna ulica 170, 2000 Maribor, Slovenia
• HSE’s interest: 100%
• total equity: 502,691,265 €
• net profi t or loss for 2008: 15,442,181 €
SOŠKE ELEKTRARNE NOVA GORICA d.o.o., Erjavčeva 20, 5000 Nova Gorica, Slovenia
• HSE’s interest: 100%
• total equity: 162,448,132 €
• net profi t or loss for 2008: 10,079,588 €
TERMOELEKTRARNA ŠOŠTANJ d.o.o., Cesta Lole Ribarja 18, 3325 Šoštanj, Slovenia
• HSE’s interest: 100%
• total equity: 258,858,911 €
• net profi t or loss for 2008: 18,037,177 €
PREMOGOVNIK VELENJE d.d., Partizanska cesta 78, 3320 Velenje, Slovenia
• HSE’s interest: 77,73%
• total equity: 109,714,170 €
• net profi t or loss for 2008: 403,385 €
HSE INVEST d.o.o., Obrežna ulica 170a, 2000 Maribor, Slovenia
• HSE’s interest: 25% (direct); 75% (indirect)
• total equity: 530,205 €
• net profi t or loss for 2008: 164,055 €
TERMOELEKTRARNA TRBOVLJE d.o.o., Ob železnici 27, 1420 Trbovlje, Slovenia
• HSE’s interest: 81,33%
• total equity: 34,101,844 €
• net profi t or loss for 2008: 2,169,256 €
HIDROELEKTRARNE NA SPODNJI SAVI d.o.o., Cesta prvih borcev 18, 8250 Brežice, Slovenia
• HSE’s interest: 51% (direct); 84,6% (indirect)

119
AN
NU
AL
RE
PO
RT
HS
E |
FIN
AN
CIA
L R
EP
OR
T O
F T
HE
CO
MP
AN
Y H
SE
• total equity: 187,751,171 €
• net profi t or loss for 2008: 939,971 €
HSE ITALIA S.r.l.,Via Roma 20, Gorizia, Italy
• HSE’s interest: 100%
• total equity: 46,247 €
• net profi t or loss for 2008: 5,238 €
HSE HUNGARY Kft.,Karolyi Mihaly u. 12, Budapest, Hungary
• HSE’s interest: 100%
• total equity: HUF 1,457,901,661 or 5,466,448 €
• net profi t or loss for 2008: HUF 131,596,475
or 506,220 €
HSE BALKAN ENERGY d.o.o.,Bulevar Mihaila Pupina 117, Belgrade, Serbia
•HSE’s interest: 100%
• total equity: RSD 81,166,543 or 908,190 €
• net profi t or loss for 2008: RSD 138,199 or 1,637 €
HSE ADRIA d.o.o.,Miramarska 24, Zagreb, Croatia
• HSE’s interest: 100%
• total equity: HRK 5,037,925 or 684,919 €
• net profi t or loss for 2008: HRK 2,654,934 or 361,419 €
HSE BULGARIA EOOD, 37 Fridtjof Nansen Street, Sofi a, Bulgaria
• HSE’s interest: 100%
• total equity: BGN 868,280 or 443,951 €
• net profi t or loss for 2008: -BGN 120,256 or -61,485 €
PLINSKO PARNA ELEKTRARNA d.o.o., KIDRIČEVO,Tovarniška 10, 2325 Kidričevo, Slovenia
• HSE’s interest: 45%
• total equity: 1,223,482 €
• net profi t or loss for 2008: 14,840 €
HIDRO MOĆNOST MAKEDONIJA D.O.O., Ul. Orce Nikolov br. 98, Skopje, Macedonia
• HSE’s interest: 33%
• total equity: MKD 307,062 or 5,067 €
• net profi t or loss for 2008: /
TOPLOFIKATSIA RUSE AD, TEC IZTOK STR. 7009 Ruse, Bulgaria
• HSE’s interest: 51%
• total equity: BGN 47,124,646 or 24,094,819 €
• net profi t or loss for 2008: BGN 2,568,583
or 1,313,316 €
(4) Long-term operating receivables € 2,715,058Long-term operating receivables from others relate to
deposits made as collaterals in connection with elec-
tricity trading in Slovenia and on foreign exchanges. In
2008 collaterals of € 2,454,751 were transferred from
short-term receivables from others as they related to
trading in foreign exchanges, which is planned to be
of a long-term nature. The difference of € 260,307 re-
lates to an increase in collaterals in 2008.
(5) Deferred tax assets€ 4,189,192Deferred tax assets were created on the basis of ex-
penses which infl uence the company’s profi t or loss
for the current year but are not deductible for tax pur-
poses in the current year and expenses arising from
the revaluation of derivatives.
Deferred tax assets of € 202,590 have been recognised
in the income statement, with deferred tax assets of €
31,326 being recognised in the balance sheet.
In 2008 the decrease in deferred tax assets was higher
than the amount created. The changes were as fol-
lows:
• creation of deferred tax assets at 50% of tax non-
deductible provisions for termination and jubilee
benefi ts in 2008,
• creation of deferred tax assets for the depreciation
of fi xed assets in cases when operating depreciation
exceeds the amount of tax deductible depreciation,
• creation of deferred tax assets in the amount of the
negative fair value of interest rate swaps,
• use of deferred tax assets in connection with the use
of provisions for termination and jubilee benefi ts,
• use of deferred tax assets in connection with the use
of provisions relating to guarantees of origin,
• reversal of deferred tax assets to decrease provisions
relating to guarantees of origin,
• use of deferred tax assets for the depreciation of
fi xed assets.

120
AN
NU
AL
RE
PO
RT
HS
E |
FIN
AN
CIA
L R
EP
OR
T O
F T
HE
CO
MP
AN
Y H
SE
Changes in deferred tax assets in €
DEFERRED DEPRECIATION AND INTEREST TAX ASSETS PROVISIONS IMPAIRMENT AMORTISATION RATE SWAPS TOTAL
Value as at 31/12/2007 1,400,026 2,936,783 23,645 0 4,360,454
Creation, increase 3,634 0 67,692 31,326 102,652
Use, decrease (273,494) 0 (420) 0 (273,914)
Value as at 31/12/2008 1,130,166 2,936,783 90,917 31,326 4,189,192
(6) Short-term investments€ 68,242,000At the end of 2008, the company’s short-term invest-
ments included short-term deposits with Slovene
banks and with maturity in January 2009. The deposits
have not been secured. In accordance with its internal
rules, the company observes the principle of deposit
diversifi cation between individual banks and monitors
their credit ratings.
As part of transferring the joint venture for the con-
struction of HPPs on the lower Sava River in the form
of an in-kind contribution, the company also trans-
ferred the deposits of € 8,250,000, which had been re-
corded as short-term investments at the end of 2007.
The company estimates that the investments are not
exposed to risk.
• short-term receivables from the state, which mainly
relate to an input VAT receivable,
• short-term operating receivables from others, which
mainly relate to cash given over a short term in re-
spect of a guarantee received abroad.
As part of transferring the joint venture for the con-
struction of HPPs on the lower Sava River in the form
of an in-kind contribution, the company also trans-
ferred the receivables of € 2,263,067, which had been
recorded as short-term receivables from others at the
end of 2007.
Trade receivables are mainly settled within deadlines
or with minor delays. In the case of delays, the custom-
ers in Slovenia and abroad are charged default interest
at the contractual rate. All overdue receivables (except
the disputed ones), which stood at € 16,963,317, were
collected up to the date of this report.
The disputed receivables include a receivable of €
14,683,915 for which a court collection was initiated
in €
TYPE OF SHORT-TERM INVESTMENT 31/12/08 31/12/07
Short-term loans to group companies 0 3,246,850
Short-term loans to others 0 200,000
Short-term deposits 68,242,000 13,463,000
Total short-term investments 68,242,000 16,909,850
(7) Short-term operating receivables € 127,497,862Short-term operating receivables from group compa-
nies mainly relate to receivables arising from electric-
ity sales and receivables arising from services of per-
forming certain functions on behalf of subsidiaries.
Short-term trade receivables mainly comprise re-
ceivables from the sale of electricity in Slovenia and
abroad.
Short-term operating receivables from others in-
clude:
• short-term advances made mainly in connection
with electricity auctions,
• short-term receivables from operations for third
party account relating to a receivable from the com-
pany TDR–Metalurgija d.d. - v stečaju,
• short-term operating receivables associated with fi -
nance income from interest on deposits, and receiv-
ables from default interest payable by customers,

121
AN
NU
AL
RE
PO
RT
HS
E |
FIN
AN
CIA
L R
EP
OR
T O
F T
HE
CO
MP
AN
Y H
SE
Short-term operating receivables
Short-term operating receivables from group companies
in March 2008 and which was recorded as disputed in
2007. The receivable in question relates to the provi-
sion system services.
The company had no receivables due from management
and Supervisory Board members at the end of 2008.
Electricity-related trade receivables arising from an-
nual contracts are mostly secured with bills of ex-
change or bank guarantees. Such are the receivables
that exceed customer limits. Receivables from cer-
tain customers are regulated in detail using the EFET
Agreements, whereas in other cases collateralisation
is not required due to customers’ strategic position
and/or fi nancial stability. For each customer, the de-
cision whether a security is required is taken on the
basis of System Credit Risk Management Instructions
and System Credit Risk Identifi cation and Monitoring
Instructions, which, among other things, lay down the
setting of limits and monitoring of their utilisation.
Short-term electricity trading is carried out through
exchanges (in this case receivables are already se-
cured by the obligatory membership system), through
trading portals and bilateral agreements. In the latter
case, the EFET Agreements are concluded with most
of the customers, except in the case of receivables for
which collateralisation is not required due to custom-
ers’ specifi cs circumstances, as is the case with trad-
ing under annual contracts, or when receivables are
secured with counter guarantees because a limit for a
certain customer has been exceeded.
The collateralisation of other receivables is not re-
quired due to their specifi c nature.
In our opinion, the trade receivables risk is well man-
aged thanks to the above-mentioned measures.
in €
TYPE OF RECEIVABLE 31/12/08 31/12/07
Short-term trade receivables in Slovenia 66,625,301 92,913,776
Short-term foreign trade receivables 32,565,626 30,304,798
Short-term advances for services in Slovenia not yet provided 2,743,872 690,557
Short-term advances for services abroad not yet provided 7,500 0
Short-term receivables from operations for third party account 614,709 41,473
Short-term receivables associated with fi nance income 181,706 181,762
Short-term receivables from the state 24,046,748 28,110,024
Short-term receivables from others 712,400 2,841,524
Total short-term operating receivables 127,497,862 155,083,914
in €
GROUP COMPANIES 31/12/08 31/12/07
Dravske elektrarne Maribor d.o.o. 8,592 75,670
Soške elektrarne Nova Gorica d.o.o. 8,592 2,701
Premogovnik Velenje d.d. 852,737 481,319
HESS d.o.o. 59,956 0
HSE Balkan Energy d.o.o. 22,396 88,945
HSE Hungary Kft. 613,687 2,260,121
HSE Adria d.o.o. 27,993 17,917
HSE Bulgaria EOOD 19,785 6,000
HSE Italia S.r.l. 1,451 1,451
Total short-term operating receivables from group companies 1,615,189 2,934,124

122
AN
NU
AL
RE
PO
RT
HS
E |
FIN
AN
CIA
L R
EP
OR
T O
F T
HE
CO
MP
AN
Y H
SE
Breakdown of receivables by maturity date
Short-term accrued revenue and deferred costs of the company
in €
MATURITY PERIOD 31/12/08 31/12/07Receivables not yet due 110,534,545 139,916,028
Receivables overdue up to 3 months 16,963,317 24,499,490
Receivables overdue from 3 to 6 months 0 2,281,843
Receivables overdue for more than 6 months 14,683,915 3,070,988
in €
TYPE OF SHORT-TERM ACCRUED REVENUE AND DEFERRED COSTS 31/12/08 31/12/07
Short-term deferred costs 1,947,320 5,495,431
Short-term accrued revenues 3,198,858 586,596
Total accrued revenue and deferred costs 5,146,178 6,082,027
(8) Cash € 6,374,755 Cash includes the cash in the company’s accounts in
Slovenia and abroad and deposits redeemable at no-
tice in Slovenia and abroad.
At the end of 2008, the company had in place an au-
tomatic borrowing facility in the form of overdrafts on
its transaction accounts with banks amounting to €
12,000,000, but did not use them.
As part of transferring the joint venture for the con-
(10) Equity € 798,817,478The value of nominal capital and capital surplus re-
mained unchanged in 2008.
Other revenue reserves increased by € 31,183,706
as follows:
• by a portion of accumulated profi t for 2007 amount-
ing to € 4,305,599 in accordance with a General
Meeting resolution,
• by a portion of net profi t for 2008 amounting to €
26,878,107 in accordance with a Supervisory Board
decision taken on the management’s proposal.
The company’s revaluation surplus includes gains or
losses on futures used for hedging and the fair value of
interest rate swaps. Revaluation surplus decreased by
€ 10,205,223 as a result of completed futures and in-
terest rate swap transactions as well as lower electric-
ity prices and interest rates as compared with 2007.
Electricity futures are concerned with the closing of
deals on the purchase of electricity in foreign exchang-
es in the future, thus securing the already concluded
deals for the sale of electricity in the same period.
Revaluation surplus and the cost of goods sold were
decreased in the income statement by the amounts of
electricity purchases in 2008 that were hedged using
futures, i.e. by € 4,379,971.
In 2008 the company also entered into futures on CO2
emission coupons for the year 2008, thereby increas-
ing the cost of coupons, which were recorded as intan-
gible assets, by € 1,226,900.
The fair value of interest rate swaps totalled € 117,851
(including accounted for deferred taxes) at the end of
2008. Due to a drop in interest rates, the company sold
the majority of interest rate swaps in December 2008.
struction of HPPs on the lower Sava River in the form
of an in-kind contribution, the company also trans-
ferred € 2,257 in cash.
(9) Short-term accrued revenue and deferred costs € 5,146,178The majority of short-term accrued revenue and de-
ferred costs relates to transactions associated with
electricity trading (auction costs, electricity devia-
tions).

123
AN
NU
AL
RE
PO
RT
HS
E |
FIN
AN
CIA
L R
EP
OR
T O
F T
HE
CO
MP
AN
Y H
SE
Changes in capital surplus
Changes in revaluation surplus
in €
TOTAL EQUITY 31/12/08 31/12/07
Nominal capital 29,558,789 29,558,789
Capital surplus 561,243,185 561,243,185
Other revenue reserves 169,502,829 138,319,123
Revaluation surplus 11,634,567 21,839,790
Net profi t or loss for the period 26,878,108 6,205,599
Total equity 798,817,478 757,166,486
in €
PROFIT OR LOSS OF THE COMPANY AFTER EQUITY RESTATEMENT 31/12/08
Net profi t or loss 53,756,215
Equity restatement result (15,860,596)
Profi t or loss after restatement based on consumer prices (2.1% growth) 37,895,619
in €
GENERAL EQUITY PAID-IN CAPITAL REVALUATION CAPITAL SURPLUS SURPLUS ADJUSTMENT TOTAL
Value as at 31/12/2007 561,243,072 113 561,243,185
Increase 0 0 0
Decrease 0 0 0
Revaluation 0 0 0
Value as at 31/12/2008 561,243,072 113 561,243,185
in €
REVALUATION CO2 FORWARD INTEREST SURPLUS FUTURES CONTRACTS SWAPS TOTAL
Value as at 31/12/2007 21,369,260 0 470,530 21,839,790
Increase 61,735,727 525,850 0 62,261,577
Decrease (66,972,598) (1,752,750) (588,381) (69,313,729)
Increase in operating expenses 68,618 0 0 68,618
Decrease in operating expenses (4,448,589) 0 0 (4,448,589)
Increase in cost of CO2 coupons 0 1,226,900 0 1,226,900
Value as at 31/12/2008 11,752,418 0 (117,851) 11,634,567
Retained net profi t or loss for the year 2007, which to-
talled € 6,205,599, was transferred to other revenue re-
serves (€ 4,305,599) and paid to the owner (€ 1,900,000),
in accordance with a General Meeting resolution.
Net profi t or loss for the year 2008, which totalled €
53,756,215, was allocated, in accordance with a Su-
pervisory Board decision taken on the proposal of the
company’s management, to other revenue reserves (€
26,878,107) while the difference (€ 26,878,108) repre-
sents the company’s accumulated profi t.
Consumer prices increased by 2.1% in 2008. Had the
increase in consumer prices been taken into account,
the total capital of the company would have increased
by € 15,860,596. The restatement of equity does not
include net profi t or loss for the current period, dis-
tributed retained profi t or loss, and changes in revalu-
ation surplus in 2008.
Had the said restatement been taken into account, the
company would have recorded a net profi t or loss of €
37,895,619 in the current year.

124
AN
NU
AL
RE
PO
RT
HS
E |
FIN
AN
CIA
L R
EP
OR
T O
F T
HE
CO
MP
AN
Y H
SE
(11) Provisions € 19,175,683At the end of 2008, the company’s provisions included:
• provisions for termination and jubilee benefi ts,
• provisions arising from the sales of electricity pro-
duced from renewable sources in 2006 and set aside
due to the non-recognition by Italy of guarantees of
origin; the company initiated an arbitration proce-
dure with the European Commission and expects to
receive a decision shortly,
(12) Long-term liabilities€ 161,302,465The company’s long-term liabilities include the fol-
lowing long-term fi nancial loans:
• long-term fi nancial loan taken out with a syndicate
of Slovene banks in 2003 for the period of 12 years,
• long-term fi nancial loan taken out with a Slovene
bank in 2006 for the period of 5 years,
• long-term fi nancial loan taken out with a Slovene
bank in 2007 for the period of 10 years,
• long-term fi nancial loan taken out with a Slovene
bank in 2007 for the period of three years, and
• long-term fi nancial loan taken out with the EIB in
2008 for the period of 20 years.
The values of loan principals due in 2009 are recorded
as short-term liabilities to banks. Interest on the loans
received is paid on a quarterly or annual basis, while
the not yet due and accounted for portion payable in
2008 is recorded as a short-term operating liability.
• provisions for the payment of the fee for limited area
use for 2007,
• provisions for lawsuits fi led by the company TDR-
Metalurgija d.d.- v stečaju and its related companies
and employees.
Long-term accrued cost and deferred revenue items totalling € 1,471,334 include a liability arising from in-
direct electricity costs for 2002, which was transferred
from short-term accrued cost and deferred revenue
items in 2008.
The long-term loan taken out in 2003 will be fully re-
paid in October 2015. The principal is being repaid on
a quarterly basis. The agreed-upon interest rate is
a 3-month EURIBOR plus a minimum mark-up. The
loan is secured with ten blank bills of exchange.
Due to changes in the money market brought about by
the global fi nancial crisis, two contracts for the inter-
est rate hedging of this loan were cancelled in 2008.
Only the interest cap operation, which closes on 4
January 2010, remained active.
The long-term loan taken out in 2006 will be fully re-
paid in December 2011. The principal is being repaid
on a quarterly basis. The agreed-upon interest rate is
a 3-month EURIBOR plus a minimum mark-up. The
loan is secured with six blank bills of exchange.
The company entered into a 5-year interest rate swap
contract effective 01/12/2006 to hedge against in-
creasing interest rates in the future. The estimated
Changes in provisions and long-term accrued costs and deferred revenue in €
PROVISIONS AND PROVISIONS FOR LONG-TERM LONG-TERM ACCRUED TERMINATION ACCRUED COSTS
COSTS AND AND JUBILEE OTHER AND DEFERRED DEFERRED REVENUE BENEFITS PROVISIONS REVENUE TOTAL
Value as at 31/12/2007 410,915 7,532,716 0 7,943,631
Creation, increases 36,328 10,740,021 0 10,776,349
*Transfers 0 0 1,471,334 1,471,334
Use (15,631) (12,176) 0 (27,807)
Reversal 0 (987,824) 0 (987,824)
Value as at 31/12/2008 431,612 17,272,737 1,471,334 19,175,683Creation planned 521,838 6,356,062 0 6,877,900
Use planned 26,838 0 0 26,838
*Transfer from short-term accrued costs and deferred revenue.

125
AN
NU
AL
RE
PO
RT
HS
E |
FIN
AN
CIA
L R
EP
OR
T O
F T
HE
CO
MP
AN
Y H
SE
fair value of the interest rate swap, which totalled €
-149,178 as at 31/12/2008, is recorded under other
long-term liabilities and revaluation surplus.
The long-term loan taken out in 2007 will be fully re-
paid in January 2017. The principal will be repaid on
a semi-annual basis (the fi rst repayment in January
2009). The agreed-upon interest rate is a 6-month EU-
RIBOR plus a minimum mark-up. The loan is secured
with six blank bills of exchange.
Due to changes in the money market brought about by
the global fi nancial crisis, two contracts for the inter-
est rate hedging were cancelled in 2008 also for this
loan.
The long-term loan taken out in 2007 will be fully re-
paid in December 2010. The principal will be repaid in
a single amount when due. The agreed-upon interest
rate is a 6-month EURIBOR plus a minimum mark-up.
The loan is secured with fi ve blank bills of exchange.
The long-term loan taken out in 2008 will be fully re-
paid in September 2028. The principal will be repaid on
a semi-annual basis (the fi rst repayment in Septem-
ber 2012). The agreed-upon interest rate is a 6-month
EURIBOR plus a minimum mark-up. The loan is fully
secured with a guarantee issued by a foreign bank for
a seven-year period.
Long-term operating trade liabilities include a with-
held payment to an equipment supplier.
As part of transferring the joint venture for the con-
struction of HPPs on the lower Sava River in the form
of an in-kind contribution, the company also trans-
ferred long-term operating liabilities of € 59,545,423,
which had been recorded at the end of 2007 as:
• long-term operating liabilities to group companies
(€ 39,960,823),
• long-term operating trade liabilities (€ 1,269,223),
and
• other long-term operating liabilities (€ 18,315,377).
The carrying amount of long-term liabilities is esti-
mated to equal their fair value.
Maturity dates of long-term liabilities in €
Maturity date LONG-TERM before between 01/01/2011 LIABILITIES 31/12/2010 and 31/12/2012 after 01/01/2013 TOTAL
Long-term fi nancial liabilities to banks 44,686,957 18,920,188 97,510,862 161,118,007
Long-term fi nancial liabilities to others 149,179 0 0 149,179
Long-term operating trade liabilities 35,279 0 0 35,279
Total 44,871,415 18,920,188 97,510,862 161,302,465
(13) Short-term liabilities€ 173,979,273The value of short-term fi nancial liabilities to banks
relates to a portion of long-term loan principals fall-
ing due in 2009.
The company’s short-term operating liabilities to
group companies mainly relate to liabilities associ-
ated with the electricity purchased from subsidiaries.
The company’s short-term operating trade liabilities
mainly relate to liabilities associated with the electric-
ity purchased in Slovenia and abroad.
The company’s other short-term operating liabilities
include:
• short-term liabilities to employees, which relate to
a liability for December salaries and other employ-
ment-related income,
• short-term liabilities to the state, which mainly re-
late to an additional payment of corporate income
tax for the year 2008,
• short-term interest liabilities associated with inter-
est charged on long-term loans,
• other short-term operating liabilities, the majority
of which relates to a liability arising from the last
day of trading in futures.

126
AN
NU
AL
RE
PO
RT
HS
E |
FIN
AN
CIA
L R
EP
OR
T O
F T
HE
CO
MP
AN
Y H
SE
As part of transferring the joint venture for the con-
struction of HPPs on the lower Sava River in the form
of an in-kind contribution, the company also trans-
ferred short-term operating liabilities of € 10,862,278,
which had been recorded at the end of 2007 as:
Short-term operating liabilities
Short-term operating liabilities to group companies
in €
TYPE OF SHORT-TERM OPERATING LIABILITY 31/12/08 31/12/07
Short-term trade liabilities in Slovenia 139,689,920 128,278,802
Short-term liabilities to suppliers abroad 20,007,591 41,557,329
Short-term advances received 0 38,939
Other short-term liabilities for operations for third party account 0 27,664
Short-term liabilities to employees 428,366 478,333
Short-term liabilities to state and other institutions 1,599,852 7,676,056
Short-term interest liabilities 1,800,293 1,155,970
Other short-term liabilities 641,295 176,383
Total short-term operating liabilities 164,167,317 179,389,476
in €
GROUP COMPANIES COUNTRY 31/12/08 31/12/07
Dravske elektrarne Maribor d.o.o. Slovenia 35,981,072 38,515,401
Soške elektrarne Nova Gorica d.o.o. Slovenia 14,526,600 3,128,111
Termoelektrarna Šoštanj d.o.o. Slovenia 70,111,658 44,760,607
Premogovnik Velenje d.d. Slovenia 8,927 17,144
Termoelektrarna Trbovlje d.o.o. Slovenia 5,045,177 5,736,001
HSE Invest d.o.o. Slovenia 78,807 279,074
HESS d.o.o. Slovenia 640,196 0
HSE Italia S.r.l. Italy 28,080 28,080
HSE Hungary Kft. Hungary 286,023 137,268
HSE Balkan Energy d.o.o. Serbia 69,050 482,904
HSE Adria d.o.o. Croatia 3,941,554 10,100,187
Other group companies Slovenia 20,756 2,647
Total short-term operating liabilities to group companies
130,737,900 103,187,424
• short-term operating liabilities to group companies
(€ 364,283), and
• short-term operating trade liabilities (€ 10,497,995).
The company settles all its liabilities in due time.
(14) Short-term accrued costs and deferred revenue € 5,506,377The company’s short-term accrued cost and deferred
revenue items include:
• contingent costs of electricity,
• electricity deviations,
• interest on loans received,
• liabilities arising from unutilised leave,
• VAT on advances given.
As part of transferring the joint venture for the con-
struction of HPPs on the lower Sava River in the form
of an in-kind contribution, the company also trans-
ferred € 1,185,418 in short-term accrued costs and
deferred revenue.

127
AN
NU
AL
RE
PO
RT
HS
E |
FIN
AN
CIA
L R
EP
OR
T O
F T
HE
CO
MP
AN
Y H
SE
Short-term accrued costs and deferred revenue in €
TYPE OF SHORT-TERM ACCRUED COSTS AND DEFERRED REVENUE 31/12/08 31/12/07Short-term accrued costs 5,049,329 4,261,147
Short-term deferred revenue 0 50,640
VAT on advances given 457,048 1,197,980
Total short-term accrued costs and deferred revenue 5,506,377 5,509,767
Changes in short-term accrued costs and deferred revenue in €
ACCRUED COSTS AND SHORT-TERM SHORT-TERM DEFERRED REVENUE ACCRUED COSTS DEFERRED REVENUE VAT TOTALValue as at 31/12/2007 4,261,148 50,640 1,197,979 5,509,767
Transfer to HESS 0 (148) (1,185,270) (1,185,418)
Creation, increases 76,365,512 (94,176) 941,353 77,212,689
Use (74,105,996) 43,684 (497,015) (74,559,327)
*Transfers (1,471,334) 0 0 (1,471,334)
Value as at 31/12/2008 5,049,330 0 457,047 5,506,377Creation planned 0 0 0 1,617,403
Use planned 0 0 0 0
(15) Off-balance sheet records € 238,366,872The company’s off-balance sheet records include fi nan-
cial instruments received and given as collaterals for re-
ceivables, liabilities and performance of contract work.
They also include outstanding futures transactions.
The company’s collaterals were as follows as at
31/12/2008:
• a guarantee issued to Geoplin in relation to the ful-
fi lment of cash and other obligations of TEŠ arising
from a long-term natural gas supply agreement for
the period until 2012; furthermore, an agreement
was signed with TEŠ stipulating that in case a pay-
ment is made to Geoplin by HSE, the receivables
arising from the payment shall be offset against
HSE’s liabilities to TEŠ,
in €
TYPE OF OFF-BALANCE SHEET RECORD 31/12/08 31/12/07Bank guarantees received 69,278,954 101,140,703
Insurance policies received 0 328,675
Mutual fund (Modri sklad) 208,974 175,452
Bank guarantees issued 91,846,689 19,267,812
Futures used for hedging - purchase 76,998,736 104,261,505
Statement of a possibility to obtain cash (AE licence) 33,519 29,346
Lawsuits received 0 179,810
Liabilities associated with Toplofi katsia-Ruse 0 240,601
Total off-balance sheet records 238,366,872 225,623,904
• a guarantee issued under a guarantee contract en-
tered into by HSE, SENG and Bank Austria Credi-
tanstalt, as an agent, and the banks Bank Austria
Creditanstalt, Bayerische Landesbank, NLB and
NKBM, as original guarantors, stating that the com-
pany shall settle all overdue liabilities arising from
the guarantee contract; an agreement was also
signed with SENG stipulating that in case the liabili-
ties arising from the guarantee contract are settled
by HSE, the receivables shall be offset against HSE’s
liabilities to SENG,
• HSE’s guarantee relating to sponsorship contracts.
The company also has blank bills of exchange received
as security for electricity receivables in Slovenia.
*Transfer from long-term accrued costs and deferred revenue.

128
AN
NU
AL
RE
PO
RT
HS
E |
FIN
AN
CIA
L R
EP
OR
T O
F T
HE
CO
MP
AN
Y H
SE
4.8.2 Income statementGeneralInformation on the basis for the preparation of the
income statement and on specifi c accounting poli-
cies selected and applied to the company’s signifi cant
operations and other business events are presented
in disclosures of individual signifi cant revenue and ex-
pense items.
The company’s income statement has been prepared
using Format I as defi ned in SAS 2006 25.5.
The amount of expenses is also subject to methods,
accounting policies and estimates presented in bal-
ance sheet disclosures. The company did not change
the methods and accounting policies, but it did change
an accounting assessment by extending the useful life
of a fi xed asset recorded as equipment.
Revenue € 856,652,784Revenue from the sale of electricity in Slovenia ac-
counts for 99.7% of the company’s revenue.
Revenue from services rendered was mostly gener-
ated through services associated with electricity and
performance of certain functions on behalf of subsid-
iaries.
Revaluation operating revenue mainly comprises
revenue from the reversal of provisions for guaran-
tees of origin.
Finance income from interests mainly relates to the
payment of profi t by subsidiaries.
Finance income from loans given mainly relates to
accounted for interest on deposits.
Finance income from operating receivables is mainly
comprised of default interest and gains on trading in
CO2 emission coupons.
Other revenue mainly relates to the realisation of a
bank guarantee under a contract for the sale of an in-
terest in the company TDR-Metalurgija d.d.
The management estimates that there is doubt as
to the collection of a receivable arising from market
research services and electricity sales services per-
formed in 2008 for the associate Toplofi katsia Ruse
AD in the amount € 930 thousand because the legal
basis has not yet been fully agreed. Until this doubt
has been removed, the management estimates that
there is a signifi cant risk of this receivable not be-
ing collected within the meaning of SAS 5.24 and SAS
18.12. The receivable and revenue arising from it have
therefore not been included in HSE’s fi nancial state-
ments for the year 2008.
Revenue of the company
Operating revenue
in €
TYPE OF REVENUE 2008 2007
Operating revenue 820,305,717 923,302,179
Finance income 31,676,981 20,577,647
Other revenue 4,670,086 81,787
Total revenue 856,652,784 943,961,613
in €
TYPE OF OPERATING REVENUE 2008 2007
Revenue from the sale of electricity 816,625,234 920,157,116
Revenue from the sale of services 2,639,293 1,018,961
Capitalised own services 0 151,341
Revenue from reversal or use of provisions 987,824 600,000
Revaluation operating revenue 53,366 1,374,761
Total operating revenue 820,305,717 923,302,179

129
AN
NU
AL
RE
PO
RT
HS
E |
FIN
AN
CIA
L R
EP
OR
T O
F T
HE
CO
MP
AN
Y H
SE
Geographical segments
Expenses of the company
Operating expenses
in €
GEOGRAPHICAL SEGMENTS 2008 2007
Domestic market 578,426,525 677,506,544
Foreign market 240,838,002 243,669,533
Total domestic and foreign market 819,264,527 921,176,077
in €
TYPE OF EXPENSE 2008 2007
Operating expenses 785,178,922 920,819,182
Finance expenses 9,865,448 6,312,538
Other expenses 3 234
Total expenses 795,044,373 927,131,954
in €
TYPE OF OPERATING EXPENSE 2008 2007
Cost of merchandise sold 727,676,137 857,289,282
Contingent costs of merchandise sold 31,947,600 30,945,960
Costs of materials 264,215 248,881
Costs of services 6,201,865 7,405,864
Labour costs 6,545,269 5,950,139
Depreciation and amortisation charge 1,458,542 2,236,463
Revaluation operating expenses 34,574 14,749,115
Other operating expenses 11,050,720 1,993,478
Total operating expenses 785,178,922 920,819,182
Expenses € 795,044,373The cost of goods sold, which accounts for 96.8% of
total operating expenses, comprises expenses for the
purchase of electricity and contingent costs of elec-
tricity purchases.
Costs of materials, costs of services, labour cost, write-downs in value and other operating expenses
represent 3.2% of total operating expenses.
Depreciation and amortisation charge was lower than
in the previous year due to the transfer of the joint
venture for the construction of HPPs on the lower
Sava River to the company HESS.
The company did not receive any additional employee
claims for payment on the basis of legal provisions,
collective agreement or the company’s governing
documents. The majority of other operating expenses
relates to the creation of provisions for lawsuits fi led
by the company TDR-Metalurgija d.d.- v stečaju and
its related companies and employees.
Finance expenses for fi nancial liabilities mainly re-
late to interest on loans and loss incurred due to the
cancellation interest rate swap contracts.
Finance expenses for operating liabilities mainly
relate to impairment, loss incurred in trading in CO2
emission coupons and foreign exchange losses.

130
AN
NU
AL
RE
PO
RT
HS
E |
FIN
AN
CIA
L R
EP
OR
T O
F T
HE
CO
MP
AN
Y H
SE
Costs by functional group
Profi t or loss of the company
in €
TYPE OF COST 2008 2007
Cost of merchandise sold 761,805,403 906,358,345
Cost of sales 2,012,627 1,981,892
General and administrative costs 21,360,892 12,327,604
Total costs 785,178,922 920,667,841
in €
TYPE OF PROFIT OR LOSS 2008 2007
Operating profi t or loss 35,126,795 2,482,997
Profi t or loss on ordinary activities 56,938,328 16,748,106
Profi t or loss on extraordinary activities 4,670,083 81,553
Total profi t or loss 61,608,411 16,829,659
Net profi t or loss for the accounting period 53,756,215 12,411,197
Total profi t or loss € 61,608,411The company ended the year 2008 with total profi t or
loss of € 61,608,411.
Corporate income tax € 7,649,606In accordance with the Corporate Income Tax Act, the
tax for 2008 amounted to 22% of the taxable base re-
ported in the company’s tax assessment.
Based on the 2007 tax assessment, the company paid
€ 6,287,101 in advance income tax payments in 2008.
Its income tax liability thus amounted to € 1,362,505
at the end of 2008.
Deferred taxes € 202,590Deferred taxes are intended for covering temporary
differences between the carrying amount and tax val-
ues of assets and liabilities. The values of deferred
taxes created and used are presented in the table
showing deferred tax assets. The company did not ac-
count for deferred tax liabilities in 2008.
Net profi t or loss € 53,756,215After taking into account corporate income tax and
deferred tax assets, the net profi t or loss for the ac-
counting period totals € 53,756,215.
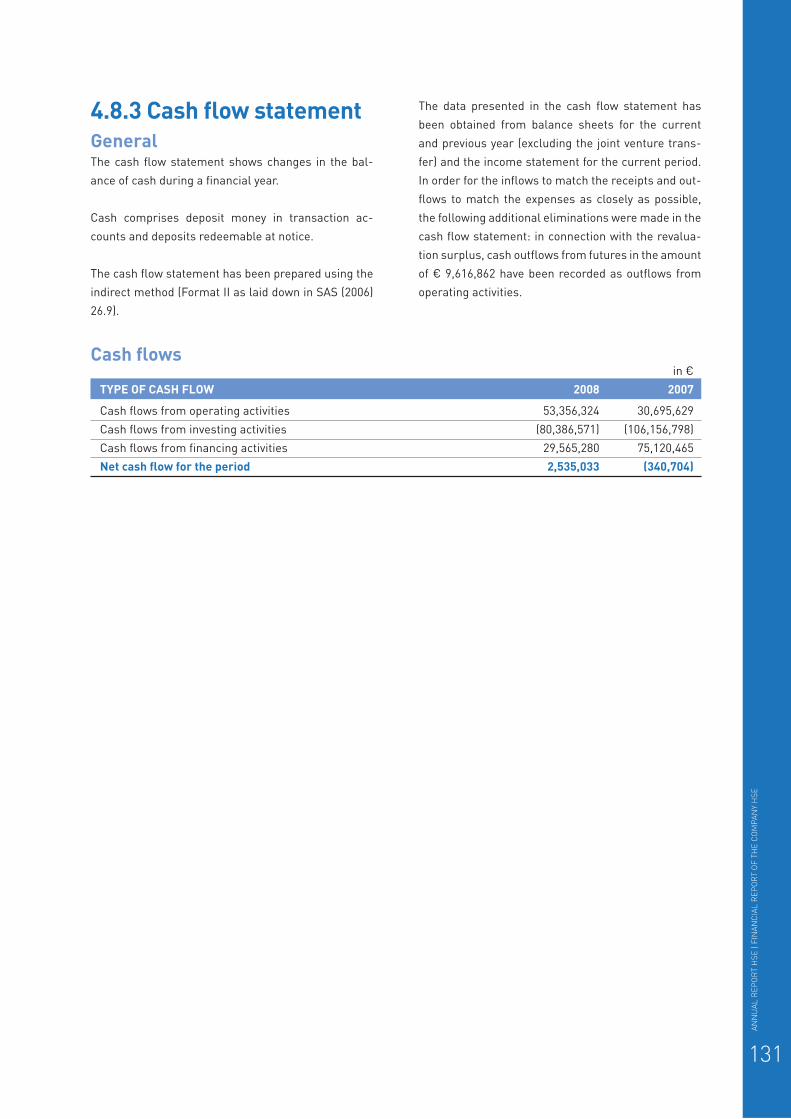
131
AN
NU
AL
RE
PO
RT
HS
E |
FIN
AN
CIA
L R
EP
OR
T O
F T
HE
CO
MP
AN
Y H
SE
Cash fl ows in €
TYPE OF CASH FLOW 2008 2007
Cash fl ows from operating activities 53,356,324 30,695,629
Cash fl ows from investing activities (80,386,571) (106,156,798)
Cash fl ows from fi nancing activities 29,565,280 75,120,465
Net cash fl ow for the period 2,535,033 (340,704)
4.8.3 Cash fl ow statementGeneralThe cash fl ow statement shows changes in the bal-
ance of cash during a fi nancial year.
Cash comprises deposit money in transaction ac-
counts and deposits redeemable at notice.
The cash fl ow statement has been prepared using the
indirect method (Format II as laid down in SAS (2006)
26.9).
The data presented in the cash fl ow statement has
been obtained from balance sheets for the current
and previous year (excluding the joint venture trans-
fer) and the income statement for the current period.
In order for the infl ows to match the receipts and out-
fl ows to match the expenses as closely as possible,
the following additional eliminations were made in the
cash fl ow statement: in connection with the revalua-
tion surplus, cash outfl ows from futures in the amount
of € 9,616,862 have been recorded as outfl ows from
operating activities.
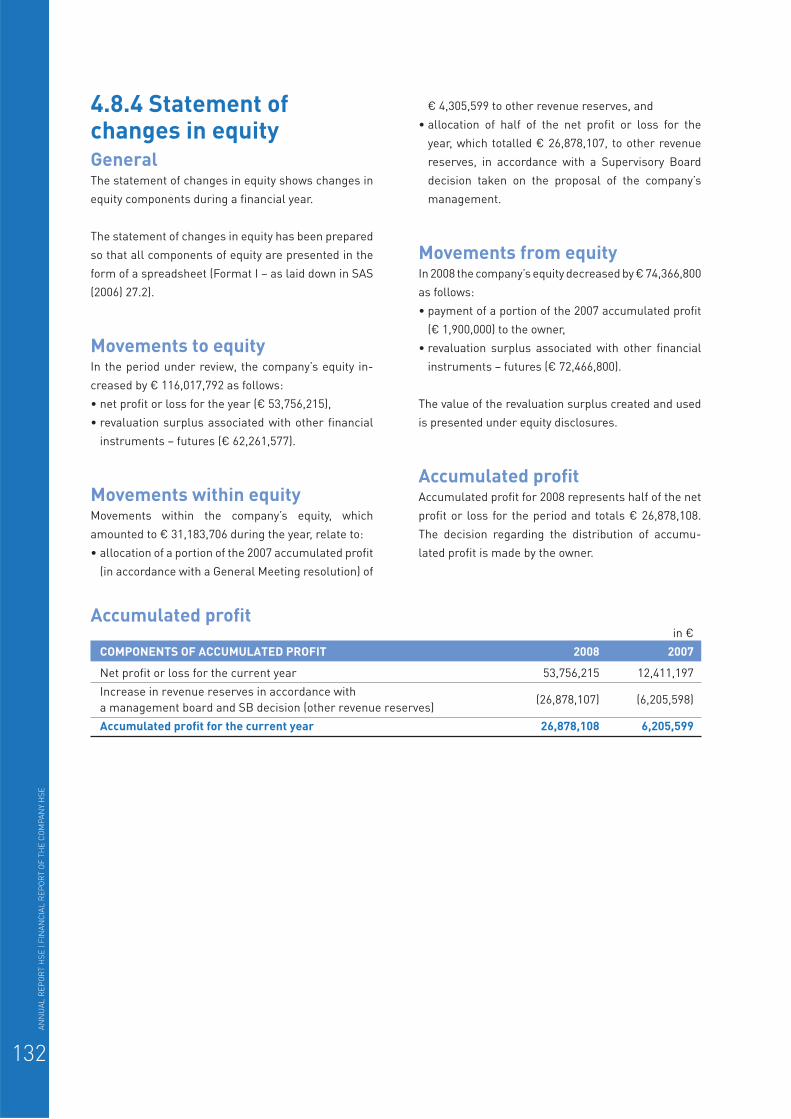
132
AN
NU
AL
RE
PO
RT
HS
E |
FIN
AN
CIA
L R
EP
OR
T O
F T
HE
CO
MP
AN
Y H
SE
4.8.4 Statement of changes in equity GeneralThe statement of changes in equity shows changes in
equity components during a fi nancial year.
The statement of changes in equity has been prepared
so that all components of equity are presented in the
form of a spreadsheet (Format I – as laid down in SAS
(2006) 27.2).
Movements to equityIn the period under review, the company’s equity in-
creased by € 116,017,792 as follows:
• net profi t or loss for the year (€ 53,756,215),
• revaluation surplus associated with other fi nancial
instruments – futures (€ 62,261,577).
Movements within equityMovements within the company’s equity, which
amounted to € 31,183,706 during the year, relate to:
• allocation of a portion of the 2007 accumulated profi t
(in accordance with a General Meeting resolution) of
€ 4,305,599 to other revenue reserves, and
• allocation of half of the net profi t or loss for the
year, which totalled € 26,878,107, to other revenue
reserves, in accordance with a Supervisory Board
decision taken on the proposal of the company’s
management.
Movements from equityIn 2008 the company’s equity decreased by € 74,366,800
as follows:
• payment of a portion of the 2007 accumulated profi t
(€ 1,900,000) to the owner,
• revaluation surplus associated with other fi nancial
instruments – futures (€ 72,466,800).
The value of the revaluation surplus created and used
is presented under equity disclosures.
Accumulated profi tAccumulated profi t for 2008 represents half of the net
profi t or loss for the period and totals € 26,878,108.
The decision regarding the distribution of accumu-
lated profi t is made by the owner.
Accumulated profi t in €
COMPONENTS OF ACCUMULATED PROFIT 2008 2007
Net profi t or loss for the current year 53,756,215 12,411,197
Increase in revenue reserves in accordance with
a management board and SB decision (other revenue reserves) (26,878,107) (6,205,598)
Accumulated profi t for the current year 26,878,108 6,205,599

133
AN
NU
AL
RE
PO
RT
HS
E |
FIN
AN
CIA
L R
EP
OR
T O
F T
HE
CO
MP
AN
Y H
SE
4.8.5 Other notesRemuneration of managers and employees who are not subject to the tariff part of the collective agreementRemuneration of managers and employees who are
not subject to the tariff part of the collective agree-
ment comprises:
• gross remuneration included in the income tax re-
turn notice,
• other remuneration (meals, transportation, per di-
ems, untaxed portion of jubilee benefi ts),
• premiums paid for voluntary supplementary pension
insurance.
Remuneration of managers comprises the remunera-
tion of all managers who acted as managers in 2008
(a member of the management was replaced during
the year).
Remuneration of Supervisory Board membersRemuneration of Supervisory Board members repre-
sents gross attendance fees and travel expenses re-
lated to the performance of tasks in the Supervisory
Board and the audit committee.
No advances, loans or guarantees were extended to
these groups of persons in 2008.
Short-term operating liabilities include December
salaries for managers and employees who are not
subject to the tariff part of the collective agreement as
well as December attendance fees payable to Supervi-
sory Board members for their work in the Supervisory
Board and audit committee.
Remuneration of individual groups of persons in €
REMUNERATION OF INDIVIDUAL GROUPS OF PERSONS 2008 2007
The management of the company 273,354 165,511
Employees who are not subject to the tariff part of the collective agreement 1,998,326 1,530,369
Supervisory Board members 181,753 82,279
Costs of audit and other assurance engagementsThe costs of audit and other assurance engagements
broken down by individual type of service were as fol-
lows in 2008:
• the cost of audit of the annual report of the company
HSE and the HSE Group amounted to € 24,986,
• the cost of other assurance engagements stood at
€ 500.
Business events after the balance sheet dateThe business events after the balance sheet date are
presented in the business report. There were not busi-
ness events up to the date of the fi nancial report that
would affect the data presented.

134
We
gain
impe
tus
We set a new challenge
We
fu
lly
co
mm
it t
o t
he
ne
w c
ha
lle
ng
eWe persist
We achieve a goal

135

136
AN
NU
AL
RE
PO
RT
HS
E |
FIN
AN
CIA
L R
EP
OR
T O
F T
HE
HS
E G
RO
UP
5.1 Introductory notes
Basis of preparationThe consolidated fi nancial statements presented
herein have been prepared in accordance with provi-
sions of the Companies Act (ZGD-1) and the Slovene
Accounting Standards 2006 (SAS 2008) for the fi nan-
cial year 2008, which corresponds to the calendar
year.
The consolidated fi nancial statements have been
presented in euros. The fi nancial statements of HSE
Group companies based in Slovenia have also been
presented in euros. The fi nancial statements of HSE
Group companies abroad have been presented in their
respective national currencies.
A group of companies is an economic rather than le-
gal entity, and as such not an independent holder of
rights and obligations. The fi nancial statements of a
group of companies are presented as those of a single
company, and are prepared based on the original fi -
nancial statements of group companies, taking into
account consolidation adjustments (eliminations).
Financial report of the HSE group
This is how much the HSE Group’s debt ratio amounted to at the end of 2008.
An analysis of the fi nancial position of HSE Group companies shows that
their business and fi nancial position is manageable from the perspective of
indebtedness as debt ratios are within safe operating margins.
05
30

137
AN
NU
AL
RE
PO
RT
HS
E |
FIN
AN
CIA
L R
EP
OR
T O
F T
HE
HS
E G
RO
UP
The consolidated fi nancial statements have been pre-
pared by observing the following qualitative charac-
teristics of accounting:
• understandability,
• relevance,
• reliability and
• comparability.
Companies included in the consolidated fi nancial statementsPrior to the consolidation of the HSE Group, a con-
solidation of the Premogovnik Velenje Group was per-
formed. In accordance with the consecutive consoli-
dation method, consolidated fi nancial statements are
already prepared at the level of subsidiaries and are
then included in the consolidated fi nancial statements
of the HSE Group.
The 2008 consolidated fi nancial statements included
for the fi rst time the company HESS, to which the
capital investment in the construction of HPPs on the
lower Sava River, which had been managed as a joint
venture project until 31/12/2007, was transferred.
HESS was established in 2008, with HSE Group com-
panies becoming its 84.6% owners.
More detailed disclosures regarding the transfer of the
capital investment to the above company are provided
in the fi nancial report of the controlling company.
Companies included in the consolidated fi nancial statements:• Holding Slovenske elektrarne d.o.o.,
• Dravske elektrarne Maribor d.o.o.,
• Soške elektrarne Nova Gorica d.o.o.,
• Termoelektrarna Šoštanj d.o.o.,
• Premogovnik Velenje Group,
• Termoelektrarna Trbovlje d.o.o.,
• Hidroelektrarne na Spodnji Savi d.o.o.,
• HSE Invest d.o.o.,
• HSE Italia S.r.l.,
• HSE Balkan Energy d.o.o.,
• HSE Hungary Kft.,
• HSE Adria d.o.o.,
• HSE Bulgaria EOOD.
Hereinafter the term “Group” refers to HSE Group
companies that are included in the consolidated fi -
nancial statements.
Companies excluded from the consolidated fi nancial statementsSubsidiaries in the HSE Group: Elprom d.o.o., Golte
d.o.o., Jama Škale v zapiranju d.o.o. and SAŠA Inkuba-
tor d.o.o. are dormant companies, and have not been
consolidated either at the level of their controlling
companies or at the Group level due to their insignifi -
cance. These companies are not signifi cant in terms of
true and fair presentation of the Group’s operations.
In 2007 the controlling company purchased a 100%
stake in the Bulgarian company Toplofi katsia-Ruse
AD, selling 49% of it in the same year. The company
still holds 51% of voting rights for the remaining 51%
stake, but because a higher majority is required in
order for general meeting decisions to be valid, the
company cannot make strategic decisions without the
approval of the other owner. The same decision-mak-
ing conditions also apply to the other owner. The con-
trolling company has already reached an agreement
with the other partner to transfer its 51% stake by the
end of 2010, meaning that the controlling company no
longer has a right to receive its share of profi t. Due to
the above facts, the company Toplofi katsia-Ruse AD
has not been included in the consolidated fi nancial
statements. Also, the equity method was not used in
connection with the above company in the consolidat-
ed fi nancial statements for the same reason.
Although the company DEM has a 50% interest in the
company Eldom d.o.o., the controlling company did
not consolidate Eldom due to its material insignifi -
cance and the lack of a controlling infl uence on its op-
erations. In 2008 DEM established a private institution
called Pomurje Development Institute Murska Sobota.
This institution is not considered a company, and be-
cause it is not signifi cant from the perspective of the
HSE Group, it is not consolidated either at the level of
the controlling company or at the Group level.
Full consolidationThe fi nancial statements of group companies have
been incorporated into the consolidated fi nancial
statements on the basis of full consolidation. The
fi nancial statements were merged item by item by
adding up similar items of assets, liabilities, equity,
revenue and expenses. In order to present the Group
as a single company, the following eliminations were
made:

138
AN
NU
AL
RE
PO
RT
HS
E |
FIN
AN
CIA
L R
EP
OR
T O
F T
HE
HS
E G
RO
UP
• investments of controlling companies in subsidiar-
ies and interests of controlling companies in the eq-
uity of subsidiaries,
• loans extended by subsidiaries and, consequently,
loans received from subsidiaries,
• intangible assets of the controlling company and
short-term accrued cost and deferred revenue items
of subsidiaries,
• intra-group receivables and liabilities,
• intra-group revenue and expenses.
The consolidated income statement shows a minor-
ity owners’ share of the Group’s profi t or loss, while
the consolidated balance sheet and the consolidated
statement of changes in equity present minority inter-
ests in the Group’s equity.
AssociatesAssociates are the companies in which the Group ex-
ercises signifi cant but not dominant control over busi-
ness decisions.
Associates in the Group are as follows:
• Plinsko parna elektrarna d.o.o. Kidričevo,
• Hidro Moćnost Makedonija d.o.o.,
• ERICo d.o.o.,
• PLP d.o.o.,
• PUP PV d.o.o.,
• Robinoks d.o.o.,
• Sipoteh d.o.o.
Accounting policiesAll accounting policies and rules regarding the valu-
ation of material items were harmonised between
companies for the purpose of preparing the consoli-
dated fi nancial statements.
Foreign exchange rate and method of conversion to the national currencyIn separate income statements, items in the fi nancial
statements of individual group companies denominat-
ed in foreign currencies are translated into local cur-
rencies at the exchange rate of the Bank of Slovenia
on the day of accrual or at the national exchange rate
of the country in which the company is registered and
where it operates.
The balances of assets and liabilities in the balance
sheets of individual group companies denominated in
foreign currencies are translated at the exchange rate
of the Bank of Slovenia on 31/12/2008 or at the nation-
al exchange rate of the country in which the company
is registered and where it operates.
The foreign exchange gains and losses resulting from
conversions are recorded as fi nance income or fi -
nance expenses, respectively. The foreign exchange
differences resulting from consolidation are recorded
as a consolidation equity adjustment.
In translating the fi nancial statements of foreign sub-
sidiaries for the purpose of their incorporation into
the consolidated fi nancial statements:
• assets and liabilities are translated at the exchange
rate of the Bank of Slovenia as at 31/12/2008,
• revenue and expenses are translated at the average
exchange rate of the Bank of Slovenia for 2008.
AuditThe companies included in the consolidated fi nancial
statements have been audited or reviewed for audit
purposes. All group companies were audited by De-
loitte fi rms.
Exchange rates used in conversionCOUNTRY Currency Closing rate in EUR for 2008 Average rate in EUR in 2008
Slovenia, Italy EUR - -
Bulgaria BGN 1.9558 1.9558
Croatia HRK 7.3555 7.3459
Hungary HUF 266.7000 259.9600
Serbia RSD 89.3718 84.4845

139
AN
NU
AL
RE
PO
RT
HS
E |
FIN
AN
CIA
L R
EP
OR
T O
F T
HE
HS
E G
RO
UP
Intangible assets and long-term accrued revenue and deferred costsIntangible assets represent a part of fi xed assets en-
abling the performance of the companies’ registered
activities, while physically they do not exist.
Intangible assets are initially recognised at cost, which
is also comprised of duties and all costs incurred
while preparing an asset for its intended use. Interest
on loans for the acquisition of intangible assets is not
considered as part of the cost.
After initial recognition, intangible assets are mea-
sured using the cost model.
An item of intangible assets with fi nite useful life is
amortised using the straight-line amortisation meth-
od. Amortisation begins when the intangible asset is
available for use. The residual value of intangible as-
sets has not been determined.
In the bookkeeping records the cost and accumulated
amortisation of intangible assets are recorded sepa-
rately, whereas in the consolidated balance sheet they
are recorded at carrying amount, i.e. as a difference
between the cost and accumulated amortisation.
On disposal, intangible assets are eliminated from the
books of account, and the difference between the net
sales value and the carrying amount of a disposed of
intangible asset is transferred to revaluation revenue
or expenses.
Goodwill occurs in consolidation as a result of the
cost of an acquired interest in a company that is high-
er than the value of this interest in the equity of such
a company. Goodwill is not amortised. It is impaired if
necessary.
Long-term accrued revenue and deferred cost items relate to long-term deferred costs that are initially
recognised at cost but are later written down as part
of costs to which they belong.
Property, plant and equipmentProperty, plant and equipment are part of long-term
assets owned by group companies and used for the
performance of their registered activities.
An item of property, plant and equipment is initially rec-
ognised at cost. The cost comprises its purchase price,
import duties and non-refundable purchase taxes, and
any directly attributable costs of bringing the asset to
working condition for its intended use, especially the
costs of transportation and installation. The cost does
not include the costs incurred upon the dismantling or
refurbishment of property, plant and equipment.
At one of the subsidiaries the cost is also increased
by the amount of interest on loans taken out to ac-
quire an item of property, plant and equipment until
the item is ready for use.
The cost of an item of property, plant and equipment
constructed or manufactured within the Group consists
of the costs incurred as a result of its construction or
manufacturing and of indirect construction or manu-
facturing costs that can be attributed to the item.
The cost of items of property, plant and equipment of
greater value is divided into individual items with dif-
ferent useful lives.
The spare parts of higher value are recorded as prop-
erty, plant and equipment and depreciated over the
useful life of the related asset.
The anticipated costs of regular inspections and re-
pairs of property, plant and equipment are considered
as parts of property, plant and equipment.
After initial recognition, the items of property, plant
and equipment are measured using the cost model.
Grants and state aid provided for the acquisition of
property, plant and equipment are not deducted from
their cost but are instead carried as long-term ac-
crued costs and deferred revenue and used in accor-
dance with the accounted for depreciation.
Subsequent expenditure on an item of property, plant
and equipment increases its cost when it increases its
future economic benefi ts in excess of the originally as-
sessed future economic benefi ts. The subsequent ex-
penditure enabling the extension of the useful life of the
asset initially reduces the accumulated depreciation.
Repairs or maintenance of property, plant and equip-
ment carried out to restore or maintain future eco-

140
AN
NU
AL
RE
PO
RT
HS
E |
FIN
AN
CIA
L R
EP
OR
T O
F T
HE
HS
E G
RO
UP
nomic benefi ts expected on the basis of the originally
assessed standard of performance of the assets are
recognised as expenses when incurred.
The difference between the net sales value and the
carrying amount of a disposed of item of property,
plant and equipment is transferred to revaluation op-
erating revenue or expenses.
Property, plant and equipment items intended for sale
are recorded as current assets intended for sale.
An item of property, plant and equipment is depreci-
ated using the straight-line depreciation method over
its expected useful life. Depreciation is accounted for
individually since the fi rst day of the following month
after an item of property, plant and equipment has
been available for use. The depreciation charge for
the current year is recorded as an operating expense
for the year. The residual value of property, plant and
equipment has not been determined.
Property, plant and equipment items are revalued if
the carrying amount exceeds the recoverable amount.
The reasons underlying the revaluation of property,
plant and equipment are checked individually in group
companies.
In the bookkeeping records the cost and accumulated
depreciation of items of property, plant and equipment
are recorded separately, whereas in the consolidated
balance sheet they are recorded at carrying amount,
i.e. as a difference between the cost and accumulated
depreciation.
Investment propertyInvestment property is part of companies’ fi xed assets
which bring economic benefi ts through leasing and
increasing of property value. In the books of account,
it is carried at cost.
Long-term investmentsLong-term investments are part of fi xed assets, the
returns on which should increase fi nance income and
which are normally held by group companies for more
than a year.
On initial recognition, long-term investments are re-
corded at their historical cost plus the costs directly
attributable to the investment.
In the books of account of group companies, long-term
investments are recognised based on their settlement
date (payment date).
After initial recognition, long-term investments are
carried at cost in companies’ books of account (which
also includes investments in subsidiaries and associ-
ates) and are recorded as available-for-sale fi nancial
assets. Because their fair value cannot be determined
(this is not the case with derivatives), they are not en-
hanced and, consequently, do not affect profi t or loss
or revaluation surplus.
In the consolidated fi nancial statements, investments
in associates are valued using the equity method.
Any indications of impairment of long-term invest-
ments are determined on an annual basis.
Depending on the envisaged settlement or the reason
for holding an investment, the investments are carried
as long-term or current assets in the balance sheet.
Assets (disposal groups) held for saleAssets included in a disposal group include assets for
which it can be reasonably assumed that their carrying
amount will be realised through the sale of these as-
sets in the next year and not through their further use.
InventoriesInventories are part of current assets that will either
be used while making products and rendering ser-
vices or sold.
Materials are initially recognised at cost comprising
the purchase price, import duties and other taxes and
direct costs of purchase.
The inventories of most end products are valued by
production costs in the narrow sense.
The companies reduce the value of material and raw
material inventories using the FIFO or the weighted
average cost method.
141
AN
NU
AL
RE
PO
RT
HS
E |
FIN
AN
CIA
L R
EP
OR
T O
F T
HE
HS
E G
RO
UP
A Group-level reconciliation has not been disclosed
because the amount is immaterial.
Inventories are revalued if their carrying amount ex-
ceeds their net realisable value. If this is the case, in-
ventories are impaired, with the value of the impair-
ment increasing revaluation operating expenses for
operating current assets.
ReceivablesReceivables represent a right to demand from cus-
tomers payment for the services provided or goods
delivered and are part of the Group’s assets. Depend-
ing on their due date, receivables can be long-term
(due in more than one year) and short-term (due in
less than one year).
A receivable is recognised as an asset if it is probable
that the future economic benefi ts attributable to the
asset will fl ow to the entity and the historical cost of the
asset can be measured reliably. All receivables are ini-
tially recognised at amounts recorded in relevant docu-
ments on the assumption that they will be collected.
In the consolidated balance sheet, advances paid are
recorded under assets for which they were provided.
If receivables are not collected within a reasonable
time or court proceedings are initiated in connection
with the collection, allowances are made and revalu-
ation operating expenses are increased. The allow-
ances for receivables are made on an individual basis.
Receivables are written off when all legal remedies
relating to their collection have been used and the re-
ceivables have still not been collected.
The part of long-term receivables due to be settled
within a year of the balance sheet date is recorded as
short-term receivables.
Short-term investmentsShort-term investments are part of the Group’s cur-
rent assets that generate profi t and thus increase fi -
nance income in a period of less than a year.
On initial recognition, they are recorded at their his-
torical cost plus the costs directly attributable to the
investment.
In the books of account of group companies, short-
term investments are recognised according to their
settlement date (payment date). After initial recogni-
tion, they are carried at cost.
Group companies carry short-term investments as in-
vestments available for sale.
CashCash of the Group comprises cash on hand, cash in
transaction accounts and deposits redeemable at no-
tice and held with commercial banks.
The carrying amount of an item of cash equals its ini-
tial nominal value, which can change due to changes
in foreign exchange rates if cash is denominated in
foreign currencies.
Short-term accrued revenue and deferred costs Short-term accrued revenue and deferred cost items comprise short-term deferred costs (expenses) and
short-term accrued revenue.
Short-term deferred costs include the amounts in-
curred but not yet charged against the activities of
group companies.
Short-term accrued revenue represents the amounts
that have been included in revenue in the preparation
of the consolidated fi nancial statements but have not
yet been invoiced by group companies.
EquityTotal equity is defi ned by the amounts invested by
owners and the amounts generated during operations
and belonging to the owners.
Nominal capital is carried in euros. Nominal capital
and capital surplus represent cash contributions and
in-kind contributions made by the owner of the con-
trolling company.
Other revenue reserves are set aside on the basis of
decisions adopted by the Supervisory Board and the
General Meeting of the controlling company.

142
AN
NU
AL
RE
PO
RT
HS
E |
FIN
AN
CIA
L R
EP
OR
T O
F T
HE
HS
E G
RO
UP
Net profi t or loss represents the unallocated portion
of net profi t or loss of the controlling company for the
year and the controlling company’s share of subsid-
iaries’ net profi t or loss.
Revaluation surplus includes the values of hedging
derivatives (futures and interest rate swaps) and the
value of increases in investments in associates ac-
counted for using the equity method.
Consolidation equity adjustment comprises foreign
exchange differences arising from conversions of ac-
counting categories used by companies abroad.
Minority interest represents the share of minority
owners in the total equity of subsidiaries.
Provisions and long-term accrued costs and deferred revenueProvisions are set aside for obligations that are ex-
pected to arise from obligating past events in a period
of more than a year. If a liability can be reliably mea-
sured, they are carried as recognised costs of provi-
sions.
The amounts of provisions for jubilee benefi ts and
termination benefi ts were estimated on the basis of
actuarial calculations. They were created based on an
estimated amount of liabilities for termination and ju-
bilee benefi ts discounted to the balance sheet date.
Provisions are derecognised in the books of account
when the events for which they were created occur or
when it is determined that the reasons for their cre-
ation no longer exist. In this case their derecognition
is recorded as operating revenue.
Long-term deferred cost and accrued revenue items
comprise deferred revenue that is expected to arise
in a period of more than a year. They also include the
values of grants for the acquisition of property, plant
and equipment provided to cover depreciation charge
through progressive transfers to operating revenue.
Long-term liabilitiesLong-term liabilities arise in connection with the fi -
nancing of group companies and can either be fi nan-
cial or operating.
They refer to the liabilities of group companies which
need to be settled over the period of more than a
year.
Long-term fi nancial liabilities relate to liabilities to lend-
ers whereas operating liabilities relate to suppliers.
On initial recognition, long-term fi nancial liabilities
are recorded in the amount of cash received and are
subsequently decreased by the amount of repayments
made. They are measured at cost.
Short-term operating liabilities are initially valued on
the basis of amounts indicated in relevant documents,
which evidence the receipt of goods or services.
The portion of long-term liabilities that is due to be
settled within a year of the balance sheet date is re-
corded as a short-term liability.
The carrying amount of long-term liabilities equals
their amortised cost.
Short-term liabilitiesShort-term liabilities need to be settled within one
year at the latest. The Group records short-term fi -
nancial and operating liabilities.
Short-term fi nancial liabilities relate to liabilities to
lenders whereas operating liabilities relate to suppli-
ers.
On initial recognition, short-term fi nancial liabilities
are recorded in the amounts of cash received and are
subsequently decreased on the basis of repayments
made. They are measured at cost.
Long-term operating liabilities are initially valued on
the basis of amounts indicated in relevant documents,
which evidence the receipt of goods or services.
The portion of long-term liabilities that is due to be
settled within a year of the balance sheet date is re-
corded as a short-term liability.
The carrying amount of short-term liabilities equals
their amortised cost.

143
AN
NU
AL
RE
PO
RT
HS
E |
FIN
AN
CIA
L R
EP
OR
T O
F T
HE
HS
E G
RO
UP
Short-term accrued costs and deferred revenueShort-term accrued cost and deferred revenue items
of the Group comprise short-term accrued costs (ex-
penses) and short-term deferred revenue.
Short-term accrued costs include the costs that
are expected but have not yet been incurred (not yet
charged) although they relate to a period for which
the fi nancial statements have been prepared. Short-
term deferred revenue relates to the services already
charged but not yet rendered.
RevenueRevenue represents increases in economic benefi ts
during an accounting period in the form of increases in
assets. It is recognised when it is probable that cash re-
ceipts will fl ow from it.
Operating revenue comprises sales revenue and other
revenue associated with products and services.
Net sales revenue comprises the selling values of prod-
ucts, merchandise and materials sold and services ren-
dered during an accounting period. It is measured based
on selling prices stated in invoices less discounts and
rebates.
Changes in the value of inventories relate to a difference
between the opening and closing balance of invento-
ries.
Capitalised own products and services are the products
or services produced by the Group and recorded as in-
tangible assets or property, plant and equipment.
Other operating revenue is associated with grants and
reversal of provisions.
Revaluation operating revenue is recognised on the dis-
posal of property, plant and equipment and intangible
assets if their carrying amount is lower than their sell-
ing price, and on the reversal of impairment of trade re-
ceivables.
Finance income represents income from investing ac-
tivities. It arises in relation to long-term and short-term
investments as well as in connection with long-term
and short-term receivables. It comprises accounted for
interest, shares of the profi t of others, and revaluation
fi nance income. It is recognised when accounted for, ir-
respective of receipts.
Other revenue comprises revenue that is neither operat-
ing revenue nor fi nance income. It is carried at actual
amounts.
ExpensesExpenses Expenses are decreases in economic ben-
efi ts during an accounting period which take the form
of decreases in assets or increases in liabilities. Ex-
penses are recognised if decreases in economic ben-
efi ts during an accounting period are associated with
decreases in assets or increases in liabilities and such
decreases can be measured reliably.
Operating expenses equal the costs accrued over an
accounting period plus the costs held in the opening
inventories of products and work in progress and less
the costs held in the closing inventories of products
and work in progress. Operating expenses also in-
clude the cost of goods sold. Operating expenses are
recognised once the costs are no longer held in the
inventories of products and work in progress or once
the merchandise has been sold.
Operating expenses comprise the cost of goods sold,
costs of materials, cost of services, labour cost and
depreciation or amortisation.
Other operating expenses include various duties pay-
able to the state, environmental charges and provi-
sions.
Revaluation operating expenses represent the value of
the impairment of property, plant and equipment, in-
tangible assets and current operating assets. They are
also recorded in the event of a sale of the above assets
if the carrying amount exceeds the selling amount.
Finance expenses are expenses arising from fi nanc-
ing and investing. They are mainly comprised of ac-
counted for interest and revaluation fi nance expenses.
They are recognised when accounted for, irrespective
of payments associated with them.
Finance expenses also include foreign exchange loss-
es on receivables and liabilities. Revaluation fi nance
144
AN
NU
AL
RE
PO
RT
HS
E |
FIN
AN
CIA
L R
EP
OR
T O
F T
HE
HS
E G
RO
UP
expenses include losses on the disposal of invest-
ments.
Other expenses include expenses that are neither op-
erating expenses nor fi nance expenses. They are car-
ried at actual amounts.
Reporting by business and geographical segmentsA segment is an identifi able component of the Group
that is engaged in products or services (a business
segment) or that is engaged in products and services
in a particular economic environment (a geographical
segment).
At the Group level, primary reporting is performed
by business segment. Net sales revenue is therefore
divided into two business segments: electricity and
other activities.
Net sales revenue is also divided into two geographi-
cal segments: domestic market and foreign markets.
TaxationDavek od dohodkov pravnih oseb je izračunan z Cor-
porate income tax is calculated based on the tax rates
prescribed in countries in which group companies
operate. All group companies are liable to pay this
tax. All group companies are also subject to the value
added tax. The tax year of all group companies is the
same as the calendar year.
Deferred taxesDeferred taxes are intended for covering temporary
differences between the carrying amount and tax val-
ues of assets and liabilities. They are accounted for
using the balance sheet liability method. Deferred tax
assets represent the assessed amount of corporate
income tax, deductible temporary differences and un-
used tax losses, which results in a lower tax payable
in future periods. Deferred tax liabilities represent the
assessed amount of corporate income tax and taxable
temporary differences, which results in a higher tax
payable in the future.

145
AN
NU
AL
RE
PO
RT
HS
E |
FIN
AN
CIA
L R
EP
OR
T O
F T
HE
HS
E G
RO
UP
5.2 Auditor’s report

146
AN
NU
AL
RE
PO
RT
HS
E |
FIN
AN
CIA
L R
EP
OR
T O
F T
HE
HS
E G
RO
UP

147
AN
NU
AL
RE
PO
RT
HS
E |
FIN
AN
CIA
L R
EP
OR
T O
F T
HE
HS
E G
RO
UP
5.3 Consolidated balance sheet in €
ITEM NOTE 31/12/08 31/12/07
ASSETS 1,747,710,783 1,628,551,663 A. LONG-TERM ASSETS 1,424,901,703 1,292,678,614 I. Intangible assets and long-term
accrued revenue and deferred costs 1
48,274,010 27,874,726
1. Long-term property rights 33,724,261 12,832,029
2. Goodwill 12,387,056 12,304,714
4. Long-term deferred development costs 234,873 502,465
5. Other long-term accrued revenue and deferred costs 1,927,820 2,235,518
II. Property, plant and equipment 2 1,301,732,514 1,189,336,408 1. Land and buildings 509,532,410 517,030,848
a) Land 27,237,926 25,685,831
b) Buildings 482,294,484 491,345,017
2. Production plant and equipment 488,440,416 448,294,882
3. Other plant and equipment 8,855,996 7,053,361
4. Property, plant and equipment being acquired 294,903,692 216,957,317
a) Property, plant and equipment in the course of construction 278,013,609 198,433,778
b) Advances for acquisition of property, plant and equipment 16,890,083 18,523,539
III. Investment property 922,758 936,992 IV. Long-term investments 3 51,541,008 49,870,537 1. Long-term investments, excluding loans 51,103,118 49,426,321
a) Shares and interests in group companies 3,034,734 26,928
b) Shares and interests in associates 1,015,126 1,060,227
c) Other shares and interests 46,932,443 46,909,871
d) Other long-term investments 120,815 1,429,295
2. Long-term loans 437,890 444,216
b) Long-term loans to others 437,890 444,216
V. Long-term operating receivables 6 3,131,217 692,280 2. Long-term operating trade receivables 30,521 38,197
3. Long-term operating receivables from others 3,100,696 654,083
VI. Deferred tax assets 4 19,300,196 23,967,671 B. CURRENT ASSETS 316,850,737 328,928,916 I. Assets (disposal groups) held for sale 401,475 210,556 II. Inventories 5 32,873,842 29,323,053 1. Materials 26,151,811 21,414,365
2. Work in progress 43,658 68,173
3. Products and merchandise 6,258,077 7,754,105
4. Advances for inventories 420,296 86,410
III. Short-term investments 7 116,375,273 103,505,751 2. Short-term loans 116,375,273 103,505,751
b) Short-term loans to others 116,375,273 103,505,751
IV. Short-term operating receivables 6 153,746,979 180,592,264 2. Short-term operating trade receivables 114,631,808 131,032,731
3. Short-term operating receivables from others 39,115,171 49,559,533
V. Cash 8 13,453,168 15,297,292 C. SHORT-TERM ACCRUED REVENUE AND DEFERRED COSTS 9 5,958,343 6,944,133 OFF-BALANCE SHEET RECORDS 10 372,404,610 312,362,776

148
AN
NU
AL
RE
PO
RT
HS
E |
FIN
AN
CIA
L R
EP
OR
T O
F T
HE
HS
E G
RO
UP
BALANCE SHEET (continued) in €
ITEM NOTE 31/12/08 31/12/07
LIABILITIES 1,747,710,783 1,628,551,663 A. EQUITY 11 1,127,608,615 1,037,374,202 I. Called-up capital 29,558,789 29,558,789 1. Nominal capital 29,558,789 29,558,789
II. Capital surplus 561,243,185 561,243,185 III. Revenue reserves 169,502,829 138,319,123 5. Other revenue reserves 169,502,829 138,319,123
IV. Revaluation surplus 10,561,050 22,670,400 V. Retained net profi t or loss 250,720,796 178,559,130 VI. Net profi t or loss for the period 46,923,175 77,255,420 VII. Consolidation equity adjustment (903,981) (433,309)VIII. Equity of minority owners 60,002,772 30,201,464 B. PROVISIONS AND LONG-TERM ACCRUED COSTS
AND DEFERRED REVENUE 12 118,046,869 95,148,216
1. Provisions for pensions and similar liabilities 12,079,249 11,587,925
2. Other provisions 73,233,791 70,728,491
3. Long-term accrued costs and deferred revenue 32,733,829 12,831,800
C. LONG-TERM LIABILITIES 13 292,685,262 244,554,162 I. Long-term fi nancial liabilities 290,364,661 224,606,377 2. Long-term fi nancial liabilities to banks 288,744,803 224,606,010
4. Other long-term fi nancial liabilities 1,619,858 367
II. Long-term operating liabilities 2,317,962 19,947,785 2. Long-term operating trade liabilities 2,008,006 1,305,363
5. Other long-term operating liabilities 309,956 18,642,422
III. Deferred tax liabilities 2,639 0 D. SHORT-TERM LIABILITIES 14 194,052,222 241,650,620 II. Short-term fi nancial liabilities 45,481,809 82,545,085 2. Short-term fi nancial liabilities to banks 45,298,464 82,457,908
4. Other short-term fi nancial liabilities 183,345 87,177
III. Short-term operating liabilities 148,570,413 159,105,535 2. Short-term operating trade liabilities 104,391,606 123,356,663
4. Short-term operating liabilities from advances 190,486 442,148
5. Other short-term operating liabilities 43,988,321 35,306,724
E. SHORT-TERM ACCRUED COSTS AND DEFERRED REVENUE 15 15,317,815 9,824,463 OFF-BALANCE SHEET RECORDS 10 372,404,610 312,362,776
* The accompanying notes are an integral part of the consolidated fi nancial statements and
should be read in conjunction with them.

149
AN
NU
AL
RE
PO
RT
HS
E |
FIN
AN
CIA
L R
EP
OR
T O
F T
HE
HS
E G
RO
UP
5.4 Consolidated income statement
* The accompanying notes are an integral part of the consolidated fi nancial statements and should be read
in conjunction with them.
in €
ITEM 2008 2007
1. Net sales revenue 872,762,328 982,333,321a) Domestic market 625,382,932 722,268,188
b) Foreign market 247,379,396 260,065,133
2. Changes in inventories of products and work in progress -1,412,901 -1,132,3433. Capitalised own products and own services 5,551,241 11,381,6144. Other operating revenue (including revaluation operating revenue) 26,519,382 19,034,416GROSS RETURN ON OPERATIONS 903,420,050 1,011,617,0085. Costs of goods, materials and services 508,120,674 681,696,549a) Cost of goods and materials sold and costs of materials used 446,843,322 629,285,523
b) Costs of services 61,277,352 52,411,026
6. Labour costs 137,687,403 123,900,511a) Payroll costs 97,977,470 87,568,286
b) Social security costs 25,039,450 22,306,892
- of which pension insurance costs 18,104,296 15,624,512
c) Other labour costs 14,670,483 14,025,333
7. Write-downs in value 79,680,448 96,561,644a) Depreciation and amortisation 74,358,495 72,040,630
b) Revaluation operating expenses associated with intangible assets and property, plant and equipment
4,927,577 9,469,391
c) Revaluation operating expenses associated with operating current assets
394,376 15,051,623
8. Other operating expenses 61,159,605 42,958,501TOTAL OPERATING EXPENSES 786,648,130 945,117,205OPERATING PROFIT OR LOSS 116,771,920 66,499,8039. Finance income from interests 1,494,470 21,992,017a) Finance income from interests in group companies 0 8,502,133
c) Finance income from interests in other companies 356,176 6,844,423
d) Finance income from other investments 1,138,294 6,645,461
10. Finance income from loans given 7,352,653 5,847,060b) Finance income from loans to others 7,352,653 5,847,060
11. Finance income from operating receivables 2,621,987 4,462,773b) Finance income from operating receivables due from others 2,621,987 4,462,773
TOTAL FINANCE INCOME 11,469,110 32,301,85012. Finance expenses arising from impairment
and write-downs of investments 18,962,851 80,19313. Finance expenses for fi nancial liabilities 18,259,988 12,516,639b) Finance expenses for loans received from banks 16,771,877 12,492,692
d) Finance expenses for other fi nancial liabilities 1,488,111 23,947
14. Finance expenses for operating liabilities 1,706,952 2,643,084b) Finance expenses for trade liabilities and bills payable 775,300 1,979,740
c) Finance expenses for other operating liabilities 931,652 663,344
TOTAL FINANCE EXPENSES 38,929,791 15,239,916PROFIT OR LOSS ON ORDINARY ACTIVITIES 89,311,239 83,561,73715. Other revenue 5,816,120 804,58816. Other expenses 1,596,431 1,141,529PROFIT OR LOSS ON EXTRAORDINARY ACTIVITIES 4,219,689 -336,941TOTAL PROFIT OR LOSS 93,530,928 83,224,79617. Corporate income tax 14,022,776 8,749,12118. Deferred taxes 4,992,938 -9,596,06619. NET PROFIT OR LOSS FOR THE ACCOUNTING PERIOD 74,515,214 84,071,741Net profi t or loss of majority owner for the accounting year 73,801,282 83,461,018Net profi t or loss of minority owner for the accounting year 713,932 610,723

150
AN
NU
AL
RE
PO
RT
HS
E |
FIN
AN
CIA
L R
EP
OR
T O
F T
HE
HS
E G
RO
UP
5.5 Consolidated cash fl ow statement in €
ITEMS 2008 2007
A. CASH FLOWS FROM OPERATING ACTIVITIES a) Items of income statement 193,539,109 155,162,910 Operating revenue (except from revaluation)
and fi nance income from operating receivables 904,614,858
1,001,790,115
Operating expenses without depreciation or amortisation (except
from revaluation) and fi nance expenses for operating liabilities (701,239,643)
(836,106,276)
Income taxes and other taxes not included in operating expenses (9,836,106) (10,520,929)
b) Changes in net operating assets in balance sheet items (including accruals and deferrals, provisions and deferred tax assets and liabilities)
7,925,206 (36,908,425)
Opening less closing operating receivables 24,692,459 (50,422,595)
Opening less closing accrued revenue and deferred costs 1,283,815 (2,550,054)
Opening less closing deferred tax assets 8,700,950 (9,561,983)
Opening less closing inventories (3,594,707) (609,806)
Closing less opening operating liabilities (22,144,432) 24,784,325
Closing less opening accrued costs
and deferred revenue, and provisions (1,012,879)
1,451,688
c) Net cash from operating activities (a + b) 201,464,315 118,254,485 B. CASH FLOWS FROM INVESTING ACTIVITIES a) Cash receipts from investing activities 1,097,142,789 1,699,829,662 Interest and dividends received from investing activities 8,824,179 23,522,728
Cash receipts from disposal of intangible assets 5,224,704 197,350
Cash receipts from disposal of property, plant and equipment 309,254 9,422,237
Cash receipts from disposal of investment property 1,287,469 49,089
Cash receipts from disposal of long-term investments 173,727 2,009,442
Cash receipts from disposal of short-term investments 1,081,323,456 1,664,628,816
b) Cash disbursements from investing activities (1,332,696,347) (1,919,557,557) Cash disbursements to acquire intangible assets (11,402,735) (2,344,218)
Cash disbursements to acquire property, plant and equipment (193,443,912) (163,341,825)
Cash disbursements to acquire long-term investments (4,547,219) (88,121,235)
Cash disbursements to acquire short-term investments (1,123,302,481) (1,665,750,279)
c) Net cash from investing activities (a + b) (235,553,558) (219,727,895)C. CASH FLOWS FROM FINANCING ACTIVITIES a) Cash receipts from fi nancing activities 334,533,248 449,873,139 Cash proceeds from paid-in capital 9,553,549 0
Cash proceeds from increase in long-term fi nancial liabilities 99,155,847 128,671,555
Cash proceeds from increase in short-term fi nancial liabilities 225,823,852 321,201,584
b) Cash disbursements from fi nancing activities (302,288,129) (340,368,728) Interest paid on fi nancing activities (14,803,124) (10,851,660)
Cash repayments of long-term fi nancial liabilities (35,687,717) (25,059,182)
Cash repayments of short-term fi nancial liabilities (249,897,288) (295,507,032)
Dividends and other profi t shares paid (1,900,000) (8,950,854)
c) Net cash from fi nancing activities (a + b) 32,245,119 109,504,411D. CLOSING BALANCE OF CASH 13,453,168 15,297,292 x) Net cash fl ow for the period (1,844,124) 8,031,001 y) Opening balance of cash 15,297,292 7,266,291
* The accompanying notes are an integral part of the consolidated fi nancial statements and
should be read in conjunction with them.

151
AN
NU
AL
RE
PO
RT
HS
E |
FIN
AN
CIA
L R
EP
OR
T O
F T
HE
HS
E G
RO
UP
5.6
Co
nso
lid
ate
d s
tate
me
nt
of
ch
an
ge
s i
n e
qu
ity
For
the
year
200
8
* T
he
acco
mp
an
yin
g n
ote
s a
re a
n i
nte
gra
l p
art
of
the
co
nso
lid
ate
d fi
na
ncia
l sta
tem
en
ts a
nd
sh
ou
ld b
e r
ea
d i
n c
on
jun
cti
on
wit
h t
he
m.
in
€
ITEM
S Ca
lled-
up
Capi
tal
Rev
enue
R
eval
uatio
n R
etai
ned
Net
pro
fi t
Cons
olid
atio
n
Equi
ty o
f
ca
pita
l su
rplu
s
rese
rves
su
rplu
s ne
t or
loss
eq
uity
m
inor
ity
profi
t
for
the
adju
stm
ent
owne
rs
TOTA
L
Nom
inal
Oth
er
or
loss
pe
riod
ca
pita
l
reve
nue
re
serv
es
A. B
alan
ce a
t yea
r st
art
29,5
58,7
89
561,
243,
185
13
8,31
9,12
3
22,6
70,4
00
255,
814,
550
0
(4
33,3
09)
30,2
01,4
64
1,03
7,37
4,20
2
B. M
ovem
ents
to e
quity
0
0
0
60
,357
,450
1,
111,
845
73
,801
,282
(4
70,6
72)
29,8
01,3
08
164,
601,
213
a)
Su
bscri
pti
on
of
ca
lle
d-u
p n
om
ina
l ca
pit
al
2
8,7
68
,92
5
28
,76
8,9
25
e)
Ne
t p
rofi
t o
r lo
ss f
or
the
pe
rio
d
7
3,8
01
,28
2
(15
8,6
64
) 7
13
,93
2
74
,35
6,5
50
f) E
qu
ity
reva
lua
tio
n a
dju
stm
en
ts
(33
1,2
93
) (1
30
) (3
31
,42
3)
g)
Oth
er
incre
ase
s i
n c
om
po
ne
nts
of
eq
uit
y
60
,35
7,4
50
1
,11
1,8
45
19
,28
5
31
8,5
81
6
1,8
07
,16
1
C. M
ovem
ents
with
in e
quity
0
0
31
,183
,706
0
(4
,305
,599
) (2
6,87
8,10
7)
0
a)
All
oca
tio
n o
f n
et
pro
fi t
as a
co
mp
on
en
t
of
eq
uit
y in
acco
rda
nce
wit
h a
ma
na
ge
me
nt
2
6,8
78
,10
7
(26
,87
8,1
07
)
0
an
d s
up
erv
iso
ry b
oa
rd d
ecis
ion
b)
All
oca
tio
n o
f n
et
pro
fi t
to a
dd
itio
na
l re
se
rve
s
in a
cco
rda
nce
wit
h a
ge
ne
ral
me
eti
ng
re
so
luti
on
4
,30
5,5
99
(4,3
05
,59
9)
0
D. M
ovem
ents
from
equ
ity
0
0
0
(72,
466,
800)
(1
,900
,000
) 0
0
0
(7
4,36
6,80
0)
a)
Pa
yme
nt
of
div
ide
nd
s
(1,9
00
,00
0)
(1
,90
0,0
00
)
d)
Tra
nsfe
r o
f re
valu
ati
on
su
rplu
s
(to
op
era
tin
g r
eve
nu
e o
r fi
na
nce
in
co
me
)
(3,1
53
,07
1)
(3,1
53
,07
1)
e)
Oth
er
de
cre
ase
s i
n c
om
po
ne
nts
of
eq
uit
y
(69
,31
3,7
29
)
(6
9,3
13
,72
9)
E. C
losi
ng b
alan
ce fo
r th
e pe
riod
29
,558
,789
56
1,24
3,18
5
169,
502,
829
10
,561
,050
25
0,72
0,79
6
46,9
23,1
75
(903
,981
) 60
,002
,772
1,
127,
608,
615

152
AN
NU
AL
RE
PO
RT
HS
E |
FIN
AN
CIA
L R
EP
OR
T O
F T
HE
HS
E G
RO
UP
For
the
year
200
7
* T
he
acco
mp
an
yin
g n
ote
s a
re a
n i
nte
gra
l p
art
of
the
co
nso
lid
ate
d fi
na
ncia
l sta
tem
en
ts a
nd
sh
ou
ld b
e r
ea
d i
n c
on
jun
cti
on
wit
h t
he
m.
in €
ITEM
S Ca
lled-
up
Capi
tal
Rev
enue
R
eval
uatio
n R
etai
ned
Net
pro
fi t
Cons
olid
atio
n
Equi
ty o
f
ca
pita
l su
rplu
s
rese
rves
su
rplu
s ne
t or
loss
eq
uity
m
inor
ity
profi
t
for
the
adju
stm
ent
owne
rs
TOTA
L
Nom
inal
Oth
er
or
loss
pe
riod
ca
pita
l
reve
nue
re
serv
es
As a
t 01/
01/2
007
4,82
4,80
7
692,
999,
922
12
3,16
2,67
0
8,50
7,73
2
226,
597,
387
0
5,
591
85
,631
,243
1,
141,
729,
352
Spin
-off
on
01/0
1/20
07
0
(131
,756
,737
) 0
(1
9,35
2)
(29,
434,
985)
0
0
(3
0,35
7,82
8)
(191
,568
,902
)
A. A
s at
01/
01/2
007
afte
r th
e sp
in-o
ff
4,82
4,80
7
561,
243,
185
12
3,16
2,67
0
8,48
8,38
0
197,
162,
402
0
5,
591
55
,273
,415
95
0,16
0,45
0
B. M
ovem
ents
to e
quity
24
,733
,982
0
0
27
,335
,860
(9
69,6
90)
83,4
61,0
18
(438
,900
) 6,
334,
746
14
0,45
7,01
6
a)
Su
bscri
pti
on
of
ca
lle
d-u
p n
om
ina
l ca
pit
al
24
,73
3,9
82
5
,98
4,2
97
3
0,7
18
,27
9
e)
Ne
t p
rofi
t o
r lo
ss f
or
the
pe
rio
d
8
3,4
61
,01
8
(31
4,9
52
) 6
10
,72
3
83
,75
6,7
89
f) E
qu
ity
reva
lua
tio
n a
dju
stm
en
ts
(11
9,8
00
) 1
9,5
48
(1
00
,25
2)
g)
Oth
er
incre
ase
s i
n c
om
po
ne
nts
of
eq
uit
y
27
,33
5,8
60
(9
69
,69
0)
(4
,14
8)
(27
9,8
22
) 2
6,0
82
,20
0
C. M
ovem
ents
with
in e
quity
0
0
15
,156
,453
(2
68,1
27)
(8,6
82,7
28)
(6,2
05,5
98)
0
0
0
a)
All
oca
tio
n o
f n
et
pro
fi t
as a
co
mp
on
en
t o
f
eq
uit
y in
acco
rda
nce
wit
h a
ma
na
ge
me
nt
6
,20
5,5
98
(6
,20
5,5
98
)
0
an
d s
up
erv
iso
ry b
oa
rd d
ecis
ion
b)
All
oca
tio
n o
f n
et
pro
fi t
to a
dd
itio
na
l
rese
rve
s i
n a
cco
rda
nce
wit
h a
ge
ne
ral
8
,95
0,8
55
(8,9
50
,85
5)
0
me
eti
ng
re
so
luti
on
c)
Se
ttle
me
nt
of
loss a
s
a d
ed
ucti
on
co
mp
on
en
t o
f e
qu
ity
(2
68
,12
7)
26
8,1
27
0
D. M
ovem
ents
from
equ
ity
0
0
0
(12,
885,
713)
(8
,950
,854
) 0
0
(3
1,40
6,69
7)
(53,
243,
264)
a)
Pa
yme
nt
of
div
ide
nd
s
(8,9
50
,85
4)
(8
,95
0,8
54
)
b)
Re
pa
yme
nt
of
ca
pit
al
(3
1,4
06
,69
7)
(31
,40
6,6
97
)
d)
Tra
nsfe
r o
f re
valu
ati
on
su
rplu
s
(to
op
era
tin
g r
eve
nu
e o
r fi
na
nce
in
co
me
)
13
,27
8,0
34
1
3,2
78
,03
4
e)
Oth
er
de
cre
ase
s i
n c
om
po
ne
nts
of
eq
uit
y
(26
,16
3,7
47
)
(2
6,1
63
,74
7)
E. C
losi
ng b
alan
ce fo
r th
e pe
riod
29
,558
,789
56
1,24
3,18
5
138,
319,
123
22
,670
,400
17
8,55
9,13
0
77,2
55,4
20
(433
,309
) 30
,201
,464
1,
037,
374,
202
153
AN
NU
AL
RE
PO
RT
HS
E |
FIN
AN
CIA
L R
EP
OR
T O
F T
HE
HS
E G
RO
UP
5.7 Notes to the consolidated fi nancial statements
5.7.1 Consolidated balance sheet
GeneralInformation on the basis for the preparation of the
consolidated balance sheet and on specifi c accounting
policies selected and applied to the Group’s signifi cant
transactions and other business events are presented
in the disclosures pertaining to individual signifi cant
assets and liabilities.
The Group has no additional information that does not
have to be disclosed in the consolidated balance sheet
but is deemed signifi cant for a true and fair presenta-
tion of the Group’s operations.
The exposure to risks associated with individual types
of assets and liabilities and their management has
been disclosed in the business report.
Assets and liabilities are carried at fair value unless
the fair value of an asset or liability cannot be deter-
mined. In this case, they are carried at historical cost.
(1) Intangible assets and long-term accrued revenue and deferred costs € 48,274,010 Long-term property rights mainly relate to software,
transfer of a lower Sava River concession for a consid-
eration, and CO2 emission coupons.
Under the Environment Protection Act and the Ordi-
nance on the National Plan for the Allocation of CO2
Emission Coupons for the period 2008-2012, two sub-
sidiaries received 24,911,220 CO2 emission coupons
in 2008. In accordance with Interpretation 1 of SAS
2 (2006) issued by the Slovene Institute of Auditors,
these coupons are carried at € 1 per coupon. The val-
ue of the coupons received from the state represents
the bulk of the increase in long-term property rights
in 2008.
The controlling company also has CO2 emission cou-
pons that are held for trading purposes.
The Group’s opening balance of CO2 emission coupons
amounted to 4,865,792. In 2008, 1,287,403 CO2 emis-
sion coupons were purchased (of which 823,572 within
the Group), 24,911,220 coupons were received from
the state, while 6,454,274 coupons were sold or used.
The Group thus had 24,610,141 CO2 emission coupons
at the end of 2008.
During consolidation, CO2 emission coupons worth €
5,572,500 were eliminated on account of intra-Group
sales.
Additional goodwill of € 82,342 was created due to
the elimination of surplus arising from the revalua-
tion of long-term investments in 2008 by a subsidiary
in which the controlling company’s ownership inter-
est was changed after the creation of the revaluation
surplus.
Amortisation rates for intangible assets with fi nite
useful lives range from 2 to 50% p.a.
In 2008 CO2 emission coupons were impaired within
the Group, but no reasons for impairment were deter-
mined in connection with other intangible assets.

154
AN
NU
AL
RE
PO
RT
HS
E |
FIN
AN
CIA
L R
EP
OR
T O
F T
HE
HS
E G
RO
UP
Cost and accumulated amortisation of intangible assets and long-term accrued revenue and deferred costs as at 31/12/2008
Changes in intangible assets and long-term accrued revenue and deferred costs
in €
LONG-TERM OTHER LONG-TERM LONG-TERM DEFERRED ACCRUED REVENUE PROPERTY DEVELOPMENT AND DEFERRED AS AT 31/12/2008 RIGHTS GOODWILL COSTS COSTS TOTAL
Cost 39,959,061 12,387,056 239,177 1,927,820 54,513,114
Accumulated amortisation 6,234,800 0 4,304 0 6,239,104
Carrying amount 33,724,261 12,387,056 234,873 1,927,820 48,274,010
in €
LONG-TERM OTHER LONG-TERM LONG-TERM DEFERRED ACCRUED REVENUE INTANGIBLE PROPERTY DEVELOPMENT AND DEFERRED ASSETS RIGHTS GOODWILL COSTS COSTS TOTAL
Carrying amount
as at 31/12/2007 12,832,029 12,304,714 502,465 2,235,518 27,874,726
Acquisitions 31,920,263 82,342 5,271 94,009 32,101,885
Disposals -9,298,312 0 -272,248 -396,611 -9,967,171
Amortisation -1,747,330 0 -615 0 -1,747,945
Transfers 527,444 0 0 -5,096 522,348
Revaluation -509,780 0 0 0 -509,780
Foreign exchange differences -53 0 0 0 -53
Carrying amount as at 31/12/2008
33,724,261 12,387,056 234,873 1,927,820 48,274,010
Cost and accumulated amortisation of intangible assets and long-term accrued revenue and deferred costs as at 31/12/2007
in €
LONG-TERM OTHER LONG-TERM LONG-TERM DEFERRED ACCRUED REVENUE PROPERTY DEVELOPMENT AND DEFERRED AS AT 31/12/2007 RIGHTS GOODWILL COSTS COSTS TOTAL
Cost 18,749,153 12,304,714 531,885 2,235,518 33,821,270
Accumulated amortisation 5,917,124 0 29,420 0 5,946,544
Carrying amount 12,832,029 12,304,714 502,465 2,235,518 27,874,726

155
AN
NU
AL
RE
PO
RT
HS
E |
FIN
AN
CIA
L R
EP
OR
T O
F T
HE
HS
E G
RO
UP
Cost and accumulated depreciation of property, plant and equipment as at 31/12/2007
Cost and accumulated depreciation of property, plant and equipment as at 31/12/2008
Changes in property, plant and equipment
in €
ADVANCES PRODUCTION OTHER PPE IN THE FOR AS AT PLANT AND PLANT AND COURSE OF ACQUISITION 31/12/2007 LAND BUILDINGS EQUIPMENT EQUIPMENT CONSTRUCTION OF PPE TOTAL
Cost 25,685,831 1,152,379,770 1,775,830,302 34,335,968 198,433,778 18,523,539 3,205,189,188
Accumulated
depreciation 0 661,034,753 1,327,535,420 27,282,607 0 0 2,015,852,780
Carrying amount 25,685,831 491,345,017 448,294,882 7,053,361 198,433,778 18,523,539 1,189,336,408
in €
ADVANCES PRODUCTION OTHER PPE IN THE FOR AS AT PLANT AND PLANT AND COURSE OF ACQUISITION 31/12/2008 LAND BUILDINGS EQUIPMENT EQUIPMENT CONSTRUCTION OF PPE TOTAL
Cost 27,237,926 1,163,688,787 1,839,062,869 37,716,622 278,013,609 16,890,083 3,362,609,896
Accumulated
depreciation 0 681,394,303 1,350,622,453 28,860,626 0 0 2,060,877,382
Carrying amount 27,237,926 482,294,484 488,440,416 8,855,996 278,013,609 16,890,083 1,301,732,514
in €
ADVANCES PRODUCTION OTHER PPE IN THE FOR PROPERTY, PLANT PLANT AND PLANT AND COURSE OF ACQUISITION AND EQUIPMENT LAND BUILDINGS EQUIPMENT EQUIPMENT CONSTRUCTION OF PPE TOTAL
Carrying amount
as at 31/12/2007 25,685,831 491,345,017 448,294,882 7,053,361 198,433,778 18,523,539 1,189,336,408
Acquisitions 1,639,358 0 154,474 469,372 192,608,231 31,730,282 226,601,717
Disposals -87,263 -493,455 -2,232,301 -91,578 -23,000 -22,835,799 -25,763,396
Transfers 0 13,534,791 93,960,075 3,634,694 -112,843,536 -10,527,939 -12,241,915
Depreciation 0 -19,495,685 -50,891,999 -2,208,635 0 0 -72,596,319
Revaluation -2,596,184 -844,715 0 -161,864 0 -3,602,763
Foreign exchange
differences 0 0 0 -1,218 0 0 -1,218
Carrying amount as at 31/12/2008
27,237,926 482,294,484 488,440,416 8,855,996 278,013,609 16,890,083 1,301,732,514
(2) Property, plant and equipment € 1,301,732,514The majority of group companies are engaged in the
production of electricity or extraction of raw materials
used for electricity production. This requires special-
ised equipment and buildings, where the equipment
is located. Property, plant and equipment items thus
account for a signifi cant share of the Group’s assets.
When the joint venture project was transferred to HESS
in the form of an in-kind contribution, the value of prop-
erty, plant and equipment represented an important
share of it, but the transfer itself did not affect the re-
cording of the value of these assets within the Group.
At some group companies, parts of immovable and
movable property were appraised in 2008, resulting
in an impairment of the assets. The appraisals were
prepared by the companies Dominus d.o.o. Ljubljana,
Sveng d.o.o., Ljubljana and Dodoma d.o.o. Maribor.
Group companies do not have any items of property, plant
and equipment held under fi nance lease or mortgage.

156
AN
NU
AL
RE
PO
RT
HS
E |
FIN
AN
CIA
L R
EP
OR
T O
F T
HE
HS
E G
RO
UP
(3) Long-term investments€ 51,541,008During consolidation, € 948,506,794 of long-term in-
vestments in Group companies were eliminated.
During consolidation, the value of investments in as-sociates accounted for using the equity method in-
creased by € 93,960. The increase was recorded as
revaluation surplus.
An investment in the subsidiary Golte, which is not
consolidated, represents an important increase in in-
terests in group companies.
In 2007 other long-term investments also included
the fair value of derivatives. Due to a drop in interest
rates, the fair value of these instruments was negative
at the end of 2008 and was therefore recorded under
other long-term fi nancial liabilities.
Cost and revaluation of long-term investments other than loans
Changes in long-term investments other than loans
in €
INTERESTS INTERESTS OTHER AND SHARES AND SHARES INVESTMENTS OTHER IN GROUP IN IN SHARES LONG-TERM AS AT 31/12/2008 COMPANIES ASSOCIATES AND INTERESTS INVESTMENTS TOTAL
Cost 3,034,734 1,015,126 47,294,798 120,815 51,465,473
Revaluation 0 0 362,355 362,355
Carrying amount 3,034,734 1,015,126 46,932,443 120,815 51,103,118
in €
INTERESTS INTERESTS OTHER AND SHARES AND SHARES INVESTMENTS OTHER LONG-TERM IN GROUP IN IN SHARES LONG-TERM INVESTMENTS COMPANIES ASSOCIATES AND INTERESTS INVESTMENTS TOTAL
Carrying amount
as at 31/12/2007 26,928 1,060,227 46,909,871 1,429,295 49,426,321
Acquisitions 3,016,569 74,919 1,044,117 36,664 4,172,269
Disposals -8,763 -120,020 -659,571 -1,345,144 -2,133,498
Revaluation 0 0 -361,974 0 -361,974
Carrying amount as at 31/12/2008
3,034,734 1,015,126 46,932,443 120,815 51,103,118
(4) Deferred tax assets€ 19,300,196 In 2008 deferred tax assets were created anew in con-
nection with the following:
• creation of provisions for jubilee and termination
benefi ts,
• impairment of long-term and short-term invest-
ments,
• differences between operating and tax depreciation
and amortisation,
• unused tax losses at two companies and other.
Deferred tax assets are used in connection with:
• use of provisions for jubilee and termination ben-
efi ts,
• reversal and use of other provisions,
• reconciliation of deferred tax assets to a lower tax
rate.
In the consolidated income statement for the year
2008 created deferred tax assets amounted to €
4,135,437, with reversed deferred tax assets total-
ling € 9,128,374. In the consolidated balance sheet,
the amount of created deferred tax assets stood at €
325,462.
The Group’s deferred tax liabilities stood at € 2,639 at
the end of 2008.

157
AN
NU
AL
RE
PO
RT
HS
E |
FIN
AN
CIA
L R
EP
OR
T O
F T
HE
HS
E G
RO
UP
Changes in deferred tax assets
Long-term operating receivables by maturity date
in €
DEFERRED DEPRECIATIONTAX ASSETS PROVISIONS IMPAIRMENT AND AMORTISATION OTHER TOTAL
Value as at 31/12/2007 9,630,803 2,936,784 23,645 11,376,439 23,967,671
Creation, increase 268,882 3,796,094 70,461 325,462 4,460,899
Use, decrease -1,306,307 0 -420 -7,821,647 -9,128,374
Value as at 31/12/2008 8,593,378 6,732,878 93,686 3,880,254 19,300,196
in €
Maturity dateLONG-TERM OPERATING before between 01/01/2012 after RECEIVABLES 31/12/2011 and 31/12/2013 01/01/2014 TOTAL
Trade receivables 0 30,521 0 30,521
Receivables from others 2,891,137 70,886 138,673 3,100,696
Total 2,891,137 101,407 138,673 3,131,217
(5) Inventories € 32,873,842Inventories of the Group consist of materials, which
also include small tools with a useful life of up to one
year and value of not more than € 500, products, work
in progress and advances for inventories. In the inven-tories of materials, the biggest amount relates to the
inventories of maintenance materials, spare parts,
coal and heating oil.
Inventories of products mostly relate to coal.
According to the inventory count, the surpluses of
materials and products amounted to € 53,022 and €
36,372, respectively, while the shortages of materials
amounted to € 28,871. At the end of the year inven-
tories were revalued by € 130,406 to refl ect a drastic
drop in the market prices of materials. The value of
materials after the revaluation totalled € 174,342.
The net realisable value of inventories is not lower
than their carrying amount.
(6) Receivables € 156,878,196Long-term trade receivables are not secured.
Other long-term operating receivables mainly com-
prise deposits given as collaterals for electricity trad-
ing by the controlling company.
Short-term trade receivables are mostly secured,
while other short-term receivables are not due to
their nature. Receivables mainly consist of receivables
from the controlling company’s electricity customers.
The Group’s allowances for receivables totalled €
16,162,540, of which the majority relates to a written
off receivable of the controlling company arising from
the provisions of system services, which was made in
2007.
The amount of short-term receivables eliminated in
consolidation totalled € 148,573,632.
Short-term operating receivables by maturity date in €
Breakdown by maturity date
SHORT-TERM Up to 3 3 to 6 6 to 9 9 to 12 More than OPERATING months months months months 1 year RECEIVABLES Not yet due overdue overdue overdue overdue overdue TOTAL
Trade receivables 96,555,165 17,743,867 270,705 9,573 8,412 16,203,487 130,791,209
Receivables
from others 39,013,648 34,234 26,903 40,269 276 2,980 39,118,310
Total 135,568,813 17,778,101 297,608 49,842 8,688 16,206,467 169,909,519

158
AN
NU
AL
RE
PO
RT
HS
E |
FIN
AN
CIA
L R
EP
OR
T O
F T
HE
HS
E G
RO
UP
Off-balance sheet records
(7) Short-term investments€ 116,375,273The largest share of the Group’s short-term invest-
ments relates to deposits with Slovenia’s major banks,
hence the exposure to risks is minimum. Deposits
with banks are not secured, but the loans given are.
(8) Cash € 13,453,168At the balance sheet date, group companies had in
place automatic borrowing facilities in the form of
overdrafts on transaction accounts with banks, which
amounted to € 13,101,030 but were not used as at
31/12/2008.
(9) Short-term accrued revenue and deferred costs € 5,958,343The bulk of the Group’s accrued revenue and deferred
cost items relates to short-term deferred costs (ac-
crued contingent costs of electricity, concessions
in €
TYPES OF SHORT-TERM INVESTMENTS 31/12/08 31/12/07
Deposits with banks 113,231,694 81,741,383
Short-term loans to associates 0 50,075
Short-term loans to others 3,142,025 21,714,293
Other short-term investments 1,554 0
Total 116,375,273 103,505,751
in €
TYPE OF OFF-BALANCE SHEET RECORD 31/12/08 31/12/07
Bank guarantees received and other collaterals 139,222,794 122,764,966
Bank guarantees issued and other collaterals 153,721,991 82,901,089
Futures used for hedging - purchase 76,998,736 104,261,505
Other 2,461,089 2,435,216
Total off-balance sheet records 372,404,610 312,362,776
One of the group companies impaired a loan by €
18,600,000 based on an estimated repayable value of
the principal arising from a loan secured with a mort-
gage. The impaired value of the loan thus amounts to
€ 2,400,000.
paid in advance, insurance premiums, maintenance
costs, etc.).
The amount of short-term accrued revenue and de-
ferred costs eliminated in consolidation totalled €
10,565,336.
(10) Off-balance sheet records€ 372,404,610The Group’s off-balance sheet items comprise given
and received instruments for the collateralisation
of payments (bank guarantees, insurance policies),
granted guarantees and the value of futures.

159
AN
NU
AL
RE
PO
RT
HS
E |
FIN
AN
CIA
L R
EP
OR
T O
F T
HE
HS
E G
RO
UP
The Group’s equity in €
TOTAL EQUITY 31/12/08 31/12/07
Nominal capital 29,558,789 29,558,789
Capital surplus 561,243,185 561,243,185
Other revenue reserves 169,502,829 138,319,123
Revaluation surplus 10,561,050 22,670,400
Retained net profi t or loss 250,720,796 178,559,130
Net profi t or loss for the period 46,923,175 77,255,420
Consolidation equity adjustment -903,981 -433,309
Equity of minority owners 60,002,772 30,201,464
Total 1,127,608,615 1,037,374,202
(11) Equity € 1,127,608,615The value of nominal capital and capital surplus re-
mained unchanged in 2008.
Other revenue reserves total € 169,502,829 and were
increased as follows in 2008:
• by a portion of accumulated profi t for 2007 amounting
to € 4,305,599, in accordance with a resolution adopt-
ed by the controlling company’s General Meeting,
• by a portion of net profi t for 2008 amounting to €
26,878,107, in accordance with a decision taken by
the controlling company’s Supervisory Board on the
management’s proposal.
Retained earnings of € 250,720,796 represent the
controlling company’s share of retained earnings of
subsidiaries and the differences in consolidation from
previous years.
Net profi t for the fi nancial year totals € 46,923,175
and comprises the accumulated profi t of the control-
ling company in the amount of € 26,878,108, the 2008
profi ts or losses of subsidiaries attributable to the
controlling company in the amount of € 47,484,324,
and a decrease by € 27,439,257 arising from consoli-
dation, which represents the elimination of the con-
trolling company’s fi nance income from shares of
profi t of subsidiaries and other effects on the consoli-
dated income statement.
Revaluation surplus, which totals € 10,561,050, stood
at € 11,634,567 at the controlling company (hedging
derivatives) but was reduced during consolidation by
€ 1,073,517, which represents the controlling compa-
ny’s share in the creation of revaluation surpluses in
subsidiaries and its share of profi t of associates.
Consolidation equity adjustment of € -903,981 rep-
resents foreign exchange differences that occurred
in the translation of balance sheet items and income
statement items of subsidiaries abroad and foreign ex-
change difference determined during consolidation.
Minority interest increased by € 29,801,308 in 2008,
mainly due to incorporation of HESS in the consoli-
dated fi nancial statements, and totals € 60,002,772.
The amount of subsidiaries’ equity eliminated during
consolidation totalled € 935,554,785.
in €
PROFIT OR LOSS OF THE GROUP AFTER EQUITY RESTATEMENT 31/12/08
Net profi t or loss 73,801,282
Equity restatement result -21,159,727
Profi t or loss after restatement based on consumer prices (2.1% growth) 52,641,555
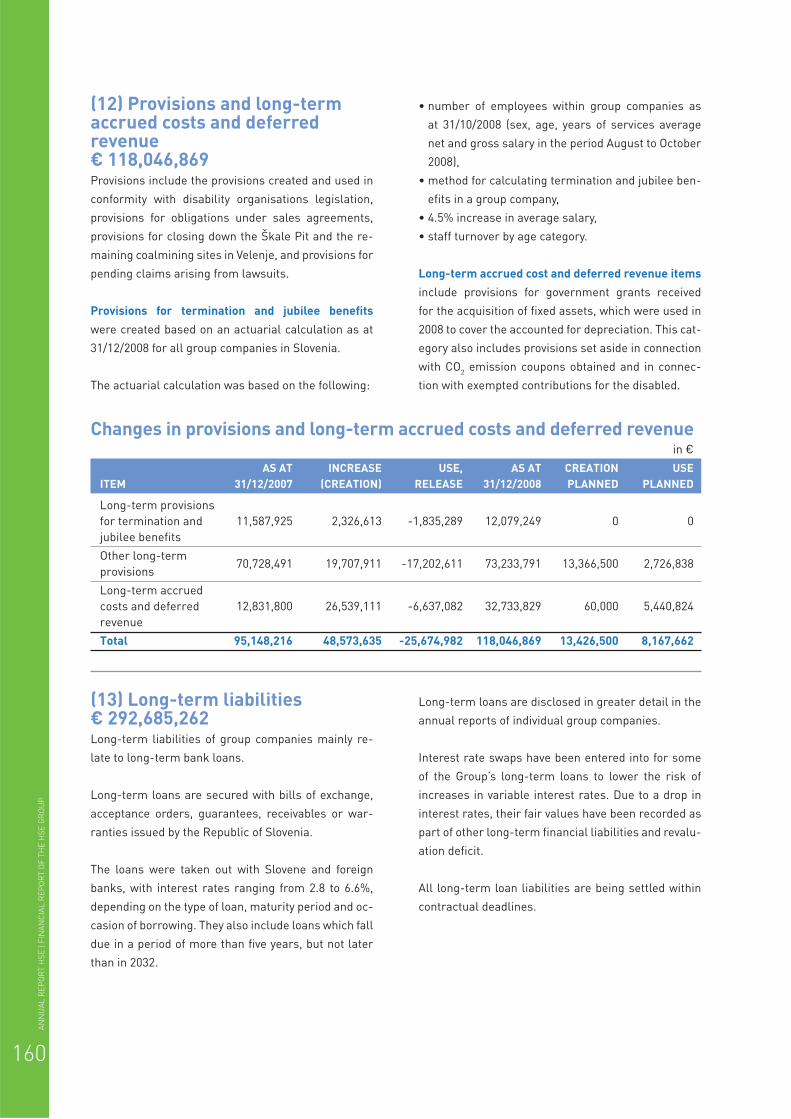
160
AN
NU
AL
RE
PO
RT
HS
E |
FIN
AN
CIA
L R
EP
OR
T O
F T
HE
HS
E G
RO
UP
(12) Provisions and long-term accrued costs and deferred revenue € 118,046,869Provisions include the provisions created and used in
conformity with disability organisations legislation,
provisions for obligations under sales agreements,
provisions for closing down the Škale Pit and the re-
maining coalmining sites in Velenje, and provisions for
pending claims arising from lawsuits.
Provisions for termination and jubilee benefi ts
were created based on an actuarial calculation as at
31/12/2008 for all group companies in Slovenia.
The actuarial calculation was based on the following:
• number of employees within group companies as
at 31/10/2008 (sex, age, years of services average
net and gross salary in the period August to October
2008),
• method for calculating termination and jubilee ben-
efi ts in a group company,
• 4.5% increase in average salary,
• staff turnover by age category.
Long-term accrued cost and deferred revenue items include provisions for government grants received
for the acquisition of fi xed assets, which were used in
2008 to cover the accounted for depreciation. This cat-
egory also includes provisions set aside in connection
with CO2 emission coupons obtained and in connec-
tion with exempted contributions for the disabled.
Changes in provisions and long-term accrued costs and deferred revenue in €
AS AT INCREASE USE, AS AT CREATION USEITEM 31/12/2007 (CREATION) RELEASE 31/12/2008 PLANNED PLANNED
Long-term provisions
for termination and 11,587,925 2,326,613 -1,835,289 12,079,249 0 0
jubilee benefi ts
Other long-term
provisions 70,728,491 19,707,911 -17,202,611 73,233,791 13,366,500 2,726,838
Long-term accrued
costs and deferred 12,831,800 26,539,111 -6,637,082 32,733,829 60,000 5,440,824
revenue
Total 95,148,216 48,573,635 -25,674,982 118,046,869 13,426,500 8,167,662
(13) Long-term liabilities€ 292,685,262Long-term liabilities of group companies mainly re-
late to long-term bank loans.
Long-term loans are secured with bills of exchange,
acceptance orders, guarantees, receivables or war-
ranties issued by the Republic of Slovenia.
The loans were taken out with Slovene and foreign
banks, with interest rates ranging from 2.8 to 6.6%,
depending on the type of loan, maturity period and oc-
casion of borrowing. They also include loans which fall
due in a period of more than fi ve years, but not later
than in 2032.
Long-term loans are disclosed in greater detail in the
annual reports of individual group companies.
Interest rate swaps have been entered into for some
of the Group’s long-term loans to lower the risk of
increases in variable interest rates. Due to a drop in
interest rates, their fair values have been recorded as
part of other long-term fi nancial liabilities and revalu-
ation defi cit.
All long-term loan liabilities are being settled within
contractual deadlines.

161
AN
NU
AL
RE
PO
RT
HS
E |
FIN
AN
CIA
L R
EP
OR
T O
F T
HE
HS
E G
RO
UP
Maturity dates of long-term liabilities
Maturity dates of short-term operating liabilities
Types of short-term liabilities
in €
Maturity date between LONG-TERM before 01/01/2012 after LIABILITIES 31/12/2011 and 31/12/2013 01/01/2014 TOTAL
Long-term fi nancial liabilities to banks 97,179,466 52,599,087 138,966,250 288,744,803
Long-term fi nancial liabilities to others 1,470,679 149,179 0 1,619,858
Long-term operating trade liabilities 1,547,155 460,851 0 2,008,006
Long-term operating liabilities to others 9,821 6,987 293,148 309,956
Total 100,207,121 53,216,104 139,259,398 292,682,623
(14) Short-term liabilities € 194,052,222 None of the short-term fi nancial liabilities were due
yet and mostly relate to the portion of long-term loans
falling due within one year of the balance sheet date.
They are secured with bills of exchange, acceptance
orders, guarantees, receivables or warranties issued
by the Republic of Slovenia. Interest rates on short-
in €
TYPES OF SHORT-TERM LIABILITIES 31/12/08 31/12/07
Short-term fi nancial liabilities to banks 45,298,464 82,457,908
Short-term fi nancial liabilities to others 183,345 87,177
Short-term operating trade liabilities 104,391,606 123,352,275
Short-term operating liabilities to associates 0 4,388
Short-term operating liabilities from advances 190,486 442,148
Short-term operating liabilities to others 43,988,321 35,306,724
Total 194,052,222 241,650,620
in €
SHORT-TERM Up to 3 months More than 3 OPERATING LIABILITIES Not yet due overdue months overdue TOTAL
Short-term trade liabilities 104,318,998 64,445 8,163 104,391,606
Short-term liabilities from advances 190,486 0 0 190,486
Short-term liabilities to others 43,988,321 0 0 43,988,321
Total 148,497,805 64,445 8,163 148,570,413
term loans range from 3.63 to 8%. Short-term loans
are disclosed in greater detail in the annual reports
of individual group companies. The amount of short-
term operating trade liabilities due on the balance
sheet date totalled € 72,608.
The amount of short-term operating liabilities elimi-
nated in consolidation totalled € 159,158,253.
Breakdown by maturity

162
AN
NU
AL
RE
PO
RT
HS
E |
FIN
AN
CIA
L R
EP
OR
T O
F T
HE
HS
E G
RO
UP
in €
Foreign As at Increase Use, exchange As at ITEM 31/12/2007 (creation) release differences 31/12/2008
Short-term accrued costs 9,749,812 97,813,202 -92,249,107 -3,651 15,310,256
Short-term deferred revenue 74,651 8,686 -75,778 0 7,559
Total 9,824,463 97,821,888 -92,324,885 -3,651 15,317,815
Changes in short-term accrued costs and deferred revenue
5.7.2 Consolidated income statement
GeneralInformation on the basis for the preparation of the
consolidated income statement and on specifi c ac-
counting policies selected and applied to the Group’s
signifi cant operations and business events are pre-
sented in disclosures pertaining to individual revenue
and expense items.
The consolidated income statement has been pre-
pared using Format I as defi ned in SAS 25.
Revenue € 920,705,280The Groups’ revenue is comprised of operating rev-
enue, fi nance income and other revenue.
in €
TYPES OF REVENUE YEAR 2008 YEAR 2007Operating revenue 903,420,050 1,011,617,008
Finance income 11,469,110 32,301,850
Other revenue 5,816,120 804,588
Total 920,705,280 1,044,723,446
(15) Short-term accrued costs and deferred revenue € 15,317,815The majority of the Group’s short-term accrued cost
and deferred revenue items relate to accrued costs
associated with contingent electricity costs, accrued
costs of unutilised leave, loan interest and VAT on ad-
vances paid.
The amount of short-term accrued cost and deferred
revenue items relating to accrued costs of CO2 emis-
sion coupons, which were eliminated during consoli-
dation, stood at € 6,118,168.
Operating revenue € 903,420,050The majority of net sales revenue relates to the rev-
enue generated through the sale of electricity.
The amount of net sales revenue and other operat-
ing revenue eliminated during consolidation totals €
579,767,094 and € 37,440, respectively.
The value of capitalised own products and services
increased by € 3,471,785 during consolidation, specif-
ically due to the sale of property, plant and equipment
within the Group.
Finance income € 11,469,110Finance income mainly relates to interest on deposits
and loans.
The amount of fi nance income eliminated during con-
solidation totals € 28,146,654. This mainly relates
to the payment of a share of profi t to the controlling
company by two subsidiaries.
Other revenue € 5,816,120 The Group’s other revenue includes the amounts of re-
alised bank guarantees, compensation and subsidies.

163
AN
NU
AL
RE
PO
RT
HS
E |
FIN
AN
CIA
L R
EP
OR
T O
F T
HE
HS
E G
RO
UP
in €
NET SALES REVENUE BY BUSINESS SEGMENT YEAR 2008 YEAR 2007
Electricity 840,340,453 953,578,530
Other 32,421,875 28,754,791
Total 872,762,328 982,333,321
in €
NET SALES REVENUE BY GEOGRAPHICAL SEGMENT YEAR 2008 YEAR 2007
Domestic market 625,382,932 722,268,188
Foreign market 247,379,396 260,065,133
Total 872,762,328 982,333,321
in €
TYPES OF EXPENSES YEAR 2008 YEAR 2007
Operating expenses 786,648,130 945,117,205
Finance expenses 38,929,791 15,239,916
Other expenses 1,596,431 1,141,529
Total 827,174,352 961,498,650
Segments
Operating expenses € 786,648,130The cost of goods sold mainly relates to the cost of
electricity.
The costs of materials mostly relate to the costs of
energy, fuel, materials specifi c to each type of produc-
tion, and spare parts.
The cost of goods and materials sold eliminated dur-
ing consolidation totalled € 574,662,900.
The majority of costs of services relate to the costs
of services associated with production, maintenance
costs, transport costs and insurance premiums.
The costs of services eliminated during consolidation
totalled € 1,808,041.
Labour costs comprise salaries and compensations,
social insurance contributions, additional pension in-
surance and other labour cost (meal allowance, com-
muting allowance, holiday allowance, jubilee benefi ts,
fi nancial support, termination benefi ts, etc.). Other
labour costs also include the payroll tax.
The majority of write-downs in value refer to the
amortisation of intangible assets and depreciation of
property, plant and equipment.
In relation to intangible assets and property, plant and
equipment, the biggest part of revaluation operating
expenses relates to the write-down of unusable and
technologically or economically ineffi cient assets,
whereas in operating current assets, it refers to the
revaluation of materials inventories.
Expenses€ 827,174,352The Group’s expenses are comprised of operating, fi -
nance and other expenses.

164
AN
NU
AL
RE
PO
RT
HS
E |
FIN
AN
CIA
L R
EP
OR
T O
F T
HE
HS
E G
RO
UP
in €
TYPES OF OPERATING EXPENSES YEAR 2008 YEAR 2007
Cost of goods sold and costs of materials 446,843,322 629,285,523
Costs of services 61,277,352 52,411,026
Labour costs 137,687,403 123,900,511
Depreciation and amortisation 74,358,495 72,040,630
Revaluation operating expenses associated
with intangible assets and property, plant and equipment 4,927,577 9,469,391
Revaluation operating expenses associated with operating current assets 394,376 15,051,623
Other operating expenses 61,159,605 42,958,501
Total 786,648,130 945,117,205
in €
FUNCTIONAL GROUPS YEAR 2008 YEAR 2007
Cost of goods sold or production costs of quantities sold 693,637,238 844,851,228
Cost of sales 13,408,994 11,226,747
General and administrative costs 75,463,558 78,789,959
in €
TYPE OF ASSET DEPRECIATION/ AMORTISATION RATEBuildings 0.75 - 11.33 %
Production equipment 0.74 - 33.33 %
Other equipment 3.34 - 33.3 %
Computer equipment 33.33 - 50 %
Intangible assets 2 - 50 %
Types of operating expenses
Overview of costs by functional group
Amortisation rates for intangible assets and depreciation rates for property, plant and equipment of the Group
Group companies account for the amortisation of in-
tangible assets and depreciation of property, plant and
equipment using the straight-line method. Assets are
depreciated/amortised individually based on antici-
pated useful lives.
The depreciation of property, plant and equipment ac-
quired through government grants or free of charge
is accounted for separately. For the amount of accu-
mulated depreciation, long-term accrued cost and
deferred revenue items are used and other operating
revenue recorded.
The Group applies similar rates of depreciation to
the property, plant and equipment of the same kind,
whereas with manufacturing plant and equipment, in-
dividual companies apply depreciation rates that cor-
respond to their activities.
Other operating expenses comprise a concession fee
payable to the state, building site fees, fee for a lim-
ited area use, water charge, environmental charge,
creation of provisions, scholarships and donations.
The amount of other intra-group operating expenses
eliminated during consolidation totalled € 222,602.
Finance expenses € 38,929,791Finance expenses mostly relate to a write-off of a short-
term investments by one of HSE Group companies and
to interest on long-term and short-term loans.
The amount of fi nance expenses for loan interest elim-
inated during consolidation totalled € 346,603.
Other expenses € 1,596,431Other expenses mainly relate to fi nes and compensa-
tions paid.

165
AN
NU
AL
RE
PO
RT
HS
E |
FIN
AN
CIA
L R
EP
OR
T O
F T
HE
HS
E G
RO
UP
in €
TYPE OF PROFIT OR LOSS YEAR 2008 YEAR 2007
Operating profi t or loss 116,771,920 66,499,803
Profi t or loss on ordinary activities 89,311,239 83,561,737
Profi t or loss on extraordinary activities 4,219,689 -336,941
Total profi t or loss 93,530,928 83,224,796
Net profi t or loss for the accounting period 74,515,214 84,071,741
- of which majority owner 73,801,282 83,461,018
- of which minority owner 713,932 610,723
Profi t or loss of the Group
Corporate income tax€ 14,022,776In 2008 seven group companies in Slovenia and four
out of fi ve abroad were liable to pay corporate income
tax. Owing to tax breaks or tax losses, the remaining
companies did not calculate the basis for the payment
of the tax.
At the end of 2008, the group companies’ unused tax
losses stood at € 35,583,792.
Deferred taxes € 4,992,938Deferred taxes relate to deferred tax assets recog-
nised in the likely amount of available profi t against
which they can be used in the future. Deferred tax as-
sets are decreased by the amount up to which it is no
longer probable that tax deductible expenses can be
utilised in the future or the amount up to which ex-
penses have been included in tax statements for the
current year. The amount of € 4,992,938 relates to the
creation and use of deferred tax assets by HSE Group
companies in 2008.
Net profi t or loss € 74,515,214Net profi t or loss relates to the net profi t or loss of the
controlling company (€ 53,756,215), the controlling
company’s share of profi ts or losses of its subsidiaries
(€ 47,484,324), decrease in profi t or loss as a result of
the elimination of the controlling company’s fi nance
income associated with the payment of shares of prof-
it of subsidiaries and other effects on the consolidated
profi t or loss during consolidation (€ -27,439,257), and
net profi t or loss of minority owners (€ 713,932).

166
AN
NU
AL
RE
PO
RT
HS
E |
FIN
AN
CIA
L R
EP
OR
T O
F T
HE
HS
E G
RO
UP
5.7.3 Consolidated cash fl ow statement
General The consolidated cash fl ow statement shows changes
in the balance of cash during a fi nancial year.
The Group’s cash comprises cash on hand, deposit
money in transaction accounts, and deposits redeem-
able at notice.
The cash fl ow statement has been prepared using the
indirect method (Format II – SAS 26.9).
The data presented in the consolidated cash fl ow
statement has been obtained from the cash fl ow
statements of group companies, taking into account
consolidation eliminations.
in €
TYPE OF CASH FLOW YEAR 2008 YEAR 2007Cash fl ows from operating activities 201,464,315 118,254,485
Cash fl ows from investing activities -235,553,558 -219,727,895
Cash fl ows from fi nancing activities 32,245,119 109,504,411
Net cash fl ow for the period -1,844,124 8,031,001
Cash fl ows
5.7.4 Consolidated state-ment of changes in equity
GeneralThe consolidated statement of changes in equity
shows all changes in equity components during a fi -
nancial year.
MethodThe consolidated statement of changes in equity has
been prepared using Format I as defi ned in SAS 27.2.
Accumulated profi t is not determined at the Group
level.
Movements to equityIn 2008 movements to equity amounted to €
164,601,213.
The equity of the Group (excluding minority interests)
changed by € 134,799,905 as follows:
• it was increased by net profi t or loss of the Group (€
73,801,282),
• it was increased by retained profi t or loss of the
Group (€ 1,111,845) arising from consolidation at
the level of a subsidiary,
• it was decreased by the amount of consolidation
equity adjustment (€ -470,672) arising from foreign
exchange differences in subsidiaries abroad,
• it was increased by the amount of revaluation surplus
amounting to € 60,357,450, of which € 62,261,577
was recorded by a subsidiary (gain on futures used
for hedging), € -1,911,221 represents the controlling
company’s share of revaluation surplus of subsid-
iaries and € 7,094 represents the controlling com-
pany’s share of profi ts or losses of associates.
Minority interest changed by € 29,801,308 as follows:
• it was increased by € 28,768,925 due to the incorpo-
ration of a new company into the Group,
• it was increased by net profi t or loss of group com-
panies (€ 713,932),
• it was decreased by the amount of revaluation sur-
plus of group companies (€ -130),
• it was increased by retained profi t or loss of the
Group (€ 318,581) arising from consolidation at the
level of a subsidiary.
Movements within equityMovements within equity, which amounted to €
31,183,706, comprise:
• allocation of a portion of the controlling company’s
accumulated profi t for 2007 (in accordance with a
General Meeting resolution) of € 4,305,599 to other
revenue reserves,
• allocation of half of the controlling company’s net
profi t for the current year (in accordance with a Su-
pervisory Board decision taken on the management’s
proposal) of € 26,878,107 to other revenue reserves.
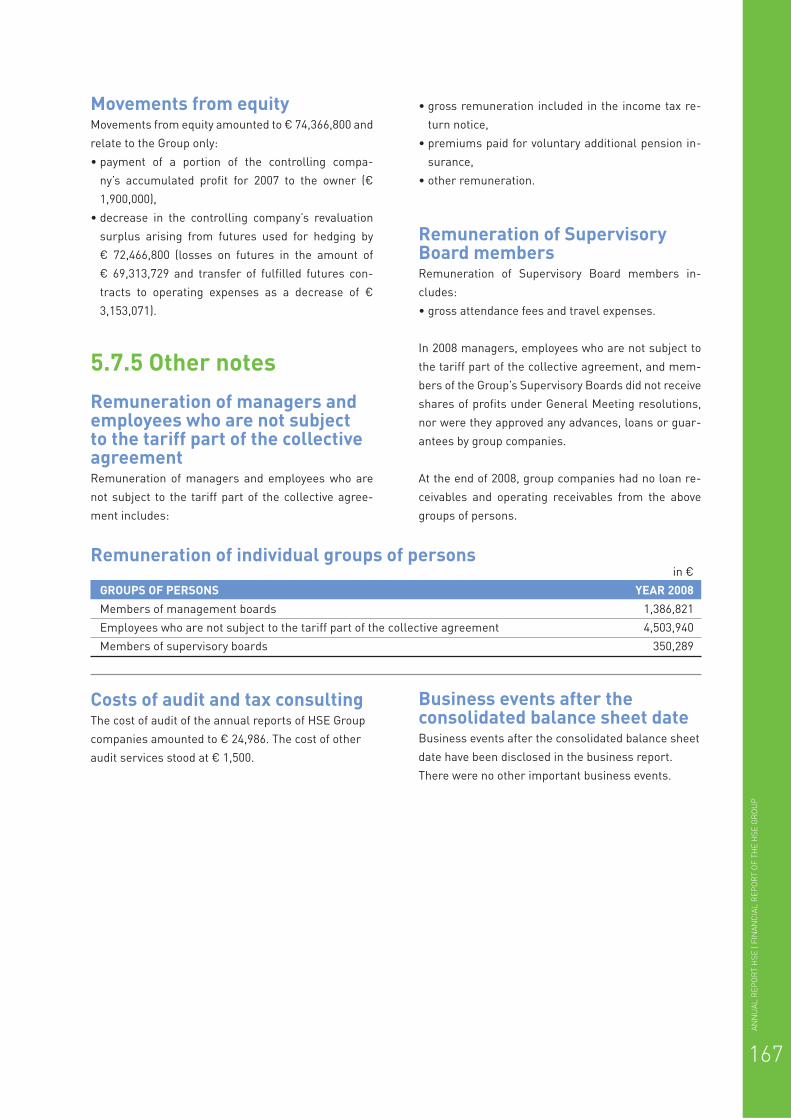
167
AN
NU
AL
RE
PO
RT
HS
E |
FIN
AN
CIA
L R
EP
OR
T O
F T
HE
HS
E G
RO
UP
Movements from equityMovements from equity amounted to € 74,366,800 and
relate to the Group only:
• payment of a portion of the controlling compa-
ny’s accumulated profi t for 2007 to the owner (€
1,900,000),
• decrease in the controlling company’s revaluation
surplus arising from futures used for hedging by
€ 72,466,800 (losses on futures in the amount of
€ 69,313,729 and transfer of fulfi lled futures con-
tracts to operating expenses as a decrease of €
3,153,071).
5.7.5 Other notesRemuneration of managers and employees who are not subject to the tariff part of the collective agreementRemuneration of managers and employees who are
not subject to the tariff part of the collective agree-
ment includes:
• gross remuneration included in the income tax re-
turn notice,
• premiums paid for voluntary additional pension in-
surance,
• other remuneration.
Remuneration of Supervisory Board members Remuneration of Supervisory Board members in-
cludes:
• gross attendance fees and travel expenses.
In 2008 managers, employees who are not subject to
the tariff part of the collective agreement, and mem-
bers of the Group’s Supervisory Boards did not receive
shares of profi ts under General Meeting resolutions,
nor were they approved any advances, loans or guar-
antees by group companies.
At the end of 2008, group companies had no loan re-
ceivables and operating receivables from the above
groups of persons.
in €
GROUPS OF PERSONS YEAR 2008Members of management boards 1,386,821
Employees who are not subject to the tariff part of the collective agreement 4,503,940
Members of supervisory boards 350,289
Remuneration of individual groups of persons
Costs of audit and tax consultingThe cost of audit of the annual reports of HSE Group
companies amounted to € 24,986. The cost of other
audit services stood at € 1,500.
Business events after the consolidated balance sheet dateBusiness events after the consolidated balance sheet
date have been disclosed in the business report.
There were no other important business events.

Rel
axat
ion
lead
s to
cre
ativ
ity
Novelties animate
Ima
gin
ati
on
se
ek
s i
de
asIdeas are im
plemented through w
ork
Work dem
ands relaxation


170
AN
NU
AL
RE
PO
RT
HS
E |
CO
NTA
CT
IN
FO
RM
AT
ION
06 Contact information
Holding Slovenske elektrarne d.o.o.Address Koprska ulica 92
1000 Ljubljana
Slovenia
Telephone 01 470 41 00
Fax 01 470 41 01
E-mail [email protected]; [email protected]
Website www.hse.si
Dravske elektrarne Maribor d.o.o.Address Obrežna ulica 170
2000 Maribor
Slovenia
Telephone 02 300 50 00
Fax 02 300 56 55
E-mail [email protected]
Website www.dem.si
Soške elektrarne Nova Gorica d.o.o.Address Erjavčeva ulica 20
5000 Nova Gorica
Slovenia
Telephone 05 339 63 10
Fax 05 339 61 15
E-mail [email protected]
Website www.seng.si
Hidroelektrarne na Spodnji Savi, d.o.o.Address Cesta prvih borcev 18
8250 Brežice
Slovenia
Telephone 07 816 45 00
02 300 59 42
Fax 02 300 59 41
E-mail /
Website /

171
AN
NU
AL
RE
PO
RT
HS
E |
CO
NTA
CT
IN
FO
RM
AT
ION
Termoelektrarna Šoštanj d.o.o.Address Cesta Lole Ribarja 18
3325 Šoštanj
Slovenia
Telephone 03 899 31 00
Fax 03 899 34 85
E-mail [email protected]
Website www.te-sostanj.si
Termoelektrarna Trbovlje d.o.o.Address Ob železnici 27
1420 Trbovlje
Slovenia
Telephone 03 565 12 00
Fax 03 565 12 32
E-mail [email protected]
Website www.tet.si
Premogovnik Velenje d.d.Address Partizanska cesta 78
3320 Velenje
Slovenia
Telephone 03 899 61 00
Fax 03 586 91 31
E-mail [email protected]
Website www.rlv.si
Plinsko parna elektrarna d.o.o., KidričevoAddress Tovarniška cesta 10
2325 Kidričevo
Slovenia
Telephone 02 799 51 20
Fax 02 799 41 03
E-mail [email protected]
Website /
HSE Italia S.r.l.Address Via Roma 20
34170 Gorizia
Italy
Telephone + 39 0481 537 386
Fax + 39 0481 536 667
E-mail [email protected]
Website /
HSE Balkan Energy d.o.o.Address Bulevar Mihaila Pupina 117
11000 Beograd
Serbia
Telephone + 381 11 311 55 86
Fax + 381 11 311 55 87
E-mail [email protected]
Website /
HSE Hungary Kft.Address Károlyi Mihály u. 12
1053 Budapest
Hungary
Telephone + 36 1 486 22 00
Fax + 36 1 486 22 01
E-mail [email protected]
Website /
HSE Adria d.o.o.Address Miramarska 24
10 000 Zagreb
Croatia
Telephone + 385 160 05 659
Fax + 385 160 05 657
E-mail [email protected]
Website /
HSE Bulgaria EOODAddress 37 Fridtjof Nansen Street
Sredetz Region
Sofi a 1142
Bulgaria
Telephone + 359 2 96 97 600
Fax + 359 2 98 05 340
E-mail [email protected]
Website /
Toplofi katsia-Ruse ADAddress TEC-Iztok Street
7009 Rousse
Bulgaria
Telephone + 359 82 88 33 11, + 359 82 84 19 05
Fax + 359 82 84 40 68
E-mail [email protected],
Website www.toplo-ruse.com

172
AN
NU
AL
RE
PO
RT
HS
E |
CO
NTA
CT
IN
FO
RM
AT
ION
Branch offi ce HSE PragueAddress Myslikova 28
121 02 Praha 2
Czech Republic
Telephone + 420 257 311 210
Fax + 420 257 317 238
E-mail [email protected]
Website /
Branch offi ce HSE BratislavaAddress Varšavská 16
831 03 Bratislava
Slovakia
Telephone + 420 257 311 210
Fax + 420 257 317 238
E-mail /
Website /
Representative offi ce HSE BelgradeAddress Bulevar Mihaila Pupina 117
11000 Beograd
Serbia
Telephone + 381 11 311 55 86
Fax + 381 11 311 55 87
E-mail [email protected]
Website /
Representative offi ce HSE BucharestAddress Str. Economu Cezărescu nr. 31B
RO-060754, sector 6, Bucharest
Romania
Telephone +040 31 229 26 00
Fax +040 31 229 26 01
E-mail [email protected]
Website /
HSE Invest d.o.o.Address Obrežna ulica 170a
2000 Maribor
Slovenia
Telephone 02 300 58 92
Fax 02 300 58 99
E-mail [email protected]
Website www.hse-invest.si
Hidro Moćnost Makedonija d.o.o.Address Ul. Orce Nikolov Br. 98
1000 Skopje-centar
Macedonia
Telephone /
Fax /
E-mail /
Website /

173
AN
NU
AL
RE
PO
RT
HS
E |
AB
BR
EV
IAT
ION
S
ABBREVIATIONS
AHP Austrian hydro power plants on the Drava River
GDP Gross domestic product
BoS Bank of Slovenia
CCS Carbon capture and storage
CER Certifi ed emission reductions
CC Control centre
PSP Pumped storage plant
VAT Value added tax
DEM Dravske elektrarne Maribor d.o.o.
NDP National detailed plan
NSP National spatial plan
OPL Overhead power line
EBIT Operating profi t or loss
EBITDA Operating profi t or loss plus amortisation and depreciation
EE Electricity
EE TÜV Organisation for technical control of RES
EEX European electricity exchange in Leipzig
EFET European Federation of Energy Traders
EIB European Investment Bank
ELES Elektro–Slovenija, d.o.o.
E-RES Electricity from renewable energy sources
EU European Union
EURIBOR Euro interbank offered rate
EXAA Austrian electricity exchange
EAS Electrotechnical Association of Slovenia
€ The euro
HACCP Hazard analysis and critical control points
HPP Hydropower plant
HESS Hidroelektrarne na Spodnji Savi, d.o.o.
HSE Holding Slovenske elektrarne d.o.o.
INFOS Information system
IPEX Italian electricity exchange
IS Information system
ISO International Organisation for Standardisation
IT Information technology
ITIL Information technology infrastructure library (good practice of IT services management)
MoE Ministry of the Economy
MoF Ministry of Finance
SHPP Small hydropower plants
MESP Ministry of the Environment and Spatial Planning
MDS Measurement and distribution station
HEA Hungarian energy agency
NEK Nuklearna elektrarna Krško d.o.o.
NKBM Nova kreditna banka Maribor
NLB Nova ljubljanska banka
SB Supervisory Board
ODOS Electronic document system
OHSAS Occupational health and safety management system

174
AN
NU
AL
RE
PO
RT
HS
E |
AB
BR
EV
IAT
ION
S
PPE Property, plant and equipment
OTE Czech electricity market operator
RES Renewable energy sources
BU Business unit
DOBP Design for obtaining a building permit
GoO Guarantee of origin
PPEK Plinsko parna elektrarna d.o.o.
PXE Prague electricity exchange
PV Premogovnik Velenje d.d.
DD Detailed design
TD Tender documents
RECS Renewable energy certifi cate system
RS Republic of Slovenia
DTS Distribution transformer station
SDE Slovene Power Sector Trade Union
SEL Savske elektrarne Ljubljana d.o.o.
SENG Soške elektrarne Nova Gorica d.o.o.
SIR Slovene Institute of Auditors
SPESS Slovene Union of Coalminers
SAS Slovene Accounting Standards
JWC Joint workers' council
SORS Statistical Offi ce of the Republic of Slovenia
TPP Thermal power plant
TEB Termoelektrarna Brestanica d.o.o.
TEŠ Termoelektrarna Šoštanj d.o.o.
TET Termoelektrarna Trbovlje d.o.o.
GHG Greenhouse gases
TC Telecommunications
IMAD Institute of Macroeconomic Analysis and Development
UPIS Management information system
USP S10 USP Institute learning enterprise standard
ZEPP Zero emission power plant
ZGD Companies Act
ZFPPZIPP Financial Operations, Insolvency Proceedings and Compulsory Dissolution Act
ZSSS Association of Free Trade Unions of Slovenia
THE SLOVENIAN VERSION OF THIS ANNUAL REPORT IS AUTHORITATIVE.

