annual report - industrial strategy council
TRANSCRIPT
Industrial Strategy Council: Annual Report
1
Annual Report
Industrial Strategy Council
Annual Report
March 2021

Industrial Strategy Council: Annual Report
1
About the Industrial Strategy Council
The Industrial Strategy Council (‘the Council’) is an independent non-statutory
advisory group established in November 2018. It is tasked with providing impartial
and expert evaluation of the government’s progress in delivering the aims of the
Industrial Strategy. Its membership is comprised of leading men and women from
business, academia and civil society.
Acknowledgements
The Industrial Strategy Council would like to thank the research team for their
contribution to this Annual Report. The Council would also like to thank Christine
Gaskell, Jennifer Rubin and Rupert Harrison who stepped down as members of the
Council earlier in the year but who made a significant contribution to the Council’s
work.

Industrial Strategy Council: Annual Report
2
Contents
Foreword from the Chair ......................................................................................... 3
Executive Summary ................................................................................................. 4
Membership .............................................................................................................. 8
Section 1: Introduction ............................................................................................ 9
Section 2: How the challenge has changed - Covid and productivity ............... 10
How we work ......................................................................................................... 10
Where activity takes place .................................................................................... 15
How business operates ......................................................................................... 20
Section 3: An assessment of the Plan for Growth .............................................. 25
Overarching recommendations ............................................................................. 25
An assessment of policy content ........................................................................... 28
Section 4: Lessons from implementation of the 2017 strategy .......................... 38
Policy delivery progress ........................................................................................ 38
Lessons learnt ....................................................................................................... 40
Section 5: The Council’s work .............................................................................. 41

Industrial Strategy Council: Annual Report
3
Foreword from the Chair
The last 12 months has been a period of
significant economic and social change, with a
global pandemic shifting how we work, where
we work and the way in which businesses
operate and the UK leaving the European
Union. This has added to the importance of
considered and co-ordinated supply-side
policies capable of delivering growth in
productivity and pay across all parts of the UK.
This final Annual Report from the Industrial Strategy Council (ISC) provides its
independent assessment of the Government’s 2017 Industrial Strategy and the
lessons that contains for its 2021 Plan for Growth. This independent evaluation is,
the Council believes, a crucial ingredient of rigorous, transparent and accountable
public policy, especially for supply-side policies whose payoffs only arise over the
medium term.
On behalf of the Council, it has been a pleasure and a privilege to provide that
independent and rigorous evaluation of the Government’s Industrial Strategy over
the past 2½ years. I hope the extensive research and outputs of the ISC over that
period will make a lasting and significant contribution to public policy design,
implementation and evaluation in this crucial area for all of our living standards.
Industrial Strategy Council: Annual Report
4
Executive Summary
In the light of Covid, the case for a strategy to boost the productivity, prosperity and
earning power of people throughout the UK is stronger than ever. That was the aim
of the UK Government’s 2017 Industrial Strategy. It has now been replaced by the
recently published Build Back Better: our plan for growth (Plan for Growth).
Whether it is called an Industrial Strategy or a Plan for Growth, the basic premise is
the same – a programme of supply-side policies to drive prosperity in and across the
economy. In this final Annual Report, the Industrial Strategy Council assesses
progress on the 2017 Industrial Strategy and draws out lessons for the Government
as it moves forward with its new plan.
The UK has a real opportunity over the next decade to make significant progress on
boosting innovation among companies and sectors, reducing inequalities across
regions, and harnessing the benefits of a productivity-enhancing and fair transition to
Net Zero emissions. Those opportunities are both domestic and global, as the UK re-
thinks and re-establishes its role in global trade and value chains following Brexit.
The Covid crisis has had a huge economic and social impact and will have a lasting
influence on how we work, where activity takes place, and the way businesses
operate (Section 2). These changes present opportunities that could boost
productivity and reduce spatial inequalities. New ways of working, such as hybrid
working for many office-based workers, have the potential to increase productivity
and enhance well-being. There is an opportunity to deliver a wholesale improvement
in UK digital infrastructure and skills as part of the recovery. And new ways of
working and doing business could help in delivering Levelling Up across the UK.
The Covid pandemic has also highlighted the importance of building resilience in the
economy. The successful development and deployment of Covid vaccines highlights
the benefits of supporting and co-ordinating across Government departments and
across sectors through strategic industrial policies, building on existing strengths and
capabilities. The Council is publishing a report, alongside this Annual Report, on the
lessons from that case study for future growth strategies.
The Council continues to believe that the key ingredients of a successful Industrial
Strategy or Plan for Growth are scale, longevity and policy co-ordination. Based
on extensive cross-country and historical experience, these are necessary conditions
for any sustained improvement in productivity, pay and prosperity. Yet, too often in
the past, UK growth plans have failed to satisfy one or more of these principles.
Using these high-level principles, and the Council’s extensive work to monitor and
evaluate the 2017 Strategy, the Council has looked to draw out some lessons it
hopes the Government will find useful as it moves forwards with the Plan for Growth
(Section 3). Specifically, the Council has four overarching recommendations that it
Industrial Strategy Council: Annual Report
5
believes would help to ensure the Plan for Growth builds on what the 2017 Industrial
Strategy started, namely a sustained improvement in long-term living standards
across the UK.
1. Having an ambitious strategy spanning a wide array of policy areas, sectors
and government departments is a good thing. But all good strategies require
prioritisation too. Supply-side policies need to be focused and financed at
scale if they are to succeed. One of the Council’s main concerns with the
2017 Industrial Strategy was that, with 142 policy measures, it spread itself
too thinly. The Council have identified around 180 policies and commitments
in the Plan for Growth. That begs questions about the scope and scale, and
hence likely success, of this plan. The Council believes greater
prioritisation is likely to be needed if the Plan for Growth is to meet its
objectives.
2. The Plan for Growth focusses on three key pillars of growth – infrastructure,
skills, and innovation. These are necessary ingredients of growth and a focus
on them is welcome. They are not, however, sufficient. When developing its
own framework for monitoring and evaluation, the Council looked beyond
these “traditional” drivers of productivity to measures of social, human, and
natural capital, as well as broader welfare impacts. That better reflects the
known drivers of productivity, earnings and prosperity. The Council
welcomes the intention to set out clear metrics to monitor progress but
encourages the Government to widen its framework beyond the
“traditional” drivers of productivity.
3. Industrial policies benefit the economy through their engagement with, and
promotion of, private sector activity. Historically, partnerships between the
public and private sectors have been a key driver of innovation, productivity,
and wealth-creation. A particular strength of the 2017 Industrial Strategy were
the elements of “co-creation”. One example was Local Industrial Strategies,
with local areas working in partnership with government. A second was sector
deals. The Council’s work on vaccine development further highlights the
power of co-creation. The principle of co-creation is under-emphasised in the
Plan for Growth. The Council believes that active engagement and co-
creation, with business and local actors, is key to ensuring the success
of the Plan for Growth.
4. The Council welcomes the planned focus on delivery, with senior cross-
Whitehall governance and regular reporting on progress. But best practice
internationally, and indeed domestically in other areas of policy, calls for arms-
length, independent and rigorous oversight and evaluation of delivery and
success. The Council believes the Government should set up an
independent body, ideally in statute, tasked with providing impartial and
expert evaluation of the Government’s progress in delivering the Plan
for Growth.
Industrial Strategy Council: Annual Report
6
The Plan for Growth focuses on three core pillars of growth (infrastructure, skills and
innovation) and three priority areas (Levelling Up, Net Zero and Global Britain). The
Council’s assessment of these areas is set out below:
5. On infrastructure, the government has a strong plan backed by significant
spending commitments that are of the scale needed. Having a National
Infrastructure Strategy, with external scrutiny and evaluation provided by the
National Infrastructure Commission, should also help to ensure both longevity
and policy co-ordination. The Council believes the infrastructure
component of the Plan for Growth satisfies the necessary success
criteria and is a role model for how industrial strategy should be
pursued across the other pillars.
6. The strong focus on skills is welcomed by the Council. The 2017 Industrial
Strategy was light on labour market and skills policies. The Council’s own
work has highlighted the scale of the UK’s potential future skill gaps – gaps
made worse by the Covid crisis – and highlighted the importance of
developing vocational skills and a new norm of lifelong learning. These are all
priority areas in the Plan for Growth. Technology, demography and
sustainability, as well as the lasting effects of Covid, are likely to lead to
significant changes in the nature of work over coming decades, with profound
implications for skills and learning, regulation, welfare and tax systems. To
meet these challenges, and building on its current plans, the Council
believes the Government needs to develop a comprehensive Labour
Market Strategy, co-ordinated across government and in collaboration
with employers, the education sector and trade unions.
7. The Plan for Growth sets out many initiatives aimed at boosting innovation. A
number of these are welcome, including the new Advanced Research and
Innovation Agency (ARIA), the “Help to Grow” initiative aimed at boosting
management skills and digital investment and the continued commitment to
the R&D target. But innovation is about much more than cutting-edge
technology in the manufacturing sector; it is about a wider set of investments
(in data, software, design, people etc.) across a wider set of sectors. This is
particularly important for the UK’s almost 6 million registered SMEs. The
Council hopes the forthcoming Innovation Strategy will take a whole
system approach to this critical area of public policy.
8. The Council believes addressing regional disparities is fundamental to
boosting productivity, pay and prosperity. The Plan for Growth highlights
Levelling Up as the Government’s most important mission. This is welcome.
But the proposed approach appears over-reliant on infrastructure spending
and the continued use of centrally controlled funding pots thinly spread across
a range of initiatives. Evidence, historical and international, suggests this is
unlikely to be a recipe for success. Sustained local growth needs to be rooted
in local strategies, covering not only infrastructure but skills, sectors,
education and culture. These strategies need to be locally designed and
Industrial Strategy Council: Annual Report
7
focussed, as with the Local Industrial Strategies drawn up under the 2017
Industrial strategy. There also needs to be investment in the local capacity
and capability to then implement these strategies. The Council believes a
comprehensive reorientation of the Government’s approach to Levelling
Up is needed, including through its forthcoming White Paper on
Devolution, if it is to be successful.
9. The Council was critical of the degree of focus, financing, and policy co-
ordination on Net Zero in its previous Annual Report. In the past year, the
Government has made significant progress. The Prime Minister’s Ten Point
Plan for a Green Industrial Revolution provided concrete policy proposals,
increased the scale of funding, and laid the foundations for a more joined up
Government approach. The Council believes the Government’s plans are
a significant step forward but are not yet a practical roadmap for
delivering Net Zero, with several areas at present lacking the required
scale to make progress at the required speed.
10. The Council strongly supports having a vision for Global Britain as a priority,
not least in the light of Covid and Brexit. The Plan for Growth sets out some
good high-level objectives around international cooperation, free and fair
trade, and export promotion. But it does not contain much detail on how these
objectives will translate into actionable policy plans. The Council’s research
has demonstrated the benefits of having comprehensive strategies to promote
sectors where the UK has a comparative strength in global value chains. The
Council believes there is a strong case for using sectoral policy in this
strategic way to promote the development of key UK industries on the
international stage.
A key part of the Council’s role has been to hold government to account on delivery.
Implementation of the 2017 Industrial Strategy has been good in some areas, but
weak in others (Section 4). Whilst around 60% of the 142 policies in the 2017
Industrial Strategy have been implemented, around 25% are in progress or delayed
and for the remaining 15% progress is unclear. The status of these
unimplemented policies is uncertain in the light of the change of Government
strategy and the Council believes clarity or closure of these policies will be
important as a matter of good governance.
The recommendations and assessments above draw on the Council’s collective
experience and its extensive programme of work over the past 2½ years. Since the
last Annual Report, the Council has published seven research and evidence papers
on topics including skills, local policy and growth, sectoral policy, and the
development of greener supply chains. In 2020 the Council also launched its blog,
Productivity Matters, and has published a total of 25 blogs. Section 5 sets out the
Council’s contributions since it was formed in November 2018. The Council hopes
its outputs will make a significant and lasting contribution to research and
public policy thinking on supply-side issues.

Industrial Strategy Council: Annual Report
8
Membership
• Andy Haldane (Chair) - Chief Economist, Bank of England1
• Kate Barker - Chair of trustees, Universities Superannuation Scheme and
member of the Geospatial Commission
• Emma Bridgewater - Founder of Emma Bridgewater Ceramics
• Jayne-Anne Gadhia - Founder and Executive Chair of Snoop
• Vivian Hunt - Senior Partner, McKinsey & Company
• Rotha Johnston - Chair of Northern Ireland Screen
• Juergen Maier - Chair of the Digital Catapult and Co-Chair of the national Made
Smarter manufacturing programme
• Paul Marshall - Co-founder and Chairman, Marshall Wace LLP
• Charlie Mayfield - Chair of Be the Business
• Nicola Mendelsohn - Advertising executive; Vice-President for Europe, the
Middle East and Africa for Facebook. Non-Executive Director of Diageo
• Archie Norman - Chair, Marks & Spencer
• Hayley Parsons - Welsh entrepreneur and investor, and Founder of GoCompare
• Roy Rickhuss - General Secretary of Community and member of the General
Council of the Trades Union Congress
• Nancy Rothwell - President and Vice-Chancellor of the University of Manchester
and Professor of Physiology, Co-chair of the Council for Science and Technology
and past President of the Royal Society of Biology
• Matthew Taylor - Chief Executive, Royal Society for the encouragement of Arts,
Manufactures and Commerce (RSA)
https://industrialstrategycouncil.org/meet-our-members

Industrial Strategy Council: Annual Report
9
Section 1: Introduction
The creation of the Industrial Strategy Council was a commitment in the UK
Government’s Industrial Strategy White Paper published in November 2017. The
Council’s remit is to provide impartial and expert evaluation of the Government’s
progress in delivering the aims of the Industrial Strategy – a long-term plan to boost
the productivity and earnings power of people throughout the UK.
The publication of Build Back Better: our plan for growth, hereafter referred to as
simply the Plan for Growth, brought with it the end of the UK Industrial Strategy and
the Industrial Strategy Council. But the Secretary of State for Business, Energy and
Industrial Strategy asked the Council to publish its Annual Report as a statement of
progress of the Industrial Strategy and to inform the Government’s work going
forward.
In light of the Covid crisis, the case for a strategy to boost the productivity, prosperity
and earning power of people throughout the UK is as strong as ever. Whether it is
called an Industrial Strategy or a Plan for Growth, the basic premise is the same – a
programme of supply-side policies to drive prosperity in and across the economy.
The UK already faced a significant productivity challenge, with a decade of weak
productivity growth, stagnant real wages, and some of the largest regional disparities
in the developed world. Section 2 set out how the Covid crisis could have a lasting
impact on how we work, where activity takes place, and the way businesses operate.
This offers the significant potential for future productivity growth.
The Council continues to believe that the key ingredients of a successful Industrial
Strategy or Plan for Growth are scale, longevity and policy co-ordination. Based
on extensive cross-country and historical experience, these are necessary conditions
for any sustained improvement in productivity, pay and prosperity. Section 3 uses
these high-level principles and the Council’s extensive work to monitor and evaluate
the 2017 Industrial Strategy to draw out some lessons for the Plan for Growth. It
provides some overarching recommendations that will help to ensure the Plan for
Growth delivers long-term benefits for the UK, building on the 2017 Industrial
Strategy.
Holding government to account on implementation of the Industrial Strategy is an
important part of the Council’s role. Section 4 provides a review of the
implementation of the 2017 Industrial Strategy and sets out lessons learned that
should help to ensure that the Plan for Growth is implemented, monitored, and
evaluated effectively.
Section 5 sets out the Council’s contributions since it was formed in November
2018.

Industrial Strategy Council: Annual Report
10
Section 2: How the challenge has changed - Covid and productivity
Even before the Covid crisis struck, the UK already faced a significant productivity
challenge, with a decade of weak productivity growth, stagnant real wages, and
some of the largest regional disparities in the developed world. Covid has created
additional challenges and opportunities that would have been unimaginable just a
year ago. This section examines how these challenges have accelerated pre-existing
trends, in particular the role of technology and automation. The challenges are
considered along three dimensions: how we work, where activity takes place, and
the way businesses operate.
How we work
Covid is reshaping where we work, how we work and when we work.
Hybrid working will most likely be the model that endures for desk workers
who can work from home. On balance, new ways of working will increase
productivity and enhance quality of life for some.
Different groups of workers will be affected differently. It will be crucial to
mitigate the potential negative consequences in labour market outcomes for
those worst affected.
The pandemic has forced the adoption of new ways of working. Different groups of
workers have been impacted in different ways. Below we look at three groups of
workers to understand the impact of these changes:
(1) desk workers – those who can work from home
(2) critical & key workers – health care, public services, security, post workers,
supermarket staff, delivery drivers etc.
(3) locked-down workers – those that are in locked-down industries such as
hospitality, accommodation, entertainment, and food services
Desk workers
For desk workers, the shift to home working has been one of the key impacts
of the pandemic, and one that is likely to persist, at least to some extent. Whilst
working from home was a trend that pre-dated Covid, it was a very gradual trend.
The availability of technology and software enabled desk workers to stay connected
throughout lockdowns and meant that the transition to home working was rapid and
relatively smooth. As of April 2020, nearly half (46.6%) of people in employment did

Industrial Strategy Council: Annual Report
11
some of their work from home, of whom the vast majority (86.0%) stated this was
because of Covid. More than half of Londoners (57.2%) did some work at home.2
In the short-term, there are challenges to full-time home working – for example,
blurred boundaries between home and work environment and extra workload due to
the pandemic. However, these challenges are not expected to persist in the longer
term as the pandemic retreats and a new hybrid-model (a mixture of home and office
working) emerges. The challenge for the medium to long term will be to develop
a hybrid model that harnesses the best of both working locations. The shift to a
hybrid model needs to be facilitated by high quality, affordable childcare and
regulation that makes it easier for employees to work flexibly. For example, rather
than having the right to ask their employer to work from home, workers would
instead have the right to work from home.
Flexibility is the key advantage of homeworking. One of the most tangible
benefits is the amount of time saved on the daily commute. The ONS estimates the
average UK commuter used to spend 221 hours per year travelling to and from
work.3 In addition, there is evidence emerging around the intangible benefits from
remote working. According to the Remote Employee Experience Index (REEI),4
developed in association with Slack, a software company, knowledge workers are
generally more satisfied with working remotely (+9.2 points). The biggest increases
are seen in work-life balance (+25.7), satisfaction with working arrangement (+20.1),
managing work-related stress and anxiety (+17.3) and productivity (+10.7).5
Other sources confirm homeworking has no negative productivity impact. The
Harvard Business Review found that ‘knowledge workers’ felt they were more
productive when working from home because they spent less time in large meetings,
more time interacting with stakeholders, and felt more empowered to take ownership
of their own schedules.6 A survey by Deloitte found 55% of respondents felt that their
colleagues were as productive, if not more productive now, than before the
2 , ONS (2020), Coronavirus and homeworking in the UK, July 2020, Available at: www.ons.gov.uk/employmentandlabourmarket/peopleinwork/employmentandemployeetypes/bulletins/coronavirusandhomeworkingintheuk/april2020 3 Based on analysis of the 2018 ONS Labour Force Survey by TUC www.tuc.org.uk/news/annual-commuting-time-21-hours-compared-decade-ago-finds-tuc 4 Based on data from a survey of 9,032 knowledge workers who identify as “skilled office workers” in the U.S., the U.K., France, Germany, Japan and Australia. See: www.futureforum.com/2020/10/07/rewiring-how-we-work-building-a-new-employee-experience-for-a-digital-first-world/ 5 More detail available at: www.slack.com/intl/en-gb/blog/collaboration/workplace-transformation-in-the-wake-of-covid-19 6 Birkinshaw J., Cohen J., Stach P. in: Harvard Business Review (2020), Research: Knowledge Workers Are More Productive from Home, Available at: www.hbr.org/2020/08/research-knowledge-workers-are-more-productive-from-home

Industrial Strategy Council: Annual Report
12
lockdown.7 Research by Birmingham University and the ESRC, found that
homeworkers were on average as productive as before the pandemic.8
Figure 1: Remote employee experience index
Notes: The highest possible score is 100 and would indicate that all employees feel working from
home is better than working in the office. 0 indicates that working from home is the same as working
in the office.
Source: slack.com, www.slack.com/intl/en-gb/blog/transformation/remote-employee-experience-
index-launch
The current experience has shown desk workers adapted quickly to home-working
and should be able to transition smoothly to hybrid working where the constraints of
a physical location have been freed, allowing people to develop work patterns that
best suit their lifestyle and employer needs.
Critical workers and key workers
Frontline workers have faced serious challenges in response to the pandemic. From
increased risk of infection to enforcing social distancing rules, evidence suggests
that the nature of their jobs has become more complex and stressful.9 Crucially, the
pandemic has under-scored the importance of these critical and key workers.
The case for better pay and conditions for this group has gained momentum, most
notably in relation to NHS and social care staff, with the latter having a high
prevalence of low-paid and insecure jobs. The pre-Covid calls to increase focus on
7 Delloite.com, Working during lockdown. The impact of COVID-19 on productivity and wellbeing, viewed February 2021, Available at: www2.deloitte.com/uk/en/pages/consulting/articles/working-during-lockdown-impact-of-covid-19-on-productivity-and-wellbeing.html 8 Birmingham Business School Blog (2020), Remote work and worker well-being during the pandemic, November 2020, Available at: www.blog.bham.ac.uk/business-school/2020/11/02/remote-work-and-worker-well-being-during-the-pandemic/ 9 Zhang et al. (2020), Occupational Stress and Mental Health: A Comparison Between Frontline Medical Staff and Non-frontline Medical Staff During the 2019 Novel Coronavirus Disease Outbreak, Front Psychiatry, Available at: www.ncbi.nlm.nih.gov/pmc/articles/PMC7785830/
-5
10.7
17.3
20.1
25.7
13.8
-10 0 10 20 30
Sense of belonging
Productivity
Stress or anxiety about work
Satisfaction with working arrangement
Work-life balance
Index Total

Industrial Strategy Council: Annual Report
13
measures of well-being and social value, beyond GDP could more accurately
evaluate frontline workers’ contribution to the economy.
In addition, some key workers will require more direct support in adjusting to
the post-Covid reality, especially in terms of re-skilling. Research suggests that
the pandemic accelerated the implementation of technology in many sectors10 - for
example, self-checkouts at the supermarket, contactless payment options, click and
collect for retail and hospitality (see Figure 2). In the short-term, as the economy
adjusts, it will create uncertainty for this group of workers. However, in the longer
term, it provides the opportunity to move into higher value-added roles. To facilitate a
smooth transition, there will need to be a focus on (1) identifying and investing in the
future skill needs of the economy (2) making this training and development
accessible to those who need it most and (3) social programmes to support workers
who have lost their jobs e.g. in providing advice about training initiatives and (4)
better-coordination between industries, unions, local and national government, to
support workers into new roles. As discussed in Section 3, this calls for a
comprehensive and co-ordinated Labour Market Strategy.
Figure 2: Acceleration of automation initiatives due to Covid-19
Notes: Three out of four companies plan to accelerate automation initiatives due to Covid-19
Source: www.bain.com/insights/will-the-pandemic-accelerate-adoption-of-artificial-intelligence/
10 McKinsey & Company (2020), How COVID-19 has pushed companies over the technology tipping point—and transformed business forever, Available at: www.mckinsey.com/business-functions/strategy-and-corporate-finance/our-insights/how-covid-19-has-pushed-companies-over-the-technology-tipping-point-and-transformed-business-forever
6377
93
75
59
9181
0%
10%
20%
30%
40%
50%
60%
70%
80%
90%
100%
Share of respondents who plan to accelerate automation initiatives
Yes No
Education FinancialServices
Healthcare Industrials/ manufacturing
Retail Tech Services
Consumerproducts

Industrial Strategy Council: Annual Report
14
Locked-down workers
Locked-down workers have been considerably impacted by the pandemic in
the short run, as the social distancing measures have meant that they could not
perform their roles in a safe way. As of 31 October 2020, the sector with the highest
proportion of its workforce on furlough was the accommodation and food services
sector at 27%, followed by arts, entertainment and recreation at 24%.11 In some
instances, digital has helped some workers to continue to work using digital
platforms like Patreon, which allows individual artists to run a subscription service.12
However, until the pandemic retreats, for the most part, this group of workers have
been effectively shut out of the jobs market.
As the recovery takes hold, the majority of furloughed or locked-down workers would
be expected to return to their jobs. But reskilling and reallocation support will be
needed in parts of the economy where demand is unlikely to return. While the
recovery in some sectors can be expected to be very rapid, the prospects for
reopening of the economy remain uncertain and some damage, in terms of lost
capacity and jobs, will have already been done.
One change that affected workers in all three groups is the need to perform
multiple, mutually exclusive tasks – for example, parents having to oversee home
schooling during the lockdowns. Multitasking, although inevitable, has a negative
impact on productivity as a result of switching costs13 and can increase stress,
anxiety and depression.14 The ONS surveyed parents who were home schooling
their children between 3 April and 10 May 2020. They found that 34% of women and
20% of men agreed that their well-being was negatively impacted and 43% of home-
schooling parents agreed that it was negatively affecting the well-being of their
children.15 Evidence shows that working-from-home mothers are doing about 90
minutes extra childcare on a typical workday relative to working-from-home fathers.16
Analysis by the ONS finds that many working parents in Great Britain have adapted
11 ONS (2020), Coronavirus Job Retention Scheme statistics: December 2020, Available at: www.gov.uk/government/statistics/coronavirus-job-retention-scheme-statistics-december-2020/coronavirus-job-retention-scheme-statistics-december-2020 12 Robertson A., in: The Verge (2017), Inside Patreon, The Economic Engine of Internet Culture, August 2017, Available at: www.theverge.com/2017/8/3/16084248/patreon-profile-jack-conte-crowdfunding-art-politics-culture 13 American Psychological Association, Multitasking: Switching costs, viewed February 2021, Available at: www.apa.org/research/action/multitask 14 Mark W Becker, Reem Alzahabi, Christopher J Hopwood (2012), Media Multitasking Is Associated with Symptoms of Depression and Social Anxiety; Cyberpsychology, Behavior, and Social Networking, available at: www.researchgate.net/publication/232926411_Media_Multitasking_Is_Associated_with_Symptoms_of_Depression_and_Social_Anxiety 15 ONS (2020) Coronavirus and homeschooling in Great Britain, Available at: www.ons.gov.uk/peoplepopulationandcommunity/educationandchildcare/articles/coronavirusandhomeschoolingingreatbritain/apriltojune2020 16 Abi Adams-Prassl, Teodora Bonev, Marta Golin, Christopher Rauh (2020), Inequality in the impact of the coronavirus shock: Evidence from real time surveys, Journal of Public Economics, Available at: www.sciencedirect.com/science/article/abs/pii/S0047272720301092

Industrial Strategy Council: Annual Report
15
their routines to accommodate their new childcare commitments, prompted by the
coronavirus lockdown (see figure 3).17
While we anticipate these impacts to be short-term, there is a lasting lesson
here – the need for formal flexible working for parents, in order to ensure they can
continue to participate in the workforce and combine work and family commitments.18
This may call for a change in social and contractual norms around flexible working.
Figure 3: Parenting and changes to working patterns in lockdown
Notes: Those working from home were more likely to work in the morning and at night, freeing up the
afternoon. Those working away from the home were more likely to work unsociable hours
Source: Office for National Statistics – Parenting in Lockdown
Where activity takes place
The Covid crisis will make Levelling Up more difficult in the short term, but
could support it in the longer term, especially if there is equal access to digital
infrastructure.
The crisis can provide new momentum towards economic transformation of
lagging areas.
17 ONS (2020), Parenting in lockdown: Coronavirus and the effects on work-life balance, Available at: www.ons.gov.uk/peoplepopulationandcommunity/healthandsocialcare/conditionsanddiseases/articles/parentinginlockdowncoronavirusandtheeffectsonworklifebalance/2020-07-22 18 Hupkau C.,Petrongolo B. (2020); Work, care and gender during the Covid-19 Crisis, Centre for Economic Performance, Available at: www.cep.lse.ac.uk/pubs/download/cepcovid-19-002.pdf
0%
10%
20%
30%
40%
50%
60%
70%
80%
00:00 02:00 04:00 06:00 08:00 10:00 12:00 14:00 16:00 18:00 20:00 22:00
Those working from home Those working away from home
Percentage of group who were working by time of the day (weekdays only) Great Britain, 2020

Industrial Strategy Council: Annual Report
16
The accelerated adoption of digital technology and automation will support
supply chain resilience and greener outcomes.
The impacts of the pandemic varied not only across individuals, but also across UK
regions. Covid has accelerated pre-existing economic trends, in particular changing
consumption patterns, such as from the high street to online, with implications for
activity in local economies.
Pre-pandemic trends
Consumption trends before the pandemic have been accelerated in response
to lockdown and social distancing measures. This is particularly true for online
retailing which is likely to continue to grow in the long term. The ONS reported that
total online retailing values increased by 46.1% in 2020 when compared with 2019,
the highest annual growth reported since 2008.19 Food stores (+79.3%), "other
stores" (+73.9%), household goods stores (+73.4%) and department stores
(+65.9%) all saw record annual increases in values of internet sales in 2020,
compared with 2019.20
In particular, online grocery shopping has gathered intense pace. Companies
like Amazon, Oddbox and Deliveroo are all adapting their business model to
increase their presence in this market. The increased digitalisation of grocery
shopping with a focus on sustainability and waste reduction, contributed to the
increased adoption of Artificial intelligence (A.I.) in food retail and production.
Companies like Afresh are developing cutting-edge A.I. to reduce food waste.21 In
addition, disruption to supplies and rapidly changing consumption patterns increased
demand for more accuracy in production. Collectively these trends will result in
further movement of activity from the front end (i.e. shop floor) to the backend (i.e.
software development) of production.
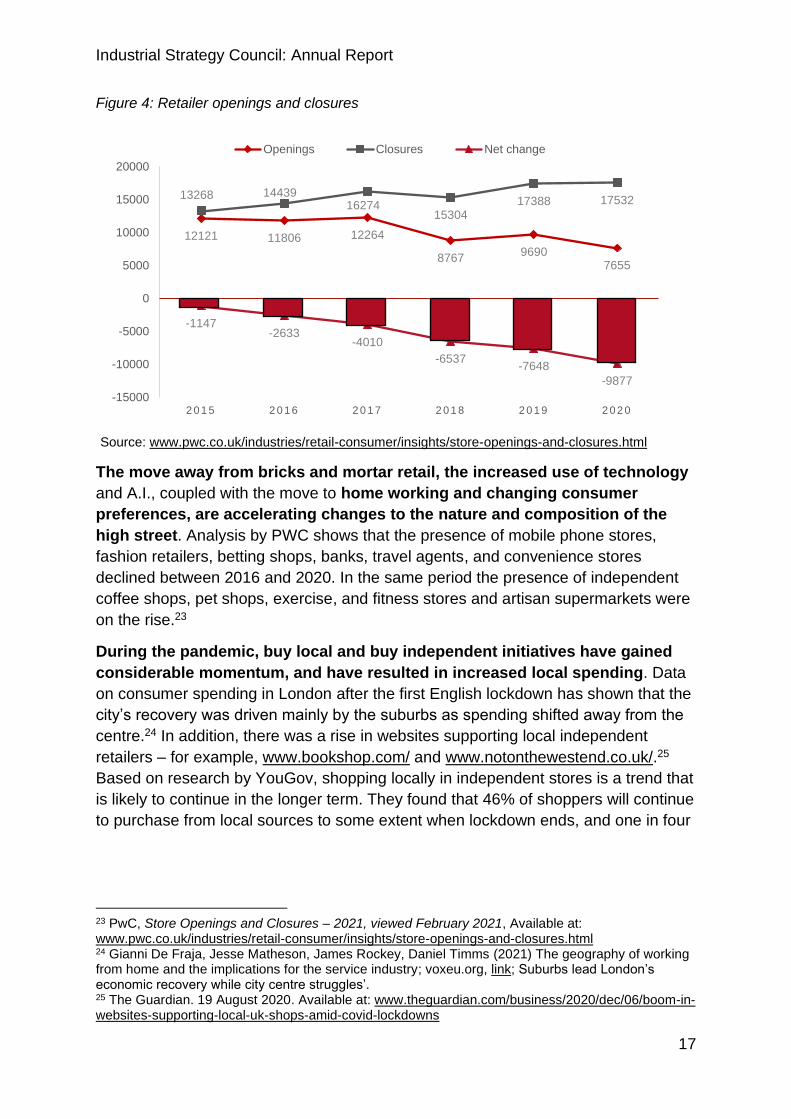
This increased uptake in online shopping will continue to reduce the demand
for physical stores, accelerating the changes we have seen in recent years. There
have been more store closures than openings since 2015, but with the net change
accelerating rapidly during 2020 (see Figure 4).22
19 ONS (2021), Retail sales, Great Britain: December 2020, Available at: www.ons.gov.uk/businessindustryandtrade/retailindustry/bulletins/retailsales/december2020 20 Ibid. 21 Louise N. in: Techstartups (2020), Afresh bags $12 million Series A follow-on funding to eliminate food waste and make fresher, healthier food accessible to all, Available at: www.techstartups.com/2020/07/20/afresh-bags-12-million-series-follow-funding-eliminate-food-waste-make-fresher-healthier-food-accessible/ 22 Pwc.co.uk, Store Openings and Closures – 2021, viewed February 2021, Available at: www.pwc.co.uk/industries/retail-consumer/insights/store-openings-and-closures.html
Industrial Strategy Council: Annual Report
17
Figure 4: Retailer openings and closures
Source: www.pwc.co.uk/industries/retail-consumer/insights/store-openings-and-closures.html
The move away from bricks and mortar retail, the increased use of technology
and A.I., coupled with the move to home working and changing consumer
preferences, are accelerating changes to the nature and composition of the
high street. Analysis by PWC shows that the presence of mobile phone stores,
fashion retailers, betting shops, banks, travel agents, and convenience stores
declined between 2016 and 2020. In the same period the presence of independent
coffee shops, pet shops, exercise, and fitness stores and artisan supermarkets were
on the rise.23
During the pandemic, buy local and buy independent initiatives have gained
considerable momentum, and have resulted in increased local spending. Data
on consumer spending in London after the first English lockdown has shown that the
city’s recovery was driven mainly by the suburbs as spending shifted away from the
centre.24 In addition, there was a rise in websites supporting local independent
retailers – for example, www.bookshop.com/ and www.notonthewestend.co.uk/.25
Based on research by YouGov, shopping locally in independent stores is a trend that
is likely to continue in the longer term. They found that 46% of shoppers will continue
to purchase from local sources to some extent when lockdown ends, and one in four
23 PwC, Store Openings and Closures – 2021, viewed February 2021, Available at: www.pwc.co.uk/industries/retail-consumer/insights/store-openings-and-closures.html 24 Gianni De Fraja, Jesse Matheson, James Rockey, Daniel Timms (2021) The geography of working from home and the implications for the service industry; voxeu.org, link; Suburbs lead London’s economic recovery while city centre struggles’. 25 The Guardian. 19 August 2020. Available at: www.theguardian.com/business/2020/dec/06/boom-in-websites-supporting-local-uk-shops-amid-covid-lockdowns
12121 11806 12264
87679690
7655
13268 1443916274
1530417388 17532
-1147-2633
-4010
-6537-7648
-9877
-15000
-10000
-5000
0
5000
10000
15000
20000
2 0 1 5 2 0 1 6 2 0 1 7 2 0 1 8 2 0 1 9 2 0 2 0
Openings Closures Net change

Industrial Strategy Council: Annual Report
18
(24%) will shop locally to an even greater extent once the lockdown is fully lifted (see
figure 5).26
To ensure that these independent retailers can continue to compete,
particularly online, to support local economies, they will need digital and
technical support. The Help to Grow initiative announced in Budget 2021 is
one mechanism through which this support might usefully be provided.
Figure 5: Shop local trends post-lockdown
*Overall, 70% OF Brits who shopped locally during the pandemic say they will continue to do so at the same or
even greater level when lockdown is fully lifted.
Source: www.yougov.co.uk/topics/consumer/articles-reports/2020/07/10/-covid-19-coronavirus-UK-high-street-
local-effect
The changes to the geography of economic activity in the UK are not limited to
high streets. Higher spending in local areas, the increased demand for local
products from independent stores, and reduced business travel are redefining the
role of the city. Typically, headquarters locate near a perceived large pool of talent
and transport hubs.27 As companies are now less constrained by geography thanks
to home working, they can hire from a global talent pool and conduct meetings
online, reducing the need for large headquarters in city centres. While the need for
office space is not expected to disappear, given the benefits of physical
collaboration, it is reasonable to expect demand to reduce in the longer term.
26 Yougov.co.uk, Could Covid-19 save the high street?, viewed January 2021, Available at: yougov.co.uk/topics/consumer/articles-reports/2020/07/10/-covid-19-coronavirus-UK-high-street-local-effect 27 Hbr.org, The Uncertain Future of Corporate HQs, viewed January 2021. Available at: www.hbr.org/2020/09/the-uncertain-future-of-corporate-hqs
46
24
21
4
5
0 10 20 30 40 50
I will continue to purchase items from local sources to the sameextent as I do now even once the lockdown is fully lifted
I will continue to purchase items from local sources to a greaterextent than I do now once the lockdown is fully lifted
I will continue to purchase items from local sources but to a lesserextent than I do now once the lockdown is fully lifted
I will not continue to purchase items from local sources once thelockdown is fully lifted
Don't know
Brits don't intend to stop shopping locally, even when lockdown ends.Which, if any, of the following best applies to you regarding your shopping habits after lockdown is fully

Industrial Strategy Council: Annual Report
19
Levelling up - short term risks and long-term opportunities
The ability of local areas to recover after this crisis will depend on their ability
to adapt to an increasingly digitalised economy. Unfortunately, some areas are
starting from a more disadvantaged position than others. Aitken et al. (2019) show
the share of premises that have ultra-fast internet has reached 75% in London but
only 31% in Wales.28 Surveys of specific online activities show a similar pattern, with
59% of respondents in London saying they use the internet to find information for
work and study, against only 38% in Yorkshire and the Humber, and below 50% in
the North East and North West.29
Recessions tend to exacerbate regional inequalities. After crisis poorer areas
typically take longer to recover, even though they may have suffered less severe
initial losses. Research finds that the share of exporting jobs in an area is also
positively correlated with productivity and the vibrancy of a local labour market and,
in turn, the ability to rebound after a shock.30 Larger metropolitan areas with more
diversified economies, including larger shares of high value industries, tend to
recover more quickly.31 High streets and suburbs that have a sufficient numbers of
home workers within close proximity, like London and the South East, are also likely
to fare better post-pandemic, with the amount of home working likely to be much
higher.32 Towns and cities that needed ‘levelling up’ – of which there were 36 before
the pandemic according to the Centre for Cities – may need greater and longer-
lasting support to recover post pandemic.33
At the same time, the post-pandemic recovery and accompanying behavioural
changes provide an opportunity to tackle some of the key long-standing
problems in regional development. The Covid crisis could be used as an
opportunity to accelerate the process of regional economic transformation, with
activity (working and doing business) more evenly distributed geographically due to
digital transformation. The pandemic might also provide momentum to improve local
governance. An OECD survey of 300 regional and municipal governments shows
that better provision of services (especially health), greater regional resilience, and
28 Aitken, A., Boshoff, J., Nguyen, D., Rincon-Aznar, A., and Stochino, A. (2019), “Places and Spaces: Mapping Britain’s Regional Divides”, NIESR General Election Briefing, December 2019. 29 Ofcom Nations and Regions Technology Tracker 2019, January 2021, available at: www.ofcom.org.uk/__data/assets/pdf_file/0026/143981/technology-tracker-2019-uk-data-tables.pdf 30 Centreforcities.org, Covid and levelling up, January 2021, available at: www.centreforcities.org/reader/cities-outlook-2021/covid-and-levelling-up/ 31 EY (2020), Moving to the Next Level. UK Regional Economic Forecast. England’s regions, cities and towns. December 2020, Available at: www.ey.com/en_uk/growth/economics-for-business/levelling-up-regional-economy-post-covid-19-crisis 32 The Guardian (2020), Suburbs lead London’s economic recovery while city centre struggles. Viewed December 2020, available at: https://www.theguardian.com/business/2020/aug/19/suburbs-lead-londons-economic-recovery-while-city-centre-struggles 33 Centreforcities.org, Covid and levelling up, January 2021, available at: www.centreforcities.org/reader/cities-outlook-2021/covid-and-levelling-up/

Industrial Strategy Council: Annual Report
20
the reduction in digital divides across regions should become priorities post-Covid
(Figure 6).
Figure 6: Regional development policy priorities arising from Covid crisis
Source: OECD-CoR, 2020
How business operates
Depressed business investment during the Covid crisis will have negative
consequences for productivity.
Companies will need to change their operating models to ensure they offer the
flexibility and connectivity required for the new hybrid way of working.
The drive towards digital transformation and technological upgrading provides
a way out of the low-investment, low-productivity equilibrium.
Need for a new operating model
The Covid crisis has created an opportunity for a step change in how
businesses operate. In addition to the shift to home working, the pandemic is
forcing companies to accelerate their transformation to digital as the main channel
for reaching customers. A rethink of business models is required so that firms
can manage dispersed teams efficiently and benefit from new digital
technologies. Hybrid working is likely to facilitate management styles which
promote empowerment and autonomy, encourage flexibility, and create flat
hierarchies. If business can develop an operating model that incorporates the best of
home and office working, and facilitates genuinely flexible working, this should have
a positive impact on productivity and well-being. For firms who cannot compete on
76
69
68
65
61
60
56
18
23
23
25
29
29
34
3
1
4
4
4
3
5
4
6
4
6
5
7
6
0% 20% 40% 60% 80% 100%
Ensuring affordable and accessible quality basic services, includinghealth, for all territories
Ensuring regional resilience
Reducing digital divides across regions
Putting the transition to a sustainable and low carbon economy atthe core of regional development policies
Developing new instruments to support firms and SMEs
Reducing regional disparities
Striking a better balance between urban and rural areas
To a large extent To a limited extent Not at all Don't know or no answer
Original question: To what extent would you like the COVID-19 crisis to reshape regional development policy priorities in the future by putting more emphasis on the following
Industrial Strategy Council: Annual Report
21
salary, this new model could enable them to develop an attractive proposition for
employees.34
There is existing evidence of this type of operating model being extremely
successful. Netflix, established in 1998, started out by mailing out physical products.
They utilised technology to transform their business model and employed a flat,
flexible, operating model resulting in them becoming a global market leader in
streaming virtually on demand, with 54% market penetration in 2019.35 According to
McKinsey, companies like Netflix have clear processes with flat structures, where
people are valued for their skills and are truly agile. The flat structure has removed
the traditional boundaries allowing for effective collaboration where individuals are
empowered and leaders spend more time connecting with teams.36
Investment challenge
Whilst the pandemic has created new long-term opportunities for businesses,
it has also limited their ability to deliver them in the short-term. Increased digital
adoption and the transition to new operating models will require considerable
investment.
The pandemic has damaged businesses investment. Low levels of investment in
the UK is not a Covid phenomenon. During the period 1997-2017, UK private sector
investment as a share of GDP was the lowest among the G7 countries. However, in
2020 business investment fell to levels not seen since 2012. According to ONS data,
business investment fell 27% in 2020 Q2, recovering only slightly in the third quarter,
with investment still more than 20% below where it was at the end of 2019. Evidence
from the Bank of England’s November 2020 Decision Maker Panel survey found that
businesses expected investment to be 25% lower in the fourth quarter of the year
than it would have been due to Covid.37 There are signs that business investment
will remain depressed in the medium term. The OBR forecasts business investment
to fall by 2.2% in 2021, but then predicts it will enter a path of rapid recovery, taking
until mid-2022 to regain its pre-virus peak.38
Many businesses will also emerge from the pandemic with significantly weaker
balance sheets and with potentially lower risk appetite. The sudden loss of
34 McKinsey Quarterly (December 2020), How COVID-19 is redefining the next-normal operating model, available at: www.mckinsey.com/business-functions/organization/our-insights/how-covid-19-is-redefining-the-next-normal-operating-model 35 Hrb.org (October 2018), How Netflix Expanded to 190 Countries in 7 Years, Available at: www.hbr.org/2018/10/how-netflix-expanded-to-190-countries-in-7-years 36 Mckinsey Quarterly (December 2020), How COVID-19 is redefining the next-normal operating model, available at: www.mckinsey.com/business-functions/organization/our-insights/how-covid-19-is-redefining-the-next-normal-operating-model 37 BankofEngland.co.uk, Impact of Covid-19 on UK businesses – evidence from the Decision Maker Panel in 2020 Q4, Available at: www.bankofengland.co.uk/agents-summary/2020/2020-q4/impact-of-covid-19-on-uk-businesses-evidence-from-the-decision-maker-panel-in-2020-q4 38 The Office for Budget Responsibility (2021), Economic and fiscal outlook – March 2021, Available at: https://obr.uk/efo/economic-and-fiscal-outlook-march-2021/

Industrial Strategy Council: Annual Report
22
revenue, additional cost of making workplaces Covid-secure, and in many cases, the
necessity to take out additional loans to survive the lockdowns will mean that many
firms will first have to focus on reducing their debt burden, at the cost of new
investments. Survey evidence shows that many businesses rapidly re-prioritised
investment decisions to preserve cash flows during the pandemic.39 The ONS find
15% of businesses that have not already permanently stopped trading had low or no
confidence of surviving the next 3 months and 32% had less than three months' cash
reserves.40
Against this backdrop, the impact of Covid on business investment might
pose a real challenge for reviving productivity growth in the UK. Compared to
its peers, the UK already has lower aggregate productivity and a disproportionately
longer ‘tail’ of low-productivity firms. As investment in human, physical and intangible
capital has been shown to have a strong impact on firms’ productivity, any persisting
stagnation in business investment might lead to further widening of the gap between
the UK and other economies, as well as between high and low productivity firms
within the UK.41
Longer-term opportunities
At the same time, the Covid crisis presents an opportunity to deliver a
wholesale improvement in UK firms’ digital infrastructure and skills, building
on the adjustments companies have needed to make during the pandemic to
improve their digital skills and streamline their estates. Be the Business
research has shown that lockdown created three years of innovation in just three
months.42 If sustained after the pandemic, this could provide an impulse for new
investment and deliver a significant productivity boost. Research has already shown
that the pandemic is speeding up the exit of the less productive companies. A study
by the University of Nottingham shows that the less productive industries have seen
larger reductions in output than the more productive ones.43 Similarly, less
productive firms across all industries are more likely to exit than the more productive
ones.
39 ONS.gov.uk, (January 2021), Business investment in the UK: July to September 2020 revised results, Available at: www.ons.gov.uk/economy/grossdomesticproductgdp/bulletins/businessinvestment/julytoseptember2020 40ONS.gov.uk, (November 2020) Business insights and impacts on the UK, available at: www.ons.gov.uk/businessindustryandtrade/business/businessservices/bulletins/coronavirusandtheeconomicimpactsontheuk/19november2020/pdf 41 Ft.com, viewed December 2020, available at: www.ft.com/content/21abdaf0-b3b6-4cf9-93f2-007fc1b1b1c8 42 Bethe business.com, The UK’s technology moment – why 2020 can be the year that changed our trajectory on tech, viewed October 2020, Available at: www.bethebusiness.com/media/the-uks-technology-moment-why-2020-can-be-the-year-that-changed-our-trajectory-on-tech/ 43 Bloom et al., Centre for Finance, Credit, and Macroeconomics, Working Paper 20/13, The impact of Covid-19 on productivity, available at: www.nottingham.ac.uk/cfcm/documents/papers/2020/cfcm-2020-13.pdf

Industrial Strategy Council: Annual Report
23
New capital spending will for many businesses be driven by the necessity to
enhance their online presence which, in turn, will require investment in data
management systems and put a premium on acquiring skills to derive value from
new data. Even for firms at the cutting edge of innovation, the pressure will grow to
apply new techniques, from better digital marketing to using A.I., to manage
production and supply chains more efficiently. Finally, most firms will need to devote
resources to reform their internal processes so that they are better suited to
managing operations with greater reliance on online presence, data collection, new
technologies and remote working.
Box 1: Opportunities from Brexit
The UK’s departure from the EU has been one of the most radical shifts in
economic policy in recent decades.
Leaving the Single Market has inevitably led to some disruption, as trading with
the UK’s largest and the closest partner has now become more difficult. The
burden of non-tariff barriers has already increased the cost of doing business for
exporters into the EU and some firms have established separate operations on
the continent.
Covid has added another level of complexity to the situation. The pandemic-
induced shift to digital, as well as the increased importance of supply chain
resilience, will have implications for cross-border trade, international cooperation,
and global value chains.
But Brexit will also give rise to new opportunities. What are they and how can
Government realise them?
New powers
After Brexit, the UK has greater flexibility over three policy areas key for future
industrial policy:
• Regional development funding: Having withdrawn from the European
Regional Development Fund, and partially replacing it with the UK Shared
Prosperity Fund, the UK now has an opportunity to improve the way
regional development funding is allocated to better reflect the UK’s
economic geography and priorities. With Levelling Up at the top of the
government’s agenda, there is scope for using this new institutional
architecture to achieve greater equality across UK regions.
• Industry support: The UK also has more flexibility over financial support
for industries and companies. While still partly bound to the EU state aid
regime via provisions in the UK-EU trade agreement, it will now have
greater room for intervention. Historically, the UK has been reluctant to use

Industrial Strategy Council: Annual Report
24
those state-aid powers allowed by EU treaties. Brexit could be an
opportunity for government to be bolder about investing in its key
strengths.
• Trade: The government has greater powers over trade policy and tariffs.
The introduction of the new UK Global Tariff has shown the government is
keen on actively using them. The UK Trade Policy Observatory
characterised the new regime as a reasonable compromise. These new
trade policy powers can be used to play to the UK’s industrial strengths.
New markets and new trade links
Brexit also provides an impetus to explore new markets and to shift the structure
of UK trade to capture a greater proportion of the total value-added. Faster export
growth in non-EU economies offers the potential to offset at least some of the
negative impact of greater restrictions on EU trade. The UK is well placed to
access many of these markets, with North America being a prime example, due
to strong cultural and historical ties, common business culture and common
language. Forging new supply chains and integrating the UK into those new
markets will be especially important in areas where the UK has a comparative
strength.
New value proposition
Brexit has forced UK policy makers and businesses to consider their unique
selling points. As pointed out in previous ISC publications, clarity on economic
strengths and weaknesses is crucial for success. The UK’s strengths in academic
research, and status as the European science and technology research leader,
provides one such pillar. But there are others, including the creative, industrial
and financial services. It is important to identify and prioritise them and commit to
their long-term support.

Industrial Strategy Council: Annual Report
25
Section 3: An assessment of the Plan for Growth
The Council believes that the key ingredients of a successful Industrial Strategy or
Plan for Growth are scale, longevity and policy-co-ordination. This section uses
these high-level principles, and the Council’s extensive work to monitor and evaluate
the 2017 Industrial Strategy, to draw out lessons for the Plan for Growth. It provides
some overarching recommendations that in hopes help to ensure the Plan for
Growth continues what the 2017 Industrial Strategy started, namely a sustained
improvement in long-term living standards across the UK. It also provides an
assessment of the policies associated with the three pillars of growth it sets out
(infrastructure, skills, and innovation) and the three priority areas (Levelling Up, Net
Zero, and Global Britain).
Overarching recommendations
Prioritisation
Having an ambitious strategy spanning a wide array of policy areas, sectors and
government departments is a good thing. The 2017 Industrial Strategy was
ambitious in its attempt to provide an overarching framework for industrial policies
and to co-ordinate those policies across Whitehall. Whilst the Council’s assessment
is that it has not always lived up to this ambition, such policy co-ordination will be
critical in future to ensure the Plan for Growth is delivered.
All good strategies also require prioritisation. Supply-side policies need to be
financed at scale and focussed if they are to succeed. One of the Council’s main
concerns with the 2017 Industrial Strategy was that, with its 142 policies different
policy measures, it tried to do too much and spread itself too thinly. The Council’s
2020 Annual Report concluded that the Industrial Strategy had made progress, but
that a refresh and reprioritisation was needed if it was to meet the challenges facing
the UK economy. A year on, that even more true in the light of Covid.
The Plan for Growth is the Government’s response to those challenges. It is an
ambitious and expansive plan, embracing many Government departments, many
sectors and containing a wide-ranging set of policy initiatives. The Council has
identified around 180 policies and commitments in the Plan for Growth, many of
which do have funding assigned to them. Around 14 of them are commitments to
publish a strategy for a specific policy area, which may multiply initiatives further.
That number of policy initiatives begs questions about their scope and scale and
hence the likely success of this plan. It will certainly make it difficult to co-ordinate

Industrial Strategy Council: Annual Report
26
this number of policy initiatives across Whitehall and in a way which actively involves
and engages the business sector and local actors. The Council believes greater
prioritisation is likely to be needed if the Plan for Growth is to meet its
objectives.
Framework and success metrics
The Plan for Growth focusses on three pillars of growth – infrastructure, skills and
innovation. These are three necessary ingredients of growth and their importance is
supported by an extensive literature. A focus on them is welcome. They are not,
however, sufficient conditions for growth. It is well-recognised that growth in living
standards and productivity typically relies on a broader set of “capitals” than the
traditional ones. That includes measures of natural capital (nature and the
environment), social and human capital (trust, relationships and well-being) and
institutional capital (both national and local institutions, suitably co-ordinated), among
others.
For example, recent work has highlighted the important links between ‘good work’,
well-being and productivity, at both the individual and organisational level.44 The
recently published Dasgupta Review for the UK Government45 has highlighted the
importance of bio-diversity for future sustainable growth, while monitoring progress
towards Net Zero will require a broader set of indicators (see Box 2). And historical
evidence, and the Council’s own work, emphasises the importance of institutional
capacity and capability, nationally but especially locally, in delivering growth.46
That is why, when developing its own framework for monitoring and evaluation of the
2017 Industrial Strategy, the Council looked beyond the “traditional” drivers of
productivity to include measures of social, human, and natural capital, as well as
broader welfare impacts. Taking that whole-system view better reflects the known
drivers of productivity, earnings and prosperity over the longer term.
The Council welcomes the intention to set out clear metrics to monitor
progress but encourages the Government to widen its framework beyond the
“traditional” drivers of productivity.
Co-creation with the private sector
Industrial policies benefit the economy in large part through the effects they have in
stimulating activity in the private sector, supporting innovation, jobs and wealth-
creation. The role of industrial policies is to provide a supporting framework within
44 www.carnegieuktrust.org.uk/news/tackle-poor-quality-work-to-help-solve-uks-productivity-puzzle-says-new-carnegie-uk-trust-rsa-research/ 45 www.gov.uk/government/publications/final-report-the-economics-of-biodiversity-the-dasgupta-review 46 See Acemoglu and Robinson (2012). Why Nations Fail: The Origins of Power, Prosperity and Poverty and https://industrialstrategycouncil.org/understanding-policy-making-processes-behind-local-growth-strategies-england

Industrial Strategy Council: Annual Report
27
which the private sector is encouraged to flourish. This objective is best achieved by
actively engaging and involving private sector actors in designing and implementing
this framework, drawing on their detailed knowledge and capacity to execute on the
plan – a model of co-creation.
This is plenty of empirical and historical evidence to support this public/private
partnership model as a means of supporting innovation, productivity, and wealth-
creation. One prominent example is the so-called mission-led approaches to
industrial strategy, which for their success rely on an active partnership between the
public and private sectors.47
A particular strength of the 2017 Industrial Strategy were the elements of “co-
creation” that it included, engaging and involving businesses and local actors in the
design and implementation of the framework. One example was the Local Industrial
Strategies which local areas (Local Enterprise Partnerships (LEPs) or Mayoral
Combined Authorities (MCAs)) developed in partnership with central Government,
drawing on local knowledge and with extensive and collaborative local participation.
A second example were Sector Deals, which involved partnerships between
Government and business in drawing-up and implementing growth plans for defined
industries.
The Council’s work on vaccine development highlights the power of co-creation.
Development of the Oxford/AstraZeneca vaccine inside a year was made possible
through a partnership between the public, private and voluntary sectors. For
example, overcoming challenges such as streamlining clinical trials required co-
ordination between public health bodies, regulators, scientists, industry and
volunteers, supported by civil servants working to secure timely funding to de-risk the
process for Oxford and AstraZeneca.
This model of co-creation is, the Council believes, significantly under-emphasised in
the Plan for Growth. For example, the status of both Local Industrial Strategies and
the Sector Deals is uncertain under the plan. The Council believes that active
engagement and co-creation, with business and local actors, is key to
ensuring the success of the Plan for Growth.
Independent and expert evaluation
Supply-side policies take time to have a material and enduring impact and need
longevity. This requires a consistent focus on delivery, monitoring and evaluation. It
also requires departments across Whitehall to work together. A key benefit of having
an Industrial Strategy or Plan for Growth is the common vision that it provides, as a
means of helping deliver that co-ordination. This is particularly true for the objectives
around Net Zero and Levelling Up, where the scale is significant and the initiatives
span several government departments
47 See for example www.ucl.ac.uk/bartlett/public-purpose/publications/2019/may/mission-oriented-uk-industrial-strategy

Industrial Strategy Council: Annual Report
28
The Council welcomes the planned focus on delivery, with cross-Whitehall
governance at senior levels and regular reporting to Cabinet Office and HM Treasury
on progress. But best practice internationally, and indeed domestically in other areas
of policy, calls for arms-length, independent and rigorous oversight and evaluation of
delivery and success. With the demise of the Industrial Strategy Council, there is
now a notable institutional gap in the UK’s policy framework for doing so.
The OECD has defined some principles to guide the design of these institutions,
including independent governance, transparent process, solid research capacity,
economy-wide frame of reference, and linkages to policy-making mechanisms within
government.48 There are external bodies in the UK that fulfil these principles for
some areas of the Plan for Growth, notably the Committee on Climate Change for
Net Zero and the National Infrastructure Commission for infrastructure. But the
abolition of the Council means no such body exists to hold Government to account
on the Plan for Growth overall.
The Council believes the Government should set up an independent body,
ideally in statute, tasked with providing impartial and expert evaluation of the
Government’s progress in delivering the Plan for Growth.
An assessment of policy content
The Plan for Growth focuses on three core pillars of growth and three priority areas.
Based on its research and experience with evaluating the 2017 Industrial Strategy,
the Council’s assessment of these areas is set out below.
Infrastructure
The policies outlined in the Plan for Growth indicate the Government is committed to
investing significantly in infrastructure. The document reiterates the pledge from the
Autumn 2020 Spending Review to spend £100bn in capital investment in 2021-22, of
which £27bn is on economic infrastructure. According to the National Infrastructure
Commission (NIC), this would constitute “a substantial increase [in spending]
compared to recent years”, equivalent to just under 1.2% of GDP, compared to
around 0.9% of GDP in recent years.49
The NIC was created in 2015 and provide expert, impartial advice to government on
long-term infrastructure. The involvement of the NIC in shaping these infrastructure
interventions in the Plan for Growth, and their oversight of them, makes it more likely
that they are well-designed and will be delivered. The alignment of the Plan for
48 Banks, G. (2015). Institutions to promote pro-productivity polices: Logic and lessons, OECD Productivity Working Papers, 2015-01, OECD Publishing, Paris. Retrieved from: www.oecd-ilibrary.org/economics/institutions-to-promote-pro-productivity-policies_5jrql2tsvh41-en 49 https://nic.org.uk/studies-reports/annual-monitoring-report-2021/

Industrial Strategy Council: Annual Report
29
Growth with the existing National Infrastructure Strategy will help facilitate co-
ordination of policy actions across government departments.
The Council believes the infrastructure component of the Plan for Growth
satisfies the success criteria of longevity, scale and policy co-ordination and
is a role model for how industrial strategy should be pursued across the other
pillars.
Skills
The strong focus on skills in the Plan for Growth is welcomed by the Council. The
2017 Industrial Strategy was light on labour market and skills policies. The Council’s
own work has highlighted the scale of the UK’s potential future skill gaps – gaps
made worse by the Covid crisis. It also highlighted the importance of developing
vocational skills and developing a new norm of lifelong learning. These are all priority
areas in the Plan for Growth.
The skills challenge is a large and growing one. Council work highlighted that, by
2030, 7 million additional workers (or 20% of the current labour market) could be
under-skilled for their job. These skills gaps are expected to be most acute in digital
and managerial skills. As Section 2 highlights, digital skills will be increasingly
important if hybrid working becomes the norm for some workers. And a green
recovery will not be possible without investment in the skills of the workforce.
Long-standing shifts in technology, demography and sustainability are likely to lead
to significant changes in the nature of work over coming decades. On top of that,
several new labour market issues have been exposed by the Covid crisis. That
includes poor job prospects of young adults and school leavers, re-employing those
whose jobs have been lost, a lack of social protection within parts of the gig
economy and the appropriate levels of pay for key and essential workers. Meeting
those labour market challenges calls, the Council believes, for an ambitious labour
market strategy. The policies set out in the Plan for Growth, while going in the right
direction, probably lack the scale and scope necessary to meet those challenges.
Labour market policies intersect several Government departments. Progress will
require the Department for Education, the Department for Work and Pensions and
BEIS to work much more closely than in the past, with strong engagement with
private businesses, the education sector and trades unions. This is another area
where a co-creation model will be essential for success
The Council believes that, building on its current plans, the Government needs
to develop a comprehensive and ambitious Labour Market Strategy, co-
ordinating across government, and in collaboration with employers, the
education sector and trade unions.

Industrial Strategy Council: Annual Report
30
Innovation
The Plan for Growth sets out many initiatives aimed at boosting innovation. Many of
those are focused on R&D. The Plan for Growth rightly maintains the R&D Roadmap
target of spending 2.4% of GDP on R&D by 2027 and includes £14.6bn of direct
public funding in 2021/2. Achieving the 2.4% target will require further substantial
increases in investment. The R&D Roadmap commits to £22bn (an additional 50%)
of public funding by 2024/5, but a significant increase in private R&D will nonetheless
be needed to meet the target.
The creation of the new Advanced Research and Innovation Agency (ARIA) is also
welcome and something the Council previously highlighted as an important
institutional step forward in catalysing research and innovation in the UK.
The innovation process is, however, about much more than R&D at or close to the
technological frontier. There are approximately 3 million active firms in the UK50, of
which only around 60,000 claim R&D tax credits each year. The remaining 98% of
firms need also to be provided with incentives to innovate if the UK is to drive
forward improvements in productivity.
There are many ways that firms can invest in innovation outside of R&D. This is
especially true of firms outside the manufacturing sector, where much of R&D
spending is concentrated. This includes investments in: better software; the curation
and analysis of data; all types of design, not just of goods; the creation of new
literary, musical and artistic works; improved organisation of business processes;
better marketing; and training to create a more productive workforce, including
management training.51 The consultation on extending the scope of R&D tax credits
to include investments in data and analytics is welcome, but embraces only a sub-
set of these investments.
The Plan for Growth does go some way to recognising, and supporting, these
investments. Specifically, it includes a programme to improve the management and
organisational skills of 30,000 SMEs and a scheme to assist 100,000 SMEs in the
adoption of software and digital solutions. These are welcome initiatives. But their
scope needs to be seen against the backdrop of a population of 5.9 million
registered SMEs. There is an opportunity to expand the scope of innovation through
the upcoming Innovation Strategy, National Data Strategy and Digital Strategy. This
could help support wider innovation investment, not just through R&D.
Successful adoption of new technology requires investment in physical capital, skills
and business processes. The Plan for Growth provides relatively little by way of
additional incentives for longer-term business investment. While the ‘super
deduction’ announced in the Budget is likely to be effective in bringing forward
50 ONS Business Demography 51 See for example, Haskel, Goodridge and Wallis (2014). Estimating UK investment in intangible assets and Intellectual Property Rights

Industrial Strategy Council: Annual Report
31
investment, its temporary nature means it does not provide a long-term incentive to
invest.52 And empirical evidence for the UK suggests increases in corporation tax
could have a significant negative effect on business investment.53
In last year’s Annual Report, the Council highlighted the need to scale up the British
Business Bank (BBB). Whilst that recommendation was made before the Covid crisis
struck, the crisis has exposed why this was needed. The BBB has done an excellent
job in rapidly expanding its capacity to deliver Covid-related financial support to
businesses. It will be important to maintain the expanded scope and scale of the
BBB’s operations in the period ahead to meet the financing needs of SMEs in
particular.
Moreover, consideration is needed of how to manage the large volume of corporate
debt built up during the Covid crisis, especially among SMEs. Covid-related business
loan support schemes account for about 16% of the £430 billion in all loans
outstanding to private non-financial corporations.54 If deleveraging is not managed
effectively, there is evidence this could result in a long period of weak business
investment growth, with negative long-run consequences for innovation and
productivity.55 Thinking of ways to manage the burden of this debt for viable firms
could also help to reduce business failures and support employment.
In summary, while there are a number of useful innovation initiatives in the Plan for
Growth, further consideration is needed of supporting the innovation system as a
whole, particularly for smaller businesses, the services industries and those firms
who sit inside the technological frontier. The Council hopes the forthcoming
Innovation Strategy will take a whole system approach to this critical area of
public policy.
Levelling Up
It is clear Levelling Up offers significant potential rewards for the UK economy.
Council research estimates that Levelling Up of places classified as “falling behind”
to the UK average would lead to aggregate UK productivity being around 3% higher.
Unlocking the potential of local economies will be more crucial than ever as the UK
begins to recover from the economic and social impacts of the Covid pandemic.
The first step in designing an effective strategy for Levelling Up is to define some
success criteria – for example, an objective of bringing productivity in left-behind
NUTS2 regions up to 90% of the national average. The Plan for Growth does not
contain any success criteria for Levelling Up, which makes it difficult to judge
52 See for example, House and Shapiro (2006). Temporary Investment Tax Incentives: Theory with Evidence from Bonus Depreciation 53 See for example, Wallis (2019). Tax incentives and investment in the UK 54 See https://blogs.lse.ac.uk/businessreview/2021/02/02/a-wave-of-covid-related-bankruptcies-is-coming-to-the-uk-what-can-we-do-about-it/ 55 See for example, Borensztein and Ye (2020). Corporate debt overhang and investment in emerging economies: Firm‐level evidence

Industrial Strategy Council: Annual Report
32
whether the scale or scope of existing initiatives is adequate. It will also make it
difficult to monitor or evaluate whether these policies are succeeding over time.
The research undertaken by the Council makes clear that there is no singular policy
that can effectively drive local economic growth on its own. Rather, it is only by
putting in place a broad range of local foundations that local growth can be realised
and sustained. The Council itself has set out “six foundations” for growth.56 These
are: scale and longevity of investments, collaboration, making areas attractive places
to live, universities and innovation, digital and transport infrastructure and skills and
supporting future sectors.
Transport infrastructure features strongly in the Plan for Growth, which by itself is
positive. But it is clearly only one foundation of success for “left behind” places. The
approach in the Plan for Growth appears over-reliant on infrastructure spending, with
too little emphasis on the other five foundational elements identified by the Council.
Every place has its own set of local strengths and challenges. Differences within
region are often as large, or larger, than differences between regions. It would be
unrealistic to expect central Government to have an in-depth knowledge of local
economies. This highlights the value of the 2017 approach of co-created Local
Industrial Strategies, with local government developing locally-tailored plans,
developed in partnership with local partners and central Government.
The status of these Local Industrial Strategies is, at present, unclear. As they drew
on extensive research, and involved intensive collaboration between local actors, it
would be a significant loss if the insights contained within them, and the networks
established through them, were to go to waste. It is also unclear who will oversee
delivery of local plans, as Local Enterprise Partnerships (LEPs) are not mentioned in
the Plan for Growth.
The Plan for Growth does contain a number of funding sources (some new, some
existing) to support Levelling Up. These include the Levelling Up Fund, the UK
Community Renewal Fund, the UK Shared Prosperity Fund and the Towns Fund. It
is difficult to judge whether this funding is sufficient for the scale of the challenge
without some clearer sense of the success criteria for Levelling Up. More generally,
however, this centralised competitive funding-based approach to Levelling Up sits
rather uncomfortably with the six foundational pillars. For success, these need to be
constructed locally. Competitively-bid central funding limits the scope for effective co-
creation between national and local actors. The funding covers only some of the six
foundations. And it generates a potentially unlevel playing field, disadvantaging
those areas with least capacity and capability to mount a successful bid.
Council research shows that strong local leadership and efficient governance are key
to driving local economic growth. Local strength is founded on the strength of local
institutions. A study of EU countries found that devolution of fiscal powers to
56 See https://industrialstrategycouncil.org/what-does-it-take-level-places
Industrial Strategy Council: Annual Report
33
subnational governments was negatively correlated with the level of regional
inequality within the sample countries.57 More broadly, the evidence suggests that
devolution plays a crucial role in the Levelling Up agenda.
At present, there are large imbalances in the capacity and capability of local
institutions across the UK.58 Indeed, this has actively contributed to the opening-up
of regional disparities in a vicious circle for left-behind regions. Levelling Up
capacities and capability, and the local institutions in which they are embedded, will
be crucial if economic Levelling Up is to succeed. At a minimum, that will require
long-term funding certainty (multi-year financial settlements and capital funding) for
local institutions.
In a forthcoming report, the Council will set out a set of policy and guiding principles
that should underpin effective devolution.59 For example, there should be a clear
mechanism for devolution of a wide range of powers to a sub-national level.
Devolution of spending powers is an essential tool for Levelling Up, with a greater
fraction of spending decided locally in line with local needs and priorities.
A Devolution White Paper is planned by the Government but has already been
postponed on multiple occasions. There is the opportunity for this to be written in
collaboration with local leaders from both the public and private sectors, in a model
of co-creation. Given the importance for success of devolving locally powers, monies
and people, this devolution plan will need to be ambitious in scope.
The Council believes a comprehensive reorientation of the Government’s
approach to Levelling Up is needed, including through its forthcoming White
Paper on Devolution, to achieve this crucial objective.
Net Zero
The Council was critical of the degree of focus, financing and policy co-ordination on
Net Zero in its 2020 Annual Report. However, over the past year, the Government
has made significant progress. The introduction of the Ten Point Plan for a Green
Industrial Revolution set out concrete policy proposals to support green jobs, and
accelerate the path to net-zero. As part of this plan, the government announced £12
billion of investment, focused on reducing emissions in the energy, buildings, and
transport sectors, as well as supporting innovation and finance.
The ten-point plan provided some concrete policy proposals, increased the scale of
funding for Net Zero and laid the foundations for a more joined up Government
approach. Nonetheless, the scale of the challenge very likely exceeds the
57 Ezcurra, R., & Pascual, P. (2008). Fiscal Decentralization and Regional Disparities: Evidence from Several European Union Countries. Environment and Planning A, Economy and Space, 40(5), 1185–1201. 58 See https://industrialstrategycouncil.org/understanding-policy-making-processes-behind-local-growth-strategies-england 59 To be published on 31 March 2021.

Industrial Strategy Council: Annual Report
34
commitments made so far. According to PwC, £40 billion of investment is needed
every year for the next decade to meet the Net Zero target.60 Of the £12 billion
announced in the ten-point plan, only £3 billion was new money.61
This leaves the plan heavily reliant on private sector investment, with the
government aiming to attract three times the committed public sector investment.
Despite progress to encourage private investment, including through climate-related
financial disclosures by the financial sector, the scale of this challenge looks
considerable.
While the ten-point plan was light on mechanisms to support the transition, the
recent release of the industrial decarbonisation strategy goes some way to
addressing this. This includes the use of public procurement to create demand for
green industrial production, new product standards to enable manufacturers to
clearly distinguish their products from high carbon competitors, and the use of
carbon pricing. Furthermore, the Industrial Decarbonisation Challenge fund has been
allocated to nine green tech projects across the country, helping industry to increase
its use of low carbon energy sources.
The ten-point plan mentions increased investment in the off-shore wind sector and
new technologies, such as floating turbines. These policies will support the
decarbonisation of the energy sector, increasing scale, and reducing costs as well as
increasing UK comparative advantage. While additional investment in nuclear
technology is also welcome, there was a lack of mention of onshore wind and solar,
both of which could also play an important part in decarbonising the energy sector.
Banning petrol and diesel vehicles by 2030, alongside investment in automotive
supply chains and innovation, will also support transition to electric vehicles and help
to scale up the industry.
Carbon capture, utilisation and storage (CCUS) and hydrogen will support industry,
especially heavy industry, in their efforts to decarbonise. In the 2020 spending
review, the government announced an increase in the CCUS infrastructure fund to
support the deployment of four CCUS clusters. In addition, £240 million has been
announced for the low carbon hydrogen fund, as well as an aim to increase low
carbon hydrogen production to 5GW by 2030, and to develop the first town heated
entirely by hydrogen by the end of the decade. When compared internationally, UK
investment in hydrogen is overshadowed by countries such as Germany, which have
allocated a further €7bn as part of their hydrogen strategy. Further investment is
likely to be need for CCUS and hydrogen to support industrial decarbonisation.
The Future Homes Standard will play an important role in the decarbonisation of our
homes. From 2025, all new homes will need to be zero-carbon. This means
hundreds of thousands of new homes built between now and 2025 will require some
form of retrofitting alongside existing homes. The Plan for Growth mentions 600,000
60 PwC. (2020). Unlocking capital for Net Zero infrastructure.. 61 The Guardian. (2020). Is £12bn enough to get UK on track for net zero carbon emissions?
Industrial Strategy Council: Annual Report
35
heat pumps will be installed every year by 2028, lower than the estimated 900,000
that is needed and rising to 1.5 million before 2035. Currently, fewer than 30,000
heat pumps have been installed each year.62
As the economy transitions to Net Zero, industries and workers will face disruptive
change. While the ten-point plan estimates that hundreds of thousands of new jobs
will be supported, these jobs may not be in the industries or regions faced with
tougher transitions and at higher risk of losing jobs. In addition, as skill requirements
differ from carbon-intensive industries, people will need to be reskilled or upskilled to
take up new opportunities. The ten-point plan mentions little to support this skills
adjustment for workers.
Policy co-ordination is essential in delivering a productivity-enhancing and a just-
transition to net-zero. An example where more co-ordination is needed is between
local and national government. Local authorities will have an important role to play in
achieving net-zero by leading the governments work on decarbonising sectors such
as housing and transport. According to the Local Government Association (LGA), the
Government needs to outline national and local government responsibilities, as well
as support councils to develop local Net Zero delivery plans.63
In summary, the Council welcomes the progress made in the past year and the ten-
point plan. It represents significant progress and lays the foundations for a more
joined-up Government approach. The Council believes the Government’s plans
are not yet a complete roadmap for delivering Net Zero and several areas still
lack the required scale to make progress at the required speed.
Global Britain
The UK has for years benefited from an ever-more integrated global economy and
increasing cross border capital flows. It has for many years been a European leader
in inward Foreign Direct Investment (FDI). But investment flows into the UK have
declined since the financial crisis – a time when trade protectionism has been on the
rise and competition between countries as an investment destination has increased.
In this context, the UK’s leading position (2nd largest destination for global FDI and
5th in world ranking of exports in 201964) is being challenged.
Brexit is reshaping the UK’s trade policy and might affect its investment
attractiveness too. It will very likely change relative comparative advantages and,
consequently, reshape the structure of the economy. In addition, the Covid pandemic
has hit global trade and value chains and has the potential to affect global
investment decisions and redraw global supply chains.
62 Committee on Climate Change. (2020). Reducing UK emissions Progress Report to Parliament. 63 House of Commons Public Accounts Committee. Achieving Net Zero. Forty-Sixth Report of Sessions 2019-21. 64 UK Trade in Numbers

Industrial Strategy Council: Annual Report
36
The Plan for Growth lists a number of useful directions of travel in furthering the
objectives of Global Britain. This includes “removing market access barriers”. The
launch of the Office for Investment, New Export Development Guarantee and
General Export Facility and the Britain is Great campaign are all initiatives that would
support this objective.
The Plan for Growth states that a refreshed Export Strategy will be published within
12 months to “align support for exporters with our plan for growth and sectoral
priorities”. It contains relatively little, however, on how trade and investment policy
will be used actively to support the UK’s key sectors. The Council’s publications
suggest there is considerable potential here, by more closely aligning UK with
international best practice. This means designing and implementing both defensive
and strategic sectoral interventions.
The Covid crisis makes the case for defensive sectoral intervention more important
than ever to secure resilience in supply chains. The fracturing of global supply chains
during the Covid crisis put as risk the supply of certain essential goods and services,
including medical equipment. This underlines the importance of building domestic
capacity in some sectors and industries to secure supply of these good and services
– as a complement to, rather than substitute for, international supply chains. The role
of defensive sectoral polices is to help achieve that resilience.
This needs to be complemented with a set of bold strategic sectoral interventions.
These should aim to promote, at scale, a well-defined set of sectors likely to deliver
the largest future pay-offs to productivity and living standards, in line with
comparative advantage. These policies are well-established, and have been pursued
with real success, in a number of other countries.
When judging which sectors best serve the objective of boosting UK productivity and
living standards, three relevant factors are:
• “Sector share”: boosting productivity in sectors that already make a material
contribution to UK employment and output will, in general, have a larger
impact on aggregate productivity.
• “Catch-up potential”: sectors whose productivity lies a long way below the
frontier of international best practice have greater potential to “catch-up” and
boost aggregate productivity.
• “Future growth”: sectors that have the greatest potential to push the
technological frontier in future are likely to make larger contributions to future
productivity growth.
The ideal focus for strategic sectoral policies would be sectors satisfying all three
criteria. In practice, in a dynamic economy such as the UK, there are relatively few
sectors meeting all three criteria. Indeed, often there are trade-offs between them:
for example, between supporting fast-growing sectors that are small in scale and

Industrial Strategy Council: Annual Report
37
concentrated in relatively more prosperous parts of the UK (life sciences, aerospace)
versus supporting larger sectors concentrated in the less well-performing parts of the
UK which have more limited upside potential (construction, retail).
That these choices are difficult does not detract from the need for them to be made,
on a strategic basis, to support the UK’s trade and investment policy and global
ambitions. A detailed understanding of the position of UK industries in global value
chains, actually and prospectively, would help in making these choices.
The Council believes there is a strong case for using sectoral policy in this
strategic fashion to promote the development of key UK industries on the
international stage.

Industrial Strategy Council: Annual Report
38
Section 4: Implementation of the 2017
Industrial Strategy
A key part of the Council’s role has been to hold the Government to account on
implementation of the 2017 Industrial Strategy. While the Government has now
moved away from the 2017 Industrial Strategy, it is still important to review its
implementation and learn any lessons to ensure that the Plan for Growth is
implemented, monitored, and evaluated effectively.
Last year’s Annual Report provided an initial assessment of the 2017 Industrial
Strategy, with the caveat that the long-term nature of the policy commitments it
contained meant that it was too early to reach definitive judgements on their
success. Overall, good progress had been made on implementation, though many
policies were not operating with the consistency and co-ordination, nor with the
scale, necessary for success.
A total of 142 policies across the five Foundations of the Industrial Strategy were
previously identified by the Council, based on the commitments set out in the
Industrial Strategy White Paper in 2017. This section provides an update on the
progress made since the 2020 Annual Report on those 142 policies and the lessons
learnt from their implementation. The analysis in the section highlights the
importance of having an independent body, ideally set in statute, that can provide
impartial and expert evaluation of the Government’s progress in delivering the aims
of the Plan for Growth.
Policy delivery progress
At the time of writing the 2020 Annual Report, most policy commitments in the 2017
White Paper had been launched and had moved into the delivery phase of
implementation. Policies were previously categorised as either: complete, in
progress, in early development or pending.65 Given it has been almost four years
since the launch of the Industrial Strategy White Paper and the environment in which
we now find ourselves has changed drastically, not unexpectedly some policies have
been delayed and a few decommissioned altogether.
65 Complete - Government has implemented the policy (the roll-out of the policy has been completed, e.g. funding has been paid out to recipients). In progress - Government is taking steps towards the delivery of the policy and has not missed its delivery deadline. Early development - Government has not taken any action towards the implementation of the policy or missed its delivery deadline.
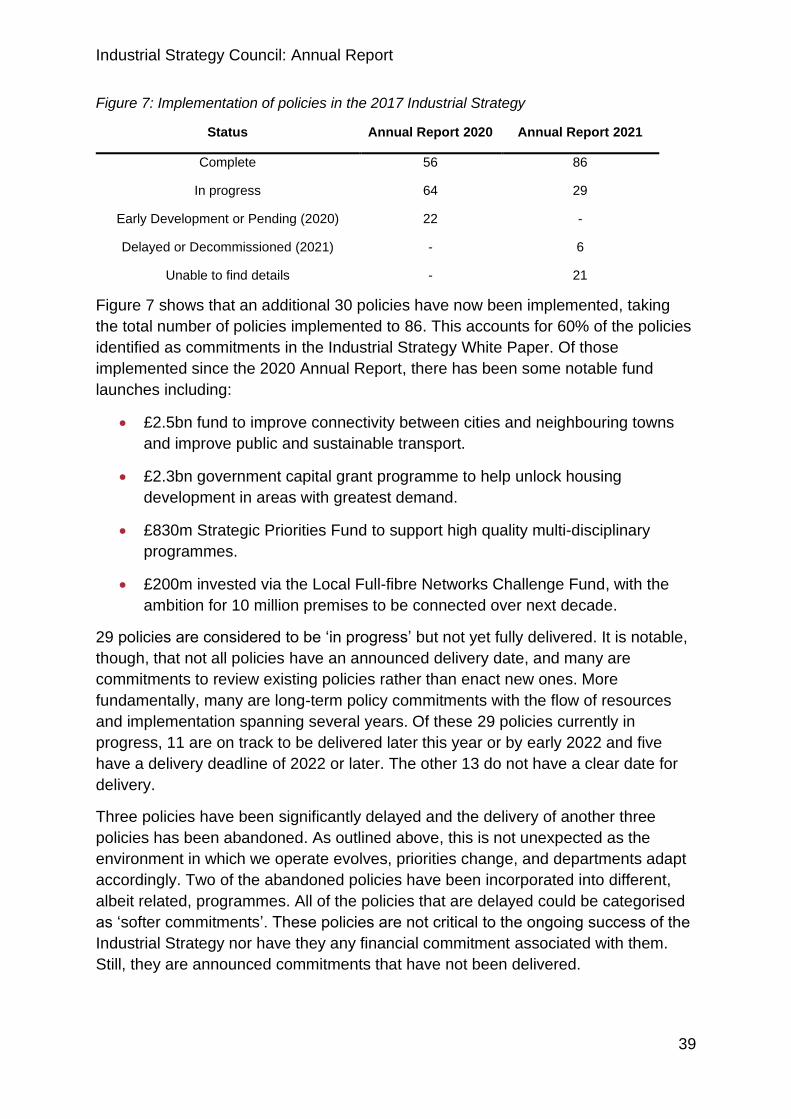
Industrial Strategy Council: Annual Report
39
Figure 7: Implementation of policies in the 2017 Industrial Strategy
Status Annual Report 2020 Annual Report 2021
Complete 56 86
In progress 64 29
Early Development or Pending (2020) 22 -
Delayed or Decommissioned (2021) - 6
Unable to find details - 21
Figure 7 shows that an additional 30 policies have now been implemented, taking
the total number of policies implemented to 86. This accounts for 60% of the policies
identified as commitments in the Industrial Strategy White Paper. Of those
implemented since the 2020 Annual Report, there has been some notable fund
launches including:
• £2.5bn fund to improve connectivity between cities and neighbouring towns
and improve public and sustainable transport.
• £2.3bn government capital grant programme to help unlock housing
development in areas with greatest demand.
• £830m Strategic Priorities Fund to support high quality multi-disciplinary
programmes.
• £200m invested via the Local Full-fibre Networks Challenge Fund, with the
ambition for 10 million premises to be connected over next decade.
29 policies are considered to be ‘in progress’ but not yet fully delivered. It is notable,
though, that not all policies have an announced delivery date, and many are
commitments to review existing policies rather than enact new ones. More
fundamentally, many are long-term policy commitments with the flow of resources
and implementation spanning several years. Of these 29 policies currently in
progress, 11 are on track to be delivered later this year or by early 2022 and five
have a delivery deadline of 2022 or later. The other 13 do not have a clear date for
delivery.
Three policies have been significantly delayed and the delivery of another three
policies has been abandoned. As outlined above, this is not unexpected as the
environment in which we operate evolves, priorities change, and departments adapt
accordingly. Two of the abandoned policies have been incorporated into different,
albeit related, programmes. All of the policies that are delayed could be categorised
as ‘softer commitments’. These policies are not critical to the ongoing success of the
Industrial Strategy nor have they any financial commitment associated with them.
Still, they are announced commitments that have not been delivered.

Industrial Strategy Council: Annual Report
40
There are 21 policies that it has been impossible to determine the status of. This
highlights poor policy delivery and tracking by the Government.
This assessment focuses only on implementation. The Council have not tracked the
extent to which the full set of policy commitments have been evaluated by
Government departments.
Lessons learnt
This is the second time the Council has undertaken the process of tracking the
implementation of the 142 policies in the 2017 Industrial Strategy. This year’s
process has been much more demanding than the last. With no single government
team or body tracking those policies, the Council believes tracking the policies in the
Plan for Growth will prove problematic in future. In addition, the status of
unimplemented policies is unclear in the light of the change of Government
strategy and the Council believes clarity or closure is needed as a matter of
good governance.
Knowledge of the policies in both the 2017 White Paper and Plan for Growth is
dispersed across government and often sits with one or two individuals within each
of the 20 government departments and arm’s-length bodies initially tasked with the
implementation. As staff move on to different roles, so it seems does the knowledge
of the policies. There is a real risk this happens with the Plan for Growth without the
appropriate structures in place.
The Council research team found some resistance from individuals to report on the
progress of individual policies, especially when these were behind schedule or were
being dropped all together. Without Council tracking of these policies, there appears
to be very little accountability for the commitments made in 2017. This contains an
important lesson for policy accountability in future.
Those in government tasked with implementing the 2017 Industrial Strategy policies
found the governance structure to be somewhat complex and fragmented. The roles
of the various government departments in joint policies can be unclear, making
escalation routes and communication on these policies confusing. Some believe the
implementation process has been significantly hampered by an overreliance on
existing Whitehall structures, processes, and ways of working, further compounded
by the large scope of the expected deliverables.
This Plan for Growth sets out plans to address these problems, with the creation of a
new focused performance reporting system at the centre of Government which will
provide an ongoing picture of departmental activity, with regular reporting to the
Cabinet Office and HM Treasury. This appears to be an improvement over previous
systems from an administrative perspective but does not expose these policies to
expert external scrutiny and evaluation.

Industrial Strategy Council: Annual Report
41
Section 5: The Council’s work
Since it was formed in November 2018, the Council has had an ambitious work
programme. Its outputs have been used to inform the Council’s assessment and
recommendations in relation to the 2017 Industrial Strategy, but also to contribute to
the debate and evidence base on successful supply-side policies. To ensure
transparency, all the Council’s work has been published on its webpage. Since the
last Annual Report, the Council has published seven papers on topics including
skills, local policy and growth, sectoral policy, the contribution of Universities and
Colleges to the Industrial Strategy, and the development of greener supply chains.66
In 2020 the Council also launched its blog, Productivity Matters, and has published a
total of 25 blogs including some high-profile contributors.
Over the course of 2020 changes were made to the work programme to reflect both
the Covid crisis and the priorities of government. The clean growth project was
launched reflecting the governments ongoing commitment to a Net Zero economy by
2050 and the project on place was scaled up to reflect the continued focus of
Government on its Levelling Up agenda. A specific project focused on lessons for
Industrial Strategy from the development of Covid vaccines was also added to the
work programme and the findings of the project have been published alongside this
Annual Report.
Below we set out the highlights of the Council’s work programme. All those papers
referenced below will remain available on the Council website. The Council hopes
its outputs will make a significant and lasting contribution to research and
public policy thinking on supply-side issues. They are crucial to the long-term
health and prosperity of the UK, its nations and its citizens.
Success Metrics
In line with the Council’s role in monitoring and evaluating progress, the Council
agreed and published a series of Success Metrics for the Industrial Strategy. The
success metrics cover key elements of the 2017 Industrial Strategy, such as
headline outcomes, Grand Challenges, Foundations, and Sector Deals. By working
closely with stakeholders both within and outside of Government, the Council aimed
to capture a broad range of indicators for the whole of the UK, and in many cases,
distributional comparisons across places and sectors as well as international
comparisons.
66 See https://industrialstrategycouncil.org/index.php/news-publications

Industrial Strategy Council: Annual Report
42
Box 2: Considerations for evaluation of progress towards Net Zero
As the economy transitions to Net Zero, industries and workers will face
disruptive change. Places more reliant on carbon-intensive industries, such as
Yorkshire and the Humber and the North West, will face tougher transitions than
those that are less reliant on carbon-intensive industries or that have a more
diversified economy. Workers will also need to retrain or upskill to meet the
growing and changing skills demands required to deliver Net Zero.
Whilst there are many challenges to overcome, there are also many opportunities
to deliver employment, wage growth, drive improvements to firm performance and
productivity, and level-up left behind towns and cities. Metrics are needed to
ensure progress towards Net Zero and to ensure the transition is a productivity-
enhancing and fair one. This will require new and more reflective metrics, many of
which are different to traditional measures used to measure success and will
require measures that capture the distributional impact of the transition to Net
Zero, as well as industrial policies and social programs.
Capturing a broader set of success metrics is essential in measuring the success
of the transition and holding the government to account when progress has
stalled. More needs to be done in these areas to ensure progress can be
supported and captured:
• Timeliness: Current measures are published with insufficient frequency
and often with long time lags.
• Inclusive transition: Monitoring a just-transition requires a distributional
dimension, which is unavailable in most current metrics.
• Input indicators: Current measures tend to be outcome rather than input
indicators. A mix is needed to allow an assessment of whether effort today
is enough to meet future targets.
• Timeframes and attribution: The long-term nature of Net Zero policies
means that it will take time for progress to show up in the data. As a range
of factors may influence some metrics, it is also difficult to demonstrate
causality. Better metrics should be developed now to allow future
evaluation to be better.
• Data for sectors at regional and local level: Local authorities need more
support with data collection and metric development to help them build
their own decarbonisation strategies, as well as monitor and evaluate their
own progress to Net Zero.
Industrial Strategy Council: Annual Report
43
While productivity and the traditional economic performance indicators are important
in evaluating the success of the industrial policies, the Council acknowledged the
need to look beyond traditional measures to those more inclusive of the
environmental and social aspects of progress. This included measures on social and
natural capital, well-being impacts, and the distribution of wealth.
The Council has been continuing to develop its thinking on success metrics. In
particular, the Council recognised that a more comprehensive set of metrics are
needed to monitor progress towards Net Zero and to ensure the transition is a
productivity-enhancing and fair one. Box 2 summarises the initial findings from that
project.
While the relationship between economic performance indicators and productivity
impacts are well documented, the link between productivity and other social metrics,
like well-being, are less well understood. At the level of individual firms, experiments
have shown that increased worker happiness is linked with higher productivity, while
higher levels of stress, poor mental and physical health is linked with lower
productivity. At broad regional level, however, areas with high productivity, like
London, tend to have the lowest average wellbeing and vice versa. There is a gap in
the evidence to link these disparate findings. To address this, the Council has a
tendered project being conducted by Frontier Economics to undertake econometric
analysis of ONS data to better understand the relationship between wellbeing and
productivity. The project will link household survey data, that includes measures of
wellbeing, with business surveys, that can be used to measure productivity. The
project will attempt to quantify the link between productivity and wellbeing at the
sector level within Travel to Work Areas. This work will be published in due course.
Skills
The Council’s Skills insight project evaluated the key challenges facing the UK skills
landscape and the extent to which policies in the Industrial Strategy addressed them,
based on the best available evidence and independent policy analysis. The Council’s
work focused on future UK skills needs and what might be needed to close predicted
future skills gaps.
UK Skills Mismatch 2030
The first paper was completed in collaboration with McKinsey Global Institute. In it
the Council analysed the extent of the skills mismatch in the UK workforce in 2030.
The report used an innovative methodology to model future skills needs of the UK
economy. It highlighted the scale of the potential future skills gap, finding that by
2030, 7 million additional workers (or 20% of the current labour market) could be
under-skilled for their job requirements.

Industrial Strategy Council: Annual Report
44
It also drew attention to the biggest skills challenge of the next decade – basic digital
skills – pointing out that up to two-thirds of the workforce could face some level of
under-skilling. Management skills were also highlighted as a significant skills gap.
Rising to the UK’s Skills Challenges
The second paper set out the policy challenge to address those skills gaps. The
report stressed the need to step up employer investment in training, the crucial role
of managers in skills development, the significance of strategic local partnerships in
skills policy, and the need to create a positive lifelong learning culture.
Places
The Places Insight Project has significantly contributed to the evidence base around
places and Levelling Up. Since the establishment of the Council, four research
reports have been published, all of which have important implications for the
Government’s Levelling Up agenda.
UK Regional Productivity Differences: An Evidence Review
The first paper highlighted that differences in productivity across UK regions are
large, in absolute terms and by international standards, and are longstanding. Highly
productive regions tend to out-perform low-productivity regions along a number of
dimensions – from the skills and health of the workforce to the quality of local
institutions and infrastructures.
Implications for policy:
• Longer-term certainty – removing the tendency to abolish and recreate
regional policy
• Foster local growth strategies that employ a broad approach
• Keep the spotlight on places whose productivity levels and growth rates are
well below the national average
Understanding the policy-making processes behind local growth strategies in
England
The second report provided insight into the policy-making processes behind Local
Industrial Strategies (LISs), a key commitment in the Government’s 2017 national
Industrial Strategy. The paper demonstrates that there is value in the development of
industrial policy at the local level through Local Enterprise Partnership and Mayoral
Combined Authorities, to bring together stakeholders constructively to agree on local
priorities based on evidence.

Industrial Strategy Council: Annual Report
45
Implications for policy:
• Better communication and understanding between central government and
localities is required to improve policies and make them longer-term. The
research also emphasises the importance of transparency and candid
communication on how political uncertainty influences central policymaking.
• Regional disparities are not only visible in productivity figures, but also in
Local Enterprise Partnership capacity. There is a need to level up not only
places but also their institutions.
• Access to sub-regional data needs to be improved and monitoring and
evaluation of policies should be made a priority.
What does it take to “level up” places?: Evidence from international
experience
This research identified six “foundations” for levelling up based on four international
case studies: scale and longevity of investments, collaboration, making areas
attractive places to live, the role of universities and innovation, digital and transport
infrastructure, skills and supporting future sectors. The foundations are cross-cutting
and underpin local economic growth and all of them need to be addressed to level
up places.
Implications for Levelling Up:
• Vision and leadership – Levelling Up is possible, but it requires a clear vision,
strong local leadership and appropriate powers.
• Longevity and scale – Levelling Up requires time and cross-party consensus
on key policies.
• People in places – inter-group inequalities are more challenging to address
than inter-regional inequalities. Policy makers should carefully consider
potential effects of displacement and gentrification.
• No size fits all and no single policy is enough – there is no single “silver bullet”
policy and place-specific strategies are needed to effectively drive local
economic growth in different contexts.
Devolution and governance structures in the UK67
Shortly after this Annual Report, the Council will publish a research paper on Local
Governance Structures and Devolution in the UK. It will look at the current state of
local governance and the successful elements of different governance
arrangements.
67 The report will be published on 31 March 2021 here www.industrialstrategycouncil.org/places-insight-project

Industrial Strategy Council: Annual Report
46
Universities and Colleges and the Industrial Strategy
Universities and Colleges and the Industrial Strategy: Exploring data on
knowledge exchange, research and skills
The Council sought to highlight the role of the higher education sector in creating
prosperity in the UK at both national and local levels. In collaboration with
Universities UK, the Council undertook a data exploration project to map the
contribution that further and higher education institutions make to the UK economy.
The project aimed to provide easier access to data which can be used to measure
and monitor the key aspects of the relationship between higher education and the
wider economy. It also set out to provide a data tool (see the ‘Visualisations’ section
of the report here) that would allow the wider public to access and use this data more
easily.
The project’s findings highlighted the scale of the contribution of the higher education
sector to the economy. For example, it showed that university-owned spin-outs (firms
using university-developed ideas) generated £1.4 billion across the UK in 2018/19. It
also pointed to some less well-known facts. It highlighted that teaching-led
universities outperform the research-led ones in start-up generation, and that the
correlation between university funding and their contribution to the economy (based
on different metrics) is not clear.
Sectors
The Council’s sectors project undertook a comprehensive review of UK and
international evidence to shed light on what makes an effective and successful
sectoral strategy.
The Sectoral Landscape – an evidence review
The first paper set out the broad trends in the sectoral composition of the UK
economy. It aimed to establish a robust evidence base on which the UK’s selective
policy interventions can be developed and assessed.
The research highlighted the heterogeneity of the UK’s sectoral landscape, the need
for both focus and versatility of sectoral policies, and the importance of designing
interventions for service industries.
Effective Policy Approaches to Sectoral Issues
To help inform and improve future policy the second paper set out principles for
successful design and implementation of sector support policies. The paper showed
that industry support is now a common practice in key developed economies and
called for an ambitious, strategic, and far-sighted sectoral strategy in the UK.

Industrial Strategy Council: Annual Report
47
The Council argued that targeted sectoral policy was needed to shore up the
economy in the UK, in the aftermath of the Covid crisis, and to maintain its long-term
competitiveness. The report pointed to the need for government to engage in both
‘defensive’ and ‘strategic’ sectoral policies.
It also highlighted that the clarity on what government aims to achieve with each
sectoral intervention, and sufficient scale and longevity are the key ingredients of a
successful policy. The reports argued that governments need in-depth knowledge of
individual industries to tailor interventions to their specific needs. It also flagged that
high-quality service-sector interventions will become increasingly important in future.
Finally, it made suggestions about how the UK’s current approach to sectoral policy
could be improved.
Clean Growth
The Clean Growth insight project set out to evaluate the role of industrial polices in
delivering a productivity enhancing, inclusive, transition to Net Zero.
Developing greener supply chains
This was published in January 2021. It explores the challenges and opportunities in
developing clean, resilient, and competitive supply chains. The paper highlighted that
despite the positive developments and opportunities, progress is not being made fast
enough in making supply chains greener. A three-minute animation was also
published for this release.