annual report - tundra fonder€¦ · · 2017-04-28prevail. the board of directors and the ceo of...
TRANSCRIPT
Annual Report
Tundra Frontier Opportunities Fund
2016-01-01 - 2016-12-31
Tundra Frontier Opportunities Fund 1 515602-4803
Management Report This is a translated copy from the Swedish original. If any conflict occurs in the translation the Swedish will prevail. The Board of Directors and the CEO of Tundra Fonder AB, 556838-6303, hereby submit the Annual Report for the period 2016-01-01 - 2016-12-31 on Tundra Frontier Opportunities Fund, 515602-4803. The fund’s performance The fund rose by 14.55 percent in 2016. Benchmark MSCI Frontier Markets excluding the GCC countries net (SEK) rose by 10.61 percent during the same period. The fund’s net assets development Assets under management at December 31, 2016 amounted to SEK 439 million, which represents an increase of SEK 94 million, compared with SEK 345 million at December 31, 2015. Value of issued fund shares amounted to SEK 143 million and redemptions amounted to SEK 100 million. Net inflows to the fund during the period amounted to SEK 43 million. Market development Frontier Markets excluding the Gulf countries rose 10.61 percent in SEK during the year. Continued risk
aversion towards emerging and frontier markets affected the asset class during the year, which meant
continuing outflows from foreign investors during 2016. The market however bottomed out already in January.
It was domestic investors’ net buying that drove markets higher, despite continued net selling by foreign
investors. Among individual markets Pakistan and Morocco excelled with returns of about 50 percent. In
Pakistan higher economic activity spurred optimism among local investors who, despite significant net selling
from foreigners, were significant net buyers in the market. Especially the second half of the year was
surprisingly strong given that foreign investors massively sold down their positions towards the end of 2016.
Morocco benefited from the fact that global investors sought a safer market in Africa as Nigeria and Kenya had
a challenging year. The dollar continued strengthening against the Swedish krona and contributed about 7
percent to the absolute market returns during the year.
Fund management and outlook The fund did relatively well and again managed to deliver a return that exceeded the benchmark index by
nearly 4 percentage points. The fund's underweight and stock selection in Nigeria was the single most
important reason for the outperformance. Further, the fund's overweight in Asia as well as stock selection in
the region contributed to the positive relative performance. The fund's stock picking in Vietnam worked
particularly well during 2016. Towards the end of the year, Egypt devalued its currency by nearly 50 percent.
After the devaluation the fund chose to enter the Egyptian equity which thus is a new market in the fund going
into 2017. After two difficult years for frontier markets with large outflows from foreign investors, we believe
the time is approaching for a more constructive year and we are relatively optimistic for 2017.
Objectives and Investment Policy The fund is actively managed to create a financial exposure to the economic development of Frontier markets excluding the Gulf countries and to deliver as high return to unitholders as possible with respect to the fund's risk level. Risks in the fund on the balance day The fund has a significant underweight in Nigeria and a significant overweight in oil-importing countries such as Pakistan, Bangladesh and Sri Lanka, which, in the event that oil prices would suddenly strengthened could greatly affect the relative performance negatively. The fund does not hedge its holdings to currency movements which may affect returns. Derivatives According to the Fund rules The Fund have the possibility to trade options, futures and similar financial instruments, as well as the possibility to lend securities. The Fund may also, in accordance with current regulations, use other techniques and instruments in the fund management of the Fund. The Fund has not used any of these possibilities during the period. To calculate the total exposure of the Fund applies a risk assessment method, the so-called commitment approach on derivative instruments. This means that any
Tundra Frontier Opportunities Fund 2 515602-4803
derivative position is converted into the equivalent position in the underlying asset. This asset has the similar value as if the derivative position was owned directly.
Tundra Frontier Opportunities Fund 3 515602-4803
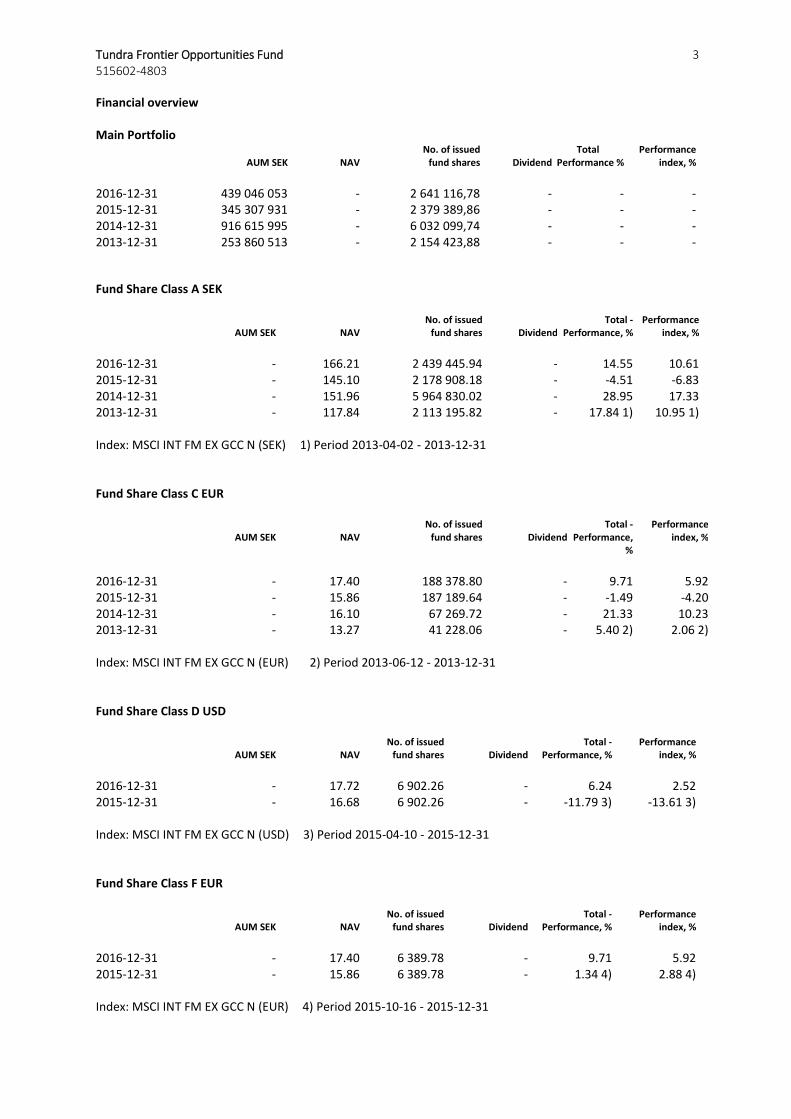
Financial overview Main Portfolio No. of issued Total Performance AUM SEK NAV fund shares Dividend Performance % index, %
2016-12-31 439 046 053 - 2 641 116,78 - - - 2015-12-31 345 307 931 - 2 379 389,86 - - - 2014-12-31 916 615 995 - 6 032 099,74 - - - 2013-12-31 253 860 513 - 2 154 423,88 - - -
Fund Share Class A SEK No. of issued Total - Performance AUM SEK NAV fund shares Dividend Performance, % index, %
2016-12-31 - 166.21 2 439 445.94 - 14.55 10.61 2015-12-31 - 145.10 2 178 908.18 - -4.51 -6.83 2014-12-31 - 151.96 5 964 830.02 - 28.95 17.33 2013-12-31 - 117.84 2 113 195.82 - 17.84 1) 10.95 1) Index: MSCI INT FM EX GCC N (SEK) 1) Period 2013-04-02 - 2013-12-31 Fund Share Class C EUR No. of issued Total - Performance AUM SEK NAV fund shares Dividend Performance,
% index, %
2016-12-31 - 17.40 188 378.80 - 9.71 5.92 2015-12-31 - 15.86 187 189.64 - -1.49 -4.20 2014-12-31 - 16.10 67 269.72 - 21.33 10.23 2013-12-31 - 13.27 41 228.06 - 5.40 2) 2.06 2) Index: MSCI INT FM EX GCC N (EUR) 2) Period 2013-06-12 - 2013-12-31 Fund Share Class D USD
No. of issued Total - Performance AUM SEK NAV fund shares Dividend Performance, % index, %
2016-12-31 - 17.72 6 902.26 - 6.24 2.52 2015-12-31 - 16.68 6 902.26 - -11.79 3) -13.61 3) Index: MSCI INT FM EX GCC N (USD) 3) Period 2015-04-10 - 2015-12-31 Fund Share Class F EUR
No. of issued Total - Performance AUM SEK NAV fund shares Dividend Performance, % index, %
2016-12-31 - 17.40 6 389.78 - 9.71 5.92 2015-12-31 - 15.86 6 389.78 - 1.34 4) 2.88 4) Index: MSCI INT FM EX GCC N (EUR) 4) Period 2015-10-16 - 2015-12-31
Tundra Frontier Opportunities Fund 4 515602-4803
Key performance indicators
Fund Share Class A SEK
Fund Share Class C EUR
Fund Share Class D USD
Fund Share Class F EUR
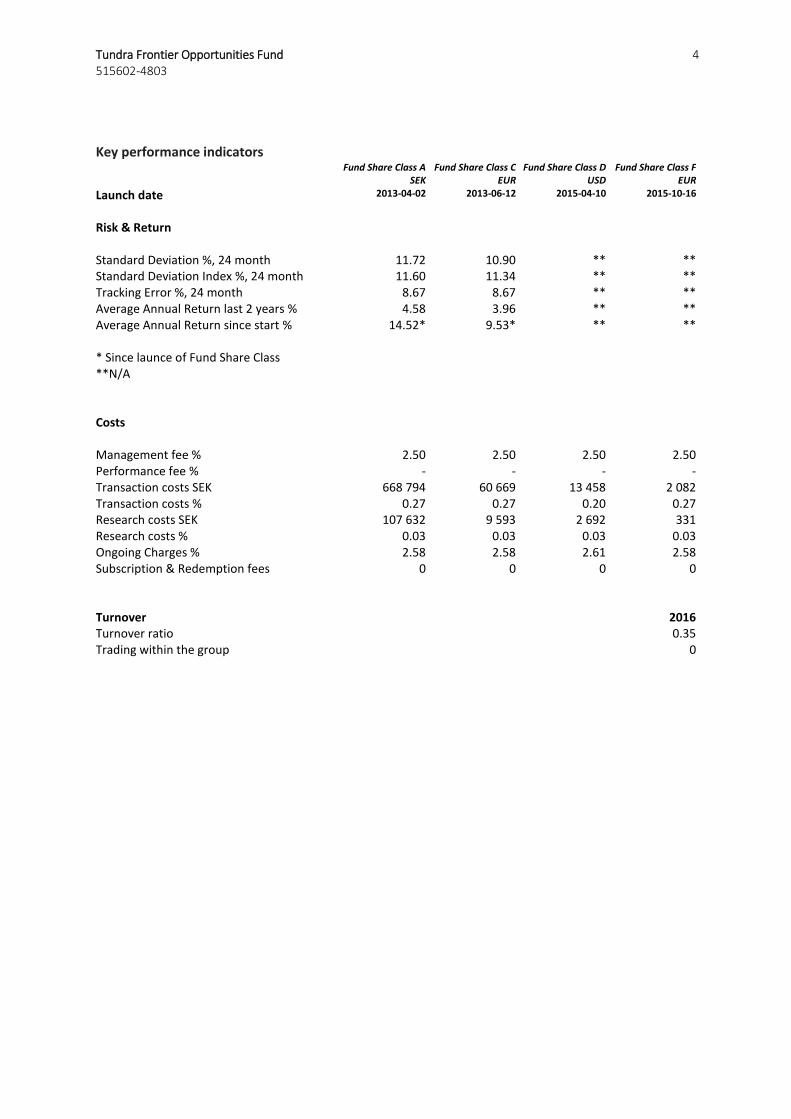
Launch date 2013-04-02 2013-06-12 2015-04-10 2015-10-16
Risk & Return Standard Deviation %, 24 month 11.72 10.90 ** ** Standard Deviation Index %, 24 month 11.60 11.34 ** ** Tracking Error %, 24 month 8.67 8.67 ** ** Average Annual Return last 2 years % 4.58 3.96 ** ** Average Annual Return since start % 14.52* 9.53* ** ** * Since launce of Fund Share Class **N/A
Costs Management fee % 2.50 2.50 2.50 2.50 Performance fee % - - - - Transaction costs SEK 668 794 60 669 13 458 2 082 Transaction costs % 0.27 0.27 0.20 0.27 Research costs SEK 107 632 9 593 2 692 331 Research costs % 0.03 0.03 0.03 0.03 Ongoing Charges % 2.58 2.58 2.61 2.58 Subscription & Redemption fees 0 0 0 0
Turnover 2016 Turnover ratio 0.35 Trading within the group 0
Tundra Frontier Opportunities Fund 5 515602-4803
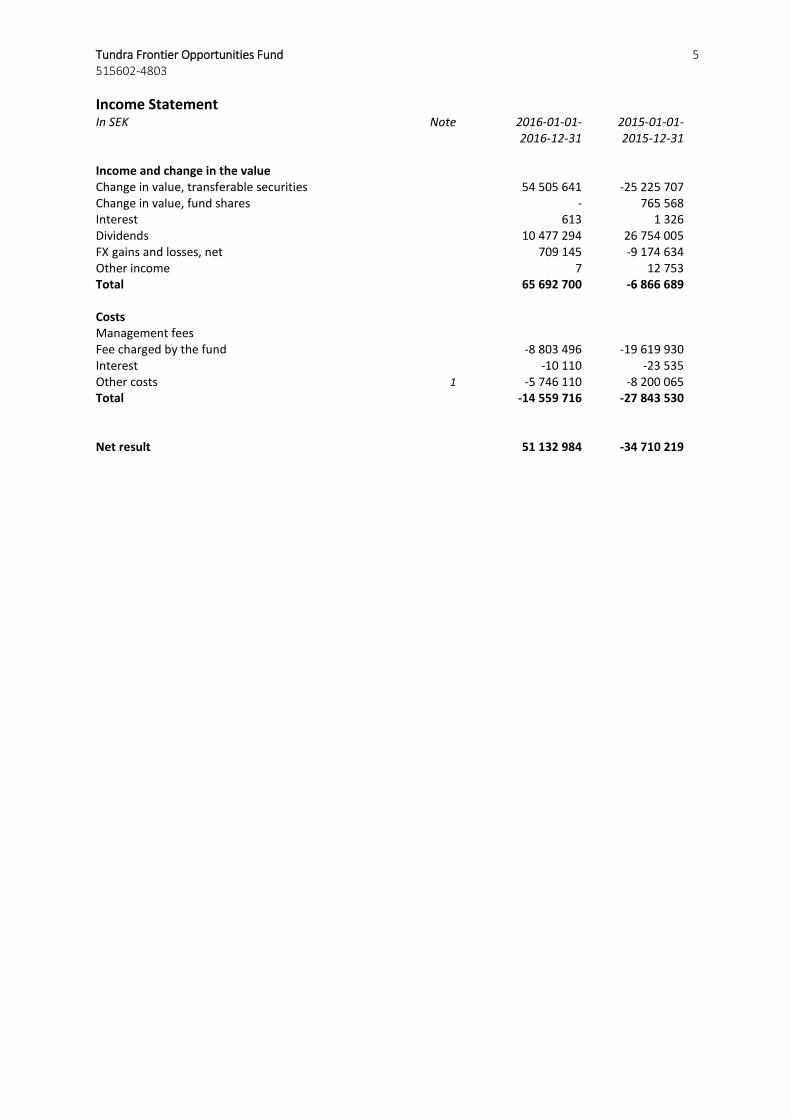
Income Statement In SEK Note 2016-01-01- 2015-01-01- 2016-12-31 2015-12-31 Income and change in the value Change in value, transferable securities 54 505 641 -25 225 707 Change in value, fund shares - 765 568 Interest 613 1 326 Dividends 10 477 294 26 754 005 FX gains and losses, net 709 145 -9 174 634 Other income 7 12 753 Total 65 692 700 -6 866 689 Costs Management fees Fee charged by the fund -8 803 496 -19 619 930 Interest -10 110 -23 535 Other costs 1 -5 746 110 -8 200 065 Total -14 559 716 -27 843 530 Net result 51 132 984 -34 710 219
Tundra Frontier Opportunities Fund 6 515602-4803
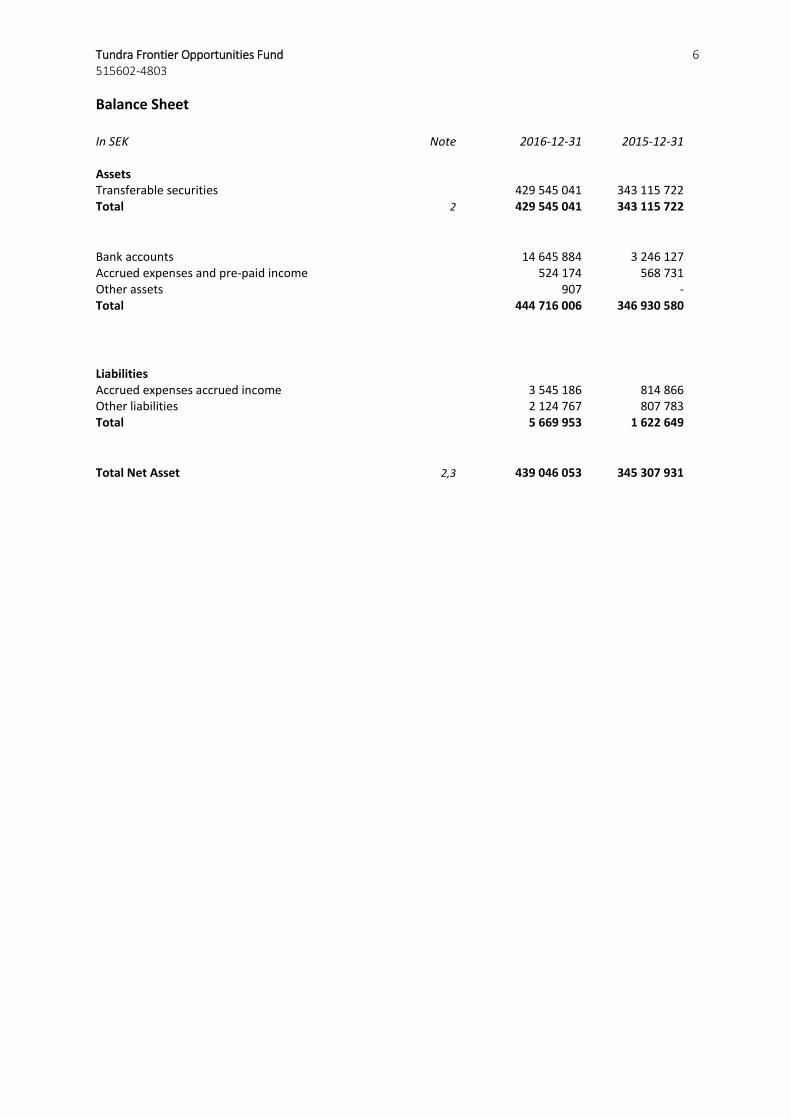
Balance Sheet In SEK Note 2016-12-31 2015-12-31 Assets Transferable securities 429 545 041 343 115 722 Total 2 429 545 041 343 115 722
Bank accounts 14 645 884 3 246 127 Accrued expenses and pre-paid income 524 174 568 731 Other assets 907 - Total 444 716 006 346 930 580
Liabilities Accrued expenses accrued income 3 545 186 814 866 Other liabilities 2 124 767 807 783 Total 5 669 953 1 622 649
Total Net Asset 2,3 439 046 053 345 307 931
Tundra Frontier Opportunities Fund 7 515602-4803
Accounting principles and valuation of financial instruments Accounting principles The fund applies the Mutual Funds Act, 2004: 46 and the Financial Supervisory Authority of accounting for mutual funds 2013:9 and follows the Swedish Investment Fund Associations guidelines. Valuation of financial instruments The financial instruments, are valued at market value according to the following order. 1. The financial instruments traded in an active market will be valued on the closing price at the balance sheet date if it is not a trading day, the most recent trading day prior to the closing date. 2. If the financial instrument is not traded in an active market, the market value is derived from information from similar transactions that have taken place under market conditions. 3. Unless method 1 or 2 can be used, or misleading the market value determined by an established market valuation. Key Figures The fund follows the Swedish Investment Fund Associations guidelines of key performance indicators.
Tundra Frontier Opportunities Fund 8 515602-4803
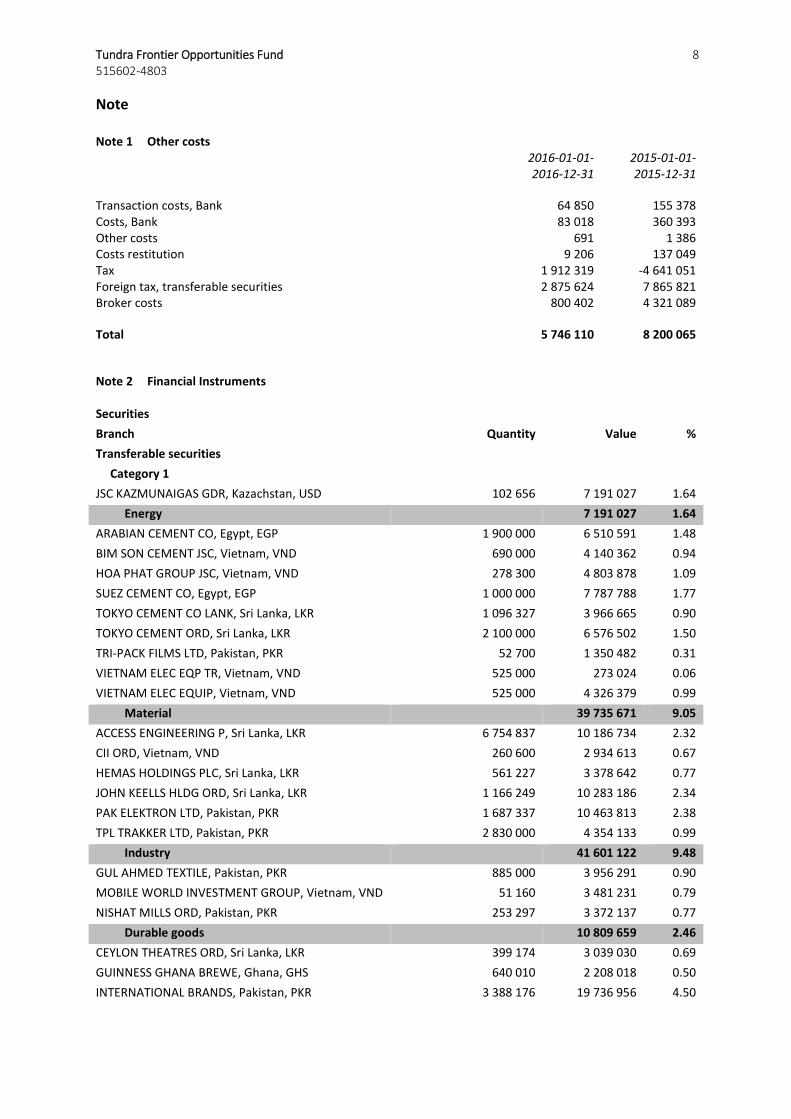
Note Note 1 Other costs 2016-01-01- 2015-01-01- 2016-12-31 2015-12-31
Transaction costs, Bank 64 850 155 378 Costs, Bank 83 018 360 393 Other costs 691 1 386 Costs restitution 9 206 137 049 Tax 1 912 319 -4 641 051 Foreign tax, transferable securities 2 875 624 7 865 821 Broker costs 800 402 4 321 089
Total 5 746 110 8 200 065 Note 2 Financial Instruments Securities
Branch Quantity Value %
Transferable securities
Category 1
JSC KAZMUNAIGAS GDR, Kazachstan, USD 102 656 7 191 027 1.64
Energy 7 191 027 1.64
ARABIAN CEMENT CO, Egypt, EGP 1 900 000 6 510 591 1.48
BIM SON CEMENT JSC, Vietnam, VND 690 000 4 140 362 0.94
HOA PHAT GROUP JSC, Vietnam, VND 278 300 4 803 878 1.09
SUEZ CEMENT CO, Egypt, EGP 1 000 000 7 787 788 1.77
TOKYO CEMENT CO LANK, Sri Lanka, LKR 1 096 327 3 966 665 0.90
TOKYO CEMENT ORD, Sri Lanka, LKR 2 100 000 6 576 502 1.50
TRI-PACK FILMS LTD, Pakistan, PKR 52 700 1 350 482 0.31
VIETNAM ELEC EQP TR, Vietnam, VND 525 000 273 024 0.06
VIETNAM ELEC EQUIP, Vietnam, VND 525 000 4 326 379 0.99
Material 39 735 671 9.05
ACCESS ENGINEERING P, Sri Lanka, LKR 6 754 837 10 186 734 2.32
CII ORD, Vietnam, VND 260 600 2 934 613 0.67
HEMAS HOLDINGS PLC, Sri Lanka, LKR 561 227 3 378 642 0.77
JOHN KEELLS HLDG ORD, Sri Lanka, LKR 1 166 249 10 283 186 2.34
PAK ELEKTRON LTD, Pakistan, PKR 1 687 337 10 463 813 2.38
TPL TRAKKER LTD, Pakistan, PKR 2 830 000 4 354 133 0.99
Industry 41 601 122 9.48
GUL AHMED TEXTILE, Pakistan, PKR 885 000 3 956 291 0.90
MOBILE WORLD INVESTMENT GROUP, Vietnam, VND 51 160 3 481 231 0.79
NISHAT MILLS ORD, Pakistan, PKR 253 297 3 372 137 0.77
Durable goods 10 809 659 2.46
CEYLON THEATRES ORD, Sri Lanka, LKR 399 174 3 039 030 0.69
GUINNESS GHANA BREWE, Ghana, GHS 640 010 2 208 018 0.50
INTERNATIONAL BRANDS, Pakistan, PKR 3 388 176 19 736 956 4.50
Tundra Frontier Opportunities Fund 9 515602-4803
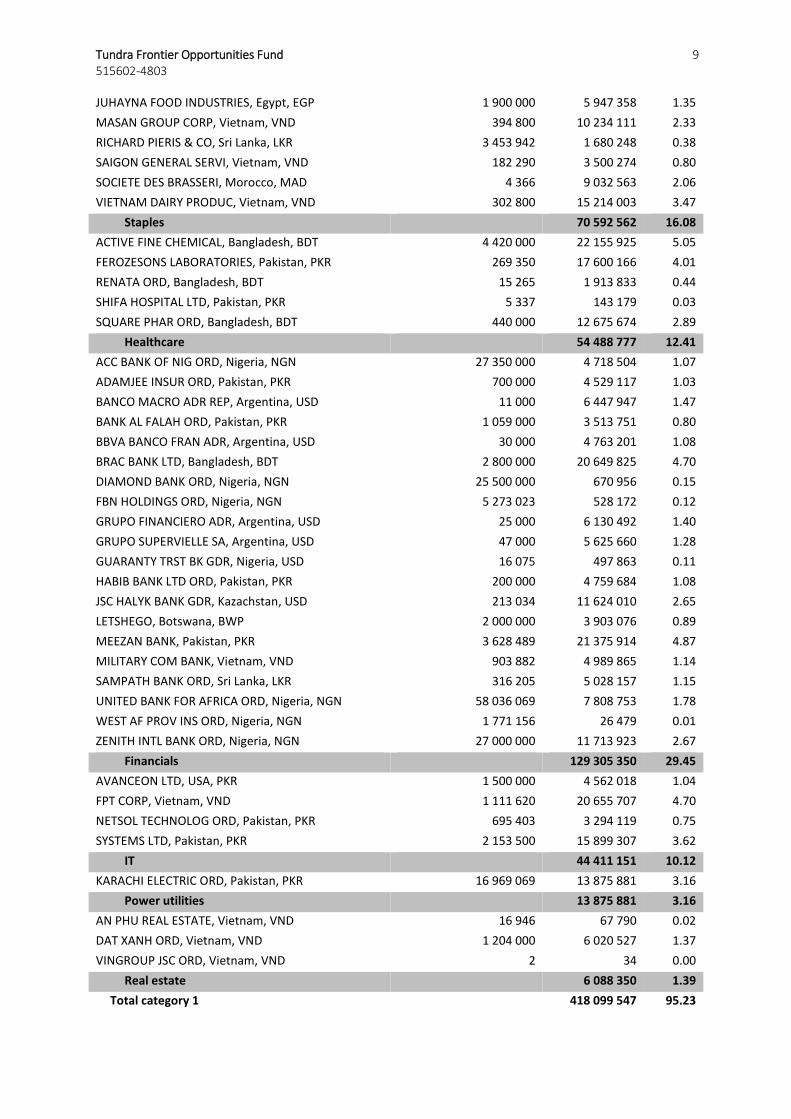
JUHAYNA FOOD INDUSTRIES, Egypt, EGP 1 900 000 5 947 358 1.35
MASAN GROUP CORP, Vietnam, VND 394 800 10 234 111 2.33
RICHARD PIERIS & CO, Sri Lanka, LKR 3 453 942 1 680 248 0.38
SAIGON GENERAL SERVI, Vietnam, VND 182 290 3 500 274 0.80
SOCIETE DES BRASSERI, Morocco, MAD 4 366 9 032 563 2.06
VIETNAM DAIRY PRODUC, Vietnam, VND 302 800 15 214 003 3.47
Staples 70 592 562 16.08
ACTIVE FINE CHEMICAL, Bangladesh, BDT 4 420 000 22 155 925 5.05
FEROZESONS LABORATORIES, Pakistan, PKR 269 350 17 600 166 4.01
RENATA ORD, Bangladesh, BDT 15 265 1 913 833 0.44
SHIFA HOSPITAL LTD, Pakistan, PKR 5 337 143 179 0.03
SQUARE PHAR ORD, Bangladesh, BDT 440 000 12 675 674 2.89
Healthcare 54 488 777 12.41
ACC BANK OF NIG ORD, Nigeria, NGN 27 350 000 4 718 504 1.07
ADAMJEE INSUR ORD, Pakistan, PKR 700 000 4 529 117 1.03
BANCO MACRO ADR REP, Argentina, USD 11 000 6 447 947 1.47
BANK AL FALAH ORD, Pakistan, PKR 1 059 000 3 513 751 0.80
BBVA BANCO FRAN ADR, Argentina, USD 30 000 4 763 201 1.08
BRAC BANK LTD, Bangladesh, BDT 2 800 000 20 649 825 4.70
DIAMOND BANK ORD, Nigeria, NGN 25 500 000 670 956 0.15
FBN HOLDINGS ORD, Nigeria, NGN 5 273 023 528 172 0.12
GRUPO FINANCIERO ADR, Argentina, USD 25 000 6 130 492 1.40
GRUPO SUPERVIELLE SA, Argentina, USD 47 000 5 625 660 1.28
GUARANTY TRST BK GDR, Nigeria, USD 16 075 497 863 0.11
HABIB BANK LTD ORD, Pakistan, PKR 200 000 4 759 684 1.08
JSC HALYK BANK GDR, Kazachstan, USD 213 034 11 624 010 2.65
LETSHEGO, Botswana, BWP 2 000 000 3 903 076 0.89
MEEZAN BANK, Pakistan, PKR 3 628 489 21 375 914 4.87
MILITARY COM BANK, Vietnam, VND 903 882 4 989 865 1.14
SAMPATH BANK ORD, Sri Lanka, LKR 316 205 5 028 157 1.15
UNITED BANK FOR AFRICA ORD, Nigeria, NGN 58 036 069 7 808 753 1.78
WEST AF PROV INS ORD, Nigeria, NGN 1 771 156 26 479 0.01
ZENITH INTL BANK ORD, Nigeria, NGN 27 000 000 11 713 923 2.67
Financials 129 305 350 29.45
AVANCEON LTD, USA, PKR 1 500 000 4 562 018 1.04
FPT CORP, Vietnam, VND 1 111 620 20 655 707 4.70
NETSOL TECHNOLOG ORD, Pakistan, PKR 695 403 3 294 119 0.75
SYSTEMS LTD, Pakistan, PKR 2 153 500 15 899 307 3.62
IT 44 411 151 10.12
KARACHI ELECTRIC ORD, Pakistan, PKR 16 969 069 13 875 881 3.16
Power utilities 13 875 881 3.16
AN PHU REAL ESTATE, Vietnam, VND 16 946 67 790 0.02
DAT XANH ORD, Vietnam, VND 1 204 000 6 020 527 1.37
VINGROUP JSC ORD, Vietnam, VND 2 34 0.00
Real estate 6 088 350 1.39
Total category 1 418 099 547 95.23
Tundra Frontier Opportunities Fund 10 515602-4803
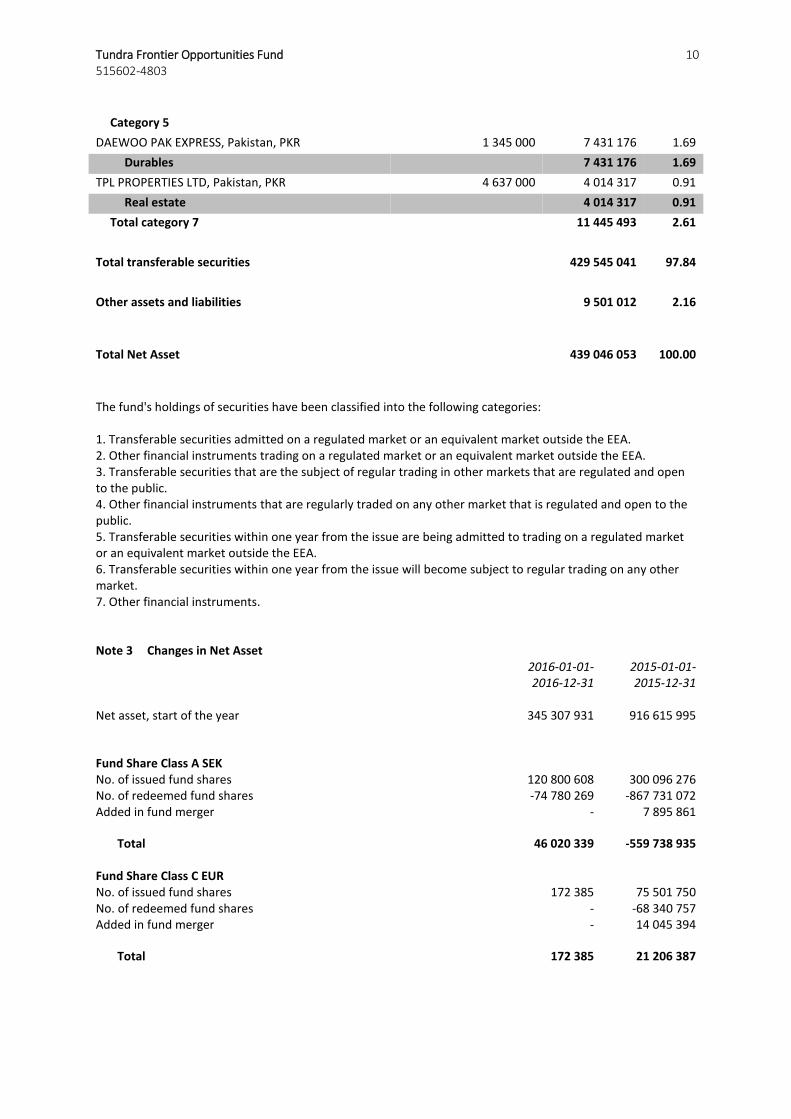
Category 5
DAEWOO PAK EXPRESS, Pakistan, PKR 1 345 000 7 431 176 1.69
Durables 7 431 176 1.69
TPL PROPERTIES LTD, Pakistan, PKR 4 637 000 4 014 317 0.91
Real estate 4 014 317 0.91
Total category 7 11 445 493 2.61
Total transferable securities 429 545 041 97.84
Other assets and liabilities
9 501 012 2.16
Total Net Asset 439 046 053 100.00
The fund's holdings of securities have been classified into the following categories: 1. Transferable securities admitted on a regulated market or an equivalent market outside the EEA. 2. Other financial instruments trading on a regulated market or an equivalent market outside the EEA. 3. Transferable securities that are the subject of regular trading in other markets that are regulated and open to the public. 4. Other financial instruments that are regularly traded on any other market that is regulated and open to the public. 5. Transferable securities within one year from the issue are being admitted to trading on a regulated market or an equivalent market outside the EEA. 6. Transferable securities within one year from the issue will become subject to regular trading on any other market. 7. Other financial instruments. Note 3 Changes in Net Asset 2016-01-01- 2015-01-01- 2016-12-31 2015-12-31 Net asset, start of the year 345 307 931 916 615 995
Fund Share Class A SEK No. of issued fund shares 120 800 608 300 096 276 No. of redeemed fund shares -74 780 269 -867 731 072 Added in fund merger - 7 895 861
Total 46 020 339 -559 738 935 Fund Share Class C EUR No. of issued fund shares 172 385 75 501 750 No. of redeemed fund shares - -68 340 757 Added in fund merger - 14 045 394
Total 172 385 21 206 387
Tundra Frontier Opportunities Fund 11 515602-4803
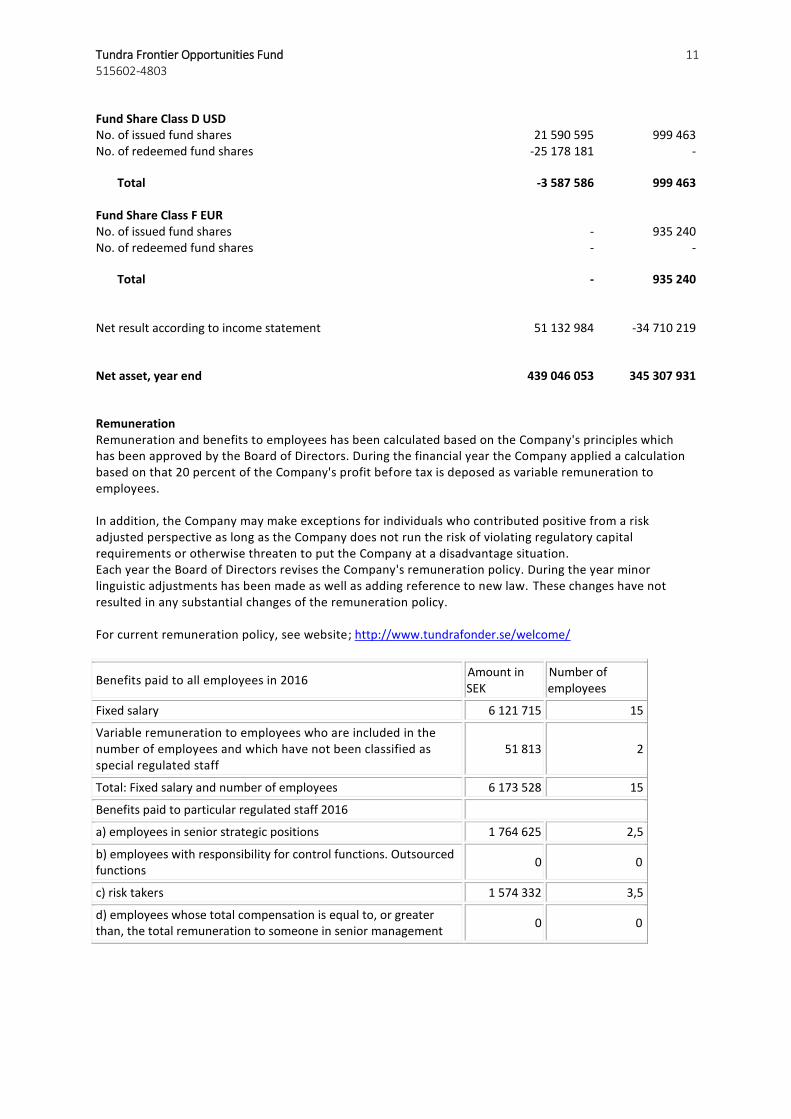
Fund Share Class D USD No. of issued fund shares 21 590 595 999 463 No. of redeemed fund shares -25 178 181 -
Total -3 587 586 999 463 Fund Share Class F EUR No. of issued fund shares - 935 240 No. of redeemed fund shares - -
Total - 935 240 Net result according to income statement 51 132 984 -34 710 219
Net asset, year end 439 046 053 345 307 931
Remuneration Remuneration and benefits to employees has been calculated based on the Company's principles which has been approved by the Board of Directors. During the financial year the Company applied a calculation based on that 20 percent of the Company's profit before tax is deposed as variable remuneration to employees. In addition, the Company may make exceptions for individuals who contributed positive from a risk adjusted perspective as long as the Company does not run the risk of violating regulatory capital requirements or otherwise threaten to put the Company at a disadvantage situation. Each year the Board of Directors revises the Company's remuneration policy. During the year minor linguistic adjustments has been made as well as adding reference to new law. These changes have not resulted in any substantial changes of the remuneration policy. For current remuneration policy, see website; http://www.tundrafonder.se/welcome/
Benefits paid to all employees in 2016 Amount in SEK
Number of employees
Fixed salary 6 121 715 15
Variable remuneration to employees who are included in the number of employees and which have not been classified as special regulated staff
51 813 2
Total: Fixed salary and number of employees 6 173 528 15
Benefits paid to particular regulated staff 2016
a) employees in senior strategic positions 1 764 625 2,5
b) employees with responsibility for control functions. Outsourced functions
0 0
c) risk takers 1 574 332 3,5
d) employees whose total compensation is equal to, or greater than, the total remuneration to someone in senior management
0 0