annual report - water corporation
TRANSCRIPT
Working with our customers to lead change
Annual Report
2018
About this report
The 2018 Annual Report is a review of our performance for the financial year ended 30 June 2018.
This report is produced in accordance with the provisions of the Water Corporations Act 1995 and other relevant legislation, which governs our operations.
Provided to the Minister for Water; Fisheries; Forestry; Innovation and ICT; Science the Hon David Kelly MLA, the report is tabled in the Parliament of Western Australia.
The objective of this report is to provide our customers, community, stakeholders, as well as our owner, the Western Australian Government with information about our operational and financial performance and our contribution to the State’s economy for the 2017–18 financial year.
To provide feedback on this report please email [email protected]
Previous annual reports can be found at watercorporation.com.au
For customer enquiries or feedback about our services, visit watercorporation.com.au/contact
ISSN 1447-4212
Contents
Chairman’s report 6
Chief Executive Officer’s year in review 7
Corporate snapshot 8Organisational profile 9
Organisational structure 10
Board profiles 11
Executive summary 13
Key capital projects 15
Financial highlights 16
Operational report 18Providing customer and community value 19
Strengthening and aligning our core business 23
Making WA a great place to live 26
Developing leading edge thinking 29
Recognising innovation and success 31
Creating a strong platform for the future 32
Tap In 33Our Tap In Insights 34
Corporate governance report 41Corporate governance report 42
Director’s report 47
Performance summary 51
Five-year statistical summary 53
Financial report 57Consolidated Statement of Comprehensive Income 59
Consolidated Statement of Financial Position 60
Consolidated Statement of Changes In Equity 61
Consolidated Statement of Cash Flows 63
Notes to the Consolidated Financial Report 64
Directors’ declaration 92
Auditor General’s report 93

Our year at a glance
363 billion litres of water supplied
17,051 kilometres of sewer mains
164billion litres of wastewater collected
2,547 kilometres of drains
34,678 kilometres of water mains
eighty water treatment plants
water pump stations
483
963,035 customer telephone calls answered
2.39 million visitors to our website
2,746 employees
4 WATER CORPORATION 2018 Annual Report
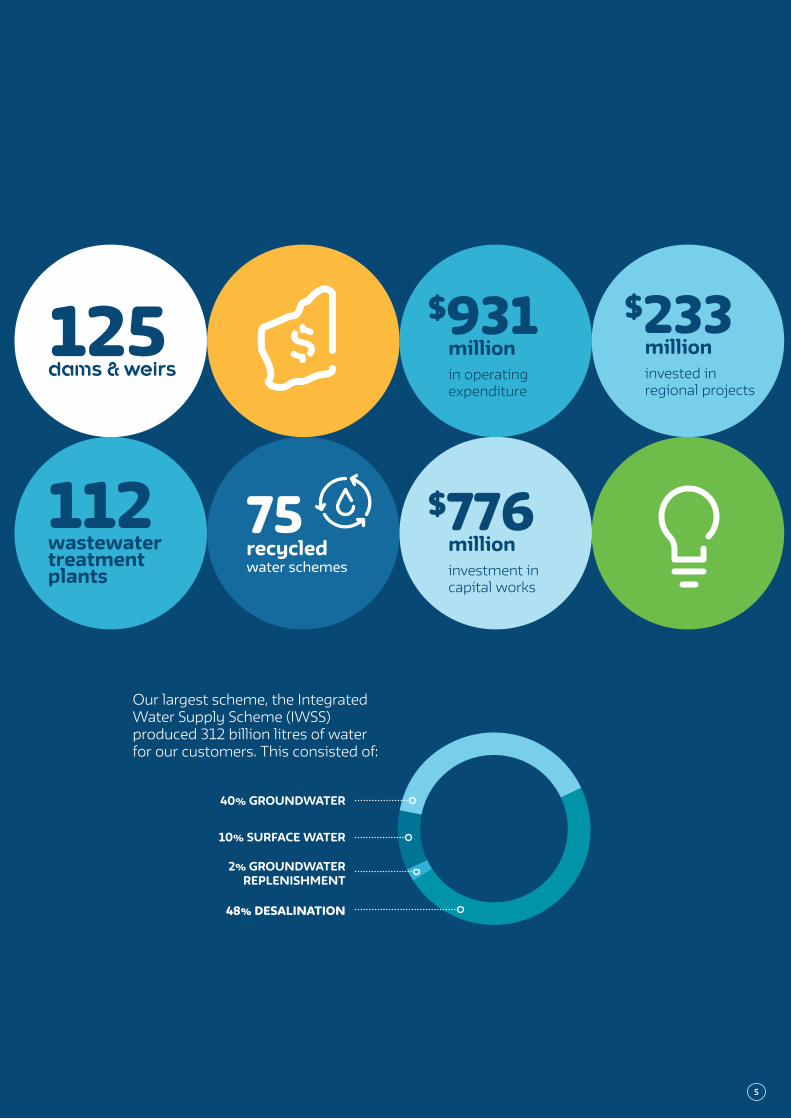
125dams & weirs
75
$�233
million invested in regional projects
recycled water schemes
�776 million investment in capital works
�931million in operating expenditure
112 wastewater treatment plants
Our largest scheme, the Integrated Water Supply Scheme (IWSS) produced 312 billion litres of water for our customers. This consisted of:
48% DESALINATION
40% GROUNDWATER
2% GROUNDWATER REPLENISHMENT
10% SURFACE WATER
5
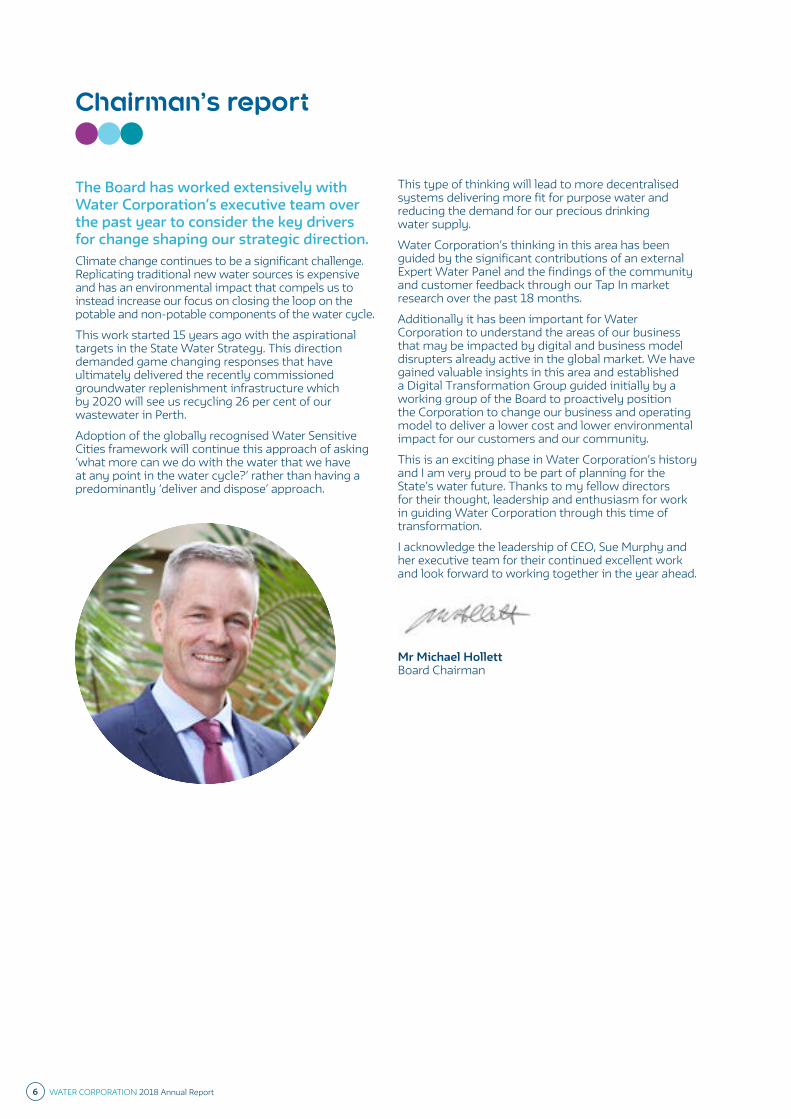
Chairman’s report
The Board has worked extensively with Water Corporation’s executive team over the past year to consider the key drivers for change shaping our strategic direction.Climate change continues to be a significant challenge. Replicating traditional new water sources is expensive and has an environmental impact that compels us to instead increase our focus on closing the loop on the potable and non-potable components of the water cycle.
This work started 15 years ago with the aspirational targets in the State Water Strategy. This direction demanded game changing responses that have ultimately delivered the recently commissioned groundwater replenishment infrastructure which by 2020 will see us recycling 26 per cent of our wastewater in Perth.
Adoption of the globally recognised Water Sensitive Cities framework will continue this approach of asking ‘what more can we do with the water that we have at any point in the water cycle?’ rather than having a predominantly ‘deliver and dispose’ approach.
This type of thinking will lead to more decentralised systems delivering more fit for purpose water and reducing the demand for our precious drinking water supply.
Water Corporation’s thinking in this area has been guided by the significant contributions of an external Expert Water Panel and the findings of the community and customer feedback through our Tap In market research over the past 18 months.
Additionally it has been important for Water Corporation to understand the areas of our business that may be impacted by digital and business model disrupters already active in the global market. We have gained valuable insights in this area and established a Digital Transformation Group guided initially by a working group of the Board to proactively position the Corporation to change our business and operating model to deliver a lower cost and lower environmental impact for our customers and our community.
This is an exciting phase in Water Corporation’s history and I am very proud to be part of planning for the State’s water future. Thanks to my fellow directors for their thought, leadership and enthusiasm for work in guiding Water Corporation through this time of transformation.
I acknowledge the leadership of CEO, Sue Murphy and her executive team for their continued excellent work and look forward to working together in the year ahead.
Mr Michael Hollett Board Chairman
6 WATER CORPORATION 2018 Annual Report
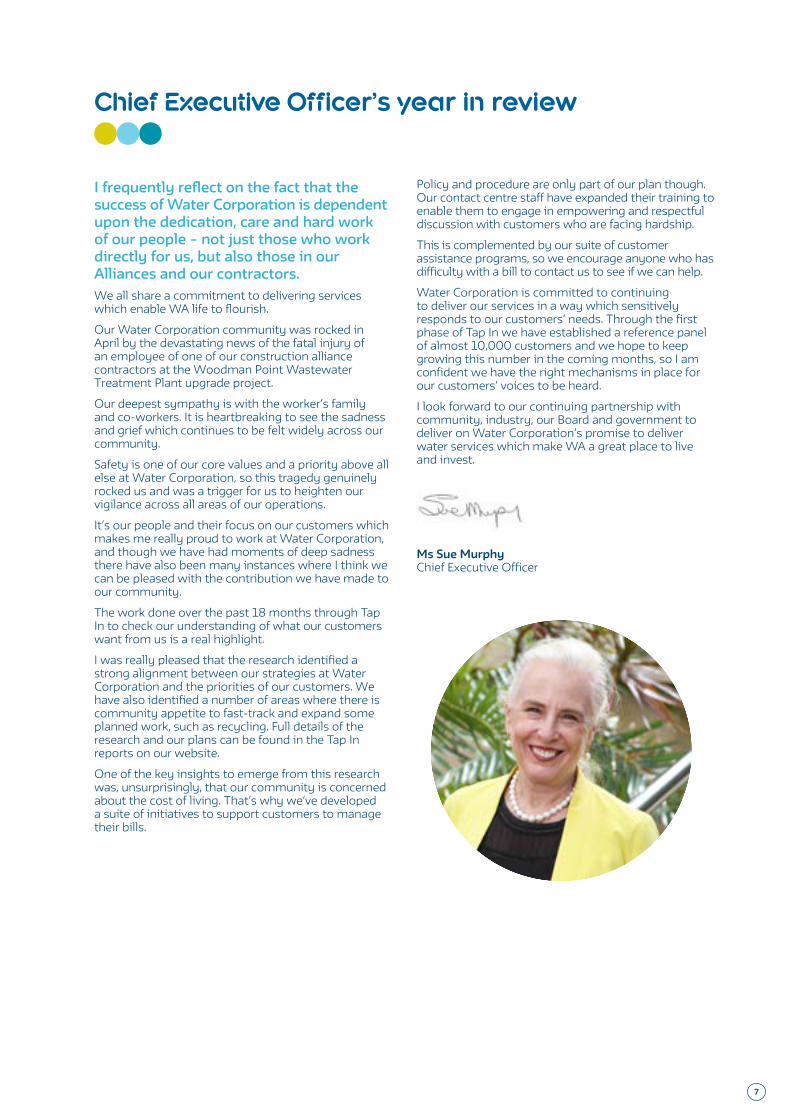
Chief Executive Officer’s year in review
I frequently reflect on the fact that the success of Water Corporation is dependent upon the dedication, care and hard work of our people – not just those who work directly for us, but also those in our Alliances and our contractors.We all share a commitment to delivering services which enable WA life to flourish.
Our Water Corporation community was rocked in April by the devastating news of the fatal injury of an employee of one of our construction alliance contractors at the Woodman Point Wastewater Treatment Plant upgrade project.
Our deepest sympathy is with the worker’s family and co-workers. It is heartbreaking to see the sadness and grief which continues to be felt widely across our community.
Safety is one of our core values and a priority above all else at Water Corporation, so this tragedy genuinely rocked us and was a trigger for us to heighten our vigilance across all areas of our operations.
It’s our people and their focus on our customers which makes me really proud to work at Water Corporation, and though we have had moments of deep sadness there have also been many instances where I think we can be pleased with the contribution we have made to our community.
The work done over the past 18 months through Tap In to check our understanding of what our customers want from us is a real highlight.
I was really pleased that the research identified a strong alignment between our strategies at Water Corporation and the priorities of our customers. We have also identified a number of areas where there is community appetite to fast-track and expand some planned work, such as recycling. Full details of the research and our plans can be found in the Tap In reports on our website.
One of the key insights to emerge from this research was, unsurprisingly, that our community is concerned about the cost of living. That’s why we’ve developed a suite of initiatives to support customers to manage their bills.
Policy and procedure are only part of our plan though. Our contact centre staff have expanded their training to enable them to engage in empowering and respectful discussion with customers who are facing hardship.
This is complemented by our suite of customer assistance programs, so we encourage anyone who has difficulty with a bill to contact us to see if we can help.
Water Corporation is committed to continuing to deliver our services in a way which sensitively responds to our customers’ needs. Through the first phase of Tap In we have established a reference panel of almost 10,000 customers and we hope to keep growing this number in the coming months, so I am confident we have the right mechanisms in place for our customers’ voices to be heard.
I look forward to our continuing partnership with community, industry, our Board and government to deliver on Water Corporation’s promise to deliver water services which make WA a great place to live and invest.
Ms Sue Murphy Chief Executive Officer
7
Corporate snapshot
8 WATER CORPORATION 2018 Annual Report
Organisational profile
Our operation Water Corporation is the principal supplier of water, wastewater, drainage and bulk irrigation services in Western Australia to hundreds of thousands of homes, businesses and farms.
We directly employ more than 2,746 people in our offices in Perth, Bunbury, Albany, Karratha, Geraldton, Northam and Kalgoorlie, and a number of depots, providing a high level of expertise and strong commitment to communities across the State.
We manage $37 billion (replacement value) of assets to deliver water services across the 2.6 million square kilometre expanse of the state, directly and through alliances with the private sector.
Our purpose is to sustainably manage our water services to make WA a great place to live and invest.
Our vision Our vision is where we want to be in the future. This is underpinned by our three pillars of Water Forever, Zero Footprint and Great Place. These pillars are continuously in tension and need to be balanced.
Our valuesGuided by our values, it is our people who enable us to deliver on our purpose and vision.
One Team: We are one team. We work together in the best interests of Water Corporation and the community.
Think Safe, Act Safe: We put safety first in everything we do. We are responsible for ourselves and others.
Customer Focussed: We value our customers. We understand their needs and deliver great services.
Value Every Dollar: We add value to our customers. We manage every hour we work, every dollar we spend.
Future Thinking: We find clever and innovative ways to do things. We plan and deliver for the future.
Take Personal Ownership: We hold ourselves and each other to account. We each take responsibility for our own decisions and actions.
Our environmentWe have a commitment and responsibility to be a leader in ensuring the sustainable future of Western Australia’s water supply. We aim to maximise the re-use of our by-products to reduce our environmental footprint. We are committed to protecting and enhancing the environment.
Our ownerWater Corporation is owned by the Western Australian Government and accountable to the Minister for Water; Fisheries; Forestry; Innovation and ICT; Science the Hon David Kelly MLA, for the delivery of our services. Most of our financial surplus is returned to the State Government as a dividend to contribute to the development of the State, with the remainder reinvested in capital infrastructure.
Our stakeholders Our key stakeholders include relevant State and Australian Government agencies and regulators, Local Government and industry associations. The support and trust of our stakeholders and the broader community is critical to the achievement of our business objectives. We are proactive in ensuring that we engage our stakeholders and the community as we work to effectively manage current and future water services.
Our regulators We deliver water to our customers and dispose of it within conditions set by the Departments of Water and Environmental Regulation, Health, Biodiversity, Conservation and Attractions, and the Environmental Protection Authority. The Economic Regulation Authority monitors our performance against our Water Services Licence. The State Government determines the prices of our regulated services each year through the State Budget process.
Corporate snapshot 9

Organisational structure
Finance and Corporate Services GroupMr Ross Hughes
• Group Finance• Procurement and Property• Risk and Assurance• Strategic Finance
Assets Delivery Group Mr Nick Churchill
• Contracts• Engineering• Project Management
Chairman of Board Mr Michael Hollett
Board of Directors
Minister Hon. David Kelly MLA
Operations GroupMr Mark Leathersich
• Aroona Alliance• Field Services• Goldfields and
Agricultural Region• Great Southern Region• Mid West Region• North West Region• Operations Performance• Perth Region Alliance• Perth Seawater
Desalination Alliance• South West Region• Southern Seawater
Desalination Alliance
Strategy and Stakeholder GroupMr Don Johnston
• Business Improvement• Infrastructure Markets• Legal Services• Media and Government
Relations• Strategy, Policy
and Analytics
Digital Transformation GroupMs Deanne McDonald
• Business and Technology Solutions
• SCADA• FLOWS• Commercial
Management Office
Assets Planning GroupMr Ashley Vincent
• Asset Investment• Asset Investment
Planning Metro• Asset Investment
Planning Regional• Asset Strategy• Development Services
Operations Services GroupDr Steve Capewell
• Aboriginal Affairs• Environment• Operations Centre• People and Capability• Safety and Wellbeing• Water Quality
Chief Executive Officer Ms Sue Murphy
Customer and Community GroupMs Catherine Ferrari
• Contact Centre• Customer and Industry
Partnerships• Customer Billing
and Assurance• Customer Strategy
and Engagement• Internal Communications
10 WATER CORPORATION 2018 Annual Report
Board profiles
Mr Michael HollettChairman GAICD
Mr Michael Hollett has extensive water industry and property development experience, and consults in both business and property development. Mr Hollett is currently Chairman of Ocean Gardens Inc, Director at H&H Development Enterprises Pty Ltd and Director at Kimberley Marine Support Base Pty Ltd. Prior to this, Mr Hollett was the Chief Executive Officer of the National Lifestyle Villages Group and expanded the Group’s delivery of affordable new housing estates, and senior and resource sector accommodation communities across the State and to Victoria. He is a qualified hydrographer and worked in a variety of roles including regional and metropolitan land development, lead new pathways in water recycling, efficiency and strategic planning for Water Corporation and its predecessors from 1982 to 2004.
Appointed 1 January 2012, appointed Chairman 1 January 2017, term expires 31 December 2019.
Chair: Safety and Wellbeing Committee and Remuneration Committee
Ms Sue MurphyChief Executive Officer BEng (Hons), CP Eng, FIE Aust, GAICD
Ms Sue Murphy was appointed Chief Executive Officer of Water Corporation in November 2008. Ms Murphy is a Member of The University of Western Australia Senate and Board Member of The University of WA Business School, Board Member of the Water Services Association of Australia, Board Member of the Fremantle Football Club and Fellow of the Australian Academy of Technological Sciences and Engineering.
Appointed November 2008, term expires 31 December 2018.
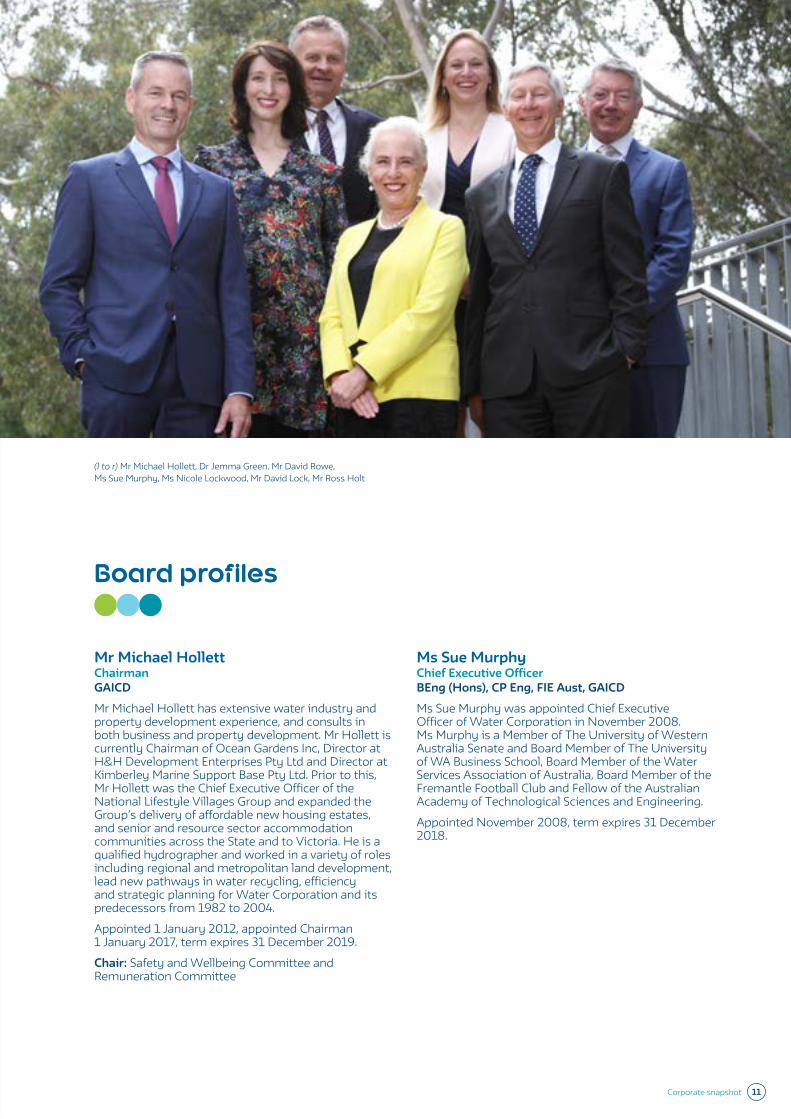
(l to r) Mr Michael Hollett, Dr Jemma Green, Mr David Rowe, Ms Sue Murphy, Ms Nicole Lockwood, Mr David Lock, Mr Ross Holt
Corporate snapshot 11
Mr David Lock Deputy Chairman BComm (UNSW), CA, FAICD
Mr David Lock is the Chairman of Mareterram Limited, a listed agribusiness company. He is also the Chairman of the Western Australia Meat Industry Authority and is a non-executive director of Odeum Produce Pty Limited and Food Fibre and Land International Pty Limited. He is Consultant to the Board of Australian Pork and is a member of the Advisory Council of the Curtin Business School. Mr Lock held Managing Director roles in public and private Australian food and agribusiness companies since 2004, prior to taking on a portfolio career in December 2017. He also held managerial positions with PricewaterhouseCoopers in Australia, Canada and the UK. In 2012, he was named NAB Agribusiness Leader of the Year and in 2013 he won the Australian Export Heroes Award. Mr Lock brings significant finance skills to the Board, as well as a deep understanding of the Australian agribusiness industry. He was previously Chairman of the Food Industry Association of Western Australia.
Appointed 1 January 2014, appointed Deputy Chairman 1 January 2017, term expires 31 December 2019.
Chair: Audit and Risk Committee Member: Remuneration Committee
Mr Ross Holt B. Econs (Hons)
Mr Ross Holt has been an integral part of the WA State Government finance and development landscape for almost 40 years. Previously the Chief Executive Officer of the WA Land Authority (LandCorp), Mr Holt retired in 2014. He is currently the Deputy Chancellor of Murdoch University, Chair of Forest Products Commission, Non-executive Director NS Projects and Chair of Nudge.
Appointed 8 June 2016, term expires 31 December 2018.
Member: Safety & Wellbeing Committee
Ms Nicole Lockwood LLB, BBus Environ, GAICD
Ms Nicole Lockwood is owner and principal of Lockwood Advisory which provides advice to government and industry in the areas of regional development, infrastructure and stakeholder engagement. Prior to the establishment of Lockwood Advisory, she was a Director at KPMG. Ms Lockwood is currently the Independent Chair of the Westport Taskforce, the Commissioner of Tourism WA, Board Member of Infrastructure Australia, Deputy Chairman of Leadership WA, Board Member of Internet of Things Alliance Australia, Chair of the Freights and Logistics Council, Chair of MNG Surveying and the Independent Chair of Sienna Wood JV. Previous Board roles include Pilbara Development Commission, WA Planning Commission and Horizon Power.
Appointed 1 March 2016, term expires 31 December 2020.
Member: Audit & Risk Committee
Mr David Rowe BA Grad AASC, JP, GAICD
Mr David Rowe has worked in executive leadership positions within the property development, construction, health and transport industries throughout Australia and in the Western Australian, Victorian and Commonwealth Governments. He is Chairman of the Ellenbrook Joint Venture, Board Member of the South Metropolitan Health Service and was previously Deputy Chairman of the Western Australian Land Authority (LandCorp) and a Member of the South Metropolitan Health Service Governing Council.
Appointed 1 March 2016, term expires 31 December 2018.
Member: Safety & Wellbeing Committee
Dr Jemma GreenB Comm, (Finance), Murdoch, Post Cert (Cross Sector Partnership) Post Cert (Sustainability) Masters (Sustainability), Cambridge University, PhD (Disruptive Innovation), Curtin University
Dr Jemma Green has extensive experience in risk assessment and advisory, working at the nexus of innovation and finance. She has a particular interest in sustainable finance and economics, and her doctoral research focuses on sustainable cities. Dr Green is a Co-Founder and Chairman of Power Ledger, the Chairman of Climate KIC Australia and an Advisory Board Member of Carbon Tracker.
Appointed 4 July 2017, term expires 31 December 2019.
Member: Audit & Risk Committee
12 WATER CORPORATION 2018 Annual Report
Executive summary
Ms Catherine Ferrari General Manager Customer and Community BBus, PGradDipBus, MLM, FCPA, GAICD
Ms Ferrari is Deputy Chair of the West Australian Opera; a Board Member of the John Curtin Gallery, ScreenWest WA, Energy and Water Ombudsman, a trustee of the Legal Contribution Trust, Director of Water Corporation Superannuation Pty Ltd (until November 2017), and is on the Southern Seawater Desalination Plant Lead Team.
Mr Ross Hughes Chief Financial Officer BBus, FCPA, FAICD
Mr Hughes had 25 years’ experience in the financial services sector prior to joining the Corporation in 2006.
He is a member of the Water Services Association of Australia Utility Excellence Committee and of the Corporation’s Perth Seawater Desalination Plant Operations and Maintenance Alliance Lead Team.
Mr Hughes is a Fellow of CPA Australia and Fellow of the Australian Institute of Company Directors, and a Senate member of Murdoch University in Perth.
Dr Steve CapewellGeneral Manager Operations ServicesBsc (Hons), PhD, GAICD
Dr Capewell has a broad background in the industrial and municipal water sectors in the areas of water quality management, operations and maintenance, asset management and service delivery. Dr Capewell is a member of the WA State Advisory Committee for the Purity of Water and the Curtin Water Quality Research Centre Advisory Board. He has considerable governance and assurance experience as a Board member for Water Research Australia, and Chairman of the Perth Seawater Desalination Plant Lead Team and the Southern Seawater Desalination Plant Lead Team.
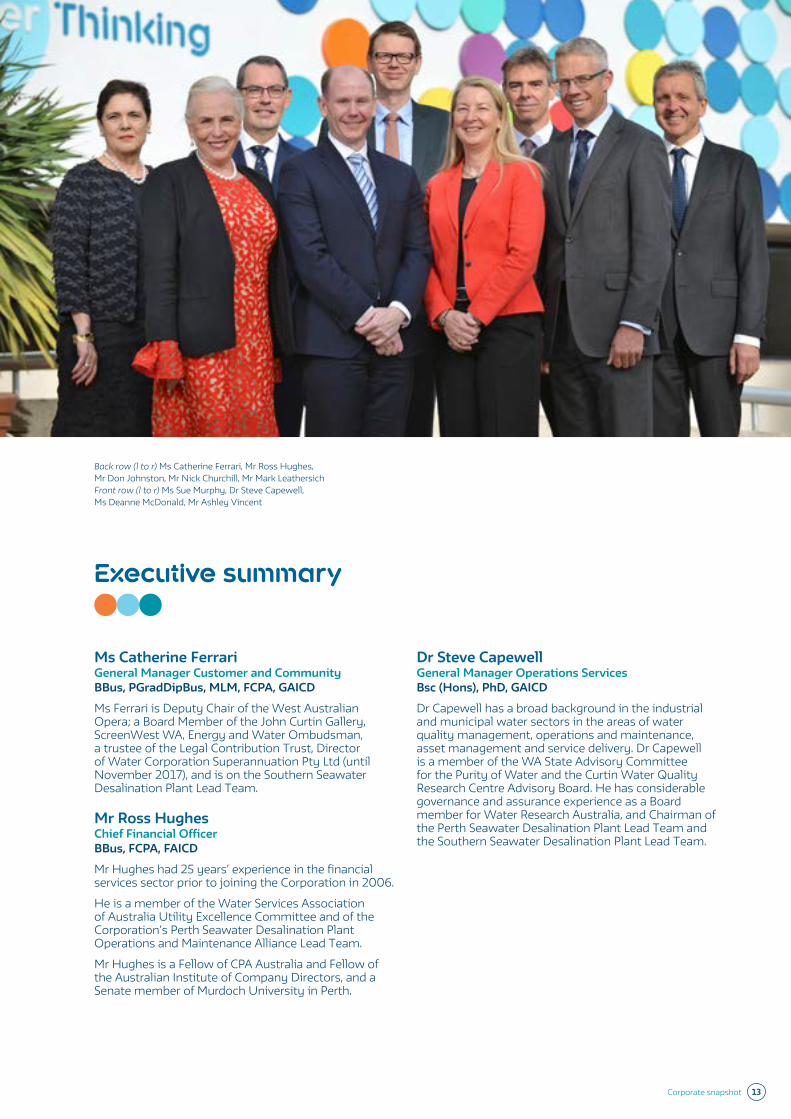
Back row (l to r) Ms Catherine Ferrari, Mr Ross Hughes, Mr Don Johnston, Mr Nick Churchill, Mr Mark Leathersich Front row (l to r) Ms Sue Murphy, Dr Steve Capewell, Ms Deanne McDonald, Mr Ashley Vincent
Corporate snapshot 13
Ms Deanne McDonaldGeneral Manager Digital Transformation MBA, GAICD
Ms McDonald has been engaged in the development, design, construction, operations and maintenance of public and private projects with a career spanning more than 20 years in the property, transport, utilities and service sectors.
Passionate about innovative thinking, Ms McDonald is currently President of the Australian Water Association in WA and an active member of a number of institutions and associations.
Ms McDonald was the inaugural winner of the Eva Skira Scholarship for Women Leaders, recognising her for not only her exceptional technical strength, but also commercial acumen, stakeholder engagement and a leadership style that brings out the best in the people she works with.
Mr Don JohnstonGeneral Manager Strategy and Stakeholders BSc/Comm (Hons), MBA
Mr Johnston draws on experience from a wide variety of industries, with a proven track record in strategy and performance improvement. He previously worked with Bain & Co, and was a co-founder of Azure Consulting. Mr Johnston is a General Council member for the Chamber of Commerce and Industry of Western Australia, and is on the Customer and Industry Leadership Committee for the Water Services Association of Australia.
Mr Mark Leathersich General Manager Assets Delivery BSc (Hons), MSc
Mr Leathersich is Chairman of the Woodman Point 180 Alliance and the Perth Region Alliance. Mr Leathersich has more than 25 years’ experience in the water industry in Western Australia, with a focus on strategic planning for water and wastewater services and major project delivery.
Mr Ashley Vincent General Manager, Assets Planning B.Eng, GCert BusMgmt, MBA
Mr Vincent is Chair of the Aroona Alliance and Chair of the WA Water Sensitive Transition Network. He has extensive leadership experience in all aspects of water servicing including, strategy, policy infrastructure planning, asset management and operations.
Mr Nick Churchill General Manager Assets Delivery B.Eng
Mr Churchill has 25 years’ experience in water infrastructure Project Management. He has successfully delivered a number of major capital projects including Western Australia’s second desalination project. His leadership roles have included Head of Project Management, Project Director Digital Transformation and most recently, General Manager, Assets Delivery Group.
14 WATER CORPORATION 2018 Annual Report
Key capital projects
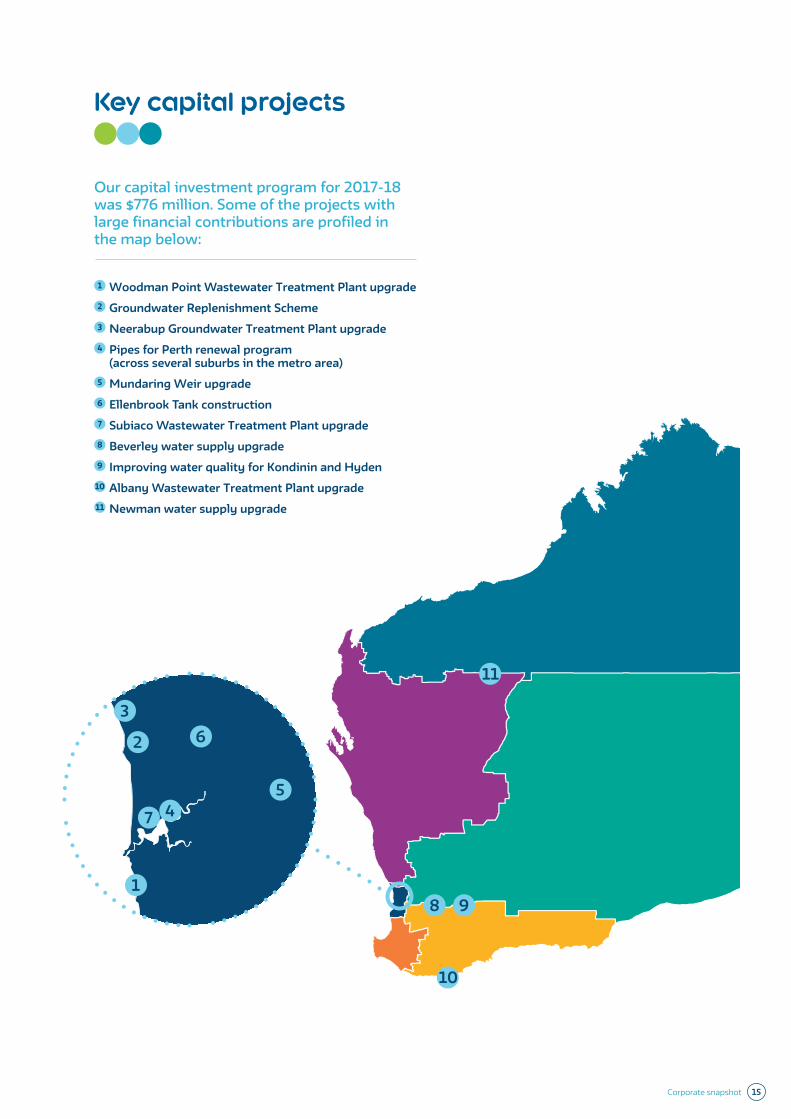
Our capital investment program for 2017-18 was $776 million. Some of the projects with large financial contributions are profiled in the map below:
1 Woodman Point Wastewater Treatment Plant upgrade 2 Groundwater Replenishment Scheme 3 Neerabup Groundwater Treatment Plant upgrade 4 Pipes for Perth renewal program
(across several suburbs in the metro area) 5 Mundaring Weir upgrade 6 Ellenbrook Tank construction 7 Subiaco Wastewater Treatment Plant upgrade 8 Beverley water supply upgrade 9 Improving water quality for Kondinin and Hyden
10 Albany Wastewater Treatment Plant upgrade 11 Newman water supply upgrade
8 9
10
11
1
2
3
45
6
7
Corporate snapshot 15
Financial highlights
Our surplus for 2017-18 was marginally higher than recent years, with a reduction in per person water use following milder summer temperatures and lower housing development activity from the domestic economy which remained stable this year. Our operating business delivered a surplus of $523 million and contributions from developers towards infrastructure for new housing developments contributed a further $127 million. These contributions were received either as cash from developers’ fees or non-cash in the form of infrastructure handed over. In 2017-18, developers’ fees represented $85 million of the surplus, which will be invested in our future capital expenditure program, and pipeline and pump infrastructure assets handed over contributed a further $42 million of surplus.
In a year when we continued to invest heavily in infrastructure with $776 million of new capital expenditure, the results featured total revenue of $2.6 billion and returns to the State Government by way of net accruals of $408 million.
Excluding the impact from development activity, total revenue increased by 3 per cent during the year due to a marginal increase in water consumption inline with additional connections during the year, together with lower operating subsidies received from the Government for the provision of non-profitable services. Climate change has seen an increasing proportion of our water delivered from sources which are independent of rainfall such as recycling and desalination, which has increased the cost of supplying into the scheme.
Total expenditure increased by 3.7 per cent to $1.4 billion. On a total cost per property basis, costs marginally increased by 1 per cent however our operating costs per property remains one of the lowest in the Australian water industry for large scale supply. A continuing focus on cost management supported the achievement of our long term average annual efficiency target of 2.0 per cent.
Returns to the StateThe Board approved dividend payments totalling $528 million to the State representing 85 per cent of our after-tax surplus (excluding developer’s handover assets, State Government grants, and grants received from Government for Capital Expenditure purposes) as per our Dividend Policy disclosed in our Statement of Corporate Intent.
We are also required by the Australian Tax Office to lodge an income tax return and pay tax equivalents to the State. Inclusive of local government rates, taxation equivalents payments made to the State in 2017-18 amounted to $289 million.
We received an operating subsidy payment from the Government of $409 million for the provision of non-profitable services, mostly in regional and remote areas of Western Australia, and concessions to customers.
When operating subsidies are offset against the dividends and taxes paid to Government, the resulting Net Accrual to Government (NATG) came to $408 million in 2017-18.
The net returns form part of the State’s consolidated results and are used to meet broader Government commitments.
Investing in Infrastructure Our capital investment program benefits the community and a wide range of local private industry partners who assist us in our construction, maintenance and operations. In doing so, we employ, both directly and indirectly, a significant number of Western Australians. The $776 million capital investment program for 2017-18 included $427 million in our water business, $225 million in our wastewater business, and the remainder on irrigation, drainage, property and facilities.
Supporting regional growthIn 2017-18, the value of our regional assets was in excess of $6 billion. During the year we spent over $233 million on the delivery of projects for regional Western Australia.
16 WATER CORPORATION 2018 Annual Report
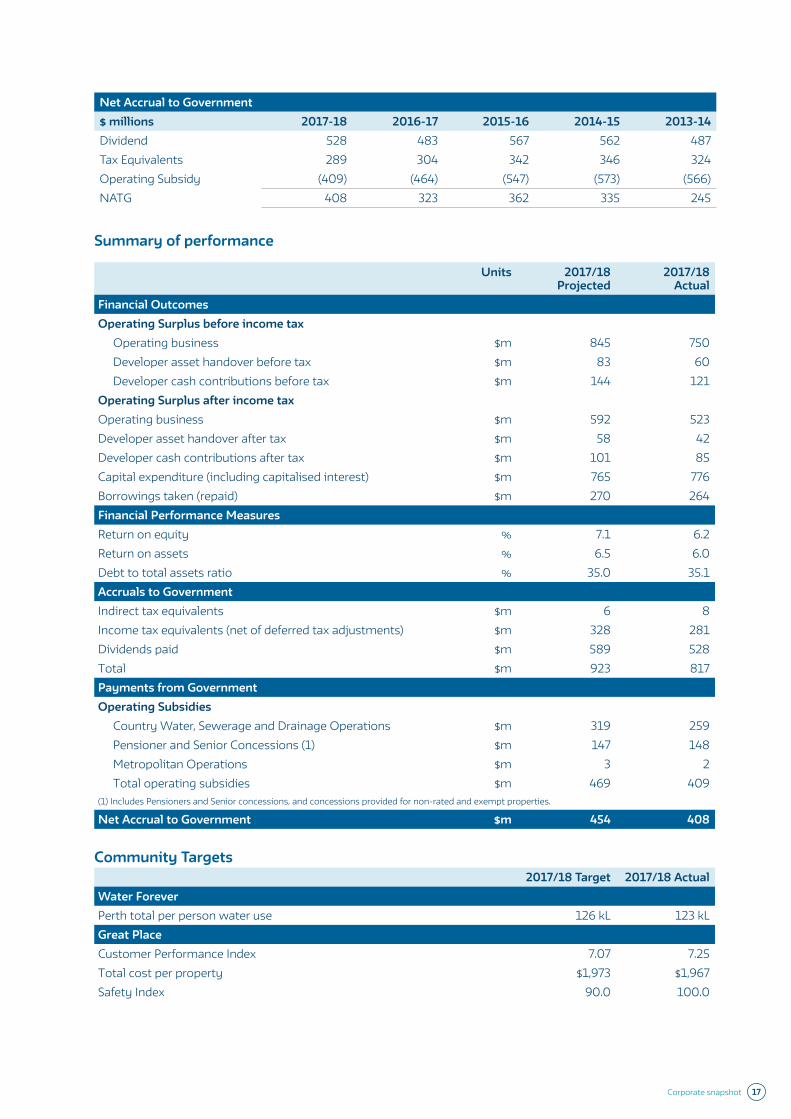
Net Accrual to Government$ millions 2017-18 2016-17 2015-16 2014-15 2013-14Dividend 528 483 567 562 487Tax Equivalents 289 304 342 346 324Operating Subsidy (409) (464) (547) (573) (566)NATG 408 323 362 335 245
Summary of performance
Units 2017/18 Projected
2017/18 Actual
Financial OutcomesOperating Surplus before income tax
Operating business $m 845 750Developer asset handover before tax $m 83 60 Developer cash contributions before tax $m 144 121
Operating Surplus after income tax Operating business $m 592 523Developer asset handover after tax $m 58 42 Developer cash contributions after tax $m 101 85 Capital expenditure (including capitalised interest) $m 765 776 Borrowings taken (repaid) $m 270 264 Financial Performance MeasuresReturn on equity % 7.1 6.2 Return on assets % 6.5 6.0 Debt to total assets ratio % 35.0 35.1 Accruals to Government Indirect tax equivalents $m 6 8 Income tax equivalents (net of deferred tax adjustments) $m 328 281 Dividends paid $m 589 528 Total $m 923 817Payments from Government Operating Subsidies
Country Water, Sewerage and Drainage Operations $m 319 259Pensioner and Senior Concessions (1) $m 147 148Metropolitan Operations $m 3 2Total operating subsidies $m 469 409
(1) Includes Pensioners and Senior concessions, and concessions provided for non-rated and exempt properties.
Net Accrual to Government $m 454 408
Community Targets2017/18 Target 2017/18 Actual
Water ForeverPerth total per person water use 126 kL 123 kLGreat PlaceCustomer Performance Index 7.07 7.25Total cost per property $1,973 $1,967Safety Index 90.0 100.0
Corporate snapshot 17
Operational report
18 WATER CORPORATION 2018 Annual Report
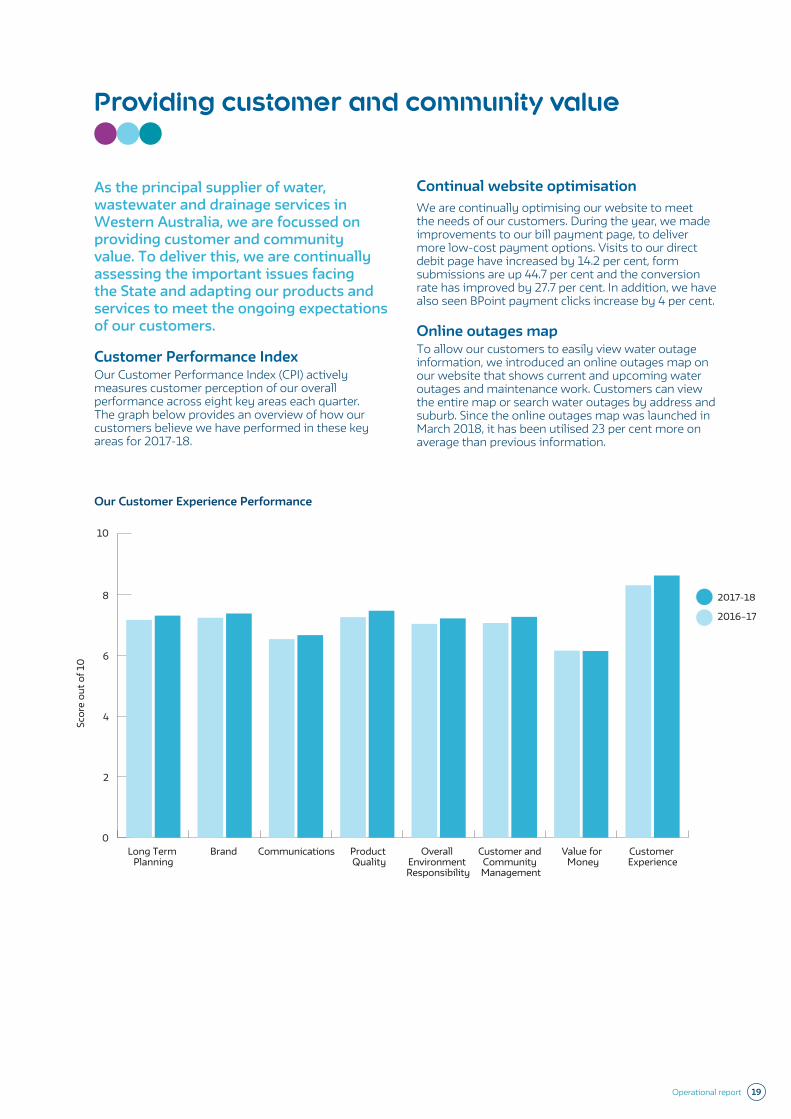
Providing customer and community value
As the principal supplier of water, wastewater and drainage services in Western Australia, we are focussed on providing customer and community value. To deliver this, we are continually assessing the important issues facing the State and adapting our products and services to meet the ongoing expectations of our customers.
Customer Performance IndexOur Customer Performance Index (CPI) actively measures customer perception of our overall performance across eight key areas each quarter. The graph below provides an overview of how our customers believe we have performed in these key areas for 2017-18.
Continual website optimisationWe are continually optimising our website to meet the needs of our customers. During the year, we made improvements to our bill payment page, to deliver more low-cost payment options. Visits to our direct debit page have increased by 14.2 per cent, form submissions are up 44.7 per cent and the conversion rate has improved by 27.7 per cent. In addition, we have also seen BPoint payment clicks increase by 4 per cent.
Online outages mapTo allow our customers to easily view water outage information, we introduced an online outages map on our website that shows current and upcoming water outages and maintenance work. Customers can view the entire map or search water outages by address and suburb. Since the online outages map was launched in March 2018, it has been utilised 23 per cent more on average than previous information.
0
2
4
6
8
10
Long Term Planning
Value for Money
Overall Environment Responsibility
Customer and Community Management
Product Quality
Customer Experience
CommunicationsBrand
2017-18
2016–17
Scor
e ou
t of 1
0
Our Customer Experience Performance
Operational report 19
Working together to save waterIn response to climate change, we are committed to working together with our customers to save water. Our dedicated water efficiency team helped households and businesses across WA reduce their water use via a range of community water saving programs and tailored water management plans.
Fifty thousand high-using residential customers in the Perth metropolitan area received detailed water use letters to help them save more than 270 million litres of water over summer. Almost 16,000 customers registered their interest in the Waterwise Garden Rewards offer, and more than 8,000 customers received free Waterwise gardening products, including mulch, soil improver and wetting agent that is estimated to have saved almost 136 million litres of water.
We also helped save more than 100 million litres of water by providing education, advice and free plumbing services to more than 3,000 customers in 14 regional towns, including Bindoon, Capel, Chittering, Coomberdale, Coral Bay, Denham, Exmouth, Fitzroy Crossing, Gascoyne Junction, Halls Creek, Moora, New Norcia, Onslow and Yalgoo.
Community Waterwise ProgramsDuring the year, our Waterwise Programs helped participants save 11 billion litres of water across a range of different areas of the community. We have a number of partnerships to support the delivery of our Waterwise Programs, including the Waterwise Council Program that reaches more than 1.8 million residents and the Waterwise Verge Incentive Scheme, which promotes low-water-use verge gardens with rebates or verge replacement initiatives.
Community partnershipsWe support a wide range of community programs across WA that build on our vision to make the State a great place to live and invest. These partnerships demonstrate our commitment to the communities and environments we operate in.
Orange SkyNew to our partnership portfolio this year was Orange Sky, a national charity offering free laundry and shower services to people experiencing homelessness. Our support is helping to provide people doing it tough around Perth with the opportunity for a free warm shower and fresh clean clothes. Even more importantly, the service provides people with the opportunity to connect and have non-judgemental conversations with Orange Sky volunteers. In just a few short months since the service has been operating, 902 loads of washing have been done, nearly 100 showers provided and 2,500 hours of conversation.
Museum of Water exhibitionWe supported Perth Festival’s Museum of Water exhibition that showcased WA’s collection of water bottles and their journey around the State. The community were encouraged to donate to the collection and share their stories. The 241 bottles collected will be curated and become part of the permanent collection at the new Western Australian Museum in 2020.
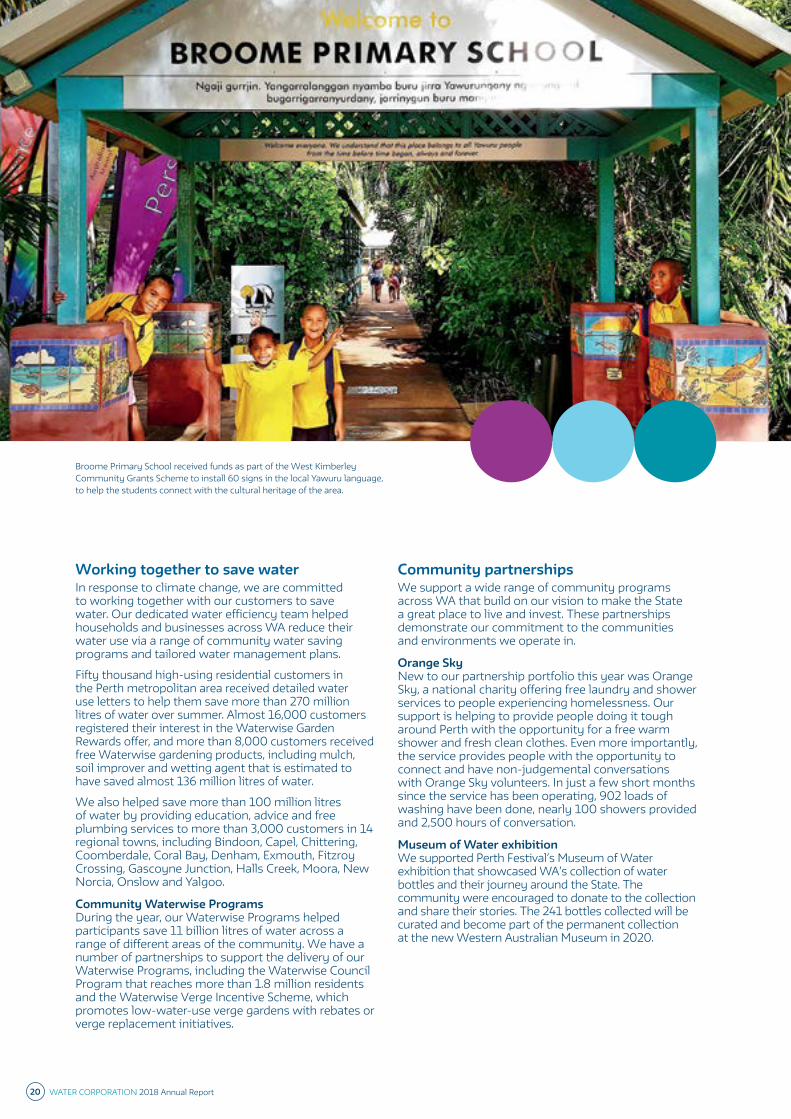
Broome Primary School received funds as part of the West Kimberley Community Grants Scheme to install 60 signs in the local Yawuru language, to help the students connect with the cultural heritage of the area.
20 WATER CORPORATION 2018 Annual Report

Clontarf FoundationWe continued our long-standing partnership with the Clontarf Foundation which provides important school engagement programs designed to help young Aboriginal and Torres Strait Islander boys complete their education and gain meaningful employment. We are WA’s biggest employer of Clontarf students and have 23 boys training with us, who make up 25 per cent of our Aboriginal workforce.
Community grants in the Kimberley In the West Kimberley, our award-winning community grants scheme distributed more than $30,600 during the year towards community-led projects to support health, culture and education. Funds for the grants were raised by the sale of hay that was irrigated and produced at the Broome North Wastewater Treatment Plant. The scheme was administered through a partnership with the Broome Lions Club.
In the East Kimberley, we provided $28,260 to Wunan, an Aboriginal development organisation that drives long-term socio-economic change for Aboriginal people. This money supported the development of 30 female Aboriginal students with tutoring services for science, technology and mathematics as well as other essential items. The funds were again raised by the sale of hay that was irrigated and produced at the Broome North Wastewater Treatment Plant.
Streamlined subdivision processTo help speed up subdivision timelines, we worked with major stakeholders in the development industry to deliver a new streamlined process. Outlined in our Developers’ Manual, the new process provides our customers with cost savings, shorter turnaround times and a reduced amount of paperwork.
Financial hardship support initiativesAs announced by the Premier and Minister for Water in May, we have implemented improved financial hardship support initiatives focussed on early intervention. The new initiatives have contributed to a decrease in the number of people who have had their water supply restricted for non-payment of bills, down from 2,467 in 2016-17 to 1,063 in 2017-18.
From 1 July 2018, people that need assistance in paying their water bills and those with a specific medical condition will benefit from the following new support initiatives:
• Medical Assist – for households that have a family member with kidney disease undertaking home dialysis, we will provide up to 180,000 litres of water free of charge each year.
• Start Over - for customers in hardship with a long-term outstanding debt, we will match their payments over a two-year period and then clear any outstanding debt, giving them a fresh start.
• Time Assist - for people who have a consistent payment history and suffer an accident that results in them being unable to pay, we will put their water bills on hold for up to three months.
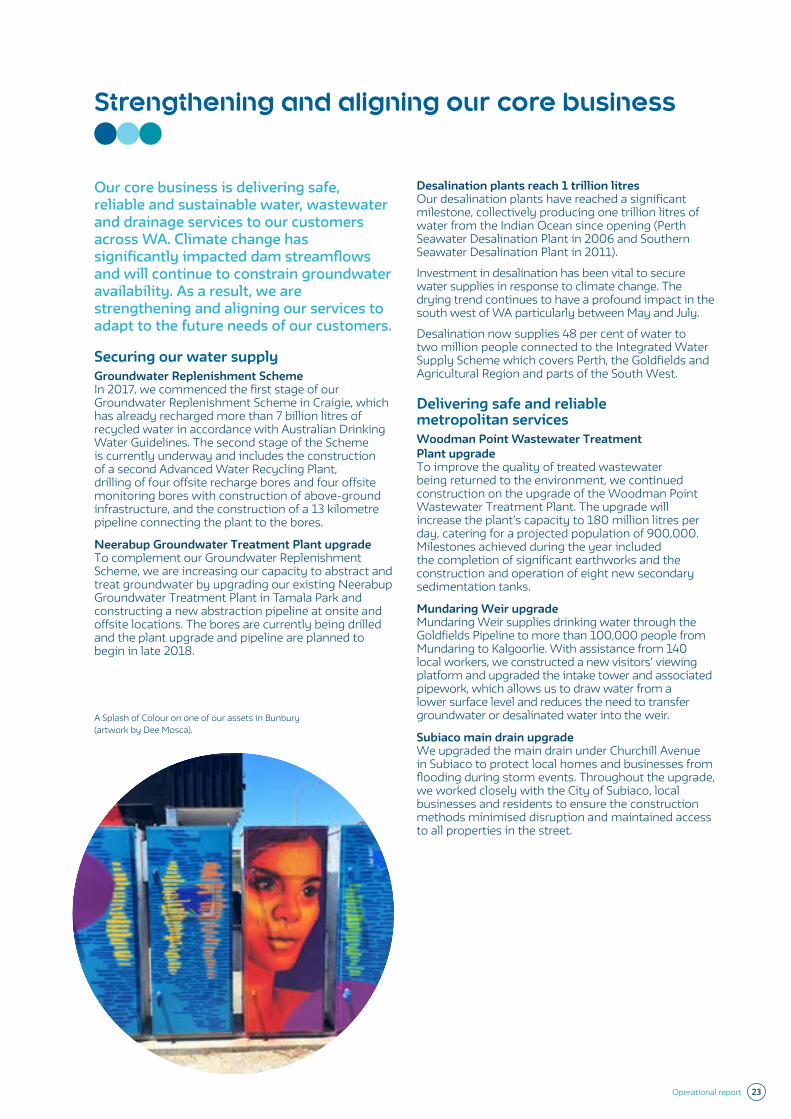
Splash of Colour Community Arts ProgramIn 2017, we worked with high school students in the South West and Great Southern to design artwork for assets through our Splash of Colour Community Arts Program. The students took part in workshops where they worked closely with professional artists who were responsible for transforming the assets. We now have 10 assets from Albany to the Wheatbelt bringing a splash of colour to the community, as well as a sense of ownership and pride to the students involved in the design process. Due to the success of the program, it is being rolled out across the State with an additional 15 water and wastewater electrical cabinets being transformed into public art pieces.
A Splash of Colour on one of our assets in Mount Pleasant (artwork by Jack Bromell).
Operational report 21
Waterwise Schools ProgramOur Waterwise Schools Program has been operating since 1995 and provides free curriculum-linked teaching resources, hands-on activities, school talks and excursions. During the year, our free School Talks program reached more than 25,000 students and we hosted more than 97 tours for schools, TAFEs and universities at our Groundwater Replenishment Visitor Centre in Craigie.
The Shower SongAs a way of motivating our customers to reduce their showering time, we launched The Shower Song that encouraged people to shower as long as a four-minute song. The Shower Song was written by Kav Temperley from Eskimo Joe and performed by a collective of local WA musicians. We promoted the song via a strategic social media campaign targeting a youth audience, who have a higher propensity to take long showers. Since its launch, The Shower Song has achieved excellent media outcomes, reaching more than 4.5 million people and amassing over 500,000 video views and more than 670,000 audio listens.
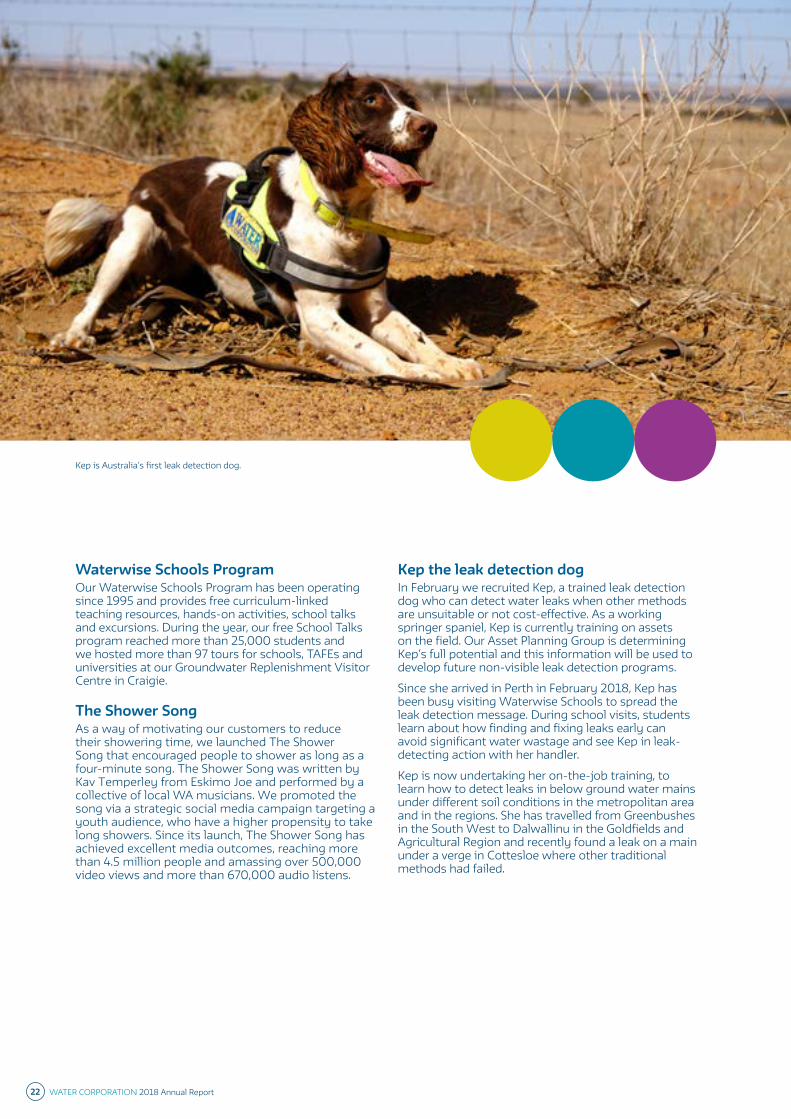
Kep the leak detection dogIn February we recruited Kep, a trained leak detection dog who can detect water leaks when other methods are unsuitable or not cost-effective. As a working springer spaniel, Kep is currently training on assets on the field. Our Asset Planning Group is determining Kep’s full potential and this information will be used to develop future non-visible leak detection programs.
Since she arrived in Perth in February 2018, Kep has been busy visiting Waterwise Schools to spread the leak detection message. During school visits, students learn about how finding and fixing leaks early can avoid significant water wastage and see Kep in leak-detecting action with her handler.
Kep is now undertaking her on-the-job training, to learn how to detect leaks in below ground water mains under different soil conditions in the metropolitan area and in the regions. She has travelled from Greenbushes in the South West to Dalwallinu in the Goldfields and Agricultural Region and recently found a leak on a main under a verge in Cottesloe where other traditional methods had failed.
Kep is Australia’s first leak detection dog.
22 WATER CORPORATION 2018 Annual Report
Strengthening and aligning our core business
Our core business is delivering safe, reliable and sustainable water, wastewater and drainage services to our customers across WA. Climate change has significantly impacted dam streamflows and will continue to constrain groundwater availability. As a result, we are strengthening and aligning our services to adapt to the future needs of our customers.
Securing our water supplyGroundwater Replenishment SchemeIn 2017, we commenced the first stage of our Groundwater Replenishment Scheme in Craigie, which has already recharged more than 7 billion litres of recycled water in accordance with Australian Drinking Water Guidelines. The second stage of the Scheme is currently underway and includes the construction of a second Advanced Water Recycling Plant, drilling of four offsite recharge bores and four offsite monitoring bores with construction of above-ground infrastructure, and the construction of a 13 kilometre pipeline connecting the plant to the bores.
Neerabup Groundwater Treatment Plant upgradeTo complement our Groundwater Replenishment Scheme, we are increasing our capacity to abstract and treat groundwater by upgrading our existing Neerabup Groundwater Treatment Plant in Tamala Park and constructing a new abstraction pipeline at onsite and offsite locations. The bores are currently being drilled and the plant upgrade and pipeline are planned to begin in late 2018.
Desalination plants reach 1 trillion litres Our desalination plants have reached a significant milestone, collectively producing one trillion litres of water from the Indian Ocean since opening (Perth Seawater Desalination Plant in 2006 and Southern Seawater Desalination Plant in 2011).
Investment in desalination has been vital to secure water supplies in response to climate change. The drying trend continues to have a profound impact in the south west of WA particularly between May and July.
Desalination now supplies 48 per cent of water to two million people connected to the Integrated Water Supply Scheme which covers Perth, the Goldfields and Agricultural Region and parts of the South West.
Delivering safe and reliable metropolitan servicesWoodman Point Wastewater Treatment Plant upgradeTo improve the quality of treated wastewater being returned to the environment, we continued construction on the upgrade of the Woodman Point Wastewater Treatment Plant. The upgrade will increase the plant’s capacity to 180 million litres per day, catering for a projected population of 900,000. Milestones achieved during the year included the completion of significant earthworks and the construction and operation of eight new secondary sedimentation tanks.
Mundaring Weir upgradeMundaring Weir supplies drinking water through the Goldfields Pipeline to more than 100,000 people from Mundaring to Kalgoorlie. With assistance from 140 local workers, we constructed a new visitors’ viewing platform and upgraded the intake tower and associated pipework, which allows us to draw water from a lower surface level and reduces the need to transfer groundwater or desalinated water into the weir.
Subiaco main drain upgradeWe upgraded the main drain under Churchill Avenue in Subiaco to protect local homes and businesses from flooding during storm events. Throughout the upgrade, we worked closely with the City of Subiaco, local businesses and residents to ensure the construction methods minimised disruption and maintained access to all properties in the street.
A Splash of Colour on one of our assets in Bunbury (artwork by Dee Mosca).
Operational report 23
Subiaco Wastewater Treatment Plant upgradeDuring the year, we upgraded the treatment, electrical and control facilities at the Subiaco Wastewater Treatment Plant, which can now treat up to 67 million litres of wastewater per day. The upgrades will continue to support growth in the western suburbs between Perth CBD, Scarborough and Fremantle.
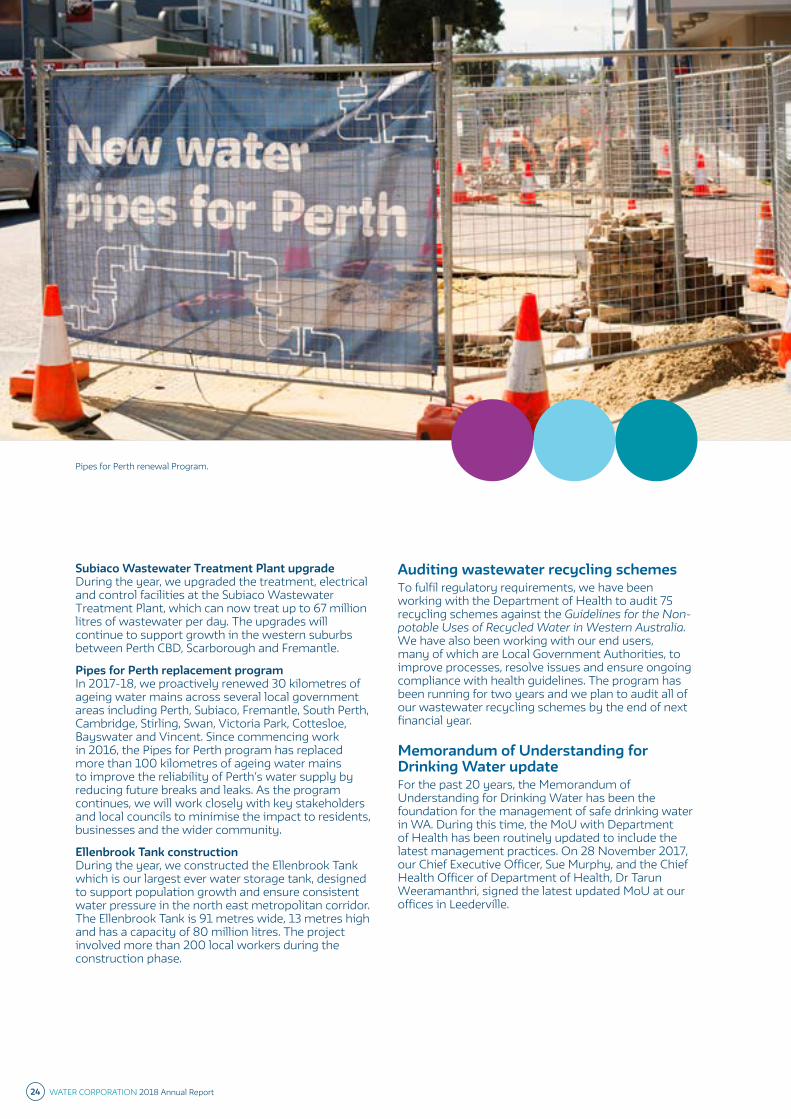
Pipes for Perth replacement programIn 2017-18, we proactively renewed 30 kilometres of ageing water mains across several local government areas including Perth, Subiaco, Fremantle, South Perth, Cambridge, Stirling, Swan, Victoria Park, Cottesloe, Bayswater and Vincent. Since commencing work in 2016, the Pipes for Perth program has replaced more than 100 kilometres of ageing water mains to improve the reliability of Perth’s water supply by reducing future breaks and leaks. As the program continues, we will work closely with key stakeholders and local councils to minimise the impact to residents, businesses and the wider community.
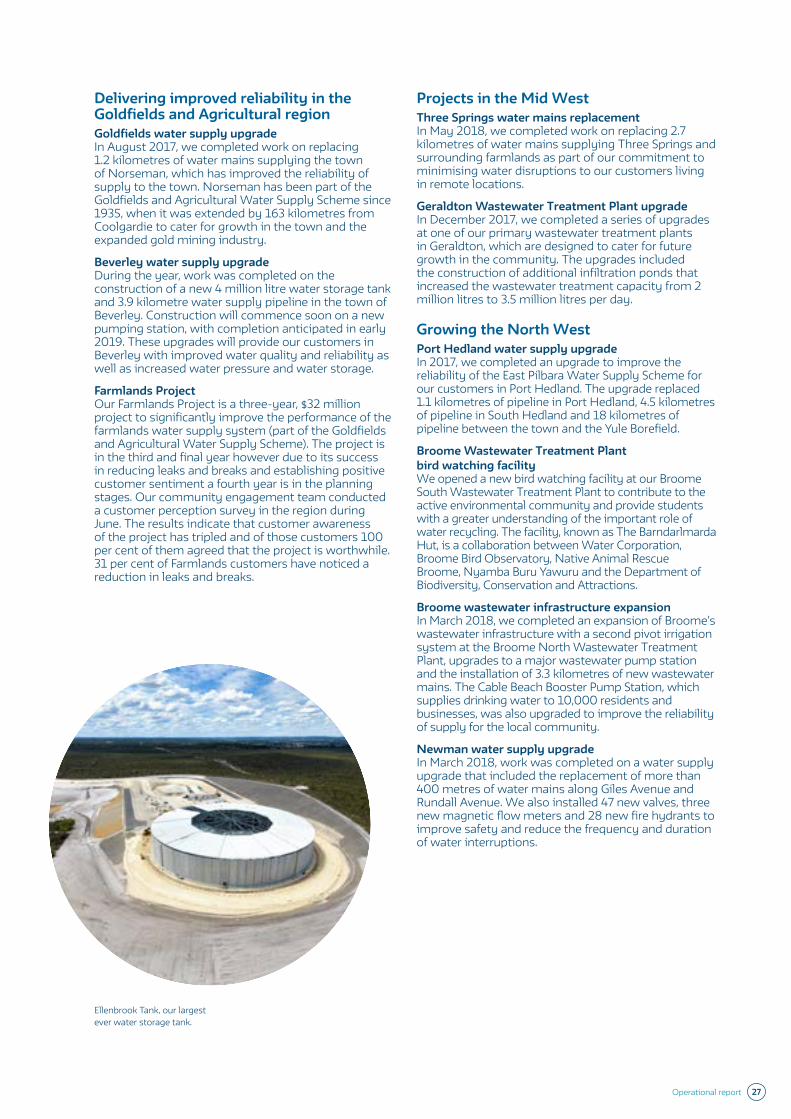
Ellenbrook Tank constructionDuring the year, we constructed the Ellenbrook Tank which is our largest ever water storage tank, designed to support population growth and ensure consistent water pressure in the north east metropolitan corridor. The Ellenbrook Tank is 91 metres wide, 13 metres high and has a capacity of 80 million litres. The project involved more than 200 local workers during the construction phase.
Auditing wastewater recycling schemesTo fulfil regulatory requirements, we have been working with the Department of Health to audit 75 recycling schemes against the Guidelines for the Non-potable Uses of Recycled Water in Western Australia. We have also been working with our end users, many of which are Local Government Authorities, to improve processes, resolve issues and ensure ongoing compliance with health guidelines. The program has been running for two years and we plan to audit all of our wastewater recycling schemes by the end of next financial year.
Memorandum of Understanding for Drinking Water updateFor the past 20 years, the Memorandum of Understanding for Drinking Water has been the foundation for the management of safe drinking water in WA. During this time, the MoU with Department of Health has been routinely updated to include the latest management practices. On 28 November 2017, our Chief Executive Officer, Sue Murphy, and the Chief Health Officer of Department of Health, Dr Tarun Weeramanthri, signed the latest updated MoU at our offices in Leederville.
Pipes for Perth renewal Program.
24 WATER CORPORATION 2018 Annual Report
Renewable energy generationOver the course of the year, we continued to develop our renewable energy generation at numerous sites across the State to reduce our greenhouse gas emissions and our reliance on power from the grid.
Exmouth borefieldWe upgraded Exmouth's southern borefield with the installation of solar panels and the addition of 10 bores, which have increased capacity by a further 500,000 litres of water per day. Solar power is now used to pump water from the borefield to a 5 million litre water storage tank, which supplies water to Exmouth’s residents, businesses and tourists.
Broome borefieldThe use of hybrid solar-diesel power trial at Broome’s borefield has proved successful and is now supplying drinking water to the town. The hybrid system powers the bore pump with solar energy during the day and stores excess solar energy in batteries for use in the evening and in times of low light. The bore pump is also equipped with a diesel generator that can be used when solar energy is not available.
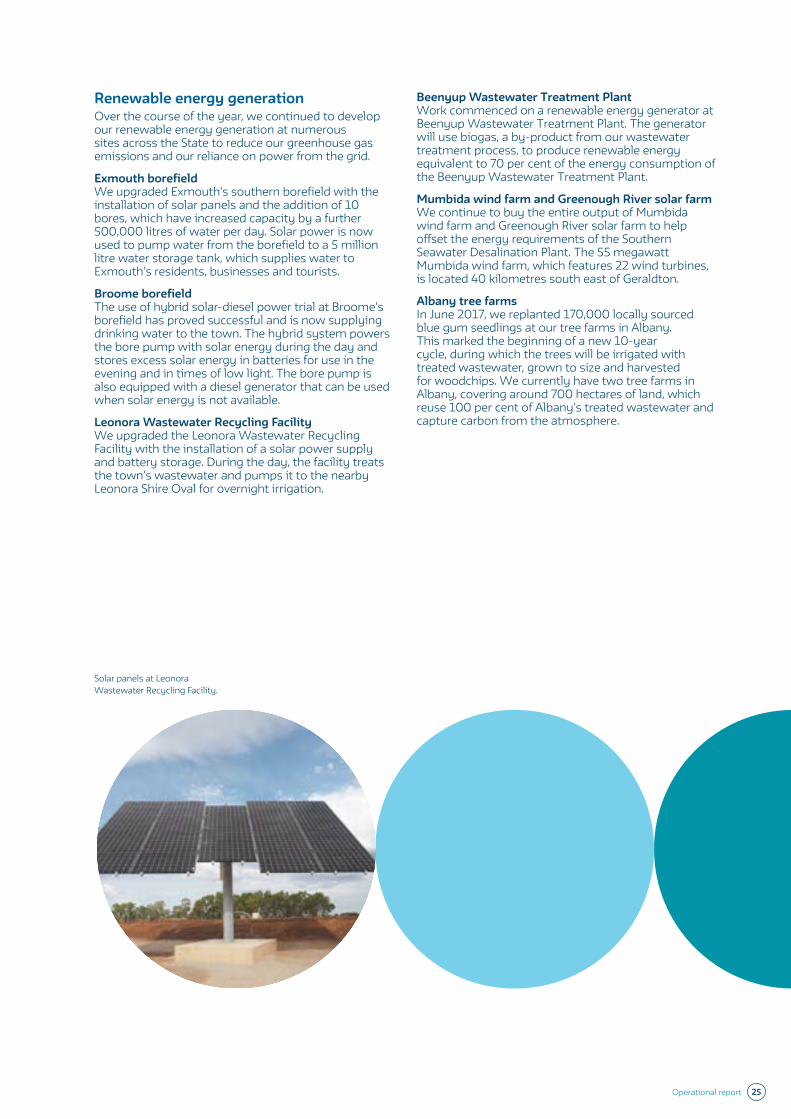
Leonora Wastewater Recycling FacilityWe upgraded the Leonora Wastewater Recycling Facility with the installation of a solar power supply and battery storage. During the day, the facility treats the town’s wastewater and pumps it to the nearby Leonora Shire Oval for overnight irrigation.
Beenyup Wastewater Treatment PlantWork commenced on a renewable energy generator at Beenyup Wastewater Treatment Plant. The generator will use biogas, a by-product from our wastewater treatment process, to produce renewable energy equivalent to 70 per cent of the energy consumption of the Beenyup Wastewater Treatment Plant.
Mumbida wind farm and Greenough River solar farmWe continue to buy the entire output of Mumbida wind farm and Greenough River solar farm to help offset the energy requirements of the Southern Seawater Desalination Plant. The 55 megawatt Mumbida wind farm, which features 22 wind turbines, is located 40 kilometres south east of Geraldton.
Albany tree farmsIn June 2017, we replanted 170,000 locally sourced blue gum seedlings at our tree farms in Albany. This marked the beginning of a new 10-year cycle, during which the trees will be irrigated with treated wastewater, grown to size and harvested for woodchips. We currently have two tree farms in Albany, covering around 700 hectares of land, which reuse 100 per cent of Albany’s treated wastewater and capture carbon from the atmosphere.
Solar panels at Leonora Wastewater Recycling Facility.
Operational report 25
Making WA a great place to live
Projects in the Great SouthernImproving water quality for Kondinin and HydenIn late 2018, construction will be complete on a new 2.5 million litre water storage tank, pump station and 18.5 kilometre pipeline in the Shires of Kondinin and Kulin. The upgrade will improve the quality of water supplied to the towns of Kondinin and Hyden, while increasing flow capacity and removing reliance on local water sources downstream.
Upgrades in the South WestBunbury Wastewater Treatment Plant upgradeIn November 2017, we completed an upgrade of the Bunbury Wastewater Treatment Plant to meet the future needs of the South West’s growing population. The project included upgrades to mechanical and electrical technology that have increased the plant’s capacity to treat 13 million litres of wastewater per day.
Kemerton Wastewater Treatment Plant upgradeDesigned to minimise environmental impact, our Kemerton Wastewater Treatment Plant maximises nitrogen removal from treated water prior to irrigation on an adjacent 27-hectare woodlot. During the year, we upgraded the plant with the addition of a two-stage oxidation-denitrification tertiary filtration facility, which removes 96.3 per cent of nitrogen from treated water and reduces the loading on the woodlot.
School-based trainees in BunburyIn 2017, we welcomed school-based trainees from Newton Moore Senior High School who are working with our operational teams in Bunbury to get on-the-job experience and gain an understanding of the career options available at Water Corporation. The students are being exposed to all facets of our business, including working onsite with our rangers and operations teams. There are currently five trainees in the program, four of which are Aboriginal, who are working towards achieving a Certificate II in Water Operations at the end of 2018.
Capel water supply upgradeIn July 2018, work will be complete on an upgrade to Capel’s water supply bores and water treatment plant. The upgrades will provide a reliable water supply to more than 1,000 customers in the town and are part of our broader commitment to secure supplies in the South West.
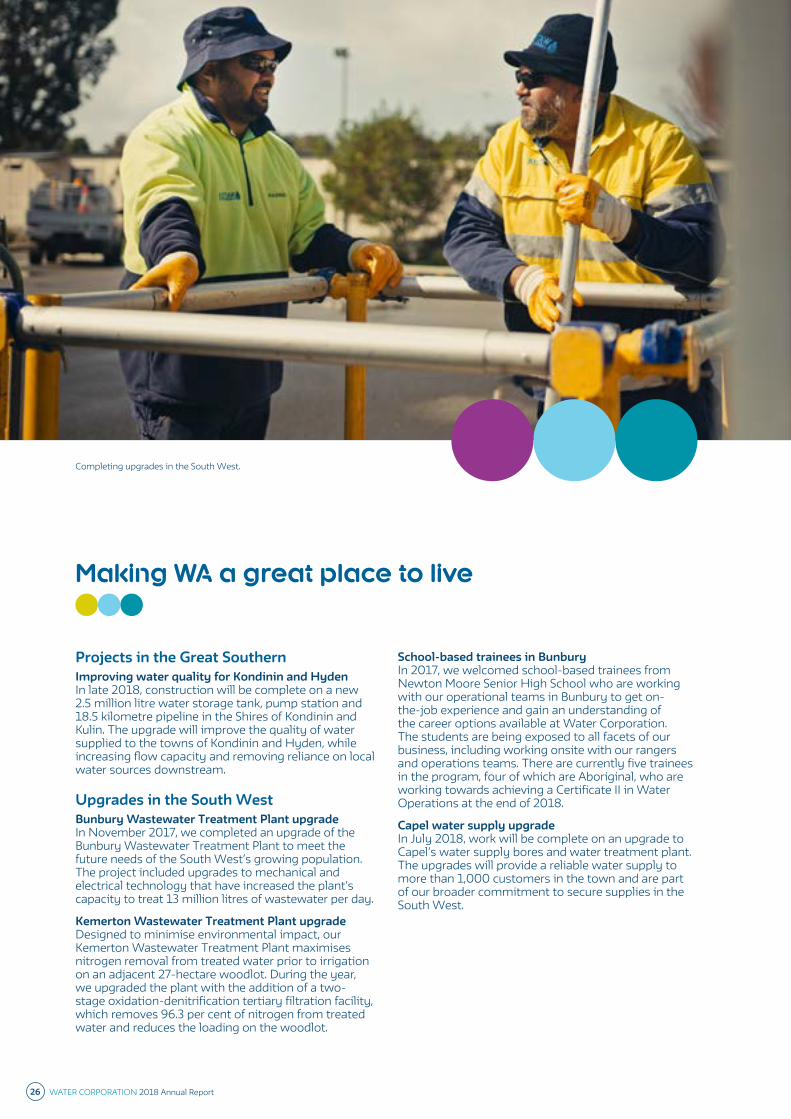
Completing upgrades in the South West.
26 WATER CORPORATION 2018 Annual Report
Delivering improved reliability in the Goldfields and Agricultural regionGoldfields water supply upgradeIn August 2017, we completed work on replacing 1.2 kilometres of water mains supplying the town of Norseman, which has improved the reliability of supply to the town. Norseman has been part of the Goldfields and Agricultural Water Supply Scheme since 1935, when it was extended by 163 kilometres from Coolgardie to cater for growth in the town and the expanded gold mining industry.
Beverley water supply upgrade During the year, work was completed on the construction of a new 4 million litre water storage tank and 3.9 kilometre water supply pipeline in the town of Beverley. Construction will commence soon on a new pumping station, with completion anticipated in early 2019. These upgrades will provide our customers in Beverley with improved water quality and reliability as well as increased water pressure and water storage.
Farmlands Project Our Farmlands Project is a three-year, $32 million project to significantly improve the performance of the farmlands water supply system (part of the Goldfields and Agricultural Water Supply Scheme). The project is in the third and final year however due to its success in reducing leaks and breaks and establishing positive customer sentiment a fourth year is in the planning stages. Our community engagement team conducted a customer perception survey in the region during June. The results indicate that customer awareness of the project has tripled and of those customers 100 per cent of them agreed that the project is worthwhile. 31 per cent of Farmlands customers have noticed a reduction in leaks and breaks.
Projects in the Mid WestThree Springs water mains replacementIn May 2018, we completed work on replacing 2.7 kilometres of water mains supplying Three Springs and surrounding farmlands as part of our commitment to minimising water disruptions to our customers living in remote locations.
Geraldton Wastewater Treatment Plant upgradeIn December 2017, we completed a series of upgrades at one of our primary wastewater treatment plants in Geraldton, which are designed to cater for future growth in the community. The upgrades included the construction of additional infiltration ponds that increased the wastewater treatment capacity from 2 million litres to 3.5 million litres per day.
Growing the North WestPort Hedland water supply upgradeIn 2017, we completed an upgrade to improve the reliability of the East Pilbara Water Supply Scheme for our customers in Port Hedland. The upgrade replaced 1.1 kilometres of pipeline in Port Hedland, 4.5 kilometres of pipeline in South Hedland and 18 kilometres of pipeline between the town and the Yule Borefield.
Broome Wastewater Treatment Plant bird watching facilityWe opened a new bird watching facility at our Broome South Wastewater Treatment Plant to contribute to the active environmental community and provide students with a greater understanding of the important role of water recycling. The facility, known as The Barndarlmarda Hut, is a collaboration between Water Corporation, Broome Bird Observatory, Native Animal Rescue Broome, Nyamba Buru Yawuru and the Department of Biodiversity, Conservation and Attractions.
Broome wastewater infrastructure expansionIn March 2018, we completed an expansion of Broome’s wastewater infrastructure with a second pivot irrigation system at the Broome North Wastewater Treatment Plant, upgrades to a major wastewater pump station and the installation of 3.3 kilometres of new wastewater mains. The Cable Beach Booster Pump Station, which supplies drinking water to 10,000 residents and businesses, was also upgraded to improve the reliability of supply for the local community.
Newman water supply upgradeIn March 2018, work was completed on a water supply upgrade that included the replacement of more than 400 metres of water mains along Giles Avenue and Rundall Avenue. We also installed 47 new valves, three new magnetic flow meters and 28 new fire hydrants to improve safety and reduce the frequency and duration of water interruptions.
Ellenbrook Tank, our largest ever water storage tank.
Operational report 27
Safety and the environmentSafety is our first priorityThe safety of our people, contractors and community is our first priority. Central to managing our operations is the ongoing cultivation of a culture where no injury is considered acceptable, people are actively encouraged to question whether risks are effectively controlled and managed, and all activities are undertaken without compromising health and safety.
Sadly, a construction contractor died as a result of a workplace incident at the upgrade project at the Woodman Point Wastewater Treatment Plant. The incident is currently under investigation.
Key safety initiatives• Safety Essentials – we continue to better define
and document the mandatory requirements and minimum standards that we expect our employees and contractors to meet to manage the work activities that pose the greatest risk.
• Competency Verification – the development and implementation of a field-based competency verification program across the State has provided us with assurance that our workforce has the necessary skills and knowledge to perform high-risk operational tasks.
• Contractor Pre-qualification – our contractors continue to go through our contractor pre-qualification process which includes requiring them to provide supporting evidence of capability. This enables us to properly assess and ensure they have the capability to meet the minimum safety requirement for the categories of work they have nominated for.
• Health and Wellbeing – we are implementing a three-year plan that is focussed on promoting positive physical and mental wellbeing through the provision of training, health and wellness programs and a range of other resources.
• Safety Culture Review – in 2014 and 2016, we undertook an independent review of our safety culture across the organisation. As a follow up, we commissioned an external consultant to conduct another review in June 2018 to assess our current safety culture and assist with identifying any further improvement opportunities.
Improving our environmental decision makingWe are continuously improving our environmental risk-based decision making process to ensure that the values impacted by our activities can be identified, measured and controlled for all high-risk environments.
Key environmental initiatives• Regulatory Notification Process – we have
automated aspects of our environmental event notification process to ensure we provide all relevant government agencies with consistent and relevant information as soon as practicable and in a transparent manner.
• Environmental Risk Assessment Framework – we have improved the way we identify and manage risks by adopting a new assessment framework for how our operations interact with the surrounding environment.
• Integrated Asbestos Inspections – as we continue to progress with our State-wide inspection program, we are starting to experience cost savings and the reduction of risk as a result of the successful identification and remediation of sites across WA.
Dedicated incident support vanIn October 2017, our operations centre successfully commissioned a dedicated incident support van with a functional trial in Northam. The new mobile facility will be deployed to incidents such as bushfires and severe weather events to support emergency services and the community. The van will act as a timely reminder for the community to prepare for bushfire season, be a reference point for the public to know we are available to assist, and also serve as a temporary base for our employees who will be available 24 hours a day during periods of need.
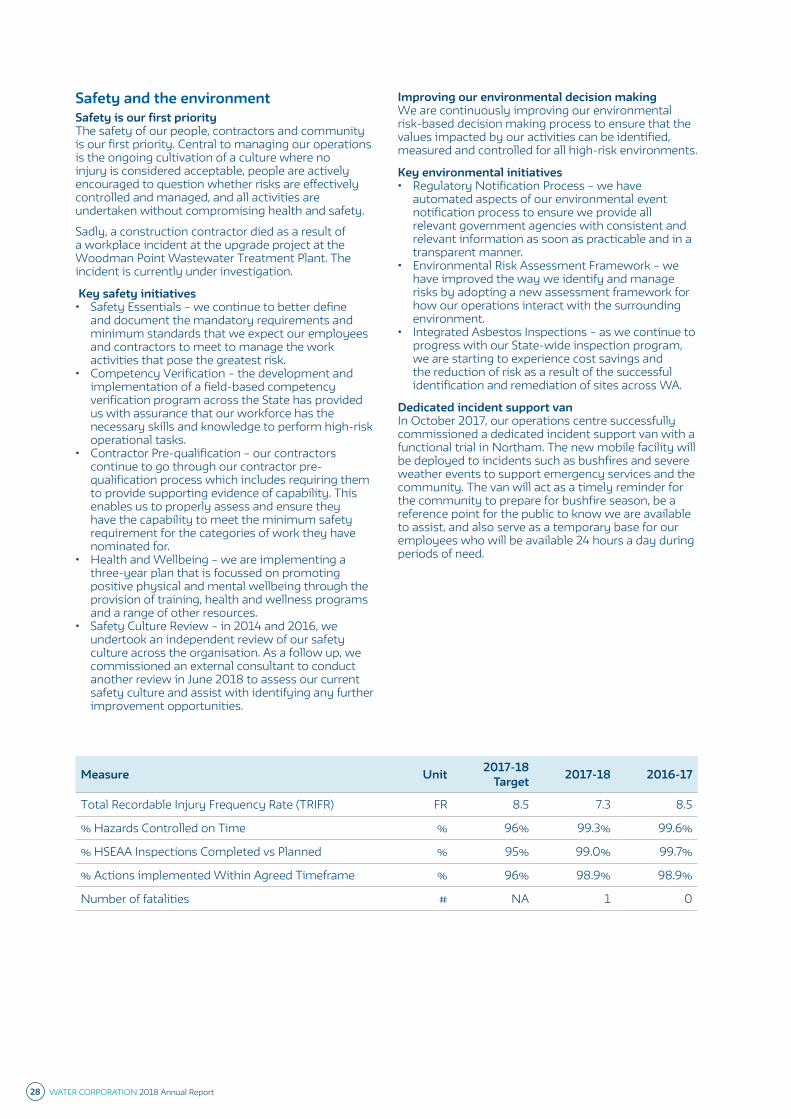
Measure Unit 2017-18Target 2017-18 2016-17
Total Recordable Injury Frequency Rate (TRIFR) FR 8.5 7.3 8.5
% Hazards Controlled on Time % 96% 99.3% 99.6%
% HSEAA Inspections Completed vs Planned % 95% 99.0% 99.7%
% Actions implemented Within Agreed Timeframe % 96% 98.9% 98.9%
Number of fatalities # NA 1 0
28 WATER CORPORATION 2018 Annual Report
Developing leading edge thinking
Work experience for people with a disabilityWe work in partnership with Workpower to offer work experience opportunities for people with disability.
In November 2017, we commenced our successful work placement program, which led to a pilot employment program at our Customer Contact Centre in Balcatta. We also implemented a strong partnership with JobAccess to improve our recruitment practices and attract candidates with disability to our workforce.
Right people for the futureWe currently have 48 graduates, including three Aboriginal participants, in our Graduate Development Program across a range of disciplines including engineering, science, commerce and finance. Water Corporation continues to be one of the top 10 employers of graduates as voted for by graduates themselves in the Australian Association of Graduate Employers (AAGE) Annual Survey.
Our Undergraduate Vacation Program had a very large intake, hosting 21 university students, including one Aboriginal participant, from a range of different disciplines.
We are also ranked in the top 20 employers of trainees and apprentices in the State. Our Trainee and Apprentices Programs are currently training more than 60 trainees and 18 trade apprentices, with 28 Aboriginal participants.
Attracting Aboriginal graduatesDuring the year, we further improved our offering to Aboriginal graduates and are now attracting more tertiary students into our programs. Our main drawcards include offering a range of services, meaningful and challenging work, care for the environment, work-life balance, variety of opportunities and the chance to work across the State.
We are working with universities to enable ‘meet and greet’ opportunities with potential Aboriginal graduates and hiring managers. Graduates are also spending time working on the job to experience day-to-day operations.
Emerging Aboriginal Leadership ProgramAs part of our Leadership Framework and Aboriginal Employment Strategy, we developed our Emerging Aboriginal Leadership Program (EALP) to identify and further the leadership skills of our Aboriginal employees.
First Aboriginal Supplier TradeshowWe launched our first Aboriginal Supplier Tradeshow on 27 October 2017 to provide Aboriginal businesses with a platform to raise awareness about the diverse products and services they provide. Delivered in collaboration with our alliance partners, the tradeshow was recognised as a huge success with more than 250 attendees. It enhanced our reputation as a client of choice amongst Aboriginal suppliers and we look forward to working with our stakeholders in the delivery of future tradeshows.
White Ribbon Australia workplace accreditationWe are working with White Ribbon Australia on their world-first workplace accreditation program that will provide us with a range of tools to prevent and respond to incidents of violence occurring inside and outside the workplace. We anticipate completing all of the accreditation requirements in late 2018. As part of our response to this important social issue, we have also introduced 10 days’ paid Family and Domestic Violence Leave for our employees. This leave is available to employees who are affected by family or domestic violence.
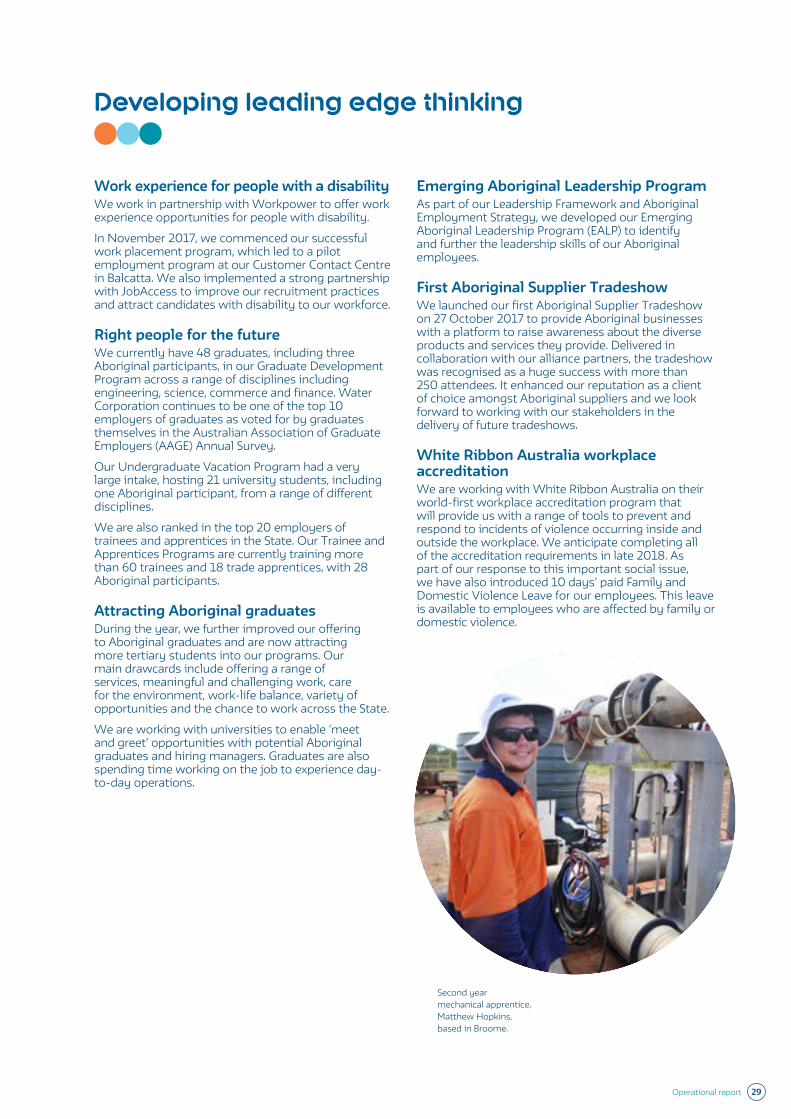
Second year mechanical apprentice, Matthew Hopkins, based in Broome.
Operational report 29

30 WATER CORPORATION 2018 Annual Report
Recognising innovation and success
Throughout the year, a number of our projects were recognised for innovation and success with coveted industry awards and acknowledgements.
WA Water Awards – Water Sensitive Urban Design Award – WinnerThe White Gum Valley Waterwise Development sets mains water efficiency targets beyond those considered as industry best practice. Working with LandCorp, Department of Water and Environmental Regulation, Josh Byrne & Associates and the Cooperative Research Centre for Water Sensitive Cities, this project won the Water Sensitive Urban Design (Grahame Heal) Award at the WA Water Awards.
WA Water Awards – Program Innovation Award – WinnerIn partnership with the Broome Lions Club, Wunan Foundation and Mamabulanjin Aboriginal Corporation, we delivered a number of projects that resulted in economic and social benefits for people in the Kimberley region. These projects were funded by the innovative disposal of recycled water at the Broome North Wastewater Treatment Plant and won the Program Innovation Award at the WA Water Awards.
Indigenous Music Awards – Community Music Clip of the Year – WinnerOur Save The Water music video won Community Music Clip of the Year at the National Indigenous Music Awards. The music clip was filmed in Halls Creek and features talented young people from the area encouraging the community to save water or “ngaba” in the local Aboriginal language.
WA Water Awards – Student Water Prize – WinnerSean Ding is a graduate mechanical engineer working in our field services branch. Mr Ding won the Student Water Prize at the WA Water Awards for his project that developed a set of tools to measure the remaining service life of bores and prioritise their replacement based on a set of criteria.
Digital Utility Awards – Best Use of New Technology – Runner UpOur virtual reality tool ‘Holodeck’ allows an operator to walk around a proposed asset before it’s built to identify and mitigate potential safety hazards during the engineering design process. This innovative tool was the Runner Up in the Best Use of New Technology category at the Digital Utility Awards.
Australian Web Awards – National FinalistOur “Don’t Feed the Monster” campaign was a national finalist at the Australian Web Awards. The engaging campaign reminded Western Australians to “only flush paper, pee and poo down the loo.”
NECA Excellence Award – WA State Winner and National WinnerThe Leonora Station Creek Telemetry Upgrade was a winner in the NECA Excellence Award. The innovative project replaced a labour-intensive system with a solar-powered, automated system that uses cost-effective communication technology.
Banksia Awards – Indigenous Leadership for Sustainability – FinalistTogether with our community partners in the Kimberley, we were a finalist in the category of Indigenous Leadership for Sustainability at the prestigious Banksia Sustainability Awards. This recognition demonstrates how we helped create projects that benefit local communities across the Kimberley in partnership with the Mamabulanjin Aboriginal Corporation, Wunan and Broome Lions Club.
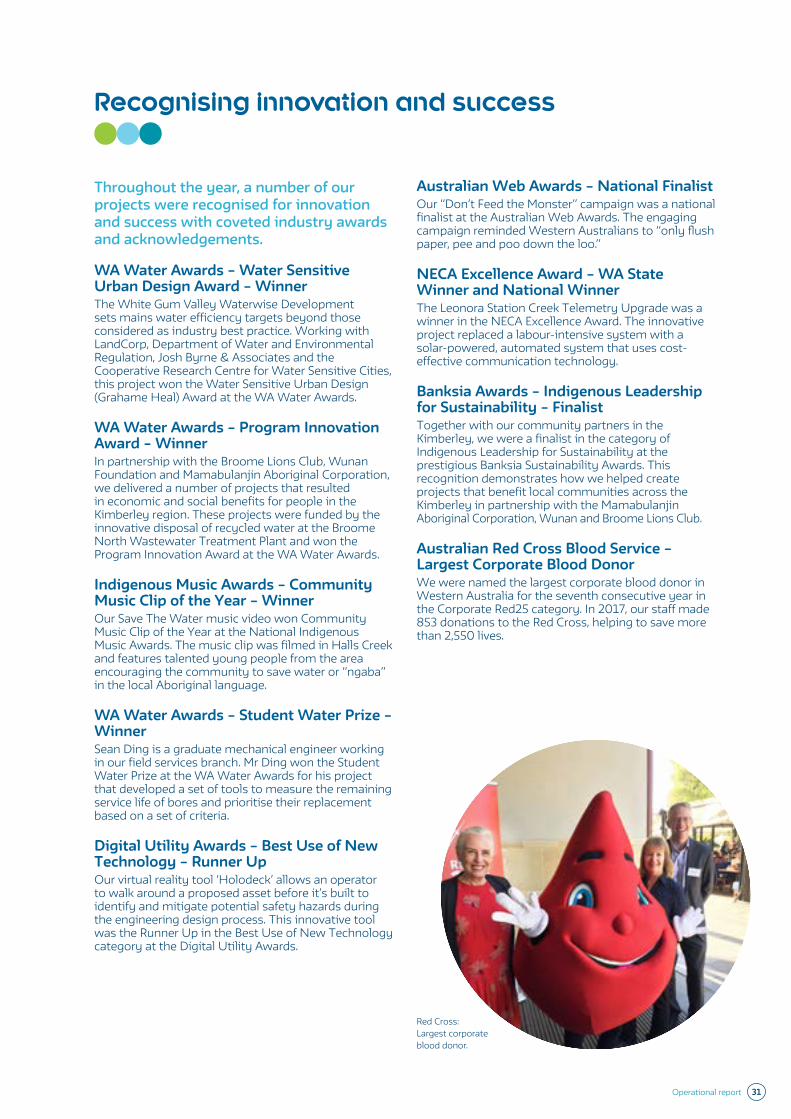
Australian Red Cross Blood Service – Largest Corporate Blood Donor We were named the largest corporate blood donor in Western Australia for the seventh consecutive year in the Corporate Red25 category. In 2017, our staff made 853 donations to the Red Cross, helping to save more than 2,550 lives.
Red Cross: Largest corporate blood donor.
Operational report 31
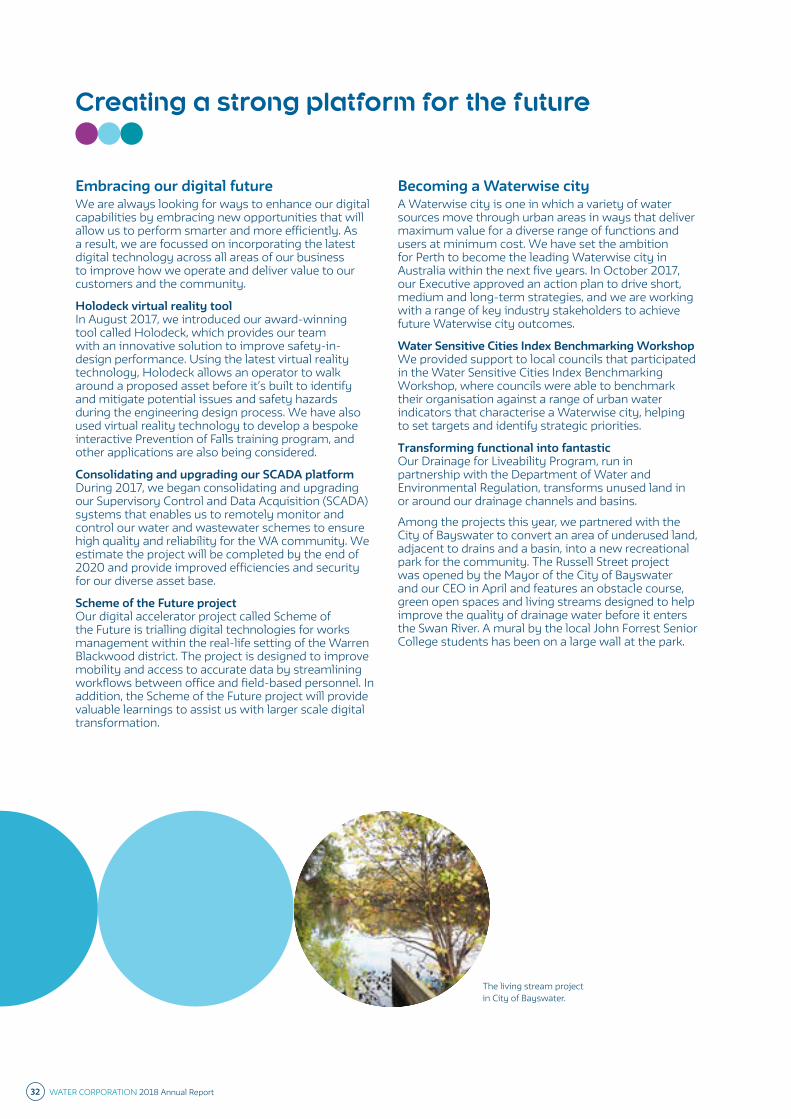
Creating a strong platform for the future
Embracing our digital futureWe are always looking for ways to enhance our digital capabilities by embracing new opportunities that will allow us to perform smarter and more efficiently. As a result, we are focussed on incorporating the latest digital technology across all areas of our business to improve how we operate and deliver value to our customers and the community.
Holodeck virtual reality toolIn August 2017, we introduced our award-winning tool called Holodeck, which provides our team with an innovative solution to improve safety-in-design performance. Using the latest virtual reality technology, Holodeck allows an operator to walk around a proposed asset before it’s built to identify and mitigate potential issues and safety hazards during the engineering design process. We have also used virtual reality technology to develop a bespoke interactive Prevention of Falls training program, and other applications are also being considered.
Consolidating and upgrading our SCADA platformDuring 2017, we began consolidating and upgrading our Supervisory Control and Data Acquisition (SCADA) systems that enables us to remotely monitor and control our water and wastewater schemes to ensure high quality and reliability for the WA community. We estimate the project will be completed by the end of 2020 and provide improved efficiencies and security for our diverse asset base.
Scheme of the Future projectOur digital accelerator project called Scheme of the Future is trialling digital technologies for works management within the real-life setting of the Warren Blackwood district. The project is designed to improve mobility and access to accurate data by streamlining workflows between office and field-based personnel. In addition, the Scheme of the Future project will provide valuable learnings to assist us with larger scale digital transformation.
Becoming a Waterwise cityA Waterwise city is one in which a variety of water sources move through urban areas in ways that deliver maximum value for a diverse range of functions and users at minimum cost. We have set the ambition for Perth to become the leading Waterwise city in Australia within the next five years. In October 2017, our Executive approved an action plan to drive short, medium and long-term strategies, and we are working with a range of key industry stakeholders to achieve future Waterwise city outcomes.
Water Sensitive Cities Index Benchmarking WorkshopWe provided support to local councils that participated in the Water Sensitive Cities Index Benchmarking Workshop, where councils were able to benchmark their organisation against a range of urban water indicators that characterise a Waterwise city, helping to set targets and identify strategic priorities.
Transforming functional into fantasticOur Drainage for Liveability Program, run in partnership with the Department of Water and Environmental Regulation, transforms unused land in or around our drainage channels and basins.
Among the projects this year, we partnered with the City of Bayswater to convert an area of underused land, adjacent to drains and a basin, into a new recreational park for the community. The Russell Street project was opened by the Mayor of the City of Bayswater and our CEO in April and features an obstacle course, green open spaces and living streams designed to help improve the quality of drainage water before it enters the Swan River. A mural by the local John Forrest Senior College students has been on a large wall at the park.
The living stream project in City of Bayswater.
32 WATER CORPORATION 2018 Annual Report
Tap In
33Tap in
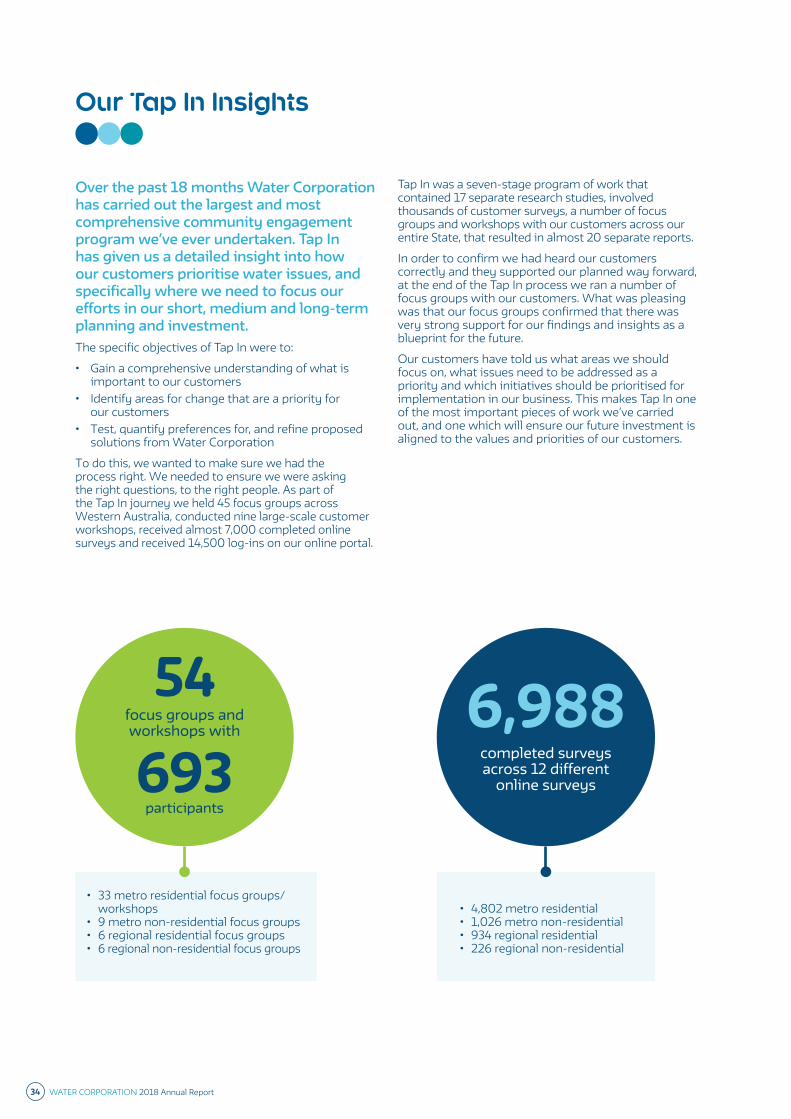
Our Tap In Insights
Over the past 18 months Water Corporation has carried out the largest and most comprehensive community engagement program we’ve ever undertaken. Tap In has given us a detailed insight into how our customers prioritise water issues, and specifically where we need to focus our efforts in our short, medium and long-term planning and investment.The specific objectives of Tap In were to:
• Gain a comprehensive understanding of what is important to our customers
• Identify areas for change that are a priority for our customers
• Test, quantify preferences for, and refine proposed solutions from Water Corporation
To do this, we wanted to make sure we had the process right. We needed to ensure we were asking the right questions, to the right people. As part of the Tap In journey we held 45 focus groups across Western Australia, conducted nine large-scale customer workshops, received almost 7,000 completed online surveys and received 14,500 log-ins on our online portal.
Tap In was a seven-stage program of work that contained 17 separate research studies, involved thousands of customer surveys, a number of focus groups and workshops with our customers across our entire State, that resulted in almost 20 separate reports.
In order to confirm we had heard our customers correctly and they supported our planned way forward, at the end of the Tap In process we ran a number of focus groups with our customers. What was pleasing was that our focus groups confirmed that there was very strong support for our findings and insights as a blueprint for the future.
Our customers have told us what areas we should focus on, what issues need to be addressed as a priority and which initiatives should be prioritised for implementation in our business. This makes Tap In one of the most important pieces of work we’ve carried out, and one which will ensure our future investment is aligned to the values and priorities of our customers.
54 focus groups and workshops with
693 participants
6,988completed surveys across 12 different
online surveys
• 33 metro residential focus groups/workshops
• 9 metro non-residential focus groups• 6 regional residential focus groups• 6 regional non-residential focus groups
• 4,802 metro residential • 1,026 metro non-residential • 934 regional residential• 226 regional non-residential
34 WATER CORPORATION 2018 Annual Report
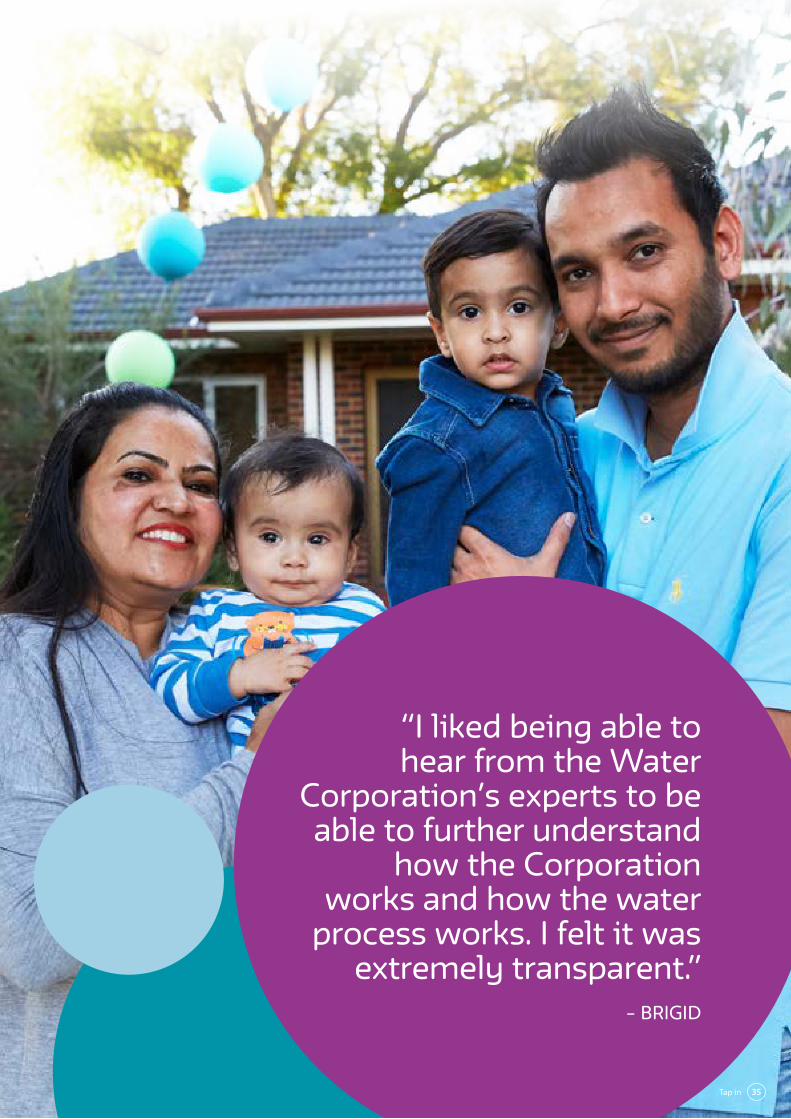
“I liked being able to hear from the Water
Corporation’s experts to be able to further understand
how the Corporation works and how the water
process works. I felt it was extremely transparent.”
– BRIGID
35Tap in
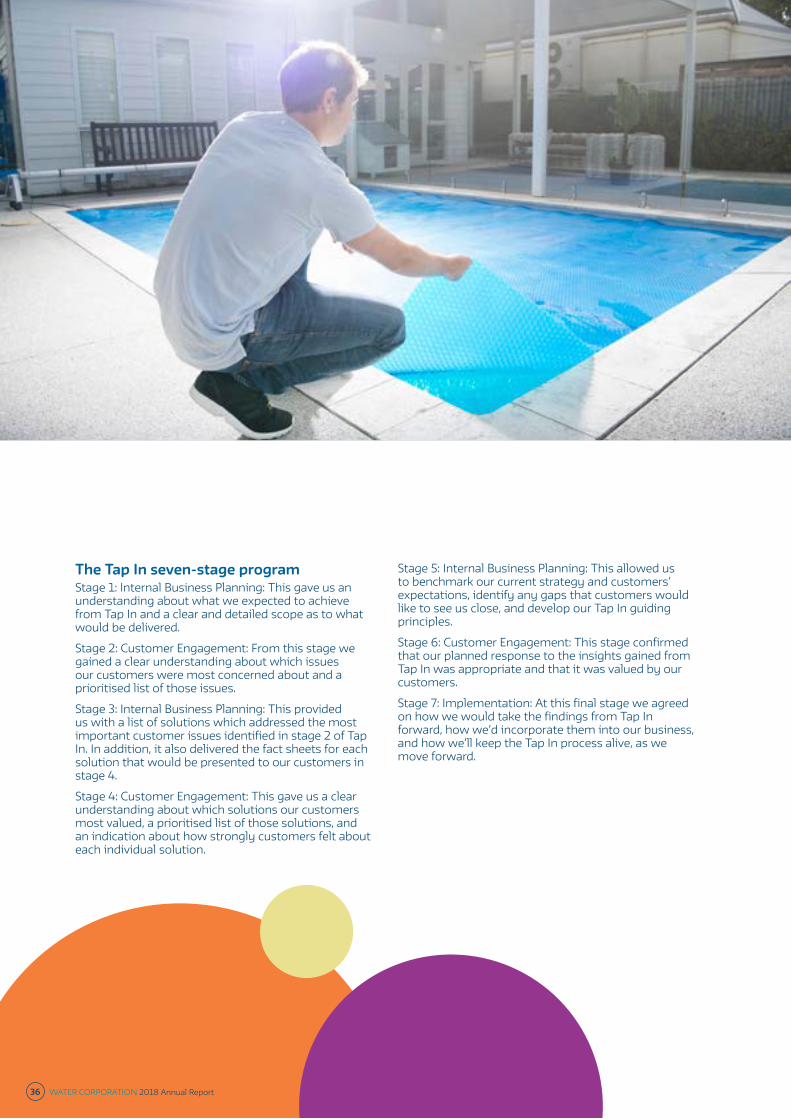
The Tap In seven-stage programStage 1: Internal Business Planning: This gave us an understanding about what we expected to achieve from Tap In and a clear and detailed scope as to what would be delivered.
Stage 2: Customer Engagement: From this stage we gained a clear understanding about which issues our customers were most concerned about and a prioritised list of those issues.
Stage 3: Internal Business Planning: This provided us with a list of solutions which addressed the most important customer issues identified in stage 2 of Tap In. In addition, it also delivered the fact sheets for each solution that would be presented to our customers in stage 4.
Stage 4: Customer Engagement: This gave us a clear understanding about which solutions our customers most valued, a prioritised list of those solutions, and an indication about how strongly customers felt about each individual solution.
Stage 5: Internal Business Planning: This allowed us to benchmark our current strategy and customers’ expectations, identify any gaps that customers would like to see us close, and develop our Tap In guiding principles.
Stage 6: Customer Engagement: This stage confirmed that our planned response to the insights gained from Tap In was appropriate and that it was valued by our customers.
Stage 7: Implementation: At this final stage we agreed on how we would take the findings from Tap In forward, how we’d incorporate them into our business, and how we’ll keep the Tap In process alive, as we move forward.
36 WATER CORPORATION 2018 Annual Report
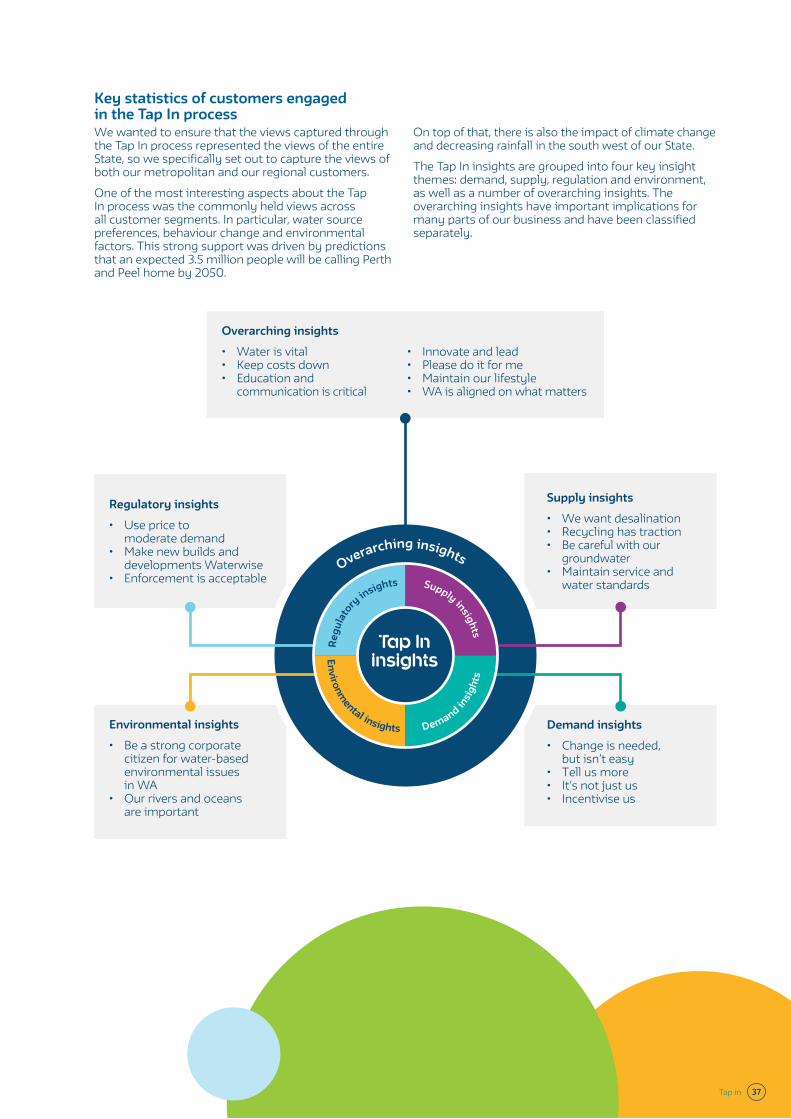
Key statistics of customers engaged in the Tap In processWe wanted to ensure that the views captured through the Tap In process represented the views of the entire State, so we specifically set out to capture the views of both our metropolitan and our regional customers.
One of the most interesting aspects about the Tap In process was the commonly held views across all customer segments. In particular, water source preferences, behaviour change and environmental factors. This strong support was driven by predictions that an expected 3.5 million people will be calling Perth and Peel home by 2050.
On top of that, there is also the impact of climate change and decreasing rainfall in the south west of our State.
The Tap In insights are grouped into four key insight themes: demand, supply, regulation and environment, as well as a number of overarching insights. The overarching insights have important implications for many parts of our business and have been classified separately.
Regulatory insights
• Use price to moderate demand
• Make new builds and developments Waterwise
• Enforcement is acceptable
Supply insights
• We want desalination • Recycling has traction• Be careful with our
groundwater• Maintain service and
water standards
Demand insights
• Change is needed, but isn’t easy
• Tell us more• It’s not just us• Incentivise us
Environmental insights
• Be a strong corporate citizen for water-based environmental issues in WA
• Our rivers and oceans are important
Overarching insights
• Water is vital• Keep costs down• Education and
communication is critical
• Innovate and lead• Please do it for me• Maintain our lifestyle• WA is aligned on what matters
Tap Ininsights
Regu
lato
ry insights Supply insights
Environmental insights Demand in
sigh
ts
Overarching insights
Tap in 37
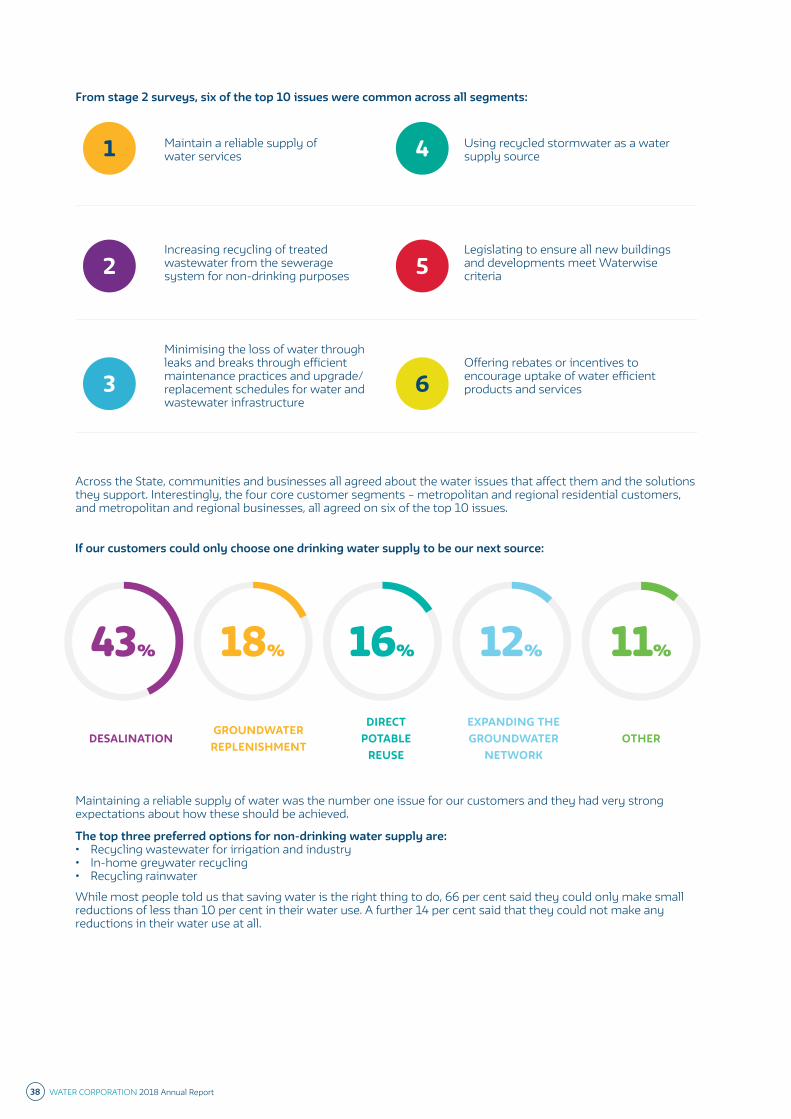
Across the State, communities and businesses all agreed about the water issues that affect them and the solutions they support. Interestingly, the four core customer segments – metropolitan and regional residential customers, and metropolitan and regional businesses, all agreed on six of the top 10 issues.
Maintaining a reliable supply of water was the number one issue for our customers and they had very strong expectations about how these should be achieved.
The top three preferred options for non-drinking water supply are:• Recycling wastewater for irrigation and industry• In-home greywater recycling• Recycling rainwater
While most people told us that saving water is the right thing to do, 66 per cent said they could only make small reductions of less than 10 per cent in their water use. A further 14 per cent said that they could not make any reductions in their water use at all.
Maintain a reliable supply of water services
Using recycled stormwater as a water supply source
Increasing recycling of treated wastewater from the sewerage system for non-drinking purposes
Legislating to ensure all new buildings and developments meet Waterwise criteria
Minimising the loss of water through leaks and breaks through efficient maintenance practices and upgrade/replacement schedules for water and wastewater infrastructure
Offering rebates or incentives to encourage uptake of water efficient products and services
1
2
3
4
5
6
From stage 2 surveys, six of the top 10 issues were common across all segments:
If our customers could only choose one drinking water supply to be our next source:
43% 18% 16% 12%
DESALINATIONGROUNDWATER
REPLENISHMENT
DIRECT POTABLE
REUSE
EXPANDING THE GROUNDWATER
NETWORKOTHER
11%
38 WATER CORPORATION 2018 Annual Report
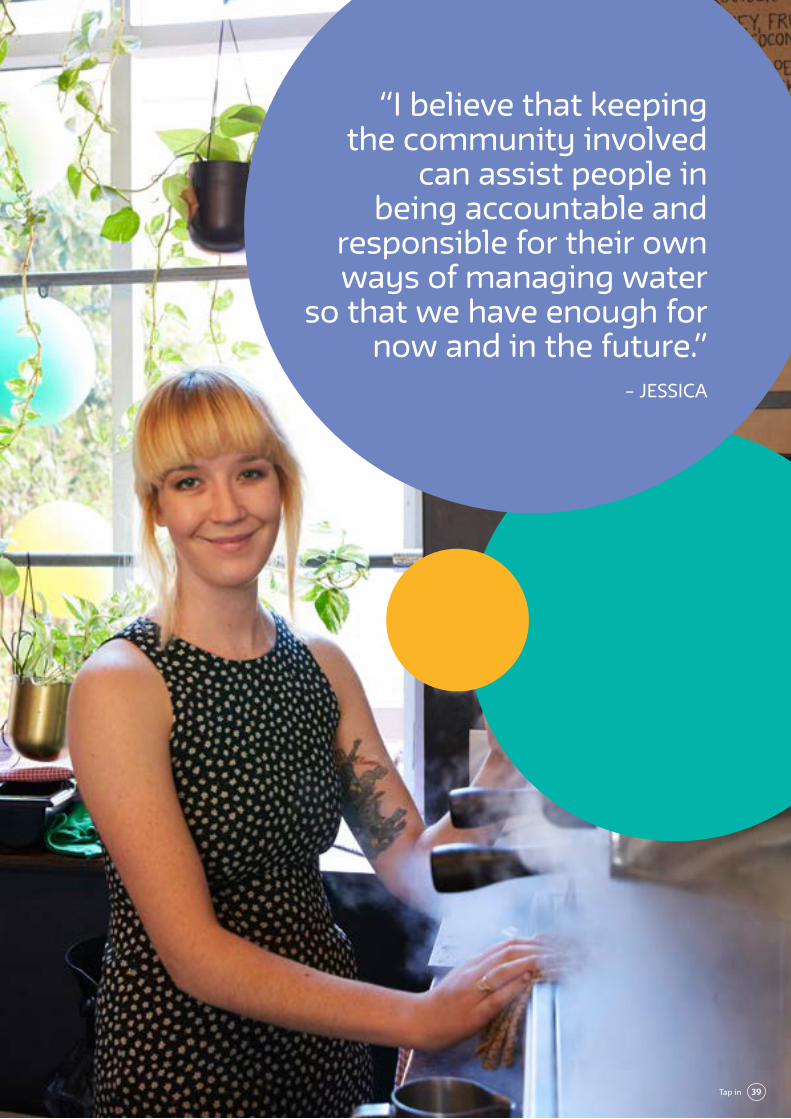
“I believe that keeping the community involved
can assist people in being accountable and
responsible for their own ways of managing water
so that we have enough for now and in the future.”
– JESSICA
39Tap in
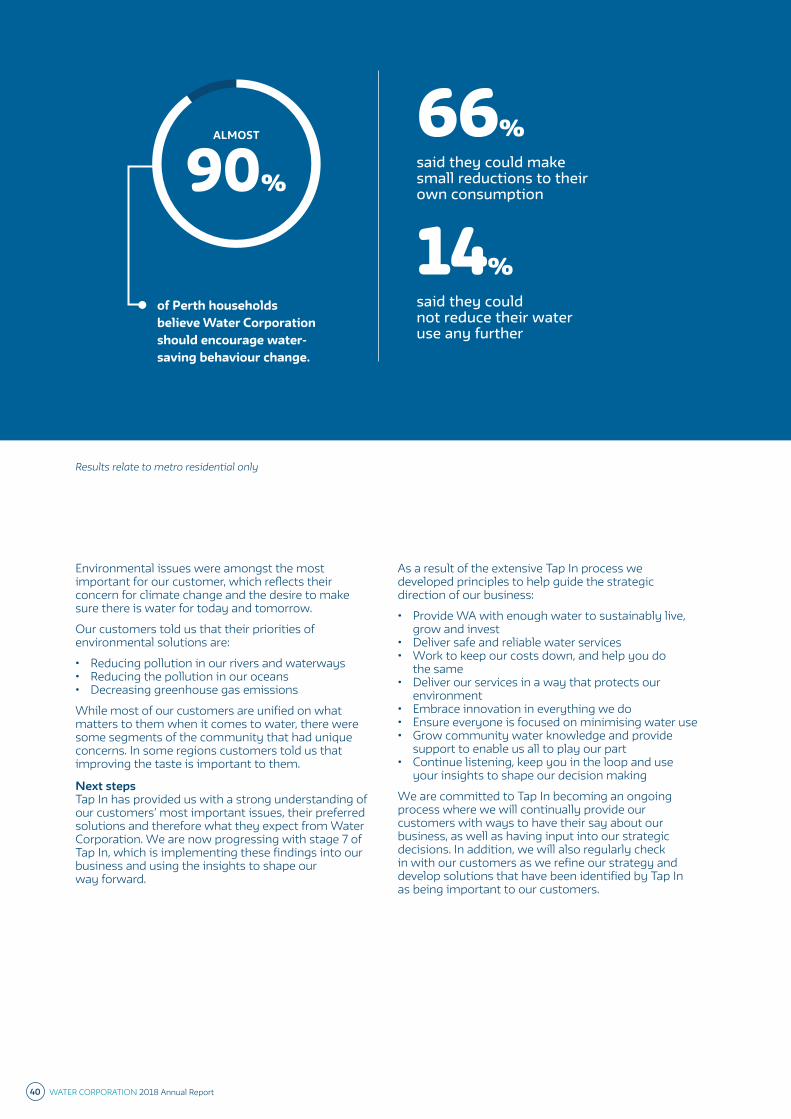
Environmental issues were amongst the most important for our customer, which reflects their concern for climate change and the desire to make sure there is water for today and tomorrow.
Our customers told us that their priorities of environmental solutions are:
• Reducing pollution in our rivers and waterways• Reducing the pollution in our oceans• Decreasing greenhouse gas emissions
While most of our customers are unified on what matters to them when it comes to water, there were some segments of the community that had unique concerns. In some regions customers told us that improving the taste is important to them.
Next stepsTap In has provided us with a strong understanding of our customers’ most important issues, their preferred solutions and therefore what they expect from Water Corporation. We are now progressing with stage 7 of Tap In, which is implementing these findings into our business and using the insights to shape our way forward.
As a result of the extensive Tap In process we developed principles to help guide the strategic direction of our business:
• Provide WA with enough water to sustainably live, grow and invest
• Deliver safe and reliable water services • Work to keep our costs down, and help you do
the same• Deliver our services in a way that protects our
environment• Embrace innovation in everything we do• Ensure everyone is focused on minimising water use• Grow community water knowledge and provide
support to enable us all to play our part• Continue listening, keep you in the loop and use
your insights to shape our decision making
We are committed to Tap In becoming an ongoing process where we will continually provide our customers with ways to have their say about our business, as well as having input into our strategic decisions. In addition, we will also regularly check in with our customers as we refine our strategy and develop solutions that have been identified by Tap In as being important to our customers.
66%said they could make small reductions to their own consumption
14% said they could not reduce their water use any further
of Perth households believe Water Corporation should encourage water- saving behaviour change.
ALMOST
90%
Results relate to metro residential only
40 WATER CORPORATION 2018 Annual Report
Corporate governance report
Corporate governance report 41
Corporate governance report
Our approach to corporate governance is based on a set of values and behaviours that underpin our culture and business practices. This approach includes a commitment to robust governance standards that is fundamental to the sustainability of our operations and our performance.This section includes a description of our main corporate governance practices, which form a framework to ensure we act with high standards of corporate behaviour and in the best interests of our owner.
The Board of DirectorsThe structure of the Board is subject to the following parameters:
• The Board must comprise of at least six and not more than seven directors (the Chief Executive Officer is the only Executive Director).
• The Directors are appointed for terms of up to three years and are eligible for re-appointment.
• The Board should comprise of Directors with a broad range of skills and experience.
• Board meetings are generally held once a month at our head office in Leederville.
Key activitiesThe Board, in consultation with management, develops our strategic direction for the immediate and long-term horizons. We have a Statement of Corporate Intent (SCI) covering 12 months, and a five-year Strategic Development Plan (SDP), which are updated every year.
Both documents were developed for the 2017-18 year and agreed with the Minister.
At its regular meetings, the Board considerations include:
• Safety performance• Strategy and risk issues• The capital program• The award of contracts for major projects• Financial matters• Key operational matters
Appointment of DirectorsThe Western Australian Governor appoints non-executive Directors on the nomination of the Minister for Water. This is after consultation with, or on the recommendation of, the Board.
Appointments are typically staggered to ensure that one third of the Directors retire each year. Subject to reappointment, there is no limit on the time a Director may serve on the Board. Their duties are not full-time.
Chief Executive Officer appointments are made by the Board, subject to the Minister’s agreement. The Board can appoint a person to act in place of the Chief Executive Officer during a vacancy in that office.
Changes to the BoardDr Jemma Green was appointed Director for a term expiring on 31 December 2019.
Mrs Nicole Lockwood was re-appointed as Director for a term expiring on 31 December 2020.
There was no other change to the composition of the Board during the year.
Board committeesCommittees of the Board that operated during the year ended 30 June 2018 were:
• Audit and Risk• Safety and Wellbeing• Remuneration
From time to time the Board convened working committees to deal with specific strategic issues.
Audit and Risk CommitteeDuring the year, the Audit and Compliance Committee changed its name to Audit and Risk Committee to reflect industry practice. This was approved at the September 2017 Board meeting. The Audit and Risk Committee was chaired by Mr David Lock and included Directors Mrs Nicole Lockwood and Dr Jemma Green (from 3 July 2017). Each member has substantial corporate and/or financial experience in private enterprise and the necessary skills to undertake the Committee’s responsibilities.
The Audit and Risk Committee invited management, auditors or others to attend meetings and provide information, as necessary. External attendees at various meetings during the year included staff of the Office of the Auditor General (OAG) and the external auditors appointed by the OAG to undertake our annual audit, which is presently KPMG.
Principal activities and dutiesThe Audit and Risk Committee assists the Board with its oversight of the financial reporting process, the system of internal control, risk management, the audit process, and our process for monitoring compliance with applicable laws and regulations.
The Committee oversees the internal audit function and liaises with the external auditor.
42 WATER CORPORATION 2018 Annual Report
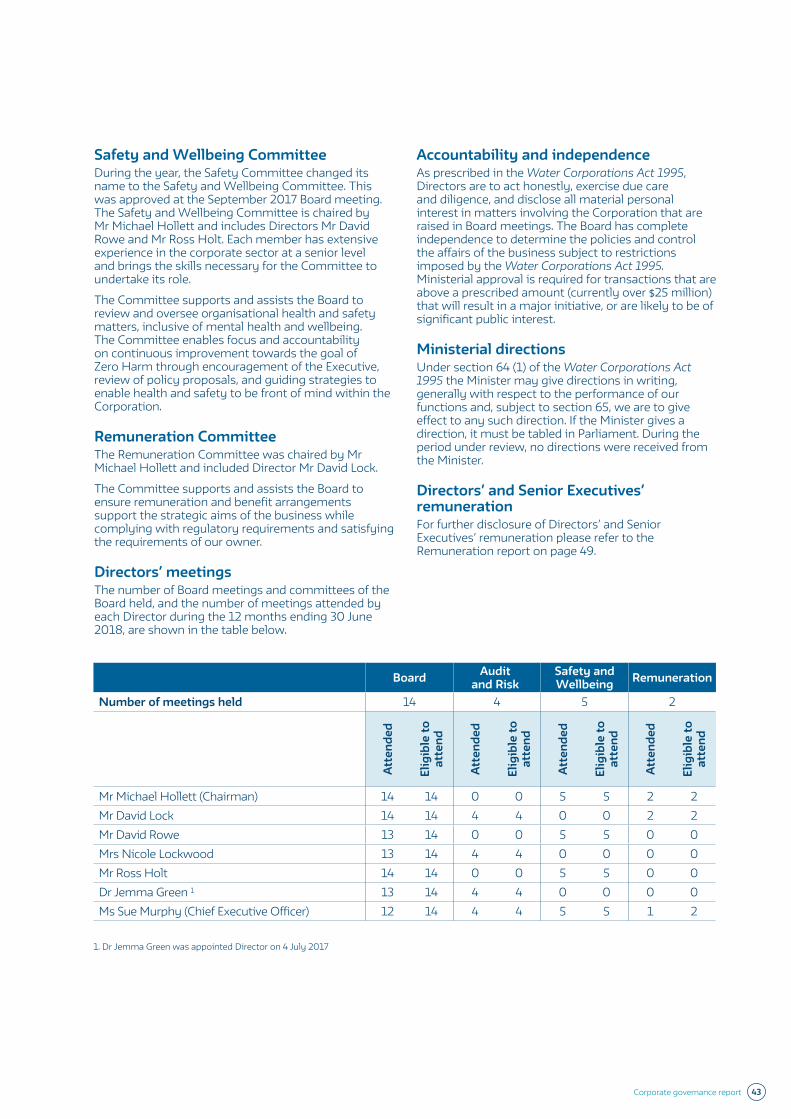
Safety and Wellbeing CommitteeDuring the year, the Safety Committee changed its name to the Safety and Wellbeing Committee. This was approved at the September 2017 Board meeting. The Safety and Wellbeing Committee is chaired by Mr Michael Hollett and includes Directors Mr David Rowe and Mr Ross Holt. Each member has extensive experience in the corporate sector at a senior level and brings the skills necessary for the Committee to undertake its role.
The Committee supports and assists the Board to review and oversee organisational health and safety matters, inclusive of mental health and wellbeing. The Committee enables focus and accountability on continuous improvement towards the goal of Zero Harm through encouragement of the Executive, review of policy proposals, and guiding strategies to enable health and safety to be front of mind within the Corporation.
Remuneration CommitteeThe Remuneration Committee was chaired by Mr Michael Hollett and included Director Mr David Lock.
The Committee supports and assists the Board to ensure remuneration and benefit arrangements support the strategic aims of the business while complying with regulatory requirements and satisfying the requirements of our owner.
Directors’ meetingsThe number of Board meetings and committees of the Board held, and the number of meetings attended by each Director during the 12 months ending 30 June 2018, are shown in the table below.
Accountability and independenceAs prescribed in the Water Corporations Act 1995, Directors are to act honestly, exercise due care and diligence, and disclose all material personal interest in matters involving the Corporation that are raised in Board meetings. The Board has complete independence to determine the policies and control the affairs of the business subject to restrictions imposed by the Water Corporations Act 1995. Ministerial approval is required for transactions that are above a prescribed amount (currently over $25 million) that will result in a major initiative, or are likely to be of significant public interest.
Ministerial directionsUnder section 64 (1) of the Water Corporations Act 1995 the Minister may give directions in writing, generally with respect to the performance of our functions and, subject to section 65, we are to give effect to any such direction. If the Minister gives a direction, it must be tabled in Parliament. During the period under review, no directions were received from the Minister.
Directors’ and Senior Executives’ remunerationFor further disclosure of Directors’ and Senior Executives’ remuneration please refer to the Remuneration report on page 49.
Board Audit and Risk
Safety and Wellbeing Remuneration
Number of meetings held 14 4 5 2
Atte
nded
Elig
ible
to
atte
nd
Atte
nded
Elig
ible
to
atte
nd
Atte
nded
Elig
ible
to
atte
nd
Atte
nded
Elig
ible
to
atte
nd
Mr Michael Hollett (Chairman) 14 14 0 0 5 5 2 2Mr David Lock 14 14 4 4 0 0 2 2Mr David Rowe 13 14 0 0 5 5 0 0Mrs Nicole Lockwood 13 14 4 4 0 0 0 0Mr Ross Holt 14 14 0 0 5 5 0 0Dr Jemma Green 1 13 14 4 4 0 0 0 0Ms Sue Murphy (Chief Executive Officer) 12 14 4 4 5 5 1 2
1. Dr Jemma Green was appointed Director on 4 July 2017
Corporate governance report 43
Governance frameworkThe Board has legislative authority under the Water Corporations Act 1995, to perform the functions and determine the policies that control our activities.
The Board is responsible for our overall corporate governance and approves strategic direction and budgets, ensuring legal compliance, ethical behaviour and proper risk management processes are in place and operate effectively. Comprehensive monthly reports are provided to the Board to allow it to monitor performance.
Internal controlThe Board, through the Audit and Risk Committee, has oversight of the financial reporting process, the system of internal control, risk management, the audit process, and our process for monitoring compliance with applicable laws and regulations. These responsibilities assist in maintaining an effective internal control structure.
It consists, in part, of organisational arrangements with clearly defined lines of responsibility and delegation of authority, and comprehensive systems and control procedures. Management has the responsibility for establishing and maintaining the system of internal control that supports the achievement of our business objectives.
This system of internal control is designed to manage and mitigate rather than eliminate the risks of failure to achieve business objectives. It can only provide reasonable and not absolute assurance of the effectiveness of the system of internal control implemented by management. An important element of the control environment is an ongoing internal audit program, delivered by Management Review and Audit.
Management review and auditOur internal audit function is managed by the Risk and Assurance Business Unit’s Management Review and Audit section, which has the authority to examine any matters referred to it by the Audit and Risk Committee, the Board of Directors or the Chief Executive Officer. The internal audit function supports the Audit and Risk Committee and senior executives by independently and objectively reviewing the adequacy, efficiency and effectiveness of the internal control and governance system with the Corporation.
External auditorsIn accordance with the Water Corporations Act 1995, we must have the financial report for a financial year audited by the Auditor General. The Auditor General has outsourced the audit to KPMG for a three-year term. Total auditor remuneration is shown in Note 19 to the Financial Statements on page 76.
Risk managementRisk management is a key element of our governance framework. We have an established Risk Management Framework that provides a common understanding of risk and a set of processes for managing risk aligned with the International Standard on Risk Management AS/NZS ISO 31000:2018. The Framework ensures a formalised, structured and corporation wide approach to the identification, evaluation and control of risks, which have the potential to threaten the achievement of our objectives and our ability to provide services.
All managers are responsible for the identification and management of risks that will impact on their business processes and subsequent objectives. The management of risk within the business is embedded at all levels, with appropriate support and systems in place to ensure risks are managed to an acceptable level.
A comprehensive commercial insurance program is maintained covering insurable risks, which may have a significant impact on our assets, construction activities and legal liability.
Performance monitoring and reportingWe provide written quarterly reports and this Annual Report to the Minister for Water detailing our performance and progress made in fulfilling the Statement of Corporate Intent. A written annual report on compliance with the Water Services Licence was also provided to the Economic Regulation Authority. In addition, the Board and Corporate Executive received monthly performance reports covering a diverse range of financial and non-financial matters.
Ethical standardsWe require all Directors, employees and contractors to exercise high standards of ethical behaviour in carrying out their duties.
Our Code of Conduct is available on both the Corporation’s external and internal websites. A report on compliance is forwarded to the Public Sector Commission.
The Board Charter, available on our website, sets out the roles and responsibilities of the Board and management. Under the guidance of the Audit and Risk Committee the Charter was drafted using the Water Corporations Act 1995, Australian Standards and other corporate governance resources.
44 WATER CORPORATION 2018 Annual Report
Managing financial exposuresWe have a central Treasury function to manage financial exposures in accordance with our Treasury Risk Management Policy. Regular reporting ensures the Board can monitor financial risk management.
Information security management systemWe maintain an enterprise information security management framework that is based on the Australian Standard for Information Technology – Security Techniques – Information security management systems AS/ NZS ISO/IEC 27001:2013.
State Records Act 2000In accordance with Section 61 of the State Records Act 2000 and the State Records Commission Standards (Standard 2 – Principle 6), we have an approved Recordkeeping Plan. In accordance with s.28 (5) of the Act, an updated Plan was submitted to the Minister and endorsed in September 2014. The Plan describes how records are created, maintained, managed and disposed of in accordance with our Standards and Principles. We regularly conduct audits of recordkeeping practices and system use by our staff and alliance partners. Regular in-house records and document management training is conducted and feedback and evaluation is sought from all attendees. The course is also available online for regional officers.
We have an online induction process for all new staff, which includes information on employee roles and responsibilities and how they comply with the approved Recordkeeping Plan. It also includes ‘Information on Record Keeping and Information Management Compliance for Water Corporation’ and ‘Information Security Awareness’.
Information management, including records management, is acknowledged as critical to the effectiveness and success of the business and we are committed to continuously improving its management.
Public Interest Disclosure StatementThe Public Interest Disclosures Act 2003 was enacted to protect the privacy and confidentiality of both the individual making a public interest disclosure and the subject of that disclosure. Public Interest Disclosure Officers have been appointed. Internal procedures relating to our obligations under the Act have been implemented in accordance with the guidelines provided by the Public Sector Commission. There were no public interest disclosures in the period under review.
Conflicts of interestWe have established procedures to identify, prevent, or resolve conflicts of interest, which are outlined in our procurement standards and code of conduct.
All our personnel with duties related to the negotiation of contracts must disclose current or prospective interests to their immediate supervisor. If known, they must also disclose the interests of members of their immediate family.
In such cases, we will assess the appropriateness of the situation and determine if the basis of that interest should be discontinued, or if the person should cease the duties involved, or if it is proper and ethical to continue the transaction.
Competition and Consumer Act Compliance ProgramIn accordance with the standards and guidelines recommended by the Australian Competition and Consumer Commission (ACCC), we conduct a Competition and Consumer Act Compliance Program to manage the risk of breaching the Act. To ensure that all employees are aware of their obligations, a State-wide program is conducted that includes mandatory training.
Freedom of informationWe met our obligations under the Freedom of Information Act 1992.
During 2017-18 we received 40 access applications, of which none were transferred in full to another agency, 10 were provided full access, 24 were provided edited access, none were withdrawn, six had access refused, none had access deferred, documents were not found or do not exist for one of the applications and four were on hand at the end of the year.
Five internal reviews were requested. Fees and charges totalling $1,050 were received for processing these applications with 23 days being the average processing time.
Under Section 96 of the Freedom of Information Act 1992, we are required to produce an Information Statement. Its purpose is to provide a description of our procedures to give members of the public access to our documents, as well as the types of documents we hold. This statement can be found at watercorporation.com.au
Corporate governance report 45
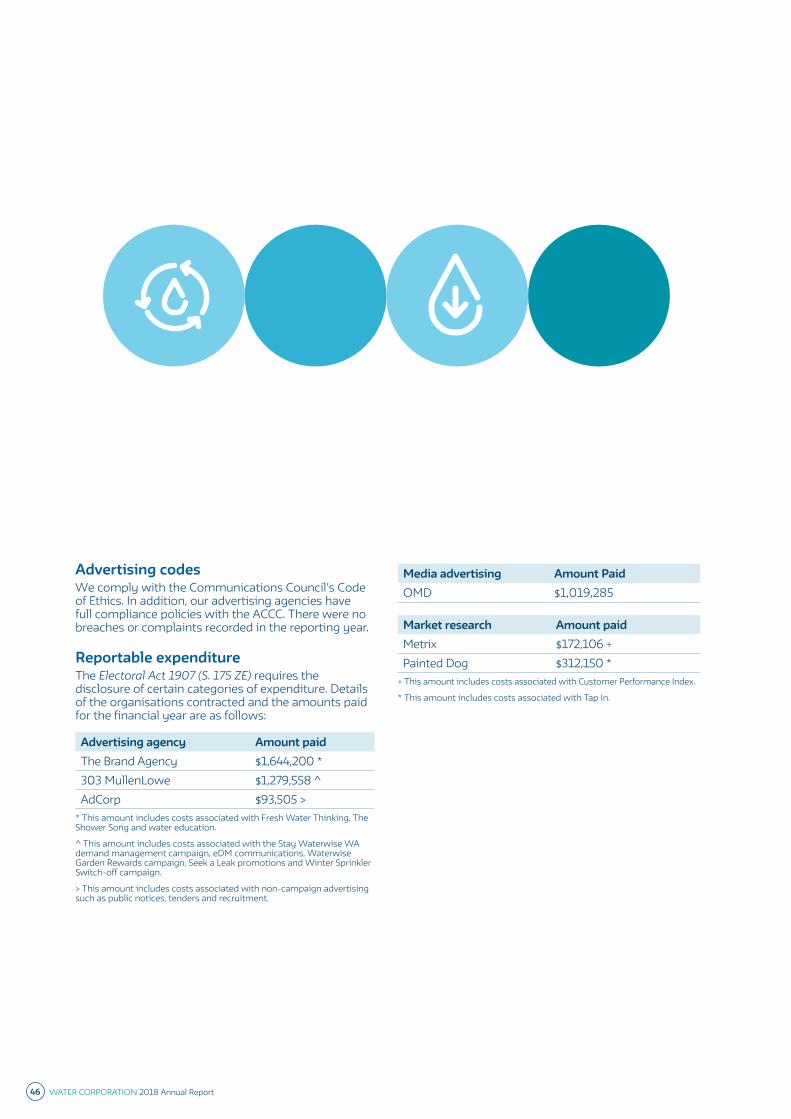
Advertising codesWe comply with the Communications Council’s Code of Ethics. In addition, our advertising agencies have full compliance policies with the ACCC. There were no breaches or complaints recorded in the reporting year.
Reportable expenditureThe Electoral Act 1907 (S. 175 ZE) requires the disclosure of certain categories of expenditure. Details of the organisations contracted and the amounts paid for the financial year are as follows:
Advertising agency Amount paidThe Brand Agency $1,644,200 *303 MullenLowe $1,279,558 ^AdCorp $93,505 >
* This amount includes costs associated with Fresh Water Thinking, The Shower Song and water education.
^ This amount includes costs associated with the Stay Waterwise WA demand management campaign, eDM communications, Waterwise Garden Rewards campaign, Seek a Leak promotions and Winter Sprinkler Switch-off campaign.
> This amount includes costs associated with non-campaign advertising such as public notices, tenders and recruitment.
Media advertising Amount PaidOMD $1,019,285
Market research Amount paidMetrix $172,106 +Painted Dog $312,150 *
+ This amount includes costs associated with Customer Performance Index.
* This amount includes costs associated with Tap In.
46 WATER CORPORATION 2018 Annual Report
Director’s report
The Directors of Water Corporation present their report for the 12 months ended 30 June 2018.
DirectorsThe following persons were Directors of Water Corporation at the date of this report:
Mr Michael Hollett (Chairman)Director since 1 January 2012 Chairman since 1 January 2017
Ms Sue MurphyChief Executive Officer since 6 November 2008
Mr David Lock (Deputy Chairman)Director since 1 January 2014 Deputy Chairman since 1 January 2017
Mr David RoweDirector since 1 March 2016
Ms Nicole LockwoodDirector since 1 March 2016
Mr Ross HoltDirector since 8 June 2016
Dr Jemma GreenDirector since 4 July 2017
Directors’ biographies are shown on pages 11 and 12. Directors’ meetings and attendance are shown on page 43. Directors’ compensation details are shown on page 49.
Principal activitiesWater Corporation was established as a body corporate under the provisions of the Water Corporations Act 1995 and is the principal water utility in Western Australia. Water, wastewater, drainage and irrigation services are provided under this Act and other legislation and subsidiary legislation, which control the water industry.
Our principal functions are:
• Acquire, store, treat, distribute, market and otherwise supply water for any purpose.
• Collect, store, treat, market and dispose of wastewater and surplus water.
• Undertake, maintain and operate any works, system, facilities, apparatus or equipment required for any of these purposes.
There has been no significant change in the nature of our activities during 2017-18.
DividendsDividends paid or declared by Water Corporation since the end of the previous financial year were:
Total amount $M Date of payment
Final 2016-17 15 22/12/2017
Interim 2017-18 513 28/06/2018
Total 528
Dividend declared after end of yearNo final dividend has been declared after balance date.
Review of operationsWe operate in a regulatory framework comprising the Economic Regulation Authority, and Departments of Water and Environmental Regulation, Health, and Biodiversity Conservation and Attractions.
Clear commercial objectives and strict environmental targets and accountabilities have been established through the Statement of Corporate Intent and a system of licences through the various regulators.
During the year, we supplied 363 billion litres of water and treated 164 billion litres of wastewater.
Risk managementOur Risk Management Framework aims to improve the quality of information considered in delivering better informed assessments for the purpose of resource allocation, increasing transparency in decision making and clearly articulated accountability.
Remuneration reportRemuneration of key management personnel is referred to as compensation throughout this report. Key management personnel comprise the Directors of the Board and Executives who are responsible for planning, directing and controlling the activities of the Corporation.
Compensation levels for key management personnel are set at a level sufficient to attract and retain appropriately qualified and experienced Directors and Executives.
The compensation of the non-executive Directors of the Board is determined following independent advice from management remuneration consultants and the State Government’s Salaries and Allowances Tribunal (SAT) on an ad-hoc basis and is agreed by the Minister. The compensation is in the form of salary and superannuation contributions. Other than compulsory superannuation contributions and superannuation via salary sacrifice, Water Corporation does not pay any other post-employment benefits to non-executive Directors. Director’s remuneration has not been increased since December 2014.
Corporate governance report 47
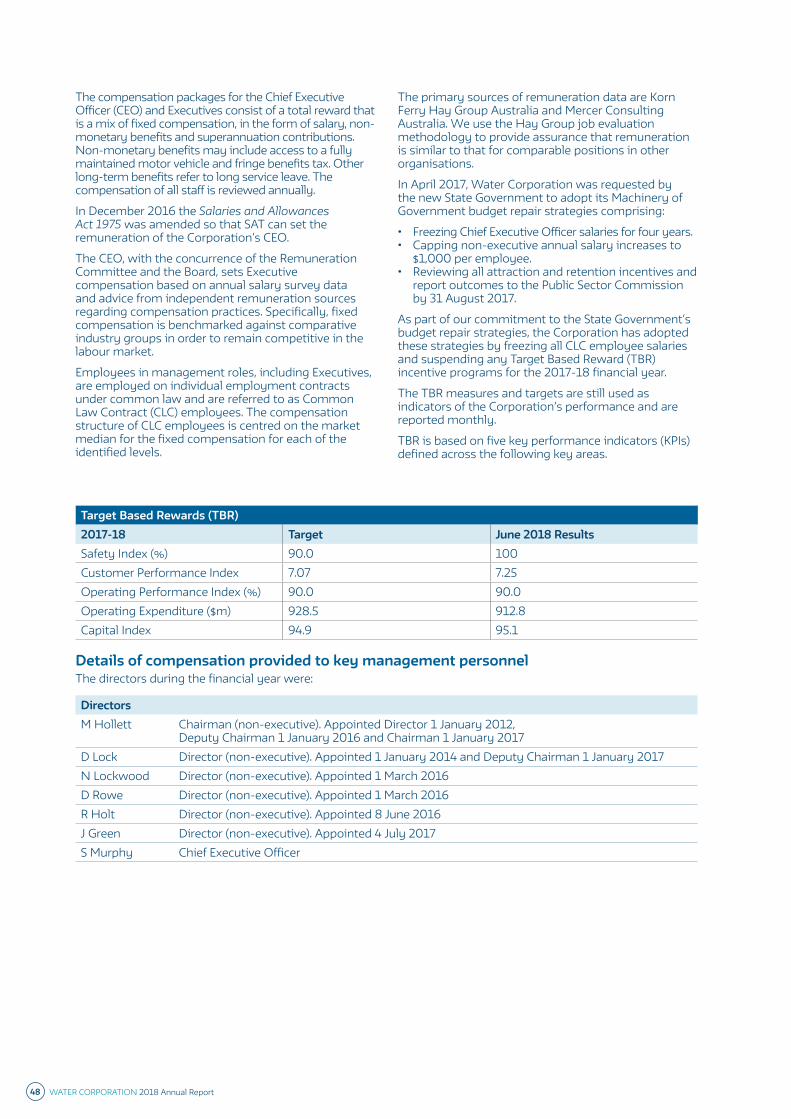
The compensation packages for the Chief Executive Officer (CEO) and Executives consist of a total reward that is a mix of fixed compensation, in the form of salary, non-monetary benefits and superannuation contributions. Non-monetary benefits may include access to a fully maintained motor vehicle and fringe benefits tax. Other long-term benefits refer to long service leave. The compensation of all staff is reviewed annually.
In December 2016 the Salaries and Allowances Act 1975 was amended so that SAT can set the remuneration of the Corporation’s CEO.
The CEO, with the concurrence of the Remuneration Committee and the Board, sets Executive compensation based on annual salary survey data and advice from independent remuneration sources regarding compensation practices. Specifically, fixed compensation is benchmarked against comparative industry groups in order to remain competitive in the labour market.
Employees in management roles, including Executives, are employed on individual employment contracts under common law and are referred to as Common Law Contract (CLC) employees. The compensation structure of CLC employees is centred on the market median for the fixed compensation for each of the identified levels.
The primary sources of remuneration data are Korn Ferry Hay Group Australia and Mercer Consulting Australia. We use the Hay Group job evaluation methodology to provide assurance that remuneration is similar to that for comparable positions in other organisations.
In April 2017, Water Corporation was requested by the new State Government to adopt its Machinery of Government budget repair strategies comprising:
• Freezing Chief Executive Officer salaries for four years.• Capping non-executive annual salary increases to
$1,000 per employee.• Reviewing all attraction and retention incentives and
report outcomes to the Public Sector Commission by 31 August 2017.
As part of our commitment to the State Government’s budget repair strategies, the Corporation has adopted these strategies by freezing all CLC employee salaries and suspending any Target Based Reward (TBR) incentive programs for the 2017-18 financial year.
The TBR measures and targets are still used as indicators of the Corporation’s performance and are reported monthly.
TBR is based on five key performance indicators (KPIs) defined across the following key areas.
Target Based Rewards (TBR)2017-18 Target June 2018 ResultsSafety Index (%) 90.0 100Customer Performance Index 7.07 7.25Operating Performance Index (%) 90.0 90.0Operating Expenditure ($m) 928.5 912.8Capital Index 94.9 95.1
Details of compensation provided to key management personnelThe directors during the financial year were:
DirectorsM Hollett Chairman (non-executive). Appointed Director 1 January 2012,
Deputy Chairman 1 January 2016 and Chairman 1 January 2017D Lock Director (non-executive). Appointed 1 January 2014 and Deputy Chairman 1 January 2017N Lockwood Director (non-executive). Appointed 1 March 2016D Rowe Director (non-executive). Appointed 1 March 2016R Holt Director (non-executive). Appointed 8 June 2016J Green Director (non-executive). Appointed 4 July 2017S Murphy Chief Executive Officer
48 WATER CORPORATION 2018 Annual Report
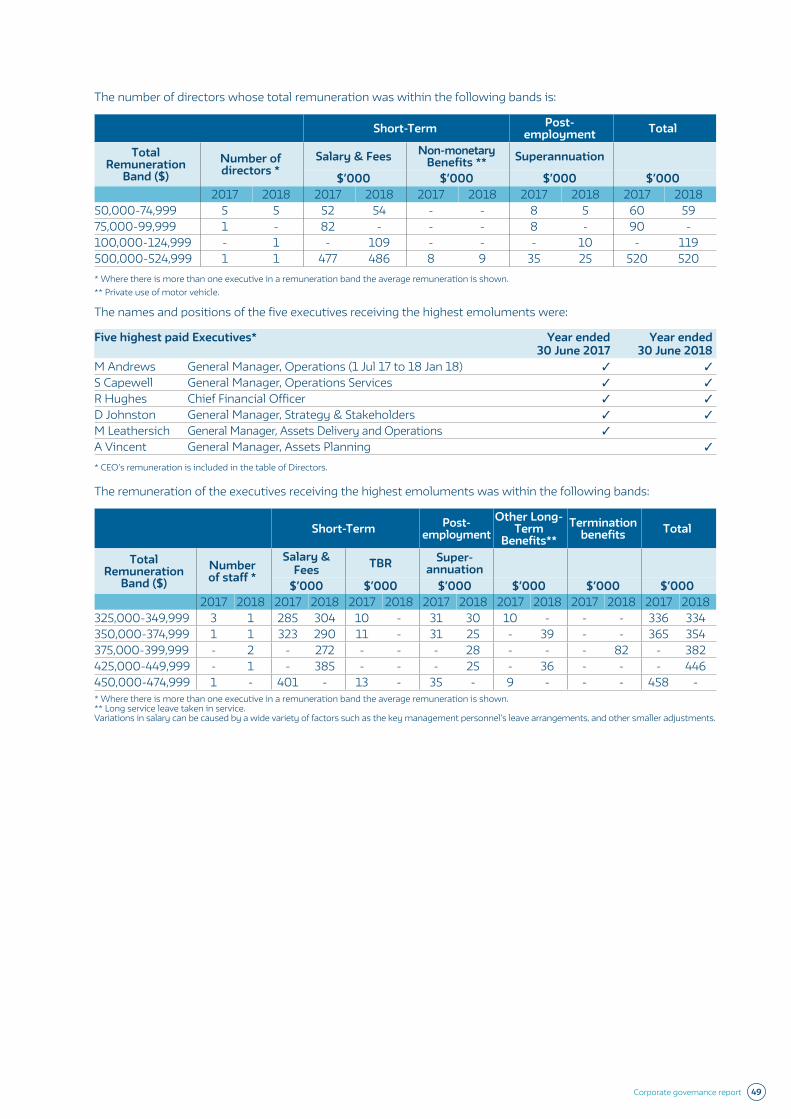
The number of directors whose total remuneration was within the following bands is:
Short-Term Post-employment Total
Total Remuneration
Band (�)Number of directors *
Salary & Fees Non-monetary Benefits ** Superannuation
�’000 �’000 �’000 �’0002017 2018 2017 2018 2017 2018 2017 2018 2017 2018
50,000-74,999 5 5 52 54 - - 8 5 60 5975,000-99,999 1 - 82 - - - 8 - 90 -100,000-124,999 - 1 - 109 - - - 10 - 119500,000-524,999 1 1 477 486 8 9 35 25 520 520* Where there is more than one executive in a remuneration band the average remuneration is shown. ** Private use of motor vehicle.
The names and positions of the five executives receiving the highest emoluments were:
Five highest paid Executives* Year ended 30 June 2017
Year ended 30 June 2018
M Andrews General Manager, Operations (1 Jul 17 to 18 Jan 18) ✓ ✓
S Capewell General Manager, Operations Services ✓ ✓
R Hughes Chief Financial Officer ✓ ✓
D Johnston General Manager, Strategy & Stakeholders ✓ ✓
M Leathersich General Manager, Assets Delivery and Operations ✓
A Vincent General Manager, Assets Planning ✓
* CEO’s remuneration is included in the table of Directors.
The remuneration of the executives receiving the highest emoluments was within the following bands:
Short-Term Post-employment
Other Long- Term
Benefits**Termination
benefits Total
Total Remuneration
Band (�)Number of staff *
Salary & Fees TBR Super-
annuation�’000 �’000 �’000 �’000 �’000 �’000
2017 2018 2017 2018 2017 2018 2017 2018 2017 2018 2017 2018 2017 2018325,000-349,999 3 1 285 304 10 - 31 30 10 - - - 336 334350,000-374,999 1 1 323 290 11 - 31 25 - 39 - - 365 354375,000-399,999 - 2 - 272 - - - 28 - - - 82 - 382425,000-449,999 - 1 - 385 - - - 25 - 36 - - - 446450,000-474,999 1 - 401 - 13 - 35 - 9 - - - 458 -* Where there is more than one executive in a remuneration band the average remuneration is shown. ** Long service leave taken in service. Variations in salary can be caused by a wide variety of factors such as the key management personnel’s leave arrangements, and other smaller adjustments.
Corporate governance report 49
Environmental performanceWater Corporation is subject to particular and significant environmental legislation under both Commonwealth and State laws; in particular:
• Environment Protection and Biodiversity Conservation Act 1999 (Cth)
• Environmental Protection Act 1986 (WA)• Contaminated Sites Act 2003 (WA)
Additionally, we comply with more than 40 other pieces of environment-related legislation and we also track our compliance with various non-statutory commitments. With the significant volume of wastewater conveyed across the State, it is possible that unplanned discharges will occasionally occur and that some of these may affect the environment, public health and public amenity. Our incident management process provides a fast and effective response to these and other incidents. Consistent with the Environmental Protection Act 1986, we report any unplanned discharges of waste that have the potential to harm the environment.
Our environmental performance is underpinned by our Corporate Environment Policy and Carbon and Energy Policy. We also maintain an Environmental Management System, certified under the internal standard ISO 14001 that provides for the systematic identification of environmental risks, setting of performance targets and development of environmental improvement plans to reduce risks and ensure our activities are sustainable.
State of affairsThere were no significant changes during the year ended 30 June 2018 in the state of our affairs not otherwise disclosed in this report, or the financial statements.
Events subsequent to balance dateSince the end of the financial year on 30 June 2018 and the date of the release of this report, the Directors are not aware of any matter or circumstance not otherwise dealt with in the report or financial statements that has significantly, or may significantly, affect our operations, the results of those operations, or our state of affairs in subsequent financial periods.
Directors’ interests and benefitsIn the 12 months to 30 June 2018, Directors did not receive, or become entitled to receive, any benefit (other than a benefit included in the total amount of remuneration received or due and receivable by Directors) by reason of a contract made by the Corporation with the Director, or with a firm, of which the Director is a member, or with an entity in which the Director has a substantial interest.
Indemnification of DirectorsThe Corporation provides a general indemnification for Directors, via a deed of indemnity, and we purchase Directors and Officers insurance. In the 12 months ending 30 June 2018, we have not made any payments in respect to this indemnity.
This statement is made in accordance with a resolution of the Board.
Michael Hollett Chairman
Sue Murphy Chief Executive Officer
Perth, 22 August 2018
50 WATER CORPORATION 2018 Annual Report
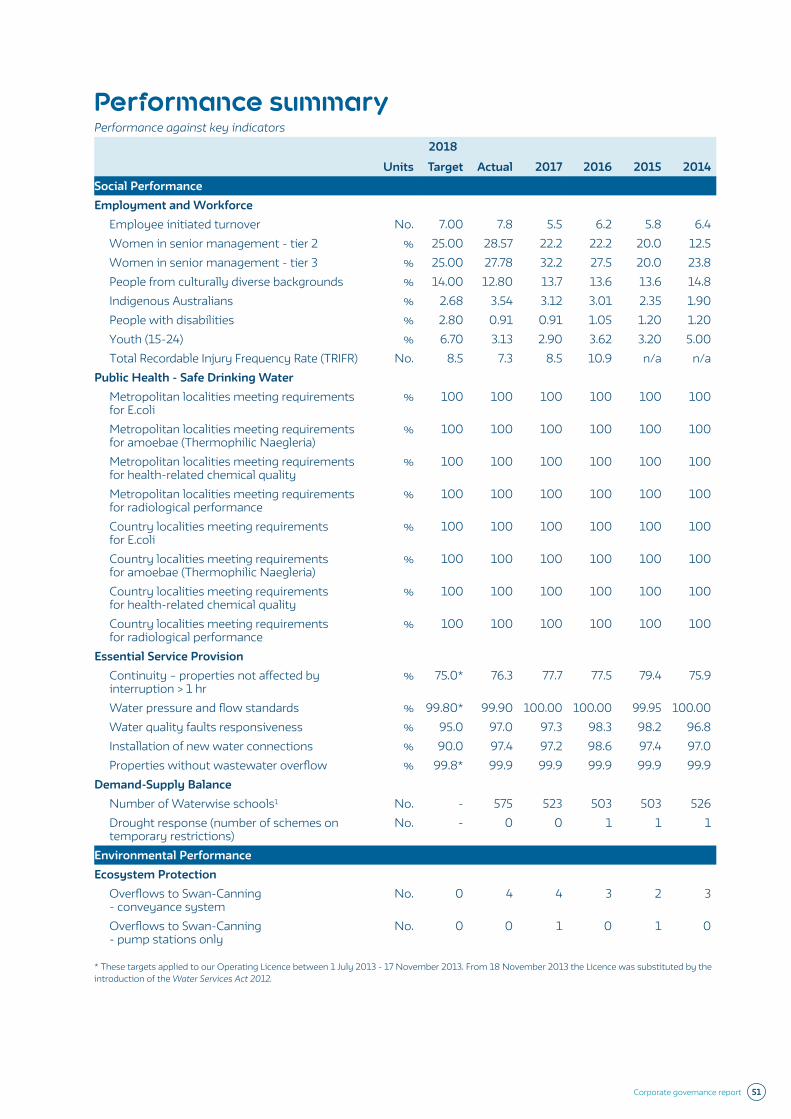
Performance summaryPerformance against key indicators
2018
Units Target Actual 2017 2016 2015 2014Social PerformanceEmployment and Workforce
Employee initiated turnover No. 7.00 7.8 5.5 6.2 5.8 6.4Women in senior management - tier 2 % 25.00 28.57 22.2 22.2 20.0 12.5Women in senior management - tier 3 % 25.00 27.78 32.2 27.5 20.0 23.8People from culturally diverse backgrounds % 14.00 12.80 13.7 13.6 13.6 14.8Indigenous Australians % 2.68 3.54 3.12 3.01 2.35 1.90People with disabilities % 2.80 0.91 0.91 1.05 1.20 1.20Youth (15-24) % 6.70 3.13 2.90 3.62 3.20 5.00Total Recordable Injury Frequency Rate (TRIFR) No. 8.5 7.3 8.5 10.9 n/a n/a
Public Health - Safe Drinking WaterMetropolitan localities meeting requirements for E.coli
% 100 100 100 100 100 100
Metropolitan localities meeting requirements for amoebae (Thermophilic Naegleria)
% 100 100 100 100 100 100
Metropolitan localities meeting requirements for health-related chemical quality
% 100 100 100 100 100 100
Metropolitan localities meeting requirements for radiological performance
% 100 100 100 100 100 100
Country localities meeting requirements for E.coli
% 100 100 100 100 100 100
Country localities meeting requirements for amoebae (Thermophilic Naegleria)
% 100 100 100 100 100 100
Country localities meeting requirements for health-related chemical quality
% 100 100 100 100 100 100
Country localities meeting requirements for radiological performance
% 100 100 100 100 100 100
Essential Service ProvisionContinuity – properties not affected by interruption > 1 hr
% 75.0* 76.3 77.7 77.5 79.4 75.9
Water pressure and flow standards % 99.80* 99.90 100.00 100.00 99.95 100.00Water quality faults responsiveness % 95.0 97.0 97.3 98.3 98.2 96.8Installation of new water connections % 90.0 97.4 97.2 98.6 97.4 97.0Properties without wastewater overflow % 99.8* 99.9 99.9 99.9 99.9 99.9
Demand-Supply BalanceNumber of Waterwise schools1 No. - 575 523 503 503 526Drought response (number of schemes on temporary restrictions)
No. - 0 0 1 1 1
Environmental PerformanceEcosystem Protection
Overflows to Swan-Canning - conveyance system
No. 0 4 4 3 2 3
Overflows to Swan-Canning - pump stations only
No. 0 0 1 0 1 0
* These targets applied to our Operating Licence between 1 July 2013 - 17 November 2013. From 18 November 2013 the Licence was substituted by the introduction of the Water Services Act 2012.
Corporate governance report 51

2018
Units Target Actual 2017 2016 2015 2014Environmental Performance (continued)Energy and Greenhouse Gases
Electricity consumption per unit of output for water
MWh/ML
- 2.38 2.41 2.17 1.93 1.84
Electricity consumption per unit of output for wastewater
MWh/ML
- 0.91 0.87 0.81 0.80 0.79
Total energy consumption TJ - 4,105 3,863 3,633 3,346 3,294Reported greenhouse gas emissions (CO2 equivalent)
kT - 771 806 784 717 718
Materials Use EfficiencyBiosolids re-use (Perth metro) % 100 100 100 100 100 100
Demand-Supply BalanceEnvironmental Performance - Demand-Supply Balance - Water supplied per capita (Perth metro)
kL 126 123 122 127 126 131
Economic PerformanceFinancial Efficiency
Operating cost per property $ 820 794 769 796 819 800Total cost per property $ 1,973 1,967 1,941 2,004 1,982 1,989Surplus before income tax equivalent $m 1,072 931 920 1,053 1118 947Return on assets % 6.5 6.0 5.8 5.8 5.8 5.5Return on equity % 7.1 6.2 6.2 7.2 7.9 7.0Interest cover Times 4.4 4.2 4.0 3.8 3.6 3.3Debt to Total Assets % 35.0 35.1 34.3 34.0 33.8 33.8
Asset PerformanceBlockages per 100km of sewer No. 40.0* 16.1 16.7 18.3 17.4 16.9Leaks and bursts per 100km of main No. 20.0* 16.2 17.9 17.8 17.8 17.5Drainage systems operating in accordance with guidelines
% 100* 100 100 100 100 100
Stakeholder PerformanceCustomer Service
Complaints (per 1000 properties) RY No. - 2.0 1.4 1.2 1.2 1.4Written customer complaints (responsiveness) < 15 business days
% 90.0* 100.0 98.9 98.4 100.0 98.8
Telephone calls to '13' numbers abandoned after 30 seconds
% 5.0 2.9 1.7 1.7 1.6
Telephone calls to '13' numbers first call resolution
% 90.0 91.8 92.6 92.0 97.5 96.9
Shareholder AccountabilityResponsiveness to priority one enquiries % 85.0 97.5 98.4 96.2 96.7 98.2
Ethical & Governance PerformanceCompliance
Number of legal sanctions for environmental breaches
No. 0 0 0 0 0 0
Environment Non-Compliances Addressed % 95.0 100.0 99.0 94.9 98.7 98.6
1) Note from 2016 we are now including early childhood centres, primary schools, high schools, education support centres and secondary colleges.
* These targets applied to our Operating Licence between 1 July 2013 - 17 November 2013. From 18 November 2013 the Licence was substituted by the introduction of the Water Services Act 2012.
52 WATER CORPORATION 2018 Annual Report
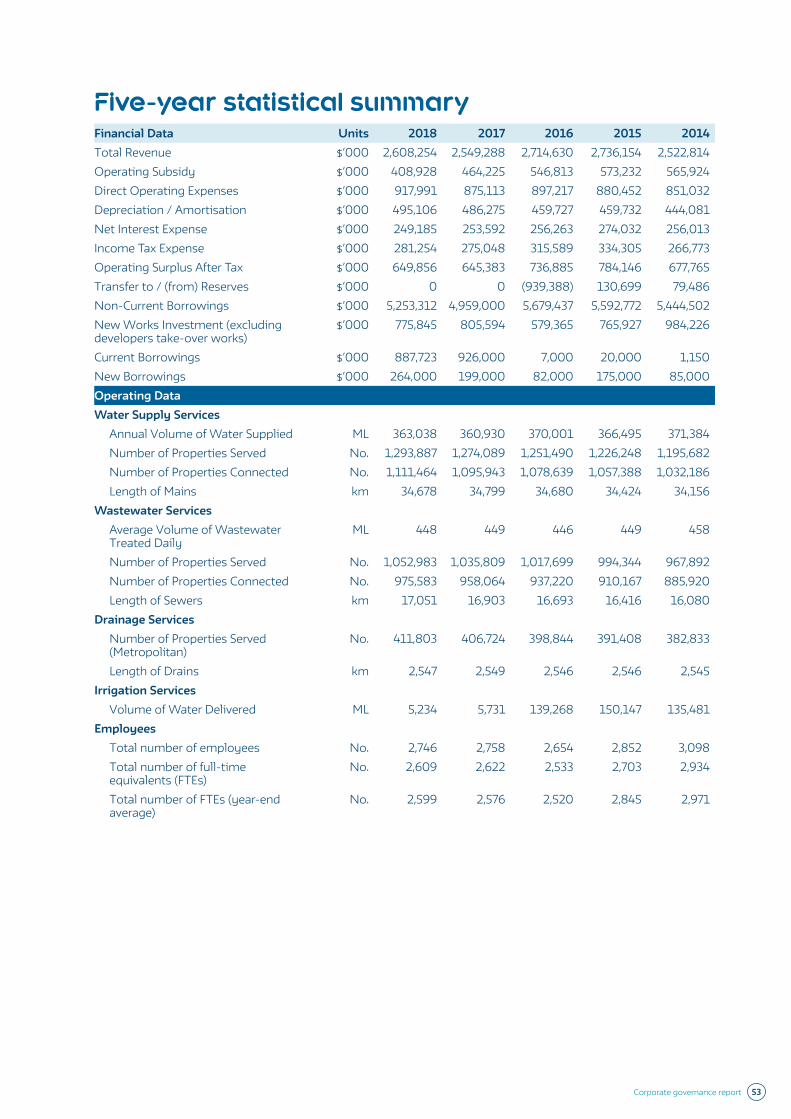
Five-year statistical summaryFinancial Data Units 2018 2017 2016 2015 2014Total Revenue $’000 2,608,254 2,549,288 2,714,630 2,736,154 2,522,814Operating Subsidy $’000 408,928 464,225 546,813 573,232 565,924Direct Operating Expenses $’000 917,991 875,113 897,217 880,452 851,032Depreciation / Amortisation $’000 495,106 486,275 459,727 459,732 444,081Net Interest Expense $’000 249,185 253,592 256,263 274,032 256,013Income Tax Expense $’000 281,254 275,048 315,589 334,305 266,773Operating Surplus After Tax $’000 649,856 645,383 736,885 784,146 677,765Transfer to / (from) Reserves $’000 0 0 (939,388) 130,699 79,486Non-Current Borrowings $’000 5,253,312 4,959,000 5,679,437 5,592,772 5,444,502New Works Investment (excluding developers take-over works)
$’000 775,845 805,594 579,365 765,927 984,226
Current Borrowings $’000 887,723 926,000 7,000 20,000 1,150New Borrowings $’000 264,000 199,000 82,000 175,000 85,000Operating DataWater Supply Services
Annual Volume of Water Supplied ML 363,038 360,930 370,001 366,495 371,384Number of Properties Served No. 1,293,887 1,274,089 1,251,490 1,226,248 1,195,682Number of Properties Connected No. 1,111,464 1,095,943 1,078,639 1,057,388 1,032,186Length of Mains km 34,678 34,799 34,680 34,424 34,156
Wastewater ServicesAverage Volume of Wastewater Treated Daily
ML 448 449 446 449 458
Number of Properties Served No. 1,052,983 1,035,809 1,017,699 994,344 967,892Number of Properties Connected No. 975,583 958,064 937,220 910,167 885,920Length of Sewers km 17,051 16,903 16,693 16,416 16,080
Drainage ServicesNumber of Properties Served (Metropolitan)
No. 411,803 406,724 398,844 391,408 382,833
Length of Drains km 2,547 2,549 2,546 2,546 2,545Irrigation Services
Volume of Water Delivered ML 5,234 5,731 139,268 150,147 135,481Employees
Total number of employees No. 2,746 2,758 2,654 2,852 3,098Total number of full-time equivalents (FTEs)
No. 2,609 2,622 2,533 2,703 2,934
Total number of FTEs (year-end average)
No. 2,599 2,576 2,520 2,845 2,971
Corporate governance report 53
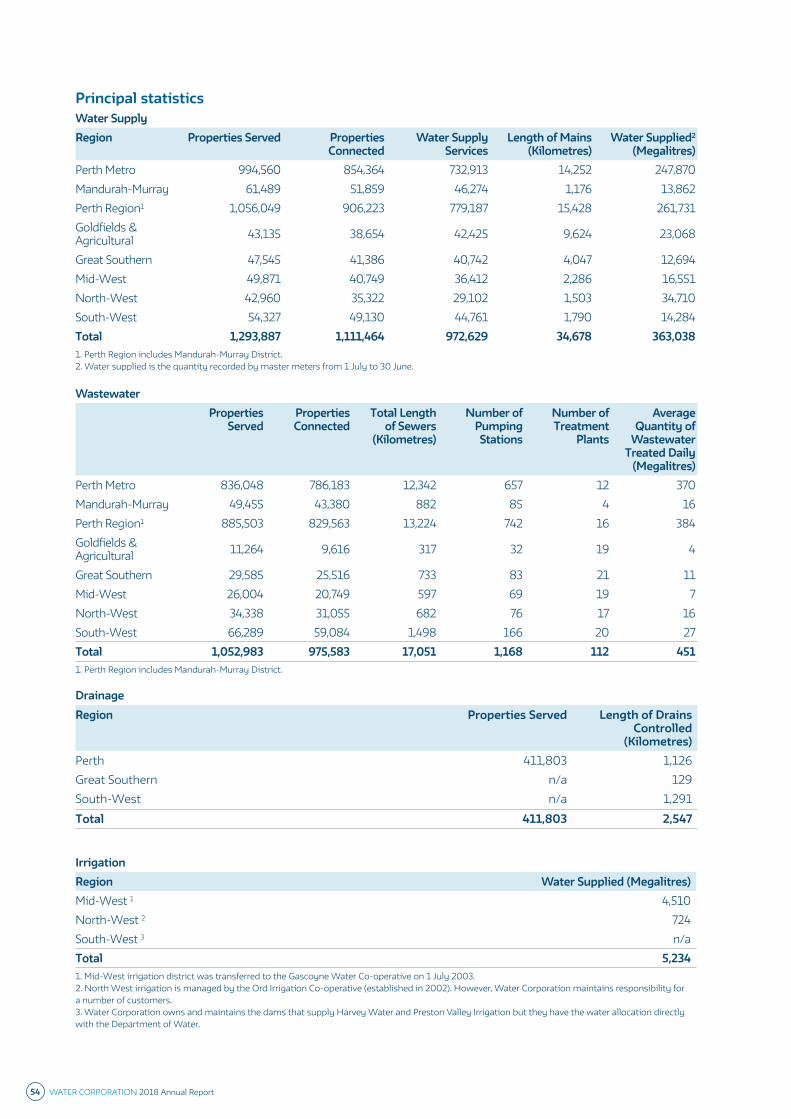
Principal statistics Water SupplyRegion Properties Served Properties
ConnectedWater Supply
ServicesLength of Mains
(Kilometres)Water Supplied2
(Megalitres)Perth Metro 994,560 854,364 732,913 14,252 247,870Mandurah-Murray 61,489 51,859 46,274 1,176 13,862Perth Region1 1,056,049 906,223 779,187 15,428 261,731Goldfields & Agricultural 43,135 38,654 42,425 9,624 23,068
Great Southern 47,545 41,386 40,742 4,047 12,694Mid-West 49,871 40,749 36,412 2,286 16,551North-West 42,960 35,322 29,102 1,503 34,710South-West 54,327 49,130 44,761 1,790 14,284Total 1,293,887 1,111,464 972,629 34,678 363,0381. Perth Region includes Mandurah-Murray District. 2. Water supplied is the quantity recorded by master meters from 1 July to 30 June.
WastewaterProperties
ServedProperties Connected
Total Length of Sewers
(Kilometres)
Number of Pumping Stations
Number of Treatment
Plants
Average Quantity of
Wastewater Treated Daily
(Megalitres)Perth Metro 836,048 786,183 12,342 657 12 370Mandurah-Murray 49,455 43,380 882 85 4 16Perth Region1 885,503 829,563 13,224 742 16 384Goldfields & Agricultural 11,264 9,616 317 32 19 4
Great Southern 29,585 25,516 733 83 21 11Mid-West 26,004 20,749 597 69 19 7North-West 34,338 31,055 682 76 17 16South-West 66,289 59,084 1,498 166 20 27Total 1,052,983 975,583 17,051 1,168 112 4511. Perth Region includes Mandurah-Murray District.
DrainageRegion Properties Served Length of Drains
Controlled (Kilometres)
Perth 411,803 1,126Great Southern n/a 129South-West n/a 1,291
Total 411,803 2,547
IrrigationRegion Water Supplied (Megalitres)Mid-West 1 4,510North-West 2 724South-West 3 n/aTotal 5,2341. Mid-West irrigation district was transferred to the Gascoyne Water Co-operative on 1 July 2003. 2. North West irrigation is managed by the Ord Irrigation Co-operative (established in 2002). However, Water Corporation maintains responsibility for a number of customers. 3. Water Corporation owns and maintains the dams that supply Harvey Water and Preston Valley Irrigation but they have the water allocation directly with the Department of Water.
54 WATER CORPORATION 2018 Annual Report
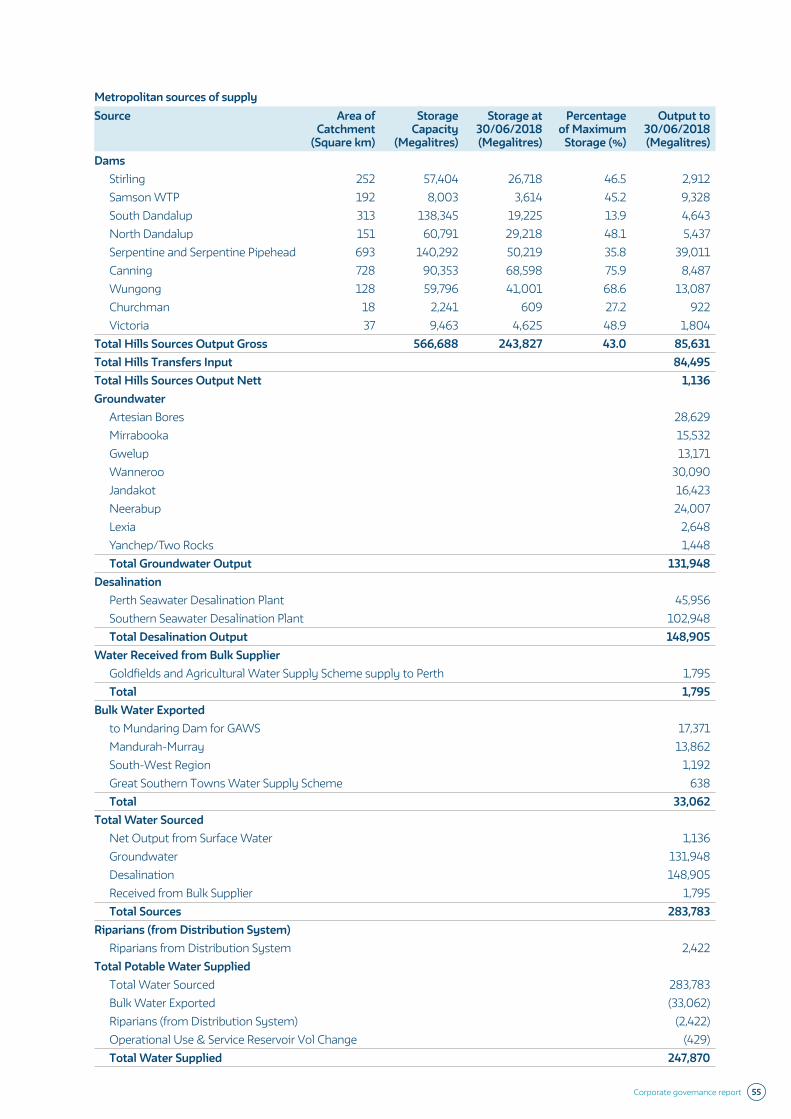
Metropolitan sources of supply Source Area of
Catchment (Square km)
Storage Capacity
(Megalitres)
Storage at 30/06/2018 (Megalitres)
Percentage of Maximum
Storage (%)
Output to 30/06/2018 (Megalitres)
DamsStirling 252 57,404 26,718 46.5 2,912Samson WTP 192 8,003 3,614 45.2 9,328South Dandalup 313 138,345 19,225 13.9 4,643North Dandalup 151 60,791 29,218 48.1 5,437 Serpentine and Serpentine Pipehead 693 140,292 50,219 35.8 39,011Canning 728 90,353 68,598 75.9 8,487 Wungong 128 59,796 41,001 68.6 13,087Churchman 18 2,241 609 27.2 922Victoria 37 9,463 4,625 48.9 1,804
Total Hills Sources Output Gross 566,688 243,827 43.0 85,631Total Hills Transfers Input 84,495Total Hills Sources Output Nett 1,136Groundwater
Artesian Bores 28,629Mirrabooka 15,532Gwelup 13,171Wanneroo 30,090Jandakot 16,423Neerabup 24,007Lexia 2,648Yanchep/Two Rocks 1,448Total Groundwater Output 131,948
DesalinationPerth Seawater Desalination Plant 45,956Southern Seawater Desalination Plant 102,948Total Desalination Output 148,905
Water Received from Bulk SupplierGoldfields and Agricultural Water Supply Scheme supply to Perth 1,795 Total 1,795
Bulk Water Exportedto Mundaring Dam for GAWS 17,371 Mandurah-Murray 13,862 South-West Region 1,192 Great Southern Towns Water Supply Scheme 638 Total 33,062
Total Water SourcedNet Output from Surface Water 1,136 Groundwater 131,948 Desalination 148,905 Received from Bulk Supplier 1,795 Total Sources 283,783
Riparians (from Distribution System)Riparians from Distribution System 2,422
Total Potable Water SuppliedTotal Water Sourced 283,783 Bulk Water Exported (33,062)Riparians (from Distribution System) (2,422)Operational Use & Service Reservoir Vol Change (429)Total Water Supplied 247,870
Corporate governance report 55
56 WATER CORPORATION 2018 Annual Report

Financial report
Financial report 57
Contents
Consolidated Statement of Comprehensive Income 59
Consolidated Statement of Financial Position 60
Consolidated Statement of Changes In Equity 61
Consolidated Statement of Cash Flows 63
Notes to the Consolidated Financial Report Note 1: Reporting Entity 64
Note 2: Basis of Preparation 64
Note 3: Functional and Presentation Currency 64
Note 4: Use of Estimates and Judgements 64
Note 5: Other Revenue 64
Note 6: Expenses 65
Note 7: Net Finance Costs 65
Note 8: Income Tax Equivalent Expense 66
Note 9: Trade and Other Receivables 66
Note 10: Property, Plant and Equipment 67
Note 11: Intangible Assets 68
Note 12: Interest-bearing Loans and Borrowings 69
Note 13: Deferred Tax Equivalent Liabilities 70
Note 14: Provisions 71
Note 15: Employee Benefits 71
Note 16: Other Liabilities 74
Note 17: Equity 75
Note 18: Reconciliation of Cash Flows from Operating Activities 75
Note 19: Auditor’s Remuneration 76
Note 20: Related Parties 76
Note 21: Operating Leases 78
Note 22: Capital Commitments 78
Note 23: Contingent Liabilities 78
Note 24: Subsequent Events 78
Note 25: Financial Instruments 79
Note 26: Controlled entities 83
Note 27: Parent Entity Disclosures 84
Note 28: Significant Accounting Policies 84
Directors’ declaration 92
Auditor General’s report 93
58 WATER CORPORATION 2018 Annual Report
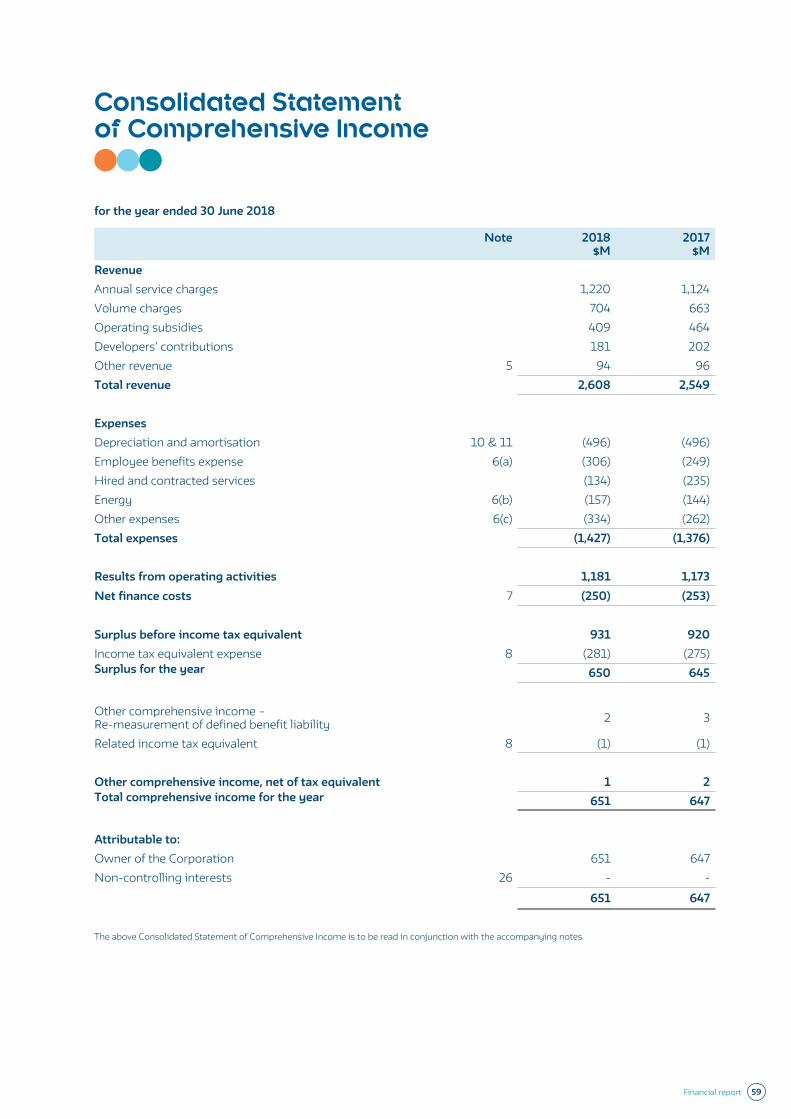
Consolidated Statement of Comprehensive Income
for the year ended 30 June 2018
Note 2018 $M
2017 $M
RevenueAnnual service charges 1,220 1,124Volume charges 704 663 Operating subsidies 409 464 Developers’ contributions 181 202 Other revenue 5 94 96 Total revenue 2,608 2,549
ExpensesDepreciation and amortisation 10 & 11 (496) (496)Employee benefits expense 6(a) (306) (249) Hired and contracted services (134) (235) Energy 6(b) (157) (144) Other expenses 6(c) (334) (262) Total expenses (1,427) (1,376)
Results from operating activities 1,181 1,173 Net finance costs 7 (250) (253)
Surplus before income tax equivalent 931 920 Income tax equivalent expense 8 (281) (275) Surplus for the year 650 645
Other comprehensive income – Re-measurement of defined benefit liability 2 3
Related income tax equivalent 8 (1) (1)
Other comprehensive income, net of tax equivalent 1 2 Total comprehensive income for the year 651 647
Attributable to:Owner of the Corporation 651 647Non-controlling interests 26 - -
651 647
The above Consolidated Statement of Comprehensive Income is to be read in conjunction with the accompanying notes.
Financial report 59
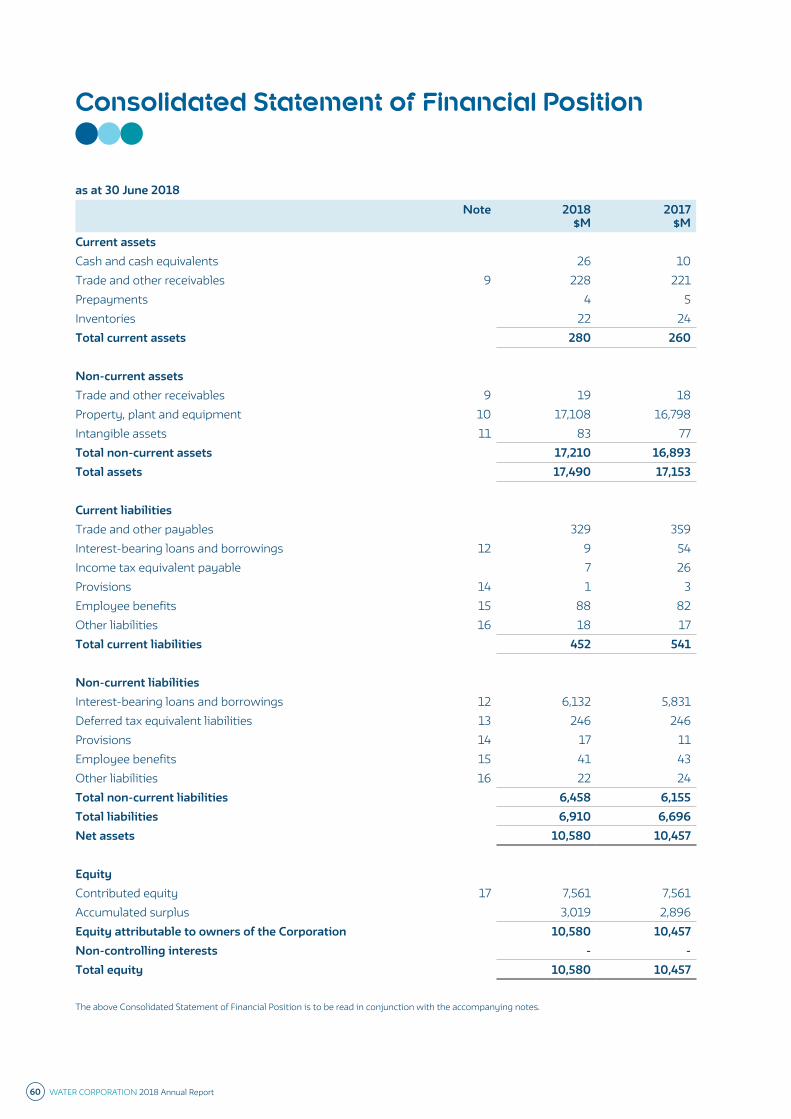
Consolidated Statement of Financial Position
as at 30 June 2018Note 2018
$M 2017
$MCurrent assetsCash and cash equivalents 26 10Trade and other receivables 9 228 221Prepayments 4 5Inventories 22 24Total current assets 280 260
Non-current assetsTrade and other receivables 9 19 18Property, plant and equipment 10 17,108 16,798Intangible assets 11 83 77Total non-current assets 17,210 16,893Total assets 17,490 17,153
Current liabilitiesTrade and other payables 329 359Interest-bearing loans and borrowings 12 9 54Income tax equivalent payable 7 26Provisions 14 1 3Employee benefits 15 88 82Other liabilities 16 18 17Total current liabilities 452 541
Non-current liabilitiesInterest-bearing loans and borrowings 12 6,132 5,831Deferred tax equivalent liabilities 13 246 246Provisions 14 17 11Employee benefits 15 41 43Other liabilities 16 22 24Total non-current liabilities 6,458 6,155Total liabilities 6,910 6,696Net assets 10,580 10,457
EquityContributed equity 17 7,561 7,561Accumulated surplus 3,019 2,896Equity attributable to owners of the Corporation 10,580 10,457Non-controlling interests - -Total equity 10,580 10,457
The above Consolidated Statement of Financial Position is to be read in conjunction with the accompanying notes.
60 WATER CORPORATION 2018 Annual Report
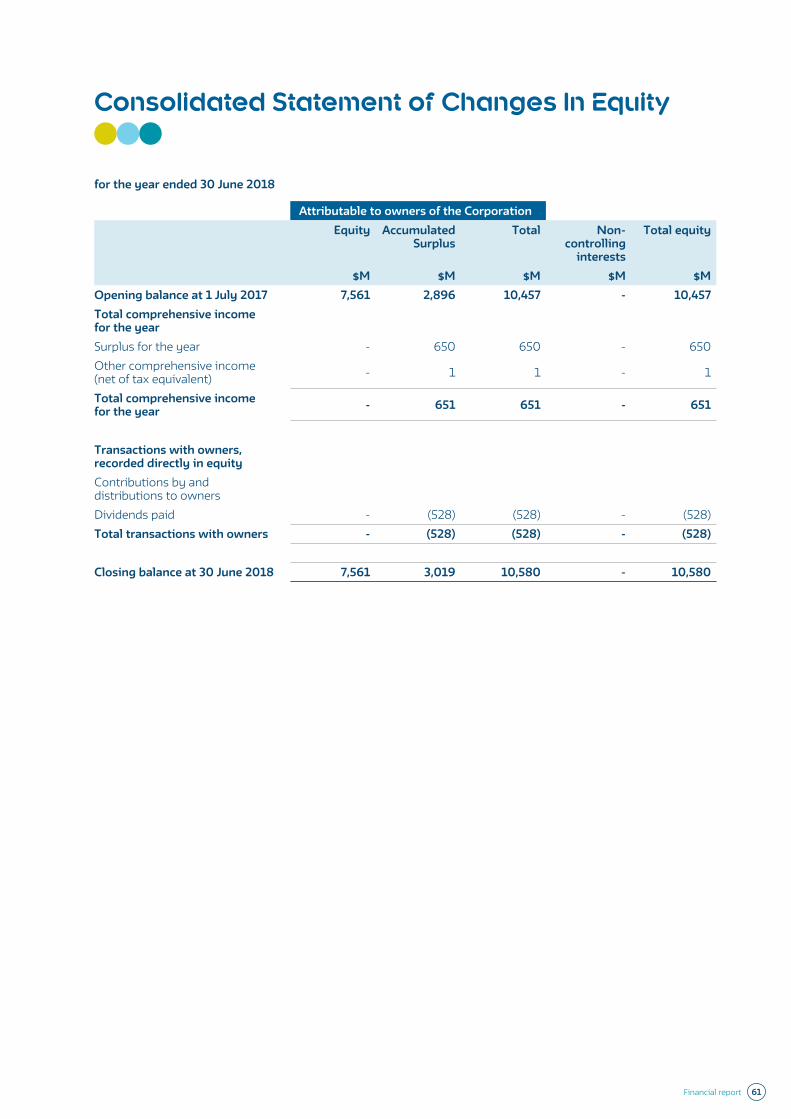
Consolidated Statement of Changes In Equity
for the year ended 30 June 2018
Attributable to owners of the CorporationEquity Accumulated
Surplus Total Non-
controlling interests
Total equity
$M $M $M $M $MOpening balance at 1 July 2017 7,561 2,896 10,457 - 10,457Total comprehensive income for the yearSurplus for the year - 650 650 - 650Other comprehensive income (net of tax equivalent) - 1 1 - 1
Total comprehensive income for the year - 651 651 - 651
Transactions with owners, recorded directly in equityContributions by and distributions to ownersDividends paid - (528) (528) - (528)Total transactions with owners - (528) (528) - (528)
Closing balance at 30 June 2018 7,561 3,019 10,580 - 10,580
Financial report 61
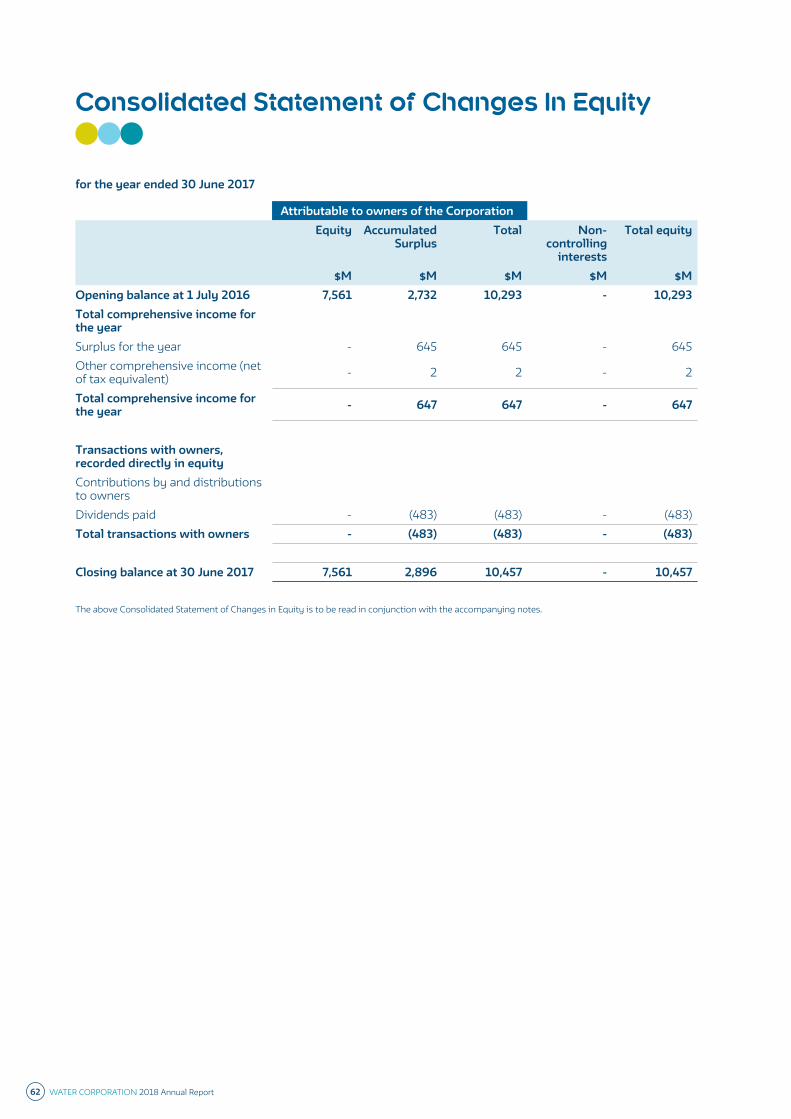
Consolidated Statement of Changes In Equity
for the year ended 30 June 2017
Attributable to owners of the CorporationEquity Accumulated
SurplusTotal Non-
controlling interests
Total equity
$M $M $M $M $MOpening balance at 1 July 2016 7,561 2,732 10,293 - 10,293Total comprehensive income for the yearSurplus for the year - 645 645 - 645Other comprehensive income (net of tax equivalent) - 2 2 - 2
Total comprehensive income for the year - 647 647 - 647
Transactions with owners, recorded directly in equityContributions by and distributions to ownersDividends paid - (483) (483) - (483)Total transactions with owners - (483) (483) - (483)
Closing balance at 30 June 2017 7,561 2,896 10,457 - 10,457
The above Consolidated Statement of Changes in Equity is to be read in conjunction with the accompanying notes.
62 WATER CORPORATION 2018 Annual Report
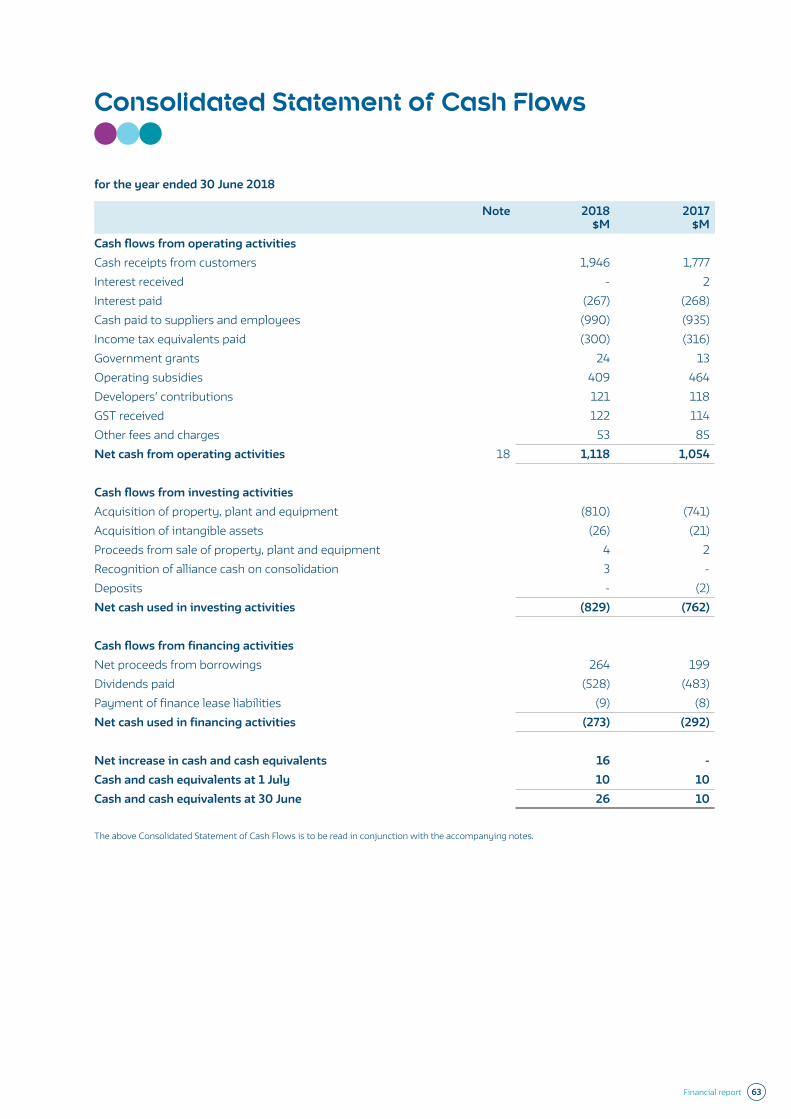
Consolidated Statement of Cash Flows
for the year ended 30 June 2018
Note 2018 $M
2017 $M
Cash flows from operating activitiesCash receipts from customers 1,946 1,777Interest received - 2Interest paid (267) (268)Cash paid to suppliers and employees (990) (935)Income tax equivalents paid (300) (316)Government grants 24 13Operating subsidies 409 464Developers’ contributions 121 118GST received 122 114Other fees and charges 53 85Net cash from operating activities 18 1,118 1,054
Cash flows from investing activitiesAcquisition of property, plant and equipment (810) (741)Acquisition of intangible assets (26) (21)Proceeds from sale of property, plant and equipment 4 2Recognition of alliance cash on consolidation 3 - Deposits - (2)Net cash used in investing activities (829) (762)
Cash flows from financing activitiesNet proceeds from borrowings 264 199Dividends paid (528) (483)Payment of finance lease liabilities (9) (8)Net cash used in financing activities (273) (292)
Net increase in cash and cash equivalents 16 -Cash and cash equivalents at 1 July 10 10Cash and cash equivalents at 30 June 26 10
The above Consolidated Statement of Cash Flows is to be read in conjunction with the accompanying notes.
Financial report 63
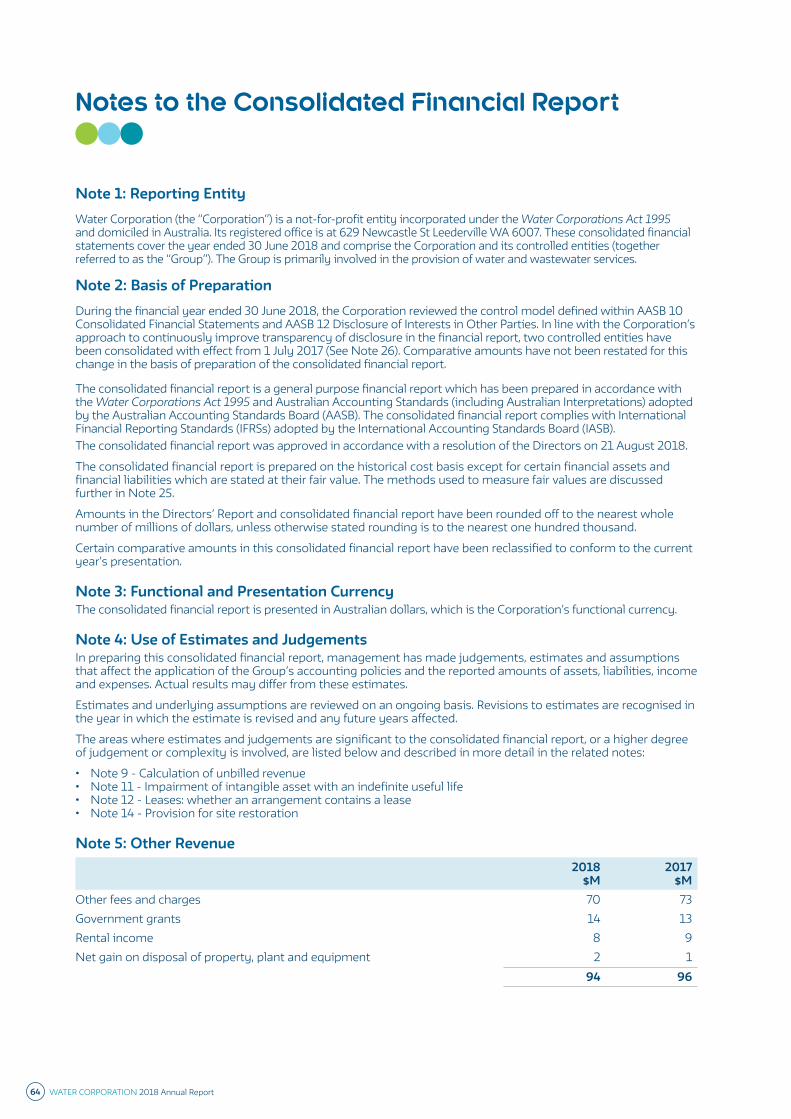
Notes to the Consolidated Financial Report
Note 1: Reporting EntityWater Corporation (the “Corporation”) is a not-for-profit entity incorporated under the Water Corporations Act 1995 and domiciled in Australia. Its registered office is at 629 Newcastle St Leederville WA 6007. These consolidated financial statements cover the year ended 30 June 2018 and comprise the Corporation and its controlled entities (together referred to as the “Group”). The Group is primarily involved in the provision of water and wastewater services.
Note 2: Basis of PreparationDuring the financial year ended 30 June 2018, the Corporation reviewed the control model defined within AASB 10 Consolidated Financial Statements and AASB 12 Disclosure of Interests in Other Parties. In line with the Corporation’s approach to continuously improve transparency of disclosure in the financial report, two controlled entities have been consolidated with effect from 1 July 2017 (See Note 26). Comparative amounts have not been restated for this change in the basis of preparation of the consolidated financial report.
The consolidated financial report is a general purpose financial report which has been prepared in accordance with the Water Corporations Act 1995 and Australian Accounting Standards (including Australian Interpretations) adopted by the Australian Accounting Standards Board (AASB). The consolidated financial report complies with International Financial Reporting Standards (IFRSs) adopted by the International Accounting Standards Board (IASB). The consolidated financial report was approved in accordance with a resolution of the Directors on 21 August 2018.
The consolidated financial report is prepared on the historical cost basis except for certain financial assets and financial liabilities which are stated at their fair value. The methods used to measure fair values are discussed further in Note 25.
Amounts in the Directors’ Report and consolidated financial report have been rounded off to the nearest whole number of millions of dollars, unless otherwise stated rounding is to the nearest one hundred thousand.
Certain comparative amounts in this consolidated financial report have been reclassified to conform to the current year’s presentation.
Note 3: Functional and Presentation CurrencyThe consolidated financial report is presented in Australian dollars, which is the Corporation’s functional currency.
Note 4: Use of Estimates and JudgementsIn preparing this consolidated financial report, management has made judgements, estimates and assumptions that affect the application of the Group’s accounting policies and the reported amounts of assets, liabilities, income and expenses. Actual results may differ from these estimates.
Estimates and underlying assumptions are reviewed on an ongoing basis. Revisions to estimates are recognised in the year in which the estimate is revised and any future years affected.
The areas where estimates and judgements are significant to the consolidated financial report, or a higher degree of judgement or complexity is involved, are listed below and described in more detail in the related notes:
• Note 9 - Calculation of unbilled revenue• Note 11 - Impairment of intangible asset with an indefinite useful life• Note 12 - Leases: whether an arrangement contains a lease• Note 14 - Provision for site restoration
Note 5: Other Revenue2018
$M2017
$MOther fees and charges 70 73Government grants 14 13Rental income 8 9Net gain on disposal of property, plant and equipment 2 1
94 96
64 WATER CORPORATION 2018 Annual Report
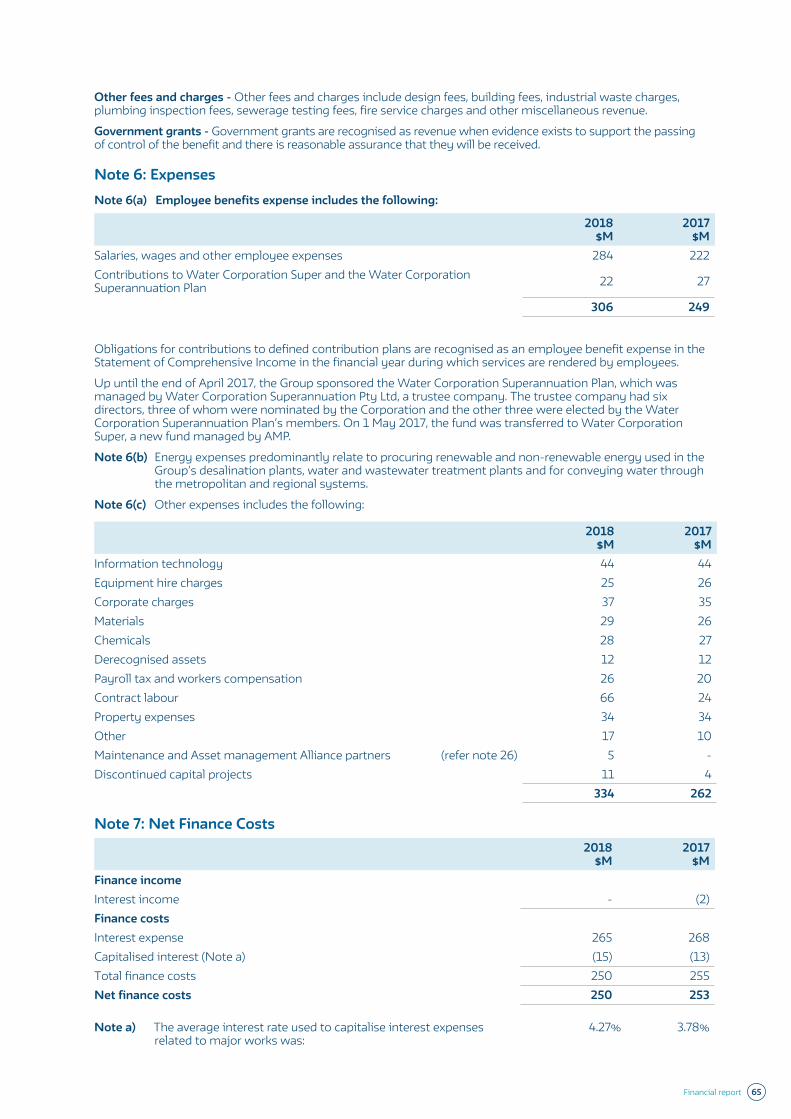
Other fees and charges - Other fees and charges include design fees, building fees, industrial waste charges, plumbing inspection fees, sewerage testing fees, fire service charges and other miscellaneous revenue.
Government grants - Government grants are recognised as revenue when evidence exists to support the passing of control of the benefit and there is reasonable assurance that they will be received.
Note 6: ExpensesNote 6(a) Employee benefits expense includes the following:
2018 $M
2017 $M
Salaries, wages and other employee expenses 284 222Contributions to Water Corporation Super and the Water Corporation Superannuation Plan 22 27
306 249
Obligations for contributions to defined contribution plans are recognised as an employee benefit expense in the Statement of Comprehensive Income in the financial year during which services are rendered by employees.
Up until the end of April 2017, the Group sponsored the Water Corporation Superannuation Plan, which was managed by Water Corporation Superannuation Pty Ltd, a trustee company. The trustee company had six directors, three of whom were nominated by the Corporation and the other three were elected by the Water Corporation Superannuation Plan’s members. On 1 May 2017, the fund was transferred to Water Corporation Super, a new fund managed by AMP.
Note 6(b) Energy expenses predominantly relate to procuring renewable and non-renewable energy used in the Group’s desalination plants, water and wastewater treatment plants and for conveying water through the metropolitan and regional systems.
Note 6(c) Other expenses includes the following:
2018 $M
2017 $M
Information technology 44 44Equipment hire charges 25 26Corporate charges 37 35Materials 29 26Chemicals 28 27Derecognised assets 12 12Payroll tax and workers compensation 26 20Contract labour 66 24Property expenses 34 34Other 17 10Maintenance and Asset management Alliance partners (refer note 26) 5 -Discontinued capital projects 11 4
334 262
Note 7: Net Finance Costs2018
$M2017
$MFinance incomeInterest income - (2)Finance costsInterest expense 265 268Capitalised interest (Note a) (15) (13)Total finance costs 250 255Net finance costs 250 253
Note a) The average interest rate used to capitalise interest expenses related to major works was:
4.27% 3.78%
Financial report 65
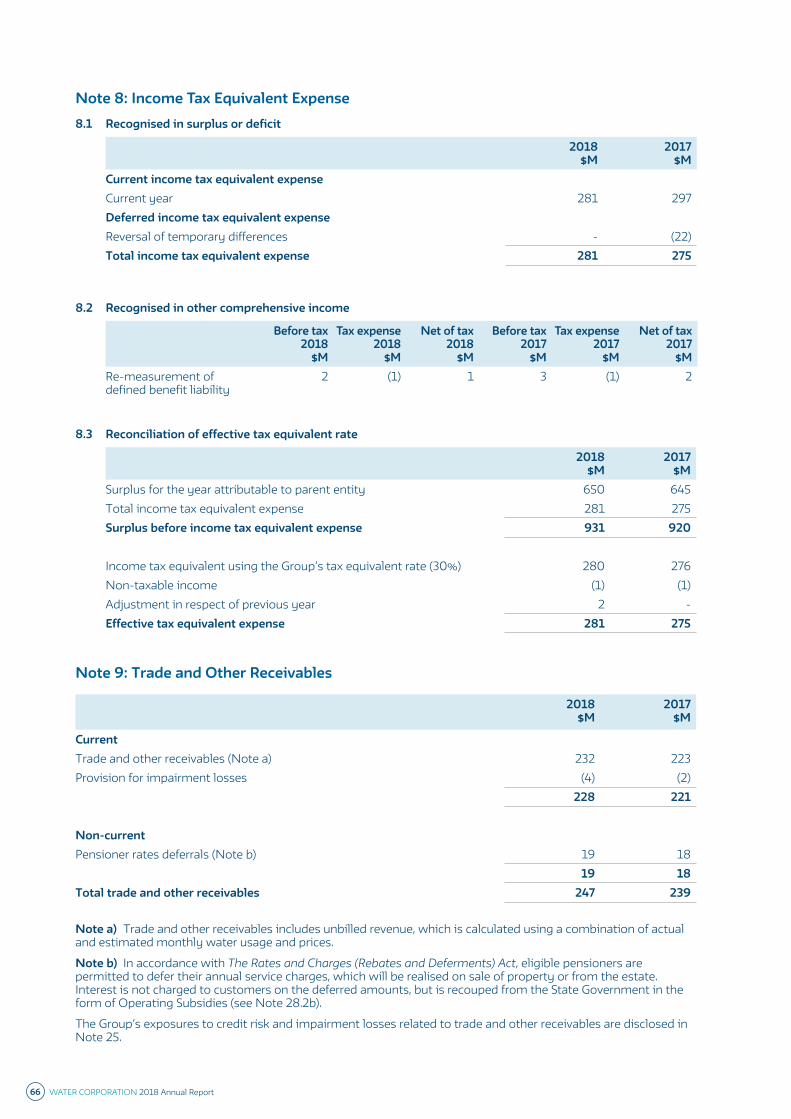
Note 8: Income Tax Equivalent Expense8.1 Recognised in surplus or deficit
2018 $M
2017 $M
Current income tax equivalent expenseCurrent year 281 297Deferred income tax equivalent expenseReversal of temporary differences - (22)Total income tax equivalent expense 281 275
8.2 Recognised in other comprehensive income
Before tax 2018
$M
Tax expense 2018
$M
Net of tax 2018
$M
Before tax 2017
$M
Tax expense 2017
$M
Net of tax 2017
$MRe-measurement of defined benefit liability
2 (1) 1 3 (1) 2
8.3 Reconciliation of effective tax equivalent rate 2018
$M2017
$MSurplus for the year attributable to parent entity 650 645Total income tax equivalent expense 281 275Surplus before income tax equivalent expense 931 920
Income tax equivalent using the Group’s tax equivalent rate (30%) 280 276Non-taxable income (1) (1)Adjustment in respect of previous year 2 -Effective tax equivalent expense 281 275
Note 9: Trade and Other Receivables
2018 $M
2017 $M
CurrentTrade and other receivables (Note a) 232 223Provision for impairment losses (4) (2)
228 221
Non-currentPensioner rates deferrals (Note b) 19 18
19 18Total trade and other receivables 247 239
Note a) Trade and other receivables includes unbilled revenue, which is calculated using a combination of actual and estimated monthly water usage and prices.
Note b) In accordance with The Rates and Charges (Rebates and Deferments) Act, eligible pensioners are permitted to defer their annual service charges, which will be realised on sale of property or from the estate. Interest is not charged to customers on the deferred amounts, but is recouped from the State Government in the form of Operating Subsidies (see Note 28.2b).
The Group’s exposures to credit risk and impairment losses related to trade and other receivables are disclosed in Note 25.
66 WATER CORPORATION 2018 Annual Report
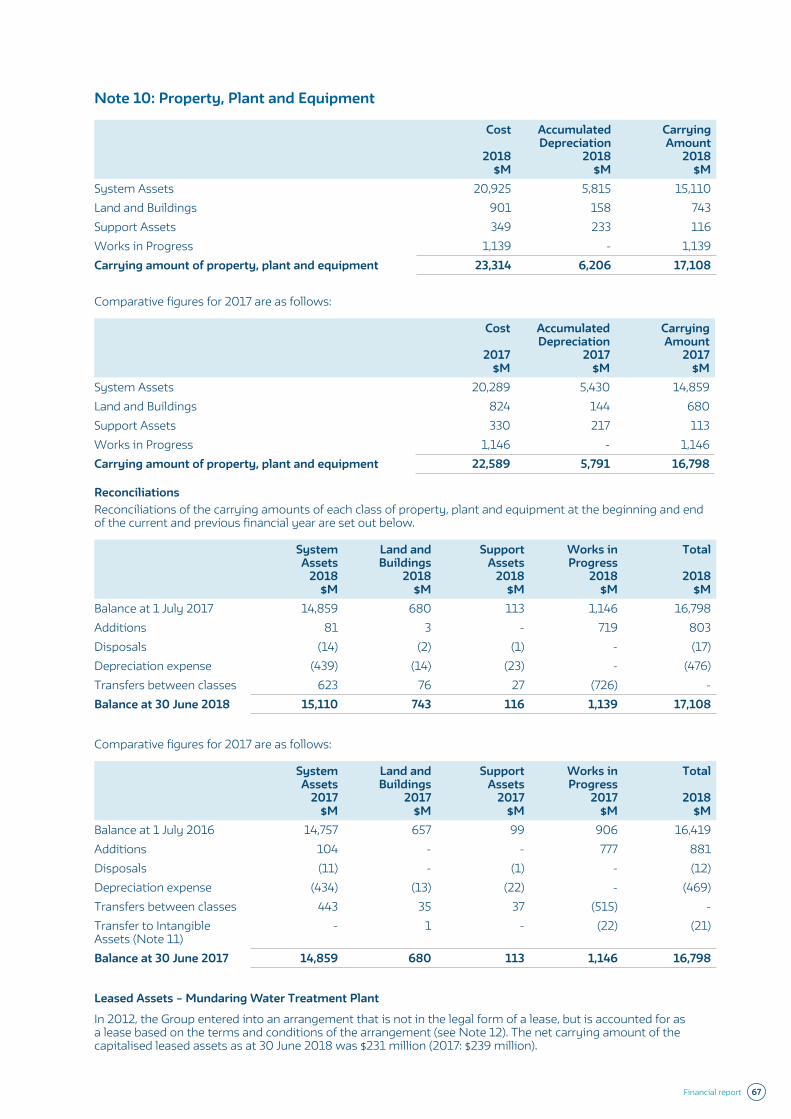
Note 10: Property, Plant and Equipment
Cost
2018 $M
Accumulated Depreciation
2018 $M
Carrying Amount
2018 $M
System Assets 20,925 5,815 15,110Land and Buildings 901 158 743Support Assets 349 233 116Works in Progress 1,139 - 1,139Carrying amount of property, plant and equipment 23,314 6,206 17,108
Comparative figures for 2017 are as follows:
Cost
2017 $M
Accumulated Depreciation
2017 $M
Carrying Amount
2017 $M
System Assets 20,289 5,430 14,859Land and Buildings 824 144 680Support Assets 330 217 113Works in Progress 1,146 - 1,146Carrying amount of property, plant and equipment 22,589 5,791 16,798
ReconciliationsReconciliations of the carrying amounts of each class of property, plant and equipment at the beginning and end of the current and previous financial year are set out below.
System Assets
2018 $M
Land and Buildings
2018 $M
Support Assets
2018 $M
Works in Progress
2018 $M
Total
2018 $M
Balance at 1 July 2017 14,859 680 113 1,146 16,798Additions 81 3 - 719 803Disposals (14) (2) (1) - (17)Depreciation expense (439) (14) (23) - (476)Transfers between classes 623 76 27 (726) -Balance at 30 June 2018 15,110 743 116 1,139 17,108
Comparative figures for 2017 are as follows:
System Assets
2017 $M
Land and Buildings
2017 $M
Support Assets
2017 $M
Works in Progress
2017 $M
Total
2018 $M
Balance at 1 July 2016 14,757 657 99 906 16,419Additions 104 - - 777 881Disposals (11) - (1) - (12)Depreciation expense (434) (13) (22) - (469)Transfers between classes 443 35 37 (515) -Transfer to Intangible Assets (Note 11)
- 1 - (22) (21)
Balance at 30 June 2017 14,859 680 113 1,146 16,798
Leased Assets – Mundaring Water Treatment Plant
In 2012, the Group entered into an arrangement that is not in the legal form of a lease, but is accounted for as a lease based on the terms and conditions of the arrangement (see Note 12). The net carrying amount of the capitalised leased assets as at 30 June 2018 was $231 million (2017: $239 million).
Financial report 67
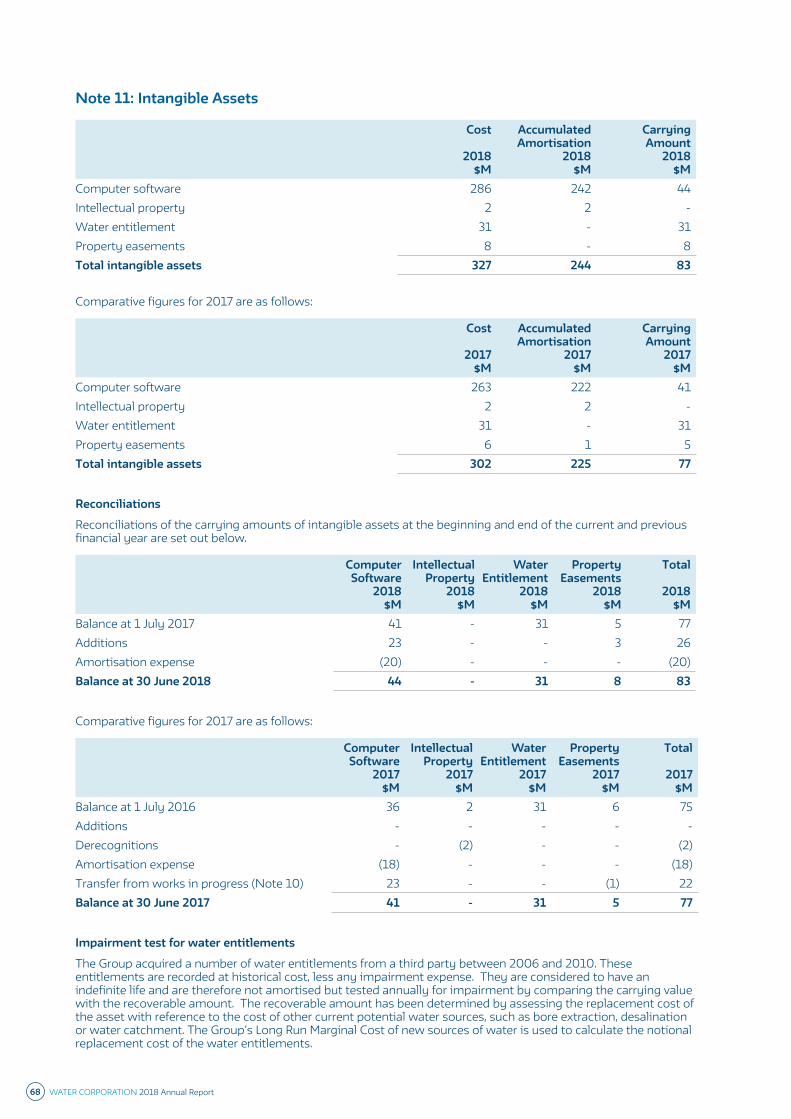
Note 11: Intangible Assets
Cost
2018 $M
Accumulated Amortisation
2018 $M
Carrying Amount
2018 $M
Computer software 286 242 44Intellectual property 2 2 -Water entitlement 31 - 31Property easements 8 - 8Total intangible assets 327 244 83
Comparative figures for 2017 are as follows:
Cost
2017 $M
Accumulated Amortisation
2017 $M
Carrying Amount
2017 $M
Computer software 263 222 41Intellectual property 2 2 -Water entitlement 31 - 31Property easements 6 1 5Total intangible assets 302 225 77
Reconciliations
Reconciliations of the carrying amounts of intangible assets at the beginning and end of the current and previous financial year are set out below.
Computer Software
2018 $M
Intellectual Property
2018 $M
Water Entitlement
2018 $M
Property Easements
2018 $M
Total
2018 $M
Balance at 1 July 2017 41 - 31 5 77Additions 23 - - 3 26Amortisation expense (20) - - - (20)Balance at 30 June 2018 44 - 31 8 83
Comparative figures for 2017 are as follows:
Computer Software
2017 $M
Intellectual Property
2017 $M
Water Entitlement
2017 $M
Property Easements
2017 $M
Total
2017 $M
Balance at 1 July 2016 36 2 31 6 75Additions - - - - -Derecognitions - (2) - - (2)Amortisation expense (18) - - - (18)Transfer from works in progress (Note 10) 23 - - (1) 22Balance at 30 June 2017 41 - 31 5 77
Impairment test for water entitlements
The Group acquired a number of water entitlements from a third party between 2006 and 2010. These entitlements are recorded at historical cost, less any impairment expense. They are considered to have an indefinite life and are therefore not amortised but tested annually for impairment by comparing the carrying value with the recoverable amount. The recoverable amount has been determined by assessing the replacement cost of the asset with reference to the cost of other current potential water sources, such as bore extraction, desalination or water catchment. The Group’s Long Run Marginal Cost of new sources of water is used to calculate the notional replacement cost of the water entitlements.
68 WATER CORPORATION 2018 Annual Report
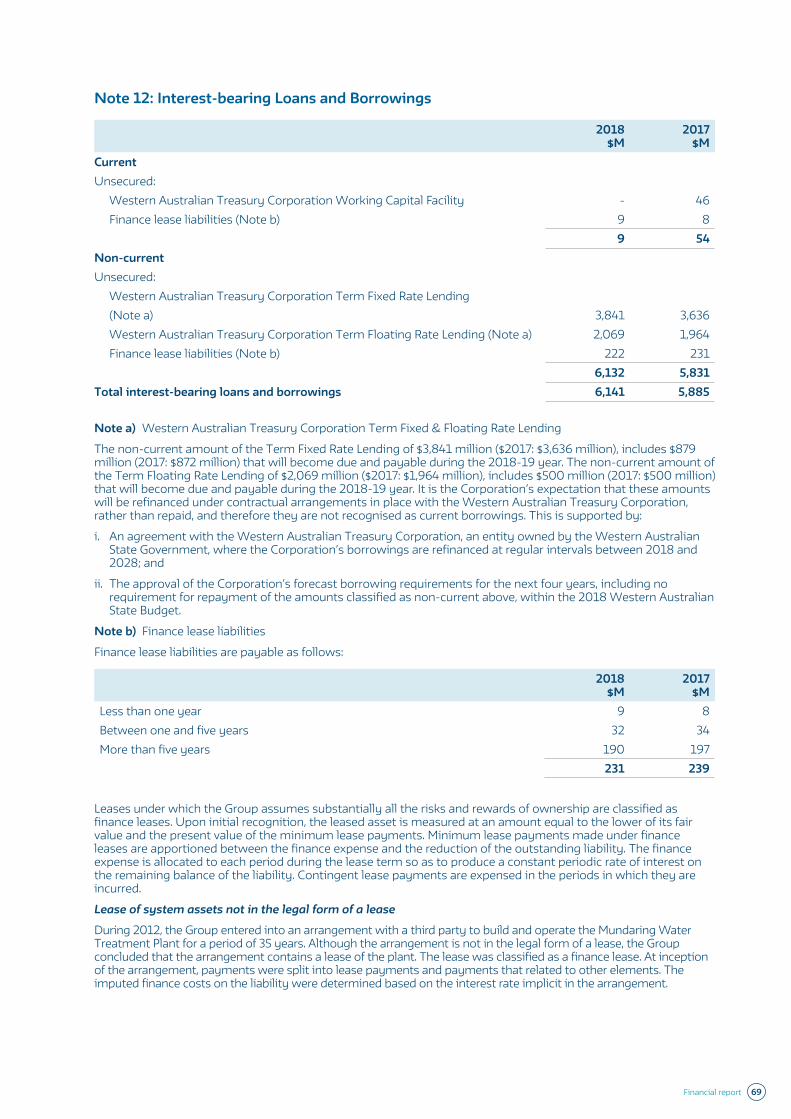
Note 12: Interest-bearing Loans and Borrowings
2018 $M
2017 $M
CurrentUnsecured:
Western Australian Treasury Corporation Working Capital Facility - 46Finance lease liabilities (Note b) 9 8
9 54Non-currentUnsecured:
Western Australian Treasury Corporation Term Fixed Rate Lending (Note a) 3,841 3,636Western Australian Treasury Corporation Term Floating Rate Lending (Note a) 2,069 1,964Finance lease liabilities (Note b) 222 231
6,132 5,831Total interest-bearing loans and borrowings 6,141 5,885
Note a) Western Australian Treasury Corporation Term Fixed & Floating Rate Lending
The non-current amount of the Term Fixed Rate Lending of $3,841 million ($2017: $3,636 million), includes $879 million (2017: $872 million) that will become due and payable during the 2018-19 year. The non-current amount of the Term Floating Rate Lending of $2,069 million ($2017: $1,964 million), includes $500 million (2017: $500 million) that will become due and payable during the 2018-19 year. It is the Corporation’s expectation that these amounts will be refinanced under contractual arrangements in place with the Western Australian Treasury Corporation, rather than repaid, and therefore they are not recognised as current borrowings. This is supported by:
i. An agreement with the Western Australian Treasury Corporation, an entity owned by the Western Australian State Government, where the Corporation’s borrowings are refinanced at regular intervals between 2018 and 2028; and
ii. The approval of the Corporation’s forecast borrowing requirements for the next four years, including no requirement for repayment of the amounts classified as non-current above, within the 2018 Western Australian State Budget.
Note b) Finance lease liabilities
Finance lease liabilities are payable as follows:
2018 $M
2017 $M
Less than one year 9 8Between one and five years 32 34More than five years 190 197
231 239
Leases under which the Group assumes substantially all the risks and rewards of ownership are classified as finance leases. Upon initial recognition, the leased asset is measured at an amount equal to the lower of its fair value and the present value of the minimum lease payments. Minimum lease payments made under finance leases are apportioned between the finance expense and the reduction of the outstanding liability. The finance expense is allocated to each period during the lease term so as to produce a constant periodic rate of interest on the remaining balance of the liability. Contingent lease payments are expensed in the periods in which they are incurred.
Lease of system assets not in the legal form of a lease
During 2012, the Group entered into an arrangement with a third party to build and operate the Mundaring Water Treatment Plant for a period of 35 years. Although the arrangement is not in the legal form of a lease, the Group concluded that the arrangement contains a lease of the plant. The lease was classified as a finance lease. At inception of the arrangement, payments were split into lease payments and payments that related to other elements. The imputed finance costs on the liability were determined based on the interest rate implicit in the arrangement.
Financial report 69
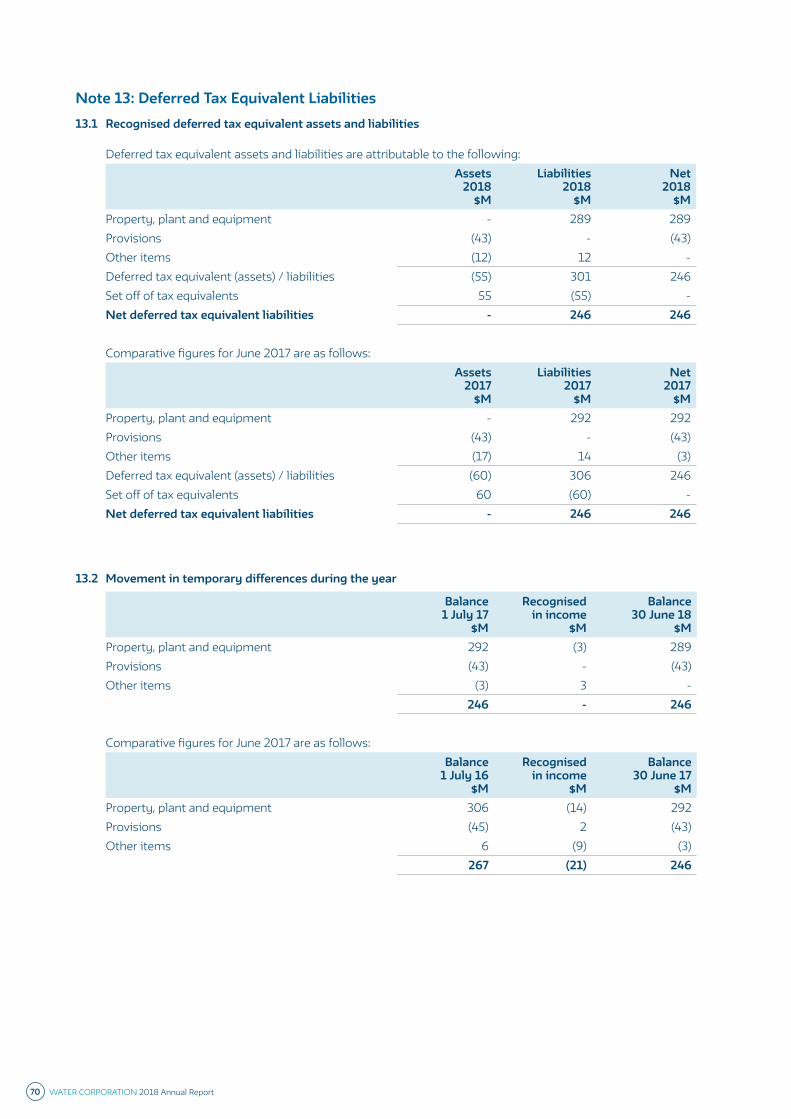
Note 13: Deferred Tax Equivalent Liabilities13.1 Recognised deferred tax equivalent assets and liabilities
Deferred tax equivalent assets and liabilities are attributable to the following:Assets
2018 $M
Liabilities 2018
$M
Net 2018
$MProperty, plant and equipment - 289 289Provisions (43) - (43)Other items (12) 12 -Deferred tax equivalent (assets) / liabilities (55) 301 246Set off of tax equivalents 55 (55) -Net deferred tax equivalent liabilities - 246 246
Comparative figures for June 2017 are as follows:Assets
2017 $M
Liabilities 2017
$M
Net 2017
$MProperty, plant and equipment - 292 292Provisions (43) - (43)Other items (17) 14 (3)Deferred tax equivalent (assets) / liabilities (60) 306 246Set off of tax equivalents 60 (60) -Net deferred tax equivalent liabilities - 246 246
13.2 Movement in temporary differences during the year
Balance 1 July 17
$M
Recognised in income
$M
Balance 30 June 18
$MProperty, plant and equipment 292 (3) 289Provisions (43) - (43)Other items (3) 3 -
246 - 246
Comparative figures for June 2017 are as follows:Balance
1 July 16 $M
Recognised in income
$M
Balance 30 June 17
$MProperty, plant and equipment 306 (14) 292Provisions (45) 2 (43)Other items 6 (9) (3)
267 (21) 246
70 WATER CORPORATION 2018 Annual Report
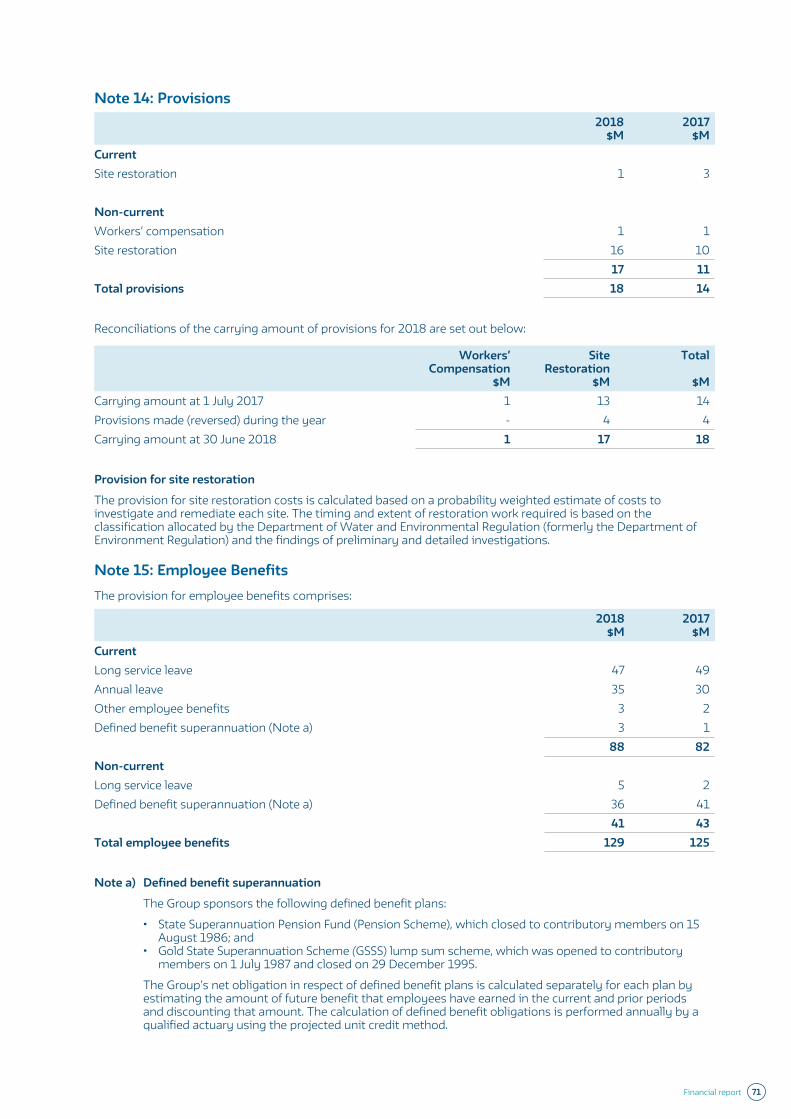
Note 14: Provisions2018
$M2017
$MCurrentSite restoration 1 3
Non-currentWorkers’ compensation 1 1Site restoration 16 10
17 11Total provisions 18 14
Reconciliations of the carrying amount of provisions for 2018 are set out below:
Workers’ Compensation
$M
Site Restoration
$M
Total
$MCarrying amount at 1 July 2017 1 13 14Provisions made (reversed) during the year - 4 4Carrying amount at 30 June 2018 1 17 18
Provision for site restoration
The provision for site restoration costs is calculated based on a probability weighted estimate of costs to investigate and remediate each site. The timing and extent of restoration work required is based on the classification allocated by the Department of Water and Environmental Regulation (formerly the Department of Environment Regulation) and the findings of preliminary and detailed investigations.
Note 15: Employee BenefitsThe provision for employee benefits comprises:
2018 $M
2017 $M
CurrentLong service leave 47 49Annual leave 35 30Other employee benefits 3 2Defined benefit superannuation (Note a) 3 1
88 82Non-currentLong service leave 5 2Defined benefit superannuation (Note a) 36 41
41 43Total employee benefits 129 125
Note a) Defined benefit superannuation
The Group sponsors the following defined benefit plans:
• State Superannuation Pension Fund (Pension Scheme), which closed to contributory members on 15 August 1986; and
• Gold State Superannuation Scheme (GSSS) lump sum scheme, which was opened to contributory members on 1 July 1987 and closed on 29 December 1995.
The Group’s net obligation in respect of defined benefit plans is calculated separately for each plan by estimating the amount of future benefit that employees have earned in the current and prior periods and discounting that amount. The calculation of defined benefit obligations is performed annually by a qualified actuary using the projected unit credit method.
Financial report 71
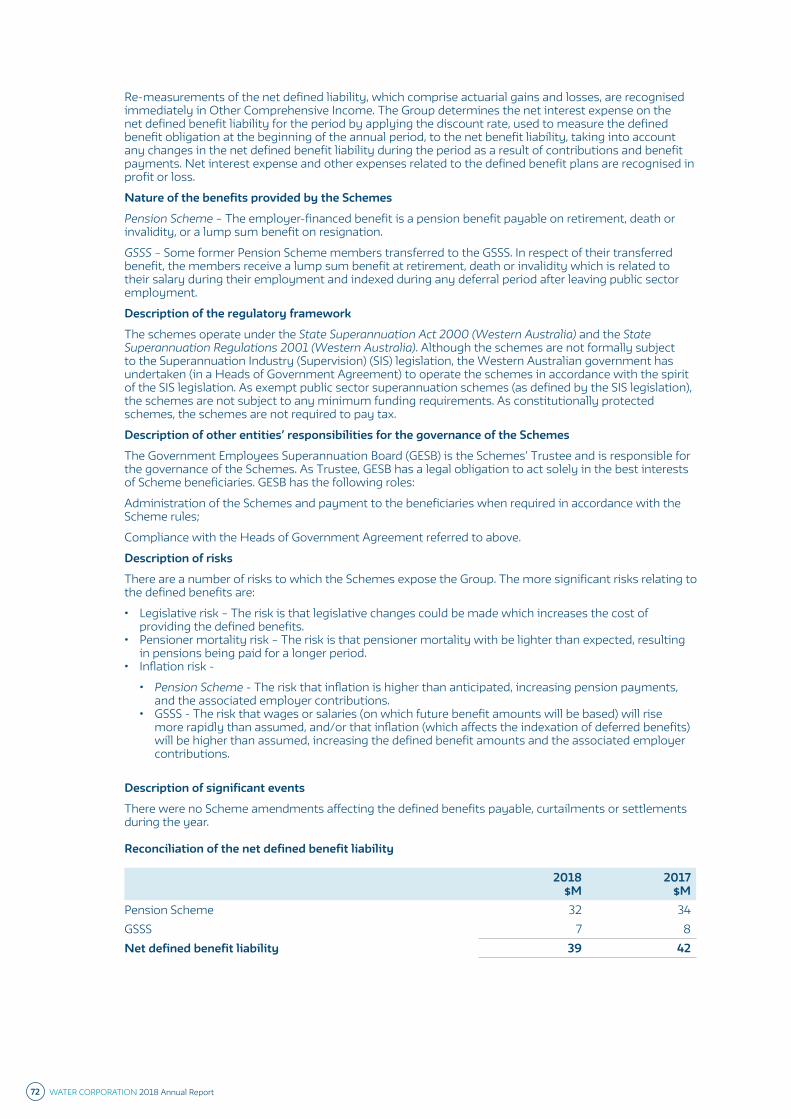
Re-measurements of the net defined liability, which comprise actuarial gains and losses, are recognised immediately in Other Comprehensive Income. The Group determines the net interest expense on the net defined benefit liability for the period by applying the discount rate, used to measure the defined benefit obligation at the beginning of the annual period, to the net benefit liability, taking into account any changes in the net defined benefit liability during the period as a result of contributions and benefit payments. Net interest expense and other expenses related to the defined benefit plans are recognised in profit or loss.
Nature of the benefits provided by the Schemes
Pension Scheme – The employer-financed benefit is a pension benefit payable on retirement, death or invalidity, or a lump sum benefit on resignation.
GSSS – Some former Pension Scheme members transferred to the GSSS. In respect of their transferred benefit, the members receive a lump sum benefit at retirement, death or invalidity which is related to their salary during their employment and indexed during any deferral period after leaving public sector employment.
Description of the regulatory framework
The schemes operate under the State Superannuation Act 2000 (Western Australia) and the State Superannuation Regulations 2001 (Western Australia). Although the schemes are not formally subject to the Superannuation Industry (Supervision) (SIS) legislation, the Western Australian government has undertaken (in a Heads of Government Agreement) to operate the schemes in accordance with the spirit of the SIS legislation. As exempt public sector superannuation schemes (as defined by the SIS legislation), the schemes are not subject to any minimum funding requirements. As constitutionally protected schemes, the schemes are not required to pay tax.
Description of other entities’ responsibilities for the governance of the Schemes
The Government Employees Superannuation Board (GESB) is the Schemes’ Trustee and is responsible for the governance of the Schemes. As Trustee, GESB has a legal obligation to act solely in the best interests of Scheme beneficiaries. GESB has the following roles:
Administration of the Schemes and payment to the beneficiaries when required in accordance with the Scheme rules;
Compliance with the Heads of Government Agreement referred to above.
Description of risks
There are a number of risks to which the Schemes expose the Group. The more significant risks relating to the defined benefits are:
• Legislative risk – The risk is that legislative changes could be made which increases the cost of providing the defined benefits.
• Pensioner mortality risk – The risk is that pensioner mortality with be lighter than expected, resulting in pensions being paid for a longer period.
• Inflation risk -
• Pension Scheme - The risk that inflation is higher than anticipated, increasing pension payments, and the associated employer contributions.
• GSSS - The risk that wages or salaries (on which future benefit amounts will be based) will rise more rapidly than assumed, and/or that inflation (which affects the indexation of deferred benefits) will be higher than assumed, increasing the defined benefit amounts and the associated employer contributions.
Description of significant events
There were no Scheme amendments affecting the defined benefits payable, curtailments or settlements during the year.
Reconciliation of the net defined benefit liability
2018 $M
2017 $M
Pension Scheme 32 34GSSS 7 8Net defined benefit liability 39 42
72 WATER CORPORATION 2018 Annual Report
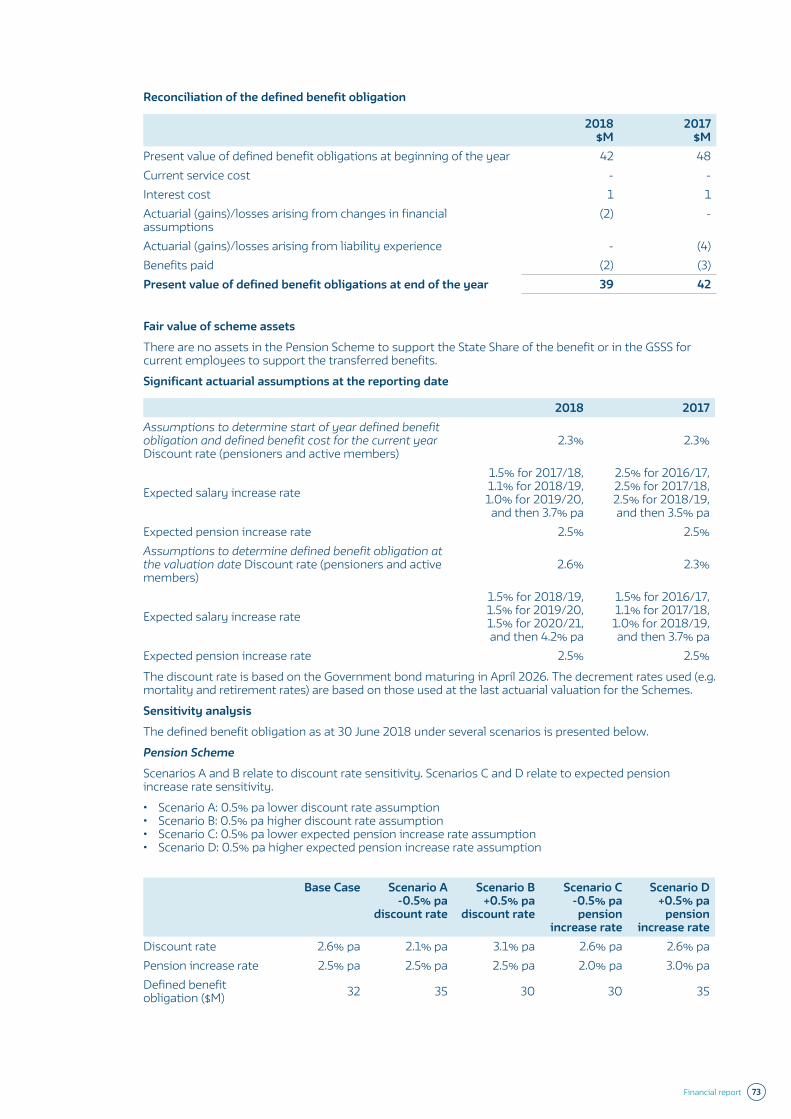
Reconciliation of the defined benefit obligation
2018 $M
2017 $M
Present value of defined benefit obligations at beginning of the year 42 48Current service cost - -Interest cost 1 1Actuarial (gains)/losses arising from changes in financial assumptions
(2) -
Actuarial (gains)/losses arising from liability experience - (4)Benefits paid (2) (3)Present value of defined benefit obligations at end of the year 39 42
Fair value of scheme assets
There are no assets in the Pension Scheme to support the State Share of the benefit or in the GSSS for current employees to support the transferred benefits.
Significant actuarial assumptions at the reporting date
2018 2017 Assumptions to determine start of year defined benefit obligation and defined benefit cost for the current year Discount rate (pensioners and active members)
2.3% 2.3%
Expected salary increase rate
1.5% for 2017/18, 1.1% for 2018/19, 1.0% for 2019/20, and then 3.7% pa
2.5% for 2016/17, 2.5% for 2017/18, 2.5% for 2018/19, and then 3.5% pa
Expected pension increase rate 2.5% 2.5%Assumptions to determine defined benefit obligation at the valuation date Discount rate (pensioners and active members)
2.6% 2.3%
Expected salary increase rate
1.5% for 2018/19, 1.5% for 2019/20, 1.5% for 2020/21, and then 4.2% pa
1.5% for 2016/17, 1.1% for 2017/18, 1.0% for 2018/19, and then 3.7% pa
Expected pension increase rate 2.5% 2.5%
The discount rate is based on the Government bond maturing in April 2026. The decrement rates used (e.g. mortality and retirement rates) are based on those used at the last actuarial valuation for the Schemes.
Sensitivity analysis
The defined benefit obligation as at 30 June 2018 under several scenarios is presented below.
Pension Scheme
Scenarios A and B relate to discount rate sensitivity. Scenarios C and D relate to expected pension increase rate sensitivity.
• Scenario A: 0.5% pa lower discount rate assumption• Scenario B: 0.5% pa higher discount rate assumption• Scenario C: 0.5% pa lower expected pension increase rate assumption• Scenario D: 0.5% pa higher expected pension increase rate assumption
Base Case Scenario A -0.5% pa
discount rate
Scenario B +0.5% pa
discount rate
Scenario C -0.5% pa pension
increase rate
Scenario D +0.5% pa
pension increase rate
Discount rate 2.6% pa 2.1% pa 3.1% pa 2.6% pa 2.6% paPension increase rate 2.5% pa 2.5% pa 2.5% pa 2.0% pa 3.0% paDefined benefit obligation ($M) 32 35 30 30 35
Financial report 73
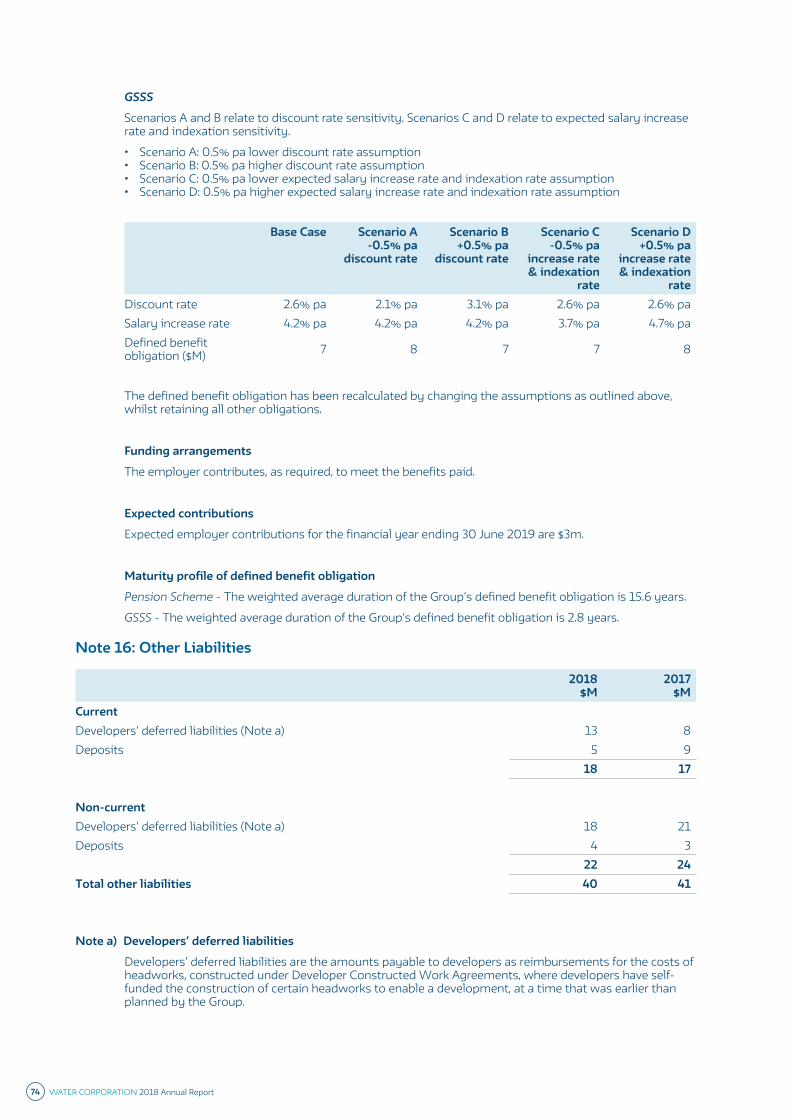
GSSS
Scenarios A and B relate to discount rate sensitivity. Scenarios C and D relate to expected salary increase rate and indexation sensitivity.
• Scenario A: 0.5% pa lower discount rate assumption• Scenario B: 0.5% pa higher discount rate assumption• Scenario C: 0.5% pa lower expected salary increase rate and indexation rate assumption• Scenario D: 0.5% pa higher expected salary increase rate and indexation rate assumption
Base Case Scenario A -0.5% pa
discount rate
Scenario B +0.5% pa
discount rate
Scenario C -0.5% pa
increase rate & indexation
rate
Scenario D +0.5% pa
increase rate & indexation
rateDiscount rate 2.6% pa 2.1% pa 3.1% pa 2.6% pa 2.6% paSalary increase rate 4.2% pa 4.2% pa 4.2% pa 3.7% pa 4.7% paDefined benefit obligation ($M) 7 8 7 7 8
The defined benefit obligation has been recalculated by changing the assumptions as outlined above, whilst retaining all other obligations.
Funding arrangements
The employer contributes, as required, to meet the benefits paid.
Expected contributions
Expected employer contributions for the financial year ending 30 June 2019 are $3m.
Maturity profile of defined benefit obligation
Pension Scheme - The weighted average duration of the Group’s defined benefit obligation is 15.6 years.
GSSS - The weighted average duration of the Group’s defined benefit obligation is 2.8 years.
Note 16: Other Liabilities
2018 $M
2017 $M
CurrentDevelopers’ deferred liabilities (Note a) 13 8Deposits 5 9
18 17
Non-currentDevelopers’ deferred liabilities (Note a) 18 21Deposits 4 3
22 24Total other liabilities 40 41
Note a) Developers’ deferred liabilities
Developers’ deferred liabilities are the amounts payable to developers as reimbursements for the costs of headworks, constructed under Developer Constructed Work Agreements, where developers have self-funded the construction of certain headworks to enable a development, at a time that was earlier than planned by the Group.
74 WATER CORPORATION 2018 Annual Report
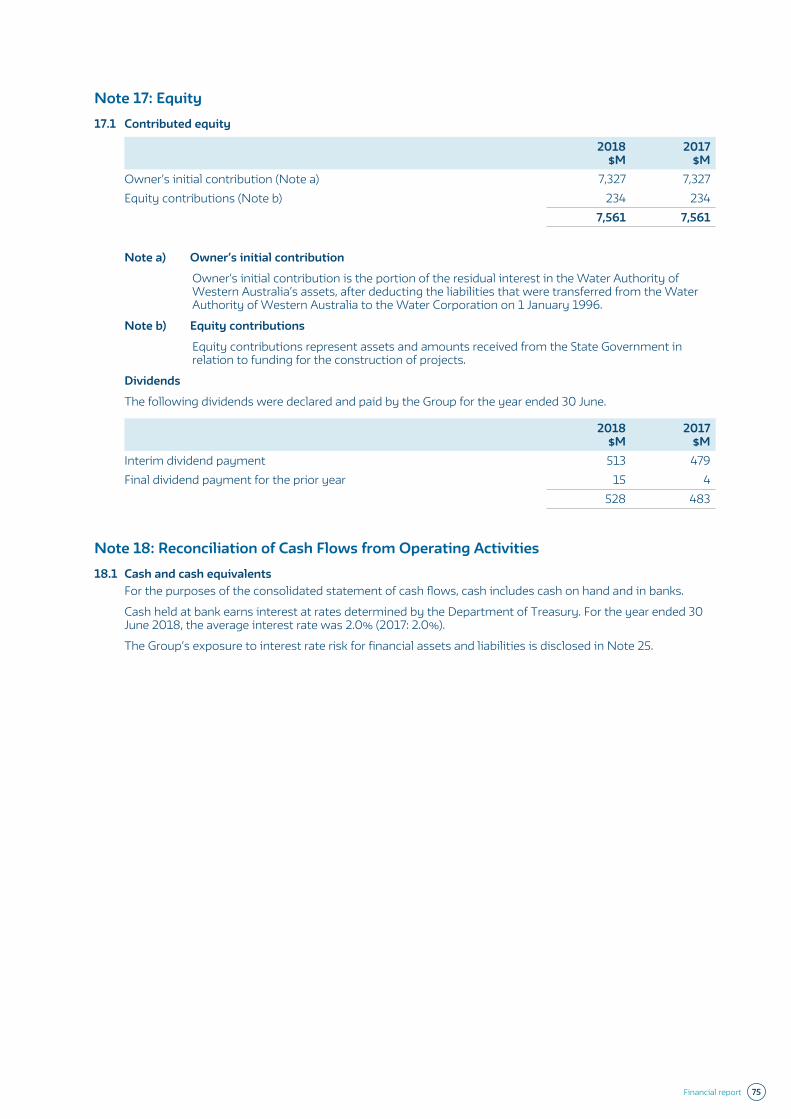
Note 17: Equity17.1 Contributed equity
2018 $M
2017 $M
Owner’s initial contribution (Note a) 7,327 7,327Equity contributions (Note b) 234 234
7,561 7,561
Note a) Owner’s initial contribution
Owner’s initial contribution is the portion of the residual interest in the Water Authority of Western Australia’s assets, after deducting the liabilities that were transferred from the Water Authority of Western Australia to the Water Corporation on 1 January 1996.
Note b) Equity contributions
Equity contributions represent assets and amounts received from the State Government in relation to funding for the construction of projects.
Dividends
The following dividends were declared and paid by the Group for the year ended 30 June.
2018 $M
2017 $M
Interim dividend payment 513 479Final dividend payment for the prior year 15 4
528 483
Note 18: Reconciliation of Cash Flows from Operating Activities18.1 Cash and cash equivalents
For the purposes of the consolidated statement of cash flows, cash includes cash on hand and in banks.
Cash held at bank earns interest at rates determined by the Department of Treasury. For the year ended 30 June 2018, the average interest rate was 2.0% (2017: 2.0%).
The Group’s exposure to interest rate risk for financial assets and liabilities is disclosed in Note 25.
Financial report 75
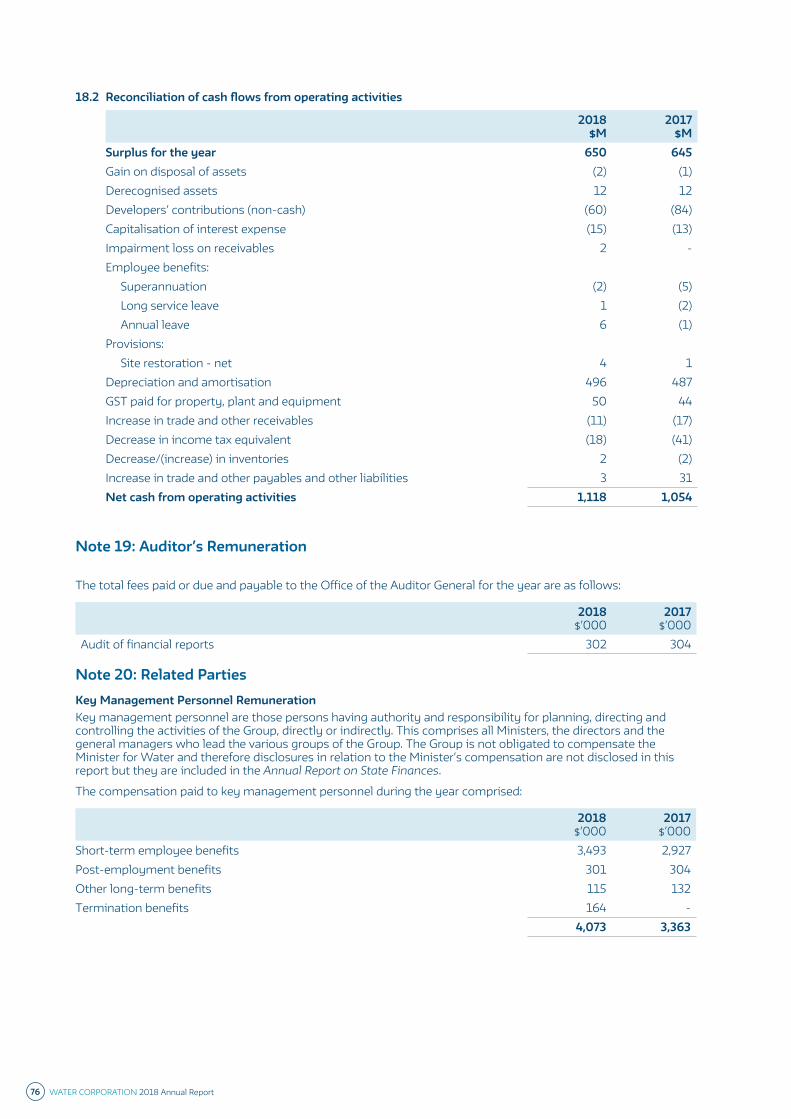
18.2 Reconciliation of cash flows from operating activities
2018 $M
2017 $M
Surplus for the year 650 645Gain on disposal of assets (2) (1)Derecognised assets 12 12Developers’ contributions (non-cash) (60) (84)Capitalisation of interest expense (15) (13)Impairment loss on receivables 2 -Employee benefits:
Superannuation (2) (5)Long service leave 1 (2)Annual leave 6 (1)
Provisions:Site restoration - net 4 1
Depreciation and amortisation 496 487GST paid for property, plant and equipment 50 44Increase in trade and other receivables (11) (17)Decrease in income tax equivalent (18) (41)Decrease/(increase) in inventories 2 (2)Increase in trade and other payables and other liabilities 3 31Net cash from operating activities 1,118 1,054
Note 19: Auditor’s Remuneration
The total fees paid or due and payable to the Office of the Auditor General for the year are as follows:
2018 $’000
2017 $’000
Audit of financial reports 302 304
Note 20: Related PartiesKey Management Personnel RemunerationKey management personnel are those persons having authority and responsibility for planning, directing and controlling the activities of the Group, directly or indirectly. This comprises all Ministers, the directors and the general managers who lead the various groups of the Group. The Group is not obligated to compensate the Minister for Water and therefore disclosures in relation to the Minister’s compensation are not disclosed in this report but they are included in the Annual Report on State Finances.
The compensation paid to key management personnel during the year comprised:
2018 $’000
2017 $’000
Short-term employee benefits 3,493 2,927Post-employment benefits 301 304Other long-term benefits 115 132Termination benefits 164 - 4,073 3,363
76 WATER CORPORATION 2018 Annual Report
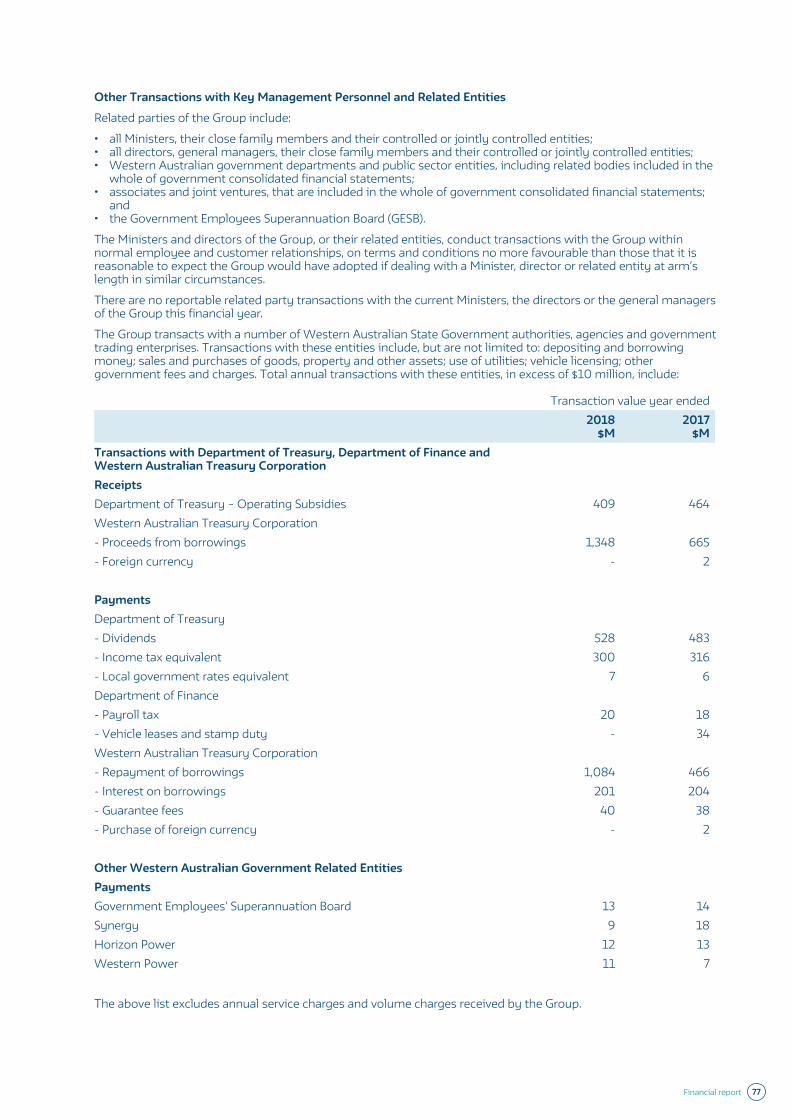
Other Transactions with Key Management Personnel and Related Entities
Related parties of the Group include:
• all Ministers, their close family members and their controlled or jointly controlled entities;• all directors, general managers, their close family members and their controlled or jointly controlled entities;• Western Australian government departments and public sector entities, including related bodies included in the
whole of government consolidated financial statements;• associates and joint ventures, that are included in the whole of government consolidated financial statements;
and• the Government Employees Superannuation Board (GESB).
The Ministers and directors of the Group, or their related entities, conduct transactions with the Group within normal employee and customer relationships, on terms and conditions no more favourable than those that it is reasonable to expect the Group would have adopted if dealing with a Minister, director or related entity at arm’s length in similar circumstances.
There are no reportable related party transactions with the current Ministers, the directors or the general managers of the Group this financial year.
The Group transacts with a number of Western Australian State Government authorities, agencies and government trading enterprises. Transactions with these entities include, but are not limited to: depositing and borrowing money; sales and purchases of goods, property and other assets; use of utilities; vehicle licensing; other government fees and charges. Total annual transactions with these entities, in excess of $10 million, include:
Transaction value year ended2018
$M2017
$MTransactions with Department of Treasury, Department of Finance and Western Australian Treasury CorporationReceiptsDepartment of Treasury – Operating Subsidies 409 464Western Australian Treasury Corporation- Proceeds from borrowings 1,348 665- Foreign currency - 2
PaymentsDepartment of Treasury- Dividends 528 483- Income tax equivalent 300 316- Local government rates equivalent 7 6Department of Finance- Payroll tax 20 18- Vehicle leases and stamp duty - 34Western Australian Treasury Corporation- Repayment of borrowings 1,084 466- Interest on borrowings 201 204- Guarantee fees 40 38- Purchase of foreign currency - 2
Other Western Australian Government Related EntitiesPaymentsGovernment Employees’ Superannuation Board 13 14Synergy 9 18Horizon Power 12 13Western Power 11 7
The above list excludes annual service charges and volume charges received by the Group.
Financial report 77
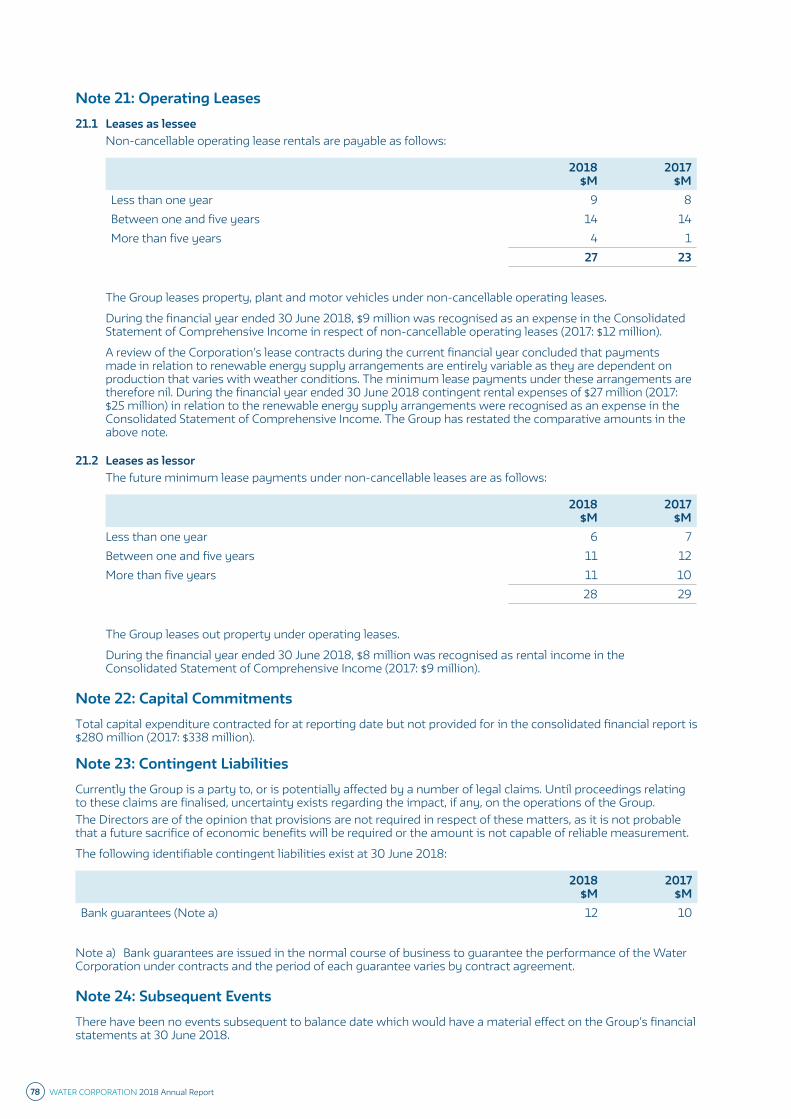
Note 21: Operating Leases21.1 Leases as lessee
Non-cancellable operating lease rentals are payable as follows:
2018 $M
2017 $M
Less than one year 9 8Between one and five years 14 14More than five years 4 1
27 23
The Group leases property, plant and motor vehicles under non-cancellable operating leases.
During the financial year ended 30 June 2018, $9 million was recognised as an expense in the Consolidated Statement of Comprehensive Income in respect of non-cancellable operating leases (2017: $12 million).
A review of the Corporation’s lease contracts during the current financial year concluded that payments made in relation to renewable energy supply arrangements are entirely variable as they are dependent on production that varies with weather conditions. The minimum lease payments under these arrangements are therefore nil. During the financial year ended 30 June 2018 contingent rental expenses of $27 million (2017: $25 million) in relation to the renewable energy supply arrangements were recognised as an expense in the Consolidated Statement of Comprehensive Income. The Group has restated the comparative amounts in the above note.
21.2 Leases as lessorThe future minimum lease payments under non-cancellable leases are as follows:
2018 $M
2017 $M
Less than one year 6 7Between one and five years 11 12More than five years 11 10
28 29
The Group leases out property under operating leases.
During the financial year ended 30 June 2018, $8 million was recognised as rental income in the Consolidated Statement of Comprehensive Income (2017: $9 million).
Note 22: Capital CommitmentsTotal capital expenditure contracted for at reporting date but not provided for in the consolidated financial report is $280 million (2017: $338 million).
Note 23: Contingent LiabilitiesCurrently the Group is a party to, or is potentially affected by a number of legal claims. Until proceedings relating to these claims are finalised, uncertainty exists regarding the impact, if any, on the operations of the Group.The Directors are of the opinion that provisions are not required in respect of these matters, as it is not probable that a future sacrifice of economic benefits will be required or the amount is not capable of reliable measurement.
The following identifiable contingent liabilities exist at 30 June 2018:
2018 $M
2017 $M
Bank guarantees (Note a) 12 10
Note a) Bank guarantees are issued in the normal course of business to guarantee the performance of the Water Corporation under contracts and the period of each guarantee varies by contract agreement.
Note 24: Subsequent EventsThere have been no events subsequent to balance date which would have a material effect on the Group’s financial statements at 30 June 2018.
78 WATER CORPORATION 2018 Annual Report
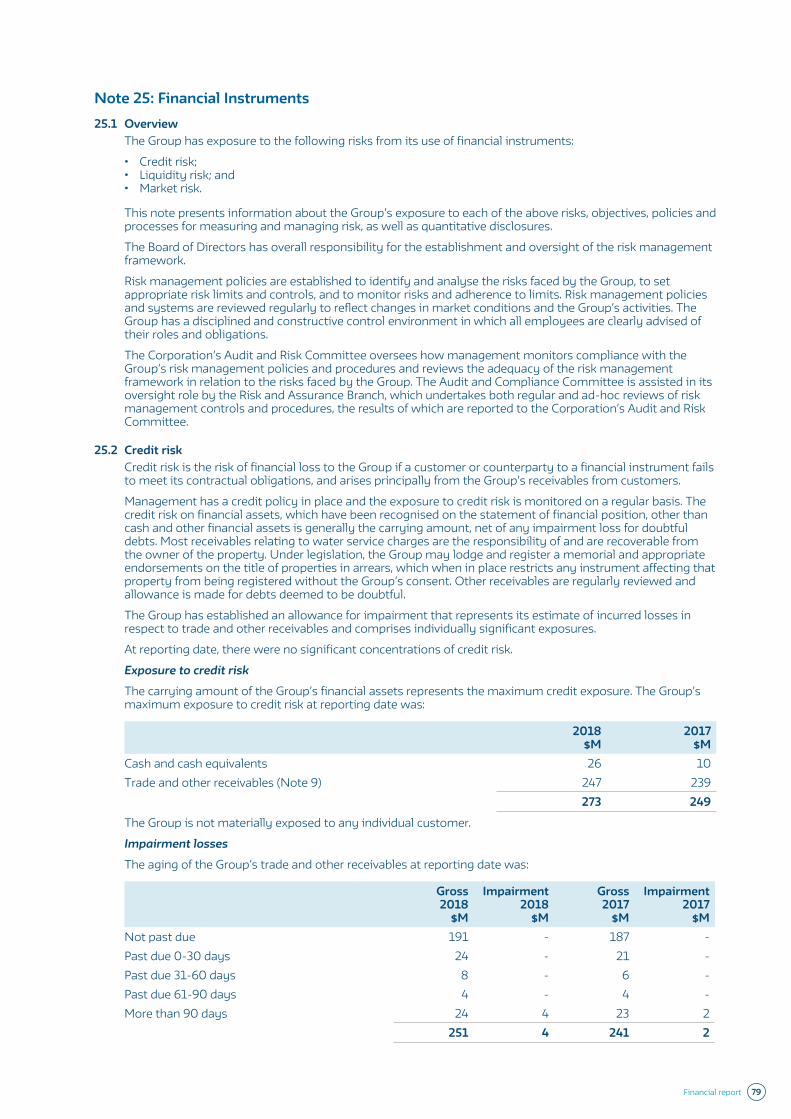
Note 25: Financial Instruments25.1 Overview
The Group has exposure to the following risks from its use of financial instruments:
• Credit risk;• Liquidity risk; and• Market risk.
This note presents information about the Group’s exposure to each of the above risks, objectives, policies and processes for measuring and managing risk, as well as quantitative disclosures.
The Board of Directors has overall responsibility for the establishment and oversight of the risk management framework.
Risk management policies are established to identify and analyse the risks faced by the Group, to set appropriate risk limits and controls, and to monitor risks and adherence to limits. Risk management policies and systems are reviewed regularly to reflect changes in market conditions and the Group’s activities. The Group has a disciplined and constructive control environment in which all employees are clearly advised of their roles and obligations.
The Corporation’s Audit and Risk Committee oversees how management monitors compliance with the Group’s risk management policies and procedures and reviews the adequacy of the risk management framework in relation to the risks faced by the Group. The Audit and Compliance Committee is assisted in its oversight role by the Risk and Assurance Branch, which undertakes both regular and ad-hoc reviews of risk management controls and procedures, the results of which are reported to the Corporation’s Audit and Risk Committee.
25.2 Credit riskCredit risk is the risk of financial loss to the Group if a customer or counterparty to a financial instrument fails to meet its contractual obligations, and arises principally from the Group’s receivables from customers.
Management has a credit policy in place and the exposure to credit risk is monitored on a regular basis. The credit risk on financial assets, which have been recognised on the statement of financial position, other than cash and other financial assets is generally the carrying amount, net of any impairment loss for doubtful debts. Most receivables relating to water service charges are the responsibility of and are recoverable from the owner of the property. Under legislation, the Group may lodge and register a memorial and appropriate endorsements on the title of properties in arrears, which when in place restricts any instrument affecting that property from being registered without the Group’s consent. Other receivables are regularly reviewed and allowance is made for debts deemed to be doubtful.
The Group has established an allowance for impairment that represents its estimate of incurred losses in respect to trade and other receivables and comprises individually significant exposures.
At reporting date, there were no significant concentrations of credit risk.
Exposure to credit risk
The carrying amount of the Group’s financial assets represents the maximum credit exposure. The Group’s maximum exposure to credit risk at reporting date was:
2018 $M
2017 $M
Cash and cash equivalents 26 10Trade and other receivables (Note 9) 247 239
273 249
The Group is not materially exposed to any individual customer.
Impairment losses
The aging of the Group’s trade and other receivables at reporting date was:
Gross 2018
$M
Impairment 2018
$M
Gross 2017
$M
Impairment 2017
$MNot past due 191 - 187 -Past due 0-30 days 24 - 21 -Past due 31-60 days 8 - 6 -Past due 61-90 days 4 - 4 -More than 90 days 24 4 23 2
251 4 241 2
Financial report 79

The movement in the allowance for impairment in respect of trade and other receivables during the year was as follows:
2018 $M
2017 $M
Balance at 1 July 2 2Impairment loss recognised 2 -Balance at 30 June 4 2
Impairment losses are recognised when recovery of the debt is considered to be unlikely or of high risk due to circumstances such as the value of any security held is or becomes less than the value of the debt, the cost of recovery is approximate to or becomes greater than the value of the debt, the customer’s financial position is unfavourable or the customer is deceased or whereabouts is unknown.
Based on historical default rates, the Group believes that no impairment allowance is necessary in respect of trade and other receivables not past due or past due by up to 90 days.
During the year ended 30 June 2018, the Group renegotiated the terms of trade and other receivables of $29 million (2017: $29 million) from customers. If it had not been for these renegotiations, the receivables would have been overdue by more than 90 days. There was no impairment loss recognised this financial year (2017: nil).
The allowance account, in respect of trade and other receivables, is used to record impairment losses, unless the Group is satisfied that no recovery of the amount owing is possible. At that point, the amounts considered irrecoverable are written off against the financial asset directly. At 30 June 2018, the Group does not have any collective impairments on its trade and other receivables (2017: nil).
25.3 Liquidity riskLiquidity risk is the risk that the Group will not be able to meet its financial obligations as they fall due. The Group’s approach to managing liquidity is to ensure, as far as possible, that it will always have sufficient liquidity to meet its liabilities when due, under both normal and stressed conditions, without incurring unacceptable losses or risking damage to the Group’s reputation.
On an annual basis, the Board approves the forward five-year forecast of cash flows incorporated in the Strategic Development Plan (SDP). On an annual basis, the Board also approves the projected cash flows, for the current and next financial years, derived from the Statement of Corporate Intent (SCI). The SDP and SCI convey the liquidity risk by reporting projected net debt levels with committed facilities. During the financial year, any significant divergence from the projected cash flows is reported to the Board.
The Corporation ensures that it maintains a liquidity buffer of $4 million on a daily basis in approved liquidity instruments to cover cash flow volatility over the short-term and to provide time to arrange additional funding facilities in the event of a cash flow emergency. Funds held in excess of liquidity requirements may be used to retire debt, invest in approved liquidity instruments or invest in approved financial instruments other than approved liquidity instruments in a manner consistent with the approved liquidity and funding strategy.
At 30 June 2018, the current liabilities of the Corporation exceeded its current assets by $172 million (2017: $281 million). The Corporation will meet its current liability obligations, as and when they fall due for payment, by refinancing the debt, under contractual arrangements in place with the Western Australian Treasury Corporation (see Note 12).
The Corporation has in place arrangements for Western Australian Treasury Corporation (WATC) to provide finance, with total facility limits set by the State Treasurer through the annual State Budget, or as amended from time-to-time by a formal process including the Mid-year Review or via letters of amendment.
For 2017/18, the borrowing limit was set at $5,956 million (2017: $5,722 million) for the repayment of maturing debt and ongoing capital expenditure. Included in the limit of $5,956 million is a Liquidity Facility that can be drawn down, within the constraints of the total limit, to meet short-term financing needs, and a Working Capital Facility currently limited to $80 million (2017: $80 million) to assist with cash flow management.
As at 30 June 2018, $5,910 million was drawn under the total debt facility (2017: $5,646 million), including $nil (2017: $46 million) of Working Capital Facility. The remaining amount available under the total debt facility, with the relevant approval was $46 million (2017: $76 million). For 2018/19, the facility limit has initially been set at $6,006 million (2017: $5,927 million) providing available borrowings of $96 million up to 30 June 2019.
Outstanding lines of credit are regularly discussed and agreed with WATC. The type, currency and term of any new finance are determined at the time of draw-down between the Corporation and WATC.
80 WATER CORPORATION 2018 Annual Report
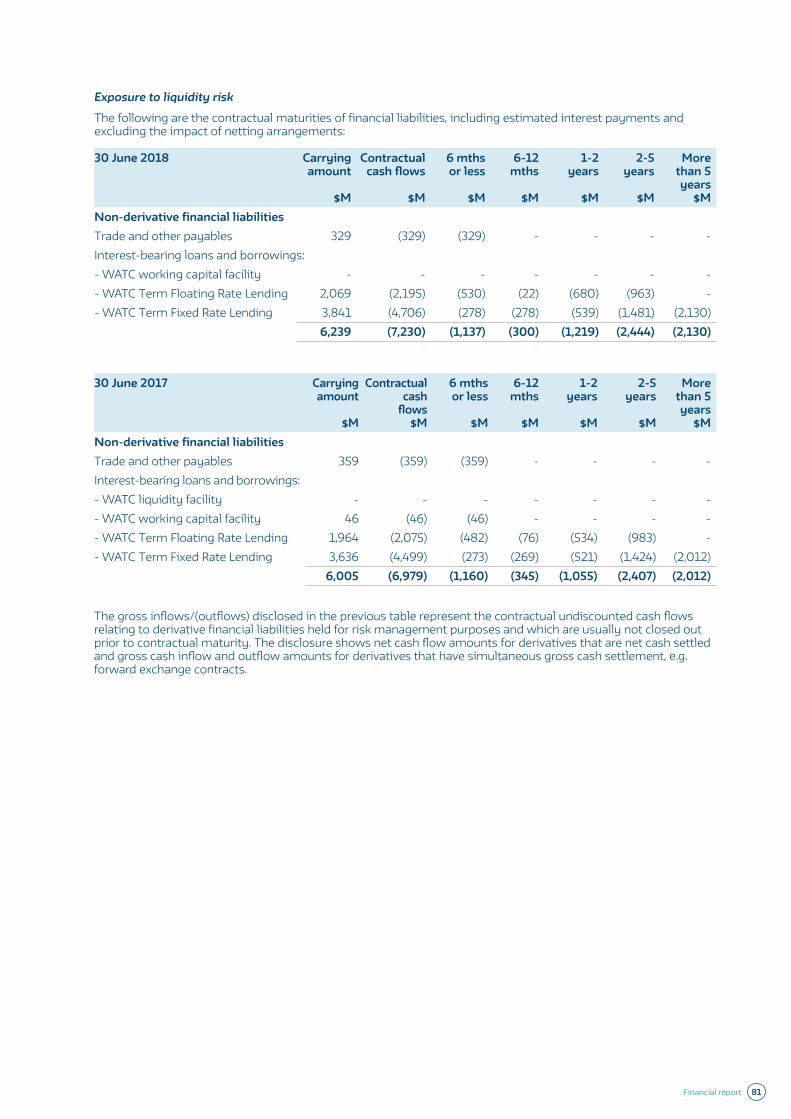
Exposure to liquidity risk
The following are the contractual maturities of financial liabilities, including estimated interest payments and excluding the impact of netting arrangements:
30 June 2018 Carrying amount
$M
Contractual cash flows
$M
6 mths or less
$M
6-12 mths
$M
1-2 years
$M
2-5 years
$M
More than 5 years
$MNon-derivative financial liabilitiesTrade and other payables 329 (329) (329) - - - -Interest-bearing loans and borrowings:- WATC working capital facility - - - - - - -- WATC Term Floating Rate Lending 2,069 (2,195) (530) (22) (680) (963) -- WATC Term Fixed Rate Lending 3,841 (4,706) (278) (278) (539) (1,481) (2,130)
6,239 (7,230) (1,137) (300) (1,219) (2,444) (2,130)
30 June 2017 Carrying amount
$M
Contractual cash
flows $M
6 mths or less
$M
6-12 mths
$M
1-2 years
$M
2-5 years
$M
More than 5 years
$MNon-derivative financial liabilitiesTrade and other payables 359 (359) (359) - - - -Interest-bearing loans and borrowings:- WATC liquidity facility - - - - - - -- WATC working capital facility 46 (46) (46) - - - -- WATC Term Floating Rate Lending 1,964 (2,075) (482) (76) (534) (983) -- WATC Term Fixed Rate Lending 3,636 (4,499) (273) (269) (521) (1,424) (2,012)
6,005 (6,979) (1,160) (345) (1,055) (2,407) (2,012)
The gross inflows/(outflows) disclosed in the previous table represent the contractual undiscounted cash flows relating to derivative financial liabilities held for risk management purposes and which are usually not closed out prior to contractual maturity. The disclosure shows net cash flow amounts for derivatives that are net cash settled and gross cash inflow and outflow amounts for derivatives that have simultaneous gross cash settlement, e.g. forward exchange contracts.
Financial report 81

25.4 Market riskMarket risk is the risk that changes in market prices, such as foreign exchange rates and interest rates, will affect the Group’s income or the value of its holdings of financial instruments. The objective of market risk management is to manage and control market risk exposures within acceptable parameters, while optimising return.
The Group enters into derivatives, and also incurs financial liabilities, in order to manage market risks. All such transactions are carried out in line with risk management policies. Generally, the Group seeks to apply hedge accounting in order to manage volatility in surplus or deficit.
25.4.1 Currency riskThe Group makes purchases that are denominated in currencies other than Australian dollars. The currencies in which these transactions primarily are denominated in are Euro and USD.
In accordance with risk management policies, non-material exposures to an aggregate value of $200,000 for any one project may be left unhedged. At any one time, unhedged exposures in a specific foreign currency cannot exceed an aggregate value of $500,000 and unhedged exposures in all foreign currencies cannot exceed an aggregate value of $1,000,000.
The Group uses forward exchange contracts to hedge its currency risk, most with a maturity of less than one year from reporting date. When necessary, forward exchange contracts are rolled over at maturity.
The Group has no material exposure to foreign currency risk.
25.4.2 Interest rate riskThe Group is exposed to interest rate risk through financial assets and financial liabilities and adopts a policy of ensuring the majority of its exposure to changes in interest rates on borrowings is on a fixed rate basis.
ProfileAt reporting date the interest rate profile of the Group’s interest bearing financial instruments was:
2018 $M
2017 $M
Fixed rate instrumentsWATC Working capital facility - 46WATC Term Floating Rate Lending (interest rate fixed for 3 or 6 months) 2,069 1,964WATC Term Fixed Rate Lending (Note a) 3,841 3,636
5,910 5,646
Note a) Structured into 40 lines spread over 40 quarters (10 years), with one fortieth of the portfolio maturing each quarter, refinanced at an interest rate fixed for 10 years.
Fair value sensitivity analysis for fixed rate instruments
The Group does not account for any fixed rate financial assets and liabilities at fair value through surplus or deficit, and the Group does not designate the forward points component of derivatives as hedging instruments under a fair value hedge accounting model. Therefore, a change in interest rates at reporting date would not affect equity.
Cash flow sensitivity analysis for fixed rate instruments
Borrowings under the Term Fixed Rate Lending facility are structured into various lines of 10 year debt, with maturities staggered quarterly. Of the total $3,841 million under the Term Fixed Rate Lending facility, $379 million will mature in the next 12 months and will be refinanced at interest rates fixed for 10 years. Borrowings under the Term Floating Rate Lending facility are structured into various debt lines, with maturities between 2 years and 5 years. Interest rates under the Term Floating Rate facility are reset every 3 months or 6 months. Of the total $2,069 million under this facility, $500 million will mature in the next 12 months, with interest rates fixed for either 3 months or 6 months. A change of 100 basis points in interest rates at the reporting date would have increased or decreased interest expense (before capitalised interest) by $18 million. This analysis assumes that all other variables remain constant.
82 WATER CORPORATION 2018 Annual Report
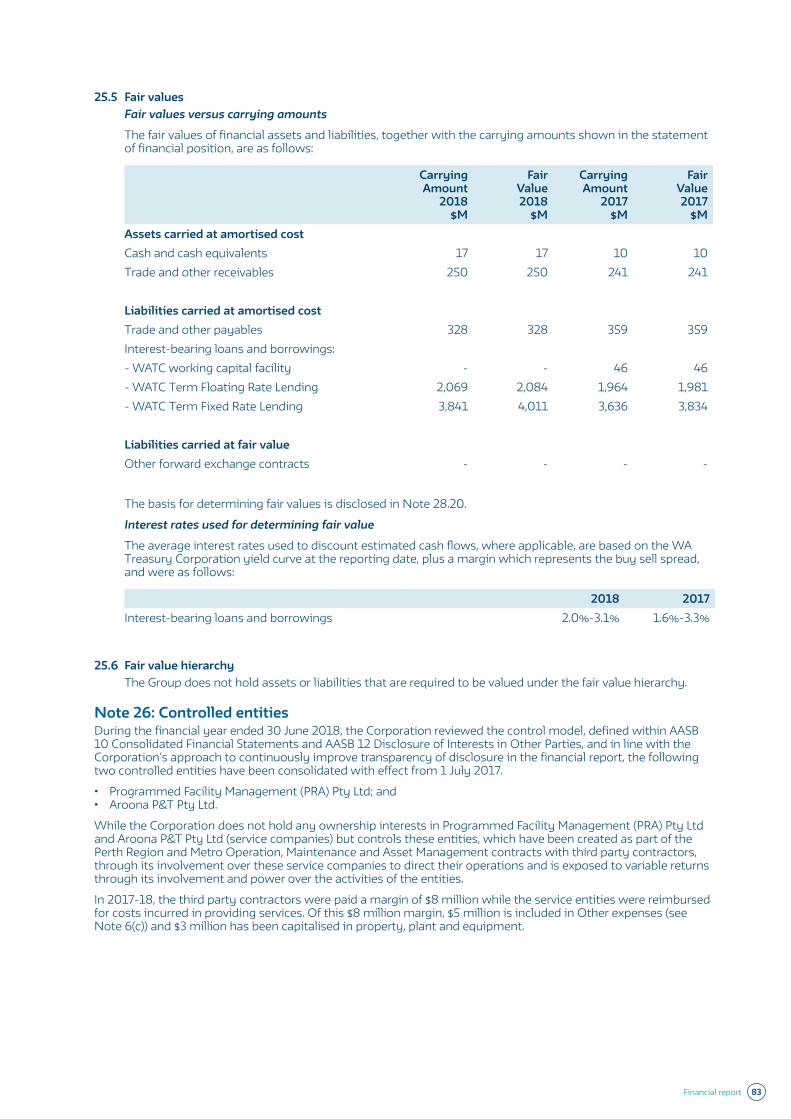
25.5 Fair valuesFair values versus carrying amounts
The fair values of financial assets and liabilities, together with the carrying amounts shown in the statement of financial position, are as follows:
Carrying Amount
2018 $M
Fair Value 2018
$M
Carrying Amount
2017 $M
Fair Value 2017
$MAssets carried at amortised costCash and cash equivalents 17 17 10 10Trade and other receivables 250 250 241 241
Liabilities carried at amortised costTrade and other payables 328 328 359 359Interest-bearing loans and borrowings:- WATC working capital facility - - 46 46- WATC Term Floating Rate Lending 2,069 2,084 1,964 1,981- WATC Term Fixed Rate Lending 3,841 4,011 3,636 3,834
Liabilities carried at fair valueOther forward exchange contracts - - - -
The basis for determining fair values is disclosed in Note 28.20.
Interest rates used for determining fair value
The average interest rates used to discount estimated cash flows, where applicable, are based on the WA Treasury Corporation yield curve at the reporting date, plus a margin which represents the buy sell spread, and were as follows:
2018 2017Interest-bearing loans and borrowings 2.0%-3.1% 1.6%-3.3%
25.6 Fair value hierarchyThe Group does not hold assets or liabilities that are required to be valued under the fair value hierarchy.
Note 26: Controlled entitiesDuring the financial year ended 30 June 2018, the Corporation reviewed the control model, defined within AASB 10 Consolidated Financial Statements and AASB 12 Disclosure of Interests in Other Parties, and in line with the Corporation’s approach to continuously improve transparency of disclosure in the financial report, the following two controlled entities have been consolidated with effect from 1 July 2017.
• Programmed Facility Management (PRA) Pty Ltd; and • Aroona P&T Pty Ltd.
While the Corporation does not hold any ownership interests in Programmed Facility Management (PRA) Pty Ltd and Aroona P&T Pty Ltd (service companies) but controls these entities, which have been created as part of the Perth Region and Metro Operation, Maintenance and Asset Management contracts with third party contractors, through its involvement over these service companies to direct their operations and is exposed to variable returns through its involvement and power over the activities of the entities.
In 2017-18, the third party contractors were paid a margin of $8 million while the service entities were reimbursed for costs incurred in providing services. Of this $8 million margin, $5 million is included in Other expenses (see Note 6(c)) and $3 million has been capitalised in property, plant and equipment.
Financial report 83
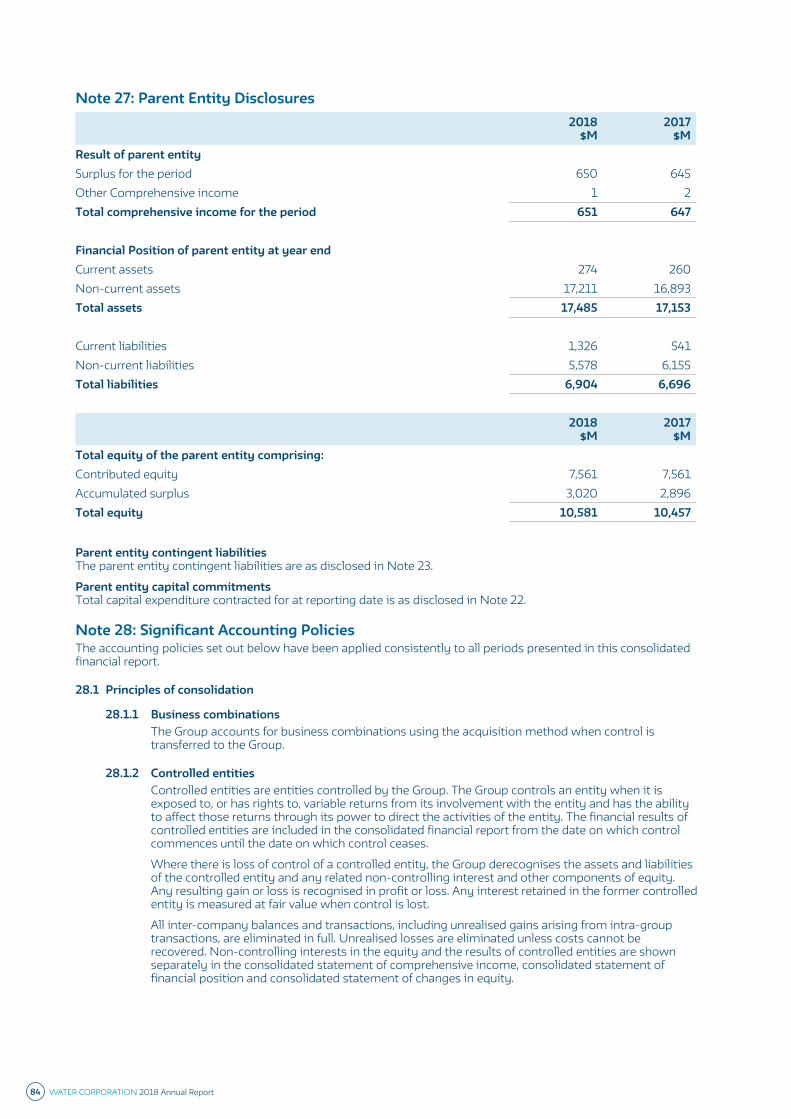
Note 27: Parent Entity Disclosures2018
$M2017
$MResult of parent entitySurplus for the period 650 645Other Comprehensive income 1 2Total comprehensive income for the period 651 647
Financial Position of parent entity at year endCurrent assets 274 260Non-current assets 17,211 16,893Total assets 17,485 17,153
Current liabilities 1,326 541Non-current liabilities 5,578 6,155Total liabilities 6,904 6,696
2018 $M
2017 $M
Total equity of the parent entity comprising:Contributed equity 7,561 7,561Accumulated surplus 3,020 2,896Total equity 10,581 10,457
Parent entity contingent liabilities The parent entity contingent liabilities are as disclosed in Note 23.
Parent entity capital commitments Total capital expenditure contracted for at reporting date is as disclosed in Note 22.
Note 28: Significant Accounting PoliciesThe accounting policies set out below have been applied consistently to all periods presented in this consolidated financial report.
28.1 Principles of consolidation
28.1.1 Business combinationsThe Group accounts for business combinations using the acquisition method when control is transferred to the Group.
28.1.2 Controlled entitiesControlled entities are entities controlled by the Group. The Group controls an entity when it is exposed to, or has rights to, variable returns from its involvement with the entity and has the ability to affect those returns through its power to direct the activities of the entity. The financial results of controlled entities are included in the consolidated financial report from the date on which control commences until the date on which control ceases.
Where there is loss of control of a controlled entity, the Group derecognises the assets and liabilities of the controlled entity and any related non-controlling interest and other components of equity. Any resulting gain or loss is recognised in profit or loss. Any interest retained in the former controlled entity is measured at fair value when control is lost.
All inter-company balances and transactions, including unrealised gains arising from intra-group transactions, are eliminated in full. Unrealised losses are eliminated unless costs cannot be recovered. Non-controlling interests in the equity and the results of controlled entities are shown separately in the consolidated statement of comprehensive income, consolidated statement of financial position and consolidated statement of changes in equity.
84 WATER CORPORATION 2018 Annual Report

28.2 Revenue(a) Revenue from annual service charges and volume charges is recognised in the Consolidated
Statement of Comprehensive Income at the amounts levied and billed for the period, including interest on overdue amounts, less rebates/concessions allowed to entitled customers. Revenue also includes an estimate for the value of water consumed but not billed at reporting date.
(b) Operating Subsidies are recognised as revenue when there is reasonable assurance that they will be received and the Corporation has complied with the conditions attached to them. Operating Subsidies are received from the State Government for:
• costs in respect of country water, sewerage, drainage and irrigation services;
• infill sewerage program; and
• revenue foregone, plus agreed administration costs, from rebates and concessions to Pensioners, Seniors and various exempt bodies on annual service charges, water consumption charges and other fees and charges.
(c) Developers’ contributions are recognised as revenue at fair value when received. The Corporation receives capital contributions from external parties in the form of either assets or cash. These are commonly referred to as Developers’ Contributions and consist of:
• headworks contributions - developers are required to make standard contributions towards the cost of headworks necessary to provide reticulation services within a subdivision;
• handover works - as a condition of subdivision, developers are required to provide water, and in most areas sewerage services, to individual blocks. These services are connected to the existing system and handed over to the Corporation free of charge;
• work performed for developers - as an alternative to developers arranging for the installation of reticulation services, the Corporation may be requested to provide these with the developer paying the cost at an agreed quotation; and
• notional capital surcharge - companies supplied water through special agreements are required to make additional capital payments if they exceed the quota of water they have paid for.
The after-tax equivalent value of handover works is excluded from the base used to calculate dividend payments.
28.3 LeasesLeases under which the Group assumes substantially all the risks and rewards of ownership are classified as finance leases. Other leases are classified as operating leases.
28.3.1 Finance leasesUpon initial recognition, the leased asset is measured at an amount equal to the lower of its fair value and the present value of the minimum lease payments. Minimum lease payments made under finance leases are apportioned between the finance expense and the reduction of the outstanding liability. The finance expense is allocated to each period during the lease term so as to produce a constant periodic rate of interest on the remaining balance of the liability. Contingent lease payments are accounted for by revising the minimum lease payments over the remaining term of the lease when the lease adjustment is confirmed.
28.3.2 Operating leasesPayments made under operating leases are recognised in the Consolidated Statement of Comprehensive Income on a straight-line basis over the term of the lease.
28.4 Net finance costs
28.4.1 Finance incomeFinance income comprises interest income on funds invested. Interest income is recognised as it accrues, using the effective interest method.
28.4.2 Finance costsFinance costs comprise interest expense on borrowings calculated using the effective interest method. The interest expense component of finance lease payments is recognised in the Consolidated Statement of Comprehensive Income using the effective interest method.
Borrowing costs are expensed as incurred except where they relate to the financing of projects under construction, with an estimated cost of more than $5 million, where they are capitalised up to the date of commissioning.
Foreign currency gains and losses are reported on a net basis.
Financial report 85
28.5 Income Tax equivalentThe Corporation is exempt from the Commonwealth of Australia’s Income Tax Assessment Act 1936 but makes income tax equivalent payments to the Western Australian Government. The Corporation entered into the National Taxation Equivalent Regime (NTER) environment on 1 July 2001 having previously operated under the state-based Taxation Equivalent Regime. While tax equivalent payments are remitted to the Department of Treasury, the Corporation’s tax equivalent is subject to Australian Tax Office (ATO) administration. The calculation of the liability in respect of these tax equivalents is governed by the Income Tax Assessment Act and the NTER guidelines as agreed by the NTER Working Party.
Income tax equivalent expense comprises current and deferred tax equivalents. Current tax equivalent and deferred tax equivalent is recognised in the Consolidated Statement of Comprehensive Income.
Current tax equivalent is the expected tax equivalent payable on the taxable income for the year, using tax rates enacted or substantively enacted at reporting date, and any adjustment to tax equivalent payable in respect of previous years.
Deferred tax equivalent is recognised in respect of temporary differences between the carrying amounts of assets and liabilities for financial reporting purposes and the amounts used for taxation purposes.
Deferred tax equivalent is measured at the tax rates that are expected to be applied to the temporary differences when they reverse, based on the laws that have been enacted or substantively enacted by reporting date.
In determining the amount of current and deferred tax equivalent the Group takes into account the impact of uncertain tax positions and whether additional tax equivalents and interest may be due. The Group believes that its accruals for tax equivalent liabilities are adequate for all open tax years based on its assessment of many factors, including interpretations of tax law and prior experience. This assessment relies on estimates and assumptions and may involve a series of judgements about future events. New information may become available that causes the Group to change its judgement regarding the adequacy of existing tax equivalent liabilities; such changes to tax equivalent liabilities will impact tax equivalent expense in the period that such a determination is made.
Deferred tax equivalent assets and liabilities are offset if there is a legally enforceable right to offset current tax equivalent liabilities and assets, and they relate to income tax equivalents levied by the same tax authority on the same taxable entity.
A deferred tax equivalent asset is recognised to the extent that it is probable that future taxable surpluses will be available against which the temporary difference can be utilised. Deferred tax equivalent assets are reviewed at each reporting date and are reduced to the extent that it is no longer probable that the related tax equivalent benefit will be realised.
28.6 Cash and cash equivalentsCash and cash equivalents comprise cash on hand and in banks.
28.7 Trade and other receivablesTrade and other receivables are stated at their amortised cost less provision for impairment losses (see Note 28.11) and are normally settled within 30 days.
28.8 InventoriesInventories consist of consumable engineering supplies and spares required for maintenance and operation of systems and general construction works. Inventories are measured at cost and adjusted when applicable for any loss of service potential.
An allowance is maintained for the diminution in the value of inventories due to obsolescence and items being surplus to requirements.
28.9 Property, plant and equipment
28.9.1 Recognition and measurementProperty, plant and equipment represent the capital works and plant required for the operation of the Group and comprises:
(a) works carried out under the capital investment program, which are initially recorded at cost. Cost includes direct materials and labour together with a proportion of management expenses directly related to bringing the asset to its working condition, and capitalisation of interest directly attributable to major works with an estimated cost greater than $5 million;
(b) works carried out by developers, which are taken over by the Group free of charge are recorded at deemed cost, being the fair value at the date of acquisition; and
(c) other property, plant and equipment, which are initially recorded at cost of acquisition plus incidental costs directly attributable to the acquisition.
Items of property, plant and equipment are stated at cost or deemed cost less accumulated depreciation (see Note 28.9.3) and impairment losses (see Note 28.11).
86 WATER CORPORATION 2018 Annual Report
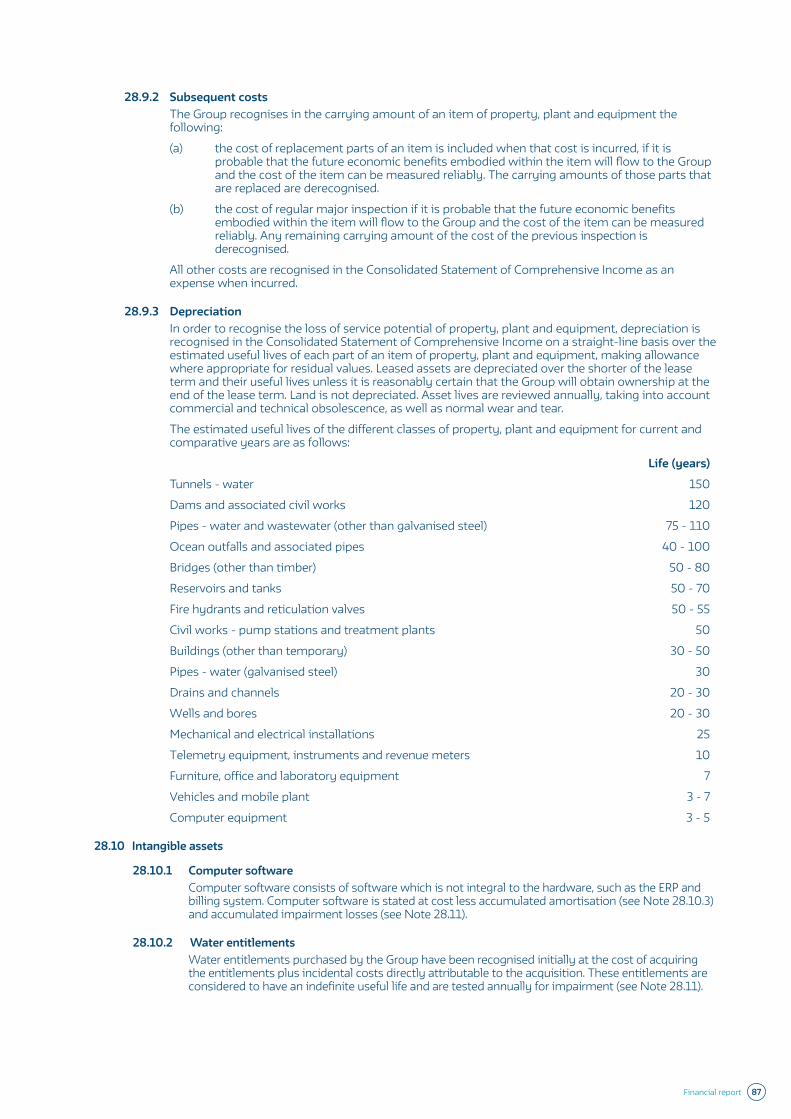
28.9.2 Subsequent costsThe Group recognises in the carrying amount of an item of property, plant and equipment the following:
(a) the cost of replacement parts of an item is included when that cost is incurred, if it is probable that the future economic benefits embodied within the item will flow to the Group and the cost of the item can be measured reliably. The carrying amounts of those parts that are replaced are derecognised.
(b) the cost of regular major inspection if it is probable that the future economic benefits embodied within the item will flow to the Group and the cost of the item can be measured reliably. Any remaining carrying amount of the cost of the previous inspection is derecognised.
All other costs are recognised in the Consolidated Statement of Comprehensive Income as an expense when incurred.
28.9.3 DepreciationIn order to recognise the loss of service potential of property, plant and equipment, depreciation is recognised in the Consolidated Statement of Comprehensive Income on a straight-line basis over the estimated useful lives of each part of an item of property, plant and equipment, making allowance where appropriate for residual values. Leased assets are depreciated over the shorter of the lease term and their useful lives unless it is reasonably certain that the Group will obtain ownership at the end of the lease term. Land is not depreciated. Asset lives are reviewed annually, taking into account commercial and technical obsolescence, as well as normal wear and tear.
The estimated useful lives of the different classes of property, plant and equipment for current and comparative years are as follows:
Life (years)
Tunnels - water 150
Dams and associated civil works 120
Pipes - water and wastewater (other than galvanised steel) 75 - 110
Ocean outfalls and associated pipes 40 - 100
Bridges (other than timber) 50 - 80
Reservoirs and tanks 50 - 70
Fire hydrants and reticulation valves 50 - 55
Civil works - pump stations and treatment plants 50
Buildings (other than temporary) 30 - 50
Pipes - water (galvanised steel) 30
Drains and channels 20 - 30
Wells and bores 20 - 30
Mechanical and electrical installations 25
Telemetry equipment, instruments and revenue meters 10
Furniture, office and laboratory equipment 7
Vehicles and mobile plant 3 - 7
Computer equipment 3 - 5
28.10 Intangible assets
28.10.1 Computer softwareComputer software consists of software which is not integral to the hardware, such as the ERP and billing system. Computer software is stated at cost less accumulated amortisation (see Note 28.10.3) and accumulated impairment losses (see Note 28.11).
28.10.2 Water entitlementsWater entitlements purchased by the Group have been recognised initially at the cost of acquiring the entitlements plus incidental costs directly attributable to the acquisition. These entitlements are considered to have an indefinite useful life and are tested annually for impairment (see Note 28.11).
Financial report 87
28.10.3 AmortisationAmortisation is calculated using the cost of the asset, or its deemed cost, less its residual value.
Amortisation of computer software and intellectual property is recognised in the Statement of Comprehensive Income on a straight-line basis over the estimated useful lives of intangible assets, unless such lives are indefinite. Intangible assets with indefinite useful lives are not amortised and are systematically tested for impairment at each reporting date.
Intangible assets are amortised over the following useful lives:
Life (years)
Computer software 3 - 10
Intellectual property 10
Amortisation methods, useful lives and residual values are reviewed at each financial year-end and adjusted if appropriate.
28.11 Impairment
28.11.1 Financial assetsA financial asset is assessed at each reporting date to determine whether there is any objective evidence that it is impaired. A financial asset is impaired if objective evidence indicates that a loss event has occurred after the initial recognition of the asset, and that the loss event had a negative effect on the estimated future cash flows of that asset that can be estimated reliably.
Objective evidence that financial assets are impaired can include default or delinquency by a debtor, restructuring of an amount due to the Group on terms that the Group would not consider otherwise and indications that a debtor will enter bankruptcy.
The Group considers evidence of impairment for financial assets at both a specific asset and collective level. All individually significant financial assets are assessed for specific impairment. All individually significant financial assets found not to be specifically impaired are then collectively assessed for any impairment that has been incurred but not yet identified. Financial assets that are not individually significant are collectively assessed for impairment by grouping together financial assets with similar risk characteristics.
In assessing collective impairment the Group uses historical trends of the probability of default, timing of recoveries and the amount of loss incurred, adjusted for management’s judgement as to whether current economic and credit conditions are such that the actual losses are likely to be greater or less than suggested by historical trends.
An impairment loss in respect of a financial asset measured at amortised cost is calculated as the difference between its carrying amount, and the present value of the estimated future cash flows discounted at the original effective interest rate.
All impairment losses are recognised in the Consolidated Statement of Comprehensive Income.
28.11.2 Non-financial assetsThe carrying amounts of the Group’s non-financial assets, other than inventories and deferred tax equivalent assets, are reviewed at each reporting date to determine whether there is any indication of impairment. If any such indication exists then the asset’s recoverable amount is estimated. For intangible assets that have indefinite lives or that are not yet available for use, recoverable amount is estimated at each reporting date.
An impairment loss is recognised if the carrying amount of an asset exceeds its recoverable amount. Impairment losses are recognised in the Consolidated Statement of Comprehensive Income.
The recoverable amount of an asset is the greater of its value in use and its fair value less costs to sell. Value in use for not–for-profit entities is determined using the depreciated replacement cost of the asset when the future economic benefits of the asset are not primarily dependent on the asset’s ability to generate net cash inflows and where the Group would, if deprived of the asset, replace its remaining future economic benefits.
28.12 Trade and other payablesTrade and other payables are stated at amortised cost and are normally settled within 30 days.
28.13 Interest-bearing borrowingsInterest-bearing borrowings are recognised initially at fair value less attributable transaction costs. Subsequent to initial recognition, interest-bearing borrowings are recognised at amortised cost with any difference between cost and redemption value being recognised in the Consolidated Statement of Comprehensive Income over the period of the borrowings on an effective interest basis.
88 WATER CORPORATION 2018 Annual Report
28.14 ProvisionsA provision is recognised if, as a result of a past event, the Group has a present legal or constructive obligation that can be measured reliably, and it is probable that an outflow of economic benefits will be required to settle the obligation. Provisions are determined by discounting the expected future cash flows at a pre-tax rate that reflects current market assessments of the time value of money and the risks specific to the liability. The unwinding of the discount is recognised as a finance cost.
28.14.1 InsuranceA provision for uninsured loss events is recognised when a claim is received from an external party after an incident occurs, and it is probable that a payment to the external party will be required to settle the financial obligation associated with the incident. The amount provided for is up to the Group’s insurance deductible level.
28.14.2 Workers’ compensationThe Group self-insures for risks associated with workers’ compensation for claims relating to pre 1 July 1997 events. Outstanding claims are recognised when an incident occurs that may give rise to a claim and are measured at the cost that the Group expects to incur in settling the claims, discounted using a government bond rate with a maturity date approximating the terms of the Group’s obligation.
28.14.3 Site restorationA provision for site restoration costs is recognised when: there is either a legal or constructive obligation to restore a site; the land is contaminated; it is probable a restoration expense will be incurred; and the costs can be estimated reasonably.
28.15 Employee benefits
28.15.1 Long service leave and annual leaveProvisions for Long Service Leave and annual leave are maintained to provide for employee benefits which are assessed on the basis of calculated leave liabilities for employee service to reporting date.
The value of long service leave and annual leave is calculated using expected future increases in wage and salary rates including related on-costs and expected settlement dates, and are discounted using the rates attached to the Commonwealth Government bonds at reporting date which have maturity dates approximating the terms of the Group’s obligations.
28.15.2 Purchased leaveA Provision for Purchased Leave is maintained to provide for purchased leave benefits which are assessed on the basis of calculated leave entitlements at reporting date.
This scheme allows employees to purchase up to 12 additional weeks leave per annum by agreeing to a reduced salary rate over 52 weeks of the year. The minimum amount of leave available to be purchased is 1 week.
This scheme also allows employees to take reduced salary of eighty percent for four years and have paid leave for the whole of the fifth year at eighty percent of their salary.
Values are calculated at undiscounted amounts based on wage and salary rates that the Group expects to pay as at reporting date including related on-costs.
28.15.3 Termination benefitsTermination benefits are recognised as an expense when the Group is demonstrably committed, without realistic possibility of withdrawal, to a formal detailed plan to terminate employment before the normal retirement date. Termination benefits for voluntary redundancies are recognised if the Group has made an offer encouraging voluntary redundancy, it is probable that the offer will be accepted, and the number of acceptances can be estimated reliably.
28.15.4 Non-monetary benefitsNon-accumulating non-monetary benefits, such as medical care, housing, cars and free or subsidised goods and services, are expensed based on the net marginal cost to the Group as the benefits are taken by the employees.
28.16 Foreign currency transactionsTransactions in foreign currencies are translated to Australian Dollars at exchange rates at the dates of the transactions. Monetary assets and liabilities denominated in foreign currencies are translated to the functional currency at the exchange rate at the reporting date. Non-monetary assets and liabilities that are measured at fair value in a foreign currency are translated to the functional currency at the exchange rate when the fair value was determined. Foreign currency differences are generally recognised in the Statement of Comprehensive Income. Non-monetary items that are measured based on historical cost in a foreign currency are not translated.
Financial report 89
28.17 Derivative financial instrumentsThe Group uses derivative financial instruments to hedge its exposure to foreign exchange risks arising from operational activities. In accordance with the Treasury Risk Management policy, the Group does not hold or issue derivative financial instruments for trading purposes. However, derivatives that do not qualify for hedge accounting are accounted for as trading instruments through surplus or deficit.
On initial designation of the hedge, the Group formally documents the relationship between the hedging instrument and hedged item, including the risk management objectives and strategy in undertaking the hedge transaction, together with the methods that will be used to assess the effectiveness of the hedging relationship. The Group makes an assessment, both at the inception of the hedge relationship as well as on an ongoing basis, whether the hedging instruments are expected to be “highly effective” in offsetting the changes in the fair value or cash flows of the respective hedged items during the period for which the hedge is designated, and whether the actual results of each hedge are within a range of 80-125 per cent. For a cash flow hedge of a forecast transaction, the transaction should be highly probable to occur and should present an exposure to variations in cash flows that could ultimately affect the reported surplus or deficit.
Derivatives are recognised initially at fair value and attributable transaction costs are recognised in the Consolidated Statement of Comprehensive Income when incurred. Subsequent to initial recognition, derivatives are measured at fair value, and changes therein are accounted for as described below.
28.17.1 Cash flow hedges Changes in the fair value of the derivative hedging instrument designated as a cash flow hedge are recognised directly in equity to the extent that the hedge is effective. To the extent that the hedge is ineffective, changes in fair value are recognised in the Consolidated Statement of Comprehensive Income.
If the hedging instrument no longer meets the criteria for hedge accounting, expires or is sold, terminated or exercised, then hedge accounting is discontinued prospectively. The cumulative gain or loss previously recognised in equity remains there until the forecast transaction occurs. When the hedged item is a non-financial asset, the amount recognised in equity is transferred to the carrying amount of the asset when it is recognised. In other cases the amount recognised in equity is transferred to the Consolidated Statement of Comprehensive Income in the same period that the hedged item affects the Consolidated Statement of Comprehensive Income.
28.18 Goods and services taxRevenue, expenses and assets are recognised net of the amount of goods and services tax (GST), except where the amount of GST incurred is not recoverable from the taxation authority. In these circumstances, the GST is recognised as part of the cost of acquisition of the asset or as part of the expense.
Receivables and payables are stated with the amount of GST included. The net amount of GST recoverable from, or payable to, the ATO is included as a current asset or current liability in the statement of financial position.
Cash flows are included in the statement of cash flows on a gross basis. The GST components of cash flows arising from investing and financing activities which are recoverable from, or payable to, the ATO are classified as operating cash flows.
28.19 New standards and interpretations not yet adoptedA number of new standards, amendments to standards and interpretations are effective for future reporting periods, and have not been applied in preparing this consolidated financial report. Those which may be relevant to the Group are set out below. The Group does not plan to adopt these standards early.
28.19.1 AASB 9 Financial InstrumentsAASB 9 includes revised guidance on the classification and measurement of financial instruments, including a new expected credit loss model for calculating impairment on financial assets, and the new general hedge accounting requirements. It also carries forward the guidance on recognition and de-recognition of financial instruments from AASB 139. Based on the work performed thus far, this new standard is not expected to have a material impact to the Group’s consolidated financial report.
AASB 9 is effective for annual reporting periods beginning on or after 1 January 2018, with early adoption permitted.
28.19.2 AASB 15 Revenue from Contracts with CustomersAASB 15 outlines a single comprehensive model to use in accounting for revenue arising from contracts with customers. Under AASB 15, revenue is recognised at an amount that reflects the consideration to which an entity expects to be entitled in exchange for transferring goods or services to a customer. The principles in AASB 15 provide a more structured approach to measuring and recognising revenue and replaces existing revenue recognition guidance, including AASB 118 Revenue, AASB 111 Construction Contracts and IFRIC 13 Customer Loyalty Programs. Based on the work performed thus far, this new standard is not expected to have a material impact to the Group’s consolidated financial report.
AASB 15 is effective for annual reporting periods beginning on or after 1 January 2019, for not-for profit entities, with early adoption permitted.
90 WATER CORPORATION 2018 Annual Report
28.19.3 AASB 16 Leases
AASB 16 removes the lease classification test for lessees and requires all leases (including operating leases) to be brought onto the balance sheet for lessees. The definition of a lease is also amended and is now the new on/off balance sheet test for lessees. It is mandatory for the Group’s 30 June 2020 financial statements. The Group is yet to fully determine the effect of the standard on the Group.
28.19.4 AASB 1058 Income of Not-for-Profit Entities
AASB 1058 replaces the majority of income recognition requirements relating to public sector not-for-profit entities previously reflected in AASB 1004 Contributions.
AASB 1058 is effective for annual reporting periods beginning on or after 1 January 2019, with early adoption permitted.
This new standard is not expected to have a material impact to the Group’s consolidated financial statements.
28.19.5 AASB 1059 Service Concession Arrangements: Grantors
AASB 1059 addresses the accounting for a service concession arrangement by a grantor that is a public sector entity by prescribing the accounting from a grantor’s perspective. The entity is to be involved in the provision of providing public services on behalf of a government entity, and managing some of those services under its own discretion. It also requires that the government entity controls the asset used to deliver those services.
AASB 1059 is effective for annual reporting periods beginning on or after 1 January 2019, with early adoption permitted.
Based on the work performed thus far, this new standard is not expected to have a material impact to the Group’s consolidated financial standards, but will require additional disclosure.
28.20 Determination of fair valuesA number of the Group’s accounting policies and disclosures require the measurement of fair value, for both financial and non-financial assets and liabilities. Fair values have been determined for measurement and/or disclosure purposes based on the following methods. Where applicable, further information about the assumptions made in determining fair values is disclosed in the notes specific to that asset or liability.
28.20.1 DerivativesThe fair value of forward exchange contracts is based on their listed market price, if available. If a listed market price is not available, then fair value is estimated by discounting the difference between the contractual forward price and the current forward price for the residual maturity of the contract using a risk-free interest rate (based on government bonds).
28.20.2 Interest-bearing loans and borrowingsFair value is calculated based on discounted expected future principal and interest cash flows.
28.20.3 Finance lease liabilitiesThe fair value is estimated as the present value of future cash flows, discounted at market interest rates for homogeneous lease agreements. The estimated fair values reflect changes in interest rates.
28.20.4 Trade and other receivables/payablesFor receivables/payables with a remaining life of less than one year, the notional amount is deemed to reflect the fair value. The fair value of all other receivables/payables is estimated as the present value of future cash flows, discounted at the market rate of interest at reporting date.
28.21 ComparativesWhere appropriate, comparative amounts have been re-presented and re-classified to ensure comparability with the current reporting year.
Financial report 91
Directors’ declaration
In the opinion of the Directors of the Water Corporation (the “Corporation”):
(a) the consolidated financial statements and notes are in accordance with the Water Corporations Act 1995, including:
(i) giving a true and fair view of the Group’s financial position as at 30 June 2018 and of its performance, for the financial year ended on that date; and
(ii) complying with Australian Accounting Standards (including the Australian Accounting Interpretations) and the Corporations Regulations 2001.
(b) there are reasonable grounds to believe that the Group will be able to pay its debts as and when they become due and payable.
Signed in accordance with a resolution of the Directors:
Michael Hollett Chairman
Sue Murphy Chief Executive Officer
Perth, 22 August 2018
92 WATER CORPORATION 2018 Annual Report
Auditor General’s report
Financial report 93

94 WATER CORPORATION 2018 Annual Report
Financial report 95