annual rept - final print
TRANSCRIPT
Uganda Coffee Development Authority
ANNUAL REPORT OCTOBER 01, 2005 - SEPTEMBER 30, 2006
VOLUME 15 UCDA P.O. BOX 7267; KAMPALA Tel: 256 041 256940/256198/233073/257139 Fax. 256 041 256994 E-mail: [email protected] Website: www//ugandacoffee.org
UCDA ANNUAL REPORT: 2005/06- Page 2
Page for Minister’s Photograph –Hon. Hillary O. Onek Page 2 – Hon. Dr. Israel Kibirige Sebunya Page 3 – Board of Directors as in the report.- 2004/05
UCDA ANNUAL REPORT: 2005/06- Page 3
TABLE OF CONTENTS
UCDA ANNUAL REPORT: 2005/06- Page 4
FOREWORD
This is the 15th Annual Coffee Report that I urge you to read in order to be abreast with developments in the coffee sub-sector. The coffee year ended September 30, 2006 witnessed a 20% slide in the volume of coffee exports but a 5% increase in value. The fall in volume which is characteristic of perennial crops due to the cyclic nature, coincided with the dry spell that led to flower abortion.
The Board put emphasis on containment of the Coffee Wilt Disease, replacement of the old coffee trees, value addition and promotion; and domestic coffee consumption. Although the wilt is tampering off, research at the Coffee Research Institute in Kituza, Mukono district has come up with 480 coffee lines that are resistant to the disease. Field evaluation and cup characterisation are ongoing before release to farmers. Meanwhile, farmers are advised to continue with phytosanitary practices – uproot and burn insitu any wilt-infested coffee trees.
Given that coffee planted in new areas is at the fruitation stage and below commercial quantities, the Board signed a memorandum of understanding with AGROPEL to develop the market. Farmers’ response is very encouraging and within the next 2 years coffee production in these areas will be in the region of 1.2 million bags (72,000 tonnes) per year.
The replanting programme continued but at a slow pace to allow time to assess the performance of coffee planted earlier on; and also to clear the outstanding arrears to nursery operators. To ensure a steady supply of clean planting materials, the Board evolved a community-based nursery programme where production of seedlings is demand driven. Measures to preserve the germplasm of the Clonal coffee mother gardens were also instituted.
To reduce the market information asymmetry hitherto a challenge to farmers, use of the SMS facility of mobile phones was taken advantage of. Farmers and other stakeholders can now access information on coffee prices every day. This has enhanced household income especially for farmer groups that market coffee through the warehouse receipt system.
On behalf of the Board, I wish to express my gratitude to the Minister of Agriculture, Animal Industry and Fishers, Hon. Hillary O. Onek, and the staff of his Ministry for the support and guidance on policy issues. In the same breath, thank the private sector which, through their respective associations, has considerably contributed to the development of the industry. It is my sincere hope and wish that this public-private-partnership is upheld in the coming years for the benefit of the ordinary household.
To my fellow members of the Board, UCDA management and staff, I congratulate you for having successfully ended the coffee year 2005/06. It is my prayer that you meet the challenges ahead of us in 2006/07. For God and my Country. Paul Sempa-Mugambwa CHAIRMAN - BOD
UCDA ANNUAL REPORT: 2005/06- Page 5
ACRONYMS APEP - Agricultural Productivity Enhancement Project ASAC - Agricultural Structural Adjustment Credit BCU - Bugisu Co-operative Union BOD - Board of Directors CABI - Centre for Agriculture & Bioscience International CBD - Coffee Berry Disease CBS - Central Broadcasting Service CFC - Common Fund for Commodities CORI - Coffee Research Institute CWD - Coffee Wilt Disease DCC - District Coffee Co-ordinator DFI - District Farm Institute EAFCA - East African Fine Coffees EPOPA - Export Promotion of Organic Products from Africa EU - European Union FAQ - Fairly Average Quality GAPs - Good Agricultural; Practices GHPs - Good Hygienic Practices GMPs - Good Manufacturing Practices HACCPs - Hazard Analysis and Critical Control Points IC - Implementation Committee ICA - International Coffee Agreement ICC - International Coffee Council ICO - International Coffee Organization IMI - International Mycological Institute MAAIF - Ministry of Agriculture, Animal Industry & Fisheries NARO - National Agriculture Research Organization NSSF - National Social Security Fund NTAE - Non-Traditional Agricultural Exports PAF - Poverty Alleviation Fund PEAP - Poverty Eradication Action Plan RBS - Retirement Benefit Scheme SIDA - Swedish International Development Agency UCDA - Uganda Coffee Development Authority UCFA - Uganda Coffee Farmers Association UCTF - Uganda Coffee Trade Federation UMA - Uganda Manufacturers Association UNEX - Union Export Services USAID - United States Agency for International Development WRS - Warehouse Receipt System WTO - World Trade Organization
UCDA ANNUAL REPORT: 2005/06- Page 6
EXECUTIVE SUMMARY
MARKETING
1) Coffee exports dropped by 20% during the year from 2.50 million 60-kilo bags in the previous year to 2.00 million bags. Robusta fell from 1.987 m bags to 1.408 m bags while Arabica totalled 0.594 m bags up from 0.518 m. The drop in robusta quantity was attributed to coffee wilt disease, dry spell and a long period of low prices.
2) Albeit the fall in volume the there was a 5% improvement in value, which rose from US $ 162.1 million in 2004/05 to $ 172.3 m. This was due to tight supply in the global market.
3) Unit export price stood at $1.42 per kilo up from $ 1.08 realised a year ago: robusta and Arabica fetched $ 1.23 and $ 1.87 per kilo up from $ 0.89 and $ 1.81 recorded in 2004/05.
4) Farm-gate prices also moved in tandem from and average of Shs. 612, Shs. 1,371 and Shs. 2,095 to Shs 865, Shs. 1,863 and Shs. 2,175 per kilo of Kiboko, FAQ and Arabica parchment respectively.
5) A total of 264 subsector players at post harvest: exporters – 27, export processors – 19, hulleries -212 and roasters – 6, were registered as opposed to 255 in 2004/05. among the exporters, the new firms were Kaginda Coffee Factory, Kaweri Coffee Plantation, Rwenzori Coffee Ltd., and Uganda Medium Industries.
6) The top 5 exporters – Kyagalanyi coffee Ltd., Kawacom (U) Ltd., Pan Afric Impex, Ugacof Ltd., and Great Lakes – handled 70% of the total export volume, indicating further concentration compared to 60% market share in 2004/05.
7) On the other hand, the market share of the top 5 overseas buyers of Uganda coffee fell from 58% a year ago to 43%. These include Ecom Agro industrialist- 13.7% (15.0%), Olam International – 8.8% (15.0%), Sucafina – 7.9% (12.6%), Socadec - 6.8% (7.9%) and Drucafe – 6.5% (4.6%). The figures in parenthesis represent their respective performance in 2004/05.
8) Coffee exports to EU countries, the main destination of Uganda coffee, stood at 1.45 m bags (72.4%) down from 1.83 million bags (72.6%) of total exports in the respective years. The Sudan’s market continued to grow from 15% in the previous year to 21.6%.
9) Some Arabica coffee growers in new areas of Kisoro district entered a supply contract with Urth Caffé, an organic coffee outlet in California, USA to supply them with organic coffee. One tonne was supplied at $ 3.5 per kilo.
10) Use of mobile phones to access market information was introduced to farmers, an initiative fully embraced by the trade.
UCDA ANNUAL REPORT: 2005/06- Page 7
11) Domestic coffee consumption continued to grow with new coffee shops mushrooming in the city and other towns. The youth, as they access the internet, do consume coffee. These cafés also provide R & G coffee to customers to take home. A good cup of coffee – espresso, cappuccino and signature coffee – goes for between Shs 2,500 and Shs. 5,000 depending on the location of the café.
12) The outlook for 2006/07 is promising given the favourable weather forecasts and prospects of good prices. Exportable production was projected to reach 2.6 million bags, 30% higher than what was realised in 2005/06.
QUALITY AND REGULATORY
13) The trading and processing of semi dried kiboko/parchment and the adulteration of pocessed coffee (FAQ) with BHP’s and other extraneous matter were the major causes of quality deterioration of coffee. Sensitization workshops to create quality awareness among the traders were jointly organised by local authorities and UCDA. The local leaders took on enforcement of the Coffee Regulations.
14) The processors found handling wet coffee (M.C > 14%) were penalised in accordance with the Coffee Regulations 1994.
15) Exporters instituted stringent internal quality control mechanisms that included high penalties for wet deliveries coffee.
16) Processing charges went up during the year from Shs. 35 per kilo of FAQ in 2004/05 to Shs. 70 in response to an increase in electricity tariffs and loadsheding.
17) There was a 2% drop in the outturn in the Robusta areas mainly due to the prolonged dry spell experienced in robusta growing areas. The percentage of screen 18 continued to be above 10% over the years, which is attributed to the maturity of clonal coffee and improved crop husbandry. On the contrary there was an improvement in Arabica out-turn, especially in Nebbi district where the harvest was plentiful.
18) Generally, the cup taste was clean and better than last year, which is attributed to improved handling practices at all stages in the value chain.
19) Under capacity building, 5 Quality controllers received training in OTA analysis by a team of laboratory experts from Brazil for two weeks. An assessment of UCDA laboratory for testing OTA in coffee was also done; the laboratory and personnel were found to be compliant.
20) Training in basic quality control techniques passed out 40 students – 22 direct from industry and 18 from tertiary institutions of learning. This being the total number of quality controllers since the programme was initiated in 1993 to 397.
UCDA ANNUAL REPORT: 2005/06- Page 8
21) Installation of the 16 wet processing mills continued during the year but only 9 were completed of which 5 are operational. The ongoing replanting exercise focusses on concentrating coffee around these mills to provide red cherries.
DEVELOPMENT
22) The departmental activities focused on farmer extension delivery services; strengthening coffee uptake in new areas; productivity enhancement technologies and developing market infrastructure in new areas in northern Uganda.
23) Under market development in northern Uganda, UCDA signed a memorandum of understanding with AGROPEL Investment Ltd to develop the internal coffee market. A total of 13,900 kilos of Kiboko were purchased at an average price of Shs. 1,070/kg. This has motivated farmers to invest more in coffee growing.
24) Much of the coffee replanting activities centred on payment of arrears to nursery operators. However, 1.83 million plantlets were planted by 13,150 families.
25) To address low productivity and production, fertigation technology was introduced in the districts of Mukono, Luweero, Mpigi, Masindi and Mbarara. These demo sites serve to train farmers on benefits of water and use of organic manure in soil improvement.
26) An assessment of the existing Clonal mother gardens countrywide was done with a view of reviving their productivity to preserve the germplasm. A mechanism for Community Based Nurseries at subcounty level was evolved whereby UCDA provides certified seed, poly pots, rooting hormone and technical extension services to farmer groups to raise seedling for their members on a demand-driven basis.
27) To ensure a steady supply of Arabica seed, a memorandum of understanding (MoU) was signed with Buginyanya Agricultural Research Development Centre. Stumping and maintenance of seed gardens was undertaken and 2,000 kg of seed expected every year.
28) A countrywide coffee production campaign strategy was developed after a series of consultations with the stakeholders. The campaign is envisaged to restore production to the 4.5 m bag mark by 2015. Implementation to be piloted in 10 districts in 2006/07. The strategy addresses the underlying constraints: research, extension, input-credit and farmer organization.
29) Surveillance and field diagnostic studies of coffee wilt disease revealed that since 1993, 52% of the old Robusta coffee trees have been destroyed. But its incidence is on the decline and some of affected trees sprouted.
RESEARCH
30) Research undertaken at the Coffee Research Institute (CORI) concentrated on coffee wilt disease for increased productivity of the smallholder farmers by controlling its spread and impact. To achieve this, research centred on: -
(a) Development and release of CWD resistant Robusta lines
– 2,124 wilt resistant Robusta lines have been identified to-date, 3,612 mother bushes of these lines planted out in 5 mother gardens at Kituza.
UCDA ANNUAL REPORT: 2005/06- Page 9
Assessment of growth characteristics and susceptibility to pests and other disease is in progress;
(b) Development and release of the TUZA Arabica and Arabusta coffee lines:
– Field evaluation of TUZA Arabica continued at Mukono, Mbarara, Bulegini ARDCs and Kachwaekano. 10 Arabusta coffee lines found to be resistant to Coffee Wilt Disease are undergoing field evaluation on-station at Kituza and at several locations in Kyenjojo, Bushenyi, Kanungu, Mubende, Luweero and Sironko districts.
(c) Development of Arabica coffee lines that are resistant of coffee berry disease and leaf rust through hybridization of the commercial lines SL 14 and KP423 with catimors continued. 146 Arabica hybrids have been developed to-date and are at evaluation stage at Kituza, Bugusege and Bulengegeni.
(d) Prevention of CWD spread
– Research work undertaken during the year confirmed that stems, branches, roots and coffee husks from infested coffee trees are the primary sources of CWD. It was confirmed that plant parts provide medium for survival of F. xylarioides but the pathogen’s survival outside the host is minimal
– Under field conditions pathogens don’t survive beyond a year. Therefore, replanting in previously infected plots can be done after a year provided the stumps were removed.
(e) Development and dissemination of appropriate technologies:
– CORI established 12 farmer field schools in 6 districts (Bugiri, Mukono, Kayunga, Masaka, Rakai and Bushenyi) to promote participatory technology generation and dissemination in the coffee communities. Training manuals, brochures, posters, leaflets on aspects of production were developed to facilitate information dissemination.
ADMINISTRATION AND MANAGEMENT
31) Staff matters:-
– The Board renewed the contract of the Mr. I. David KIWANUKA for another 3 years as the Manager in charge of Quality, Regulatory and Information Services. Also renewed were the contracts of the 27 District Coffee Coordinators.
– The three officers formally on the global OTA project were absorbed in the mainstream as quality controllers; and 7 DCCs were appointed for the districts of Bugiri, Gulu, Kyenjojo, Mbarara, Rakai, Ntungamo and Rukungiri.
– Two Quality Controllers were trained by CIRAD as Trainers of Trainers in liquoring and quality control in France for one month under the IACO/ADB Capacity Building Project.
UCDA ANNUAL REPORT: 2005/06- Page 10
– Another Quality Controller trained in improvement of organoleptic quality of African Robusta in France.
– Two officers undertook study tour in Peru where they interacted with farmers organised under the Central Piurana de Cafeterelos on the certification process of specialty coffees.
– On coffee consumption, one Board member and UCDA staff visited Pinhal and Sao Paolo in Brazil to familise themselves with the strategy for stepping domestic coffee consumption.
32) Value addition and promotional efforts continued the year. Uganda consolidated its position in the Chinese joint venture by taking 99% of the shares and opening up an office in Shangai. The coffee roastery in Beiging became ISO 9001 certified in quality.
33) Actively participated in the international coffee meetings by ICO, IACO, SCAA, SCAE and EAFCA.
34) UCDA in conjunction with APEP held a series of stakeholder consultative meetings in which APEP’s activities were review and a way forward for the coffee industry chartered. To revamp productivity and production, a coffee production campaign was proposed for 2006/07.
UCDA ANNUAL REPORT: 2005/06- Page 11
Chapter One
COFFEE SUBSECTOR POLICIES
1.1 INTRODUCTION
The coffee sub sector continues to play a dominant role in the economy in terms of foreign exchange earnings and as a provider of household income on a sustainable basis. Given its importance, the Board put in place policies and consolidated the old ones to enhance the performance of the industry. Emphasis was placed on: Coffee Replanting, Quality Improvement, Information Dissemination, Value Addition, and Promotion of Domestic Coffee Consumption. UCDA also continued to foster collaborative linkages with the private and public sector stakeholders.
1.2 Coffee Replanting
The policy is to gradually replace the old coffee trees and those destroyed by Coffee Wilt Disease (CWD) at a rate of 5% annually in Robusta and 2% Arabica in 20 years, with the genetically pure and high-yielding varieties.
The improvement in coffee prices gave support to the replanting programme in the face of a slack in SIP funds. Farmers and NGOs have continued to implement the programme utilizing their own funds. To make seedlings available and affordable to farmers, the concept of community based nurseries and rehabilitation of Clonal mother gardens was adopted.
With the Community based nurseries, certified elite seed, polypots and technical support are provided to groups of farmers initially. While in the case of mother gardens that had been neglected due to low coffee prices, rehabilitation is being encouraged to preserve germplasm. UCDA is to avail rooting hormones and polypots as well. This approach is envisaged to ease propagation and distribution of coffee seedlings to farmers and thus increase farm productivity.
At a rate of 2% per annum, the proportion of Arabica coffee is envisaged to increase from the current 15% to 25% of the total coffee production. Biological research at the Coffee Research Institute (CORI), Kituza is geared towards developing new Arabica varieties (TUZZA) suitable for the predominately robusta growing areas.
The coffee replanting programme also encompasses planting coffee in new areas such as the Mid-North and Eastern Uganda as a fall-back against CWD which is endemic in the soils in traditional robusta areas.
1.3 Quality Improvement
While quality is a shared responsibility by all players within the supply chain, UCDA Board put in place specific guidelines to be observed at each stratum. At the farm level, good agricultural practices to ensure sustainability and traceability are underscored. A number of farmers are encouraged to engage in production of coffee for the specialty markets – Organic, Fair-Trade, Utz Kapeh, etc., based on the experiences drawn from Burundi, Tanzania and Peru. Harmonization of the certification processes is being sought at NOGAMU to reduce the costs involved.
UCDA ANNUAL REPORT: 2005/06- Page 12
The policy of increasing the proportion of robusta through wet coffee processing continued to be pursued. Support towards the completion of the installation process of the wet coffee machines was undertaken. It is envisaged that if all the machines become operational, washed coffee will go up by 4000 metric tonnes.
1.4 Marketing and Information Dissemination
A market development policy, especially in the new coffee growing districts of Apac, Lira, Kitgum, Gulu, Pader, Busia, Tororo, Pallisa, Kabale and Kisoro where quantities are still too small to attract serious buyers, was formulated. The objective is to guarantee the farmers in these areas of a reliable market and thus continue with coffee production. In this arrangement seed capital amounting to Sh. 15 million was given out to a prominent buyer to mobilize coffee from the farmers.
Taking advantage of the growing popularity of mobile phones in the countryside, UCDA signed a memorandum of understanding with Trueafrican to provide market information to stakeholders through the SMS facility. In the internal market, farmers and traders alike do access price indicators on a daily basis. This has greatly reduced market information asymmetry, which hitherto compromised the bargaining power of farmers.
The Warehouse Receipt Project was extended for one year up to September 2007 to address the critical areas identified in the evaluation report. The main objective of the extension is to establish and operationalize the regulatory bodies given that the Warehouse Receipt Act is already in place. The Warehouse System is envisaged to improve quality, promote bulk marketing and access to trade finance.
1.5 Value Addition
The policy of adding value to Uganda coffee was pursued during the year by inviting foreign investors to establish a soluble coffee plant in the country. A memorandum of understanding was signed between Uganda Government and LAFICO of Libya. The TATA Group of India also held discussions with Uganda Government expressing their interest to establish a similar plant in the country.
A policy to undertake generic promotion of the private sector to produce coffee for the domestic coffee consumption was undertaken. This policy was geared towards increasing the level of consumption by 2% per annum which was also important for the Commonwealth Heads of States Meeting (CHOGM) to be held in 2007.
1.6 Research
A specific policy to support research was undertaken through inclusion of funds in the UCDA 2005-06 budget and work plans. Additional support was also expected to be extended through the Government budget towards the coffee sub sector. This was to enable the development and release of new robusta tolerant or/and resistant to CWD and Arabica varieties which are more high yielding. On farm trials for the new Arabica coffee variety (Tuzza Arabica) continued to be promoted in the gazetted mid-altitude areas of South Western districts of Bushenyi, Mbarara, Ntungamo, Rukungiri and Kanungu.

UCDA ANNUAL REPORT: 2005/06- Page 13
Chapter Two
COFFEE MARKETING
2.0 GENERAL PERFORMANCE
The coffee year (Oct/Sept) 2005/06 under review witnessed a rise in global coffee prices, which resulted in a 5.0% increase in foreign exchange earnings from US $ 162.0 million to $ 170.4 m.
In contrast, the corresponding volume of export fell by almost 20% from 2.50 million 60-kilo bags in 2004/05 to 2.0 m bags. Robusta quantities fell from 2.0 m bags to 1.4 m bags while that of Arabica went up by 15% from 0.52 m to 0.59 m bags. This drop in volume during the year was attributed mostly to the prolonged drought that led to flower abortion and poor bean formation thus affecting yield.
The average export price in 2005/06 stood at US 142 cents/kilo, which was 31.3% up compared with the 108 cents realized last year. There was an increase of 3.0% in the Arabica unit price from 181 cents last year to US cents 187/kilo. Similarly, Robusta unit price rose sharply from 89 cents to 123 cents (98%) attributed to a global Robusta supply squeeze.
2.1 COFFEE PROCUREMENT
Marketed production in terms of FAQ and Arabica parchment totalled 2.2 million bags, a drop 19.3% compared to what was recorded last year. The drop in quantity, which is also reflected in export performance, is attributed to: -
- The prolonged dry spell that led to flower abortion and poor bean formation. According to the Uganda National Household Survey (UNHS) for 2005/06, 48% of the households indicated that drought adversely hit the agricultural sector.
- The effect of a long period of low prices to farmers that compromised husbandry practices, and in some cases farmers literally abondoned coffee shambas. Farmers acknowledge that since 1998/99 farm-gate prices were below the cost of production;
- The declining soil fertility against a backdrop of old coffee trees; and
- The Coffee Wilt Disease, which was estimated in 2005 to have cumulatively destroyed 52% of the old robusta trees since 1993.
Table 2.1 Coffee Procurement by type: 2001/02 - 2005/06 - 60-kilo bags.
Coffee Year Coffee Type TOTAL %-Age Change
Robusta Arabica Over Previous yr
Average 2,211,217 514,193 2,725,410
2005/06 1,550,497 624,724 2,175,221 (19.26)
2004/05 2,149,403 544,575 2,693,978 (2.53)
2003/04 2,221,850 542,104 2,763,954 1.26
2002/03 2,284,649 444,794 2,729,443 (16.39)
2001/02 2,849,686 414,767 3,264,453 0.96

UCDA ANNUAL REPORT: 2005/06- Page 14
There was, however, a 15% improvement in the volume of arabica that came on market this year compared to the previous year. The improvement was due to the relatively good weather in Arabica growing areas, new arabica coffee trees coming into production and the relatively better arabica prices over the years. The five-year procurement average stood at 2.73 million bags (163,525 tonnes) comprising 2.21 million bags (132,600 tonnes) of Robusta and 0.51 million bags (30,925 tonnes) of Arabica as indicated in table 2.1.
Table 2.2 represents comparative procurement figures on a monthly basis for the years 2005/06 and 2004/05. Coffee deliveries were highest in November ( 265,327 bags), the main harvesting period in Central and Eastern regions. This coincided with the good prices on the global market, which prompted farmers to offload the stocks in their possession.
Table 2.2 Comparative Coffee Procurement by Type- 60-kilo Bags.
MONTH 2005/06 2004/05
Robusta Arabica Total Robusta Arabica Total TOTAL 1,550,497 624,724 2,175,221 2,149,403 544,575 2,693,978 OCT. 80,151 50,125 130,276 189,216 35,604 224,820 NOV. 200,178 65,149 265,327 150,112 50,119 200,231 DEC. 136,100 75,124 211,224 185,024 55,728 240,752 QTR - 1 416,429 190,398 606,827 524,352 141,451 665,803 JAN. 160,127 75,455 235,582 175,333 46,523 221,856 FEB. 95,078 81,003 176,081 165,201 48,625 213,826 MAR 100,197 72,528 172,725 152,143 55,900 208,043 QTR - 2 355,402 228,986 584,388 492,677 151,048 643,725 APR. 84,540 76,574 161,114 172,854 55,215 228,069 MAY 105,196 49,310 154,506 159,071 56,777 215,848 JUN. 162,282 20,075 182,357 201,535 48,123 249,658 QTR - 3 352,018 145,959 497,977 533,460 160,115 693,575 JUL 180,032 20,235 200,267 267,148 30,148 297,296 AUG. 155,345 20,001 175,346 186,530 37,546 224,076 SEPT 91,271 19,145 110,416 145,236 24,267 169,503 QTR - 4 426,648 59,381 486,029 598,914 91,961 690,875
2.20 COFFEE EXPORT PERFORMANCE
A total of 2,002,324 60-kilo bags of coffee were exported to all destinations during the year, representing a 20% drop from 2,504,890 bags recorded in 2004/05. Exports comprised: Arabica - 594,010 bags, an increase of 15.0% compared to 516,530 bags realised in 2004/05; and Robusta – 1,408,104 bags, a drop of 29% from 1,988,360 bags over last year. Figure 1 below represents the export performance of Robusta and Arabica coffee quantities in the last 5 years. Robusta continued to display a negative trend while arabica is on the increase. The decline in robusta is largely due to the prevelance of CWD and the drought being experience in the Robusta areas.

UCDA ANNUAL REPORT: 2005/06- Page 15
0
500,000
1,000,000
1,500,000
2,000,000
2,500,000
3,000,000
60-K
ilo
bag
s
Robusta Arabica
Figure 1: Comparative Coffee Exports by Type: Arabica & Robusta
2001/02
2002/03
2003/04
2004/05
2005/06
The corresponding earnings from coffee rose by 5% from US $ 162 million in 2004/05 to $ 170 m this year. The improvement was generally a result of the rise in international coffee prices prompted by supply tightness from major origins.
Table 2.3 Monthly Coffee Export Performance - 60-Kg Bags & Dollar$
MONTHS
2005/06 2004/05 %-Age Change Qty Value $ Qty Value $ Qty Value $
GRAND TOTAL
2,002,324 170,344,187 2,504,890 162,078,550 (20.0) (20.1)
5.0 5.1 OCT. 121,696 9,279,495 185,933 8,248,721 (34.5) 12.5
NOV. 182,053 14,472,486 182,881 8,301,451 (0.5) 74.3
DEC. 180,344 14,849,849 237,406 12,369,677 (24.0) 20.1
Qtr - 1 484,093 38,601,830 606,220 28,919,849 (20.1) 33.5 JAN. 228,714 19,679,281 214,723 11,450,326 6.5 71.9
FEB. 165,762 16,113,588 215,118 12,390,484 (22.9) 30.0
MAR 155,960 14,630,894 195,417 13,932,031 (20.2) 5.0
Qtr - 2 550,436 50,423,763 625,258 37,772,841 (12.0) 33.5 APR. 146,642 13,714,424 211,388 15,347,589 (30.6) (10.6)
MAY 123,321 10,967,328 220,025 16,777,748 (44.0) (34.6)
JUN 187,448 14,574,446 229,251 18,067,505 (18.2) (19.3)
Qtr - 3 457,411 39,256,198 660,664 50,192,842 (73.3) (21.8) JUL. 176,310 13,711,673 251,013 18,618,507 (29.8) (26.4)
AUG 175,526 14,380,876 219,447 16,541,894 (20.0) (13.1)
SEP 158,548 13,969,847 142,288 10,032,617 11.4 39.2
Qtr - 4 510,384 42,062,396 612,748 45,193,018 (16.7) (6.9)
2.21 COFFEE EXPORTS BY TYPE AND GRADE
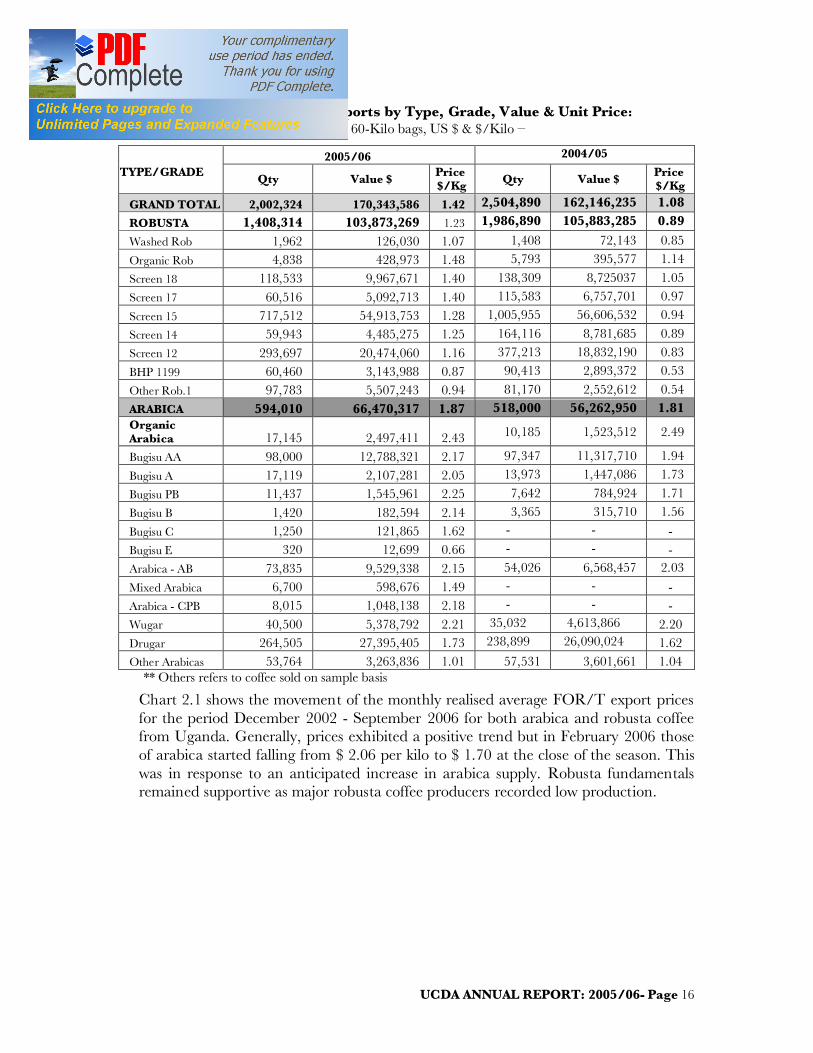
Table 2.4 gives coffee exports by type, grade, value and realised unit price compared to the previous year. Robusta coffee, which represented close to 80% of total exports, earned US $ 105.8 million, while arabica – 20% - realised $ 56.3 million. There was a marked improvement in the realised export price this year from $ 1.08 per kilo in 2004/05 to $ 1.42, reflecting a 31.5% rise. The rise in price was more pronounced in robusta coffee grades, from an average of $ 0.89 in 2004/05 to $ 1.23, which was 38.2% up. Arabica prices rose marginally by 3.3% from $ 1.81 per kilo to $ 1.87.
UCDA ANNUAL REPORT: 2005/06- Page 16
Table 2.4 Coffee Exports by Type, Grade, Value & Unit Price: - in 60-Kilo bags, US $ & $/Kilo –
TYPE/GRADE
2005/06 2004/05
Qty Value $ Price $/Kg Qty Value $ Price
$/Kg
GRAND TOTAL 2,002,324 170,343,586 1.42 2,504,890 162,146,235 1.08
ROBUSTA 1,408,314 103,873,269 1.23 1,986,890 105,883,285 0.89
Washed Rob 1,962 126,030 1.07 1,408 72,143 0.85
Organic Rob 4,838 428,973 1.48 5,793 395,577 1.14
Screen 18 118,533 9,967,671 1.40 138,309 8,725037 1.05
Screen 17 60,516 5,092,713 1.40 115,583 6,757,701 0.97
Screen 15 717,512 54,913,753 1.28 1,005,955 56,606,532 0.94
Screen 14 59,943 4,485,275 1.25 164,116 8,781,685 0.89
Screen 12 293,697 20,474,060 1.16 377,213 18,832,190 0.83
BHP 1199 60,460 3,143,988 0.87 90,413 2,893,372 0.53
Other Rob.1 97,783 5,507,243 0.94 81,170 2,552,612 0.54
ARABICA 594,010 66,470,317 1.87 518,000 56,262,950 1.81 Organic Arabica 17,145 2,497,411 2.43 10,185 1,523,512 2.49
Bugisu AA 98,000 12,788,321 2.17 97,347 11,317,710 1.94
Bugisu A 17,119 2,107,281 2.05 13,973 1,447,086 1.73
Bugisu PB 11,437 1,545,961 2.25 7,642 784,924 1.71
Bugisu B 1,420 182,594 2.14 3,365 315,710 1.56
Bugisu C 1,250 121,865 1.62 - - - Bugisu E 320 12,699 0.66 - - - Arabica - AB 73,835 9,529,338 2.15 54,026 6,568,457 2.03
Mixed Arabica 6,700 598,676 1.49 - - - Arabica - CPB 8,015 1,048,138 2.18 - - - Wugar 40,500 5,378,792 2.21 35,032 4,613,866 2.20 Drugar 264,505 27,395,405 1.73 238,899 26,090,024 1.62 Other Arabicas 53,764 3,263,836 1.01 57,531 3,601,661 1.04
** Others refers to coffee sold on sample basis
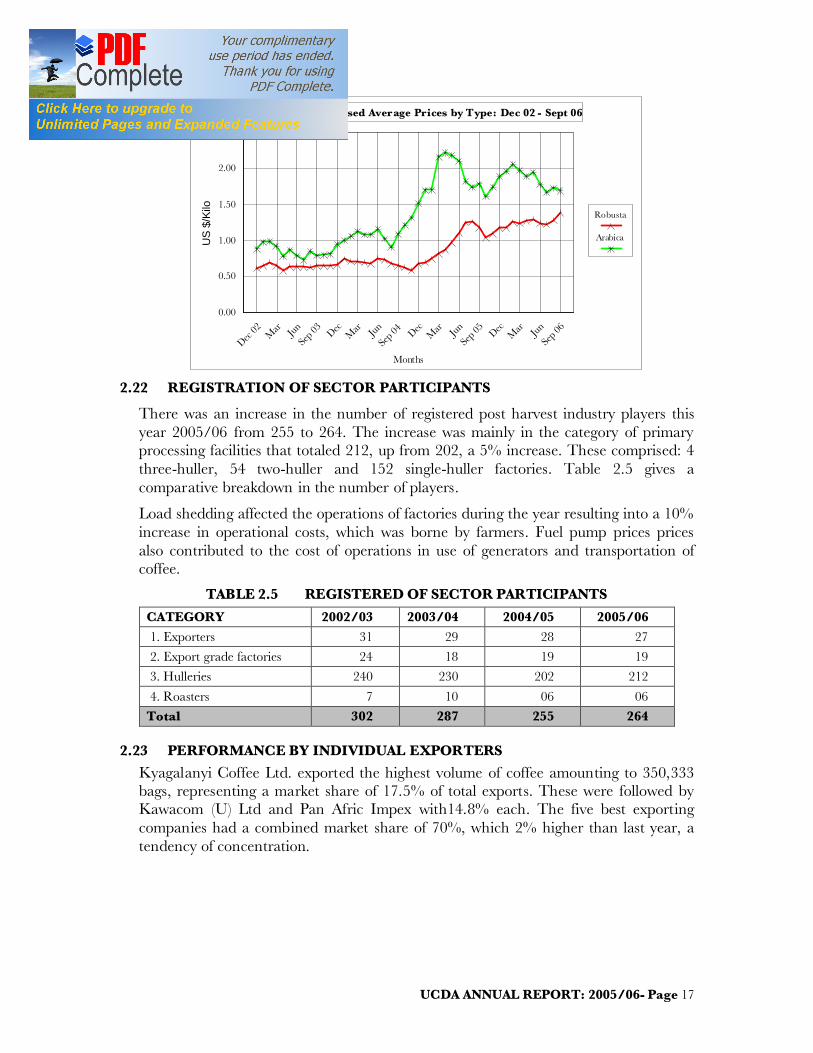
Chart 2.1 shows the movement of the monthly realised average FOR/T export prices for the period December 2002 - September 2006 for both arabica and robusta coffee from Uganda. Generally, prices exhibited a positive trend but in February 2006 those of arabica started falling from $ 2.06 per kilo to $ 1.70 at the close of the season. This was in response to an anticipated increase in arabica supply. Robusta fundamentals remained supportive as major robusta coffee producers recorded low production.
UCDA ANNUAL REPORT: 2005/06- Page 17
Dec 02 M
ar Jun
Sep 03 Dec
Mar Ju
n
Sep 04 Dec
Mar Ju
n
Sep 05 Dec
Mar Ju
n
Sep 06
Months
0.00
0.50
1.00
1.50
2.00
2.50
US
$/Ki
loRobusta
Arabica
Monthly Average Realised Average Prices by Type: Dec 02 - Sept 06
2.22 REGISTRATION OF SECTOR PARTICIPANTS
There was an increase in the number of registered post harvest industry players this year 2005/06 from 255 to 264. The increase was mainly in the category of primary processing facilities that totaled 212, up from 202, a 5% increase. These comprised: 4 three-huller, 54 two-huller and 152 single-huller factories. Table 2.5 gives a comparative breakdown in the number of players.
Load shedding affected the operations of factories during the year resulting into a 10% increase in operational costs, which was borne by farmers. Fuel pump prices prices also contributed to the cost of operations in use of generators and transportation of coffee.
TABLE 2.5 REGISTERED OF SECTOR PARTICIPANTS
CATEGORY 2002/03 2003/04 2004/05 2005/06 1. Exporters 31 29 28 27
2. Export grade factories 24 18 19 19
3. Hulleries 240 230 202 212
4. Roasters 7 10 06 06
Total 302 287 255 264
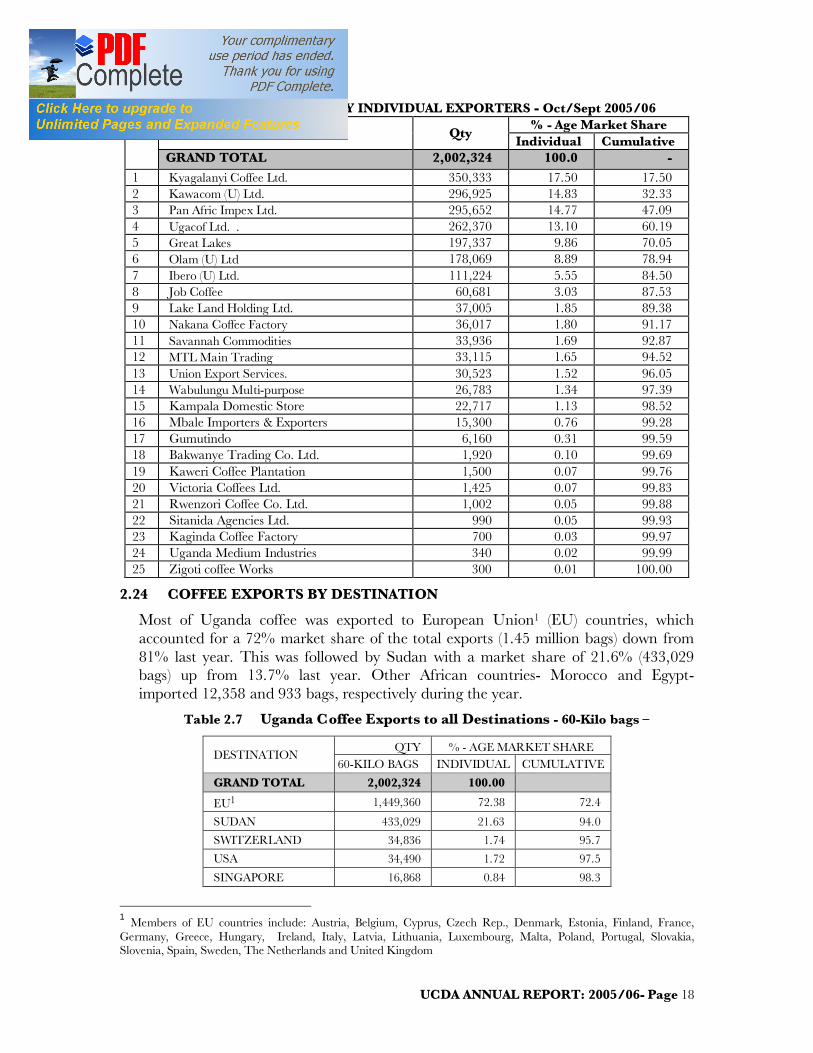
2.23 PERFORMANCE BY INDIVIDUAL EXPORTERS Kyagalanyi Coffee Ltd. exported the highest volume of coffee amounting to 350,333 bags, representing a market share of 17.5% of total exports. These were followed by Kawacom (U) Ltd and Pan Afric Impex with14.8% each. The five best exporting companies had a combined market share of 70%, which 2% higher than last year, a tendency of concentration.
UCDA ANNUAL REPORT: 2005/06- Page 18
Table 2.6 PERFORMANCES BY INDIVIDUAL EXPORTERS - Oct/Sept 2005/06 EXPORTER Qty
% - Age Market Share Individual Cumulative
GRAND TOTAL 2,002,324 100.0 - 1 Kyagalanyi Coffee Ltd. 350,333 17.50 17.50 2 Kawacom (U) Ltd. 296,925 14.83 32.33 3 Pan Afric Impex Ltd. 295,652 14.77 47.09 4 Ugacof Ltd. . 262,370 13.10 60.19 5 Great Lakes 197,337 9.86 70.05 6 Olam (U) Ltd 178,069 8.89 78.94 7 Ibero (U) Ltd. 111,224 5.55 84.50 8 Job Coffee 60,681 3.03 87.53 9 Lake Land Holding Ltd. 37,005 1.85 89.38 10 Nakana Coffee Factory 36,017 1.80 91.17 11 Savannah Commodities 33,936 1.69 92.87 12 MTL Main Trading 33,115 1.65 94.52 13 Union Export Services. 30,523 1.52 96.05 14 Wabulungu Multi-purpose 26,783 1.34 97.39 15 Kampala Domestic Store 22,717 1.13 98.52 16 Mbale Importers & Exporters 15,300 0.76 99.28 17 Gumutindo 6,160 0.31 99.59 18 Bakwanye Trading Co. Ltd. 1,920 0.10 99.69 19 Kaweri Coffee Plantation 1,500 0.07 99.76 20 Victoria Coffees Ltd. 1,425 0.07 99.83 21 Rwenzori Coffee Co. Ltd. 1,002 0.05 99.88 22 Sitanida Agencies Ltd. 990 0.05 99.93 23 Kaginda Coffee Factory 700 0.03 99.97 24 Uganda Medium Industries 340 0.02 99.99 25 Zigoti coffee Works 300 0.01 100.00
2.24 COFFEE EXPORTS BY DESTINATION
Most of Uganda coffee was exported to European Union1 (EU) countries, which accounted for a 72% market share of the total exports (1.45 million bags) down from 81% last year. This was followed by Sudan with a market share of 21.6% (433,029 bags) up from 13.7% last year. Other African countries- Morocco and Egypt- imported 12,358 and 933 bags, respectively during the year.
Table 2.7 Uganda Coffee Exports to all Destinations - 60-Kilo bags –
DESTINATION QTY % - AGE MARKET SHARE
60-KILO BAGS INDIVIDUAL CUMULATIVE
GRAND TOTAL 2,002,324 100.00
EU1 1,449,360 72.38 72.4
SUDAN 433,029 21.63 94.0
SWITZERLAND 34,836 1.74 95.7
USA 34,490 1.72 97.5
SINGAPORE 16,868 0.84 98.3
1 Members of EU countries include: Austria, Belgium, Cyprus, Czech Rep., Denmark, Estonia, Finland, France, Germany, Greece, Hungary, Ireland, Italy, Latvia, Lithuania, Luxembourg, Malta, Poland, Portugal, Slovakia, Slovenia, Spain, Sweden, The Netherlands and United Kingdom

UCDA ANNUAL REPORT: 2005/06- Page 19
MOROCCO 12,358 0.62 98.9
JAPAN 10,710 0.53 99.5
AUSTRALIA 3,999 0.20 99.7
CANADA 2,264 0.11 99.8
ISRAEL 2,178 0.11 99.9
HONG KONG 1,299 0.06 100.0
EGYPT 933 0.05 100.0
2.25 COFFEE EXPORTS BY OVERSEAS BUYERS
Table 2.8 represents overseas coffee buyers by quantity, individual and comulative market shares. Collectively, the top 10 buyers had a market share of 66.4% down from 78% recorded in the previous year.
Ecom Agro Industrialists topped the list of buyers with 13.8% (15.1%) followed by Olam International – 8.8% (15.0%), Sucafina – 7.9% (10.5%), Socadec – 6.8% (2.6%), and Drucafe – 6.5% ( 4.6%) as represented in the table 2.8 below. The figures indicated in parentheses represent the performance of those buyers in the preceding year. A large number of those in the category of others are small roasters that buy one or two 20 tonne-containers directly from origin and the dealers in specialty coffees.
Table 2.8 OVERSEAS BUYERS OF UGANDA COFFEE: 2005/06 - 60 -kilo bags.
2.26 SPECIATY COFFEE
A total of 27,320 bags of various specialty coffee grades worth US$ 3.48 million was exported to during the year. These include Organic Bugisu, which fetched the highest average price of US$ 2.56 per kilo, 39 cents higher than Bugisu AA at US$ 2.17. Organic Okoro fetched US$ 2.36 per kilo against US$ 2.21 a kilo for Wugar (15 cents higher). Bugisu AA that went to the niche market segment realised an average price of US$ 2.26 a kilo against US$ 2.17 for the conventional market (a premium of 9 cents).
Overseas Buyers
Qty Percentage Market Share
60-Kilo Bags Individual Cumulative GRAND TOTAL 2,002,324 100 1 Ecom Agro industrialist 275,999 13.78 13.78 2 Olam International 176,204 8.80 22.58 3 Sucafina 158,062 7.89 30.48 4 Socadec 135,624 6.77 37.25 5 Drucafe 129,861 6.49 43.74 6 Cofftea (Sudan) 125,010 6.24 49.98 7 Louis Dreyfus 105,266 5.26 55.24 8 Bernard Rothfos 103,832 5.19 60.42 9 Volcafe 63,373 3.16 63.59
10 Decotrade 55,904 2.79 66.38 11 Icona Café 53,047 2.65 69.03 12 El Mathahib 49,300 2.46 71.49 13 Others 570,842 28.51 100.00
UCDA ANNUAL REPORT: 2005/06- Page 20
Organic Robusta fetched an average of $ 1.48 cents a kilo, which was 25 cents higher than the average price for robusta coffee of $ 1.23 during the year. However, the volue for organic robusta dropped from 5,793 bags in 2004/05 to 4,838 bags (20%) – table 2.4 above.
A total of 1,962 bags of washed Robusta valued at $ 126,030 were exported during the year with an average price of US$ 1.07 per kilo, up from 1,408 bags ($ 72,143) in 2004/5 and 210 bags worth $ 10,232 in 2003/04. The quantity of washed robusta coffee is envisaged to increase further as more wet mills under the Strategic Export Programme are established. And coffee planted around these mills comes into production. The wet mills that are operational had a problem of obtaining adequate red cherries for processing this year.
2.30 PRICE MOVEMENT
2.31 LOCAL PRICES
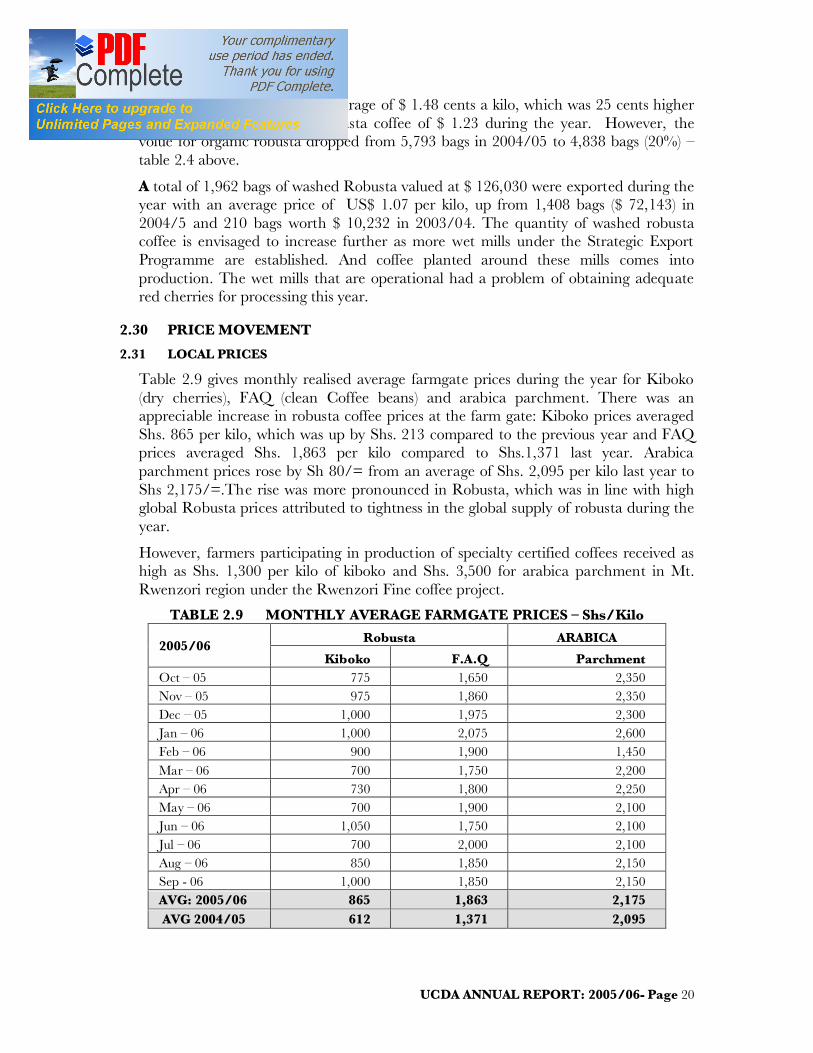
Table 2.9 gives monthly realised average farmgate prices during the year for Kiboko (dry cherries), FAQ (clean Coffee beans) and arabica parchment. There was an appreciable increase in robusta coffee prices at the farm gate: Kiboko prices averaged Shs. 865 per kilo, which was up by Shs. 213 compared to the previous year and FAQ prices averaged Shs. 1,863 per kilo compared to Shs.1,371 last year. Arabica parchment prices rose by Sh 80/= from an average of Shs. 2,095 per kilo last year to Shs 2,175/=.The rise was more pronounced in Robusta, which was in line with high global Robusta prices attributed to tightness in the global supply of robusta during the year.
However, farmers participating in production of specialty certified coffees received as high as Shs. 1,300 per kilo of kiboko and Shs. 3,500 for arabica parchment in Mt. Rwenzori region under the Rwenzori Fine coffee project.
TABLE 2.9 MONTHLY AVERAGE FARMGATE PRICES – Shs/Kilo
2005/06 Robusta ARABICA
Kiboko F.A.Q Parchment Oct – 05 775 1,650 2,350 Nov – 05 975 1,860 2,350 Dec – 05 1,000 1,975 2,300 Jan – 06 1,000 2,075 2,600 Feb – 06 900 1,900 1,450 Mar – 06 700 1,750 2,200 Apr – 06 730 1,800 2,250 May – 06 700 1,900 2,100 Jun – 06 1,050 1,750 2,100 Jul – 06 700 2,000 2,100 Aug – 06 850 1,850 2,150 Sep - 06 1,000 1,850 2,150 AVG: 2005/06 865 1,863 2,175 AVG 2004/05 612 1,371 2,095
UCDA ANNUAL REPORT: 2005/06- Page 21
Table 2.10 shows farmers’ percentage share in the FOR/T, Kampala price in the last 5 years. The percentage marginally dropped from 80% in 2004/05 to 79%, a result of appreciation of the local shilling against the US dollar. That notwithstanding, farmers still command a good share and because of this, farmers’ demand for planting materials to enhance productivity and production has increased.
Table 2.10 FARMERS’ PERCENTAGE SHARE OF FOR/T KAMPALA PRICE
COFFEE YEAR Average Price in Shs/Kilo %-Age Share
F.A.Q SC. 1500 2001/02 520 778 67 2002/03 1,080 1,386 78 2003/04 1,090 1,420 77 2004/05 1,371 1,720 80 2005/06 1,863 2,351 79
2.40 GLOBAL SITUATION
The global coffee exports in 2005/06 totaled 87.21 million bags, a drop of 2.63% compared to 89.56 bags recorded in 2004/05. Arabica and Robusta exports in coffee year 2005/06 amounted to 58.46 million bags and 28.75 million bags, respectively compared with 59.35 million bags and 30.20 million bags in 2004/05.
The ICO composite indicator price averaged 91.44 US Cents per pound in 2005/06 compared with 85.30 cents for 2004/05 and 57.77 cents in 2003/042.
Global production in 2005/06 was pegged at 106 million bags against a consumption level of 115 million bags, resulting in a global deficit of 9 million bags. This situation is nonetheless projected to stabilize in 2006/07 coffee year where production is estimated at 120 million bags against a consumption uptake of around 118 million bags. Prices are projected to remain as they are in the near future but for changes in exogenous factors and speculations.
2.50 DOMESTIC COFFEE CONSUMPTION
Domestic coffee consumption continued to increase with a number of new cafés mushrooming in major towns. New cafés such as Pap Café, Bakers World, Nandos, Boldwin’s Café and others have been set up on top of the old ones – Bancafe and 1000 Cups. These have attracted a number of customers, especially the youth. A good cup of coffee sells between Sh. 2,000 - 5,000/=.
The growth in the number of supermarkets, the main distribution channel of coffee products, in the country has made coffee available in most parts of the country. The main brands being sold in these supermarkets include Nescafe, Star Coffee (both instant and R & G), Africafe, Elgonia, Elgon Pride, Nguvu, Kahawa Maluum (Uganda Bugisu Coffee Beans) and lately One Café. Different supermarkets displayed quite a variety of coffee brands on their shelves catering for the diverse tastes and preferences
2 See ICO website for details

UCDA ANNUAL REPORT: 2005/06- Page 22
of consumers. Supermarkets such as Shoprite and Uchumi (Garden City) display as many as 12 brands on the shelves that cater for all income groups of customers.
2.60 CLOSING STOCKS
Table 2.11 represents the coffee stock position as at the close of the coffee season, September 30, 2006. Stocks at the export level were estimated at 265,227 bags of exportable grades, comprising - Robusta 174,423 bags and Arabica 90,804 bags. The high stock level especially for Arabica was mostly attributed to rising global prices prompting speculative exporters to stockpile in anticipation for yet higher prices.
Table 2.11 COFFEE STOCK MOVEMENT – 60-Kilo Bags – Oct/Sept. 2005/06 Robusta Arabica Total Opening Stock 152,240 90,090 242,330
Total Production3 1,550,497 624,724 2,175,221 Availability 1,702,737 714,814 2,417,551 Domestic Consumption 120,000 30,00 150,000 Exports (Oct/Sept) 1,408,314 594,010 2,002,324 Closing Stock –Sept 30. 174,423 90,804 265,227
2.60 OUTLOOK FOR 2006/07
Despite the drought experienced in 2005/06, coffee exports are projected to go up by 30% to reach 2.6 m bags on the account of the good husbandry practices arising from the favourable prices; and a forecast of good weather in 2007 as reported by the Meteorology Department. The coffee campaign, which started in 2005/06 in ten NAADS districts is also expected to result into higher farm productivity and production.
On the global scene, coffee production in Oct/Sept. 2006/07 is estimated at 1184 million 60 kg bags, an increase of around 10% compared to 2005/06. This increase is attributed to an increase in Brazilian production due to the biennial cycle, characteristic of Arabica production; and production in Vietnam, which is estimated at 16.5 million bags.
Coffee stocks held by importing countries were reported to have fallen to 18.9 million bags5, the lowest in many years, because of the supply-demand imbalance experienced in 2005/06.
3 This represents mainly coffee procurement or marketed production. 4 ICO Coffee Market Report 5 ICO Coffee Market Report
UCDA ANNUAL REPORT: 2005/06- Page 23
Chapter Three
QUALITY AND REGULATORY SERVICES
3.1 TECHNICAL EXTENSION SERVICES Extension technical services aimed at equipping the sector players with good processing, handling and storage techniques were provided. Partcicular emphasis was placed on demonstrating the correct use of moisture anlysers and adjustment of the hullers. Over 150 buying stores, 212 hulleries, 20 central washing stations, 19 export grading plants, 27 exporting companies and 12 roasters were visited.
3.2 QUALITY AWARENESS AND ENFORCEMENT OF COFFEE REGULATIONS
The processing, handling and trading in semi dried kiboko and parchment continued to be the major cause of quality deterioration of coffee traded in the internal market. The adulteration of processed coffee (FAQ) with BHP’s and other extraneous matter by some unscrouplous dealers also aggravates the deterioration of quality.
Sensitization workshops for the stakeholders were jointly organised by local authorities and UCDA in the districts of Kamuli, Jinja, Bushenyi, Mubende and Mpigi. It was resolved that the local authorities would enact and implement coffee by-laws to underpin the current Coffee Regulations.
Those dealers and processors found handling wet coffee (M.C > 14%) were penalised by suspending their operations for at least two weeks. Masaka district authorities in a joint effort with Masaka Coffee Buyers and Processors Association; and UCDA continued to man check points along the highways as a measure to curb the movement of poor quality coffees through the district. Those traders who were transporting poor quality lots were prosecuted in court of law where they paid hefty fines.
Similarly, poor FAQ deliveries to the export grading factories received high penalties as a deterrent to dealing in poor quality coffee. The exporters were advised to always reject poor deliveries so that these coffees are denied a market. The exporters were also advised to implement strict in-process quality control measures.
3.3 EFFECTS OF LOAD SHEDDING
The on-going nation-wide power shortage and load shedding have greatly undermined the coffee processing performance. Most hulleries could only operate on alternate days in line with rationing, and even then the supply is often intermittent. Envitably, milling charges rose from an average of Shs. 30/- per kilogramme of FAQ in the 2004/05 to Shs. 60/= in 2005/06. This led to a general decrease in the number of active processing units on top of depressing farm-gate prices.
3.4 FIELD EVALUATION
3.4.1 Volume of the crop
The prolonged dry spell experienced during the year in most coffee growing and the effect of CWD in the Robusta resulted in a drastic drop in coffee production from 2.7 million bags to around 2.40 m bags, as measured by procurement figures. The drop was more in robustas, arabicas rose from 0.52 m bags to around 0.66 m.
UCDA ANNUAL REPORT: 2005/06- Page 24
3.4.2 Field Quality Evaluation
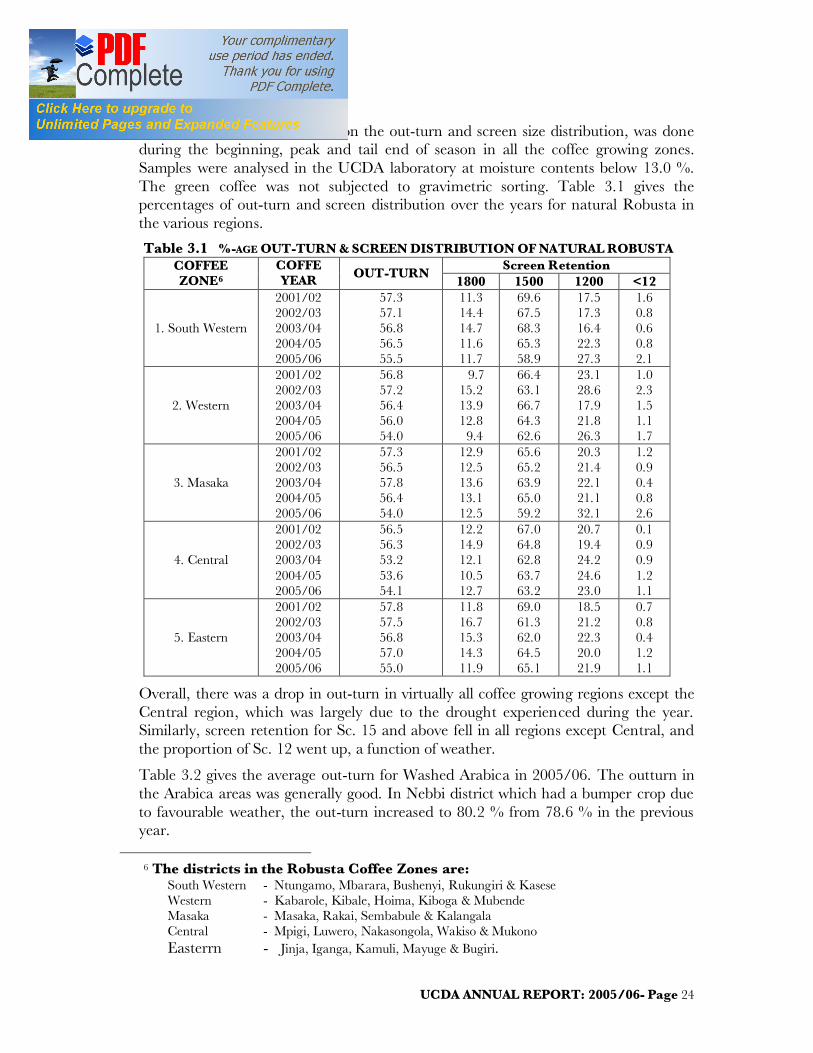
Field quality evaluation, based on the out-turn and screen size distribution, was done during the beginning, peak and tail end of season in all the coffee growing zones. Samples were analysed in the UCDA laboratory at moisture contents below 13.0 %. The green coffee was not subjected to gravimetric sorting. Table 3.1 gives the percentages of out-turn and screen distribution over the years for natural Robusta in the various regions.
Table 3.1 %-AGE OUT-TURN & SCREEN DISTRIBUTION OF NATURAL ROBUSTA COFFEE ZONE6
COFFE YEAR OUT-TURN Screen Retention
1800 1500 1200 <12
1. South Western
2001/02 2002/03 2003/04 2004/05 2005/06
57.3 57.1 56.8 56.5 55.5
11.3 14.4 14.7 11.6 11.7
69.6 67.5 68.3 65.3 58.9
17.5 17.3 16.4 22.3 27.3
1.6 0.8 0.6 0.8 2.1
2. Western
2001/02 2002/03 2003/04 2004/05 2005/06
56.8 57.2 56.4 56.0 54.0
9.7 15.2 13.9 12.8 9.4
66.4 63.1 66.7 64.3 62.6
23.1 28.6 17.9 21.8 26.3
1.0 2.3 1.5 1.1 1.7
3. Masaka
2001/02 2002/03 2003/04 2004/05 2005/06
57.3 56.5 57.8 56.4 54.0
12.9 12.5 13.6 13.1 12.5
65.6 65.2 63.9 65.0 59.2
20.3 21.4 22.1 21.1 32.1
1.2 0.9 0.4 0.8 2.6
4. Central
2001/02 2002/03 2003/04 2004/05 2005/06
56.5 56.3 53.2 53.6 54.1
12.2 14.9 12.1 10.5 12.7
67.0 64.8 62.8 63.7 63.2
20.7 19.4 24.2 24.6 23.0
0.1 0.9 0.9 1.2 1.1
5. Eastern
2001/02 2002/03 2003/04 2004/05 2005/06
57.8 57.5 56.8 57.0 55.0
11.8 16.7 15.3 14.3 11.9
69.0 61.3 62.0 64.5 65.1
18.5 21.2 22.3 20.0 21.9
0.7 0.8 0.4 1.2 1.1
Overall, there was a drop in out-turn in virtually all coffee growing regions except the Central region, which was largely due to the drought experienced during the year. Similarly, screen retention for Sc. 15 and above fell in all regions except Central, and the proportion of Sc. 12 went up, a function of weather.
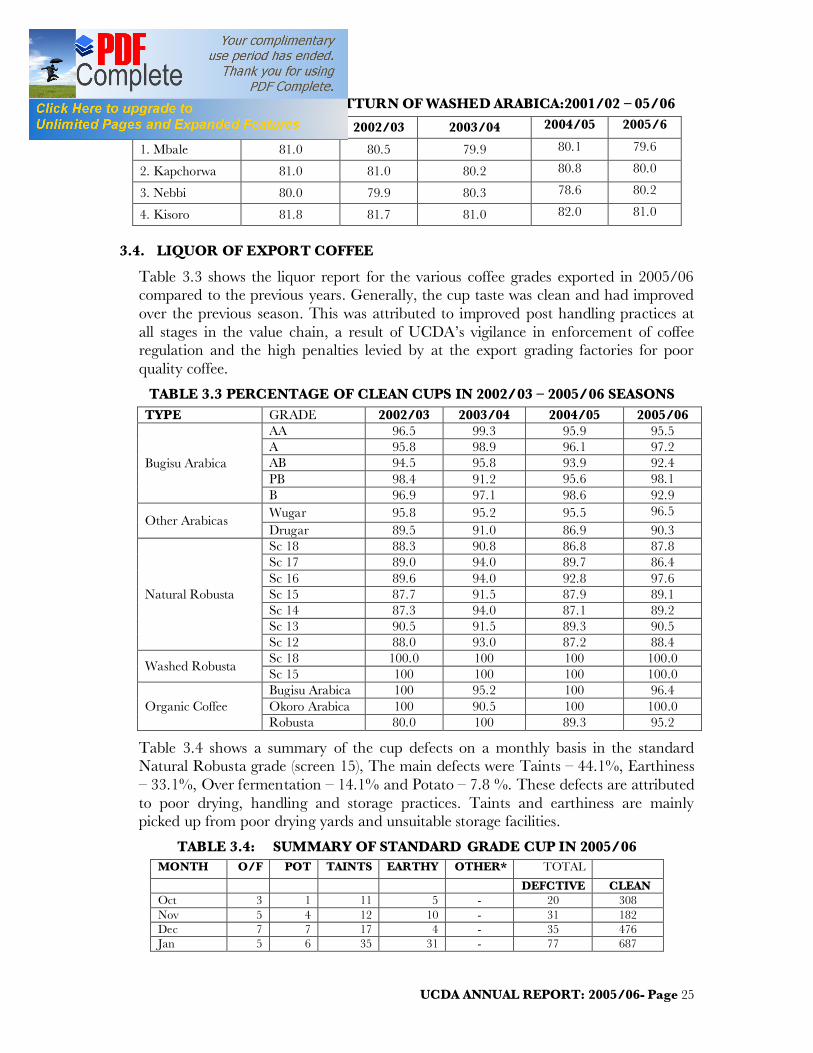
Table 3.2 gives the average out-turn for Washed Arabica in 2005/06. The outturn in the Arabica areas was generally good. In Nebbi district which had a bumper crop due to favourable weather, the out-turn increased to 80.2 % from 78.6 % in the previous year.
6 The districts in the Robusta Coffee Zones are:
South Western - Ntungamo, Mbarara, Bushenyi, Rukungiri & Kasese Western - Kabarole, Kibale, Hoima, Kiboga & Mubende Masaka - Masaka, Rakai, Sembabule & Kalangala Central - Mpigi, Luwero, Nakasongola, Wakiso & Mukono Easterrn - Jinja, Iganga, Kamuli, Mayuge & Bugiri.
UCDA ANNUAL REPORT: 2005/06- Page 25
TABLE 3.2 COMPARATIVE OUTTURN OF WASHED ARABICA:2001/02 – 05/06
DISTRICT 2001/02 2002/03 2003/04 2004/05 2005/6
1. Mbale 81.0 80.5 79.9 80.1 79.6
2. Kapchorwa 81.0 81.0 80.2 80.8 80.0
3. Nebbi 80.0 79.9 80.3 78.6 80.2
4. Kisoro 81.8 81.7 81.0 82.0 81.0
3.4. LIQUOR OF EXPORT COFFEE
Table 3.3 shows the liquor report for the various coffee grades exported in 2005/06 compared to the previous years. Generally, the cup taste was clean and had improved over the previous season. This was attributed to improved post handling practices at all stages in the value chain, a result of UCDA’s vigilance in enforcement of coffee regulation and the high penalties levied by at the export grading factories for poor quality coffee.
TABLE 3.3 PERCENTAGE OF CLEAN CUPS IN 2002/03 – 2005/06 SEASONS TYPE GRADE 2002/03 2003/04 2004/05 2005/06
Bugisu Arabica
AA 96.5 99.3 95.9 95.5 A 95.8 98.9 96.1 97.2 AB 94.5 95.8 93.9 92.4 PB 98.4 91.2 95.6 98.1 B 96.9 97.1 98.6 92.9
Other Arabicas Wugar 95.8 95.2 95.5 96.5 Drugar 89.5 91.0 86.9 90.3
Natural Robusta
Sc 18 88.3 90.8 86.8 87.8 Sc 17 89.0 94.0 89.7 86.4 Sc 16 89.6 94.0 92.8 97.6 Sc 15 87.7 91.5 87.9 89.1 Sc 14 87.3 94.0 87.1 89.2 Sc 13 90.5 91.5 89.3 90.5 Sc 12 88.0 93.0 87.2 88.4
Washed Robusta Sc 18 100.0 100 100 100.0 Sc 15 100 100 100 100.0
Organic Coffee Bugisu Arabica 100 95.2 100 96.4 Okoro Arabica 100 90.5 100 100.0 Robusta 80.0 100 89.3 95.2
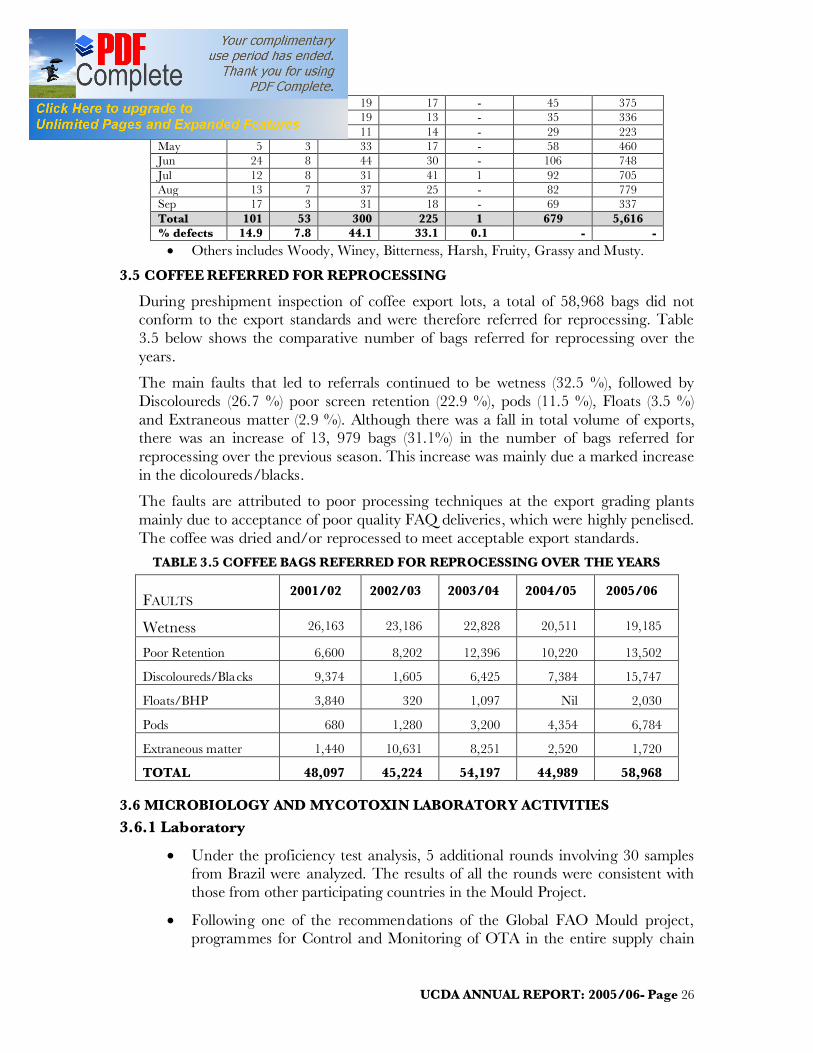
Table 3.4 shows a summary of the cup defects on a monthly basis in the standard Natural Robusta grade (screen 15), The main defects were Taints – 44.1%, Earthiness – 33.1%, Over fermentation – 14.1% and Potato – 7.8 %. These defects are attributed to poor drying, handling and storage practices. Taints and earthiness are mainly picked up from poor drying yards and unsuitable storage facilities.
TABLE 3.4: SUMMARY OF STANDARD GRADE CUP IN 2005/06 MONTH O/F POT TAINTS EARTHY OTHER* TOTAL DEFCTIVE CLEAN Oct 3 1 11 5 - 20 308 Nov 5 4 12 10 - 31 182 Dec 7 7 17 4 - 35 476 Jan 5 6 35 31 - 77 687
UCDA ANNUAL REPORT: 2005/06- Page 26
Feb 5 4 19 17 - 45 375 Mar 2 1 19 13 - 35 336 Apr 3 1 11 14 - 29 223 May 5 3 33 17 - 58 460 Jun 24 8 44 30 - 106 748 Jul 12 8 31 41 1 92 705 Aug 13 7 37 25 - 82 779 Sep 17 3 31 18 - 69 337 Total 101 53 300 225 1 679 5,616 % defects 14.9 7.8 44.1 33.1 0.1 - -
• Others includes Woody, Winey, Bitterness, Harsh, Fruity, Grassy and Musty.
3.5 COFFEE REFERRED FOR REPROCESSING
During preshipment inspection of coffee export lots, a total of 58,968 bags did not conform to the export standards and were therefore referred for reprocessing. Table 3.5 below shows the comparative number of bags referred for reprocessing over the years.
The main faults that led to referrals continued to be wetness (32.5 %), followed by Discoloureds (26.7 %) poor screen retention (22.9 %), pods (11.5 %), Floats (3.5 %) and Extraneous matter (2.9 %). Although there was a fall in total volume of exports, there was an increase of 13, 979 bags (31.1%) in the number of bags referred for reprocessing over the previous season. This increase was mainly due a marked increase in the dicoloureds/blacks.
The faults are attributed to poor processing techniques at the export grading plants mainly due to acceptance of poor quality FAQ deliveries, which were highly penelised. The coffee was dried and/or reprocessed to meet acceptable export standards.
TABLE 3.5 COFFEE BAGS REFERRED FOR REPROCESSING OVER THE YEARS
FAULTS 2001/02 2002/03 2003/04 2004/05 2005/06
Wetness 26,163 23,186 22,828 20,511 19,185
Poor Retention 6,600 8,202 12,396 10,220 13,502
Discoloureds/Blacks 9,374 1,605 6,425 7,384 15,747
Floats/BHP 3,840 320 1,097 Nil 2,030
Pods 680 1,280 3,200 4,354 6,784
Extraneous matter 1,440 10,631 8,251 2,520 1,720
TOTAL 48,097 45,224 54,197 44,989 58,968
3.6 MICROBIOLOGY AND MYCOTOXIN LABORATORY ACTIVITIES
3.6.1 Laboratory
• Under the proficiency test analysis, 5 additional rounds involving 30 samples from Brazil were analyzed. The results of all the rounds were consistent with those from other participating countries in the Mould Project.
• Following one of the recommendations of the Global FAO Mould project, programmes for Control and Monitoring of OTA in the entire supply chain

UCDA ANNUAL REPORT: 2005/06- Page 27
have been instituted; and training in Mould prevention in coffee is ongoing. A code of practice for exporting factories as a guide in control of mould (OTA) has also been drafted.
• A Laboratory policy manual and a Standard Operation Procedures manual that show in detail, the procedures to follow when carrying out the laboratory operations have also been drafted.
3.6.2 Training
A student of Food Science and Processing from Kyambogo University received his industrial in analytical procedures in the Microbiology laboratory where an investigation on the occurrence of OTA in green coffee beans was done. Forty eight (48) samples were analyzed using the fluorometer method.
A team of laboratory experts from Brazil provided training for 2 weeks to UCDA and UNBS staff in OTA analysis. They also took an assessment of UCDA OTA laboratory in readiness testing OTA levels in coffee.
3.7 DEVELOPMENT OF WASHED COFFEE
Installation works of the 16 wet processing units obtained under the Strategic Export Programme (SEP) in 2003 continued; 9 were completed of which 5 are operational. Two other mills await the completion of electrical wiring to begin operations. The rest are at various stages of installation as shown in table 3.6 below.
TABLE 3.8: STATUS OF WET MILLS UNDER THE SEP BENEFICIARY DISTRICT T/HR* STATUS
1. Mt View Farm Bushenyi 3.5 Wiring (electrical) to be done 2. Mt View Farm Bushenyi 1.0 Wiring (electrical) to be done 3. West Nile Womens Assoc. Arua 3.5 Complete 4. Four Ways Group Masaka 3.5 Complete and operating 5. Victoria Coffees Ltd Mukono 3.5 Installation in progress 6. Busaanyi Agro. Investments Mpigi 3.5 Installation in progress 7. Savannah Commodities Ibanda 3.5 Complete and operating 8. Savannah Commodities Ibanda 1.0 Complete and operating 9. Kabasekende Enterprises Hoima 1.0 Civil works have stalled 10. Kabagala Estates Masaka 1.0 Civil works have stalled 11. Bugisu Pulperies Mbale 1.0 EIA in progress 12. Kyolaba Farm Wakiso 1.0 Complete 13. Zinunula Coffee Ltd Luweero 1.0 Civil works have started 14. BCU (Mtl Traders Ltd Sironko 1.0 Complete and operating 15. Sipi Falls Pulperies Kapchorwa 1.0 EIA in progress 16. Kikonda Estates Luweero 1.0 Civil works have began
* Capacity in T/hr of fresh cherry
The onging coffee replanting programme focuses on creation of catchment areas for red coffee cherries aroud these wet mills. The mills that are operational had a problem of having adequate supply of cherries for optimal operations.
3.9. TRAINING IN BASIC QUALITY CONTROL TECHNIQUES
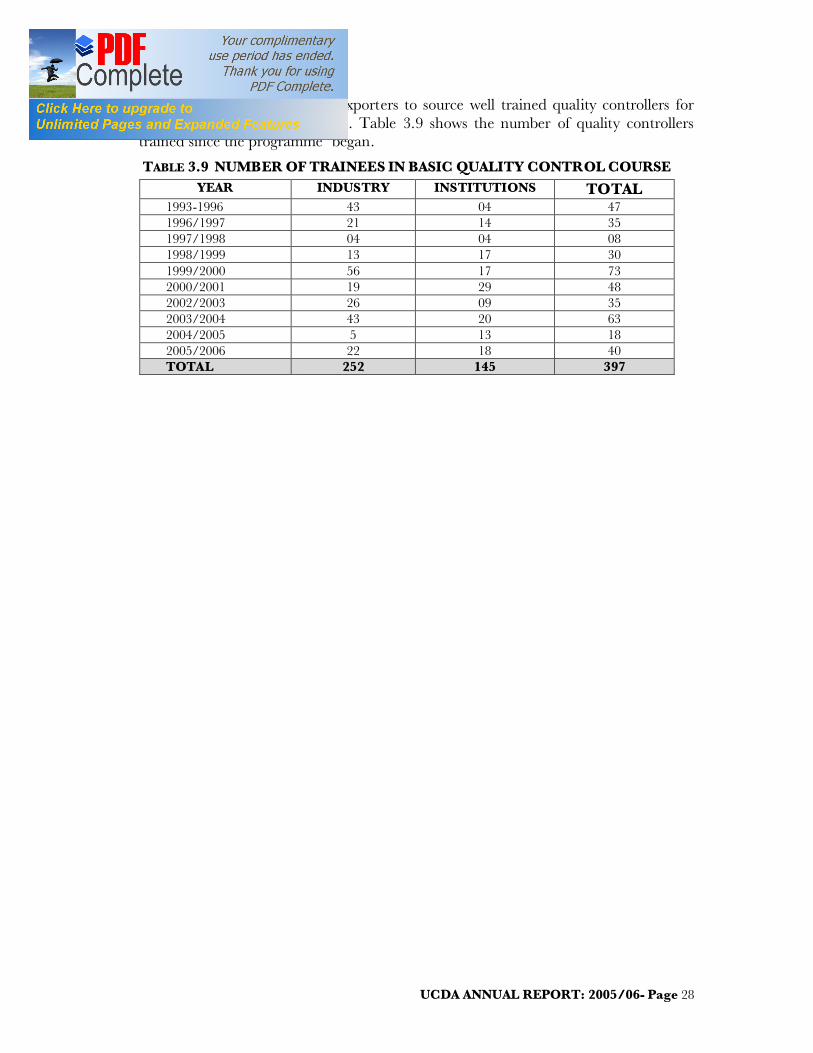
A total of 40 quality controllers comprising of 22 from the industry and 18 ftom institutions of tertiary learning were trained in basic quality control systems during the
UCDA ANNUAL REPORT: 2005/06- Page 28
year. The course has enabled exporters to source well trained quality controllers for employment in their companies. Table 3.9 shows the number of quality controllers trained since the programme began.
TABLE 3.9 NUMBER OF TRAINEES IN BASIC QUALITY CONTROL COURSE YEAR INDUSTRY INSTITUTIONS TOTAL
1993-1996 43 04 47 1996/1997 21 14 35 1997/1998 04 04 08 1998/1999 13 17 30 1999/2000 56 17 73 2000/2001 19 29 48 2002/2003 26 09 35 2003/2004 43 20 63 2004/2005 5 13 18 2005/2006 22 18 40 TOTAL 252 145 397
UCDA ANNUAL REPORT: 2005/06- Page 29
Chapter Four COFFEE DEVELOPMENT PROGRAMMES
4.0 INTRODUCTION
4.1 Coffee Development
The major coffee development activities implemented during the year targeted farmer extension delivery services (training, farm visits, method demonstrations and radio programmes); strengthening coffee uptake in new areas; productivity improvement technologies and developing market infrastructure for new coffee growing areas (Mid North and new Arabica areas); development of new strategies for reviving coffee re-planting; and Monitoring and Evaluation.
Coffee production remained on a declining course despite the efforts of previous re-planting. Coffee output during 2005/06 dropped to 2.40 million bags from 2.70 million bags in 2004/05 as measured by market production. The sharp fall was largely attributed to effects of a combination of prolonged drought, the Coffee Wilt Disease, declining soil fertility and high incidences of pests and diseases in the arabica areas.
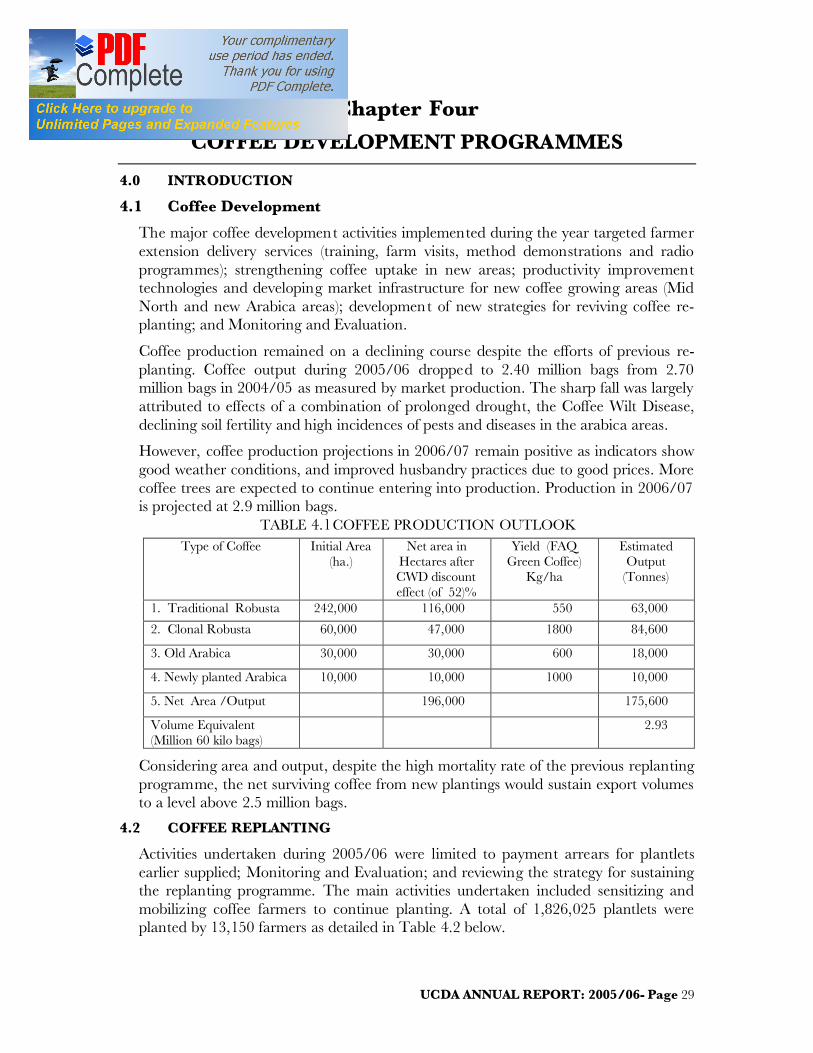
However, coffee production projections in 2006/07 remain positive as indicators show good weather conditions, and improved husbandry practices due to good prices. More coffee trees are expected to continue entering into production. Production in 2006/07 is projected at 2.9 million bags.
TABLE 4.1 COFFEE PRODUCTION OUTLOOK Type of Coffee Initial Area
(ha.) Net area in
Hectares after CWD discount effect (of 52)%
Yield (FAQ Green Coffee)
Kg/ha
Estimated Output
(Tonnes)
1. Traditional Robusta 242,000 116,000 550 63,000
2. Clonal Robusta 60,000 47,000 1800 84,600
3. Old Arabica 30,000 30,000 600 18,000
4. Newly planted Arabica 10,000 10,000 1000 10,000
5. Net Area /Output 196,000 175,600
Volume Equivalent (Million 60 kilo bags)
2.93
Considering area and output, despite the high mortality rate of the previous replanting programme, the net surviving coffee from new plantings would sustain export volumes to a level above 2.5 million bags.
4.2 COFFEE REPLANTING
Activities undertaken during 2005/06 were limited to payment arrears for plantlets earlier supplied; Monitoring and Evaluation; and reviewing the strategy for sustaining the replanting programme. The main activities undertaken included sensitizing and mobilizing coffee farmers to continue planting. A total of 1,826,025 plantlets were planted by 13,150 farmers as detailed in Table 4.2 below.

UCDA ANNUAL REPORT: 2005/06- Page 30
TABLE 4.2: NO. OF COFFEE TREES PLANTED IN 2005/06
District
Source of Plantlets Total No. of Farmers
UCDA Private Planted Arua 57,350 57,350 425
Bugiri - 18,300 18,300 131
Bushenyi - 78,900 78,900 564
Hoima - 36,480 36,480 261
Jinja - 16,000 16,000 114
Kalangala - 2,200 2,200 16
Kabarole - 27,800 27,800 199
Kamwenge - 26,400 26,400 200
Kyenjojo - 18,000 18,000 129
Kapchorwa - 79,500 108,500 781
Kisoro - 12,050 12,050 86
Kibaale - 11,690 11,690 84
Kayunga - 13,000 13,000 93
Kanungu - 600,350 600,350 4,385
Kamuli - 28,560 28,560 204
Luweero - 65,500 65,500 471
Masaka - 48,000 48,000 343
Masindi - 1,500 1,500 10
Mayuge - 14,600 14,600 104
Mbale - 109,505 109,505 782
Manafwa - 86,200 86,200 616
Mubende 59,750 79,000 138,750 991
Mbarara 36,000 36,000 257
Mukono 9,000 68,000 77,000 550
Nakaseke - 11,990 11,990 86
Nakasongola - 20,000 20,000 143
Nebbi - 92,400 92,400 660
Rakai - 60,000 31,000 221
Rukungiri - 16,000 16,000 114
Tororo 4,000 - 4,000 1
Wakiso 10,000 8,000 18,000 129
TOTAL 82,750 1,743,275 1,826,025 13,150
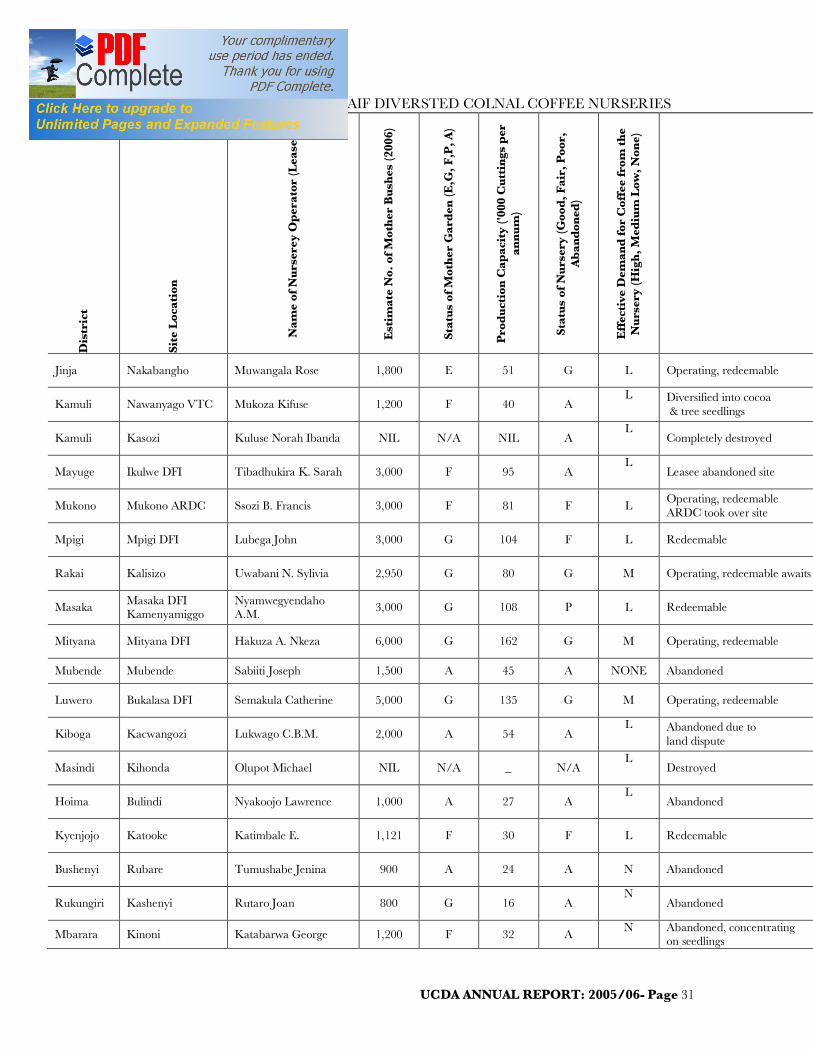
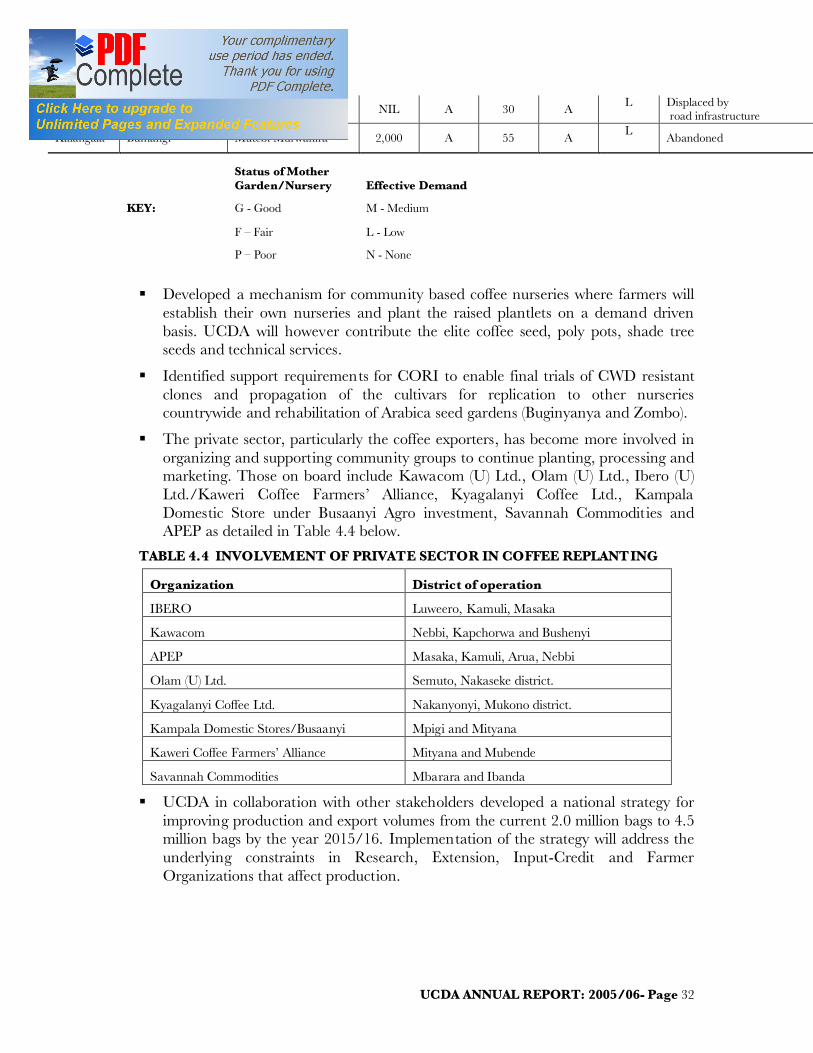
An Assessment of MAAIF divested Clonal coffee nurseries was carried out with the following results:- Out of the 20 nurseries 6 were still well maintained and operational, 12 were abandoned and overgrown but redeemable; and 3 were completely destroyed. There is therefore a good potential to bring many of them back into production to preserve the germplam.
UCDA ANNUAL REPORT: 2005/06- Page 31
TABLE 4.3 STATUS OF MAAIF DIVERSTED COLNAL COFFEE NURSERIES
Dis
tric
t
Site
Loc
atio
n
Nam
e of
Nur
sere
y O
per
ator
(Lea
see)
Est
imat
e N
o. o
f Mot
her
Bus
hes
(200
6)
Stat
us o
f Mot
her
Gar
den
(E,G
, F,P
, A)
Pro
duc
tion
Cap
acit
y ('
000
Cut
ting
s p
er
annu
m)
Stat
us o
f Nur
sery
(Goo
d, F
air,
Poo
r,
Ab
and
oned
)
Eff
ecti
ve D
eman
d fo
r C
offe
e fr
om t
he
Nur
sery
(Hig
h, M
ediu
m L
ow, N
one)
Jinja Nakabangho Muwangala Rose 1,800 E 51 G L Operating, redeemable
Kamuli Nawanyago VTC Mukoza Kifuse 1,200 F 40 A L Diversified into cocoa
& tree seedlings
Kamuli Kasozi Kuluse Norah Ibanda NIL N/A NIL A L
Completely destroyed
Mayuge Ikulwe DFI Tibadhukira K. Sarah 3,000 F 95 A L
Leasee abandoned site
Mukono Mukono ARDC Ssozi B. Francis 3,000 F 81 F L Operating, redeemable ARDC took over site
Mpigi Mpigi DFI Lubega John 3,000 G 104 F L Redeemable
Rakai Kalisizo Uwabani N. Sylivia 2,950 G 80 G M Operating, redeemable awaits
Masaka Masaka DFI Kamenyamiggo
Nyamwegyendaho A.M. 3,000 G 108 P L Redeemable
Mityana Mityana DFI Hakuza A. Nkeza 6,000 G 162 G M Operating, redeemable
Mubende Mubende Sabiiti Joseph 1,500 A 45 A NONE Abandoned
Luwero Bukalasa DFI Semakula Catherine 5,000 G 135 G M Operating, redeemable
Kiboga Kacwangozi Lukwago C.B.M. 2,000 A 54 A L Abandoned due to
land dispute
Masindi Kihonda Olupot Michael NIL N/A _ N/A L
Destroyed
Hoima Bulindi Nyakoojo Lawrence 1,000 A 27 A L
Abandoned
Kyenjojo Katooke Katimbale E. 1,121 F 30 F L Redeemable
Bushenyi Rubare Tumushabe Jenina 900 A 24 A N Abandoned
Rukungiri Kashenyi Rutaro Joan 800 G 16 A N
Abandoned
Mbarara Kinoni Katabarwa George 1,200 F 32 A N Abandoned, concentrating on seedlings
UCDA ANNUAL REPORT: 2005/06- Page 32
Kibale Kakumiro Tumwizere Emmanuel NIL A 30 A L Displaced by road infrastructure
Kalangala Bumangi Mutebi Murwanira 2,000 A 55 A L
Abandoned
Status of Mother Garden/Nursery Effective Demand
KEY: G - Good M - Medium
F – Fair L - Low
P – Poor N - None
§ Developed a mechanism for community based coffee nurseries where farmers will establish their own nurseries and plant the raised plantlets on a demand driven basis. UCDA will however contribute the elite coffee seed, poly pots, shade tree seeds and technical services.
§ Identified support requirements for CORI to enable final trials of CWD resistant clones and propagation of the cultivars for replication to other nurseries countrywide and rehabilitation of Arabica seed gardens (Buginyanya and Zombo).
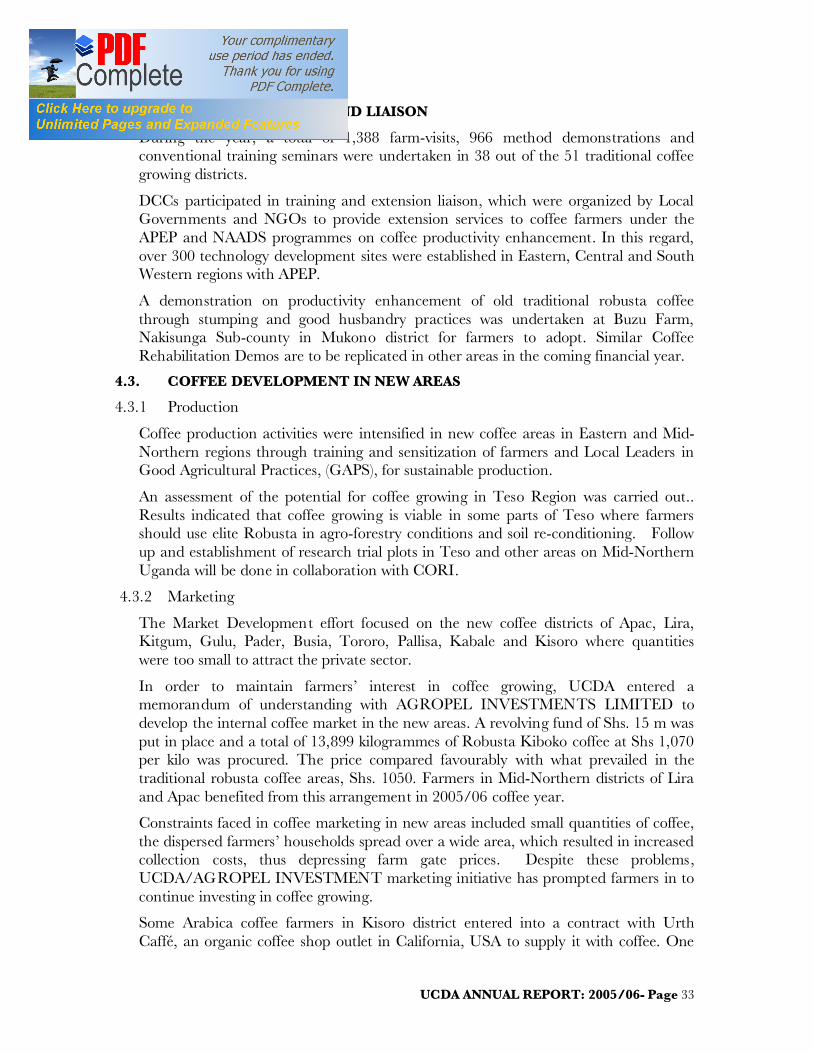
§ The private sector, particularly the coffee exporters, has become more involved in organizing and supporting community groups to continue planting, processing and marketing. Those on board include Kawacom (U) Ltd., Olam (U) Ltd., Ibero (U) Ltd./Kaweri Coffee Farmers’ Alliance, Kyagalanyi Coffee Ltd., Kampala Domestic Store under Busaanyi Agro investment, Savannah Commodities and APEP as detailed in Table 4.4 below.
TABLE 4.4 INVOLVEMENT OF PRIVATE SECTOR IN COFFEE REPLANTING
Organization District of operation
IBERO Luweero, Kamuli, Masaka
Kawacom Nebbi, Kapchorwa and Bushenyi
APEP Masaka, Kamuli, Arua, Nebbi
Olam (U) Ltd. Semuto, Nakaseke district.
Kyagalanyi Coffee Ltd. Nakanyonyi, Mukono district.
Kampala Domestic Stores/Busaanyi Mpigi and Mityana
Kaweri Coffee Farmers’ Alliance Mityana and Mubende
Savannah Commodities Mbarara and Ibanda
§ UCDA in collaboration with other stakeholders developed a national strategy for improving production and export volumes from the current 2.0 million bags to 4.5 million bags by the year 2015/16. Implementation of the strategy will address the underlying constraints in Research, Extension, Input-Credit and Farmer Organizations that affect production.
UCDA ANNUAL REPORT: 2005/06- Page 33
4.2 FARMER EXTENSION AND LIAISON
During the year, a total of 1,388 farm-visits, 966 method demonstrations and conventional training seminars were undertaken in 38 out of the 51 traditional coffee growing districts.
DCCs participated in training and extension liaison, which were organized by Local Governments and NGOs to provide extension services to coffee farmers under the APEP and NAADS programmes on coffee productivity enhancement. In this regard, over 300 technology development sites were established in Eastern, Central and South Western regions with APEP.
A demonstration on productivity enhancement of old traditional robusta coffee through stumping and good husbandry practices was undertaken at Buzu Farm, Nakisunga Sub-county in Mukono district for farmers to adopt. Similar Coffee Rehabilitation Demos are to be replicated in other areas in the coming financial year.
4.3. COFFEE DEVELOPMENT IN NEW AREAS
4.3.1 Production
Coffee production activities were intensified in new coffee areas in Eastern and Mid-Northern regions through training and sensitization of farmers and Local Leaders in Good Agricultural Practices, (GAPS), for sustainable production.
An assessment of the potential for coffee growing in Teso Region was carried out.. Results indicated that coffee growing is viable in some parts of Teso where farmers should use elite Robusta in agro-forestry conditions and soil re-conditioning. Follow up and establishment of research trial plots in Teso and other areas on Mid-Northern Uganda will be done in collaboration with CORI.
4.3.2 Marketing
The Market Development effort focused on the new coffee districts of Apac, Lira, Kitgum, Gulu, Pader, Busia, Tororo, Pallisa, Kabale and Kisoro where quantities were too small to attract the private sector.
In order to maintain farmers’ interest in coffee growing, UCDA entered a memorandum of understanding with AGROPEL INVESTMENTS LIMITED to develop the internal coffee market in the new areas. A revolving fund of Shs. 15 m was put in place and a total of 13,899 kilogrammes of Robusta Kiboko coffee at Shs 1,070 per kilo was procured. The price compared favourably with what prevailed in the traditional robusta coffee areas, Shs. 1050. Farmers in Mid-Northern districts of Lira and Apac benefited from this arrangement in 2005/06 coffee year.
Constraints faced in coffee marketing in new areas included small quantities of coffee, the dispersed farmers’ households spread over a wide area, which resulted in increased collection costs, thus depressing farm gate prices. Despite these problems, UCDA/AGROPEL INVESTMENT marketing initiative has prompted farmers in to continue investing in coffee growing.
Some Arabica coffee farmers in Kisoro district entered into a contract with Urth Caffé, an organic coffee shop outlet in California, USA to supply it with coffee. One
UCDA ANNUAL REPORT: 2005/06- Page 34
tonne was supplied at US$ 3.50 per kilo during the year. Internal domestic marketing of coffee from Kabale and Kisoro is however still at the embryo stage of development.
Use of mobile phone based SMS market information delivery mechanism was introduced to farmers in new areas as well. This facility provides prompt market information on coffee prices. It is envisaged to improve internal marketing and production.
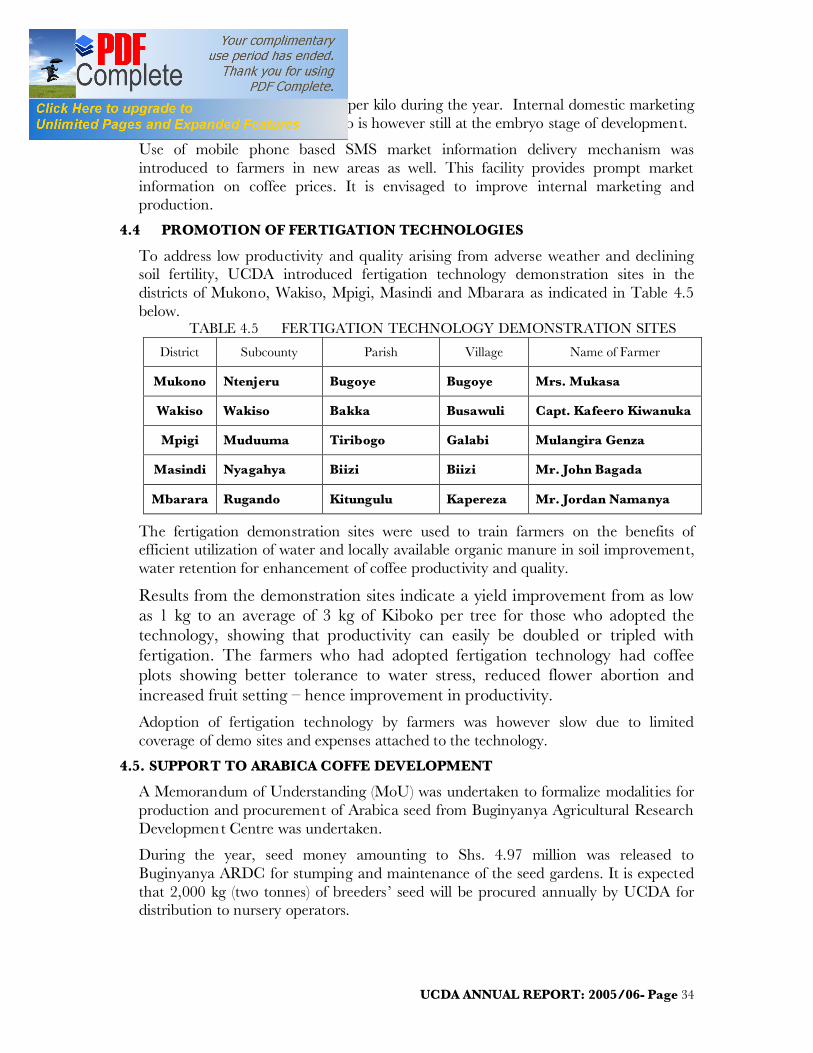
4.4 PROMOTION OF FERTIGATION TECHNOLOGIES
To address low productivity and quality arising from adverse weather and declining soil fertility, UCDA introduced fertigation technology demonstration sites in the districts of Mukono, Wakiso, Mpigi, Masindi and Mbarara as indicated in Table 4.5 below.
TABLE 4.5 FERTIGATION TECHNOLOGY DEMONSTRATION SITES
District Subcounty Parish Village Name of Farmer
Mukono Ntenjeru Bugoye Bugoye Mrs. Mukasa
Wakiso Wakiso Bakka Busawuli Capt. Kafeero Kiwanuka
Mpigi Muduuma Tiribogo Galabi Mulangira Genza
Masindi Nyagahya Biizi Biizi Mr. John Bagada
Mbarara Rugando Kitungulu Kapereza Mr. Jordan Namanya
The fertigation demonstration sites were used to train farmers on the benefits of efficient utilization of water and locally available organic manure in soil improvement, water retention for enhancement of coffee productivity and quality.
Results from the demonstration sites indicate a yield improvement from as low as 1 kg to an average of 3 kg of Kiboko per tree for those who adopted the technology, showing that productivity can easily be doubled or tripled with fertigation. The farmers who had adopted fertigation technology had coffee plots showing better tolerance to water stress, reduced flower abortion and increased fruit setting – hence improvement in productivity.
Adoption of fertigation technology by farmers was however slow due to limited coverage of demo sites and expenses attached to the technology.
4.5. SUPPORT TO ARABICA COFFE DEVELOPMENT
A Memorandum of Understanding (MoU) was undertaken to formalize modalities for production and procurement of Arabica seed from Buginyanya Agricultural Research Development Centre was undertaken.
During the year, seed money amounting to Shs. 4.97 million was released to Buginyanya ARDC for stumping and maintenance of the seed gardens. It is expected that 2,000 kg (two tonnes) of breeders ’ seed will be procured annually by UCDA for distribution to nursery operators.
UCDA ANNUAL REPORT: 2005/06- Page 35
In collaboration with CORI, on-farm trials for the new Arabica coffee variety (Tuza Arabica) continued to be promoted in the gazetted mid-altitude areas of the South Western districts of Bushenyi, Mbarara, Ntungamo, Rukungiri and Kanungu. Preliminary assessment of field results from Masaka and Bushenyi show that Tuzza Arabica has only one major season of about 6 months ranging from April to October. It is tolerant to drought and Coffee Wilt Disease. The yield range is (30-40) bags per hectare per year compared to an average of about (12-15) bags of parchment of traditional Arabica coffee under average management conditions.
Due to the good field performance, (mainly high productivity and resistance to pests and diseases) observed on farms in the above gazetted zone, many farmers in other traditionally Robusta areas particularly in the districts of Masaka, Luweero, Mpigi, Kabarole, Nakasongola and Eastern Uganda have expressed a lot of interest in planting the new Tuza Arabica. The challenge therefore remains on establishment of more on-farm trials in the interested districts and quickening cup analysis and market reactions to enable commercial growing based on good cup quality and market acceptability.
4.6. MONITORING AND EVALUATION OF THE REPLANTING PROGRAMME
Monitoring and Evaluation of the Replanting Programme continued to be undertaken, with an objective of receiving feedback from all the districts about the performance of coffee planted under the Government supported Strategic Export Programme (SEP), which started in 2001 and ended in 2004. It was also intended to seek views on how the programme could be revived.
The following were the major findings:
§ Most of coffee planted under this programme was bearing fruits. The average survival rate was 70%. The districts in eastern Uganda of Kapchorwa and Sironko had the highest survival rate in the range 80-90% while marginal areas of Lira and Apac had the lowest of between 50-60%.
§ The average reported yield of Kiboko coffee per hectare per year ranged between 2,500 kg to 5,000 kg, depending on the period of establishment and level of farm management.
§ The average reported income per household that carried out replanting ranged between Shs. 800,000/= to Shs. 1,200,000/= depending on acreage and type of coffee. Arabica farmers reported relatively high incomes per unit of production as a result of Arabica good prices.
§ Over the years, before the onset of the Coffee Wilt Disease the average annual Robusta production had been 2.7 million bags per year. By 2005/06 the Coffee Wilt Disease had cumulatively destroyed 52% of Robusta coffee. This meant that without replanting, the annual exports could have reduced in the same proportion by about 1.4 million bags, implying that replanting also accounted for about 1.4 million bags of the total of the 2 million bags exported during the 05/06 Coffee Year.
§ Coffee was still ranked as a major household income earner for coffee farmers.

UCDA ANNUAL REPORT: 2005/06- Page 36
§ The farmers continued to show willingness to plant coffee but were constrained by the generally low household incomes;
§ The Local Governments were willing to give the programme maximum support despite the limited resources at their disposal;
§ Other coffee multiplication and distribution models such as community based nurseries were seen as appropriate avenues for improving the efficiency and effectiveness of the replanting programme at farmers level;
§ It was suggested that the private sector (Coffee Exporters and Farmer Organizations) and NGOs be fully integrated as partners in the new coffee production strategy.
§ Intercropping and diversification were identified as coping mechanisms for farmers to remain in coffee and avoid the disappointments from other crops as was the case with Vanilla, Moringa and Aloe Vera.
§ Stakeholders requested Government to put in place a mechanism for providing sustainable funding of the Replanting Programme.
4.7 PESTS AND DISEASES IN ARABICA COFFEE GROWING AREAS
A comparative assessment of the effect of pests and diseases on Arabica coffee productivity was carried out in the districts of Mbale and Kapchorwa. Spraying resulted into a yield variation of 20 - 40% between farmers who sprayed and those who didn’t.
There was an improvement in general coffee practices as a result of remunerative farm gate prices during the past three years. Other factors observed that could be contributing to low productivity at farm level include poor soil conditions, limited use of fertilizers and insufficient agronomic practices.
The major challenge identified was lack of an effective input credit system to enable the farmers’ access the required chemicals.
4.8 THE COFFEE WIL DISEASE (CWD)
Surveillance and field diagnostic studies on the disease continued to be undertaken by UCDA, CORI and Extension workers to update on the cumulative infection levels since 1993.
Results indicated that the cumulative infection level of CWD since 1993 was estimated at 52% by 2005/06 of total Robusta area, which was initially estimated at 242,000 ha. or 300 million trees compared to 50% in 2004/05 coffee year, 47% in 2003/04 coffee year, 45% in 2002/03 coffee year and 42% in 2001/02 coffee year – (UCDA/CORI Baseline Surveys).
Compared to the previous years, the disease effect, year-on-year had been confirmed to be on a diminishing trend. In some districts, the earlier affected coffee trees had sprouted indicating some resistance build up against the disease. Year to year,

UCDA ANNUAL REPORT: 2005/06- Page 37
evidence showed that the rate of infection had remained at 2% in 2005/06 down from 3% in 2004/05 and 2.5% in 2003/04.
TABLE 4.6 CUMULATIVE COFFEE WILT DISEASE INFECTION LEVEL
Region/District Initial Area Cumulative Infection (%)
(Ha) 2001/02 2002/03 2003/04 2004/05 2005/06 Central Mukono 54,000 65.00 65.60 71.00 71.00 71.00 Luweero 20,000 60.00 62.50 68.20 68.2 68.2 Mpigi* 33,000 62.00 65.00 68.50 65.00 68.50 Rakai 8,000 5.00 6.50 12.00 6.50 12.00 Sembabule 3,500 10.00 12.45 18.00 12.45 18.00 Masaka 40,000 5.00 11.20 15.00 11.20 15.00 Kalangala 3,500 0.00 0.00 0.00 0.00 0.00 Western Mubende 21,000 58.00 58.80 67.30 67.30 67.30 Kiboga 10,000 50.00 54.20 68.20 68.20 68.20 Hoima 4,000 40.00 50.30 52.50 52.50 52.50 Masindi 2,100 35.00 45.00 47.50 47.50 47.50 Kabarole 2,500 65.00 66.20 67.20 67.20 67.20 Bundibugyo 1,500 82.00 90.00 90.00 90.00 90.00 Kibaale 5,000 45.00 55.00 65.50 65.50 65.50 South Western Mbarara 5,000 25.00 32.30 47.50 47.50 47.50 Bushenyi 6,000 25.00 30.40 48.20 48.20 48.20 Ntungamo 4,000 30.00 33.20 45.50 45.50 45.50 Rukungiri 3,000 55.00 56.90 68.50 68.50 68.50 Kabale 0.00 0.00 0.00 0.00 0.00 0.00 Kisoro 0.00 0.00 0.00 0.00 0.00 0.00 Eastern Jinja 5,000 10.00 22.85 30.00 31.00 33.00 Iganga 12,000 10.00 23.90 44.00 45.00 45.00 Kamuli 6,000 20.00 28.85 35.00 36.00 36.00 Mbale 16,000 0.00 0.00 0.00 0.00 0.00 Kapchorwa 6,000 0.00 0.00 0.00 0.00 0.00 North Western Arua 4,000 0.00 0.00 0.00 0.00 0.00 Nebbi 2,500 0.00 0.00 0.00 0.00 0.00 National Average 42.00 44.50 47.00 50.00 52.00
The cumulative infection level of 52% translates into 126,000 hectares of Robusta that have been lost to the disease. At an average yield of old Robusta taken of 550 kg of green coffee per hectare, this is equivalent to 69,000 tonnes of green coffee. At average export price of green coffee of $ 1,230 during the coffee season, this is equivalent to $ 85 m.
Yield and output simulations show that replanting has had an impact in the recent output levels by about 50% of which 44% is attributed to Clonal coffee and 6% to new Arabicas.
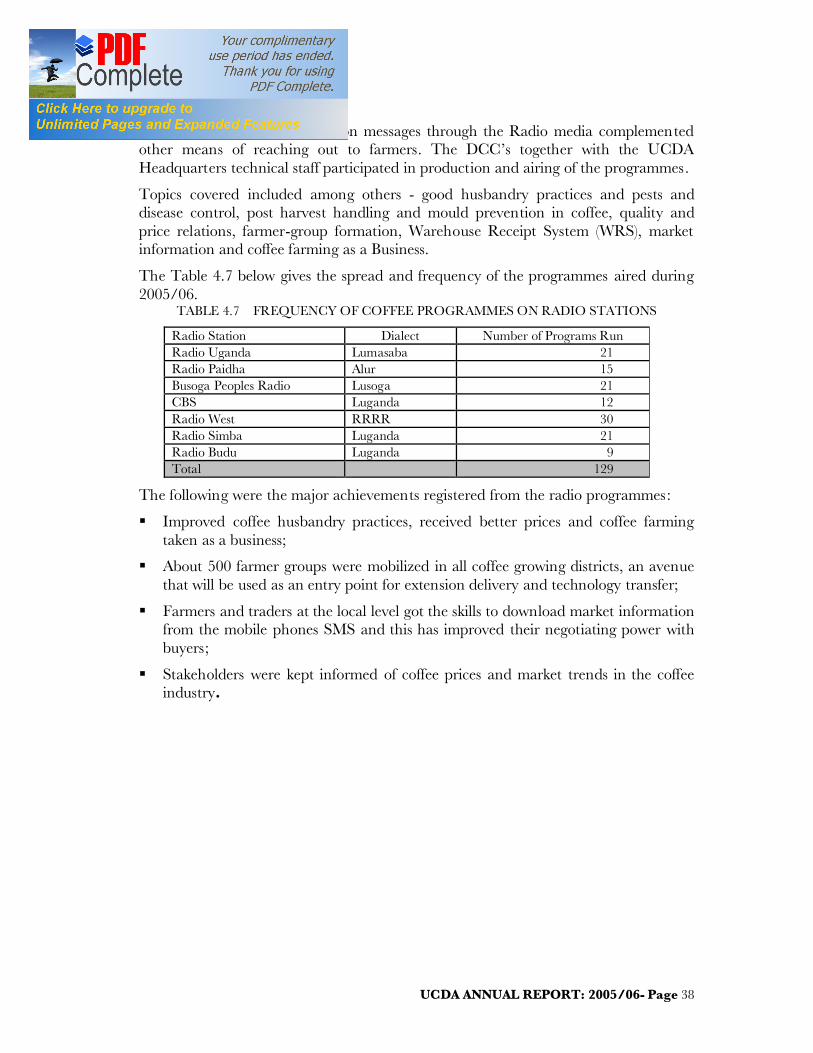
UCDA ANNUAL REPORT: 2005/06- Page 38
4.9. RADIO PROGRAMMES
Dissemination of coffee extension messages through the Radio media complemented other means of reaching out to farmers. The DCC’s together with the UCDA Headquarters technical staff participated in production and airing of the programmes.
Topics covered included among others - good husbandry practices and pests and disease control, post harvest handling and mould prevention in coffee, quality and price relations, farmer-group formation, Warehouse Receipt System (WRS), market information and coffee farming as a Business.
The Table 4.7 below gives the spread and frequency of the programmes aired during 2005/06.
TABLE 4.7 FREQUENCY OF COFFEE PROGRAMMES ON RADIO STATIONS
Radio Station Dialect Number of Programs Run Radio Uganda Lumasaba 21 Radio Paidha Alur 15 Busoga Peoples Radio Lusoga 21 CBS Luganda 12 Radio West RRRR 30 Radio Simba Luganda 21 Radio Budu Luganda 9 Total 129
The following were the major achievements registered from the radio programmes:
§ Improved coffee husbandry practices, received better prices and coffee farming taken as a business;
§ About 500 farmer groups were mobilized in all coffee growing districts, an avenue that will be used as an entry point for extension delivery and technology transfer;
§ Farmers and traders at the local level got the skills to download market information from the mobile phones SMS and this has improved their negotiating power with buyers;
§ Stakeholders were kept informed of coffee prices and market trends in the coffee industry.
UCDA ANNUAL REPORT: 2005/06- Page 39
Chapter Five
COFFEE RESEARCH
5.1 INTRODUCTION:
This chapter reports on various research undertakings and achievements by the Coffee Research Institute (CORI) of the National Agricultural Research Organization (NARO). As in the previous year, much of the activities still focused on addressing the problem of the coffee wilt disease (CWD) epidemic on Robusta coffee.
5.2 RESEARCH GOAL AND OBJECTIVES
The goal of coffee wilt disease research is to achieve sustainable increase in productivity of coffee for small holder farmers a by controlling spread and reducing impact of CWD.
The specific objectives of CWD research are to:
§ Quantify losses due to the CWD at farm and national level;
§ Understand the nature of the disease and its mechanisms of spread (Etiology, pathogenesis and epidemiology);
§ Identify sources of resistance to CWD through screening of local and foreign coffee germplasm;
§ Develop alternative coffee cultivars adaptable to traditional Robusta coffee growing areas (Lowland Arabica and Arabusta coffee cultivars);
§ Confer CWD resistance onto current commercial Robusta coffee lines through hybridization;
§ Evaluate effectiveness of available control measures, and to devise procedures for chemical and cultural control of CWD;
§ Rapidly multiply, transfer and distribute appropriate technologies to combat CWD and its effect; and
§ Conduct trainings and sensitization of stakeholders on the importance of CWD and the options available for its management.
5.3 RESEARCH FOCUS
The major areas of focus in coffee wilt disease research are:
i. Development and release of CWD resistant Robusta coffee lines;
ii. Development and release of lowland Arabica and Arabusta coffee lines;
iii. Development and transfer of appropriate technologies for combating CWD:
iv. Prevention of CWD spread by identifying the various sources and mechanisms of disease spread and incorporating findings into disease management strategies;
v. Adaptation trial for new Clonal varieties of Robusta coffee:
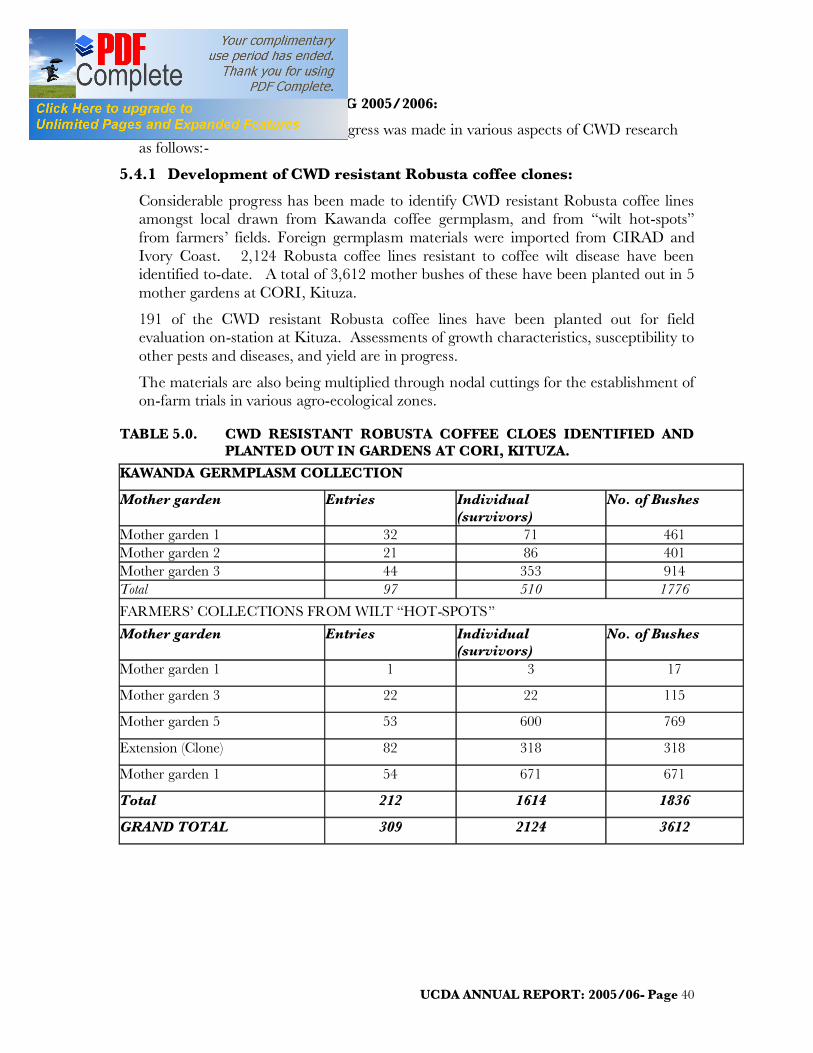
UCDA ANNUAL REPORT: 2005/06- Page 40
5.4 ACHIEVEMENTS DURING 2005/2006:
During the reporting period, progress was made in various aspects of CWD research as follows:-
5.4.1 Development of CWD resistant Robusta coffee clones:
Considerable progress has been made to identify CWD resistant Robusta coffee lines amongst local drawn from Kawanda coffee germplasm, and from “wilt hot-spots” from farmers’ fields. Foreign germplasm materials were imported from CIRAD and Ivory Coast. 2,124 Robusta coffee lines resistant to coffee wilt disease have been identified to-date. A total of 3,612 mother bushes of these have been planted out in 5 mother gardens at CORI, Kituza.
191 of the CWD resistant Robusta coffee lines have been planted out for field evaluation on-station at Kituza. Assessments of growth characteristics, susceptibility to other pests and diseases, and yield are in progress.
The materials are also being multiplied through nodal cuttings for the establishment of on-farm trials in various agro-ecological zones.
TABLE 5.0. CWD RESISTANT ROBUSTA COFFEE CLOES IDENTIFIED AND PLANTED OUT IN GARDENS AT CORI, KITUZA.
KAWANDA GERMPLASM COLLECTION
Mother garden Entries Individual (survivors)
No. of Bushes
Mother garden 1 32 71 461 Mother garden 2 21 86 401 Mother garden 3 44 353 914 Total 97 510 1776
FARMERS’ COLLECTIONS FROM WILT “HOT-SPOTS”
Mother garden Entries Individual (survivors)
No. of Bushes
Mother garden 1 1 3 17
Mother garden 3 22 22 115
Mother garden 5 53 600 769
Extension (Clone) 82 318 318
Mother garden 1 54 671 671
Total 212 1614 1836
GRAND TOTAL 309 2124 3612
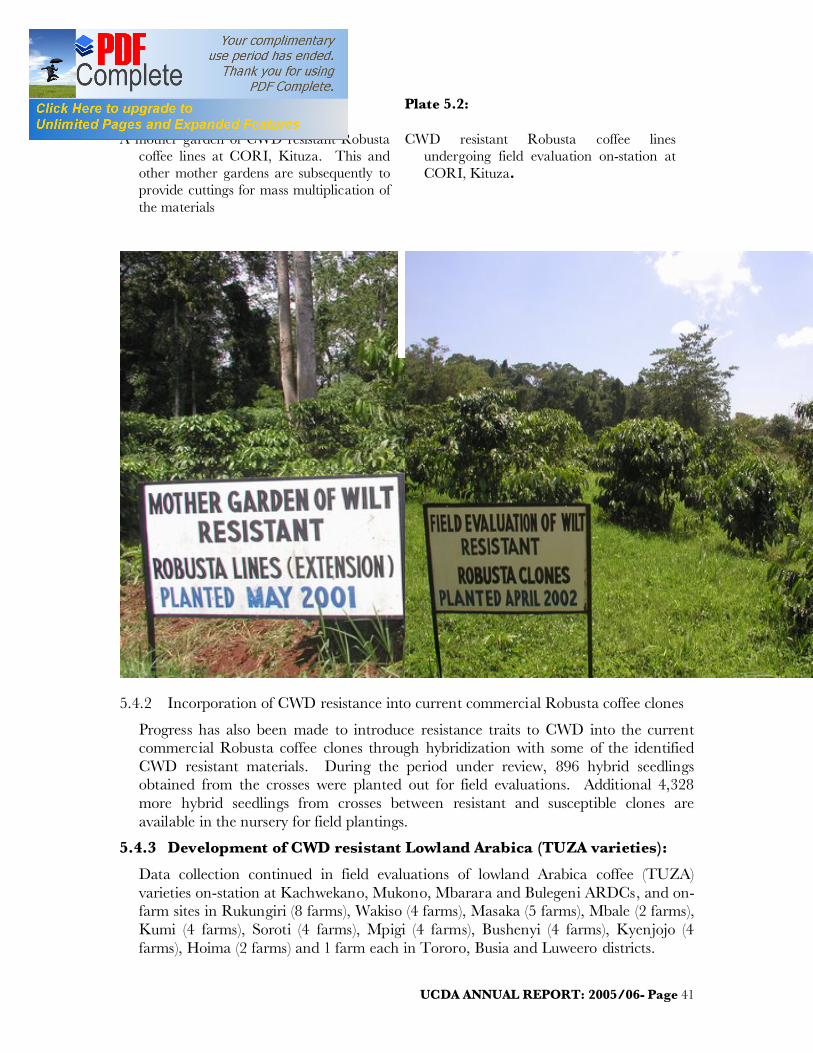
UCDA ANNUAL REPORT: 2005/06- Page 41
Figure 5.1:
A mother garden of CWD resistant Robusta coffee lines at CORI, Kituza. This and other mother gardens are subsequently to provide cuttings for mass multiplication of the materials
Plate 5.2:
CWD resistant Robusta coffee lines undergoing field evaluation on-station at CORI, Kituza.
5.4.2 Incorporation of CWD resistance into current commercial Robusta coffee clones
Progress has also been made to introduce resistance traits to CWD into the current commercial Robusta coffee clones through hybridization with some of the identified CWD resistant materials. During the period under review, 896 hybrid seedlings obtained from the crosses were planted out for field evaluations. Additional 4,328 more hybrid seedlings from crosses between resistant and susceptible clones are available in the nursery for field plantings.
5.4.3 Development of CWD resistant Lowland Arabica (TUZA varieties):
Data collection continued in field evaluations of lowland Arabica coffee (TUZA) varieties on-station at Kachwekano, Mukono, Mbarara and Bulegeni ARDCs, and on-farm sites in Rukungiri (8 farms), Wakiso (4 farms), Masaka (5 farms), Mbale (2 farms), Kumi (4 farms), Soroti (4 farms), Mpigi (4 farms), Bushenyi (4 farms), Kyenjojo (4 farms), Hoima (2 farms) and 1 farm each in Tororo, Busia and Luweero districts.
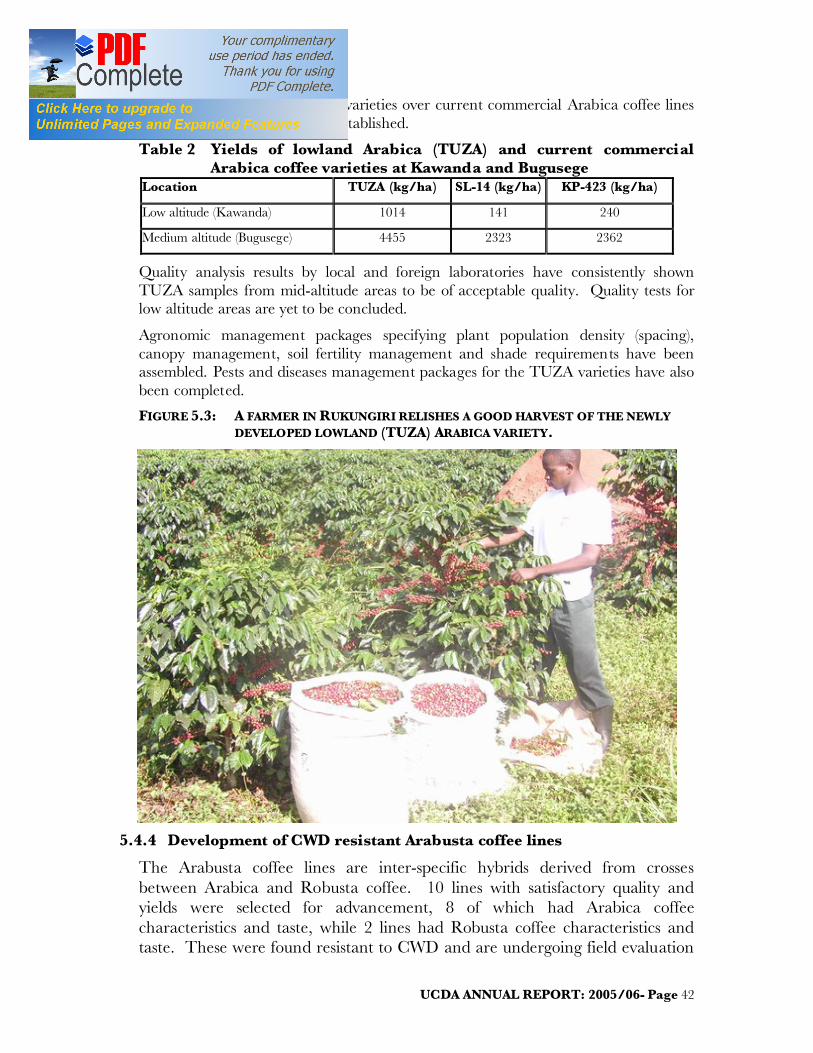
UCDA ANNUAL REPORT: 2005/06- Page 42
Yield advantages of the TUZA varieties over current commercial Arabica coffee lines (SL14 and KP 423) have been established.
Table 2 Yields of lowland Arabica (TUZA) and current commercial Arabica coffee varieties at Kawanda and Bugusege
Location TUZA (kg/ha) SL-14 (kg/ha) KP-423 (kg/ha)
Low altitude (Kawanda) 1014 141 240
Medium altitude (Bugusege) 4455 2323 2362
Quality analysis results by local and foreign laboratories have consistently shown TUZA samples from mid-altitude areas to be of acceptable quality. Quality tests for low altitude areas are yet to be concluded.
Agronomic management packages specifying plant population density (spacing), canopy management, soil fertility management and shade requirements have been assembled. Pests and diseases management packages for the TUZA varieties have also been completed.
FIGURE 5.3: A FARMER IN RUKUNGIRI RELISHES A GOOD HARVEST OF THE NEWLY DEVELOPED LOWLAND (TUZA) ARABICA VARIETY.
5.4.4 Development of CWD resistant Arabusta coffee lines
The Arabusta coffee lines are inter-specific hybrids derived from crosses between Arabica and Robusta coffee. 10 lines with satisfactory quality and yields were selected for advancement, 8 of which had Arabica coffee characteristics and taste, while 2 lines had Robusta coffee characteristics and taste. These were found resistant to CWD and are undergoing field evaluation
UCDA ANNUAL REPORT: 2005/06- Page 43
on-station at CORI and several locations on-farm in Kyenjojo, Bushenyi, Kanungu, Mubende, Luweero and Sironko districts.
During the reporting period, more field trials were established in Hoima and Kabale districts to cater for their respective agro-ecological conditions. Data were collected at all sites, and are undergoing analysis.
5.4.5 Development of other Arabica coffee lines:
The development of Arabica coffee lines that are resistant to coffee berry disease (CBD) and coffee leaf rust through hybridization of current commercial Arabica lines (SL14 and KP423) with catimors have continued. Activities during the reporting period concentrated mostly on selection of parental combinations with desired complementary attributes, controlled crosses, propagation and evaluation of hybrid progenies.
146 Arabica hybrids have been developed to-date and are undergoing evaluation on-station at Kituza, Bugusege and Bulengeni.
5.4.6 Prevention of CWD spread through establishment of sources and mechanisms of its spread
Considerable progress was made to understand the nature of the coffee wilt disease in order to develop appropriate measures to control its incidence and spread.
During the period, no alternate hosts or vectors of CWD have been identified. Stems, branches, leaves, roots and coffee husks from infected plants, and infected seedlings have been confirmed as primary sources of CWD infection. It has also been confirmed that plant parts provide the mechanism for survival of F. xylarioides, while the pathogen has been shown that its survival outside the host is quite low.
Under field conditions, the pathogen does not survive for more than one year, therefore replanting of previously infected plots can be done after one year on condition that stumps have removed. It was also experimentally confirmed that infected farm tools such as machetes transmit CWD.
A serological method for CWD detection using molecular and immunological techniques has been developed. This will greatly reduce the time and costs of CWD detection in infected plant parts and soils.
5.4.7 Evaluation of marigolds and Pseudomonas bacterial for suppression of CWD incidence in coffee fields (Biological CWD control)
Studies to investigate the effective of marigolds and Pseudomonas for biological CWD control was conducted in-vitro using marigold extracts and Pseudomonas cultures in bio-assays, and under controlled conditions using marigold plantings and Pseudomonas sprays in the screen house. In both instances, marigolds and Pseudomonas bacteria were found to suppress CWD incidence. CWD occurrence was however not prevented in either case. The efficacies are to be further investigated under field conditions.
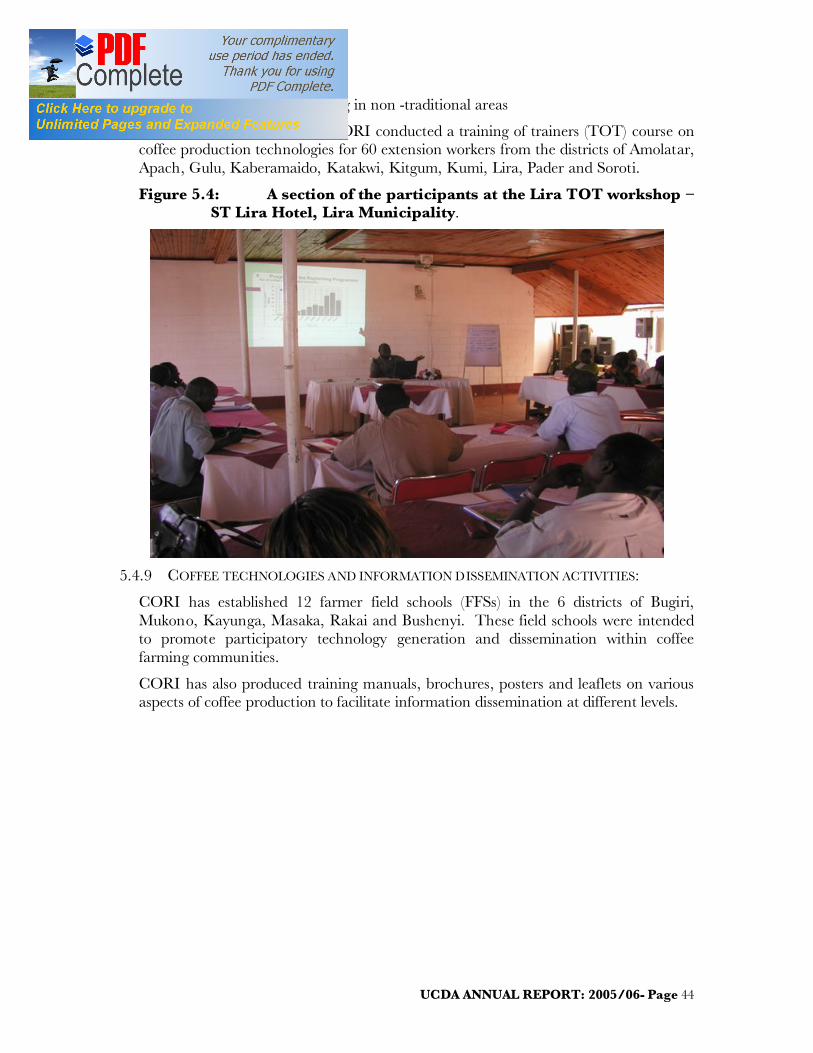
UCDA ANNUAL REPORT: 2005/06- Page 44
5.4.8 Promotion of coffee growing in non -traditional areas
During the reporting period, CORI conducted a training of trainers (TOT) course on coffee production technologies for 60 extension workers from the districts of Amolatar, Apach, Gulu, Kaberamaido, Katakwi, Kitgum, Kumi, Lira, Pader and Soroti.
Figure 5.4: A section of the participants at the Lira TOT workshop – ST Lira Hotel, Lira Municipality.
5.4.9 COFFEE TECHNOLOGIES AND INFORMATION DISSEMINATION ACTIVITIES:
CORI has established 12 farmer field schools (FFSs) in the 6 districts of Bugiri, Mukono, Kayunga, Masaka, Rakai and Bushenyi. These field schools were intended to promote participatory technology generation and dissemination within coffee farming communities.
CORI has also produced training manuals, brochures, posters and leaflets on various aspects of coffee production to facilitate information dissemination at different levels.
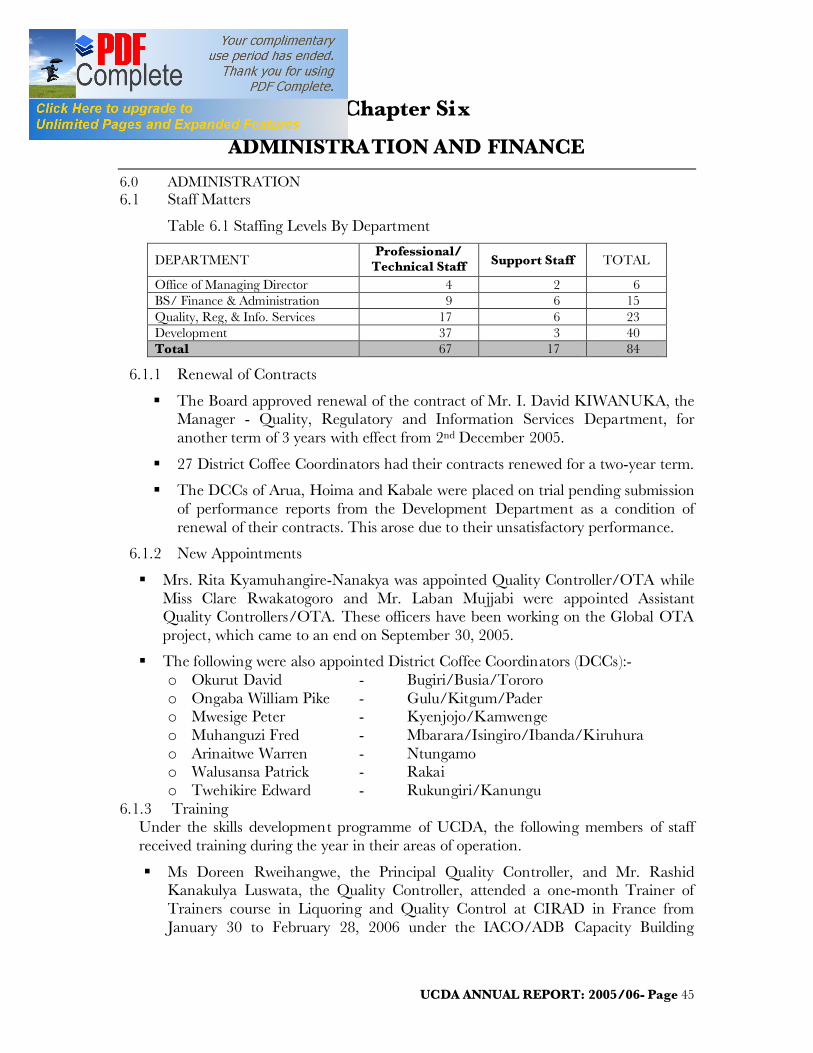
UCDA ANNUAL REPORT: 2005/06- Page 45
Chapter Six
ADMINISTRATION AND FINANCE 6.0 ADMINISTRATION 6.1 Staff Matters
Table 6.1 Staffing Levels By Department
DEPARTMENT Professional/
Technical Staff Support Staff TOTAL
Office of Managing Director 4 2 6 BS/ Finance & Administration 9 6 15 Quality, Reg, & Info. Services 17 6 23 Development 37 3 40 Total 67 17 84
6.1.1 Renewal of Contracts
§ The Board approved renewal of the contract of Mr. I. David KIWANUKA, the Manager - Quality, Regulatory and Information Services Department, for another term of 3 years with effect from 2nd December 2005.
§ 27 District Coffee Coordinators had their contracts renewed for a two-year term.
§ The DCCs of Arua, Hoima and Kabale were placed on trial pending submission of performance reports from the Development Department as a condition of renewal of their contracts. This arose due to their unsatisfactory performance.
6.1.2 New Appointments
§ Mrs. Rita Kyamuhangire-Nanakya was appointed Quality Controller/OTA while Miss Clare Rwakatogoro and Mr. Laban Mujjabi were appointed Assistant Quality Controllers/OTA. These officers have been working on the Global OTA project, which came to an end on September 30, 2005.
§ The following were also appointed District Coffee Coordinators (DCCs):- o Okurut David - Bugiri/Busia/Tororo o Ongaba William Pike - Gulu/Kitgum/Pader o Mwesige Peter - Kyenjojo/Kamwenge o Muhanguzi Fred - Mbarara/Isingiro/Ibanda/Kiruhura o Arinaitwe Warren - Ntungamo o Walusansa Patrick - Rakai o Twehikire Edward - Rukungiri/Kanungu
6.1.3 Training Under the skills development programme of UCDA, the following members of staff received training during the year in their areas of operation.
§ Ms Doreen Rweihangwe, the Principal Quality Controller, and Mr. Rashid Kanakulya Luswata, the Quality Controller, attended a one-month Trainer of Trainers course in Liquoring and Quality Control at CIRAD in France from January 30 to February 28, 2006 under the IACO/ADB Capacity Building
UCDA ANNUAL REPORT: 2005/06- Page 46
Project. These officers are to train Coffee Quality Controllers in Eastern Africa – Kenya, Tanzania, Rwanda, Ethiopia and Uganda.
§ Ms Joan Katumba attended a Customer Care Course organized by Uganda Manufacturers’ Association.
§ Mr. Edmund Kananura – Senior Quality Controller participated in the training on "improvement of organoleptic quality of African Robusta through selected markets" project. UCDA is a member of the project together with CORI, CIRAD France, and Seville University.
6.1.4 Study Tours and Workshops
The following members of staff undertook study tours to build capacity to improve of the performance of UCDA and the coffee sub sector as a whole: -
§ Mr. Julius Madira – PMEO and Mr. Ezra Munyambonera – Principal Research Officer, visited coffee farmers in Northern Peru, who are organised under Central Piurana de Cafeterelos (CEPICAFE), to study the different certification systems for the coffee specialty market segments. The study established that production of coffee for the specialty markets was feasible subject to critical volumes.
§ Mr. James Kizito – Mayanja – PMA, visited Pinhal and Sao Paolo in Brazil, to understudy strategies used to increase domestic coffee consumption. The tour established that the coffee industry in Brazil was highly mechanized. Several strategies to improve the level of domestic coffee consumption such as targeted training were in place on top of high-level technology for coffee roasting.
6.1.5 Management Meetings
Management continued to hold regular meetings aimed at reviewing the performance of the annual work plans. The names of the UCDA Senior staff are as listed in the table below.
Table 6.2 List of Senior Members of Staff
No Name Title 1 Mr. H. Ngabirano Managing Director 2 Mr. F. Luzinda-Mukasa Board Secretary/Head of Finance and Administration 3 Mr. I. David KIWANUKA Quality, Regulatory & Information Services Manager 4 Mr. E.S. Lutaakome Ag Development Manager 5 Mr. M. S Wasswa Principal Administration Officer 6 Mr. J. Madira Principal Monitoring and Evaluation Officer 7 Mr. H. Tayebwa Principal Accountant 8 Mr. F. Sewaya Principal Research Officer 9 Mr. A. Kamugisha Principal Development Officer 10 Mr. J. M. Kizito Principal Market Analyst 11 Ms. D. Rweihangwe Principal Quality Controller 12 Mr. J. Luswata Principal Technical Officer 13 Mr. E Munyambonera Principal Research Officer 13 Mr. E Kananura Senior Quality Controller 15 Mr. E Ayiga Senior Technical Officer 16 Mr. William Rugadya Senior Auditor
UCDA ANNUAL REPORT: 2005/06- Page 47
Nineteen meetings were held of which 12 were the regular monthly meetings, 4 extraordinary and 3 for the budget process. And there were three general staff meetings were also held during the year.
6.1.6 Resignations
A total of 7 officers left the services of UCDA as indicated below:
§ Mr. George Lukwago - Development Manager, Mr. Dick Wadada - Senior Quality Controller, Mr. Richard Mukasa - Quality Controller and Mrs. Albertina Kakuba - Quality Controller resigned to take up other challenging jobs.
§ The DCC for Kamuli, Mr. Galisansana Vincent resigned to take up a political office as Vice Chairman of the District and Mr. Kennedy Senoga, the DCC Rakai took up another job with Kaweri Coffee Farmers Alliance (KCFA), Mr. Frank Twebaze the DCC for Kyenjojo, left for further studies.
6.2 VALUE ADDITION
6.2.1 China Joint Venture
§ The process of registering the company in which Uganda holds majority shares (99%) was completed. Mr. Solomon Rutega, the General Manager, was also granted diplomatic status.
§ Activities of the joint venture were further consolidated by opening an office in Shanghai to coordinate its operations.
§ The roasting factory owned by the venture was ISO 9001 certified for quality and became the second factory to be certified in Beijing.
§ Roasted Uganda coffee is now served in 23 outlets in Beijing and Shanghai.
§ Over 600 metric tonnes of Uganda coffee have been shipped to China by the private sector to-date.
6.2.2 Egypt
§ Over 30 metric tonnes of coffee were bought by the venture during the year and the outlets serving Uganda coffee have increased to 25.
6.2.3 Denmark
§ The operations of the Joint Venture in Denmark were transferred to Uganda; and a roasting factory was established at Bugolobi within the former Coffee Marketing Board premises, the Tri-Star.
§ As result of a survey conducted by the Joint Venture coffee produced under the brand of ‘One Café’ is being produced in Tororo by Elgonia Industries in conjunction with One Café International of Denmark.
6.2.4 Soluble Coffee
§ A Memorandum of Understanding (MoU) was signed with Libya, and a feasibility study was commissioned. The feasibility study showed that the manufacture of soluble coffee was viable.
UCDA ANNUAL REPORT: 2005/06- Page 48
§ TATA Group of Companies from India was involved in discussions with Ugandan officials over a similar venture, with assistance of UCDA and signed an agreement to establish as spray-dried coffee plant of 3,600 tonnes in Uganda in Jinja district.
6.2.5 Other Value Addition Efforts
The following value addition efforts were registered during the year by the private sector:
§ Rwenzori Commodities produced the 1st Ugandan Freeze-dried Coffee Brand ‘African Coffee 100% Arabica’ for its marketing outlets in the UK and South Africa.
§ A coffee brand ‘One Café’ produced by Elgonia Industries in Tororo started producing roast & ground coffee for export; and Elgonia Industries won the Local international Award for innovative Packaging.
§ Zigoti Coffee established an outlet in Nagoya, Japan that serves ready to drink and roasted coffee to Japanese Nationals.
§ Gumutindo coffee been developed as a single origin brand and placed on shelves in UK and Germany by Café Direct.
§ Three new World Class cafes: Rwenzori Coffee Shop, Bold Win’s Café, and Café PAP were opened up in Kampala to boost domestic coffee consumption. This brings the number of such Cafés in Kampala to five after Bancafé and 1000 cups.
§ Kawacom (U) Ltd. Won the Presidential Gold Award 2005, for being the best coffee exporting company, at a function organised by Uganda Export Promotion Board (UEPB). They also won themselves a ticket to China to explore trading opportunities.
6.3 INTERNATIONAL MEETINGS
§ IACO
The 45th IACO General Assembly took place on November 20 – 25, 2005 in Abidjan under the chairmanship of Mr. Paul Antone Bohoun Boubare, Minister of the Economy and Finance in Cote d’ivoire. The Assembly run concurrently with the 6th Africa Coffee Research Network Annual General meeting. The General Assembly chose Ethiopia for the next Chairmanship, and Addis Ababa as the venue for the 2006 meeting ACRN undertook to compile and circulate the findings on OTA to members for the benefit of policy makers. The UCDA board Secretary Mr. Fred Luzinda Mukasa and Principal Quality Controller Ms. Doreen Rweihangwe represented Uganda at the meetings.
The 2nd meeting of the Steering Committee on capacity building under ADB/IACO arrangement, chaired by Mme. Josefa SACKO, the IACO Secretary General, also took place in Abidjan on November 22, 05. Uganda along with Cote d’Ivoire, Cameroon and Zambia were chosen as the Regional training centres to cater for coffee growers’ training needs.
UCDA ANNUAL REPORT: 2005/06- Page 49
§ AGOA
The Managing Director - UCDA, Ambassador Kabonero and Mrs. Susan Muhwezi, the Special Presidential advisor on AGOA, visited URTH CAFFE Company, to concretize plans to promote Uganda coffee in Los Angeles, California. A promotion strategy drawing heavily on the support of business chambers, celebrities in television and film industries, as well as music, sports and churches in Los Angeles to promote the product around the theme of eco - tourism, was developed. Urth Caffe serves more than 6,000 clients per day at its outlets in California, some of whom will be attracted to visit the proposed eco – lodge in Kisoro district.
§ EAFCA
UCDA participated in the 3rd EAFCA conference and exhibition held at Ngurdoto Mountain Lodge in Arusha, Tanzania during February 14 -18, 2006. Dr. Ali Mohammed Shein, the Vice President of The Republic of Tanzania Opened the conference.
Dr. Ogwang, the Ag. Director of CORI and member of the UCDA BOD, together with Dr. Hakiza, gave presentations on the progress of coffee research with particular emphasis on coffee wilt disease, at the 2nd Scientific Conference held at Arusha. Ambassador Ali Mchomo, the CFC Managing Director, who gave the keynote address, highlighted the opportunities for commodity driven industrialization of the African coffee sector. The conference stressed the need for traceability and sustainability as a way of ensuring food safety and health, value for money, consistency of the cup, market sensitivity i.e. having thorough knowledge of consumers’ tastes and preferences.
Other participants from Uganda included; Mr. Yorokam Abainenamar, a member of the UCDA BOD, Mr. Kizito Mayanja of UCDA, Mr. David Barry of Kyagalanyi Coffee Ltd., Mukono district, Mr. Allan Tullip of Kawacom (U) Ltd and Messrs Luigi Giainnazzi and Dick Wadada of MTL Ltd. of Mbale.
§ Uganda North America association Convention 2006
UCDA participated in the Uganda North America association Convention 2006, which took place in New York. Uganda coffee was availed to the convention goers throughout the period by Nile commodities, Inc., one of the leading manufacturers of corporate brand coffee. Nile Commodities, Inc. also packs for wholesalers and retailers in the USA, Canada and UK.
6.4 LOCAL VISITS, WORKSHOPS AND TRAINING
§ UCDA in conjunction with the Agricultural Productivity Enhancement Project (APEP), held a Stakeholders’ workshop on November 10, 2005,in Kampala. The workshop aimed at reviewing APEP 2006 coffee programmes and to chart a way forward for the industry. The Government of Uganda was requested to commit itself to the revival of the coffee replanting programme in a bid to replace the diseased and wilted coffee trees.
§ UCDA management addressed participants at the 3rd Conference of Ugandan Ambassadors and High Commissioners, held in Kampala on 12th January 2006,

UCDA ANNUAL REPORT: 2005/06- Page 50
on various matters in the coffee sub – sector. The Ambassadors resolved to promote Uganda coffee in their respective countries of accreditation.
§ Six Quality Controllers attended training sessions in analysis of samples using the High Performance Liquid Chromatography (HPLC), and verification of the Quality Assurance System and the standard operating procedures for carrying out mycotoxin analysis in April 2006. The training was conducted by Dr. Vargas Eugenia and Eliena Santos from the Department of Quality Control and Food Supply in Brazil.
§ UCDA participated in a fair – trade and UTZ Kapeh workshop that was organised by the National Organic Agricultural Movement of Uganda (NOGAMU) in May 2006. The workshop mainly concentrated on the code of conduct, which is based on the 3 pillars of sustainability - economic, social and environmental.
§ Coffee Stakeholders in Uganda were involved in workshops in June, to discuss developments in the sub – sector. YCDA and Café Africa an
6.5 Debt Collection
6.5.1 CESS Debtors
CESS debtors were reduced to a minimum reflecting balances of the active exporters save for the core of Shs 82 m of dormant balances that have been referred to court for invoking the performance bonds.
6.5.2 Rent Debtors
Rent debtors have been reduced from a gross figure of Shs 200m to Shs 100m during the year. Management is applying more effort in order to minimize the amount.
6.6 Assets Management
6.6.1 Vehicles
§ UCDA retired the lease for Isuzu pick-ups Reg. Nos. UAF 735 B and UAF 637 C earlier secured from Dfcu Limited.
§ A new station wagon was secured under a lease arrangement from DFCU limited.
§ Mitsubishi pick – up Reg 763 UDU and 130 UBN were disposed off through competitive bidding. Nissan Patrol 902 UCS is yet to find a buyer.
§ A process to procure two new pick ups was initiated.
6.6.2 Land and Buildings
The programme to upgrade residential properties for better income is ongoing.
§ Plot 42 Windsor Crescent, Kololo
Work on Plot 42 Windsor crescent Kololo was completed, and the premises were rented out to M/S Land ‘O’ Lakes Inc., with effect from 1ST March 2006, for an initial period of 3 years.
UCDA ANNUAL REPORT: 2005/06- Page 51
§ Plot 9/11 Baskerville Avenue, Kololo
Management has already initiated plans to have the above property redeveloped. Preliminary work will start as soon as funding sources have been identified.
§ Other Properties
Routine maintenance continued for other properties, which retained full occupancy.
6.7 BOD ACTIVITIES
6.7.1 Field Visits
Members of the Board of Directors visited the Districts of Wakiso, Mukono, Jinja, Tororo, Mbale, Sironko and Kapchorwa in January 2006 to acquaint themselves with the progress of the coffee projects in these districts. The projects include: -
§ Bukenya Estate at Manyangwa Gayaza, Wakiso district, and MTL in Mbale who recently rehabilitated washing stations. Victoria Coffees Ltd. at Naggalama Mukono district, are still in process.
§ Kyagalanyi coffee Ltd. with an initiative of involving farmers in an out growers’ scheme to feed the wet processing factory at Nakanyonyi Mukono district.
§ A fertigation demonstration site in Ntenjeru Mukono district and a coffee nursery at Nakabango Jinja district.
§ Shire International Coffee roasting factory in Tororo.
§ Elgonia Coffee Roasters who were in advanced stages of implementing a joint venture arrangement with Danish coffee roasters.
§ CORI Kituza in Mukono and Buginyanya coffee research station.
The following were identified as areas where action was required: -
§ Deliberate effort made to establish coffee villages around wet processing factories to accord them enough catchment areas for supply of cherry.
§ Coffee exporters should be encouraged to support coffee production and reduce poverty through community initiatives like the one started by Kyagalanyi Coffee Ltd. at Nakanyonyi, Mukono District. One way of doing this could be to interest them into taking over the MAAIF divested nurseries.
§ There was need to support private entrepreneurs in the bid to revive wet mills, through loan guarantees both for completion of civil works and crop finance.
§ More support to coffee research should be emphasized.
§ Funds should be provided for the revival of the MAAIF divested coffee nurseries as one of the means to re–ignite the replanting program.
§ Emphasize good agricultural practices such as mulching, application of manure, and planting of shade trees for marginal and new coffee areas such as Tororo District.
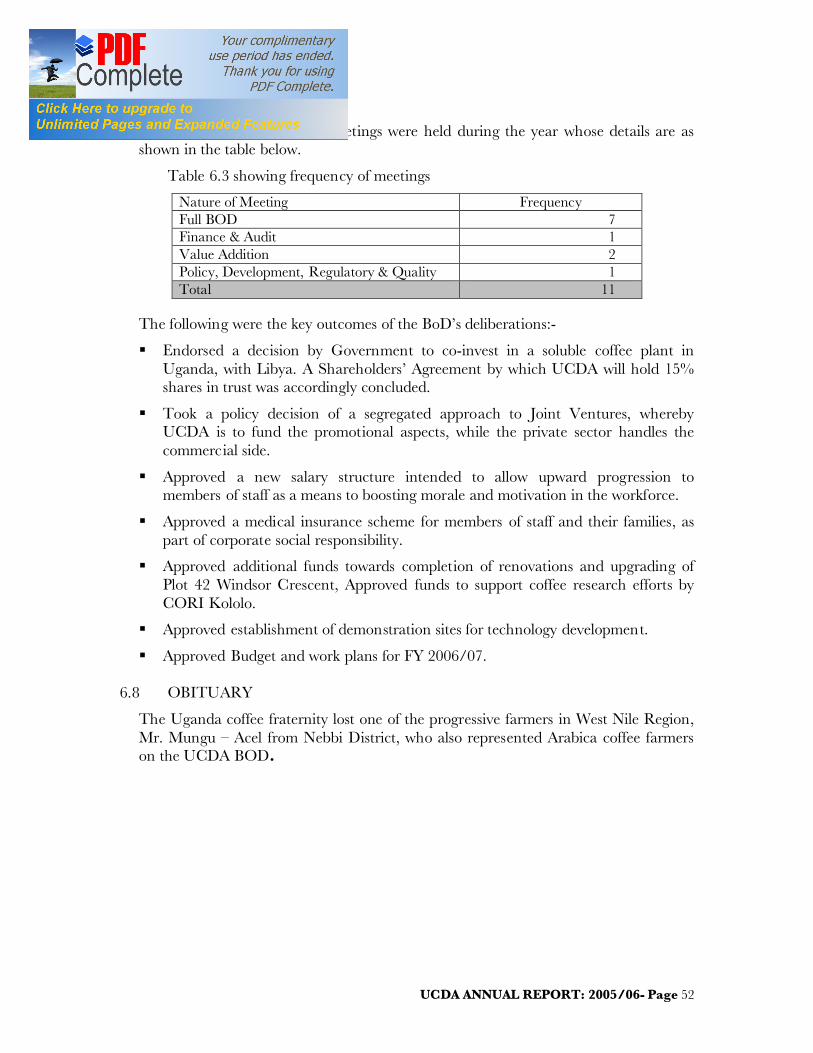
UCDA ANNUAL REPORT: 2005/06- Page 52
6.7.2 Meetings
A total of 11 UCDA Board meetings were held during the year whose details are as shown in the table below.
Table 6.3 showing frequency of meetings
Nature of Meeting Frequency Full BOD 7 Finance & Audit 1 Value Addition 2 Policy, Development, Regulatory & Quality 1 Total 11
The following were the key outcomes of the BoD’s deliberations:-
§ Endorsed a decision by Government to co-invest in a soluble coffee plant in Uganda, with Libya. A Shareholders’ Agreement by which UCDA will hold 15% shares in trust was accordingly concluded.
§ Took a policy decision of a segregated approach to Joint Ventures, whereby UCDA is to fund the promotional aspects, while the private sector handles the commercial side.
§ Approved a new salary structure intended to allow upward progression to members of staff as a means to boosting morale and motivation in the workforce.
§ Approved a medical insurance scheme for members of staff and their families, as part of corporate social responsibility.
§ Approved additional funds towards completion of renovations and upgrading of Plot 42 Windsor Crescent, Approved funds to support coffee research efforts by CORI Kololo.
§ Approved establishment of demonstration sites for technology development.
§ Approved Budget and work plans for FY 2006/07. 6.8 OBITUARY
The Uganda coffee fraternity lost one of the progressive farmers in West Nile Region, Mr. Mungu – Acel from Nebbi District, who also represented Arabica coffee farmers on the UCDA BOD.
UCDA ANNUAL REPORT: 2005/06- Page 53
STATISTICAL APPENDICES
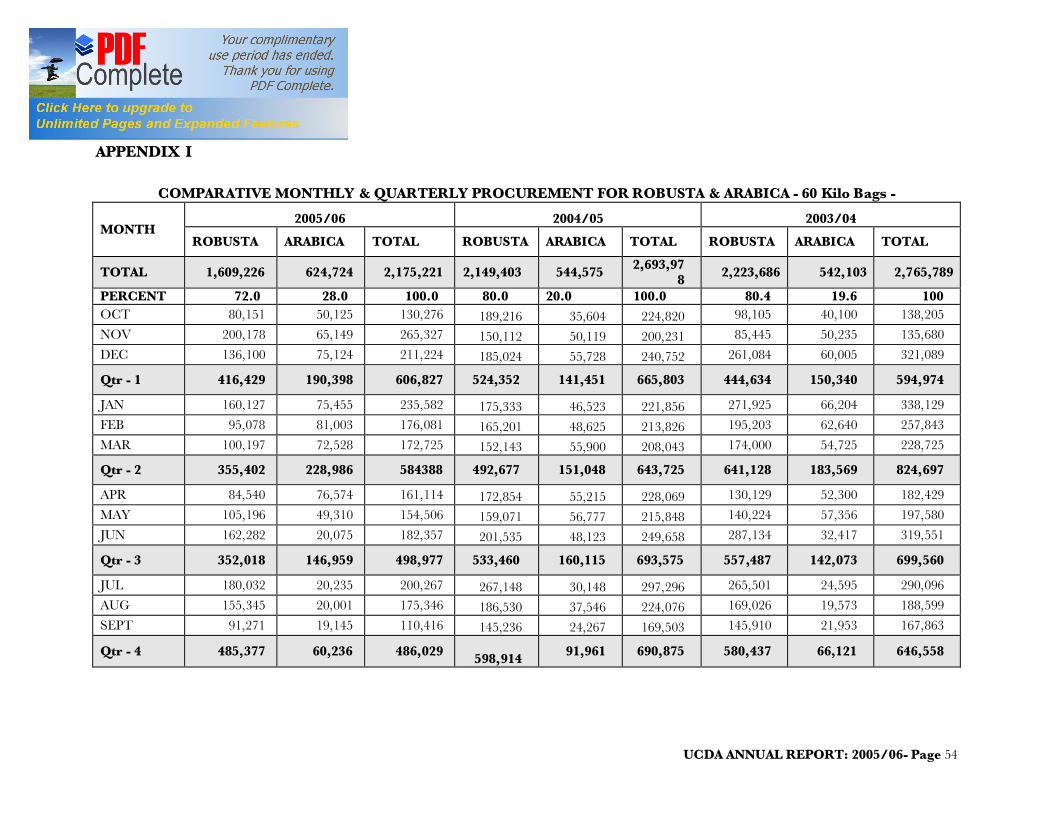
UCDA ANNUAL REPORT: 2005/06- Page 54
APPENDIX I
COMPARATIVE MONTHLY & QUARTERLY PROCUREMENT FOR ROBUSTA & ARABICA - 60 Kilo Bags -
MONTH 2005/06 2004/05 2003/04
ROBUSTA ARABICA TOTAL ROBUSTA ARABICA TOTAL ROBUSTA ARABICA TOTAL
TOTAL 1,609,226 624,724 2,175,221 2,149,403 544,575 2,693,978 2,223,686 542,103 2,765,789
PERCENT 72.0 28.0 100.0 80.0 20.0 100.0 80.4 19.6 100 OCT 80,151 50,125 130,276 189,216 35,604 224,820 98,105 40,100 138,205
NOV 200,178 65,149 265,327 150,112 50,119 200,231 85,445 50,235 135,680
DEC 136,100 75,124 211,224 185,024 55,728 240,752 261,084 60,005 321,089
Qtr - 1 416,429 190,398 606,827 524,352 141,451 665,803 444,634 150,340 594,974
JAN 160,127 75,455 235,582 175,333 46,523 221,856 271,925 66,204 338,129
FEB 95,078 81,003 176,081 165,201 48,625 213,826 195,203 62,640 257,843
MAR 100,197 72,528 172,725 152,143 55,900 208,043 174,000 54,725 228,725
Qtr - 2 355,402 228,986 584388 492,677 151,048 643,725 641,128 183,569 824,697
APR 84,540 76,574 161,114 172,854 55,215 228,069 130,129 52,300 182,429
MAY 105,196 49,310 154,506 159,071 56,777 215,848 140,224 57,356 197,580
JUN 162,282 20,075 182,357 201,535 48,123 249,658 287,134 32,417 319,551
Qtr - 3 352,018 146,959 498,977 533,460 160,115 693,575 557,487 142,073 699,560
JUL 180,032 20,235 200,267 267,148 30,148 297,296 265,501 24,595 290,096
AUG 155,345 20,001 175,346 186,530 37,546 224,076 169,026 19,573 188,599
SEPT 91,271 19,145 110,416 145,236 24,267 169,503 145,910 21,953 167,863
Qtr - 4 485,377 60,236 486,029 598,914 91,961 690,875 580,437 66,121 646,558

UCDA ANNUAL REPORT: 2005/06- Page 55
APPENDIX II
COMPARATIVE MONTHLY & QUARTERLY EXPORT FIGURES BY TYPE: ROBUSTA & ARABICA - 60-Kilo Bags - MONTH 2005/06 2004/05 2003/04
Robusta Arabica Total Robusta Arabica Total Robusta Arabica Total
TOTAL 1,408,314 594,010 2,002,324 1,988,360 516,530 2,504,890 1,979,633 543,409 2,523,042
PERCENT 70.3 29.7 100 79.4 20.6 100 78.5 24.5 100 OCT 71,774 49,922 121,696 152,346 33,587 185,933 97,132 36,642 133,774 NOV 121,407 60,646 121,696 141,435 41,446 182,881 83,445 54,475 137,920 DEC 132,336 48,008 243,392 182,975 54,431 237,406 169,749 58,828 228,577 Qtr - 1 325,517 158,576 486,784 476,756 129,464 606,220 350,326 149,945 500,271 JAN 156,047 72,667 228,714 171,107 43,616 214,723 234,062 61,979 296,041 FEB 91,747 74,015 165,762 167,404 47,714 215,118 179,002 56,191 235,193 MAR 86,973 68,987 155,960 142,214 53,203 195,417 159,839 75,739 235,578 Qtr - 2 334,767 215,669 550,436 480,725 144,533 625,258 572,903 193,909 766,812 APR 76,946 69,696 146,642 156,353 55,035 211,388 122,967 54,602 177,569 MAY 89,157 34,164 123,321 164,849 55,176 220,025 127,546 53,355 180,901 JUN 167,401 20,047 187,448 181,899 47,352 229,251 234,235 28,943 263,178 Qtr - 3 333,504 123,907 457,411 503,101 157,563 660,664 484,748 136,900 621,648 JUL 149,759 26,551 176,310 220,549 30,464 251,013 260,500 23,590 284,090 AUG 147,366 28,160 175,526 183,923 35,524 219,447 169,251 18,114 187,365 SEPT 117,401 41,147 158,548 123,306 18,982 142,288 141,905 20,951 162,856 Qtr - 4 414,526 95,858 510,384 527,778 84,970 612,748 571,656 62,655 634,311
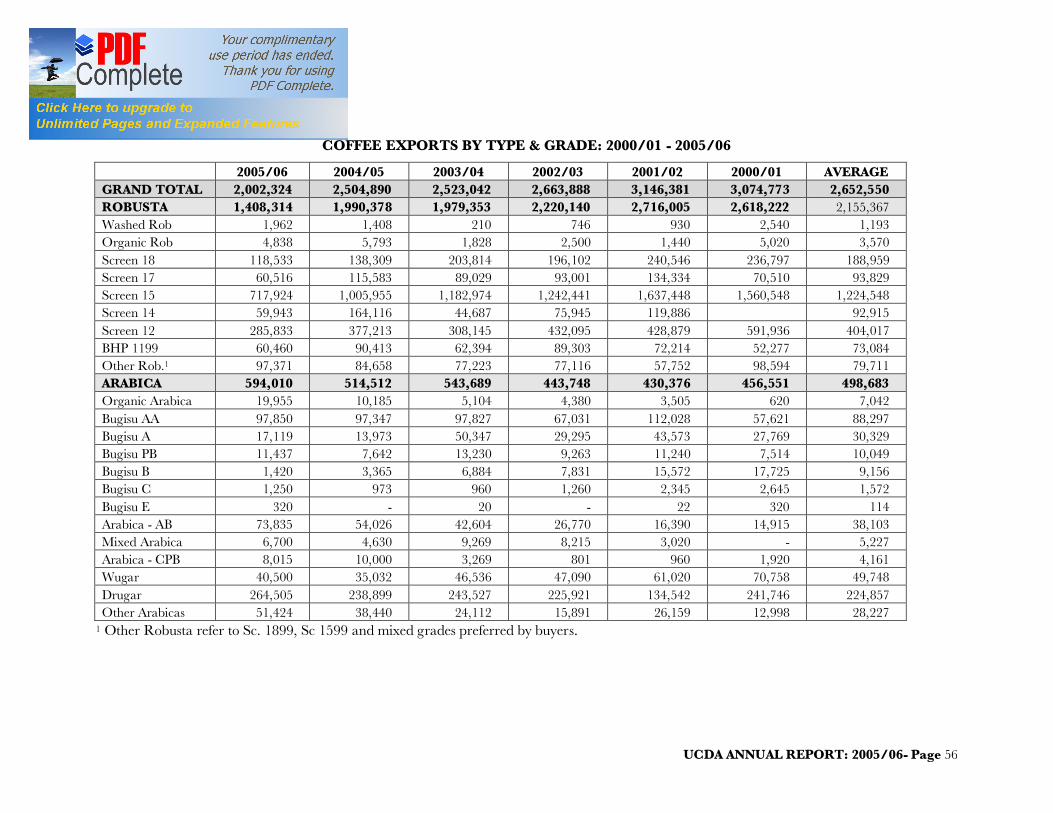
UCDA ANNUAL REPORT: 2005/06- Page 56
APPENDIX IV COFFEE EXPORTS BY TYPE & GRADE: 2000/01 - 2005/06
2005/06 2004/05 2003/04 2002/03 2001/02 2000/01 AVERAGE GRAND TOTAL 2,002,324 2,504,890 2,523,042 2,663,888 3,146,381 3,074,773 2,652,550 ROBUSTA 1,408,314 1,990,378 1,979,353 2,220,140 2,716,005 2,618,222 2,155,367 Washed Rob 1,962 1,408 210 746 930 2,540 1,193 Organic Rob 4,838 5,793 1,828 2,500 1,440 5,020 3,570 Screen 18 118,533 138,309 203,814 196,102 240,546 236,797 188,959 Screen 17 60,516 115,583 89,029 93,001 134,334 70,510 93,829 Screen 15 717,924 1,005,955 1,182,974 1,242,441 1,637,448 1,560,548 1,224,548 Screen 14 59,943 164,116 44,687 75,945 119,886 92,915 Screen 12 285,833 377,213 308,145 432,095 428,879 591,936 404,017 BHP 1199 60,460 90,413 62,394 89,303 72,214 52,277 73,084 Other Rob.1 97,371 84,658 77,223 77,116 57,752 98,594 79,711 ARABICA 594,010 514,512 543,689 443,748 430,376 456,551 498,683 Organic Arabica 19,955 10,185 5,104 4,380 3,505 620 7,042 Bugisu AA 97,850 97,347 97,827 67,031 112,028 57,621 88,297 Bugisu A 17,119 13,973 50,347 29,295 43,573 27,769 30,329 Bugisu PB 11,437 7,642 13,230 9,263 11,240 7,514 10,049 Bugisu B 1,420 3,365 6,884 7,831 15,572 17,725 9,156 Bugisu C 1,250 973 960 1,260 2,345 2,645 1,572 Bugisu E 320 - 20 - 22 320 114 Arabica - AB 73,835 54,026 42,604 26,770 16,390 14,915 38,103 Mixed Arabica 6,700 4,630 9,269 8,215 3,020 - 5,227 Arabica - CPB 8,015 10,000 3,269 801 960 1,920 4,161 Wugar 40,500 35,032 46,536 47,090 61,020 70,758 49,748 Drugar 264,505 238,899 243,527 225,921 134,542 241,746 224,857 Other Arabicas 51,424 38,440 24,112 15,891 26,159 12,998 28,227
1 Other Robusta refer to Sc. 1899, Sc 1599 and mixed grades preferred by buyers.
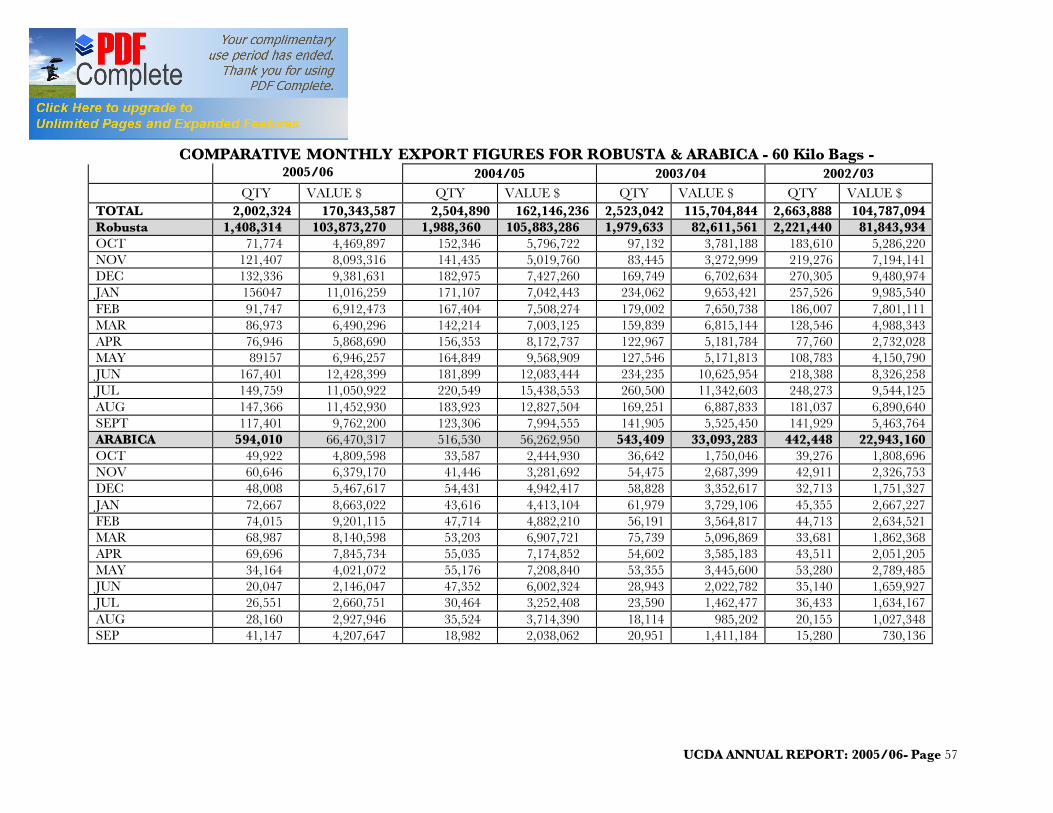
UCDA ANNUAL REPORT: 2005/06- Page 57
APPENDIX III
COMPARATIVE MONTHLY EXPORT FIGURES FOR ROBUSTA & ARABICA - 60 Kilo Bags - 2005/06 2004/05 2003/04 2002/03
QTY VALUE $ QTY VALUE $ QTY VALUE $ QTY VALUE $ TOTAL 2,002,324 170,343,587 2,504,890 162,146,236 2,523,042 115,704,844 2,663,888 104,787,094 Robusta 1,408,314 103,873,270 1,988,360 105,883,286 1,979,633 82,611,561 2,221,440 81,843,934 OCT 71,774 4,469,897 152,346 5,796,722 97,132 3,781,188 183,610 5,286,220 NOV 121,407 8,093,316 141,435 5,019,760 83,445 3,272,999 219,276 7,194,141 DEC 132,336 9,381,631 182,975 7,427,260 169,749 6,702,634 270,305 9,480,974 JAN 156047 11,016,259 171,107 7,042,443 234,062 9,653,421 257,526 9,985,540 FEB 91,747 6,912,473 167,404 7,508,274 179,002 7,650,738 186,007 7,801,111 MAR 86,973 6,490,296 142,214 7,003,125 159,839 6,815,144 128,546 4,988,343 APR 76,946 5,868,690 156,353 8,172,737 122,967 5,181,784 77,760 2,732,028 MAY 89157 6,946,257 164,849 9,568,909 127,546 5,171,813 108,783 4,150,790 JUN 167,401 12,428,399 181,899 12,083,444 234,235 10,625,954 218,388 8,326,258 JUL 149,759 11,050,922 220,549 15,438,553 260,500 11,342,603 248,273 9,544,125 AUG 147,366 11,452,930 183,923 12,827,504 169,251 6,887,833 181,037 6,890,640 SEPT 117,401 9,762,200 123,306 7,994,555 141,905 5,525,450 141,929 5,463,764 ARABICA 594,010 66,470,317 516,530 56,262,950 543,409 33,093,283 442,448 22,943,160 OCT 49,922 4,809,598 33,587 2,444,930 36,642 1,750,046 39,276 1,808,696 NOV 60,646 6,379,170 41,446 3,281,692 54,475 2,687,399 42,911 2,326,753 DEC 48,008 5,467,617 54,431 4,942,417 58,828 3,352,617 32,713 1,751,327 JAN 72,667 8,663,022 43,616 4,413,104 61,979 3,729,106 45,355 2,667,227 FEB 74,015 9,201,115 47,714 4,882,210 56,191 3,564,817 44,713 2,634,521 MAR 68,987 8,140,598 53,203 6,907,721 75,739 5,096,869 33,681 1,862,368 APR 69,696 7,845,734 55,035 7,174,852 54,602 3,585,183 43,511 2,051,205 MAY 34,164 4,021,072 55,176 7,208,840 53,355 3,445,600 53,280 2,789,485 JUN 20,047 2,146,047 47,352 6,002,324 28,943 2,022,782 35,140 1,659,927 JUL 26,551 2,660,751 30,464 3,252,408 23,590 1,462,477 36,433 1,634,167 AUG 28,160 2,927,946 35,524 3,714,390 18,114 985,202 20,155 1,027,348 SEP 41,147 4,207,647 18,982 2,038,062 20,951 1,411,184 15,280 730,136

UCDA ANNUAL REPORT: 2005/06- Page 58
APPENDIX VI
MAIN BUYERS OF UGANDA COFFEE IN 2005/06 – 60-KILO BAGS
COFFEE BUYERS TOTAL Oct. 05. Nov. 05 Dec. 05 Jan. 06 Feb. 06 Mar. 06 Apr. 06 May 06 Jun. 06 Jul. 06 Aug. 06 Sep. 06
GRAND TOTAL 2,002,324 121,696 182,053 180,344 228,714 165,762 155,960 146,642 123,321 187,448 176,310 175,526 158,548 ECOM AGROINDUST 275,999 19,020 28,755 46,.955 34,538 25,878 21,878 29,281 17,541 15,453 16,872 8,643 11,185
OLAM INT. 176,204 15,080 12,308 6,000 18,428 3,520 18,867 9,651 8,367 17,347 22,328 15,969 28,339
SUCAFINA 158,062 7,912 7,198 6,272 35,114 21,201 6,082 10,139 2,330 9,070 9,038 32,168 11,538
SOCADEC 135,624 3,574 7,332 26,953 19,095 9,755 5,045 3,435 5,645 24,635 13,348 4,593 12,214
DRUCAFE 129,861 5,830 16,440 4,260 11,520 12,010 15,364 8,135 4,103 10,733 14,935 5,269 21,262
COFFTEA (SUDAN) 125,010 2,410 12,410 12,950 6,270 23,420 11,900 1,750 13,650 14,000 15,750 7,000 3,500
LOUIS DREYFUS 105,266 5,355 10,380 9,640 5,635 14,825 14,265 27,375 9,591 2,010 0 640 5,550
BERNHARD ROTHFO 103,832 2,200 6,830 8,464 20,420 4,600 6,830 12,554 13,888 12,776 5,766 5,964 3,540
VOLCAFE 63,373 8,940 5,800 3,260 6,260 5,940 5,760 300 5,980 3,762 4,292 6,675 6,404
DECOTRADE 55,904 3,560 9,280 1,800 3,960 1,800 1,664 7,200 7,200 11,160 8,280
ICONACAFE 53,047 960 1,970 3,970 5,850 5,671 2,020 6,624 5,960 7,542 3,200 6,720 2,560
ELMATHAHIB 49,300 2,450 3,150 2,100 5,250 2,100 7,000 5,250 4,150 6,300 5,250 5,250 1,050
ELITE 23,377 2,756 1,234 4,774 1,002 0 2,060 3,050 5,439 3,062
HACOFCO 20,344 5,190 1,990 1,630 3,090 1,630 970 0 1,520 1,850 1,874 600
AZIENDE 19,685 1,610 600 620 620 940 300 1,275 1,295 1,600 1,965 3,350 5,510
ROBUSTA TRADE I 19,270 1,720 2,100 2,100 1,050 350 3,850 2,100 0 3,550 2,450
COFFY HANDELS 16,885 00 0 1,440 4,660 4,309 3,596 0 0 0 2,880 2,880
KRAFTS JACOBS 7,734 0 320 320 0 0 640 320 960 5,174
WALTER MATTER 6,340 960 640 320 960 640 960 1,540 320
TWIN TRADE 4,200 300 600 600 900 300 300 0 600 600
PRISMA 3,600 1,080 2,520
SELECT SERVICE 2,724 600 620 600 350 554
OTHERS 446,683 37,005 55,270 42,090 45,108 25,378 26,932 24,705 25,711 47,760 50,186 44,202 22,336

UCDA ANNUAL REPORT: 2005/06- Page 59

UCDA ANNUAL REPORT: 2005/06- Page 60
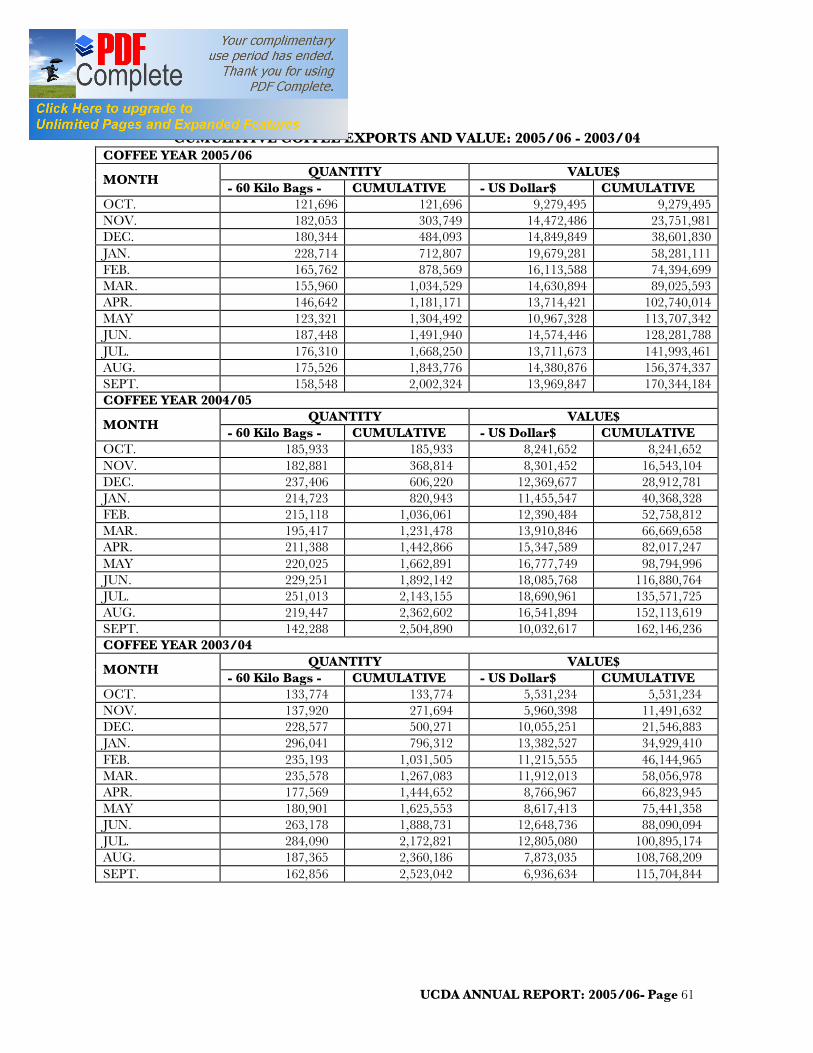
UCDA ANNUAL REPORT: 2005/06- Page 61
APPENDIX V
CUMULATIVE COFFEE EXPORTS AND VALUE: 2005/06 - 2003/04 COFFEE YEAR 2005/06
MONTH QUANTITY VALUE$ - 60 Kilo Bags - CUMULATIVE - US Dollar$ CUMULATIVE
OCT. 121,696 121,696 9,279,495 9,279,495 NOV. 182,053 303,749 14,472,486 23,751,981 DEC. 180,344 484,093 14,849,849 38,601,830 JAN. 228,714 712,807 19,679,281 58,281,111 FEB. 165,762 878,569 16,113,588 74,394,699 MAR. 155,960 1,034,529 14,630,894 89,025,593 APR. 146,642 1,181,171 13,714,421 102,740,014 MAY 123,321 1,304,492 10,967,328 113,707,342 JUN. 187,448 1,491,940 14,574,446 128,281,788 JUL. 176,310 1,668,250 13,711,673 141,993,461 AUG. 175,526 1,843,776 14,380,876 156,374,337 SEPT. 158,548 2,002,324 13,969,847 170,344,184 COFFEE YEAR 2004/05
MONTH QUANTITY VALUE$ - 60 Kilo Bags - CUMULATIVE - US Dollar$ CUMULATIVE
OCT. 185,933 185,933 8,241,652 8,241,652 NOV. 182,881 368,814 8,301,452 16,543,104 DEC. 237,406 606,220 12,369,677 28,912,781 JAN. 214,723 820,943 11,455,547 40,368,328 FEB. 215,118 1,036,061 12,390,484 52,758,812 MAR. 195,417 1,231,478 13,910,846 66,669,658 APR. 211,388 1,442,866 15,347,589 82,017,247 MAY 220,025 1,662,891 16,777,749 98,794,996 JUN. 229,251 1,892,142 18,085,768 116,880,764 JUL. 251,013 2,143,155 18,690,961 135,571,725 AUG. 219,447 2,362,602 16,541,894 152,113,619 SEPT. 142,288 2,504,890 10,032,617 162,146,236 COFFEE YEAR 2003/04
MONTH QUANTITY VALUE$ - 60 Kilo Bags - CUMULATIVE - US Dollar$ CUMULATIVE
OCT. 133,774 133,774 5,531,234 5,531,234 NOV. 137,920 271,694 5,960,398 11,491,632 DEC. 228,577 500,271 10,055,251 21,546,883 JAN. 296,041 796,312 13,382,527 34,929,410 FEB. 235,193 1,031,505 11,215,555 46,144,965 MAR. 235,578 1,267,083 11,912,013 58,056,978 APR. 177,569 1,444,652 8,766,967 66,823,945 MAY 180,901 1,625,553 8,617,413 75,441,358 JUN. 263,178 1,888,731 12,648,736 88,090,094 JUL. 284,090 2,172,821 12,805,080 100,895,174 AUG. 187,365 2,360,186 7,873,035 108,768,209 SEPT. 162,856 2,523,042 6,936,634 115,704,844
UCDA ANNUAL REPORT: 2005/06 - Page 62
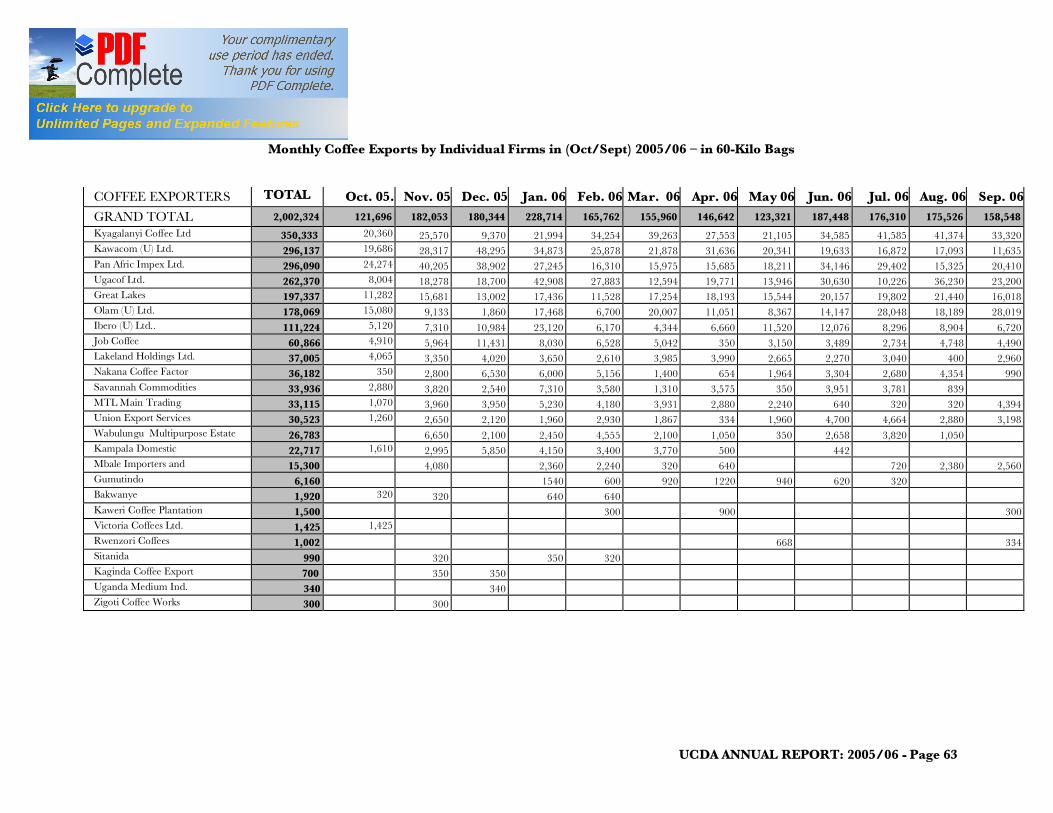
UCDA ANNUAL REPORT: 2005/06 - Page 63
Appendix VII
Monthly Coffee Exports by Individual Firms in (Oct/Sept) 2005/06 – in 60-Kilo Bags
COFFEE EXPORTERS TOTAL Oct. 05. Nov. 05 Dec. 05 Jan. 06 Feb. 06 Mar. 06 Apr. 06 May 06 Jun. 06 Jul. 06 Aug. 06 Sep. 06
GRAND TOTAL 2,002,324 121,696 182,053 180,344 228,714 165,762 155,960 146,642 123,321 187,448 176,310 175,526 158,548
Kyagalanyi Coffee Ltd 350,333 20,360 25,570 9,370 21,994 34,254 39,263 27,553 21,105 34,585 41,585 41,374 33,320 Kawacom (U) Ltd. 296,137 19,686 28,317 48,295 34,873 25,878 21,878 31,636 20,341 19,633 16,872 17,093 11,635 Pan Afric Impex Ltd. 296,090 24,274 40,205 38,902 27,245 16,310 15,975 15,685 18,211 34,146 29,402 15,325 20,410 Ugacof Ltd. 262,370 8,004 18,278 18,700 42,908 27,883 12,594 19,771 13,946 30,630 10,226 36,230 23,200 Great Lakes 197,337 11,282 15,681 13,002 17,436 11,528 17,254 18,193 15,544 20,157 19,802 21,440 16,018 Olam (U) Ltd. 178,069 15,080 9,133 1,860 17,468 6,700 20,007 11,051 8,367 14,147 28,048 18,189 28,019 Ibero (U) Ltd.. 111,224 5,120 7,310 10,984 23,120 6,170 4,344 6,660 11,520 12,076 8,296 8,904 6,720 Job Coffee 60,866 4,910 5,964 11,431 8,030 6,528 5,042 350 3,150 3,489 2,734 4,748 4,490 Lakeland Holdings Ltd. 37,005 4,065 3,350 4,020 3,650 2,610 3,985 3,990 2,665 2,270 3,040 400 2,960 Nakana Coffee Factor 36,182 350 2,800 6,530 6,000 5,156 1,400 654 1,964 3,304 2,680 4,354 990 Savannah Commodities 33,936 2,880 3,820 2,540 7,310 3,580 1,310 3,575 350 3,951 3,781 839 MTL Main Trading 33,115 1,070 3,960 3,950 5,230 4,180 3,931 2,880 2,240 640 320 320 4,394 Union Export Services 30,523 1,260 2,650 2,120 1,960 2,930 1,867 334 1,960 4,700 4,664 2,880 3,198 Wabulungu Multipurpose Estate 26,783 6,650 2,100 2,450 4,555 2,100 1,050 350 2,658 3,820 1,050 Kampala Domestic 22,717 1,610 2,995 5,850 4,150 3,400 3,770 500 442 Mbale Importers and 15,300 4,080 2,360 2,240 320 640 720 2,380 2,560 Gumutindo 6,160 1540 600 920 1220 940 620 320 Bakwanye 1,920 320 320 640 640 Kaweri Coffee Plantation 1,500 300 900 300 Victoria Coffees Ltd. 1,425 1,425 Rwenzori Coffees 1,002 668 334 Sitanida 990 320 350 320 Kaginda Coffee Export 700 350 350 Uganda Medium Ind. 340 340 Zigoti Coffee Works 300 300

UCDA ANNUAL REPORT: 2005/06 - Page 64
APPENDIX VIII
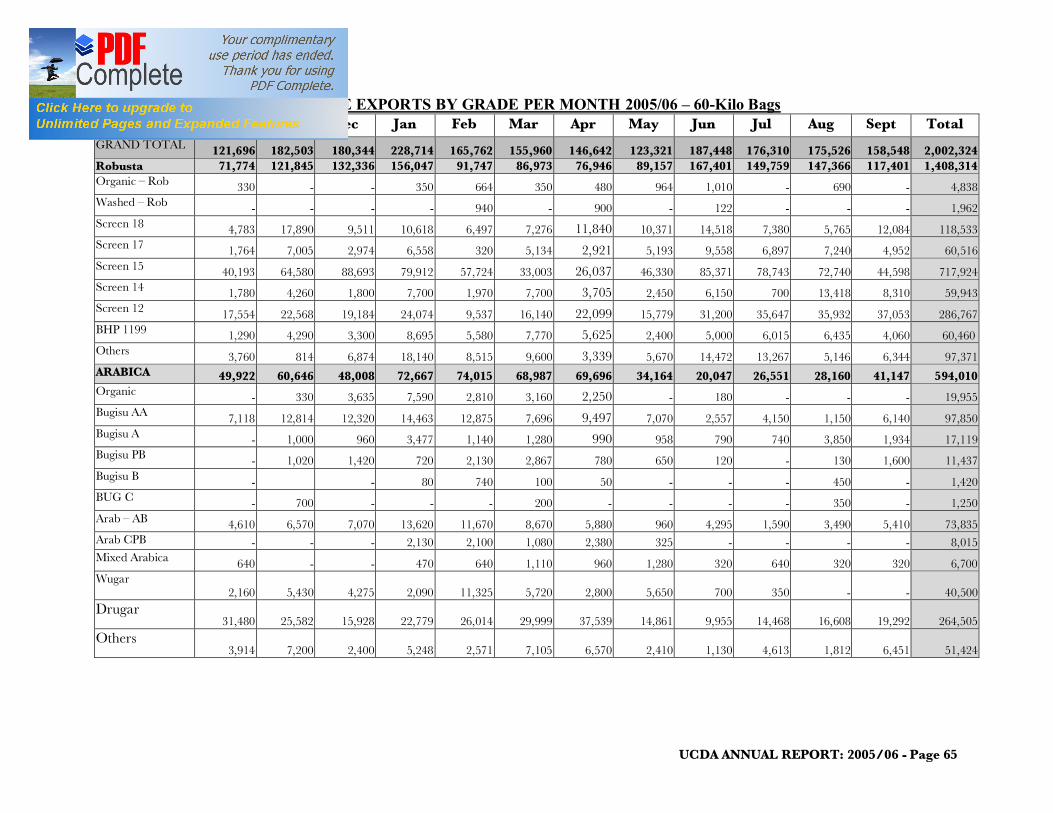
UCDA ANNUAL REPORT: 2005/06 - Page 65
Appendix IX: COFFEE EXPORTS BY GRADE PER MONTH 2005/06 – 60-Kilo Bags Oct Nov Dec Jan Feb Mar Apr May Jun Jul Aug Sept Total GRAND TOTAL 121,696 182,503 180,344 228,714 165,762 155,960 146,642 123,321 187,448 176,310 175,526 158,548 2,002,324 Robusta 71,774 121,845 132,336 156,047 91,747 86,973 76,946 89,157 167,401 149,759 147,366 117,401 1,408,314 Organic – Rob 330 - - 350 664 350 480 964 1,010 - 690 - 4,838 Washed – Rob - - - - 940 - 900 - 122 - - - 1,962 Screen 18 4,783 17,890 9,511 10,618 6,497 7,276 11,840 10,371 14,518 7,380 5,765 12,084 118,533 Screen 17 1,764 7,005 2,974 6,558 320 5,134 2,921 5,193 9,558 6,897 7,240 4,952 60,516 Screen 15 40,193 64,580 88,693 79,912 57,724 33,003 26,037 46,330 85,371 78,743 72,740 44,598 717,924 Screen 14 1,780 4,260 1,800 7,700 1,970 7,700 3,705 2,450 6,150 700 13,418 8,310 59,943 Screen 12 17,554 22,568 19,184 24,074 9,537 16,140 22,099 15,779 31,200 35,647 35,932 37,053 286,767 BHP 1199 1,290 4,290 3,300 8,695 5,580 7,770 5,625 2,400 5,000 6,015 6,435 4,060 60,460 Others 3,760 814 6,874 18,140 8,515 9,600 3,339 5,670 14,472 13,267 5,146 6,344 97,371 ARABICA 49,922 60,646 48,008 72,667 74,015 68,987 69,696 34,164 20,047 26,551 28,160 41,147 594,010 Organic - 330 3,635 7,590 2,810 3,160 2,250 - 180 - - - 19,955 Bugisu AA 7,118 12,814 12,320 14,463 12,875 7,696 9,497 7,070 2,557 4,150 1,150 6,140 97,850 Bugisu A - 1,000 960 3,477 1,140 1,280 990 958 790 740 3,850 1,934 17,119 Bugisu PB - 1,020 1,420 720 2,130 2,867 780 650 120 - 130 1,600 11,437 Bugisu B - - 80 740 100 50 - - - 450 - 1,420 BUG C - 700 - - - 200 - - - - 350 - 1,250 Arab – AB 4,610 6,570 7,070 13,620 11,670 8,670 5,880 960 4,295 1,590 3,490 5,410 73,835 Arab CPB - - - 2,130 2,100 1,080 2,380 325 - - - - 8,015 Mixed Arabica 640 - - 470 640 1,110 960 1,280 320 640 320 320 6,700 Wugar
2,160 5,430 4,275 2,090
11,325 5,720 2,800 5,650 700 350 - - 40,500 Drugar
31,480 25,582 15,928 22,779 26,014 29,999 37,539 14,861 9,955
14,468 16,608 19,292 264,505 Others
3,914 7,200 2,400 5,248 2,571 7,105 6,570 2,410 1,130
4,613 1,812 6,451 51,424
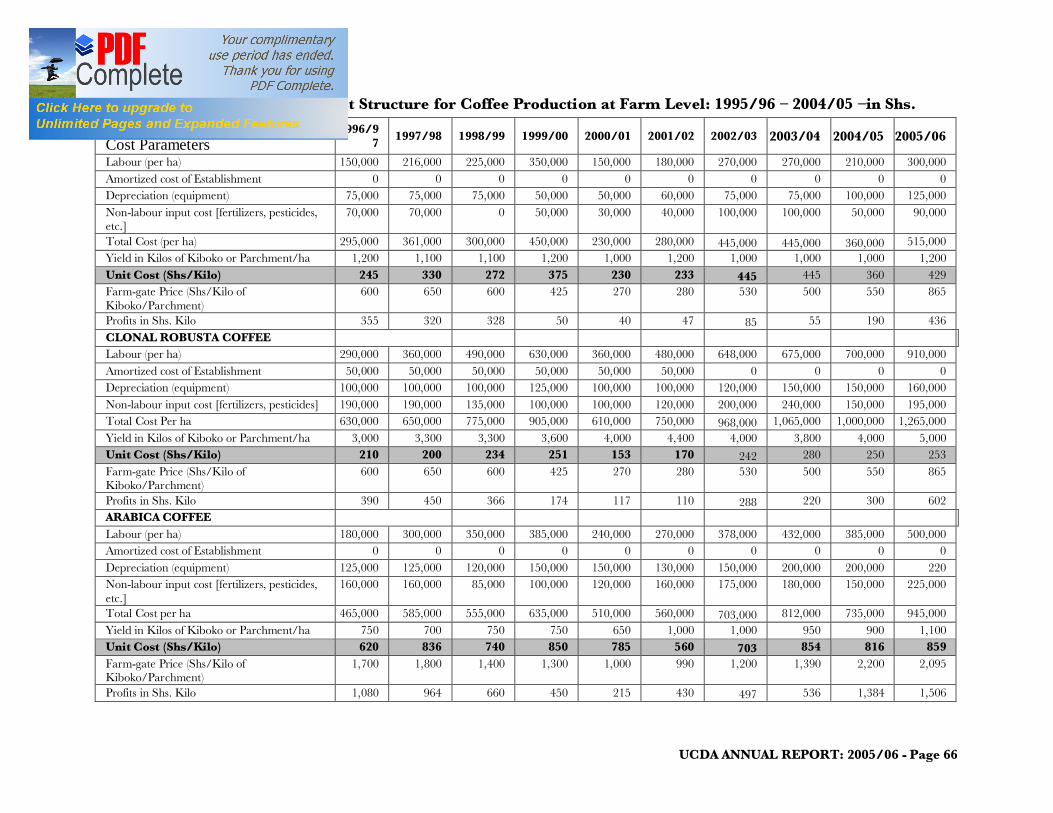
UCDA ANNUAL REPORT: 2005/06 - Page 66
Appendix X: Production Cost Structure for Coffee Production at Farm Level: 1995/96 – 2004/05 –in Shs. OLD ROBUSTA COFFEE 1996/9
7 1997/98 1998/99 1999/00 2000/01 2001/02 2002/03 2003/04 2004/05 2005/06 Cost Parameters Labour (per ha) 150,000 216,000 225,000 350,000 150,000 180,000 270,000 270,000 210,000 300,000 Amortized cost of Establishment 0 0 0 0 0 0 0 0 0 0 Depreciation (equipment) 75,000 75,000 75,000 50,000 50,000 60,000 75,000 75,000 100,000 125,000 Non-labour input cost [fertilizers, pesticides, etc.]
70,000 70,000 0 50,000 30,000 40,000 100,000 100,000 50,000 90,000
Total Cost (per ha) 295,000 361,000 300,000 450,000 230,000 280,000 445,000 445,000 360,000 515,000 Yield in Kilos of Kiboko or Parchment/ha 1,200 1,100 1,100 1,200 1,000 1,200 1,000 1,000 1,000 1,200 Unit Cost (Shs/Kilo) 245 330 272 375 230 233 445 445 360 429 Farm-gate Price (Shs/Kilo of Kiboko/Parchment)
600 650 600 425 270 280 530 500 550 865
Profits in Shs. Kilo 355 320 328 50 40 47 85 55 190 436 CLONAL ROBUSTA COFFEE Labour (per ha) 290,000 360,000 490,000 630,000 360,000 480,000 648,000 675,000 700,000 910,000 Amortized cost of Establishment 50,000 50,000 50,000 50,000 50,000 50,000 0 0 0 0 Depreciation (equipment) 100,000 100,000 100,000 125,000 100,000 100,000 120,000 150,000 150,000 160,000 Non-labour input cost [fertilizers, pesticides] 190,000 190,000 135,000 100,000 100,000 120,000 200,000 240,000 150,000 195,000 Total Cost Per ha 630,000 650,000 775,000 905,000 610,000 750,000 968,000 1,065,000 1,000,000 1,265,000 Yield in Kilos of Kiboko or Parchment/ha 3,000 3,300 3,300 3,600 4,000 4,400 4,000 3,800 4,000 5,000 Unit Cost (Shs/Kilo) 210 200 234 251 153 170 242 280 250 253 Farm-gate Price (Shs/Kilo of Kiboko/Parchment)
600 650 600 425 270 280 530 500 550 865
Profits in Shs. Kilo 390 450 366 174 117 110 288 220 300 602 ARABICA COFFEE Labour (per ha) 180,000 300,000 350,000 385,000 240,000 270,000 378,000 432,000 385,000 500,000 Amortized cost of Establishment 0 0 0 0 0 0 0 0 0 0 Depreciation (equipment) 125,000 125,000 120,000 150,000 150,000 130,000 150,000 200,000 200,000 220 Non-labour input cost [fertilizers, pesticides, etc.]
160,000 160,000 85,000 100,000 120,000 160,000 175,000 180,000 150,000 225,000
Total Cost per ha 465,000 585,000 555,000 635,000 510,000 560,000 703,000 812,000 735,000 945,000 Yield in Kilos of Kiboko or Parchment/ha 750 700 750 750 650 1,000 1,000 950 900 1,100 Unit Cost (Shs/Kilo) 620 836 740 850 785 560 703 854 816 859 Farm-gate Price (Shs/Kilo of Kiboko/Parchment)
1,700 1,800 1,400 1,300 1,000 990 1,200 1,390 2,200 2,095
Profits in Shs. Kilo 1,080 964 660 450 215 430 497 536 1,384 1,506
UCDA ANNUAL REPORT: 2005/06 - Page 67
Note: Opportunity Cost of Family Labour is estimated at 40 per cent and it is incorporated in the cost structure.
68
UGANDA COFFEE DEVELOPMENT AUTHORITY FINANCIAL STATEMENTS FOR THE YEAR ENDED SEPTEMBER 30,
2005, TOGETHER WITH THE REPORT AND OPINION THEREON BY THE AUDITOR GENERAL
AUDITED ACCOUNTS: 2005/06
SUMMARY PAGE Auditor General’s Report Statement of Directors’ Responsibility Balance Sheet Income and Expenditure Statement of Movement in Net Surplus/Deficit Notes to Financial Statements Fixed Assets Schedule Expenditure Notes Cash Flow
69
AUDITOR GENERAL’S REPORT
Under section 16 (2) of Uganda Coffee Development Authority (UCDA) Act (Cap325), I
am required to audit the accounts of Uganda Coffee Development Authority and report
to Parliament in accordance with Article 163 (4) of the Constitution not later than six (6)
months after the end of the financial year to which they relate.
REPORT
The Financial statements of the Uganda Coffee Development Authority (UCDA) for the
year ended 30th September 2006 set out on pages 1 to 10 which have been prepared on
the basis of accounting policies set out on Page 4 have been audited. All the information
and explanations, which were considered necessary for purposes of the audit, were
obtained.
Respective responsibilities of the Directors and Auditors
The Directors are responsible for the preparation of the financial statements, which give a
true and fair view of the Authority’s state of affairs and its surplus or deficit. The
responsibility of the Auditor is to express an independent opinion on the financial
statements based on the Audit.
Basis of Opinion
The audit was conducted in accordance with international standards on Auditing. Those
standards require that the audit is planned and performed to obtain reasonable assurance
that the accounts are free from material misstatement. An audit includes an examination,
on a test basis of evidence supporting the amounts and disclosures in the financial
statements. It also includes an assessment of the accounting policies and significant
estimates made by the directors, as well as an evaluation of the overall presentation of the
financial statements.
OPINION
In my opinion the financial statements give a true and fair view of the state of affairs of
the Authority as at 30th September 2006 and of its surplus and cash flows for the year
then ended and comply with the International Financial Reporting Standards (IFRS) and
the Uganda Coffee Development Authority Act Cap.325.
70
Emphasis of Matter
Without qualifying my opinion, I draw attention to the following matter:
Joint Venture Losses
As stated in Note 10(a) to the financial statements, the Authority entered into Joint
Ventures to promote Uganda coffee overseas in Denmark, China and Egypt. The
Authority has continued to make losses in these joint venture operations. This trend is
unlikely to change soon.
During the year one Joint Venture partner (China) withdrew from the joint venture
without making good its share of the loss. UCDA took over full control of the venture.
In view of this poor performance, management was advised to review the strategy of
participating in joint ventures and put more effort in promotional activities.
John F. S. Muwanga AUDITOR GENERAL
Kampala
August 16, 2007
71
UGANDA COFFEE DEVELOPMENT AUTHORITY
STATEMENT OF DIRECTORS’ RESPONSIBILITIES
FOR THE YEAR ENDED SEPTEMBER 30, 2006
The Uganda Coffee Development Authority Act requires the Directors to prepare
financial statements for each financial year that give a true and fair view of the state of
affairs of the company at the end of the financial year and of its profit and loss. It also
requires that the company keeps proper accounting records that disclose, with reasonable
accuracy, the financial position of the company. They are also responsible for safe
guarding of the assets of the company.
The directors accept responsibility for the annual financial statements set out on pages 1
to 12, which have been prepared using appropriate accounting polices supported by
reasonable and prudent judgments and estimates, in conformity with International
Reporting Standards and the requirements of the Uganda Companies Act. The directors
are of the opinion that the financial statements give a true and fair view of the financial
affairs of the Company and of its profit for the year. The directors accept responsibility
for the maintenance of accounting records that may be relied upon in the preparation of
financial statements as well as adequate systems of internal financial control.
Nothing has come to the attention of the directors to indicate that the company will not
remain a going concern for at least the twelve months from the date of this statement.
Paul Mugambwa Henry Ngabirano Chairman Board of Directors Managing Director
15/08/2007
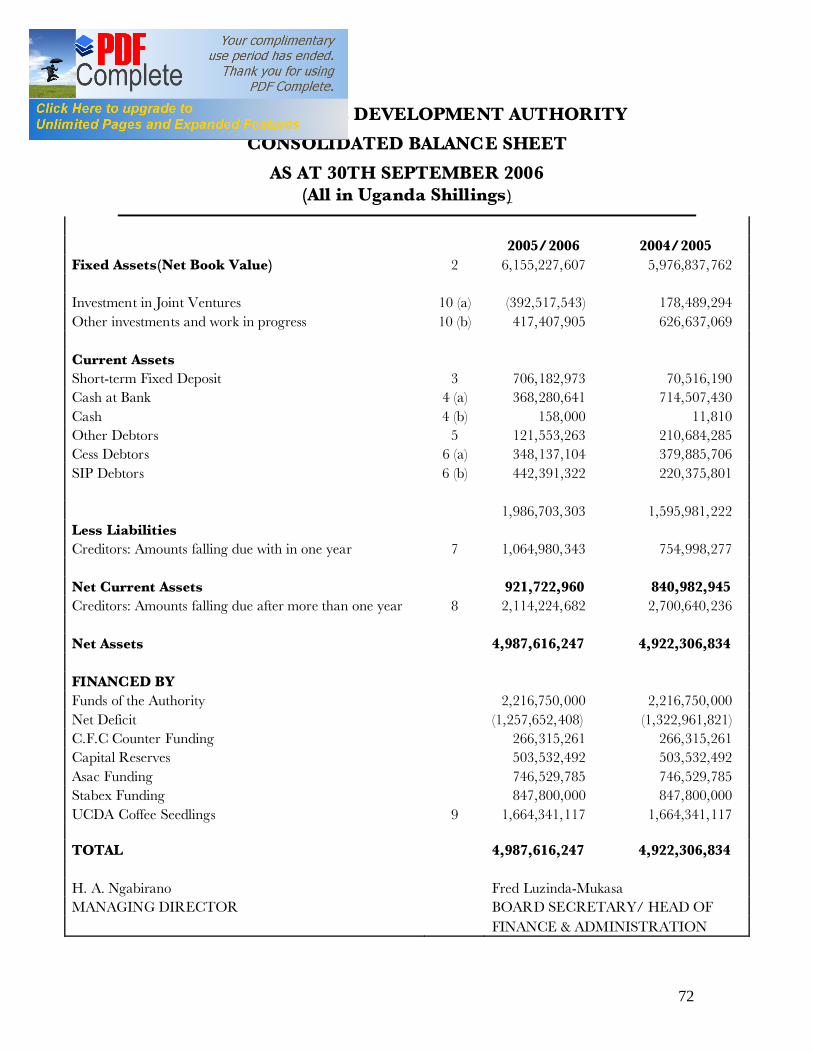
72
UGANDA COFFEE DEVELOPMENT AUTHORITY
CONSOLIDATED BALANCE SHEET
AS AT 30TH SEPTEMBER 2006 (All in Uganda Shillings)
2005/2006 2004/2005 Fixed Assets(Net Book Value) 2 6,155,227,607 5,976,837,762 Investment in Joint Ventures 10 (a) (392,517,543) 178,489,294 Other investments and work in progress 10 (b) 417,407,905 626,637,069 Current Assets Short-term Fixed Deposit 3 706,182,973 70,516,190 Cash at Bank 4 (a) 368,280,641 714,507,430 Cash 4 (b) 158,000 11,810 Other Debtors 5 121,553,263 210,684,285 Cess Debtors 6 (a) 348,137,104 379,885,706 SIP Debtors 6 (b) 442,391,322 220,375,801 1,986,703,303 1,595,981,222 Less Liabilities Creditors: Amounts falling due with in one year 7 1,064,980,343 754,998,277 Net Current Assets 921,722,960 840,982,945 Creditors: Amounts falling due after more than one year 8 2,114,224,682 2,700,640,236 Net Assets 4,987,616,247 4,922,306,834 FINANCED BY Funds of the Authority 2,216,750,000 2,216,750,000 Net Deficit (1,257,652,408) (1,322,961,821) C.F.C Counter Funding 266,315,261 266,315,261 Capital Reserves 503,532,492 503,532,492 Asac Funding 746,529,785 746,529,785 Stabex Funding 847,800,000 847,800,000 UCDA Coffee Seedlings 9 1,664,341,117 1,664,341,117 TOTAL 4,987,616,247 4,922,306,834 H. A. Ngabirano Fred Luzinda-Mukasa MANAGING DIRECTOR BOARD SECRETARY/ HEAD OF FINANCE & ADMINISTRATION
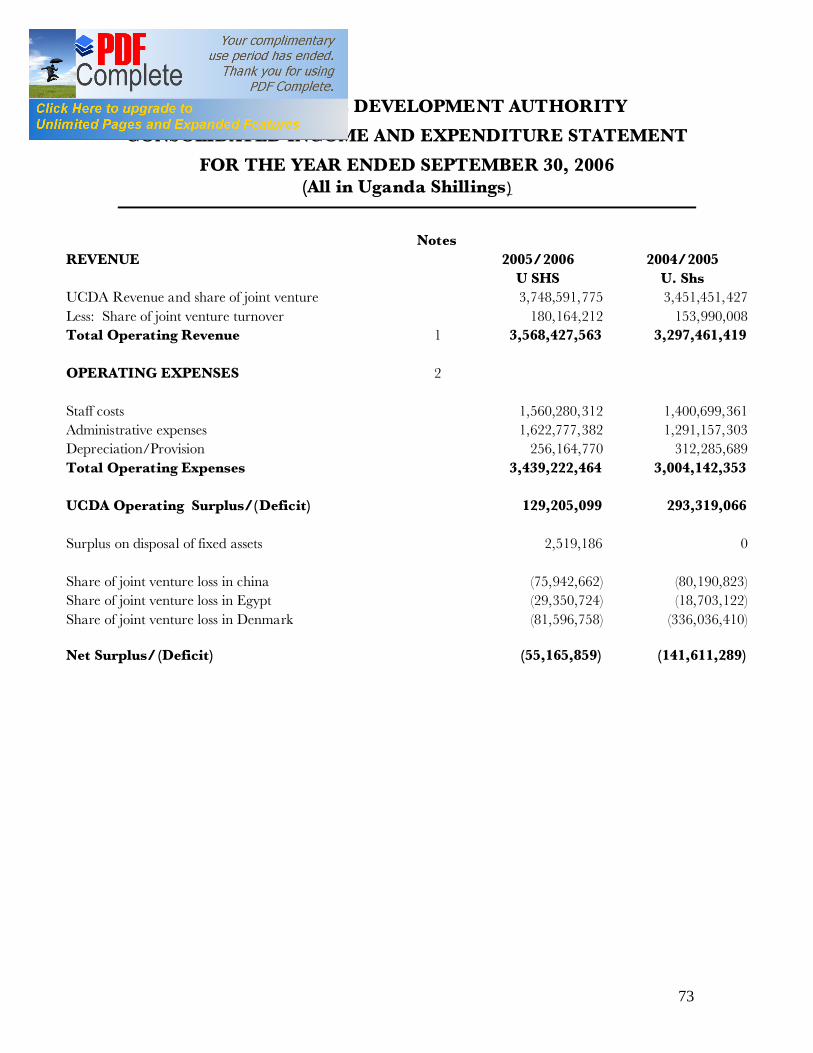
73
UGANDA COFFEE DEVELOPMENT AUTHORITY
CONSOLIDATED INCOME AND EXPENDITURE STATEMENT
FOR THE YEAR ENDED SEPTEMBER 30, 2006 (All in Uganda Shillings)
Notes REVENUE 2005/2006 2004/2005 U SHS U. Shs UCDA Revenue and share of joint venture 3,748,591,775 3,451,451,427 Less: Share of joint venture turnover 180,164,212 153,990,008 Total Operating Revenue 1 3,568,427,563 3,297,461,419 OPERATING EXPENSES 2 Staff costs 1,560,280,312 1,400,699,361 Administrative expenses 1,622,777,382 1,291,157,303 Depreciation/Provision 256,164,770 312,285,689 Total Operating Expenses 3,439,222,464 3,004,142,353 UCDA Operating Surplus/(Deficit) 129,205,099 293,319,066 Surplus on disposal of fixed assets 2,519,186 0 Share of joint venture loss in china (75,942,662) (80,190,823) Share of joint venture loss in Egypt (29,350,724) (18,703,122) Share of joint venture loss in Denmark (81,596,758) (336,036,410) Net Surplus/(Deficit) (55,165,859) (141,611,289)
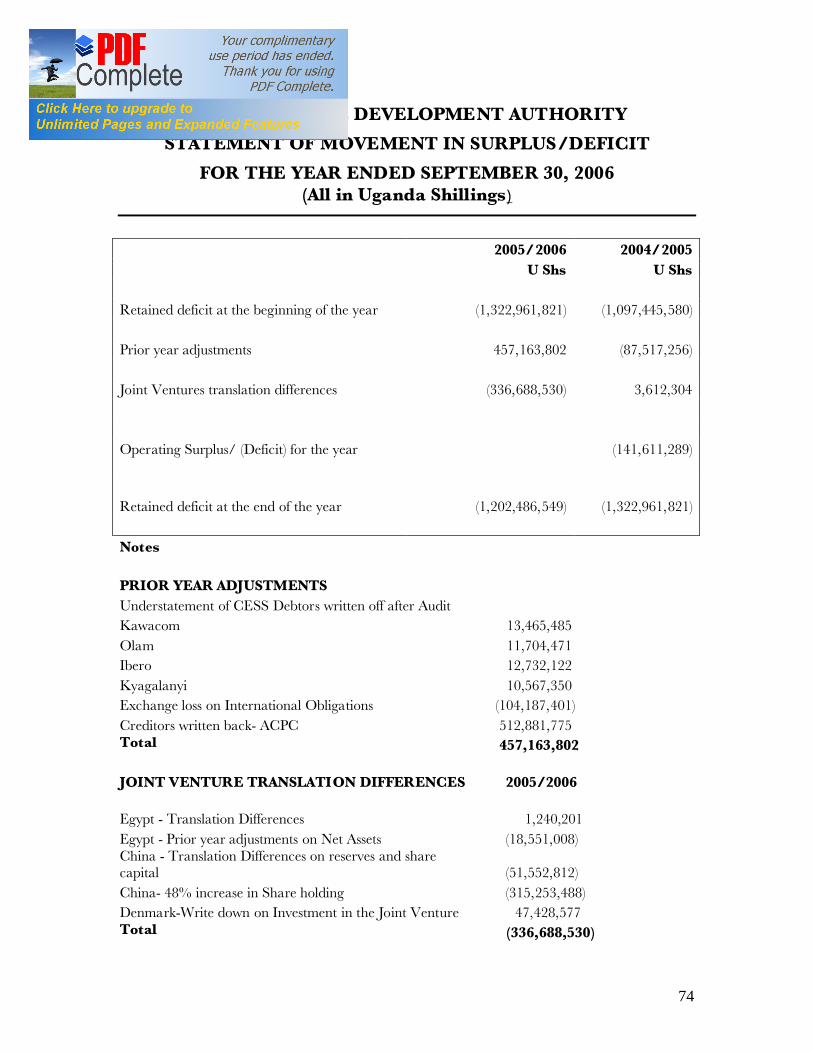
74
UGANDA COFFEE DEVELOPMENT AUTHORITY
STATEMENT OF MOVEMENT IN SURPLUS/DEFICIT
FOR THE YEAR ENDED SEPTEMBER 30, 2006 (All in Uganda Shillings)
2005/2006 2004/2005 U Shs U Shs Retained deficit at the beginning of the year (1,322,961,821) (1,097,445,580) Prior year adjustments 457,163,802 (87,517,256) Joint Ventures translation differences (336,688,530) 3,612,304 Operating Surplus/ (Deficit) for the year (141,611,289) Retained deficit at the end of the year (1,202,486,549) (1,322,961,821) Notes
PRIOR YEAR ADJUSTMENTS Understatement of CESS Debtors written off after Audit Kawacom 13,465,485 Olam 11,704,471 Ibero 12,732,122 Kyagalanyi 10,567,350 Exchange loss on International Obligations (104,187,401) Creditors written back- ACPC 512,881,775 Total 457,163,802 JOINT VENTURE TRANSLATION DIFFERENCES 2005/2006 Egypt - Translation Differences 1,240,201 Egypt - Prior year adjustments on Net Assets (18,551,008) China - Translation Differences on reserves and share capital (51,552,812) China- 48% increase in Share holding (315,253,488) Denmark-Write down on Investment in the Joint Venture 47,428,577 Total (336,688,530)
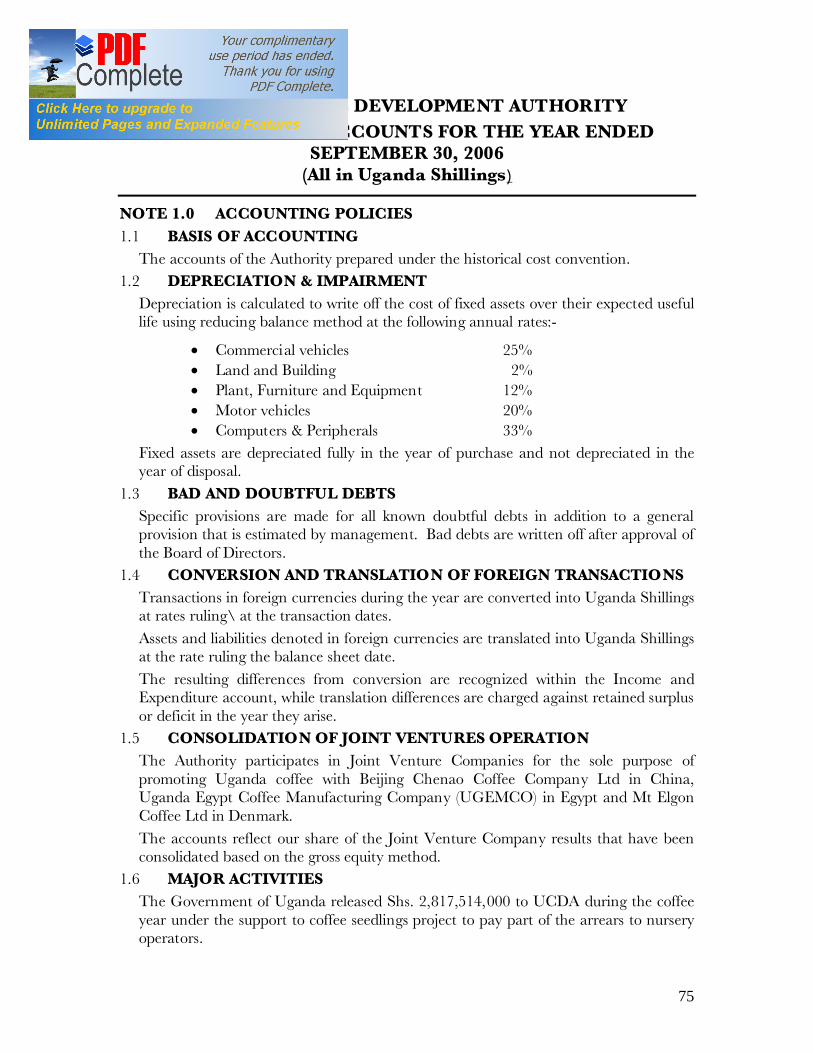
75
UGANDA COFFEE DEVELOPMENT AUTHORITY NOTES TO FINAL ACCOUNTS FOR THE YEAR ENDED
SEPTEMBER 30, 2006 (All in Uganda Shillings)
NOTE 1.0 ACCOUNTING POLICIES 1.1 BASIS OF ACCOUNTING
The accounts of the Authority prepared under the historical cost convention. 1.2 DEPRECIATION & IMPAIRMENT
Depreciation is calculated to write off the cost of fixed assets over their expected useful life using reducing balance method at the following annual rates:-
• Commercial vehicles 25% • Land and Building 2% • Plant, Furniture and Equipment 12% • Motor vehicles 20% • Computers & Peripherals 33%
Fixed assets are depreciated fully in the year of purchase and not depreciated in the year of disposal.
1.3 BAD AND DOUBTFUL DEBTS Specific provisions are made for all known doubtful debts in addition to a general provision that is estimated by management. Bad debts are written off after approval of the Board of Directors.
1.4 CONVERSION AND TRANSLATION OF FOREIGN TRANSACTIONS Transactions in foreign currencies during the year are converted into Uganda Shillings at rates ruling\ at the transaction dates. Assets and liabilities denoted in foreign currencies are translated into Uganda Shillings at the rate ruling the balance sheet date. The resulting differences from conversion are recognized within the Income and Expenditure account, while translation differences are charged against retained surplus or deficit in the year they arise.
1.5 CONSOLIDATION OF JOINT VENTURES OPERATION The Authority participates in Joint Venture Companies for the sole purpose of promoting Uganda coffee with Beijing Chenao Coffee Company Ltd in China, Uganda Egypt Coffee Manufacturing Company (UGEMCO) in Egypt and Mt Elgon Coffee Ltd in Denmark. The accounts reflect our share of the Joint Venture Company results that have been consolidated based on the gross equity method.
1.6 MAJOR ACTIVITIES The Government of Uganda released Shs. 2,817,514,000 to UCDA during the coffee year under the support to coffee seedlings project to pay part of the arrears to nursery operators.

76
UGANDA COFFEE DEVELOPME NT AUTHORITY
NOTES TO THE FINANCIAL STATEMENTS
FOR THE YEAR ENDED SEPTEMBER 30, 2006 (All in Uganda Shillings)
COST/
VALUATION
Land and
Buildings
Office
Furniture
Computer &
Peripherals
Office
Equipment
Motor
Vehicles
Commercial
l Vehicles
Liquoring
Equipment
Motor
Cycles
Generator TOTAL
At 1st Oct 2005 6,998,141,836 211,235,716 188,735,923 91,953,733 185,468,998 421,271,806 246,718,132 84,688,260 59,429,346 8,487,643,750
Additions 2005/2006
297,080,345 11,489,235 9,332,000 7,200,334 87,000,000 4,843,574 0 0 1,941,425 418,886,913
Disposals 2005/2006
0 0 0 0 0 (58,598,741) 0 (3,982,160) 0 (62,580,901)
At 30th Sept. 2006
7,295,222,181 222,714,951 198,067,923 99,154,067 272,468,998 367,516,639 246,718,133 80,706,100 61,370,771 8,843,949,762
DEPRECIATION At 1st Oct. 2005 1,544,335,082 171,007,288 140,137,852 51,484,456 112,140,874 311,152,589 130,819,609 29,910,077 19,818,164 2,510,805,991
Disposal Adjustments
0 0 0 0 0 (55,298,798) 0 (2,351,067) 0 (57,649,865)
Depreciation for the Year
115,017,742 6,206,120 19,116,923 5,720,353 32,065,625 27,915,712 13,907,823 10,629,418 4,986,313 235,566,029
At 30th Sept 2005
1,659,352,824 177,213,408 159,254,775 57,204,809 144,206,499 283,769,503 144,727,432 38,188,428 24,804,477 2,688,722,155
Net Book Value
5,635,869,357 45,511,543 38,813,148 41,949,258 128,262,499 83,747,136 101,990,700 42,517,672 36,566,294 6,155,227,607
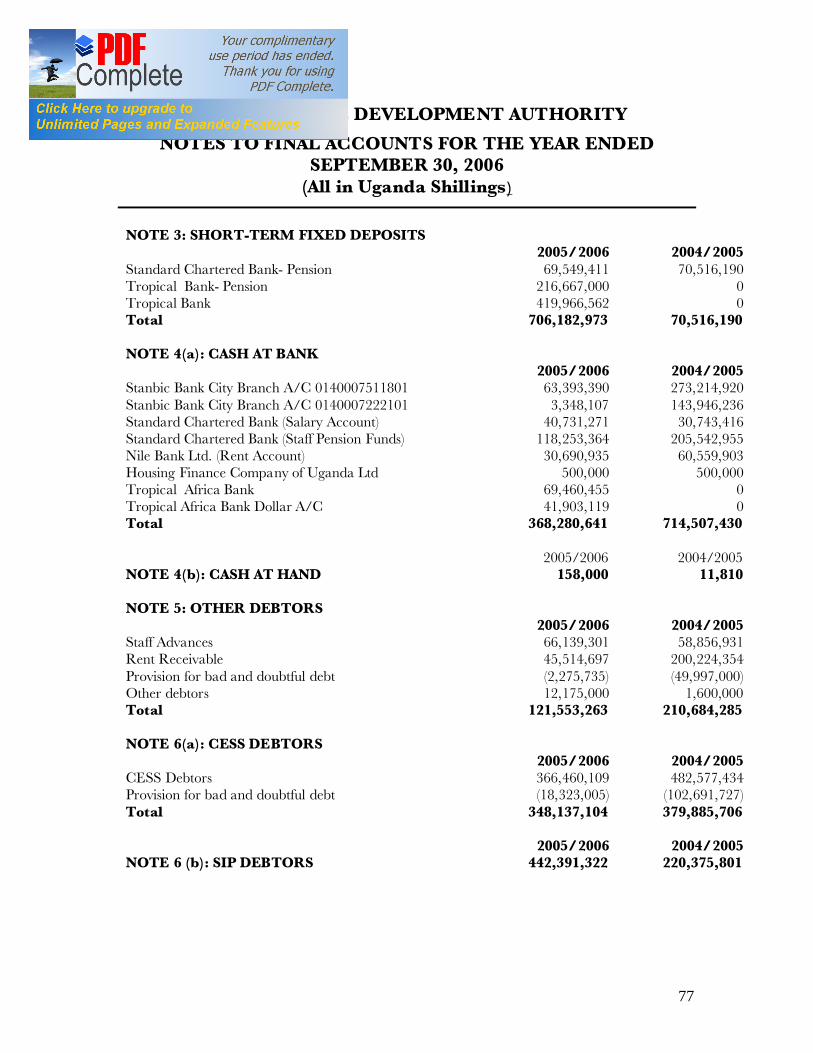
77
UGANDA COFFEE DEVELOPMENT AUTHORITY
NOTES TO FINAL ACCOUNTS FOR THE YEAR ENDED SEPTEMBER 30, 2006
(All in Uganda Shillings)
NOTE 3: SHORT-TERM FIXED DEPOSITS 2005/2006 2004/2005 Standard Chartered Bank- Pension 69,549,411 70,516,190 Tropical Bank- Pension 216,667,000 0 Tropical Bank 419,966,562 0 Total 706,182,973 70,516,190 NOTE 4(a): CASH AT BANK 2005/2006 2004/2005 Stanbic Bank City Branch A/C 0140007511801 63,393,390 273,214,920 Stanbic Bank City Branch A/C 0140007222101 3,348,107 143,946,236 Standard Chartered Bank (Salary Account) 40,731,271 30,743,416 Standard Chartered Bank (Staff Pension Funds) 118,253,364 205,542,955 Nile Bank Ltd. (Rent Account) 30,690,935 60,559,903 Housing Finance Company of Uganda Ltd 500,000 500,000 Tropical Africa Bank 69,460,455 0 Tropical Africa Bank Dollar A/C 41,903,119 0 Total 368,280,641 714,507,430 2005/2006 2004/2005 NOTE 4(b): CASH AT HAND 158,000 11,810 NOTE 5: OTHER DEBTORS 2005/2006 2004/2005 Staff Advances 66,139,301 58,856,931 Rent Receivable 45,514,697 200,224,354 Provision for bad and doubtful debt (2,275,735) (49,997,000) Other debtors 12,175,000 1,600,000 Total 121,553,263 210,684,285 NOTE 6(a): CESS DEBTORS 2005/2006 2004/2005 CESS Debtors 366,460,109 482,577,434 Provision for bad and doubtful debt (18,323,005) (102,691,727) Total 348,137,104 379,885,706 2005/2006 2004/2005 NOTE 6 (b): SIP DEBTORS 442,391,322 220,375,801
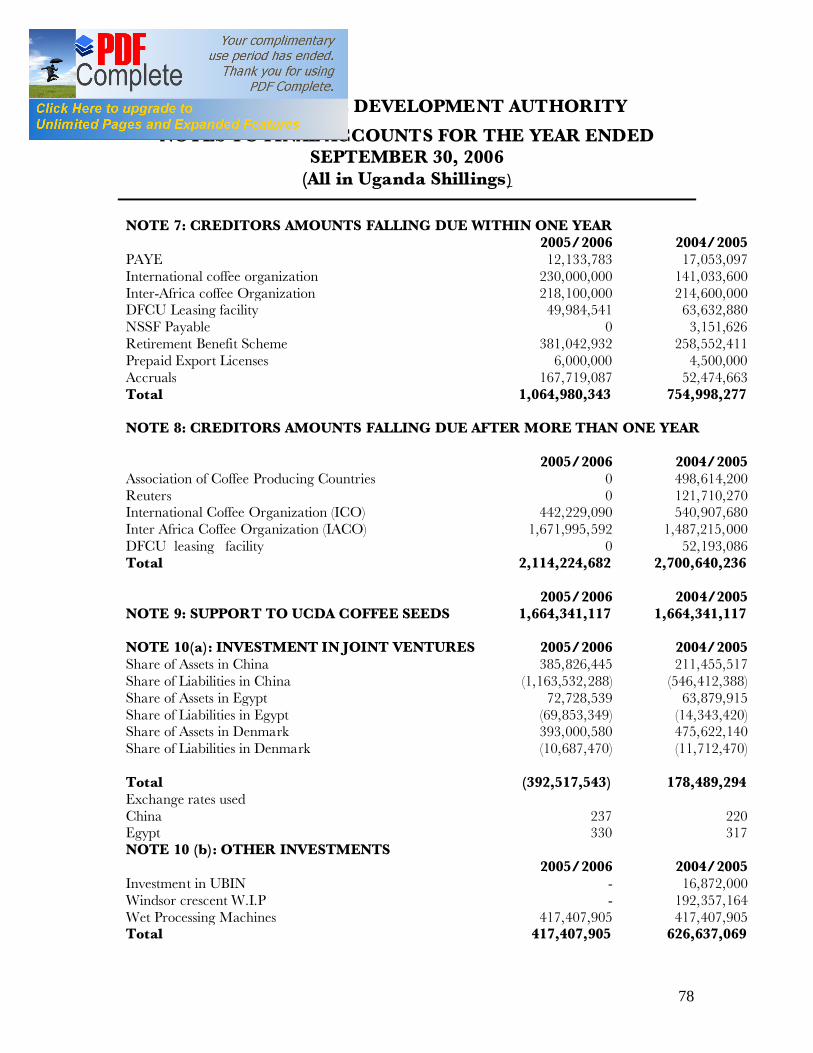
78
UGANDA COFFEE DEVELOPMENT AUTHORITY
NOTES TO FINAL ACCOUNTS FOR THE YEAR ENDED SEPTEMBER 30, 2006
(All in Uganda Shillings)
NOTE 7: CREDITORS AMOUNTS FALLING DUE WITHIN ONE YEAR 2005/2006 2004/2005 PAYE 12,133,783 17,053,097 International coffee organization 230,000,000 141,033,600 Inter-Africa coffee Organization 218,100,000 214,600,000 DFCU Leasing facility 49,984,541 63,632,880 NSSF Payable 0 3,151,626 Retirement Benefit Scheme 381,042,932 258,552,411 Prepaid Export Licenses 6,000,000 4,500,000 Accruals 167,719,087 52,474,663 Total 1,064,980,343 754,998,277 NOTE 8: CREDITORS AMOUNTS FALLING DUE AFTER MORE THAN ONE YEAR 2005/2006 2004/2005 Association of Coffee Producing Countries 0 498,614,200 Reuters 0 121,710,270 International Coffee Organization (ICO) 442,229,090 540,907,680 Inter Africa Coffee Organization (IACO) 1,671,995,592 1,487,215,000 DFCU leasing facility 0 52,193,086 Total 2,114,224,682 2,700,640,236 2005/2006 2004/2005 NOTE 9: SUPPORT TO UCDA COFFEE SEEDS 1,664,341,117 1,664,341,117 NOTE 10(a): INVESTMENT IN JOINT VENTURES 2005/2006 2004/2005 Share of Assets in China 385,826,445 211,455,517 Share of Liabilities in China (1,163,532,288) (546,412,388) Share of Assets in Egypt 72,728,539 63,879,915 Share of Liabilities in Egypt (69,853,349) (14,343,420) Share of Assets in Denmark 393,000,580 475,622,140 Share of Liabilities in Denmark (10,687,470) (11,712,470) Total (392,517,543) 178,489,294 Exchange rates used China 237 220 Egypt 330 317 NOTE 10 (b): OTHER INVESTMENTS 2005/2006 2004/2005 Investment in UBIN - 16,872,000 Windsor crescent W.I.P - 192,357,164 Wet Processing Machines 417,407,905 417,407,905 Total 417,407,905 626,637,069
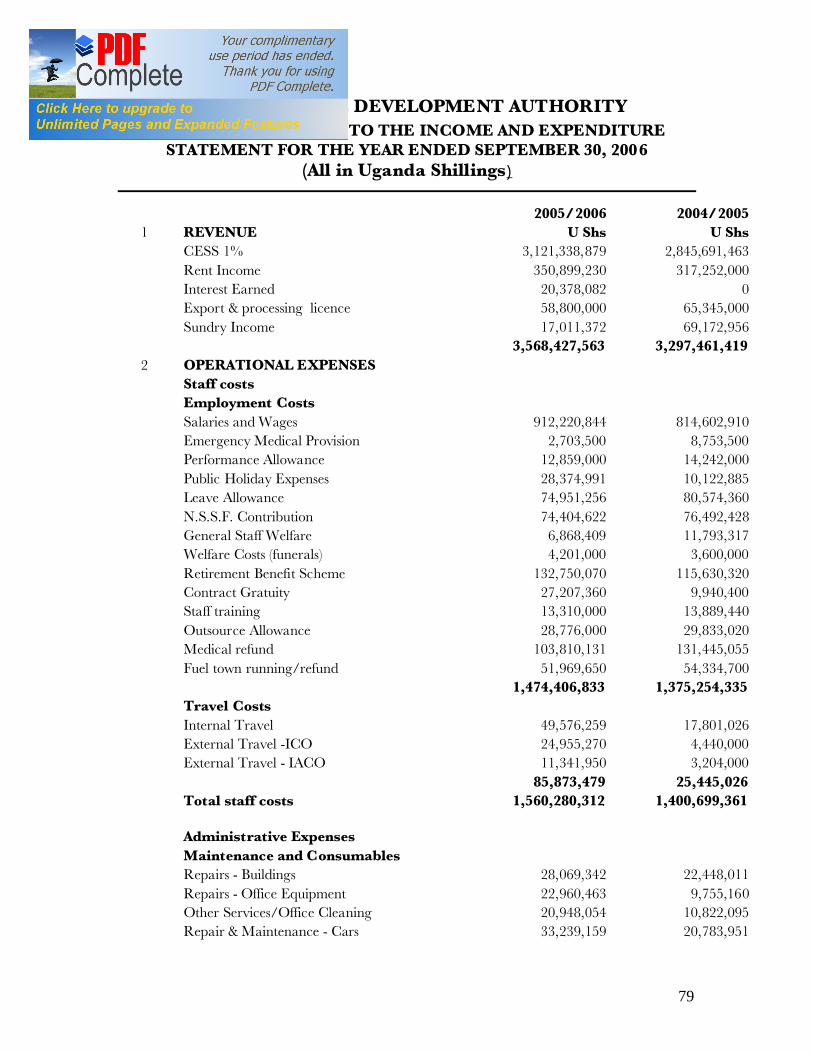
79
UGANDA COFFEE DEVELOPMENT AUTHORITY DETAILED SCHEDULES TO THE INCOME AND EXPENDITURE
STATEMENT FOR THE YEAR ENDED SEPTEMBER 30, 2006 (All in Uganda Shillings)
2005/2006 2004/2005 1 REVENUE U Shs U Shs CESS 1% 3,121,338,879 2,845,691,463 Rent Income 350,899,230 317,252,000 Interest Earned 20,378,082 0 Export & processing licence 58,800,000 65,345,000 Sundry Income 17,011,372 69,172,956 3,568,427,563 3,297,461,419 2 OPERATIONAL EXPENSES Staff costs Employment Costs Salaries and Wages 912,220,844 814,602,910 Emergency Medical Provision 2,703,500 8,753,500 Performance Allowance 12,859,000 14,242,000 Public Holiday Expenses 28,374,991 10,122,885 Leave Allowance 74,951,256 80,574,360 N.S.S.F. Contribution 74,404,622 76,492,428 General Staff Welfare 6,868,409 11,793,317 Welfare Costs (funerals) 4,201,000 3,600,000 Retirement Benefit Scheme 132,750,070 115,630,320 Contract Gratuity 27,207,360 9,940,400 Staff training 13,310,000 13,889,440 Outsource Allowance 28,776,000 29,833,020 Medical refund 103,810,131 131,445,055 Fuel town running/refund 51,969,650 54,334,700 1,474,406,833 1,375,254,335 Travel Costs Internal Travel 49,576,259 17,801,026 External Travel -ICO 24,955,270 4,440,000 External Travel - IACO 11,341,950 3,204,000 85,873,479 25,445,026 Total staff costs 1,560,280,312 1,400,699,361 Administrative Expenses Maintenance and Consumables Repairs - Buildings 28,069,342 22,448,011 Repairs - Office Equipment 22,960,463 9,755,160 Other Services/Office Cleaning 20,948,054 10,822,095 Repair & Maintenance - Cars 33,239,159 20,783,951
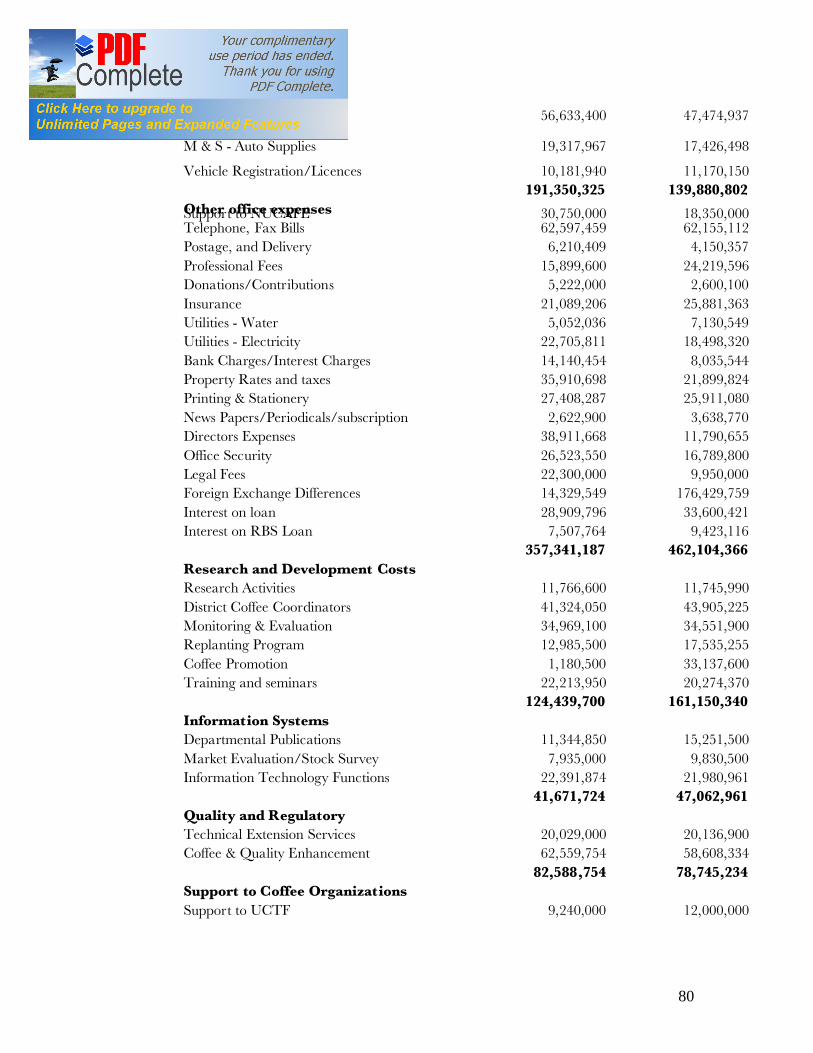
80
Motor vehicle fuel 56,633,400 47,474,937
M & S - Auto Supplies 19,317,967 17,426,498
Vehicle Registration/Licences 10,181,940 11,170,150 191,350,325 139,880,802 Other office expenses Telephone, Fax Bills 62,597,459 62,155,112 Postage, and Delivery 6,210,409 4,150,357 Professional Fees 15,899,600 24,219,596 Donations/Contributions 5,222,000 2,600,100 Insurance 21,089,206 25,881,363 Utilities - Water 5,052,036 7,130,549 Utilities - Electricity 22,705,811 18,498,320 Bank Charges/Interest Charges 14,140,454 8,035,544 Property Rates and taxes 35,910,698 21,899,824 Printing & Stationery 27,408,287 25,911,080 News Papers/Periodicals/subscription 2,622,900 3,638,770 Directors Expenses 38,911,668 11,790,655 Office Security 26,523,550 16,789,800 Legal Fees 22,300,000 9,950,000 Foreign Exchange Differences 14,329,549 176,429,759 Interest on loan 28,909,796 33,600,421 Interest on RBS Loan 7,507,764 9,423,116 357,341,187 462,104,366 Research and Development Costs Research Activities 11,766,600 11,745,990 District Coffee Coordinators 41,324,050 43,905,225 Monitoring & Evaluation 34,969,100 34,551,900 Replanting Program 12,985,500 17,535,255 Coffee Promotion 1,180,500 33,137,600 Training and seminars 22,213,950 20,274,370 124,439,700 161,150,340 Information Systems Departmental Publications 11,344,850 15,251,500 Market Evaluation/Stock Survey 7,935,000 9,830,500 Information Technology Functions 22,391,874 21,980,961 41,671,724 47,062,961 Quality and Regulatory Technical Extension Services 20,029,000 20,136,900 Coffee & Quality Enhancement 62,559,754 58,608,334 82,588,754 78,745,234 Support to Coffee Organizations Support to UCTF 9,240,000 12,000,000
Support to NUCAFE 30,750,000 18,350,000
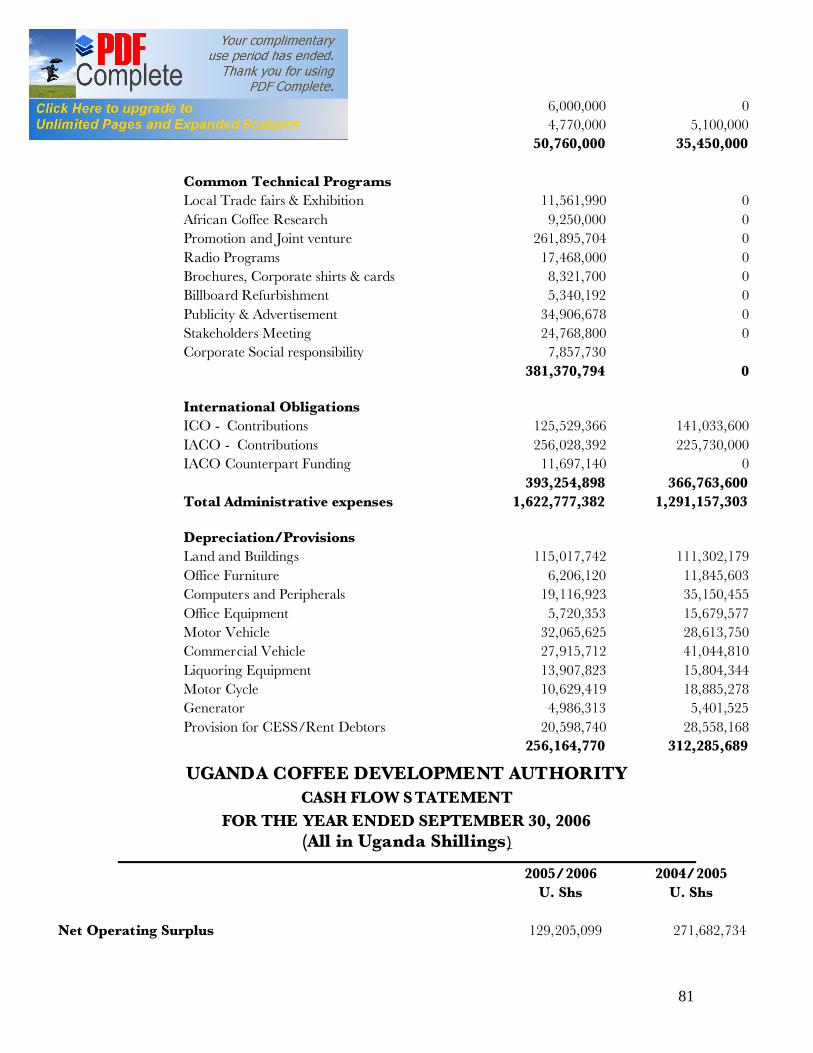
81
UGANDA COFFEE DEVELOPMENT AUTHORITY CASH FLOW S TATEMENT
FOR THE YEAR ENDED SEPTEMBER 30, 2006 (All in Uganda Shillings)
2005/2006 2004/2005 U. Shs U. Shs Net Operating Surplus 129,205,099 271,682,734
Support to CORI 6,000,000 0 Support to UCRA 4,770,000 5,100,000 50,760,000 35,450,000 Common Technical Programs Local Trade fairs & Exhibition 11,561,990 0 African Coffee Research 9,250,000 0 Promotion and Joint venture 261,895,704 0 Radio Programs 17,468,000 0 Brochures, Corporate shirts & cards 8,321,700 0 Billboard Refurbishment 5,340,192 0 Publicity & Advertisement 34,906,678 0 Stakeholders Meeting 24,768,800 0 Corporate Social responsibility 7,857,730 381,370,794 0 International Obligations ICO - Contributions 125,529,366 141,033,600 IACO - Contributions 256,028,392 225,730,000 IACO Counterpart Funding 11,697,140 0 393,254,898 366,763,600 Total Administrative expenses 1,622,777,382 1,291,157,303 Depreciation/Provisions Land and Buildings 115,017,742 111,302,179 Office Furniture 6,206,120 11,845,603 Computers and Peripherals 19,116,923 35,150,455 Office Equipment 5,720,353 15,679,577 Motor Vehicle 32,065,625 28,613,750 Commercial Vehicle 27,915,712 41,044,810 Liquoring Equipment 13,907,823 15,804,344 Motor Cycle 10,629,419 18,885,278 Generator 4,986,313 5,401,525 Provision for CESS/Rent Debtors 20,598,740 28,558,168
256,164,770 312,285,689
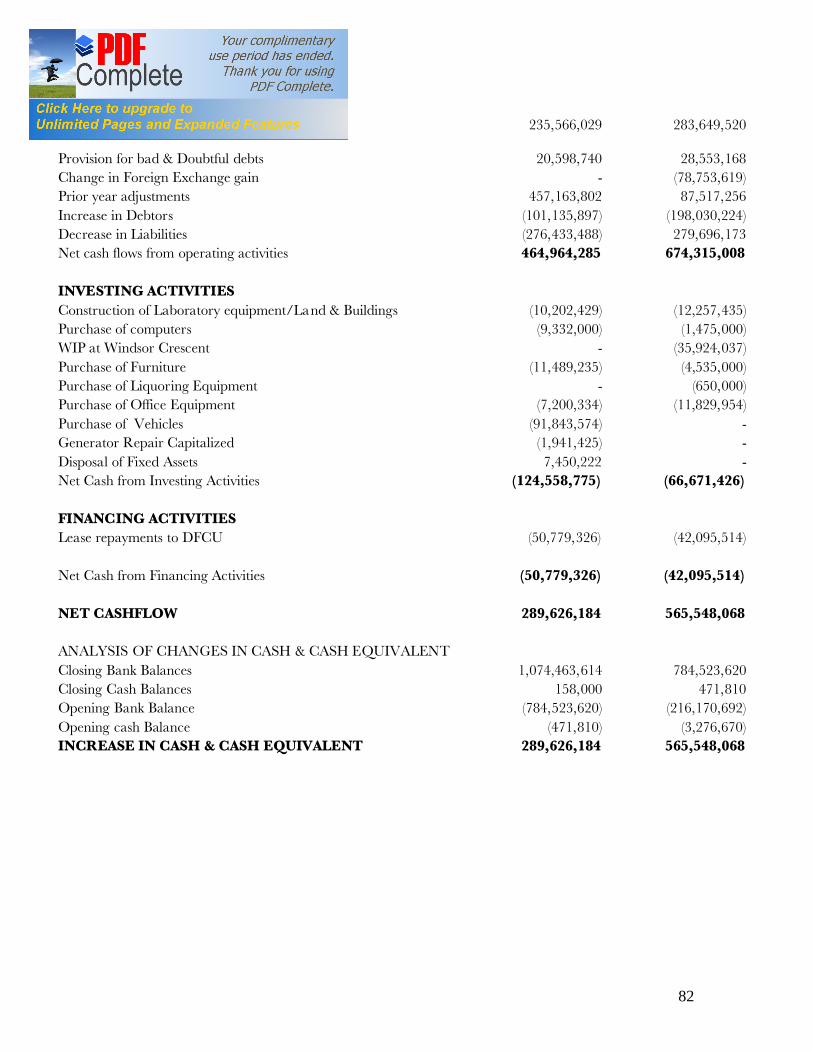
82
Depreciation 235,566,029 283,649,520
Provision for bad & Doubtful debts
20,598,740 28,553,168 Change in Foreign Exchange gain - (78,753,619) Prior year adjustments 457,163,802 87,517,256 Increase in Debtors (101,135,897) (198,030,224) Decrease in Liabilities (276,433,488) 279,696,173 Net cash flows from operating activities 464,964,285 674,315,008 INVESTING ACTIVITIES Construction of Laboratory equipment/Land & Buildings (10,202,429) (12,257,435) Purchase of computers (9,332,000) (1,475,000) WIP at Windsor Crescent - (35,924,037) Purchase of Furniture (11,489,235) (4,535,000) Purchase of Liquoring Equipment - (650,000) Purchase of Office Equipment (7,200,334) (11,829,954) Purchase of Vehicles (91,843,574) - Generator Repair Capitalized (1,941,425) - Disposal of Fixed Assets 7,450,222 - Net Cash from Investing Activities (124,558,775) (66,671,426) FINANCING ACTIVITIES Lease repayments to DFCU (50,779,326) (42,095,514) Net Cash from Financing Activities (50,779,326) (42,095,514) NET CASHFLOW 289,626,184 565,548,068 ANALYSIS OF CHANGES IN CASH & CASH EQUIVALENT Closing Bank Balances 1,074,463,614 784,523,620 Closing Cash Balances 158,000 471,810 Opening Bank Balance (784,523,620) (216,170,692) Opening cash Balance (471,810) (3,276,670) INCREASE IN CASH & CASH EQUIVALENT 289,626,184 565,548,068