annual surmont sagd performance review approvals … · surmont sagd performance review approvals...
TRANSCRIPT

Annual Surmont SAGD Performance Review Approvals 9426 and 11596
Surface Operations
April 11, 2013
Calgary, Alberta, Canada
Contents of Presentation
2
• Introduction• Surmont Overview and Highlights• Facilities & Facility Performance 3.1.2(1,2)• Measurement and Reporting 3.1.2 (3)• Water Production, Injection, and Uses 3.1.2(4)• Sulphur Production 3.1.2 (5)• Environmental Issues 3.1.2(6)• Compliance Confirmation 3.1.2(7)• Non-Compliance Issues 3.1.2(8)• Future Plans 3.1.2(9)

Introduction

Ownership and Approvals
• 50/50 joint venture between ConocoPhillips and TOTAL E&P Canada Ltd; Operated by ConocoPhillips
• Approval history: 1997 - ERCB Project Approval - Pilot 2003 - ERCB Project Approval - Commercial 2007 - First Steam at Phase1 2008 - Approval of Phase 2 2009 - Approval of Phase 2 Amendment 2010 - Construction Start at Phase 2 2011 - Approval of Phase 2 Expansion, E-SAGD and GT-OTSG Projects 2012 - Multiple Amendment Submissions for Scheme 9426
- Phase 1- Well pad 103 - approved
- Phase 2- Condition 9 – Well Pads 264-2 and 263-1 – approved- Condition 10 – Operating Strategy – approved- HWY 881 Steam Pipeline Crossing – approved
Subsection 3.1.2 (1) 4

Surmont Overview and Highlights
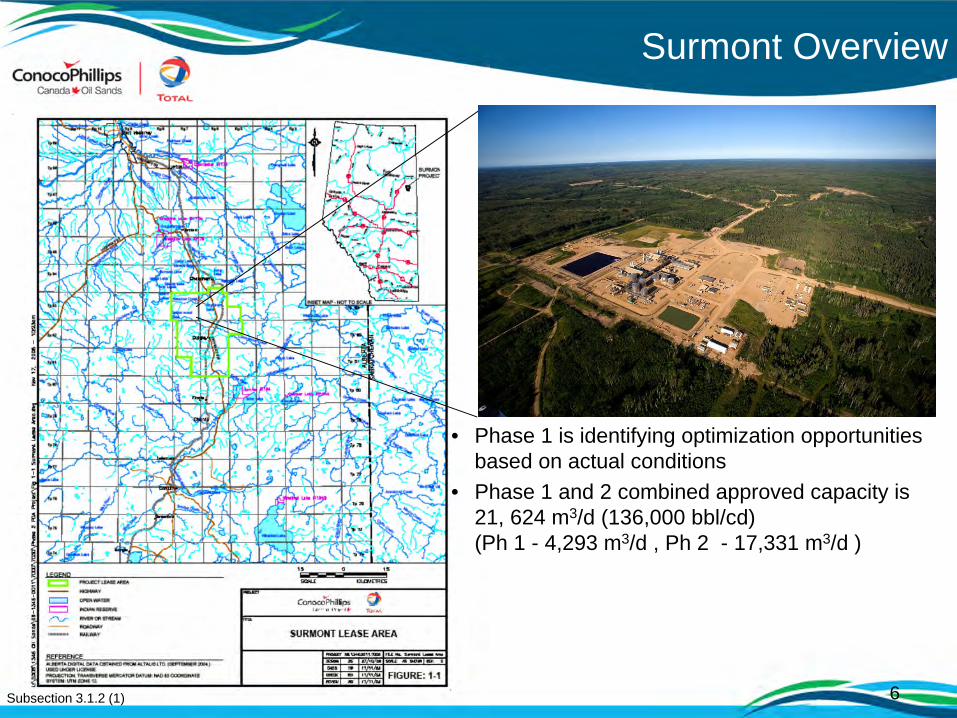
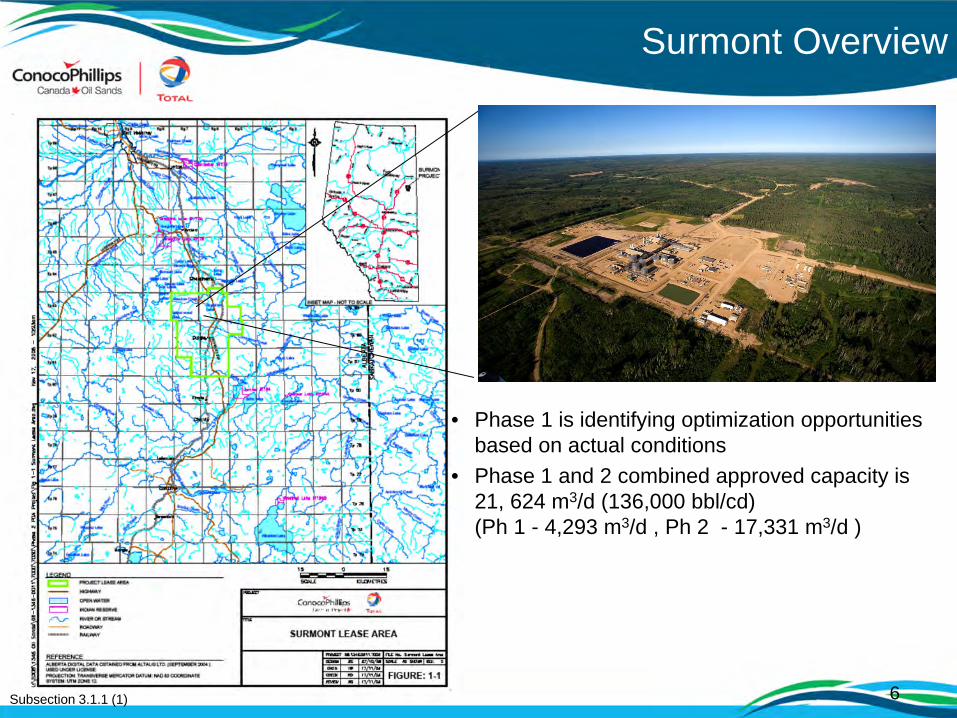
• Phase 1 is identifying optimization opportunities based on actual conditions
• Phase 1 and 2 combined approved capacity is 21, 624 m3/d (136,000 bbl/cd) (Ph 1 - 4,293 m3/d , Ph 2 - 17,331 m3/d )
Surmont Overview
Subsection 3.1.2 (1) 6

7
2012 Highlights
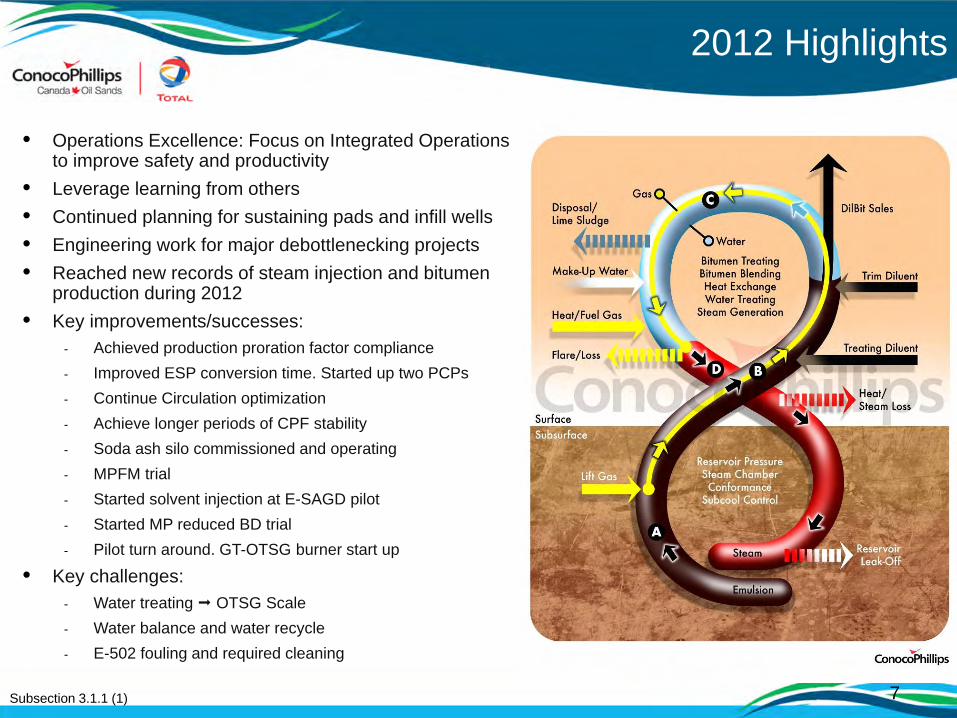
• Operations Excellence: Focus on Integrated Operations to improve safety and productivity
• Leverage learning from others• Continued planning for sustaining pads and infill wells• Engineering work for major debottlenecking projects • Reached new records of steam injection and bitumen
production during 2012• Key improvements/successes:
- Achieved production proration factor compliance- Improved ESP conversion time. Started up two PCPs- Continue Circulation optimization- Achieve longer periods of CPF stability- Soda ash silo commissioned and operating- MPFM trial - Started solvent injection at E-SAGD pilot- Started MP reduced BD trial - Pilot turn around. GT-OTSG burner start up
• Key challenges:- Water treating OTSG Scale- Water balance and water recycle- E-502 fouling and required cleaning
Subsection 3.1.2 (1)

D ata as o f January 31 , 2013
0
5,000
10,000
15,000
20,000
25,000
30,000
35,000
Oct
-07
Jan-
08
Apr
-08
Jul-0
8
Oct
-08
Jan-
09
Apr
-09
Jul-0
9
Oct
-09
Jan-
10
Apr
-10
Jul-1
0
Oct
-10
Jan-
11
Apr
-11
Jul-1
1
Oct
-11
Jan-
12
Apr
-12
Jul-1
2
Oct
-12
Jan-
13
Gro
ss P
rodu
ctio
n (b
oepd
)
0
20,000
40,000
60,000
80,000
100,000
120,000
Stea
m In
ject
ion
(cw
ebpd
)
Daily produc tion P roduc tion record Daily S team S team record
8
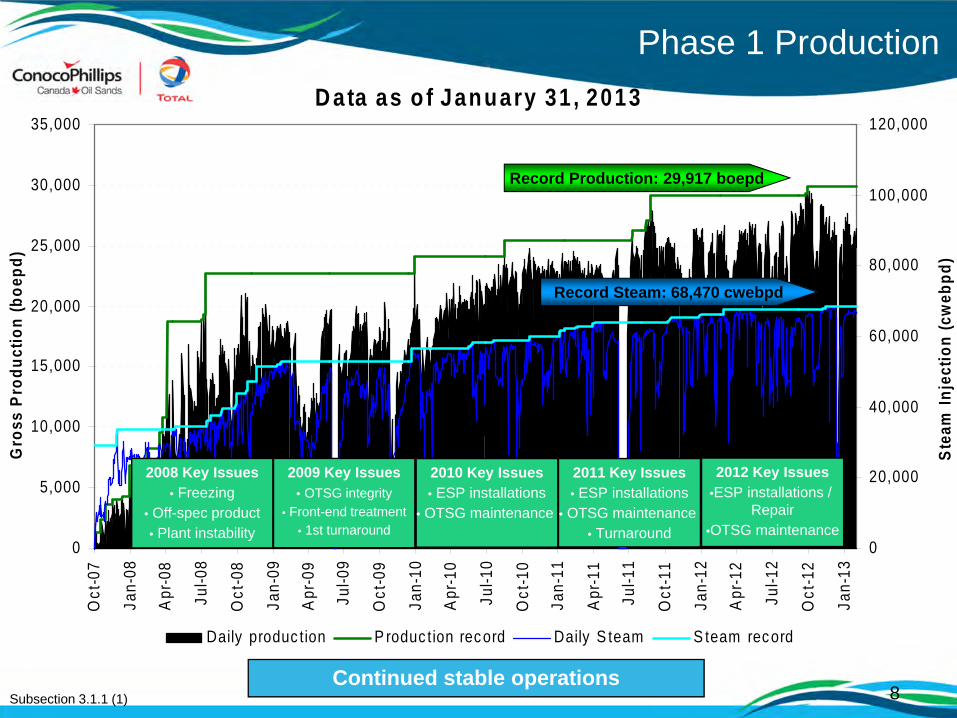
Phase 1 Production
•2008 Key Issues• Freezing
• Off-spec product• Plant instability
•2009 Key Issues• OTSG integrity
• Front-end treatment• 1st turnaround
•2010 Key Issues• ESP installations
• OTSG maintenance
•Continued stable operationsSubsection 3.1.2 (1)
•2011 Key Issues• ESP installations
• OTSG maintenance • Turnaround
•2012 Key Issues•ESP installations /
Repair•OTSG maintenance
•Record production: 29,917 boepd
•Record Steam: 68,470 cwebpd

Key actions to reduce lost production: Optimize treating capacity and frequency of boiler pigging, optimize downtime for ESP installs, continue to optimize well conformance and subcool and reduce downtime for ESP replacement
2012 Lost Production Roll Up (2437 bbl/d)
Lost Production Rollup
9
bbl/d m3/d bbl/d m3/d bbl/d m3/d bbl/d m3/dTotal Losses 4979.0 791.6 1858.0 295.4 3376.1 536.7 2437.0 387.5
Wells 405.0 64.4 912.0 144.7 1354.5 215.3 1233.0 196.0Facility 4574.0 727.2 898.0 142.8 2021.6 321.4 1204.0 191.4Other 0.0 0.0 48.0 7.6 0.0 0.0 0.0 0.0
2009 2010 2011 2012
424378
339 325
201178
106 97 81 6642 38 26
-555
136
-600
-400
-200
0
200
400
01.02.04 Facility:Process Upsets:Unit 05 - Steam
Generation
02.02.05 Wells:Artificial Lift:
Planned ArtificialLift Replacement
01.11.03 Facility:Facility Capacity:Unit 04 - Water
Treatment
02.02.02 Wells:Artificial Lift:
Failure /Replacement
02.02.01 Wells:Artificial Lift:
Optimization /Troubleshooting
01.11.04 Facility:Facility Capacity:Unit 05 - Steam
Generation
02.04.02 Wells:Downhole
Optimization:Upgrade of lift
system
02.06.06 Wells:Downhole
Impairment:Optimization /
Conformance /Troubleshooting
01.11.05 Facility:Facility Capacity:Unit 05 - Planned
SteamGeneration/OTSG
Pigging
01.02.03 Facility:Process Upsets:Unit 04 - Water
Treatment
01.07.01 Facility:Power and Fuel:
Third party powersupply failure
02.06.01 Wells:Downhole
Impairment:Subcool control
02.06.02 Wells:Downhole
Impairment:Downhole
obstruction
Flush Combined Misc
Loss
(bbl
/d)
Boiler Pigging
ALS Conversions
E502 Work
ESP Failures
Well Optimization
C-Gen Repairs
ALS Upgrades
Plugged GLUpgrades
Subcool Control on 101P02102P03 Liner
Issue
D-Gen Pigging
WLS Problems, Turbidity issues
ATCO Power Outage
Flush Production
Combined Miscellaneous
Subsection 3.1.2 (2a)

Surmont Oil Sands Commercial ProjectApproval 9426I
Subsection 3.1.2 (1) Facilities
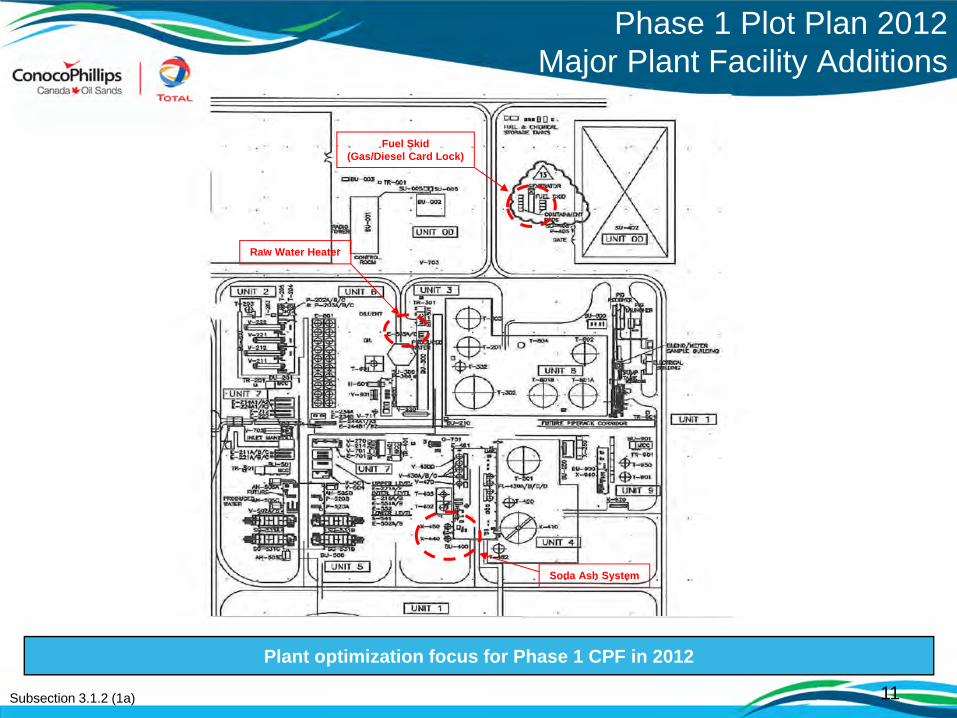
Phase 1 Plot Plan 2012 Major Plant Facility Additions
Subsection 3.1.2 (1a)
Plant optimization focus for Phase 1 CPF in 2012
11
Soda Ash System
Raw Water Heater
Fuel Skid(Gas/Diesel Card Lock)

Phase 1 Plot Plan - Pad 101 - 2012 Major Plant Facility Additions
Subsection 3.1.2 (1a)
Artificial Lift Program added 6 new wells in 2012
12
- Infill Producer 11- Infill Producer 12
- Infill Pair 19- Infill Pair 20

Phase 1 Plot Plan - Pad 102 - 2012 Major Plant Facility Additions
Subsection 3.1.2 (1a)
Artificial Lift Program added 4 new units in 2012
13
- P15 ESP- P09 ESP- P16 ESP- P14 ESP

Plant Schematic
Subsection 3.1.2 (1b)
Raw WaterHeater Upgrade
14
BTU Analyzer
Automated Soda Ash
OTSG ConvectionBox Replacement
Belly Drain
Surmont Operations2012 Focus
• 2012 – Capital Projects– Fuel gas measurement: Btu analyzer installed in 2012 project, currently
online and measuring.– Spare OTSG Economizer with metallurgy improvements ordered.
• 2012 – Optimization Focus– Steam optimization
• Steam production and delivery development: boiler master control enhancements.
• Burner Management System (BMS) optimization: Minimize nuisance trips on low flow deviation and optimize flowrate for each pass maximizing steam quality.
• Steam production development: Complete CFD for S1 OTSGs.
2012 optimization and opportunity development focusSubsection 3.1.2 (1c) 15
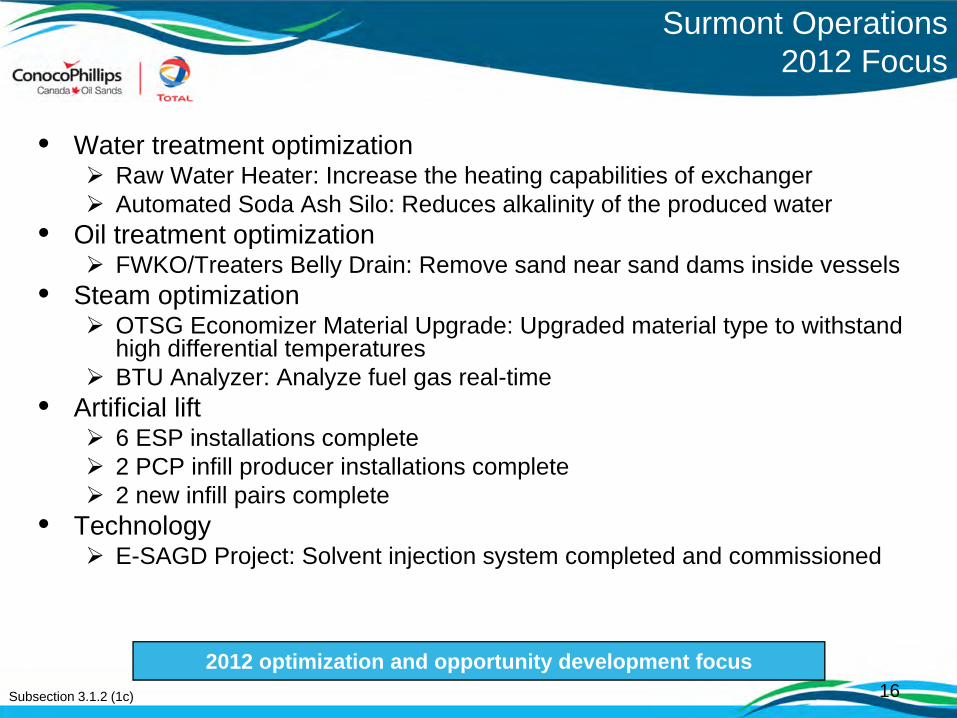
Surmont Operations2012 Focus
• Water treatment optimization Raw Water Heater: Increase the heating capabilities of exchanger Automated Soda Ash Silo: Reduces alkalinity of the produced water
• Oil treatment optimization FWKO/Treaters Belly Drain: Remove sand near sand dams inside vessels
• Steam optimization OTSG Economizer Material Upgrade: Upgraded material type to withstand
high differential temperatures BTU Analyzer: Analyze fuel gas real-time
• Artificial lift 6 ESP installations complete 2 PCP infill producer installations complete 2 new infill pairs complete
• Technology E-SAGD Project: Solvent injection system completed and commissioned
2012 optimization and opportunity development focusSubsection 3.1.2 (1c) 16

Surmont Oil Sands Commercial ProjectApproval 9426I
Subsection 3.1.2 (2) Facility Performance
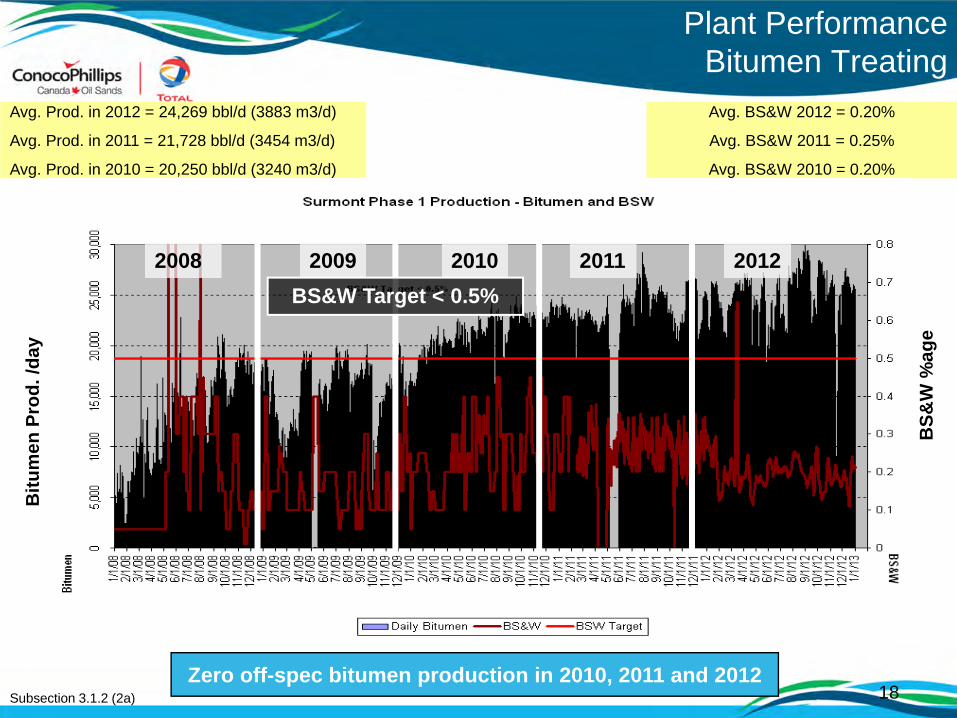
Plant PerformanceBitumen Treating
Zero off-spec bitumen production in 2010, 2011 and 2012Subsection 3.1.2 (2a)
Avg. Prod. in 2012 = 24,269 bbl/d (3883 m3/d)
Avg. Prod. in 2011 = 21,728 bbl/d (3454 m3/d)
Avg. Prod. in 2010 = 20,250 bbl/d (3240 m3/d)
Avg. BS&W 2012 = 0.20%
Avg. BS&W 2011 = 0.25%
Avg. BS&W 2010 = 0.20%
Bitu
men
Pro
d. /d
ay
BS&
W %
age
20112008 2009 2010 2012BS&W Target < 0.5%
18

Surmont FacilitiesModifications
1. 2012 – Capital Projects
• Front end vessels treating: Install belly drain system on FWKOs and treaters vessels (March 10, 2012 start-up)
2. 2012 – Production Increase
• Reduced <1% prod. loss to process and capacity
• Produced water cooling improvements:Increase PW coolers ASC to 580m3/hr combined
• Emulsion treating improvements:Increase emulsion ASC to 740 m3/hr combined
• Front end chemical injection optimization: EB (<400 ppm) and REB (<150 ppm) averagely
3. 2012 – Opex Reduction
• Prolonged PW coolers cleaning cycle time:Target 120 days (Q3/2012)
• Optimized de-sand cycle & trucking cost; • Target save ~$ 250K trucking cost by lowering
de-sand on treaters 3 times a week vs 5 times
2012 optimization and opportunity development focusSubsection 3.1.2 (2a)
LPO 40K BBL
Zero Prod. Loss
Prod
uctio
n w
eekl
y av
erag
e (b
bl/d
ay)
%ag
e fr
ont e
nd lo
ss
19
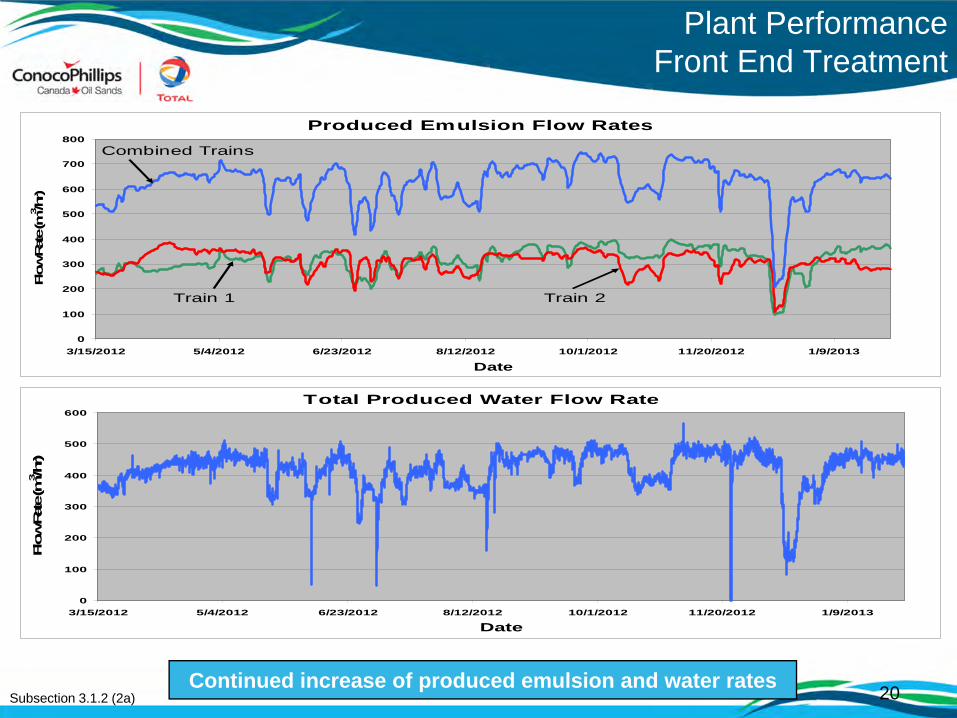
Plant PerformanceFront End Treatment
Continued increase of produced emulsion and water ratesSubsection 3.1.2 (2a) 20
Produced Emulsion Flow Rates
0
100
200
300
400
500
600
700
800
3/15/2012 5/4/2012 6/23/2012 8/12/2012 10/1/2012 11/20/2012 1/9/2013
Date
Flow
Rate (m
3 /hr)
Train 2Train 1
Combined Trains
Total Produced Water Flow Rate
0
100
200
300
400
500
600
3/15/2012 5/4/2012 6/23/2012 8/12/2012 10/1/2012 11/20/2012 1/9/2013
Date
Flow
Rate (m
3 /hr)

Plant PerformanceBitumen Treating
Front end vessels online cleaningKey Issue: Automated de-sand system is not able to remove solid near sand dams inside the vessels
Issue mitigated: Belly drain systems, manual, are installed
Key findings:- Optimized emulsion through put – Optimized to 770 m3/hr combined- PW trim coolers rune time increase to 120 days before offline cleaning- Lowered de-sand cycle and reduced de-sanding trucking cost- Treatment - oil in water <300 ppm 90 % of year- EB normal operating ranges lowered to (450 to 350ppm) and - REB normal operating ranges lowered to (150 to 100ppm)- Maintained BS&W <0.5
Subsection 3.1.2 (2a)
De-Sand Tank
Internal Sand Dam
FWKO’s/Treaters
Current De-Sand System
Existing Belly Drain Piping
Proposed Belly Drain Piping Additions
Camlock Truck Off Connection De-Sand Slurry Header
21
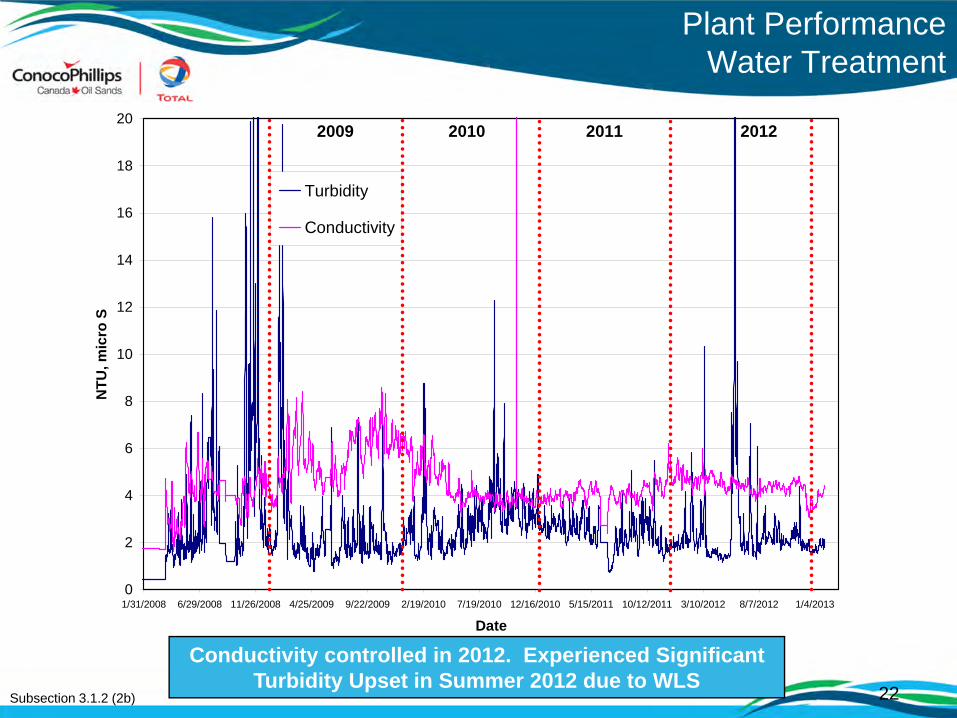
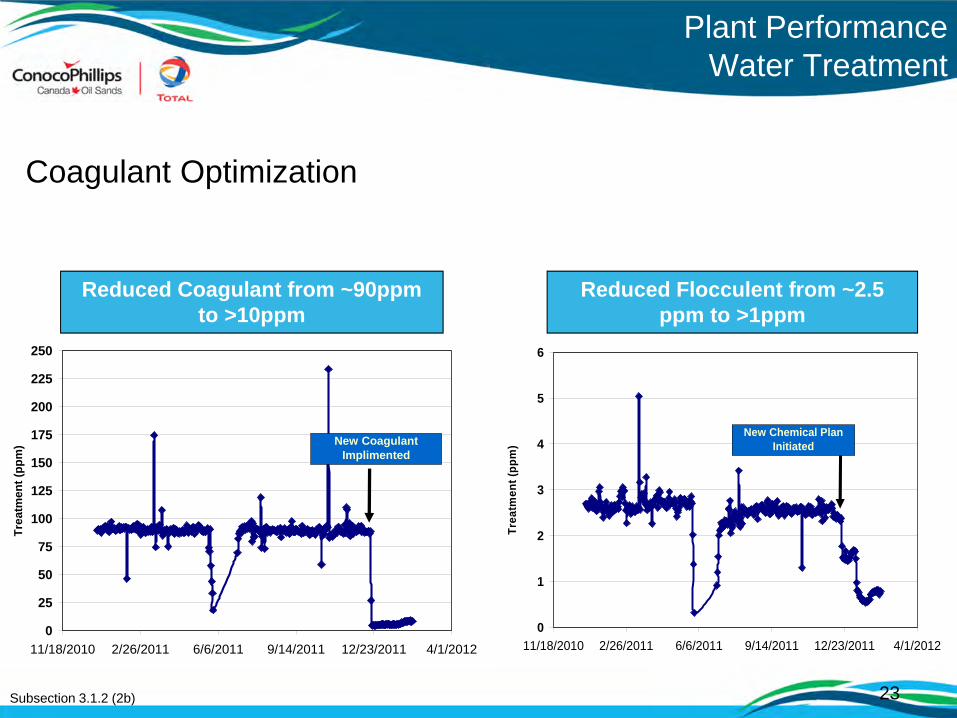
Plant PerformanceWater Treatment
Subsection 3.1.2 (2b)
Conductivity controlled in 2012. Experienced Significant Turbidity Upset in Summer 2012 due to WLS
0
2
4
6
8
10
12
14
16
18
20
1/31/2008 6/29/2008 11/26/2008 4/25/2009 9/22/2009 2/19/2010 7/19/2010 12/16/2010 5/15/2011 10/12/2011 3/10/2012 8/7/2012 1/4/2013
Date
NTU
, mic
ro S
Turbidity
Conductivity
2009 2010 2011 2012
22
0
1
2
3
4
5
6
11/18/2010 2/26/2011 6/6/2011 9/14/2011 12/23/2011 4/1/2012
Trea
tmen
t (pp
m)
New Chemical Plan Initiated
0
25
50
75
100
125
150
175
200
225
250
11/18/2010 2/26/2011 6/6/2011 9/14/2011 12/23/2011 4/1/2012
Trea
tmen
t (pp
m) New Coagulant
Implimented
Reduced Coagulant from ~90ppm to >10ppm
Reduced Flocculent from ~2.5 ppm to >1ppm
Plant PerformanceWater Treatment
Subsection 3.1.2 (2b) 23
Coagulant Optimization
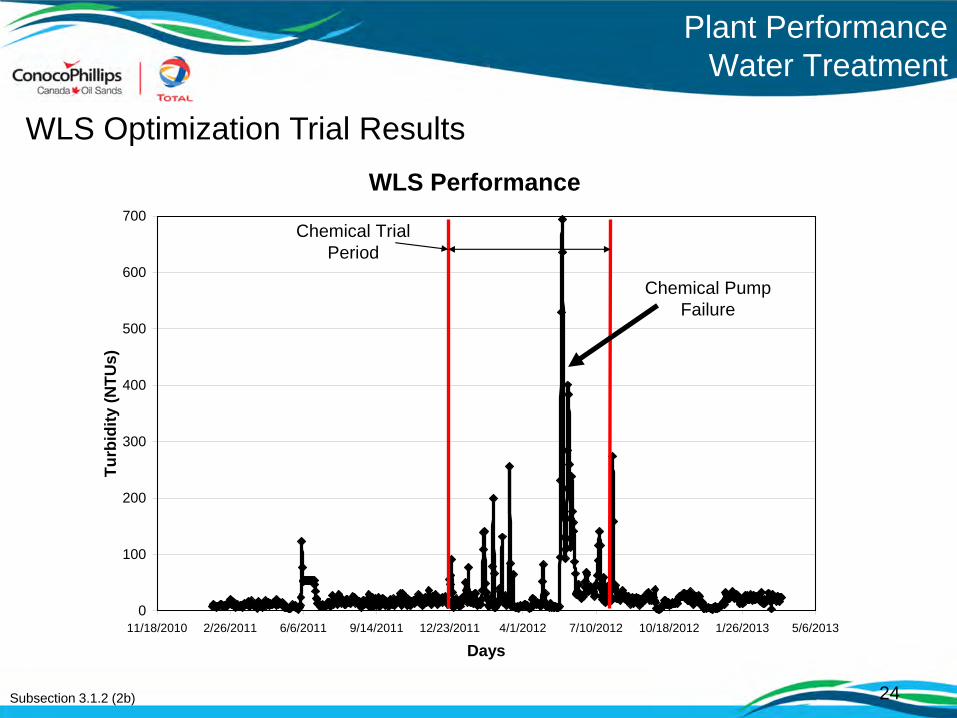
Plant PerformanceWater Treatment
Subsection 3.1.2 (2b) 24
WLS Optimization Trial ResultsWLS Performance
0
100
200
300
400
500
600
700
11/18/2010 2/26/2011 6/6/2011 9/14/2011 12/23/2011 4/1/2012 7/10/2012 10/18/2012 1/26/2013 5/6/2013
Days
Turb
idity
(NTU
s)
Chemical Trial Period
Chemical Pump Failure

Soda Ash System
WLS
440 m3/hr PW
53 m3/hr RW @ 12%
80 m3/hr Super + BD
WLS PW Capacity Limited due to RW Minimum (Carbonate Deficient)
573 m3/hr BFW
Automated Soda Ash System
• Historically The WLS struggles below 12% RW factor, Study underway to “find” new RW Minimum for WLS
• Goal of Soda Ash system was to allow WLS to operate at lower raw water cuts and increase throughput through the facility
• System complete Dec, 2012 and online Jan, 2013
25Subsection 3.1.2 (2b)

Soda Ash System
• Able to sustain WLS performance during low raw water cuts –NO UPSETS
• Improvements on WRR during BD recycle Trial
Surmont WLS Inlet Raw Water Cut
0
0.05
0.1
0.15
0.2
0.25
0.3
0.35
11/3/2011 12/23/2011 2/11/2012 4/1/2012 5/21/2012 7/10/2012 8/29/2012 10/18/2012 12/7/2012 1/26/2013 3/17/2013
Raw
Wat
er K
-Fac
tor
Sustained Lower Raw Water Cuts at Full Rates--WITHOUT WLS UPSETS.
Soda Ash System Online
26Subsection 3.1.2 (2b)
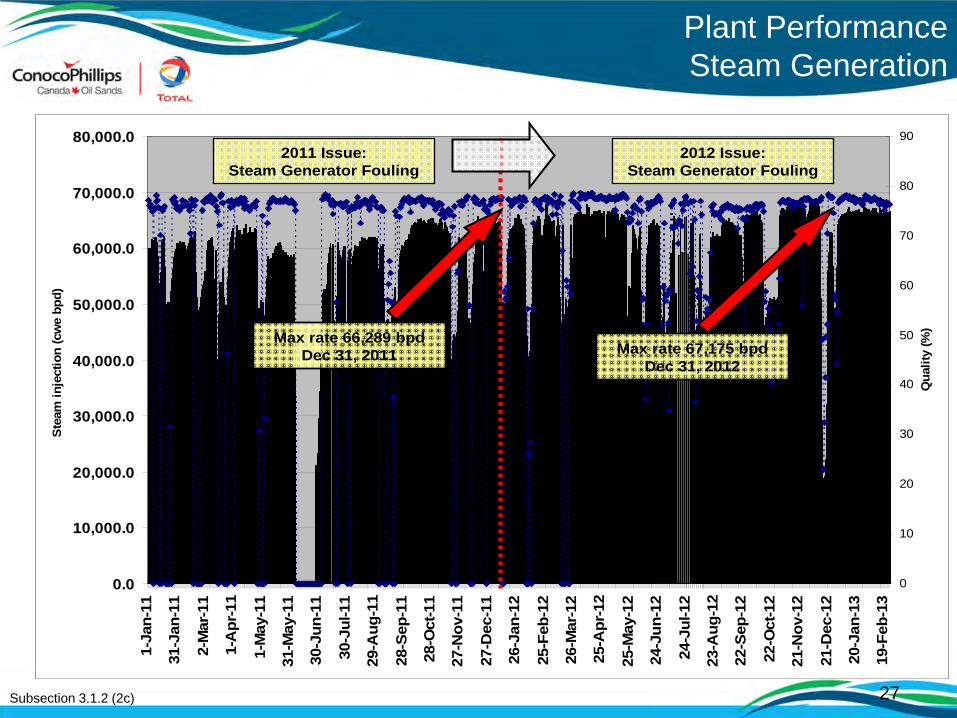
Plant PerformanceSteam Generation
Subsection 3.1.2 (2c) 27
0.0
10,000.0
20,000.0
30,000.0
40,000.0
50,000.0
60,000.0
70,000.0
80,000.01-
Jan-
11
31-J
an-1
1
2-M
ar-1
1
1-A
pr-1
1
1-M
ay-1
1
31-M
ay-1
1
30-J
un-1
1
30-J
ul-1
1
29-A
ug-1
1
28-S
ep-1
1
28-O
ct-1
1
27-N
ov-1
1
27-D
ec-1
1
26-J
an-1
2
25-F
eb-1
2
26-M
ar-1
2
25-A
pr-1
2
25-M
ay-1
2
24-J
un-1
2
24-J
ul-1
2
23-A
ug-1
2
22-S
ep-1
2
22-O
ct-1
2
21-N
ov-1
2
21-D
ec-1
2
20-J
an-1
3
19-F
eb-1
3
Stea
m in
ject
ion
(cw
e bp
d)
0
10
20
30
40
50
60
70
80
90
Qua
lity
(%)
2011 Issue:Steam Generator Fouling
2012 Issue:Steam Generator Fouling
Max rate 67,175 bpdDec 31, 2012
Max rate 66,289 bpdDec 31, 2011
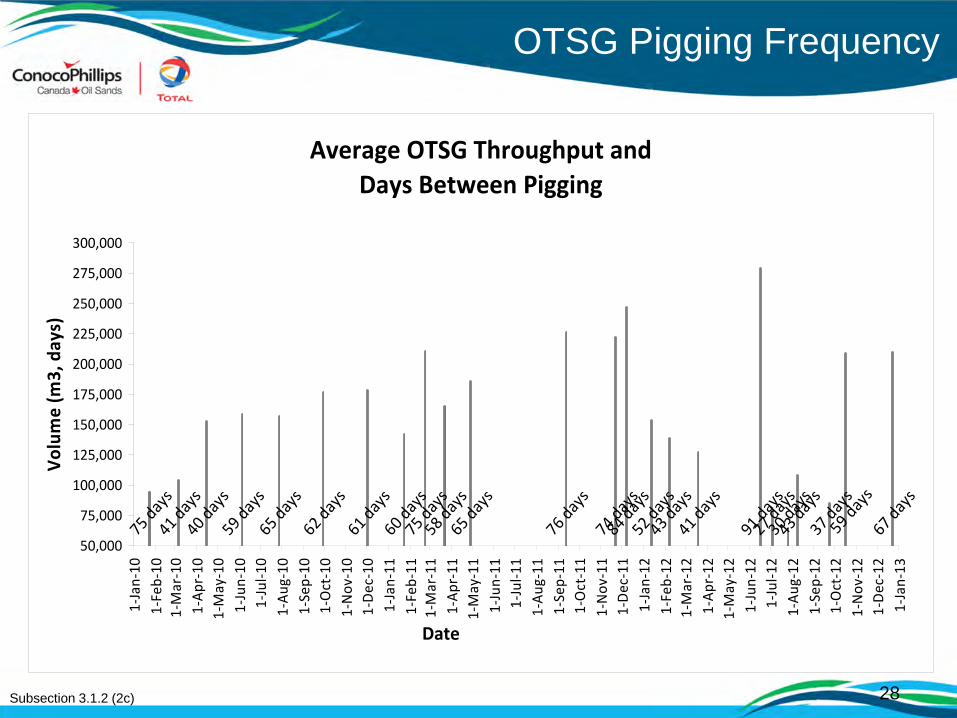
OTSG Pigging Frequency
28
Average OTSG Throughput and Days Between Pigging
75 days
41 days
40 days
59 days
65 days
62 days
61 days
60 days
75 days
58 days
65 days
76 days
74 days
84 days
52 days
43 days
41 days
91 days
27 days
30 days
37 days
67 days
43 days
59 days
50,000
75,000
100,000
125,000
150,000
175,000
200,000
225,000
250,000
275,000
300,000
1‐Jan‐10
1‐Feb‐10
1‐Mar‐10
1‐Ap
r‐10
1‐May‐10
1‐Jun‐10
1‐Jul‐1
01‐Au
g‐10
1‐Sep‐10
1‐Oct‐10
1‐Nov
‐10
1‐De
c‐10
1‐Jan‐11
1‐Feb‐11
1‐Mar‐11
1‐Ap
r‐11
1‐May‐11
1‐Jun‐11
1‐Jul‐1
11‐Au
g‐11
1‐Sep‐11
1‐Oc t‐11
1‐Nov
‐11
1‐De
c‐11
1‐Jan‐12
1‐Feb‐12
1‐Mar‐12
1‐Ap
r‐12
1‐May‐12
1‐Jun‐12
1‐Jul‐1
21‐Au
g‐12
1‐Sep‐12
1‐Oct‐12
1‐Nov
‐12
1‐De
c‐12
1‐Jan‐13
Date
Volume (m
3, days)
Subsection 3.1.2 (2c)
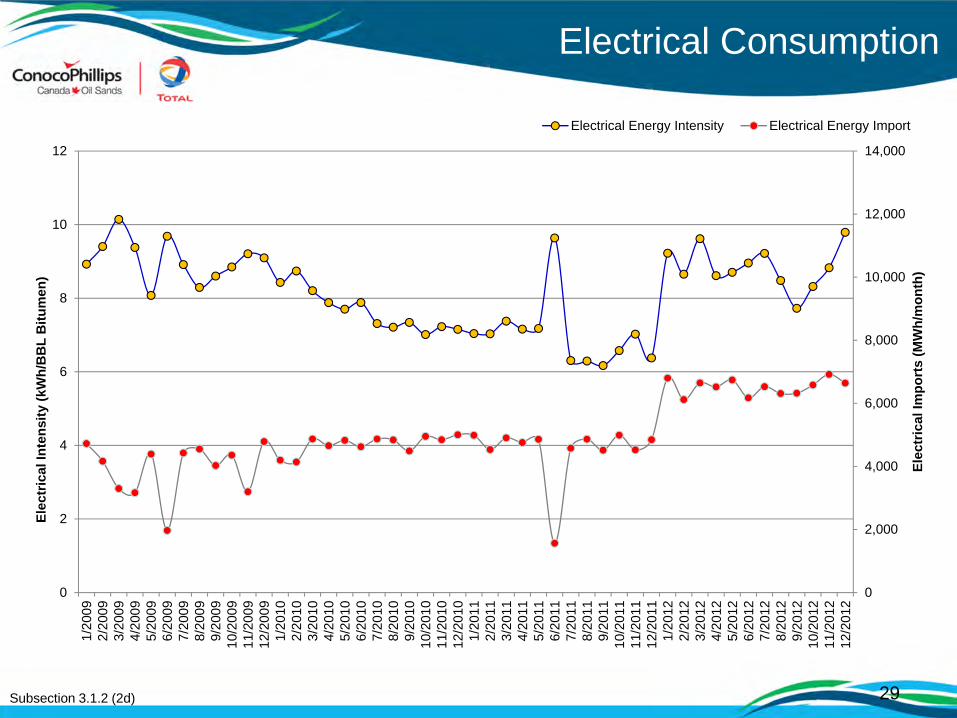
Electrical Consumption
0
2,000
4,000
6,000
8,000
10,000
12,000
14,000
0
2
4
6
8
10
12
1/20
092/
2009
3/20
094/
2009
5/20
096/
2009
7/20
098/
2009
9/20
0910
/200
911
/200
912
/200
91/
2010
2/20
103/
2010
4/20
105/
2010
6/20
107/
2010
8/20
109/
2010
10/2
010
11/2
010
12/2
010
1/20
112/
2011
3/20
114/
2011
5/20
116/
2011
7/20
118/
2011
9/20
1110
/201
111
/201
112
/201
11/
2012
2/20
123/
2012
4/20
125/
2012
6/20
127/
2012
8/20
129/
2012
10/2
012
11/2
012
12/2
012
Elec
tric
al Im
port
s (M
Wh/
mon
th)
Elec
tric
al In
tens
ity (k
Wh/
BB
L B
itum
en)
Electrical Energy Intensity Electrical Energy Import
Subsection 3.1.2 (2d) 29
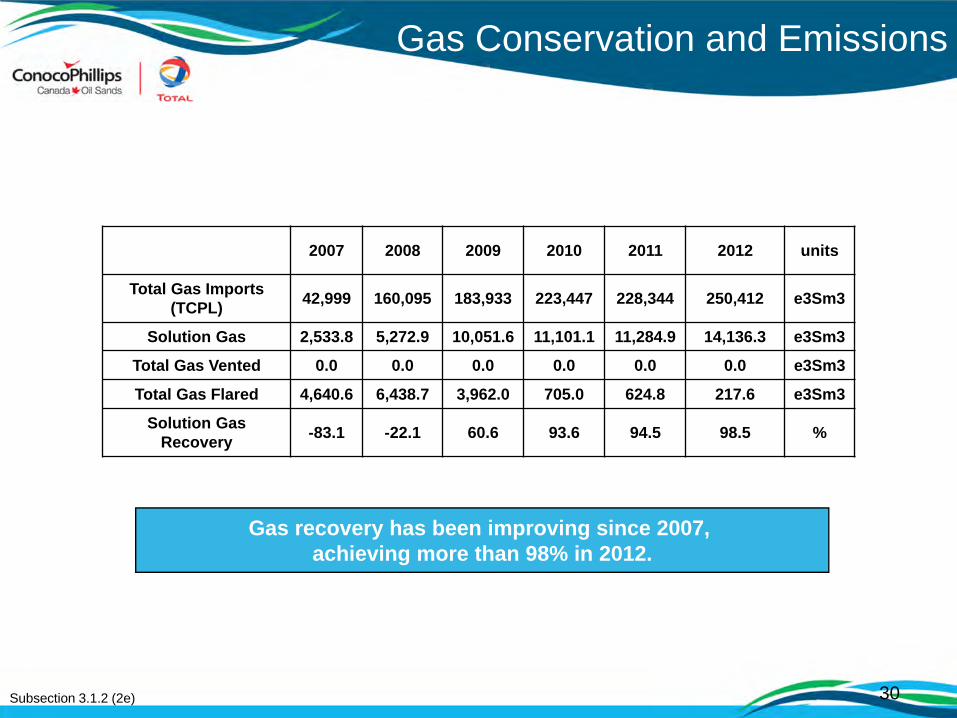
Gas Conservation and Emissions
Gas recovery has been improving since 2007, achieving more than 98% in 2012.
Subsection 3.1.2 (2e)
2007 2008 2009 2010 2011 2012 units
Total Gas Imports (TCPL) 42,999 160,095 183,933 223,447 228,344 250,412 e3Sm3
Solution Gas 2,533.8 5,272.9 10,051.6 11,101.1 11,284.9 14,136.3 e3Sm3
Total Gas Vented 0.0 0.0 0.0 0.0 0.0 0.0 e3Sm3
Total Gas Flared 4,640.6 6,438.7 3,962.0 705.0 624.8 217.6 e3Sm3
Solution Gas Recovery -83.1 -22.1 60.6 93.6 94.5 98.5 %
30
0
20
40
60
80
100
120
1-20
092-
2009
3-20
094-
2009
5-20
096-
2009
7-20
098-
2009
9-20
0910
-200
911
-200
912
-200
91-
2010
2-20
103-
2010
4-20
105-
2010
6-20
107-
2010
8-20
109-
2010
10-2
010
11-2
010
12-2
010
1-20
112-
2011
3-20
114-
2011
5-20
116-
2011
7-20
118-
2011
9-20
1110
-201
111
-201
112
-201
11-
2012
2-20
123-
2012
4-20
125-
2012
6-20
127-
2012
8-20
129-
2012
10-2
012
11-2
012
12-2
012
1-20
13
Gre
enho
use
Gas
Em
issi
ons
(kg
CO
2e/B
OE)
Greenhouse Gas Emission Intensity Intensity
Performance Target
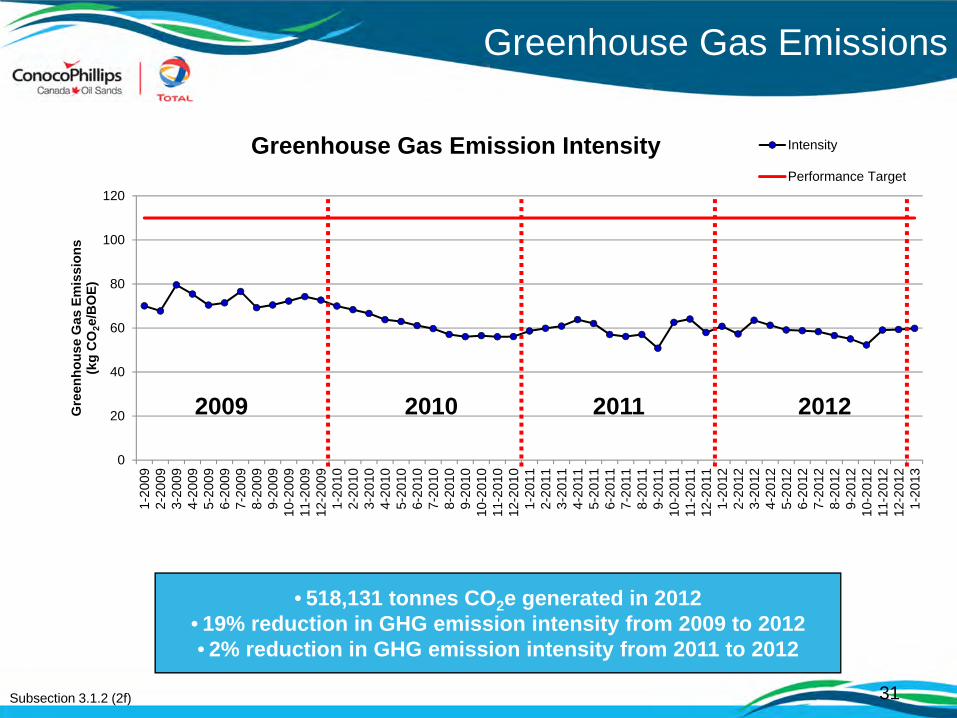
Greenhouse Gas Emissions
Subsection 3.1.2 (2f)
• 518,131 tonnes CO2e generated in 2012• 19% reduction in GHG emission intensity from 2009 to 2012 • 2% reduction in GHG emission intensity from 2011 to 2012
2009 2010 2011
31
2012
Surmont Oil Sands Commercial ProjectApproval 9426I
Subsection 3.1.2 (3) Measurement and Reporting
Well Allocated Oil Production
Subsection 3.1.2 (3a)
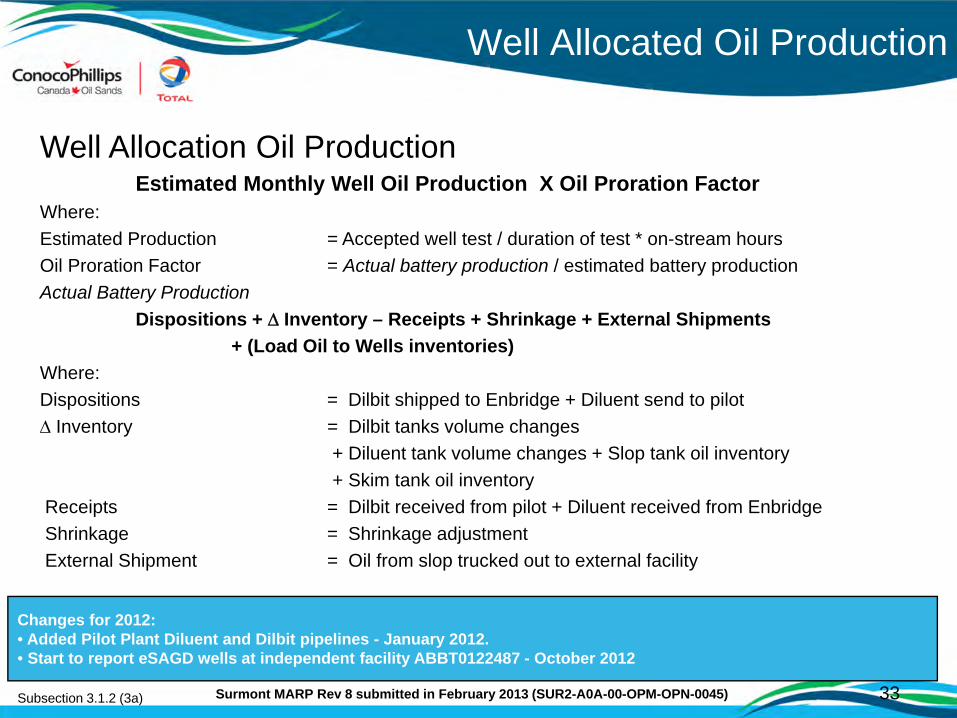
Well Allocation Oil ProductionEstimated Monthly Well Oil Production X Oil Proration Factor
Where:Estimated Production = Accepted well test / duration of test * on-stream hoursOil Proration Factor = Actual battery production / estimated battery productionActual Battery Production
Dispositions + Inventory – Receipts + Shrinkage + External Shipments + (Load Oil to Wells inventories)
Where:Dispositions = Dilbit shipped to Enbridge + Diluent send to pilotInventory = Dilbit tanks volume changes
+ Diluent tank volume changes + Slop tank oil inventory + Skim tank oil inventory
Receipts = Dilbit received from pilot + Diluent received from EnbridgeShrinkage = Shrinkage adjustmentExternal Shipment = Oil from slop trucked out to external facility
Changes for 2012:• Added Pilot Plant Diluent and Dilbit pipelines - January 2012.• Start to report eSAGD wells at independent facility ABBT0122487 - October 2012
Surmont MARP Rev 8 submitted in February 2013 (SUR2-A0A-00-OPM-OPN-0045) 33
Well Allocated Water Production
Subsection 3.1.2 (3a)
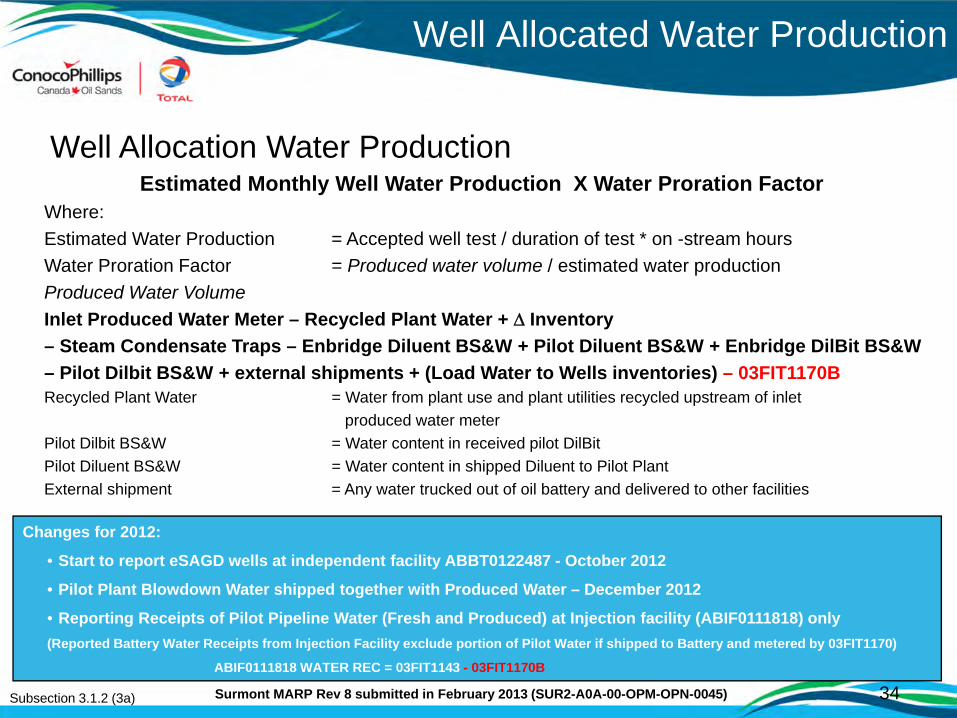
Well Allocation Water ProductionEstimated Monthly Well Water Production X Water Proration Factor
Where:Estimated Water Production = Accepted well test / duration of test * on -stream hoursWater Proration Factor = Produced water volume / estimated water productionProduced Water VolumeInlet Produced Water Meter – Recycled Plant Water + Inventory– Steam Condensate Traps – Enbridge Diluent BS&W + Pilot Diluent BS&W + Enbridge DilBit BS&W – Pilot Dilbit BS&W + external shipments + (Load Water to Wells inventories) – 03FIT1170BRecycled Plant Water = Water from plant use and plant utilities recycled upstream of inlet
produced water meter Pilot Dilbit BS&W = Water content in received pilot DilBitPilot Diluent BS&W = Water content in shipped Diluent to Pilot PlantExternal shipment = Any water trucked out of oil battery and delivered to other facilities
Changes for 2012:
• Start to report eSAGD wells at independent facility ABBT0122487 - October 2012
• Pilot Plant Blowdown Water shipped together with Produced Water – December 2012
• Reporting Receipts of Pilot Pipeline Water (Fresh and Produced) at Injection facility (ABIF0111818) only(Reported Battery Water Receipts from Injection Facility exclude portion of Pilot Water if shipped to Battery and metered by 03FIT1170)
ABIF0111818 WATER REC = 03FIT1143 - 03FIT1170B
34Surmont MARP Rev 8 submitted in February 2013 (SUR2-A0A-00-OPM-OPN-0045)
Well Allocated Gas Production
Subsection 3.1.2 (3a)
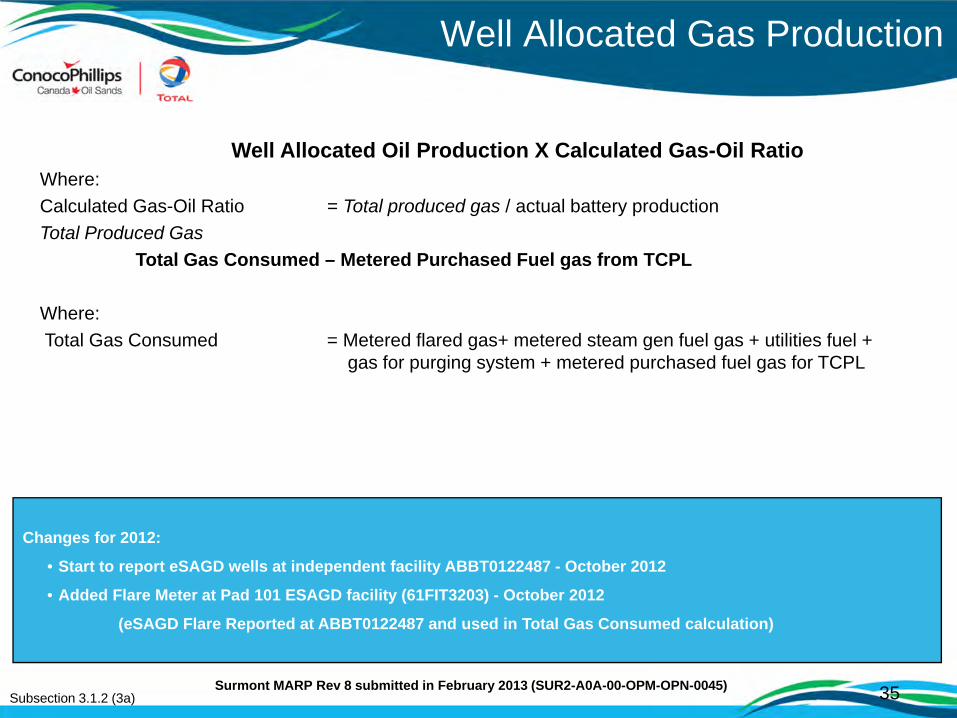
Well Allocated Oil Production X Calculated Gas-Oil RatioWhere:Calculated Gas-Oil Ratio = Total produced gas / actual battery productionTotal Produced Gas
Total Gas Consumed – Metered Purchased Fuel gas from TCPL
Where:Total Gas Consumed = Metered flared gas+ metered steam gen fuel gas + utilities fuel +
gas for purging system + metered purchased fuel gas for TCPL
35Surmont MARP Rev 8 submitted in February 2013 (SUR2-A0A-00-OPM-OPN-0045)
Changes for 2012:
• Start to report eSAGD wells at independent facility ABBT0122487 - October 2012
• Added Flare Meter at Pad 101 ESAGD facility (61FIT3203) - October 2012
(eSAGD Flare Reported at ABBT0122487 and used in Total Gas Consumed calculation)
Well Allocated Steam Injection
Subsection 3.1.2 (3a)
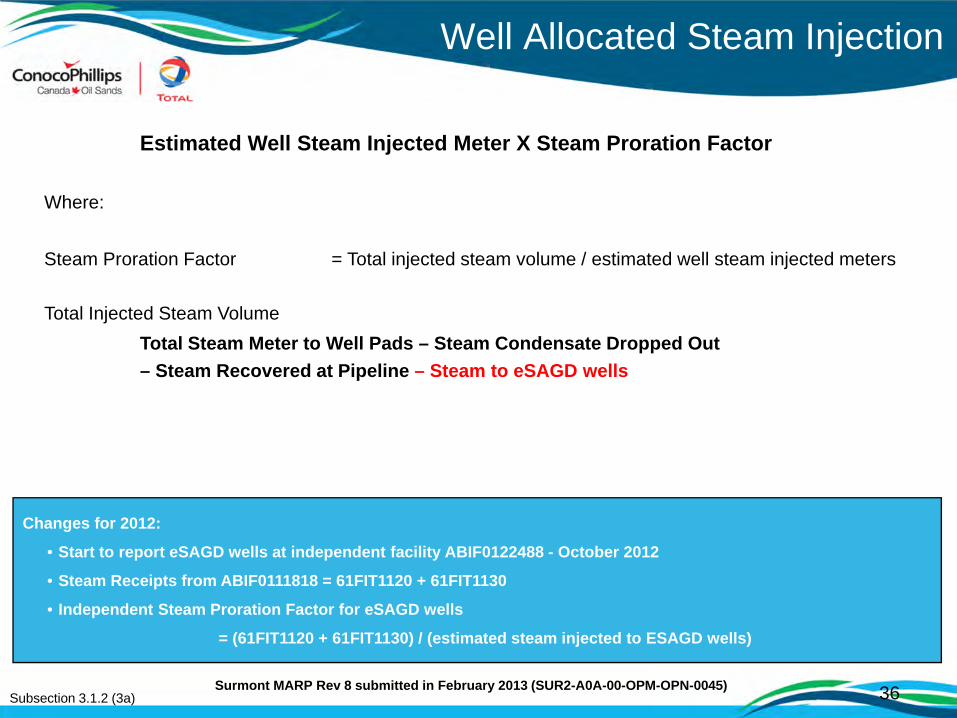
Estimated Well Steam Injected Meter X Steam Proration Factor
Where:
Steam Proration Factor = Total injected steam volume / estimated well steam injected meters
Total Injected Steam VolumeTotal Steam Meter to Well Pads – Steam Condensate Dropped Out – Steam Recovered at Pipeline – Steam to eSAGD wells
36Surmont MARP Rev 8 submitted in February 2013 (SUR2-A0A-00-OPM-OPN-0045)
Changes for 2012:
• Start to report eSAGD wells at independent facility ABIF0122488 - October 2012
• Steam Receipts from ABIF0111818 = 61FIT1120 + 61FIT1130
• Independent Steam Proration Factor for eSAGD wells
= (61FIT1120 + 61FIT1130) / (estimated steam injected to ESAGD wells)
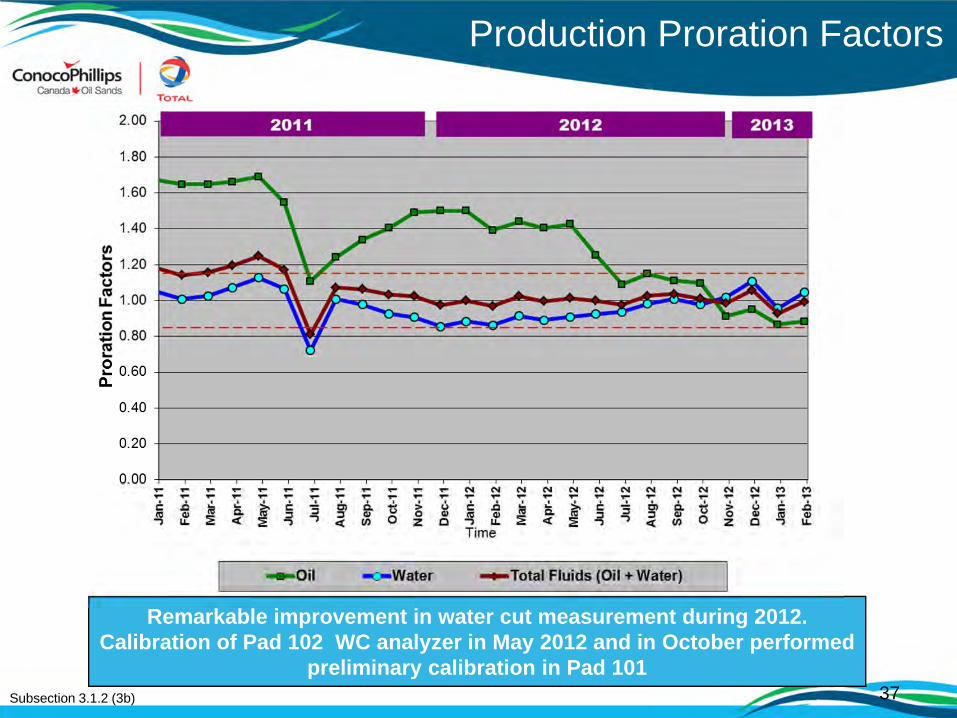
Production Proration Factors
Subsection 3.1.2 (3b)
Remarkable improvement in water cut measurement during 2012. Calibration of Pad 102 WC analyzer in May 2012 and in October performed
preliminary calibration in Pad 101
•Proration Factors
37
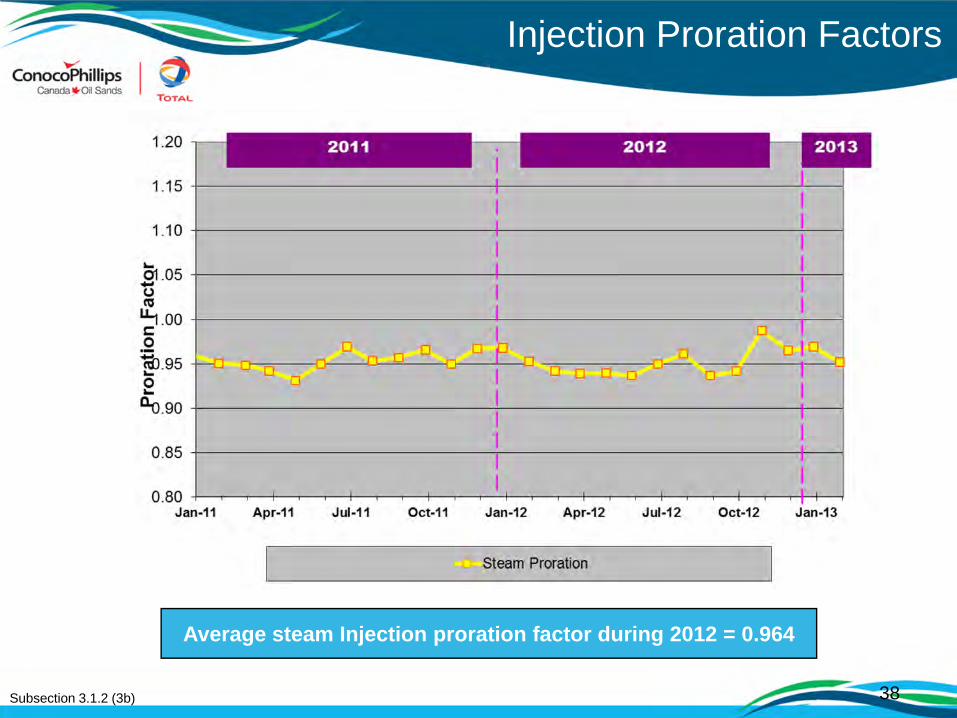
Injection Proration Factors
Subsection 3.1.2 (3b)
Average steam Injection proration factor during 2012 = 0.964
38
Well Testing
Well Testing• Well test duration is optimized to 8 hours with 1 hour purge• Typical frequency is 4-5 per month per well on the pad test separartor• Method is test separator with Coriolis flow meter for total liquid measurement and water
cut meter based on multiple high frequency permittivity measurement• Since January 2012, eSAGD dedicated test separator online at Pad 101. Testing
continuously 4 solvent candidate wellpairs.
Production Sampling Program• Produced gas analysis for detailed composition every month (minimum3 wells)• Sampling for calibration purpose and adjustment of meters:
• In 2012, intensive well sampling at Pad 101 and 102 to recalibrate water cut analyzer • Since eSAGD test separator started-up, intensive sampling program to baseline SAGD performance: up to daily water cut, weekly oil composition, and produced gas samples to calibrate online gas chromatograph
Subsection 3.1.2 (3c) 39

New Technology
Improvements in WatercutMeasurement & Sampling • Significant work put into improving both oil and water
proration factors in 2012. Water cut calibrations performed on both Pad 102 and Pad 101. Significant improvement in proration factors after calibrations.
• Installed temporary sampling skid on Pad 102 and calibrated the water cut analyzer.
• Calibrated Pad 101 water cut analyzer utilizing manual (bomb) sampling.
• Kicked off engineering for a permanent automatic sampler on Pad 101.
Multi-phase Flow Meter Update• Selected vendor and location for MPFM trial. Received
approval for testing program in Application 173221.• Completed engineering and began construction on Pad
102.• Test ongoing with results expected by April 2013
Subsection 3.1.2 (3d) 40

Surmont Oil Sands Commercial ProjectApproval 9426I
Subsection 3.1.2 (4) Water Production, Injection, and Uses
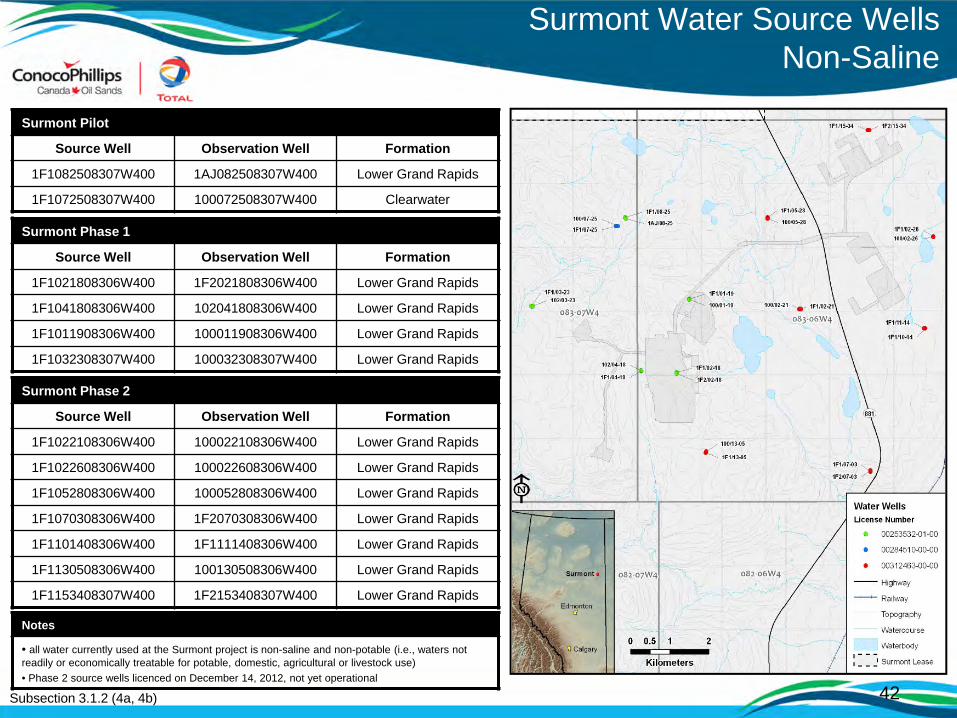
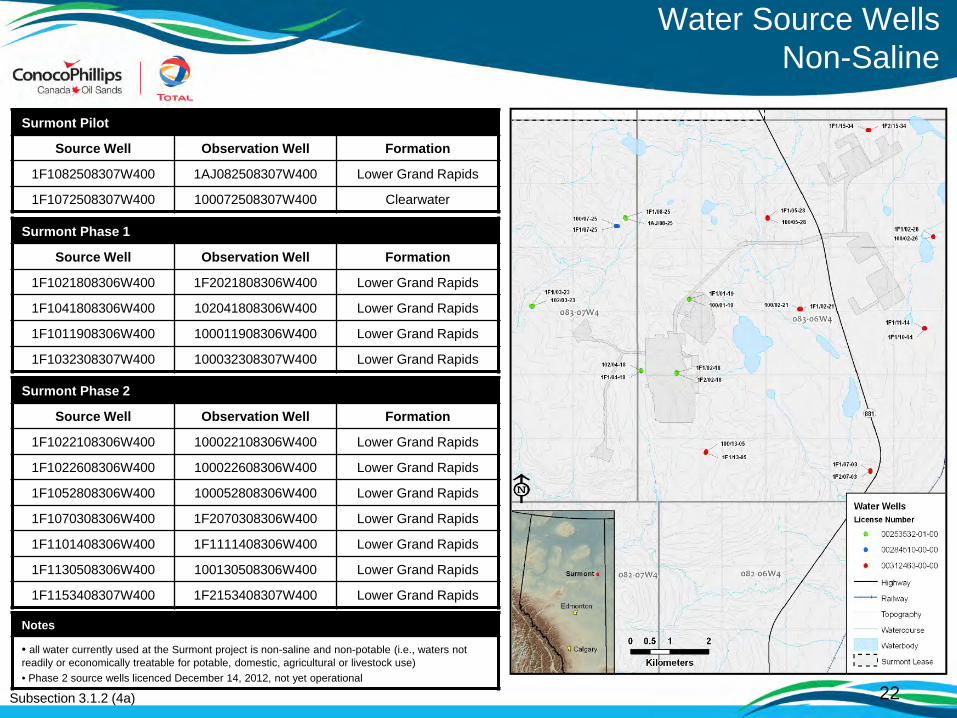
Surmont Water Source WellsNon-Saline
Surmont Pilot
Source Well Observation Well Formation
1F1082508307W400 1AJ082508307W400 Lower Grand Rapids
1F1072508307W400 100072508307W400 Clearwater
Surmont Phase 1
Source Well Observation Well Formation
1F1021808306W400 1F2021808306W400 Lower Grand Rapids
1F1041808306W400 102041808306W400 Lower Grand Rapids
1F1011908306W400 100011908306W400 Lower Grand Rapids
1F1032308307W400 100032308307W400 Lower Grand Rapids
Notes
• all water currently used at the Surmont project is non-saline and non-potable (i.e., waters not readily or economically treatable for potable, domestic, agricultural or livestock use)• Phase 2 source wells licenced on December 14, 2012, not yet operational
Subsection 3.1.2 (4a, 4b) 42
Surmont Phase 2
Source Well Observation Well Formation
1F1022108306W400 100022108306W400 Lower Grand Rapids
1F1022608306W400 100022608306W400 Lower Grand Rapids
1F1052808306W400 100052808306W400 Lower Grand Rapids
1F1070308306W400 1F2070308306W400 Lower Grand Rapids
1F1101408306W400 1F1111408306W400 Lower Grand Rapids
1F1130508306W400 100130508306W400 Lower Grand Rapids
1F1153408307W400 1F2153408307W400 Lower Grand Rapids
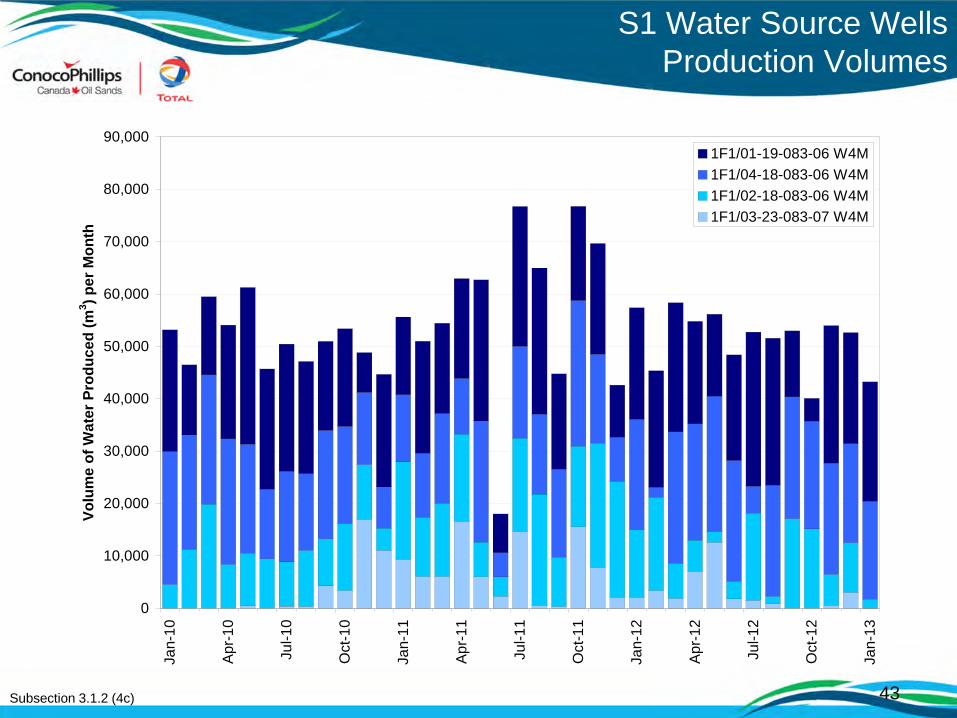
S1 Water Source WellsProduction Volumes
Subsection 3.1.2 (4c) 43
0
10,000
20,000
30,000
40,000
50,000
60,000
70,000
80,000
90,000
Jan-
10
Apr
-10
Jul-1
0
Oct
-10
Jan-
11
Apr
-11
Jul-1
1
Oct
-11
Jan-
12
Apr
-12
Jul-1
2
Oct
-12
Jan-
13
Volu
me
of W
ater
Pro
duce
d (m
3 ) per
Mon
th
1F1/01-19-083-06 W4M1F1/04-18-083-06 W4M1F1/02-18-083-06 W4M1F1/03-23-083-07 W4M

Water Production and Steam Injection Volumes
Subsection 3.1.2 (4d) 44
-
50,000
100,000
150,000
200,000
250,000
300,000
350,000
Jan-
11
Mar
-11
May
-11
Jul-1
1
Sep
-11
Nov
-11
Jan-
12
Mar
-12
May
-12
Jul-1
2
Sep
-12
Nov
-12
Jan-
13
Prod Water Steam Injection
Stea
m (C
WE
–m
3 ); P
rodu
ced
wat
er (m
3 )
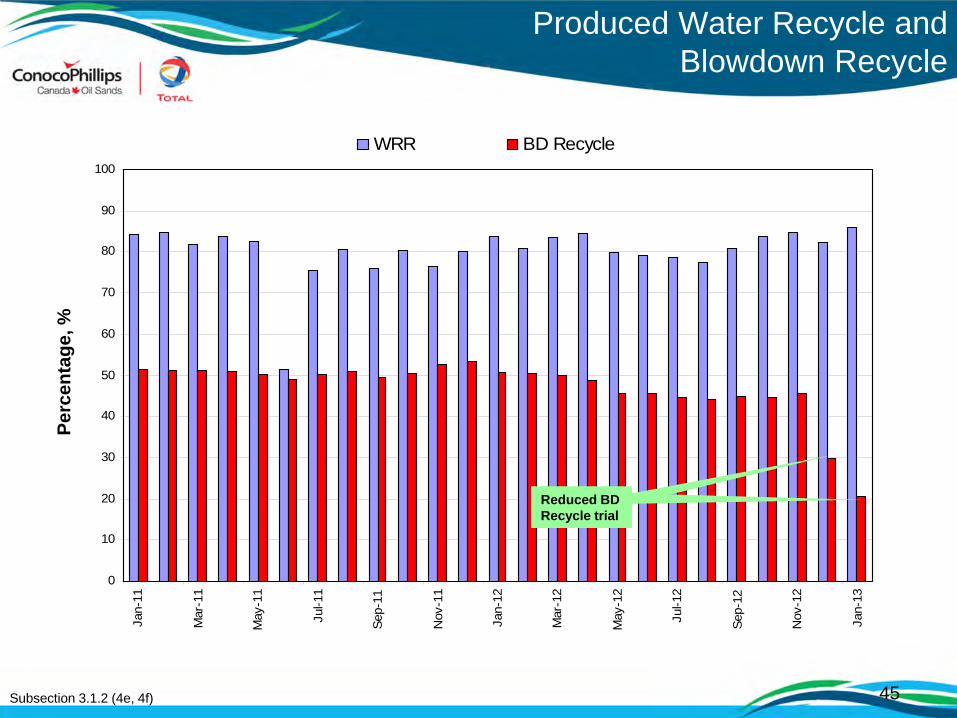
Produced Water Recycle and Blowdown Recycle
Subsection 3.1.2 (4e, 4f) 45
0
10
20
30
40
50
60
70
80
90
100
Jan-
11
Mar
-11
May
-11
Jul-1
1
Sep-
11
Nov
-11
Jan-
12
Mar
-12
May
-12
Jul-1
2
Sep-
12
Nov
-12
Jan-
13
WRR BD Recycle
Reduced BD Recycle trial
Perc
enta
ge, %
Reduced BD Recycle trial
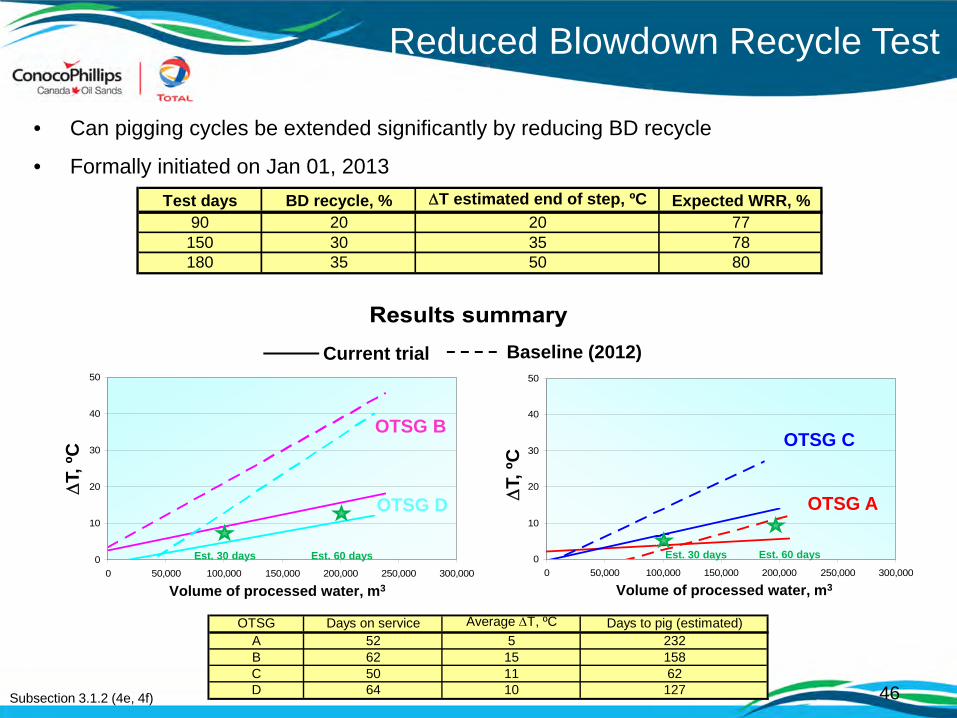
• Can pigging cycles be extended significantly by reducing BD recycle
• Formally initiated on Jan 01, 2013
Reduced Blowdown Recycle Test
Test days BD recycle, % T estimated end of step, ºC Expected WRR, %90 20 20 77150 30 35 78180 35 50 80
T,
ºC
0
10
20
30
40
50
0 50,000 100,000 150,000 200,000 250,000 300,000
Volume of processed water, m3
OTSG B
OTSG D
Current trial Baseline (2012)
0
10
20
30
40
50
0 50,000 100,000 150,000 200,000 250,000 300,000
OTSG C
OTSG AT,
ºC
Volume of processed water, m3
OTSG Days on service Average T, ºC Days to pig (estimated)A 52 5 232B 62 15 158C 50 11 62D 64 10 127
Est. 30 days Est. 60 days Est. 30 days Est. 60 days
46Subsection 3.1.2 (4e, 4f)
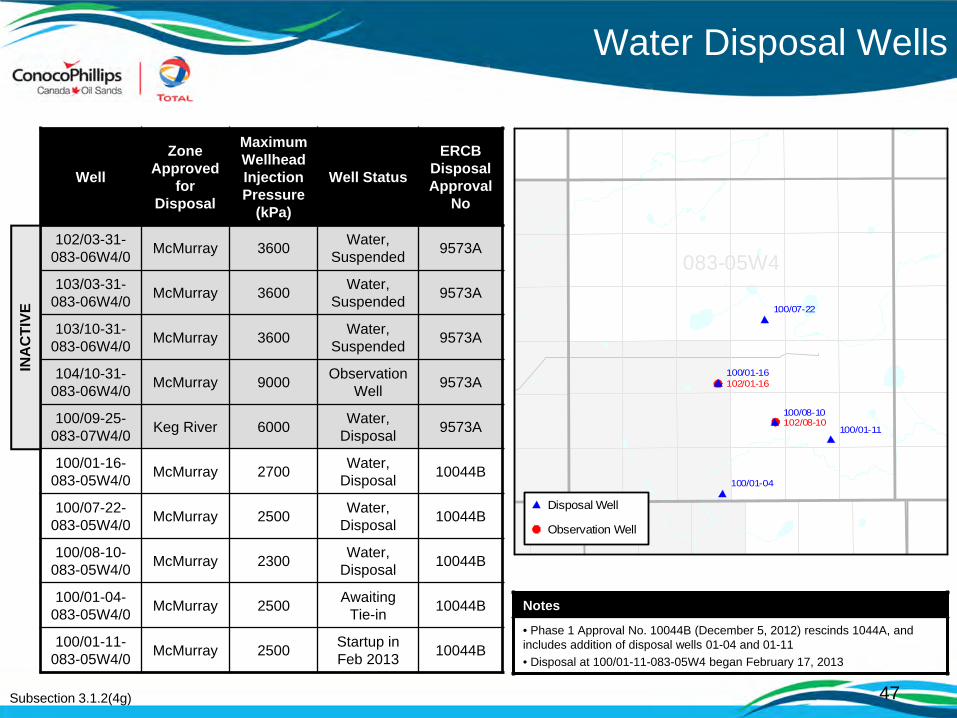
Water Disposal Wells
Subsection 3.1.2(4g)
Well
Zone Approved
for Disposal
Maximum Wellhead Injection Pressure
(kPa)
Well Status
ERCB DisposalApproval
No
102/03-31-083-06W4/0 McMurray 3600 Water,
Suspended 9573A
103/03-31-083-06W4/0 McMurray 3600 Water,
Suspended 9573A
103/10-31-083-06W4/0 McMurray 3600 Water,
Suspended 9573A
104/10-31-083-06W4/0 McMurray 9000 Observation
Well 9573A
100/09-25-083-07W4/0 Keg River 6000 Water,
Disposal 9573A
100/01-16-083-05W4/0 McMurray 2700 Water,
Disposal 10044B
100/07-22-083-05W4/0 McMurray 2500 Water,
Disposal 10044B
100/08-10-083-05W4/0 McMurray 2300 Water,
Disposal 10044B
100/01-04-083-05W4/0 McMurray 2500 Awaiting
Tie-in 10044B
100/01-11-083-05W4/0 McMurray 2500 Startup in
Feb 2013 10044B
47
INA
CTI
VE
102/01-16
102/08-10
100/01-04
100/01-11
100/01-16
100/07-22
100/08-10
083-05W4
Disposal Well
Observation Well
Notes
• Phase 1 Approval No. 10044B (December 5, 2012) rescinds 1044A, and includes addition of disposal wells 01-04 and 01-11• Disposal at 100/01-11-083-05W4 began February 17, 2013

Water Disposal WellsInjection Rates (McMurray)
Subsection 3.1.2 (4g, 4h) 48
0
5,000
10,000
15,000
20,000
25,000
30,000
35,000
40,000
45,000
50,000Ja
n-09
Jul-0
9
Jan-
10
Jul-1
0
Jan-
11
Jul-1
1
Jan-
12
Jul-1
2
Jan-
13
Volu
me
of W
ater
Inje
cted
(m3 ) p
er M
onth
00/01-16-083-05 W4M00/07-22-083-05 W4M00/08-10-083-05 W4M
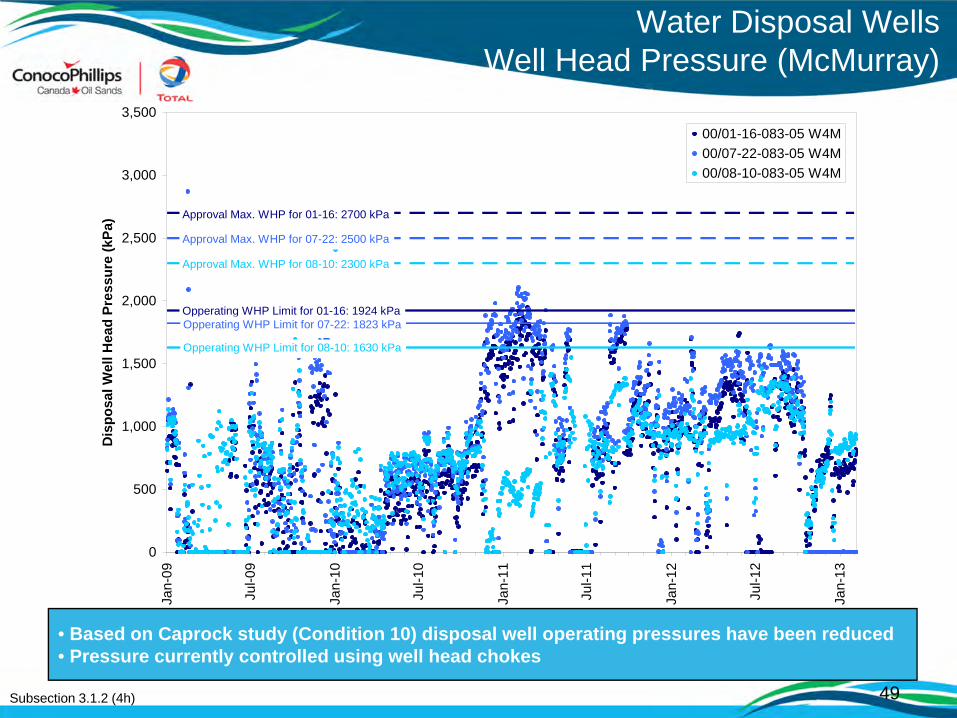
Water Disposal WellsWell Head Pressure (McMurray)
Subsection 3.1.2 (4h)
• Based on Caprock study (Condition 10) disposal well operating pressures have been reduced • Pressure currently controlled using well head chokes
49
0
500
1,000
1,500
2,000
2,500
3,000
3,500
Jan-
09
Jul-0
9
Jan-
10
Jul-1
0
Jan-
11
Jul-1
1
Jan-
12
Jul-1
2
Jan-
13
Dis
posa
l Wel
l Hea
d Pr
essu
re (k
Pa)
00/01-16-083-05 W4M00/07-22-083-05 W4M00/08-10-083-05 W4M
Approval Max. WHP for 01-16: 2700 kPa
Opperating WHP Limit for 01-16: 1924 kPa
Approval Max. WHP for 07-22: 2500 kPa
Opperating WHP Limit for 07-22: 1823 kPa
Approval Max. WHP for 08-10: 2300 kPa
Opperating WHP Limit for 08-10: 1630 kPa
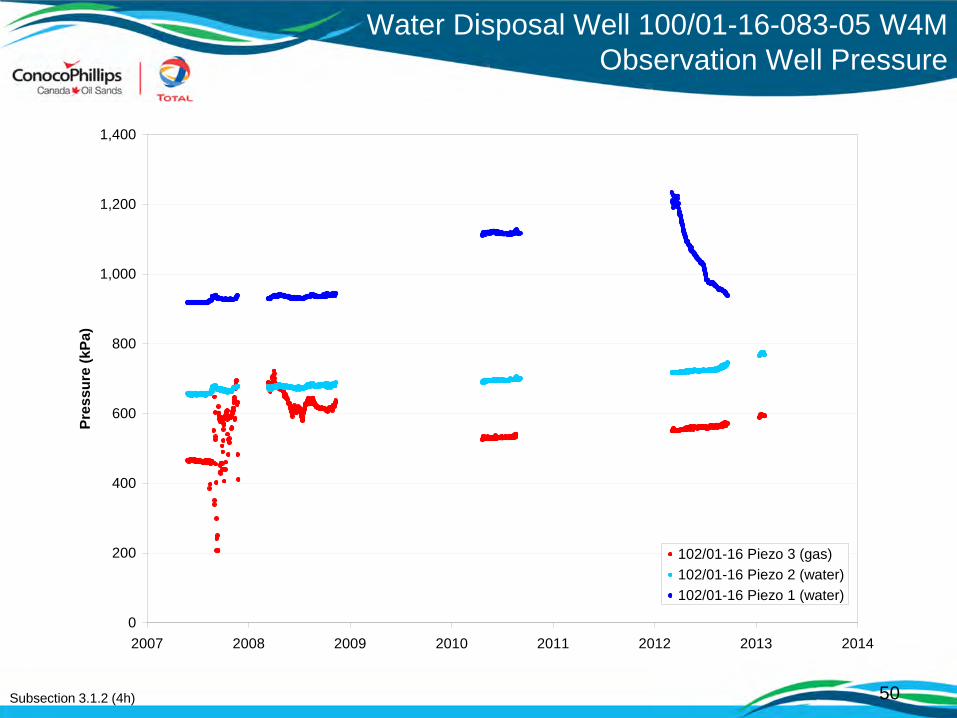
Water Disposal Well 100/01-16-083-05 W4MObservation Well Pressure
Subsection 3.1.2 (4h) 50
0
200
400
600
800
1,000
1,200
1,400
2007 2008 2009 2010 2011 2012 2013 2014
Pres
sure
(kPa
)
102/01-16 Piezo 3 (gas)102/01-16 Piezo 2 (water)102/01-16 Piezo 1 (water)

Water Disposal Well 100/08-10-083-05 W4MObservation Well Pressure
Subsection 3.1.2 (4h) 51
0
200
400
600
800
1,000
1,200
2007 2008 2009 2010 2011 2012 2013 2014
Pres
sure
(kPa
)
102/08-10 Piezo 3 (gas)102/08-10 Piezo 2 (water)102/08-10 Piezo 1 (water)
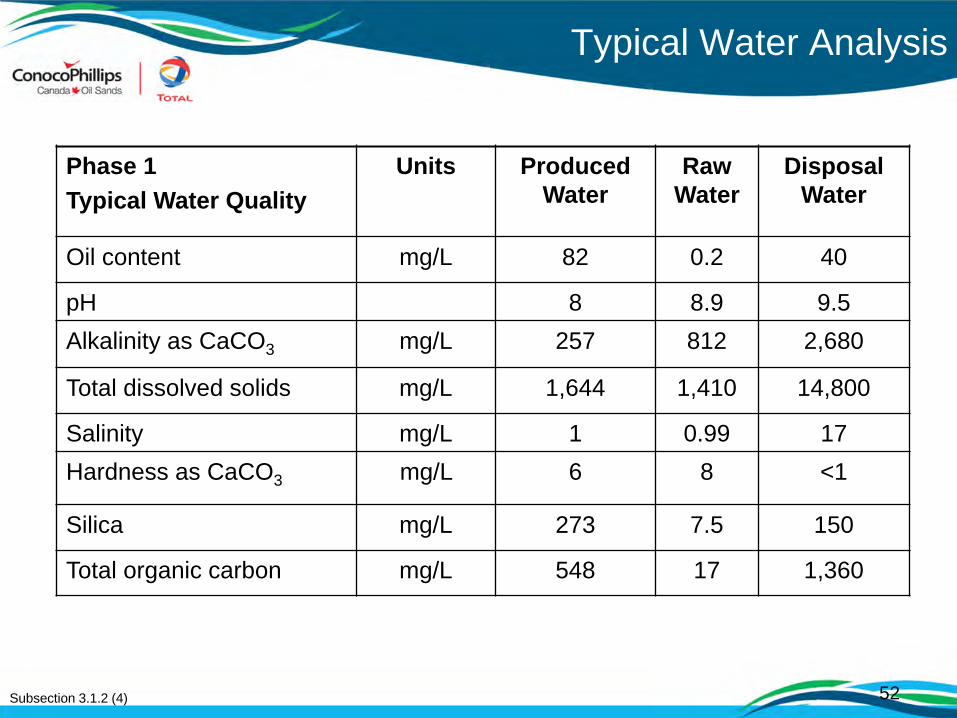
Typical Water Analysis
Subsection 3.1.2 (4)
Phase 1 Typical Water Quality
Units Produced Water
Raw Water
Disposal Water
Oil content mg/L 82 0.2 40
pH 8 8.9 9.5Alkalinity as CaCO3 mg/L 257 812 2,680
Total dissolved solids mg/L 1,644 1,410 14,800
Salinity mg/L 1 0.99 17Hardness as CaCO3 mg/L 6 8 <1
Silica mg/L 273 7.5 150
Total organic carbon mg/L 548 17 1,360
52
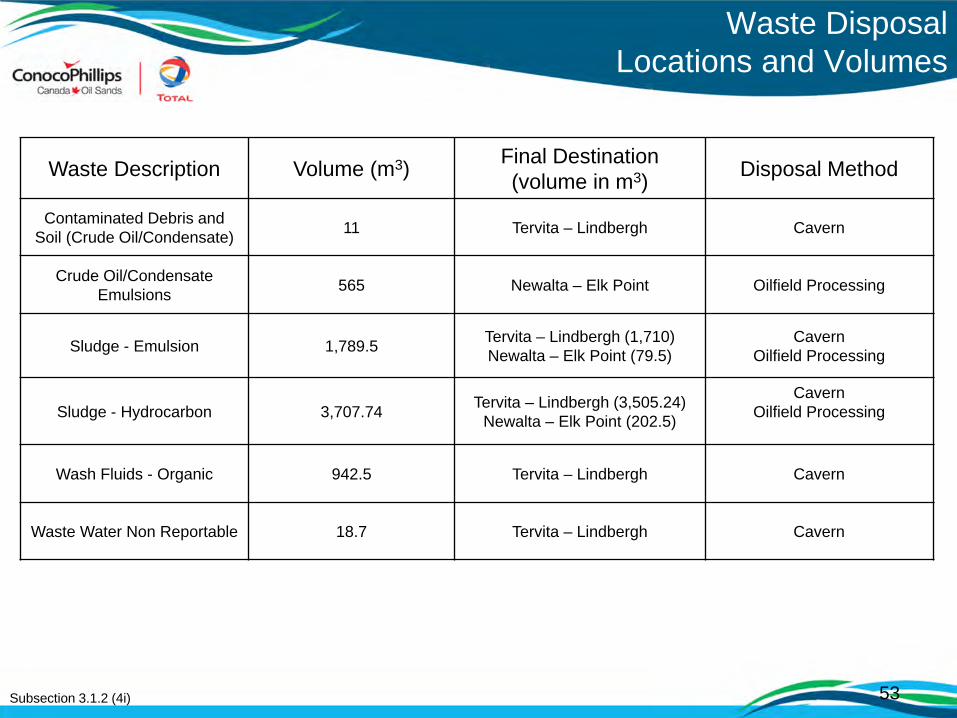
Waste DisposalLocations and Volumes
Subsection 3.1.2 (4i) 53
Waste Description Volume (m3) Final Destination(volume in m3) Disposal Method
Contaminated Debris and Soil (Crude Oil/Condensate) 11 Tervita – Lindbergh Cavern
Crude Oil/Condensate Emulsions 565 Newalta – Elk Point Oilfield Processing
Sludge - Emulsion 1,789.5 Tervita – Lindbergh (1,710)Newalta – Elk Point (79.5)
CavernOilfield Processing
Sludge - Hydrocarbon 3,707.74 Tervita – Lindbergh (3,505.24)Newalta – Elk Point (202.5)
CavernOilfield Processing
Wash Fluids - Organic 942.5 Tervita – Lindbergh Cavern
Waste Water Non Reportable 18.7 Tervita – Lindbergh Cavern

Solid Waste Disposal
Subsection 3.1.2 (4i) 54
Waste Description Class Ia Disposal Well Landfill Class I Landfill Class II Swan Hills Facility
BATTERIES - ALKALINE (disposal) (cls 8) 114.00BATTERIES - DRY CELL 95.00
Contaminated Debris and Soil (Crude Oil/Condensate) 36,710.00CORROSIVE LIQUID - ORGANIC ACID (cls 8) 442.00
CORROSIVE LIQUID - ORGANIC BASIC (cls 8) 248.80DESICCANT MATERIALS - LEACHABLE (cls N/R) 250.00
FILTERS - LEACHABLE (cls N/R) 17,758.00GREASE - LEACHABLE (cls N/R) 60.00
GREASE - NONREG 744.00 5,234.00LEACHABLE WASTE LIQUIDS (cls N/R) 3,131.00LEACHABLE WASTE SOLIDS (cls N/R) 1,388.25
LP FLAM TOXIC LIQ (cls 3) 40.05LP PEROXIDE ORG SOLID TYPE E (cls 5.2) 15.00
NON-REGULATED LIQUIDS 355.60NON-REGULATED SOLIDS (LANDFILL) 7,310.30 34,594.23
RAGS - LEACHABLE (cls N/R) 15,775.00Sludge - Hydrocarbon 73,500.00
SLUDGE - HYDROCARBON LEACHABLE (cls N/R) 206.75Sludge - Lime 9,799,590.00
SOIL & DEBRIS - LEACHABLE HYDROCARBON (REFINED) (cls N/R) 20,175.00
SOIL & DEBRIS - NONREG HYDROCARBON (REFINED) 320,496.00SOLIDS WITH FLAMMABLE LIQUIDS (cls 4.1) 3,176.97
Total 3,486.60 67,053.27 10,270,124.23 745.85
The pond dredging accounted for most of the solid waste disposal in 2012
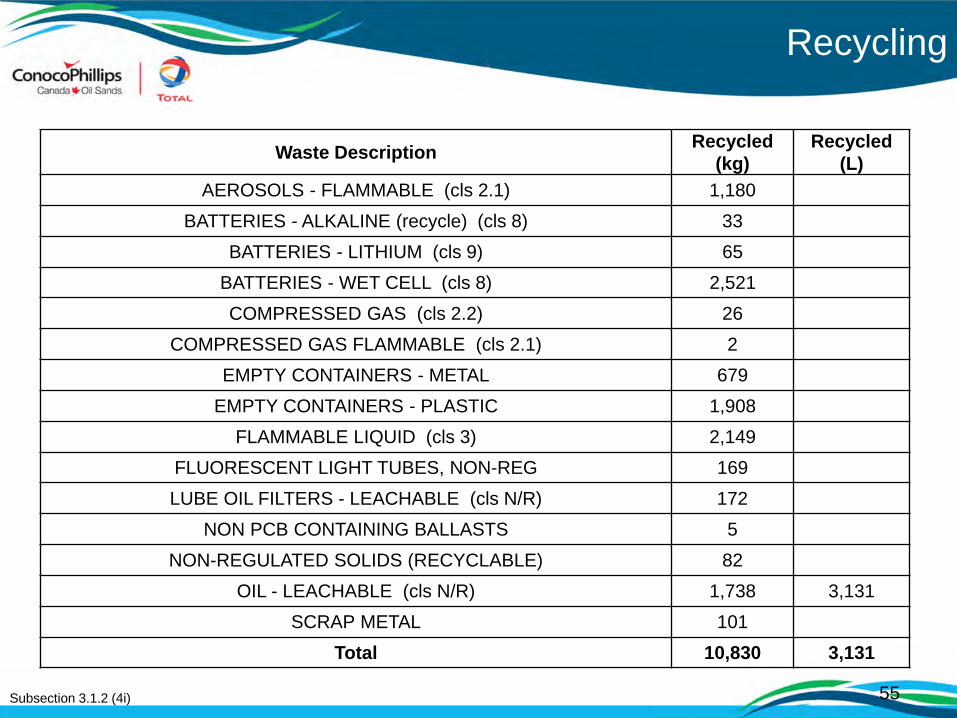
Recycling
Subsection 3.1.2 (4i) 55
Waste Description Recycled (kg)
Recycled (L)
AEROSOLS - FLAMMABLE (cls 2.1) 1,180BATTERIES - ALKALINE (recycle) (cls 8) 33
BATTERIES - LITHIUM (cls 9) 65BATTERIES - WET CELL (cls 8) 2,521COMPRESSED GAS (cls 2.2) 26
COMPRESSED GAS FLAMMABLE (cls 2.1) 2EMPTY CONTAINERS - METAL 679
EMPTY CONTAINERS - PLASTIC 1,908FLAMMABLE LIQUID (cls 3) 2,149
FLUORESCENT LIGHT TUBES, NON-REG 169LUBE OIL FILTERS - LEACHABLE (cls N/R) 172
NON PCB CONTAINING BALLASTS 5NON-REGULATED SOLIDS (RECYCLABLE) 82
OIL - LEACHABLE (cls N/R) 1,738 3,131SCRAP METAL 101
Total 10,830 3,131
Surmont Oil Sands Commercial ProjectApproval 9426I
Subsection 3.1.2 (5) Sulphur Production

0.0
0.1
0.2
0.3
0.4
0.5
0.6
0.7
0.8
0.9
1.0
Sulp
hur E
mis
sion
s (to
nnes
/day
)
Average Peak Daily Limit
Daily Sulphur Emissions
Subsection 3.1.2 (5a)
Sulphur emissions have stabilized around 0.4 tonnes/day
2009 2010 2011
57
2012

0
5
10
15
20
25
Sulp
hur E
mis
sion
s (to
nnes
/mon
th)
Monthly Sulphur Emissions
Subsection 3.1.2 (5a)
2009 2010 2011
58
2012

0.0
0.5
1.0
1.5
2.0
2.5
SO2
Emis
sion
s (to
nnes
/day
)
Average Peak Daily Limit (AESRD)
Daily SO2 Emissions
Subsection 3.1.2 (5a)
SO2 Emissions are well below the EPEA approval limit of 2 tonnes/day
2009 2010 2011
59
2012
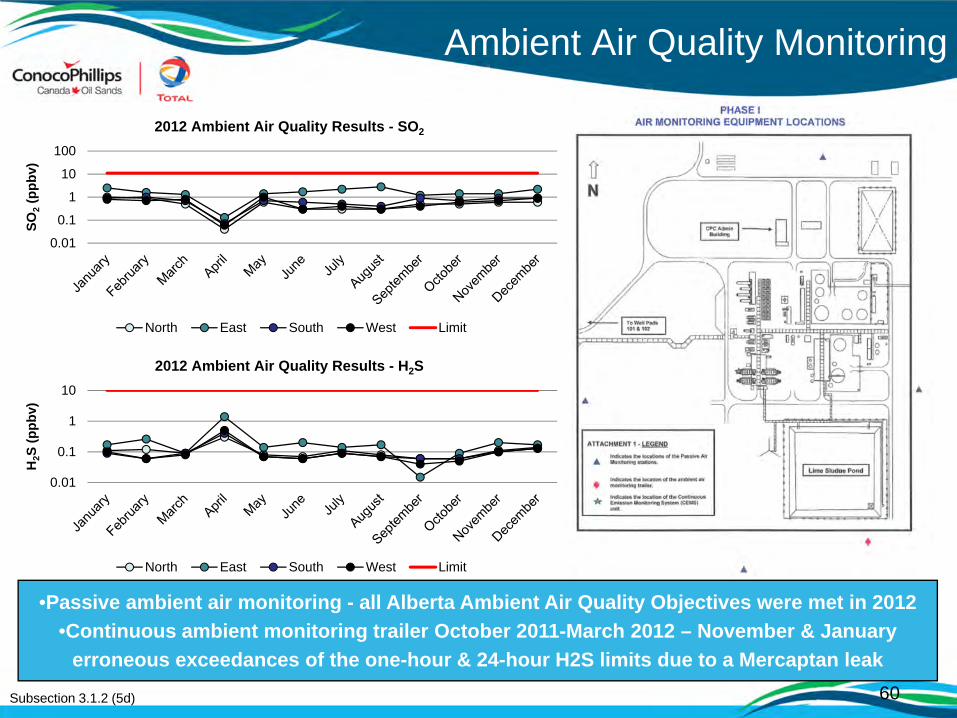
Ambient Air Quality Monitoring
Subsection 3.1.2 (5d)
•Passive ambient air monitoring - all Alberta Ambient Air Quality Objectives were met in 2012•Continuous ambient monitoring trailer October 2011-March 2012 – November & January
erroneous exceedances of the one-hour & 24-hour H2S limits due to a Mercaptan leak60
0.01
0.1
1
10
H2S
(ppb
v)
2012 Ambient Air Quality Results - H2S
North East South West Limit
0.01
0.1
1
10
100
SO2
(ppb
v)
2012 Ambient Air Quality Results - SO2
North East South West Limit

Surmont Oil Sands Commercial ProjectApproval 9426I
Subsection 3.1.2 (6) Environmental Issues
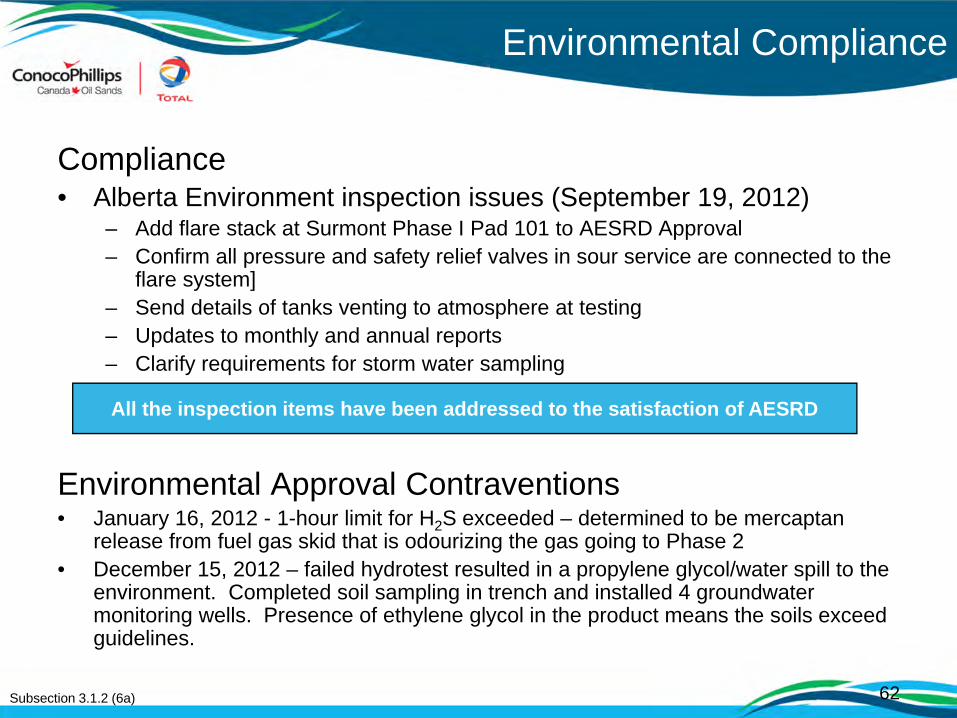
Environmental Compliance
Compliance• Alberta Environment inspection issues (September 19, 2012)
– Add flare stack at Surmont Phase I Pad 101 to AESRD Approval– Confirm all pressure and safety relief valves in sour service are connected to the
flare system]– Send details of tanks venting to atmosphere at testing– Updates to monthly and annual reports– Clarify requirements for storm water sampling
Environmental Approval Contraventions• January 16, 2012 - 1-hour limit for H2S exceeded – determined to be mercaptan
release from fuel gas skid that is odourizing the gas going to Phase 2• December 15, 2012 – failed hydrotest resulted in a propylene glycol/water spill to the
environment. Completed soil sampling in trench and installed 4 groundwater monitoring wells. Presence of ethylene glycol in the product means the soils exceed guidelines.
Subsection 3.1.2 (6a) 62
All the inspection items have been addressed to the satisfaction of AESRD

Groundwater Monitoring• 2012 results within historical/background concentrations
Soil Monitoring• Soil monitoring program completed in 2012
Integrated Wetlands Monitoring Program• 2012 results within historical/background concentrations
Reclamation Programs• No reclamation in 2012
Programs will be expanded in 2013 to collect background information before Phase II goes into operation.
Environmental Monitoring
Subsection 3.1.2 (6a) 63
Surmont Oil Sands Commercial ProjectApproval 9426I
Subsection 3.1.2 (7) Compliance Confirmation
Compliance Confirmation
Subsection 3.1.2 (7)
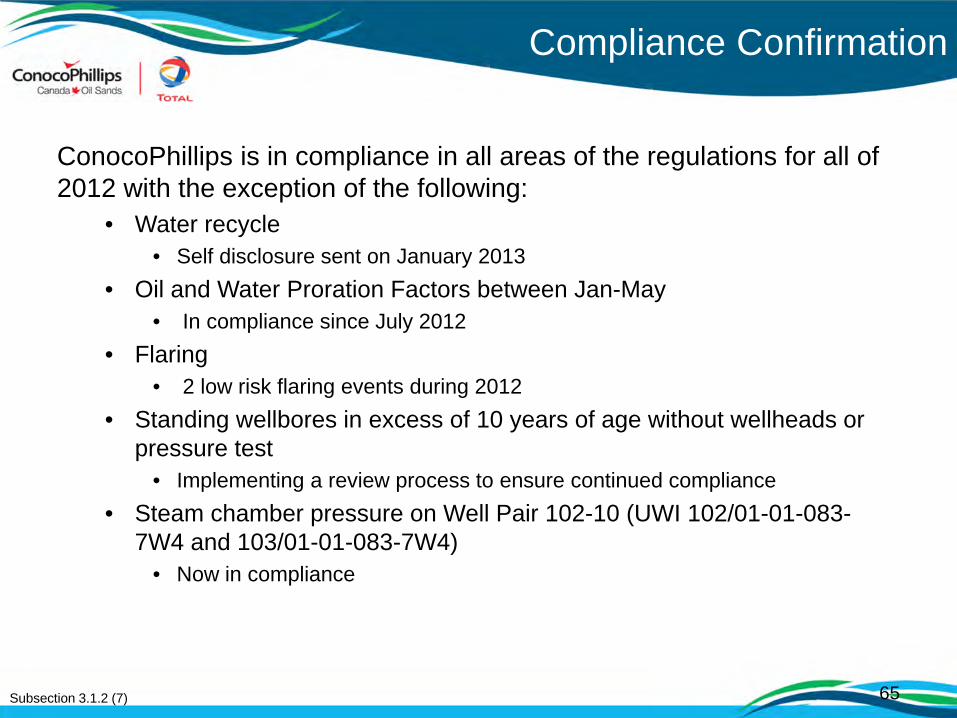
ConocoPhillips is in compliance in all areas of the regulations for all of 2012 with the exception of the following:
• Water recycle• Self disclosure sent on January 2013
• Oil and Water Proration Factors between Jan-May • In compliance since July 2012
• Flaring• 2 low risk flaring events during 2012
• Standing wellbores in excess of 10 years of age without wellheads or pressure test
• Implementing a review process to ensure continued compliance• Steam chamber pressure on Well Pair 102-10 (UWI 102/01-01-083-
7W4 and 103/01-01-083-7W4) • Now in compliance
65

Surmont Oil Sands Commercial ProjectApproval 9426I
Subsection 3.1.2 (8) Noncompliance Issues
Compliance
Subsection 3.1.2 (7, 8)
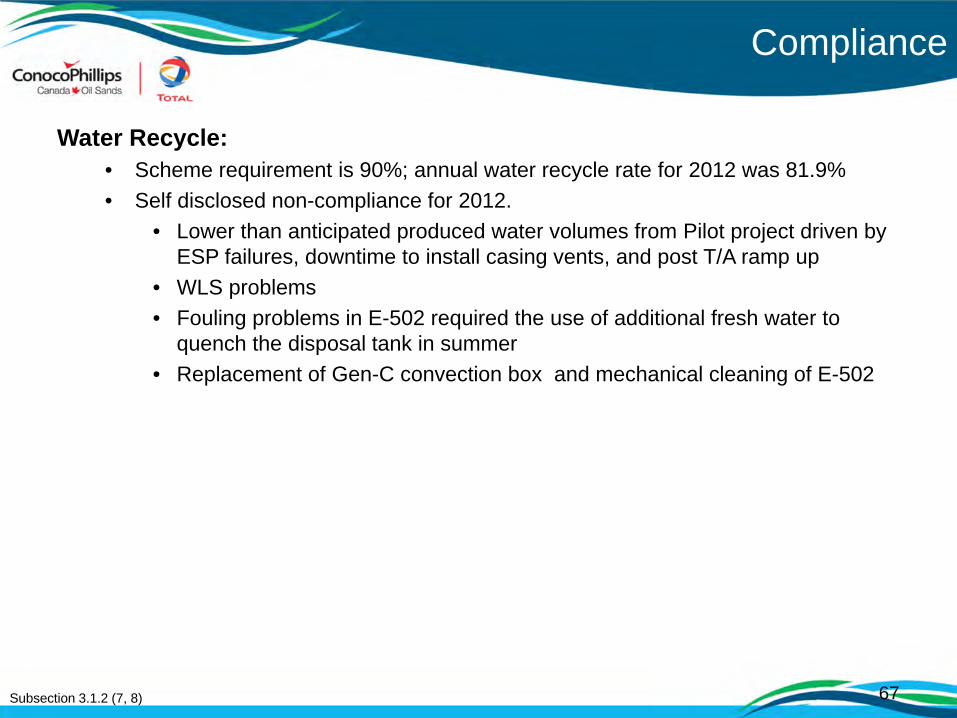
Water Recycle:• Scheme requirement is 90%; annual water recycle rate for 2012 was 81.9%• Self disclosed non-compliance for 2012.
• Lower than anticipated produced water volumes from Pilot project driven by ESP failures, downtime to install casing vents, and post T/A ramp up
• WLS problems • Fouling problems in E-502 required the use of additional fresh water to
quench the disposal tank in summer • Replacement of Gen-C convection box and mechanical cleaning of E-502
67

Compliance
Subsection 3.1.2 (7, 8)
Metering and Reporting:• High Risk: Online BS&W analyzer did not exist at delivery point from Pilot facility (F 16885)
to Surmont Plant (F 30980)• Water cut analyzer was installed and commissioned during T/A; now in compliance
• Low Risk: Inaccurate reporting of fuel gas. • CPC created an administrative control to review flared volumes for accuracy between production
accounting and Operations on a monthly basis. Volumes that were inaccurately reported were corrected.
• Low Risk: Product analyzers for the well test separators were not being calibrated. The calibration had also expired for the gas reporting meters.
• Recurrent Preventive Maintenance work orders were implemented. WC analyzer in pad 101 and 102 were calibrated and sampling skid was adopted as permanent installation for yearly calibration.
• Low Risk: Calibration tags/labels had not been updated or were not attached.• Included instrumentation tag/labels verification and correction in PM program.
Flaring:• Low Risk: Two flaring events (December 24, 2011, for 6.5 hours and January 22, 2012 for 7
hours) and the ERCB was not notified of these events• Implemented an electronic Flare Log for Operations to track flare events and reduce manual data
entry errors. Implemented procedure to review log on a weekly basis and report to the Environmental Coordinator.
• Improved DCS alarms on events lasting greater than 4 hours in any 24 hour period (both CPF and well pad flares). Automatic creation of work notification of urgent priority alarm and warn of the need to enter an ERCB submission
68

Compliance
Subsection 3.1.2 (7, 8)
Standing wellbores:• High Risk Enforcement Action issue on June 27/2012. Improper well suspension,
Remedial Action:• Downhole suspension operation completed, DDS update for suspension operation.
• Self-disclosed inactive wells with respect Directive 013 non-compliance for 2012. Low and Medium Risk inactive well without proper suspension.
Remedial Action:• Executed well review to further verify and define steps to bring all Surmont wells in compliance with
Directive 013.• Incorrect well status within the petroleum registry for observation wells.• Low Risk inactive wells suspension that were not reported through the DDS• Inactive wells that have not undergone proper downhole suspension• Develop actions to prevent future Non-Compliance situations.
• Low Risk: Valve handles present on the suspended wellhead that were not chained/locked.• Chains and locks have been installed on the suspended wellhead valves.
Steam Chamber Pressure:• Self disclosure of steam chamber pressure exceedence on Well Pair 102-10 (UWI 102/01-
01-083-7W4 and 103/01-01-083-7W4) due to a manual monitoring pressure process during circulation mode.
Remedial Action:• Adjusted alarm management strategy• Piping surface modified to work for circulation and SAGD mode• Inclusion of a stand alone pressure monitoring system in the piping designs for future circulation wells
69

Surmont Oil Sands ProjectApproval 9426I
Subsection 3.1.2 (9) Future Plans
71
Future Plans – Phase 1
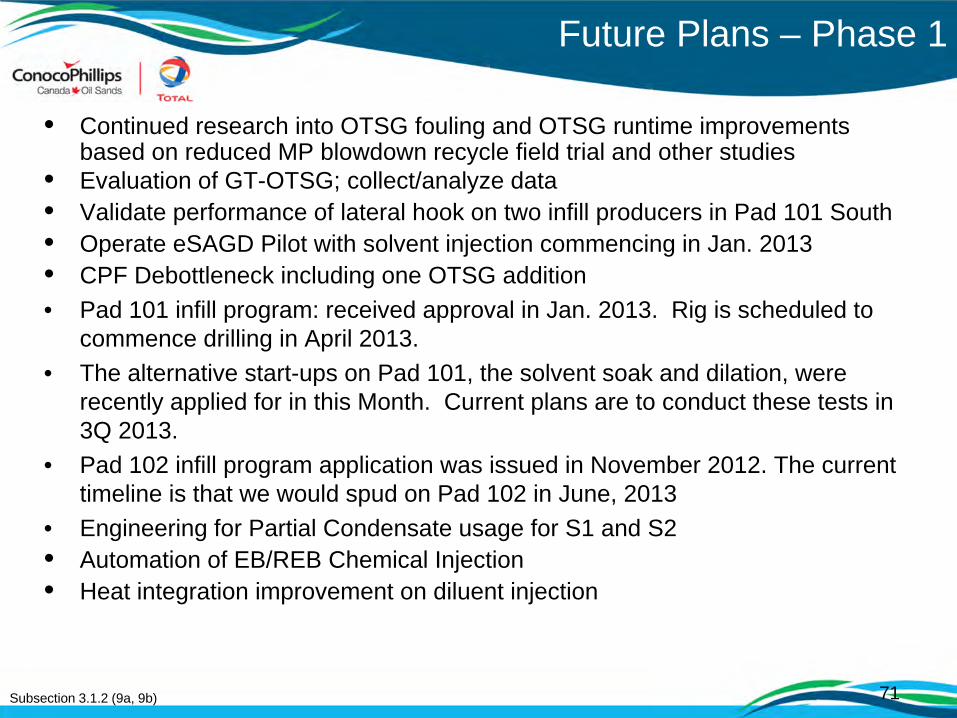
• Continued research into OTSG fouling and OTSG runtime improvements based on reduced MP blowdown recycle field trial and other studies
• Evaluation of GT-OTSG; collect/analyze data• Validate performance of lateral hook on two infill producers in Pad 101 South• Operate eSAGD Pilot with solvent injection commencing in Jan. 2013 • CPF Debottleneck including one OTSG addition • Pad 101 infill program: received approval in Jan. 2013. Rig is scheduled to
commence drilling in April 2013. • The alternative start-ups on Pad 101, the solvent soak and dilation, were
recently applied for in this Month. Current plans are to conduct these tests in 3Q 2013.
• Pad 102 infill program application was issued in November 2012. The current timeline is that we would spud on Pad 102 in June, 2013
• Engineering for Partial Condensate usage for S1 and S2• Automation of EB/REB Chemical Injection• Heat integration improvement on diluent injection
Subsection 3.1.2 (9a, 9b)
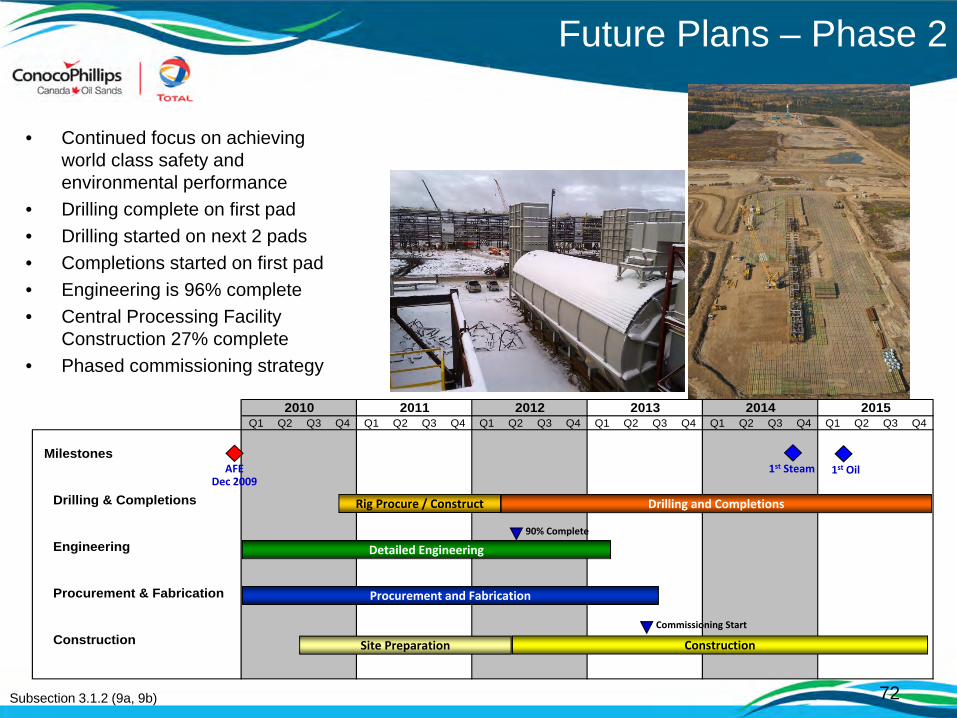
Q1 Q2 Q3 Q4 Q1 Q2 Q3 Q4 Q1 Q2 Q3 Q4 Q1 Q2 Q3 Q4 Q1 Q2 Q3 Q4 Q1 Q2 Q3 Q4
Milestones
Drilling & Completions
Engineering
Procurement & Fabrication
Construction
2013 2014 20152010 2011 2012
Rig Procure / Construct Drilling and Completions
Detailed Engineering
Procurement and Fabrication
Site Preparation Construction
90% Complete
AFEDec 2009
1st Oil
Commissioning Start
1st Steam
• Continued focus on achieving world class safety and environmental performance
• Drilling complete on first pad • Drilling started on next 2 pads• Completions started on first pad• Engineering is 96% complete• Central Processing Facility
Construction 27% complete• Phased commissioning strategy
Subsection 3.1.2 (9a, 9b)
Future Plans – Phase 2
72

Annual Surmont SAGD Performance Review Approval 9460
Surface Operations
April 11, 2013
Calgary, Alberta, Canada

Contents of Presentation
2
• Introduction• Surmont Overview and Highlights• Facilities & Facility Performance 3.1.2(1,2)• Measurement and Reporting 3.1.2 (3)• Water Production, Injection, and Uses 3.1.2(4)• Sulphur Production 3.1.2 (5)• Environmental Issues 3.1.2(6)• Compliance Confirmation 3.1.2(7)• Non-Compliance Issues 3.1.2(8)• Future Plans 3.1.2(9)

Introduction

Ownership and Approvals
• 50/50 joint venture between ConocoPhillips and TOTAL E&P Canada Ltd; Operated by ConocoPhillips
• Approval history: 1997 - ERCB Project Approval - Pilot 2003 - ERCB Project Approval - Commercial 2007 - First Steam at Phase1 2008 - Approval of Phase 2 2009 - Approval of Phase 2 Amendment 2010 - Multiple Amendment Submissions for Scheme 9426 2011 - Multiple Amendment Submissions for Scheme 9426
- Phase 1- E-SAGD - approved- Infill Wells - approved- Produced Water Heat Exchanger - approved- Well pad 103 - currently under review
- Phase 2- Production Capacity Increase - approved- Condition 9 - Well Pad 263-2 approved, Well Pad 264-2 and 263-1 currently under review- Condition 10 - currently under review
Subsection 3.1.2 (1) 4
Surmont Oil Sands Pilot ProjectApproval 9460D
Subsection 3.1.2 (1) Facilities
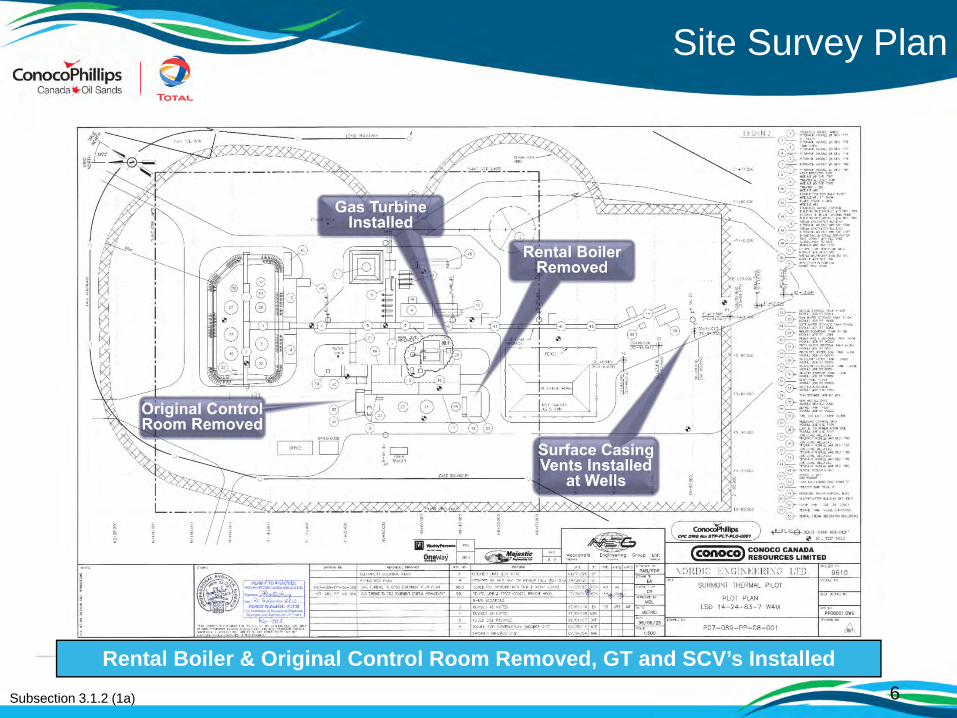
Site Survey Plan
Rental Boiler & Original Control Room Removed, GT and SCV’s InstalledSubsection 3.1.2 (1a) 6
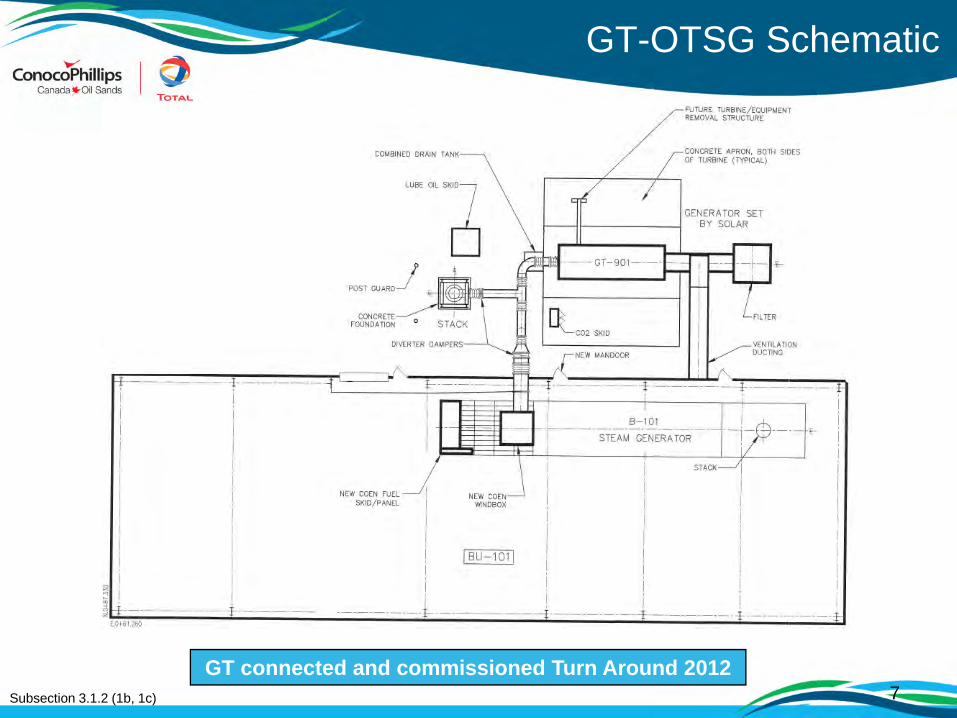
GT-OTSG Schematic
GT connected and commissioned Turn Around 2012 Subsection 3.1.2 (1b, 1c) 7
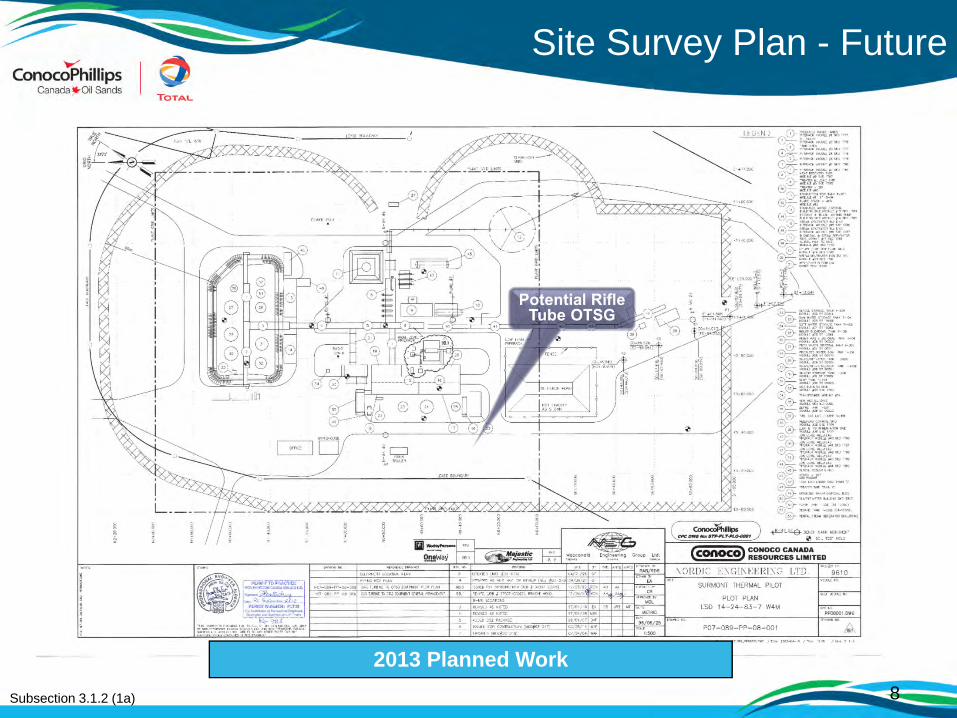
Site Survey Plan - Future
Subsection 3.1.2 (1a) 8
2013 Planned Work

Surmont Oil Sands Pilot ProjectApproval 9460D
Subsection 3.1.2 (2) Facility Performance
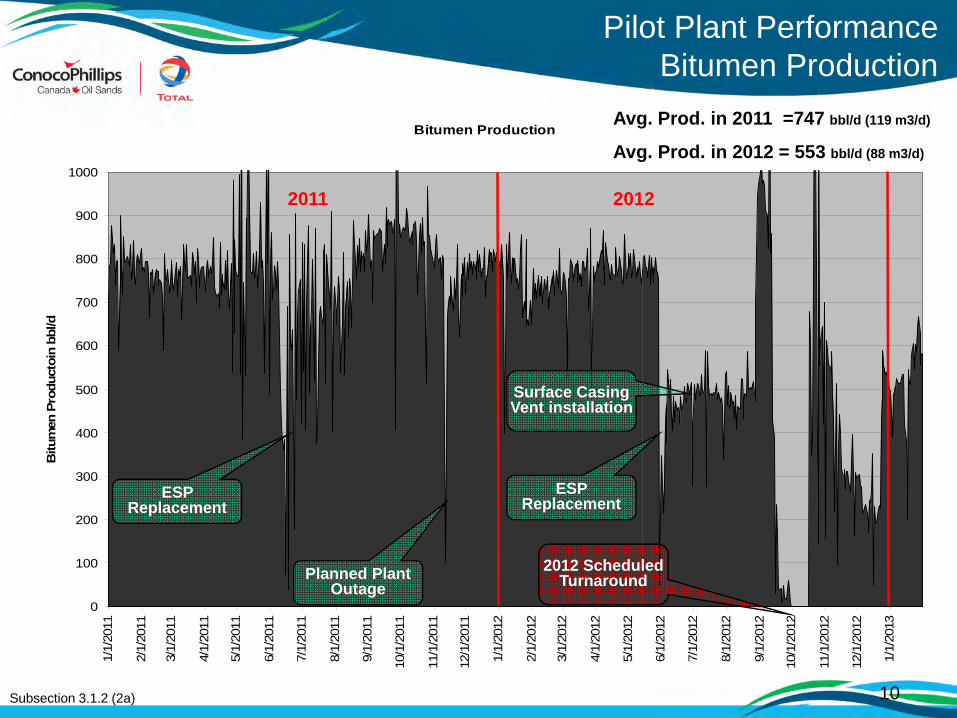
Pilot Plant PerformanceBitumen Production
Subsection 3.1.2 (2a) 10
Bitumen Production
0
100
200
300
400
500
600
700
800
900
1000
1/1/
2011
2/1/
2011
3/1/
2011
4/1/
2011
5/1/
2011
6/1/
2011
7/1/
2011
8/1/
2011
9/1/
2011
10/1
/201
1
11/1
/201
1
12/1
/201
1
1/1/
2012
2/1/
2012
3/1/
2012
4/1/
2012
5/1/
2012
6/1/
2012
7/1/
2012
8/1/
2012
9/1/
2012
10/1
/201
2
11/1
/201
2
12/1
/201
2
1/1/
2013
Bitu
men
Pro
duct
oin
bbl/d
2011 2012
Avg. Prod. in 2011 =747 bbl/d (119 m3/d)
Avg. Prod. in 2012 = 553 bbl/d (88 m3/d)
ESP Replacement
Planned Plant Outage
ESP Replacement
Surface Casing Vent installation
2012 Scheduled Turnaround

Pilot Plant PerformanceSteam Generation
Subsection 3.1.2 (2a) 11
Steam Injection
0
500
1000
1500
2000
2500
3000
3500
1/1/
2011
2/1/
2011
3/1/
2011
4/1/
2011
5/1/
2011
6/1/
2011
7/1/
2011
8/1/
2011
9/1/
2011
10/1
/201
1
11/1
/201
1
12/1
/201
1
1/1/
2012
2/1/
2012
3/1/
2012
4/1/
2012
5/1/
2012
6/1/
2012
7/1/
2012
8/1/
2012
9/1/
2012
10/1
/201
2
11/1
/201
2
12/1
/201
2
1/1/
2013
Stea
m In
ject
ed (b
pd C
WE)
2011 2012
ESP Replacement
Planned Plant Outage
2012 Scheduled Turnaround
ESP Replacement
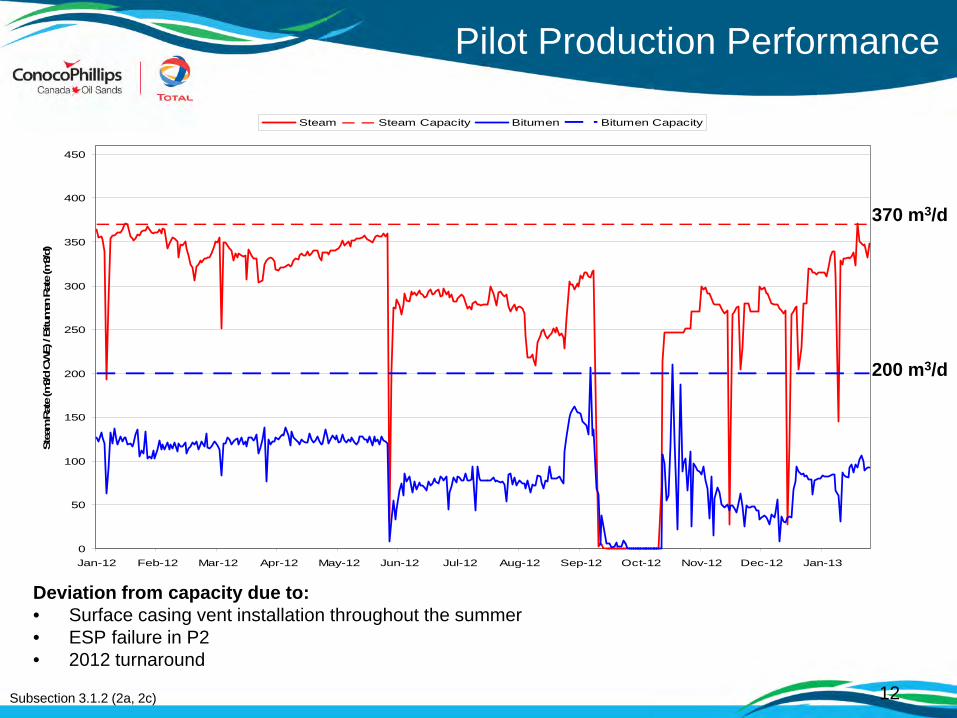
Pilot Production Performance
Deviation from capacity due to:• Surface casing vent installation throughout the summer • ESP failure in P2 • 2012 turnaround
370 m3/d
200 m3/d
Subsection 3.1.2 (2a, 2c) 12
0
50
100
150
200
250
300
350
400
450
Jan-12 Feb-12 Mar-12 Apr-12 May-12 Jun-12 Jul-12 Aug-12 Sep-12 Oct-12 Nov-12 Dec-12 Jan-13
Stea
m R
ate
(m3/
d CW
E) /
Bitu
men
Rat
e (m
3/d)
Steam Steam Capacity Bitumen Bitumen Capacity
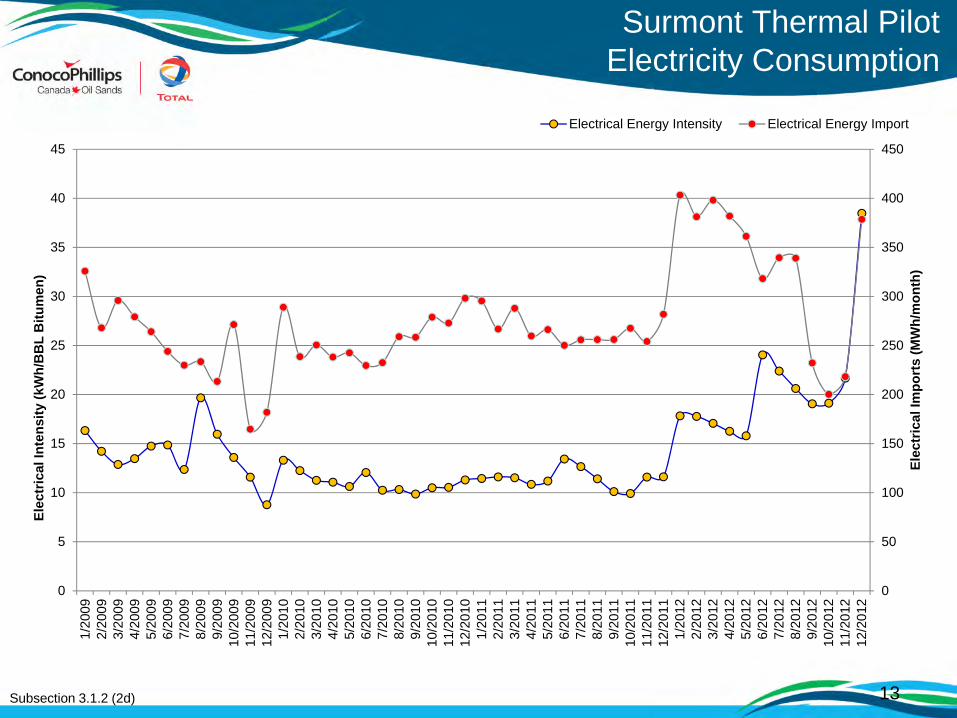
Surmont Thermal PilotElectricity Consumption
Subsection 3.1.2 (2d) 13
0
50
100
150
200
250
300
350
400
450
0
5
10
15
20
25
30
35
40
45
1/20
092/
2009
3/20
094/
2009
5/20
096/
2009
7/20
098/
2009
9/20
0910
/200
911
/200
912
/200
91/
2010
2/20
103/
2010
4/20
105/
2010
6/20
107/
2010
8/20
109/
2010
10/2
010
11/2
010
12/2
010
1/20
112/
2011
3/20
114/
2011
5/20
116/
2011
7/20
118/
2011
9/20
1110
/201
111
/201
112
/201
11/
2012
2/20
123/
2012
4/20
125/
2012
6/20
127/
2012
8/20
129/
2012
10/2
012
11/2
012
12/2
012
Elec
tric
al Im
port
s (M
Wh/
mon
th)
Elec
tric
al In
tens
ity (k
Wh/
BB
L B
itum
en)
Electrical Energy Intensity Electrical Energy Import

Surmont Thermal PilotProduced Gas
14Subsection 3.1.2 (2e)
Change from calculated to metered volumes
0
50
100
150
200
250
300
350
400
450
1/20
092/
2009
3/20
094/
2009
5/20
096/
2009
7/20
098/
2009
9/20
0910
/200
911
/200
912
/200
91/
2010
2/20
103/
2010
4/20
105/
2010
6/20
107/
2010
8/20
109/
2010
10/2
010
11/2
010
12/2
010
1/20
112/
2011
3/20
114/
2011
5/20
116/
2011
7/20
118/
2011
9/20
1110
/201
111
/201
112
/201
11/
2012
2/20
123/
2012
4/20
125/
2012
6/20
127/
2012
8/20
129/
2012
10/2
012
11/2
012
12/2
012
1/20
13
Prod
uced
Gas
(103 m
3 /mon
th)
Produced Gas
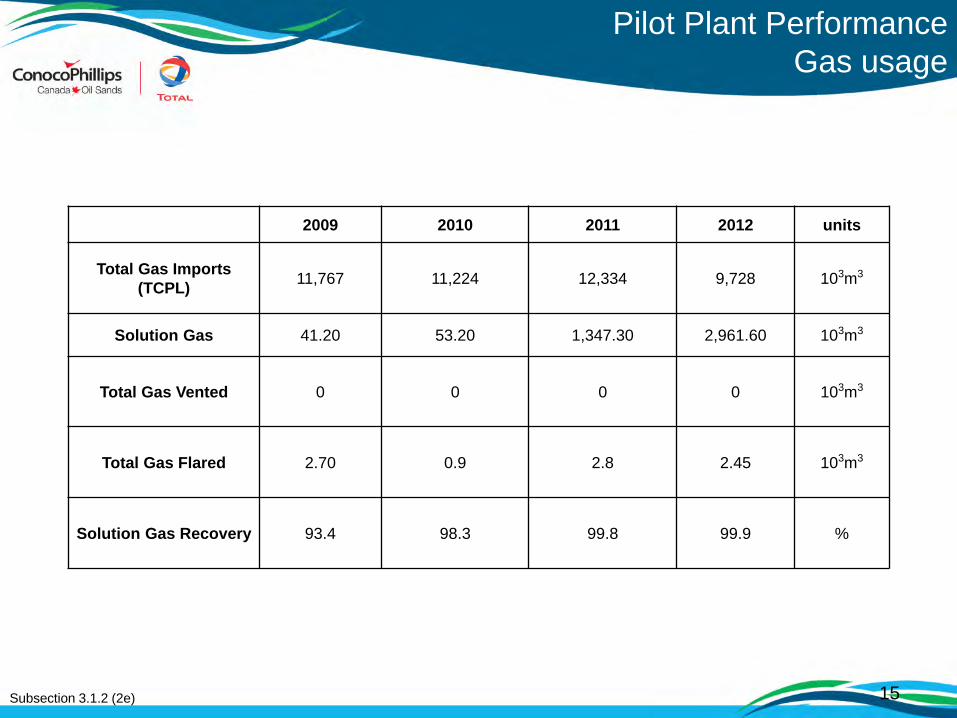
Pilot Plant PerformanceGas usage
Subsection 3.1.2 (2e) 15
2009 2010 2011 2012 units
Total Gas Imports (TCPL) 11,767 11,224 12,334 9,728 103m3
Solution Gas 41.20 53.20 1,347.30 2,961.60 103m3
Total Gas Vented 0 0 0 0 103m3
Total Gas Flared 2.70 0.9 2.8 2.45 103m3
Solution Gas Recovery 93.4 98.3 99.8 99.9 %

0
20
40
60
80
100
120
140
160
180
200
1/20
092/
2009
3/20
094/
2009
5/20
096/
2009
7/20
098/
2009
9/20
0910
/200
911
/200
912
/200
91/
2010
2/20
103/
2010
4/20
105/
2010
6/20
107/
2010
8/20
109/
2010
10/2
010
11/2
010
12/2
010
1/20
112/
2011
3/20
114/
2011
5/20
116/
2011
7/20
118/
2011
9/20
1110
/201
111
/201
112
/201
11/
2012
2/20
123/
2012
4/20
125/
2012
6/20
127/
2012
8/20
129/
2012
10/2
012
11/2
012
12/2
012
1/20
13
Gre
enho
use
Gas
Em
issi
on In
tens
ity
(kg
CO
2e/B
OE)
Greenhouse Gas Emission Intensity
2012
Greenhouse Gas Emissions
2009 2010 2011
Subsection 3.1.2 (2f) 16

Surmont Oil Sands Pilot ProjectApproval 9460D
Subsection 3.1.2 (3) Measurement and Reporting

Bitumen Measurement and Reporting
Subsection 3.1.2 (3)
Bitumen Production = [Phase 1 meter Daily Total + Phase 1 Truck receipts + (Sales Tank finish level – Sales Tank start level) ] –[Diluent Pilot Receipt Meter Daily Total + Diluent Truck receipts +(Diluent Tank finish level – Diluent Tank start level)]
Well Bitumen production is calculated from well tests (pro-rated battery)
18
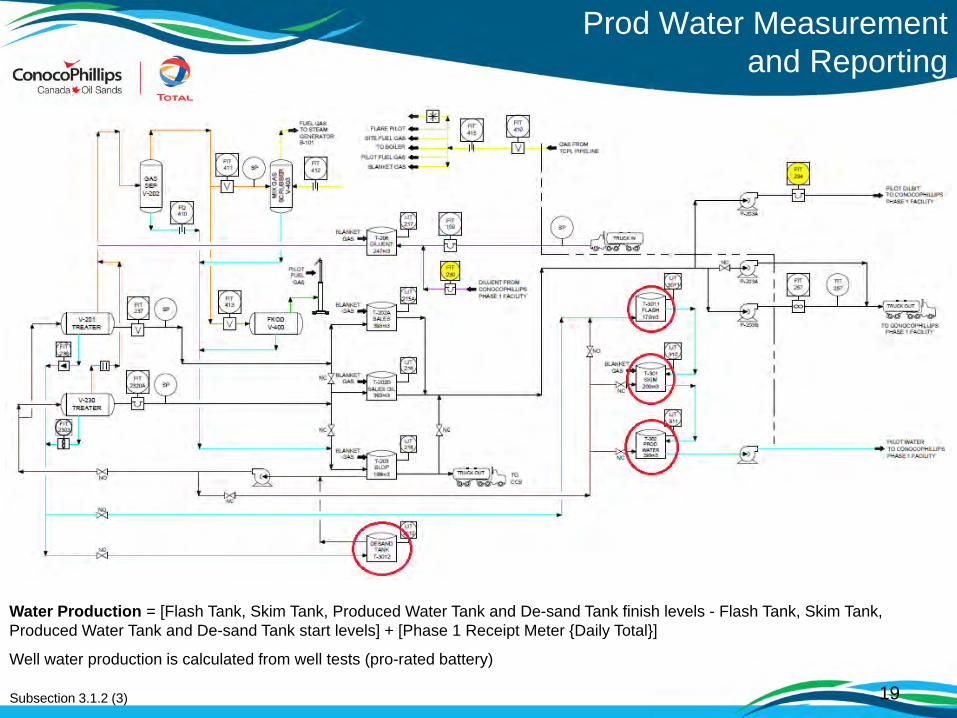
Prod Water Measurement and Reporting
Subsection 3.1.2 (3)
Water Production = [Flash Tank, Skim Tank, Produced Water Tank and De-sand Tank finish levels - Flash Tank, Skim Tank, Produced Water Tank and De-sand Tank start levels] + [Phase 1 Receipt Meter Daily Total]
Well water production is calculated from well tests (pro-rated battery)
19
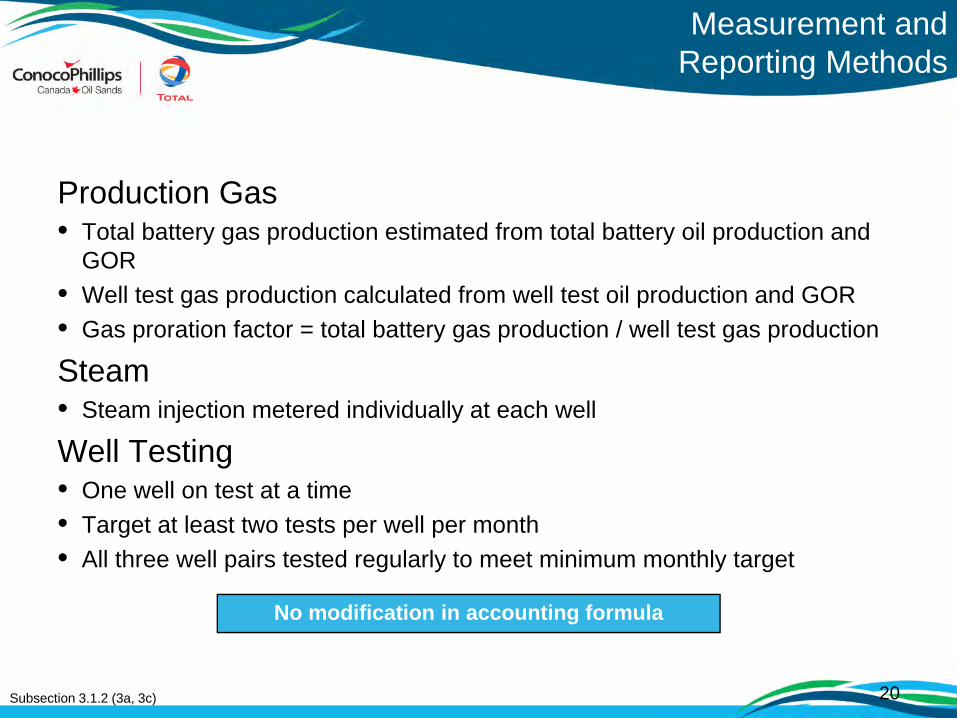
Production Gas• Total battery gas production estimated from total battery oil production and
GOR• Well test gas production calculated from well test oil production and GOR• Gas proration factor = total battery gas production / well test gas production
Steam• Steam injection metered individually at each well
Well Testing• One well on test at a time• Target at least two tests per well per month• All three well pairs tested regularly to meet minimum monthly target
Measurement and Reporting Methods
Subsection 3.1.2 (3a, 3c)
No modification in accounting formula
20
Surmont Oil Sands Pilot ProjectApproval 9460D
Subsection 3.1.2 (4) Water Production, Injection, and Uses
Water Source WellsNon-Saline
Surmont Pilot
Source Well Observation Well Formation
1F1082508307W400 1AJ082508307W400 Lower Grand Rapids
1F1072508307W400 100072508307W400 Clearwater
Surmont Phase 1
Source Well Observation Well Formation
1F1021808306W400 1F2021808306W400 Lower Grand Rapids
1F1041808306W400 102041808306W400 Lower Grand Rapids
1F1011908306W400 100011908306W400 Lower Grand Rapids
1F1032308307W400 100032308307W400 Lower Grand Rapids
Notes
• all water currently used at the Surmont project is non-saline and non-potable (i.e., waters not readily or economically treatable for potable, domestic, agricultural or livestock use)• Phase 2 source wells licenced December 14, 2012, not yet operational
Subsection 3.1.2 (4a) 22
Surmont Phase 2
Source Well Observation Well Formation
1F1022108306W400 100022108306W400 Lower Grand Rapids
1F1022608306W400 100022608306W400 Lower Grand Rapids
1F1052808306W400 100052808306W400 Lower Grand Rapids
1F1070308306W400 1F2070308306W400 Lower Grand Rapids
1F1101408306W400 1F1111408306W400 Lower Grand Rapids
1F1130508306W400 100130508306W400 Lower Grand Rapids
1F1153408307W400 1F2153408307W400 Lower Grand Rapids

Pilot Water Source WellsProduction Volumes
Subsection 3.1.2 (4b) 23
0
2,000
4,000
6,000
8,000
10,000
12,000
14,000
16,000
18,000
20,000
Jan-
10
Apr
-10
Jul-1
0
Oct
-10
Jan-
11
Apr
-11
Jul-1
1
Oct
-11
Jan-
12
Apr
-12
Jul-1
2
Oct
-12
Jan-
13
Volu
me
of W
ater
Pro
duce
d (m
3 ) per
Mon
th
1F1/08-25-083-07 W4M (Lower Grand Rapids)1F1/07-25-083-07 W4M (Clearwater)

Source Water and Steam Injection Volumes
Subsection 3.1.2 (4c; 4d) 24
0
2000
4000
6000
8000
10000
12000
14000
16000Ja
n-11
Feb-
11
Mar
-11
Apr
-11
May
-11
Jun-
11
Jul-1
1
Aug
-11
Sep
-11
Oct
-11
Nov
-11
Dec
-11
Jan-
12
Feb-
12
Mar
-12
Apr
-12
May
-12
Jun-
12
Jul-1
2
Aug
-12
Sep
-12
Oct
-12
Nov
-12
Dec
-12
Jan-
13
Stea
m (c
we
m3/
mnt
h), P
rod.
Wat
er (m
3/m
nth)
Steam Prod Wtr
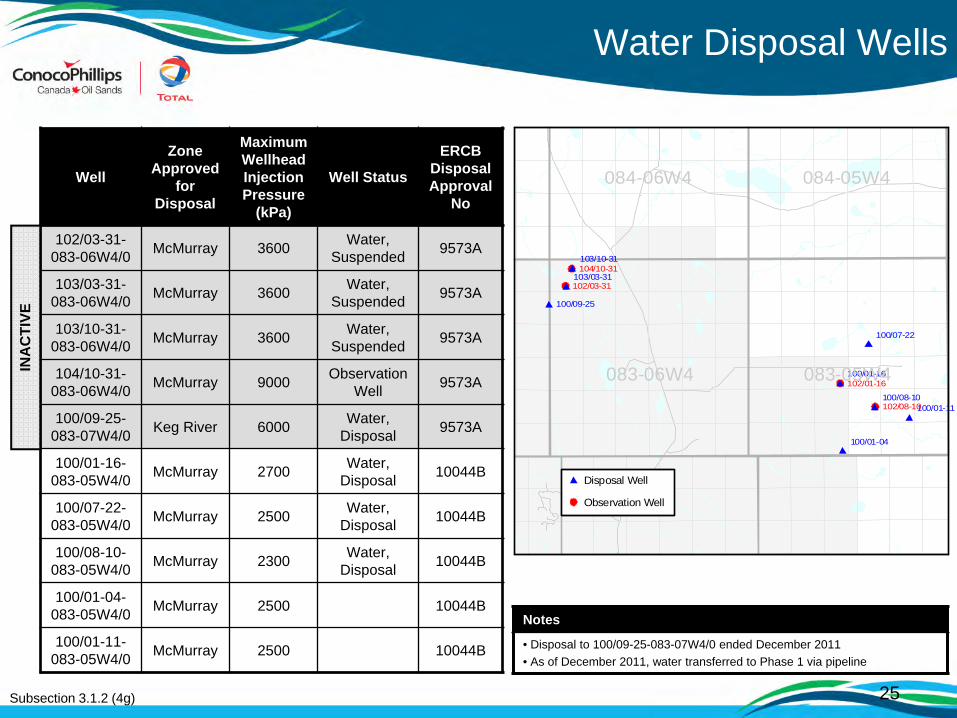
Water Disposal Wells
Subsection 3.1.2 (4g)
Well
Zone Approved
for Disposal
Maximum Wellhead Injection Pressure
(kPa)
Well Status
ERCB DisposalApproval
No
102/03-31-083-06W4/0 McMurray 3600 Water,
Suspended 9573A
103/03-31-083-06W4/0 McMurray 3600 Water,
Suspended 9573A
103/10-31-083-06W4/0 McMurray 3600 Water,
Suspended 9573A
104/10-31-083-06W4/0 McMurray 9000 Observation
Well 9573A
100/09-25-083-07W4/0 Keg River 6000 Water,
Disposal 9573A
100/01-16-083-05W4/0 McMurray 2700 Water,
Disposal 10044B
100/07-22-083-05W4/0 McMurray 2500 Water,
Disposal 10044B
100/08-10-083-05W4/0 McMurray 2300 Water,
Disposal 10044B
100/01-04-083-05W4/0 McMurray 2500 10044B
100/01-11-083-05W4/0 McMurray 2500 10044B
25
INA
CTI
VE
Notes
• Disposal to 100/09-25-083-07W4/0 ended December 2011• As of December 2011, water transferred to Phase 1 via pipeline
102/01-16
102/03-31
102/08-10
104/10-31
1F1/08-32
100/01-04
100/01-11
100/01-16
100/07-22
100/08-10
103/03-31
103/10-31
100/09-25
083-05W4
Disposal Well
Observation Well
083-06W4
084-06W4 084-05W4

Water Disposal Rates
Subsection 3.1.2 (4h) 26Disposal waters transferred to Phase 1 via pipeline and truck as of December 2011
0
2,000
4,000
6,000
8,000
10,000
12,000
14,000
16,000
18,000
20,000
22,000
24,000Ja
n-11
Feb-
11
Mar
-11
Apr
-11
May
-11
Jun-
11
Jul-1
1
Aug
-11
Sep
-11
Oct
-11
Nov
-11
Dec
-11
Jan-
12
Feb-
12
Mar
-12
Apr
-12
May
-12
Jun-
12
Jul-1
2
Aug
-12
Sep
-12
Oct
-12
Nov
-12
Dec
-12
Jan-
13
Volu
me
of W
ater
Tra
nsfe
rred
(m3 )
per
Mon
th
Blow Down Water Transferred to Phase 1 via Pipeline
Blow Down Water Trucked to Pond
Produced Water Injected at 100/09-25-083-07 W4M (Keg River)
Produced Water Transferred to Phase 1 via Pipeline
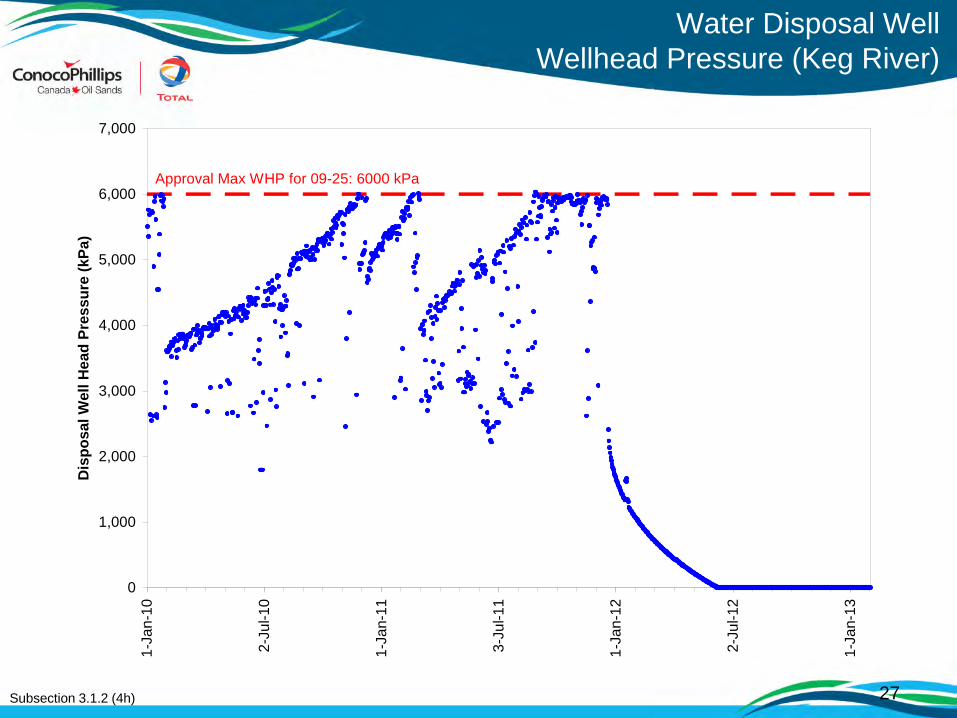
Water Disposal WellWellhead Pressure (Keg River)
Subsection 3.1.2 (4h) 27
0
1,000
2,000
3,000
4,000
5,000
6,000
7,0001-
Jan-
10
2-Ju
l-10
1-Ja
n-11
3-Ju
l-11
1-Ja
n-12
2-Ju
l-12
1-Ja
n-13
Dis
posa
l Wel
l Hea
d Pr
essu
re (k
Pa)
Approval Max WHP for 09-25: 6000 kPa

Solid Waste Disposal
Data provided by Tervita
Subsection 3.1.2 (4i)
Waste Description Waste Weight (kg) Final Destination Facility Type
FILTERS - LEACHABLE (cls N/R) 356 Secure Energy – Pembina Area Landfill Landfill Class I
RAGS - LEACHABLE (cls N/R) 277 Secure Energy – Pembina Area Landfill Landfill Class I
SOIL & DEBRIS - LEACHABLE HYDROCARBON (REFINED) (cls N/R) 5,518 Secure Energy – Pembina Area Landfill Landfill Class I
ASBESTOS (TDG PIN UN2590 OR UN2212) (cls 9) 470 Beaver County Regional Landfill Landfill Class II
NON-REGULATED SOLIDS (LANDFILL) 135 Beaver County Regional Landfill Landfill Class II
28
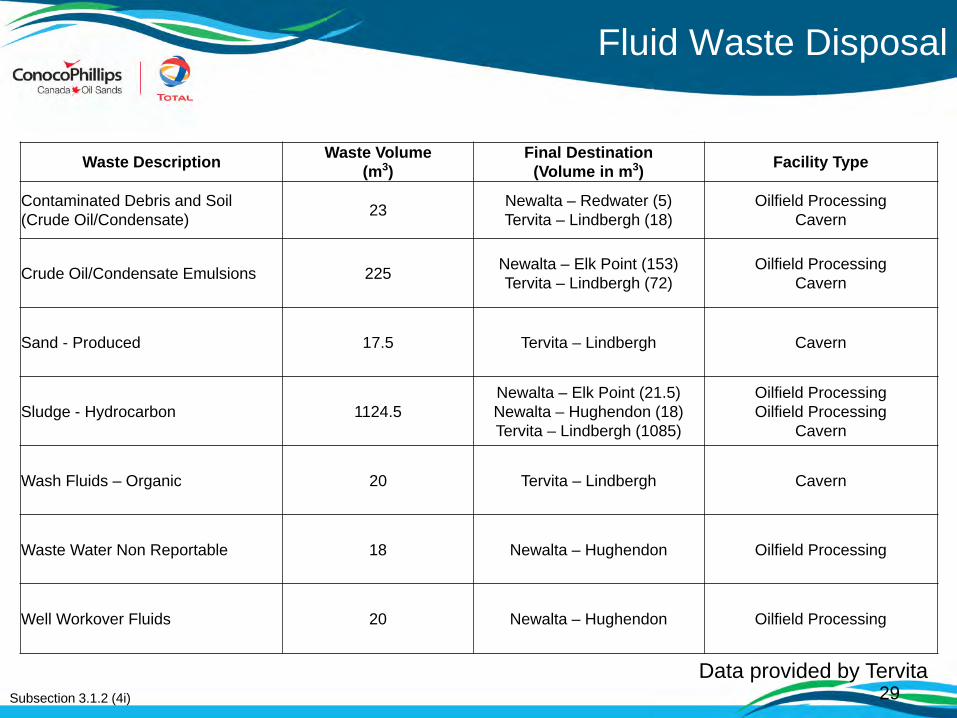
Waste Description Waste Volume (m3)
Final Destination (Volume in m3) Facility Type
Contaminated Debris and Soil (Crude Oil/Condensate) 23 Newalta – Redwater (5)
Tervita – Lindbergh (18)Oilfield Processing
Cavern
Crude Oil/Condensate Emulsions 225 Newalta – Elk Point (153)Tervita – Lindbergh (72)
Oilfield ProcessingCavern
Sand - Produced 17.5 Tervita – Lindbergh Cavern
Sludge - Hydrocarbon 1124.5Newalta – Elk Point (21.5)Newalta – Hughendon (18)Tervita – Lindbergh (1085)
Oilfield ProcessingOilfield Processing
Cavern
Wash Fluids – Organic 20 Tervita – Lindbergh Cavern
Waste Water Non Reportable 18 Newalta – Hughendon Oilfield Processing
Well Workover Fluids 20 Newalta – Hughendon Oilfield Processing
Fluid Waste Disposal
Data provided by TervitaSubsection 3.1.2 (4i) 29
Surmont Oil Sands Pilot ProjectApproval 9460D
Subsection 3.1.2 (5) Sulphur Production

0
0.05
0.1
0.15
0.2
0.25
0.3
0.35
0.4
0.45
Sulp
hur E
mis
sion
s (to
nnes
/mon
th)
Monthly Sulphur Emissions
Subsection 3.1.2 (5b)
2012
31
Change to a more accurate Field Data Capture system starting May 2011
2009 2010 2011Unusually high field H2S concentration
0.000
0.010
0.020
0.030
0.040
0.050
0.060
0.070
0.080
0.090
SO2
Emis
sion
s (to
nnes
/day
)
Average Peak Daily Limit (AESRD)
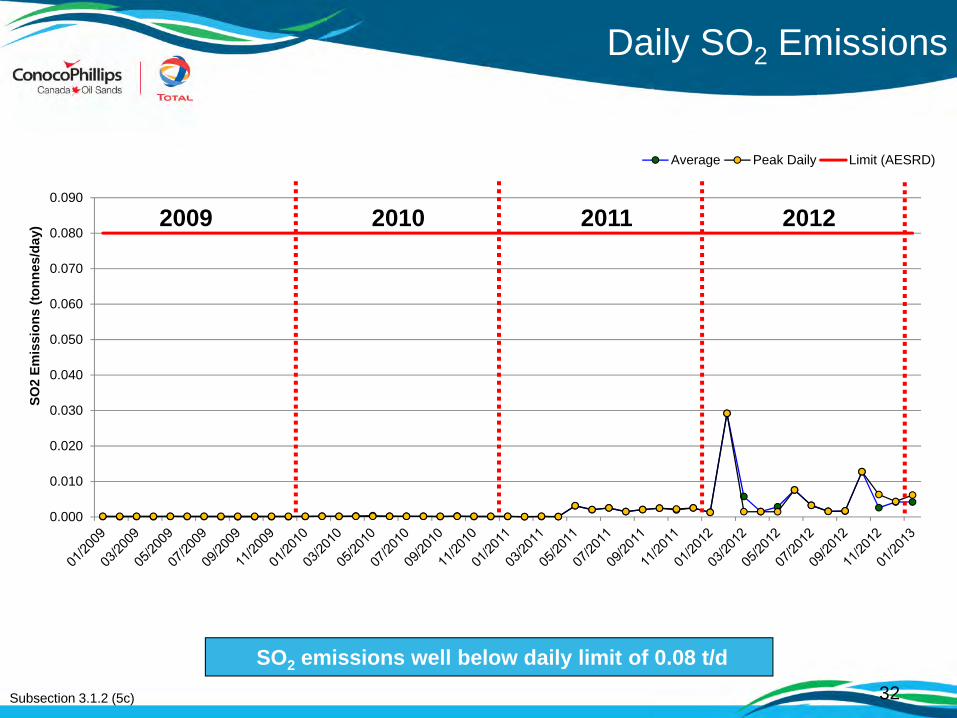
Daily SO2 Emissions
Subsection 3.1.2 (5c)
SO2 emissions well below daily limit of 0.08 t/d32
2009 2010 2011 2012
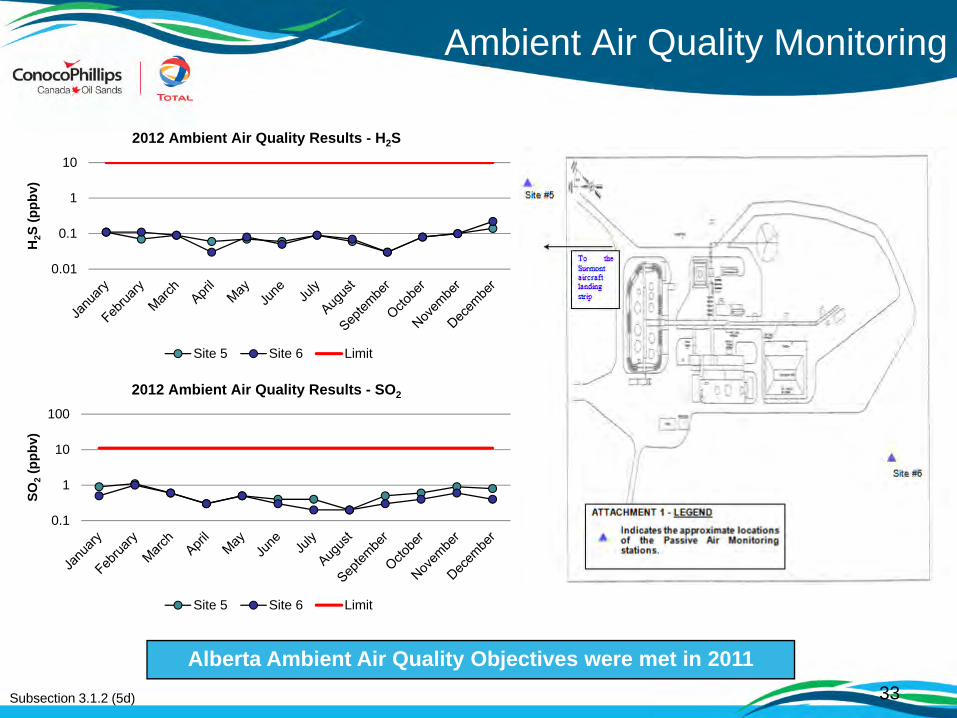
Ambient Air Quality Monitoring
Subsection 3.1.2 (5d)
Alberta Ambient Air Quality Objectives were met in 201133
0.01
0.1
1
10
H2S
(ppb
v)
2012 Ambient Air Quality Results - H2S
Site 5 Site 6 Limit
0.1
1
10
100
SO2
(ppb
v)
2012 Ambient Air Quality Results - SO2
Site 5 Site 6 Limit

Surmont Oil Sands Pilot ProjectApproval 9460D
Subsection 3.1.2 (6) Environmental Issues
Compliance• No regulatory issues with Alberta Environment, SRD or DFO
Groundwater Monitoring• 2012 results within historical/background concentrations
Soil and Groundwater Monitoring• Soil monitoring program completed in 2012
Reclamation Programs• No reclamation in 2012
Environmental Compliance
Subsection 3.1.2 (6a, 6c, 6d) 35
Surmont Oil Sands Pilot ProjectApproval 9460D
Subsection 3.1.2 (7) Compliance Confirmation
Compliance Confirmation
ConocoPhillips is in compliance in all areas of the regulations for all of 2012 with the exception of the following:
• Inaccurate reporting of flared gas• Meter calibration/proving tag or detailed report does not meet
requirementsFollow-up items from audit
• Glycol surge drum blanketed with fuel gas• Pilot VRU• Raw water with no secondary containment• No surface casing vents• Water-cut meter
Subsection 3.1.2 (7) 37
Surmont Oil Sands Pilot ProjectApproval 9460D
Subsection 3.1.2 (8) Noncompliance Issues
Compliance
Inaccurate Reporting of Flared Gas:• High risk noncompliance• (Complete) Administrative controls in place
Meter calibration/proving tag or detailed report does not meet requirements:
• Low risk noncompliance• (Complete) Recalibrated and re-tagged at Pilot turn around September 2012
Follow-up Items From Audit:• Glycol surge drum blanketed with fuel gas
– (Complete) Replaced fuel gas blanket with inert N2 during September 2012 turn around
• Pilot VRU – H2S release calculations submitted, ERCB meeting pending
• Raw water with no secondary containment– (Complete) Sampling and testing of the raw water meets the criteria of Directive 055 Section 3.4.1 and
therefore does not require secondary containment.
• No surface casing vents– (Complete) Installed during 2012 turn around
• Water-cut meter on sales oil – (Complete) Installed during 2012 turn around
Subsection 3.1.2 (8) 39

Subsection 3.1.1 – 2) Geology and GeophysicsSurmont Oil Sands Pilot Project
Approval 9460DSubsection 3.1.2 (9)
Future Plans
• Potentially re-drill well pair C and reestablish total steam chamber coalescence with pairs A and B.
• Maintain a production strategy for well pairs A and B to achieve primary objective of the Pilot of understanding SAGD performance under thief zones.
• Gas cap monitoring• Thief zone and blowdown studies• Potentially install and test the operation of a rifled tube OTSG • Test the operation of the GT-OTSG
Subsection 3.1.2 (9)
Future Plans
41
April 10, 2013
AnnualSurmont SAGD
Performance ReviewApprovals 9460, 9426 and 11596
Subsurface
2
Contents of Presentation
• Introduction• Surmont Overview and Highlights• Geology and Geophysics 3.1.1(2)• Drilling and Completions 3.1.1(3)• Artificial Lift 3.1.1(4)• Instrumentation in Wells 3.1.1(5)• 4D Seismic 3.1.1(6)• Scheme Performance 3.1.1(7)• Future Plans 3.1.1(8)

Introduction

Ownership and Approvals
• 50/50 joint venture between ConocoPhillips and TOTAL E&P Canada Ltd; Operated by ConocoPhillips
• Approval history: 1997 - ERCB Project Approval - Pilot 2003 - ERCB Project Approval - Commercial 2007 - First Steam at Phase1 2008 - Approval of Phase 2 2009 - Approval of Phase 2 Amendment 2010 - Construction Start at Phase 2 2011 - Approval of Phase 2 Expansion, GT-OTSG and E-SAGD Projects 2012 - Multiple Amendment Submissions for Scheme 9426
- Phase 1- Well pad 103 - approved
- Phase 2- Condition 9 – Well Pads 264-2 and 263-1 – approved- Condition 10 – Operating Strategy – approved- HWY 881 Steam Pipeline Crossing – approved
Subsection 3.1.1 (1) 4
5
Surmont Overview and Highlights
6
• Phase 1 is identifying optimization opportunities based on actual conditions
• Phase 1 and 2 combined approved capacity is 21, 624 m3/d (136,000 bbl/cd) (Ph 1 - 4,293 m3/d , Ph 2 - 17,331 m3/d )
Surmont Overview
Subsection 3.1.1 (1)
7
2012 Highlights
• Operations Excellence: Focus on Integrated Operations to improve safety and productivity
• Leverage learning from others• Continued planning for sustaining pads and infill wells• Engineering work for major debottlenecking projects • Reached new records of steam injection and bitumen
production during 2012• Key improvements/successes:
- Achieved production proration factor compliance- Improved ESP conversion time. Started up two PCPs- Continue Circulation optimization- Achieve longer periods of CPF stability- Soda ash silo commissioned and operating- MPFM trial - Started solvent injection at E-SAGD pilot- Started MP reduced BD trial - Pilot turn around. GT-OTSG burner start up
• Key challenges:- Water treating OTSG Scale- Water balance and water recycle- E-502 fouling and required cleaning
Subsection 3.1.1 (1)
D ata as o f January 31 , 2013
0
5,000
10,000
15,000
20,000
25,000
30,000
35,000
Oct
-07
Jan-
08
Apr
-08
Jul-0
8
Oct
-08
Jan-
09
Apr
-09
Jul-0
9
Oct
-09
Jan-
10
Apr
-10
Jul-1
0
Oct
-10
Jan-
11
Apr
-11
Jul-1
1
Oct
-11
Jan-
12
Apr
-12
Jul-1
2
Oct
-12
Jan-
13
Gro
ss P
rodu
ctio
n (b
oepd
)
0
20,000
40,000
60,000
80,000
100,000
120,000
Stea
m In
ject
ion
(cw
ebpd
)
Daily produc tion P roduc tion record Daily S team S team record
8
Phase 1 Production
2008 Key Issues• Freezing
• Off-spec product• Plant instability
2009 Key Issues• OTSG integrity
• Front-end treatment• 1st turnaround
2010 Key Issues• ESP installations
• OTSG maintenance
Continued stable operationsSubsection 3.1.1 (1)
2011 Key Issues• ESP installations
• OTSG maintenance • Turnaround
2012 Key Issues•ESP installations /
Repair•OTSG maintenance
Record Production: 29,917 boepd
Record Steam: 68,470 cwebpd

9
Subsection 3.1.1 (2) Geology and Geophysics
1010
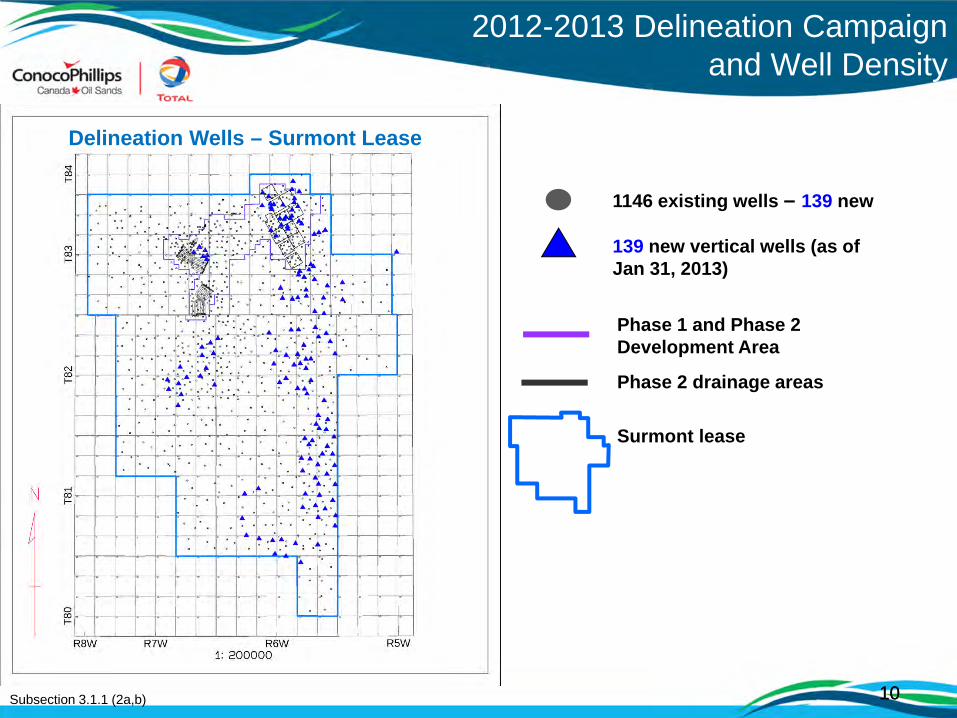
2012-2013 Delineation Campaign and Well Density
Subsection 3.1.1 (2a,b)
Phase 1 and Phase 2 Development Area
Phase 2 drainage areas
Surmont lease
1146 existing wells – 139 new
139 new vertical wells (as of Jan 31, 2013)
Delineation Wells – Surmont Lease

11
2012-2013 Delineation Campaign and Well Density
Subsection 3.1.1 (2a,b)
Focus on Phase 2 Initial Drainage Areas and Initial Surmont 1 sustaining pad
locations as well as delineation of Phase 3
Existing wells
New vertical wells (as of Jan 31, 2013)
Phase 1 and Phase 2 Development Area
Phase 2 drainage areas
Surmont lease
Delineation Wells – Development Area
(only includes wells that penetrate the McMurray)
1212
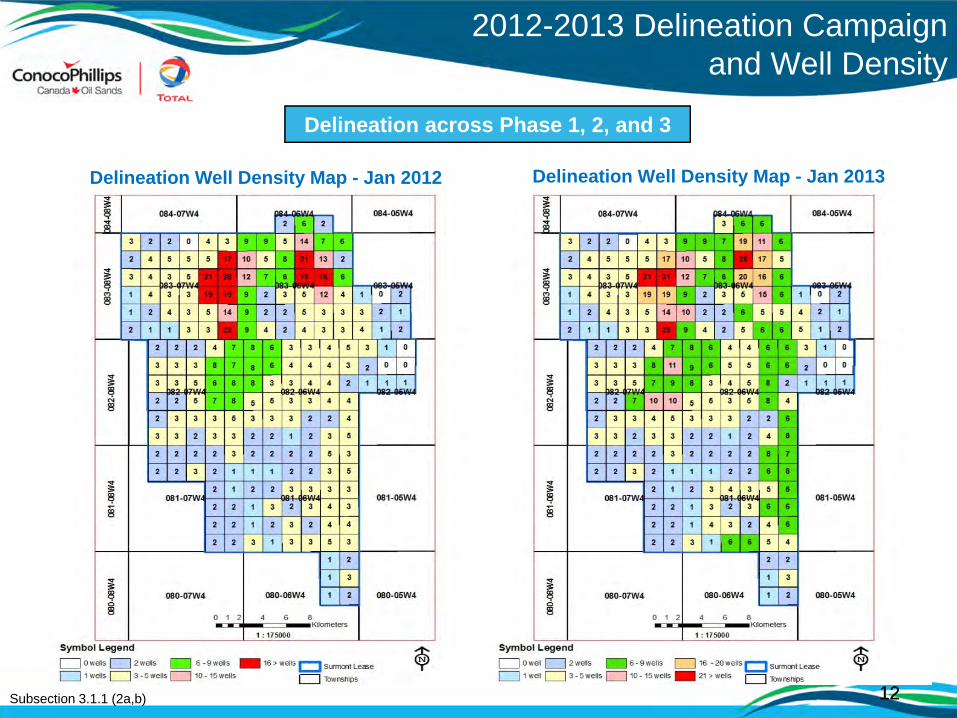
2012-2013 Delineation Campaign and Well Density
Subsection 3.1.1 (2a,b)
Delineation focused on Phase 2 AreaDelineation across Phase 1, 2, and 3
Delineation Well Density Map - Jan 2013Delineation Well Density Map - Jan 2012
1313
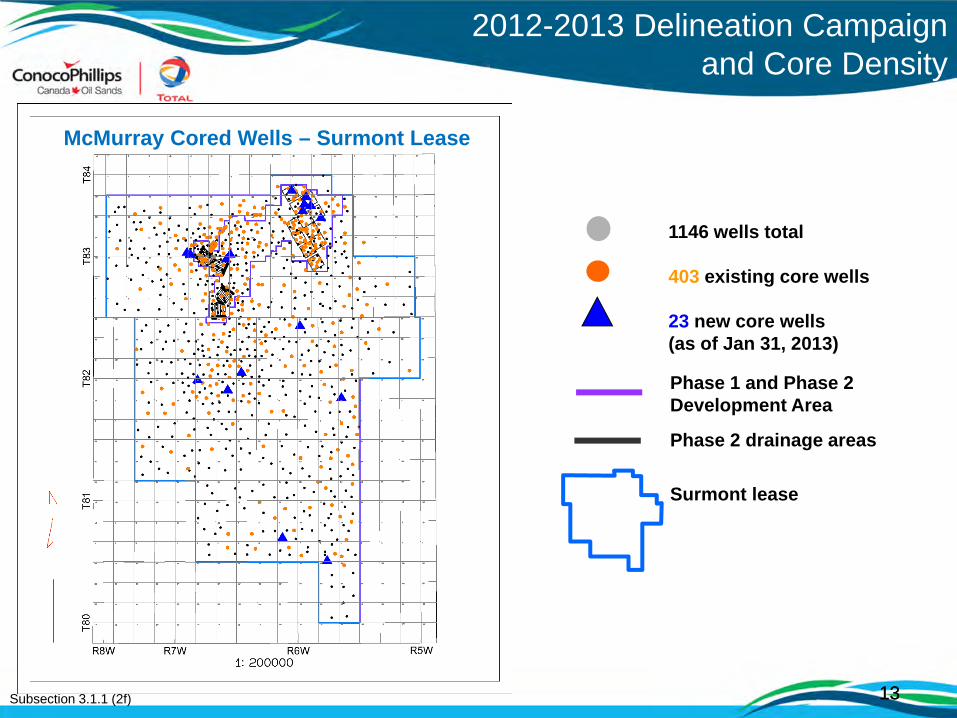
2012-2013 Delineation Campaign and Core Density
Subsection 3.1.1 (2f)
McMurray Cored Wells – Surmont Lease
1146 wells total
403 existing core wells
23 new core wells (as of Jan 31, 2013)
Phase 1 and Phase 2 Development Area
Phase 2 drainage areas
Surmont lease
14Subsection 3.1.1 (2a,b)
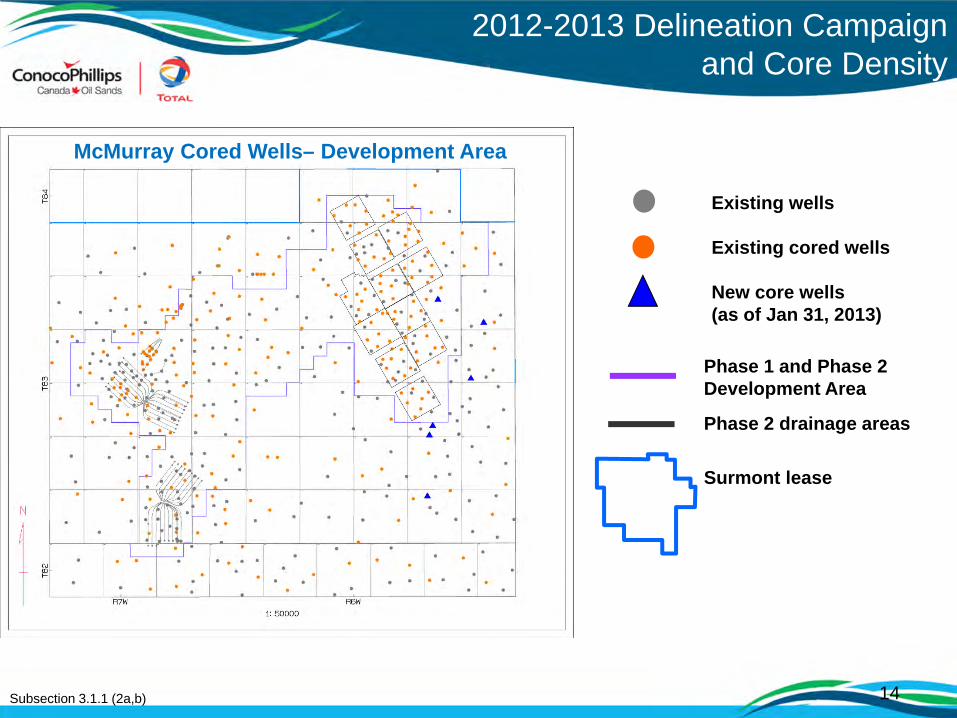
2012-2013 Delineation Campaign and Core Density
McMurray Cored Wells– Development Area
Existing wells
Existing cored wells
New core wells (as of Jan 31, 2013)
Phase 1 and Phase 2 Development Area
Phase 2 drainage areas
Surmont lease
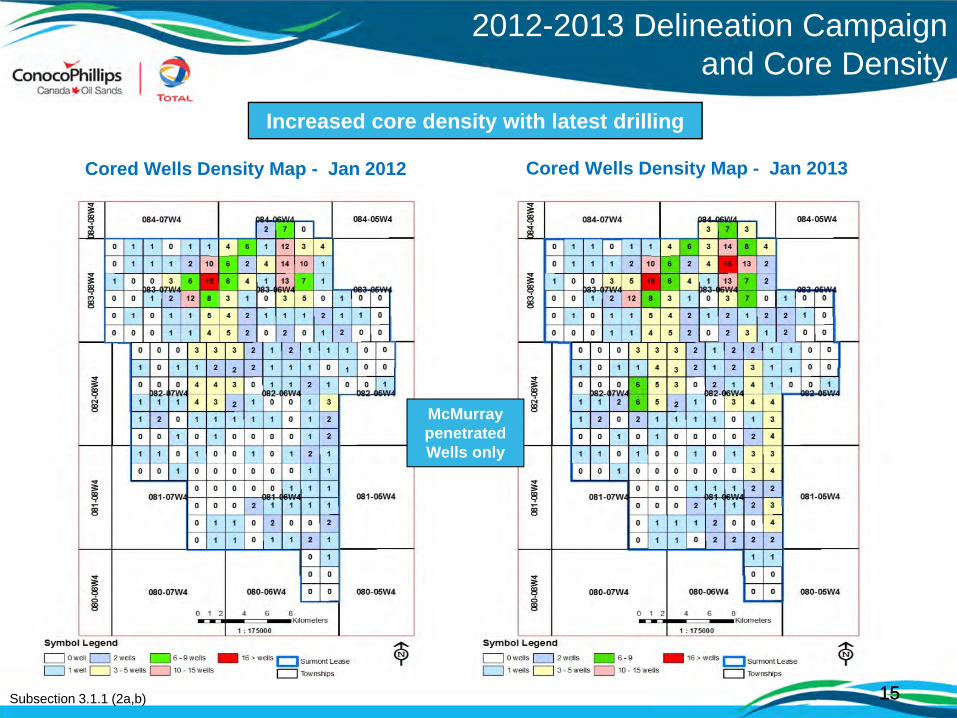
1515
Increased core density with latest drilling
2012-2013 Delineation Campaign and Core Density
Cored Wells Density Map - Jan 2012
McMurray penetrated Wells only
Cored Wells Density Map - Jan 2013
Subsection 3.1.1 (2a,b)

1616
2012-2013 Delineation Campaign and FMI Logs
Subsection 3.1.1 (2f)
1146 wells total
657 existing FMI wells
139 new FMI wells (as of Jan 31, 2013)
Phase 1 and Phase 2 Development Area
Phase 2 drainage areas
Surmont lease
McMurray FMI Logs – Surmont Lease 100% Coverage of FMI Data in 2012/2013 program
• Important for breccia identification

1717Subsection 3.1.1 (2f)
2012-2013 Delineation Campaign and FMI Logs
McMurray FMI Logs – Development Area 100% Coverage of FMI Data in 2012/2013 program
• Important for breccia identification
Existing wells
Existing FMI wells
New FMI wells (as of Jan 31, 2013)
Phase 1 and Phase 2 Development Area
Phase 2 drainage areas
Surmont lease

McMurray penetrated Wells only
FMI Well Log Density Map – Jan 2012
Increased Formation Micro Imaging density with latest drilling
FMI Well Log Density Map – Jan 2013
2012-2013 Delineation Campaign and FMI Density
18Subsection 3.1.1 (2a,b)

TopResSeis: was a composite surface interpreted from seismic and well picks to represent the top of the McMurray reservoir. It could be top bitumen, top water or top gas, and it was a challenged seismic pick.• Decision: discontinue this interpretation in
favor of clear stratigraphic interpretations: Top McMurray and Base Channel.
Top McMurray (MCMR): distinct geologic and seismic pick, a stratigraphic boundary.• McMurray fluid boundary interpretations
remain based on well data
McMurray Channels (MCMR_CH_SH_Base): distinct geologic and seismic pick, stratigraphic feature that erodes into McMurray reservoir.
2012 Geological Updates
Updated Geological Schematic 2012
19Subsection 3.1.1 (2i)
Refined Channel Interpretation
20
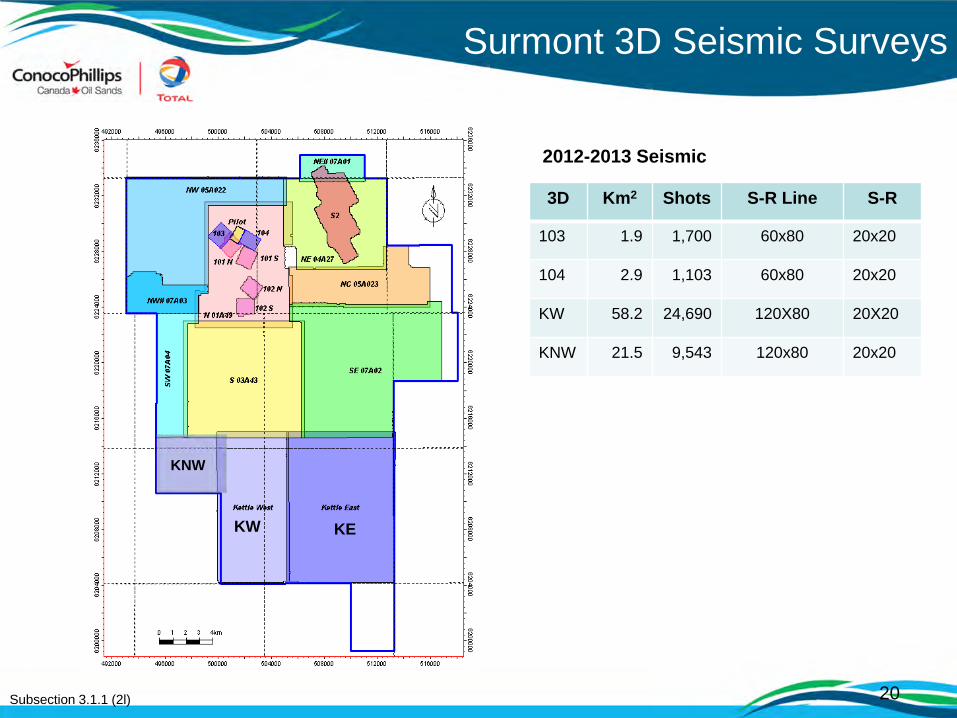
Surmont 3D Seismic Surveys
KW KE
Subsection 3.1.1 (2l)
KNW
3D Km2 Shots S-R Line S-R
103 1.9 1,700 60x80 20x20
104 2.9 1,103 60x80 20x20
KW 58.2 24,690 120X80 20X20
KNW 21.5 9,543 120x80 20x20
2012-2013 Seismic
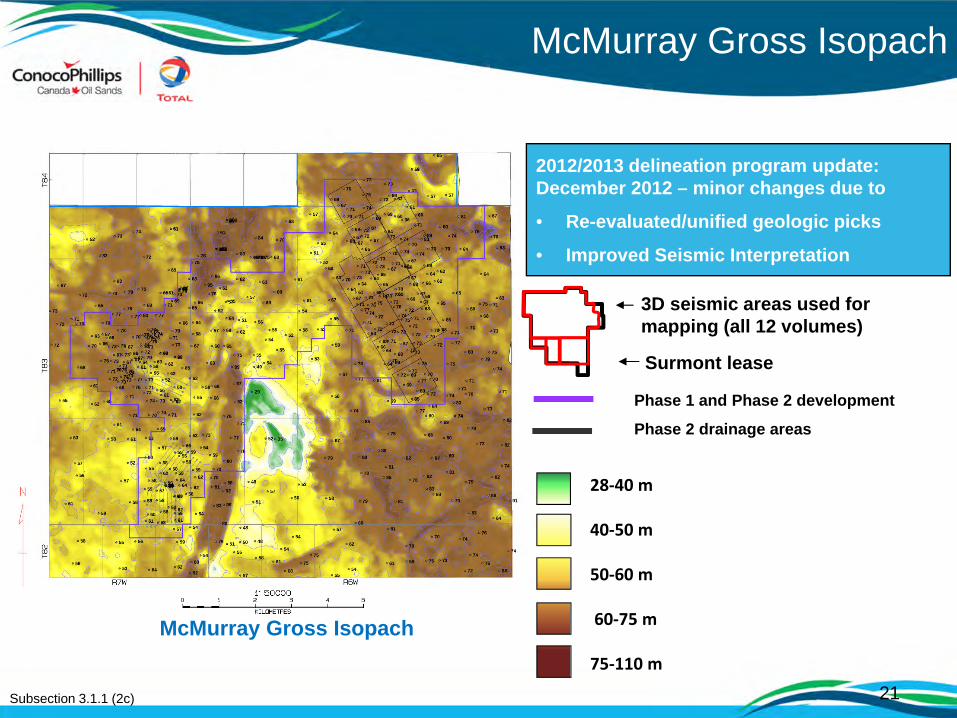
21Subsection 3.1.1 (2c)
McMurray Gross Isopach
McMurray Gross Isopach
28‐40 m
40‐50 m
50‐60 m
60‐75 m
75‐110 m
Phase 1 and Phase 2 development
Phase 2 drainage areas
3D seismic areas used for mapping (all 12 volumes)
Surmont lease
2012/2013 delineation program update: December 2012 – minor changes due to
• Re-evaluated/unified geologic picks
• Improved Seismic Interpretation
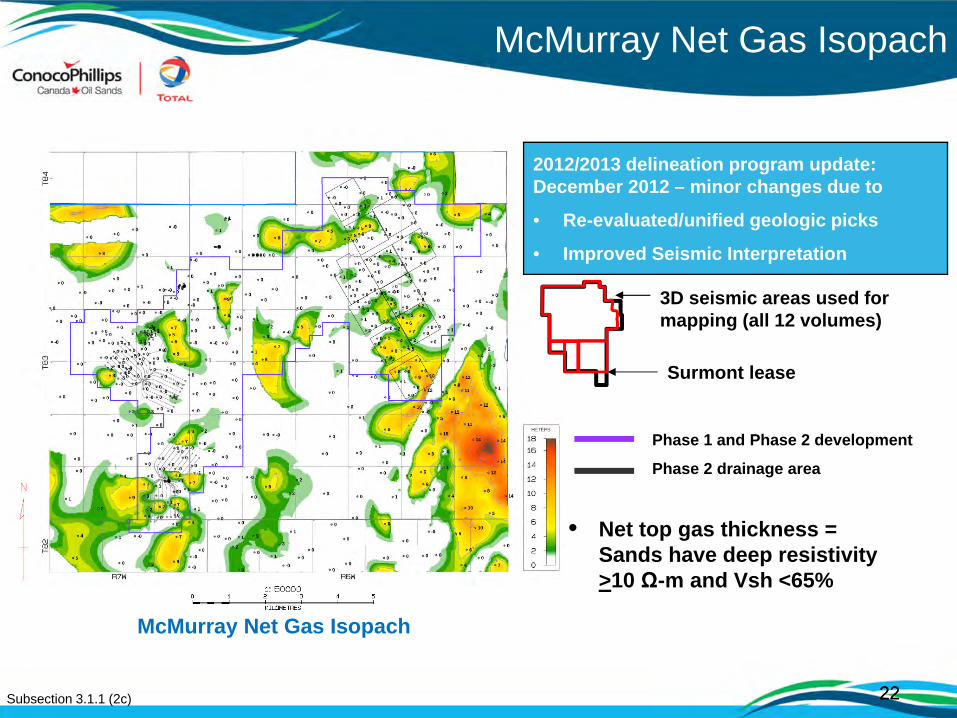
2222
McMurray Net Gas Isopach
Subsection 3.1.1 (2c)
McMurray Net Gas Isopach
Phase 1 and Phase 2 development
Phase 2 drainage area
3D seismic areas used for mapping (all 12 volumes)
Surmont lease
• Net top gas thickness = Sands have deep resistivity >10 Ω-m and Vsh <65%
2012/2013 delineation program update: December 2012 – minor changes due to
• Re-evaluated/unified geologic picks
• Improved Seismic Interpretation
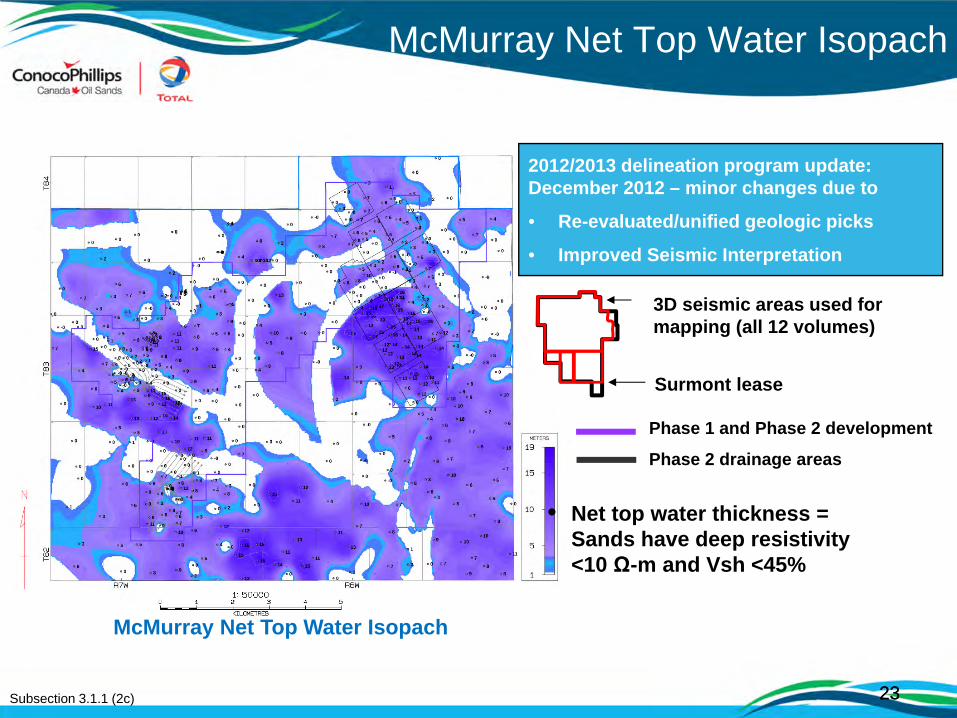
2323
McMurray Net Top Water Isopach
Subsection 3.1.1 (2c)
3D seismic areas used for mapping (all 12 volumes)
Surmont lease
• Net top water thickness = Sands have deep resistivity <10 Ω-m and Vsh <45%
2012/2013 delineation program update: December 2012 – minor changes due to
• Re-evaluated/unified geologic picks
• Improved Seismic Interpretation
McMurray Net Top Water Isopach
Phase 1 and Phase 2 development
Phase 2 drainage areas
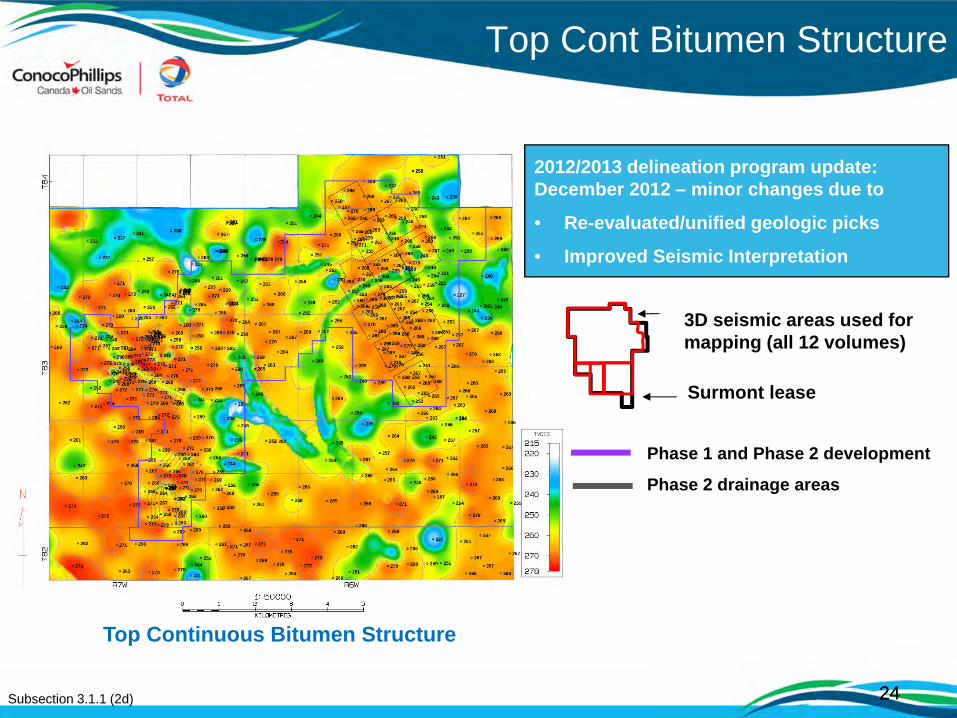
2424
Top Cont Bitumen Structure
Subsection 3.1.1 (2d)
3D seismic areas used for mapping (all 12 volumes)
Surmont lease
2012/2013 delineation program update: December 2012 – minor changes due to
• Re-evaluated/unified geologic picks
• Improved Seismic Interpretation
Top Continuous Bitumen Structure
Phase 1 and Phase 2 development
Phase 2 drainage areas

2525
Base Cont Bitumen Structure
Subsection 3.1.1 (2d)
Phase 1 and Phase 2 development
Phase 2 drainage areas
3D seismic areas used for mapping (all 12 volumes)
Surmont lease
2012/2013 delineation program update: December 2012 – minor changes due to
• Re-evaluated/unified geologic picks
• Improved Seismic Interpretation
Base Continuous Bitumen Structure
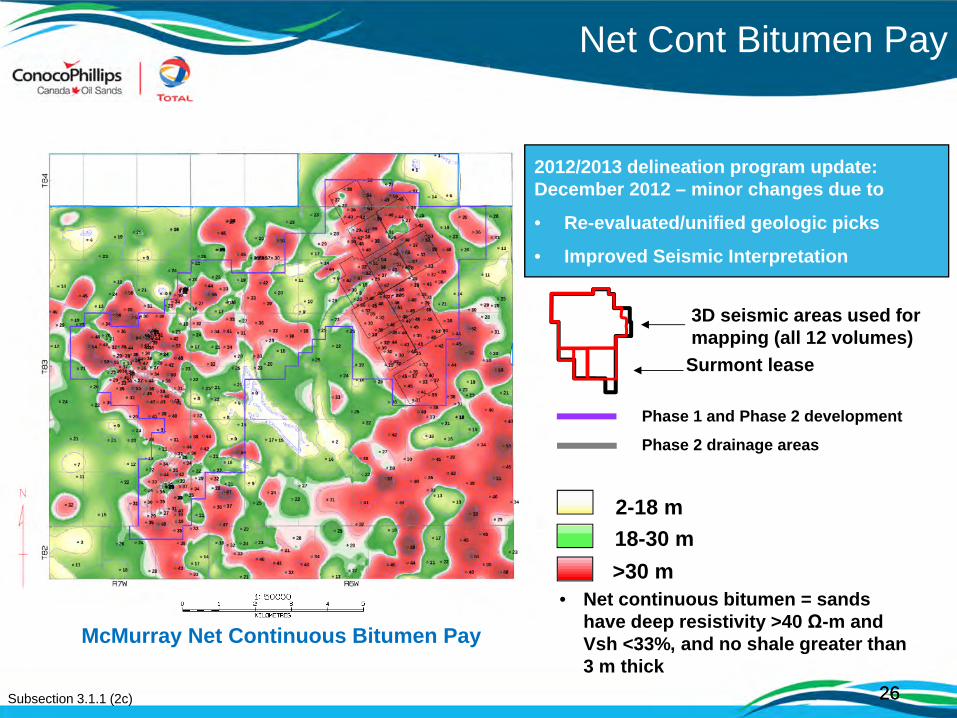
2626
Net Cont Bitumen Pay
Subsection 3.1.1 (2c)
McMurray Net Continuous Bitumen Pay
3D seismic areas used for mapping (all 12 volumes)
Surmont lease
Phase 1 and Phase 2 development
Phase 2 drainage areas
• Net continuous bitumen = sands have deep resistivity >40 Ω-m and Vsh <33%, and no shale greater than 3 m thick
18-30 m>30 m
2-18 m
2012/2013 delineation program update: December 2012 – minor changes due to
• Re-evaluated/unified geologic picks
• Improved Seismic Interpretation

27
Surmont Lease OBIP
Subsection 3.1.1 (2a, 2b, 2c)
Surmont Lease OBIP
Surmont lease
Phase 1 and Phase 2 development
Phase 2 drainage areas
OBIP = Thickness x Phie x So x Area
2012/2013 Delineation Program Update: December 2012 – no major change to
OBIP per square mile (enlarged Development Area)
18-30m
>30m
2-18m
Properties Development Area
NCBThickness Range
0 to Greater than 30 m
Phie in NCB 33%
So in NCB 79%
OOIP in NCB > 18m
2761 MMbblsDeterministic
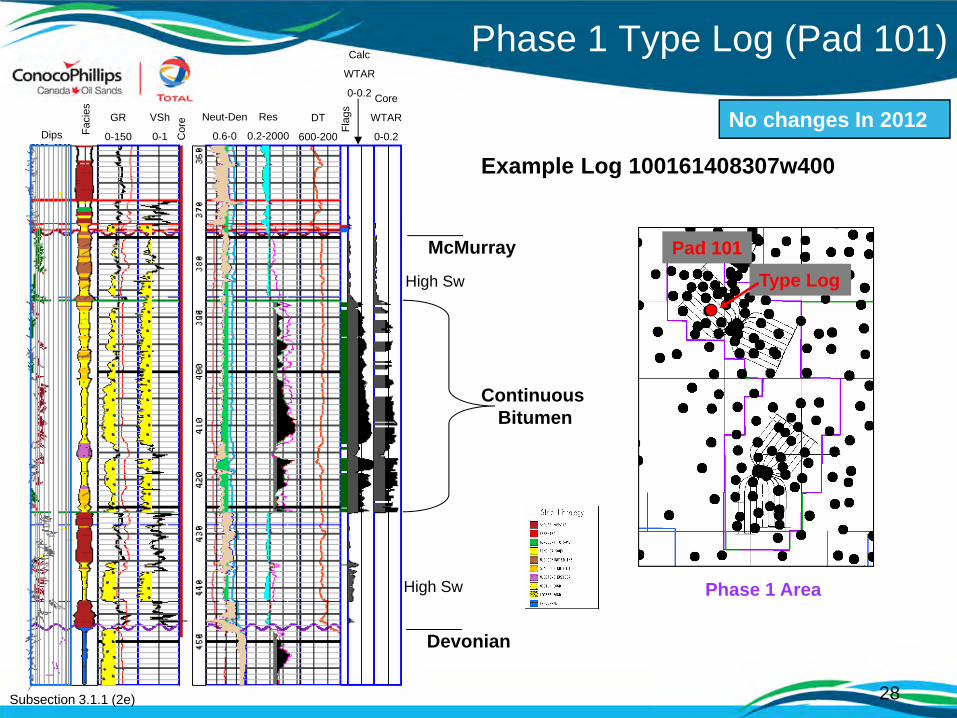
28
Example Log 100161408307w400
Phase 1 Area
Phase 1 Type Log (Pad 101)
Subsection 3.1.1 (2e)
Type LogPad 101
Core
WTAR
0-0.2
Calc
WTAR
0-0.2
DT
600-200
Res
0.2-2000
Neut-Den
0.6-0Cor
eVSh
0-1
GR
0-150Faci
es
Dips Flag
s
Devonian
McMurray
Continuous Bitumen
High Sw
High Sw
No changes In 2012
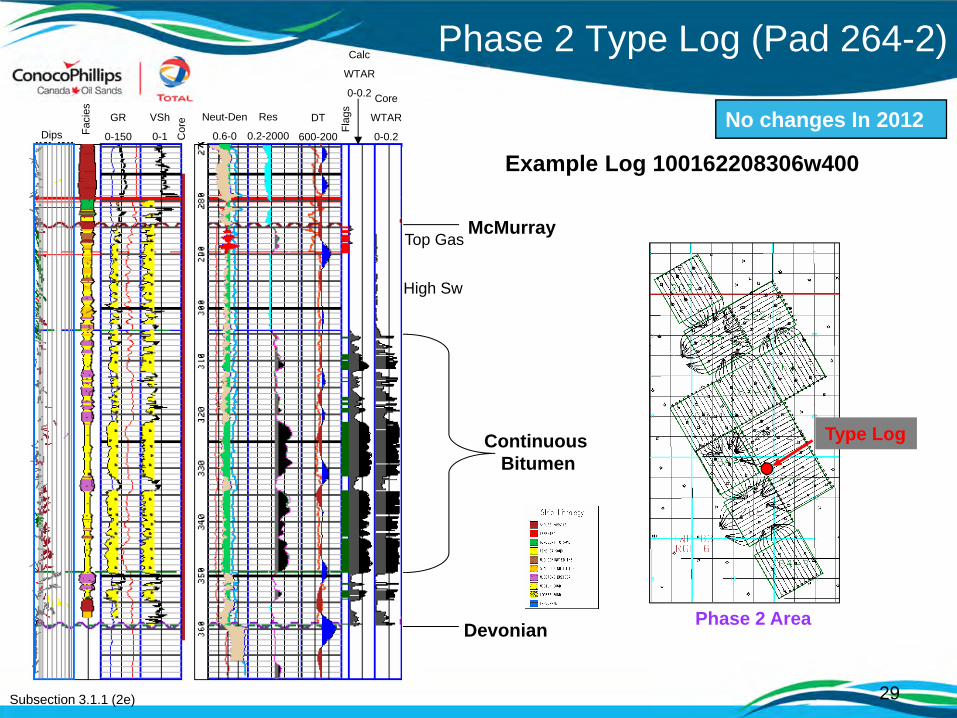
29
Example Log 100162208306w400
Phase 2 Area
Phase 2 Type Log (Pad 264-2)
Subsection 3.1.1 (2e)
Type Log
Core
WTAR
0-0.2
Calc
WTAR
0-0.2
DT
600-200
Res
0.2-2000
Neut-Den
0.6-0Cor
eVSh
0-1
GR
0-150Faci
es
Dips Flag
s
Devonian
McMurray
Continuous Bitumen
High Sw
Top Gas
No changes In 2012

30
Special Core Analyses BitumenViscosity Sampling
Subsection 3.1.1 (2f)
Objectives• Characterize vertical and lateral variance in
viscosity at different temperatures
• Model the variance in bitumen properties and its implications for bitumen production rates during SAGD
• Characterize relationship between viscosity, density and geochemical composition
No changes. Viscosity increases with depth in the
McMurray Formation.
8 viscosity sample wells (Jan 31, 2013 )
38 existing viscosity sample wells
2012 – 2013 DelineationDelineated Wells - Surmont
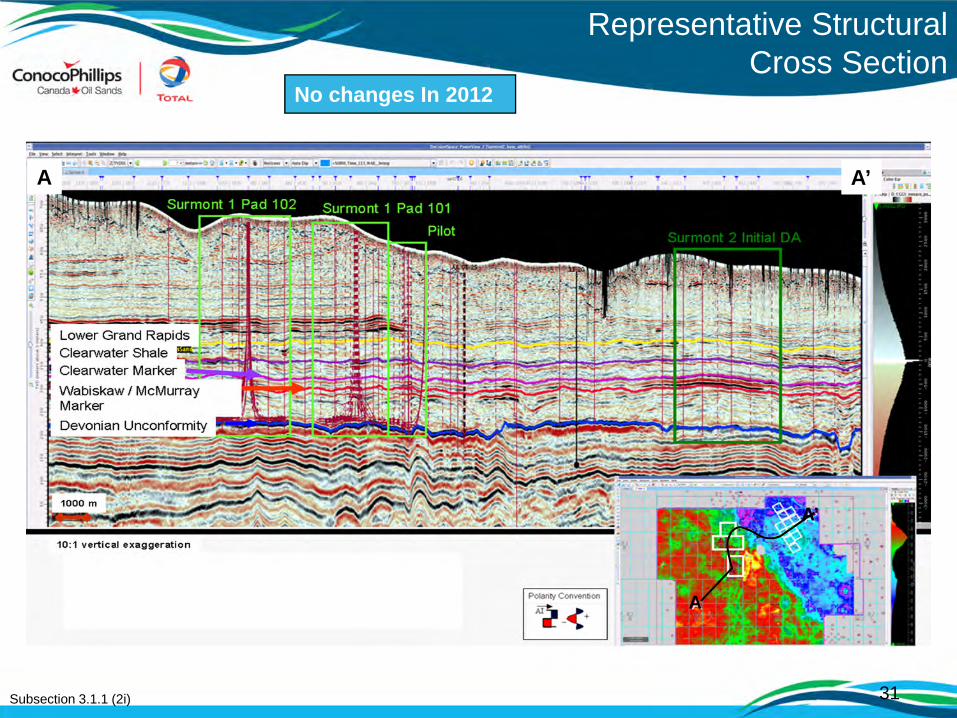
31
Representative Structural Cross Section
Subsection 3.1.1 (2i)
A
A’
A A’
No changes In 2012

3232
Pad 262-1 VariableBitumen-Water Contact
The presence of basal water becomes a risk on Pad 262-1
Subsection 3.1.1 (2)
Existing 13-34 04-03
270m
TopContBit
DevUnc
Small gas accumulation
BitumenWater
McMurray Net Continuous Bitumen (NCB)
13-344-3
• Well 4-3-84-6w4 intersected a raised bitumen/water contact. Contact is ~ 12 m higher than the nearest offset.
• Well also intersected a small gas pool under the bitumen.
No changes In 2012
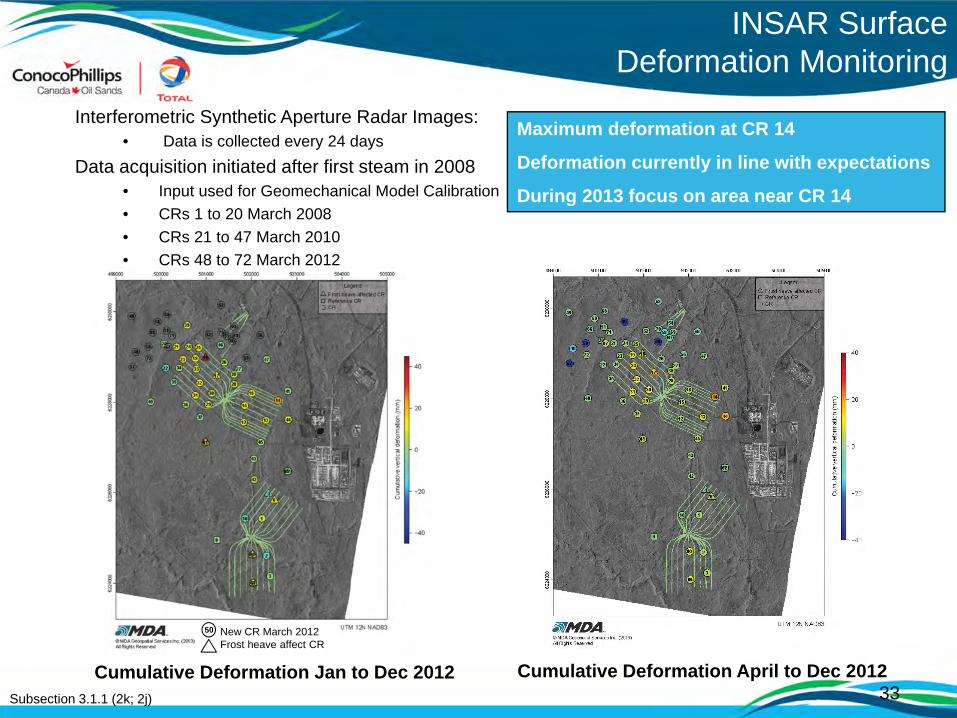
33
INSAR Surface Deformation Monitoring
Subsection 3.1.1 (2k; 2j)
Cumulative Deformation April to Dec 2012Cumulative Deformation Jan to Dec 2012
Interferometric Synthetic Aperture Radar Images:• Data is collected every 24 days
Data acquisition initiated after first steam in 2008 • Input used for Geomechanical Model Calibration• CRs 1 to 20 March 2008• CRs 21 to 47 March 2010• CRs 48 to 72 March 2012
50 New CR March 2012Frost heave affect CR
Maximum deformation at CR 14
Deformation currently in line with expectations
During 2013 focus on area near CR 14
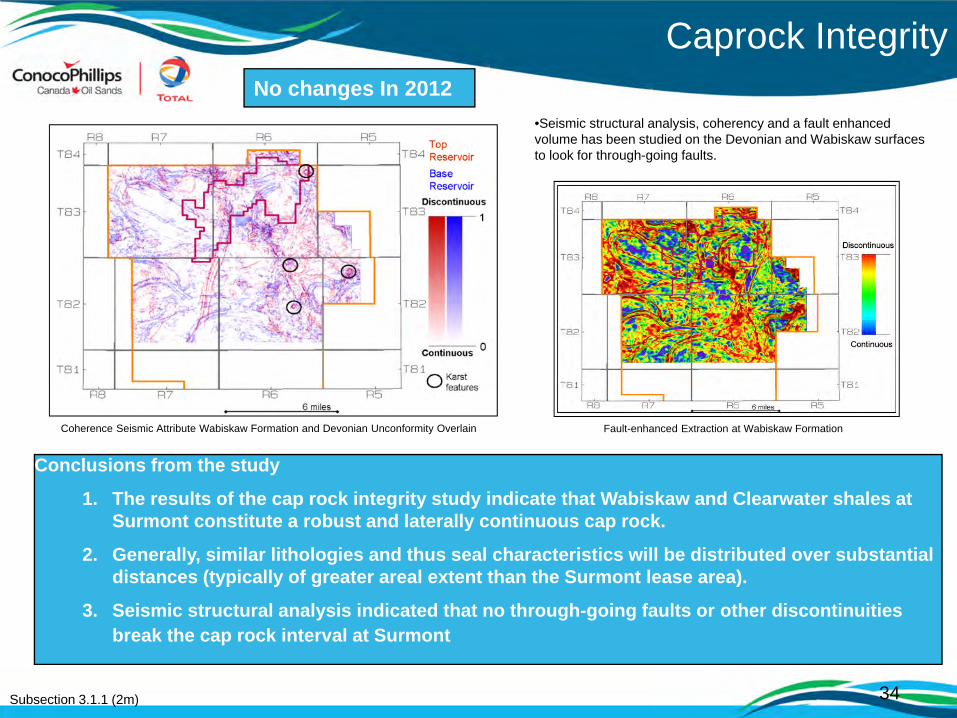
34Subsection 3.1.1 (2m)
Caprock Integrity
Conclusions from the study
1. The results of the cap rock integrity study indicate that Wabiskaw and Clearwater shales at Surmont constitute a robust and laterally continuous cap rock.
2. Generally, similar lithologies and thus seal characteristics will be distributed over substantial distances (typically of greater areal extent than the Surmont lease area).
3. Seismic structural analysis indicated that no through-going faults or other discontinuities break the cap rock interval at Surmont
•Seismic structural analysis, coherency and a fault enhanced volume has been studied on the Devonian and Wabiskaw surfaces to look for through-going faults.
Coherence Seismic Attribute Wabiskaw Formation and Devonian Unconformity Overlain Fault-enhanced Extraction at Wabiskaw Formation
No changes In 2012

Subsection 3.1.1 (2m)
Caprock Integrity
Conclusion from the study:
•The best seals within the cap rock interval are the deeper water deposits occurring on maximum flooding surfaces.
•These muds can be over 80% clay and are correlated throughout and beyond the Surmont lease.
•9 new cap rock cores in 2011
•The cap rock interval was investigated by:•core description and analyses•log interpretation and correlation•seismic interpretation and correlation.
•Analytical methods included •visual core examination,•reflected light microscopy, •laser particle size analysis, •biostratigraphic analyses, •X-ray diffraction for clay species, •QEMSCAN (quantitative mineralogy),•chemostratigraphy (bulk geochemistry) and •MICP (mercury injection capillary pressure) analyses to determine seal capacity
35
No changes In 2012
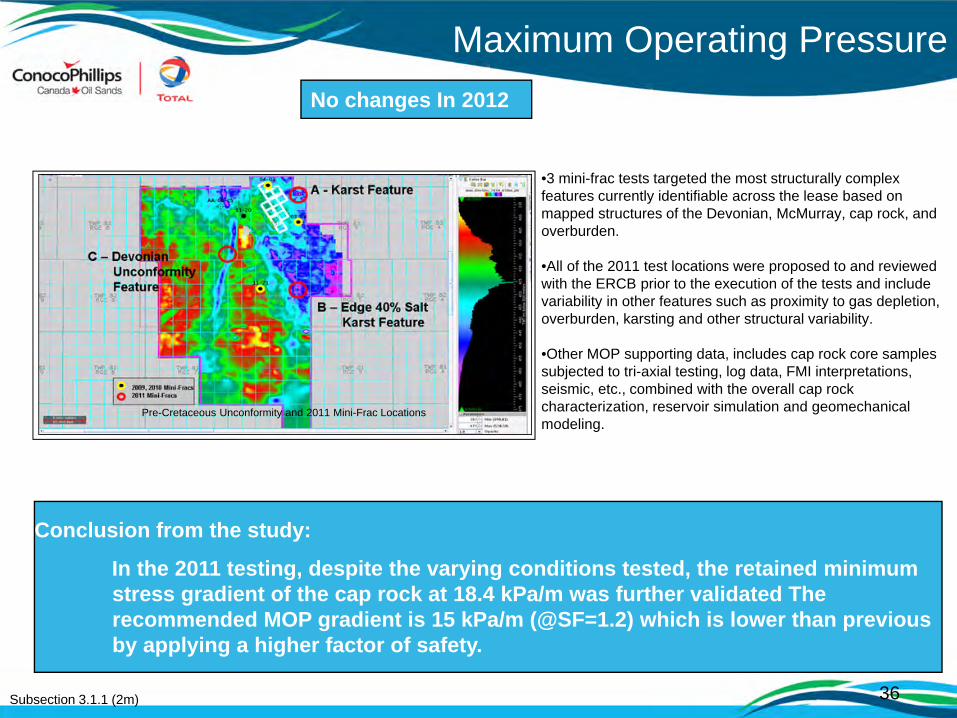
36Subsection 3.1.1 (2m)
Maximum Operating Pressure
Conclusion from the study:
In the 2011 testing, despite the varying conditions tested, the retained minimum stress gradient of the cap rock at 18.4 kPa/m was further validated The recommended MOP gradient is 15 kPa/m (@SF=1.2) which is lower than previous by applying a higher factor of safety.
•3 mini-frac tests targeted the most structurally complex features currently identifiable across the lease based on mapped structures of the Devonian, McMurray, cap rock, and overburden.
•All of the 2011 test locations were proposed to and reviewed with the ERCB prior to the execution of the tests and include variability in other features such as proximity to gas depletion, overburden, karsting and other structural variability.
•Other MOP supporting data, includes cap rock core samples subjected to tri-axial testing, log data, FMI interpretations, seismic, etc., combined with the overall cap rock characterization, reservoir simulation and geomechanical modeling.
Pre-Cretaceous Unconformity and 2011 Mini-Frac Locations
No changes In 2012
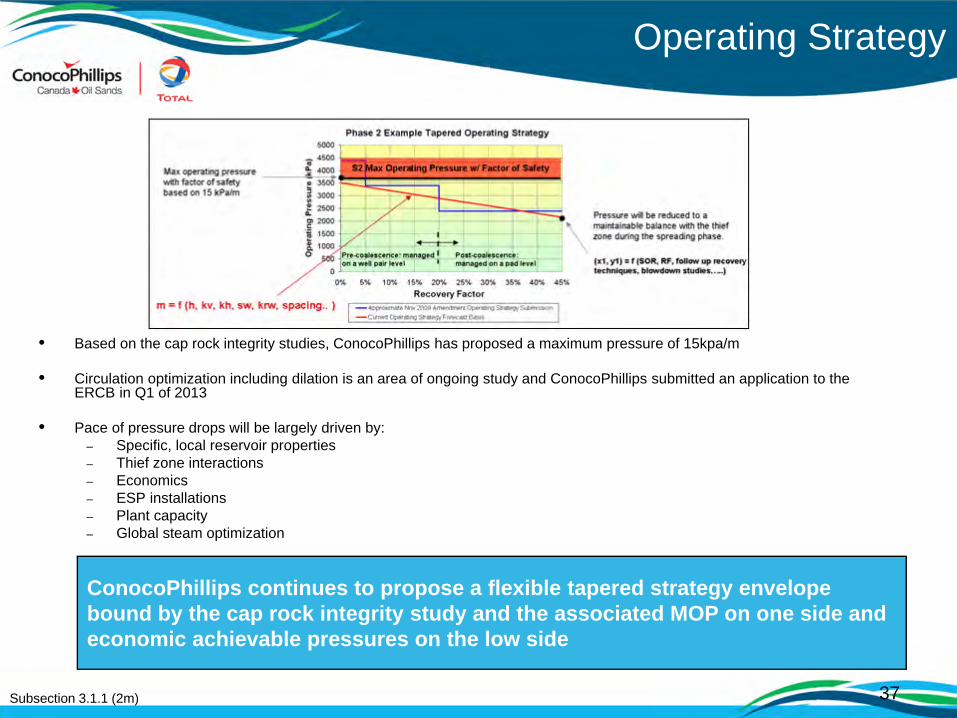
37
Operating Strategy
• Based on the cap rock integrity studies, ConocoPhillips has proposed a maximum pressure of 15kpa/m
• Circulation optimization including dilation is an area of ongoing study and ConocoPhillips submitted an application to the ERCB in Q1 of 2013
• Pace of pressure drops will be largely driven by:– Specific, local reservoir properties– Thief zone interactions– Economics– ESP installations– Plant capacity– Global steam optimization
Subsection 3.1.1 (2m)
ConocoPhillips continues to propose a flexible tapered strategy envelope bound by the cap rock integrity study and the associated MOP on one side and economic achievable pressures on the low side
38
Subsection 3.1.1 (3)Drilling and Completions
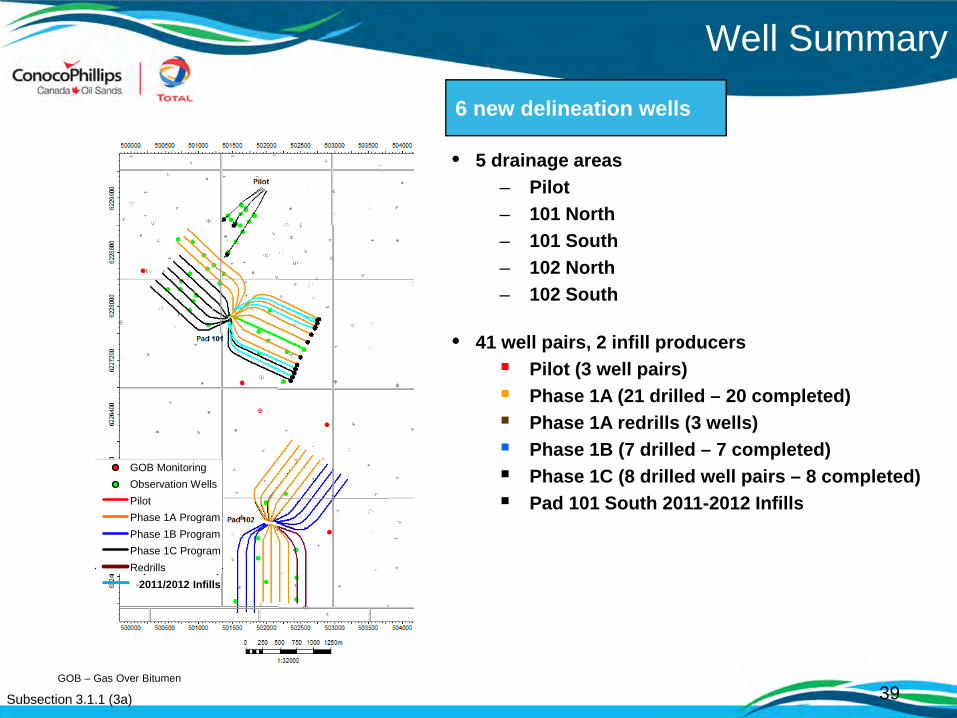
39
6 new delineation wells
Well Summary
• 5 drainage areas– Pilot– 101 North– 101 South– 102 North– 102 South
• 41 well pairs, 2 infill producers Pilot (3 well pairs) Phase 1A (21 drilled – 20 completed) Phase 1A redrills (3 wells) Phase 1B (7 drilled – 7 completed) Phase 1C (8 drilled well pairs – 8 completed) Pad 101 South 2011-2012 Infills
Subsection 3.1.1 (3a)GOB – Gas Over Bitumen
2011/2012 Infills
GOB MonitoringObservation WellsPilotPhase 1A ProgramPhase 1B ProgramPhase 1C ProgramRedrills
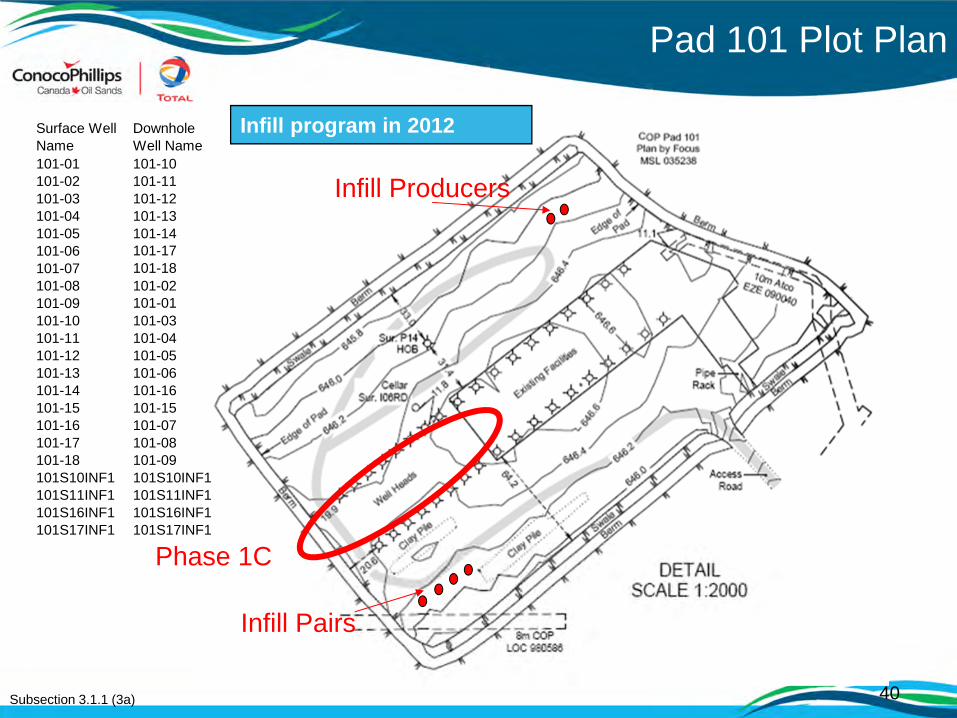
40
Pad 101 Plot Plan
Subsection 3.1.1 (3a)
Phase 1C
Infill program in 2012
Infill Pairs
Infill Producers
Surface Well Name
Downhole Well Name
101-01 101-10101-02 101-11101-03 101-12101-04 101-13101-05 101-14101-06 101-17101-07 101-18101-08 101-02101-09 101-01101-10 101-03101-11 101-04101-12 101-05101-13 101-06101-14 101-16101-15 101-15101-16 101-07101-17 101-08101-18 101-09101S10INF1 101S10INF1101S11INF1 101S11INF1101S16INF1 101S16INF1101S17INF1 101S17INF1
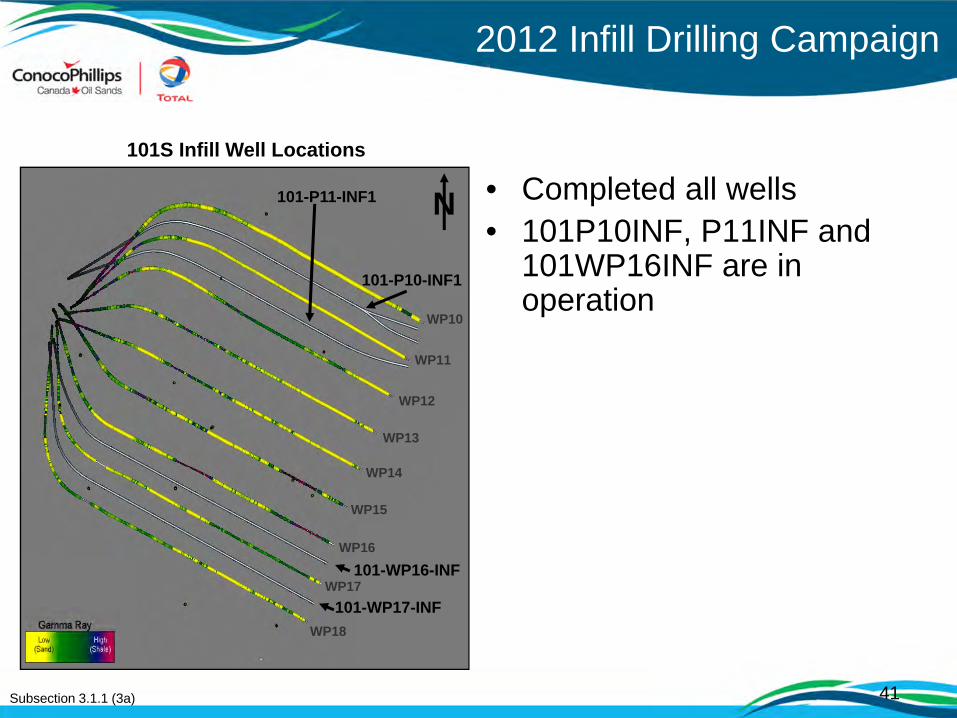
2012 Infill Drilling Campaign
• Completed all wells• 101P10INF, P11INF and
101WP16INF are in operation
Subsection 3.1.1 (3a)
N
101-WP17-INF
101-WP16-INF
101-P11-INF1
101-P10-INF1
101S Infill Well Locations
WP18
WP17
WP16
WP15
WP14
WP13
WP12
WP11
WP10
41
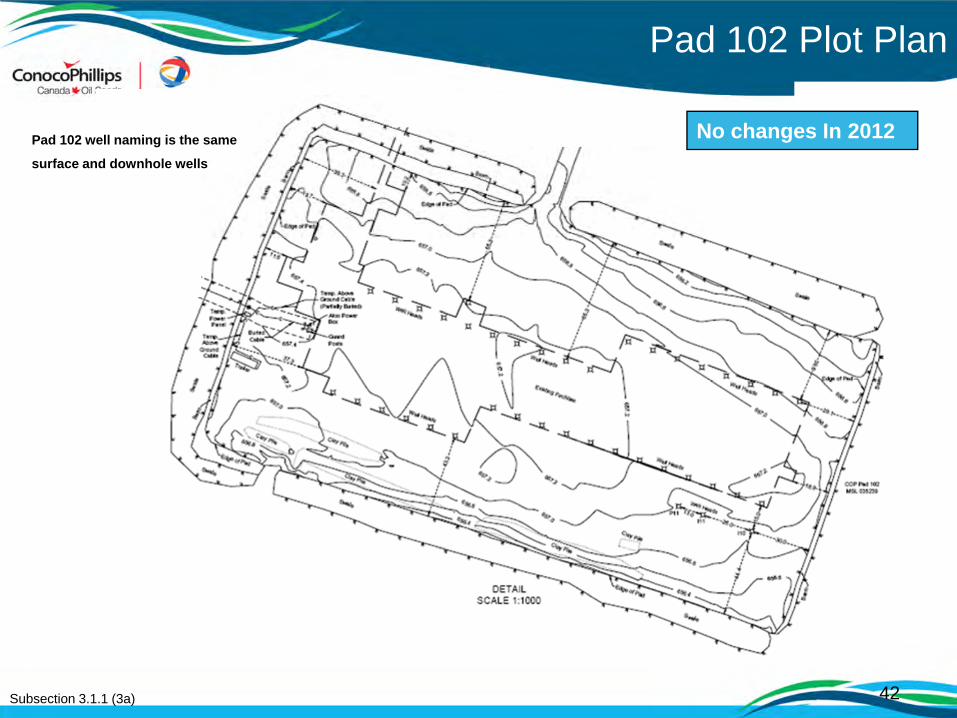
42
Pad 102 Plot Plan
Subsection 3.1.1 (3a)
No changes In 2012Pad 102 well naming is the same
surface and downhole wells
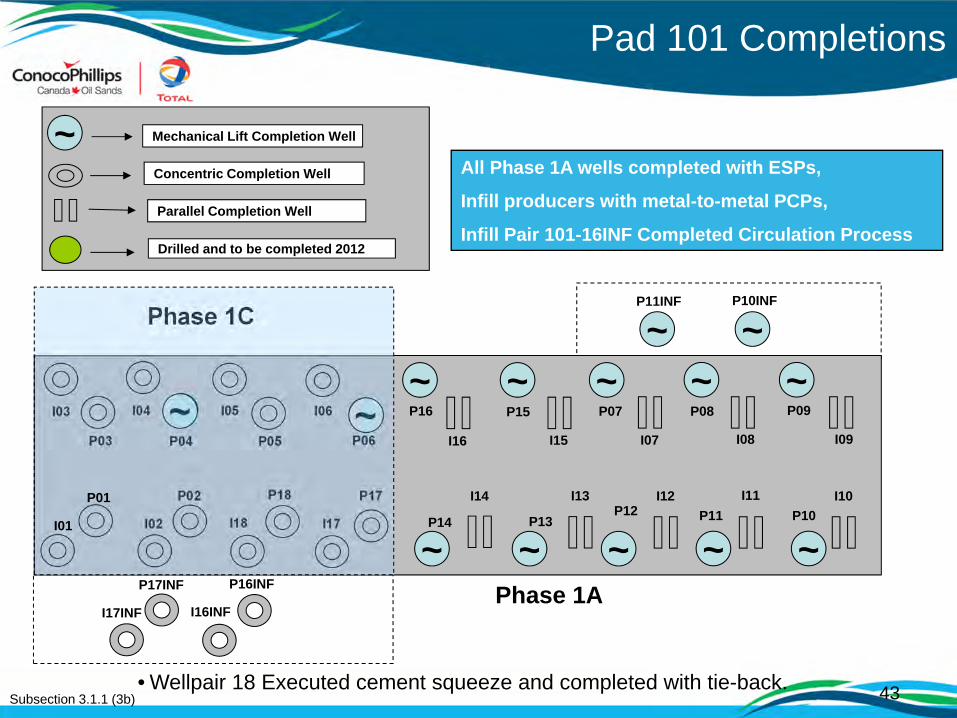
43
All Phase 1A wells completed with ESPs,
Infill producers with metal-to-metal PCPs,
Infill Pair 101-16INF Completed Circulation Process
Pad 101 Completions
Subsection 3.1.1 (3b)• Wellpair 18 Executed cement squeeze and completed with tie-back.
P01
I01 I02
P02 P18
I18 I17
P17
I09
P09P08
I08I07
P07
I15
P15
I16
P16
P06
I06
P05
I05I04
P03
I03
I10 P10
I11P11
I12P12
I13
P13
I14
P14
P04
Phase 1C
Phase 1A
Concentric Completion Well
Parallel Completion Well
Drilled and to be completed 2012
~ ~~ ~ ~
~
~ ~~ ~ ~
Mechanical Lift Completion Well
~~
~ ~P10INFP11INF
I17INF
P17INF P16INF
I16INF
I01
P01
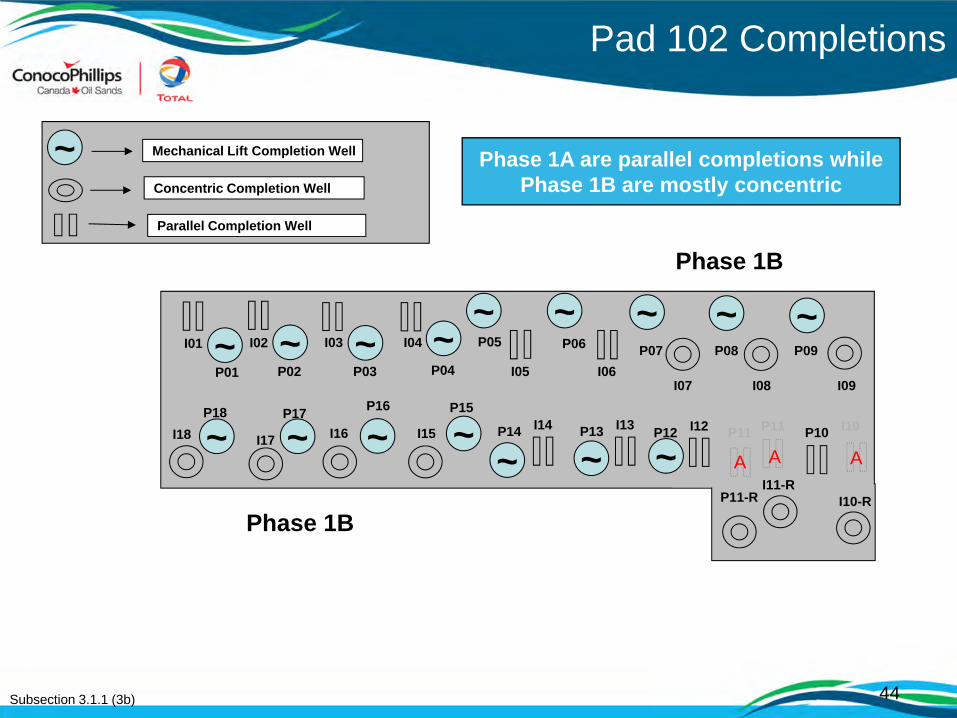
44
Pad 102 Completions
Subsection 3.1.1 (3b)
P18I18 I17
P17 P16
I16 I15
P15I09
P09P08
I08I07
P07 I06
P06
I05
P05
P04
I04
P03
I03
P02
I02
P01
I01
I10P10P11P11I12P12I13P13I14P14
A A
AP11-R I10-RI11-R
A
Phase 1A are parallel completions while Phase 1B are mostly concentric
Phase 1B
Phase 1B
~ ~~ ~~ ~
~ ~~ ~
Concentric Completion Well
Parallel Completion Well
~ Mechanical Lift Completion Well
~~
~
~
~~
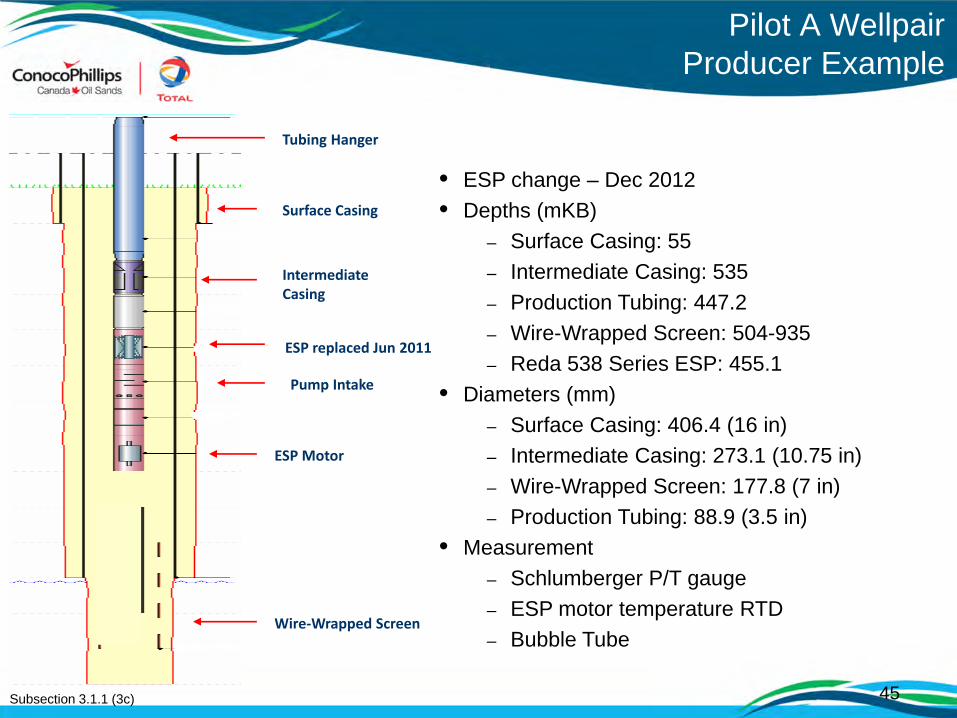
45
• ESP change – Dec 2012• Depths (mKB)
– Surface Casing: 55– Intermediate Casing: 535 – Production Tubing: 447.2– Wire-Wrapped Screen: 504-935 – Reda 538 Series ESP: 455.1
• Diameters (mm)– Surface Casing: 406.4 (16 in)– Intermediate Casing: 273.1 (10.75 in)– Wire-Wrapped Screen: 177.8 (7 in)– Production Tubing: 88.9 (3.5 in)
• Measurement– Schlumberger P/T gauge– ESP motor temperature RTD– Bubble Tube
Pilot A Wellpair Producer Example
ESP replaced Jun 2011
Pump Intake
ESP Motor
Wire‐Wrapped Screen
Surface Casing
Intermediate Casing
Tubing Hanger
Subsection 3.1.1 (3c)

46
Surface Casing
Intermediate Casing
Toe Injection Tubing
Heel injection Tubing
Promore Thermocouple Instrument String
Wire‐Wrapped Screen
Pilot A Wellpair Parallel Injector Example
• Depths (mKB)– Surface Casing: 64– Intermediate Casing: 545– Toe Tubing: 905– Heel Tubing: 501– Instrument String: 905– Wire-Wrapped Screen: 518-920
• Diameters (mm)– Surface Casing: 339.7 (13.4 in)– Intermediate Casing: 244.5 (9.625 in)– Wire-Wrapped Screen: 177.8 (7 in)– Heel Tubing: 60.3 (2.4 in)– Toe Tubing: 60.3 (2.4 in)
• Measurement– Promore Thermocouple string installed
Subsection 3.1.1 (3c)
No change in 2012
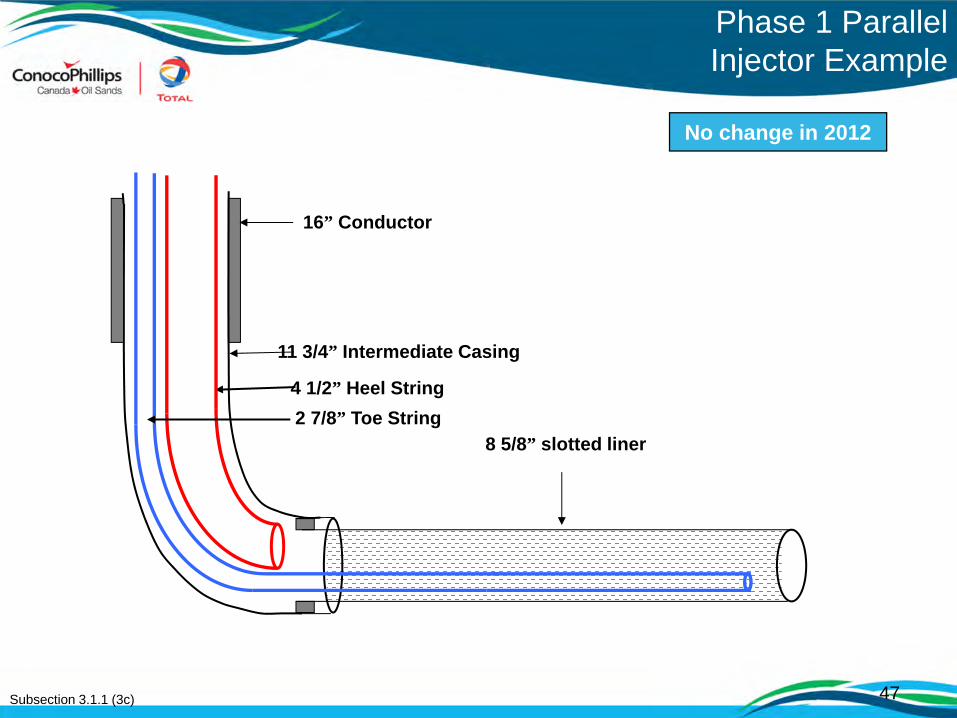
47
Phase 1 Parallel Injector Example
11 3/4” Intermediate Casing
4 1/2” Heel String
8 5/8” slotted liner2 7/8” Toe String
16” Conductor
Subsection 3.1.1 (3c)
No change in 2012
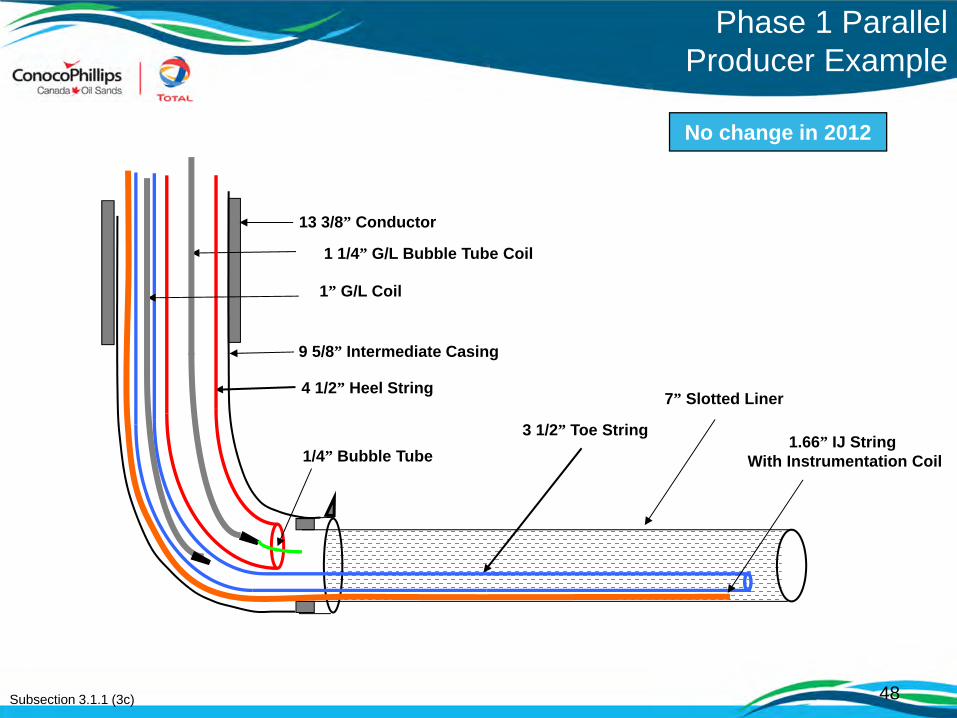
48
Phase 1 Parallel Producer Example
9 5/8” Intermediate Casing
4 1/2” Heel String 7” Slotted Liner
3 1/2” Toe String
1 1/4” G/L Bubble Tube Coil
1/4” Bubble Tube
1” G/L Coil
13 3/8” Conductor
Subsection 3.1.1 (3c)
1.66” IJ String With Instrumentation Coil
No change in 2012
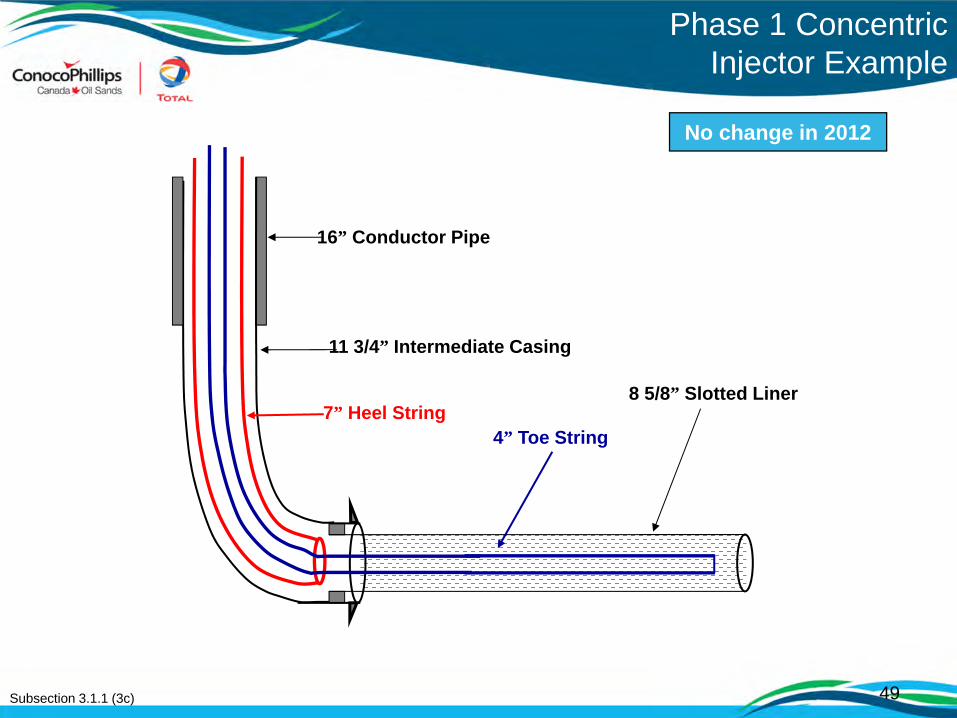
49
11 3/4” Intermediate Casing
7” Heel String8 5/8” Slotted Liner
4” Toe String
16” Conductor Pipe
Phase 1 Concentric Injector Example
Subsection 3.1.1 (3c)
No change in 2012
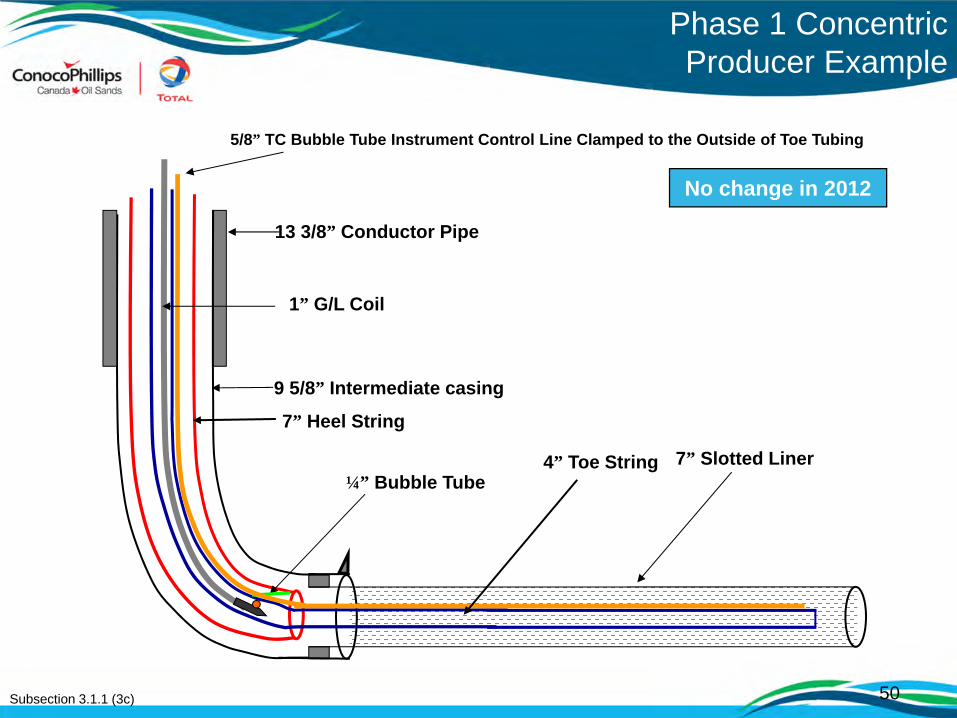
50
1” G/L Coil
Phase 1 Concentric Producer Example
9 5/8” Intermediate casing
7” Heel String
7” Slotted Liner4” Toe String
5/8” TC Bubble Tube Instrument Control Line Clamped to the Outside of Toe Tubing
¼” Bubble Tube
13 3/8” Conductor Pipe
Subsection 3.1.1 (3c)
No change in 2012
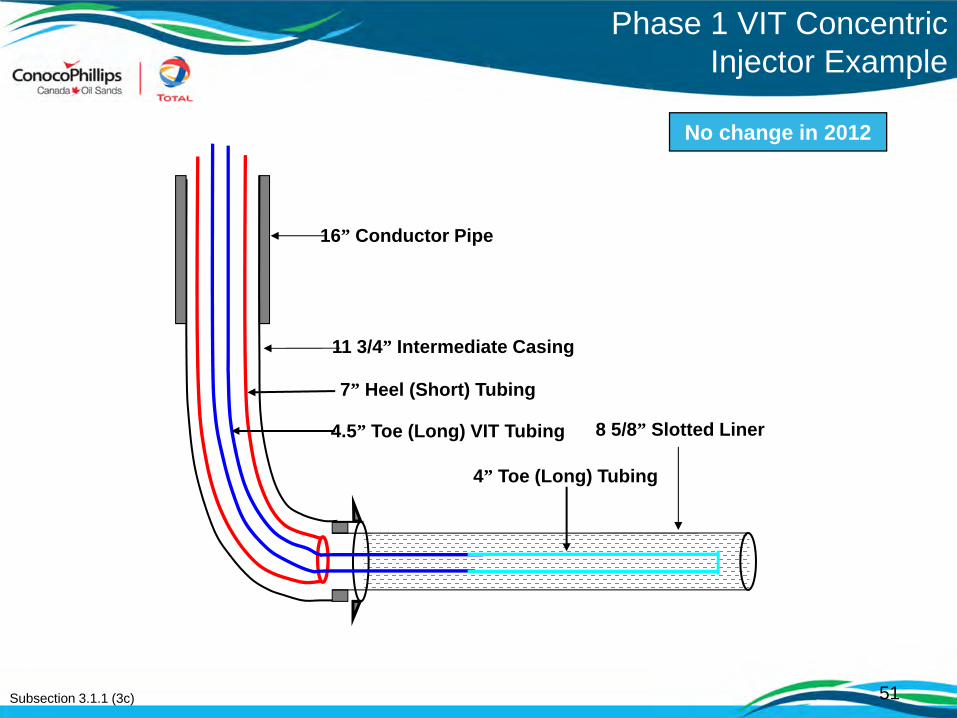
51
Phase 1 VIT Concentric Injector Example
Subsection 3.1.1 (3c)
11 3/4” Intermediate Casing
7” Heel (Short) Tubing
8 5/8” Slotted Liner
4” Toe (Long) Tubing
16” Conductor Pipe
4.5” Toe (Long) VIT Tubing
No change in 2012
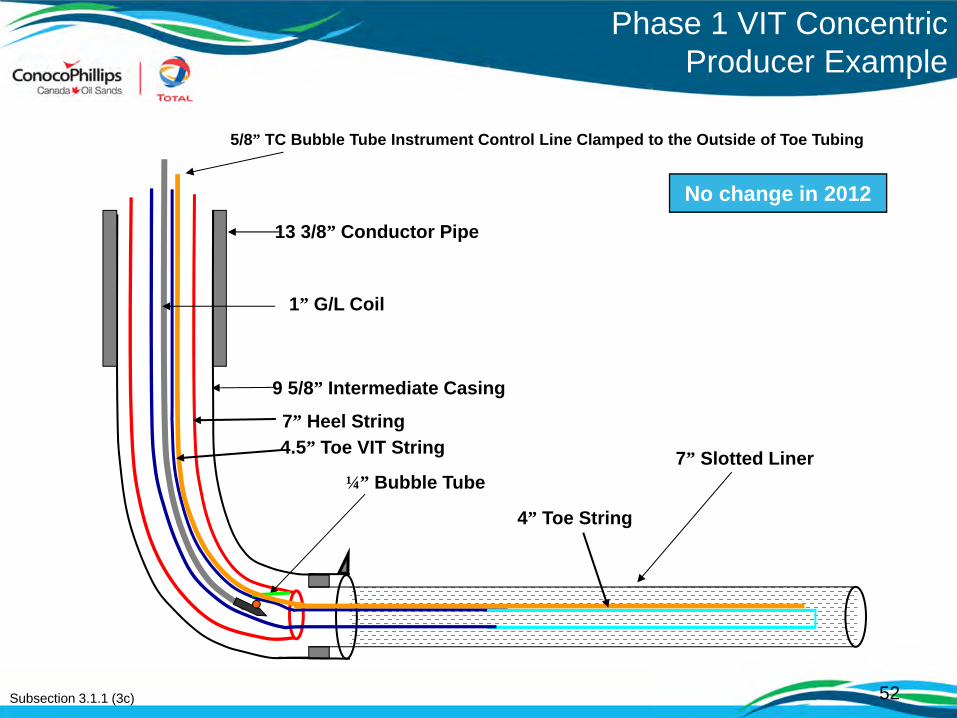
52
1” G/L Coil
Phase 1 VIT Concentric Producer Example
9 5/8” Intermediate Casing
7” Heel String
7” Slotted Liner
4” Toe String
5/8” TC Bubble Tube Instrument Control Line Clamped to the Outside of Toe Tubing
¼” Bubble Tube
13 3/8” Conductor Pipe
Subsection 3.1.1 (3c)
4.5” Toe VIT String
No change in 2012

53
Phase 1 VIT Completions
Subsection 3.1.1 (3c)
Vacuum insulated tubing (VIT):• Consists of concentric inner and outer
standard oil field tubing welded at each end • Vacuum is applied to the annular space• Coupling further insulated with a covering
Applications:• Minimize heat transfer to permafrost zones to
prevent subsidence• Minimize annular pressure build-up• Hydrate prevention• Paraffin prevention• Heat retention for heavy oil and steam
flooding projectsCourtesy of V&M Tubing Alloy
No change in 2012
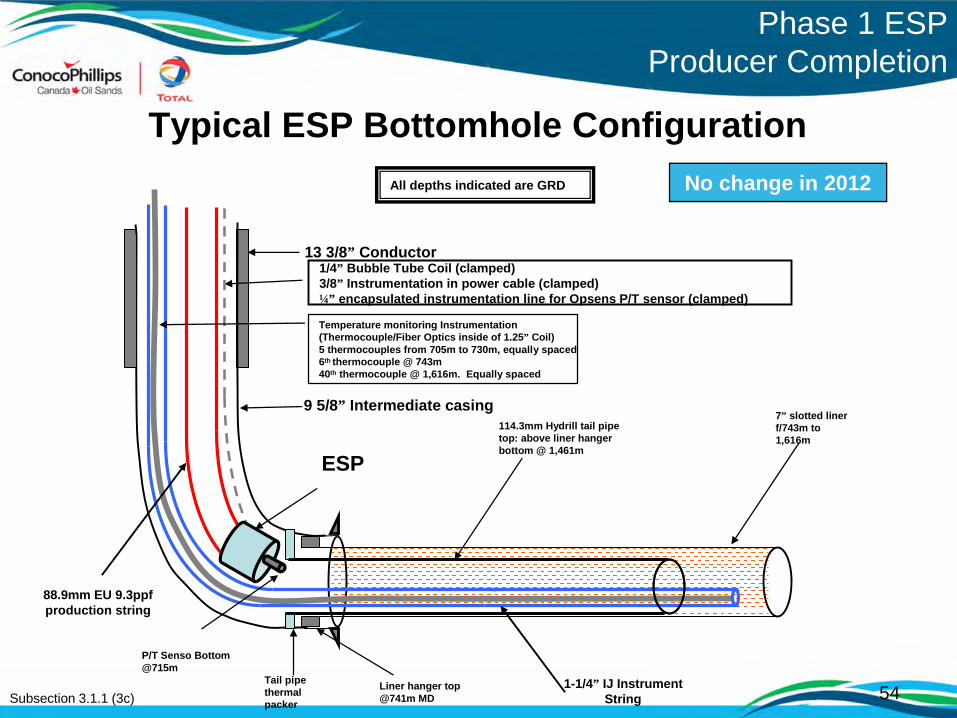
54
Phase 1 ESP Producer Completion
Subsection 3.1.1 (3c)
Typical ESP Bottomhole Configuration
9 5/8” Intermediate casing
88.9mm EU 9.3ppf production string
7” slotted liner f/743m to 1,616m
1-1/4” IJ InstrumentString
1/4” Bubble Tube Coil (clamped)3/8” Instrumentation in power cable (clamped)¼” encapsulated instrumentation line for Opsens P/T sensor (clamped)
ESP – REDAHotline III
13 3/8” Conductor
P/T Senso Bottom @715m
Tail pipe thermal packer
114.3mm Hydrill tail pipe top: above liner hanger bottom @ 1,461m
All depths indicated are GRD
Temperature monitoring Instrumentation (Thermocouple/Fiber Optics inside of 1.25” Coil)5 thermocouples from 705m to 730m, equally spaced6th thermocouple @ 743m40th thermocouple @ 1,616m. Equally spaced
Liner hanger top @741m MD
ESP
No change in 2012
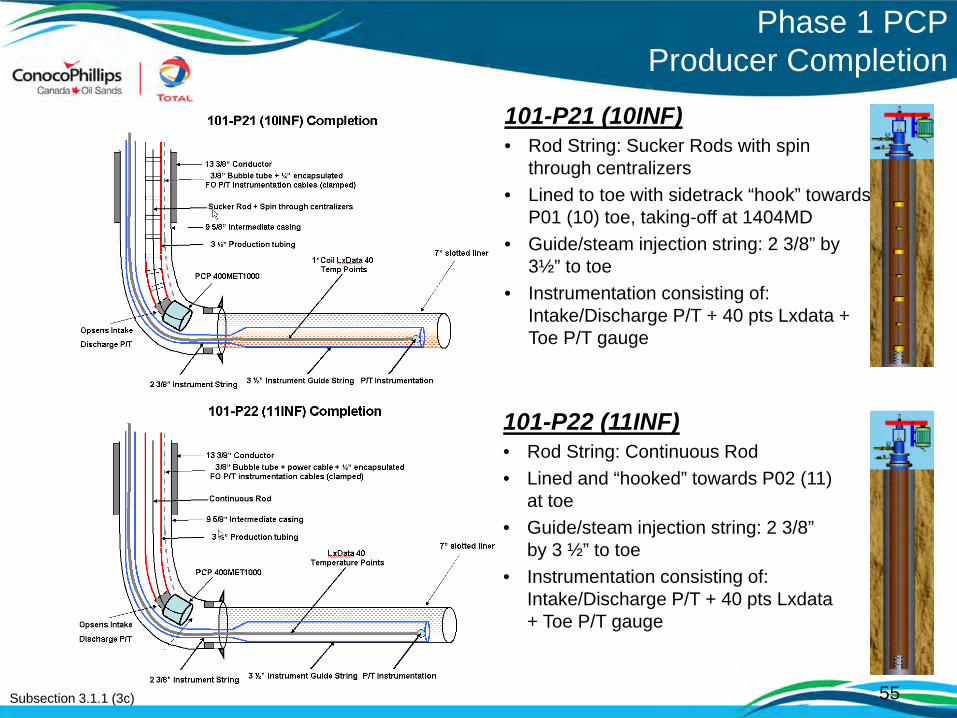
Phase 1 PCP Producer Completion
55
101-P21 (10INF) • Rod String: Sucker Rods with spin
through centralizers• Lined to toe with sidetrack “hook” towards
P01 (10) toe, taking-off at 1404MD • Guide/steam injection string: 2 3/8” by
3½” to toe• Instrumentation consisting of:
Intake/Discharge P/T + 40 pts Lxdata + Toe P/T gauge
101-P22 (11INF) • Rod String: Continuous Rod• Lined and “hooked” towards P02 (11)
at toe• Guide/steam injection string: 2 3/8”
by 3 ½” to toe• Instrumentation consisting of:
Intake/Discharge P/T + 40 pts Lxdata + Toe P/T gauge
Subsection 3.1.1 (3c)

Flow Control Device Update102-06 Equalizer Completion
4 ½” Heel String
Injector Equalizer SAGD
Liner hanger:WFT packer
1/4” Bubble Tube
SteamEmulsionBlanket Gas
Steam Injection
Slotted liner6-5/8” Equalizer
Intermediate casing9 5/8” Producer
Thermocouples Downhole Temperature Measurement:1-1/4” coil deployed TC inside toe tubing
Downhole Pressure Measurement: Bubble tube banded to heel string
4 ½” Heel String
Producer Equalizer SAGD
Liner hanger:WFT packer
1/4” Bubble Tube
EmulsionBlanket Gas
Emulsion
Slotted liner6-5/8” Equalizer
Intermediate casing9 5/8” Producer
Thermocouples Downhole Temperature Measurement:1-1/4” coil deployed TC inside toe tubing
Downhole Pressure Measurement: Gas lift pressureand/or bubble tube banded to heel string
Look at scale of injection points
SPE 153706 J Stalder
56Subsection 3.1.1 (3c)
101-07(18) Well Pair Status
• Several issues identified during CBL review with ERCB
• Remedial jobs executed:– Injector: Cement squeezes and 8-5/8” liner install. – Producer: Cement squeezes and 7” liner install.
• Current Status and Path Forward– Injector and Producer: Circulation completion is
installed and ready for operation.
57Subsection 3.1.1 (3c)
58
Subsection 3.1.1 (4) Artificial Lift
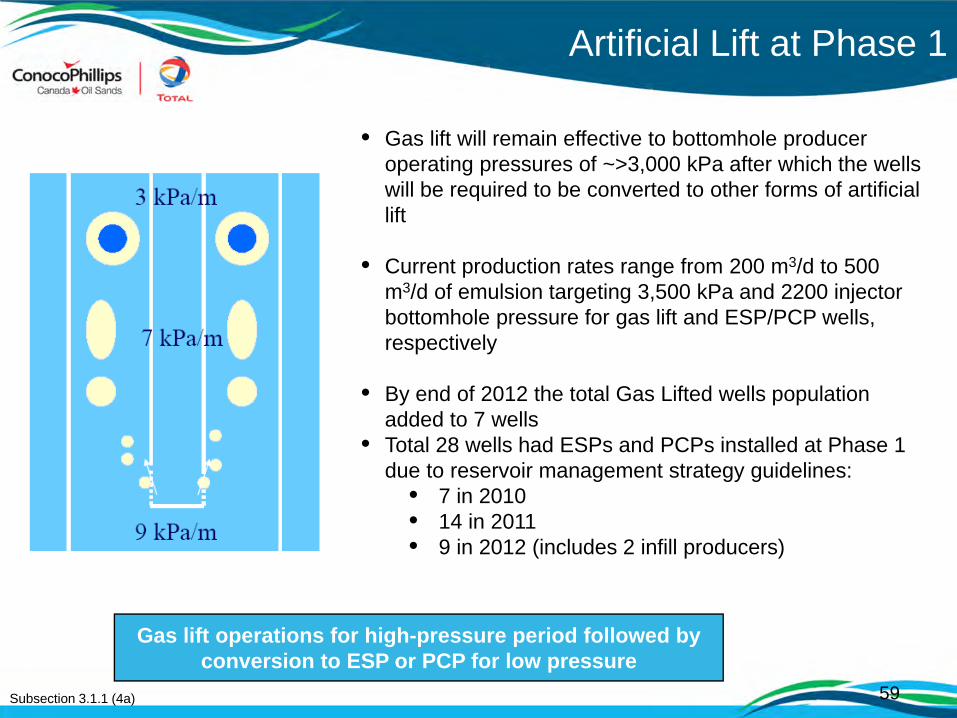
59
• Gas lift will remain effective to bottomhole producer operating pressures of ~>3,000 kPa after which the wells will be required to be converted to other forms of artificial lift
• Current production rates range from 200 m3/d to 500 m3/d of emulsion targeting 3,500 kPa and 2200 injector bottomhole pressure for gas lift and ESP/PCP wells, respectively
• By end of 2012 the total Gas Lifted wells population added to 7 wells
• Total 28 wells had ESPs and PCPs installed at Phase 1 due to reservoir management strategy guidelines:
• 7 in 2010• 14 in 2011• 9 in 2012 (includes 2 infill producers)
Artificial Lift at Phase 1
Subsection 3.1.1 (4a)
Gas lift operations for high-pressure period followed by conversion to ESP or PCP for low pressure
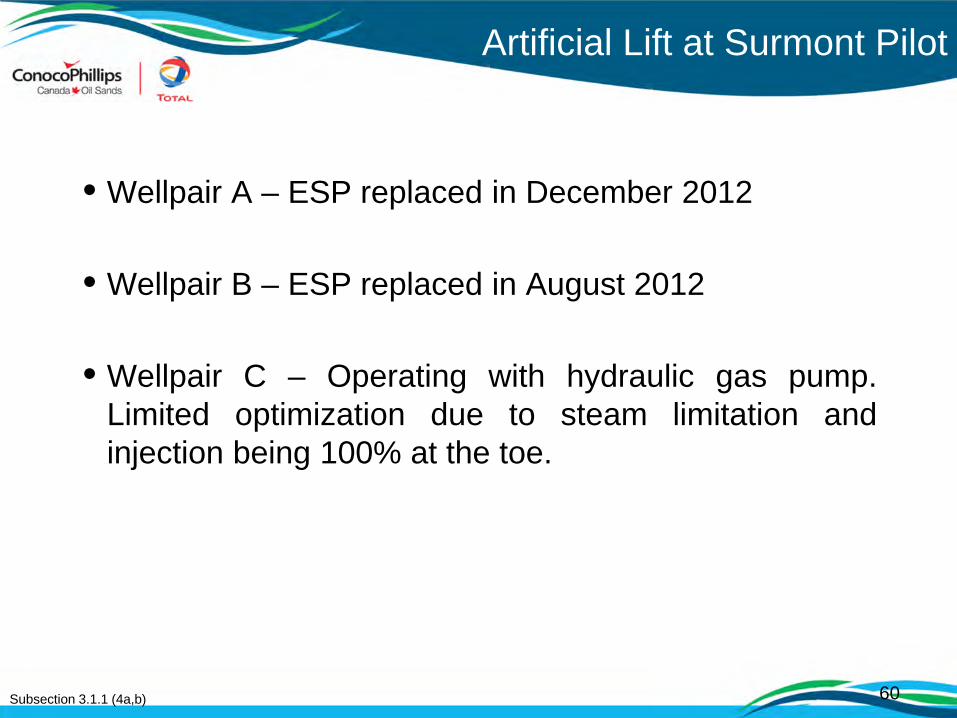
60
• Wellpair A – ESP replaced in December 2012
• Wellpair B – ESP replaced in August 2012
• Wellpair C – Operating with hydraulic gas pump.Limited optimization due to steam limitation andinjection being 100% at the toe.
Artificial Lift at Surmont Pilot
Subsection 3.1.1 (4a,b)
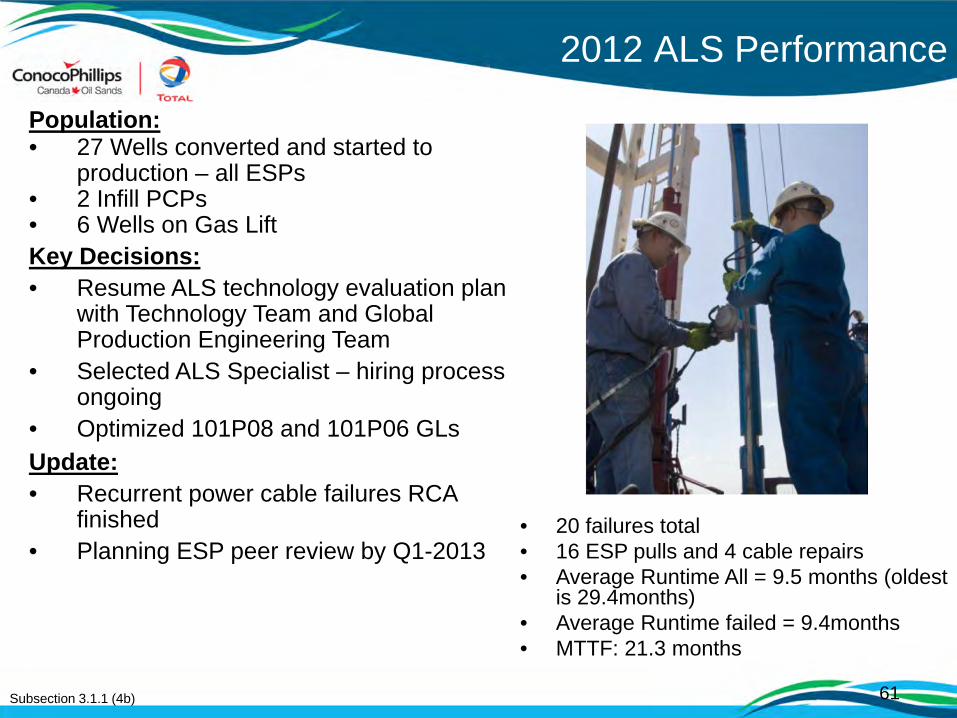
2012 ALS Performance
• 20 failures total• 16 ESP pulls and 4 cable repairs• Average Runtime All = 9.5 months (oldest
is 29.4months)• Average Runtime failed = 9.4months• MTTF: 21.3 months
Subsection 3.1.1 (4b) 61
Population:• 27 Wells converted and started to
production – all ESPs• 2 Infill PCPs• 6 Wells on Gas LiftKey Decisions:• Resume ALS technology evaluation plan
with Technology Team and Global Production Engineering Team
• Selected ALS Specialist – hiring process ongoing
• Optimized 101P08 and 101P06 GLsUpdate:• Recurrent power cable failures RCA
finished• Planning ESP peer review by Q1-2013
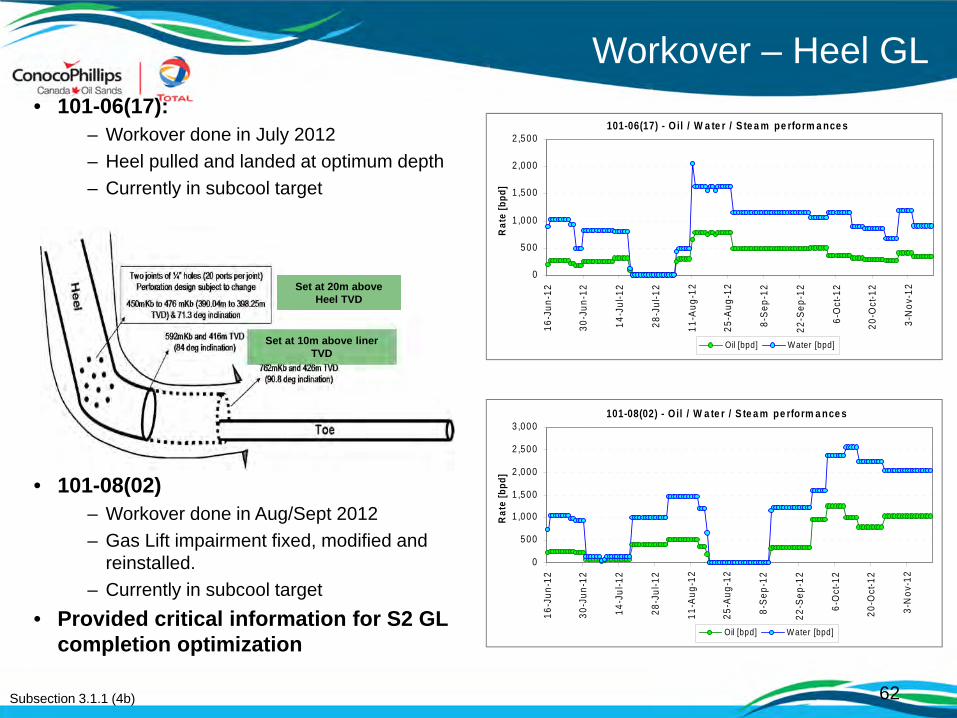
Workover – Heel GL• 101-06(17):
– Workover done in July 2012– Heel pulled and landed at optimum depth– Currently in subcool target
• 101-08(02)– Workover done in Aug/Sept 2012– Gas Lift impairment fixed, modified and
reinstalled.– Currently in subcool target
• Provided critical information for S2 GL completion optimization
Set at 10m above liner TVD
Set at 20m above Heel TVD
101-06(17) - O il / W a te r / S te a m pe rform a nce s
0
500
1 ,000
1 ,500
2 ,000
2 ,500
16-J
un-1
2
30-J
un-1
2
14-J
ul-1
2
28-J
ul-1
2
11-A
ug-1
2
25-A
ug-1
2
8-Se
p-12
22-S
ep-1
2
6-O
ct-1
2
20-O
ct-1
2
3-N
ov-1
2
Rat
e [b
pd]
Oil [bpd] Water [bpd]
101-08(02) - O il / W a te r / S te a m pe rform a nce s
0
500
1 ,000
1 ,500
2 ,000
2 ,500
3 ,000
16-J
un-1
2
30-J
un-1
2
14-J
ul-1
2
28-J
ul-1
2
11-A
ug-1
2
25-A
ug-1
2
8-S
ep-1
2
22-S
ep-1
2
6-O
ct-1
2
20-O
ct-1
2
3-N
ov-1
2
Rat
e [b
pd]
Oil [bpd] Water [bpd]
62Subsection 3.1.1 (4b)
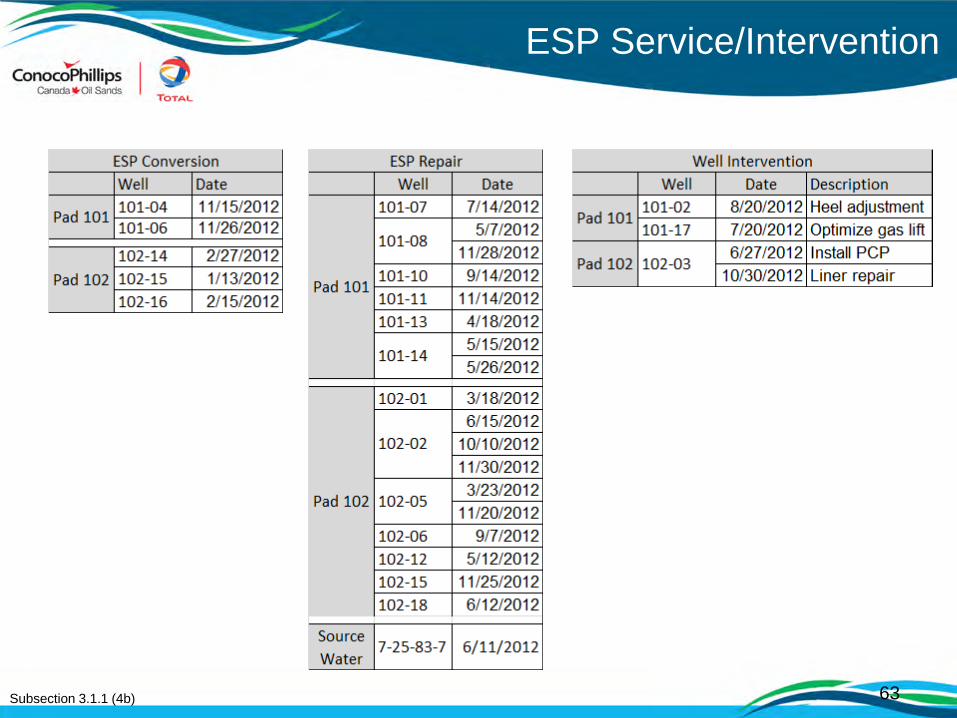
ESP Service/Intervention
Subsection 3.1.1 (4b) 63

64
Artificial Lift Commercial Production
Subsection 3.1.1 (4b)
Example ESP performance curve
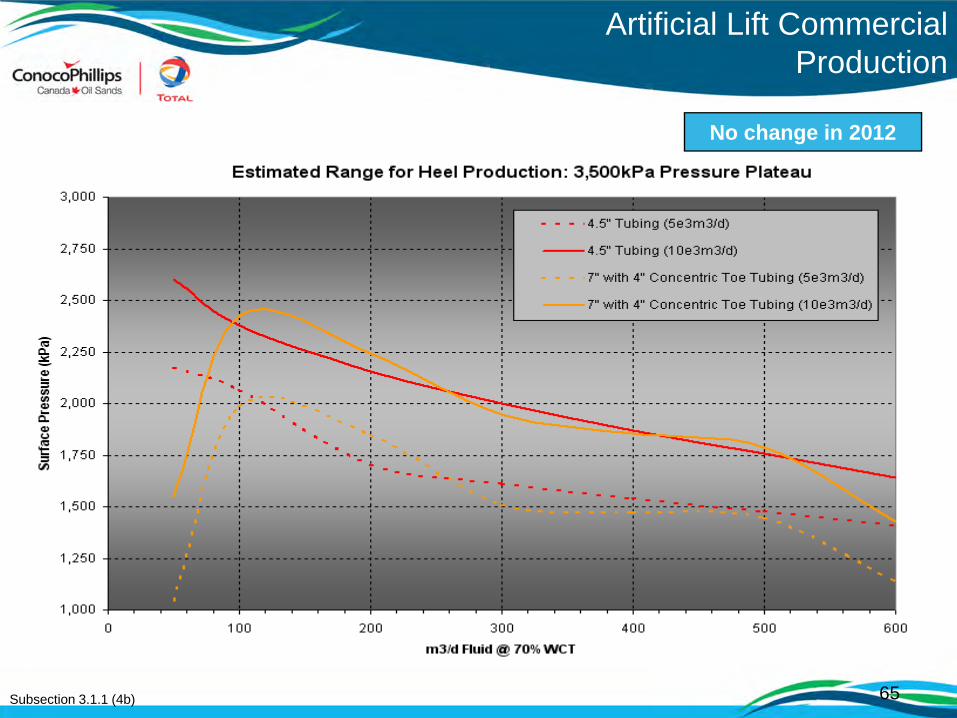
65
Artificial Lift Commercial Production
Subsection 3.1.1 (4b)
No change in 2012
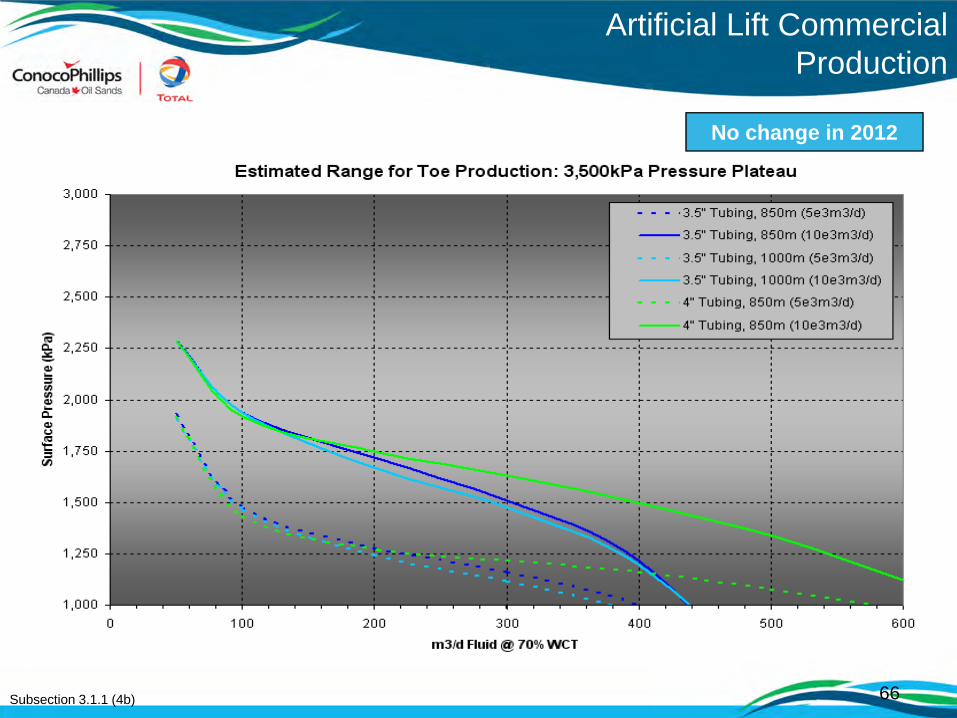
66
Artificial Lift Commercial Production
Subsection 3.1.1 (4b)
No change in 2012

New Technology Field TrialPCP Performance
• Positive displacement pump– Improved efficiency (compared to
other ALS)• Handles wide fluid viscosity range• More cost effective for maintenance
(pump changes), especially in the lower production range wells
• The All Metal PCP, also can:– Produce fluids up to 250C– Steam into the well without removing
the production tubing– Eventual steam flashes cause lesser
impact on runlife than ESPs
Advantages of a PCP system
• Infill producers (2) Jun 2012 -Significant challenges:
– Uncertainty about well productivity
– Wide temperature, water cut and viscosity range
Field Trial Scope
Subsection 3.1.1 (4b) 67
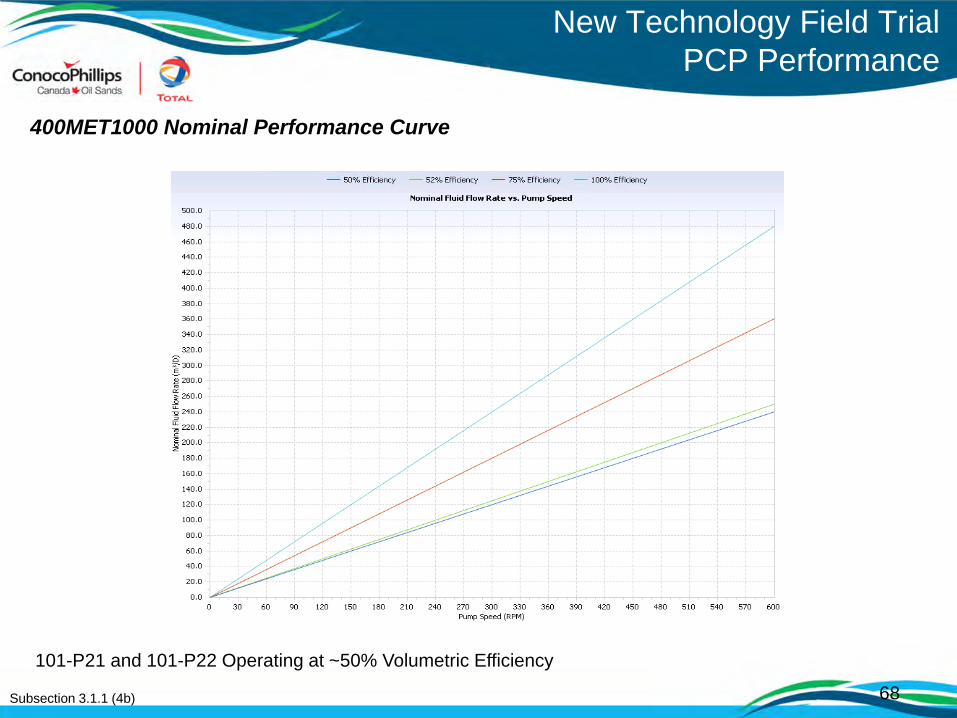
New Technology Field TrialPCP Performance
Subsection 3.1.1 (4b) 68
400MET1000 Nominal Performance Curve
101-P21 and 101-P22 Operating at ~50% Volumetric Efficiency
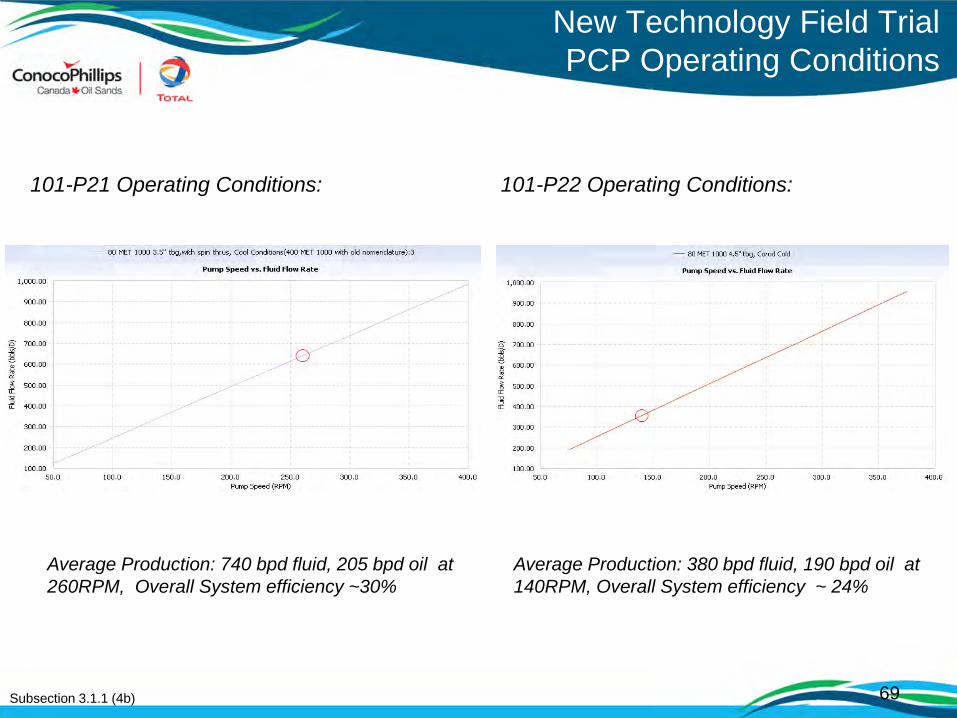
New Technology Field TrialPCP Operating Conditions
Subsection 3.1.1 (4b) 69
101-P21 Operating Conditions: 101-P22 Operating Conditions:
Average Production: 740 bpd fluid, 205 bpd oil at 260RPM, Overall System efficiency ~30%
Average Production: 380 bpd fluid, 190 bpd oil at 140RPM, Overall System efficiency ~ 24%
70
Subsection 3.1.1 (5) Instrumentation in Wells
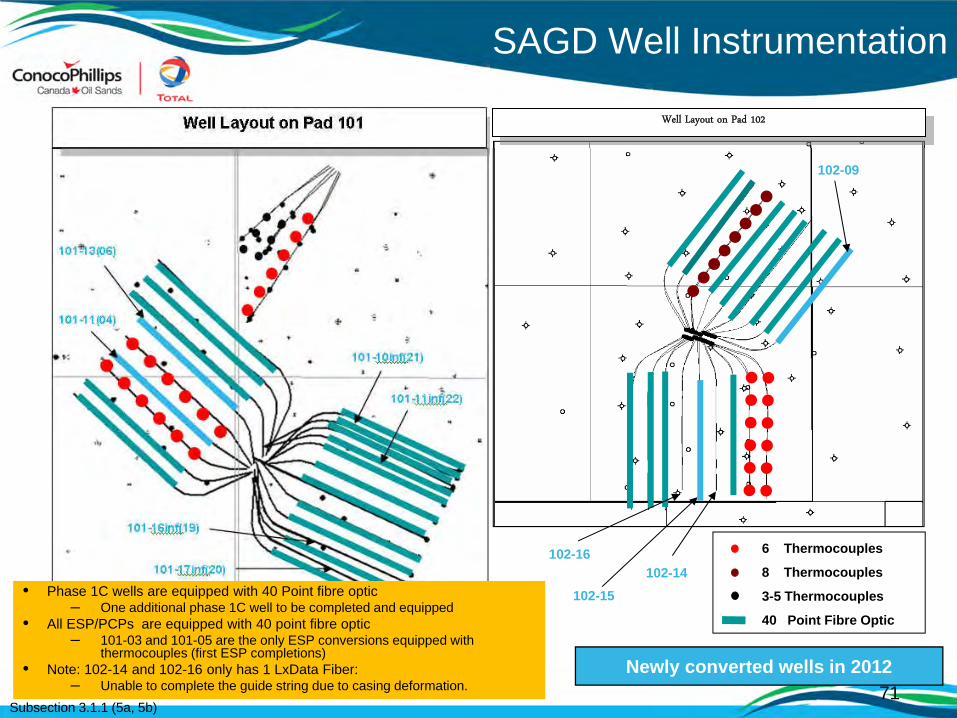
71
SAGD Well Instrumentation
Subsection 3.1.1 (5a, 5b)
6 Thermocouples
8 Thermocouples
3-5 Thermocouples
40 Point Fibre Optic
Newly converted wells in 2012
Well Layout on Pad 102
102-14102-16
102-09
102-15• Phase 1C wells are equipped with 40 Point fibre optic– One additional phase 1C well to be completed and equipped
• All ESP/PCPs are equipped with 40 point fibre optic– 101-03 and 101-05 are the only ESP conversions equipped with
thermocouples (first ESP completions)• Note: 102-14 and 102-16 only has 1 LxData Fiber:
– Unable to complete the guide string due to casing deformation.
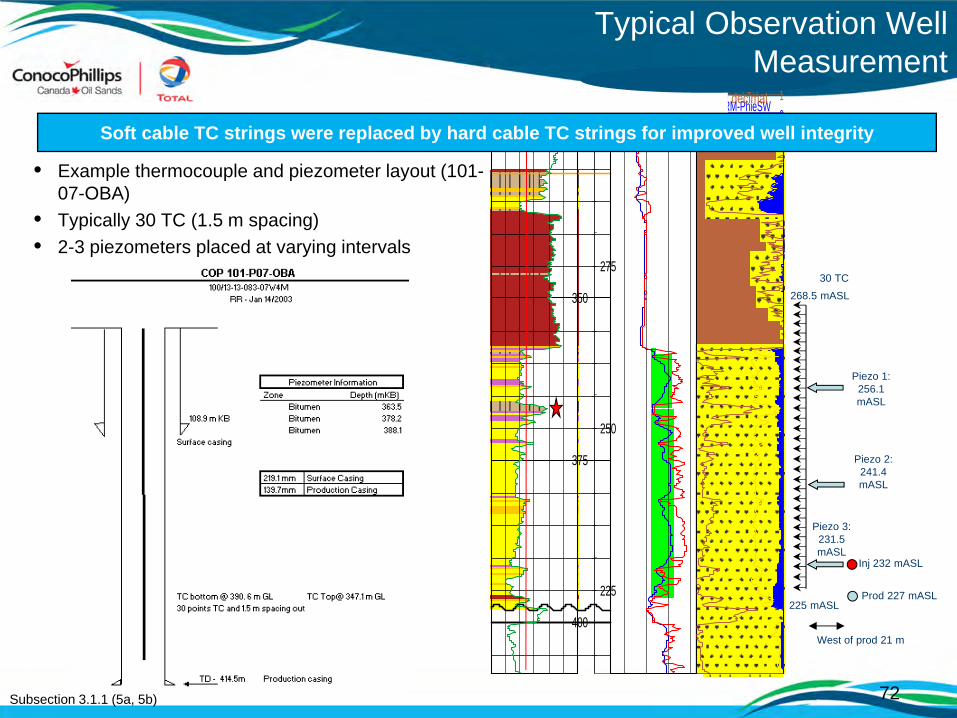
72
• Example thermocouple and piezometer layout (101-07-OBA)
• Typically 30 TC (1.5 m spacing)• 2-3 piezometers placed at varying intervals
Subsection 3.1.1 (5a, 5b)
225 mASL
268.5 mASL
Prod 227 mASL
Inj 232 mASL
West of prod 21 m
30 TC
Piezo 1: 256.1 mASL
Piezo 2: 241.4 mASL
Piezo 3: 231.5 mASL
MetersMD TVDSS
350
375
400
225
250
275
0.2 2000AF900.2 2000RXOZ
0 150APIAR_GRrsc 1 0v/v decimal
AR_PHIE1 0SURM-PhieSW0 1v/v decimal
AR_VSH
AnalysisCoreSoft cable TC strings were replaced by hard cable TC strings for improved well integrity
Typical Observation Well Measurement

73
Producer Well P/T Instrumentation
Subsection 3.1.1 (5a, 5b)
Typical ESP Bottomhole Configuration
9 5/8” Intermediate casing
88.9mm EU 9.3ppf production string
7” slotted liner f/743m to 1,616m
1-1/4” IJ InstrumentString
1/4” Bubble Tube Coil (clamped)3/8” Instrumentation in power cable (clamped)¼” encapsulated instrumentation line for Opsens P/T sensor (clamped)
ESP – REDAHotline III
13 3/8” Conductor
P/T Senso Bottom @715m
Tail pipe thermal packer
114.3mm Hydrill tail pipe top: above liner hanger bottom @ 1,461m
All depths indicated are GRD
Temperature monitoring Instrumentation (Thermocouple/Fiber Optics inside of 1.25” Coil)5 thermocouples from 705m to 730m, equally spaced6th thermocouple @ 743m40th thermocouple @ 1,616m. Equally spaced
Liner hanger top @741m MD
ESP
• Current standard system
configuration utilizes one P/T gauge
(fiber optics) and a bubble tube
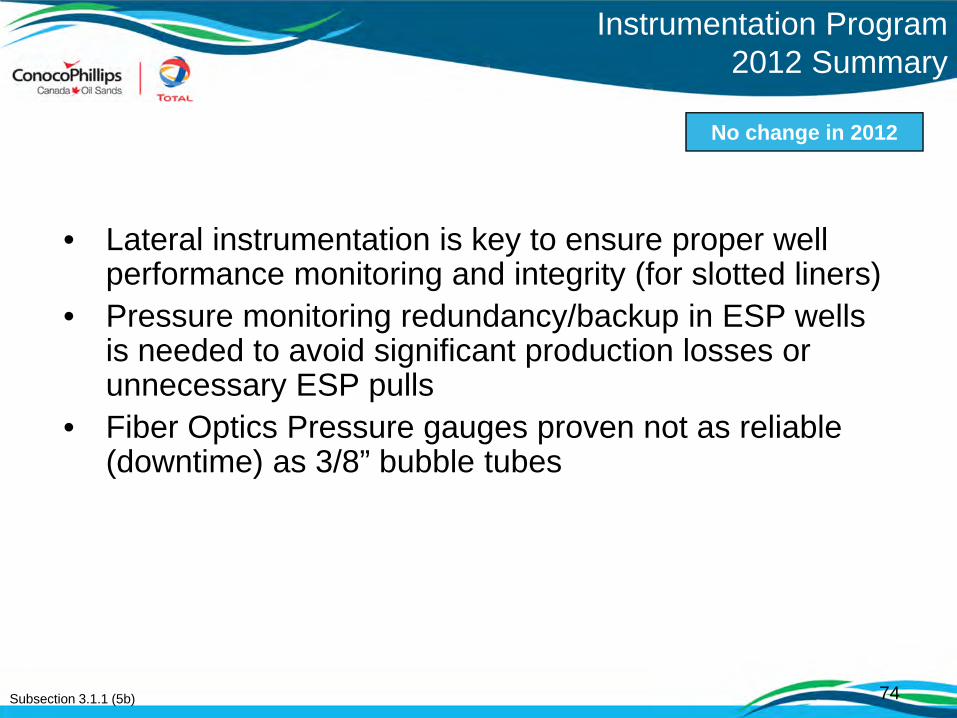
74
Instrumentation Program 2012 Summary
• Lateral instrumentation is key to ensure proper well performance monitoring and integrity (for slotted liners)
• Pressure monitoring redundancy/backup in ESP wells is needed to avoid significant production losses or unnecessary ESP pulls
• Fiber Optics Pressure gauges proven not as reliable (downtime) as 3/8” bubble tubes
Subsection 3.1.1 (5b)
No change in 2012

75
Subsection 3.1.1 (6) 4-D Seismic

• Pilot– Buried analog single component geophones– Cased dynamite shots (1/4 Kg) @ 9 m– 11th monitor acquired in September 2012
• Pad 101N– Buried analog single component geophones– Cased dynamite shots (1/8 Kg) @ 6 m– 2nd and 3rd monitor acquired in March and
September 2012• Pad 101S
– Buried analog single component geophones– Cased dynamite shots (1/8 Kg) @ 6 m– 6th monitor acquired in March 2012
• Pad 102N– Buried analog single component geophones– Cased dynamite shots (1/8 Kg) @ 6 m– 6th monitor acquired in April 2012
• Pad 102S– Buried analog single component geophones– Cased dynamite shots (1/8 Kg) @ 6 m– 4th monitor acquired in April 2012
• Pads 103 and 104– Buried analog single component geophones– Cased dynamite shots (1/8 Kg) @ 6 m– Baseline acquired in April 2012
Subsection 3.1.1 (6a)
Phase 1 Area
4D Seismic Location Map
76

101N
1998
October
SAGD Start-up
2007 2008 2009 2010
101S
102N
102S
B M
MB
B M
M
Pilot M M
M
M
M
B
March September March March
March
March September
MAugust January
JanuaryJanuaryMarch
August August
SAGD Start-up
SAGD Start-up
SAGD Start-up
SAGD Start-up
M
M
October
October
2011
MOctober
MMarch
M
M
April
April
M
2012
MMarch
MApril
MApril
MMarch
103
104
BMarch
BMarch
2013
MMarch
MApril
MApril
MOctober
October
M
P,A
P
P
P
MSept
MSept
Phase 1 4D Seismic Program
77Subsection 3.1.1 (6a)
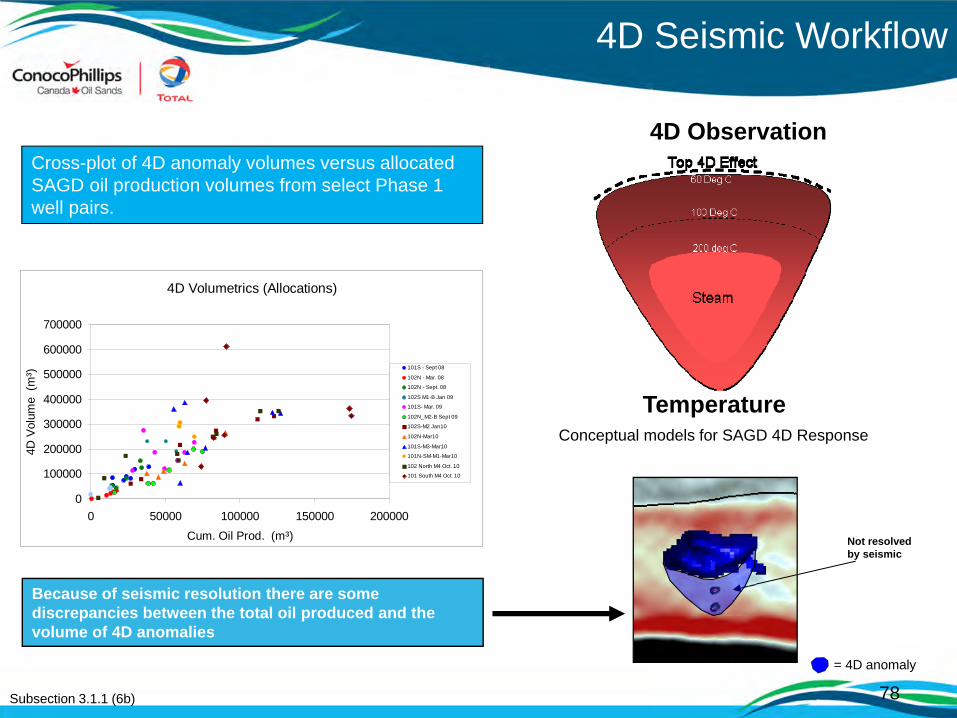
78
4D Seismic Workflow
4D Volumetrics (Allocations)
0
100000
200000
300000
400000
500000
600000
700000
0 50000 100000 150000 200000Cum. Oil Prod. (m³)
4D V
olum
e (m
³) 101S - Sept 08
102N - Mar. 08
102N - Sept. 08
102S M1-B Jan 09
101S- Mar. 09
102N_M2-B Sept 09
102S-M2 Jan10
102N-Mar10
101S-M3-Mar10
101N-SM-M1-Mar10
102 North M4 Oct. 10
101 South M4 Oct. 10
Cross-plot of 4D anomaly volumes versus allocated SAGD oil production volumes from select Phase 1 well pairs.
TemperatureConceptual models for SAGD 4D Response
4D Observation
= 4D anomaly
Not resolved by seismic
Because of seismic resolution there are some discrepancies between the total oil produced and the volume of 4D anomalies
Subsection 3.1.1 (6b)

= 4D anomaly~60 deg C Isotherm
Subsection 3.1.1 (6b) 79
WP 07/08/09, without a true baseline. For the rest of Well Pairs the 4D anomaly volumes have increased. Good conformance, especially at the heel. WP 03 an ESAGD pilot
4D anomaly volumes have increased. Continued conformance improvement along WP 10, 11.
Infill wells drilled between WP 10, 11, 12. 16, 17 and 18 to optimize production in a geological more complex zone.
2012 4D Seismic Results Pad 101
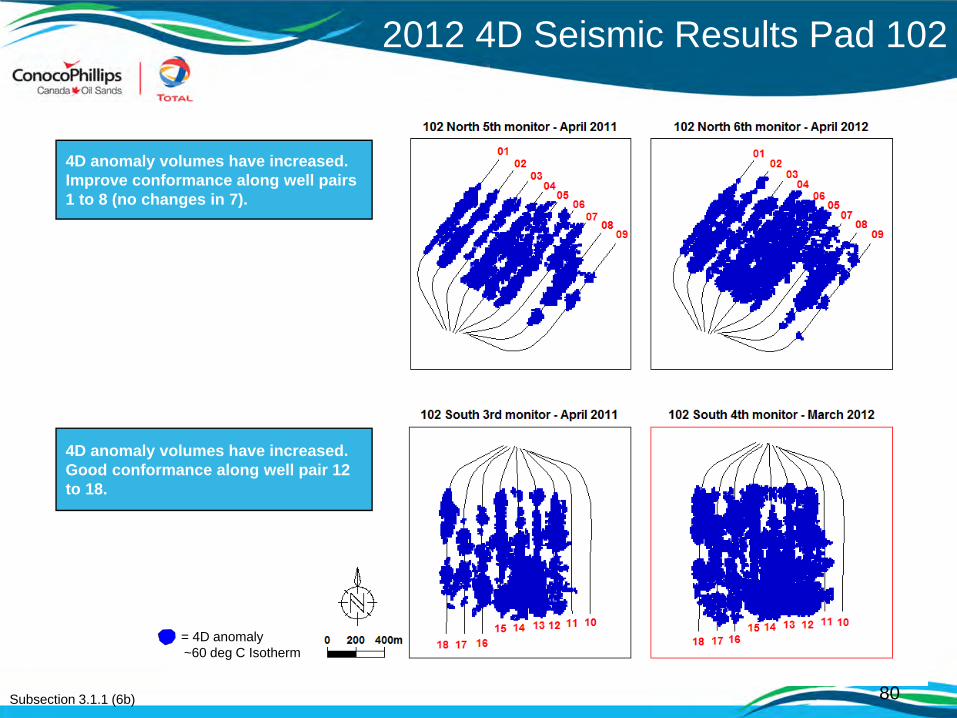
Subsection 3.1.1 (6b) 80
2012 4D Seismic Results Pad 102
= 4D anomaly~60 deg C Isotherm
4D anomaly volumes have increased. Improve conformance along well pairs 1 to 8 (no changes in 7).
4D anomaly volumes have increased. Good conformance along well pair 12 to 18.
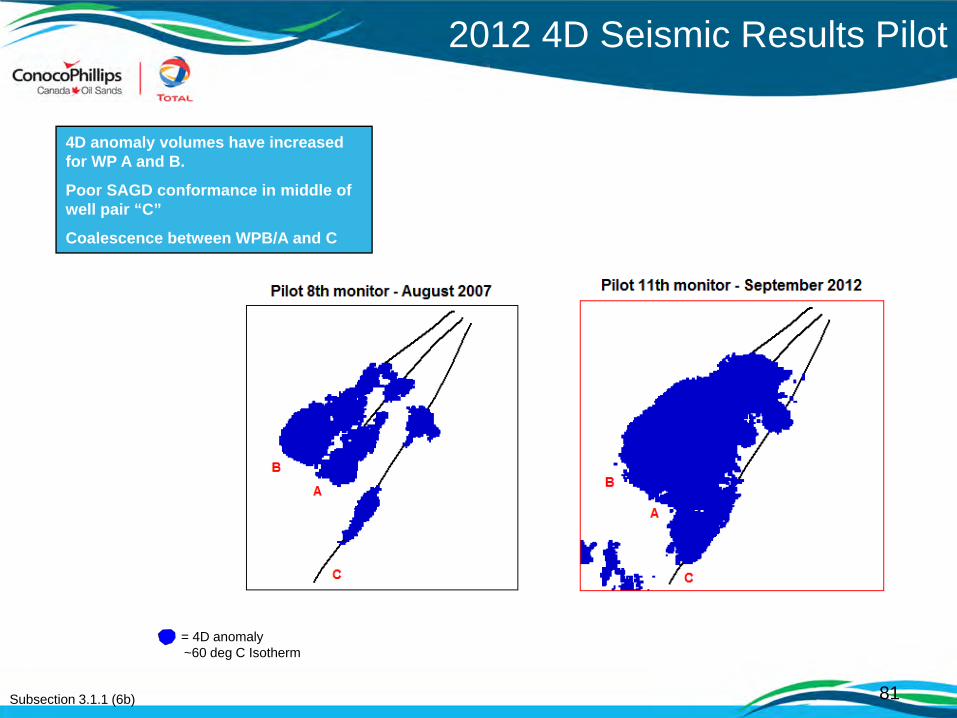
Subsection 3.1.1 (6b) 81
2012 4D Seismic Results Pilot
= 4D anomaly~60 deg C Isotherm
4D anomaly volumes have increased for WP A and B.
Poor SAGD conformance in middle of well pair “C”
Coalescence between WPB/A and C

Subsection 3.1.1 (6b) 82
Problem:
Well pair 101-P16 lacking good conformance along well pair
Action:
Increase pressure of steam injection at toe
Results:
Conformance improved at toe
M4-Oct/2010
M5-Apr/2011
M6-Mar/2012
Amp GR
Top Bottom Water (Thief Zone)
Seismic Examples: 101-P16 Conformance (Toe)

Seismic Examples: 102-04 OBA Baffle Breakthrough (Heel)
2009 2008
RST
2009 RST and 4D surveys confirmed recovery above mudstone
Operating pressure reduced to manage thief zone interactions
April 2012 4D survey with RST showing steam breakthrough through mudstone
M4-Oct/2010
M5-Apr/2011
M6-Apr/2012
Amp GR
Mud Abandon Channel
Mud Abandon Channel
Mud Abandon Channel
1 m baffle
1 m baffle
83Subsection 3.1.1 (6b)
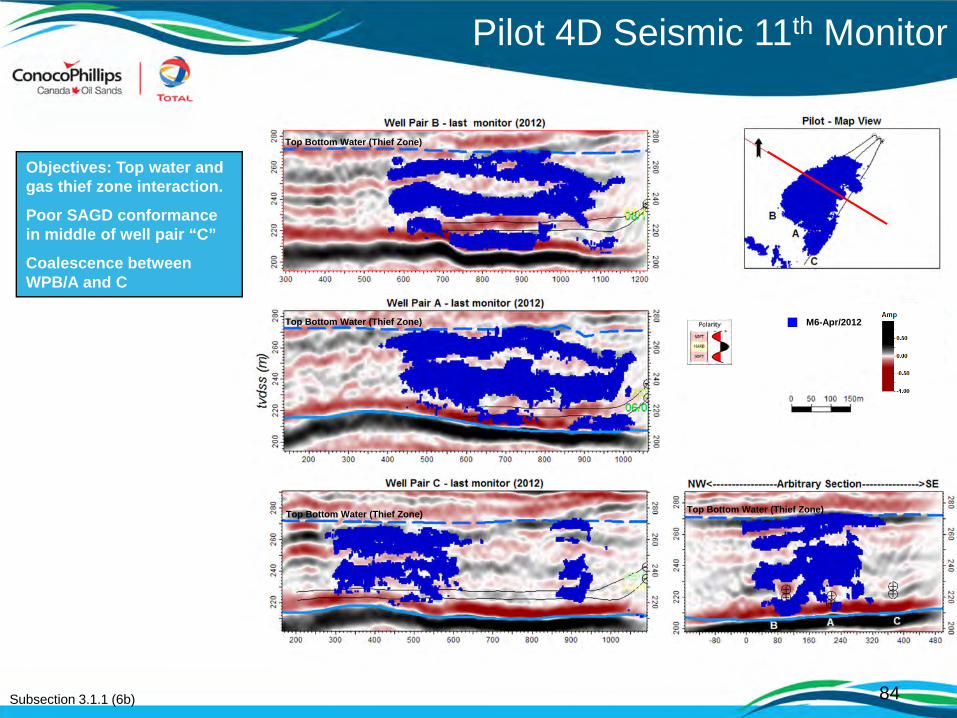
Pilot 4D Seismic 11th Monitor
Objectives: Top water and gas thief zone interaction.
Poor SAGD conformance in middle of well pair “C”
Coalescence between WPB/A and C
Subsection 3.1.1 (6b) 84
Top Bottom Water (Thief Zone)
Top Bottom Water (Thief Zone)
Top Bottom Water (Thief Zone) Top Bottom Water (Thief Zone)
M6-Apr/2012
85
4D Seismic Program 2012
• 4D seismic has proven very useful in monitoring and optimizing conformance and pressure strategy
• 4D correlates with observation well data• Continuing to optimize heel/toe production/injection
splits using 4D results• Ongoing efforts to history match reservoir models using
4D seismic
Subsection 3.1.1 (6b)
86
Subsection 3.1.1 (7) Scheme Performance
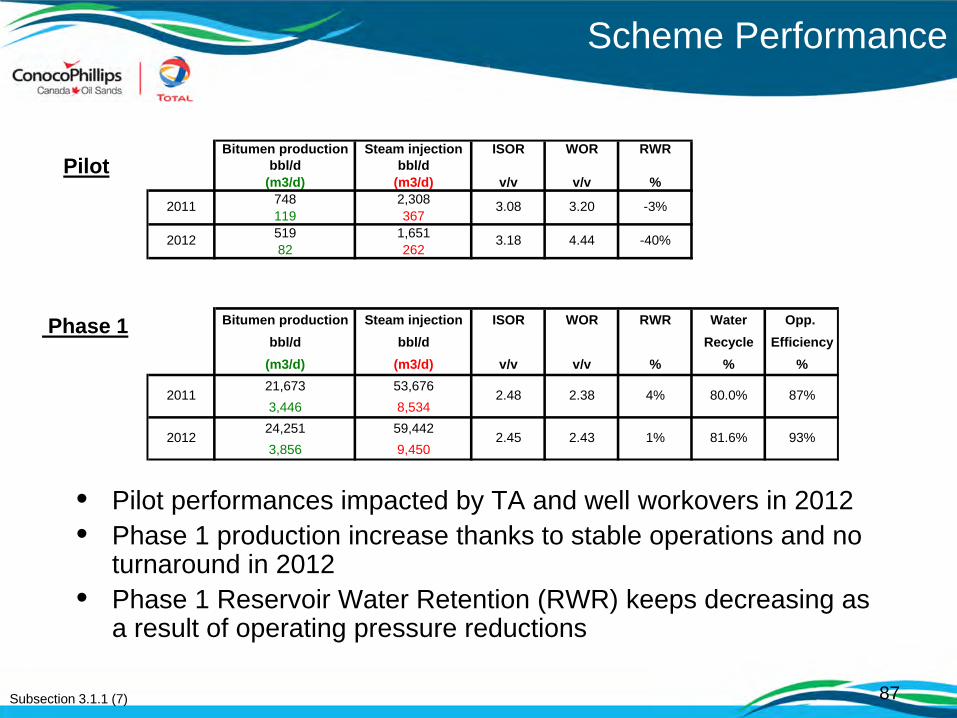
87
Scheme Performance
• Pilot performances impacted by TA and well workovers in 2012• Phase 1 production increase thanks to stable operations and no
turnaround in 2012• Phase 1 Reservoir Water Retention (RWR) keeps decreasing as
a result of operating pressure reductions
Pilot
Phase 1
Subsection 3.1.1 (7)
Bitumen production Steam injection ISOR WOR RWRbbl/d bbl/d
(m3/d) (m3/d) v/v v/v %748 2,308119 367519 1,65182 262
Bitumen production Steam injection ISOR WOR RWR Water Opp. bbl/d bbl/d Recycle Efficiency
(m3/d) (m3/d) v/v v/v % % %21,673 53,6763,446 8,53424,251 59,4423,856 9,450
2012 3.18 4.44 -40%
2011 3.08 3.20 -3%
80.0%
81.6%
2.48
2.45
2.38
2.43
2011
2012
4%
1%
87%
93%
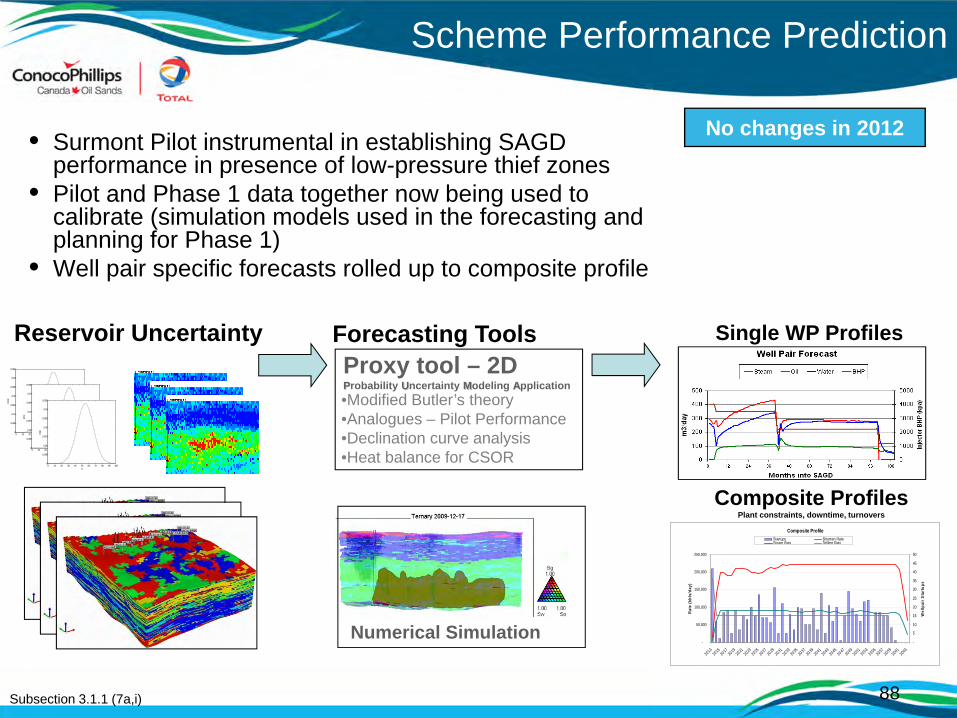
88
Scheme Performance Prediction
• Surmont Pilot instrumental in establishing SAGD performance in presence of low-pressure thief zones
• Pilot and Phase 1 data together now being used to calibrate (simulation models used in the forecasting and planning for Phase 1)
• Well pair specific forecasts rolled up to composite profile
Subsection 3.1.1 (7a,i)
Single WP Profiles
Composite Profile
-
50,000
100,000
150,000
200,000
250,000
201320
15201720
1920
21202320
2520
2720
2920
3120
3320
3520
3720
3920
4120
43204520
4720
49205120
53205520
5720
5920
6120
63
Rate
(bbl
s/da
y)
-
5
10
15
20
25
30
35
40
45
50
Wel
lpai
r Sta
rtups
Startups Bitumen RateSteam Rate Drilling Rate
Composite Profiles Plant constraints, downtime, turnovers
0 10 20 30 40 50 60 70 80 90 1000
0.005
0.01
0.015
0.02
0.025
0.03
0.035
X
PD
F
0 10 20 30 40 50 60 70 80 90 1000
0.005
0.01
0.015
0.02
0.025
0.03
0.035
X
PD
F
0 10 20 30 40 50 60 70 80 90 1000
0.005
0.01
0.015
0.02
0.025
0.03
0.035
X
PD
F
Reservoir UncertaintyProxy tool – 2DProbability Uncertainty Modeling Application•Modified Butler’s theory•Analogues – Pilot Performance•Declination curve analysis•Heat balance for CSOR
Numerical Simulation
Forecasting Tools
No changes in 2012
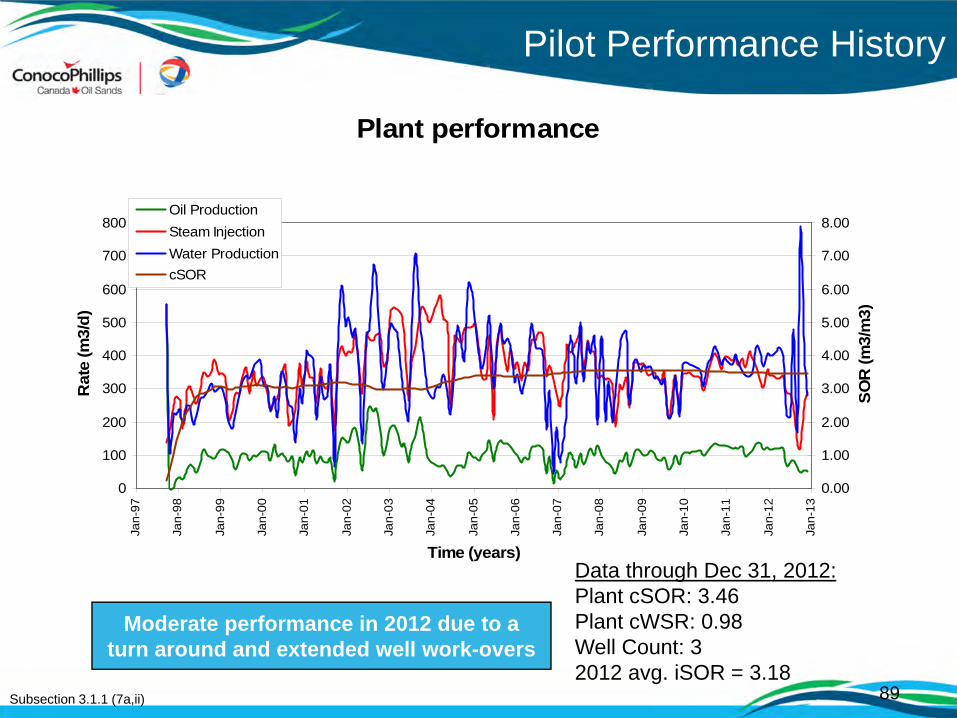
Plant performance
0
100
200
300
400
500
600
700
800
Jan-
97
Jan-
98
Jan-
99
Jan-
00
Jan-
01
Jan-
02
Jan-
03
Jan-
04
Jan-
05
Jan-
06
Jan-
07
Jan-
08
Jan-
09
Jan-
10
Jan-
11
Jan-
12
Jan-
13
Time (years)
Rat
e (m
3/d)
0.00
1.00
2.00
3.00
4.00
5.00
6.00
7.00
8.00
SOR
(m3/
m3)
Oil ProductionSteam InjectionWater ProductioncSOR
89
Pilot Performance History
Subsection 3.1.1 (7a,ii)
Moderate performance in 2012 due to a turn around and extended well work-overs
Data through Dec 31, 2012:Plant cSOR: 3.46Plant cWSR: 0.98Well Count: 32012 avg. iSOR = 3.18
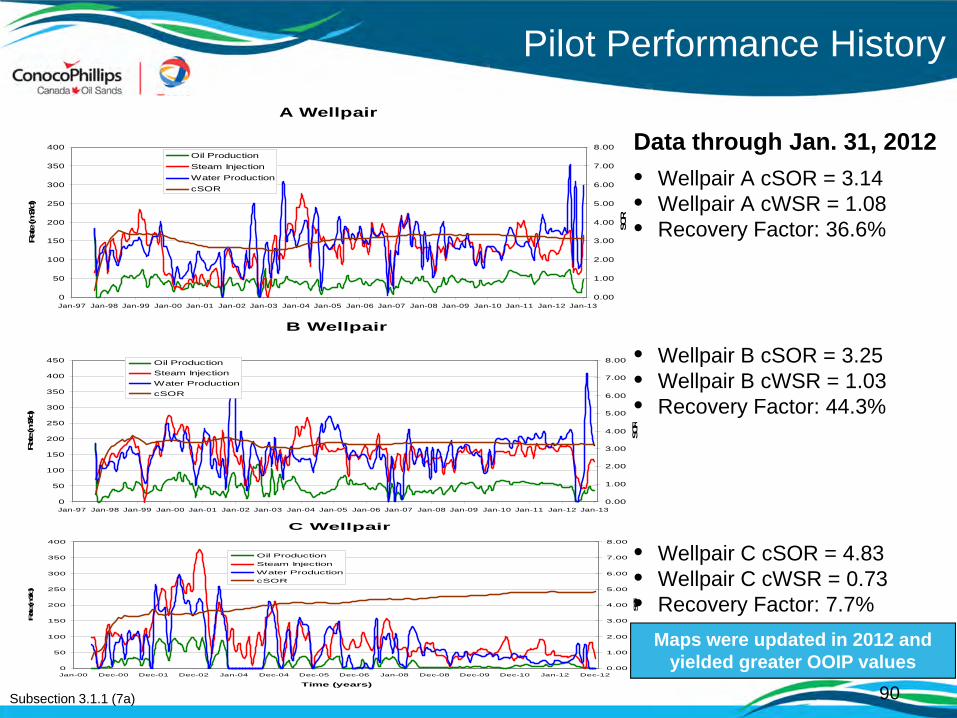
A Wellpair
0
50
100
150
200
250
300
350
400
Jan-97 Jan-98 Jan-99 Jan-00 Jan-01 Jan-02 Jan-03 Jan-04 Jan-05 Jan-06 Jan-07 Jan-08 Jan-09 Jan-10 Jan-11 Jan-12 Jan-13
Time (years)
Rat
e (m
3/d)
0.00
1.00
2.00
3.00
4.00
5.00
6.00
7.00
8.00
SOR
Oil ProductionSteam InjectionWater ProductioncSOR
B Wellpair
0
50
100
150
200
250
300
350
400
450
Jan-97 Jan-98 Jan-99 Jan-00 Jan-01 Jan-02 Jan-03 Jan-04 Jan-05 Jan-06 Jan-07 Jan-08 Jan-09 Jan-10 Jan-11 Jan-12 Jan-13
Time (years)
Rate (m
3/d)
0.00
1.00
2.00
3.00
4.00
5.00
6.00
7.00
8.00
SOR
Oil ProductionSteam InjectionWater ProductioncSOR
C Wellpair
0
50
100
150
200
250
300
350
400
Jan-00 Dec-00 Dec-01 Dec-02 Jan-04 Dec-04 Dec-05 Dec-06 Jan-08 Dec-08 Dec-09 Dec-10 Jan-12 Dec-12
Time (years)
Rate (m
3/d)
0.00
1.00
2.00
3.00
4.00
5.00
6.00
7.00
8.00
SOR
Oil ProductionSteam InjectionWater ProductioncSOR
90
Pilot Performance History
Subsection 3.1.1 (7a)
Data through Jan. 31, 2012• Wellpair A cSOR = 3.14• Wellpair A cWSR = 1.08• Recovery Factor: 36.6%
• Wellpair B cSOR = 3.25• Wellpair B cWSR = 1.03• Recovery Factor: 44.3%
• Wellpair C cSOR = 4.83• Wellpair C cWSR = 0.73• Recovery Factor: 7.7%
Maps were updated in 2012 and yielded greater OOIP values
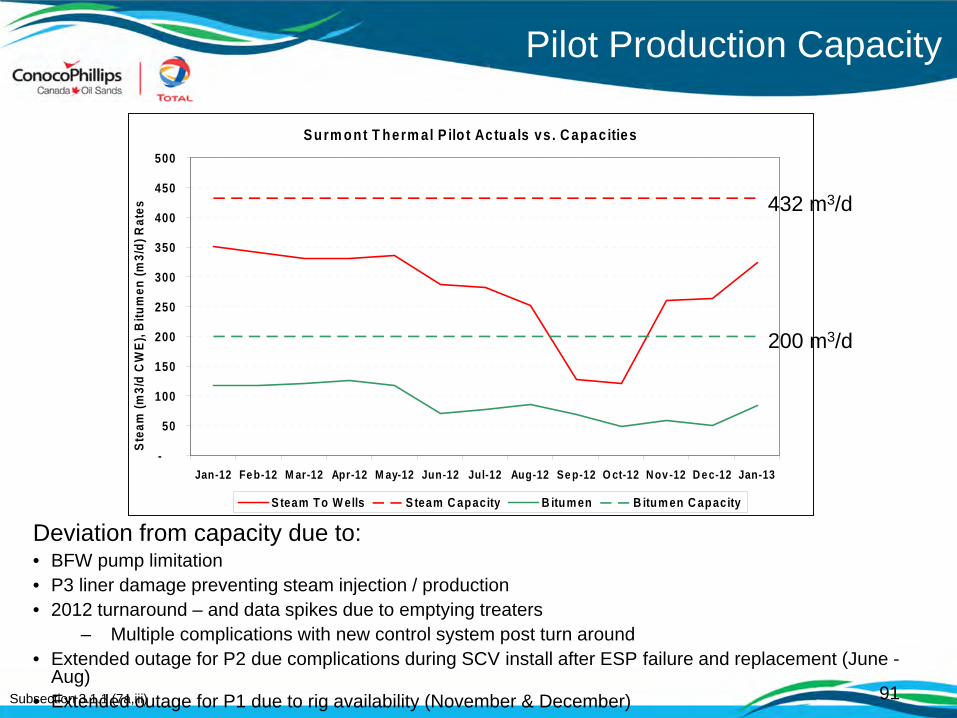
Pilot Production Capacity
Deviation from capacity due to:• BFW pump limitation• P3 liner damage preventing steam injection / production• 2012 turnaround – and data spikes due to emptying treaters
– Multiple complications with new control system post turn around• Extended outage for P2 due complications during SCV install after ESP failure and replacement (June -
Aug)• Extended outage for P1 due to rig availability (November & December)Subsection 3.1.1 (7a,iii) 91
S urm ont T herm al P ilo t Actua ls vs . C apac ities
-
50
100
150
200
250
300
350
400
450
500
Jan-12 Fe b-12 M ar-12 Apr-12 M ay-12 Jun-12 Jul-12 Aug-12 Se p-12 O ct-12 N ov -12 D e c-12 Jan-13
Stea
m (m
3/d
CW
E), B
itum
en (m
3/d)
Rat
es
S team To W ells S team C apacity B itum en B itum en C apacity
200 m3/d
432 m3/d

92
Well Status
Status on January 31, 2013
• Pilot: – 3 well pairs on SAGD
• Phase 1:– 35 well pairs on SAGD– 2 Infill producers online– 1 well pair in eSAGD– 2 Cold well pairs
• Infill drilling– 2012: 2 infill well pairs and 2 infill producers
drilled– 2013: New infill drilling campaign
• Planning underway for first sustaining pad drainage areas and more Phase 1 infill wellpairs
• No expected pad abandonments in 5 year outlook
Subsection 3.1.1 (7a,ii)
Continuing to bring wells online
3
3
3
3
3
3
Delineation WellsGOB Monitoring WellsObservation Wellsin SAGDUnder SAGD conversionNGL steam co-injectionCold
Pad 101
Pad 102
Pilot
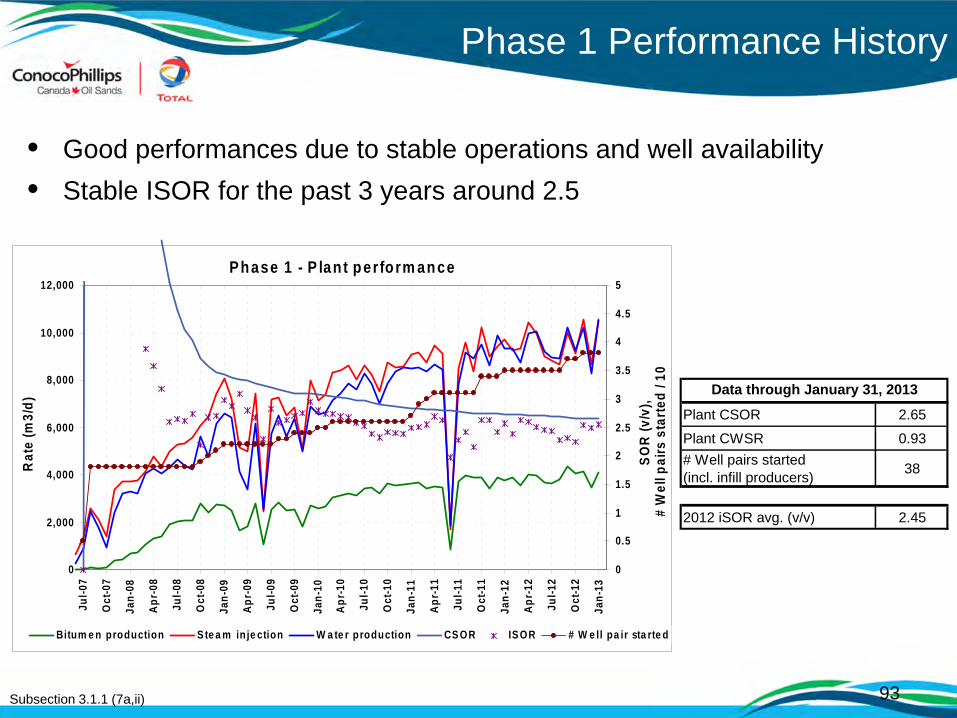
Phase 1 - P lant perform ance
0
2,000
4,000
6,000
8,000
10,000
12,000
Jul-0
7
Oct
-07
Jan-
08
Apr-0
8
Jul-0
8
Oct
-08
Jan-
09
Apr-0
9
Jul-0
9
Oct
-09
Jan-
10
Apr-1
0
Jul-1
0
Oct
-10
Jan-
11
Apr-1
1
Jul-1
1
Oct
-11
Jan-
12
Apr-1
2
Jul-1
2
Oct
-12
Jan-
13
Rat
e (m
3/d)
0
0.5
1
1.5
2
2.5
3
3.5
4
4.5
5
SOR
(v/v
), #
Wel
l pai
rs s
tarte
d / 1
0
Bitum e n production S te a m in je ction W a te r production CS OR IS OR # W e ll pa ir sta rte d
93
Phase 1 Performance History
Subsection 3.1.1 (7a,ii)
Plant CSOR 2.65
Plant CWSR 0.93# Well pairs started (incl. infill producers) 38
2012 iSOR avg. (v/v) 2.45
Data through January 31, 2013
• Good performances due to stable operations and well availability• Stable ISOR for the past 3 years around 2.5
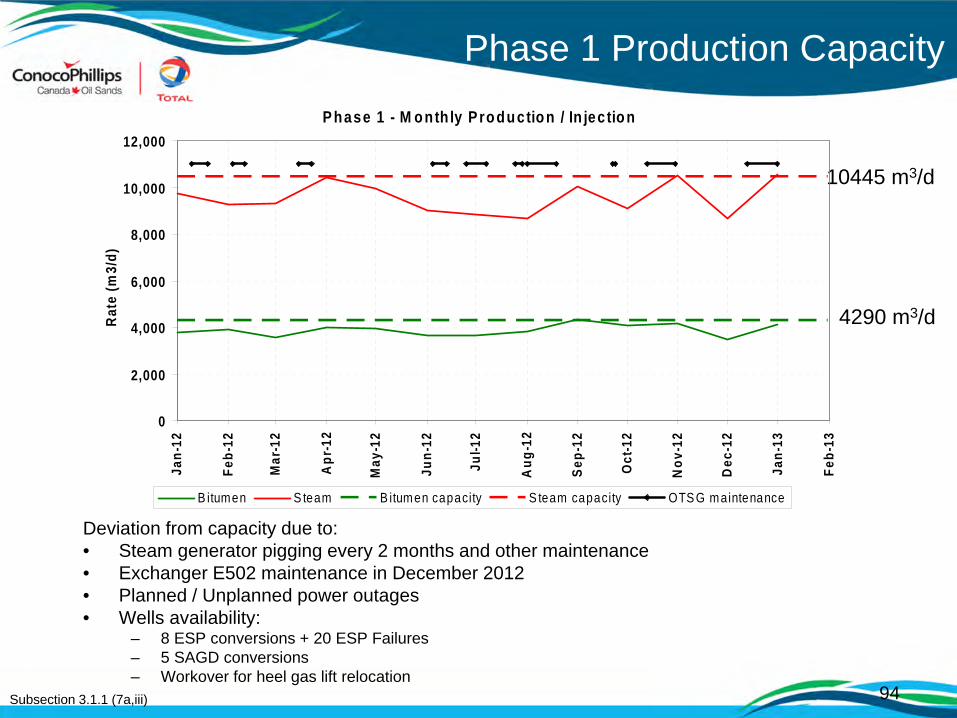
Phase 1 Production Capacity
Deviation from capacity due to:• Steam generator pigging every 2 months and other maintenance• Exchanger E502 maintenance in December 2012• Planned / Unplanned power outages• Wells availability:
– 8 ESP conversions + 20 ESP Failures– 5 SAGD conversions– Workover for heel gas lift relocation
10445 m3/d
4290 m3/d
Subsection 3.1.1 (7a,iii) 94
P hase 1 - M onth ly P roduction / In jec tion
0
2,000
4,000
6,000
8,000
10,000
12,000
Jan-
12
Feb-
12
Mar
-12
Apr
-12
May
-12
Jun-
12
Jul-1
2
Aug
-12
Sep-
12
Oct
-12
Nov
-12
Dec
-12
Jan-
13
Feb-
13
Rat
e (m
3/d)
B itumen S team B itumen capacity S team capacity OTS G maintenance

May-98 Mar-99 Dec-99 Sep-00 Jun-01 Apr-02 Jan-03 Oct-03 Jul-04 May-05 Feb-06 Nov-06 Aug-07 May-08 Mar-09 Dec-09 Sep-10 Jun-11 Apr-12 Jan-13
276273270267264261257254251248245242239236233230227224221217
225-250 200-225 175-200 150-175 125-150 100-125 75-100 50-75 25-50 0-25
95
Pilot Wellpair A: OBS36 (Mid)
Subsection 3.1.1 (7b)
MetersMD TVDSS
325
350
375
400
200
225
250
275
0.2 2000N-RD0.2 2000N-RS
0 150APIAR_GRrsc 1 0v/v decimal
AR_PHIE1 0SURM-PhieSW0 1v/v decimalAR_VSH
AnalysisCore
OBS36 A well pair (mid)
Piezo 1: 287 mASL
Piezo 2: 265 mASL
Piezo 3: 247 mASL
Piezo 4: 227 mASL
276 mASLTC
Prod depth 216 mASL
Inj depth 222 mASL
Offset : X m
TZPF = 2.5 m
TZPF = 2.5 m
MetersMD TVDSS
325
350
375
400
200
225
250
275
0.2 2000N-RD0.2 2000N-RS
0 150APIAR_GRrsc 1 0v/v decimal
AR_PHIE1 0SURM-PhieSW0 1v/v decimalAR_VSH
AnalysisCore
OBS36 A well pair (mid)
Piezo 1: 287 mASL
Piezo 2: 265 mASL
Piezo 3: 247 mASL
Piezo 4: 227 mASL
276 mASLTC
Prod depth 216 mASL
Inj depth 222 mASL
Offset : X m
TZPF = 2.5 m
TZPF = 2.5 m
OBS 36: Heat keeps progressing above breccia
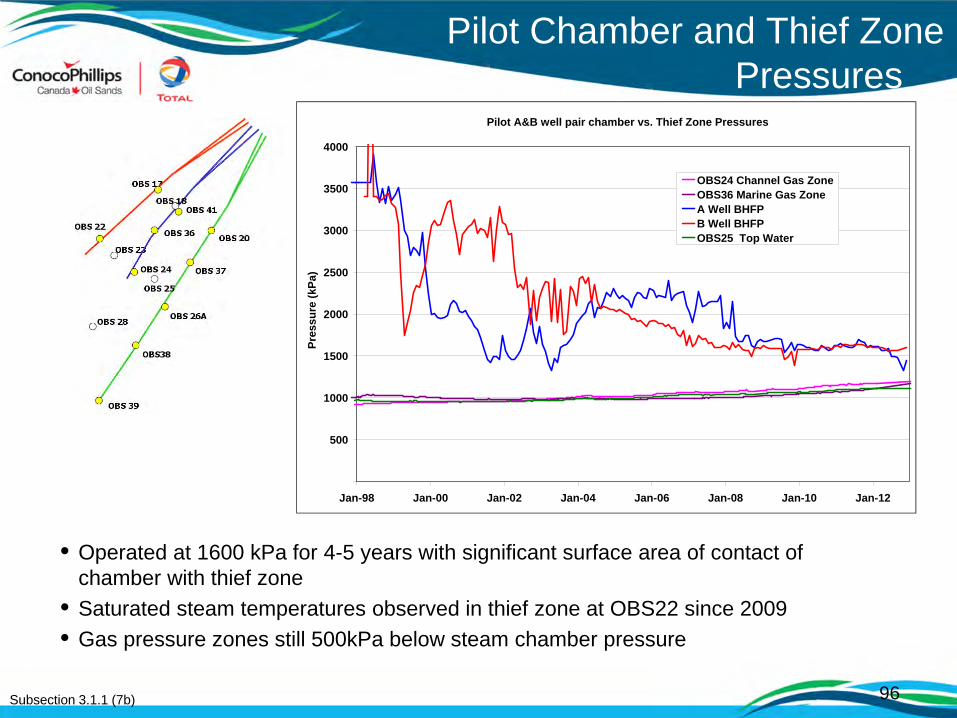
96
Pilot Chamber and Thief Zone Pressures .
Subsection 3.1.1 (7b)
• Operated at 1600 kPa for 4-5 years with significant surface area of contact of chamber with thief zone
• Saturated steam temperatures observed in thief zone at OBS22 since 2009• Gas pressure zones still 500kPa below steam chamber pressure
Pilot A&B well pair chamber vs. Thief Zone Pressures
500
1000
1500
2000
2500
3000
3500
4000
Jan-98 Jan-00 Jan-02 Jan-04 Jan-06 Jan-08 Jan-10 Jan-12
Pres
sure
(kPa
)
OBS24 Channel Gas ZoneOBS36 Marine Gas ZoneA Well BHFPB Well BHFP OBS25 Top Water
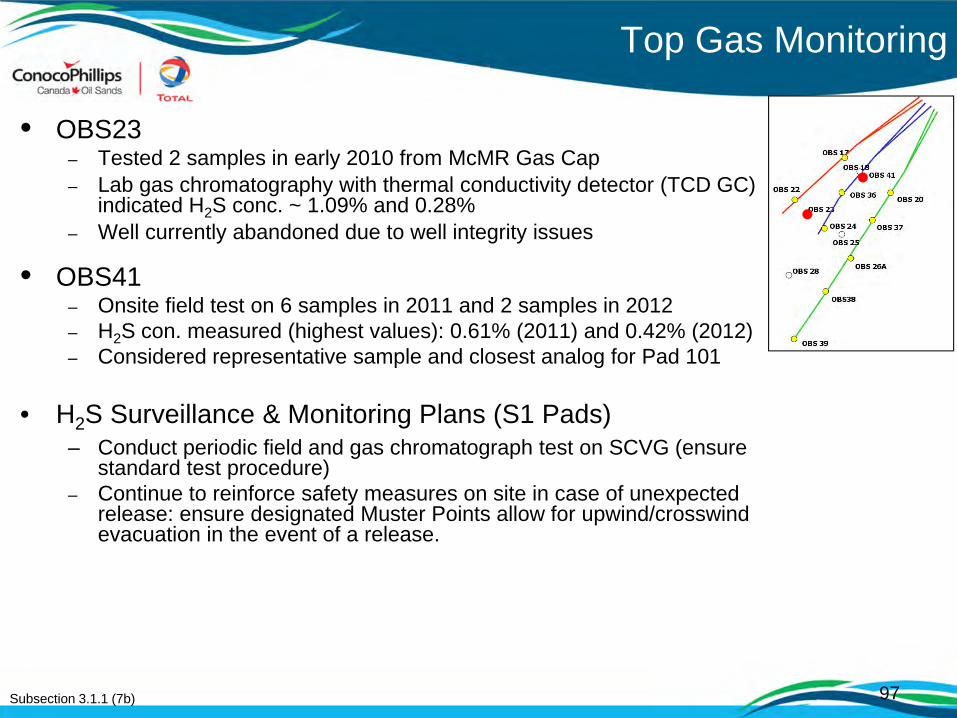
97
Top Gas Monitoring
• OBS23– Tested 2 samples in early 2010 from McMR Gas Cap– Lab gas chromatography with thermal conductivity detector (TCD GC)
indicated H2S conc. ~ 1.09% and 0.28% – Well currently abandoned due to well integrity issues
• OBS41– Onsite field test on 6 samples in 2011 and 2 samples in 2012 – H2S con. measured (highest values): 0.61% (2011) and 0.42% (2012)– Considered representative sample and closest analog for Pad 101
• H2S Surveillance & Monitoring Plans (S1 Pads)– Conduct periodic field and gas chromatograph test on SCVG (ensure
standard test procedure)– Continue to reinforce safety measures on site in case of unexpected
release: ensure designated Muster Points allow for upwind/crosswind evacuation in the event of a release.
Subsection 3.1.1 (7b)

98
Piezos in:Bitumen
Top water
Bitumen and top water
Top gas
Top gas, bitumen and top water
E-SAGD observation wells with 10 piezometers per well monitoring:
- bitumen zones- high water saturation zones- thief zone (water / gas)- cap rock
No piezometer installed
Reservoir Monitoring
Thermocouple string installed
Horizontal observation well with fiber optic
No temperature monitoring
Temperature Measurement Pressure Measurement(as planned after hard cable TC string installation)
Subsection 3.1.1 (7b)
No changes in 2012
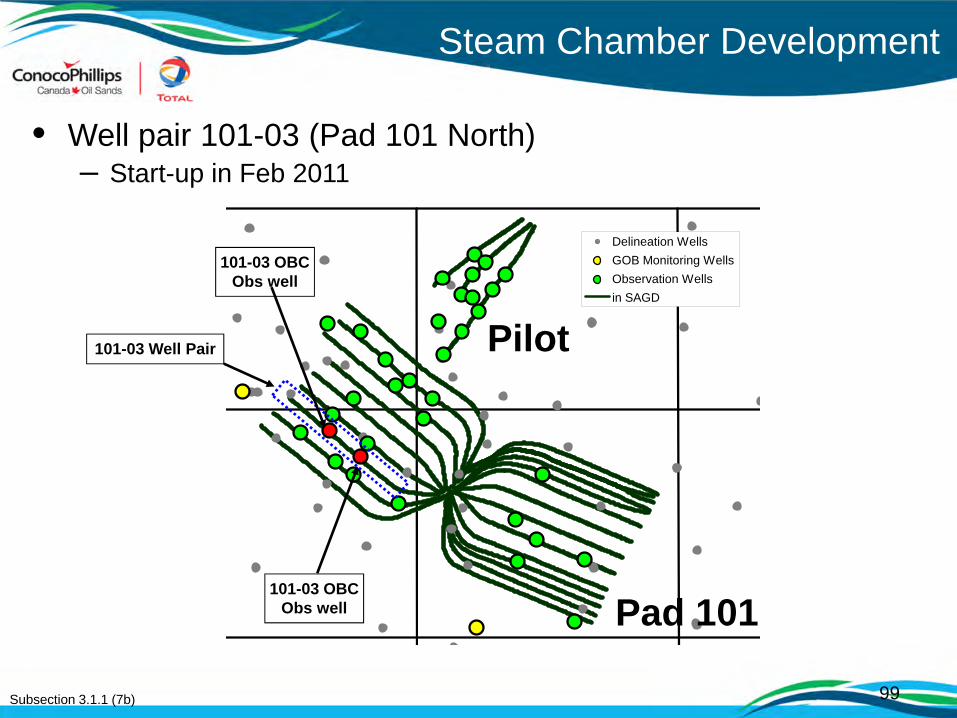
Pad 101
Pilot
Steam Chamber Development
Subsection 3.1.1 (7b) 99
• Well pair 101-03 (Pad 101 North)– Start-up in Feb 2011
Delineation WellsGOB Monitoring WellsObservation Wellsin SAGD
101-03 Well Pair
101-03 OBC Obs well
101-03 OBC Obs well
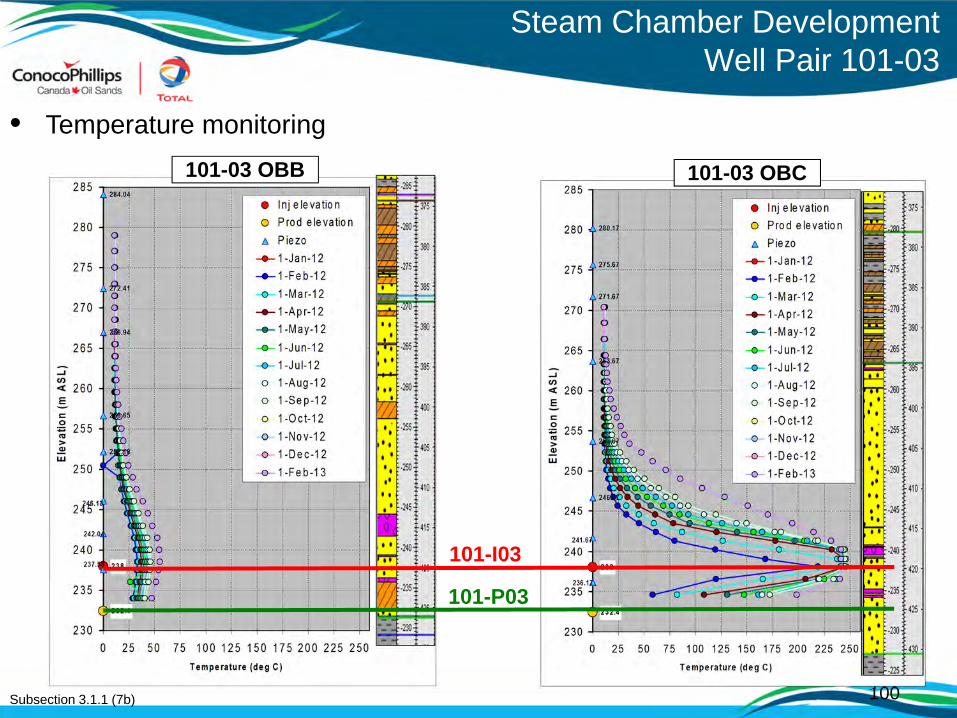
Steam Chamber DevelopmentWell Pair 101-03
Subsection 3.1.1 (7b) 100
• Temperature monitoring
101-I03
101-P03
101-03 OBB 101-03 OBC

Steam Chamber DevelopmentWell pair 101-03
Subsection 3.1.1 (7b) 101
• 4D seismic monitoring
101-03
Mc Murray
101-03-OBC101-03-OBB
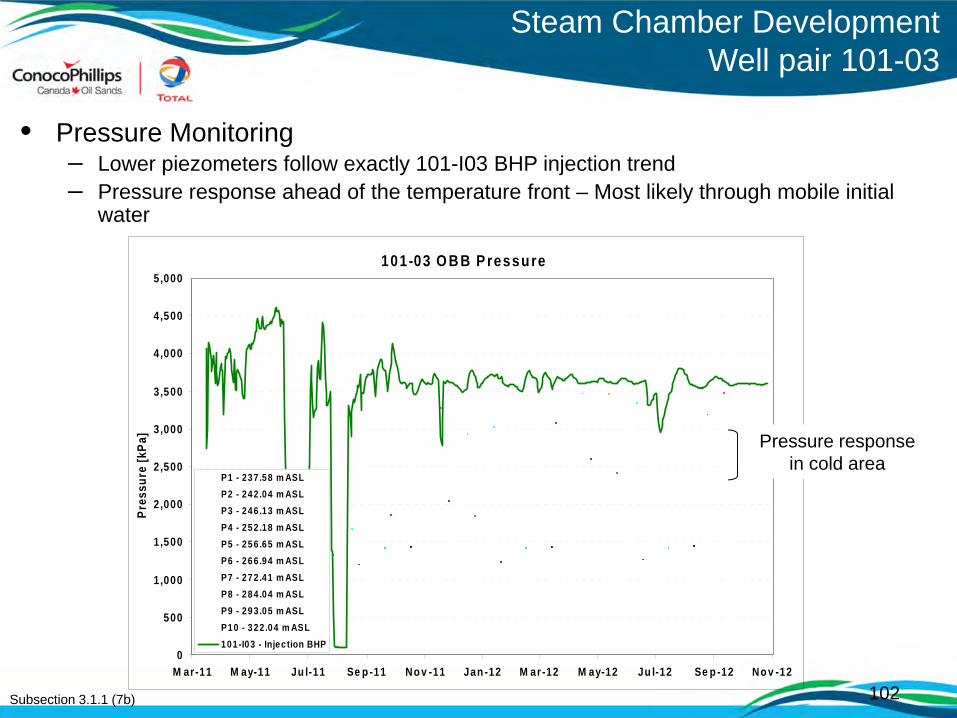
Subsection 3.1.1 (7b) 102
• Pressure Monitoring– Lower piezometers follow exactly 101-I03 BHP injection trend– Pressure response ahead of the temperature front – Most likely through mobile initial
water
101-03 O B B P ressu re
0
500
1,000
1,500
2,000
2,500
3,000
3,500
4,000
4,500
5,000
M ar-11 M ay-11 Ju l-11 Se p -11 No v -11 Jan -12 M ar-12 M ay-12 Ju l-12 Se p -12 No v -12
Pres
sure
[kPa
]
P1 - 23 7 .58 m ASLP2 - 24 2 .04 m ASLP3 - 24 6 .13 m ASLP4 - 25 2 .18 m ASLP5 - 25 6 .65 m ASLP6 - 26 6 .94 m ASLP7 - 27 2 .41 m ASLP8 - 28 4 .04 m ASLP9 - 29 3 .05 m ASLP10 - 3 22 .04 m ASL101-I03 - Injec tion BHP
Pressure response in cold area
Steam Chamber DevelopmentWell pair 101-03

103
OBIP and Recovery Factor
Subsection 3.1.1 (7c,i)
No change in 2012
NCB = producer to Vsh cutoff of 33%
Average porosity = 33%
Average So = 80%
OBIP = bulk volume x Φ x So
125 m
40 m
Minimized resource below producer

104
Recovery Factor vs Thief Zone Type
Top GasTop Water
Top Cont Bitumen
1 = No thief zone, highest recovery, 45%+
2 = Limited thief zone, medium recovery, 40%+
3 = Thief zone, lowest recovery, 30%+
Type 2 Type 1 Type 1Type 3
Pri = 1400-1800 kpa
Pri = 1000-1200 kpa
* Recoveries based on simulations and in-house proxy tool
Mud
Continuous Bitumen
Subsection 3.1.1 (7c,i)
No change in 2012

105
Pilot
Pad 101
Pad 102
Pilot and Phase 1 Polygons
OBIP = Thickness x Phi x So x AreaThickness = Calculated from the top of continuous bitumen to the producer depthArea = Polygons around each well pair of 125 m x length of lateral section
• Expected ultimate recovery dependent on blow down timing and operating strategy
OBIP and Recovery Factor Jan 31, 2013
Subsection 3.1.1 (7c,ii)
OBIP Avg Phi Avg So Expected Rf Cum Prod Current Rf(e3m3) % % % (e3m3) %
101N 7,856 32.8% 81.8% 45% 770 9.8%101S 8,853 33.6% 83.0% 45% 1,479 16.7%102N 7,058 33.1% 81.6% 45% 1,321 18.7%102S 7,296 31.7% 73.5% 45% 1,915 26.3%Pilot A 615 32.6% 82.2% 45% 225 36.6%Pilot B 592 32.5% 82.8% 55% 263 44.5%Pilot C 1,183 33.6% 85.8% N/A 91 7.7%Pilot A&B 1,207 32.6% 82.5% 50% 488 40.4%
Drainage area
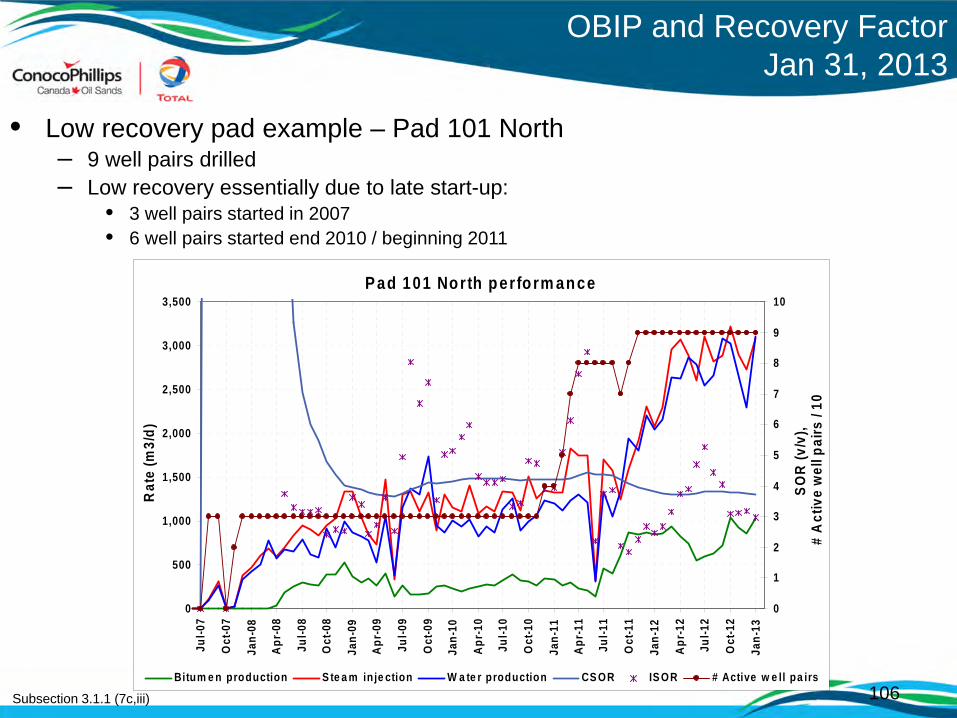
106
OBIP and Recovery Factor Jan 31, 2013
Subsection 3.1.1 (7c,iii)
• Low recovery pad example – Pad 101 North– 9 well pairs drilled– Low recovery essentially due to late start-up:
• 3 well pairs started in 2007• 6 well pairs started end 2010 / beginning 2011
P ad 101 North p erform ance
0
500
1,000
1,500
2,000
2,500
3,000
3,500
Jul-0
7
Oct
-07
Jan-
08
Apr-0
8
Jul-0
8
Oct
-08
Jan-
09
Apr-0
9
Jul-0
9
Oct
-09
Jan-
10
Apr-1
0
Jul-1
0
Oct
-10
Jan-
11
Apr-1
1
Jul-1
1
Oct
-11
Jan-
12
Apr-1
2
Jul-1
2
Oct
-12
Jan-
13
Rat
e (m
3/d)
0
1
2
3
4
5
6
7
8
9
10
SOR
(v/v
), #
Act
ive
wel
l pai
rs /
10
B itum e n production S te a m in je ction W a te r production CS OR IS OR # Active w e ll pa irs
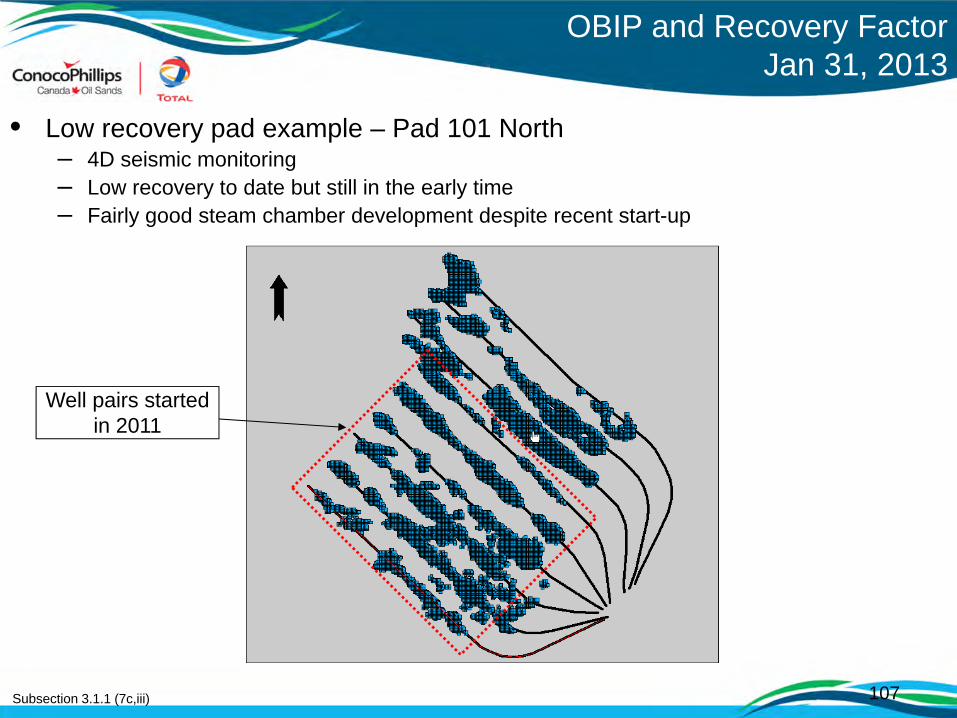
107
OBIP and Recovery Factor Jan 31, 2013
Subsection 3.1.1 (7c,iii)
• Low recovery pad example – Pad 101 North– 4D seismic monitoring– Low recovery to date but still in the early time– Fairly good steam chamber development despite recent start-up
Well pairs started in 2011
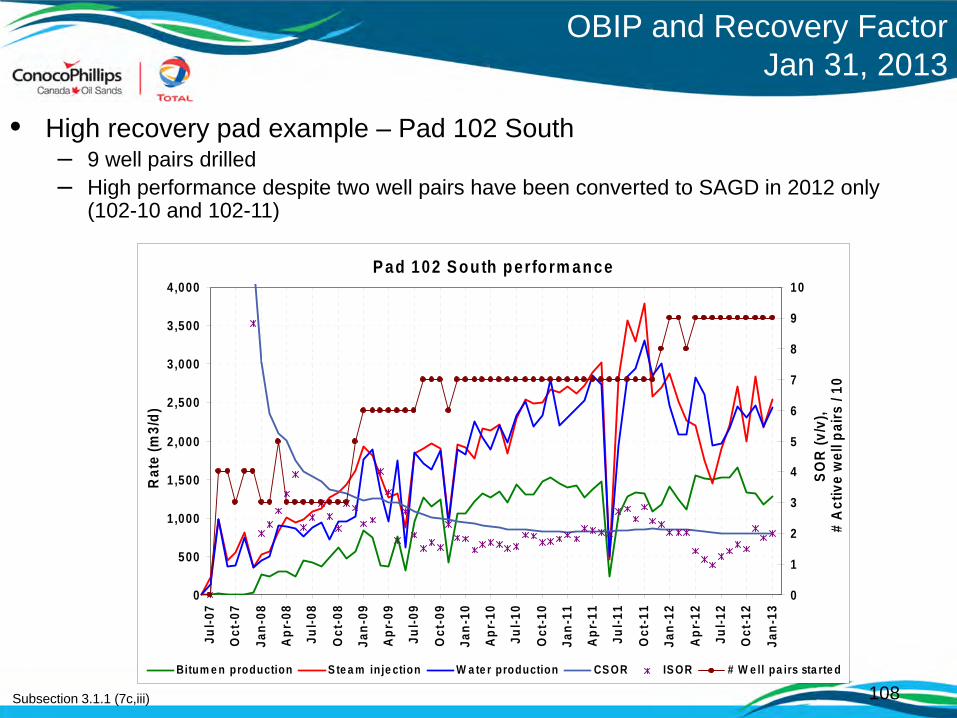
108
OBIP and Recovery Factor Jan 31, 2013
Subsection 3.1.1 (7c,iii)
• High recovery pad example – Pad 102 South– 9 well pairs drilled– High performance despite two well pairs have been converted to SAGD in 2012 only
(102-10 and 102-11)
P ad 102 S outh perfo rm ance
0
500
1,000
1,500
2,000
2,500
3,000
3,500
4,000
Jul-0
7
Oct
-07
Jan-
08
Apr
-08
Jul-0
8
Oct
-08
Jan-
09
Apr
-09
Jul-0
9
Oct
-09
Jan-
10
Apr
-10
Jul-1
0
Oct
-10
Jan-
11
Apr
-11
Jul-1
1
Oct
-11
Jan-
12
Apr
-12
Jul-1
2
Oct
-12
Jan-
13
Rat
e (m
3/d)
0
1
2
3
4
5
6
7
8
9
10
SOR
(v/v
), #
Act
ive
wel
l pai
rs /
10
B itum e n production S te a m in je ction W a te r production CS OR IS OR # W e ll pa irs sta rte d

109
OBIP and Recovery Factor Jan 31, 2013
Subsection 3.1.1 (7c,iii)
• High recovery pad example – Pad 102 South– 4D seismic monitoring – March 2012 monitor– Good steam chamber development over mature wells
Well pairs converted into
SAGD in 2012 –102-10 & 102-11
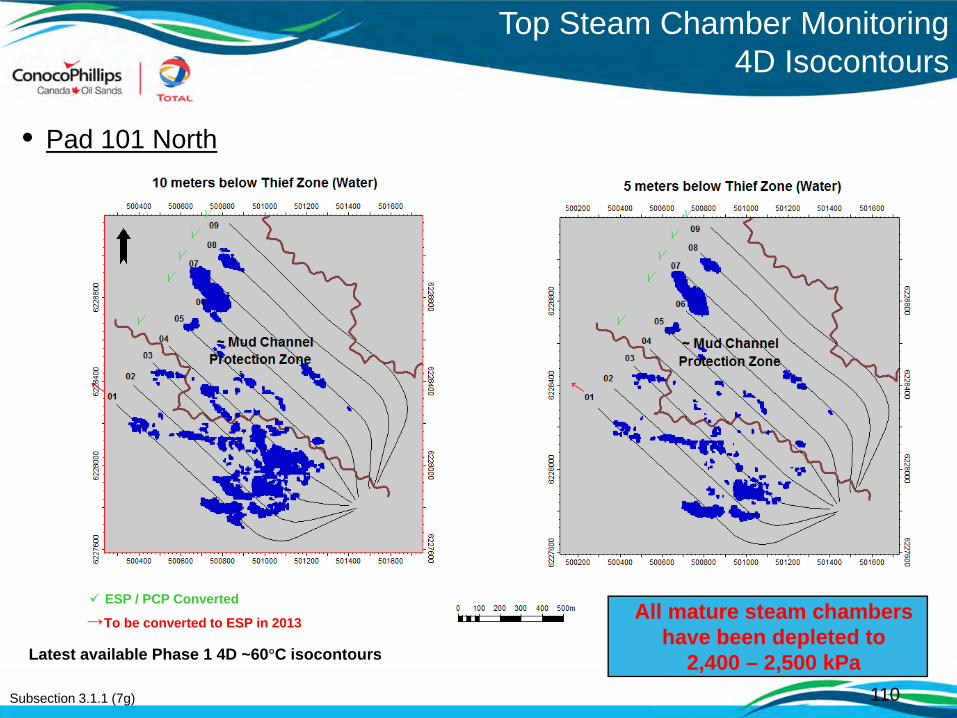
110
All mature steam chambers have been depleted to
2,400 – 2,500 kPaLatest available Phase 1 4D ~60°C isocontours
Subsection 3.1.1 (7g)
• Pad 101 North
ESP / PCP Converted
To be converted to ESP in 2013→
Top Steam Chamber Monitoring 4D Isocontours
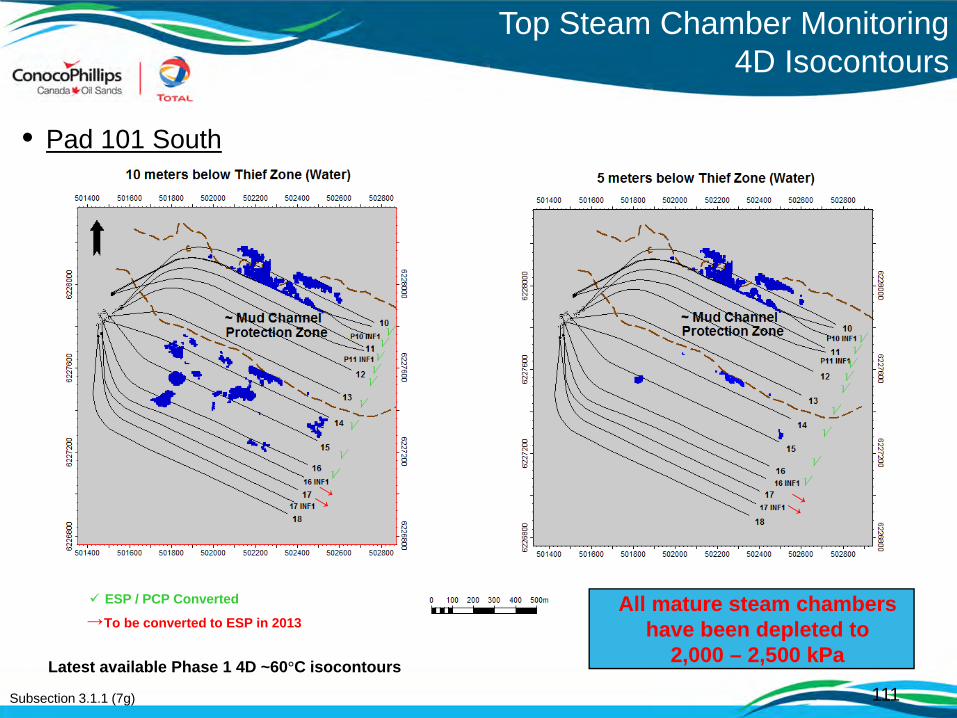
111Latest available Phase 1 4D ~60°C isocontours
Subsection 3.1.1 (7g)
All mature steam chambers have been depleted to
2,000 – 2,500 kPa
• Pad 101 South
ESP / PCP Converted
To be converted to ESP in 2013→
Top Steam Chamber Monitoring 4D Isocontours

112
Latest available Phase 1 4D ~60°C isocontours
Subsection 3.1.1 (7g)
All mature steam chambers have been depleted to
2,400 – 2,500 kPa
• Pad 102 North
ESP / PCP Converted
To be converted to ESP in 2013→
Top Steam Chamber Monitoring 4D Isocontours
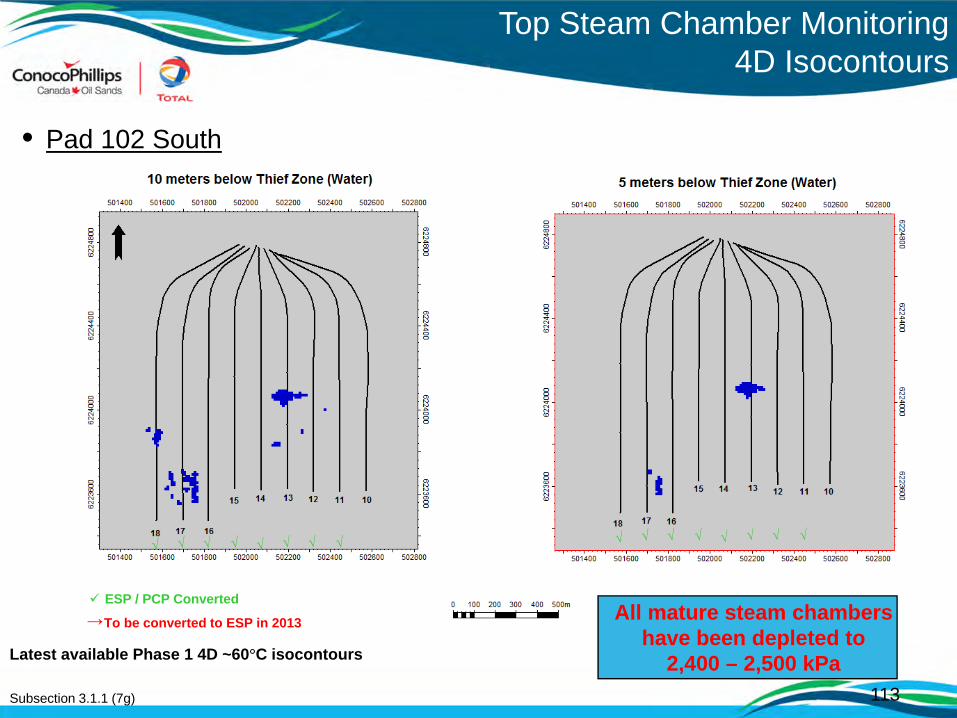
113
Latest available Phase 1 4D ~60°C isocontours
Subsection 3.1.1 (7g)
All mature steam chambers have been depleted to
2,400 – 2,500 kPa
• Pad 102 South
ESP / PCP Converted
To be converted to ESP in 2013→
Top Steam Chamber Monitoring 4D Isocontours
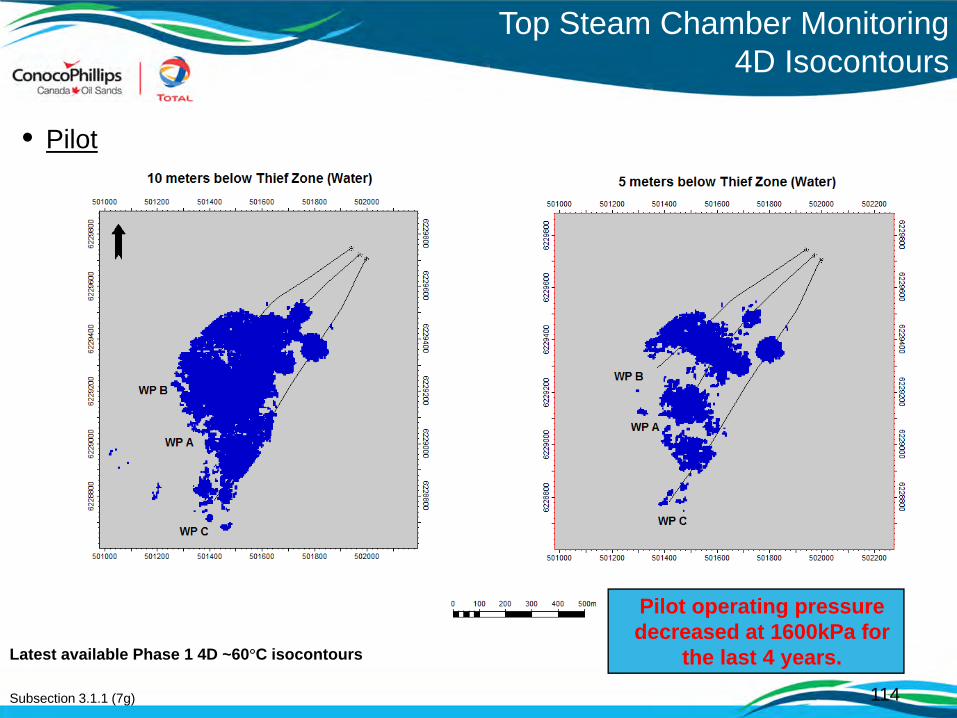
114
Latest available Phase 1 4D ~60°C isocontours
Subsection 3.1.1 (7g)
Pilot operating pressure decreased at 1600kPa for
the last 4 years.
• Pilot
Top Steam Chamber Monitoring 4D Isocontours
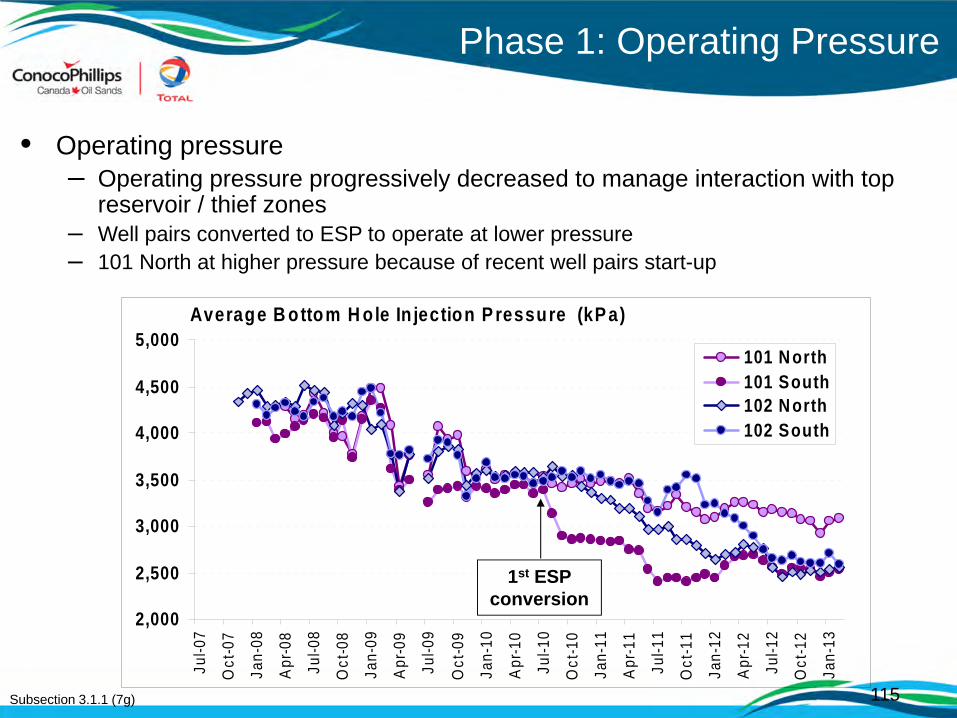
2,000
2,500
3,000
3,500
4,000
4,500
5,000
Jul-0
7
Oct
-07
Jan-
08
Apr
-08
Jul-0
8
Oct
-08
Jan-
09
Apr
-09
Jul-0
9
Oct
-09
Jan-
10
Apr
-10
Jul-1
0
Oct
-10
Jan-
11
Apr
-11
Jul-1
1
Oct
-11
Jan-
12
Apr
-12
Jul-1
2
Oct
-12
Jan-
13
101 N orth101 South102 N orth102 South
Average B ottom H ole In jection P ressure (kP a)
Phase 1: Operating Pressure
Subsection 3.1.1 (7g)
• Operating pressure– Operating pressure progressively decreased to manage interaction with top
reservoir / thief zones– Well pairs converted to ESP to operate at lower pressure– 101 North at higher pressure because of recent well pairs start-up
1st ESP conversion
115
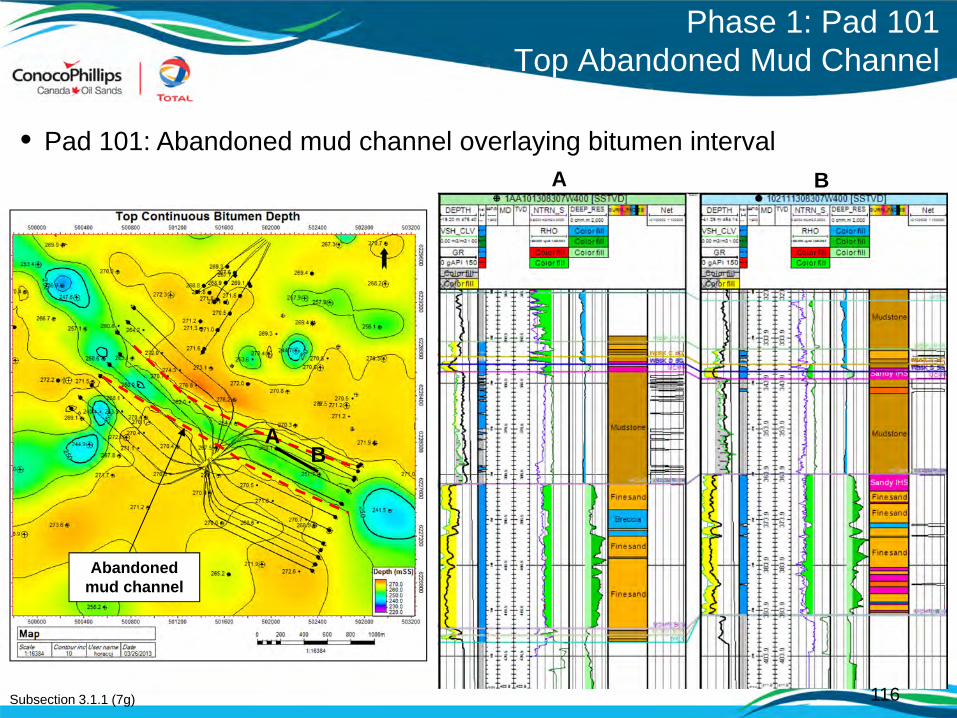
Phase 1: Pad 101 Top Abandoned Mud Channel
Subsection 3.1.1 (7g)
• Pad 101: Abandoned mud channel overlaying bitumen intervalA B
Abandoned mud channel
AB
116
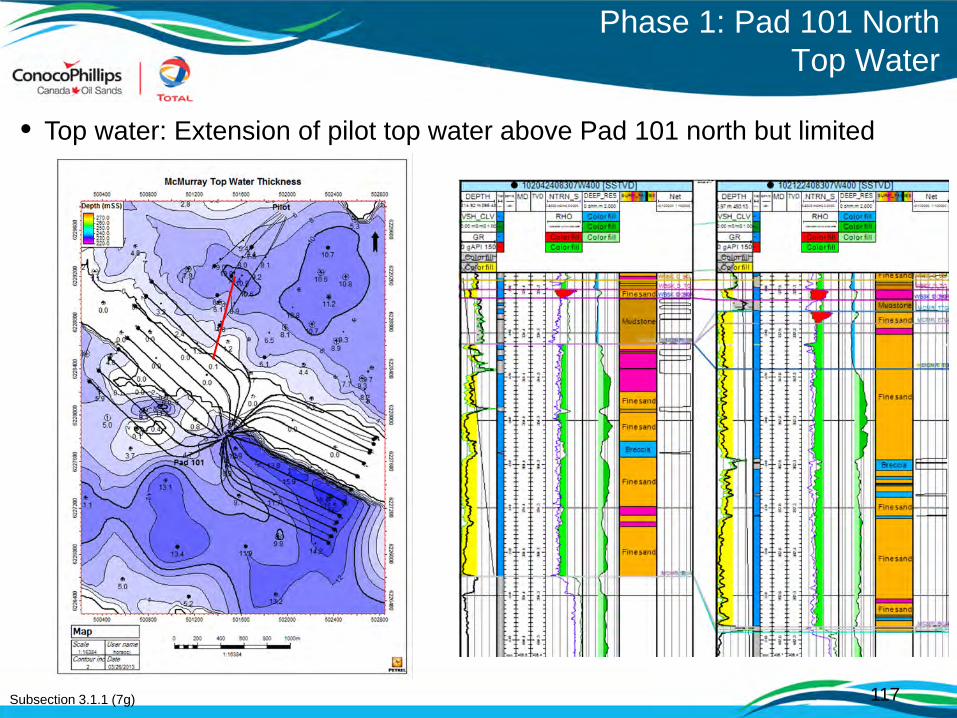
Phase 1: Pad 101 North Top Water
Subsection 3.1.1 (7g)
• Top water: Extension of pilot top water above Pad 101 north but limited
117
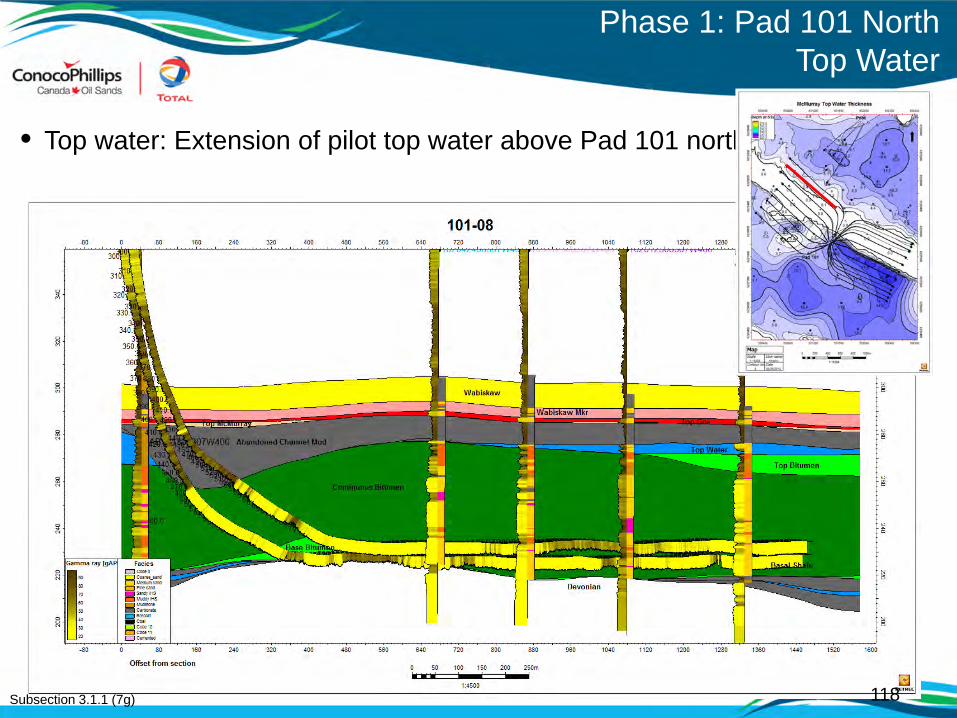
• Top water: Extension of pilot top water above Pad 101 north but limited
Phase 1: Pad 101 North Top Water
Subsection 3.1.1 (7g) 118
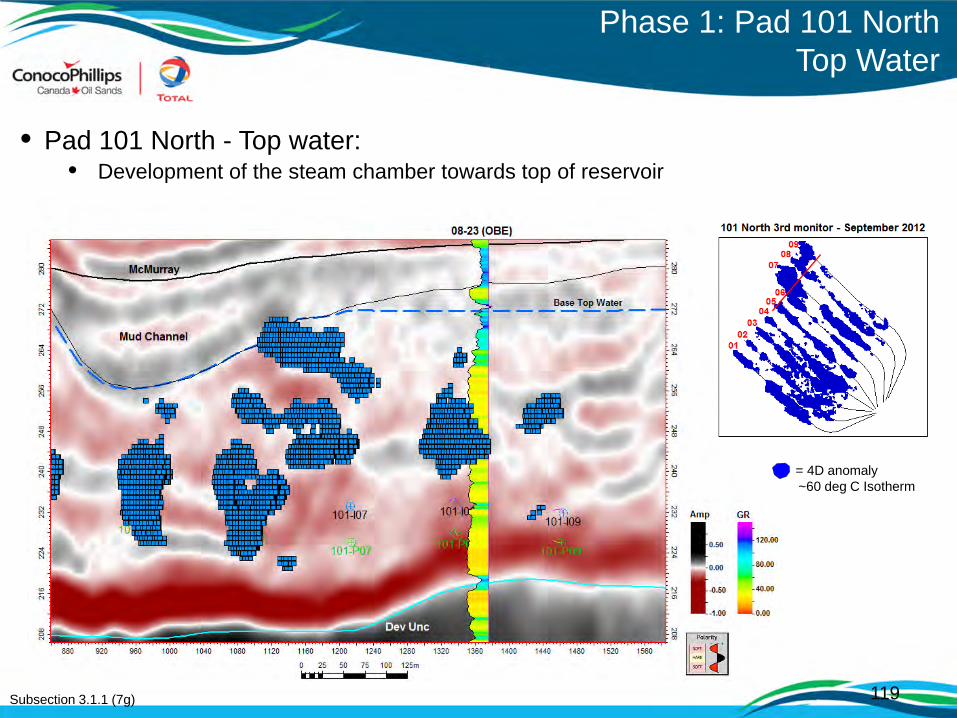
Subsection 3.1.1 (7g)
• Pad 101 North - Top water: • Development of the steam chamber towards top of reservoir
119
Phase 1: Pad 101 North Top Water
= 4D anomaly~60 deg C Isotherm

Phase 1: Pad 101 North Top Water
Subsection 3.1.1 (7g)
• Pad 101 North - Top water:
• Operating pressure decreased to manage interaction with top water and coalescence between well pairs
• Well performances not impaired by top water
Pad 101 North - 101-06 /07 /08 /09
0
200
400
600
800
1,000
1,200
1,400
1,600
1,800
Jul-0
7
Oct
-07
Jan-
08
Apr-0
8
Jul-0
8
Oct
-08
Jan-
09
Apr-0
9
Jul-0
9
Oct
-09
Jan-
10
Apr-1
0
Jul-1
0
Oct
-10
Jan-
11
Apr-1
1
Jul-1
1
Oct
-11
Jan-
12
Apr-1
2
Jul-1
2
Oct
-12
Jan-
13
Rat
e (m
3/d)
0
1
2
3
4
5
6
7
8
SOR
(v/v
), #
Wel
l pai
rs s
tarte
d / 1
0
B itum e n production S te a m inje ction W a te r production CS OR IS OR # Active W e ll pa irs
P ad 101 North - 101-06 /07 /08 /09
1,500
2,000
2,500
3,000
3,500
4,000
4,500
5,000
Jul-0
7
Oct
-07
Jan-
08
Apr
-08
Jul-0
8
Oct
-08
Jan-
09
Apr
-09
Jul-0
9
Oct
-09
Jan-
10
Apr
-10
Jul-1
0
Oct
-10
Jan-
11
Apr
-11
Jul-1
1
Oct
-11
Jan-
12
Apr
-12
Jul-1
2
Oct
-12
Jan-
13
BH
P In
ject
ion
(kPa
)
101-P 06 101-P 07 101-P 08 101-P 09
Flush production after 07/08/09 ESP
conversion
101-06 ESP conversion after steam chamber
coalescence
120

Subsection 3.1.1 (7g) 121M4 Oct 2010 M6 April 2012
Base Top Water
• Pad 101 South - Top abandoned mud channel: • Development of the steam chamber towards top of reservoir
Phase 1: Pad 101 South Top Abandoned Mud Channel
= 4D anomaly~60 deg C Isotherm

P ad 101 S ou th - 101-10 /11 /12 /13 /14
0
500
1,000
1,500
2,000
2,500
3,000
3,500
4,000
4,500
5,000
Jul-0
7
Oct
-07
Jan-
08
Apr-0
8
Jul-0
8
Oct
-08
Jan-
09
Apr-0
9
Jul-0
9
Oct
-09
Jan-
10
Apr-1
0
Jul-1
0
Oct
-10
Jan-
11
Apr-1
1
Jul-1
1
Oct
-11
Jan-
12
Apr-1
2
Jul-1
2
Oct
-12
Jan-
13
BH
P In
ject
ion
(kPa
)
101-P 10 101-P 11 101-P 12 101-P 13 101-P 14
Phase 1: Pad 101 SouthTop Abandoned Mud Channel
Subsection 3.1.1 (7g)
• Pad 101 South (101-10/11/12/13/14) - Performances
• June 2009: 101-12 steam chamber development up to the top reservoir. WP shut down.
• 101-12/13/14: ESP conversion on Aug/Sept 2010. Operating pressure decreased to manage interaction with top reservoir
• Stable performances since after ESP conversion.
101-12: Quick vertical development of steam
chamber – WP shut down101-12/13/14: ESP
conversion – Operating pressure decreased
101-10/11: ESP conversion – Operating pressure
decreased
P ad 101 S outh - 101-10 /11 /12 /13 /14 /21 /22
0
500
1,000
1,500
2,000
2,500
3,000
Jul-0
7
Oct
-07
Jan-
08
Apr-0
8
Jul-0
8
Oct
-08
Jan-
09
Apr-0
9
Jul-0
9
Oct
-09
Jan-
10
Apr-1
0
Jul-1
0
Oct
-10
Jan-
11
Apr-1
1
Jul-1
1
Oct
-11
Jan-
12
Apr-1
2
Jul-1
2
Oct
-12
Jan-
13
Rat
e (m
3/d)
0
1
2
3
4
5
6
7
8
SOR
(v/v
), #
Wel
l pai
rs s
tarte
d / 1
0
B itum e n production S te a m in je ction W a te r production CS OR IS OR # Active W e ll pa irs
122
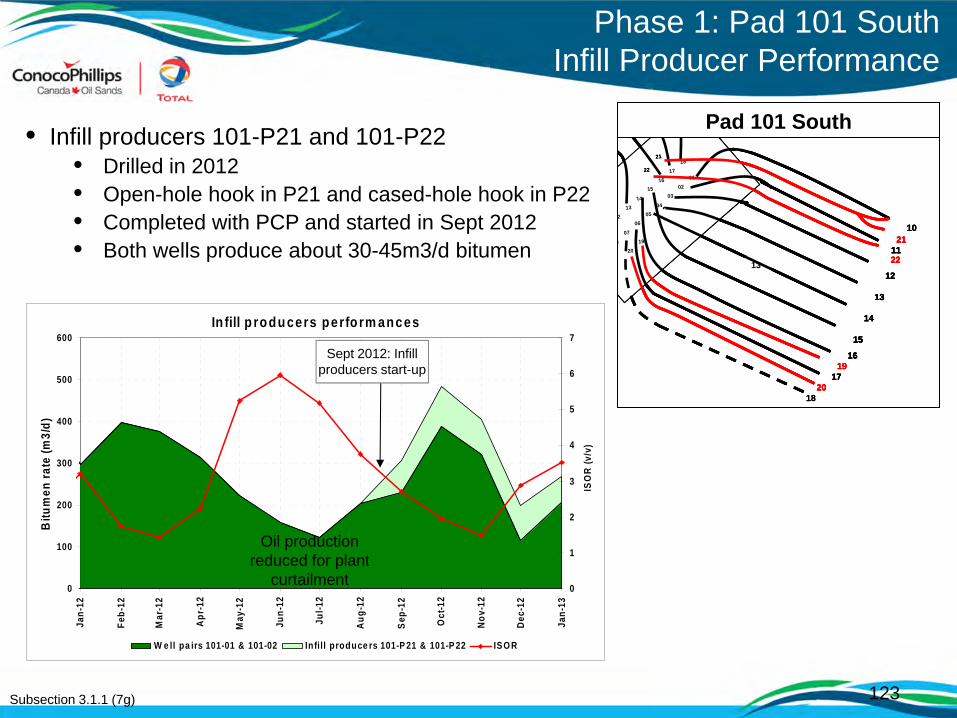
Phase 1: Pad 101 SouthInfill Producer Performance
Subsection 3.1.1 (7g)
• Infill producers 101-P21 and 101-P22• Drilled in 2012• Open-hole hook in P21 and cased-hole hook in P22• Completed with PCP and started in Sept 2012• Both wells produce about 30-45m3/d bitumen
In fill p rodu cers perform ances
0
100
200
300
400
500
600
Jan-
12
Feb-
12
Mar
-12
Apr-1
2
May
-12
Jun-
12
Jul-1
2
Aug-
12
Sep-
12
Oct
-12
Nov-
12
Dec-
12
Jan-
13
Bitu
men
rate
(m3/
d)
0
1
2
3
4
5
6
7
ISO
R (v
/v)
W e ll pa irs 101-01 & 101-02 Infill produce rs 101-P 21 & 101-P 22 IS OR
21
13
2017
1916
15
14
13
12
2211
108
07
03
0405
06
0201
2
1615
1413
1718
2019
22
21
18
21
13
2017
1916
15
14
13
12
2211
108
07
03
0405
06
0201
2
1615
1413
1718
2019
22
21
21
13
2017
1916
15
14
13
12
2211
108
07
03
0405
06
0201
2
1615
1413
1718
2019
22
21
21
13
2017
1916
15
14
13
12
2211
108
07
03
0405
06
0201
2
1615
1413
1718
2019
2019
22
21
22
21
18
Pad 101 South
21
13
2017
1916
15
14
13
12
2211
108
07
03
0405
06
0201
2
1615
1413
1718
2019
22
21
18
21
13
2017
1916
15
14
13
12
2211
108
07
03
0405
06
0201
2
1615
1413
1718
2019
22
21
21
13
2017
1916
15
14
13
12
2211
108
07
03
0405
06
0201
2
1615
1413
1718
2019
22
21
21
13
2017
1916
15
14
13
12
2211
108
07
03
0405
06
0201
2
1615
1413
1718
2019
2019
22
21
22
21
18
Pad 101 South
Sept 2012: Infill producers start-up
123
Oil production reduced for plant
curtailment
124
• Record well performances in 2012.
• Thief zone impact on scheme performance have been very limited so far. Progressive decrease of operating pressure enabled to minimize interaction with thief zones and to operate at stable SOR. This has been observed on Pilot and S1 (Pad 101 North especially).
• 4D seismic has been a key input for reservoir management:– To anticipate operating pressure decrease based on distance of the steam chamber
to the thief zone. Needed for ESP conversion plan.– To refine steam allocation toe / heel– To identify infill drilling opportunities
• Pilot and Phase 1 performances are continuously used to calibrate geological and reservoir models for production forecasts.
Key Reservoir and Operational Learnings Summary
Subsection 3.1.1 (7f)
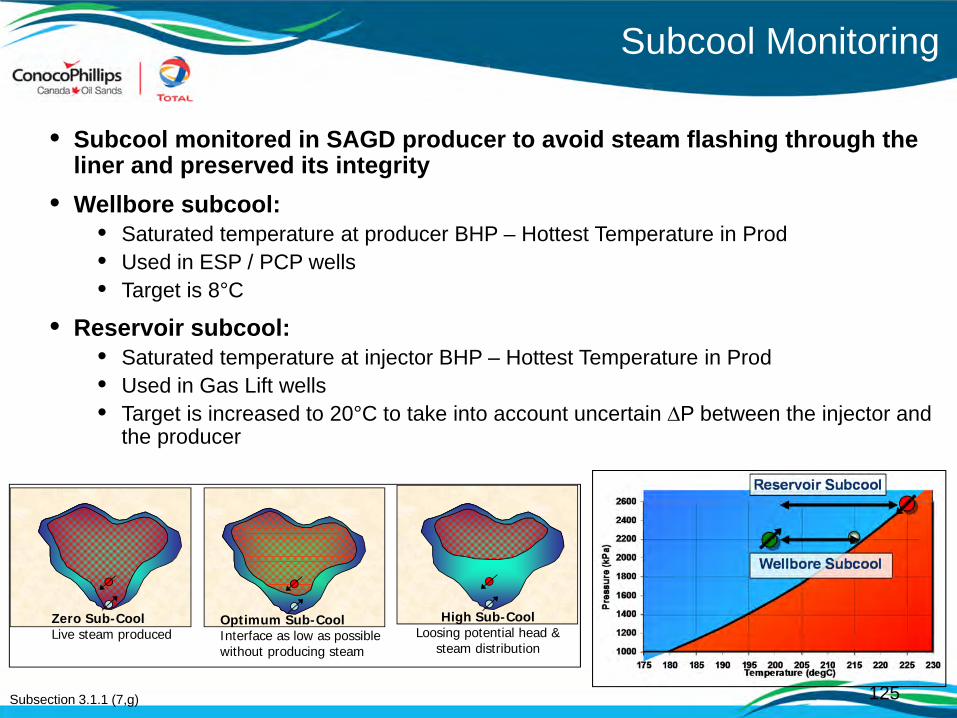
Subcool Monitoring
Subsection 3.1.1 (7,g)
• Subcool monitored in SAGD producer to avoid steam flashing through the liner and preserved its integrity
• Wellbore subcool:• Saturated temperature at producer BHP – Hottest Temperature in Prod• Used in ESP / PCP wells• Target is 8°C
• Reservoir subcool:• Saturated temperature at injector BHP – Hottest Temperature in Prod• Used in Gas Lift wells• Target is increased to 20°C to take into account uncertain ∆P between the injector and
the producer
125
Zero Sub-Cool Live steam produced
High Sub-Cool Loosing potential head &
steam distribution
Optimum Sub-CoolInterface as low as possiblewithout producing steam

Phase 1: Pad 101 North Performance
126Subsection 3.1.1 (7h)
101-
01 c
ircul
atio
n
101-
02 h
eel G
L re
loca
tion
101-
04 E
SP c
onv.
101-
06 E
SP c
onv.
101-
07 E
SP re
pair
101-
08 E
SP re
pair
101-
08 E
SP re
pair
OTS
G m
aint
enan
ce
0
500
1,000
1,500
2,000
2,500
3,000
3,500
4,000
4,500
Jan-
12
Feb-
12
Mar
-12
Apr
-12
May
-12
Jun-
12
Jul-1
2
Aug
-12
Sep-
12
Oct
-12
Nov
-12
Dec
-12
Jan-
13
Feb-
13
Rat
e (m
3/d)
-
2
4
6
8
10
12
SOR
(v/v
), #
Wel
l pai
rs s
tart
ed
B itumen production S team injection W ater production C S OR IS OR # W ell pair started
Imbalance between pads is affected by water-cut calibration
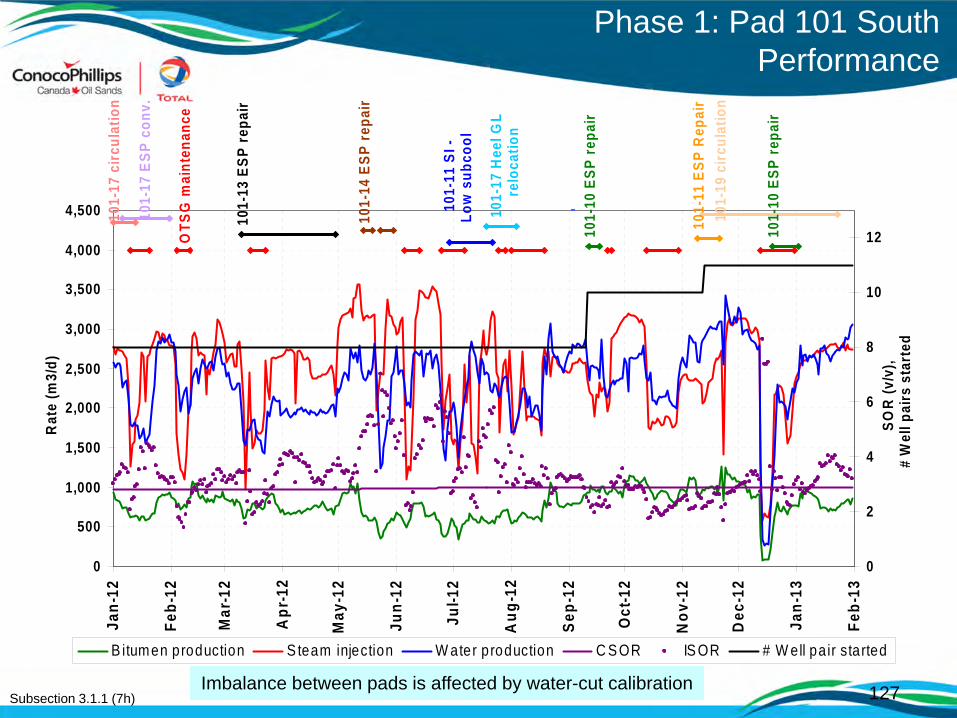
Phase 1: Pad 101 South Performance
127Subsection 3.1.1 (7h)
101-
10 E
SP re
pair
101-
10 E
SP re
pair
101-
11 S
I -
Low
sub
cool
101-
11 E
SP R
epai
r
101-
13 E
SP re
pair
101-
14 E
SP re
pair
101-
17 H
eel G
L re
loca
tion
OTS
G m
aint
enan
ce
101-
17 c
ircul
atio
n
101-
17 E
SP c
onv.
101-
19 c
ircul
atio
n
0
500
1,000
1,500
2,000
2,500
3,000
3,500
4,000
4,500
Jan-
12
Feb-
12
Mar
-12
Apr
-12
May
-12
Jun-
12
Jul-1
2
Aug
-12
Sep-
12
Oct
-12
Nov
-12
Dec
-12
Jan-
13
Feb-
13
Rat
e (m
3/d)
0
2
4
6
8
10
12
SOR
(v/v
), #
Wel
l pai
rs s
tart
ed
B itumen production S team injection W ater production C S OR IS OR # W ell pair started
Imbalance between pads is affected by water-cut calibration
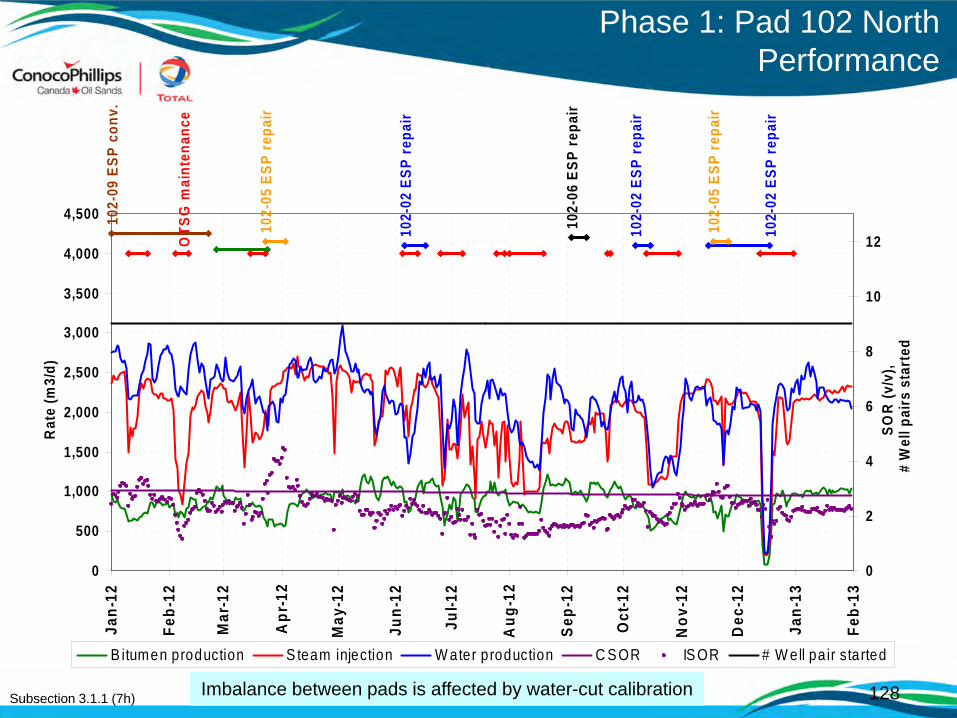
Phase 1: Pad 102 North Performance
128Subsection 3.1.1 (7h)
102-
02 E
SP re
pair
102-
02 E
SP re
pair
102-
02 E
SP re
pair
102-
05 E
SP re
pair
102-
05 E
SP re
pair
102-
06 E
SP re
pair
102-
09 E
SP c
onv.
OTS
G m
aint
enan
ce
0
500
1,000
1,500
2,000
2,500
3,000
3,500
4,000
4,500
Jan-
12
Feb-
12
Mar
-12
Apr
-12
May
-12
Jun-
12
Jul-1
2
Aug
-12
Sep-
12
Oct
-12
Nov
-12
Dec
-12
Jan-
13
Feb-
13
Rat
e (m
3/d)
0
2
4
6
8
10
12
SOR
(v/v
), #
Wel
l pai
rs s
tart
ed
B itumen production S team injection W ater production C S OR IS OR # W ell pa ir started
Imbalance between pads is affected by water-cut calibration
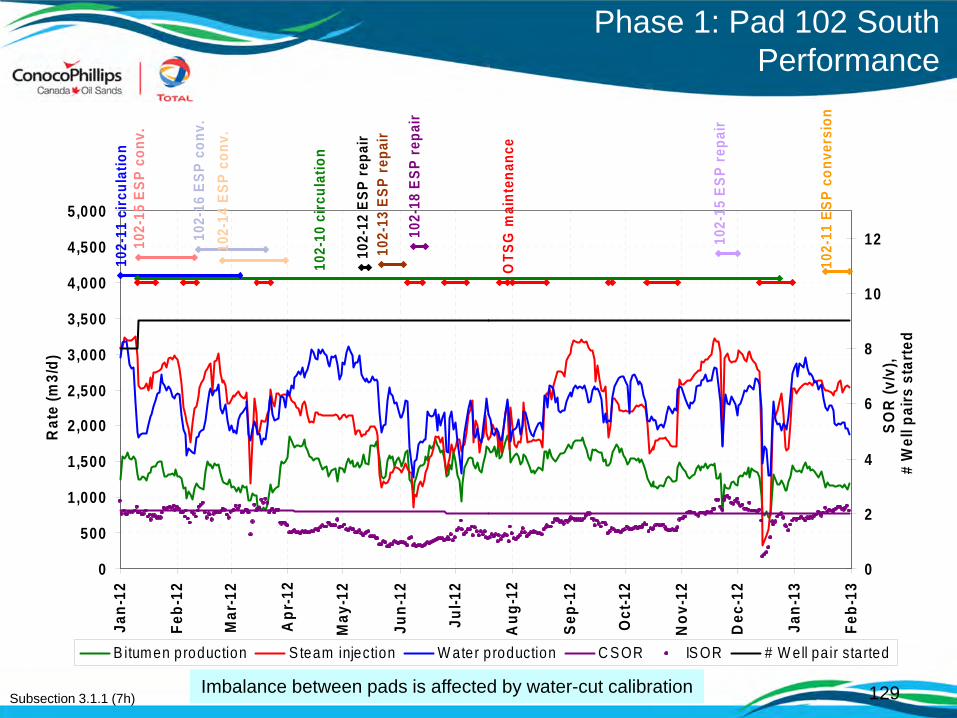
Phase 1: Pad 102 SouthPerformance
129Subsection 3.1.1 (7h)
102-
10 c
ircul
atio
n
102-
11 c
ircul
atio
n
102-
11 E
SP c
onve
rsio
n
102-
12 E
SP re
pair
102-
13 E
SP re
pair
OTS
G m
aint
enan
ce
102-
14 E
SP c
onv.
102-
15 E
SP c
onv.
102-
15 E
SP re
pair
102-
16 E
SP c
onv.
102-
18 E
SP re
pair
0
500
1,000
1,500
2,000
2,500
3,000
3,500
4,000
4,500
5,000
Jan-
12
Feb-
12
Mar
-12
Apr
-12
May
-12
Jun-
12
Jul-1
2
Aug
-12
Sep-
12
Oct
-12
Nov
-12
Dec
-12
Jan-
13
Feb-
13
Rat
e (m
3/d)
0
2
4
6
8
10
12
SOR
(v/v
), #
Wel
l pai
rs s
tarte
d
B itumen production S team injection W ater production C S OR IS OR # W ell pair started
Imbalance between pads is affected by water-cut calibration
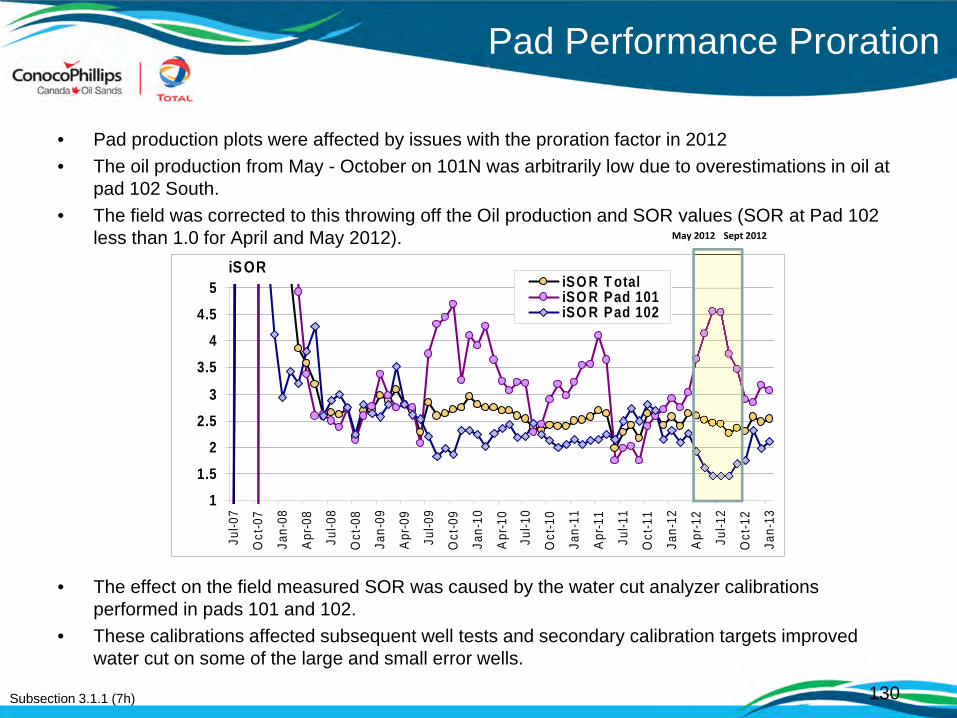
Pad Performance Proration
• Pad production plots were affected by issues with the proration factor in 2012• The oil production from May - October on 101N was arbitrarily low due to overestimations in oil at
pad 102 South. • The field was corrected to this throwing off the Oil production and SOR values (SOR at Pad 102
less than 1.0 for April and May 2012).
• The effect on the field measured SOR was caused by the water cut analyzer calibrations performed in pads 101 and 102.
• These calibrations affected subsequent well tests and secondary calibration targets improved water cut on some of the large and small error wells.
11.5
22.5
3
3.54
4.55
Jul-0
7
Oct
-07
Jan-
08
Apr
-08
Jul-0
8
Oct
-08
Jan-
09
Apr
-09
Jul-0
9
Oct
-09
Jan-
10
Apr
-10
Jul-1
0
Oct
-10
Jan-
11
Apr
-11
Jul-1
1
Oct
-11
Jan-
12
Apr
-12
Jul-1
2
Oct
-12
Jan-
13
iSO R T otaliSO R Pad 101iSO R Pad 102
iS OR
May 2012 Sept 2012
130Subsection 3.1.1 (7h)

131
Subsection 3.1.1 (8) Future Plans

132
Future Plans – Phase 1
• Continued research into OTSG fouling and OTSG runtime improvements based on reduced MP blowdown recycle field trial and other studies
• Evaluation of GT-OTSG; collect/analyze data• Validate performance of lateral hook on two infill producers in Pad 101 South• Operate eSAGD Pilot with solvent injection commencing in Jan. 2013 • CPF Debottleneck including one OTSG addition • Pad 101 infill program: received approval in Jan. 2013. Rig is scheduled to
commence drilling in April 2013. • The alternative start-ups on Pad 101, the solvent soak and dilation, were
recently applied for in this Month. Current plans are to conduct these tests in 3Q 2013.
• Pad 102 infill program application was issued in November 2012. The current timeline is that we would spud on Pad 102 in June, 2013
• Engineering for Partial Condensate usage for S1 and S2• Automation of EB/REB Chemical Injection• Heat integration improvement on diluent injection
Subsection 3.1.1 (8a, 8b)

Q1 Q2 Q3 Q4 Q1 Q2 Q3 Q4 Q1 Q2 Q3 Q4 Q1 Q2 Q3 Q4 Q1 Q2 Q3 Q4 Q1 Q2 Q3 Q4
Milestones
Drilling & Completions
Engineering
Procurement & Fabrication
Construction
2013 2014 20152010 2011 2012
Rig Procure / Construct Drilling and Completions
Detailed Engineering
Procurement and Fabrication
Site Preparation Construction
90% Complete
AFEDec 2009 1st Oil
Commissioning Start
1st Steam
• Continued focus on achieving world class safety and environmental performance
• Drilling complete on first pad • Drilling started on next 2 pads• Completions started on first pad• Engineering is 96% complete• Central Processing Facility
Construction 27% complete• Phased commissioning strategy
Subsection 3.1.1 (8a, 8b)
Future Plans – Phase 2
133