annualreport - lake cumberland district health department · pdf filedon wilkey, dvm clinton...
TRANSCRIPT

www.LCDHD.org I 1
annualreport
A Healthy Today fora Brighter Tomorrow.
2014-2015

2 I 2010-11 Annual Report2 I 2014-15 Annual Report
o u r l e a d e r s h i p 3 - 5 Message from District Board of Health Chair, 3 Message from LCDHD Director, 3 District Board of Health, 4 Local Boards of Health, 5
o u r f i n a n c e s 6 - 10 Administration Department - Leah Jasper, 6 Allowable Unrestricted Reserve Calculation, 6-8 Statement of Revenues/Expenditures, 9 Revenue and Expense Summary, 10
o u r s e r v i c e s 11 - 22 Diabetes - Jamie Lee, 11 Clinical Services - Laura Woodrum, 12 HANDS Program - Sylvia Ferrell, 13 Support Services - Melinda Copenhaver, 14 School Health Program - Beth Thomas, 14 Preparedness - Amy Tomlinson, 15 Medical Director - Christine Weyman, 16 Environmental - Stuart Spillman, 16-17 Health Promotion & Policy - Tracy Aaron, 18 Service and Patient Data, 19 - 22
inside
o u r q u a l i t y 23 - 30 Quality Improvement - Janae Tucker, 23 Patient Satisfaction Survey 2014, 23 - 27 Safety Management Program, 28 Utilization Review: Clinics, 29 - 30
o u r s t a f f 31 - 35 Human Resources - Pam Godby, 31 2015 Employees by County, 32 - 34 2015 Retirees, 35
o u r l o c a t i o n s 36 - 37 Adair County, 36 Casey County, 36 Clinton County, 36 Cumberland County, 36 Green County, 37 McCreary County, 37 Pulaski County, 37 Russell County, 37 Taylor County, 37 Wayne County, 37
A Healthy Today for a Brighter Tomorrow. w w w. LC D H D. o r g
Our MissionThe Lake Cumberland District Health Department will prevent illness and injury, promote good health practices, and assure a safe environment to protect and improve the health of our communities.
Our VisionThe Lake Cumberland District Health Department will be a progressive leader providing innovative solutions to achieve optimal health status for our communities.

www.LCDHD.org I 3
Evolution, innovation, shifting with the environment: all very exciting sounding words! Transformation,
though, is a much more pleasant experience when we do so because we want to, not because we have to change. While we have made some proactive changes, unfortunately, the down-turned economy has forced us to change in some ways that are challenging. We choose to move into Ryan White, Louisville Vitality, Passport EPSDT Outreach and Worksite Wellness. At the time of this writing, we are hiring our Ryan White staff. The Louisville Vitality project is churning – not only providing a positive community service, but also generating a surplus. The HANDS staff are performing the Passport EPSDT Outreach project, and, while it doesn’t generate a lot of revenues, it does more than cover its cost. We are in the middle of pilot testing our Worksite Wellness Program, hoping this will be an area of potential future growth. We have also made some changes we would rather not have. We changed our traditional model of school health, resulting in far fewer staff. While this is saving the agency a significant amount of money, it was difficult to change a program we spent multiple decades building and fine-tuning.
We are also seeing a shrinking of funds and staff in our clinical programs. Nevertheless, we continue to do well on programmatic and financial audits, patient satisfaction and employee satisfaction. In other words, the quality of the work we do, remains high. While we recognize employees desire a cost-of-living raise, we are thankful folks still like their jobs. Like most of you, I value my co-workers and our mission. We have been fortunate the last two fiscal years to have performed better financially than expected, ending with surpluses. Therefore, our reserve has grown now almost back to capacity. Hopefully, the million dollar annual negative funding hits will stop so we can truly stabilize our financial condition. Our preparations for accreditation have readied us for the impending PHAB site review. We expect to be accredited before next year’s Annual Report. I am approaching fifteen years with the Lake Cumberland District Health Department. Only seven of sixty-one Local Health Department Directors have served in that capacity longer than me. I have found my time in public health to be rewarding, fulfilling and enjoyable. I believe in the importance of our mission and continue to be impressed by the resilience of our staff. May God bless us all.
Shawn Crabtree MSSW, MPADirectorLake Cumberland DistrictHealth Department
From the director
www.LCDHD.org I 3
o u r l e a d e r s h i p
I have been honored and privileged to serve as Chairman of the Lake Cumberland District Board of Health in 2015. We have
experienced many changes and have faced many challenges not only this past year, but over the last several years. I commend our Board Members, Executive Leadership, Employees and Staff all, for the hard work and dedication that has been necessary
to keep Lake Cumberland District Health Department moving forward as our healthcare system continues to change around us daily. All involved are to be commended and everyone has adapted well to the necessary changes that have had to take place to keep our Health Department District successful in providing healthcare to the citizens of the Lake Cumberland Region.
Hon.John A. Phelps, Jr.ChairmanLake Cumberland DistrictHealth Department
From the district Board of Health Chair

4 I 2014-15 Annual Report
o u r l e a d e r s h i p
Adair County
Ronnie Grant Matt Jackson, RPh
Hon.Michael stephens
Adlie F. Brown, Jr., dMd
darin CundiffHon.Randy dial
Casey County
Clinton County
Hon.RichardArmstrong
Jake staton Hon.John Phelps, Jr.Chair
Gina Lee-Watson
Glenda BagbyHon.John Frank
Cumberland County Green County
McCreary County
sue singleton Rosalie Wright Hossein Fallahzadeh, MdVice Chair
Patty Guinn, RPh
Hon.steven Kelley
Pulaski County
Pulaski County
L. Bruce Jasper, dVM
James Wesley Richard Miles, Md
Hon.Gary d. Robertson
susanneWatkins, Od
Russell County
Taylor County
Marlene Richardson, dMd
Hon.Mike Anderson
Lora elam, Rn
Wayne County
Hon.eddie Rogers
Keith sinclair, Md
Hon.doug e.stephens
stephanie southard, Md
Gayle Phillips, APRn

LoCAL BoARDS oF HEALTH
Adair County
Hon. Michael StephensJanella Brown, DMDJacob Burton, oDMartha Anne Burton, MDBilly Coffey, FiscalCatherine Feese, MDRonnie GrantMatt Jackson, RPhLee Ann JesseeGary Partin, MDShantila Rexroat, DVMCynthia Waggener, RN
Casey County
Hon. Randy DialAdlie Brown, DMDDarin CundiffGina GoodeHousam Haddad, MDLinda Hamilton, FiscalHomer HechtKay King, RNLinda LeeJohn Price, MDTony PriceDon Wilkey, DVM
Clinton County
Hon. Richard ArmstrongJudith Brown, RNHeather Brown-Conner, oDSusan Cash, DMDCharles Dailey, DVMCarol DenneyLala HaddixFrances Hay, FiscalWilliam Powell, MDKent Shearer, RPhJake Staton, PE
www.LCDHD.org I 5
Cumberland County
Hon. John Phelps, Jr.Raymond ApplebyJanet ClarkBrian Dyer, DVMRobert Flowers, DoBetty LeeGina Lee-Watson, FiscalMary McCoyJoseph Michael Morgan, RPhJM Stephenson, DMDGary WhiteDouglas Williams
Green County
Hon. John FrankCharlie Allen, PEGlenda Bagby, RNPam BillsGarth Bobrowski, DMDDevi Bradshaw, FiscalTeresa Collison, RPhShane DeSimone, MDMary DeSpainPaul Patterson, oDMark Risen, MDR Michael Shuffett, DVM
McCreary County
Hon. Doug E. StephensJerald Burgess, MDAllan ChapmanAzalie EgnewTammie Emerson JohnsonTerry Allan LawsonStephen McKinley, oDJohn Sandidge, RPhSue Singleton, FiscalGrady WilsonRita WrightRosalie Wright
2015
The Lake Cumberland District Health Department is governed by a 30-member District Board of Health with representation from each county’s local board of health. The board is comprised of county judge executives, physicians, nurses, dentists, veterinarians, engineers, optometrists and citizen members, who are all pictured on the previous page. The following list is all the members of each county’s local board of health within the Lake Cumberland District.
Pulaski County
Hon. Steven KelleyReginald Chaney, PERodney Dick, FiscalHossein Fallahzadeh, MDPatty Guinn, RPhBruce Jasper, DVMJim Muse, DMDHarvey Schleter, oDKeith Sinclair, MDGerard Weigel, MDJames WesleyRebecca Whitis, RN
Russell County
Hon. Gary D. RobertsonRobert Bertram, MDConnie BlankenshipDon CooperKaren Dalton, RNCharles L. Gore, RPhStephanie Jones, MDRichard Miles, MDH. James Popplewell, DMDTerry Waddell, FiscalC. Leslie Wade, DVMSusanne Watkins, oD
Taylor County
Hon. Eddie RogersDonald Dabney, PEJerome Dixon, MDJay Eastridge, RPhArthur Haley, oDLoretta HashPhilip Hays, DVMDavid Hesson, MDGayle Phillips, FiscalMarlene Richardson, DMDThomas Rogers, MD
Wayne County
Hon. Mike AndersonWilliam Breeding, DMDSarah Debord, APRNJeffery Dishman, FiscalVesta EdwardsLora Elam, RNRonald McFarland, MDKenneth RamseyJames Sawyer, oDJoe Silvers, RPhStephanie Southard, MDJames Upchurch, PE
Casey
Pulaski
Wayne
Clinton
Cumberland
Adair
Russell
TaylorGreen
McCreary
o u r l e a d e r s h i p

6 I 2014-15 Annual Report
o u r f i n a n c e s
Lake Cumberland District Health Department’s (LCDHD) Administrative Services Department
recognized improved efficiencies by managing a challenging financial year in which we had budgeted a 1.39M deficit. Instead of ending the year with a deficit, over the course of the year, as the agency reduced expenditures, primarily in salaries, fringe, and contracts, we ended the year with a $511,524 surplus, with revenues decreasing by 5% ($872,875) over last year ’s, while expenses increased by 1% ($88,112) over last year ’s. At the end of the fiscal year, after adding in that surplus, our fund balance, which includes restricted and unrestricted funds, totaled $5,905,637 The Administrative Services Department is also pleased to report we received our annual audit conducted by Ray, Foley, Hensley & Company which included no proposed audit adjustments or reportable findings. Additionally, they found the financial statements to be neutral, consistent, and clear.
Although the administrative tasks required in processing Medicaid claims continues to grow more complex with the five different Medicaid Managed Care Organizations administering the claims for the Medicaid Program, the Administrative Services team continues to manage the work load with no new staff members by being proactive in searching for efficiencies by Quality Improvement efforts as we endeavor to support the mission of LCDHD and Public Health. During the 2015 Fiscal Year, the Administrative Team conducted several documented quality improvement projects which were successful efforts to find ways to perform the same tasks, but in less time. As the health departments’ role continues to evolve as a Public Health Partner in the larger picture of the Patient Protection and Affordable Care Act, the Administrative Services Department is committed to a transparent working environment that’s constantly seeking improvement while maintaining high standards.
Leah Jasper,BBADirector of Administrative Services
Administration department
Allowable Unrestricted Reserve Calculation As of Period Ending June 30, 2015
Cost Center CC# expenseservice
Feesservice Fee % of
Total expensenon-Fee
Program expenseFee for service
Program expense
Food Service 500 310,152 1,305 0.42% 310,152 0
Public Facilities 520 90,277 9,622 10.66% 90,277 0
General Sanitation 540 160,887 0 0.00% 160,887 0
onsite Sewage 560 364,733 229,890 63.03% 0 364,733
Tanning Beds 580 0 0 100.00% 0 0
other Environmental 590 5,753 0 0.00% 5,753 0
Radon 591 0 0 100.00% 0 0
West Nile Virus 595 0 0 100.00% 0 0
Winter Storm Response 598 0 0 100.00% 0 0
Winter Storm Resp-Local 599 0 0 100.00% 0 0
Dental Services 712 16,937 14,637 86.42% 0 16,937
Asthma Education 722 21,243 0 0.00% 21,243 0
osteoporosis 723 0 0 100.00% 0 0
UK HPV 727 0 0 100.00% 0 0
PHER 726 0 0 100.00% 0 0
Diabetes Case Management 728 7 0 0.00% 7 0
ESVAR-VHP 729 0 0 100.00% 0 0
Ebola Coordination 731 12,918 0 0.00% 12,918 0
Diabetes Prevention Program 732 19,138 16,759 87.57% 0 19,138

www.LCDHD.org I 7
Allowable Unrestricted Reserve Calculation (cont.)
Cost Center CC# expense service Fees service Fee % of Total expense
non-Fee Program expense
Fee for service Program expense
o u r f i n a n c e s
oral Health Coalitions 735 0 0 100.00% 0 0
Community Health Action Team 736 102,694 0 0.00% 102,694 0
KCCSP outreach & Education 738 10,350 0 0.00% 10,350 0
Coordinated School Health 740 0 0 0.00% 0 0
Passport Referrals 741 869 1,587 182.61% 0 869
Winter Storm 745 1,148 0 0.00% 1,148 0
Environmental Strike Team 746 104 0 0.00% 104 0
KHREF 747 332 332 100.00% 0 0
IEP School Services 748 0 0 100.00% 0 0
HPP Training Coordinator 749 0 0 100.00% 0 0
Accreditation 750 54,917 0 0.00% 54,917 0
PHEP Special Project 753 0 0 100.00% 0 0
PREP Reducing the Risk 756 62,991 0 0.00% 62,991 0
Regional EPI 757 6,957 0 0.00% 6,957 0
Humana Vitality 758 170,047 263,615 155.03% 0 170,047
Regional Preparedness Coord 759 28 0 0.00% 28 0
Smiling Schools Program 762 0 0 100.00% 0 0
Tobacco Free Schools 765 17,271 0 0.00% 17,271 0
MCH Coordinator 766 7,831 0 0.00% 7,831 0
HANDS Expanded Multi-Gravida Families 767 1,050,019 0 0.00% 1,050,019 0
HANDS Expansion/outreach 768 71,017 0 0.00% 71,017 0
Kentucky Colon Cancer Screening Project 770 26,122 0 0.00% 26,122 0
PHEP Special Project` 771 33,262 0 0.00% 33,262 0
HBE Assistance 772 70,916 0 0.00% 70,916 0
Child Fatality Prevention 774 685 0 0.00% 685 0
Pediatric/Adolescent 800 1,140,591 421,166 36.93% 1,140,591 0
Immunizations 801 0 0 100.00% 0 0
Family Planning 802 726,920 261,440 35.97% 726,920 0
Maternity Services 803 536,647 203,194 37.86% 536,647 0
WIC Services 804 1,855,248 0 0.00% 1,855,248 0
Medical Nutrition 805 102,089 11,660 11.42% 102,089 0
Tuberculosis 806 298,801 72,747 24.35% 298,801 0
STD Services 807 149,111 47,045 31.55% 149,111 0
Diabetes 809 239,367 755 0.32% 239,367 0
Adult Services 810 237,714 54,558 22.95% 237,714 0
Breast & Cervical Cancer 813 250,323 57,532 22.98% 250,323 0
MCH Forum 816 0 0 100.00% 0 0
Healthy Communities - Tobacco 817 350 0 0.00% 350 0
Community Based Services 818 14 0 0.00% 14 0
Bioterrorism - Focus Area A 821 77,607 0 0.00% 77,607 0
Bioterrorism - Focus Area B 822 70,152 0 0.00% 70,152 0
Bioterrorism - Focus Area E 823 9,925 3,655 36.82% 9,925 0
Bioterrorism - Focus Area F 824 0 0 100.00% 0 0
Bioterrorism - Focus Area G 825 0 0 100.00% 0 0
Merck HPV Study 826 1,700 26,292 1,546.61% 0 1,700

Multiplier for Allowed Unrestricted Reserve 30% 40%Allowed Unrestricted Reserve 2,841,938 2,729,019Allowed Non-Service Fee Restricted Reserves (30% of Total Non-Service Fee Expenses) 2,841,938Allowed Service Fee Restricted Reserves (40% of Total Service Fee Expenses) 2,729,019Total Allowed Unrestricted Reserve $5,570,957.63Fiscal Year End Actual Unrestricted Reserve 5,202,260.30Remaining Allowable Unrestricted Reserve 368,697
Allowable Unrestricted Reserve Calculation (cont.)
description FY2014 FY2015
Current Unrestricted Reserve $5,491,431.70 100% $5,570,957.63 100%
Fiscal Year End Actual Unrestricted Reserve 4,907,890.95 89% 5,202,260.30 93%
Remaining Allowable Unrestricted Reserve $583,540.75 11% $368,697.33 7%
Total Program Restricted Reserves $486,221.99 $703,377.06
Total Reserves $5,394,112.94 $5,905,637.36
U of L Social Media, Teen Moms and PPD 827 142 1,200 843.41% 0 142
Diabetes outreach and Education 828 163,205 0 0.00% 163,205 0
Title III Geriatric Program 829 40,138 40,138 100.00% 0 40,138
Community Cancer Coalition 830 0 0 100.00% 0 0
Worksite Wellness Project 831 8,329 0 0.00% 8,329 0
Heart Disease & Stroke Prevention 832 34,439 0 0.00% 34,439 0
Breastfeeding 833 44,294 0 0.00% 44,294 0
UK Research Cancer F/U 834 0 0 100.00% 0 0
Cervical Cancer Free KY 835 5,294 10,000 188.91% 0 5,294
Tobacco Prevention Project 836 87,532 1,546 1.77% 87,532 0
Abstinence Education 837 0 0 100.00% 0 0
HAI Prevention (Infec. Prev. Conf) 838 0 0 100.00% 0 0
Marshall Univ. Diabetes Grant 839 74 7,397 10,013.20% 0 74
Breastfeeding Peer Counselor 840 56,918 0 0.00% 56,918 0
Federal Diabetes Today 841 46,651 0 0.00% 46,651 0
HIV Counseling & Testing 842 2,413 0 0.00% 2,413 0
Healthy Start Project 848 51,269 0 0.00% 51,269 0
Pandemic Flu Summit 851 0 0 100.00% 0 0
HANDS Project 853 1,996,393 1,931,652 96.76% 0 1,996,393
Arthritis 856 9,197 0 0.00% 9,197 0
Physical Activity 857 27 0 0.00% 27 0
Supplemental School Health 858 3,291,965 3,291,965 100.00% 0 3,291,965
MRC - ASPR Training 871 0 0 100.00% 0 0
TLC - obesity Grant 872 527 0 0.00% 527 0
HPP Coordinators 875 25,388 0 0.00% 25,388 0
EPSDT Verbal Notification 883 18,519 16,494 89.06% 0 18,519
Core Assessment & Policy Dev. 890 17,441 4,299 24.65% 17,441 0
Medicaid Match 891 896,267 566,178 63.17% 0 896,267
Minor Receipts 892 0 0 100.00% 0 0
Capital 894 0 0 100.00% 0 0
Allocable Direct 895 1,113,093 7,382 0.66% 1,113,093 0
Total 16,295,676 7,576,041 46.49% 9,473,127 6,822,549
Cost Center CC# expense service Fees service Fee % of Total expense
non-Fee Program expense
Fee for service Program expense
8 I 2014-15 Annual Report
o u r f i n a n c e s
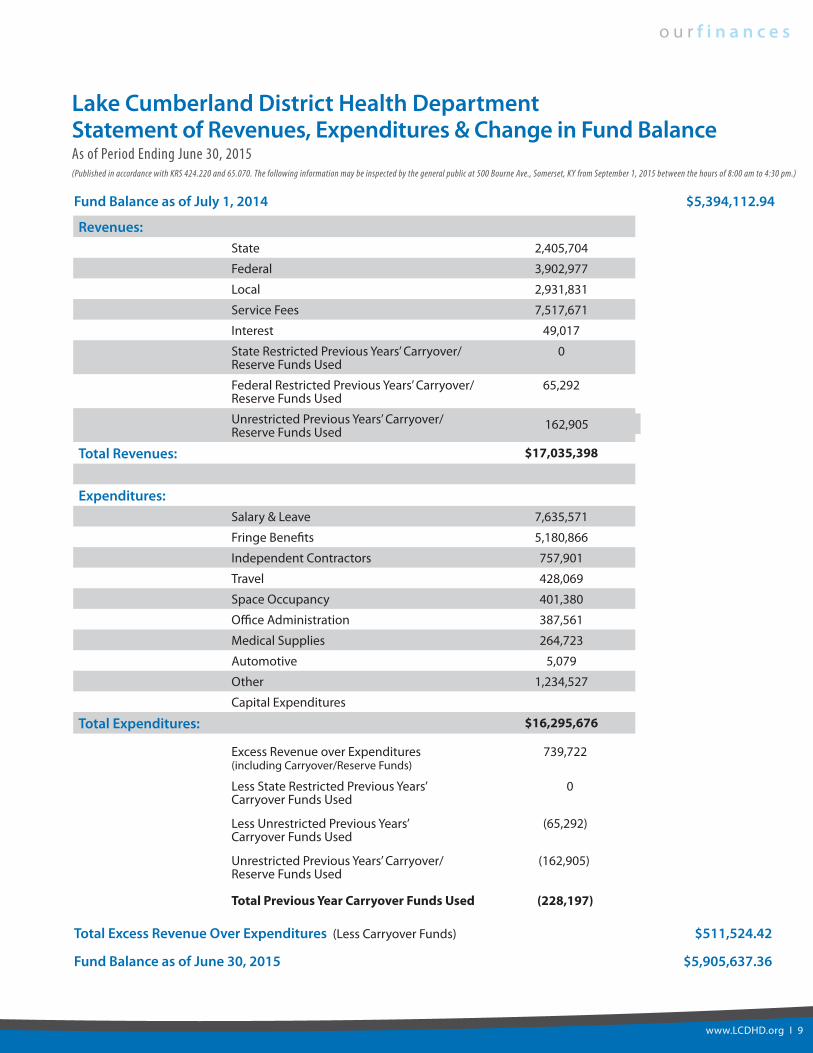
Lake Cumberland district Health department statement of Revenues, expenditures & Change in Fund BalanceAs of Period Ending June 30, 2015
www.LCDHD.org I 9
o u r f i n a n c e s
(Published in accordance with KRS 424.220 and 65.070. The following information may be inspected by the general public at 500 Bourne Ave., Somerset, KY from September 1, 2015 between the hours of 8:00 am to 4:30 pm.)
Revenues:State 2,405,704
Federal 3,902,977
Local 2,931,831
Service Fees 7,517,671
Interest 49,017
State Restricted Previous Years’ Carryover/Reserve Funds Used
0
Federal Restricted Previous Years’ Carryover/Reserve Funds Used
65,292
Unrestricted Previous Years’ Carryover/Reserve Funds Used 162,905
Total Revenues: $17,035,398
expenditures:Salary & Leave 7,635,571
Fringe Benefits 5,180,866
Independent Contractors 757,901
Travel 428,069
Space occupancy 401,380
office Administration 387,561
Medical Supplies 264,723
Automotive 5,079
other 1,234,527
Capital Expenditures
Total expenditures: $16,295,676
Fund Balance as of July 1, 2014 $5,394,112.94
Total excess Revenue Over expenditures (Less Carryover Funds) $511,524.42
Fund Balance as of June 30, 2015 $5,905,637.36
Excess Revenue over Expenditures 739,722(including Carryover/Reserve Funds)
Less State Restricted Previous Years’ 0Carryover Funds Used
Less Unrestricted Previous Years’ (65,292)Carryover Funds Used
Unrestricted Previous Years’ Carryover/ (162,905)Reserve Funds Used
Total Previous Year Carryover Funds Used (228,197)

10 I 2010-11 Annual Report10 I 2014-15 Annual Report
Current YTd Actual Prior YTd Actual Change % ChangeRevenue
State 2,405,704 2,542,356 (136,653) -5%
Federal 3,902,977 3,965,031 (62,053) -2%
Local 2,931,831 2,918,726 13,105 0%
Service Fees 7,566,689 7,670,889 (104,201) -1%
Restricted Reserves 65,292 230,001 (164,709) -72%
Unrestricted Reserves 162,905 581,269 (418,364) -72%
Total Revenue 17,035,398 17,908,273 (872,875) -5%
expenseSalary & Leave 7,635,571 8,179,030 (543,459) -7%
Fringe Benefits 5,180,866 4,569,510 611,355 13%
Independent Contractors 757,901 653,308 104,593 16%
Travel 428,069 411,709 16,630 4%
Space occupancy 401,380 391,539 9,840 3%
office Administration 387,561 385,698 1,863 0%
Medical Supplies 264,723 283,959 (19,236) -7%
Automotive 5,079 7,882 (2,803) -36%
other 1,234,527 1,319,479 (84,952) -6%
Capital Expenditures 5,450 (5,450)
Total Expense 16,295,676 16,207,564 88,112 1%
excess/(deficit) of Revenueover expense
739,722 1,700,708 (960,987) -57%
Less Restricted and UnrestrictedReserves Utilized
(228,197) (811,270) 583,073 -72%
Actual Cash surplus/(deficit) 511,524 889,438 (377,914) -42%
Lake Cumberland district Health department Revenue and expense summary Comparison to Prior YearAs of Period Ending June 30, 2015
o u r f i n a n c e s

www.LCDHD.org I 11www.LCDHD.org I 11
o u r s e r v i c e s
The Diabetes Education Program has been busy this year providing educational displays and materials
at health fairs, community events, and worksites, as well as educating the LCDHD community about diabetes via radio talk shows, payroll stuffers, and newspaper articles. Diabetes education was provided throughout the district with our AADE accredited self-management classes plus supplemental classes and support groups. Team members have actively participated in local health coalitions and the Kentucky Diabetes Network on the state level.
We have started a new program, the LIFE CHANGE diabetes prevention program, in Adair, Casey, and Clinton Counties with great success. This year-long program has proven to reduce the risk of type 2 diabetes by 58% and is a covered benefit for eligible members of the Kentucky Employees’ Health Plan (KEHP). We plan to expand this program in the coming year. The STITCH Worksite Wellness program (funded by the three-year HSRA grant for diabetes prevention work-site wellness activities in Wayne and Clinton Counties at Patriot Industries) concluded this year with a total of 469 employees participating in some aspect of the project. Valuable lessons were learned from this
project that can be used as we develop and expand the worksite wellness activities in our district. At the beginning of 2015 LCDHD began a partnership with Humana Vitality to provide the Vitality Checks in Jefferson County for KEHP members. Contract staff was secured and screenings began early March. This venture has proven to be cost-effective and we hope to not only continue, but to expand this program next fiscal year. Additionally, diabetes team members began providing Vitality Checks for community KEHP members in the district.
The LCDHD Diabetes Education Program has adapted to the ever-changing needs and funding in public health. As we conclude this fiscal year we see that our program has expanded to cover not only diabetes prevention and education, but to include Vitality Checks and Worksite Wellness activities. So, we have changed our name to reflect our new roles –Wellness Outreach and Education. Our name has
changed, but not our goals as we continue to strive to make our community healthier.
Jamie Lee, RN, CDEDiabetes Program
diabetes/Worksite Wellness
WorksiteWellness
Diabetes Prevention Program
L I F EH A N GC E

12 I 2010-11 Annual Report12 I 2014-15 Annual Report
o u r s e r v i c e s
Laura Woodrum, RN, BSNClinic Director
Clinical services
The Lake Cumberland District Health Department (LCDHD) clinic nursing division has continued to provide
quality health services the past year to the citizens of the LCDHD service area. The year has been full of both opportunities and challenges as budget constraints have resulted in staff attrition. Remaining staff have taken on new and ever evolving job duties. As staff have been challenged working with fewer staff we have adopted a new system in scheduling our patients. We are in the second year of this process called same day scheduling (SDS), with SDS patients are instructed to come to the clinic or call for an appointment on the day they are seeking health department services. The patient is seen that day rather than schedule an appointment later in the week or sometimes up to 3 months in advance. As a result of SDS we are seeing a huge reduction in our “no show” rate and are able to maintain staff productivity. We are in the second year of a 2 year grant to provide colon cancer screening to uninsured, eligible patients in our district. We have reached out to eligible clients through social marketing, newspaper, and radio ads all paid for through the grant we received. We continue to look for ways to find those who are uninsured and at high risk. Our WIC program currently services approximately 8000 participants in the LCDHD. Each participant receives healthy foods, nutritional education, and referrals to other programs. The LCDHD WIC coordinator works with over 50 different stores and pharmacies who participate as vendors for WIC participants. The WIC program makes up over 50% of services that our clinics perform. The breastfeeding and peer counselor program provides breastfeeding support throughout the district in various forms; support groups, phone call, home visits, health fairs, and one on one clinic visits.
The peer counselor program employs six peer counselors and provides support to clients in each of our ten counties. Our prenatal program offers onsite prenatal care in 6 of the 10 LCDHD county health centers. Patients are able to receive quality services from a OB/GYN in their county of residence rather than travel to nearby county to receive care. Through a partnership with the University of Kentucky (UK); Russell, McCreary, and Wayne county are participating in Centering Pregnancy. Centering Pregnancy is a model of group healthcare. Health assessment, education, and support are provided in a group facilitated by a trained provider. Centering Pregnancy is an evidence based program proven to provide better patient outcomes for both mom and baby. Recently LCDHD has begun preparing to provide Ryan White HIV/AIDS case management services to patients in the 10 county area as well in 21 additional counties east of our district. The Ryan White HIV/AIDS program was designed to address health care related needs to individuals who are HIV positive. The program helps clients find and utilize resources which will improve their overall health and quality of life. We continue to provide family planning and cancer screening services to women in the LCDHD area. Women receive a full physical exam, education, counseling, and referral as needed. Women who meet income guidelines also receive assistance with additional testing and procedures such as mammogram, biopsy, etc. The clinic staff continue to provide immunizations for both adults and children, STD/HIV exams, TB screening and treatment, well child exams, lead screening, and medical nutrition therapy. The LCDHD clinic nursing staff continues to strive to provide the best possible care to those in our communities.

www.LCDHD.org I 13www.LCDHD.org I 13
o u r s e r v i c e s
Sylvia Ferrell, RNH.A.N.D.S Director
HAnds Program
Fiscal year 2015 has been a very good year for Lake Cumberland District Health Department H.A.N.D.S.
program. As Director, I am extremely proud of the accomplishments of our team. Lake Cumberland District H.A.N.D.S. remains the largest provider of H.A.N.D.S. services in the state of Kentucky; for both “First Time” families and “Multigravida” families. As we begin a new fiscal year, growth in both programs remains consistent. We currently provide home visitation and education to approximately 650 families enrolled in H.A.N.D.S. across our beautiful District. We recently received some wonderful news from the H.A.N.D.S. central office in Frankfort, as Kentucky’s H.A.N.D.S. program applied for and received recognition from HOMVEE, as a federally approved home visitation program. This is very exciting news, as now, Kentucky’s H.A.N.D.S. can apply for and receive federal funding to support our program. We have had very little staff turnover but, due to continued growth of H.A.N.D.S., several school nurses were transferred into the H.A.N.D.S. program and some additional staff have been hired. At this time, there are 50 folks working in H.A.N.D.S.. This additional staff will allow us to more effectively provide services to our H.A.N.D.S. families, in both programs.
Statistics compiled at the state level continue to show a reduction in premature and low birth weight babies and decreased instances of child abuse and neglect, as a direct result of the Kentucky H.A.N.D.S. program. One major focus of our program is baby’s brain development, which begins at birth. Recently LCDHD H.A.N.D.S. was contacted by the University of Kentucky and asked to take part in a research project. This project will include LCDHD H.A.N.D.S., Wayne County and McCreary County Elementary Schools and the University Of Kentucky Department of Research and will evaluate the benefit of H.A.N.D.S. in preparing our enrolled children for school readiness. We are very excited to be a part of this project. LCDHD H.A.N.D.S. has an amazing staff and our success and growth are a direct result of our staff’s desire and dedication to make a difference in the lives of our H.A.N.D.S. families and to educate our communities about the value of encouragement and support for new parents. Good things are happening in the lives of many new moms, dads and babies due to H.A.N.D.S.. As we begin FY 2016, the entire H.A.N.D.S. staff and I look forward to continued growth of our program and remain focused on our primarily goal: to help ALL new parents become the BEST parents they can be!!

14 I 2010-11 Annual Report14 I 2014-15 Annual Report
o u r s e r v i c e s
MelindaCopenhaver, CCS-PAdministrative Services Manager
support services
The LCDHD School Health Program provides essential public health prevention and promotion services
to the students, parents and school staff throughout our communities. Our public health school nurses are committed to providing the most comprehensive and efficient nursing care as possible to help decrease barriers to learning while improving community health. Our program, for the 2014-15 school year, consisted of forty eight satellite health department clinics which are located within twelve of our service area’s school districts. LCDHD provided registered nurses to staff these clinics at a contractual amount to the school board The LCDHD School Health Program offers a vast array of services, which include but are not limited to; assessment and treatment of illnesses, monitoring children with special health care needs/chronic disease, emergent problem identification and treatment and asthma education. Referrals are given to primary care providers as indicated.
Beth Thomas,RN, BSN, AE-CSchool Nurse Administrator
school Health Program 104,664 sick/acute visits
51,194 daily medications
14,563 diabetes
2,606 asthma
162 seizure
128 allergies
94 emergency-type visits
292 well child exams
3,020 required immunizations
2,421 flu vaccine
3,201 KDE Required Screenings
4,524 Lice Screenings
647 MD referrals
3,307 Humana Vitality Checks (employees wellness)
2014-2015 School Health Services Summary
Another year has come and gone and our Clinic Support Staff continue to be as busy as ever providing
support to the Clinic Providers through their daily routine of patient intake, check out, WIC issuance, medical record maintenance and many other duties As with most departments in the agency, the Clinic Support Staff continue to do more with less. The past few years have been challenging to say the least. Clinic Support Staff play a vital role in the day to day operations of the local health departments. Providing support to the Clinic Providers to enable them to provide effective and efficient patient care as well as supporting all other departments within the agency in various ways. Same day scheduling has now been implemented in of 10 counties and seems to
be going well. In preparation for conversion to an electronic medical record, we have begun the processing of scanning inactive medical records and storing them in an electronic format. In the coming year we will more than likely begin using an electronic medical record which will be exciting as well as frustrating. Quality improvement projects are being reviewed and will be put into place in the coming year. I am proud to say that the Clinic Support Staff scores on Patient and Employee Satisfaction Surveys continue to remain high. We will continue to do our best to maintain our level of customer service. Our Clinic Support Staff are a dedicated group of individuals and will continue to give their best efforts in carrying out the mission of the Lake Cumberland District Health Department.

www.LCDHD.org I 15www.LCDHD.org I 15
o u r s e r v i c e s
The Preparedness Program of Lake Cumberland District Health Department has faced a very
challenging year with the emergence of Ebola Virus Disease as a potential public health threat in the United States. Plans have been developed at the local, regional and state levels to ensure that our healthcare workers are prepared to respond and care for this highly infectious disease. Last year, the Preparedness Program achieved 100% on the State Health Department Readiness Review, which means all program deliverables and requirements were met for the year. This is impressive due to the fact that funding and staffing levels are at all-time lows in the program. The Preparedness staff continue to do good work and make the most of every opportunity. It is always important to build and strengthen local capacity and relationships with first responders, hospitals, long term care agencies, community organizations and other partners within the Lake Cumberland Region. The staff of the Preparedness Program at LCDHD are working diligently to build and maintain
these relationships as well as the local capacity to detect and respond to events of public health significance. The LCDHD Preparedness Program participated in the Region 14 Healthcare Preparedness Coalition Full Scale exercise in April 2015. This exercise involved numerous agencies from across the Lake Cumberland Region, including all nine hospitals, responding in a medical surge situation to set up an alternate care site. Additionally, the LCDHD Preparedness Program coordinates monthly redundant communication systems tests for the region and quarterly emergency notification drills for LCDHD staff and volunteers. The Lake Cumberland District Medical Reserve Corps (LCDMRC) continues to train for situations in which the unit might be called upon to assist public health in an emergency response. These volunteers are valuable, pre-credentialed and trained resources that would be available to assist in a public health disaster or event. The LCDHD Preparedness Program consists of 1 full-time Preparedness Manager and 1 full-time Epidemiologist. For more information on Disaster Preparedness and Epidemiology, visit our
website at www.lcdhd.org.
Amy Tomlinson,MPHPublic HealthPreparedness Program Manager
Preparedness
EMERGENCYPREPAREDNESS

16 I 2014-15 Annual Report
o u r s e r v i c e s
During the 2014-2015 fiscal year our epidemiologist, nursing and environmental staff investigated
103 reportable diseases and 14 outbreaks, 13 of which were in Long Term Care Facilities (LTCF). LTCFs are a perfect environment for spread of communicable disease; there were 6 gastrointestinal and 7 influenza outbreaks. The 2014/15 flu vaccine was not a good match for the circulating flu virus strain (H3N2) and therefore afforded little protection during that season, causing higher rates of disease and hospitalization. When well matched, the flu vaccine is excellent at preventing serious consequences of influenza infection- such as pneumonia, hospitalization and death. The H3N2 strain is included in the 2015/16 vaccine, which should be much more protective this season. We encourage
all individuals who are 65 years or older to receive the high dose flu vaccine as it induces a higher antibody response. In order to aid LTCFs in their quest for prevention of disease and antibiotic resistance we have initiated a bi-annual focus group meeting with LTCF and hospital infection preventionists. Hopefully this will facilitate information sharing and enhance reporting of notifiable diseases. We have also seen a dramatic increase in Hepatitis C (HCV) reporting. We are aware that Kentucky has the highest rates of HCV infections in the nation and that the major mode of transmission is via sharing contaminated syringes by IV drug users. Harm reduction strategies are being discussed in our district following the lead of Louisville and Lexington. We will also be able to provide HCV rapid testing in our clinics.
Christine Weyman, MD, PhD, FAAPMedical Director
Medical director
Environmental Services has had another productive and positive year. We did lose one of our
environmentalists in Casey County, but will be refilling that position in January. Otherwise we have a seasoned group of Senior Environmentalist that have proven most capable to deal with any situation that has presented itself thus far. We are very fortunate not to have the turnover in people and talent that other health departments face. A few years ago we decided that we wanted to empower our people to make the necessary decisions in their respective counties and now we are able to handle all of our problems in-house except for a very few. This is a very good thing in light of the fact that the state no longer has the technical consultant resources they once did to send into a county to assist. This year we continue to see the resurgence of bedbugs in our communities.
We have several complaints per week regarding the nuisance pests and are able to give advice on how to best get rid of them. There is no actual funding for bedbug remediation; however, we do provide education to the public. Along the same lines, mold continues to be a hot button issue. Like bedbugs there is no funding for remediation and the Health Department provides educational resources only. The state legislation this year increased permit fees for all food service programs substantially. This increase should help our programs funding woes. According to the state, the increase was long overdue because Kentucky’s permit fees were much lower than other states. As the graph states, food service is our largest program and the fee increase will help with this vital program. As our society shifts from eating most meals at home to eating most meals in a restaurant, the potential for
(continued on the next page)
Stuart Spillman, RS, REHSEnvironmental Health Director
environmental

www.LCDHD.org I 17
o u r s e r v i c e s
(continued from the previous page)
foodborne illness exponentially increases so the importance of food inspections increases. We are still actively monitoring rabies and quarantining or submitting every animal that bites a person; inspecting all schools, mobile home parks, swimming pools, motels, tattoo and body piercing studios; investigating complaints whether
it be rodent infestations or garbage and sewage; inspecting all installations of septic systems; and serve as the first point of contact and clearinghouse for all environmental issues. This is an incomplete list of what we do, but shows that we are involved deeply in our communities, and that the work we do touches everyone who lives in or visits the Lake Cumberland District.
Stuart Spillman, RS, REHSEnvironmental Health Director
environmental (cont.)
environmental inspections by Program 2014 - 2015
Food Inspections: 1,881
Public Facilities: 570
Pool Monitoring: 82
General Sanitation*: 528
on-Site Sewage: 1,338
Existing Septic Inspections: 208
Follow-up Inspections of all types: 1,151
*including rabies and sewage complaints
Food Inspections33%
Public Facilities10%
General Sanitation9%
On-Site Sewage23%
Existing Septic4%
Follow-Up Inspections20%
Pool Monitoring 1%
18 I 2014-15 Annual Report
o u r s e r v i c e s
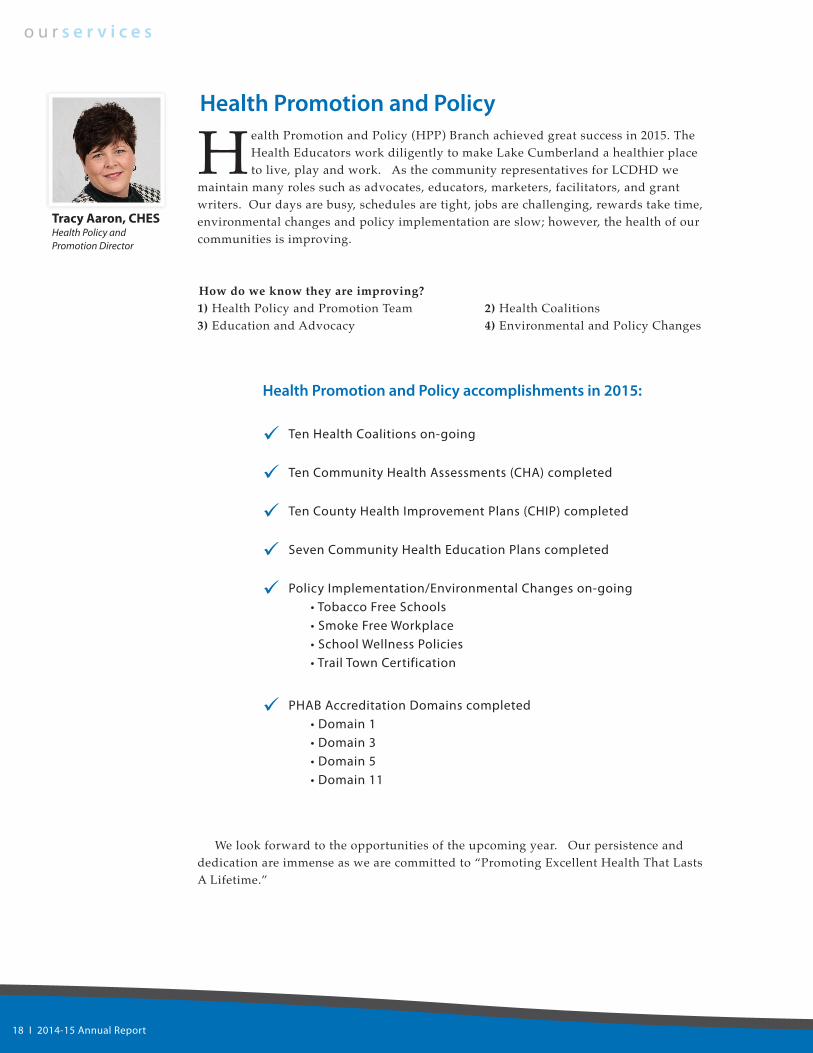
Health Promotion and Policy (HPP) Branch achieved great success in 2015. The Health Educators work diligently to make Lake Cumberland a healthier place to live, play and work. As the community representatives for LCDHD we
maintain many roles such as advocates, educators, marketers, facilitators, and grant writers. Our days are busy, schedules are tight, jobs are challenging, rewards take time, environmental changes and policy implementation are slow; however, the health of our communities is improving.
How do we know they are improving? 1) Health Policy and Promotion Team 2) Health Coalitions3) Education and Advocacy 4) Environmental and Policy Changes
Tracy Aaron, CHESHealth Policy and Promotion Director
Health Promotion and Policy
Health Promotion and Policy accomplishments in 2015:
Ten Health Coalitions on-going
Ten Community Health Assessments (CHA) completed
Ten County Health Improvement Plans (CHIP) completed
Seven Community Health Education Plans completed
Policy Implementation/Environmental Changes on-going • Tobacco Free Schools • Smoke Free Workplace • School Wellness Policies • Trail Town Certification
PHAB Accreditation Domains completed • Domain 1 • Domain 3 • Domain 5 • Domain 11
We look forward to the opportunities of the upcoming year. Our persistence and dedication are immense as we are committed to “Promoting Excellent Health That Lasts A Lifetime.”

0
100000
200000
300000
400000
500000
600000
700000
800000
700,000
600,000
500,000
400,000
300,000
200,000
100,000
0
370,334
598,520 602,393
644,199666,041
692,199
615,875586,827
FY ‘14-’15FY ‘05-’06 FY ‘06-’07 FY ‘07-’08 FY ‘08-’09 FY ‘09-’10 FY ‘10-’11 FY ‘11-’12 FY ‘12-’13 FY ‘13-’14
district Total Unduplicated Patients by Fiscal Year
0
30000
35000
40000
45000
50000
55000
60000
6500065,000
60,000
55,000
50,000
45,000
40,000
35,000
43,923
56,15257,175
55,29156,459
60,109
56,085
53,874
48,306
www.LCDHD.org I 19
538,273
52,157
FY ‘14-’15FY ‘05-’06 FY ‘06-’07 FY ‘07-’08 FY ‘08-’09 FY ‘09-’10 FY ‘10-’11 FY ‘11-’12 FY ‘12-’13 FY ‘13-’14
district Total services by Fiscal Year
o u r s e r v i c e s
397,651

20 I 2014-15 Annual Report
o u r s e r v i c e s
district services per Patient by Fiscal Year
0
2
4
6
8
10
1212
10
8
6
4
2
0
7.74
10.66 10.54
11.65 11.8011.52
10.98 10.89
8.23
FY ‘14-’15FY ‘05-’06 FY ‘06-’07 FY ‘07-’08 FY ‘08-’09 FY ‘09-’10 FY ‘10-’11 FY ‘11-’12 FY ‘12-’13 FY ‘13-’14
10.32
Total Clinical services by Program
WIC23.62%
School Health32.14%
Pediatrics17.32%
Adult
Hea
lth 5
.86%
Family
Planning 6.62%
H.A.N.D.S. 5%
Canc
er 1.
49%
Maternity Services 3.71%
Tuberculosis 2.02%STDs 1.37%
Adult Health: 22,946
Cancer: 5,819
Dental: 951, 0.24%
Family Planning: 25,927
Geriatrics: 1,854
H.A.N.D.S.: 19,589
Maternity Services: 14,545
Nutrition Services: 531, 0.14%
Pediatrics: 67,866
School Health: 125,907
STDs: 5,367
Tuberculosis: 7,923
WIC: 92,552
Unduplicated Individuals Receiving
Clinical Services: 43,923
Geriatrics 0.47%

10,000
30,000
50,000
70,000
90,000
110,000
130,000
150,000
170,000
190,000
210,000
FY 14-15FY 13-14FY 12-13FY 11-12FY 10-11FY 09-10FY 08-09FY 07-08FY 06-07FY 05-06
Adair 43,867 41,280 48,316 49,673 57,616 53,870 49,388 45,204 31,300 26,913
Casey39,393 42,950 48,797 48,841 49,826 43,747 43,002 39,475 32,252 26,763
Clinton27,961 27,313 30,968 36,286 35,785 31,443 31,092 27,555 23,879 19,764
Cumberland25,125 21,713 22,468 28,235 32,258 29,815 27,915 27,298 21,556 19,144
Green42,362 40,245 41,069 41,974 44,621 38,900 35,938 29,909 22,788 18,920
McCreary70,678 73,128 70,701 72,133 73,060 67,766 67,273 63,474 51,734 48,021
Pulaski172,989 178,137 188,757 186,738 181,768 156,144 145,035 132,943 109,721 94,916
Russell61,950 56,282 64,194 65,611 67,057 57,378 54,584 51,086 44,718 27,406
Taylor55,784 59,109 61,247 70,207 79,060 70,805 66,921 58,294 47,248 41,156
Wayne58,411 62,236 67,682 66,343 71,148 66,007 65,679 63,035 53,193 47,331
Adair
Casey
Clinton
Cumberland
Green
McCreary
Pulaski
Russell
Taylor
Wayne
www.LCDHD.org I 21
o u r s e r v i c e s
Total services per County by Fiscal Year
Unduplicated Individuals Receiving
Clinical Services: 43,923

22 I 2010-11 Annual Report22 I 2014-15 Annual Report
o u r s e r v i c e s
1,000
3,000
5,000
7,000
9,000
11,000
13,000
15,000
17,000
19,000
21,000
FY 14-15FY 13-14FY 12-13FY 11-12FY 10-11FY 09-10FY 08-09FY 07-08FY 06-07FY 05-06
Unduplicated Patients per County by Fiscal Year
Adair 4,263 4,640 3,625 3,717 4,504 4,214 4,256 3,961 3,807 3,531
Casey3,623 4,199 4,613 4,495 4,502 3,780 3,904 4,009 3,650 3,326
Clinton2,677 2,549 2,386 2,841 2,751 2,508 2,600 2,552 2,307 2,106
Cumberland2,072 2,035 2,041 2,115 2,261 1,999 1,980 1,905 1,852 1,781
Green3,982 3,649 3,443 3,414 3,527 2,966 3,064 2,751 2,475 2,436
McCreary7,033 6,525 6,016 5,955 6,274 5,613 5,780 5,387 5.131 4,892
Pulaski17,258 18,391 17,950 17,998 17,771 18,658 15,534 15,230 14,070 13,389
Russell4,835 4,488 4,625 4,669 5,270 4,465 4,590 4,466 4,146 2,243
Taylor5,835 5,908 5,390 5,846 6,988 6,387 6,528 6,387 5,647 5,364
Wayne4,574 4,791 5,202 5,409 6,261 5,495 5,638 5,509 5,221 4,855
Adair
Casey
Clinton
Cumberland
Green
McCreary
Pulaski
Russell
Taylor
Wayne

www.LCDHD.org I 23
PATienT sATisFACTiOn sURVeY 2 0 1 5district Trend ReportInterval Start Date End Date Respondents
T1 1/1/2003 12/31/2003 680
T2 1/1/2004 12/31/2004 425
T3 1/1/2006 12/31/2006 750
T4 1/1/2007 12/31/2007 559
T5 1/1/2008 12/31/2008 796
T6 1/1/2009 12/31/2009 811
T7 1/1/2010 12/31/2010 836
T8 1/1/2011 12/31/2011 867
T9 1/1/2012 12/31/2012 869
T10 1/1/2013 12/31/2013 826
T11 1/1/2014 12/31/2014 808
T12 1/1/2015 12/31/2015 603
www.LCDHD.org I 23
The Lake Cumberland District Health Department submitted an application for voluntary
national accreditation to the Public Health Accreditation Board (PHAB) in December 2014. The Accreditation Coordinator and Health Education Director attended the PHAB required training in February 2015 and all of the required documentation was submitted by July. The first review (a completeness review) has been completed by the PHAB accreditation specialist and the site visitors are now performing a final review of all the documentation. A PHAB site visit is scheduled in January 2016. Revisions to the clinic utilization review tools continue to be made as needed to reflect the annual state updates to the Core Clinical Service Guide and Administrative Reference, these tools help assure that we remain in compliance with all the district and state requirements, as well as all federal guidelines. Peer reviews continue to be conducted quarterly in each county and district staff continue to complete an
annual audit in each county using these tools. All ten counties were audited by the Division of Women’s Health from the Department of Public Health this year with excellent results. The Safety Committee continues to promote health and safety in the workplace. Safety inspections are done annually and safety drills continue to be performed quarterly. The safety committee also developed several new policies that were approved by the District Board of Health last year. Our patient satisfaction and employee satisfaction results remain very high. This is an indication that both our patients and our staff are pleased with the services we provide and the environment in which they work and receive care in spite of the financial struggles we have dealt with throughout the last several years. Overall, the internal and external audit scores continue to be very good for all of our programs. We are very proud of these scores but still continue to strive for excellence in all areas.
Quality improvement
Janae Tucker, RN, CCS-PLocal Health Nurse Specialist
o u r q u a l i t y

24 I 2014-15 Annual Report
o u r q u a l i t y
1. How long did you wait until you were registered by the front desk/registration staff?
2. How long did you wait until you were called back?
3. How happy were you with how you were treated by the front desk/registration staff?
2015 Patient Satisfaction SurveyLake Cumberland District Health
Department TrendInterval Start Date End Date Respondents Interval Start Date End Date RespondentsT1 1/1/2003 12/31/2003 680 T7 1/1/2010 12/31/2010 836T2 1/1/2004 12/31/2004 425 T8 1/1/2011 12/31/2011 867T3 1/1/2006 12/31/2006 750 T9 1/1/2012 12/31/2012 869T4 1/1/2007 12/31/2007 559 T10 1/1/2013 12/31/2013 826T5 1/1/2008 12/31/2008 796 T11 1/1/2014 12/31/2014 808T6 1/1/2009 12/31/2009 811 T12 1/1/2015 12/31/2015 603
1. How long did you wait until you were registered by the front desk/registration staff?
5
4
3
2
1T1 T2 T3 T4 T5 T6 T7 T8 T9 T10 T11 T12
Resp Avg1. 0 - 5 mins. T1 675 1.292. 6 - 10 mins. T2 423 1.193. 11-15 mins. T3 746 1.224. 16 - 20 mins. T4 557 1.175. 20 mins. + T5 792 1.30
T6 808 1.27T7 835 1.29T8 863 1.39T9 867 1.38
T10 824 1.33T11 804 1.43T12 599 1.32
2. How long did you wait until you were called back?
5
4
3
2
1T1 T2 T3 T4 T5 T6 T7 T8 T9 T10 T11 T12
Resp Avg1. 0 - 5 mins. T1 593 2.502. 6 - 10 mins. T2 381 2.153. 11-15 mins. T3 673 2.274. 16 - 20 mins. T4 513 2.085. 20 mins. + T5 727 2.16
T6 729 2.29T7 763 2.21T8 781 2.36T9 815 2.05
T10 774 2.24T11 716 2.16T12 549 2.08
3. How happy were you with how you were treated by the front desk/registration staff?
5
4
3
2
1T1 T2 T3 T4 T5 T6 T7 T8 T9 T10 T11 T12
Resp Avg1. Very Unhappy T1 672 4.452. Unhappy T2 420 4.393. Neutral T3 741 4.144. Happy T4 557 4.425. Very happy T5 790 4.49
T6 805 4.52T7 833 4.56T8 854 4.53T9 859 4.56
T10 815 4.57T11 802 4.58T12 595 4.58
Page 14. How happy were you with how you were treated by the clinic staff?
1. 0 - 5 mins.2. 6 - 10 mins.3. 11 - 15 mins.4. 16 - 20 mins.5. 20 mins. +
int. Resp. Avg.T1 675 1.29T2 423 1.19T3 746 1.22T4 557 1.17T5 792 1.30T6 808 1.27T7 835 1.29T8 863 1.39T9 867 1.38T10 824 1.33T11 804 1.43T12 599 1.32
2015 Patient Satisfaction SurveyLake Cumberland District Health
Department TrendInterval Start Date End Date Respondents Interval Start Date End Date RespondentsT1 1/1/2003 12/31/2003 680 T7 1/1/2010 12/31/2010 836T2 1/1/2004 12/31/2004 425 T8 1/1/2011 12/31/2011 867T3 1/1/2006 12/31/2006 750 T9 1/1/2012 12/31/2012 869T4 1/1/2007 12/31/2007 559 T10 1/1/2013 12/31/2013 826T5 1/1/2008 12/31/2008 796 T11 1/1/2014 12/31/2014 808T6 1/1/2009 12/31/2009 811 T12 1/1/2015 12/31/2015 603
1. How long did you wait until you were registered by the front desk/registration staff?
5
4
3
2
1T1 T2 T3 T4 T5 T6 T7 T8 T9 T10 T11 T12
Resp Avg1. 0 - 5 mins. T1 675 1.292. 6 - 10 mins. T2 423 1.193. 11-15 mins. T3 746 1.224. 16 - 20 mins. T4 557 1.175. 20 mins. + T5 792 1.30
T6 808 1.27T7 835 1.29T8 863 1.39T9 867 1.38
T10 824 1.33T11 804 1.43T12 599 1.32
2. How long did you wait until you were called back?
5
4
3
2
1T1 T2 T3 T4 T5 T6 T7 T8 T9 T10 T11 T12
Resp Avg1. 0 - 5 mins. T1 593 2.502. 6 - 10 mins. T2 381 2.153. 11-15 mins. T3 673 2.274. 16 - 20 mins. T4 513 2.085. 20 mins. + T5 727 2.16
T6 729 2.29T7 763 2.21T8 781 2.36T9 815 2.05
T10 774 2.24T11 716 2.16T12 549 2.08
3. How happy were you with how you were treated by the front desk/registration staff?
5
4
3
2
1T1 T2 T3 T4 T5 T6 T7 T8 T9 T10 T11 T12
Resp Avg1. Very Unhappy T1 672 4.452. Unhappy T2 420 4.393. Neutral T3 741 4.144. Happy T4 557 4.425. Very happy T5 790 4.49
T6 805 4.52T7 833 4.56T8 854 4.53T9 859 4.56
T10 815 4.57T11 802 4.58T12 595 4.58
Page 1
1. 0 - 5 mins.2. 6 - 10 mins.3. 11 - 15 mins.4. 16 - 20 mins.5. 20 mins. +
int. Resp. Avg.T1 593 2.50T2 381 2.15T3 673 2.27T4 513 2.08T5 727 2.16T6 729 2.29T7 763 2.21T8 781 2.36T9 815 2.05T10 774 2.24T11 716 2.16T12 549 2.08
1. Very Unhappy2. Unhappy3. Neutral4. Happy5. Very Happy
2015 Patient Satisfaction SurveyLake Cumberland District Health
Department TrendInterval Start Date End Date Respondents Interval Start Date End Date RespondentsT1 1/1/2003 12/31/2003 680 T7 1/1/2010 12/31/2010 836T2 1/1/2004 12/31/2004 425 T8 1/1/2011 12/31/2011 867T3 1/1/2006 12/31/2006 750 T9 1/1/2012 12/31/2012 869T4 1/1/2007 12/31/2007 559 T10 1/1/2013 12/31/2013 826T5 1/1/2008 12/31/2008 796 T11 1/1/2014 12/31/2014 808T6 1/1/2009 12/31/2009 811 T12 1/1/2015 12/31/2015 603
1. How long did you wait until you were registered by the front desk/registration staff?
5
4
3
2
1T1 T2 T3 T4 T5 T6 T7 T8 T9 T10 T11 T12
Resp Avg1. 0 - 5 mins. T1 675 1.292. 6 - 10 mins. T2 423 1.193. 11-15 mins. T3 746 1.224. 16 - 20 mins. T4 557 1.175. 20 mins. + T5 792 1.30
T6 808 1.27T7 835 1.29T8 863 1.39T9 867 1.38
T10 824 1.33T11 804 1.43T12 599 1.32
2. How long did you wait until you were called back?
5
4
3
2
1T1 T2 T3 T4 T5 T6 T7 T8 T9 T10 T11 T12
Resp Avg1. 0 - 5 mins. T1 593 2.502. 6 - 10 mins. T2 381 2.153. 11-15 mins. T3 673 2.274. 16 - 20 mins. T4 513 2.085. 20 mins. + T5 727 2.16
T6 729 2.29T7 763 2.21T8 781 2.36T9 815 2.05
T10 774 2.24T11 716 2.16T12 549 2.08
3. How happy were you with how you were treated by the front desk/registration staff?
5
4
3
2
1T1 T2 T3 T4 T5 T6 T7 T8 T9 T10 T11 T12
Resp Avg1. Very Unhappy T1 672 4.452. Unhappy T2 420 4.393. Neutral T3 741 4.144. Happy T4 557 4.425. Very happy T5 790 4.49
T6 805 4.52T7 833 4.56T8 854 4.53T9 859 4.56
T10 815 4.57T11 802 4.58T12 595 4.58
Page 1
int. Resp. Avg.T1 672 4.45T2 420 4.39T3 741 4.14 T4 557 4.42T5 790 4.49T6 805 4.52T7 833 4.56T8 854 4.53T9 859 4.56T10 815 4.57T11 802 4.58T12 595 4.58
1. Very Unhappy2. Unhappy3. Neutral4. Happy5. Very Happy
4. How happy were you with how you were treated by the clinic staff?
5
4
3
2
1T1 T2 T3 T4 T5 T6 T7 T8 T9 T10 T11 T12
Resp Avg1. Very Unhappy T1 635 4.432. Unhappy T2 408 4.353. Neutral T3 715 4.254. Happy T4 539 4.405. Very Happy T5 758 4.49
T6 781 4.52T7 810 4.55T8 821 4.54T9 832 4.58
T10 792 4.58T11 775 4.57T12 576 4.57
5. Did you have a physical exam today?
3
2
1T1 T2 T3 T4 T5 T6 T7 T8 T9 T10 T11 T12
Resp Avg1. Yes T1 636 1.712. No T2 390 1.64
T3 709 1.70T4 528 1.71T5 757 1.74T6 751 1.75T7 767 1.79T8 827 1.70T9 838 1.74
T10 783 1.72T11 725 1.79T12 545 1.82
6. If you answered yes to question #5, how happy are you with the way the person who examinedyou today listened to you?
5
4
3
2
1T1 T2 T3 T4 T5 T6 T7 T8 T9 T10 T11 T12
Resp Avg1. Very Unhappy T1 233 4.442. Unhappy T2 168 4.403. Neutral T3 241 4.224. Happy T4 195 4.365. Very Happy T5 270 4.39
T6 275 4.43T7 265 4.54T8 319 4.51T9 283 4.46
T10 309 4.51T11 222 4.46T12 159 4.48
2015 Patient Satisfaction SurveyLake Cumberland District Health
Department Trend
Page 2
int. Resp. Avg.T1 635 4.43T2 408 4.35T3 715 4.25T4 539 4.40T5 758 4.49T6 781 4.52T7 810 4.55T8 821 4.54T9 832 4.58T10 792 4.58T11 775 4.57T12 576 4.57

6. if you answered yes to question no. 5, how happy are you with the way the person who examined you today listened to you?
7. if you answered yes to question no. 5, how happy are you with the health care that the person who examined you today provided?
8. if you answered yes to question #5, how happy are you with the time the person who examined you today took to explain conditions and treatments?
www.LCDHD.org I 25
o u r q u a l i t y
5. did you have a physical exam today?
1. Yes2. No
4. How happy were you with how you were treated by the clinic staff?
5
4
3
2
1T1 T2 T3 T4 T5 T6 T7 T8 T9 T10 T11 T12
Resp Avg1. Very Unhappy T1 635 4.432. Unhappy T2 408 4.353. Neutral T3 715 4.254. Happy T4 539 4.405. Very Happy T5 758 4.49
T6 781 4.52T7 810 4.55T8 821 4.54T9 832 4.58
T10 792 4.58T11 775 4.57T12 576 4.57
5. Did you have a physical exam today?
3
2
1T1 T2 T3 T4 T5 T6 T7 T8 T9 T10 T11 T12
Resp Avg1. Yes T1 636 1.712. No T2 390 1.64
T3 709 1.70T4 528 1.71T5 757 1.74T6 751 1.75T7 767 1.79T8 827 1.70T9 838 1.74
T10 783 1.72T11 725 1.79T12 545 1.82
6. If you answered yes to question #5, how happy are you with the way the person who examinedyou today listened to you?
5
4
3
2
1T1 T2 T3 T4 T5 T6 T7 T8 T9 T10 T11 T12
Resp Avg1. Very Unhappy T1 233 4.442. Unhappy T2 168 4.403. Neutral T3 241 4.224. Happy T4 195 4.365. Very Happy T5 270 4.39
T6 275 4.43T7 265 4.54T8 319 4.51T9 283 4.46
T10 309 4.51T11 222 4.46T12 159 4.48
2015 Patient Satisfaction SurveyLake Cumberland District Health
Department Trend
Page 2
int. Resp. Avg.T1 636 1.71T2 390 1.64T3 709 1.70T4 528 1.71T5 757 1.74T6 751 1.75T7 767 1.79T8 827 1.70T9 838 1.74T10 783 1.72T11 725 1.79T12 545 1.82
1. Very Unhappy2. Unhappy3. Neutral4. Happy5. Very Happy
4. How happy were you with how you were treated by the clinic staff?
5
4
3
2
1T1 T2 T3 T4 T5 T6 T7 T8 T9 T10 T11 T12
Resp Avg1. Very Unhappy T1 635 4.432. Unhappy T2 408 4.353. Neutral T3 715 4.254. Happy T4 539 4.405. Very Happy T5 758 4.49
T6 781 4.52T7 810 4.55T8 821 4.54T9 832 4.58
T10 792 4.58T11 775 4.57T12 576 4.57
5. Did you have a physical exam today?
3
2
1T1 T2 T3 T4 T5 T6 T7 T8 T9 T10 T11 T12
Resp Avg1. Yes T1 636 1.712. No T2 390 1.64
T3 709 1.70T4 528 1.71T5 757 1.74T6 751 1.75T7 767 1.79T8 827 1.70T9 838 1.74
T10 783 1.72T11 725 1.79T12 545 1.82
6. If you answered yes to question #5, how happy are you with the way the person who examinedyou today listened to you?
5
4
3
2
1T1 T2 T3 T4 T5 T6 T7 T8 T9 T10 T11 T12
Resp Avg1. Very Unhappy T1 233 4.442. Unhappy T2 168 4.403. Neutral T3 241 4.224. Happy T4 195 4.365. Very Happy T5 270 4.39
T6 275 4.43T7 265 4.54T8 319 4.51T9 283 4.46
T10 309 4.51T11 222 4.46T12 159 4.48
2015 Patient Satisfaction SurveyLake Cumberland District Health
Department Trend
Page 2
int. Resp. Avg.T1 233 4.44T2 168 4.40T3 241 4.22T4 195 4.36T5 270 4.39T6 275 4.43T7 265 4.54T8 319 4.51T9 283 4.46T10 309 4.51T11 222 4.46T12 159 4.48
1. Very Unhappy2. Unhappy3. Neutral4. Happy5. Very Happy
7. If you answered yes to question #5, how happy are you with the health care that the person whoexamined you today provided?
5
4
3
2
1T1 T2 T3 T4 T5 T6 T7 T8 T9 T10 T11 T12
Resp Avg1. Very Unhappy T1 226 4.432. Unhappy T2 164 4.413. Neutral T3 236 4.274. Happy T4 175 4.265. Very Happy T5 265 4.35
T6 265 4.40T7 252 4.54T8 307 4.53T9 271 4.41
T10 299 4.49T11 217 4.44T12 150 4.49
8. If you answered yes to question #5, how happy are you with the time the person who examined you today took to explain conditions and treatments?
5
4
3
2
1T1 T2 T3 T4 T5 T6 T7 T8 T9 T10 T11 T12
Resp Avg1. Very Unhappy T1 223 4.432. Unhappy T2 164 4.323. Neutral T3 238 4.224. Happy T4 176 4.275. Very Happy T5 265 4.31
T6 261 4.37T7 256 4.52T8 312 4.54T9 271 4.41
T10 306 4.49T11 212 4.42T12 154 4.43
9. How happy were you with the counseling and information you received?
5
4
3
2
1T1 T2 T3 T4 T5 T6 T7 T8 T9 T10 T11 T12
Resp Avg1. Very Unhappy T1 617 4.362. Unhappy T2 386 4.363. Neutral T3 655 4.214. Happy T4 496 4.315. Very Happy T5 743 4.40
T6 764 4.46T7 778 4.48T8 795 4.48T9 829 4.51
T10 785 4.45T11 735 4.49T12 560 4.49
2015 Patient Satisfaction SurveyLake Cumberland District Health
Department Trend
Page 3
int. Resp. Avg.T1 226 4.43T2 164 4.41T3 236 4.27T4 175 4.26T5 265 4.35T6 265 4.40T7 252 4.54T8 307 4.53T9 271 4.41T10 299 4.49T11 217 4.44T12 150 4.49
1. Very Unhappy2. Unhappy3. Neutral4. Happy5. Very Happy
7. If you answered yes to question #5, how happy are you with the health care that the person whoexamined you today provided?
5
4
3
2
1T1 T2 T3 T4 T5 T6 T7 T8 T9 T10 T11 T12
Resp Avg1. Very Unhappy T1 226 4.432. Unhappy T2 164 4.413. Neutral T3 236 4.274. Happy T4 175 4.265. Very Happy T5 265 4.35
T6 265 4.40T7 252 4.54T8 307 4.53T9 271 4.41
T10 299 4.49T11 217 4.44T12 150 4.49
8. If you answered yes to question #5, how happy are you with the time the person who examined you today took to explain conditions and treatments?
5
4
3
2
1T1 T2 T3 T4 T5 T6 T7 T8 T9 T10 T11 T12
Resp Avg1. Very Unhappy T1 223 4.432. Unhappy T2 164 4.323. Neutral T3 238 4.224. Happy T4 176 4.275. Very Happy T5 265 4.31
T6 261 4.37T7 256 4.52T8 312 4.54T9 271 4.41
T10 306 4.49T11 212 4.42T12 154 4.43
9. How happy were you with the counseling and information you received?
5
4
3
2
1T1 T2 T3 T4 T5 T6 T7 T8 T9 T10 T11 T12
Resp Avg1. Very Unhappy T1 617 4.362. Unhappy T2 386 4.363. Neutral T3 655 4.214. Happy T4 496 4.315. Very Happy T5 743 4.40
T6 764 4.46T7 778 4.48T8 795 4.48T9 829 4.51
T10 785 4.45T11 735 4.49T12 560 4.49
2015 Patient Satisfaction SurveyLake Cumberland District Health
Department Trend
Page 3
int. Resp. Avg.T1 223 4.43T2 164 4.32T3 238 4.22T4 176 4.27T5 265 4.31T6 261 4.37T7 256 4.52T8 312 4.54T9 271 4.41T10 306 4.49T11 212 4.42T12 154 4.43

26 I 2010-11 Annual Report26 I 2014-15 Annual Report
o u r q u a l i t y
9. How happy were you with the counseling and information you received?
10. How happy were you with the privacy provided to you during your visit?
11. Our hours are Monday - Friday 8 a.m. to 4:30 p.m. plus extended hours twice a month. Are you happy with these hours?
12. Are you charged for your services?
1. Very Unhappy2. Unhappy3. Neutral4. Happy5. Very Happy
7. If you answered yes to question #5, how happy are you with the health care that the person whoexamined you today provided?
5
4
3
2
1T1 T2 T3 T4 T5 T6 T7 T8 T9 T10 T11 T12
Resp Avg1. Very Unhappy T1 226 4.432. Unhappy T2 164 4.413. Neutral T3 236 4.274. Happy T4 175 4.265. Very Happy T5 265 4.35
T6 265 4.40T7 252 4.54T8 307 4.53T9 271 4.41
T10 299 4.49T11 217 4.44T12 150 4.49
8. If you answered yes to question #5, how happy are you with the time the person who examined you today took to explain conditions and treatments?
5
4
3
2
1T1 T2 T3 T4 T5 T6 T7 T8 T9 T10 T11 T12
Resp Avg1. Very Unhappy T1 223 4.432. Unhappy T2 164 4.323. Neutral T3 238 4.224. Happy T4 176 4.275. Very Happy T5 265 4.31
T6 261 4.37T7 256 4.52T8 312 4.54T9 271 4.41
T10 306 4.49T11 212 4.42T12 154 4.43
9. How happy were you with the counseling and information you received?
5
4
3
2
1T1 T2 T3 T4 T5 T6 T7 T8 T9 T10 T11 T12
Resp Avg1. Very Unhappy T1 617 4.362. Unhappy T2 386 4.363. Neutral T3 655 4.214. Happy T4 496 4.315. Very Happy T5 743 4.40
T6 764 4.46T7 778 4.48T8 795 4.48T9 829 4.51
T10 785 4.45T11 735 4.49T12 560 4.49
2015 Patient Satisfaction SurveyLake Cumberland District Health
Department Trend
Page 3
int. Resp. Avg.T1 617 4.36T2 386 4.36T3 655 4.21T4 496 4.31T5 743 4.40T6 764 4.46T7 778 4.48T8 795 4.48T9 829 4.51T10 785 4.45T11 735 4.49T12 560 4.49
1. Very Unhappy2. Unhappy3. Neutral4. Happy5. Very Happy
10. How happy were you with the privacy provided to you during your visit?
5
4
3
2
1T1 T2 T3 T4 T5 T6 T7 T8 T9 T10 T11 T12
Resp Avg1. Very Unhappy T1 633 4.432. Unhappy T2 409 4.333. Neutral T3 720 4.324. Happy T4 528 4.385. Very Happy T5 757 4.44
T6 782 4.52T7 804 4.53T8 826 4.53T9 851 4.55
T10 802 4.51T11 749 4.55T12 575 4.52
11. Our hours are Monday - Friday 8:00 AM to 4:30 PM plus extended hours twice a month. Are you happy with these hours?
5
4
3
2
1T1 T2 T3 T4 T5 T6 T7 T8 T9 T10 T11 T12
Resp Avg1. Very Unhappy T1 658 4.242. Unhappy T2 413 4.313. Neutral T3 727 4.244. Happy T4 535 4.325. Very Happy T5 764 4.35
T6 793 4.43T7 806 4.44T8 836 4.39T9 859 4.41
T10 805 4.42T11 762 4.43T12 579 4.42
12. Are you charged for your Services?
3
2
1T1 T2 T3 T4 T5 T6 T7 T8 T9 T10 T11 T12
Resp Avg1. Yes T1 595 1.712. No T2 378 1.81
T3 664 1.79T4 494 1.81T5 686 1.86T6 701 1.85T7 700 1.85T8 737 1.84T9 778 1.82
T10 722 1.87T11 698 1.92T12 537 1.93
2015 Patient Satisfaction SurveyLake Cumberland District Health
Department Trend
Page 4
int. Resp. Avg.T1 633 4.43T2 409 4.33T3 720 4.32T4 528 4.38T5 757 4.44T6 782 4.52T7 804 4.53T8 826 4.53T9 851 4.55T10 802 4.51T11 749 4.55T12 575 4.52
1. Very Unhappy2. Unhappy3. Neutral4. Happy5. Very Happy
10. How happy were you with the privacy provided to you during your visit?
5
4
3
2
1T1 T2 T3 T4 T5 T6 T7 T8 T9 T10 T11 T12
Resp Avg1. Very Unhappy T1 633 4.432. Unhappy T2 409 4.333. Neutral T3 720 4.324. Happy T4 528 4.385. Very Happy T5 757 4.44
T6 782 4.52T7 804 4.53T8 826 4.53T9 851 4.55
T10 802 4.51T11 749 4.55T12 575 4.52
11. Our hours are Monday - Friday 8:00 AM to 4:30 PM plus extended hours twice a month. Are you happy with these hours?
5
4
3
2
1T1 T2 T3 T4 T5 T6 T7 T8 T9 T10 T11 T12
Resp Avg1. Very Unhappy T1 658 4.242. Unhappy T2 413 4.313. Neutral T3 727 4.244. Happy T4 535 4.325. Very Happy T5 764 4.35
T6 793 4.43T7 806 4.44T8 836 4.39T9 859 4.41
T10 805 4.42T11 762 4.43T12 579 4.42
12. Are you charged for your Services?
3
2
1T1 T2 T3 T4 T5 T6 T7 T8 T9 T10 T11 T12
Resp Avg1. Yes T1 595 1.712. No T2 378 1.81
T3 664 1.79T4 494 1.81T5 686 1.86T6 701 1.85T7 700 1.85T8 737 1.84T9 778 1.82
T10 722 1.87T11 698 1.92T12 537 1.93
2015 Patient Satisfaction SurveyLake Cumberland District Health
Department Trend
Page 4
int. Resp. Avg.T1 658 4.24T2 413 4.31T3 727 4.24T4 535 4.32T5 764 4.35T6 793 4.43T7 806 4.44T8 836 4.39T9 859 4.41T10 805 4.42T11 762 4.43T12 579 4.42
1. Yes2. No
10. How happy were you with the privacy provided to you during your visit?
5
4
3
2
1T1 T2 T3 T4 T5 T6 T7 T8 T9 T10 T11 T12
Resp Avg1. Very Unhappy T1 633 4.432. Unhappy T2 409 4.333. Neutral T3 720 4.324. Happy T4 528 4.385. Very Happy T5 757 4.44
T6 782 4.52T7 804 4.53T8 826 4.53T9 851 4.55
T10 802 4.51T11 749 4.55T12 575 4.52
11. Our hours are Monday - Friday 8:00 AM to 4:30 PM plus extended hours twice a month. Are you happy with these hours?
5
4
3
2
1T1 T2 T3 T4 T5 T6 T7 T8 T9 T10 T11 T12
Resp Avg1. Very Unhappy T1 658 4.242. Unhappy T2 413 4.313. Neutral T3 727 4.244. Happy T4 535 4.325. Very Happy T5 764 4.35
T6 793 4.43T7 806 4.44T8 836 4.39T9 859 4.41
T10 805 4.42T11 762 4.43T12 579 4.42
12. Are you charged for your Services?
3
2
1T1 T2 T3 T4 T5 T6 T7 T8 T9 T10 T11 T12
Resp Avg1. Yes T1 595 1.712. No T2 378 1.81
T3 664 1.79T4 494 1.81T5 686 1.86T6 701 1.85T7 700 1.85T8 737 1.84T9 778 1.82
T10 722 1.87T11 698 1.92T12 537 1.93
2015 Patient Satisfaction SurveyLake Cumberland District Health
Department Trend
Page 4
int. Resp. Avg.T1 595 1.71T2 378 1.81T3 664 1.79T4 494 1.81T5 686 1.86T6 701 1.85T7 700 1.85T8 737 1.84T9 778 1.82T10 722 1.87T11 698 1.92T12 537 1.93

www.LCDHD.org I 27
14. Appointment
15. if the patient had an appointment, when did he/she arrive?
16. County
13. if so, are the charges reasonable?
www.LCDHD.org I 27
o u r q u a l i t y
1. Yes2. No
13. If so, are the charges reasonable?
3
2
1T1 T2 T3 T4 T5 T6 T7 T8 T9 T10 T11 T12
Resp Avg1. Yes T1 195 1.102. No T2 90 1.20
T3 172 1.10T4 123 1.15T5 131 1.17T6 145 1.17T7 155 1.17T8 152 1.11T9 164 1.15
T10 146 1.15T11 89 1.20T12 61 1.30
14. Appointment
3
2
1T1 T2 T3 T4 T5 T6 T7 T8 T9 T10 T11 T12
Resp Avg1. Yes T1 548 1.042. No T2 343 1.04
T3 688 1.07T4 505 1.07T5 705 1.05T6 755 1.05T7 768 1.07T8 790 1.03T9 792 1.07
T10 752 1.06T11 756 1.09T12 538 1.42
15. If the patient had an appointment, when did he/she arrive?
4
3
2
1T1 T2 T3 T4 T5 T6 T7 T8 T9 T10 T11 T12
Resp Avg1. Early - On-time T1 585 1.152. 1-15 minutes late T2 360 1.163. 16-30 minutes late T3 670 1.104. over 30 minutes late T4 493 1.14
T5 692 1.13T6 727 1.09T7 726 1.09T8 779 1.12T9 754 1.18
T10 734 1.18T11 721 1.12T12 343 1.12
2015 Patient Satisfaction SurveyLake Cumberland District Health
Department Trend
Page 5
int. Resp. Avg.T1 195 1.10T2 90 1.20T3 172 1.10T4 123 1.15T5 131 1.17T6 145 1.17T7 155 1.17T8 152 1.11T9 164 1.15T10 146 1.15T11 89 1.20T12 61 1.30
1. Yes2. No
13. If so, are the charges reasonable?
3
2
1T1 T2 T3 T4 T5 T6 T7 T8 T9 T10 T11 T12
Resp Avg1. Yes T1 195 1.102. No T2 90 1.20
T3 172 1.10T4 123 1.15T5 131 1.17T6 145 1.17T7 155 1.17T8 152 1.11T9 164 1.15
T10 146 1.15T11 89 1.20T12 61 1.30
14. Appointment
3
2
1T1 T2 T3 T4 T5 T6 T7 T8 T9 T10 T11 T12
Resp Avg1. Yes T1 548 1.042. No T2 343 1.04
T3 688 1.07T4 505 1.07T5 705 1.05T6 755 1.05T7 768 1.07T8 790 1.03T9 792 1.07
T10 752 1.06T11 756 1.09T12 538 1.42
15. If the patient had an appointment, when did he/she arrive?
4
3
2
1T1 T2 T3 T4 T5 T6 T7 T8 T9 T10 T11 T12
Resp Avg1. Early - On-time T1 585 1.152. 1-15 minutes late T2 360 1.163. 16-30 minutes late T3 670 1.104. over 30 minutes late T4 493 1.14
T5 692 1.13T6 727 1.09T7 726 1.09T8 779 1.12T9 754 1.18
T10 734 1.18T11 721 1.12T12 343 1.12
2015 Patient Satisfaction SurveyLake Cumberland District Health
Department Trend
Page 5
int. Resp. Avg.T1 548 1.04T2 343 1.04T3 688 1.07T4 505 1.07T5 705 1.05T6 755 1.05T7 768 1.07T8 790 1.03T9 792 1.07T10 752 1.06T11 756 1.09T12 538 1.42
1. Early - on-time2. 1 - 15 minutes late3. 16 - 30 minutes late4. over 30 minutes late
13. If so, are the charges reasonable?
3
2
1T1 T2 T3 T4 T5 T6 T7 T8 T9 T10 T11 T12
Resp Avg1. Yes T1 195 1.102. No T2 90 1.20
T3 172 1.10T4 123 1.15T5 131 1.17T6 145 1.17T7 155 1.17T8 152 1.11T9 164 1.15
T10 146 1.15T11 89 1.20T12 61 1.30
14. Appointment
3
2
1T1 T2 T3 T4 T5 T6 T7 T8 T9 T10 T11 T12
Resp Avg1. Yes T1 548 1.042. No T2 343 1.04
T3 688 1.07T4 505 1.07T5 705 1.05T6 755 1.05T7 768 1.07T8 790 1.03T9 792 1.07
T10 752 1.06T11 756 1.09T12 538 1.42
15. If the patient had an appointment, when did he/she arrive?
4
3
2
1T1 T2 T3 T4 T5 T6 T7 T8 T9 T10 T11 T12
Resp Avg1. Early - On-time T1 585 1.152. 1-15 minutes late T2 360 1.163. 16-30 minutes late T3 670 1.104. over 30 minutes late T4 493 1.14
T5 692 1.13T6 727 1.09T7 726 1.09T8 779 1.12T9 754 1.18
T10 734 1.18T11 721 1.12T12 343 1.12
2015 Patient Satisfaction SurveyLake Cumberland District Health
Department Trend
Page 5
int. Resp. Avg.T1 585 1.15T2 360 1.16T3 670 1.10T4 493 1.14T5 692 1.13T6 727 1.09T7 726 1.09T8 779 1.12T9 754 1.18T10 734 1.18T11 721 1.12T12 343 1.12
1. Adair 2. Casey 3. Clinton 4. Cumberland 5. Green 6. McCreary 7. Pulaski 8. Russell 9. Taylor10. Wayne
17. County
10987654321
T1 T2 T3 T4 T5 T6 T7 T8 T9 T10 T11 T12
Resp Avg1. Adair T1 675 6.012. Casey T2 387 5.673. Clinton T3 728 6.224. Cumberland T4 559 6.095. Green T5 796 6.126. McCreary T6 809 6.177. Pulaski T7 822 6.308. Russell T8 821 6.169. Taylor T9 840 6.22
10. Wayne T10 801 6.27T11 806 6.33T12 603 6.33
2015 Patient Satisfaction SurveyLake Cumberland District Health
Department Trend
Page 6
int. Resp. Avg.T1 675 6.01T2 387 5.67T3 728 6.22T4 559 6.09T5 796 6.12T6 809 6.17T7 822 6.30T8 821 6.16T9 840 6.22T10 801 6.27T11 806 6.33T12 603 6.33

28 I 2010-11 Annual Report28 I 2014-15 Annual Report
o u r q u a l i t y
50
60
70
80
90
100
DistrictWayneTaylorRussellPulaskiMcCrearyGreenCumb.ClintonCaseyAdair
Ove
rall
scor
e: P
erce
ntag
e
Location
sAFeTY MAnAGeMenT PROGRAM 2015
Ad Ca Cl Cu Gr Mc Pu Ru Ta Wa dist
entrances/exits 100% 100% 100% 100% 100% 100% 100% 100% 100% 100% 100%
General Housekeeping 100% 100% 100% 100% 100% 100% 100% 100% 100% 100% 100%
emergency info/doc 100% 100% 100% 100% 100% 100% 100% 100% 100% 100% 100%
Fire Prevention 100% 100% 100% 100% 100% 100% 100% 100% 100% 100% 100%
Hazard Communication 100% 100% 100% 100% 100% 100% 100% 100% 100% 100% 100%
electrical systems 100% 100% 100% 100% 100% 100% 100% 100% 100% 100% 100%
Utilities & equip Mgmt 100% 100% 100% 100% 100% 100% 100% 100% 100% 100% 100%
Life safety 100% 100% 100% 100% 100% 100% 100% 100% 100% 100% 100%
OVeRALL 100% 100% 100% 100% 100% 100% 100% 100% 100% 100% 100%

www.LCDHD.org I 29
Unit TypeDist. Dist.
Period: Previous Year Current Year Current Month14 15 9 - 15
Provider: dist.
section Total 97% 98% 99%vs. district* 97% 98% 99%
Medical Records Requirements
H&P 13 or 14 94% 95% 94%Referral 100% 89% 100%
CH 12 96% 97% 100%Shot & Lab 98% 99% 100%
CH 2 96% 97% 97%Coding of Service 89% 88% 94%
section Total 95% 95% 97%vs. district* 95% 95% 97%
Immunization/Well Child
WIC CH 5 96% 94% 97%WIC 75 or CH 3A 93% 94% 96%
CH 2 92% 97% 100%WIC 53 98% 94% 100%
CH 12 96% 98% 100%Coding of Service 93% 96% 97%
section Total 94% 95% 97%vs. district* 94% 95% 97%
WiC
ACoG 100% 97% 100%other Required Forms 100% 100% 100%
Required Labs 99% 97% 93%Counseling/Education 100% 100% 100%
Coding of Service 100% 100% 100%section Total 100% 99% 97%
vs. district* 100% 99% 97%
Prenatal Program Record Review
CH 12 96% 97% 97%H&P 13 or 14 97% 98% 98%
Consent Forms 81% 83% 100%CH 3A 99% 99% 94%
Pregnancy Test 94% 95% 90%Coding of Service 90% 88% 97%
section Total 94% 95% 96%vs. district* 94% 95% 96%
Family Planning
Loc. dist.
www.LCDHD.org I 29
o u r q u a l i t y
organizational Threshold
90%UTiLizATiOn ReVieW: Clinics
Ad Ca Cl Cu Gr Mc Pu Ru Ta Wa dist
entrances/exits 100% 100% 100% 100% 100% 100% 100% 100% 100% 100% 100%
General Housekeeping 100% 100% 100% 100% 100% 100% 100% 100% 100% 100% 100%
emergency info/doc 100% 100% 100% 100% 100% 100% 100% 100% 100% 100% 100%
Fire Prevention 100% 100% 100% 100% 100% 100% 100% 100% 100% 100% 100%
Hazard Communication 100% 100% 100% 100% 100% 100% 100% 100% 100% 100% 100%
electrical systems 100% 100% 100% 100% 100% 100% 100% 100% 100% 100% 100%
Utilities & equip Mgmt 100% 100% 100% 100% 100% 100% 100% 100% 100% 100% 100%
Life safety 100% 100% 100% 100% 100% 100% 100% 100% 100% 100% 100%
OVeRALL 100% 100% 100% 100% 100% 100% 100% 100% 100% 100% 100%

30 I 2010-11 Annual Report30 I 2014-15 Annual Report
o u r q u a l i t y
Cancer screening Program
sTds
TB
General Requirements 98% 95% 91%H&P 13 or 14 96% 99% 95%
Required Labs 98% 99% 100%Abnormal Mam. Follow-up 100% 71% 100%
Abnormal Pap. Follow-up 100% 100%Coding of Service 96% 100% 100%
section Total 97% 97% 96%vs. district* 97% 97% 96%
General Requirements 100% 98% 92%Coding of Service 64% 85% 100%
section Total 87% 94% 95%vs. district* 87% 94% 95%
General Requirements 96% 95% 100%Coding of Service 90% 100% 100%
section Total 96% 95% 100%vs. district* 95% 96% 100%
Period: Previous Year Current Year Current Month
14 15 9 - 15
Your entire Chart Total 96% 96% 97%
vs. Other Counties Local Review 97% 98%
vs. district Review for Your County
vs. district Review for entire district* 96% 96% 97%
Previous Year Current Year Current Month
8,753 7,781 1,530398 286 40
14,069 9,744
378 227
8,753 7,781 1,530398 286 40
number of Questions Reviewed
General Site ReviewSupport 90% 93% 88%Nursing 100% 100% 100%
section Total 94% 96% 92%vs. district* 94% 96% 92%
40,3471,289
41,636*This reviews your scores against the average district review team scores for any charts (area) reviewed in any county for the same time period.
0
20
40
60
80
100
Current MonthCurrent YearPrevious Year
Your Entire Chart Total District Review for Entire District*
UTiLizATiOn ReVieW: Clinics

www.LCDHD.org I 31www.LCDHD.org I 31
The Human Resources (HR)Office continued to oversee the following:
• recruitment program and new employee orientation• employee performance evaluation program• employee benefit programs and required paperwork• personnel actions in accordance with Local Health Merit System
The Human Resources Office has completed a Workforce DevelopmentPlan as part of the upcoming accreditation efforts. This plan indicates the many areas the agency is assisting employees such as new employee orientation, employee training, employee morale and incentives, as well as health and wellness programs. It is rewarding to work with excellent dedicated staff within the HR Office and across our ten counties. I look forward to continuing to work with all of our employees in the future as they continue to make a difference in our communities each day.
Pam Godby,BS, MAHuman ResourcesManager
o u r s t a f f
statistics for Fiscal Year 2014 - 2015(November 2014 – November 2015)
HR Office is staffed with 2.5 FTe employees
The agency had 54 full time employees go off duty in the period
14 new full time employees were hired during the same period
Merit employees decreased by 40 full time employees from 221 to 181
employee worksites reduced from 59 to 11
In addition LCDHD has assumed responsibility for 30 school sites under the new school health model. LCDHD conducts administrative oversight and quality assurance for these sites.
Human Resources

32 I 2014-15 Annual Report
EMPLoYEES
ADAIRAkin, Rhonda G. Nurse Supv 1Brendel, Jacquelyn M. APRNDillingham, Crystal G. LPN 2Dye, Angela D. SSSupv 1Greer, Destiny R. LHN 2Hale, Pamela J. FSW IIIHarlow, Jelaine T. H Educator 3Kemp, Lisa A. LPN 2Lawhorn, Marsha C. SSSA 2Matthews, Shannon M. SSSA 2Melson, Cynthia G. SSSA 2Patterson, Corey L. H Envir 2Walker, Julia B. LHN 4/Team LdrWillis, LaDonna J. PH HANDS Spec CASEY Bowmer, Natasha L. Nurse Supv 1Brown, Lisa C. LHN 4/Team LdrCoffman, Angelia M. PH HANDS Spec Kane, Kimberly M. SSSA 2Porter, Sandra K. SSSupv 1Stevens, Regina A. MNT Nutritit 3Watson-Wethington, Karen LHN 2Wesley, Michelle L. SSSA 2Wilson, Kelly R. PH HANDS Spec CLINToN Albertson, Vicky L. LHN 2Arterburn, Jessica A. LHN 2Beaty, Shannon G. PH HANDS Spec Brown, Jennifer C. PH HANDS Spec Flowers, Wanda P. SSSA 2Fryman, Etta G. SSSupv 1Parrish, Donna J. Nurse Supv 1Prater, Sabrina R. LHN 4/Team LdrThrasher, Christy J. SSSA 2
CUMBERLAND Capps, Heather R. LHN 2Coe, Raykesha N. SSSA 2England, Amanda J. EpidemiologistGibson, Sherri L. Nurse Supv 1Long, Betty S. JanitorNettles, Cindy J. SSSupv 1Patterson, Chasity N. H Envir 2Riley, Martha J. Janitor DISTRICT Acey, Pamela J. Nutrition Serv SupvAnderson, Lisa G. Adm SecBaker, John T. Acct Clerk 3Bourne, Shyla D. Accounting SupvBullock, Victoria L. Tech Speclst IICook, William L. JanitorCopenhaver, Lauren F. Acct Clerk 2Copenhaver, Melinda H. Admin Serv MgrCrabtree, Shawn D. PH Dir 4Crist, Joan Accounting SupvCross, DeAnn S. Adm SecDixon, Ashley E. Acct Clerk 2Godby, Pamela A. Human Res MgrHamm, Priscilla J. PH Serv CoordHarris, Lisa A. Acct Clerk 3Huckelby, Carol A. Adm SecJasper, Leah A. Dir Adm SerLivesay, Vickie F. Acct Clerk 3McFeeters, Daniel J. Information MgrMcGowan, Michael D. Maint SupvMeece, Tina R. SSSA 2Munsey, Wilma J. HR AssistantRamsey, Brian K. Tech Speclst ISilvers, Mary J. Acct Clerk 3Simpson, Angela L. Adm SecSmith, Melinda J. Tech Speclst I
2015
o u r s t a f f

www.LCDHD.org I 33
CUMBERLAND Capps, Heather R. LHN 2Coe, Raykesha N. SSSA 2England, Amanda J. EpidemiologistGibson, Sherri L. Nurse Supv 1Long, Betty S. JanitorNettles, Cindy J. SSSupv 1Patterson, Chasity N. H Envir 2Riley, Martha J. Janitor DISTRICT Acey, Pamela J. Nutrition Serv SupvAnderson, Lisa G. Adm SecBaker, John T. Acct Clerk 3Bourne, Shyla D. Accounting SupvBullock, Victoria L. Tech Speclst IICook, William L. JanitorCopenhaver, Lauren F. Acct Clerk 2Copenhaver, Melinda H. Admin Serv MgrCrabtree, Shawn D. PH Dir 4Crist, Joan Accounting SupvCross, DeAnn S. Adm SecDixon, Ashley E. Acct Clerk 2Godby, Pamela A. Human Res MgrHamm, Priscilla J. PH Serv CoordHarris, Lisa A. Acct Clerk 3Huckelby, Carol A. Adm SecJasper, Leah A. Dir Adm SerLivesay, Vickie F. Acct Clerk 3McFeeters, Daniel J. Information MgrMcGowan, Michael D. Maint SupvMeece, Tina R. SSSA 2Munsey, Wilma J. HR AssistantRamsey, Brian K. Tech Speclst ISilvers, Mary J. Acct Clerk 3Simpson, Angela L. Adm SecSmith, Melinda J. Tech Speclst I
DISTRICT (cont.)Sneed, Robyn L. Acct Clerk 3Thomas, Bethany A. oursler Nurse AdminisTomlinson, Amy C. PH Preprdnes MgrWeyman, Christine Med DirYoung, Roger A. Maintenance Per GREEN Bush, Kaylene W. Nurse Supv 1Davis, Lori R. LHN 2Durrett, Stella A. SSSupv 1Green, Timothy D. H Envir 2Hodges, Jaclyn E. H Educator 3Perkins, Sharon A. SSSA 1 McCREARY Burke, Loretta L. FSW IIICreekmore, Tina A. SSSA 2Farrington, Donna E. PH HANDS Spec Garner, Melissa K. SSSA 2Gaskin, Jeanne F. Nurse Supv 1Keith, Gwendolyn E. Lab TechKing, Tammy J. FSW 1Lair, Heather M. LHN 1Matthews, Lois A. SSSA 2Miller, Mary E. LHN 2Roberts, Courtney L. H Educator 1Simpson, Jarrod W. H Envir 2Strunk, Rhonda M. LHN 1Trammell, Melissa K. JanitorTucker, Kimberly A. SSSupv 1Warman, Kimberly K. SSSA 2Wells, Melissa A. LHN 4/Team LdrWest, Christopher W. JanitorYadon, Sandra G. LHN 2 PULASKI Adams, Susan J. FSW IIIAnderson, Jacqueline F. LHN 1Baker, Rebecca L. LHN 2Bender, Brigette E. SSSupv 2Burton, Patricia L. H Educator 3
PULASKI (cont.)Catron, Tammy E. SSSA 2Chriswell, Rachel A. LHN 1Dancy, Peggy L. Nurse Supv 2Denney, Monica D. SSSA 2Eaton, Marilyn L. Sr Clncl AsstGregory, Dorthy SSSA 2Hall, Karen S. LHN 2Hall, Thomas J. SSSA 2Hamilton, Jeremy S. H Envir 2Harris, Jennifer Kay APRNHickman, IV Jefferson Env Hlth Prog MgrHopkins, Angel D. LHN 4/Team LdrJenkins, Tamara L. Lab TechMayberry, Deborah E. PH HANDS Spec McGahan, Sabrina L. LHN 2McKnight, Belinda K. SSSA 3-EnvMorris, Wilda C. PH HANDS Spec osborne, Deana S. SSSA 2Ping, Kathy J. FSW IIIPollitt, Shawnda D. SSSA 2Poynter, Ashley M. SSSA 2Poynter, Peggy L. Adm SecPrice Jr., Ferlin S. H Envir 2Spillman, Michael S. Env Hlth DirTrull, Norma J. LHN 2Tuggle, April D. FSW 2Wesley, Sharon S. LPN 2West, Brian D. JanitorWiedeman, Devan A. H Envir 1 RUSSELL Aaron, Tracy R. H. Ed DirectorBrockman, Beverly A. Nurse Supv 1Collins, Arlena BethAnn PH HANDS Spec Cummings, Candi L. SSSA 2Curry, Ashley D. SSSA 2Dial, Brenda S. LHN 4/Team LdrDye, Jonathan P. H Envir 2Heathman, Judy C. LHN 2Jones, Jane C. SSSupv 1 Keen, Donna E. LHN 2
o u r s t a f f

34 I 2014-15 Annual Report
RUSSELL (cont.)Lee, Jamie L. Nurs Prog MgrMann-Polston, Connie M. PH HANDS Spec Roberson Daulton, Shirley A. H Educator 3Smith, Melody A. LHN 2Spradlin, Connie L. LHN 2Tucker, Bonnie L. SSSA 2Whitis, Sonya L. LHN 2Woodrum, Laura E. Nurse Adminis TAYLoR Arnold, Connie M. LHN 4/Team LdrBender, Frances R. Nurse Supv 1Cowherd, Janet F LHN 2Dykes, Valerie A. H Envir 2Franklin, Anita L. LHN 2Griffiths, Allison S. SSSupv 1Hall, Monica R. LHN 2Harrison, Megan R. LHN 2Lewis, Savannah L. PH HANDS Spec Milby, Janet L. SSSA 2Murphy, Joyce C. LPN 2Pickett, Tammy G. FSW IIIWarner, Samuel JanitorWhitfill, Dawn P. LHN 2Wright, Tracy D. SSSA 2
WAYNE Atkinson, Rebecca R. FSW IIIBridgman, Ashley N. H Educator 1Daniels, Shirley D. SSSA 2East, Charlotte K. SSSA 2Ferrell, Sylvia E. Nurse AdminisGregory, Lisa W. LHN 4/Team LdrJones, Sandra L. SSSupv 1Lair, Heather M. LHN 2McGinnis, Danielle N. PH HANDS SpecRamsey, Mary F. PH HANDS Spec Redman, Laura D. LHN 2Spears, Lora B. H Envir 2Tucker, Anna Janae LHN SpecialistTurner, Lori C. Nurse Supv 1Upchurch, Kristi D. LHN 4/Team LdrYork, Nita J. SSSA 2
o u r s t a f f
Casey
Pulaski
Wayne
Clinton
Cumberland
Adair
Russell
TaylorGreen
McCreary

Michael CashJanitorMcCreary CountyMay 13, 2002 to May 31, 2015
www.LCDHD.org I 35
WAYNE Atkinson, Rebecca R. FSW IIIBridgman, Ashley N. H Educator 1Daniels, Shirley D. SSSA 2East, Charlotte K. SSSA 2Ferrell, Sylvia E. Nurse AdminisGregory, Lisa W. LHN 4/Team LdrJones, Sandra L. SSSupv 1Lair, Heather M. LHN 2McGinnis, Danielle N. PH HANDS SpecRamsey, Mary F. PH HANDS Spec Redman, Laura D. LHN 2Spears, Lora B. H Envir 2Tucker, Anna Janae LHN SpecialistTurner, Lori C. Nurse Supv 1Upchurch, Kristi D. LHN 4/Team LdrYork, Nita J. SSSA 2
RETIREES2015
Carol LaneAccounting Supervisordistrict OfficeApril 27, 1981 to July 31, 2015
Cheryl ClarkSupport Supervisor ITaylor CountyAugust 19, 1991 to June 30, 2015
Fay delcampNurse Supervisor 1Wayne CountyDecember 30, 1985 to January 31, 2015
o u r s t a f f
Congratulations!
sharon WesleyLPN IIPulaski CountyNovember 13, 1989 to June 30, 2015
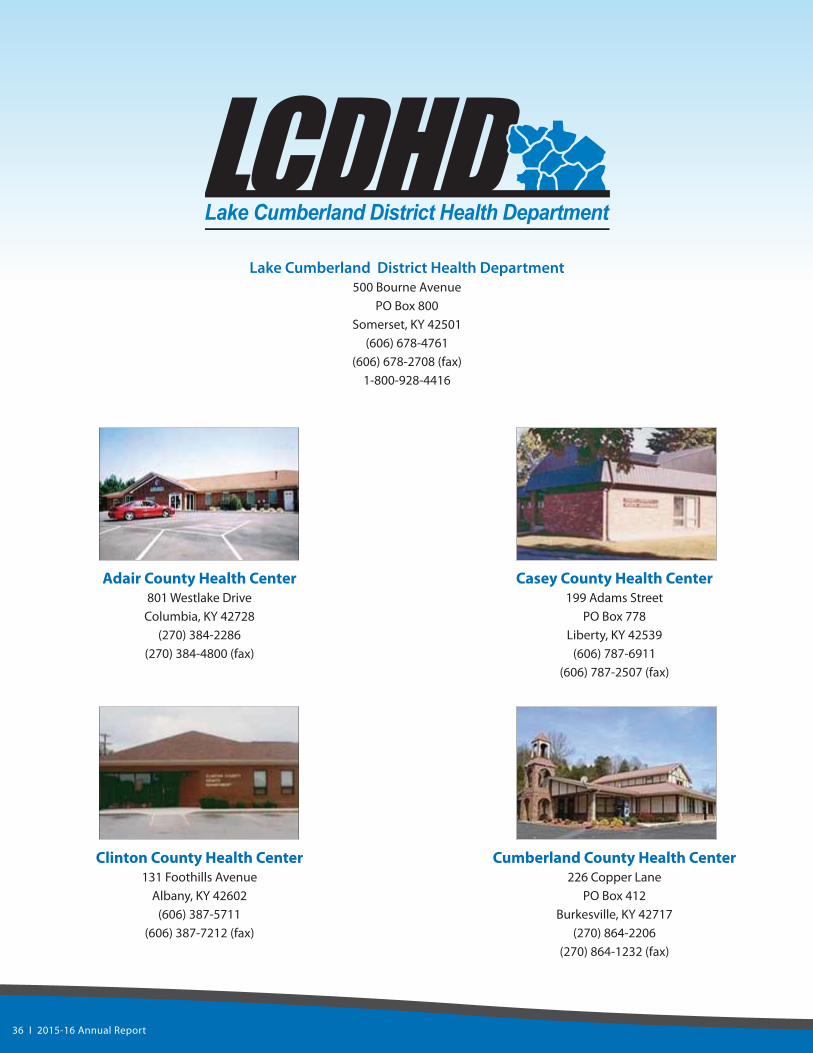
36 I 2010-11 Annual Report
Lake Cumberland district Health department500 Bourne Avenue
Po Box 800Somerset, KY 42501
(606) 678-4761(606) 678-2708 (fax)
1-800-928-4416
Adair County Health Center801 Westlake Drive
Columbia, KY 42728 (270) 384-2286
(270) 384-4800 (fax)
Casey County Health Center199 Adams Street
Po Box 778Liberty, KY 42539
(606) 787-6911(606) 787-2507 (fax)
Clinton County Health Center131 Foothills Avenue
Albany, KY 42602(606) 387-5711
(606) 387-7212 (fax)
Cumberland County Health Center226 Copper Lane
Po Box 412Burkesville, KY 42717
(270) 864-2206(270) 864-1232 (fax)
Green County Health Center220 Industrial Park
Po Box 177Greensburg, KY 42743
(270) 932-4341(270) 932-6016 (fax)
Pulaski County Health Center45 Roberts Street
Somerset, KY 42501(606) 679-4416
(606) 679-4419 (fax)
Taylor County Health Center1880 N. Bypass Road
Campbellsville, KY 42718(270) 465-4191
(270) 789-3873 (fax)
36 I 2015-16 Annual Report
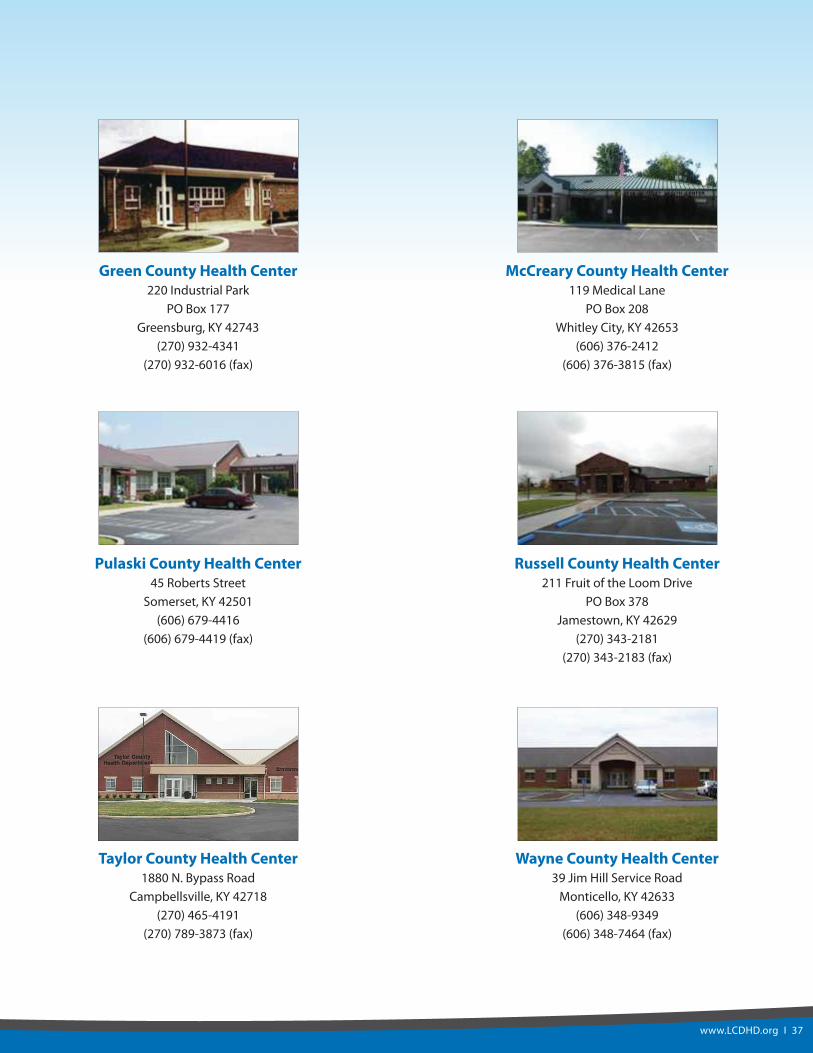
www.LCDHD.org I 37
Green County Health Center220 Industrial Park
Po Box 177Greensburg, KY 42743
(270) 932-4341(270) 932-6016 (fax)
McCreary County Health Center119 Medical Lane
Po Box 208Whitley City, KY 42653
(606) 376-2412(606) 376-3815 (fax)
Pulaski County Health Center45 Roberts Street
Somerset, KY 42501(606) 679-4416
(606) 679-4419 (fax)
Russell County Health Center211 Fruit of the Loom Drive
Po Box 378Jamestown, KY 42629
(270) 343-2181(270) 343-2183 (fax)
Taylor County Health Center1880 N. Bypass Road
Campbellsville, KY 42718(270) 465-4191
(270) 789-3873 (fax)
Wayne County Health Center39 Jim Hill Service Road
Monticello, KY 42633(606) 348-9349
(606) 348-7464 (fax)
www.LCDHD.org I 37

38 I 2010-11 Annual Report
A Healthy Today for a Brighter Tomorrow.
w w w. LC D H D. o r g