anti-china rhetoric, presidential elections and u.s
TRANSCRIPT

ANTI-CHINA RHETORIC, PRESIDENTIAL ELECTIONS AND U.S. FOREIGN POLICY TOWARDS CHINA
A Dissertation Submitted to the Faculty of the
Graduate School of Arts and Sciences of Georgetown University
in partial fulfillment of the requirements for the degree of
Doctor of Philosophy in Government
By
Xiaodong Fang, M.A.
Washington, DC May 16, 2016

ii
Copyright 2016 by Xiaodong Fang All Rights Reserved

iii
ANTI-CHINA RHETORIC, PRESIDENTIAL ELECTIONS AND U.S. FOREIGN POLICY TOWARDS CHINA
Xiaodong Fang, M.A.
Thesis Advisor: Stephen J. Wayne, Ph.D.
ABSTRACT
Is anti-China rhetoric an effective strategy in U.S. presidential campaigns? If the
answer is Yes, then to what extent does anti-China rhetoric affect them? If the answer is
No, then why have so many presidential candidates used anti-China rhetoric in recent
campaigns? Is anti-China rhetoric only election-driven? Is it also policy-driven? Do
presidential candidates use anti-China rhetoric to seek voter support, as well as propose
changes in U.S. foreign policy towards China?
Conventional wisdom and scholars like Robert Sutter suggest that foreign policy
has little effect on American presidential elections and anti-foreign rhetoric by
presidential candidates does not matter to American foreign policy and foreign relations.
In this dissertation, however, I argue the opposite that anti-China rhetoric exercises
significant influence on American presidential elections and foreign policy towards
China. The dissertation addresses two fundamental questions: 1) what is the effect of
anti-China rhetoric on American presidential elections? And 2) what is the effect of anti-
China rhetoric on American foreign policy towards China, American public opinion
towards China, and U.S.-China relationship? To answer the first question about elections,
I focus on televised campaign commercials and statistically estimate the effect of anti-
China rhetoric on seeking voter support in the presidential election. The data I examine
come from the “Wisconsin Advertising Project” and various election polls in 2008. I

iv
answer the second question about foreign policy by exploring the contents of anti-China
rhetoric in campaign activities including ads, candidates’ speeches and debates, and
public statements about policy towards China and how that rhetoric affects subsequent
American foreign policy towards China, as well as public opinion of China and U.S.-
China relations. My statistical and qualitative analyses find that airing ads using anti-
China rhetoric increases the presidential candidate’s voter support in target states; that the
administration is more likely to make tough foreign policies towards China when there is
more anti-China rhetoric by presidential candidates; and thirdly, that anti-China rhetoric
during the election year negatively affects American opinions of China but produces a
positive impact on U.S.-China relations.

v
I want to express my deepest gratitude to my advisor, Stephen Wayne, and dissertation
committee members, Hans Noel and Kristen Looney. They have given invaluable
inspiration, guidance, and support to my study with their profound knowledge and
wisdom in the fields of American politics and foreign policy towards China. My gratitude
is extended to the Faculty of the Department of Government and the colleagues I have
worked with at Georgetown. I am proud of being a part of the rich academic community
created by them, and I have greatly benefited from them.
Many thanks,
Xiaodong Fang

vi
TABLE OF CONTENTS Introduction ...................................................................................................................... 1 1 Background of Anti-China Rhetoric in U.S. Presidential Campaigns ........................ 3
1.1 Foreign Bashing ............................................................................................. 3
1.2 Anti-China Rhetoric ....................................................................................... 3 2 Theory of Campaign Advertising Effect and Domestic Sources of Foreign Policy ............................................................................................................. 6
2.1 Theory of Campaign Advertising Effect ........................................................ 6 2.2 Domestic Factors of Foreign Policy ............................................................ 13
2.3 Permanent Campaign and Campaign Promise ............................................. 20 2.4 The White House Statement and China Policy ............................................ 22
3 Anti-China Rhetoric and Voter Support ................................................................... 28
3.1 Data and Method .......................................................................................... 29 3.2 Results .......................................................................................................... 40 3.3 What Happened with the “Sold Us out” Ads Airing? Financial Crisis ....... 53
3.4 Comparative Studies: The “Real Change” Ads and the “Alternative” Ads.. 59
3.5 Conclusion ................................................................................................... 66
4 Anti-China Rhetoric, U.S. Foreign Policy towards China and Public Opinion…..... 67
4.1 Overview ...................................................................................................... 67
4.2 Method and Sources ..................................................................................... 68 4.3 Findings ....................................................................................................... 75
4.4 Congress and Anti-China Rhetoric in Presidential Campaign ..................... 90
4.5 Public Opinion: A Periodic Effect ............................................................... 93
4.6 Conclusion ................................................................................................... 95

vii
5 Case Studies: China’s Trade and Currency Issues .................................................... 96
5.1 Anti-China Rhetoric and President’s Policy ................................................ 97
5.2 Obama’s Promise and Performance: A Long-Term Effect ........................ 103
5.3 China’s Response ....................................................................................... 107 5.4 Conclusion ................................................................................................. 114
Conclusions ................................................................................................................. 115
Limitations and Future Studies ........................................................................ 115 Findings and Implications ................................................................................ 116
Appendices ................................................................................................................... 120
Appendix A. Transcripts of the Ads Used in the Research ............................. 120
Appendix B. Polling Information Used by RealClearPolitics.com ................. 122
Appendix C. Detail Polling Data by State during the Research Period ........... 132
Appendix D. Content of the Anti-China Rhetoric and White House Statements ... ........................................................................................................................... 138 Appendix E. Participants of the First Round Joint Meeting of the U.S.–China Strategic and Economic Dialogue (S&ED) Held in Washington, D.C. from July 27-28, 2009............................................................................................... 142
Bibliography ................................................................................................................ 144

viii
LIST OF FIGURES Figure 1. Means of Obama’s Daily Polls of the 15 Target States .................................. 33 Figure 2. Average Change of Obama’s Vote Share in the 15 Target States’ Daily Polls .. ........................................................................................................................................ .34 Figure 3. Average Count of Whether “Sold Us Out” Ads Are Aired in the 15 Target States .............................................................................................................................. 34 Figure 4. Average Daily Amount of “Sold Us Out” Ads Airing in the 15 Target States ... ......................................................................................................................................... 35 Figure 5. Average Daily Spending on Airing the “Sold Us Out” Ads in the 15 Target States .............................................................................................................................. 35 Figure 6. Obama’s Daily Ad Amount in the 15 Target States ....................................... 36 Figure 7. McCain’s Daily Ad Amount in the 15 Target States ..................................... 37 Figure 8. Obama's Ad Spending in the 15 Target States ............................................... 37
Figure 9. McCain’s Ad Spending in the 15 Target States ............................................. 38 Figure 10. Unemployment Rates of the 15 Target States, September 2008 .................. 39 Figure 11. Airing “Sold Us Out” Ads and Obama’s Change of Vote Share in the 15 Target States’ Daily Polls .............................................................................................. 50 Figure 12. Change of Obama’s Vote Share in the National Poll and Change of the Dow Jones Industrial Averages .............................................................................................. 54
Figure 13. Obama’s Vote Share of National Poll and Average of the 15 Target State Polls ................................................................................................................................ 56
Figure 14. Change of Obama’s Vote Share in the 15 Target States’ Poll and Change of the Dow Jones Industrial Averages ................................................................................ 56 Figure 15. Obama’s Vote Share of Public Support in the Ohio Poll ............................. 57 Figure 16. Amount of the New York Times Articles Regarding Anti-China Rhetoric in Presidential Campaign ................................................................................................... 69 Figure 17. Amount of the New York Times Articles Regarding Anti-China Rhetoric in Presidential Campaign (by Issue Category) ................................................................... 69

ix
Figure 18. Amount of Anti-China Rhetoric from Romney and GOP (by Issue Category) ......................................................................................................................................... 70 Figure 19. Amount of the White House Statements Taking a Tough Stance on China (by Issue Category) .............................................................................................................. 75 Figure 20. Amount of President’s Tough Statements on China and the New York Times Articles of Anti-China Rhetoric in Presidential Campaign ........................................... 76 Figure 21. Romney’s and/or GOP’s Anti-China Rhetoric and the Response from the White House, from Mar. to Jun. 2012 ........................................................................... 77 Figure 22. Romney’s and/or GOP’s Anti-China Rhetoric and the Response from the White House, from Jul. to Nov. 2012 ............................................................................ 78 Figure 23. Obama’s Anti-China Campaign Rhetoric and Reinforcement by the White House, from Mar. to Jun. 2012 ...................................................................................... 80 Figure 24. Obama’s Anti-China Campaign Rhetoric and Reinforcement by the White House, from Jul. to Nov. 2012 ....................................................................................... 81 Figure 25. Amount of the President’s Tough Statements on China and the New York Times Articles of Anti-China Rhetoric in the 2012 Presidential Campaign (Economic Issues) ............................................................................................................................ .86 Figure 26. Anti-China Rhetoric and Anti-China Congressional Activities ................... 91 Figure 27. American Public Opinion of China .............................................................. 94 Figure 28. Amount of Anti-China Rhetoric and the President’s Tough Statements on China’s Trade and Currency Issues ............................................................................... 98 Figure 29. The Growth of Chinese (Yuan) RMB against USD, from Mar. 1 to Nov. 6, 2012.............................................................................................................................. 108 Figure 30. The Growth of Chinese (Yuan) RMB against USD, from Mar. 1 to Dec. 26, 2014.............................................................................................................................. 109
Figure 31. The 15 Days Growth of Chinese (Yuan) RMB against USD after the 2009 U.S.–China Strategic and Economic Dialogue Annual Meeting ................................. 111 Figure 32. The 15 Days Growth of Chinese (Yuan) RMB against USD after the 2010 U.S.–China Strategic and Economic Dialogue Annual Meeting ................................. 112
Figure 33. The 15 Days Growth of Chinese (Yuan) RMB against USD after the 2011 U.S.–China Strategic and Economic Dialogue Annual Meeting ................................. 112

x
Figure 34. The 15 Days Growth of Chinese (Yuan) RMB against USD after the 2012 U.S.–China Strategic and Economic Dialogue Annual Meeting ................................. 113 Figure 35. The 15 Days Growth of Chinese (Yuan) RMB against USD after the 2013 U.S.–China Strategic and Economic Dialogue Annual Meeting ................................. 113

xi
LIST OF TABLES
Table 1. China FDI of the 15 Target States, 2000-2008 ................................................ 39 Table 2. Airing “Sold US Out” Ads and Obama’s Next Day State Polls ...................... 41
Table 3. Amount of “Sold US Out” Ads and Obama’s Next Day State Polls ............... 42
Table 4. Spending on “Sold US Out” Ads and Obama’s Next Day State Polls ............ 43 Table 5. Airing “Sold US Out” Ads and the Change in Obama’s State Polls ............... 44 Table 6. Amount of “Sold US Out” Ads and the Change in Obama’s State Polls ........ 45 Table 7. Spending on “Sold US Out” Ads and the Change in Obama’s State Polls ..... 46 Table 8. “Sold US Out” Ads and Obama’s Next Day State Polls ................................. 47
Table 9. “Sold US Out” Ads and the Change in Obama’s State Polls ........................... 49
Table 10. The 2008 Presidential Election Results for Obama in the 15 Target States .. 52
Table 11. “Real Change” Ads and Obama’s Next Day State Polls ............................... 61 Table 12. “Real Change” Ads and the Change in Obama’s State Polls ........................ 62 Table 13. “Alternative” Ads and Obama’s Next Day State Polls .................................. 64
Table 14. “Alternative” Ads and the Change in Obama’s State Polls ........................... 65 Table 15. Selected Events and Statements from the Obama Administration in 2009 ... 73 Table 16. Selected Events and Statements from the Obama Administration in 2010 and in 2011 ........................................................................................................................... 73 Table 17. Amount of Anti-China Congressional Activities ............................................ 92
Table 18. The New York Times Anti-China Rhetoric on Trade and Currency Issues and the Response by the White House .................................................................................. 99

1
Introduction
Anti-China rhetoric in the presidential campaign has been widely reported and
discussed in news media in recent years. However, few academic studies using scientific
methodology have shed light on this phenomenon. Are anti-China rhetoric strategies
useful? What impact (if any) does the anti-China rhetoric have on voters? Is it an
effective strategy for presidential candidates to spend millions of dollars airing anti-China
ads? Has anti-China rhetoric affected the American public’s perception of China? Are
anti-China rhetoric ads policy-oriented? Has anti-China rhetoric oriented U.S. foreign
policy making towards China and affected the U.S.-China relations? These questions,
underexplored in the literature, are examined in the dissertation.
Conventional wisdom suggests that foreign policy issues have little effect on U.S.
presidential elections and anti-China rhetoric during campaigns does not matter to U.S.-
China relations.1 and 2 However, I argue that anti-China rhetoric and China issue can make
a difference. In this dissertation, I examine the effect of anti-China rhetoric on the U.S.
presidential elections through a systematic analysis of campaign advertising, election
results and polls, and U.S. policy towards China in the election years 2008 and 2012. I
also conduct qualitative analyses of anti-China rhetoric in campaign speeches and debates
to examine if anti-China rhetoric strategies affect U.S. foreign policy and American
public opinions of China. If so, how they have done so. The findings of the study
contribute to the literature on presidential campaigns, foreign policy, and China issues, as
1 Compared to domestic policies, foreign policies appear to have negligible impact on voting behavior because American voters possess little information and weak attitudes on foreign affairs, and domestic issues have more direct and immediate consequences on people’s lives (e.g. Almond 1950). 2 For example, Robert Sutter (1998) suggested that U.S.-China relations were following a historical trend and independent from other factors.

2
well as provide valuable insights for understanding anti-China campaign rhetoric’s past,
present, and future.
The thesis proceeds as follows. In Chapter 1, I introduce the subject of anti-China
rhetoric in U.S. presidential elections. In Chapter 2, I review the related literature on
campaign advertising and the foreign policy process and identify the weaknesses in the
existing literature. In Chapter 3, I conduct a statistical analysis of anti-China rhetoric in
the campaign advertisement. In Chapter 4, I explore the anti-China rhetoric strategies of
various campaigns to anticipate their possible effect on foreign policy and public opinion.
In Chapter 5, I conduct case studies on China’s trade and currency issues to support my
argument that anti-China rhetoric during presidential campaigns affects the American
foreign policy towards China and U.S.-China relations. In Chapter 6, I conclude the
thesis with a discussion of significance, limitations and suggestions for future research.

3
Chapter 1. Background of Anti-China Rhetoric in U.S. Presidential Campaigns
1.1 Foreign Bashing
“Political ads are the leading indicator of the next set of policies.” --- Evan Tracey,
President of the Campaign Media Analysis Group October 29, 2010
Foreign bashing is not uncommon in American politics. In the Cold War era, as
the Soviet Union’s military might posed a threat to the U.S. global security interests and
the growing Japanese economy invaded the U.S. electronic and automotive markets, the
anti-Soviet and anti-Japan rhetoric became weapons in the public relations war being
waged in Washington over U.S.-Soviet and U.S.-Japan policy. Though anti-Soviet and
anti-Japan rhetoric were widely reported in news media and used in campaign activities,
they played little role in shaping voter preferences in U.S. presidential election, as well as
in American foreign policy making towards the Soviet Union and Japan (Ornstein 1992).
As the Soviet Union collapsed in 1991 and Japan’s “bubble economy” burst in the late
1980s and went into recession, the bashing subsided.
1.2 Anti-China Rhetoric
The anti-China rhetoric in recent presidential elections is more influential than the
anti-Soviet and anti-Japan rhetoric in 1980’s and 1990’s: it arouses more public concern
on a rising power that poses both economy and military threats to the U.S. leadership in
the current international order; it raises prominent issues with China, including job
outsourcing and unfair trade, that affected the recessional and/or recovering domestic
economy and job market in U.S.; and it happens at a time when campaign finance is less

4
limited, and media and interest groups play greater roles in shaping voter preference than
before.
Since the end of the Cold War, China has undertaken dramatic military and
economic growth that poses a threat to America’s leadership and interests in the current
international arena, portending the possible decline of the American influence in East
Asia. During the financial crisis that began in 2007 and continued through the 2008
presidential election, economic growth in the United States declined, while China's
economy continued grew. The average annual change of the Gross Domestic Product
(GDP) in the U.S. was +0.8% from 2007 to 2012, while the average annual change in
GDP in China was +10.1% during the same period.3 A Pew survey in 2009 found that 41
percent of the American public said the United States played a less important and
powerful role as a world leader today than it did 10 years earlier; and 44 percent of the
American public in 2009 said China was the world’s leading economic power, while just
27% named the United States.4 “With the economy in recession, America had fewer
carrots and fewer sticks with which to influence the behavior of other states. Voters had
to consider how each candidate would perform in a world that was increasingly
dominated by Chinese interests and which candidate was best equipped to work
3 Data Source: GDP growth page on The World Bank website http://data.worldbank.org/indicator/NY.GDP.MKTP.KD.ZG. 4 Results for the general public survey are based on telephone interviews conducted under the direction of Abt SRBI Inc. among a national sample of 2,000 adults living in the continental United States, 18 years of age or older, from October 28-November 8, 2009. See “U.S. Seen as Less Important, China as More Powerful,” Pew Research Center for the People & the Press. December 3, 2009. http://www.people-press.org/2009/12/03/us-seen-as-less-important-china-as-more-powerful/

5
constructively with China in order to pursue U.S. strategic interests.”5 According to the
dataset of Wisconsin Advertising Project, campaign ads using anti-China rhetoric were
aired about 16,000 times throughout the country during the 2008 presidential campaign,
which built up to 1.4% of all campaign ads in quantity. Apart from campaign ads, anti-
China rhetoric was used in speeches, debates and other public statements throughout the
campaign period. The news and reports of the anti-China rhetoric in media coverage
further increased its potential influence on voters’ choice and U.S. foreign policy towards
China. Over the course of 2012 presidential campaign, 52 articles regarding anti-China
rhetoric in presidential campaign were published in the New York Times.6
It had become a popular strategy for presidential candidates to use China as a
scapegoat for America’s domestic woes and accused their opponents of supporting
policies that favored China’s boom but harmed American interests. However, the
effectiveness of using anti-China rhetoric in seeking voter support and its consequences
on U.S. foreign policy towards China has not been substantiated. To bridge the gap, I
explore the anti-China rhetoric by presidential candidates and use scientific
methodologies to examine its effect on voter choice, and on foreign policy in recent
presidential campaigns.
5 See Richard Komaiko, “China and the US Presidential Election.” Asia Sentinel. www.asiasentinel.com. 6 The statistics are calculated based on the publication obtained from the New York Times. www.nytimes.com; The 2012 presidential campaign period indicates the period from Mar.1 to Nov. 6, 2012.

6
Chapter 2. Theory of Campaign Advertising Effect and Domestic Sources of Foreign Policy 2.1 Theory of Campaign Advertising Effect
Campaign advertising in broadcast media is one of the most important
mechanisms that parties, candidates, and interest groups use to appeal to voters. In the
2008 presidential campaign, broadcast media expenditures of both candidates
($360,748,127) were much higher than those of Internet media ($43,605,647), print
media ($21,850,368) and miscellaneous media ($273,784,015).7 The 2012 presidential
campaign witnessed a dramatic increase in TV ads spending: $896 million were spent on
TV ads for both candidates ($404 million for Barack Obama and $492 million for Mitt
Romney).8
Many studies are examining the impact of campaign activities - including
campaign advertising - on voter turnout. Some scholars argued that campaign activities
mobilized voters (Wielhouwe and Lockerbie 1994; Goldstein and Freedman 2002;
Freedman, Franz, and Goldstein 2004; McClurg 2005; Hillygus 2005; and etc.). They
believed that campaign activities credited active efforts to campaign aggressively and
brought voters to the polls. Wielhouwe and Lockerbie (1994) focused on the party
activities from 1952 to 1990 and found that parties continued to be active organizations,
and contacted one-fifth to one-quarter of the electorate, an activity that had important
consequences. Specifically, when contacted by the parties, individuals had a greater
propensity to vote and to engage in other political activities. Holbrook and McClurg
7 See Center for Responsive Politics, “Presidential Expenditures for 2008.” www.opensecrets.org/pres08/expenditures 8 See Washington Post, “Mad Money: TV ads in the 2012 presidential campaign.” http://www.washingtonpost.com/wp-srv/special/politics/track-presidential-campaign-ads-2012/

7
(2005) argued that voter turnout was positively influenced by presidential campaigns,
though not by all campaign activities. They found evidence that campaigns had direct
effects on the participation of core partisan groups; and the ability of parties to mobilize
their core groups had a strong effect on state electoral success that existed over and above
the direct effect of campaign activity on state electoral outcomes (Holbrook and McClurg
2005). Campbell (2000) used aggregated National Election Study data from 1952 to 1996
and found that the relative turnout of partisan groups played a key role in shaping
presidential elections at the national level, although this impact was clearly secondary to
that of partisan loyalty.
In terms of campaign advertising, Gerber et al. (2011) argued that the effects of
televised campaign ads were strong but short-lived. To determine whether paid
advertising was capable of producing noticeable shifts in voter support, Gerber et al.
(2011) conducted a large-scale experiment involving paid political advertising during the
2006 gubernatorial campaign in Texas. In that study the researchers randomly assigned
the launch date and volume of television advertising in each experimental media market
to gauge movement in public opinion; the researchers also conducted brief telephone
interviews with approximately 1,000 registered voters each day during the opening
months (from January to March) of a 2006 gubernatorial campaign, and conducted a brief
follow-up interview one month after the conclusion of the television campaign. The
results indicated that televised ads had strong but short-lived effects on voting
preferences (Gerber et al. 2011). In another study of campaign advertising, Sides and
Vavreck (2013) argued that the difference of two candidates’ campaign ads in quantity

8
did shift votes in their favor. They used “Gross Rating Point” (GRPs)9 obtained from the
Nielsen Company to measure the difference between the effects of Obama and Romney’s
advertising intensity in June and July 2012, and combined these advertising data with
weekly YouGov polls thereby matching each respondent to the advertising in his or her
media market. Their statistical analysis suggested that other things being equal, a
candidate who had a 100-GRP advantage in a market – about one ad per capita more than
his opponent aired – could expect to gain almost an additional point of vote share,
compared to a market in which the two candidates were at parity in their televising
advertising (Sides and Vavreck 2013). However, they also found that neither presidential
candidate was able to pull hard enough for long enough to change the dynamic of the race
because two campaigns largely neutralized each other’s efforts (Sides and Vavreck
2013).
The Effect of Negativity
Negativity is a popular strategy in campaign advertising and is widely debated in
campaign effect literature. Some scholars argued that the increased amount of negativity
made the electorate more cynical (e.g., Ansolabehere and Iyengar 1995, and
Ansolabehere et. al. 1999). Ansolabehere and Iyengar (1995) formulated a theory of
demobilization. Their experimental studies of negative political commercials revealed
that campaign advertising shrunk the size of the electorate, and attack campaigns drove
potential voters away from the polls. Others believed that negative ads stimulated turnout
(e.g., Goldstein and Freedman 1999 and 2002; Steven Finkel and Geer 1998; Kahn and
Kenney 1999; Wattenberg and Brians 1999; Geer 2006). Wayne (2012) synthesized those
9 One GRP is equal to 1 percent of the viewing audience; 1,000 points is ostensibly the equivalent of everyone seeing an ad 10 times (Gerber et. al. 2011).

9
arguments and concluded that “for knowledgeable partisans, their primary effect is to
reinforce rather than challenge their inclinations to support their party’s nominees.
Negative advertisements, in particular, seem to generate a strong response from partisans,
which solidifies their vote. In this sense, the ads ‘work.’ They prime the electorate; they
provide clues for seeing and images for evaluating; and they turn out party voters (Wayne
2012: 280).”
Criticisms on the Effect of Campaign Advertising
A number of studies, however, questioned the effectiveness of campaign ads.
Krasno and Green (2008) argued that campaign ads had little effect on presidential
elections. They conducted an experiment using data from Campaign Media Analysis
Group (CMAG) to analyze the voting rates in media markets and found that advertising
purchased by the presidential campaigns during the final weeks of the 2000 election had
negligible effects on voter turnout. Also, they found no evidence to suggest that attack
ads promoted or diminished turnout (Krasno and Green 2008).
Although campaign ads could target people likely to vote in the absence of
advertising exposure, the effect of campaign ads was also subject to other extraneous
factors. Darrell West (2012) traced the evolution of how voters were influenced by these
advertising efforts on modern elections from 1952 to 2012 and concluded that the impact
of campaign ads was subject to the political environment, the nature of the public
opinion, how reporters cover the ads, the ways in which ads were edited and financed,
and the strategies of stereotyping, association, demonization, and code words used by
campaigners (West 2012). West (2012) also suggested that the method used to make

10
campaign ads conditioned its effect. For example, recent presidential candidates tended to
use social media tools to reach audiences and seek more support.
Though some research assumed a causal relationship between campaign
advertising and voters’ choice, that assumption was constrained by the problem of
external confounding. Since voters’ behavior might be independent of the campaign,
therefore, the campaign efforts might be spurious (Gerber and Green 2000). Campaign
ads might target voters who had already gained sufficient information, because they
might also seek out information on their own, such as reading newspapers or watching
media coverage of the race, even if they were not targeted. Though campaign ads
intended to provide certain information in favor of the candidates, such information
might not be the decisive factor for voters’ choice.
There are also many longstanding factors that could weaken the effects of
campaign ads on voters. Partisanship is a strong motivator for voter turnout and behavior.
Rosenblum (2010) mentioned in her book in defense of parties and partisanship that
nonaligned American voters tended to be less informed than those with a party affiliation.
Sides and Vavreck (2013) argued that people’s longstanding identification with a
political party was a powerful influence: most people who voted knew how they would
vote a year before the general election. Wolfinger and Rosenstone (1980) argued that
demographic characteristics mattered for voting behavior. They used census data from
1972 and 1974 to compare the differences between voters and non-voters and found that
the key demographic difference between voters and nonvoters was education, followed
by age. Other demographic characteristics such as marriage, registration laws, race,
income all mattered, but not much (Wolfinger and Rosenstone 1980). Accordingly,

11
confounding with those longstanding factors, campaign advertising, as a relatively short-
term factor, might provide little new information and exert little influence on voter’s
choice.
Internal confounding is another problem that the political science literature has
addressed. Most of existing studies treated advertising as a combination of different ads
and did not take the content of campaign ads into consideration. For example, Martin
(2004) treated all the campaign ads as “undifferentiated” individuals and used large-N
statistical analysis to find that negative ads mobilized voters, but he did not differentiate
the content of those negative ads and therefore failed to specify what kinds of ads
mattered, and what kinds of ads did not.
Actions and strategies that campaign advertisements use to appeal to voters vary
from one another and may have different effects. For example, “to take a stand on certain
policies”, “to send a negative message about someone’s retrospective record” and “to
defeat someone’s prospective policy” may produce different effects on voters. Therefore,
it may be inappropriate to classify them together into the same category. Also, different
issues mentioned in the ads may have different effects on voters. During the economic
recession, a campaign advertisement related to an economic issue would probably catch
more attention and have greater effects than ads related to other less salient issues. Gallup
polls showed that 86% Americans mentioned economic issues as the nation’s most
important problem in 2009, while only 16% did in a similar poll conducted in 2007
before the financial crisis.10
10 See Gallup, “Most Important Problem,” http://www.gallup.com/poll/1675/most-important-problem.aspx

12
Laboratory studies can overcome some of the diverse threats to internal validity
present in observational studies. By experiment, scholars are usually able to make sure
the effect comes from the treatment itself. Experimental studies found that television
news and ads could potentially shape public opinion, direct public attention, and
influence voter cynicism (Iyengar et. al. 1982; Ansolabehere and Iyengar 1995; Gilliam
and Iyengar 2000). Other laboratory studies indicated that campaign advertisements
increased voters' support for the sponsoring candidates (e.g. Kaid 1997; Valentino et. al.
2004). The problem is that laboratory studies are not conducted in a real world setting, so
their findings may not parallel the voter responses in the real world. Ansolabehere and
Iyengar (1995) found that negative ads made the electorate more cynical and decreased
the voter turnout, but people who were cynical might vote for other reasons than
watching negative ads.
Another problem with laboratory researched is that they estimate the short-term
campaign effect on voters but underestimate the effect of longstanding factors such as
partisanship, age, and education. Similarly, the weekly effect of campaign ads, using
GRPs as the measure of advertising volume, might not take into account other factors
occurring at the same time.
To overcome the problem of external confounding, my statistical analysis in
Chapter 3 looks at the effects of advertising in real world settings. Instead of using GRPs
to estimate the weekly effect of campaign ads, I track the ads airing daily, as well as the
candidate’s support in polls. My objective with using this methodology is to identify and
measure the effect of the ads within the context of voters’ longstanding prejudgment of a
candidate. To overcome the problem of internal confounding, I differentiate the issues

13
contained in campaign ads using anti-China rhetoric. Here I focus on Obama’s “Sold Us
Out” ads, which linked John McCain to jobs that were moved overseas. In this way, I
seek to estimate the short-term effect of these campaign ads on their target audience.
2.2 Domestic Factors of Foreign Policy
If the ads affect the campaign, do they also affect the administration’s foreign
policy? Most scholars believed that domestic factors played a great role in foreign policy,
and foreign policy was the outcome of both international effects and domestic structures.
Katzenstein (1976) offered a comparison of the differences between a state-centered
policy network in France and a society-centered policy network in the United States; his
case studies on commercial, financial, and energy policies showed that domestic factors
must be included in an analysis of foreign economic policies. Northedge (1968) posited
that the foreign policy of any country was a product of environmental factors both
internal and external. Kissinger (1969) examined the role of domestic structures in a
country’s relations with other nations in the world system and found that the domestic
structure was not irrelevant in any historical period. “At a minimum, it determines the
amount of social effect which can be devoted to foreign policy (Kissinger 1969:504).”
The economic contest with Japan in the 1980s and the 1990s, especially the
American perception of Japan's unfair trade practices and trade imbalance with America,
triggered anti-Japanese rhetoric in the presidential elections. Ornstein (1992) studied the
1992 presidential election and found that the growing anti-Japanese rhetoric in 1992 was
positively associated with the public opinion towards Japan. For example, the Chicago
Council on Foreign Relations found in 1991 a significant decline in "warm feelings"

14
toward Japan among Americans; and 31 percent of American identified Japan as
America's greatest security threat in 1992 compared to 8 percent in 1990.11 He also found
that candidates who emphasized anti-Japanese stances did not fare well on the campaign
trail. Although Japan-bashing provided early notoriety and an emotional boost, it led to
few votes in primaries and caucuses. Democratic Senator Bob Kerrey briefly shot to
national prominence with a television spot in New Hampshire, set in a hockey rink,
where he warned that if Japan did not open its markets to American products, America
reciprocally would close its markets. However, Kerrey dropped his hockey rink
commercial after New Hampshire; when asked why during a debate, he responded:
“Because it didn't work.” Republican challenger Patrick Buchanan even called for
abrogation of the U.S. mutual security treaty with Japan but still threw his support to
Bush at the Republican National Convention. Ornstein explained that even for those
voters who feel threatened by Japan's economic power, it was not a high enough priority
to supersede other worries, from the domestic economy to general concerns about
leadership among the candidates (1992).
Scholars studying the U.S.-Soviet policy during the Cold War era found a surge
of anti-Soviet assertiveness in the year of the election. In short, there was a tendency of
presidential candidates to stress foreign policy issues in their campaigns. “If an
incumbent is running for reelection, he will seek to disprove the challenger's claims by
displaying examples of his own firmness; if non-incumbent challengers are competing
against each other, they tend to demonstrate their toughness by promises of tough policies
if elected (Nincic 1990).” In his analysis of U.S. Soviet policy and the electoral
11 See Ornstein 1992.

15
connection from 1952 to 1988, Nincic (1990) argued that domestic political rhythms in
the presidential campaign substantially shaped American attitudes and policy toward the
Soviet Union.
In sum, researchers cited here found that anti-foreign rhetoric by candidates
followed the American public opinions of certain foreign countries; though it did not
seem to work in seeking voter support in the election, it might affect the future policy
decisions. Based on the existing literature of anti-foreign campaign rhetoric, my study
continues to explore whether and how does the anti-foreign campaign rhetoric lead the
public opinion and affect the foreign policy?
Interest Groups and Foreign Policy
Presidential candidates rely on the support of various interest groups to run their
campaigns. Interest groups also sponsor many campaign ads. Therefore, it is highly
probable that presidential candidates’ campaign promises in the TV commercials reveal
the policy demands of interest groups.
In the United States, there has generally been a shift away from the leadership of a
small foreign policy elite toward greater pluralism since the end of the Cold War. A wide
range of interest groups has been effective in influencing U.S. foreign policy making.
Bennett (2002) argued that members of Congress were vulnerable to transient populist
sentiments and interest group pressures because they represented discrete geographic
districts and states and faced frequent elections. DeBièvre and Dür (2005) contended that
legislators delegated power to the foreign trade bureaucracy so that their clients could
obtain better access to the policy that promoted access to foreign markets or exporters,
and the policy that promoted protectionism for domestic industries. Drope and Hansen

16
(2004) also found that campaign contributions and lobbying activities by business and
industry interests had an impact on foreign trade policy.
There are other studies, however, that downplayed the role that interest groups
played in foreign policy making. Haney (2011) examined the various models of
congressional behavior on military issues and found little connection between the
interests groups of the defense industry and a vote by a member of Congress (Haney
2011). Grenzke’s analysis, based on an examination of 120 PACs in 10 issue areas over
four congresses, concluded that PACs contributions do not affect members’ voting
patterns (1989). Other studies came to similar conclusions (e.g., Wright 1985; Chappell
1982; Wayman 1985; and Welch 1982). Even though the influence that interest groups
exerted in foreign policy were not necessarily decisive to the policy itself, the groups still
tried to exert influence in campaigns, particularly through campaign contributions and
activities.
Regarding China policy, however, there is a dearth of literature on how interest
groups affect U.S. foreign policy towards China during campaigns. In the post-Cold War
era, studies about interest groups and China shed some light on China’s most-favored-
nation (MFN) debate. Dietrich (1999) confirmed that there were noteworthy interest
group activity and access to decision makers in both Congress and the Clinton
administration. The roles of the activity and access in helping set the terms of the debate
in policy oversight, in supplying information, and policy analysis, permitted interest
groups to have an impact on the early stages of the policy process. However, as policy
options were actually weighed and settled on, it was broader domestic political goals and
international pressures that ultimately shaped policy choices. Robert Sutter (1998)

17
explored the MFN debate about China during the George H. W. Bush and Bill Clinton
administrations and claimed that many of the interest groups were actively involved in
the making of U.S. foreign policy toward China after the Tiananmen Square massacre in
1989. But those scholars did not explain specifically how these groups influenced the
U.S. foreign policy towards China through presidential campaigns. According to Sutter
(2010), U.S.-China relations were following an overall positive historical trend with little
indication that the conflicting issues would have a meaningful impact on the two
countries’ larger foreign relations policies.
Lampton (2002) thought of the relationship between China and the United States
as operating on the global, domestic, and individual levels. On the global level, the
relationship was characterized by the operation of international organizations and regimes
(both worldwide and regional in scope), the operation of international markets, and the
behavior of third parties. On the domestic level, the relationship was characterized by the
operation of governmental and civic institutions, internal politics, ideologies, and public
opinion in China and the United States. On the individual level, the relationship was
characterized by the operation of political and societal leaders who had a demonstrated
impact on bilateral relations (Lampton 2002). Since the anti-China ads were sponsored by
the presidential candidates, political parties, and interest groups, they could be treated as
an operation that resides in the second and third level. Lampton (2002) argued that the
ability of an individual to alone determine the relationship had declined since the 1970s.
“Bill Clinton was almost one year into his second administration before he delivered a
comprehensive speech (in October 1997) on China policy to the American people;
George H.W. Bush, had a comparatively more integrated view of U.S.-China relations

18
and certainly devoted more attention to the subject, but he, too, rarely shared his views
systematically with the American people. The most notable exception was a little-
publicized speech given at Yale University in May 1991, six months after the mass media
and interest groups had seized the China policy initiative. The absence of presidential
leadership simply means that diverse interest groups and the mass media fill the void
(Lampton 2002: 9).”
The presidency was, in traditional models of agenda setting, the primary agenda
setter in American politics, particularly in foreign policy. But recently the president’s
foreign policy agenda was becoming more responsive to media coverage and
international events than in the past (Wood and Peake 1998; Edwards and Wood 1999).
Robert Sutter believed that the post-Cold War period had seen substantial changes in the
way foreign policy towards China was made in the United States. “There has been a shift
away from the elitism of the past and toward a much greater pluralism (Sutter 1998: 11).”
Though Sutter was reluctant to believe that interest groups affect the overall U.S.-China
relations (2010), he did find that the Clinton administration’s policy “was influenced by
campaign contributions from U.S. and foreign donors eager to promote better U.S.
relations with China (1998: 4).”
Indeed, foreign policy was not usually the major issue of a presidential
campaign.12 However, the spread of anti-China messaging through the mass media did
point out some critical problems on U.S.-China relations, which would probably draw a
political leader’s attention. In Kingdon’s three-streams (problem, policy, and politics)
model, the problem stream was the first step to create the momentum necessary to place
12 Foreign policy issues did play roles in some presidential campaigns, such as the Vietnam War in 1968 and 1972, and the War in Iraq and international terrorism in 2004.

19
an issue on the public policy agenda (Kingdon 1995). Accordingly, anti-China rhetoric
played a role in recognizing problems that had a dramatic impact on U.S. awareness on
those issues, which might, in turn, lead to policy change and affect U.S.-China relations.
Ramirez (2012) found quantitative evidence that China bashing in U.S. newspapers hurt
U.S.-China relations. He developed an index based on the count of articles that were
related to China in major U.S. newspapers and also touched on one or more of the
following issues: human rights, Tibet, democracy, child labor, and repression, and then
examined the effect of bashing on U.S.-China relations, which was indicated by a
monthly score measuring the overall relations between U.S. and China (Yan et al.
2009).13 The results indicated that a one-standard-deviation shock in bashing led to a
0.038 points decline in Yan’s Sino-American index after about four months (Ramirez
2012).14 In other words, anti-China rhetoric in the newspaper had a negative effect on the
overall U.S.-China relations.
Ramirez (2012)’s study was, foremost, the first demonstration of the phenomena
of anti-China rhetoric in U.S. media markets. However, there were still some unexplored
areas the author does not address. First, Ramirez did not specify whether the anti-China
rhetoric strategies in a specific time were more influential than those in any other time.
Since huge amounts of campaign activities were reported and people were concerned
about the election, anti-China rhetoric might play a greater role in influencing foreign
13 Yan et al. (2009) have developed a sophisticated measure of Sino-American relations using statements and actions from the Chinese government. The coding process involves the conversion of events related to U.S.-China relations into a uniform scale bounded above by 9, the highest degree of friendship, and below by -9, the most severe degree of confrontation. The Chinese version has updated toward December 2012. 14 The model uses the increase of “one standard deviation”, rather than the increase of one unit.
20
policy during a presidential election year than in a non-election year. Second, Ramirez
developed his model using the data of newspapers reporting and editorials, a relatively
objective and neutral media compared to campaign activities. It was entirely possible that
campaign activities, which directly bashed China by presidential candidates, parties and
other interest groups, had a greater effect on U.S.-China relations than that of China
bashing reported by newspapers or indicated in their editorials. Third, Ramirez’s model
only covered the issue of human rights, Tibet, democracy, child labor, and repression,
which ignored the economic issues. Recently presidential campaigns had been more
concerned with the economy, making China-related economic issues potentially more
important influence in public policy. Therefore, taking a close look at the economic issue
was necessary.
To bridge the gaps of existing literature, I focus on the anti-China rhetoric in the
election year; differentiate the rhetoric by different presidential candidates; and
comprehensively specify the effects of the anti-China rhetoric on different issues,
especially economic-related issues.
2.3 Permanent Campaign and Campaign Promise
Carrying out voters’ policy choices by the victorious presidential candidate is the
underlying rationale of democratic electoral politics. Therefore, presidential elections are
not only single-minded contests for office but also encumbered by policy choice.
Krikones (1984) compared presidential campaign promises and the performance of
presidents for the period 1912-1976 and found that approximately seventy percent of
campaign promises were fulfilled. Fishel (1985) studied presidential campaigns from

21
Kennedy through Reagan, with case studies devoted to Carter and Reagan, and found that
presidential candidates made reasonably specific promises about future domestic policy,
and they took those promises seriously. Elected presidents were successful in fulfilling
the majority of their most specific pledges. Specifically, approximately two-thirds of their
commitments were fulfilled in terms of executive orders or passed by the Congress
(Fishel 1985). The PolitiFact.com compiled all the promises that major American
politicians made and found that President Obama kept 45% of promised he made during
the 2008 and 2012 campaigns.15
Though the general conclusion regarding promise and performance is that
campaign promises are linked to presidential action regarding the policy agenda,
differences do exist in different types of policy issues. On the basis of an examination of
sixteen party platforms established in the presidential campaigns of 1932-1992 and the
actions taken by presidents Roosevelt through Clinton, Sussman and Daynes (2008)
found that the overall performance rate of social issues was lower than that reported by
other researchers about other public policy issues because of party polarization on social
issues.
Apart from promise keeping, the consistency of presidential statements before and
after the election can be seen as a product of permanent campaign. American presidents
had adapted to the permanent campaign (Tenpas 2000). Presidents’ running of permanent
campaign revealed their continuous and voracious quest for public approval. “Elections
themselves are only one part of the picture, where the focus is typically on personalities
and the mass public. Less obvious are the thousands of orchestrated appeals that are
15 See PolitiFact.com. http://www.politifact.com/truth-o-meter/promises/obameter/

22
constantly underway to build and maintain the favor of certain publics and targeted elites
for one or another policy cause (Heclo 2000: 15).” Ornstein and Mann (2000) stressed
that campaigns were nonstop and year-round interlinked and “governing / campaigning /
governing / campaigning” took place in a continuous loop. For example, Bill Clinton’s
governing could be seen as a continuous campaign to promote values of his party and to
support their electoral candidates.
Heclo (2000) stated that campaigning and governing were inextricably interlinked
in American-style democracy. However, the permanent campaign literature stressed the
election-driven side of the link between campaigning and governing but understudied the
policy-driven side of the link. Campaign promises during a presidential election,
especially those draw much public attention, were relevant to the policymaking after the
election.
Whether the consistency of president’s policy before and after the election is a
credit-gaining strategy for the future campaign or a promise-keeping response to the past
campaign remains unanswered in existing literature. By exploring the consistency of
president’s China policy, I seek to find whether and how much the president maintains a
tough stance on China as a response to the past campaign.
2.4 The White House Statement and China Policy
The White House statement on China represents the President and the
administration’s policy attitude toward the China, which plays a predominant role in
shaping U.S.- China relations. The Presidency is the primary agenda setter in American
foreign policy and the President’s foreign policy initiatives are more likely to result in

23
policy outcomes. Even though not turning into laws or actions, the White House
statement towards China would still be treated seriously by China, compared to the other
forms of pressure.
Classical wisdom in American politics suggested that the executive branch
generally dominated the U.S. foreign policy making. Typical ways of presidential
influence in the legislation were persuasion, bargaining and “going public.” Presidential
power had always been the guiding paradigm since it was first introduced in 1960.
Richard Neustadt argued that presidents are powerful enough to dominate policymaking
by persuasion and bargaining, which came with the position, professional reputation, and
public prestige (1960). Kingdon also argued that the president who had advantages in
institutional, organizational, public and political resources was a powerful force in
agenda setting by being able to dominate the policy agenda (1995). The presidential
dominance of agenda setting was really important because it was at the early stage of
domestic policy making and adoption. Kernell (2007) argued that presidents prefer to use
the strategy of appealing to the public to get Congress to do what they want; if presidents
could win over the public support they wound pressure other actors, particularly members
of Congress, to support their agenda. Since the Washington community had become more
individualistic, less hierarchical, less amiable, and harder to win the support of and the
innovations in technology had made the communication easier, going public was more
akin to force than to bargaining (Kernell 2007).
In the foreign policy area, the presidential power is much stronger than that in the
domestic policy area. Actors outside the executive branch used to play a far less
influential role in foreign policy making than those inside (Allison 1971). The “two

24
presidencies” theory suggested that American presidents exercised fundamentally greater
influence over foreign than domestic affairs.
Wildavsky (1966) provided quantitative evidence for this line of thinking,
declaring in memorable language that the U.S. had one presidency for domestic matters
along with a second, more powerful presidency for foreign affairs. He found that between
1948 and 1964 Congress enacted 65% of presidents’ foreign policy initiatives and only
40% of domestic ones. Wildavsky’s (1966) article ushered in a veritable industry of
systematic tests of whether presidents fared better on roll-call votes and other legislative
activities in foreign versus domestic policy. Following Wildavsky’s reasoning, scholars
had tested the “two presidents” theory in different issue areas and found that presidents
had a much freer hand and enjoyed substantial discretion in dealing with foreign affairs
(e.g. Fenno 1973; Oldfield and Wildavsky 1989). For example, Canes-Wrone et. al.
(2008) tested the “two presidencies” theory in the enactment of budget appropriations
(1969-2000) and the design of administrative agencies (1946-2000), and the findings
provided strong support for the argument that presidents had greater influence over
foreign than domestic policy.16
Apart from bargaining and persuasion to influence both Congress and the
executive branch itself, the President also possesses the unilateral power to influence the
policy making, especially in the foreign policy arena. In Federalist Paper (1788) No. 74
Hamilton recognized that ‘‘the exercise of power by a single hand’’ was especially
16 Specifically, they found that the president’s requested change in budgetary appropriations was approximately 8 percentage points closer in foreign and defense agencies than it was in domestic ones; foreign and defense agencies were created to allow significantly more presidential influence than domestic ones.

25
important to the conduct of foreign affairs. Given their unilateral powers, presidents
could respond quickly to foreign conflagrations, negotiate peace settlements between
other nations, monitor other nations’ military development, provide military support
overseas and start an international military action—usually without first securing the
formal consent of Congress or the courts. The presidential unilateral actions were more
likely to be used in foreign affairs, where the presidents had first-mover advantage,
asymmetric information over the Congress and electoral incentives (Canes-Wrone et. al.
2008). Howell (2005) found an increased use of unilateral powers including executive
orders, proclamations, national security directives, etc. in the modern presidency; the
unilateral action gave the president a first-mover advantage that reduced transaction costs
and collective action problems.17
On the other hand, the Chinese government believes that only cabinet members
matter to the foreign policy and they treat seriously the statements of U.S. president and
the administration. Therefore, even the tough president’s statement may not be realized
into a governmental action the statement would still pose great pressure on China to make
a response. When establishing the U.S. - China Strategic and Economic Dialogue
(S&ED), China requested that the annual meetings brought together nearly a score of
cabinet members from each side. Jeffrey Bader, the former principal advisor to President
Obama on Asia, noted that such mechanism of the dialogue with China was “unknown in
U.S. relations with any other country in the world (2012: 22).” “The Chinese attach
17 For Howell, power was “the president’s capacity to influence public policy”, not “the president’s ability to influence congressional behavior” as Neustadt indicated. When contemplating policy moved, presidents could submit a proposal to Congress; or, when doing so did not explicitly infringe upon existing law, they could take the lead in setting policy.

26
considerable importance to protocol, ceremony, form, and appearances (Bader 2012:
110).”
Historically, the Chinese government had been taking the statements from the
U.S. Presidents seriously, even though no one on the U.S. side would pay attention to the
statements. A prominent example was the Three Communiqué, a collection of three joint
statements made on Feb 28, 1972, Jan 1, 1979, and Aug 17. 1982, which played a crucial
role in the normalization of relations between the U.S. and China and continued to be
treated as an essential element by the China side in the current dialogue between the two
countries.18 During a meeting between President Obama and Chinese President Hu
Jiangtao at the G-20 summit in London in April 2009, the Chinese leader proposed that
the two sides issued a joint statement or communiqué marking the event, and it was
rejected by the U.S. side given the history of political controversy sparked by joint
communiqués focusing on the Taiwan issue (Bader 2012: 24). As President Obama’s
principal negotiator of the joint statements, Bader was frankly unenthusiastic about the
prospect of the joint statements and expected no one paid any attention to the good
language in these statements; but the Chinese insisted on issuing a joint statement during
Obama’s visit to China in November 2009 (Bader 2012: 55). Accordingly, the White
House statements on China would be treated seriously by the Chinese government and
therefore play a great role in shaping U.S.-China relations.
According to the existing literature, nowadays it might be difficult for the
President as an individual to dominate foreign policy. Other domestic factors such as
interest groups, to a large extent, influence foreign policy making. The making of foreign
18 For detail statements, see “Joint Communiqué.” www.taiwandocuments.org/doc_com.htm.

27
policy towards China might be affected by the anti-China rhetoric aired and reported in
media. By responding to the public attention raised by anti-China campaign rhetoric,
President should consider the potential consequence on U.S.-China relations. President
should also consider whether the policymaking on China is linked to the campaign
promises because the consistency of presidential statements shows a quest for public
approval that would benefit future elections.
Currently, China has posed both military and economic threats to the U.S. The
rise of China and the relative American decline have aroused public concern and made
presidential candidates play China card to attack their opponents in recent elections.
Since anti-China rhetoric in recent presidential elections seems to be more influential
than the anti-Soviet and anti-Japan rhetoric in 1980’s and 1990’s, and the study of anti-
China rhetoric during the presidential campaign and its effect on China policies will
probably provide more insights into the literature regarding U.S. foreign policy making
on various issues. In Chapter 4, I will show how the anti-China rhetoric by presidential
candidates affects the White House statement towards China and its consequence on
American public opinions of China.

28
Chapter 3. Anti-China Rhetoric and Voter Support
In this Chapter, I examine whether and how anti-China rhetoric affects the U.S.
presidential elections. Based on the data obtained from the Wisconsin Advertising Project
(WiscAds), RealClearPolitics.com (RCP), and various governmental and non-
governmental institutes, I built an original Time-Series-Cross-Sectional (TSCS) model to
test the effect of campaign ads using anti-China rhetoric in seeking voter support. The
primary ad I focus is Obama’s “Sold Us Out” campaign commercials, which were aired
in 15 target states from Sep. 15 to Oct. 1, 2008. I use the “Sold Us Out” ads as the
representative of ads using anti-China rhetoric to show how airing the ads increases
Obama’s public support in the target states. After that, I analyze the national
environment, especially the economic conditions during the airing of the “Sold Us Out”
ads airing period from the Sep. 15 to Oct. 1, 2008, to justify the independence of the
“Sold Us Out” ads’ effect and rule out the external confounding factors. In addition, to
better access the unique effectiveness of the ads using anti-China rhetoric, I use my TSCS
model to analyze another two prominent Obama ads in 2008, the “Real Change” ads and
the “Alternative” ads, which were also aired with the “Sold Us Out” ads from Sep.15 to
Oct. 1, 2008 and compared their effects in seeking voter support as measured in public
opinion polls. 19
The campaign advertisement on which I focus, “Sold Us Out”, sought to link John
McCain to jobs that were moved overseas. It emphasized McCain's support for tax breaks
for companies that move jobs overseas as well as his unwillingness to take a strong
19 The ads on which I focus were sponsored by Obama’s campaign. Ads sponsored by political parties and outside groups were not included in my study.

29
stance against Chinese currency manipulation (See Appendix A for transcript).20 The
“Sold Us Out” ads were aired a total of 10,782 times across 15 target states – Colorado,
Florida, Iowa, Indiana, Michigan, Minnesota, Missouri, Montana, North Carolina, New
Hampshire, Nevada, Ohio, Pennsylvania, Virginia, and Wisconsin - from Sep. 16 to Oct
1, 2008.
3.1 Data and Method
Informed by the existing literature and the reality of both presidential electoral
politics and China issues, I plan to estimate the effects of campaign ads using anti-China
rhetoric in the presidential election by exploring the following factors:
Ads Airing
The effect of campaign ads, especially negative ads, has long been debated in
political science literature. Unlike laboratory experiment, my study looks at the effects of
advertising in real world settings. The airing of the “Sold Us Out” was strategically
designed: they were aired in swing states, as well as those with high manufacture output
and high business relations with China. For example, the airing in Michigan, a solid blue
state where Democratic presidential candidates won all the elections since 1992, due
20 The video of the “Sold Us Out” ads is available on Youtube, uploaded on Sep 16, 2008. http://www.youtube.com/watch?v=xaCdcvdPHVM.

30
largely to its high manufacturing out and business relations with China.21 Voters in those
states had more concern about the outsourcing of manufacturing jobs to China and the
airing of the “Sold Us Out” ads, which linked McCain to the jobs outsourcing to China,
would probably solidify the Democratic candidates voter support in the 2008 presidential
election. The ads were also aired in Missouri, a traditionally red state where Democratic
presidential candidates only won 3 times since 1968, partly because of its growing
business relations with China in 2008.22 The first hypothesis follows:
Hypothesis1: Airing ads using anti-China rhetoric increases the favoring
candidate’s voter support in target states.
Ads Quantity
Gerber et al (2011) and Sides and Vavreck (2013) found that the amount of
campaign ads did shift votes in their favor in a week. Their studies, however, suffered
from the external confounding factors such as voter’s long-standing partisanship. Instead
of looking at the weekly ads amount, I track the ads amount daily and contrast it with the
candidate’s daily voter support in state polls. My objective with using this methodology
21 In 2008, Michigan had total 5 deals (ranked second next to California’s 16 deals) from China’s FDI, and the total value was $12 million. See “China Investment Monitor,” Rhodium Group. http://rhg.com/interactive/china-investment-monitor. Retrieved on 11/18/2015. Michigan had a high manufacturing output, $66.2 billion (8th highest of all states) in 2012. See Alexander E.M. Hess, et al. “10 states where manufacturing still maters,” USA Today, published on 8/10/2013. http://www.usatoday.com/story/money/business/2013/08/10/10-states-where-manufacturing-still-matters/2638363/. retrived on 11/18/2015. 22 Missouri firms sent $944 million in goods to China in 2008, growing its exports to China by over 31 percent in the past five years. China’s growing export market had benefited Missouri’s waste and scrap industry, as commodities in copper, alloy steel, and aluminum waste and scrap had had the highest sales growth from 2007 to 2008. See “Global Market Place – International Trade and Investment in Missouri,” 2009, Missouri Economic Research and Informational Center, retrieved on 11/20/2015, https://www.missourieconomy.org/pdfs/global_market_0313.pdf.
31
is to identify and measure the effect of the ads amount within the context of voters’
longstanding prejudgment of a candidate. The second hypothesis follows:
Hypothesis2: As the amount of ads using anti-China rhetoric increases, the voter
support of the favoring candidate increases in the target state.
Ads Spending
The existing literature on campaign ads also suffered from internal confounding
factors. They treated all the campaign ads as “undifferentiated” individuals. Also, using
GRPs as a measurement of ads (e.g. Sides and Vavreck 2013), which focused on the
advertising volume, they confounded the ads quantity with the ads spending. As a result,
they failed to specify 1) what kinds of ads matter, and what kinds of ads do not; 2) what
kinds of ads worth much spending, and what kinds of ads do not worth much spending.
To overcome the problem of internal confounding, I single out the campaign ads
spending using anti-China rhetoric. In this way, I seek to find out whether it is
worthwhile to spend much money on those campaign ads using anti-China rhetoric. The
third hypothesis follows:
Hypothesis3: The more spending on ads using anti-China rhetoric, the more voter
support the favoring candidate gains in the target state.
Original Time-Series-Cross-Sectional (TSCS) Dataset
To test my hypotheses, I generate an original Time-Series-Cross-Sectional
(TSCS) dataset. I collect data for the 15 target states from Sep. 15 to Oct. 2, 2008,
matching the 16-day airing record of the “Sold Us Out” ads. I add one day before and one
day after the airing period in order to show the next day poll after the ads airing and
calculate the daily change of the state polls. Therefore, the research period has 18 days.

32
The “Sold Us Out” ads were aired on different days in the 15 target states during the 18-
day period. For example, in Colorado, the ads were aired on 7 days from Sep. 20 to Sep.
26, 2008 and not aired on the other 11 days. Based on the airing and spending data
obtained from the “Wisconsin Advertising Project” (WiscAds) dataset, each observation
on my TSCS dataset records includes whether the “Sold US Out” ads were aired on the
state (Variable: “C”), daily amount of the “Sold Us Out” ads aired on the state (Variable:
“N”), and daily spending of airing the “Sold Us Out” ads on the state (Variable:
“Spending”, rescaled in $1000 dollars).23 Each of the 15 states has 18 daily observations,
giving a total of 270 possible observations.
The dependent variable is Obama’s share of the vote from the next day’s state poll
(Code: “Poll”) after the ads airing. I use the daily state-level polling data for my 18-day
research period from the RealClearPolitics.com (RCP). By updating major state-level
polls every day, RCP created the “McCain vs. Obama Polling Data”, which recorded the
daily average poll standings of both presidential candidates for all 50 states in 2008.24
(Figure 1 shows the means of Obama’s daily polls of the 15 target states during the
research period).
23 The Wisconsin Advertising Project recorded the airing information of major campaign ads since 1996. http://wiscadproject.wisc.edu/ 24 See Appendix B and C for the detail list of original polls that RCP used to calculate the average state polls and for the detail polling data by state during the research period.

33
Figure 1. Means of Obama’s Daily Polls of the 15 Target States.
Sep. 15 – Oct.2, 2008 Share in percentage
Source: RealClearPolitics.com
To better access the dynamic effect on Obama’s state poll, I also create a model
taking the daily change of Obama’s share of the vote from the state poll (Code:
“Change”) as the dependent variable, the one-day change of Obama’s share since the ads
were aired. For each observation on my dataset, I generate the “Change” variable by
calculating the daily change between two consequent days. For example, Obama’s
average poll standing in Colorado is 47.3% on Sep. 22, 2008 and 48.4% on Sep. 23,
2008, and then the value of the “Change” on Sep. 22, 2008 is 1.1 [(47.3%-48.4%)*100].
The missing data of average daily poll reduces my set to 250 observations (Figure 2
shows the average change of Obama’s daily polls of the 15 target states during the
research period).
45
45.5
46
46.5
47
47.5
48
48.5

34
Figure 2. Average Change of Obama’s Vote Share
in the 15 Target States’ Daily Polls. Change in percentage
The independent variables are the airing and intensity of ads using anti-China
rhetoric. According to my three hypotheses, the independent variables are indicated by:
1) Whether the “Sold US Out” ads were aired in the state (Dummy Variable: “C”, coded
by “0” if the ads were not aired, and “1” if the ads were aired; Figure 3 shows the average
count of whether “Sold Us Out” ads were aired in the 15 target states).
Figure 3. Average Count of Whether “Sold Us Out” Ads Are Aired
in the 15 Target States. Day 1 starts from 9/15/2008

35
2) Daily amount of the “Sold Us Out” ads aired in the state (Variable: “N”; Figure 4
shows the average daily amount of “Sold Us Out” ads airing in the 15 target states).
Figure 4. Average Daily Amount of “Sold Us Out” Ads Airing
in the 15 Target States. Day 1 starts from 9/15/2008
3) Daily spending of airing the “Sold Us Out” ads in the state (Variable: “Spending”;
Figure 5 shows average daily spending on airing the “Sold Us Out” ads in the 15 target
states).
Figure 5. Average Daily Spending on Airing the “Sold Us Out” Ads
in the 15 Target States. Spending in USD
Day 1 starts from 9/15/2008

36
In addition, since the data has a time-series dynamic dependent variable, I include
lag values of Obama’s vote share of state poll (Variable: “LPoll”) as independent
variables.
The control variables are the Obama’s total ads amount, Obama’s total ads
spending, unemployment rates and FDI from China at the state level. Based on the
WiscAds dataset, I calculate the number of daily ads of both candidates (Variable:
“N.Obama” and “N.McCain”) and their daily spending for all ads (Variable: “S.Obama”
and “S.McCain”). Figure 6 and 7 shows Obama’s and McCain’s daily ad amount in the
15 target states. Figure 8 and 9 shows Obama’s and McCain’s daily spending on all ads
in the 15 target states (rescaled in $1000 of dollars).
Figure 6. Obama’s Daily Ad Amount in the 15 Target States.
Day 1 starts from 9/15/2008

37
Figure 7. McCain’s Daily Ad Amount in the 15 Target States.
Day 1 starts from 9/15/2008
Figure 8. Obama's Ad Spending in the 15 Target States.
Rescaled in $1000 USD Day 1 starts from 9/15/2008

38
Figure 9. McCain’s Ad Spending in the 15 Target States.
Rescaled in $1000 USD Day 1 starts from 9/15/2008
Besides, since the economy appears to be a prominent longstanding confounding
effect according to the existing literature and the “Sold Us Out” ads are related to the job
and China issue, I add the state-level unemployment rates in September 2008 (Variable:
Unemp) and state level cumulative China FDI from 2000 to 2008 (Variable: FDI) into the
TSCS model (Figure 10 shows the unemployment rates in the 15 target states; Table 1
shows the China FDI in the 15 target states).25 and 26
25 The unemployment rates data is obtained from Bureau of Labor Statistics. http://www.bls.gov/lau/ 26 The China FDI data is obtained from Rhodium Group. See Rhodium Group, “China Investment Monitor - Tracking Chinese Direct Investment in the U.S.” http://rhg.com/interactive/china-investment-monitor.

39
Figure 10. Unemployment Rates of the 15 Target States, September 2008.
Source: Bureau of Labor Statistics
Table 1. China FDI of the 15 Target States
2000-2008
State Cumulative $million State Cumulative $million Co 9 NC 2000 FL 14 NH 0 IA 0 NV 2 IN 23 OH 38 MI 139 PA 21
MN 163 VA 39 MO 125 WI 2 MT 0
Source: Rhodium Group
Statistical Models
To estimate the effect of the “Sold Us Out” ads on Obama’s daily state poll, I
build “three models”: 1) an OLS regression (Pooling) to estimate the general effect of the
“Sold Us Out” ads on Obama’s daily state poll; 2) a fixed effects (FE) model to estimate
the within-state effect of “Sold Us Out” ads on Obama’s daily state poll; 3) a random
intercept (RI) model to take account both the between-state variance and within-state
0.0% 1.0% 2.0% 3.0% 4.0% 5.0% 6.0% 7.0% 8.0% 9.0% 10.0%
Co FL IA IN MI MN MO MT NC NH NV OH PA VA WI

40
variance. There are two steps of the statistical models. In the first step, I build three
models for each independent variables separately with the controlled variables; and in the
second step, I build the “three-models” combining all independent variables and
controlled variables.
Presented in equation form my models is as follows:
Lag models using the next day’s poll as dependent variable:
Poll(t+1)i = α + β1LPollti + β2Airingti + β3Amountti + β4Spendingti + β5Unemploymentti + β6FDIti + β7N.Obamati + β8S.Obamati + β9N.McCainti + β10S.McCainti + εti Where: ti = state i at date t α = intercept for equation βn = regression coefficient for variable n εti = error term for state i at date t Change models using daily change of the poll as dependent variable: Change(t+1)i = α + β1Airingti + β2Amountti + β3Spendingti + β4Unemploymentti + β5FDIti + β6N.Obamati + β7S.Obamati + β8N.McCainti + β9S.McCainti + εti Where: ti = state i at date t α = intercept for equation βn = regression coefficient for variable n εti = error term for state i at date t
3.2 Results
Step 1 – Separate Independent Variables
When testing the three hypotheses with each independent variable separately, the
lag models show that airing “Sold US Out” ads has statistically positive effect on
Obama’s daily average state poll at the 0.05 level. Specifically, airing “Sold US Out” ads

41
increased the Obama’s daily average state poll by 0.338 points in the complete pooling
model, 0.336 points in the fixed effect model and 0.338 points in the random intercept
model (R2=0.812 in Pooling; 0.811 in FE and 0.812 in RI). The amount and spending on
the “Sold US Out” ads have no effect on Obama’s daily average state poll. The three
models have similar results (See Table 2, 3 and 4).
Table 2. Airing “Sold US Out” Ads and Obama’s Next Day State Polls.
Sep. 15- Oct.2, 2008
Independent Variables Pooling FE RI LPoll
0.904*** 0.847*** 0.904***
(0.033) (0.059) (0.033) Airing 0.338** 0.336** 0.338**
(0.120) (0.129) (0.120)
Unemployment 0.014 N/A 0.014
(0.050) N/A (0.050)
FDI from China 0 N/A 0
(0) N/A (0)
S.Obama 0.001 0.001 0.001
(0.001) (0.002) (0.001)
S.McCain 0.001 0.002 0.001
(0.002) (0.003) (0.002)
N.Obama 0 0 0
(0.001) (0.001) (0.001)
N.McCain -0.001 -0.001 -0.001
(0.001) (0.001) (0.001)
Constant -4.175** 6.917** 4.175** (1.689) (2.732) (1.689)
R^2
0.812 0.811 0.812 Probability 0 0 0 N
250 250 250
* significant at the 0.1 level; ** significant at the 0.05 level; *** significant at the 0.001
level

42
Table 3. Amount of “Sold US Out” Ads and Obama’s Next Day State Polls.
Sep. 15- Oct.2, 2008
Independent Variables Pooling FE RI LPoll
0.906*** 0.833*** 0.906***
(0.034) (0.061) (0.034) Amount 0 0 0
(0.001) (0.001) (0.001)
Unemployment 0.020 N/A 0.020
(0.051) N/A (0.051)
FDI from China 0 N/A 0
(0) N/A (0)
S.Obama 0.001 0.002 0.001
(0.001) (0.002) (0.001)
S.McCain 0.001 0.002 0.001
(0.002) (0.003) (0.002)
N.Obama 0 0 0
(0.001) (0.001) (0.001)
N.McCain -0.002 -0.002 -0.002
(0.001) (0.001) (0.001)
Constant 4.227** 7.760** 4.227** (1.716) (2.801) (1.716)
R^2
0.806 0.804 0.806 Probability 0 0 0 N
250 250 250
* significant at the 0.1 level; ** significant at the 0.05 level; *** significant at the 0.001
level

43
Table 4. Spending on “Sold US Out” Ads and Obama’s Next Day State Polls.
Sep. 15- Oct.2, 2008
Independent Variables Pooling FE RI LPoll
0.906*** 0.831*** 0.906***
(0.034) (0.061) (0.034) Spending 0 -0.001 0
(0.003) (0.003) (0.003)
Unemployment 0.018 N/A 0.018
(0.051) N/A (0.051)
FDI from China 0 N/A 0
(0) N/A (0)
S.Obama 0.001 0.002 0.001
(0.001) (0.002) (0.001)
S.McCain 0.001 0.002 0.001
(0.002) (0.003) (0.002)
N.Obama 0 0 0
(0.001) (0.001) (0.001)
N.McCain -0.002 -0.002 -0.002
(0.001) (0.001) (0.001)
Constant 4.230** 7.860** 4.230** (1.716) (2.801) (1.716)
R^2
0.806 0.804 0.806 Probability 0 0 0 N
250 250 250
* significant at the 0.1 level; ** significant at the 0.05 level; *** significant at the 0.001
level
The change models have similar results with the lag models. Airing “Sold US
Out” ads has statistically positive effect on the change of Obama’s daily average state
poll at the 0.05 level. Specifically, airing “Sold US Out” ads increased the Obama’s daily
average state poll by 0.328 points in the complete pooling model, 0.361 points in the
fixed effect model and 0.328 points in the random intercept model (R2=0.092 in Pooling;

44
0.060 in FE and 0.092 in RI). The amount and spending on the “Sold US Out” ads have
no effect on the change in Obama’s daily average state poll. (See Table 5, 6 and 7)
Table 5. Airing “Sold US Out” Ads and the Change in Obama’s State Polls.
Sep. 15- Oct.2, 2008
Independent Variables Pooling FE RI Airing 0.328** 0.361** 0.328**
(0.121) (0.129) (0.121)
Unemployment 0.064 N/A 0.064
(0.048) N/A (0.048)
FDI from China 0 N/A 0
(0) N/A (0)
S.Obama 0.001 0 0.001
(0.001) (0.002) (0.001)
S.McCain 0.001 0.002 0.001
(0.002) (0.003) (0.002)
N.Obama 0.001 0 0.001
(0.001) (0.001) (0.001)
N.McCain -0.002 -0.001 -0.002
(0.001) (0.001) (0.001)
Constant -0.638* -0.176 -0.638* (0.285) (0.173) (0.285)
R^2
0.092 0.060 0.092 Probability 0.001 0.057 0 N
250 250 250
* significant at the 0.1 level; ** significant at the 0.05 level; *** significant at the 0.001
level

45
Table 6. Amount of “Sold US Out” Ads and the Change in Obama’s State Polls.
Sep. 15- Oct.2, 2008
Independent Variables Pooling FE RI Amount 0 0 0
(0.001) (0.001) (0.001)
Unemployment 0.068 N/A 0.068
(0.049) N/A (0.049)
FDI from China 0 N/A 0
(0) N/A (0)
S.Obama 0.001 0 0.001
(0.001) (0.002) (0.001)
S.McCain 0.002 0.002 0.002
(0.002) (0.003) (0.003)
N.Obama 0.001 0 0.001
(0.001) (0.001) (0.001)
N.McCain -0.002* -0.002 -0.002*
(0.001) (0.001) (0.001)
Constant -0.456 0.059 -0.456 (0.283) (0.155) (0.283)
R^2
0.065 0.039 0.065 Probability 0.002 0.682 0.019 N
250 250 250
* significant at the 0.1 level; ** significant at the 0.05 level; *** significant at the 0.001
level

46
Table 7. Spending on “Sold US Out” Ads and the Change in Obama’s State Polls.
Sep. 15- Oct.2, 2008
Independent Variables Pooling FE RI Spending -0.001 0 -0.001
(0.003) (0.003) (0.003)
Unemployment 0.067 N/A 0.067
(0.049) N/A (0.049)
FDI from China 0 N/A 0
(0) N/A (0)
S.Obama 0.001 0 0.001
(0.001) (0.002) (0.001)
S.McCain 0.002 0.002 0.002
(0.002) (0.003) (0.002)
N.Obama 0.001 0 0.001
(0.001) (0.001) (0.001)
N.McCain -0.002* -0.002 -0.002*
(0.001) (0.001) (0.001)
Constant -0.445 0.058 -0.445 (0.284) (0.155) (0.284)
R^2
0.065 0.040 0.065 Probability 0.022 0.695 0.019 N
250 250 250
* significant at the 0.1 level; ** significant at the 0.05 level; *** significant at the 0.001
level
Step 2 – Combined Independent Variables
The results of lag models show that airing “Sold US Out” ads has statistically
positive effect on Obama’s daily state poll at the 0.001 level. Specifically, airing “Sold
US Out” ads increased the Obama’s daily average state poll by 0.454 points in the
complete pooling model, 0.470 points in the fixed effect model and 0.454 points in the
random intercept model (R2=0.815 in Pooling; 0.811 in FE; and 0.815 in RI; See Table

47
8). The model indicates that lag polls also have the statistically significant effect on the
next day’s poll. However, the amount and spending on the “Sold US Out” ads have no
effect on Obama’s next day state poll.
Table 8. “Sold US Out” Ads and Obama’s Next Day State Polls.
Sep. 15- Oct.2, 2008
Independent Variables Pooling FE RI LPoll
0.904*** 0.828*** 0.904***
(0.033) (0.060) (0.033) Airing 0.454*** 0.470** 0.454*** (0.141) (0.149) (0.141) Amount -0.001 -0.001 -0.001 (0.003) (0.003) (0.002) Spending -0.003 -0.003 -0.003
(0.051) (0.001) (0.001)
Unemployment 0.003 N/A 0.003
(0.051) N/A (0.051)
FDI from China 0 N/A 0
(0) N/A (0)
S.Obama 0.001 0.002 0.001
(0.001) (0.002) (0.001)
S.McCain 0.002 0.002 0.002
(0.002) (0.003) (0.002)
N.Obama 0.001 0.001 0.001
(0.001) (0.001) (0.001)
N.McCain -0.002 -0.002 -0.002
(0.001) (0.001) (0.001)
Constant 4.171** 7.669** 4.171** (1.686) (2.756) (1.686)
R^2
0.815 0.811 0.815 Probability 0 0 0 N
250 250 250
* significant at the 0.1 level; ** significant at the 0.05 level; *** significant at the 0.001
level

48
The results of the change models show that airing “Sold US Out” ads has
statistically positive effect on the change of Obama’s daily state poll at the 0.01 level.
Specifically, airing “Sold US Out” ads increased the Obama’s daily average state poll by
0.445 points in the complete pooling model, 0.462 points in the fixed effect model and
0.445 points in the random intercept model (R2=0.103 in Pooling; 0.080 in FE; and 0.103
in RI; See Table 9). The amount of the “Sold US Out” ads and the spending on them have
no effect on the change of Obama’s daily average state poll. The pooling and random
intercept models also find that the total number of McCain’s has statistically significant
negative effect on the change of Obama’s state poll at the 0.1 level, indicating that
Obama’s state poll would decrease as McCain aired more ads across the target states.

49
Table 9. “Sold US Out” Ads and the Change in Obama’s State Polls.
Sep. 15- Oct.2, 2008
Independent Variables Pooling FE RI Airing 0.445** 0.462** 0.445** (0.143) (0.151) (0.143) Amount -0.001 -0.001 -0.001 (0.003) (0.003) (0.002) Spending -0.003 -0.002 -0.003
(0.001) (0.001) (0.007)
Unemployment 0.053 N/A 0.053
(0.048) N/A (0.048)
FDI from China 0 N/A 0
(0) N/A (0)
S.Obama 0.001 0 0.001
(0.001) (0.002) (0)
S.McCain 0.002 0.002 0.002
(0.002) (0.003) (0.002)
N.Obama 0.001 0.001 0.001
(0.001) (0.001) (0.001)
N.McCain -0.002* -0.002 -0.002*
(0.001) (0.001) (0.001)
Constant -0.628* -0.253 -0.628** (0.286) (0.183) (0.286)
R^2
0.103 0.080 0.103 Probability 0.002 0.085 0.001 N
250 250 250
* significant at the 0.1 level; ** significant at the 0.05 level; *** significant at the 0.001
level
Figure 11 tracks the evolution of Obama’s state polls change and the daily
average of whether “Sold Us Out” ads were aired. As the “Sold Us Out” ads were aired
on more states from Sep. 15 to Sep. 21, Obama’s poll changing was generally positive
and then reached a wave crest on Sep. 21 when the ads were aired in all the 15 states. The
second wave of the ads airing on Sep. 28 and Sep. 29 also resulted in another wave crest

50
of Obama’s poll changing. On the contrary, as the number of states airing the “Sold Us
Out” ads started to reduce on Sep. 26 and Oct. 1, Obama’s poll changing declined
correspondently. When the ads remained airing in all the 15 states from Sep. 21 to Sep
25, Obama’s poll did not follow up. Instead, it went down. Apparently, repeating the ads
airing on multiple days was ineffective.
Figure 11. Airing “Sold Us Out” Ads and Obama’s Change of Vote Share
in the 15 Target States’ Daily Polls. Change in percentage
All the statistical models above have similar results: hyphthesis1 is verified,
whereas hyphthesis2, and hyphthesis3 are rejected. In general, airing the “Sold Us Out”
ads increased Obama’s daily voter support in the target states by about 0.45% (range
from 0.44% to 0.47% across the different models), but the daily amount and daily
spending of ads have no effect in increasing the candidate’s public support. Airing the
ads using anti-China rhetoric has significantly “one-day” effect in seeking voter support
while repeating the ads airing in the same state cost much more money and has little
influence in seeking voter support. Therefore, it is wise for the presidential candidate to

51
air the ads using anti-China rhetoric on more days and in more states rather than repeat
airing the ads more times in the same state.
Why could one televised campaign ad, aired only 10,782 times on local stations
with a small audience make such a difference? A probable reason is that the ads using
anti-China rhetoric not only influenced the population of the airing media market, but
also raised the public attention on the China-related issues that generated the echo effect
from other campaign activities and news coverage, which expanded the negative attack
on the candidate who had been linked to China and together contributed to change of the
public support beyond the media market and beyond the airing period. For example,
following the airing of “Sold Us Out” ads in Ohio since Sep. 16, 2008, Democratic vice
president candidate Biden reinforced the anti-China rhetoric by attacking China’s clean
energy policy at a campaign event in Maumee, Ohio on Sep. 23.27 Meanwhile, The Plain
Dealer, a major newspaper in Ohio reported this anti-China rhetoric by Biden on Sep. 23.
As a result, Obama gained 0.1% of vote share of public support in Ohio poll on Sep. 23
and won the Ohio’s electoral vote on Election Day.
The “Sold Us Out” ads were most effective on the first day of airing. The ads
posed an over time effect within the state when they were airing. After the airing stopped,
the echo effect created by the “Sold Us Out” continued to benefit Obama in target states.
Of all the 15 target states, Obama eventually won 13 in the 2008 presidential election
(See Table 10). Obama’s average two-party vote share in the 15 states was 52.4% on the
27 When asked why he supported clean coal, Biden noted that the U.S. should not “build more coal-fired plants, and should instead focus on making China clean up its coal plants.” See Dubalil, Jean. “Ohio Republicans Blast Gaffes by Biden,” The Plain Dealer, Published on 9/23/2008. http://blog.cleveland.com/openers/2008/09/ohio_republicans_blast_gaffes.html.

52
Election Day compared to 48.3% on the last day of airing the “Sold Us Out” ads.
Accordingly, once McCain was linked to the jobs sold to China and the momentum of
Obama’s growing vote support was created by the ads airing, there was no need to
increase ads spending and quantity on target markets because the burden had been shifted
to other forms of campaign activities and media coverage.
Table 10. The 2008 Presidential Election Results for Obama in the 15
Target States
State Result State Result CO Win NC Win FL Win NH Win IA Win NV Win IN Win OH Win MI Win PA Win
MN Win VA Win MO Lose WI Win MT Lose
The choice of the 15 target states to air the “Sold Us Out” ads had proven to be
successful. The results of the fixed effect models indicated that in general airing the
“Sold Us Out” ads increased Obama’s voter support within the target states over time.
Substantially, the fixed effect airing effects (coefficient: 0.470 in lag model and 0.462 in
change model) were stronger than those effects in completed pooling and random
intercept models (0.445 in lag model and 0.454 in change model). Variation exists across
different states. In Michigan, a Democratic-leaning state, the ads using anti-China
rhetoric successfully solidify the Democratic partisan voters when airing. After the airing
of the “Sold Us Out” ads stopped the upturn momentum of Obama’s public support
continued. Obama’s voter support grew from 49.1% on the last day of the “Sold Us Out”
ads airing to 57.4% on Election Day. In Missouri, a Republican-leaning state, however,

53
there was a different story. The “Sold Us Out” ads did increase Obama’s voter support
during the airing period but the effect diminished after the airing stopped. Obama’s poll
in Missouri dropped from 46.8% on the last day of ads airing to 43% on Election Day,
and eventually he lost Missouri on Election Day. Accordingly, airing ads using anti-
China rhetoric helped to firm up the partisan voter within the target state and provided a
long-term effect towards the Election Day; however, airing the ads using anti-China
rhetoric was unable to exert a long-term effect on the state where the voters favored the
opposite party’s candidate.
3.3 What Happened with the “Sold Us Out” Ads Airing? Financial Crisis
The period from Sep. 15 to Oct. 2 in 2008 not only had the “Sold Us Out” ads
aired, but also witnessed the outbreak of a financial crisis and the related responses from
the U.S. government. A series of breaking economic events took place in September
2008, followed by the twists and turns of policy actions of U.S. government and massive
drops in the stock market.28 Though the national economic situations did produce some
influence on the presidential candidates’ voter support at the national level, the effect of
airing the “Sold Us Out” ads on Obama’s state poll was independent of the national
economic conditions.
28 The major finantial events in September 2008 included the bankruptcies of Lehman Brothers, American International Group and Washington Mutual, Sold of Merrill Lynch and the federal takeover of Fannie Mae and Freddie Mac. See “Lehman Files for Bankruptcy; Merrill Is Sold,” published on 9/14/2008, The New York Times. http://www.nytimes.com/2008/09/15/business/15lehman.html?pagewanted=all.

54
To proxy the national economic conditions, I use the daily change of the Dow
Jones Industrial Average (DJIA).29 Through contrasting the daily change of the DJIA
with the daily change of Obama’s average vote share of popular support in the national
polls and the 15 states’ polls, I find that the significant gains of Obama’s voter support at
the national level are negatively associated with the huge declines of DJIA.30 In other
words, the Obama’s voter support increased when the national economic conditions went
bad (See Figure 12).
Figure 12. Change of Obama’s Vote Share in the National Poll and
Change of the Dow Jones Industrial Averages. Sep. 15 – Oct. 2, 2008
Percentage of change from the last calendar day or trading day (for better visualization, I use 10 times the change of Dow Jones Industrial Average).
Source: RealClearPolitics and Yahoo Finance
During the 16 days period, the major daily plummets of DJIA happened on the
days when Obama’s vote share increased drastically in the national polls. Since Sep. 15,
29 The “daily change” is indicated by the percentage change of the present day’s closing prices from the last trading day’s closing price. The source of the Dow Jones Industrial Average data is Yahoo Finance. http://finance.yahoo.com. 30 The Source of the opinion polls is RealClearPolitics. http://www.realclearpolitics.com.
-‐1
-‐0.5
0
0.5
1
1.5
2
Change of Obama's National Poll (%)
Daily Change of Dow Jones Industrial Average (%)*10

55
2008, fear overlooked the market day after Lehman Brothers filed for bankruptcy and
DJIA declined 4.42% on Sep. 15, the worst one-day loss since the Sep. 11, 2001 terrorist
attacks, and DJIA continued to decline 4.06% on Sep. 17.31 By contrast, Obama’s
popular support started to grow since Sep. 15, and it gained 1.4% on Sep. 17, the biggest
one-day growth of Obama’s national polls standing in September 2008. Another huge
drop of DJIA happened on Sep. 29, 2008 (-6.98%), when the House of Representatives
rejected a $700 billion bailout package.32 By contrast, Obama gained 0.9% of two-party
vote share in the national polls on Sep. 29, 2008.
When the financial crisis took place during the 2008 presidential campaign
period, the public might accuse Bush administration’s inability to fix the economic
problem, which in turn hurt the Republican presidential candidate McCain and benefited
the Democratic presidential candidate Obama. When the economy went worse as the
stock market declined further, American voters might tend to place more expectations on
the opposing party’s presidential candidate, and thus, Obama gained more voter support
at the national level.
Though the Obama’s voter support was probably affected by the economic
conditions at the national level, the impact of airing “Sold Us Out” ads in the target states
was independent of the national conditions. Obama’s average vote share in the 15 target
31 See Rowen, Beth. “The Biggest One-Day Declines in the Dow Jones Industrial Average,” Infoplease, retrieved on 2/11/2015. http://www.infoplease.com/business/economy/declines-dow-jones-industrial-average.html. 32 The amendment of the bailout package was rejected via a vote of the House of Representatives on September 29, 2008, voting 205–228. See “Final vote results for roll call 674.” Clerk of the United States House of Representatives. Published on September 29, 2008. http://clerk.house.gov.

56
states’ polls neither stuck to the national polls nor followed the DJIA from Sep. 15 to Oct.
2, 2008 (See Figure 13 and Figure 14). Instead, it stuck to the airing intensity of the “Sold
Us Out” ads in the 15 target states.
Figure 13. Obama’s Vote Share of National Poll and Average
of the 15 Target State Polls. Sep. 15 to Oct. 2, 2008
Source: RealClearPolitics
Figure 14. Change of Obama’s Vote Share in the 15 Target States’ Poll and
Change of the Dow Jones Industrial Averages. Sep. 15 to Oct. 2, 2008
Percentage of change from the last calendar day or trading day (for better visualization, I use 10 times the change of Dow Jones Industrial Average).
Source: RealClearPolitics and Yahoo Finance
42 43 44 45 46 47 48 49 50
15 Target States' Polls (%)
National poll (%)
-‐0.8
-‐0.6
-‐0.4
-‐0.2
0
0.2
0.4
0.6
0.8
Average Daily Change of Obama's 15 State Polls
Daily Change of Dow Jones Industrial Average

57
The two upturn momentums of Obama’s popular support in the target states happened on
Sep. 21 and Sep. 28 when the ads were aired in all the 15 states.
Take Ohio for an example. The “Sold Us Out” ads were aired in Ohio from Sep.
16 to Sep. 26, and then Sep 29 to Sep. 30, 2008. The airing of the “Sold Us Out” ads did
produce upturn momentums for Obama’s public support in Ohio. Obama gained 0.4% of
vote share on Sep. 17, 2008, the next day of the “Sold Us Out” ads started airing; another
momentum happened on Sep. 30, the next day of “Sold Us Out” ads’ re-airing in Ohio,
Obama gained 2.3% of vote share in Ohio poll (See Figure 15).
Figure 15. Obama’s Vote Share of Public Support in the Ohio Poll.
Sep. 15 – Oct. 2, 2008 Source: RealClearPolitics.com
Accordingly, by ruling out the external confounding factor of the national
economic conditions, we have more confidence that airing the ads using anti-China
rhetoric independently increase presidential candidate’s public support in target states.
43 43.5 44
44.5 45
45.5 46
46.5 47
47.5 48
48.5
9/15
9/16
9/17
9/18
9/19
9/20
9/21
9/22
9/23
9/24
9/25
9/26
9/27
9/28
9/29
9/30
10/1
10/2

58
Did McCain Respond?
China became an issue of the 2008 presidential campaign partly because the
airing of the anti-China campaign ads. Presidential candidates of both parties had drawn
attention to the issues between U.S. and China. During the 2008 presidential campaign,
neither McCain nor interest groups supporting Republican made campaign ads using anti-
China rhetoric to attack Obama or to seek voter support. Though McCain and his
campaign team did not initiate anti-China rhetoric, they did treat China as an issue of the
presidential campaign.
Facing Obama’s attack using anti-China rhetoric, Republican vice presidential
candidate Sarah Palin met with former Secretary of State Henry Kissinger and discussed
international affairs including China on Sep. 22, 2008.33 And during the first presidential
debate on Sep. 26, 2008, McCain noted that U.S. owed $500 billion to China while
Obama noted that the debt was a trillion dollars; the accurately amount is $518 billion.34
Though not airing any campaign ads using anti-China rhetoric, McCain did notice the
importance of China issues in the presidential campaign and had prepared to respond to
China-related issues by other campaign activities including the presidential debates. In
33 See Cooper, Michael and Kate Zernike, “For Palin in New York, a Predebate Introduction to Motorcade Diplomacy,” Published on 9/23/2008, The New York Times. http://thecaucus.blogs.nytimes.com/2008/09/21/palin-to-meet-with-kissinger-colombian-president/. 34 See Bosman, Julie. et al. “Check Point: The First Debate,” published on 9/26/2008, The New York Times, http://thecaucus.blogs.nytimes.com/2008/09/26/check-point-the-first-debate/.

59
2012, Republican presidential candidate Mitt Romney had learned the lesson and used
much more anti-China rhetoric than McCain did in 2008.35
3.4 Comparative Studies: The “Real Change” Ads and the “Alternative” Ads
With the 2008 presidential election approaching, campaign commercials
regarding different issues were aired in mid-September to early-October. The “Sold Us
Out” ads, which using anti-China rhetoric, were effective in seeking voter support, how
about other ads, especially those also mentioned economy and job issues? In this section,
I use my TSCS model to test the effect of another two prominent Obama ads aired from
Sep. 15 to Oct. 1, 2008: the “Real Change” ads and the “Alternative” ads.
The “Real Change” Ads
The “Real Change” ad also sought to link the current Republican government
with companies that sent jobs overseas. However, unlike the “Sold Us Out” ad, it did not
mention China (See Appendix A for transcript).36 From Sep. 16 to Oct. 1, 2008, the ads
were aired totally 16,558 times across the 15 target states of the study.
The dependent variable is Obama’s daily share of the vote from the 15 state polls
and its change (Variable: “Poll” and “Change”). The independent variables are 1)
Whether the “Real Change” ads were aired in the state (Dummy Variable: “C2”, coded
by “0” if the ads were not aired, and “1” if the ads were aired); 2) Daily amount of the
“Real Change” ads aired in the state (Variable: “N2”); 3) Daily spending of airing the
35 For example, there were 22 campaign ads using anti-China campaign ads that supported Mitt Romney in the 2012 presidential campaign. See Political Communication Lab for anti-China campaign ads. http://pcl.stanford.edu. 36 The video of the “Real Change” ads is available on Youtube, uploaded on Sep 11, 2008, http:// www.youtube.com/watch?v=R3F18zVblJ8.

60
“Real Change” ads in the state (Variable: “Spending2”, rescaled in $1000 dollars). In the
lag model, I also include the lag poll as an independent variable (Variable: “LPoll”). The
control variables are Obama’s total ads amount, Obama’s total ads spending,
unemployment rates and FDI from China at the state level.
The results of “Real Change” ads in both the lag model and change model show
that only the lag poll has statistically positive effect on the next day’s poll (in complete
polling model, the coefficient of Lpoll = 0.901 and R2 = 0.807; in fixed effect model, the
coefficient of Lpoll = 0.820 and R2 = 0.805; and in random intercept model, the
coefficient of Lpoll = 0.901 and R2 = 0.807). However, except the slightly negative
effects of McCain’s ads amount (coefficient=-0.002) in pooling and random intercept
change models, none of the major independent variables has statistically positive effect
on Obama’s daily state polls (See Table 11) and their changes (See Table 12). In other
words, the airing and spending on the “Real Change” ads show little or no effect on
Obama’s daily average state poll.

61
Table 11. “Real Change” Ads and Obama’s Next Day State Polls.
Sep. 15- Oct.2, 2008
Independent Variables Pooling FE RI LPoll
0.901*** 0.820*** 0.901***
(0.035) (0.062) (0.035) Airing -0.134 -0.180 -0.134 (0.152) (0.190) (0.152) Amount 0 0 0 (0.002) (0.002) (0.002) Spending 0.002 0.002 0.002
(0.004) (0.004) (0.004)
Unemployment 0.021 N/A 0.021
(0.051) N/A (0.051)
FDI from China 0 N/A 0
(0) N/A (0)
S.Obama 0 0 0
(0) (0) (0)
S.McCain 0 0 0
(0) (0) (0)
N.Obama 0.001 0 0.001
(0.001) (0.001) (0.001)
N.McCain -0.002 -0.002 -0.002
(0.001) (0.001) (0.001)
Constant 4.524** 8.464*** 4.524** (1.778) (2.888) (1.778)
R^2
0.807 0.805 0.807 Probability 0 0 0 N
250 250 250
* significant at the 0.1 level; ** significant at the 0.05 level; *** significant at the 0.001
level

62
Table 12. “Real Change” Ads and the Change in Obama’s State Polls.
Sep. 15- Oct.2, 2008
Independent Variables Pooling FE RI Airing -0.035 -0.115 -0.035 (0.151) (0.192) (0.151) Amount 0. -0.001 0 (0.002) (0.002) (0.002) Spending 0.002 0.003 0.002
(0.004) (0.004) (0.004)
Unemployment 0.072 N/A 0.072
(0.049) N/A (0.049)
FDI from China 0 N/A 0
(0) N/A (0)
S.Obama 0 0 0
(0) (0) (0)
S.McCain 0 0 0
(0) (0) (0)
N.Obama 0.001 0.001 0.001
(0.001) (0.001) (0.001)
N.McCain -0.002* -0.002 -0.002*
(0.001) (0.001) (0.001)
Constant -0.454 0.121 -0.454 (0.283) (0.183) (0.283)
R^2
0.067 0.030 0.067 Probability 0.050 0.807 0.045 N
250 250 250
* significant at the 0.1 level; ** significant at the 0.05 level; *** significant at the 0.001
level
The study of the “Real Change” ads provides a clear comparison. Airing at the
same campaign period and both attacking another candidate about sending job overseas,
the “Real Change” ads did not work, but the “Sold Us Out” ads increased Obama’s public
support by using anti-China rhetoric.

63
The “Alternative” Ads
The “Alternative” ad sought to link John McCain to American attention to foreign
oil. It accuses John McCain of voting against tax incentives for alternative energy and
supporting tax breaks for oil companies (See Appendix A for transcript).37 From Sep. 16
to Oct. 1, 2008, the ads were aired totally 6,187 times across the 15 target states of the
study.
The dependent variable is Obama’s daily share of the vote from the 15 state polls
and its change (Variable: “Poll” and “Change”). The independent variables are 1)
Whether the “Alternative” ads were aired in the state (Dummy Variable: “C3”, coded by
“0” if the ads were not aired, and “1” if the ads were aired); 2) Daily amount of the
“Alternative” ads aired in the state (Variable: “N3”); 3) Daily spending of airing the
“Alternative” ads in the state (Variable: “Spending3”, rescaled in $1000 dollars). In the
lag model, I also include the lag poll as an independent variable (Variable: “LPoll”). The
control variables are Obama’s total ads amount, Obama’s total ads spending,
unemployment rates and FDI from China at the state level.
The results of “Alternative” ads in both the lag model and change model show
that only the lag poll has statistically positive effect on the next day’s poll (in complete
polling model, the coefficient of Lpoll = 0.907 and R2 = 0.807; in fixed effect model, the
coefficient of Lpoll = 0.836 and R2 = 0.805; and in random intercept model, the
coefficient of Lpoll = 0.907 and R2 = 0.807). However, none of the independent variables
has statistically positive effect on Obama’s daily state polls (See Table 13) and their 37 The video of the “Alternative” ads is available on “The Living Room Candidate.” Original air date: September 18, 2008. http://www.livingroomcandidate.org/commercials/2008/alternative.

64
changes (See Table 14). In other words, the airing and spending on the “Alternative” ads
have no effect on Obama’s daily average state poll. The results also indicate that
McCain’s ads amount has a slightly negative effect on Obama’s change of state poll
(coefficient=-0.002) in pooling and random intercept change models.
Table 13. “Alternative” Ads and Obama’s Next Day State Polls.
Sep. 15- Oct.2, 2008
Independent Variables Pooling FE RI LPoll
0.907*** 0.836*** 0.907***
(0.035) (0.062) (0.035) Airing 0.141 0.128 0.141 (0.150) (0.165) (0.150) Amount -0.002 -0.002 -0.002 (0.003) (0.003) (0.003) Spending 0.001 0.002 0.001
(0.004) (0.005) (0.004)
Unemployment 0.015 N/A 0.015
(0.053) N/A (0.053)
FDI from China 0 N/A 0
(0) N/A (0)
S.Obama 0 0 0
(0) (0) (0)
S.McCain 0 0 0
(0) (0) (0)
N.Obama 0.001 0 0.001
(0.001) (0.001) (0.001)
N.McCain -0.002 -0.002 -0.002
(0.001) (0.001) (0.001)
Constant 4.181** 7.549*** 4.181** (1.763) (2.860) (1.763)
R^2
0.807 0.805 0.807 Probability 0 0 0 N
250 250 250 * significant at the 0.1 level; ** significant at the 0.05 level; *** significant at the 0.001
level

65
Table 14.
“Alternative” Ads and the Change in Obama’s State Polls. Sep. 15- Oct.2, 2008
Independent Variables Pooling FE RI Airing 0.144 0.129 0.144 (0.152) (0.167) (0.152) Amount -0.002 -0.002 -0.002 (0.003) (0.002) (0.003) Spending 0.003 0.004 0.003
(0.004) (0.004) (0.004)
Unemployment 0.068 N/A 0.068
(0.050) N/A (0.050)
FDI from China 0 N/A 0
(0) N/A (0)
S.Obama 0 0 0
(0) (0) (0)
S.McCain 0 0 0
(0) (0) (0)
N.Obama 0.001 0 0.001
(0.001) (0.001) (0.001)
N.McCain -0.002* -0.002 -0.002*
(0.001) (0.001) (0.001)
Constant -0.492* -0.003 -0.492* (0.286) (0.172) (0.286)
R^2
0.070 0.047 0.070 Probability 0.038 0.735 0.033 N
250 250 250
* significant at the 0.1 level; ** significant at the 0.05 level; *** significant at the 0.001
level
The study of the “Alternative” ads indicates that the ads using anti-foreign
rhetoric about energy issue failed to increase Obama’s public support. While at the same
period, airing the “Sold Us Out” ads, which particularly use anti-China rhetoric, made a
difference and increased presidential candidate’s public support in target states.

66
3.5 Conclusion
Airing the ads using anti-China rhetoric has strong one-day effect in increasing
the favoring candidate’s popular support, as well as the echo effect that reinforces and
expands the attack on the opponent candidate linked to China issues. The “freshness” of
ads using anti-China rhetoric on different days and/or in different states appears to be
more effective than the “repeating” of those ads on the same day and/or in the same state.
Obama took the advantage of airing ads using anti-China rhetoric in 2008, and the
effort did help to increase his voter support and contribute to his winning on Election
Day. In 2012, presidential candidates and interest groups supporting both parties had
learned the lesson and increased their anti-China rhetoric during the campaign period.
There were totally 40 campaign ads using anti-China rhetoric were aired to support
presidential candidates from both parties during the general campaign period, much more
than the 7 ads aired in 2008.38 Presidential candidates also used anti-China rhetoric in all
kinds of campaign activities including on-the-ground speeches, presidential debates, and
fund-raising events, which generated echo effect from the news converge on China issues
over the course of the 2012 presidential campaign. In the next chapter, I explore the anti-
China rhetoric during the 2012 presidential campaign and examine its effects on the U.S.
foreign policy towards China.
38 See Political Communication Lab for anti-China campaign ads. http://pcl.stanford.edu.

67
Chapter 4. Anti-China Rhetoric, U.S. Foreign Policy towards China and Public Opinion 4.1 Overview
In this Chapter, I explore the impact of Anti-China rhetoric in presidential
campaigns on the U.S. foreign policy towards China and American public opinion of
China. The foreign policy in this study stands for the U.S. government’s foreign policy,
which consists of the policy of the President, the administration, and Congress, indicated
by the public statements by those foreign policy players. Unlike the election study, which
mainly uses quantitative analyses through hypothesis testing and focuses on campaign
ads, my foreign policy study primarily uses qualitative methods and focus on all kinds of
campaign activities including campaign ads, candidates’ speeches, and debates. The
primary source of the anti-China campaign rhetoric is the articles from the New York
Times.
By analyzing the China-related public statements and campaign activities using
anti-China rhetoric during the 2012 presidential campaign period (March to November), I
argue that anti-China rhetoric in a presidential campaign affected U.S. foreign policy
towards China. Specifically, President’s statements on China responded to the anti-China
rhetoric from the opponent presidential candidates or reinforced his own anti-China
rhetoric. Congressional activities regarding certain China issues were less in favor of
China when there were more campaign activities using anti-China rhetoric. Partisan
sponsorships were stuck to their party’s presidential candidates’ anti-China campaign
rhetoric. And anti-China rhetoric during the presidential election year had a negative
effect on American public opinion of China.

68
4.2 Method and Sources
Anti-China Campaign Rhetoric in the New York Times
The general independent variable is the anti-China campaign rhetoric during the
presidential campaign period (March to November in the election year 2012). The data is
obtained from articles in the New York Times39. From the New York Times website, I first
use the keyword “China” to search all the New York Times articles during the 2012
presidential campaign period. From those articles, I identify those contents that contain
anti-China rhetoric in presidential candidate’s campaign ads, debates, public messages,
statements, speeches, and news conference remarks. And then I divide each of those
articles with anti-China rhetoric into three categories: economic issues, security issues,
and human rights issues. The different effects among those issue areas on foreign policy
are examined and compared. Data are aggregated by month, and the intensity is measured
by the monthly amounts of the New York Times articles.40 When conducting an in-depth
analysis on a specific issue, further sources of campaign activities using anti-China
rhetoric are used apart from the articles of the New York Times. The sources include
Political Communication Lab for anti-China campaign ads and the American Presidency
Project for the content of candidates’ speeches and debates.41 and 42 Figure 16 shows the
monthly amount of the New York Times articles regarding anti-China rhetoric in
presidential campaign from Mar. 1 to Nov. 6, 2012, and Figure 17 shows the monthly
39 The New York Times articles are obtained from its website: www.nytimes.com. 40 The New York Times articles that reported the same anti-China rhetoric by the presidential candidate were counted as one article. 41 http://pcl.stanford.edu/campaigns. 42 See http://www.presidency.ucsb.edu/index.php.

69
amount of articles regarding anti-China rhetoric in presidential campaign from Mar. 1 to
Nov. 6, 2012, by issue category.
Figure 16. Amount of the New York Times Articles Regarding Anti-China Rhetoric in Presidential Campaign. From Mar. 1 to Nov. 6, 2012 Source: The New York Times
Figure 17. Amount of the New York Times Articles Regarding Anti-China Rhetoric
in Presidential Campaign (by Issue Category). From Mar.1 to Nov. 6, 2012 Source: The New York Times
0 2 4 6 8 10 12 14 16
0
2
4
6
8
10
12
14
16
Economy
Security
Human Right

70
Based on the New York Times articles as the proxy of the anti-China rhetoric in
the presidential campaign, I will show how that rhetoric affects the White House
statements on China and American public opinion of China in the following sections.
Since President Obama’s policy statements from the White House and campaign
statements reported by the New York Times largely overlap, I particularly single out the
New York Times articles with Mitt Romney’s and other Republican (GOP) presidential
candidates’ anti-China rhetoric during the campaign period in order to examine whether
and how the president responded to the anti-China rhetoric in terms of all kinds of issues.
Figure 18 shows the number of anti-China rhetoric from Romney and GOP from Mar. 1
to Nov. 6, 2012.
Figure 18. Amount of Anti-China Rhetoric from Romney and GOP
(by Issue Category). From Mar. 1 to Nov. 6, 2012 Source: The New York Times
0
1
2
3
4
5
6
7
8
9
Economy
Security
Human Right

71
The Presidents and Foreign Policy towards China
Do a U.S. president’s China policies respond to the anti-China rhetoric by his
opponent in the presidential campaign? The literature on this question is inconclusive.
The Presidency was the primary agenda setter in American politics, particularly in
foreign policy (e.g. Wildavsky 1966; Canes-Wrone et al. 2008). But foreign policy was
also responsive to media coverage and international events (Wood and Peake 1998;
Edwards and Wood 1999). Does anti-China rhetoric in the presidential campaign make a
difference in foreign policy making? To answer those questions, I examine the impact of
campaign activities using anti-China rhetoric on the president’s and the administration’s
foreign policy statements on China during and after the campaign.
President Obama’s China Policy: 2009-2011
After coming into office in 2009, President Obama had sought cooperation with
China on several important international issues, including dealing with the global
financial crisis through the mechanism of the G-20, establishing the "U.S.-China
Strategic and Economic Dialogue” (S&ED) to deepen mutually beneficial cooperation in
economy and trade,43 taking multilateral efforts to block the nuclear ambitions of Iran and
North Korea,44 and setting more cooperation on climate change.45 On the other hand, the
Obama administration had challenged China's core interests and taken a tough stance on a
43 See “Statement on Bilateral Meeting with President Hu of China,” Office of the Press Secretary, April 1, 2009. http://www.whitehouse.gov. 44 See Press Briefings by Press Secretary Robert Gibbs, Office of the Press Secretary, The White House, April 14, 2009, May 16, 2009, May 28, 2009, Feb 4, 2010, and Oct 28, 2010. http://www.whitehouse.gov. 45 During Obama’s visit to China in November 2009, the two sides produced seven cooperative agreements on clean energy, encompassing areas such as research, technology, manufacturing, regulatory policy and low carbon-development strategies. See “U.S.-China Joint Statement,” Beijing, China. November 17, 2009. http://www.whitehouse.gov/the-press-office/us-china-joint-statement.

72
number of sensitive issues, such as accusing China of manipulating its currency for trade
advantage,46 enhancing U.S. military existence in the East Asian region,47 accusing China
of human rights violations,48 and restrictions on Internet freedom.49
President Obama’s China policy had a major shift from soft to tough in 2010.
Since President Obama came into office in January 2009, the administration pledged to
further develop bilateral cooperation in keystone areas. It laid stress on cooperation and
common interests in the statements and maintained a lower profile to disagreements and
issues of conflict (See Table 15). By contrast, after Obama’s state visit to China in
November 2009, the administration took a tougher stance on China and the bilateral
relationship was characterized by significant discord (See Table 16).
46 President Obama said in a Town Hall discussion, “China, its currency is valued lower than market conditions would say it should be. And what that means is essential that they can sell stuff cheaper here, and our stuff when we try to sell there is more expensive. So it gives them an advantage in trade … what we’ve said to them is you need to let your currency rise in accordance to the fact that your economy is rising,” See “Remarks by the President at CNBC Town Hall Discussion on Jobs,” Newseum, Washington, D.C., September 20, 2010. http://www.whitehouse.gov. 47 Since late 2011, the Obama administration began to adopt a strategic “pivot” from the Middle East to East Asia. For example, the United States has planned to deploy 2,500 Marines in Australia to shore up alliances in Japan, South Korea, Philippines and Singapore. See The Foreign Policy Initiative (FPI), “The Obama Administration's Pivot to Asia.” http://www.foreignpolicyi.org/content/obama-administrations-pivot-asia. 48 See Stephen Kaufman, “United States Criticizes Trial of Chinese Dissident Liu Xiaobo,” http://America.gov, December 23, 2009. 49 See Secretary of State Hillary Rodham Clinton, “Remarks on Internet Freedom,” Washington, DC, January 21, 2010. http://www.state.gov/secretary/rm/2010/01/135519.htm.

73
Table 15.
Selected Events and Statements from the Obama Administration in 2009
Month Events and Statements 01/2009 Treasury Secretary Timothy Geithner avoided talking about China as a "currency
manipulator" in the White House press briefing, and said that ''we have to take a comprehensive approach to enhancing our economic relationship with China.''
03/2009 President Obama and China’s Foreign Minister Yang emphasized the desire to strengthen cooperation and build a positive and constructive U.S.-China relationship.
04/2009 The two sides decided to establish the "U.S.-China Strategic and Economic Dialogue (S&ED)."
05/2009 President Obama expressed appreciation for the important role China had played as the Chair of the Six-Party Talks on North Korea.
09/2009 The Obama Administration postponed a meeting with the Dalai Lama to occur after the President’s first visit to China.
11/2009 During President Obama's state visit to China, the two sides produced seven cooperative agreements on clean energy and climate change.
The statements were retrieved from WhiteHouse.gov
Table 16. Selected Events and Statements from the Obama Administration
in 2010 and in 2011 Month Events and Statements 01/2010 Secretary of State Hillary Clinton condemned the cyber attacks in a policy speech on
Internet freedom. 01/2010 The Obama administration notified Congress of arms sales to Taiwan. 02/2010 President Obama announced a tougher line on trade issues. He claimed at the Senate
Democratic Policy Committee Issues Conference that “we have lost 2.3 million jobs as a result of the trade imbalance with China between 2001 and 2007.”
02/2010 President Obama unofficially meet with Tibet’s exiled spiritual leader, the Dalai Lama, at the White House.
07/2010 U.S. military aircrafts entered the Yellow Sea of China 09/2010 President Obama pushed China about their currency. He said the undervalued
currency gave China an advantage in trade. "There should be an adjustment there based on market conditions. They have said yes in theory, but in fact they have not done everything that needs to be done."
12/2010 President Obama reiterated his appeal for the release of Liu Xiaobo, the 2010 winner of Nobel Peace Prize.
09/2011 The White House Press Secretary Jay Carney stated that the Chinese currency was substantially undervalued, and we needed to see continued progress of appreciating its currency.
11/2011 The Obama administration began to adopt a strategic “pivot” from the Middle East to East Asia by planning to deploy 2,500 Marines in Australia.
The statements were retrieved from WhiteHouse.gov

74
President Obama’s tougher stance on China had coincided with the anti-China
campaign rhetoric in the 2010 midterm election. In 2010, candidates from both parties
targeted China for some of America's economic woes. The New York Times reported on
October 9, 2010, that, “in the past week or so, at least 29 candidates have unveiled
advertisements suggesting that their opponents have been too sympathetic to China and,
as a result, Americans have suffered.”50 As a response to those campaign accusations, the
Obama administration adopted a tougher stance on China. To verify this speculation, I
conducted an in-depth analysis on the relationship between anti-China rhetoric during the
2012 presidential campaign and the President’s foreign policy statements on China.
Tracking the Public Statements
The dependent variable is the White House statements on China from March to
November in the election year 2012. The independent variable is the New York Times
anti-China rhetoric in the 2012 presidential campaign. To find the relationship between
the administration’s public statements on China and the anti-China campaign rhetoric, I
identified all the China-related press articles of the Obama administration by searching
the White House’s official website. Of the 82 statements, 60 of them took a tough stance
on China (See Figure 19).51
50 See David W. Chen, “China Emerges as a Scapegoat in Campaign Ads,” http://www.nytimes.com. 51 I treat the same policy statements on the same day or closing days as one statement. For example, President Obama accused Romney of outsourcing jobs to China twice on September 13 in two campaign events, and I count them as one statement. The source of the statements is whitehouse.gov.

75
Figure 19. Amount of the White House Statements Taking a Tough Stance on China
(by Issue Category). From Mar.1 to Nov. 6, 2012 Source: The New York Times
4.3 Findings
White House Statements: Response and Reinforcement
President’s foreign policy statements on China responded to the anti-China
rhetoric during the presidential campaign. Figure 20 tracks the monthly amount of
President’s tough statements on China and the New York Times articles of Anti-China
Rhetoric in the 2012 presidential campaign. Apparently, the President’s foreign policy
statements on China generally stuck to candidates’ anti-China rhetoric during the 2012
presidential campaign period.
0
2
4
6
8
10
12
14
16
Economy
Security
Human Right

76
Figure 20. Amount of President’s Tough Statements on China and the New York
Times Articles of Anti-China Rhetoric in Presidential Campaign. Mar.1 – Nov. 6, 2012
Source: The New York Times (www.nytimes.com) and The White House (www.whitehouse.com)
From Mar. 1 to Nov. 6, 2012, President Obama responded to 80 percent of
Romney’s and/or GOP’s anti-China campaign rhetoric reported in the New York Times by
public statements. On the other hand, 81 percent of Obama’s anti-China campaign
rhetoric reported in the New York Times was reinforced by the White House’s foreign
policy statement on China.
Figure 21 and 22 tracks the New York Times articles of Romney’s and GOP’s
anti-China campaign rhetoric and their responses from the White House statements from
Mar. 1 to Nov. 4, 2012 (See Appendix D for the content of the anti-China rhetoric and
White House statements). In general, when the campaign opponents made anti-China
campaign rhetoric, the President and/or the administration would respond to the rhetoric
and most of the responses contained a foreign policy statement on China.
0
2
4
6
8
10
12
14
16
18
White House Touch Statements on China
Anti-‐China Rhetoric in NYT

77
Figure 21. Romney’s and/or GOP’s Anti-China Rhetoric and the Response from the White House, from Mar. to Jun. 2012.
The statements were retrieved from WhiteHouse.gov and The New York Times.

78
Figure 22. Romney’s and/or GOP’s Anti-China Rhetoric
and the Response from the White House, from Jul. to Nov. 2012. The statements were retrieved from WhiteHouse.gov and The New York Times.

79
Figure 23 and 24 tracks the New York Times articles of Obama’s campaign
rhetoric and reinforcements by the White House statements from Mar. 1 to Nov. 4, 2012
(See Appendix D for the content of the anti-China rhetoric and White House statements).
When President Obama had a campaign statement using anti-China rhetoric reported by
the New York Times, the White House would generally make a related foreign policy
statement on China to reinforce the campaign statement.

80
Figure 23. Obama’s Anti-China Campaign Rhetoric and
Reinforcement by the White House, from Mar. to Jun. 2012. The statements were retrieved from WhiteHouse.gov and The New York Times.

81
Figure 24. Obama’s Anti-China Campaign Rhetoric and Reinforcement by the White House, from Jul. to Nov. 2012.
The statements were retrieved from WhiteHouse.gov and The New York Times.

82
Only few New York Times articles with anti-China campaign rhetoric during the
2012 presidential campaign period did not receive a response from the White House.
These New York Times articles were comparatively not as important as those received a
response. For example, the White House did not comment on two New York Times
articles with Romney’s Bain purchase in China in March 2012 probably because Romney
had not clinched the Republican nomination at that time. Later, as Romney’s advantage
over other Republican candidates for nomination got clear, the President started to attack
Romney sharply on his Bain purchase in China.52 Also, the White House did not respond
to some anti-China rhetoric that blamed Obama administration’s borrowing from China
for spending, which was made by the Republican Vice President Nominee Ryan and by
some PACs supporting Romney, probably because there were simultaneously tougher
rhetoric made directly by Romney himself and the White House chose to respond to the
more important issue.53
52 See “Republicans Brace for Possible Open Convention,” reported in 3/18/2012, The New York Times. http://www.nytimes.com/2012/03/18/us/politics/republicans-brace-for-possible-open-convention.html?pagewanted=all&gwh=9FF417CA4E4862D76972E4918B39DA80&gwt=pay; and “When Packaging Oversteps the Facts,” reported in 3/25/2012, The New York Times. http://www.nytimes.com/2012/03/25/opinion/sunday/when-packaging-oversteps-the-facts.html. 53 See “Full Transcript of the Vice-Presidential Debate,” reported on 3/25/2012, The New York Times. http://www.nytimes.com/2012/10/11/us/politics/full-transcript-of-the-vice-presidential-debate.html?pagewanted=all&gwh=C0D16C034EDAA86B70B7C78DE7C3DE43&gwt=pay; and “Campaigns Blitz 9 Swing States in a Battle of Ads,” reported on 6/8/2012, The New York Times. http://www.nytimes.com/2012/06/08/us/politics/9-swing-states-are-main-focus-of-ad-blitz.html.

83
The Evolution of White House Statements on China during the 2012 Presidential Campaign
The President was not always tough on China. Whether highlighting the
cooperation or taking a tough stance on China depended on the intensity of anti-China
rhetoric in the presidential campaign.
Economic issues predominated the anti-China rhetoric by presidential candidates
in 2012. From Mar. 1 to Nov. 6 (Election Day), 2012, about 88 percent (46 out of 52) of
the New York Times articles regarding presidential candidates’ anti-China rhetoric were
about economic issues. And about 74 percent (61 out of 82) of White House statements
on China were about economic issues. President Obama was tough on economic policy
towards China in March 2012 when the Republican presidential candidates fiercely
attacked on one another with issues related to China and proposed anti-China claims in
the nominating campaigns.54 As a response, President Obama filed World Trade
Organization (WTO) case against China on the issue of rare earth materials and claimed
to enforce the law against China’s unfair advantage on solar energy.55 In April, as the
number of economic-related anti-China rhetoric by presidential candidates decreased, the
54 For example, Romney’s former firm Bain was reported to have purchased in China; PAC supporting Gingrich was invested by SEC related interests in China; Romney vowed to crack down on China’s trade. See the New York Times. http://www.nytimes.com/2012/03/05/us/05iht-letter05.html?pagewanted=all&_r=0; http://www.nytimes.com/2012/03/06/us/politics/republican-policies-for-iran-differ-little-from-obamas.html; and http://www.nytimes.com/2012/03/23/us/politics/mitt-romneys-stance-on-china trade.html?pagewanted=all&_r=0&gwh=3302F5D734F154236797F73F0DE25513&gwt=pay. 55 See “Remarks by the President on Fair Trade” published on 3/13/2012 and “Remarks by the President on Energy” published on 3/21/2012, WhiteHouse.gov, https://www.whitehouse.gov/the-press-office/2012/03/13/remarks-president-fair-trade; and https://www.whitehouse.gov/the-press-office/2012/03/21/remarks-president-energy.

84
administration turned to adopt a softer stance on China.56 President Obama mentioned
the economic cooperation with China at the CEO summit of the Americas and Ben
Rhodes, Deputy National Security Advisor for Strategic Communication, praised China
for making some progress in currency.57 In May, as Romney repeated vowing to name
China as a currency manipulator, President Obama responded by accusing Romney’s
outsourcing job to China and by reinstating the trade cases against China’s unfair trade
practices when signing the Export-Import Bank Bill.58 and 59 There were few New York
Times articles with anti-China rhetoric of both parties’ candidates from June to August
and the month of June witnessed the most friendly economic-related statements that the
White House made on China in 2012.60 On Jun. 16, White House claimed that China was
not a threat and welcomed China’s commitment on currency issue; and President Obama
sought to build a cooperative partnership with China and avoided to talk about currency
56 In April 2012, there were only two New York Times articles with Romney’s anti-China rhetoric on economic issue and both of them were about his claiming China as a currency manipulator. See http://www.nytimes.com/2012/04/16/us/politics/house-republicans-would-thwart-romney-move-to-center.html?pagewanted=all ; and http://thecaucus.blogs.nytimes.com/2012/04/17/boehner-endorses-romney/. 57 See “Remarks by President Obama at CEO Summit of the Americas” published on 4/14/2012 and “Press Briefing by Press Secretary Jay Carney and Deputy National Security Advisor for Strategic Communication Ben Rhodes,” published on 4/14/2012, https://www.whitehouse.gov/the-press-office/2012/04/14/remarks-president-obama-ceo-summit-americas; and https://www.whitehouse.gov/the-press-office/2012/04/14/press-briefing-press-secretary-jay-carney-and-deputy-national-security-0. 58 Romney’s vowing on China was reported by the New York Times on May 2, 12 and 24, 2012. Obama’s accusation on Romney’s outsourcing jobs to China was reported by the New York Times on May 1 and 7, 2012. See www.nytimes.com. 59 See “Remarks by the President at Export-Import Bank Bill Signing,” published on 5/30/2012. https://www.whitehouse.gov/the-press-office/2012/05/30/remarks-president-export-import-bank-bill-signing. 60 Only 3 New York Times articles were about Romney’s anti-China rhetoric and 3 New York Times articles were about Obama’s anti-China rhetoric in June, July and August. See www.nytimes.com.

85
issues at the meeting with Chinese President Hu Jintao.61 The only exception in the
summer was the sanction against China’s Bank of Kunlun on July 31,62 which was
announced right after Romney’s vow to sanction against China on July 29.63 In
September and October, both contenders aggressively attacked each other using anti-
China rhetoric and the White House correspondingly took a tough stance on China.64
Romney continued criticizing Obama’s soft policy towards China and claiming to crack
down on China if elected,65 while Obama responded by criticizing Romney’s Bain
purchase in China and made a couple of tough foreign policy statements on China
61 See “Press Briefing by Press Secretary Jay Carney, 6/13/12,” published on 6/13/12; “G20 Leaders Declaration,” published on 6/16/2012; and “Remarks by President Obama and President Hu Jintao of China before Bilateral Meeting,” published on 6/19/2012. See https://www.whitehouse.gov/the-press-office/2012/06/13/press-briefing-press-secretary-jay-carney-61312; https://www.whitehouse.gov/the-press-office/2012/06/19/g20-leaders-declaration; and https://www.whitehouse.gov/the-press-office/2012/06/19/remarks-president-obama-and-president-hu-jintao-china-bilateral-meeting. 62 See “Statement by the President on the Announcement of Additional Sanctions Related to Iran,” published on 7/31/2012. https://www.whitehouse.gov/the-press-office/2012/07/31/statement-president-announcement-additional-sanctions-related-iran. 63 See “Romney and Obama Strain to Show Gap on Foreign Policy,” reported on 7/29/2012. http://www.nytimes.com/2012/07/29/us/politics/obama-and-romney-strain-to-assert-foreign-policy-differences.html?_r=1&partner=rss&emc=rss&pagewanted=all. 64 There were 10 New York Times articles with presidential candidates’ anti-China rhetoric reported in September and 15 in October, 2012; The White House made 15 tough statements on China in Septemer and 16 in October, 2012. 65 For example, Romney made a campaign ad that claimed to crackdown on cheaters like China on September 17. See “A Shift in Strategy in Romney's Latest Ads,” reported on 9/17/2012. http://thecaucus.blogs.nytimes.com/2012/09/17/a-shift-in-strategy-in-romneys-latest-ads/.

86
including issuing executive orders to reject Chinese Acquisition of U.S. companies, filing
WTO cases against China, and claiming to fight China on cleaning energy.66
Figure 25 tracks the monthly amount of the President’s tough economic
statements on China and the New York Times articles of anti-China rhetoric regarding
economic issues in the 2012 presidential campaign. The figure indicates that the White
House’s economic foreign policy statements adhered to the anti-China rhetoric during the
presidential campaign.
Figure 25. Amount of the President’s Tough Statements on China and the New York Times Articles of Anti-China Rhetoric in the 2012 Presidential Campaign (Economic
Issues). Source: The New York Times (www.nytimes.com) and The White House
(www.whitehouse.com)
66 See “Order Signed by the President regarding the Acquisition of Four U.S. Wind Farm Project Companies by Ralls Corporation,” published on 9/28/2012; “Press Gaggle by Principal Deputy Press Secretary Josh Earnest en route Cincinnati, OH, 9/17/12,” published on 9/17/2012; and “Remarks by the President at a Campaign Event,” published on 10/8/2012. https://www.whitehouse.gov/the-press-office/2012/09/28/order-signed-president-regarding-acquisition-four-us-wind-farm-project-c; http://www.whitehouse.gov/the-press-office/2012/09/17/press-gaggle-principal-deputy-press-secretary-josh-earnest-en-route-cinc; and https://www.whitehouse.gov/the-press-office/2012/10/08/remarks-president-campaign-event.
0
2
4
6
8
10
12
14
16
White House Touch Statements on China
Anti-‐China Rhetoric in NYT

87
Though the amounts of anti-China campaign rhetoric about security, human
rights, and other issues were not as numerous as statements on economic issues, they did
coincident with the policy tone of the White House during this period.
The major security issues between U.S. and China during the 2012 presidential
campaign periods included the UN sanctions against Syria, preventing nuclear
proliferation, and conflicts in South China seas. In March and early April 2012,
Republican presidential candidates fiercely attacked China and Obama’s policy regarding
security issues.67 Correspondingly, the White House took a tough stance on China by
criticizing China’s vetoing UN sanctions against Syria, urging China to restrain Iran’s
and North Korea’s nuclear proliferation.68 However, as the anti-China rhetoric regarding
security issues diminished since mid-April, the tone of the White House rhetoric changed
as well. It was less critical from mid-April to Election Day. On Jun. 8, President Obama
claimed to seek a cooperative agreement with China on Iran, Syria and South China
67 See “Candidates Hammer Obama Over Iran, but Approaches Differ Little,” reported on 3/5/2012; and “Smaller Navy Ship Has a Rocky Past and Key Support,” reported on 4/5/2012. http://www.nytimes.com/2012/03/06/us/politics/republican-policies-for-iran-differ-little-from-obamas.html; and http://www.nytimes.com/2012/04/06/us/politics/a-smaller-navy-ship-with-troubles-but-presidents-backing.html?src=me&ref=us&_r=0. 68 See “Remarks by the President at AIPAC Policy Conference,” published on 3/4/2012; “Remarks by President Obama and President Hu Jintao of the People's Republic of China Before Bilateral Meeting,” published on 3/26/2012; and “Press Briefing by Press Secretary Jay Carney, 4/11/12,” published on 4/11/2012. https://www.whitehouse.gov/the-press-office/2012/03/04/remarks-president-aipac-policy-conference-0; https://www.whitehouse.gov/the-press-office/2012/03/26/remarks-president-obama-and-president-hu-jintao-peoples-republic-china-b; and https://www.whitehouse.gov/the-press-office/2012/04/11/press-briefing-press-secretary-jay-carney-41112.

88
seas.69 And when asked about tough security issues regarding China, the White House
generally refused to respond. For example, at press briefings on Apr. 19 and Jun. 5, Press
Secretary Carney refused to label China as a military threat;70 on May. 19, the Camp
David Declaration welcomed the resumption of talks between Iran and the E3+3
including China;71 and on Sep. 19, Carney claimed that U.S. did not take a position on the
Senkaku Islands (Diaoyu Dao) issue between China and Japan.72
Though there were few New York Times articles about presidential candidates’
positions on China’s human rights, those articles, to some extent, encouraged the White
House to take certain actions. A prominent case was Chen Guangcheng, a Chinese civil
rights activist. On Apr. 22, 2012, Chen escaped from house arrest and entered the U.S.
Embassy in Beijing.73 The administration initially made no comment, but later took
69 See “Statement on the President’s Meeting with President Aquino of the Philippines,” published on 6/8/2012; and “Background Conference Call on Today's Presidential Determination Regarding the Availability of non-Iranian Oil in the Market,” published on 6/11/2012. https://www.whitehouse.gov/the-press-office/2012/06/08/statement-president-s-meeting-president-aquino-philippines; and https://www.whitehouse.gov/the-press-office/2012/06/11/background-conference-call-todays-presidential-determination-regarding-a. 70 See “Press Briefing by Press Secretary Jay Carney, 4/19/12,” published on 4/19/2012; and “Press Briefing by Press Secretary Jay Carney, Secretary of Education Arne Duncan, and Director of the Consumer Financial Protection Bureau Richard Cordray, 6/5/12,” published on 6/5/2012. https://www.whitehouse.gov/the-press-office/2012/04/19/press-briefing-press-secretary-jay-carney-41912; and https://www.whitehouse.gov/the-press-office/2012/06/05/press-briefing-press-secretary-jay-carney-secretary-education-arne-dunca. 71 See “Camp David Declaration,” published on 5/19/2012. https://www.whitehouse.gov/the-press-office/2012/05/19/camp-david-declaration. 72 See “Press Briefing by Press Secretary Jay Carney, 9/19/12,” published on 9/19/2012. https://www.whitehouse.gov/the-press-office/2012/09/19/press-briefing-press-secretary-jay-carney-91912. 73 See Andrew Jacobs and Jonathan Ansfield, “Challenge for U.S. After Escape by China Activist,” published on 4/27/2012, The New York Times. http://www.nytimes.com/2012/04/28/world/asia/chen-guangcheng-blind-lawyer-escapes-house-arrest-china.html.

89
actions to solve the case when Romney criticized Obama’s silence about Chen
Guangcheng. At the press briefing on Apr. 23, Press Secretary Carney refused to single
out China as the regimes that repressed its dissidents.74 And on Apr. 30, President Obama
declined to talk about the case of Chen Guangcheng.75 After Romney criticized Obama
for his long silence about Chen Guangcheng,76 the administration granted Chen and his
families U.S. visas. They departed Beijing for New York City on May. 19.77 It was
difficult for the administration to take the actions regarding China’s human rights at the
time when the U.S. was seeking to improve relations with China and seeking its support
with respect to crises in Iran, Sudan, Syria, and North Korea.78 But Romney’s anti-China
rhetoric made the administration change its statement and take particular policy action on
the Chen Guangcheng case. Accordingly, the pressure from an opposite candidate’s anti-
China rhetoric in the presidential campaign might contribute to a policy change of the
White House on China’s human rights issue.
74 See “Press Briefing by Press Secretary Jay Carney, 4/23/12,” published on 4/23/2012. https://www.whitehouse.gov/the-press-office/2012/04/23/press-briefing-press-secretary-jay-carney-42312. 75 See “On a Tightrope, President Prods China on Rights,” published on 5/1/2012, The New York Times. http://www.nytimes.com/2012/05/01/world/asia/talks-between-china-and-united-states-over-dissident-chen-guangcheng.html. 76 See “Amnesia as the West Judges China,” published on 5/11/2012, The New York Times. http://www.nytimes.com/2012/05/12/world/asia/12iht-currents12.html. 77 See Andrew Jacobs. “Blind Chinese Dissident Leaves on Flight for U.S.” published on 5.19.2012, The New York Times. http://www.nytimes.com/2012/05/20/world/asia/china-dissident-chen-guangcheng-united-states.html. 78 See Andrew Jacobs and Jonathan Ansfield, “Challenge for U.S. After Escape by China Activist,” published on 4/27/2012, The New York Times. http://www.nytimes.com/2012/04/28/world/asia/chen-guangcheng-blind-lawyer-escapes-house-arrest-china.html.

90
4.4 Congress and Anti-China Rhetoric in Presidential Campaign
Since the end of the Cold War, there has generally been a shift away from the
leadership of the foreign policy elite toward greater pluralism. A wide range of domestic
actors has been active in the making of foreign policy, including Congress. The Congress
plays an important role in influencing U.S. policy because of the greater fluidity and
pluralism in U.S. foreign policy making, including the policy toward China. Scholars in
congressional politics identified many factors that contribute to the congressional
behavior, such as reelection, the pressure from interest groups, constituency and
partisanship (e.g. Fenno 1973; Mayhew 1974; Fiorina 1974; Ripley 1998; Bennett 2002;
Haney 2011). I argue that congressional behaviors regarding China issues are correlated
with the presidential candidates’ anti-China rhetoric during the presidential campaign
period. Specifically, congressional activities regarding certain China issues are less in
favor of China when there are more campaign activities using anti-China rhetoric.
The dependent variable in this section is campaign activity, which includes the
introduction of a bill, roll call voting, and agreement of amendment. I identified all the
congressional activities regarding China issues during the campaign period (from March
to October 2012) from The Library of Congress (Thomas). The measurements of the
dependent variable include 1) date; 2) issues; 3) the category of the issue (economy,
security and/or human rights); 4) the action of the case (introduced, passed or agreed); 5)
favoring China or against China; 6) House or Senate; and 7) sponsor’s party ID. The
independent variable is the intensity of anti-China rhetoric from the presidential
candidates, which is indicated by the amount of New York Times articles. To examine the
effect of the independent variable on the dependent variable, I statistically analyze the

91
general relationship between anti-China rhetoric and the congressional activities
throughout the 2012 presidential campaign period, and also qualitatively examine the
detail congressional activities to support my argument.
Through the statistical and quantitative analyses, I find that 1) congressional
activities are generally less in favor of China when there are more campaign activities
using anti-China rhetoric; 2) partisan sponsorships are consistent with to their party’s
presidential candidates’ anti-China campaign rhetoric; 3) human rights is the major issue
of the anti-China congressional activities.
Figure 26 shows the monthly amounts of anti-China rhetoric in the presidential
elections in the New York Times articles and monthly amounts of anti-China
congressional activities from March to October 2012.
Figure 26. Anti-China Rhetoric and Anti-China Congressional Activities.
March to October 2012 Source: The New York Times and The Library of Congress
The growing amounts of anti-China campaign activities were associated with the
increasing of anti-China rhetoric in quantity in May and September 2012. By contrast,
0
2
4
6
8
10
12
14
16
Mar Apr May Jun Jul Aug Sep Oct
Amount of NYC anti-‐China rhetoric
Amount of Anti-‐China congressional activities

92
April and summer (June to August) 2012 had comparatively few anti-China campaign
rhetoric in the New York Times articles and correspondingly few anti-China congressional
activities. October was an outlier. With the presidential election and the congressional
election approaching, there were 15 New York Times articles about anti-China rhetoric by
presidential candidates, but no anti-China legislation was introduced, voted or agreed.
One probable reason was that the congressional elections were also approaching in
October, and members of Congress might focus more on the re-election than on foreign
policy making.
There were totally 18 congressional activities (12 from House of Representative
and 6 from Senate) about China from March to October 2012. 15 congressional activities
were tough on China, of which 7 were about human rights, 3 were about the economy, 3
were about security and 2 were about general U.S.-China relations (See Table 17). There
were 3 congressional activities in favor of China, and all of them were House
introductions regarding economic issues. Senate was always tough on China throughout
the 2012 presidential campaign period. All of the 6 Senate activities were against China.
Table 17. Amount of Anti-China Congressional Activities.
March to October 2012
Issue Mar Apr May Jun Jul Aug Sep Oct Economy 0 0 1 1 1 0 0 0 Security 0 0 1 0 0 1 1 0
Human Rights 1 0 3 1 0 0 2 0 General Relations 0 0 2 0 0 0 0 0
Total 1 0 7 2 1 1 3 0
Source: The Library of Congress

93
Partisan sponsorships were consistent with their party’s presidential candidates’
anti-China campaign rhetoric. During the 2012 presidential campaign period, Republican
members of Congress sponsored totally 11 congressional activities, 10 of which
happened in May, the month with the highest amount of anti-China rhetoric by
Romney.79 Similarly, September witnessed the highest amount of Democratic
sponsorship on congressional activities and the highest amount of Obama’s anti-China
campaign rhetoric.80 Accordingly, presidential candidates’ anti-China rhetoric, to some
extent, exerted influence on their party’s congressional behaviors regarding China issues.
Besides, unlike the President, who was generally tough on China regarding
economic issues and fluctuating regarding human rights and security, the Congress was
fluctuating on economic issue and was always tough on China regarding human rights
and security issues during the presidential campaign period.
4.5 Public Opinion: A Periodic Effect
Anti-China rhetoric by presidential candidates has a negative effect on American
public opinion of China. By exploring Gallup poll’s American public opinion of China, I
find that American’s favorability on China usually goes down in the election year when
there is anti-China rhetoric by presidential candidates and goes up after the election.
79 In May 2012, the New York Times had 4 articles regarding Obama’s anti-China campaign rhetoric, the highest amount except October, the outlier of my congressional research. 80 In September 2012, The New York Times had 6 articles regarding Obama’s anti-China campaign rhetoric and Democratic members of congress sponsored 3 congressional activities.

94
Figure 27 shows the historical trend of Gallup’s polls on American public opinion
of China. 81
Figure 27. American Public Opinion of China.
1980 – 2015
Obtained from Gallup.com In general, the American public opinion of China remained stable after the Tiananmen
Square Massacre in 1989, particularly after 2000. The favorable rates of China declined
in the presidential election year including 2000, 2004, 2008 and 2012, and went up after
then. Also, the unfavorable rates of China in those election years usually reached a higher
point than those of the years around.
The decline of America public perceptions on China in the election year is due
largely to the anti-China rhetoric by presidential candidates. Presidential candidate’s anti-
China rhetoric, such as the “Sold Us Out” ads that linked China with unemployment in
the U.S., together with the echo effect including the massive anti-China media report,
contributed to the negative public opinion of China. When the election is over the effect
decays as there is no anti-China rhetoric by presidential candidates.
81 Gallup asks a random sample of American citizens normally in February each year if they have a “favorable”, “somewhat favorable”, “somewhat unfavorable”, or “unfavorable” opinion of China. http://www.gallup.com/poll/1624/perceptions-foreign-countries.aspx.

95
Accordingly, anti-China rhetoric has a negative effect on American’s public
opinion of China during the presidential election year, and the effect decays after the
presidential election is over.
4.6 Conclusion
Anti-China rhetoric by presidential candidates not only affects the voter support
but also affects U.S. foreign policy towards China. The pressure from a presidential
candidate, in conjunction with its echo effect, especially the news report and media
coverage on the anti-China campaign rhetoric, could effectively make White House
respond by certain foreign policy statements on China. President’s statement on China
responds to the anti-China rhetoric from the opponent presidential candidates or
reinforces his own anti-China rhetoric. Congressional activities regarding certain China
issues are less in favor of China when there are more campaign activities using anti-
China rhetoric. Partisan sponsorships stick to their party’s presidential candidates’ anti-
China campaign rhetoric. And anti-China rhetoric during the presidential election year
has a negative effect on American public opinion of China.

96
Chapter 5. Case Studies: China’s Trade and Currency Issues
China has long been accused by U.S. politicians of undervaluing its currency to
gain unfair advantages in trade with U.S. Bashing China using trade and currency issues
is a popular strategy in recent presidential elections. Over the past decade, the Chinese
government continues manipulating its currency to gain unfair trade advantages over the
U.S., which is harmful to the U.S. manufacturers and job market. China undervalues its
currency so that its exports are cheap. While U.S. exports are more expensive, and the
cheaper Chinese imports flood U.S. markets, ultimately costing American manufacturing
jobs.82 Currency manipulation provides an unfair subsidy to Chinese exports and
represents the most protectionist policy of any major country since World War II.83 “And
when American manufacturers try to sell their products to China, they are hit with the
same percentage in what amounts to an unfair tariff.”84 Therefore, the cost advantages
resulted from China’s currency manipulation cost American jobs and hurt the U.S.
economy. The trade and currency have always been major issues regarding China in
recent U.S. presidential campaigns.
In this chapter, I conduct case studies on China’s trade and currency issues to
show that how anti-China rhetoric during the 2012 presidential campaigns affected the
White House statements on China regarding the trade and currency issues and eventually
82 In 2011, the US trade deficit with China reached a new record, of $295 billion. The US trade deficit with China, exacerbated by Chinese currency manipulation, has caused the loss of more than 2.8 million American jobs since 2001 - including more than 1.9 million manufacturing jobs, just as a result of the Chinese trade deficit. See Sen. Sherrod Brown (D-Ohio), “Currency manipulation gives Chinese an unfair advantage.” July 11, 2012. http://www.brown.senate.gov. 83 See Fred Bergsten, “An Overlooked Way to Create Jobs,” The New York Times, September 28, 2011. http://www.nytimes.com. 84 See Sen. Sherrod Brown (D-Ohio), “Currency manipulation gives Chinese an unfair advantage.” July 11, 2012. http://www.brown.senate.gov.

97
contributed to the policy outcome towards the U.S.-China economic relations. On the
U.S. side, the president is more likely to make a tough foreign policy statement towards
China on trade and currency issues when there is more related anti-China rhetoric by
presidential candidates, and vice versa. The impact of anti-China campaign rhetoric on
the White House tough statements towards China on trade and currency issues is
independent of the congressional pressure and the White House’s grand strategy toward
China. On the China side, the Chinese government is more likely to allow for
appreciation of its currency (Yuan) when there is more trade and currency related anti-
China rhetoric by U.S. presidential candidates.
Apart from the case study for the 2012 presidential campaign, I also conduct a
comparative study of the presidents’ campaign promise and performance regarding
China’s trade and currency policy during and after the 2008 and 2012 elections to support
my argument that the intensity of anti-China rhetoric by presidential candidates
contributes to the presidents’ foreign policy towards China. In addition, I discuss the
external confounding factors, the domestic pro-market reformer and international
business interests that might also contribute to the U.S.-China economic relations to show
the importance of anti-China campaign rhetoric compared to other pressures.
5.1 Anti-China Rhetoric and President’s Policy
President Obama’s public statements on China’s trade and currency were
generally responsive to the related anti-China campaign rhetoric in the New York Times
articles during the 2012 presidential campaign period. From Mar. 1 to Nov. 6, 2012,
totally 16 New York Times articles contained presidential candidate’s anti-China rhetoric

98
on trade and currency issues, and 14 White House statements took a tough stance on
China on trade and currency issues. Figure 28 shows the monthly amount of the New
York Times articles and White House tough statements on China’s trade and currency
issues.
Figure 28. Amount of Anti-China Rhetoric and the President's Tough Statements on
China's Trade and Currency Issues. Mar. 1 to Nov. 6, 2012
Source: The New York Times (www.nytimes.com) and The White House (www.whitehouse.com)
Apparently, the more campaign news that contains anti-China rhetoric on trade and
currency, the more likelihood that the president would take a tough stance on China
regarding trade and currency policies. Table 18 tracks the major anti-China rhetoric by
presidential candidates in the New York Time articles and their responses by the White
House’s tough economic statements towards China on trade and currency issues. Half of
the New York Times articles that contain anti-China campaign rhetoric were responded by
a concrete foreign policy action by the White House.
0
1
2
3
4
5
NYT Articles
White House Statements

99
Table 18. The New York Times Anti-China Rhetoric on Trade and Currency Issues
and the Response by the White House. March to November 2012
Anti-China Rhetoric White House Response
Date Issue Date Content Statement / Action
Mar 20
Romney criticized Obama for a low level of attention to China trade issues over
solar panel
Mar 21
President Obama enforced trade laws against China’s unfair advantage on solar energy
Action
Mar 22
Romney vowed to crack down on China’s trade
policy
Mar 28
Vice President Biden reinstated the trade case against China on
Mar 13 Statement
Apr 16
Romney repeatedly vowed to crack down on China’s trade and named China as
currency manipulator
May 30
President Obama reinstated the trade cases against China’s
unfair trade practices at signing the Export-Import Bank Bill
Statement
Apr 17
May 2
May 12
May 24 Jul 29
Romney vowed to sanction China
Jul 31
President Obama sanctioned China’s Bank of Kunlun Action
Sep 17
Romney ads claimed to crackdown on cheaters like
China
Sep 17
President Obama filed WTO case against China Action
Sep 26
Obama accused Romney on unfair trade case in
China
Sep 28
President Obama issues executive orders to reject
Chinese Acquisition of U.S. companies
Action
Oct 15
Romney criticized Obama administration for delaying the release of the currency
report
Oct 17
President Obama highlighted the trade cases against China at
the 2nd presidential debate Statement
Oct 22
Romney bashed China’s trade policies
Oct 23
President Obama highlighted the trade cases against China at
the 3rd presidential debate Statement
Source: The New York Times (www.nytimes.com) and The White House (www.whitehouse.com)

100
After May 2012, as Romney started to attack Obama fiercely on his trade and
currency positions on China, the responses from President Obama became immediate and
confrontational. All Romney’s anti-China rhetoric on trade and currency issues received
the President’s response within two days, and all the China-related trade and currency
issue raised by Romney were directly responded with a relevant White House statement
or action, showing the president’s effort to solve the issue. For example, President Obama
sanctioned a China’s Bank on Jul. 31 in response to Romney’s vow to sanction China on
Jul. 29; 85 and filed WTO case against China on Sep. 17 in response to Romney’s claim to
crack down China on the same day, though the White House denied that it was for
campaign purpose.86
By contrast, when there was no anti-China rhetoric by presidential candidates
regarding trade and currency, the White House’s economic policy statement towards
China would be more positive. The president made two friendly economic policy
statements towards China during the 2012 presidential campaign. The first one was on
Apr. 14, after nearly one month without any New York Times articles with presidential
candidate’s anti-China rhetoric on trade and currency issues (the last one was on Mar. 22
when the New York Times reported Romney’s vow to crack down on China’s trade), the
President mentioned the economic cooperation with China at the CEO summit of the
Americas and Ben Rhodes, Deputy National Security Advisor for Strategic
85 See “Romney and Obama Strain to Show Gap on Foreign Policy,” reported on 7/29/2012. http://www.nytimes.com/2012/07/29/us/politics/obama-and-romney-strain-to-assert-foreign-policy-differences.html?_r=1&partner=rss&emc=rss&pagewanted=all. 86 See “Press Gaggle by Principal Deputy Press Secretary Josh Earnest en route Cincinnati, OH, 9/17/12,” published on 9/17/2012, Press Gaggle by Principal Deputy Press Secretary Josh Earnest en route Cincinnati, OH, 9/17/12.

101
Communication praised China for making some progress in currency.87 The second one
was on Jun. 19, also after nearly one month without any New York Times articles with
presidential candidate’s anti-China rhetoric on trade and currency issues (the last one was
on May 24 when the New York Times reported Romney’s Day 1 promises), the president
welcomed the commitment by China on currency issue and claimed to build a
cooperative economic partnership with China.88
The Congressional Pressure
During the 2012 presidential campaign period, anti-China congressional activities
on trade and currency issue did not lead to White House tough statements on China. Only
after presidential candidates raising China’s currency and trade issues did the White
House make the tough statements on China. On May 8, the House agreed to the Turner
(R-OH) amendment that would increase by $5 million the minimal level of funding for
the International Trade Administration for use in dealing with Chinese trade practices.89
The White House did not make any statements related to the House agreement until May
30 when President Obama reinstated the trade cases against China’s unfair trade practices
at signing the Export-Import Bank Bill, after Romney’s repeatedly vowing to crack down
87 See “Remarks by President Obama at CEO Summit of the Americas,” published on 4/14/2012 and “Press Briefing by Press Secretary Jay Carney and Deputy National Security Advisor for Strategic Communication Ben Rhodes,” published on 4/14/2012, https://www.whitehouse.gov/the-press-office/2012/04/14/remarks-president-obama-ceo-summit-americas; and https://www.whitehouse.gov/the-press-office/2012/04/14/press-briefing-press-secretary-jay-carney-and-deputy-national-security-0. 88 See “G20 Leaders Declaration,” published on 6/19/2012. https://www.whitehouse.gov/the-press-office/2012/06/19/g20-leaders-declaration; and “Remarks by President Obama and President Hu Jintao of China before Bilateral Meeting,” published on 6/19/2012. https://www.whitehouse.gov/the-press-office/2012/06/19/remarks-president-obama-and-president-hu-jintao-china-bilateral-meeting. 89 Source: The Library of Congress.

102
on China’s trade and named China as currency manipulator on May 12 and May 24.90 On
Jul. 26, Senate introduced the “China Fair Trade Act of 2012” by Sen. Debbie Stabenow
(D-MI).91 The White House did not make any statements related to the Senate
introduction until Jul. 31 when President Obama sanctioned China’s Bank of Kunlun,
after Romney’s vowing to sanction China on Jul. 29.92 Accordingly, rather than followed
the congressional activities on China’s trade and currency issues, the White House
responded to the anti-China rhetoric by the presidential candidate and ignored the
Congress.
The Grand Strategy toward China
The impact of anti-China campaign rhetoric on the White House tough statements
on China is also independent of the administration’s grand strategy toward China. In May
2012, the fourth round of the U.S.-China Strategic and Economic Dialogue (S&ED) was
held in Beijing May 3-4, 2012. The two sides highlighted the cooperation and
90 See “Mitt Romney’s Stance on China Trade,” The New York Times, reported in 5/22/2012. http://www.nytimes.com/2012/03/23/us/politics/mitt-romneys-stance-on-china-trade.html?pagewanted=all&_r=0&gwh=3302F5D734F154236797F73F0DE25513&gwt=pay; and “When Packaging Oversteps the Facts,” The New York Times, reported in 5/24/2012. http://www.nytimes.com/2012/03/25/opinion/sunday/when-packaging-oversteps-the-facts.html. 91 Source: The Library of Congress. 92 See “Romney and Obama Strain to Show Gap on Foreign Policy,” reported on 7/29/2012. http://www.nytimes.com/2012/07/29/us/politics/obama-and-romney-strain-to-assert-foreign-policy-differences.html?_r=1&partner=rss&emc=rss&pagewanted=all.

103
coordination during the summit.93 However, the month of May 2012 also witnessed
Romney’s repeatedly vowing to name China as a currency manipulator. As a
consequence, President Obama responded to Romney by reinstating the trade cases
against China’s unfair trade practices at signing the Export-Import Bank Bill on May 30,
rather than followed the corporative grand strategy toward China after the S&ED
summit.94 and 95
5.2 Obama’s Promise and Performance: A Long-Term Effect
Apart from the analysis of 2012 presidential campaign, I also conduct a case study
of the presidents’ foreign policy changes regarding China’s trade policy during and after
the 2008 and 2012 elections to compare the different effects of anti-China rhetoric on the
foreign policy towards China. The comparison between 2008 and 2012 indicates that
whether the President keeps the campaign promises regarding China’s trade and currency
issues depend on the intensity of anti-China rhetoric by presidential candidates on related
93 Secretary of State Hillary Rodham Clinton and Secretary of the Treasury Timothy Geithner, special representatives of President Barack Obama, together with Vice Premier Wang Qishan and State Councilor Dai Bingguo, special representatives of President Hu Jintao, co-chaired two days of S&ED discussions. On the media note, they stated that “the two sides engaged in candid, in-depth and constructive discussions and decided to advance practical cooperation between the United States and China in order to build a cooperative partnership based on mutual benefit and mutual respect…Given that cooperation should be the defining characteristic of U.S.-China relations, the two sides decided to strengthen bilateral relations, including through increased cooperation and coordination on a range of pressing global and regional issues, to build a new model of bilateral relations in the 21st century.” See “Joint Statement on the 4th Round of the U.S.-China Strategic and Economic Dialogue,” 5/4/2012. http://www.state.gov/r/pa/prs/ps/2012/05/189286.htm. 94 Romney’s vowing on China was reported by the New York Times on May 2, 12 and 24, 2012. Obama’s accuse on Romney’s outsourcing jobs to China was reported by the New York Times on May 1 and 7, 2012. See www.nytimes.com. 95 See “Remarks by the President at Export-Import Bank Bill Signing,” published on 5/30/2012, https://www.whitehouse.gov/the-press-office/2012/05/30/remarks-president-export-import-bank-bill-signing.

104
issues. Specifically, more anti-China rhetoric in the presidential campaign makes the
president more likely to keep the campaign promise on related issues during the first year
in office.
Source and Method
The comparative study examines whether the presidential performances in
making foreign policy towards China keep their campaign promises. In other words,
whether the anti-China rhetoric is just for the American audience in the electorate or does
it have a long-term effect on foreign policy. Two questions are to be explored: 1) Has
President Obama done what he promised regarding China issues during the presidential
campaigns? 2) Are President Obama’s China policies coincident with the anti-China
rhetoric from his opponents (McCain and Romney)? Since policy change frequently
occurs after the election, I treat President Obama’s first year in office, including 2009 and
2013, as the post-election period. I do not study the President’s foreign policy towards
China in year two, three, and four because the mid-term election and the reelection might
become the major consideration of the foreign policy making (Quandt 1986).
The resources of this case study are the China-related public statements obtained
from WhiteHouse.gov, the presidential candidates’ campaign websites, and
PolitiFact.com – a website who compiled more than 500 promises that Barack Obama
made during 2008 and 2012 presidential campaigns and tracked their progress by rating
them as “Kept”, “Broken”, “Compromise”, “In the Works”, and “Stalled.”
Findings and Discussion
Obama’s campaign promise regarding China’s trade issues was “compromised”
after the 2008 presidential election since anti-China rhetoric regarding trade and currency

105
issues was scarcely used by presidential candidates. By contrast, Obama’s campaign
promise regarding China’s currency issues was rated “in the works” after the 2012
presidential election since much more anti-China rhetoric regarding trade and currency
issues was made by presidential candidates than those in 2008.
In the 2008 presidential campaign, Obama and Biden promised to “use all
diplomatic means at their disposal to achieve change in China's manipulation of the value
of its currency.”96 However, in President Obama’s first year in office, the administration
laid stress on cooperation and common interests in the public statements about China and
maintained the disagreements and conflicting issues including trade and currency a low
profile. Though President Obama brought up the issue of increasing the value of the
Yuan during the trip to China at the end of 2009, no further progress was made to urge
China to stop manipulation of its currency value, and therefore, this promise was
compromised.97 In the 2012 presidential campaign, Obama and Biden promised to
“create a new trade enforcement unit that will address China's trade practices.”98 The
tough stance on China in trade continued in 2013. For example, the president's budget
96 In their plan, “Protecting U.S. Interests and Advancing American Values in our Relationship with China," Obama and Biden promised to “use all diplomatic means at his disposal to achieve change in China's manipulation of the value of its currency, a practice that contributes to massive global imbalances and provides Chinese companies with an unfair competitive advantage.” See https://www.barackobama.com/pdf/FactSheetChina.pdf. 97 See “Urge China to stop manipulation of its currency value,” Politifact.com, retrieved on 2/8/2015. http://www.politifact.com/truth-o-meter/promises/obameter/promise/226/urge-china-to-stop-manipulation-of-its-currency-va/. 98 In “A Plan for Jobs and Middle-Class Security,” Obama and Biden promised to “stand up for American workers and businesses in the global marketplace, taking on China's unfair trade practices through a new trade enforcement unit to level the playing field.” See https://www.documentcloud.org/documents/557639-jobs-plan-booklet-from-the-obama-2012-campaign.html#document/p3/a86862.

106
proposal for the fiscal year 2014 (posted on Apr 10, 2013) did single out China, saying
the government’s purpose is "to aggressively challenge unfair trade practices and trade
barriers around the world, including in China."99 While China was usually downplayed in
most official documents in other years, such as the president's budget proposal for the
fiscal year 2015 (posted on March 14, 2014), did not single out China.100 Therefore, this
promise was in the works during the first year of the President’s second term.
The difference in performances of the president’s similar campaign promises
might be the consequences of the different intensities of related anti-China rhetoric by
presidential candidates. During the 2008 presidential campaign, there were only two New
York Times articles with presidential candidates’ anti-China rhetoric regarding trade and
currency issues. The first one was about the presidential debate on Oct. 15, 2008, when
debating oil policy, Obama complained China’s currency manipulation.101 The other one
was on Oct. 26, 2008, the New York Times noted that “in 2005, Mr. Obama supported a
bill that would have imposed a tariff on imports from China if the Chinese did not agree
to revalue their currency; Mr. McCain opposed it.”102 While in 2012, there were 16 New
York Times articles that contained presidential candidate’s anti-China rhetoric regarding
trade and currency issues during the campaign period from Mar. 1 to Nov. 6, 2012. In
addition, there were many more campaign ads using anti-China rhetoric in 2012 than
99 The full text of the “Fiscal Year 2014 Budget of The U.S. Government” could be found at http://www.gpo.gov/fdsys/pkg/BUDGET-2014-BUD/pdf/BUDGET-2014-BUD.pdf. 100 The full text of the “Fiscal Year 2015 Budget of The U.S. Government” could be found at http://www.gpo.gov/fdsys/pkg/BUDGET-2015-BUD/pdf/BUDGET-2015-BUD.pdf. 101 See “The Debate, Live Blogging,” published on 10/15/2008, The New York Times. http://economix.blogs.nytimes.com/2008/10/15/the-debate-live-blogging/. 102 See “Global Trade,” published on 10/26/2008, The New York Times. http://query.nytimes.com/gst/fullpage.html?res=9402E3D6143CF935A15753C1A96E9C8B63.

107
those in 2008. There were totally 40 campaign ads (18 Obama ads and 22 Romney ads)
using anti-China rhetoric during the general presidential campaign. By contrast, there
were only 7 Obama ads (no McCain ad) using anti-China rhetoric in the 2008 general
presidential campaign. With an intensified campaign efforts using anti-China rhetoric,
much more public attention was drawn in 2012 than those in 2008. Therefore, after the
2008 presidential election, the President had less need to respond to the opponent and
under little public obligation to keep his campaign promises; while after the 2012
presidential election, with much more anti-China rhetoric by presidential candidates were
reported than that in 2008, the President was under greater public obligation to keep his
own promises and response to the opponent’s. Also, Obama’s presidential approval rating
was 51 percent on Election Day 2012, much lower than 67 percent when he took office in
January 2009.103 The low approval rating further increased the pressure on Obama to
keep his campaign promises during the 2012 presidential campaign and maintain the
tough stance on China throughout the year 2013.
Accordingly, the more intensity of anti-China rhetoric by presidential candidates
in 2012 than that in 2008 produced more pressure for the President to keep its campaign
promises on China’s trade and currency issues.
5.3 China’s Response
Anti-China rhetoric in presidential campaigns not only pushes the President to
take tough policy stands towards China on currency and trade issues but also results in
responses from China. Since the Chinese government attached considerable importance
103 Data obtained from Gallup, “Presidential Approval Rating.” http://www.gallup.com/poll/116479/barack-obama-presidential-job-approval.aspx.

108
to protocol, ceremony, form, and appearances (Bader 2012), the statements by U.S.
President, as well as by the potential future president, would merit serious consideration.
To mollify the U.S. anger, the Chinese government is more likely to allow for
appreciation of its currency (Yuan) when there is more trade and currency related anti-
China rhetoric by presidential candidates, and the appreciation continues in the first year
after the presidential election.
Over the course of the 2012 presidential campaign, China’s currency (Yuan) went
up steadily during the period when anti-China rhetoric was heavily used in candidates’
speeches, debates and ads, particularly since September when the amount of anti-China
rhetoric had been increased. By contrast, the Yuan depreciated in the summer (June to
August), as there was less anti-China rhetoric by presidential candidates during the period
(See Figure 29)104.
USD per 1 Yuan
Figure 29. The Growth of Chinese (Yuan) RMB against USD from Mar. 1 to Nov 6, 2012.
The figure is generated and obtained from http://www.xe.com.
104 Figure obtained and generated from Google Finance. www.google.com/finance.

109
During the first year of President Obama’s second term, Yuan continued to go up steadily
in 2013, as Obama’s campaign promise on Chinese currency was still in the works (See
Figure 30).105
USD per 1 Yuan
Figure 30. The Growth of Chinese (Yuan) RMB against USD
from Mar 1 2012 to Dec 26, 2014. The figure is generated and obtained from http://www.xe.com.
The External Confounding Factors: The Comparison
Common senses suggest that the changing (or manipulating) of Chinese Yuan
might be affected by other domestic and international factors. However, compared to the
anti-China rhetoric by presidential candidates, those confounding pressures are less
confrontational and less influential in shaping the policy statements and policy outcomes.
The Chinese government is facing domestic and international pressures on
currency issues. Domestically, the pro-market reformers want to accelerate reforms in the
105 Figure obtained and generated from Google Finance. www.google.com/finance.

110
financial sector, including the internationalization of Chinese Yuan. The pro-market
reformers, including top officials of the People’s Bank of China, Finance Minister,
Commerce Minister and etc., seek to boost the nation’s growth momentum and foresee
the Chinese Yuan becoming an international currency by 2020.106 Internationally, China
is facing the pressure from international business interests to raise its currency, especially
from the U.S. A strong Chinese Yuan might cut the U.S. trade deficit because the rise in
the price of imports from China would outweigh any gain in exports; and in turn create
enough American jobs to put a modest dent in the unemployment rate.107
The Economic Track of The U.S.-China Strategic and Economic Dialogue
(S&ED) provides an ideal proxy of the pressures from the domestic pro-market reformers
and the international business interests on China’s currency issues. The annual meetings
of the S&ED were delegated by major U.S. Cabinet members and China’s pro-market
reformers including Ministers of Finance, Governor of the People’s Bank of China, and
Minister of the National Development and Reform Commission (See Appendix E for
detail lists of participants). From July 2009 to July 2013, there were 5 round meetings of
106 See Huileng Tan, “Top officials: China is totally committed to reform.” CNBC. published on November 10, 2015. http://www.cnbc.com/2015/11/10/pbocs-zhou-promises-capital-markets-reforms-yuan-to-be-international-by-2020.html. Retrived on 11/20/2015. 107 See Emily Kaiser, “Insight: What a stronger Chinese Yuan means for the U.S.” Reuters. Published on Oct 5, 2011. http://www.reuters.com/article/us-china-yuan-idUSTRE79411620111005#a0Mo3f9w76khfET1.97. Retrieved on 11/12/2015.

111
the S&ED. Trade and currency issues between U.S. and China were always the highlights
of the annual meetings.108
To estimate the effect of S&ED on the Chinese Yuan (RMB), I track the 15 days
changing of the Yuan after each S&ED annual meeting from 2009 to 2013. The results
indicate that the Yuan, in general, did not go higher after those meetings. Figure 31~35
shows the growth of Chinese (Yuan) RMB against USD about 15 days after the S&ED
annual meetings.
Figure 31. The 15 Days Growth of Chinese (Yuan) RMB against USD after the 2009
U.S.–China Strategic and Economic Dialogue Annual Meeting. The first round of the S&ED meeting took place on July 27–28, 2009 in Washington,
D.C. The figure is generated and obtained from http://www.xe.com.
108 For example, the “Clause 8-13, Develop a More Balanced Trade and Investment Relationship” released for the 2011 annual meetings stated that “the two countries recognize the importance of open trade and investment for promoting innovation, creating jobs, and boosting incomes and economic growth. The United States and China are committed to further expanding bilateral trade and investment, fostering more open trade and investment globally, and fighting against trade and investment protectionism.” See “U.S.-China Comprehensive Framework for Promoting Strong, Sustainable and Balanced Growth and Economic Cooperation.” U.S. Department of the Treasury. https://www.treasury.gov/press-center/press-releases/Pages/TG1171.aspx. Retrieved on 11/14/2015.

112
Figure 32. The 15 Days Growth of Chinese (Yuan) RMB against USD after the 2010
U.S.–China Strategic and Economic Dialogue Annual Meeting. The second round of the S&ED meeting took place on May 24–25, 2010 in Beijing.
The figure is generated and obtained from http://www.xe.com.
Figure 33. The 15 Days Growth of Chinese (Yuan) RMB against USD after the 2011
U.S.–China Strategic and Economic Dialogue Annual Meeting. The third round the S&ED meeting took place on May 9-10, 2011 in Washington, D.C.
The figure is generated and obtained from http://www.xe.com.

113
Figure 34. The 15 Days Growth of Chinese (Yuan) RMB against USD after the 2012
U.S.–China Strategic and Economic Dialogue Annual Meeting. The fourth round of the S&ED meetings took place on May 3–4, 2012 in Beijing.
The figure is generated and obtained from http://www.xe.com.
Figure 35. The 15 Days Growth of Chinese (Yuan) RMB against USD after the 2013
U.S.–China Strategic and Economic Dialogue Annual Meeting. The fifth round of the S&ED meetings took place on July 10–11, 2013, in Washington,
D.C The figure is generated and obtained from http://www.xe.com.

114
The Yuan either remained fluctuating or went slightly down after the S&ED annual
meetings. Apparently, the S&ED meeting has no immediate effect on the currency issues
between U.S. and China. Anti-China rhetoric by presidential candidates plays a greater
role than other domestic and international pressures in shaping U.S.-China economic
relations.
5.4 Conclusion
The case study of China’s trade and currency issues indicates that anti-China
rhetoric by a presidential candidate would not only receive a White House response in
statements on China but also pressure the foreign policy outcome. On the U.S. side, the
president is more likely to make a tough foreign policy statement towards China on trade
and currency issues when there is more related anti-China rhetoric by presidential
candidates. And the President is more likely to keep his campaign promises in the first
year after the election if there has been more anti-China campaign rhetoric during the past
presidential campaign period. On the China side, the Chinese government is more likely
to allow for appreciation of its currency (Yuan) to mollify the U.S. anger when there is
more trade and currency related anti-China rhetoric by presidential candidates. The anti-
China rhetoric by a presidential candidate is more effective than the pressures from other
domestic and international factors in urging China to raise its currency.

115
Conclusions
Limitations and Future Studies
The statistical analysis focuses on a specific campaign advertisement over a short
period. It may contain theoretical and empirical flaws. First of all, since the study is not a
laboratory experiment, we are unable to control the sample of the population who are
being treated and control the sample of the population who produce the effect. That is to
say, the sample of the state opinions polls are not necessary those who have watched the
“Sold Us Out” ads and therefore the effect on the poll changing may not come from the
ads itself. Perhaps one solution, other than conducting a laboratory experiment, is to
refine the level of analysis, for example, to estimate the ads effect on the presidential
candidate’s voter support at the media market level. A possible approach is to track ads
airing and the opinion polls in selected target media markets and estimate the effect of the
ads airing on the presidential candidate’s polls standing. Another solution is to conduct a
survey that identifies the issue related to China and tests the voter concern of its impact
on a specific presidential candidate.
In addition, the “Sold Us Out” ads have just 16 days’ airing on 15 states and they
could not represent all the campaign ads using anti-China rhetoric. One possible
improvement is to expand the TSCS model to cover the whole presidential campaign
period by focusing on all the campaign ads using anti-China rhetoric. However, adding
more campaign ads into the model is subject to data availability and may result in the
problem of internal confounding effect as discussed in the literature review.109
109 The WiscAds datasets do not cover all the ads using anti-China rhetoric. There are 4 ads using anti-China rhetoric in the 2008 WiscAds dataset, and 2 of them are for the primary campaign.

116
The foreign policy study also suffers from theoretically and methodological
shortcomings. First, the president’s policymaking is also subject to many governmental
and environmental factors, which might undermine the effect of anti-China rhetoric in the
presidential campaign. Second, the New York Times articles might not cover all the
campaign activities using anti-China rhetoric, which might make the measurement of
independent variables biased. Third, the study focuses solely on one presidency in one
presidential election and the findings and implications might be inclusive and could not
be generalized to other Presidencies in the past and in the future.
Future studies could start from these points, refine the method, and use more up-
to-date data to estimate the effects of anti-China rhetoric in U.S. presidential campaigns
and foreign policy towards China.
Findings and Implications
Anti-China rhetoric continues to be a popular strategy in presidential campaigns.
According to the “Political Communication Lab” (PCL) of Stanford University, in the
2012 presidential campaign Romney aired 22 ads using anti-China rhetoric to attack
Obama and Obama aired 18 ads using anti-China rhetoric to attack Romney, much more
than those in 2008 (Obama’s 7 vs. McCain’s 0).110 And the strategies of using anti-China
110 The “Political Communication Lab” (PCL) has records of all the major ads in the 2004, 2008 and 2012 presidential campaigns. http://pcl.stanford.edu/campaigns.

117
rhetoric is expected to continue in the future elections.111 Does Anti-China rhetoric work
in the presidential campaign? Base on my statistical models on campaign advertising, the
answer is Yes. The airing of campaign ads using anti-China rhetoric effectively increases
the favoring candidate’s voter support across the target states over time. Is it worth
spending a significant amount of money airing the ads using anti-China rhetoric? The
answer is No. Presidential candidates will gain more voter support in the states where
they air ads using anti-China rhetoric, but there is no need to spend more money or
increase the ads quantity in a state and/or on a specific day. Once the opposite candidate
has been linked to the China issue and the momentum has been created, the echo effect of
airing the ads has shifted the burden to other forms of campaign activities and media
coverage to extend the attack on the opposite candidate and increase the favoring
candidate’s voter support beyond the target media market.
According to my statistical models, to seek voter support, the “freshness” of ads
using anti-foreign rhetoric on different days and/or in more states appears to be more
efficient than the “repeating” of the ads on the same day and/or in the same state.
Therefore, a good strategy for campaign management is “dilution”, specifically, 1)
diluting the spending and amounts of airings ads using anti-foreign rhetoric on one target
state into more states; 2) and diluting the spending and amounts of airings ads using anti-
111 For example, there has been several campaign ads using anti-China rhetoric during the 2014 congressional campaign and 2016 presidential campaign. See William Saletan, “Panda Sluggers.” Slate. http://www.slate.com/articles/news_and_politics/politics/2014/10/democratic_candidates_are_bashing_china_liberals_are_trying_to_tarnish_republicans.html; and Paula Dwyer, “Republicans’ Misguided China-Bashing.” Bloomberg. http://www.bloombergview.com/articles/2015-08-28/republicans-misguided-china-bashing.

118
foreign rhetoric on the same day into more days, thus extending the airing period to
generate more echo effect beyond the target media market.
On the other hand, anti-China rhetoric in presidential campaigns exercises
significant influence on U.S. foreign policy statements on China. President will generally
make a related foreign policy statement on China in response to the anti-China rhetoric of
presidential candidates during the presidential campaign period. The foreign policy
towards China is generally tough during the election year, but the level of toughness
depends largely on the intensity of anti-China rhetoric of presidential candidates.
Congress and the American public are also affected by the anti-China rhetoric of
presidential candidates. Congressional activities are less in favor of China when there are
more campaign activities using anti-China rhetoric, and vice versa. American public
opinion is less favorable on China in the election year than that in non-election years.
Accordingly, U.S. foreign policy towards China and the U.S.-China relations are
not always following a historical pattern. In the election year, the President’s foreign
policies statement towards China, as well as the activities of the Congress, are more apt
to use anti-China rhetoric and are not always being tough during the campaign period.
The anti-China rhetoric by presidential candidates also receives positive responses from
the Chinese government, particularly in trade and currency issues. The impact of the
campaign activities on foreign policy towards China could be extended to the elected
President’s first year in office, depending on the intensity of anti-China rhetoric in the
election year.
Based on my foreign policy study, a good strategy to proposal foreign policy
changes is raising the anti-foreign issues by a presidential candidate in campaign

119
activities. Such anti-foreign rhetoric will draw more public attention and is more likely to
result in a foreign policy discussion and perhaps change by the President and Congress.

120
Appendices
Appendix A. Transcripts of the Ads Used in the Research
1) Transcript of the “Sold Us Out” Ads
OBAMA: "I'm Barack Obama, and I approve this message."
ANNOUNCER: Corning shuts down its plant in Pennsylvania. Hundreds lose their jobs.
Then, the workers are rehired to disassemble the plant and ship the equipment to China.
Washington sold them out with the help of people like John McCain. He supported tax
breaks for companies that ship jobs overseas and voted against cracking down on China
for unfair trade practices. We can't afford more of the same.
* Obtain from the New York Times.
http://elections.nytimes.com/2008/president/advertising/ads/6702392--barack-obama-
sold-us-out (accessed May 15, 2016).
2) Transcript of the “Real Change” Ads
OBAMA: We've heard a lot of talk about "change" this year. The question is: change to
what? To me, change is a government that doesn't let banks and oil companies rip off the
American people. Change is when we finally fix health care instead of just talking about
it. Change is giving tax breaks to middle-class families instead of companies that send
jobs overseas. Change is a president who brings people together.
I'm Barack Obama. And I approve this message because, this year, change has to be more
than a slogan.
[TEXT: Read the Obama plan for real change. BARACKOBAMA.COM/ISSUES]

121
* Obtained from Museum of the Moving Image, The Living Room Candidate:
Presidential Campaign Commercials 1952-2012.
www.livingroomcandidate.org/commercials/2008/real-change (accessed May 14, 2015).
3) Transcript of the “Alternative” Ads
Museum of the Moving Image
The Living Room Candidate
"Alternative", Obama, 2008
MALE NARRATOR: We must break our addiction to foreign oil. [with TEXT:] But
John McCain voted against tax incentives for alternative energy. Against ethanol. Against
fuel cells.
(Sound of videotape fast-forwarding)
MALE NARRATOR (voice growing higher, as if it's playing on fast-forward): Against
hybrids. Against electric cars. Against wind and solar. Against geothermal and biomass.
Against hydropower.
(Sound of videotape stopping)
MALE NARRATOR: But McCain does support tax breaks for one source of energy. Oil
companies. McCain would give four billion in new tax breaks to big oil.
* Obtained From Museum of the Moving Image, The Living Room Candidate:
Presidential Campaign Commercials 1952-2012.
www.livingroomcandidate.org/commercials/2008/alternative (accessed May 14, 2015).

122
Appendix B. Polling Information Used by RealClearPolitics.com
7News/Suffolk
By 7News and Suffolk University
Survey Question Wording: “There are 5 major candidates for President: <WORD9 >. At
this point, for whom will you vote?” and “As of today, who are you leaning toward?”
http://www.realclearpolitics.com
ARG
By American Research Group, Inc.
Survey Question Wording: “If the general election were being held today between John
McCain for president and Sarah Palin for vice president, the Republicans, and Barack
Obama for president and Joe Biden for vice president, the Democrats, for whom would
you vote - McCain and Palin, Obama and Biden (names rotated), or someone else?”
http://www.americanresearchgroup.com
Big10 Battleground
By Big Ten Battleground Poll
Survey Question Wording: N/A
http://ww2.bigtenpoll.org
Ciruli Assoc.
By Ciruli Associates
Survey Question Wording: “First, let me ask you about the presidential election. If you
had to vote today, would you vote for John McCain and Sarah Palin, the Republicans;
Barack Obama and Joe Biden, the Democrats; or some other candidate?”
http://www.ciruli.com

123
Civitas/TelOpinion (R)
By Civitas Institute
Survey Question Wording: N/A
http://www.nccivitas.org
Columbus Dispatch
By The Columbus Dispatch
Survey Question Wording: N/A
http://www.dispatch.com
Concord Monitor
By Concord Monitor
Survey Question Wording: N/A
http://www.concordmonitor.com
CNN/Time
By CNN/Time Magazine/Opinion Research Corporation
Survey Question Wording: “Please tell me whether you agree or disagree that each of the
following candidates has the personality and leadership qualities a president should have.
. . .”
http://www.cnn.com
Democracy Corps (D)
By Democracy Corps
Survey Question Wording: “Now thinking about the presidential election in November. If
the election for president were held today and the candidates were -- Democrat Barack
Obama, Republican John McCain, Libertarian Party candidate Bob Barr or Independent

124
candidate Ralph Nader for whom would you vote?”
http://www.democracycorps.com/wp-content/files/ohsw100108fq1_pb.pdf
Det. News (EPIC/MRA)
By The Detroit News
Survey Question Wording: N/A
http://www.detroitnews.com
Detroit Free Press
By The Detroit Free Press
Survey Question Wording: N/A
http://www.freep.com/apps/pbcs.dll/article?AID=/20080925/NEWS15/80925082
Denver Post/Mason-Dixon
By Mason-Dixon Polling & Research Inc.
Survey Question Wording: “If the 2008 presidential election were held today, would you
vote for the Democratic ticket of Barack Obama & Joe Biden, the Republican ticket of
John McCain & Sarah Palin, or one of the other party candidates?”
http://www.denverpost.com
Florida Chamber (R)
By Florida Chamber of Commerce
Survey Question Wording: “If the election for president were held today, would you vote
for Republican John McCain, Democrat Barack Obama (ROTATE) or one of the other
candidates?”
http://www.flchamber.com

125
FOX News/Rasmussen
By Rasmussen Reports for FOX News
Survey Question Wording: “If the Presidential Election were held today, would you vote
for Republican John McCain, Democrat Barack Obama, Libertarian Bob Barr,
Independent Ralph Nader or Green Party Candidate Cynthia Ann McKinney?”
http://www.foxnews.com
Franklin & Marshall
By Center for Opinion Research, Floyd Institute for Public Policy, Franklin & Marshall
College
Survey Question Wording: “If the November general election for president were being
held today and the candidates were (rotated) John McCain and Sarah Palin, the
Republicans, Barack Obama and Joe Biden, the Democrats, Ralph Nader and Matt
Gonzalez, the Independents, and Bob Barr and Wayne Root, the Libertarians, would you
vote for John McCain and Sarah Palin, Barack Obama and Joe Biden, Ralph Nader and
Matt Gonzalez, Bob Barr and Wayne Root, or aren't you sure how you would vote?”
http://www.fandm.edu/fandmpoll/survey-releases
InAdv/PollPosition
By InsiderAdvantage/Poll Position
Survey Question Wording: N/A
Data collected from http://www.realclearpolitics.com
Indy Star/Selzer
By S The Indianapolis Star-WTHR, conducted by Selzer & Co. Inc.
Survey Question Wording: N/A

126
http://www.indystar.com
Marist
By Marist College Institute for Public Opinion
Survey Question Wording: “If November’s presidential election were held
today, whom would you support if the candidates are: john McCain/Sarah
Palin the Republicans, Barack Obama/Joe Biden the Democrats, Other, or
Undecided.”
http://www.maristpoll.marist.edu
Miami Herald/SP Times
By The Miami Herald and St. Petersburg Times
Survey Question Wording: N/A
Data collected from http://www.realclearpolitics.com
Morning Call
By Institute of Public Opinion, Muhlenberg College and The Morning Call
Survey Question Wording: “Now, if the 2008 presidential election was being held today
and the race was between Barack Obama and
John McCain, who would you vote for? (INCLUDING LEANERS)”
http://www.muhlenberg.edu
MRG (R)
By Marketing Resource Group
Survey Question Wording: “If the election for U.S. President and Vice-President were
being held today, and the candidates were John McCain and Sarah Palin, the

127
Republicans, and Barack Obama and Joe Biden, the Democrats, for whom would you
vote?”
http://www.mrgmi.com/PR%20Pres%20Fall%2008.pdf
National Journal/FD
By National Journal
Survey Question Wording: N/A
http://www.nationaljournal.com
NBC/Mason-Dixon
By National Broadcasting Company (NBC) and Mason-Dixon Polling & Research, Inc.
Survey Question Wording: “Do you recognize the name ____________? (IF YES) Do
you have a favorable, unfavorable or neutral opinion of ________?”
http://msnbcmedia.msn.com
Ohio Newspaper Poll
By The Ohio News Organization — a cooperative formed in 2008 by the state’s eight
largest daily newspapers / Survey conducted by the Institute for Policy Research at the
University of Cincinnati
Survey Question Wording: “If the election were held today, who would you vote for?”
http://blog.cleveland.com/openers/2008/09/ONOpoll.pdf
Post-Dispatch/R2000
By St. Louis Post Dispatch and Research 2000
Survey Question Wording: N/A
www.stltoday.com

128
PPP (D)
By Public Policy Polling
Survey Question Wording: “The candidates for President are Republican John McCain
and Democrat Barack Obama. If the election was today, who would you vote for? If John
McCain, press 1. If Barack Obama, press 2. If you’re undecided, press 3.”
http://www.publicpolicypolling.com
Quad-City Times/R2000
By Quad-City Times and Research 2000
Survey Question Wording: N/A
http://qctimes.com
Quinnipiac
By Quinnipiac University
Survey Question Wording: “If the election were today, for whom would you vote?”
http://www.quinnipiac.edu
Quinnipiac/WSJ/WP
By Quinnipiac University, Wall Street Journal and Washington Post
Survey Question Wording: “If the election were today, for whom would you vote?”
http://www.washingtonpost.com
Rasmussen
By Rasmussen Reports
Survey Question Wording: “If the Presidential Election were held today, would you vote
for Republican John McCain, Democrat Barack Obama, Libertarian Bob Barr,
Independent Ralph Nader or Green Party Candidate Cynthia Ann McKinney?”

129
http://www.rasmussenreports.com
Rossman Group/MIRS (D)
By The Rossman Group and Michigan Information & Research Service
Survey Question Wording: N/A
http://www.mirsnews.com
Research 2000
By Research 2000
Survey Question Wording: “If the election for President were held today, would you vote
for the Democratic ticket of Barack Obama and Joe Biden, the Republican ticket of John
McCain and Sarah Palin, Bob Barr, the Libertarian Party candidate, Ralph Nader, an
Independent, Chuck Baldwin, the Constitution Party candidate, Cynthia McKinney, the
Green Party candidate, or John Joseph Polachek, the New Party candidate?”
Website unknown. Questionnaire obtained from http://www.pantagraph.com
St. Anselm/SRBI
By Saint Anselm College Institute of Politics and SRBI Research
Survey Question Wording: N/A
http://www.anselm.edu/
Star Tribune
By Startribune.com
Survey Question Wording: N/A
http://www.startribune.com

130
Strategic Vision (R)
By Strategic Vision, LLC
Survey Question Wording: “If the 2008 Presidential election were held today between
(candidates), for whom would you vote?
http://www.strategicvision.biz
Suffolk/WSVN
By Suffolk University Political Research Center
Survey Question Wording: “There are 14 candidates for President on the Florida ballot.
Of these, the major 5 candidates are: Republican John McCain, Democrat Barack Obama,
Libertarian Bob Barr, Green Party Cynthia McKinney, and Ecology Party Ralph Nader
{NAY-der}. At this point, for whom will you vote?”
http://www.suffolk.edu/research/1450.html
Sun-Sentinel/R2000
By Sun-Sentinel.com and Research 2000
Survey Question Wording: “If the election for President were held today, would you vote
for the Democratic ticket of Barack Obama and Joe Biden, the Republican ticket of John
McCain and Sarah Palin, Bob Barr, the Libertarian Party candidate, Ralph Nader, an
Independent, Chuck Baldwin, the Constitution Party candidate, Cynthia McKinney, the
Green Party candidate, or John Joseph Polachek, the New Party candidate?”
http://www.sun-sentinel.com
SurveyUSA
By Surveyusa.com
Survey Question Wording: “If the election for President were today, would you vote for

131
... (choices rotated) Republican John McCain? Democrat Barack Obama? Or one of the
other candidates?”
http://www.surveyusa.com
University of New Hampshire
By The Survey Center, University of New Hampshire
Survey Question Wording: "Suppose the 2008 presidential election was being held today
and the candidates were John McCain and Sarah Palin,
the Republicans and Barack Obama and Joe Biden, the Democrats, who would you vote
for?"
http://cola.unh.edu/survey-center

132
Appendix C. Detail Polling Data by State during the Research Period. From Sep. 15 to Oct. 2, 2008.
Colorado Poll Date Sample MoE Obama (D) McCain (R) Final Results -- -- -- 53.7 44.7 Denver Post/Mason-Dixon 9/29 - 10/1 625 LV 4.0 44 44 FOX News/Rasmussen 9/28 - 9/28 500 LV 4.5 49 48 InAdv/PollPosition 9/23 - 9/23 505 LV 4.3 50 41 CNN/Time 9/21 - 9/23 794 LV 3.5 51 47 Ciruli Assoc. 9/19 - 9/23 501 LV 4.4 44 43 Rasmussen 9/23 - 9/23 700 LV 4.0 50 47 PPP (D) 9/20 - 9/21 1084 LV 3.0 51 44 Quinnipiac/WSJ/WP 9/14 - 9/21 1418 LV 2.6 49 45 InAdv/PollPosition 9/17 - 9/17 508 LV 4.3 51 41 * LV-likely voter; RV-Registered Voter; MoE-Margin of Error; (D)-Democrat; (R)-Republican
Florida Poll Date Sample MoE Obama (D) McCain (R) Final Results -- -- -- 51.0 48.2 Florida Chamber (R) 9/30 - 10/1 619 RV 4.0 42 45 CNN/Time 9/28 - 9/30 770 LV 3.5 51 47 InAdv/PollPosition 9/30 - 9/30 532 LV 4.0 49 46 Suffolk/WSVN 9/27 - 9/30 600 LV -- 46 42 Quinnipiac 9/27 - 9/29 836 LV 3.4 51 43 FOX News/Rasmussen 9/28 - 9/28 500 LV 4.5 47 47 SurveyUSA 9/27 - 9/28 599 LV 4.1 47 48 PPP (D) 9/27 - 9/28 941 LV 3.2 49 46 Rasmussen 9/24 - 9/24 700 LV 4.0 47 48 Strategic Vision (R) 9/21 - 9/23 1200 LV 3.5 45 48 FOX News/Rasmussen 9/21 - 9/21 500 LV 4.5 46 51 NBC/Mason-Dixon 9/16 - 9/18 625 LV 4.0 47 45 Sun-Sentinel/R2000 9/15 - 9/18 600 LV 4.0 45 46 SurveyUSA 9/16 - 9/17 707 LV 3.8 45 51 Miami Herald/SP Times 9/14 - 9/17 800 LV 3.5 45 47 CNN/Time 9/14 - 9/16 907 RV 3.5 48 48 * LV-likely voter; RV-Registered Voter; MoE-Margin of Error; (D)-Democrat; (R)-Republican

133
Iowa Poll Date Sample MoE Obama (D) McCain (R) Final Results -- -- -- 53.9 44.4 Research 2000 9/29 - 9/30 600 LV 4.0 55 39 Rasmussen 9/25 - 9/25 700 LV 4.0 51 43 Marist 9/18 - 9/21 467 LV 4.0 51 41 Quad-City Times/R2000 9/15 - 9/17 600 LV 4.0 53 39 SurveyUSA 9/17 - 9/18 702 LV 3.8 54 43 Big10 Battleground 9/14 - 9/17 643 RV 4.0 45 45 * LV-likely voter; RV-Registered Voter; MoE-Margin of Error; (D)-Democrat; (R)-Republican
Indiana Poll Date Sample MoE McCain (R) Obama (D) Final Results -- -- -- 48.9 50.0 Research 2000 9/29 - 10/3 800 LV 3.5 46 46 Research 2000 9/28 - 9/30 600 LV 4.0 46 45 SurveyUSA 9/28 - 9/29 687 LV 3.8 48 45 Rasmussen 9/17 - 9/18 500 LV 4.5 49 47 Big10 Battleground 9/14 - 9/17 612 RV 4.0 47 43 Indy Star/Selzer 9/14 - 9/16 600 LV 4.0 44 47 * LV-likely voter; RV-Registered Voter; MoE-Margin of Error; (D)-Democrat; (R)-Republican
Michigan Poll Date Sample MoE Obama (D) McCain (R) Final Results -- -- -- 57.4 41.0 Rossman Group/MIRS (D) 10/1 - 10/4 600 RV -- 44 39 PPP (D) 9/29 - 10/1 731 LV 3.6 51 41 Detroit Free Press 9/22 - 9/24 602 LV 4.0 51 38 Strategic Vision (R) 9/22 - 9/24 1200 LV 3.0 48 45 NBC/Mason-Dixon 9/18 - 9/23 625 LV 4.0 46 46 CNN/Time 9/21 - 9/23 755 LV 3.5 51 46 National Journal/FD 9/18 - 9/22 406 RV 4.9 47 39 Det. News (EPIC/MRA) 9/20 - 9/22 400 LV 4.9 48 38 FOX News/Rasmussen 9/21 - 9/21 500 LV 4.5 51 44 Quinnipiac/WSJ/WP 9/14 - 9/21 1346 LV 2.7 48 44 MRG (R) 9/15 - 9/20 600 LV 4.1 43 46 Marist 9/16 - 9/17 599 LV 3.5 52 43 Det. News (EPIC/MRA) 9/14 - 9/17 602 LV 4.0 43 42 Big10 Battleground 9/14 - 9/17 600 RV 4.0 48 44 * LV-likely voter; RV-Registered Voter; MoE-Margin of Error; (D)-Democrat; (R)-Republican

134
Minnesota Poll Date Sample MoE Obama (D) McCain (R) Final Results -- -- -- 54.1 43.8 Star Tribune 9/30 - 10/2 1084 LV 3.7 55 37 SurveyUSA 9/30 - 10/1 725 LV 3.7 46 47 CNN/Time 9/28 - 9/30 849 LV 3.5 54 43 Quinnipiac/WSJ/WP 9/14 - 9/21 1301 LV 2.7 47 45 Rasmussen 9/18 - 9/18 500 LV 4.5 52 44 Big10 Battleground 9/14 - 9/17 610 RV 4.0 47 45 * LV-likely voter; RV-Registered Voter; MoE-Margin of Error; (D)-Democrat; (R)-Republican
Missouri Poll Date Sample MoE McCain (R) Obama (D) Final Results -- -- -- 49.4 49.3 CNN/Time 9/28 - 9/30 744 LV 3.5 48 49 SurveyUSA 9/23 - 9/24 705 LV 3.8 48 46 Post-Dispatch/R2000 9/22 - 9/24 800 LV 3.5 47 46 Post-Dispatch/R2000 9/15 - 9/18 800 LV 3.5 49 45 * LV-likely voter; RV-Registered Voter; MoE-Margin of Error; (D)-Democrat; (R)-Republica
Montana Poll Date Sample McCain (R) Obama (D) Final Results -- -- 49.5 47.3 Rasmussen 10/1 - 10/1 500 LV 52 44 Research 2000 9/22 - 9/24 600 LV 52 39 CNN/Time 9/21 - 9/23 737 LV 54 43 Rasmussen 9/8 - 9/8 700 LV 53 42 * MoE not provided by realclearpolitics.com * LV-likely voter; RV-Registered Voter; MoE-Margin of Error; (D)-Democrat; (R)-Republican
North Carolina Poll Date Sample MoE McCain (R) Obama (D) Final Results -- -- -- 49.4 49.7 Rasmussen 9/30 - 9/30 700 LV 4.0 47 50 ARG 9/27 - 9/29 600 LV 4.0 49 46 PPP (D) 9/27 - 9/28 1041 LV 3.0 45 47 Rasmussen 9/23 - 9/23 500 LV 4.5 47 49 Civitas/TelOpinion (R) 9/17 - 9/20 600 LV -- 45 45 Rasmussen 9/18 - 9/18 500 LV 4.5 50 47 PPP (D) 9/17 - 9/19 1060 LV 3.0 46 46 * LV-likely voter; RV-Registered Voter; MoE-Margin of Error; (D)-Democrat; (R)-Republican

135
New Hampshire Poll Date Sample MoE Obama (D) McCain (R) Final Results -- -- -- 54.1 44.5 Rasmussen 10/1 - 10/1 700 LV 4.0 53 43 St. Anselm/SRBI 9/25 - 9/30 823 LV 3.5 49 37 Concord Monitor 9/22 - 9/24 600 LV 4.0 48 44 Strategic Vision (R) 9/22 - 9/24 800 LV 3.0 46 45 7News/Suffolk 9/20 - 9/24 600 LV -- 46 45 Rasmussen 9/23 - 9/23 700 LV 4.0 47 49 National Journal/FD 9/18 - 9/22 403 RV 4.9 44 43 Marist 9/17 - 9/21 604 LV 3.5 51 45 University of New Hampshire 9/14 - 9/21 523 LV 4.3 45 47 * LV-likely voter; RV-Registered Voter; MoE-Margin of Error; (D)-Democrat; (R)-Republican
Nevada Poll Date Sample MoE Obama (D) McCain (R) Final Results -- -- -- 55.2 42.7 Rasmussen 10/2 - 10/2 700 LV 4.0 51 47 InAdv/PollPosition 9/30 - 9/30 437 LV 5.0 48 47 CNN/Time 9/28 - 9/30 684 LV 3.5 51 47 ARG 9/27 - 9/29 600 LV 4.0 47 49 Suffolk University 9/17 - 9/21 600 LV 4.0 45 46 Rasmussen 9/11 - 9/11 700 LV 4.0 46 49 * LV-likely voter; RV-Registered Voter; MoE-Margin of Error; (D)-Democrat; (R)-Republican
Ohio Poll Date Sample MoE Obama (D) McCain (R) Final Results -- -- -- 51.5 46.9 Columbus Dispatch 9/24 - 10/3 2262 LV 2.0 49 42 Democracy Corps (D) 9/29 - 10/1 600 LV -- 49 43 InAdv/PollPosition 9/29 - 9/29 512 LV 4.0 47 45 SurveyUSA 9/28 - 9/29 693 LV 3.8 48 49 Quinnipiac 9/27 - 9/29 825 LV 3.4 50 42 FOX News/Rasmussen 9/28 - 9/28 500 LV 4.5 47 48 Rasmussen 9/24 - 9/24 700 LV 4.0 46 47 InAdv/PollPosition 9/22 - 9/22 545 LV 4.1 46 46 FOX News/Rasmussen 9/21 - 9/21 500 LV 4.5 46 50 Big10 Battleground 9/14 - 9/17 619 RV 4.0 46 45 Ohio Newspaper Poll 9/12 - 9/16 869 LV 3.3 42 48 Marist 9/11 - 9/15 565 LV 3.5 47 45 National Journal/FD 9/11 - 9/15 400 RV 4.9 41 42 * LV-likely voter; RV-Registered Voter; MoE-Margin of Error; (D)-Democrat; (R)-Republican

136
Pennsylvania Poll Date Sample MoE Obama (D) McCain (R) Final Results -- -- -- 54.5 44.2 Morning Call 9/26 - 9/30 598 LV 4.0 48 41 Quinnipiac 9/27 - 9/29 832 LV 3.4 54 39 FOX News/Rasmussen 9/28 - 9/28 500 LV 4.5 50 42 Franklin & Marshall 9/23 - 9/28 767 RV 3.5 45 38 Morning Call 9/21 - 9/25 577 LV 4.5 47 43 Rasmussen 9/24 - 9/24 500 LV 4.0 49 45 SurveyUSA 9/23 - 9/24 1094 LV 3.0 50 44 Strategic Vision (R) 9/21 - 9/23 1200 LV 3.0 47 46 CNN/Time 9/21 - 9/23 730 LV 3.5 53 44 National Journal/FD 9/18 - 9/22 406 RV 4.9 43 41 FOX News/Rasmussen 9/21 - 9/21 500 LV 4.5 48 45 NBC/Mason-Dixon 9/16 - 9/18 625 LV 4.0 46 44 Big10 Battleground 9/14 - 9/17 600 RV 4.0 45 45 Marist 9/11 - 9/15 535 LV 3.5 49 44 * LV-likely voter; RV-Registered Voter; MoE-Margin of Error; (D)-Democrat; (R)-Republican
Virginia Poll Date Sample MoE Obama (D) McCain (R) Final Results -- -- -- 52.6 46.3 Mason-Dixon 9/29 - 10/1 625 LV 4.0 45 48 CNN/Time 9/28 - 9/30 684 LV 4.0 53 44 InAdv/PollPosition 9/29 - 9/29 436 LV 5.0 51 45 ARG 9/27 - 9/29 600 LV 4.0 46 49 FOX News/Rasmussen 9/28 - 9/28 500 LV 4.5 50 47
Rasmussen 9/25 - 9/25 700 LV 4.0 50 45 NBC/Mason-Dixon 9/17 - 9/22 625 LV 4.0 44 47 FOX News/Rasmussen 9/21 - 9/21 500 LV 4.5 48 50
ABC News/Wash Post 9/18 - 9/21 698 LV 3.5 49 46 SurveyUSA 9/19 - 9/21 716 LV 3.7 51 45 InAdv/PollPosition 9/17 - 9/17 502 LV 4.3 46 48 National Journal/FD 9/11 - 9/15 400 RV 4.9 41 48 * LV-likely voter; RV-Registered Voter; MoE-Margin of Error; (D)-Democrat; (R)-Republican

137
Wisconsin Poll Date Sample MoE Obama (D) McCain (R) Final Results -- -- -- 56.2 42.3 Strategic Vision (R) 9/26 - 9/28 800 LV 3.0 49 40 Research 2000 9/22 - 9/23 600 LV 4.0 49 43 Quinnipiac/WSJ/WP 9/14 - 9/21 1313 LV 2.7 49 42 Big10 Battleground 9/14 - 9/17 600 RV 4.0 45 44 Rasmussen 9/15 - 9/15 700 LV 4.0 48 46 * LV-likely voter; RV-Registered Voter; MoE-Margin of Error; (D)-Democrat; (R)-Republican Source: Real Clear Politics. http://www.realclearpolitics.com
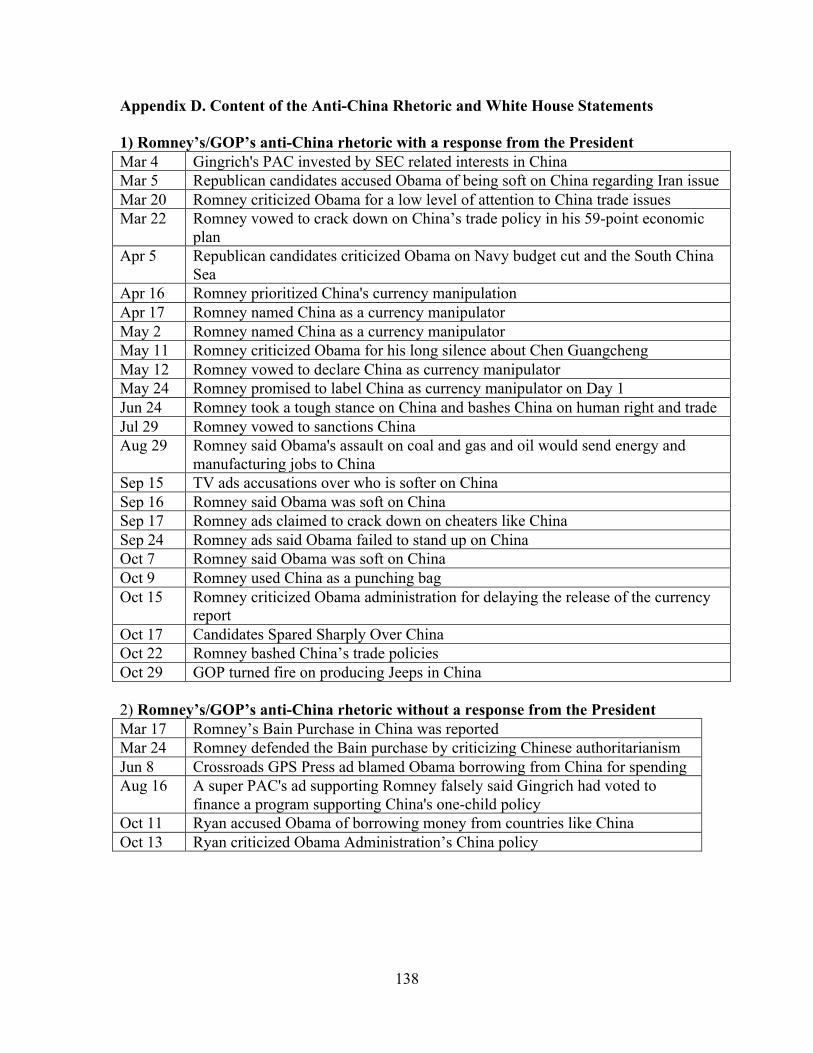
138
Appendix D. Content of the Anti-China Rhetoric and White House Statements
1) Romney’s/GOP’s anti-China rhetoric with a response from the President Mar 4 Gingrich's PAC invested by SEC related interests in China Mar 5 Republican candidates accused Obama of being soft on China regarding Iran issue Mar 20 Romney criticized Obama for a low level of attention to China trade issues Mar 22 Romney vowed to crack down on China’s trade policy in his 59-point economic
plan Apr 5 Republican candidates criticized Obama on Navy budget cut and the South China
Sea Apr 16 Romney prioritized China's currency manipulation Apr 17 Romney named China as a currency manipulator May 2 Romney named China as a currency manipulator May 11 Romney criticized Obama for his long silence about Chen Guangcheng May 12 Romney vowed to declare China as currency manipulator May 24 Romney promised to label China as currency manipulator on Day 1 Jun 24 Romney took a tough stance on China and bashes China on human right and trade Jul 29 Romney vowed to sanctions China Aug 29 Romney said Obama's assault on coal and gas and oil would send energy and
manufacturing jobs to China Sep 15 TV ads accusations over who is softer on China Sep 16 Romney said Obama was soft on China Sep 17 Romney ads claimed to crack down on cheaters like China Sep 24 Romney ads said Obama failed to stand up on China Oct 7 Romney said Obama was soft on China Oct 9 Romney used China as a punching bag Oct 15 Romney criticized Obama administration for delaying the release of the currency
report Oct 17 Candidates Spared Sharply Over China Oct 22 Romney bashed China’s trade policies Oct 29 GOP turned fire on producing Jeeps in China 2) Romney’s/GOP’s anti-China rhetoric without a response from the President Mar 17 Romney’s Bain Purchase in China was reported Mar 24 Romney defended the Bain purchase by criticizing Chinese authoritarianism Jun 8 Crossroads GPS Press ad blamed Obama borrowing from China for spending Aug 16 A super PAC's ad supporting Romney falsely said Gingrich had voted to
finance a program supporting China's one-child policy Oct 11 Ryan accused Obama of borrowing money from countries like China Oct 13 Ryan criticized Obama Administration’s China policy

139
3) President’s response with a foreign policy towards China Mar 6 President Obama said he was setting up a Trade Enforcement Unit to
aggressively investigate and counter unfair trade practices against China Mar 21 Obama was enforcing trade laws against China’s unfair advantage over ours Mar 26 Obama took a tough stance by urging China to preventing nuclear
proliferation Mar 28 Vice President Biden reinstated the trade case against China on Mar 13 Apr 11 Press Secretary Carney asked China to have North Korea change May 19 Deputy national security adviser Rhodes said the government deal with Chen
Guangcheng case cooperatively with China May 30 Obama claimed the trade cases against China Jul 31 Obama sanctioned China’s Bank of Kunlun Sep 17 Earnest said the President was filing WTO case against China, But not for
campaign purpose Sep 26 Carney said the President had been tough on China Sep 28 Obama issued executive orders to reject Chinese Acquisition of U.S.
companies Oct 8 Obama claimed to fight China on cleaning energy Oct 11 Press Secretary Earnest said the President had taken actions on China Oct 17 Obama said he had taken actions against China; while Romney had created
12 million jobs in China Oct 23 Obama had been tough on China and brought cases against China 4) President’s response without a foreign policy towards China May 8 Obama asked companies moving their manufacturing operations from China
back to the US May 24 Carney said Governor Romney wasn't always for enforcing trade laws
against China Jun 25 Obama said Romney was a “pioneer” in offshoring jobs to China Jul 5 Obama said Romney outsourcing jobs to China Sep 1 Obama said Romney ceded jobs to China Nov 2 Obama said Romney ad cheated on Jeep production in China

140
5) Obama’s campaign statements using anti-China rhetoric Mar 26 Obama Urged China to Restrain North Korea Apr 6 Obama said Romney will be portrayed as playing both sides of numerous
issues, for and against enforcing trade laws against China Apr 9 Obama criticized Republican letting Canadian oil to China May 1 Obama accused Romney’s shipping jobs to China May 7 Obama accused Romney’s outsourcing jobs to China Jun 30 Obama alleged Romney shipped jobs to China and Mexico Jul 14 Obama said Mr. Romney shipped jobs to Mexico, China and India Jul 23 Obama blamed Romney's firm shipped jobs to Mexico and China Jul 29 Obama’s aides said he had acted against unfair practices but he had not been
as confrontational Sep 6 Obama criticized GOP’s firing teachers and cutting student financial aid and
claimed to compete with the scientists and engineers out of China Sep 15 Obama ad accused Romney sending jobs to China Sep 17 Obama said Romney shifting jobs to China Sep 21 Obama had been tough on China Sep 26 Obama accused Romney on unfair trade cases Oct 4 China had assailed the anti-China comments by President Obama by
President Obama Oct 10 Obama accused Romney’s Bain purchase in China Oct 14 Obama charged that Romney was putting profits for China ahead Oct 16 Obama mentioned Romney's investment in Chinese companies Oct 17 Obama painted Romney as a tool of big oil who was soft on China Oct 20 China is wary of U.S. candidates’ tough talk Oct 31 Obama said Romney ad auto bailout did nothing but create more jobs in
China 6) President reinforced the campaign statements with a foreign policy towards China Apr 11 Press Secretary Carney reinstated the President’s statement that asked China
to have North Korea change direction Apr 13 Obama claimed that he had brought trade cases against China at nearly twice
the rate as the last administration Jul 5 Obama said he had brought trade cases against China at a faster pace than the
former administration Jul 31 Obama sanctioned China's Bank of Kunlun Sep 17 Earnest said the President was filing WTO case against China, But not for
campaign purpose Sep 28 Obama issued executive orders to reject Chinese Acquisition of U.S.
companies Oct 8 Carney highlighted cooperation with China and refuse to comment on trade
issue with China Oct 23 Paski claimed that we were being tough on China when we need to be tough

141
7) President reinforced the campaign statements without a foreign policy towards China May 8 White House released report to show that manufacturing jobs were moving
back to U.S. from China Jul 24 Obama claimed to create manufacturing jobs not in China, but here in U.S. Nov 1 Obama claimed to create jobs in U.S., not in China

142
Appendix E. Participants of the First Round Joint Meeting of the U.S.–China Strategic and Economic Dialogue (S&ED) Held in Washington, D.C. from July 27-28, 2009 On the U.S. side:
Secretary of States Hilary Clinton
Secretary of the Treasury Timothy Geithner
Secretary of Agriculture Thomas Vilsack
Secretary of Labor Hilda Solis
Secretary of Transportation Raymond LaHood
Chair of the Council of Economic Advisors Christina Romer
Director of Office of Management and Budget Peter Orszag
U.S. Trade Representative Ronald Kirk
Director of the National Economic Council and Assistant to the President for Economic
Policy Lawrence Summers
Chairman of the Federal Reserve Ben Bernanke
Chair of the Federal Deposit Insurance Corporation Sheila Bair
Chairman of the Securities and Exchange Commission Mary Schapiro
Chairman of Commodity Futures Trading Commission Gary Gensler
Chairman and President of the Export-Import Bank Fred Hochberg
On the Chinese side
Vice Premier Wang Qishan,
State Councilor Dai Bingguo
Minister of Finance Xie Xuren

143
Governor of the People's Bank of China Zhou Xiaochuan
Chairman of the China Banking Regulatory Commission Liu Mingkang
Chairman of the China Securities Regulatory Commission Chairman Shang Fulin
Chinese Ambassador to the United States Zhou Wenzhong
Deputy Secretary-General of the State Council Bi Jingquan
Vice Minister of Foreign Affairs He Yafei
Vice Minister of the National Development and Reform Commission Zhang Xiaoqiang
Vice Minister of Human Resources and Social Security Wang Xiaochu
Vice Minister of Transport Weng Mengyong
Vice Minister of Agriculture Niu Dun
Vice Minister of Commerce Ma Xiuhong
Vice Minister of Health Yin Li
Vice Chairman of the China Insurance Regulatory Commission Li Kemu
President of the Export-Import Bank of China Li Ruogu
* For a complete lists of all annual meetings, see Wikipedia, “U.S.-China Strategic and Economic Dialogue.” https://en.wikipedia.org/wiki/U.S.%E2%80%93China_Strategic_and_Economic_Dialogue#cite_ref-32

144
Bibliography Allison, Graham T. 1971. Essence of Decision: Explaining the Cuban Missile Crisis.
Boston: Little, Brown.
Almond, Gabriel A. 1950. American People and Foreign Policy. New York: Harcourt,
Brace and Company.
Ansolabehere, S., and S. Iyengar. 1995. Going Negative: How Attack Ads Shrink and
Polarize the Electorate. New York: Free Press.
Ansolabehere, Stephen, Shanto Iyengar, and Adam Simon. 1999. “Replicating
Experiments Using Aggregate and Survey Data: The Case of Negative
Advertising and Turnout.” American Political Science Review 93(3): 901–9.
Bader, Jeffrey A. 2012. Obama and China’s Rise: An Insider’s Account Of American’s
Asia Strategy. Washington DC: Brookings Institution Press.
Bennett, Andrew. 2002. “Who Rules the Roost? Congressional-Executive Relations on
Foreign Policy After the Cold War,” in Robert J. Lieber, ed., Eagle Rules?
Foreign Policy and American Primacy in the 21st Century NJ: Prentice Hall:
Upper Saddle River.
Campbell, James E. 2000. The American Campaign: US. Presidential Campaigns and the
National Vote. College Station: Texas A&M Press.
Canes-Wrone, Brandice, William G. Howell, and David E. Lewis. 2008. “Toward a
Broader Understanding of Presidential Power: A Reevaluation of the Two
Presidencies Thesis.” The Journal of Politics, (70)1:1–16.
Carpenter, Ted G. 2012. China Bashing: A U.S. Political Tradition, Reuters. October 11,
2012.

145
Chappell, henry. 1982. “Campaign Contributions and Congressional Voting: A
Simultaneous Probit-Tobit Model.” Review of Economics and Statistics 62:718-
33.
De Bièvre, Dirk, and Andreas Dür. 2005. “Constituency Interests And Delegation In
European And American Trade Policy. Comparative Political Studies 38(10):
1271-1296.
Dietrich, John W. 1999. “Interest Groups and Foreign Policy: Clinton and the China
MFN Debates.” Presidential Studies Quarterly 29(2): 280-96.
Drope, Jeffrey M., and Wendy L. Hansen. 2004. “Purchasing Protection? The Effect of
Political Spending on U.S. Trade Policy.” Political Research Quarterly 57(1): 27-
37.
Edwards, George C., III, and B. Dan Wood. 1999. “Who Influences Whom? The
President, Congress, and the Media.” American Political Science Review 93(2):
327–344.
Fenno, Richard F., Jr. 1973. Congressmen in Committees. Boston: Little, Brown.
Finkel, Steven E. and John Geer. 1988. “A Spot Check: Casting Doubt on the
Demobilizing Effect of Attack Advertising.” American Journal of Political
Science, 42: 573-595.
Finkel, Steven E 1993. "Reexamining the 'Minimal Effects' Model in Recent Presidential
Campaigns." The Journal of Politics 55(1): 1-21.
Fiorina, Morris P. 1974. Representatives, Roll Calls, and Constituencies. Lexington, MA:
Lexington Books.
Fishel, Jeff. 1985, Presidents and Promises: From Campaign Pledge to Presidential

146
Performance. Washington DC: Congressional Quarterly Press.
Freedman, Paul, Michael Franz M, and Ken Goldstein. 1999. “Measuring Media
Exposure and the Effects of Negative Campaign Ads.” American Journal of
Political Science, 43: 1189-1208.
Freedman, Paul, Michael Franz M, and Ken Goldstein. 2004. "Campaign Advertising and
Democratic Citizenship." American Journal of Political Science 48 (4): 723-41.
Geer, John G. 2006. In Defense of Negativity: Attack Ads in Presidential Campaigns.
Chicago: University of Chicago Press.
Gerber, Alan S. and Donald Green. 2000. “The Effects of Canvassing, Telephone Calls,
and Direct Mail on Voter Turnout: A Field Experiment.” American Political
Science Review 94(3): 653-63.
Gerber, Alan, James G. Gimpel, Donald P. Green, and Daron R. Shaw. 2011. “How
Large and Long-lasting Are the Persuasive Effects of Televised Campaign Ads?
Results from a Randomized Field Experiment.” American Political Science
Review 105(1): 135-50.
Gilliam, Franklin D., Jr. and Shanto Iyengar. 2000. “Prime Suspects: The Influence of
Local Television News on the Viewing Public.” American Journal of Political
Science 44: 560–74
Goldstein, Ken, and Freedman, Paul. 2002. “Campaign Advertising and Voter Turnout:
New Evidence for the Stimulation Effect,” with Paul Freedman. The Journal of
Politics 64 (3): 721-740.Grenzke, Janet M. 1989. “Shopping in the Congressional
Supermarket: The Currency is Complex.” American Journal of Political Science
33:1-24.

147
Haney, Patrick J. 2011. “Interest Group,” in Hook and Jones, in Hook, Steven W. and
Jones, Christopher M., Routledge Handbook of American Foreign Policy.
London: Routledge.
Holbrook, Thomas M., and Scott D. McClurg. 2005. “The Mobilization of Core
Supporters: Campaigns, Turnout, and Electoral Composition in United States
Presidential Elections.” American Journal of Political Science 49 (4): 689–703.
Howell, William G. 2005 “Unilateral Powers: A Brief Overview,” Presidential Studies
Quarterly 35: 417-439.
Hibbs, Douglas A. Jr. 1987. The American Political Economy: Macroeconomics and
Electoral Politics. Cambridge: Harvard University Press.
Hillygus, D. Sunshine. 2005. “Campaign Effects and the Dynamics of Turnout Intention
in Election 2000.” The Journal of Politics, 67(1): 50-68.
Heclo, Hugh. 2000. “Campaigning and Governing: A Conspectus.” in The Permanent
Campaign and Its Future. Norman J. Ornstein and Thomas E. Mann. Washington
DC: American Enterprise Institute and The Brookings Institution.
Iyengar, Shanto, Mark Peters, and Donald R. Kinder. 1982. “Experimental
Demonstration of the Not-So-Minimal Consequences of Television News
Programs.” American Political Science Review 76: 848–58.
Johnston, Richard, Michael G. Hagen, and Kathleen Hall Jamieson. 2004. The 2000
Presidential Elections and the Foundations of Party Politics. Cambridge:
Cambridge University Press.
Jones, Charles O. 2000. “Preparing to Govern in 2001: Lessons from the Clinton
Presidency.” in The Permanent Campaign and Its Future. Norman J. Ornstein and

148
Thomas E. Mann. Washington DC: American Enterprise Institute and The
Brookings Institution.
Kahn, Kim Fridkin, and Patrick Kenney. 1999. “Do Negative Campaigns Mobilize or
Suppress Turnout? Clarifying the Relationship between Negativity and
Participation.” American Political Science Review, 93: 877-890.
Kaid, Lynda Lee. 1997. “Effects of the Television Spots on Images of Dole and Clinton.”
American Behavioral Scientist 40 (8): 1085–94.
Katzenstein, Peter J. 1976. International Relations and Domestic Structures: Foreign
Economic Policies of Advanced Industrial States. International Organization,
30(1): 1-45.
Kernell, Samuel. 2007. Going Public: New Strategies Of Presidential Leadership, 4th
Edition. Washington DC: Congressional Quarterly Press.
Kingdon, J. W. (1995). Agendas, Alternatives, and Public Policies, 2nd edition. New
York: Harper Collins.
Kissinger, Henry. 1969. “Domestic Structure and Foreign Policy.” Daedalus 95(2): 501-
526.
Krasno, Jonathan S., and Donald P. Green. 2008. “Do Televised Presidential Ads
Increase Voter Turnout? Evidence from a Natural Experiment.” The Journal of
Politics 70 (1): 245-61.
Krukones, Michael G. 1984 Promises and Performance: Presidential Campaigns as
Policy Predictors Lanham, MD: University Press of America.
Lampton, David M. 2002. Same Bed, Different Dreams: Managing U.S. - China
Relations, 1989-2000, New York, NY: University of California Press.

149
Lau, Richard, Lee Sigelman, Caroline Heldman, and Paul Babbit. 1999. “The Effects of
Negative Political Advertisements: A Meta-Analytical Assessment.” American
Political Science Review 93 (4): 851–76.
Madison, James, Alexander Hamilton, and John Jay. [1788] 1966. The Federalist Papers.
Ed. Roy P. Fairfield. Garden City, NY: Anchor Books.
Martin, Paul S. 2004. “Inside the Black Box of Negative Campaign Effects: Three
Reasons Why Negative Campaign Mobilize.” Political Psychology 25(4): 545-62.
Mayhew, David R. 1974. Congress: The Electoral Connection. New Haven: Yale
University Press.
Neustadt, Richard E. 1960. Presidential Power. New York: NY Macmillan Publishing
Company.
Nincic, Miroslav. 1990. “U. S. Soviet Policy and the Electoral Connection.” World
Politics (42)3: 370-396.
Northedge, F.S. 1968. “The Foreign Policies of the Powers.” London: Faber and Faber.
Oldfield, Duane and Aaron Wildavsky. 1989. “Reconsidering the Two Presidencies.”
Society 26 (July/August): 54–59.
Ornstein, Norman J. 1992. “Foreign Policy and The 1992 Election.” Foreign Affairs
71(2): 1-16.
Ornstein, Norman J. and Thomas E. Mann. 2000. The Permanent Campaign and Its
Future. Washington DC: American Enterprise Institute and The Brookings
Institution.
Page, Benjamin I., and Tao Xie. 2010. Living with the Dragon: How the American Public
Views the Rise of China. New York: NY, Columbia University Press.

150
Ramirez, Carlos D. 2012. “The Effect of ‘China Bashing’ on Sino-American Relations.”
Journal of Chinese Political Science 17: 291-311.
Ripley, Randall B. 1998. ―Congress and Foreign Policy: A Neglected Stage. In Great
Theatre: The American Congress in the 1990s, Herbert F. Weisberg and Samuel
C. Patterson, eds., 248-268. Cambridge: Cambridge University Press.
Rosenblum, Nancy. 2010. On the Side of Angels: An Appreciation of Parties and
Partisanship. Princeton: Princeton University Press.
Shaw, Daron R. 1999. “The Effect of TV Ads and Candidate Appearances on Statewide
Presidential Votes, 1988–96.” American Political Science Review 93: 345–61.
Sides, John and Lynn Vavreck. 2013. The Gamble: Choice and Chance in the 2012
Presidential Election. Princeton: Princeton University Press.
Sussman, G. and Daynes, B. W. 2000. Party Promises and Presidential Performance:
Social Policies of the Modern Presidents, FDR-Clinton. Southeastern Political
Review, 28: 111-130.
Sutter, Robert G. 1998. U.S. Policy Toward China: An Introduce to The Role of Interest
Groups. Lanham, MD: Rowman and Littlefield Publishers.
Sutter, Robert G. 2010. US-Chinese Relations: Perilous Past, Pragmatic Present.
Lanham, MD: Rowman and Littlefield Publishers.
Tenpas, Kathryn D. 2000. “The American Presidency: Surviving and Thriving amidst the
Permanent Campaign.” in The Permanent Campaign and Its Future. Norman J.
Ornstein and Thomas E. Mann. Washington DC: American Enterprise Institute
and The Brookings Institution.
Valentino, Nicholas A., Vincent L. Hutchings, and Dmitri Williams. 2004. “The Impact

151
of Political Advertising on Knowledge, Internet Information Seeking, and
Candidate Preference.” Journal of Communication 54: 337–54.
Wattenberg, Martin, and Craig Brians. 1999. “Negative Campaign Advertising:
Demobilizer or Mobilizer?” American Political Science Review, 93: 891-900.
Wayman, Frank W. 1985. “Arms Control and Strategic Arms Voting in the U.S. Senate:
Patterns of Change, 1967-1983.” Journal of Conflict Resolution 29:225-51.
Wayne, Stephen J. 2012. The Road to the White House 2012. Boston: MA: Wadsworth.
Welch, William P. 1982. “Campaign Contributions and Legislative Voting: Milk Money
and Dairy Price Supports.” Western Political Quarterly 35: 478-95.
West, Darrell M. 2012. Air Wars: Television Advertising and Social Media in Election
Campaigns, 1952-2012. 6th ed. Washington, DC: CQ Press.
Wielhouwer, Peter W. and Brad Lockerbie. 1994. “Party Contacting and Political
Participation, 1952-90.” American Journal of Political Science, 38: 211-229.
Wildavsky, Aaron. 1966. “The Two Presidencies.” Trans-Action 4 (December): 7–14.
Wolfinger and Rosenstone. 1980. Who votes? New Haven: Yale University Press.
Wood, B. Dan, and Jeffrey S. Peake. 1998. “The Dynamics of Foreign Policy Agenda
Setting.” American Political Science Review 92: 173-84.
Yan, Xuetong, Zhuo Fangyin, Qi Haixia, Xu Jin, Mei Zhaijiu, and Yan Liangzhu. 2010.
Zhong guo yu da guo guan xi ding liang heng liang 1950-2005 (China’s Foreign
Relations with Major Powers by the Numbers 1950-2005). Beijing: Gaodeng
jiaoyu chubanshe.
Yan, Xuetong, and Haixia Qi. 2009. Zhong wai guan xi ding liang yu ce (Quantitative
Forecasts of China’s Foreign Relations). Beijing, China: Shijie heshi chubanshe.