ap & regents biology - grapbiology -...
TRANSCRIPT

AP Biology 2004-2005
AP Biology
Lab Review

AP Biology
What AP labs have we done?
Big Idea 1: Evolution
Investigation 1 – Artificial Selection
Investigation 2 – Hardy-Weinberg Modeling
Investigation 3 – Using BLAST to show evolutionary
relationships
Big Idea 2: Cellular Processes
Investigation 4 – Diffusion and Osmosis
Investigation 5 – Photosynthesis
Investigation 6 – Cellular Respiration
Big Idea 3: Genetics and Information Transfer
Investigation 7 – Cell Division, Mitosis and Meiosis
Investigations 8 & 9 – Biotechnology: Bacteria
Transformation and Electrophoresis

AP Biology
What AP labs have we done?
Big Idea 4: Interactions
Investigation 10 – Energy Transfer
Investigation 11 – Transpiration
Investigation 12 – Animal Behavior
Investigation 13 – Enzyme Catalysis

AP Biology
Investigation 1: Artificial Selection
Description
Grow a parent generation of plants
Selectively breed for chosen traits
Grown the second generation and
quantify the results.

AP Biology
Investigation 1 – Artificial
Selection Key Terms/Concepts:
Phenotype
Artificial Selection (vs. Natural Selection)
Parent Generation, Filial (1st generation)
Cross-Pollination
Genetic Variation (or lack of)
Conclusions:
Plant generations can be selectively cross
breed to determine what traits are
dominant/recessive; Artificial Selection has
effects on future generations – specifically on
genetic variation.

AP Biology 2004-2005
Investigation 2: H-W Modeling
random vs. non-random mating
size of population & gene pool

AP Biology 2004-2005
Investigation 2: H-W Modeling
Description
simulations were used to study effects
of different parameters on frequency of
alleles in a population
selection
heterozygous advantage
genetic drift

AP Biology 2004-2005
Investigation 2: H-W Modeling Concepts
Hardy-Weinberg equilibrium p + q = 1
p2 + 2pq + q2 = 1
required conditions
large population
random mating
no mutations
no natural selection
no migration
gene pool
heterozygous advantage
genetic drift founder effect
bottleneck

AP Biology
Investigation 2: H-W Modeling
Conclusions
recessive alleles remain hidden
in the pool of heterozygotes
even lethal recessive alleles are not
completely removed from population
know how to solve H-W problems!
to calculate allele frequencies, use p + q = 1
to calculate genotype frequencies or how
many individuals, use, p2 + 2pq + q2 = 1

AP Biology 2004-2005
Investigation 2: H-W Modeling ESSAY 1989
Do the following with reference to the Hardy-Weinberg model.
a. Indicate the conditions under which allele frequencies (p and q)
remain constant from one generation to the next.
b. Calculate, showing all work, the frequencies of the alleles and
frequencies of the genotypes in a population of 100,000 rabbits of
which 25,000 are white and 75,000 are agouti.
(In rabbits the white color is due to a recessive allele, w, and agouti
is due to a dominant allele, W.)
c. If the homozygous dominant condition were to become lethal, what
would happen to the allelic and genotypic frequencies in the rabbit
population after two generations?

AP Biology
Investigation 3: BLAST Lab
Purpose: Using bioinformatics tool
(BLAST) to research and show
evolutionary relationships between
organisms.
Key Terms:
Basic Local Alignment
Search Tool
Cladogram
Root
Derived Characteristics

AP Biology
Investigation 3: BLAST Lab
Conclusions:
The more aligned a gene sample is to a
known sample in the database the more
closely related = would be closer
together on a cladogram.

AP Biology 2004-2005
Investigation 4 : Diffusion &
Osmosis

AP Biology 2004-2005
Investigation 4 : Diffusion & Osmosis
Description
dialysis tubing filled with starch-
glucose solution in beaker filled with
KI solution
Dialysis bags in
different sucrose
solutions
Different sucrose
solutions to
determine Molarity
of tissue sample

AP Biology
Investigation 4: Diffusion & Osmosis
Concepts/Key Terms
semi-permeable membrane
diffusion
osmosis
solutions
hypotonic
hypertonic
Isotonic
Water potential
Solute, pressure
AP Biology 2004-2005
Investigation 4: Diffusion & Osmosis
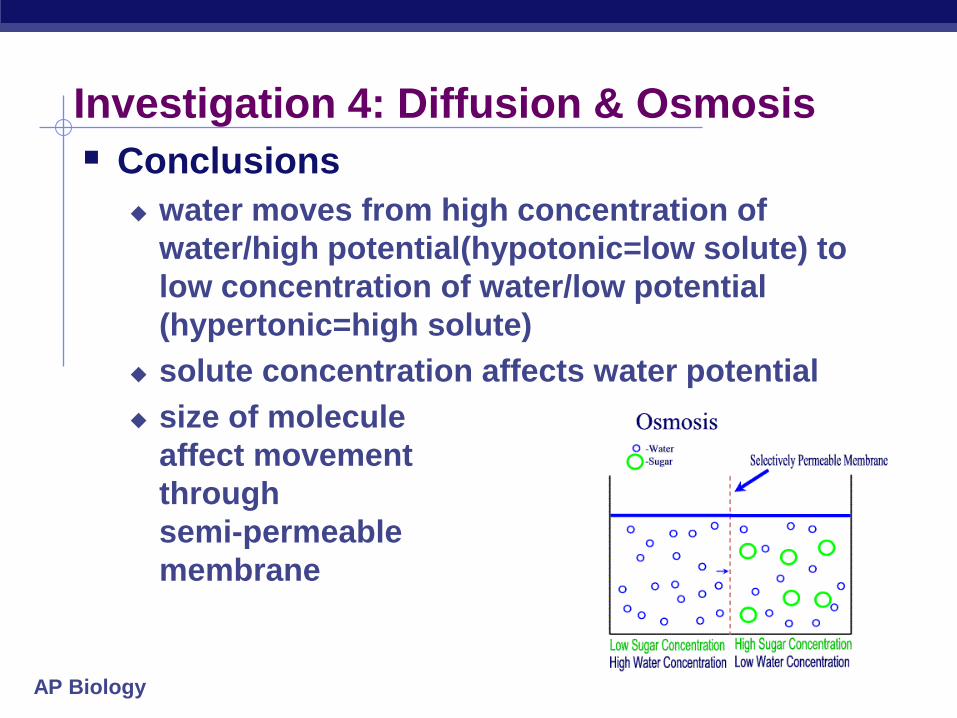
Conclusions
water moves from high concentration of
water/high potential(hypotonic=low solute) to
low concentration of water/low potential
(hypertonic=high solute)
solute concentration affects water potential
size of molecule
affect movement
through
semi-permeable
membrane

AP Biology
Investigation 4: Diffusion & Osmosis
ESSAY 1992
A laboratory assistant prepared solutions of 0.8 M, 0.6 M, 0.4 M, and
0.2 M sucrose, but forgot to label them. After realizing the error, the
assistant randomly labeled the flasks containing these four unknown
solutions as flask A, flask B, flask C, and flask D.
Design an experiment, based on the principles of diffusion and osmosis,
that the assistant could use to determine which of the flasks contains
each of the four unknown solutions.
Include in your answer:
a. a description of how you would set up and perform the experiment;
b.the results you would expect from your experiment; and
c. an explanation of those results based on the principles involved.
Be sure to clearly state the principles addressed in your discussion.
AP Biology
Investigation 5: Photosynthesis

AP Biology 2004-2005
Investigation 5: Photosynthesis
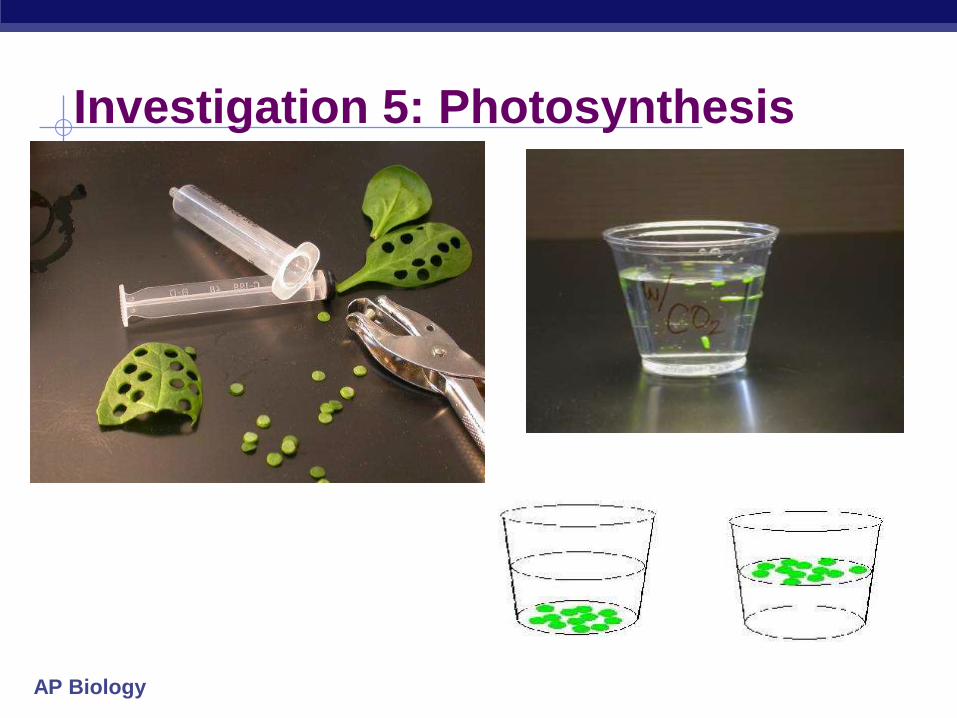
Description
determine rate of photosynthesis under
different conditions
Carbon (sodium bicarbonate) v. no carbon
Removed the air from leaf disks to sink,
placed in solution and counted number of
disks rising
Production of oxygen caused the disks to
float (shows rate of photosynthesis)
AP Biology 2004-2005
Investigation 5: Photosynthesis
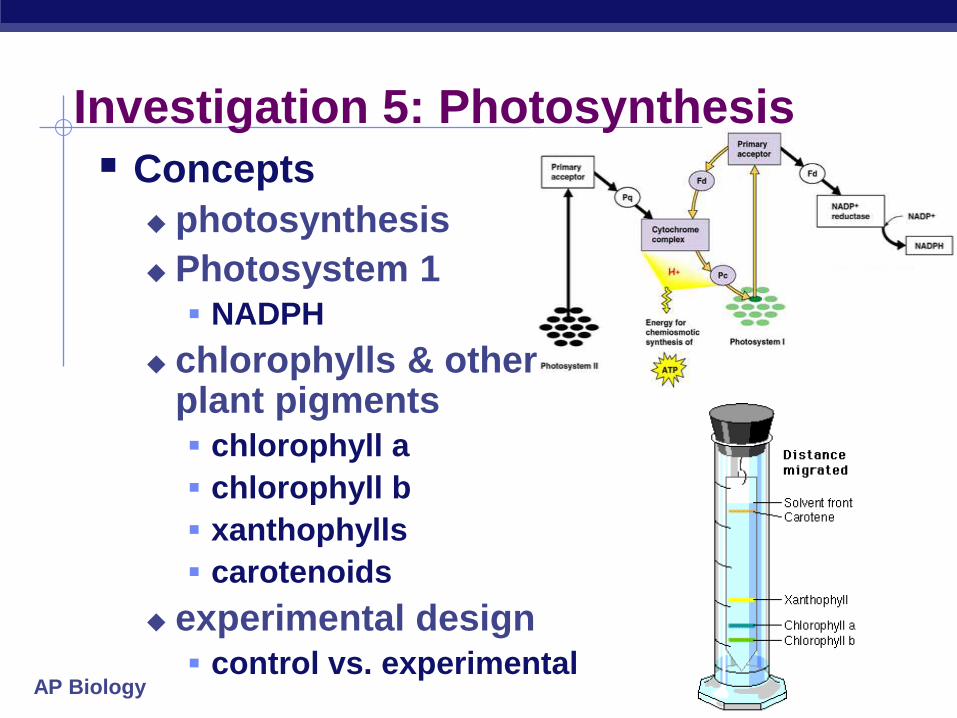
Concepts
photosynthesis
Photosystem 1 NADPH
chlorophylls & other plant pigments chlorophyll a
chlorophyll b
xanthophylls
carotenoids
experimental design control vs. experimental

AP Biology
Investigation 5: Photosynthesis
Conclusions
Photosynthesis
Leaf disks with carbon source floated at a
faster rate than leaf disks with no carbon
source
Others?
Light Intensity
Light Color

AP Biology 2004-2005
Investigation 5: Photosynthesis ESSAY 2004 (part 1)
A controlled experiment was conducted to analyze the effects of darkness and
boiling on the photosynthetic rate of incubated chloroplast suspensions. The dye
reduction technique was used. Each chloroplast suspension was mixed with
DPIP, an electron acceptor that changes from blue to clear when it is reduced.
Each sample was placed individually in a spectrophotometer and the percent
transmittance was recorded. The three samples used were prepared as follows.
Sample 1 — chloroplast suspension + DPIP
Sample 2 — chloroplast suspension surrounded by foil wrap to provide a
dark environment + DPIP
Sample 3 — chloroplast suspension that has been boiled + DPIP
Data are given in the table on the next page.
a. Construct and label a graph showing the results for the three samples.
b. Identify and explain the control or controls for this experiment.
c. The differences in the curves of the graphed data indicate that there were
differences in the number of electrons produced in the three samples during
the experiment. Discuss how electrons are generated in photosynthesis and
why the three samples gave different transmittance results.

AP Biology
Investigation 5: Photosynthesis ESSAY 2004 (part 2)
Time
(min)
Light, Unboiled
% transmittance
Sample 1
Dark, Unboiled
% transmittance
Sample 2
Light, Boiled
% transmittance
Sample 3
0 28.8 29.2 28.8
5 48.7 30.1 29.2
10 57.8 31.2 29.4
15 62.5 32.4 28.7
20 66.7 31.8 28.5

AP Biology
Investigation 6: Cellular Respiration
Description
Using probeware to measure rate of CO2
production by seeds/crickets
non-germinating seeds
germinating seeds
Crickets (live)
effect of temperature
control for changes in pressure &
temperature in room

AP Biology
Investigation 6: Cellular Respiration
Concepts
respiration
experimental design control vs. experimental

AP Biology
Lab 5: Cellular Respiration
Conclusions
temp = respiration
germination = respiration
calculate rate

AP Biology 2004-2005
Investigation 6: Cellular Respiration ESSAY 1990
The results below are measurements of cumulative oxygen consumption by germinating and dry seeds. Gas volume measurements were corrected for changes in temperature and pressure.
a. Plot the results for the germinating seeds at 22°C and 10°C.
b. Calculate the rate of oxygen consumption for the germinating seeds at 22°C, using the time interval between 10 and 20 minutes.
c. Account for the differences in oxygen consumption observed between:
1. germinating seeds at 22°C and at 10°C
2. germinating seeds and dry seeds.
d. Describe the essential features of an experimental apparatus that could be used to measure oxygen consumption by a small organism. Explain why each of these features is necessary.
Cumulative Oxygen Consumed (mL)
Time (minutes) 0 10 20 30 40
Germinating seeds 22°C 0.0 8.8 16.0 23.7 32.0
Dry Seeds (non-germinating) 22°C 0.0 0.2 0.1 0.0 0.1
Germinating Seeds 10°C 0.0 2.9 6.2 9.4 12.5
Dry Seeds (non-germinating) 10°C 0.0 0.0 0.2 0.1 0.2

AP Biology 2004-2005
Investigation 7: Mitosis & Meiosis

AP Biology 2004-2005
Investigation 7: Mitosis & Meiosis
Description
A: cell stages of mitosis
exam slide of onion root tip
count number of cells in each stage to
determine relative time spent in each stage
B: crossing over in meiosis
farther gene is from centromere the greater
number of crossovers
observed crossing over in
fungus, Sordaria
arrangement of ascospores

AP Biology
Investigation 7: Mitosis & Meiosis
Concepts
mitosis interphase
prophase
metaphase
anaphase
telophase
meiosis meiosis 1
meiosis 2
crossing over tetrad in prophase 1
I P M A T

AP Biology 2004-2005
Investigation 7: Mitosis & Meiosis
Conclusions
Mitosis
longest phase = interphase
each subsequent phase is
shorter in duration
Meiosis
4:4 arrangement in
ascospores
no crossover
any other arrangement
crossover
2:2:2:2 or 2:4:2

AP Biology 2004-2005
Sordaria analysis
% crossover total crossover
total offspring =

AP Biology
Investigation 7: Mitosis & Meiosis ESSAY 1987
Discuss the process of cell division in animals. Include a description of
mitosis and cytokinesis, and of the other phases of the cell cycle. Do not
include meiosis.
ESSAY 2004
Meiosis reduces chromosome number and rearranges genetic
information.
a. Explain how the reduction and rearrangement are accomplished in
meiosis.
b. Several human disorders occur as a result of defects in the meiotic
process. Identify ONE such chromosomal abnormality; what effects does
it have on the phenotype of people with the disorder? Describe how this
abnormality could result from a defect in meiosis.
c. Production of offspring by parthenogenesis or cloning bypasses the
typical meiotic process. Describe either parthenogenesis or cloning and
compare the genomes of the offspring with those of the parents.

AP Biology
Investigation 8 & 9: Biotechnology

AP Biology 2004-2005
Investigation 8 & 9: Biotechnology
Description
Transformation
insert foreign DNA in bacteria by using
engineered plasmid (creating recombinant
DNA)
Gel electrophoresis
cut DNA with restriction enzyme
fragments separate on gel based
on size

AP Biology
Investigation 8: Biotechnology
Concepts
Transformation –
Foreign DNA
plasmid
restriction enzyme
gel electrophoresis
DNA is negatively
charged
smaller fragments
travel faster

AP Biology
Investigation 8: Biotechnology
Conclusions
can insert foreign DNA
Use the plasmid to engineer a product from
bacteria

AP Biology
Investigation 9: Biotechnology
Conclusions
DNA = negatively
charged
smaller fragments
travel faster &
therefore farther
correlate distance
to size

AP Biology 2004-2005
Investigation 9: Biotechnology ESSAY 1995 The diagram below shows a segment of DNA with a total length of 4,900 base pairs.
The arrows indicate reaction sites for two restriction enzymes (enzyme X and enzyme Y).
a. Explain how the principles of gel electrophoresis allow for the separation of DNA
fragments
b. Describe the results you would expect from electrophoretic separation of fragments from
the following treatments of the DNA segment above. Assume that the digestion occurred
under appropriate conditions and went to completion.
I. DNA digested with only enzyme X
II. DNA digested with only enzyme Y
III. DNA digested with enzyme X and enzyme Y combined
IV. Undigested DNA
c. Explain both of the following:
1. The mechanism of action of restriction enzymes
2. The different results you would expect if a mutation occurred at the recognition
site for enzyme Y.
D N A Segmen t
Leng th ( base pair s) 400 500 1 ,20 0 1 ,300 1 ,500
X X X
En zym e En zym eEn zym e E nz yme
Y
AP Biology 2004-2005
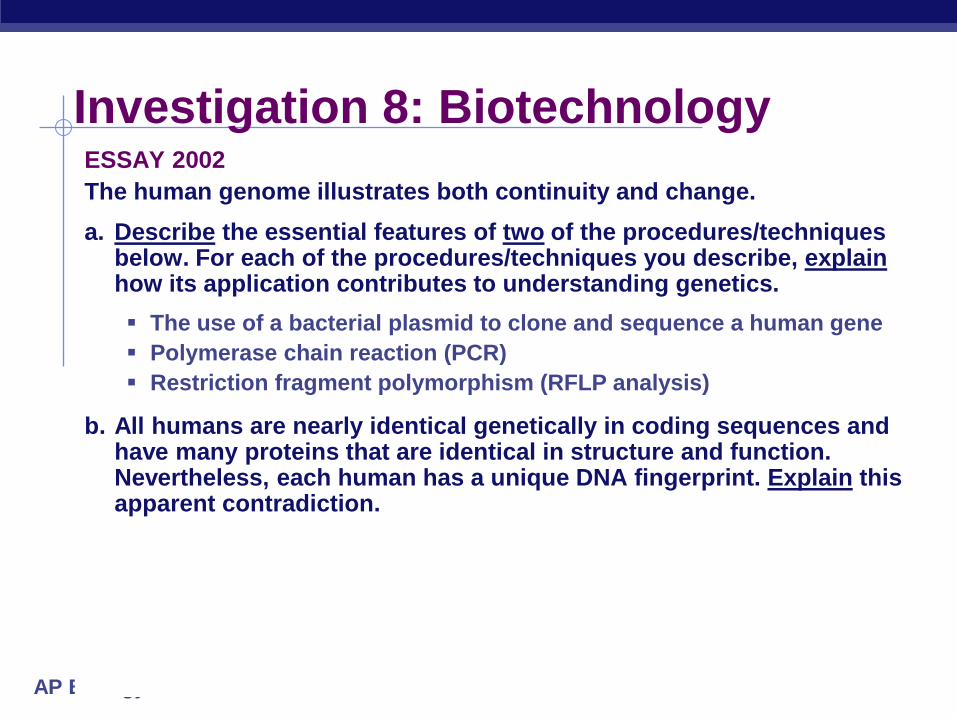
Investigation 8: Biotechnology ESSAY 2002
The human genome illustrates both continuity and change.
a. Describe the essential features of two of the procedures/techniques below. For each of the procedures/techniques you describe, explain how its application contributes to understanding genetics.
The use of a bacterial plasmid to clone and sequence a human gene
Polymerase chain reaction (PCR)
Restriction fragment polymorphism (RFLP analysis)
b. All humans are nearly identical genetically in coding sequences and have many proteins that are identical in structure and function. Nevertheless, each human has a unique DNA fingerprint. Explain this apparent contradiction.

AP Biology
Investigation 10: Energy Transfer
Description:
Observe the transfer of energy between
a producer and a consumer and
determine the efficiency of the transfer
Key Terms:
1st law of thermodynamics
Biomass
Gross vs. Net Productivity
Producer, Consumer

AP Biology
Investigation 10: Energy Transfer
Conclusions:
Energy Transfer between trophic levels
is not efficient.
Not all the mass from the oatmeal was
transferred to the mealworm.
Why? What else does the energy go
towards?

AP Biology
Investigation 11: Transpiration

AP Biology 2004-2005
Investigation 11: Transpiration
Description
test the effects of environmental factors
on rate of transpiration
temperature
humidity
air flow (wind)
light intensity (dark)

AP Biology
Investigation 11: Transpiration
Concepts
transpiration
stomatas
guard cells
xylem
adhesion
cohesion
H bonding
Cohesion-tension theory

AP Biology 2004-2005
Investigation 11: Transpiration
Conclusions
transpiration
wind
light
transpiration
humidity

AP Biology 2004-2005
Lab 9: Transpiration ESSAY 1991 A group of students designed an experiment to measure transpiration rates in a particular species of herbaceous plant. Plants were divided into four groups and were exposed to the following conditions.
Group I: Room conditions (light, low humidity, 20°C, little air movement.)
Group II: Room conditions with increased humidity.
Group III: Room conditions with increased air movement (fan)
Group IV: Room conditions with additional light
The cumulative water loss due to transpiration of water from each plant was measured at 10-minute intervals for 30 minutes. Water loss was expressed as milliliters of water per square centimeter of leaf surface area. The data for all plants in Group I (room conditions) were averaged. The average cumulative water loss by the plants in Group I is presented in the table below.
1. Construct and label a graph using the data for Group I. Using the same set of axes, draw and label three additional lines representing the results that you would predict for Groups II, III, and IV.
2. Explain how biological and physical processes are responsible for the difference between each of your predictions and the data for Group I.
3. Explain how the concept of water potential is used to account for the movement of water from the plant stem to the atmosphere during transpiration.
Average Cumulative Water Loss by the Plants in Group I
Time (minutes) Average Cumulative Water Loss (mL H2O/cm2)
10 3.5 x 10⁻⁴
20 7.7 x 10⁻⁴
30 10.6 x 10⁻⁴

AP Biology 2004-2005
Investigation 12: Animal Behavior

AP Biology
Investigation 12: Animal Behavior
Description
set up an experiment to study behavior
in an organism
Mealworm kinesis or taxis?

AP Biology
Investigation 12: Animal Behavior
Concepts
innate vs. learned behavior
experimental design control vs. experimental
hypothesis
choice chamber temperature
humidity
light intensity
salinity
other factors

AP Biology
Investigation 12: Animal Behavior
Experimental design sample size

AP Biology
Investigation 12: Animal Behavior
Conclusions
Kinesis is random movement
Taxis is movement in response to
something (light, moisture)
AP Biology 2004-2005
Investigation 12: Animal Behavior ESSAY 1997
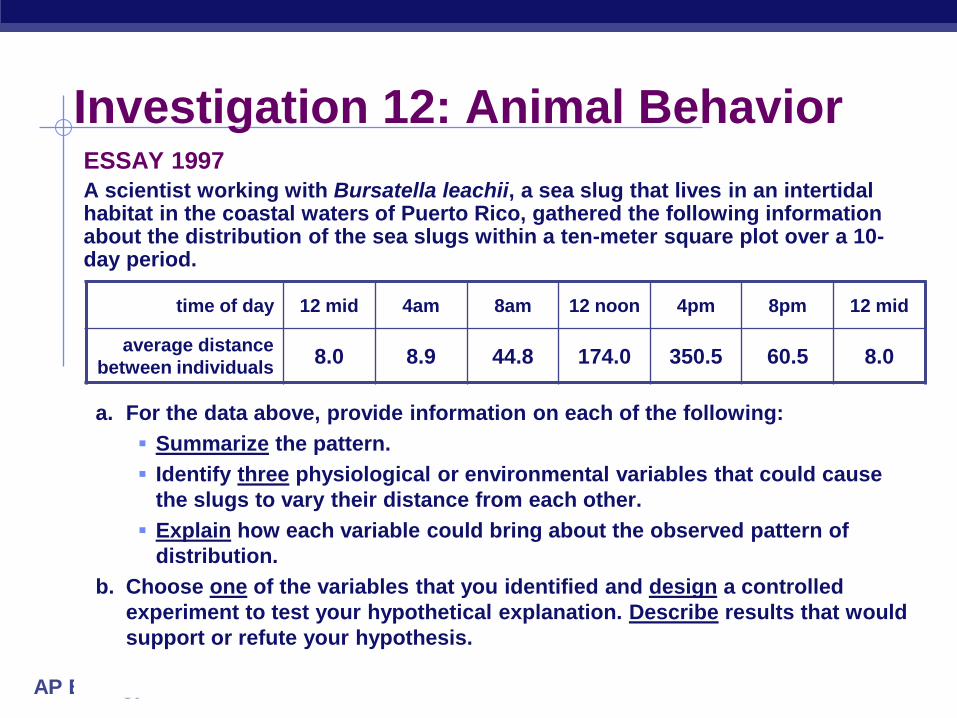
A scientist working with Bursatella leachii, a sea slug that lives in an intertidal habitat in the coastal waters of Puerto Rico, gathered the following information about the distribution of the sea slugs within a ten-meter square plot over a 10-day period.
a. For the data above, provide information on each of the following:
Summarize the pattern.
Identify three physiological or environmental variables that could cause
the slugs to vary their distance from each other.
Explain how each variable could bring about the observed pattern of
distribution.
b. Choose one of the variables that you identified and design a controlled
experiment to test your hypothetical explanation. Describe results that would
support or refute your hypothesis.
time of day 12 mid 4am 8am 12 noon 4pm 8pm 12 mid
average distance
between individuals 8.0 8.9 44.8 174.0 350.5 60.5 8.0

AP Biology
Investigation 12: Animal Behavior ESSAY 2002 The activities of organisms change at regular time intervals. These changes are called biological rhythms. The graph depicts the activity cycle over a 48-hour period for a fictional group of mammals called pointy-eared bombats, found on an isolated island in the temperate zone.
a. Describe the cycle of activity for the bombats. Discuss how three of the following factors might affect the physiology and/or behavior of the bombats to result in this pattern of activity.
temperature
food availability
presence of predators
social behavior
b. Propose a hypothesis regarding the effect of light on the cycle of activity in bombats. Describe a controlled experiment that could be performed to test this hypothesis, and the results you would expect.

AP Biology
Investigation 13: Enzyme Catalysis

AP Biology 2004-2005
Investigation 13: Enzyme Catalysis
Description
measured factors affecting enzyme
activity
H2O2 H2O + O2
measured rate of O2 production
catalase

AP Biology
Investigation 13: Enzyme Catalysis
Concepts/Key Terms
substrate
enzyme enzyme structure
product
denaturation of protein
experimental design rate of reactivity reaction with enzyme vs. reaction without enzyme
optimum pH or temperature test at various pH, temperature values, or salinity
AP Biology 2004-2005
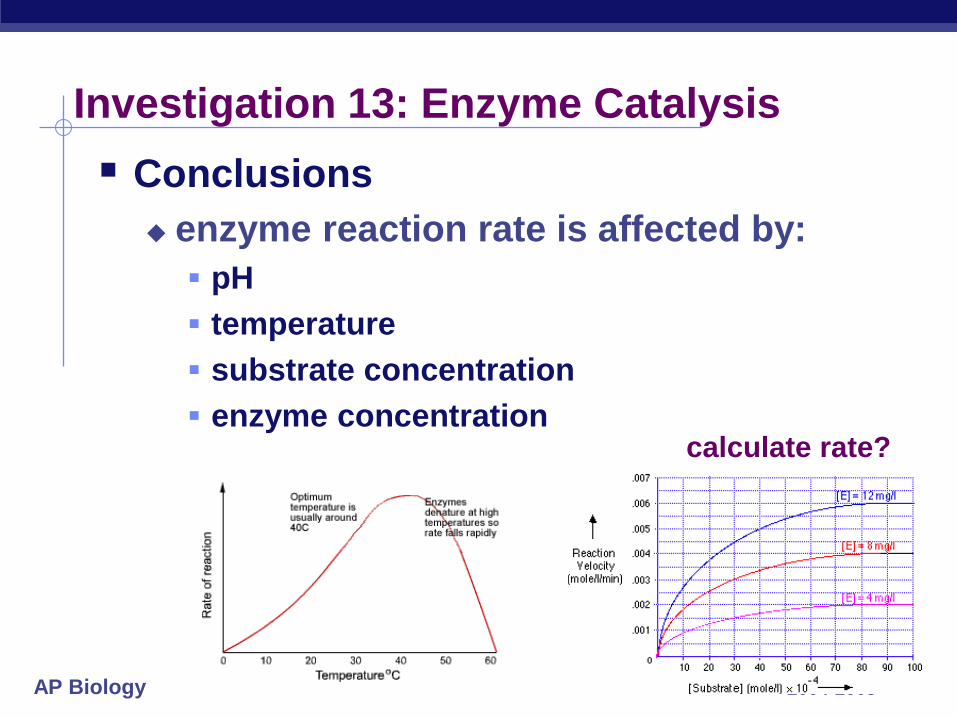
Investigation 13: Enzyme Catalysis
Conclusions
enzyme reaction rate is affected by:
pH
temperature
substrate concentration
enzyme concentration calculate rate?

AP Biology
ESSAY 2000
The effects of pH and temperature were studied for an enzyme-catalyzed
reaction. The following results were obtained.
a. How do (1) temperature and (2) pH affect the activity of this enzyme? In
your answer, include a discussion of the relationship between the
structure and the function of this enzyme, as well as a discussion of ho
structure and function of enzymes are affected by temperature and pH.
b. Describe a controlled experiment that could have produced the data
shown for either temperature or pH. Be sure to state the hypothesis that
was tested here.
Investigation 13: Enzyme Catalysis