appendix 4e - asx...2020/02/28 · molecular diagnostics for infectious diseases has been widely...
TRANSCRIPT
TBG Diagnostics Limited Appendix 4E
Page 1 of 39
Appendix 4E Preliminary Final Report
Name of Entity: TBG Diagnostics Limited
ABN 82 010 975 612
1. Details of the reporting period
Current Period: 1 January 2019 – 31 December 2019
Previous Corresponding Period: 1 January 2018 – 31 December 2018
2. Results for announcement to the market $’000 Revenue from continuing operations Up 6.1% to $3,346 Loss from ordinary activities after income tax attributable to members
Down 343.3% to ($11,222)
Net profit attributable to members Up 118.4% to $765 Explanation of revenue Of the total revenues, 81% pertained to product revenues which mainly include sequence based typing (SBT) and sequence specific primer (SSP); while 8% pertained to revenues from technical services consisting 89% of the total revenues. Explanation of Net Profit after Tax The increase to a net profit for the year ended 31 December 2019 of $620,137 is mainly attributed to results from discontinued operations of $11,842,126 mil (2018: $1,861,793 loss). The result improvement is primarily due to income realised for $5,999,000 pertaining to the early settlement of the deferred consideration of PG500 assets that were sold in 2016. On 3 May 2019, the discontinued operations relating to the disposal of TBG Xiamen resulted to gain of $5,843,126 which formed part of the gain on discontinued operations. However, an impairment loss of $5,169,917 was recognised in relation to this investment as the investment was partially impaired at 31 December 2019.
3. Consolidated Statement of Profit and Loss and Other Comprehensive Income Refer to page 10.
4. Consolidated Statement of Financial Position Refer to page 11.
5. Consolidated Statement of Changes in Equity Refer to page 12.
6. Consolidated Statement of Cash Flows Refer to page 13.
For
per
sona
l use
onl
y
TBG Diagnostics Limited Appendix 4E
Page 2 of 39
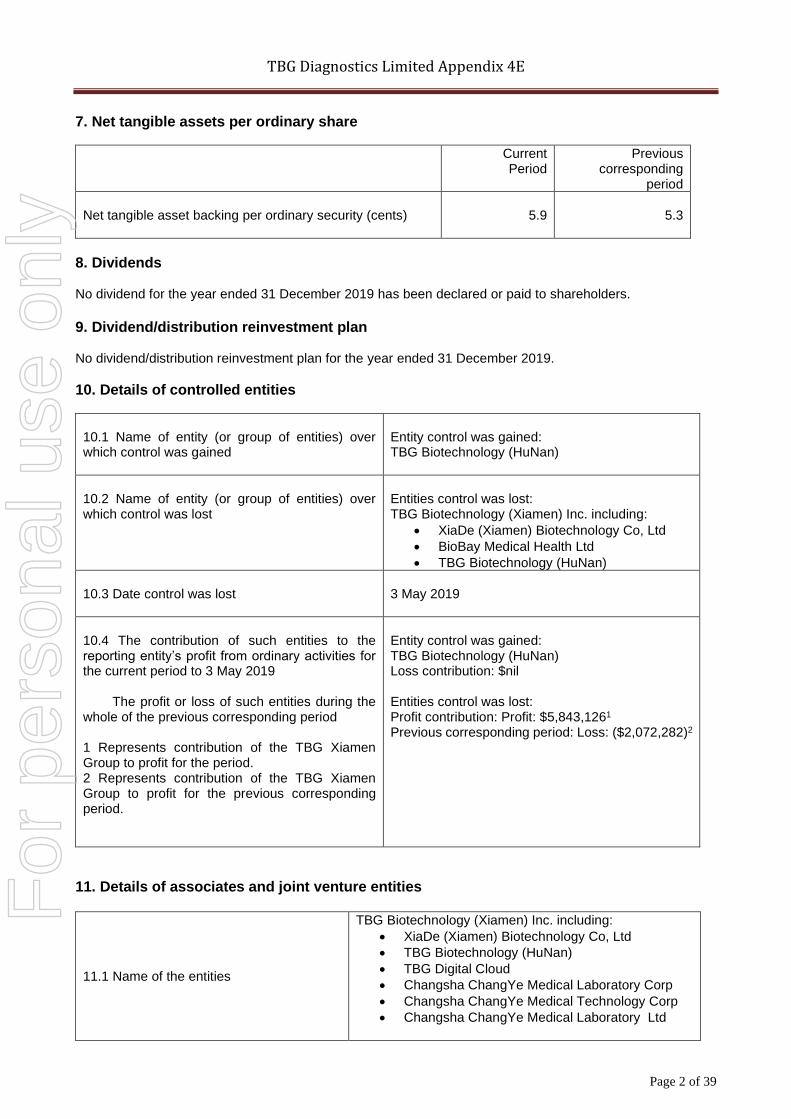
7. Net tangible assets per ordinary share
Current Period
Previous corresponding
period
Net tangible asset backing per ordinary security (cents)
5.9
5.3
8. Dividends No dividend for the year ended 31 December 2019 has been declared or paid to shareholders.
9. Dividend/distribution reinvestment plan No dividend/distribution reinvestment plan for the year ended 31 December 2019.
10. Details of controlled entities
10.1 Name of entity (or group of entities) over which control was gained
Entity control was gained: TBG Biotechnology (HuNan)
10.2 Name of entity (or group of entities) over which control was lost
Entities control was lost: TBG Biotechnology (Xiamen) Inc. including:
• XiaDe (Xiamen) Biotechnology Co, Ltd
• BioBay Medical Health Ltd
• TBG Biotechnology (HuNan)
10.3 Date control was lost
3 May 2019
10.4 The contribution of such entities to the reporting entity’s profit from ordinary activities for the current period to 3 May 2019 The profit or loss of such entities during the whole of the previous corresponding period 1 Represents contribution of the TBG Xiamen Group to profit for the period. 2 Represents contribution of the TBG Xiamen Group to profit for the previous corresponding period.
Entity control was gained: TBG Biotechnology (HuNan) Loss contribution: $nil Entities control was lost: Profit contribution: Profit: $5,843,1261 Previous corresponding period: Loss: ($2,072,282)2
11. Details of associates and joint venture entities
11.1 Name of the entities
TBG Biotechnology (Xiamen) Inc. including:
• XiaDe (Xiamen) Biotechnology Co, Ltd
• TBG Biotechnology (HuNan)
• TBG Digital Cloud
• Changsha ChangYe Medical Laboratory Corp
• Changsha ChangYe Medical Technology Corp
• Changsha ChangYe Medical Laboratory Ltd
For
per
sona
l use
onl
y
TBG Diagnostics Limited Appendix 4E
Page 3 of 39
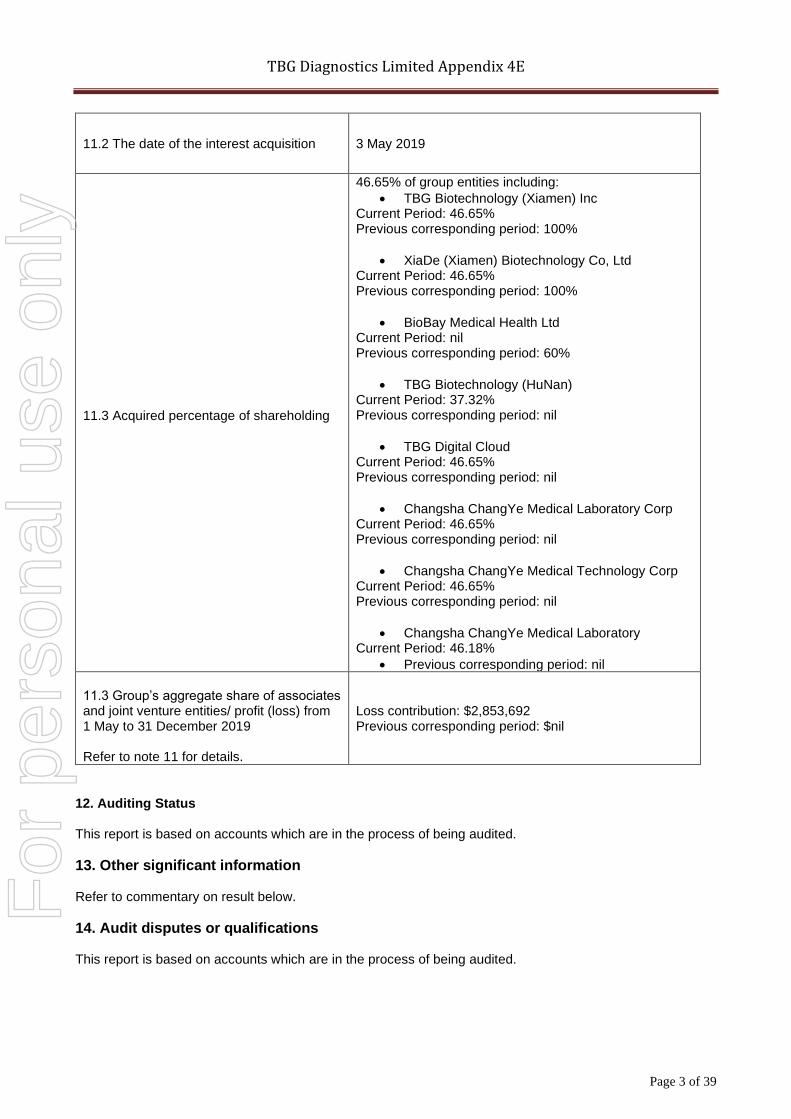
11.2 The date of the interest acquisition 3 May 2019
11.3 Acquired percentage of shareholding
46.65% of group entities including:
• TBG Biotechnology (Xiamen) Inc Current Period: 46.65% Previous corresponding period: 100%
• XiaDe (Xiamen) Biotechnology Co, Ltd Current Period: 46.65% Previous corresponding period: 100%
• BioBay Medical Health Ltd Current Period: nil Previous corresponding period: 60%
• TBG Biotechnology (HuNan) Current Period: 37.32% Previous corresponding period: nil
• TBG Digital Cloud Current Period: 46.65% Previous corresponding period: nil
• Changsha ChangYe Medical Laboratory Corp Current Period: 46.65% Previous corresponding period: nil
• Changsha ChangYe Medical Technology Corp Current Period: 46.65% Previous corresponding period: nil
• Changsha ChangYe Medical Laboratory Current Period: 46.18%
• Previous corresponding period: nil
11.3 Group’s aggregate share of associates and joint venture entities/ profit (loss) from 1 May to 31 December 2019 Refer to note 11 for details.
Loss contribution: $2,853,692 Previous corresponding period: $nil
12. Auditing Status This report is based on accounts which are in the process of being audited.
13. Other significant information Refer to commentary on result below.
14. Audit disputes or qualifications This report is based on accounts which are in the process of being audited.
For
per
sona
l use
onl
y
TBG Diagnostics Limited Appendix 4E
Page 4 of 39
15. Results and Review of Operations Company Overview The principal activities of TBG Diagnostics Limited during the period were as follows: 1. Focused on the research and development, manufacturing, sales and marketing and services of Molecular
Diagnostics (MDx) products, including assays and instruments; 2. Entered into collaboration arrangements and product licensing agreements with external parties to expand
market presence and product portfolio; and 3. Completed the disposal of TBG Biotechnology (Xiamen) Inc. and its subsidiaries as announced on 3 May
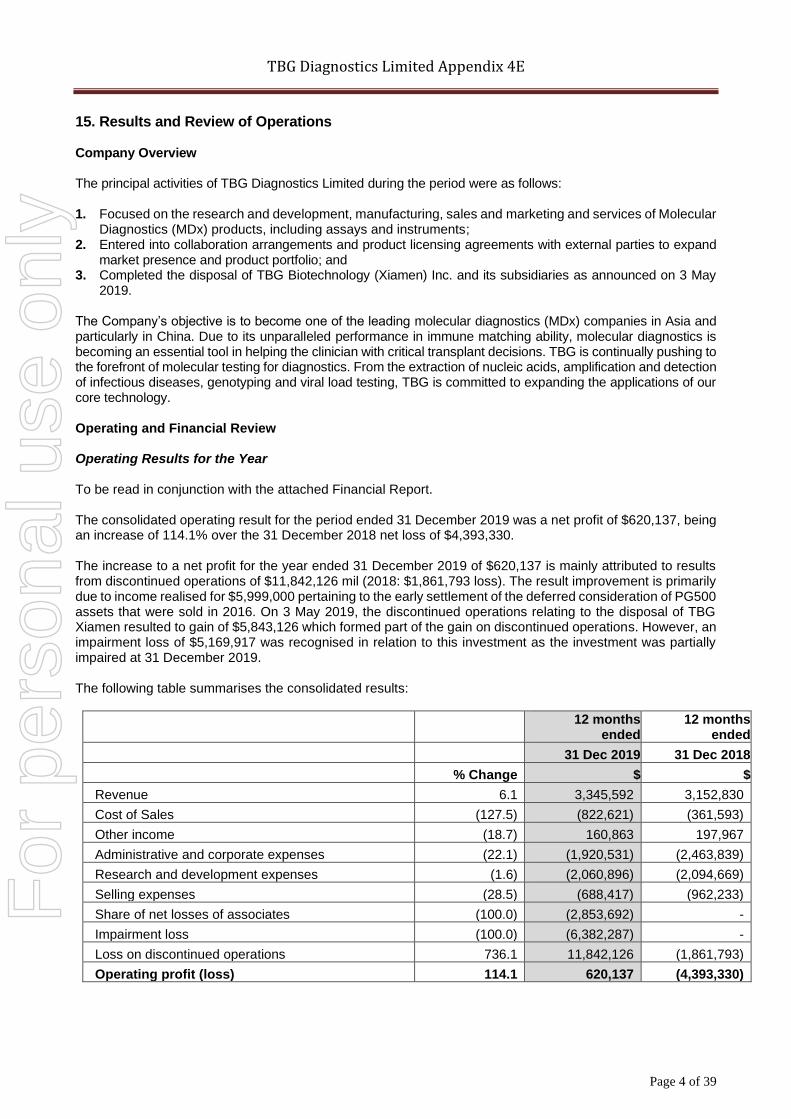
2019. The Company’s objective is to become one of the leading molecular diagnostics (MDx) companies in Asia and particularly in China. Due to its unparalleled performance in immune matching ability, molecular diagnostics is becoming an essential tool in helping the clinician with critical transplant decisions. TBG is continually pushing to the forefront of molecular testing for diagnostics. From the extraction of nucleic acids, amplification and detection of infectious diseases, genotyping and viral load testing, TBG is committed to expanding the applications of our core technology. Operating and Financial Review Operating Results for the Year To be read in conjunction with the attached Financial Report. The consolidated operating result for the period ended 31 December 2019 was a net profit of $620,137, being an increase of 114.1% over the 31 December 2018 net loss of $4,393,330. The increase to a net profit for the year ended 31 December 2019 of $620,137 is mainly attributed to results from discontinued operations of $11,842,126 mil (2018: $1,861,793 loss). The result improvement is primarily due to income realised for $5,999,000 pertaining to the early settlement of the deferred consideration of PG500 assets that were sold in 2016. On 3 May 2019, the discontinued operations relating to the disposal of TBG Xiamen resulted to gain of $5,843,126 which formed part of the gain on discontinued operations. However, an impairment loss of $5,169,917 was recognised in relation to this investment as the investment was partially impaired at 31 December 2019. The following table summarises the consolidated results:
12 months
ended 12 months
ended
31 Dec 2019 31 Dec 2018
% Change $ $
Revenue 6.1 3,345,592 3,152,830
Cost of Sales (127.5) (822,621) (361,593)
Other income (18.7) 160,863 197,967
Administrative and corporate expenses (22.1) (1,920,531) (2,463,839)
Research and development expenses (1.6) (2,060,896) (2,094,669)
Selling expenses (28.5) (688,417) (962,233)
Share of net losses of associates (100.0) (2,853,692) -
Impairment loss (100.0) (6,382,287) -
Loss on discontinued operations 736.1 11,842,126 (1,861,793)
Operating profit (loss) 114.1 620,137 (4,393,330)
For
per
sona
l use
onl
y
TBG Diagnostics Limited Appendix 4E
Page 5 of 39
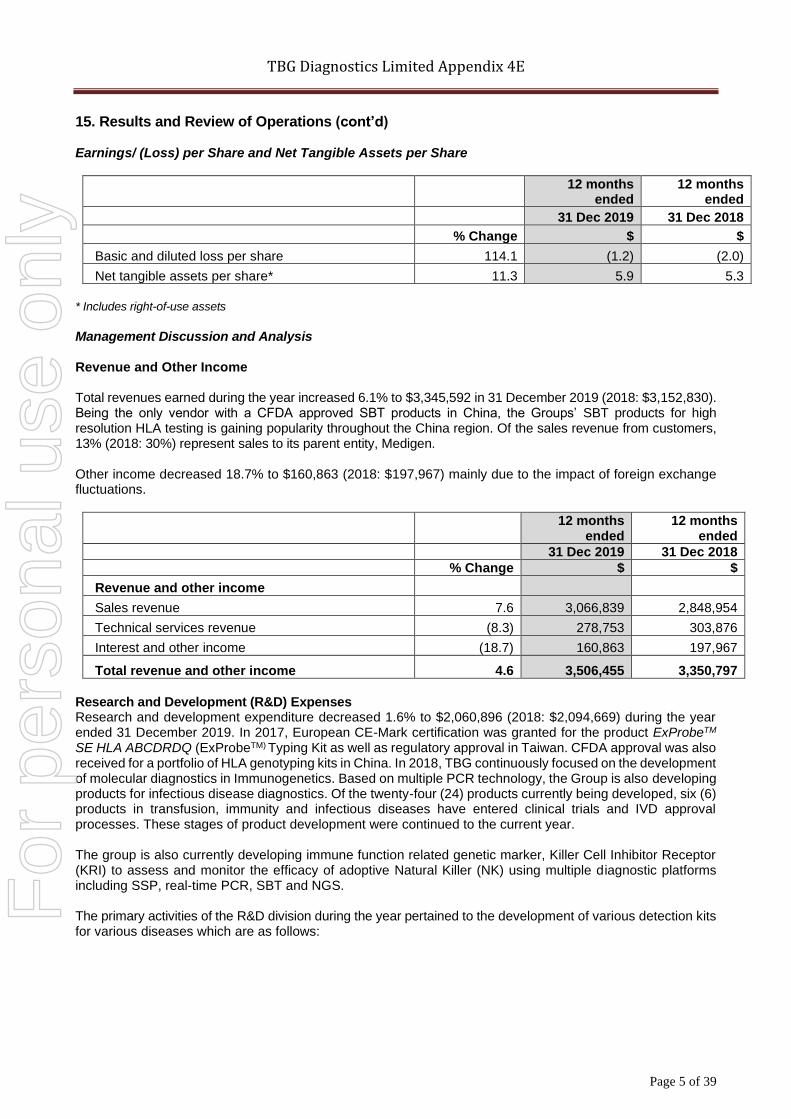
15. Results and Review of Operations (cont’d) Earnings/ (Loss) per Share and Net Tangible Assets per Share
12 months ended
12 months ended
31 Dec 2019 31 Dec 2018
% Change $ $
Basic and diluted loss per share 114.1 (1.2) (2.0)
Net tangible assets per share* 11.3 5.9 5.3
* Includes right-of-use assets
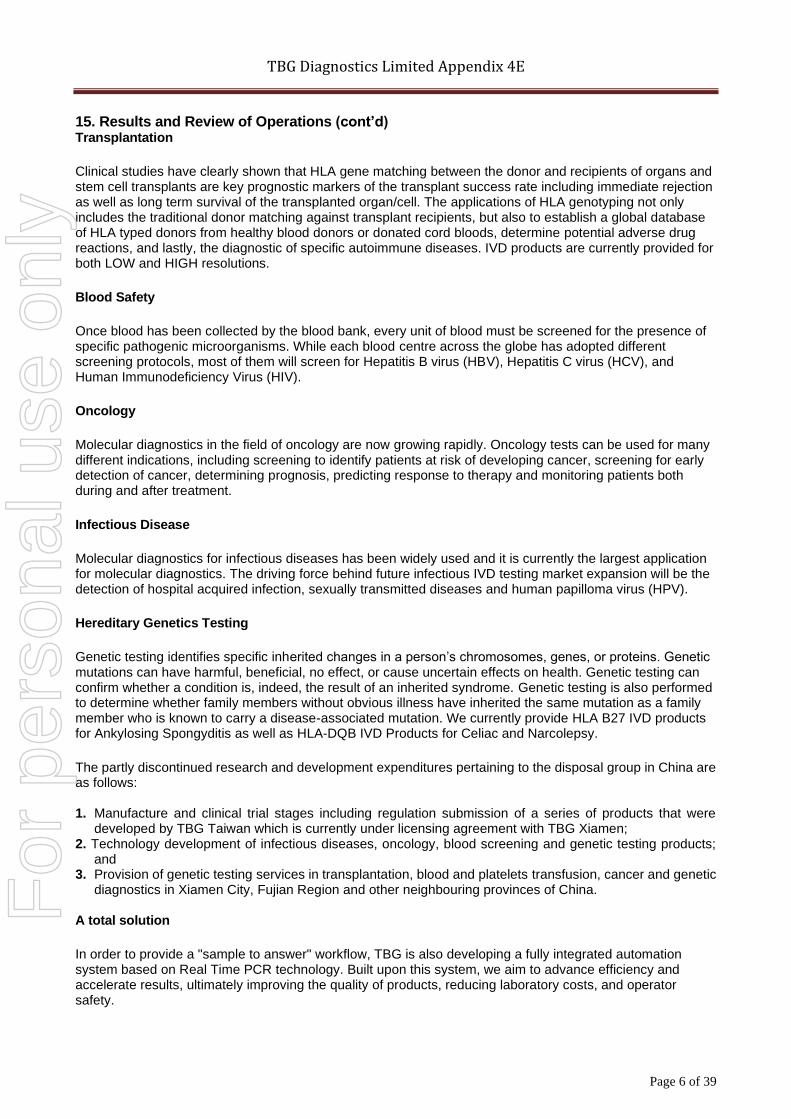
Management Discussion and Analysis Revenue and Other Income Total revenues earned during the year increased 6.1% to $3,345,592 in 31 December 2019 (2018: $3,152,830). Being the only vendor with a CFDA approved SBT products in China, the Groups’ SBT products for high resolution HLA testing is gaining popularity throughout the China region. Of the sales revenue from customers, 13% (2018: 30%) represent sales to its parent entity, Medigen. Other income decreased 18.7% to $160,863 (2018: $197,967) mainly due to the impact of foreign exchange fluctuations.
12 months ended
12 months ended
31 Dec 2019 31 Dec 2018
% Change $ $
Revenue and other income
Sales revenue 7.6 3,066,839 2,848,954
Technical services revenue (8.3) 278,753 303,876
Interest and other income (18.7) 160,863 197,967
Total revenue and other income 4.6 3,506,455 3,350,797
Research and Development (R&D) Expenses Research and development expenditure decreased 1.6% to $2,060,896 (2018: $2,094,669) during the year ended 31 December 2019. In 2017, European CE-Mark certification was granted for the product ExProbeTM SE HLA ABCDRDQ (ExProbeTM) Typing Kit as well as regulatory approval in Taiwan. CFDA approval was also received for a portfolio of HLA genotyping kits in China. In 2018, TBG continuously focused on the development of molecular diagnostics in Immunogenetics. Based on multiple PCR technology, the Group is also developing products for infectious disease diagnostics. Of the twenty-four (24) products currently being developed, six (6) products in transfusion, immunity and infectious diseases have entered clinical trials and IVD approval processes. These stages of product development were continued to the current year. The group is also currently developing immune function related genetic marker, Killer Cell Inhibitor Receptor (KRI) to assess and monitor the efficacy of adoptive Natural Killer (NK) using multiple diagnostic platforms including SSP, real-time PCR, SBT and NGS. The primary activities of the R&D division during the year pertained to the development of various detection kits for various diseases which are as follows:
For
per
sona
l use
onl
y
TBG Diagnostics Limited Appendix 4E
Page 6 of 39
15. Results and Review of Operations (cont’d) Transplantation
Clinical studies have clearly shown that HLA gene matching between the donor and recipients of organs and stem cell transplants are key prognostic markers of the transplant success rate including immediate rejection as well as long term survival of the transplanted organ/cell. The applications of HLA genotyping not only includes the traditional donor matching against transplant recipients, but also to establish a global database of HLA typed donors from healthy blood donors or donated cord bloods, determine potential adverse drug reactions, and lastly, the diagnostic of specific autoimmune diseases. IVD products are currently provided for both LOW and HIGH resolutions.
Blood Safety
Once blood has been collected by the blood bank, every unit of blood must be screened for the presence of specific pathogenic microorganisms. While each blood centre across the globe has adopted different screening protocols, most of them will screen for Hepatitis B virus (HBV), Hepatitis C virus (HCV), and Human Immunodeficiency Virus (HIV).
Oncology
Molecular diagnostics in the field of oncology are now growing rapidly. Oncology tests can be used for many different indications, including screening to identify patients at risk of developing cancer, screening for early detection of cancer, determining prognosis, predicting response to therapy and monitoring patients both during and after treatment.
Infectious Disease
Molecular diagnostics for infectious diseases has been widely used and it is currently the largest application for molecular diagnostics. The driving force behind future infectious IVD testing market expansion will be the detection of hospital acquired infection, sexually transmitted diseases and human papilloma virus (HPV).
Hereditary Genetics Testing
Genetic testing identifies specific inherited changes in a person’s chromosomes, genes, or proteins. Genetic mutations can have harmful, beneficial, no effect, or cause uncertain effects on health. Genetic testing can confirm whether a condition is, indeed, the result of an inherited syndrome. Genetic testing is also performed to determine whether family members without obvious illness have inherited the same mutation as a family member who is known to carry a disease-associated mutation. We currently provide HLA B27 IVD products for Ankylosing Spongyditis as well as HLA-DQB IVD Products for Celiac and Narcolepsy.
The partly discontinued research and development expenditures pertaining to the disposal group in China are as follows: 1. Manufacture and clinical trial stages including regulation submission of a series of products that were
developed by TBG Taiwan which is currently under licensing agreement with TBG Xiamen; 2. Technology development of infectious diseases, oncology, blood screening and genetic testing products;
and 3. Provision of genetic testing services in transplantation, blood and platelets transfusion, cancer and genetic
diagnostics in Xiamen City, Fujian Region and other neighbouring provinces of China.
A total solution
In order to provide a "sample to answer" workflow, TBG is also developing a fully integrated automation system based on Real Time PCR technology. Built upon this system, we aim to advance efficiency and accelerate results, ultimately improving the quality of products, reducing laboratory costs, and operator safety.
For
per
sona
l use
onl
y
TBG Diagnostics Limited Appendix 4E
Page 7 of 39
15. Results and Review of Operations (cont’d) Selling expenses Selling expenses decreased 28.5% to $688,417 (2018: $962,233). During the year ended 31 December 2019, the group focused on marketing campaigns and exhibitions on a smaller scale in Asia following the disposal of TBG Xiamen. TBG Xiamen group is responsible for marketing campaigns in the whole of China, its country of jurisdiction. Administrative and Corporate Expenses Administrative and corporate expenses decreased 22.1% to $1,920,531 (2018: $2,463,839). During 2018, impairment loss attributable to the goodwill allocated to TBG Taiwan was recognised in full. Furthermore, Mr Eugene Cheng, the Group’s Chief Operating Officer/Non-executive Director resigned during the year resulting to savings in employee costs. This was in spite of increased audit and management consultancy fees relating to the disposal groups. Gain / (Loss) on Discontinued Operations Gain on discontinued operations significantly increased to $11,842,126 (2018: $1,861,793 loss). During the year, the Group completed the disposal of its subsidiaries in China, TBG Xiamen and its subsidiaries, resulting to a gain of $5,843,126. Concurrently, during the same period, income of $5,999,000 was recognised relating to the full settlement of the deferred receivable relating to the PG500 assets that were sold in 2016. The proposed disposal of TBG Xiamen operations was announced on 17 December 2018, where loss on discontinued operations of $2,072,282 was recognised in 2018 financial year end. In addition to prior year, income of $210,489 was recognised pertaining to the early settlement of the deferred consideration from the sale of PharmaSynth Pty Ltd. Refer to note 4 for further details. Impairment loss At 31 December 2019, impairment loss of $6,382,287 was recognised which mainly pertains to the equity accounted investment in TBG Xiamen as the recoverable amount is estimated to be significantly lower than its carrying amount. Liquidity and Cash Resources The Group ended the financial year with cash and cash equivalents totalling $5,205,131 compared with $6,734,791 at 31 December 2018. In May 2019, the Company received a total of $1.9 million from Zucero Therapeutics Pty Ltd as the full and final settlement of the receivable from the sale of PG500 assets (note 4 (iii)). Cash and cash equivalents at 31 December 2019 were represented by a mix of highly liquid interest bearing investments with maturities of up to 90 days and deposits on call. Cash Flows Cash of $2,323,704 was disbursed during the year to fund consolidated net operating activities, compared to $2,726,902 in 2018. The decrease was mainly due to decreased trade collections more than the disbursements. Bulk of expenditures pertained to oncology costs relating to current products and products under new development of the research and development activities in Taiwan. Cash outflows from investing activities amounted to $729,875 (2018: $450,113 inflow). During the year, the Group completed the disposal of TBG Xiamen resulting to cash outflows of $327,534. Following its disposal, the Group increased the investment in TBG Xiamen by investing additional cash of $2.1 million (US$ 1.430 million) through participation in rights issue; thus, the investment interest was maintained at 46.65%.
For
per
sona
l use
onl
y
TBG Diagnostics Limited Appendix 4E
Page 8 of 39
15. Results and Review of Operations (cont’d) Capital expenditures of $271,157 was also used for the purchase of testing and machinery equipment in Taiwan and $184,595 was paid for operating leases. During the year, the Group entered into a short-term bank loan of $952,140 to finance its short-term operations. This loan is payable within the next six months. Funding Requirements At 31 December 2019, the Group has total outstanding commitments of $233,222 (2018: $1,793,677) pertaining to the Group’s operating lease commitments. Prior year commitments include $455,403 pertaining to the Group’s operating lease commitments and $1,338,274 pertaining to technical support services of the disposed subsidiaries in China. In addition, the Group expects to incur substantial future expenditure in light of its research and development programs, manufacturing facility expansion and sales growth plans. At present, TBG is undertaking to continue product development and the manufacture of its wide range of molecular diagnostics products and an integrated automated clinical system. Prior to full product launches, TBG needs to secure clinical trials and obtain regulatory approvals of its internally developed products and build its competitive advantage to achieve its growth plans. Significant cash requirements are required to achieve these objectives. Future cash requirements will depend on a number of factors, including the scope and results of nonclinical studies and clinical trials, continued progress of research and development programs, the company’s out-licensing activities, the ability to generate positive cash flow from the molecular diagnostics (MDx) business, the ability to generate revenues from the commercialisation of drug development efforts and the availability of other funding. The Company estimates that the current cash and cash equivalents are sufficient to fund its on-going operations for at least 37 months from the date of this report. This excludes capital requirements outside of normal operating activities. In light of the continuing merger and acquisition strategies, the Group is also looking further at various funding arrangements to finance any potential acquisition requirements, and to expand its cash reserves and capital resources.
Significant Changes in the State of Affairs Completion of the acquisition of Changsha Chang-Ye Medical Laboratory On 3 May 2019, TBG Diagnostics Ltd (the ‘Group’ or the ‘Company’) announced that it has completed the acquisition of Changsha ChangYe Medical Laboratory Corp. (“ChangYe”) through its subsidiary TBG Biotechnology Xiamen (“TBG Xiamen”) in accordance with the terms announced to ASX on 17 December 2018. After completion of the transactions, the Company currently holds 46.65% of the equity in TBG Xiamen and TBG Xiamen holds 100% of the equity in ChangYe, such that the Company indirectly holds an interest of 46.65% in ChangYe. TBG Xiamen was incorporated in 2014 to address the government requirements of Haicang, China, for foreign entities operating genetic testing businesses in the Xiamen region of China and carries on a business of research and development and manufacturing molecular diagnostic kits and instruments. ChangYe is a company incorporated in China which conducts a business of providing medical laboratory testing services to hospitals and the community, and which is based in the city of Changsha in Hunan Province. As part of the agreement, DongYuan Huaxin (Beijing) Capital Management Co Ltd (“DongYuan”), one of the parties in the agreement, provided capital investment of $2,252,252 (CNY 10,680,000) into TBG Xiamen. DongYuan, a private equity firm incorporated in China, is a consulting and advisory company which aims to strategically grow the reach of many of the businesses it invests in, including by leveraging off its relationships in China and Asia Pacific to expand its portfolio companies’ capabilities.
For
per
sona
l use
onl
y
TBG Diagnostics Limited Appendix 4E
Page 9 of 39
15. Results and Review of Operations (cont’d) Significant Changes in the State of Affairs (cont’d) Completion of the acquisition of Changsha Chang-Ye Medical Laboratory (cont’d) The acquisition allows the Company to draw on the capabilities and resources of ChangYe and Dongyuan in order to develop synergies between each of the businesses of ChangYe and Dongyuan and the TBG Xiamen Business, and to expand the TBG Xiamen Business further within the China and Asia Pacific markets. Refer to note 11 for further details of the investment in associates accounted for under the equity method. Settlement of the deferred consideration for the Sale of PG500 Assets
As announced on 22 August 2016, the Company entered into a binding agreement to sell the PG500 assets to Zucero Therapeutics Ltd (‘Zucero’) for a total deferred consideration of $6,000,000 payable in August 2019. The Company has negotiated the right to be able to convert the deferred consideration into equity such that the Company will hold 20% of the total issued share capital of Zucero, under certain specific circumstances. In order to secure payment of the deferred consideration and protect the Company’s interests, the parties have entered into security interest agreements and a guarantee.
On 23 February 2017, a Deed of Variation was executed whereby the Company gave the buyer, Zucero, a right to make an early payment of the deferred payment, subject to occurrence of a $4,000,000 capital raising event. This allows the buyer to pay the deferred payment by way of a $1,999,000 cash payment and $4,000,000 in Zucero shares. This right had to be exercised before 31 December 2017 or the original agreement is enforceable. This did not occur during the period.
On 7 May 2018, the Company accepted and signed an agreement deed with Zucero Therapeutics whereby the Company granted irrevocable rights to Zucero to satisfy the deferred payment prior to 31 December 2018, the conversion end date, by converting the Convertible Deferred Payment portion of $4 million into QF Shares, subject to the buyer completing a qualified Financing Event and other relevant conditions; and pay the seller the Cash Deferred Payment portion of $1,999,000. This did not occur during the period, however, further extension of the Conversion End Date to 31 March 2019 was approved on 21 February 2019. On 3 May 2019, the Company announced that it has entered into a Deed of Settlement for the full settlement of the $5,999,000 deferred consideration whereby the Company received cash settlement of $1,999,000 and 10,000,000 preference shares in Zucero at an issue price of $0.40 per share with a total value of $4,000,000. Following the issuance of the preference shares, the Company currently holds 7.89% in the capital of Zucero. Changes to board of directors On 1 February 2019, Mr Eugene Cheng resigned as Group Chief Operating Officer but remained in his capacity as non-executive director of the group until his subsequent resignation on 28 May 2019.
Significant Events after the Reporting Date
ChangYe approved as designated testing lab for Coronavirus
On 27 February 2020, the Group announced that Changsha ChangYe Medical Laboratory Corp. (ChangYe), a subsidiary of TBG Biotechnology Xiamen (“TBG Xiamen”) which the Company have invested in, has been approved by the Health Competent Authority of the Province of Hunan (China) as a designated testing lab for 2019-nCov among other labs. As a designated lab, currently considerable samples from all over Hunan Province have been sent to ZhangYe Medical Laboratories for analysis service, mainly from hospitals and corporate clients whose employees have to be screened.
For
per
sona
l use
onl
y

TBG Diagnostics Limited Appendix 4E
Page 10 of 39
16. Outlook and Prospects for 2020 The likely developments in the year ahead include: (i) Providing solutions for transplantation, blood screening, infectious disease detection, monitoring of
hereditary genetic disease and cancer therapeutics; (ii) Continue to look for opportunities for expansion of the Group’s core technology through merger and
acquisition; (iii) Proactively increase presence in the larger Asian market through licensing, partnerships and
collaborations; and (iv) On-going provision of necessary assistance to associates in China in promoting TBG products.
For
per
sona
l use
onl
y
TBG Diagnostics Limited Appendix 4E
Page 11 of 39
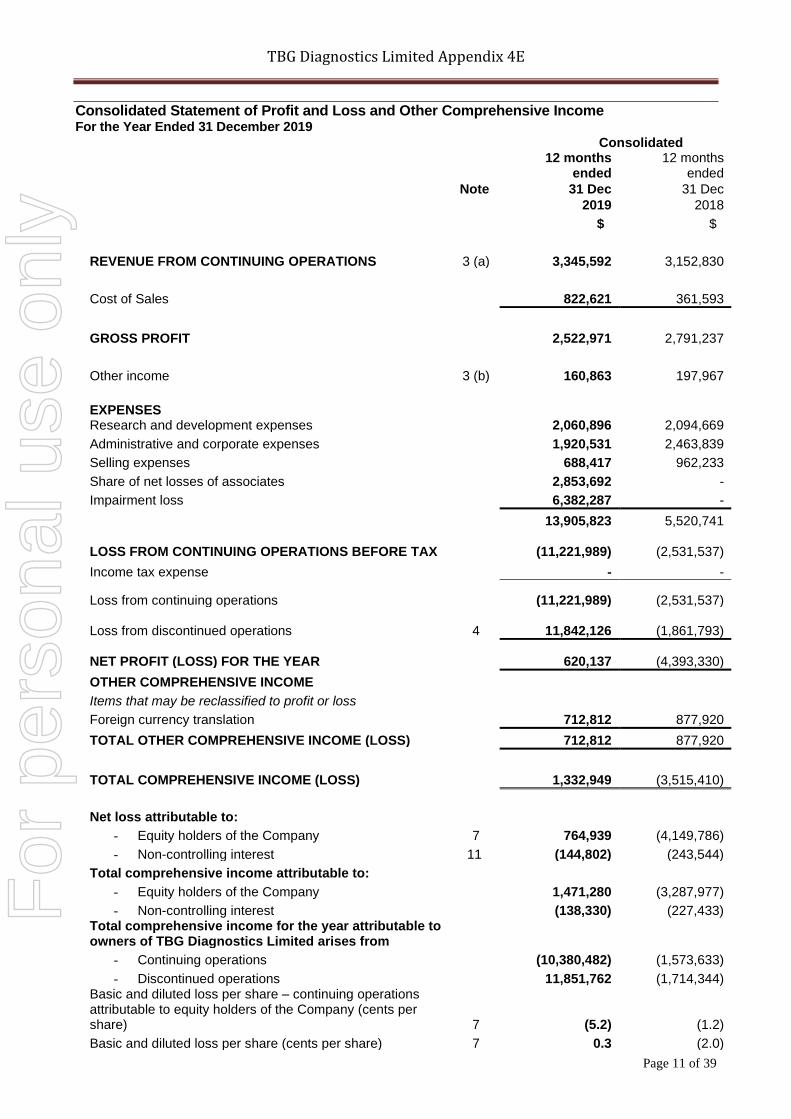
Consolidated Statement of Profit and Loss and Other Comprehensive Income For the Year Ended 31 December 2019
Consolidated
12 months
ended 12 months
ended
Note 31 Dec 31 Dec
2019 2018
$ $
REVENUE FROM CONTINUING OPERATIONS 3 (a) 3,345,592 3,152,830
Cost of Sales 822,621 361,593
GROSS PROFIT 2,522,971 2,791,237
Other income 3 (b) 160,863 197,967
EXPENSES Research and development expenses 2,060,896 2,094,669
Administrative and corporate expenses 1,920,531 2,463,839
Selling expenses 688,417 962,233
Share of net losses of associates 2,853,692 -
Impairment loss 6,382,287 -
13,905,823 5,520,741 LOSS FROM CONTINUING OPERATIONS BEFORE TAX (11,221,989) (2,531,537)
Income tax expense - -
Loss from continuing operations
(11,221,989) (2,531,537)
Loss from discontinued operations 4 11,842,126 (1,861,793)
NET PROFIT (LOSS) FOR THE YEAR
620,137 (4,393,330)
OTHER COMPREHENSIVE INCOME
Items that may be reclassified to profit or loss
Foreign currency translation 712,812 877,920
TOTAL OTHER COMPREHENSIVE INCOME (LOSS) 712,812 877,920
TOTAL COMPREHENSIVE INCOME (LOSS) 1,332,949 (3,515,410)
Net loss attributable to:
- Equity holders of the Company 7 764,939 (4,149,786)
- Non-controlling interest 11 (144,802) (243,544)
Total comprehensive income attributable to:
- Equity holders of the Company 1,471,280 (3,287,977)
- Non-controlling interest (138,330) (227,433) Total comprehensive income for the year attributable to owners of TBG Diagnostics Limited arises from
- Continuing operations (10,380,482) (1,573,633)
- Discontinued operations 11,851,762 (1,714,344) Basic and diluted loss per share – continuing operations attributable to equity holders of the Company (cents per share) 7 (5.2) (1.2)
Basic and diluted loss per share (cents per share) 7 0.3 (2.0)
For
per
sona
l use
onl
y
TBG Diagnostics Limited Appendix 4E
Page 12 of 39
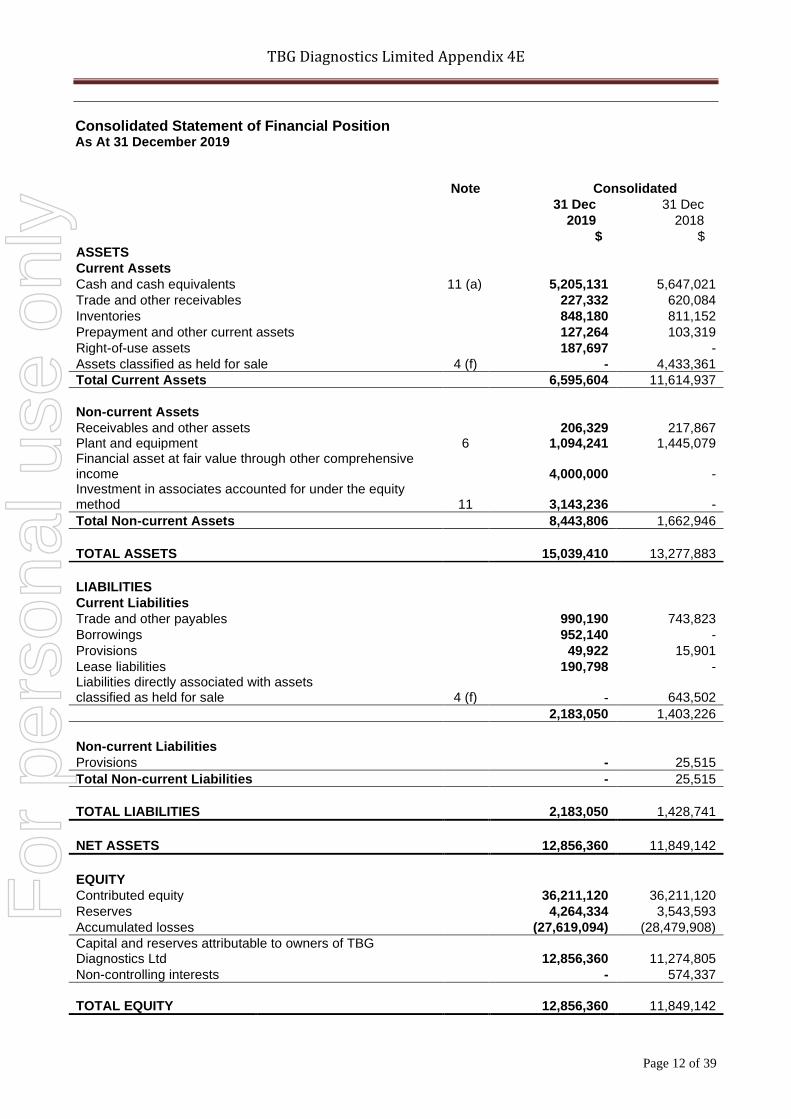
Consolidated Statement of Financial Position As At 31 December 2019
Note Consolidated
31 Dec 31 Dec
2019 2018
$ $
ASSETS
Current Assets
Cash and cash equivalents 11 (a) 5,205,131 5,647,021
Trade and other receivables 227,332 620,084
Inventories 848,180 811,152
Prepayment and other current assets 127,264 103,319
Right-of-use assets 187,697 -
Assets classified as held for sale 4 (f) - 4,433,361
Total Current Assets 6,595,604 11,614,937
Non-current Assets
Receivables and other assets 206,329 217,867 Plant and equipment 6 1,094,241 1,445,079 Financial asset at fair value through other comprehensive income 4,000,000 - Investment in associates accounted for under the equity method 11 3,143,236 -
Total Non-current Assets 8,443,806 1,662,946
TOTAL ASSETS 15,039,410 13,277,883
LIABILITIES
Current Liabilities
Trade and other payables 990,190 743,823
Borrowings 952,140 -
Provisions 49,922 15,901
Lease liabilities 190,798 - Liabilities directly associated with assets classified as held for sale 4 (f) - 643,502
2,183,050 1,403,226
Non-current Liabilities
Provisions - 25,515
Total Non-current Liabilities - 25,515
TOTAL LIABILITIES 2,183,050 1,428,741
NET ASSETS 12,856,360 11,849,142
EQUITY
Contributed equity 36,211,120 36,211,120
Reserves 4,264,334 3,543,593
Accumulated losses (27,619,094) (28,479,908)
Capital and reserves attributable to owners of TBG Diagnostics Ltd 12,856,360 11,274,805
Non-controlling interests - 574,337
TOTAL EQUITY 12,856,360 11,849,142
For
per
sona
l use
onl
y
TBG Diagnostics Limited Appendix 4E
Page 13 of 39
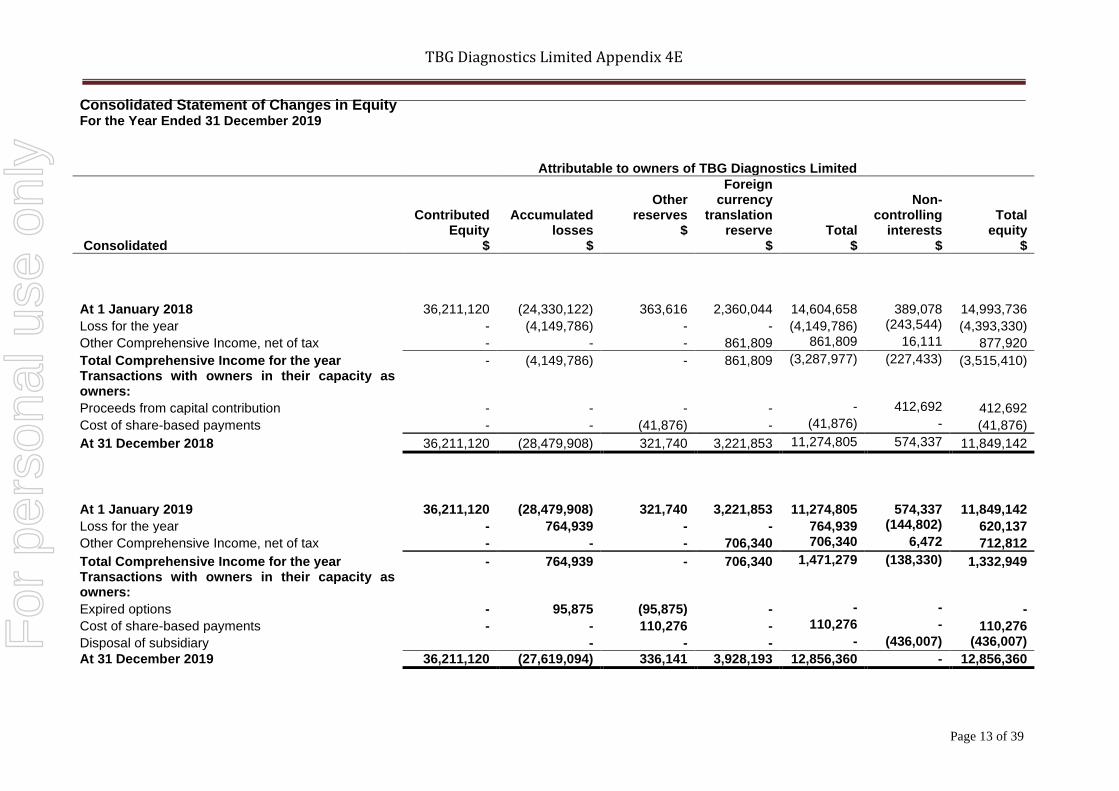
Consolidated Statement of Changes in Equity For the Year Ended 31 December 2019
Attributable to owners of TBG Diagnostics Limited
Consolidated
Contributed Equity
$
Accumulated losses
$
Other
reserves $
Foreign currency
translation reserve
$
Total $
Non-
controlling interests
$
Total
equity $
At 1 January 2018 36,211,120 (24,330,122) 363,616 2,360,044
14,604,658
389,078 14,993,736
Loss for the year - (4,149,786) - - (4,149,786) (243,544) (4,393,330)
Other Comprehensive Income, net of tax - - - 861,809 861,809 16,111 877,920
Total Comprehensive Income for the year - (4,149,786) - 861,809 (3,287,977) (227,433) (3,515,410) Transactions with owners in their capacity as owners:
Proceeds from capital contribution - - - - - 412,692 412,692
Cost of share-based payments - - (41,876) - (41,876) - (41,876)
At 31 December 2018 36,211,120 (28,479,908) 321,740 3,221,853 11,274,805 574,337 11,849,142
At 1 January 2019 36,211,120 (28,479,908) 321,740 3,221,853
11,274,805
574,337 11,849,142
Loss for the year - 764,939 - - 764,939 (144,802) 620,137
Other Comprehensive Income, net of tax - - - 706,340 706,340 6,472 712,812
Total Comprehensive Income for the year - 764,939 - 706,340 1,471,279 (138,330) 1,332,949 Transactions with owners in their capacity as owners:
Expired options - 95,875 (95,875) - - - -
Cost of share-based payments - - 110,276 - 110,276 - 110,276
Disposal of subsidiary - - - - (436,007) (436,007)
At 31 December 2019 36,211,120 (27,619,094) 336,141 3,928,193 12,856,360 - 12,856,360
For
per
sona
l use
onl
y
TBG Diagnostics Limited Appendix 4E
Page 14 of 39
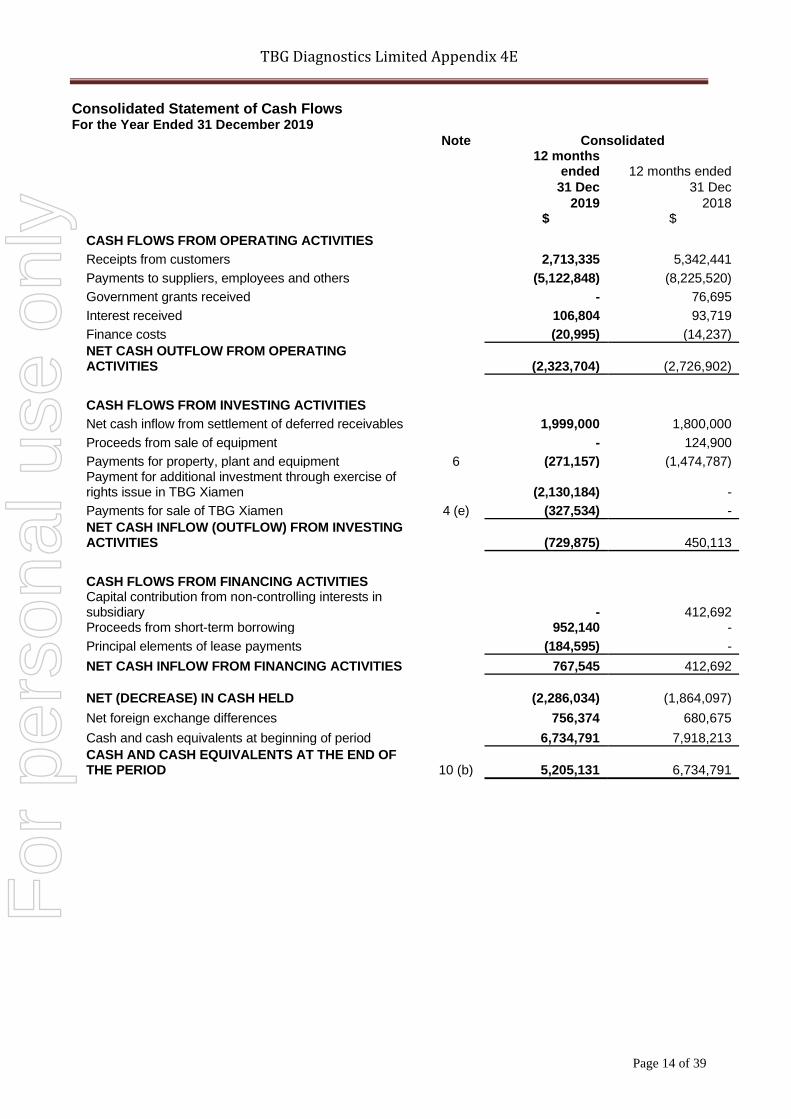
Consolidated Statement of Cash Flows For the Year Ended 31 December 2019
Note Consolidated
12 months
ended 12 months ended
31 Dec 31 Dec
2019 2018 $ $
CASH FLOWS FROM OPERATING ACTIVITIES
Receipts from customers 2,713,335 5,342,441
Payments to suppliers, employees and others (5,122,848) (8,225,520)
Government grants received - 76,695
Interest received 106,804 93,719
Finance costs (20,995) (14,237)
NET CASH OUTFLOW FROM OPERATING ACTIVITIES
(2,323,704) (2,726,902)
CASH FLOWS FROM INVESTING ACTIVITIES
Net cash inflow from settlement of deferred receivables 1,999,000 1,800,000
Proceeds from sale of equipment - 124,900
Payments for property, plant and equipment 6 (271,157) (1,474,787) Payment for additional investment through exercise of rights issue in TBG Xiamen (2,130,184) -
Payments for sale of TBG Xiamen 4 (e) (327,534) -
NET CASH INFLOW (OUTFLOW) FROM INVESTING ACTIVITIES
(729,875) 450,113
CASH FLOWS FROM FINANCING ACTIVITIES Capital contribution from non-controlling interests in subsidiary
- 412,692
Proceeds from short-term borrowing 952,140 -
Principal elements of lease payments (184,595) -
NET CASH INFLOW FROM FINANCING ACTIVITIES 767,545 412,692
NET (DECREASE) IN CASH HELD
(2,286,034) (1,864,097)
Net foreign exchange differences 756,374 680,675
Cash and cash equivalents at beginning of period 6,734,791 7,918,213
CASH AND CASH EQUIVALENTS AT THE END OF THE PERIOD
10 (b) 5,205,131 6,734,791
For
per
sona
l use
onl
y
TBG Diagnostics Limited Appendix 4E
Page 15 of 39
Notes to the financial statements NOTE 1 – SUMMARY OF SIGNIFICANT ACCOUNTING POLICIES
Basis of preparation This preliminary report is for TBG Diagnostics Limited (the ‘Company’) and its subsidiaries (the ‘Group’) for the year ended 31 December 2019. TBG Diagnostics Limited is a company limited by shares incorporated and domiciled in Australia whose shares are publicly traded on the Australian Securities Exchange (ASX) and the United States OTCQB Market. The nature of the operations and principal activities of the Group are described in Note 2. The preliminary report has been prepared on an accrual basis and is based on historical costs modified, where appropriate, by the revaluation of selected non-current assets, financial assets and financial liabilities for which the fair value basis of accounting has been applied. The preliminary report does not include all the notes of the type normally included in annual financial statements. Accordingly, this preliminary report should be read in conjunction with the annual financial statements for the year ended 31 December 2018 and any public announcements made by TBG Diagnostics Limited during the year in accordance with the continuous disclosure requirements of the Australian Securities Exchange and the Corporations Act 2001. Statement of compliance The consolidated financial statements of the Group also comply with International Financial Reporting Standards (IFRS) as issued by the International Accounting Standards Board (IASB). Summary of Significant Accounting Policies Historical cost convention The financial statements have been prepared on an accruals basis and are based on historical costs, modified, where applicable, by the measurement at fair value of selected non-current assets, financial assets and financial liabilities. New, revised or amending Accounting Standards and Interpretations adopted The Group has applied the following standards and amendments for the first time for their annual reporting period commencing 1 January 2019:
• AASB 16 Leases The impact of the adoption of these standards and the new accounting policies are disclosed below. The other standards did not have any impact on the group’s accounting policies and did not require retrospective adjustments.
For
per
sona
l use
onl
y
TBG Diagnostics Limited Appendix 4E
Page 16 of 39
NOTE 1 - SUMMARY OF SIGNIFICANT ACCOUNTING POLICIES (cont’d)
Basis of consolidation Subsidiaries are all entities (including structured entities) over which the Group has control. The Group controls an entity when the Group is exposed to, or has rights to, variable returns from its involvement with the entity and has the ability to affect those returns through its power to direct the activities of the entity. Subsidiaries are fully consolidated from the date on which control is transferred to the Group. They are deconsolidated from the date that control ceases. Intercompany transactions, balances and unrealised gains on transactions between Group companies are eliminated. Unrealised losses are also eliminated unless the transaction provides evidence of an impairment of the transferred asset. Accounting policies of subsidiaries have been changed where necessary to ensure consistency with the policies adopted by the Group. Non-controlling interests in the results and equity of subsidiaries are shown separately in the statement of profit or loss and other comprehensive income, statement of changes in equity and statement of financial position respectively. Investments in subsidiaries held by the Group are accounted for at cost in the separate financial statements of the parent entity. Business combinations and asset acquisitions The acquisition method of accounting is used to account for all business combinations regardless of whether equity instruments or other assets are acquired. Cost is measured as the fair value of the assets given, shares issued or liabilities incurred or assumed at the date of exchange. Where equity instruments are issued in a business combination, the fair value of the instruments is their published market price as at the date of exchange. Transaction costs arising on the issue of equity instruments are recognised directly in equity. All identifiable assets acquired and liabilities and contingent liabilities assumed in a business combination are measured initially at their fair values at the acquisition date. The excess of the cost of the business combination over the net fair value of the Group’s share of the identifiable net assets acquired is recognised as goodwill. If the cost of acquisition is less than the Group’s share of the net fair value of the identifiable net assets of the subsidiary, the difference is recognised as a gain in the statement of profit or loss and other comprehensive income, but only after a reassessment of the identification and measurement of the net assets acquired. Acquisitions of entities that do not meet the definition of a business contained in AASB 3 Business Combinations (IFRS 3) are not accounted for as business combinations. In such cases the Group identifies and recognises the individual identifiable assets acquired (including those assets that meet the definition of, and recognition criteria for, intangible assets in AASB 138 Intangible Assets (IAS 38) and liabilities assumed. The cost of the group of net assets is then allocated to the individual identifiable assets and liabilities on the basis of their relative fair values at the date of purchase. Such a transaction or event does not give rise to goodwill. Investment in Associates Associates are all entities over which the group has significant influence but not control or joint control. This is generally the case where the group holds between 20% and 50% of the voting rights. Investments in associates are accounted for using the equity method of accounting after initially being recognised at cost. Under the equity method of accounting, the investments are initially recognised at cost and adjusted thereafter to recognise the group’s share of the post-acquisition profits or losses of the investee in profit or loss, and the group’s share of movements in other comprehensive income of the investee in other comprehensive income. Dividends received or receivable from associates and joint ventures are recognised as a reduction in the carrying amount of the investment. When the group’s share of losses in an equity-accounted investment equals or exceeds its interest in the entity, including any other unsecured long-term receivables, the group does not recognise further losses, unless it has incurred obligations or made payments on behalf of the other entity.
For
per
sona
l use
onl
y
TBG Diagnostics Limited Appendix 4E
Page 17 of 39
NOTE 1 - SUMMARY OF SIGNIFICANT ACCOUNTING POLICIES (cont’d)
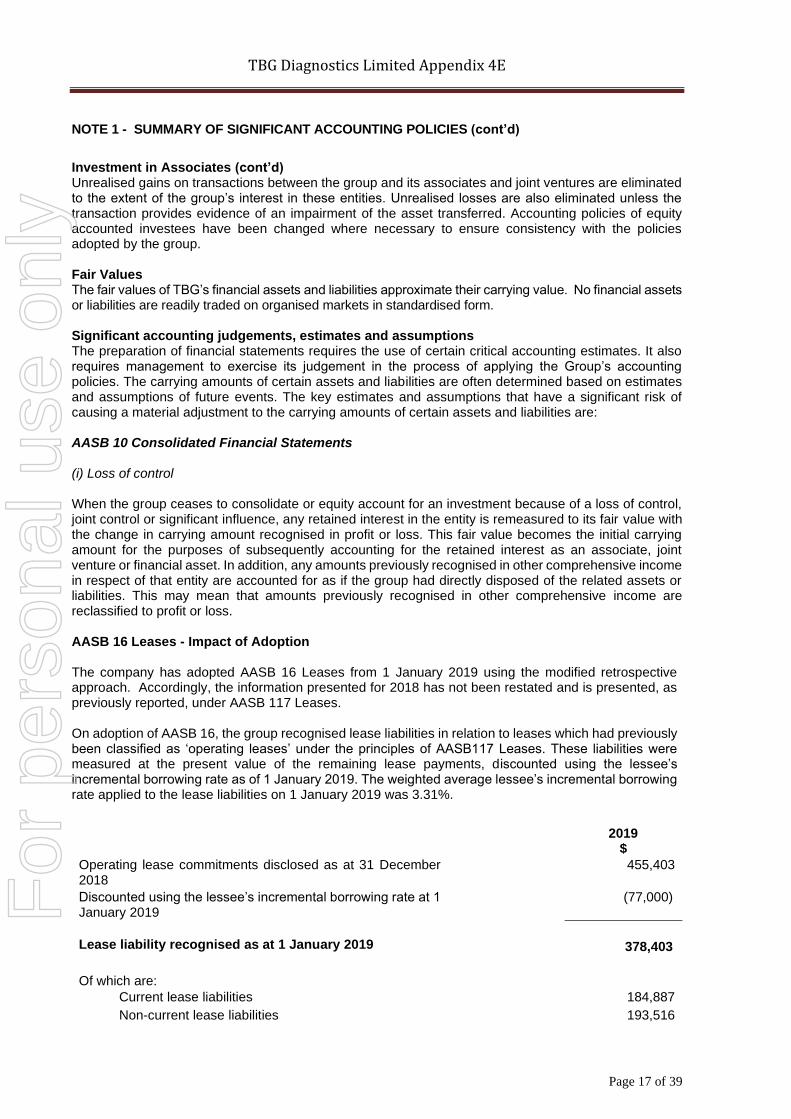
Investment in Associates (cont’d) Unrealised gains on transactions between the group and its associates and joint ventures are eliminated to the extent of the group’s interest in these entities. Unrealised losses are also eliminated unless the transaction provides evidence of an impairment of the asset transferred. Accounting policies of equity accounted investees have been changed where necessary to ensure consistency with the policies adopted by the group. Fair Values The fair values of TBG’s financial assets and liabilities approximate their carrying value. No financial assets or liabilities are readily traded on organised markets in standardised form. Significant accounting judgements, estimates and assumptions The preparation of financial statements requires the use of certain critical accounting estimates. It also requires management to exercise its judgement in the process of applying the Group’s accounting policies. The carrying amounts of certain assets and liabilities are often determined based on estimates and assumptions of future events. The key estimates and assumptions that have a significant risk of causing a material adjustment to the carrying amounts of certain assets and liabilities are: AASB 10 Consolidated Financial Statements (i) Loss of control When the group ceases to consolidate or equity account for an investment because of a loss of control, joint control or significant influence, any retained interest in the entity is remeasured to its fair value with the change in carrying amount recognised in profit or loss. This fair value becomes the initial carrying amount for the purposes of subsequently accounting for the retained interest as an associate, joint venture or financial asset. In addition, any amounts previously recognised in other comprehensive income in respect of that entity are accounted for as if the group had directly disposed of the related assets or liabilities. This may mean that amounts previously recognised in other comprehensive income are reclassified to profit or loss. AASB 16 Leases - Impact of Adoption The company has adopted AASB 16 Leases from 1 January 2019 using the modified retrospective approach. Accordingly, the information presented for 2018 has not been restated and is presented, as previously reported, under AASB 117 Leases. On adoption of AASB 16, the group recognised lease liabilities in relation to leases which had previously been classified as ‘operating leases’ under the principles of AASB117 Leases. These liabilities were measured at the present value of the remaining lease payments, discounted using the lessee’s incremental borrowing rate as of 1 January 2019. The weighted average lessee’s incremental borrowing rate applied to the lease liabilities on 1 January 2019 was 3.31%.
2019 $
Operating lease commitments disclosed as at 31 December 2018
455,403
Discounted using the lessee’s incremental borrowing rate at 1 January 2019
(77,000)
Lease liability recognised as at 1 January 2019
378,403
Of which are:
Current lease liabilities 184,887
Non-current lease liabilities 193,516
For
per
sona
l use
onl
y
TBG Diagnostics Limited Appendix 4E
Page 18 of 39
NOTE 1 - SUMMARY OF SIGNIFICANT ACCOUNTING POLICIES (cont’d)
AASB 16 Leases - Impact of Adoption (cont’d) The associated right-of-use assets were measured at the amount equal to the lease liability, adjusted by the amount of any prepaid or accrued lease payments relating to that lease recognised in the Statement of financial position as at 31 December 2018. There were no onerous lease contracts that would have required an adjustment to the right-of-use assets at the date of initial application. The recognised right-of-use assets relate site leases.
The change in accounting policy affected the following items in the balance sheet on 1 January 2019:
• right-of-use assets – increase by $378,403.
• lease liabilities – increase by $378,403. There was no impact on accumulated losses on 1 January 2019. In applying AASB 16 for the first time, the company used the following practical expedients permitted by the standard: the use of a single discount rate to a portfolio of leases with reasonably similar characteristics, reliance on previous assessments on whether leases are onerous, the accounting for operating leases with a remaining lease term of less than 12 months as at 1 January 2019 as short-term leases, the exclusion of initial direct costs for the measurement of the right-of-use asset at the date of initial application, and the use of hindsight in determining the lease term where the contract contains options to extend or terminate the lease. AASB 16 Leases - Accounting policies applied from 1 January 2019 All leases are accounted for by recognising a right-of-use asset and a lease liability except for:
• Leases of low value assets; and
• Leases with a duration of twelve months or less. Lease liabilities are measured at the present value of the contractual payments due to the lessor over the lease term, with the discount rate determined by reference to the rate inherent in the lease unless (as is typically the case) this is not readily determinable, in which case The Group’s incremental borrowing rate on commencement of the lease is used. Variable lease payments are only included in the measurement of the lease liability if they depend on an index or rate. In such cases, the initial measurement of the lease liability assumes the variable element will remain unchanged throughout the lease term. Other variable lease payments are expensed in the period to which they relate. On initial recognition, the carrying value of the lease liability also includes:
• Amounts expected to be payable under any residual value guarantee;
• The exercise price of any purchase option granted in favour of The Group if it is reasonable certain to assess that option;
• Any penalties payable for terminating the lease, if the term of the lease has been estimated on the basis of termination option being exercised.
Right-of-use assets are initially measured at the amount of the lease liability, reduced for any lease incentives received, and increased for:
• Lease payments made at or before commencement of the lease;
• Initial direct costs incurred; and
• The amount of any provision recognised where The Group is contractually required to dismantle, remove or restore the leased asset.
Subsequent to initial measurement lease liabilities increase as a result of interest charged at a constant rate on the balance outstanding and are reduced for lease payments made. Right-of-use assets are amortised on a straight-line basis over the remaining term of the lease or over the remaining economic life of the asset if, rarely, this is judged to be shorter than the lease term.
For
per
sona
l use
onl
y
TBG Diagnostics Limited Appendix 4E
Page 19 of 39
NOTE 1 - SUMMARY OF SIGNIFICANT ACCOUNTING POLICIES (cont’d)
AASB 16 Leases - Accounting policies applied from 1 January 2019 (cont’d) When the Group revises its estimate of the term of any lease (because, for example, it re-assesses the probability of a lessee extension or termination option being exercised), it adjusts the carrying amount of the lease liability to reflect the payments to make over the revised term, which are discounted at the same discount rate that applied on lease commencement. The carrying value of lease liabilities is similarly revised when the variable element of future lease payments dependent on a rate or index is revised. In both cases an equivalent adjustment is made to the carrying value of the right-of-use asset, with the revised carrying amount being amortised over the remaining (revised) lease term. AASB 15 Revenue from Contracts from Customers – Accounting policies (i) Sale of goods The Group manufactures and sells molecular diagnostics. Sales are recognised when control of the products has transferred, being when the products are delivered to the customer, the customer has full discretion over the channel and price to sell the products, and there is no unfulfilled obligation that could affect the wholesaler’s acceptance of the products. Delivery occurs when the products have been shipped to the specific location, the risks of obsolescence and loss have been transferred to the customer, and either the customer has accepted the products in accordance with the sales contract, the acceptance provisions have lapsed, or the group has objective evidence that all criteria for acceptance have been satisfied.
The molecular diagnostics products are sometimes sold with retrospective volume discounts based on aggregate sales over a fixed period. Revenue from these sales is recognised based on the price specified in the contract, net of the estimated volume discounts. Accumulated experience is used to estimate and provide for the discounts, using the expected value method, and revenue is only recognised to the extent that it is highly probable that a significant reversal will not occur. A refund liability (included in trade and other payables) is recognised for expected volume discounts payable to customers in relation to sales made until the end of the reporting period. No element of financing is deemed present as the sales are made with a credit term of 30 days, which is consistent with market practice. The group’s obligation to provide a refund for faulty products under the standard warranty terms is recognised as a provision. A receivable is recognised when the goods are delivered as this is the point in time that the consideration is unconditional because only the passage of time is required before the payment is due. (ii) Technical service revenue The Group provides technical services of HLA (Human Leukocyte Antigen) typing. Revenue from providing services is recognised in the accounting period in which the services are rendered. For fixed-price contracts, revenue is recognised based on the actual service provided to the end of the reporting period as a proportion of the total services to be provided. This is determined based on the actual labour hours spent relative to the total expected labour hours. Estimates of revenues, costs or extent of progress toward completion are revised if circumstances change. Any resulting increases or decreases in estimated revenues or costs are reflected in profit or loss in the period in which the circumstances that give rise to the revision become known by management. (iii) Interest income Revenue is recognised as interest accrues using the effective interest method. This is a method of calculating the amortised cost of a financial asset and allocating the interest income over the relevant period using the effective interest rate, which is the rate that exactly discounts estimated future cash receipts through the expected life of the financial asset to the net carrying amount of the financial asset. (iv) Financing components The group does not expect to have any contracts where the period between the transfer of the promised goods or services to the customer and payment by the customer exceeds one year. As a consequence, the group does not adjust any of the transaction prices for the time value of money.
For
per
sona
l use
onl
y
TBG Diagnostics Limited Appendix 4E
Page 20 of 39
NOTE 1 - SUMMARY OF SIGNIFICANT ACCOUNTING POLICIES (cont’d)
AASB 15 Revenue from Contracts from Customers – Accounting policies (cont’d) (v) Government grants Government grants are recognised as revenue when there is reasonable assurance that the grant will be received and all attaching conditions will be complied with. When grants ate received prior to being earned, they are recognised as a liability in the statement of financial position. When the grant relates to an expense item, it is recognised as income over the periods necessary to match the grant on a systematic basis to the costs that it is intended to compensate. Where the costs that correspond to the income received are prior year costs, the grant received is immediately recognised in the profit or loss. When the grant relates to an asset, the fair value is credited to a deferred income account and is released to the profit or loss and other comprehensive income over the expected useful life of the relevant asset by equal annual instalments. Leases The determination of whether an arrangement is or contains a lease is based on the substance of the arrangement and requires an assessment of whether the fulfilment of the arrangement is dependent on the use of a specific asset or assets and the arrangement conveys a right to use the asset. Operating lease payments are recognised as an expense in the profit or loss on a straight-line basis over the lease term. Lease incentives are recognised in the profit or loss as an integral part of the total lease expense. There are no finance leases. Cash and cash equivalents Cash and short-term deposits in the statement of financial position comprise cash at bank and in hand and short term deposits with an original maturity of three months or less. For the purposes of the statement of cash flows, cash and cash equivalents consist of cash and cash equivalents as defined above. Trade and other receivables Trade receivables, which generally have 30-90 day terms, are recognised and carried at original invoice amount less an allowance for any uncollectible amounts Trade receivables and contract assets The group applies the AASB 9 simplified approach to measuring expected credit losses which uses a lifetime expected loss allowance for all trade receivables and contract assets. To measure the expected credit losses, trade receivables and contract assets have been grouped based on shared credit risk characteristics and the days past due. The contract assets relate to unbilled work in progress and have substantially the same risk characteristics as the trade receivables for the same types of contracts. The group has therefore concluded that the expected loss rates for trade receivables are a reasonable approximation of the loss rates for the contract assets. Trade receivables and contract assets are written off when there is no reasonable expectation of recovery. Indicators that there is no reasonable expectation of recovery include, amongst others, the failure of a debtor to engage in a repayment plan with the group, and a failure to make contractual payments for a period of greater than 120 days past due.
For
per
sona
l use
onl
y
TBG Diagnostics Limited Appendix 4E
Page 21 of 39
NOTE 1 - SUMMARY OF SIGNIFICANT ACCOUNTING POLICIES (cont’d) AASB 9 Financial Instruments – Accounting policies (i) Investments and other financial assets Classification The group classifies its financial assets in the following measurement categories:
• those to be measured subsequently at fair value (either through OCI, or through profit or loss); and
• those to be measured at amortised cost. The classification depends on the entity’s business model for managing the financial assets and the contractual terms of the cash flows. For assets measured at fair value, gains and losses will either be recorded in profit or loss or OCI. For investments in equity instruments that are not held for trading, this will depend on whether the group has made an irrevocable election at the time of initial recognition to account for the equity investment at fair value through other comprehensive income (FVOCI). The group reclassifies debt investments when and only when its business model for managing those assets changes. Measurement At initial recognition, the group measures a financial asset at its fair value plus, in the case of a financial asset not at fair value through profit or loss (FVPL), transaction costs that are directly attributable to the acquisition of the financial asset. Transaction costs of financial assets carried at FVPL are expensed in profit or loss. Financial assets with embedded derivatives are considered in their entirety when determining whether their cash flows are solely payment of principal and interest. Debt instruments Subsequent measurement of debt instruments depends on the group’s business model for managing the asset and the cash flow characteristics of the asset. There are three measurement categories into which the group classifies its debt instruments:
• Amortised cost: Assets that are held for collection of contractual cash flows where those cash flows represent solely payments of principal and interest are measured at amortised cost. Interest income from these financial assets is included in finance income using the effective interest rate method. Any gain or loss arising on derecognition is recognised directly in profit or loss and presented in other gains/(losses), together with foreign exchange gains and losses. Impairment losses are presented as separate line item in the statement of profit or loss.
• FVOCI: Assets that are held for collection of contractual cash flows and for selling the financial assets, where the assets’ cash flows represent solely payments of principal and interest, are measured at FVOCI. Movements in the carrying amount are taken through OCI, except for the recognition of impairment gains or losses, interest revenue and foreign exchange gains and losses which are recognised in profit or loss. When the financial asset is derecognised, the cumulative gain or loss previously recognised in OCI is reclassified from equity to profit or loss and recognised in other gains/(losses). Interest income from these financial assets is included in finance income using the effective interest rate method. Foreign exchange gains and losses are presented in other gains/(losses) and impairment expenses are presented as separate line item in the statement of profit or loss.
FVPL: Assets that do not meet the criteria for amortised cost or FVOCI are measured at FVPL. Again or loss on a debt investment that is subsequently measured at FVPL is recognised in profit or loss and presented net within other gains/(losses) in the period in which it arises.
For
per
sona
l use
onl
y
TBG Diagnostics Limited Appendix 4E
Page 22 of 39
NOTE 1 - SUMMARY OF SIGNIFICANT ACCOUNTING POLICIES (cont’d) AASB 9 Financial Instruments – Accounting policies (cont’d) Impairment The group assesses on a forward looking basis the expected credit losses associated with its debt instruments carried at amortised cost and FVOCI. The impairment methodology applied depends on whether there has been a significant increase in credit risk. For trade receivables, the group applies the simplified approach permitted by AASB 9, which requires expected lifetime losses to be recognised from initial recognition of the receivables. Foreign currency translation (i) Functional and presentation currency Items included in the financial statements of each of the group’s entities are measured using the currency of the primary economic environment in which the entity operates (‘the functional currency’). The consolidated financial statements are presented in Australian dollars, which is TBG Diagnostics Limited’s presentation currency. TBG Inc.’s functional currency is in Taiwanese dollars converted to Australian dollars to conform to the group’s presentation currency. (ii) Transactions & balances Transactions in foreign currencies are initially recorded in the functional currency by applying the exchange rates ruling at the date of the transaction. Monetary assets and liabilities denominated in foreign currencies are retranslated at the rate of exchange ruling at the reporting date. (iii) Translation of Group Companies functional currency to presentation currency Non-monetary items that are measured in terms of historical cost in a foreign currency are translated using the exchange rate as at the date of the initial transaction. Non-monetary items measured at fair value in a foreign currency are translated using the exchange rates at the date when the fair value was determined. The results and financial position of foreign operations (none of which has the currency of a hyperinflationary economy) that have a functional currency different from the presentation currency are translated into the presentation currency as follows:
• Monetary assets and liabilities are translated at the spot rate of exchange at reporting date.
• income and expenses are translated at average exchange rates (unless this is not a reasonable
approximation of the cumulative effect of the rates prevailing on the transaction dates, in which
case income and expenses are translated at the dates of the transactions), and
• all resulting exchange differences are recognised in other comprehensive income.
On consolidation, exchange differences arising from the translation of any net investment in foreign entities, and of borrowings and other financial instruments designated as hedges of such investments, are recognised in other comprehensive income. When a foreign operation is sold or any borrowings forming part of the net investment are repaid, the associated exchange differences are reclassified to profit or loss, as part of the gain or loss on sale.
• Goodwill and fair value adjustments arising on the acquisition of a foreign operation are treated
as assets and liabilities of the foreign operation and translated at the closing rate.
• when the deferred income tax liability arises from the initial recognition of goodwill or an asset
or liability in a transaction that is not a business combination and that, at the time of the
transaction, affects neither the accounting profit or loss nor taxable profit or loss; or
For
per
sona
l use
onl
y
TBG Diagnostics Limited Appendix 4E
Page 23 of 39
NOTE 1 - SUMMARY OF SIGNIFICANT ACCOUNTING POLICIES (cont’d) (iii) Translation of Group Companies functional currency to presentation currency (cont’d)
• when the taxable temporary difference is associated with investments in subsidiaries, and the
timing or the reversal of the temporary difference can be controlled and it is probable that the
temporary difference will not reverse in the foreseeable future.
Income tax Current tax assets and liabilities for the current and prior periods are measured at the amount expected to be recovered from or paid to the taxation authorities. The tax rates and tax laws used to compute the amount are those that are enacted or substantively enacted by the reporting date. Deferred income tax is provided on all temporary differences at the reporting date between the tax bases of assets and liabilities and their carrying amounts for financial reporting purposes. Deferred income tax liabilities are recognised for all taxable temporary differences except:
• when the deferred income tax liability arises from the initial recognition of goodwill or an asset or liability in a transaction that is not a business combination and that, at the time of the transaction, affects neither the accounting profit or loss nor taxable profit or loss; or
• when the taxable temporary difference is associated with investments in subsidiaries, and the timing or the reversal of the temporary difference can be controlled and it is probable that the temporary difference will not reverse in the foreseeable future.
Deferred income tax assets are recognised for all deductible temporary differences, carry-forward of unused tax credits and unused tax losses, to the extent that it is probable that taxable profit will be available against which the deductible temporary differences and the carry-forward of unused tax credits and unused tax losses can be utilised, except:
• when the deferred income tax asset relating to the deductible temporary difference arises from the initial recognition of an asset or liability in a transaction that is not a business combination and, at the time of the transaction, affects neither the accounting profit nor taxable profit or loss; or
• when the deductible temporary difference is associated with investments in subsidiaries, in which case a deferred tax asset is only recognised to the extent that it is probable that the temporary difference will reverse in the foreseeable future and taxable profit will be available against which the temporary difference can be utilised.
The carrying amount of deferred income tax assets is reviewed at each reporting date and reduced to the extent that it is no longer probable that sufficient taxable profit will be available to allow all or part of the deferred income tax asset to be utilised. Unrecognised deferred income tax assets are reassessed at each reporting date and are recognised to the extent that it has become probable that future taxable profit will allow the deferred tax asset to be recovered. Deferred income tax assets and liabilities are measured at the tax rates that are expected to apply to the year when the asset is realised or the liability is settled, based on tax rates (and tax laws) that have been enacted or substantively enacted at the reporting date. Deferred tax assets and deferred tax liabilities are offset only if a legally enforceable right exists to set off current tax assets against current tax liabilities and the deferred tax assets and liabilities relate to the same taxable entity and the same taxation authority.
For
per
sona
l use
onl
y
TBG Diagnostics Limited Appendix 4E
Page 24 of 39
NOTE 1 - SUMMARY OF SIGNIFICANT ACCOUNTING POLICIES (cont’d) Other taxes Value Added Taxes (Including Goods and Services Tax) Revenues, expenses and assets are recognised net of the amount of Value Added Tax (VAT), except where the amount of VAT is not recoverable from the relevant tax authority. In these circumstances the VAT is recognised as part of the cost of acquisition of the asset or as part of the item as expense. Receivables and payables are stated with the amount of VAT included. The net amount of VAT recoverable from, or payable to, the relevant tax authority is included as a current asset or liability in the statement of financial position. Cash flows are included in the statement of cash flows on a gross basis. The VAT components of the cash flows arising from investing and financing activities which are recoverable from, or payable to, the relevant tax authority are classified as operating cash flows. Revenues, expenses and assets are recognised net of the amount of VAT except:
• when the VAT incurred on a purchase of goods and services is not recoverable from the taxation authority, in which case the VAT is recognised as part of the cost of acquisition of the asset or as part of the expense item as applicable; and
• receivables and payables, which are stated with the amount of VAT included. The net amount of VAT recoverable from, or payable to, the taxation authority is included as part of receivables or payables in the statement of financial position. Commitments and contingencies are disclosed net of the amount of VAT recoverable from, or payable to, the taxation authority. Inventories Inventories are stated at the lower of cost or net realisable value. Cost is determined using the weighted average method. The cost of finished goods and work in progress comprises raw materials, direct labour, other direct costs and related production overheads (allocated based on normal operating capacity). It excludes borrowing costs. The item by item approach is used in applying the lower of cost or net realisable value. Net realisable value is estimated selling price in the ordinary course of business, less the estimated cost of completion and applicable variable selling expenses. Non-current assets (or disposal groups) held for sale and discontinued operations - refer note 4 Non-current assets (or disposal groups) are classified as held for sale if their carrying amount will be recovered principally through a sale transaction rather than through continuing use and a sale is considered highly probable. They are measured at the lower of their carrying amount and fair value less costs to sell, except for assets such as deferred tax assets, assets arising from employee benefits, financial assets and investment property that are carried at fair value and contractual rights under insurance contracts, which are specifically exempt from this requirement. An impairment loss is recognised for any initial or subsequent write-down of the asset (or disposal group) to fair value less costs to sell. A gain is recognised for any subsequent increases in fair value less costs to sell of an asset (or disposal group), but not in excess of any cumulative impairment loss previously recognised. A gain or loss not previously recognised by the date of the sale of the non-current asset (or disposal group) is recognised at the date of derecognition. Non-current assets (including those that are part of a disposal group) are not depreciated or amortised while they are classified as held for sale. Interest and other expenses attributable to the liabilities of a disposal group classified as held for sale continue to be recognised. Non-current assets classified as held for sale and the assets of a disposal group classified as held for sale are presented separately from the other assets in the statement of financial position. The liabilities of a disposal group classified as held for sale are presented separately from other liabilities in the statement of financial position.
For
per
sona
l use
onl
y
TBG Diagnostics Limited Appendix 4E
Page 25 of 39
NOTE 1 - SUMMARY OF SIGNIFICANT ACCOUNTING POLICIES (cont’d) Non-current assets (or disposal groups) held for sale and discontinued operations - refer note 4 (cont’d) A discontinued operation is a component of the entity that has been disposed of or is classified as held for sale and that represents a separate major line of business or geographical area of operations, is part of a single co-ordinated plan to dispose of such a line of business or area of operations, or is a subsidiary acquired exclusively with a view to resale. The results of discontinued operations are presented separately in the statement of profit or loss and other comprehensive income. Plant and equipment Plant and equipment is stated at cost less accumulated depreciation and any accumulated impairment losses. Depreciation is calculated on a straight-line basis over the estimated useful life of the assets as follows: Machinery & office equipment 3 to 15 years Leasehold improvements Shorter of rental period and useful life Motor vehicles 4 to 5 years Testing equipment 3 to 5 years The assets' residual values, useful lives and amortisation methods are reviewed, and adjusted if appropriate, at each financial year end. (i) Impairment The carrying values of plant and equipment are reviewed for impairment at each reporting date, with recoverable amount being estimated when events or changes in circumstances indicate that the carrying value may be impaired. The recoverable amount of plant and equipment is the higher of fair value less costs to sell and value in use. In assessing value in use, the estimated future cash flows are discounted to their present value using a pre-tax discount rate that reflects current market assessments of the time value of money and the risks specific to the asset. For an asset that does not generate largely independent cash inflows, recoverable amount is determined for the cash-generating unit to which the asset belongs, unless the asset's value in use can be estimated to be close to its fair value. An impairment exists when the carrying value of an asset or cash-generating units exceeds its estimated recoverable amount. The asset or cash-generating unit is then written down to its recoverable amount. (ii) Derecognition and disposal An item of plant and equipment is derecognised upon disposal or when no further future economic benefits are expected from its use or disposal. Any gain or loss arising on derecognition of the asset (calculated as the difference between the net disposal proceeds and the carrying amount of the asset) is included in profit or loss in the year the asset is derecognised. Intangibles Research and development costs Research costs are expensed as incurred. An intangible asset arising from development expenditure on an internal project is recognised only when the Group can demonstrate the technical feasibility of completing the intangible asset so that it will be available for use or sale, its intention to complete and its ability to use or sell the asset, how the asset will generate future economic benefits, the availability or resources to complete the development and the ability to measure reliably the expenditure attributable to the intangible asset during its development. The expenditure capitalised comprises all directly attributable costs, including costs of materials, services, direct labour and an appropriate proportion of overheads.
For
per
sona
l use
onl
y
TBG Diagnostics Limited Appendix 4E
Page 26 of 39
NOTE 1 - SUMMARY OF SIGNIFICANT ACCOUNTING POLICIES (cont’d) Intangibles (cont’d) Research and development costs (cont’d) Other development expenditures that do not meet these criteria are recognised as an expense as incurred. Development costs previously recognised as an expense are not recognised as an asset in a subsequent period. Following the initial recognition of the development expenditure, the cost model is applied requiring the asset to be carried at cost less any accumulated amortisation and accumulated impairment losses. Any expenditure so capitalised is amortised over the period of expected benefit from the related project on a straight-line basis. Patents Patents acquired as part of a business combination are recognised separately from goodwill. The patents are carried at their fair value at the date of acquisition less accumulated amortisation and impairment losses. Amortisation is calculated based on the patent expiry dates on a straight-line basis. Goodwill Goodwill represents the excess of the cost of an acquisition over the fair value of the Group’s share of the net identifiable assets of the acquired subsidiary/business at the date of acquisition. Goodwill on acquisition is included in intangible assets. Goodwill is not amortised. Instead, goodwill is tested for impairment annually or more frequently if events or circumstances indicate that it might be impaired and is carried at cost less accumulated impairment losses. Goodwill is allocated to cash generating units for the purposes of impairment testing. The allocation is made to those cash generating units or groups of cash generating units that are expected to benefit from business combination in which goodwill arose, identified according to operating segments or components of operating assets. Trade and other payables Trade payables and other payables are carried at amortised cost and their fair value approximates their carrying value due to their short term nature. They represent liabilities for goods and services provided to the Group prior to the end of the financial year that are unpaid and arise when the Group becomes obliged to make future payments in respect of the purchase of these goods and services. Provisions Provisions are recognised when the Group has a present obligation (legal or constructive) as a result of a past event, it is probable that an outflow of resources embodying economic benefits will be required to settle the obligation and a reliable estimate can be made of the amount of the obligation. When the Group expects some or all of a provision to be reimbursed, for example under an insurance contract, the reimbursement is recognised as a separate asset but only when the reimbursement is virtually certain. The expense relating to any provision is presented in the statement of comprehensive income net of any reimbursement. If the effect of the time value of money is material, provisions are discounted using a current pre-tax rate that reflects the risks specific to the liability. When discounting is used, the increase in the provision due to the passage of time is recognised as a borrowing cost. Employee leave benefits (i) Wages, salaries, annual leave and sick leave Liabilities for wages and salaries, including non-monetary benefits expected to be settled within 12 months of the reporting date are recognised in other payables in respect of employees' services up to the reporting date. Annual leave accrued and expected to be settled within 12 months of the reporting date is recognised in current provisions. They are measured at the amounts expected to be paid when the liabilities are settled. Liabilities for non-accumulating sick leave are recognised when the leave is taken and are measured at the rates paid or payable.
For
per
sona
l use
onl
y
TBG Diagnostics Limited Appendix 4E
Page 27 of 39
NOTE 1 - SUMMARY OF SIGNIFICANT ACCOUNTING POLICIES (cont’d) Employee leave benefits (ii) Long service leave The liability for long service leave is recognised in the provision for employee benefits and measured as the present value of expected future payments to be made in respect of services provided by employees up to the reporting date using the projected unit credit method. Consideration is given to expected future wage and salary levels, experience of employee departures, and periods of service. Expected future payments are discounted using market yields at the reporting date on national corporate bonds with terms to maturity and currencies that match, as closely as possible, the estimated future cash outflows. Share-based payment transactions (i) Equity-settled transactions: The Group provides benefits to employees (including senior executives) and consultants of the Group in the form of share-based payments, whereby employees and consultants render services in exchange for shares or rights over shares (equity-settled transactions). The cost of these equity-settled transactions is measured by reference to the fair value of the equity instruments at the date at which they are granted. The fair value of rights over shares is determined using a binomial, other appropriate model. The fair value of shares is determined by the market value of the Group’s shares at grant date. In valuing equity-settled transactions, no account is taken of any performance conditions, other than conditions linked to the price of the shares of the Group (market conditions) if applicable. The cost of equity-settled transactions is recognised, together with a corresponding increase in equity, over the period in which the performance and/or service conditions are fulfilled, ending on the date on which the relevant employees become fully entitled to the award (the vesting period). The cumulative expense recognised for equity-settled transactions at each reporting date until vesting date reflects
(i) the extent to which the vesting period has expired; and (ii) the Group’s best estimate of the number of equity instruments that will ultimately vest.
No adjustment is made for the likelihood of market performance conditions being met as the effect of these conditions is included in the determination of fair value at grant date. The income charge or credit for a period represents the movement in cumulative expense recognised as at the beginning and end of that period. No expense is recognised for awards that do not ultimately vest, except for awards where vesting is only conditional upon a market condition. If the terms of an equity-settled award are modified, as a minimum an expense is recognised as if the terms had not been modified. In addition, an expense is recognised for any modification that increases the total fair value of the share-based payment arrangement, or is otherwise beneficial to the employee, as measured at the date of modification. If an equity-settled award is cancelled, it is treated as if it had vested on the date of cancellation, and any expense not yet recognised for the award is recognised immediately. However, if a new award is substituted for the cancelled award and designated as a replacement award on the date that it is granted, the cancelled and new award are treated as if they were a modification of the original award, as described in the previous paragraph. The dilutive effect, if any, of outstanding options is reflected as additional share dilution in the computation of earnings per share.
For
per
sona
l use
onl
y
TBG Diagnostics Limited Appendix 4E
Page 28 of 39
NOTE 1 - SUMMARY OF SIGNIFICANT ACCOUNTING POLICIES (cont’d) Contributed equity Ordinary shares are classified as equity. Incremental costs directly attributable to the issue of new shares or options are shown in equity as a deduction, net of tax, from the proceeds. Earnings per share Basic earnings per share is calculated as net profit attributable to members of the Group, adjusted to exclude any costs of servicing equity, divided by the weighted average number of ordinary shares, adjusted for any bonus element. Diluted earnings per share is calculated as net profit attributable to members of the Group, adjusted for:
• costs of servicing equity;
• the weighted average number of additional ordinary shares that would have been outstanding assuming the conversion of all dilutive potential ordinary shares;
• the after tax effect of dividends and interest associated with dilutive potential ordinary shares that have been recognised as expenses; and
• other non-discretionary changes in revenues or expenses during the period that would result from the dilution of potential ordinary shares divided by the weighted average number of ordinary shares and dilutive potential ordinary shares, adjusted for any bonus element.
Operating segments – refer note 2 Operating segments are reported in a manner consistent with the internal reporting provided to the chief operating decision maker. The chief operating decision maker is responsible for allocating resources and assessing performance of the operating segments, has been identified as the chief executive officer. NOTE 2 - OPERATING SEGMENTS The Company operates in the biotechnology industry. The Company’s activities comprise the research, development, and manufacture of biopharmaceuticals. The operating segments are identified by executive management (chief operating decision makers) based on the nature of the activity. Accordingly, management currently identifies the Company as having one reportable segment, the InVitro Diagnostics segment which is engaged with the research of biological drugs and the retail and wholesale of veterinary drugs with operations mainly in Taiwan and China. All revenue derived from continuing operations is from the InVitro Diagnostics segment and this is what has been reported in the financial statements. The legal parent is domiciled in Australia. The amount of its revenue from external customers in Australia is $nil (2018: nil). Segment revenues are allocated based on the country in which the customer is located. The legal parent is domiciled in Australia. The amount of its revenues from external customers in Australia is $nil (2018: $nil). Total revenues of $3,345,592 (2018: $3,152,830) were derived from Taiwan. Revenues of $2,235,468 (2018: $1,473,433) were derived from four regular customers in Taiwan composing 66.8% (2018: 46.7% from two regular customers) of total revenues for the group. Out of total revenues, $1,315,053 (2018: $954,586) was derived from related parties in Taiwan and in China. This revenue is attributable to the In Vitro Diagnostics segment. Intersegment transactions of $222,273 (2018: $743,962) were eliminated pertaining to revenues and costs within the group. Non-current assets located in Australia is $4,000,905 (2018: $2,981) and non-current assets located overseas is $4,442,901 (2018: $2,209,257) Segment assets are allocated to countries based on where the assets are located.
For
per
sona
l use
onl
y
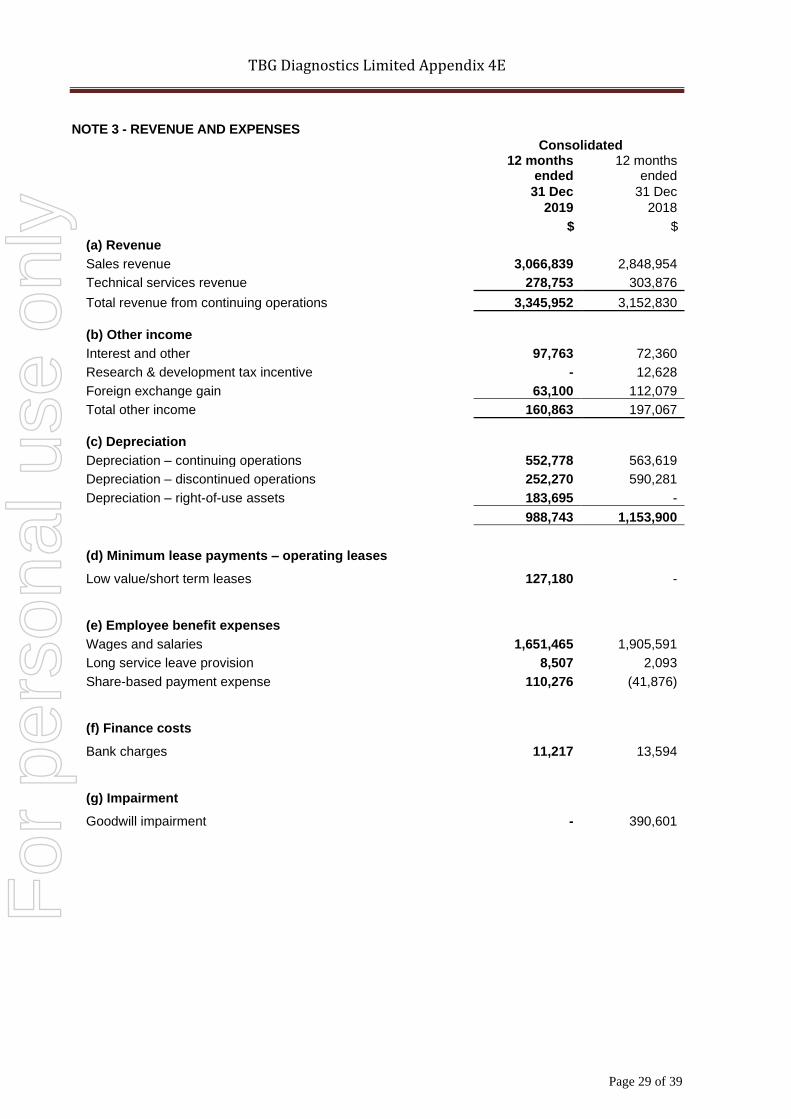
TBG Diagnostics Limited Appendix 4E
Page 29 of 39
NOTE 3 - REVENUE AND EXPENSES
Consolidated
12 months
ended 12 months
ended
31 Dec 31 Dec
2019 2018
$ $
(a) Revenue
Sales revenue 3,066,839 2,848,954
Technical services revenue 278,753 303,876
Total revenue from continuing operations 3,345,952 3,152,830
(b) Other income
Interest and other 97,763 72,360
Research & development tax incentive - 12,628
Foreign exchange gain 63,100 112,079
Total other income 160,863 197,067
(c) Depreciation
Depreciation – continuing operations 552,778 563,619
Depreciation – discontinued operations 252,270 590,281
Depreciation – right-of-use assets 183,695 -
988,743 1,153,900
(d) Minimum lease payments – operating leases
Low value/short term leases 127,180 -
(e) Employee benefit expenses
Wages and salaries 1,651,465 1,905,591
Long service leave provision 8,507 2,093
Share-based payment expense 110,276 (41,876)
(f) Finance costs
Bank charges 11,217 13,594
(g) Impairment
Goodwill impairment - 390,601
For
per
sona
l use
onl
y
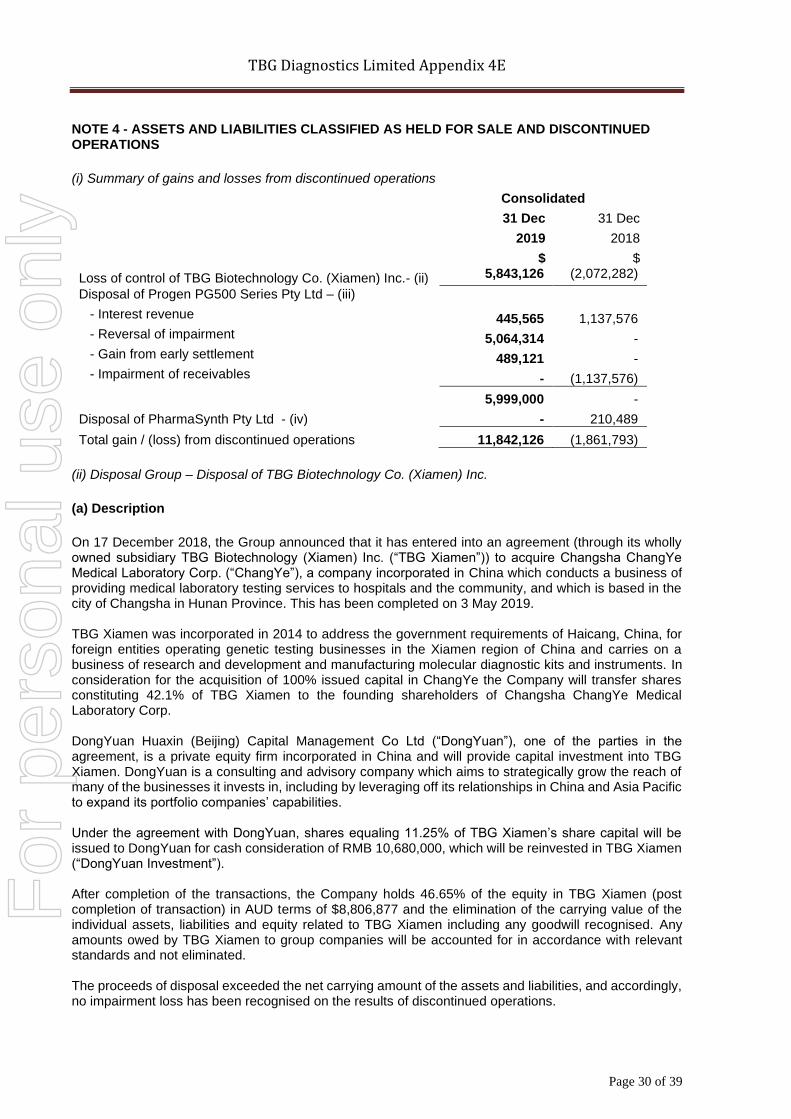
TBG Diagnostics Limited Appendix 4E
Page 30 of 39
NOTE 4 - ASSETS AND LIABILITIES CLASSIFIED AS HELD FOR SALE AND DISCONTINUED OPERATIONS
(i) Summary of gains and losses from discontinued operations
Consolidated
31 Dec 31 Dec
2019 2018
$ $
Loss of control of TBG Biotechnology Co. (Xiamen) Inc.- (ii) 5,843,126 (2,072,282)
Disposal of Progen PG500 Series Pty Ltd – (iii) - Interest revenue 445,565 1,137,576 - Reversal of impairment 5,064,314 - - Gain from early settlement 489,121 - - Impairment of receivables - (1,137,576)
5,999,000 -
Disposal of PharmaSynth Pty Ltd - (iv) - 210,489
Total gain / (loss) from discontinued operations 11,842,126 (1,861,793)
(ii) Disposal Group – Disposal of TBG Biotechnology Co. (Xiamen) Inc.
(a) Description
On 17 December 2018, the Group announced that it has entered into an agreement (through its wholly owned subsidiary TBG Biotechnology (Xiamen) Inc. (“TBG Xiamen”)) to acquire Changsha ChangYe Medical Laboratory Corp. (“ChangYe”), a company incorporated in China which conducts a business of providing medical laboratory testing services to hospitals and the community, and which is based in the city of Changsha in Hunan Province. This has been completed on 3 May 2019. TBG Xiamen was incorporated in 2014 to address the government requirements of Haicang, China, for foreign entities operating genetic testing businesses in the Xiamen region of China and carries on a business of research and development and manufacturing molecular diagnostic kits and instruments. In consideration for the acquisition of 100% issued capital in ChangYe the Company will transfer shares constituting 42.1% of TBG Xiamen to the founding shareholders of Changsha ChangYe Medical Laboratory Corp. DongYuan Huaxin (Beijing) Capital Management Co Ltd (“DongYuan”), one of the parties in the agreement, is a private equity firm incorporated in China and will provide capital investment into TBG Xiamen. DongYuan is a consulting and advisory company which aims to strategically grow the reach of many of the businesses it invests in, including by leveraging off its relationships in China and Asia Pacific to expand its portfolio companies’ capabilities. Under the agreement with DongYuan, shares equaling 11.25% of TBG Xiamen’s share capital will be issued to DongYuan for cash consideration of RMB 10,680,000, which will be reinvested in TBG Xiamen (“DongYuan Investment”). After completion of the transactions, the Company holds 46.65% of the equity in TBG Xiamen (post completion of transaction) in AUD terms of $8,806,877 and the elimination of the carrying value of the individual assets, liabilities and equity related to TBG Xiamen including any goodwill recognised. Any amounts owed by TBG Xiamen to group companies will be accounted for in accordance with relevant standards and not eliminated. The proceeds of disposal exceeded the net carrying amount of the assets and liabilities, and accordingly, no impairment loss has been recognised on the results of discontinued operations.
For
per
sona
l use
onl
y
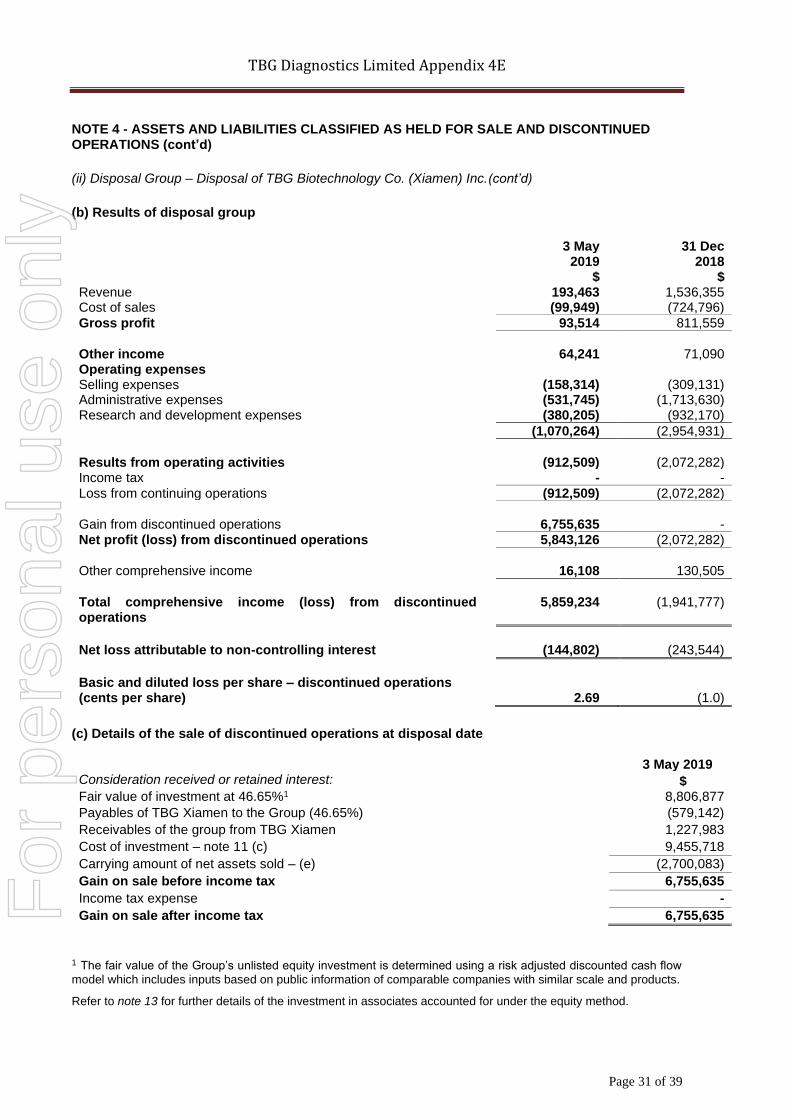
TBG Diagnostics Limited Appendix 4E
Page 31 of 39
NOTE 4 - ASSETS AND LIABILITIES CLASSIFIED AS HELD FOR SALE AND DISCONTINUED OPERATIONS (cont’d)
(ii) Disposal Group – Disposal of TBG Biotechnology Co. (Xiamen) Inc.(cont’d)
(b) Results of disposal group
3 May 31 Dec 2019 2018 $ $ Revenue 193,463 1,536,355 Cost of sales (99,949) (724,796)
Gross profit 93,514 811,559
Other income 64,241 71,090 Operating expenses Selling expenses (158,314) (309,131) Administrative expenses (531,745) (1,713,630) Research and development expenses (380,205) (932,170)
(1,070,264) (2,954,931)
Results from operating activities (912,509) (2,072,282) Income tax - -
Loss from continuing operations (912,509) (2,072,282)
Gain from discontinued operations 6,755,635 - Net profit (loss) from discontinued operations 5,843,126 (2,072,282)
Other comprehensive income 16,108 130,505
Total comprehensive income (loss) from discontinued operations
5,859,234 (1,941,777)
Net loss attributable to non-controlling interest (144,802) (243,544)
Basic and diluted loss per share – discontinued operations (cents per share)
2.69
(1.0)
(c) Details of the sale of discontinued operations at disposal date
3 May 2019 Consideration received or retained interest: $ Fair value of investment at 46.65%1 8,806,877
Payables of TBG Xiamen to the Group (46.65%) (579,142)
Receivables of the group from TBG Xiamen 1,227,983
Cost of investment – note 11 (c) 9,455,718
Carrying amount of net assets sold – (e) (2,700,083)
Gain on sale before income tax 6,755,635
Income tax expense -
Gain on sale after income tax 6,755,635
1 The fair value of the Group’s unlisted equity investment is determined using a risk adjusted discounted cash flow
model which includes inputs based on public information of comparable companies with similar scale and products.
Refer to note 13 for further details of the investment in associates accounted for under the equity method.
For
per
sona
l use
onl
y
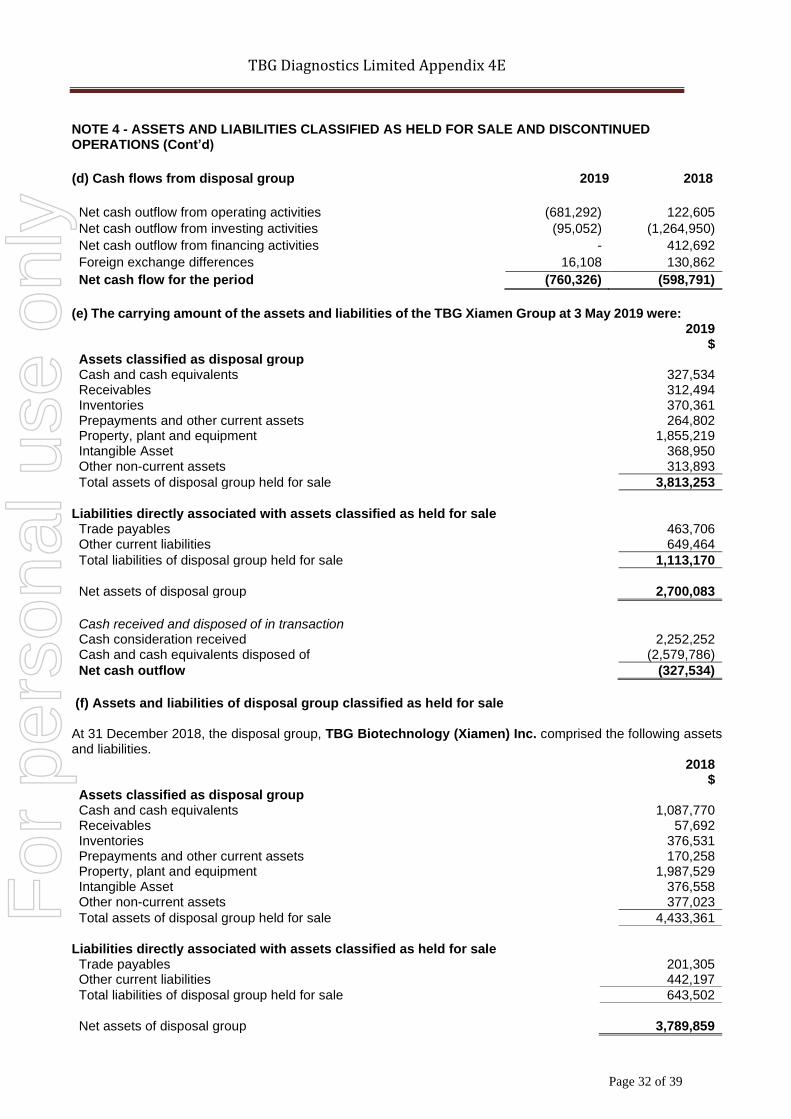
TBG Diagnostics Limited Appendix 4E
Page 32 of 39
NOTE 4 - ASSETS AND LIABILITIES CLASSIFIED AS HELD FOR SALE AND DISCONTINUED OPERATIONS (Cont’d)
(d) Cash flows from disposal group 2019 2018
Net cash outflow from operating activities (681,292) 122,605
Net cash outflow from investing activities (95,052) (1,264,950)
Net cash outflow from financing activities - 412,692
Foreign exchange differences 16,108 130,862
Net cash flow for the period (760,326) (598,791)
(e) The carrying amount of the assets and liabilities of the TBG Xiamen Group at 3 May 2019 were: 2019 $ Assets classified as disposal group Cash and cash equivalents 327,534 Receivables 312,494 Inventories 370,361 Prepayments and other current assets 264,802 Property, plant and equipment 1,855,219 Intangible Asset 368,950 Other non-current assets 313,893
Total assets of disposal group held for sale 3,813,253
Liabilities directly associated with assets classified as held for sale Trade payables 463,706 Other current liabilities 649,464
Total liabilities of disposal group held for sale 1,113,170
Net assets of disposal group 2,700,083
Cash received and disposed of in transaction
Cash consideration received 2,252,252 Cash and cash equivalents disposed of (2,579,786)
Net cash outflow (327,534)
(f) Assets and liabilities of disposal group classified as held for sale At 31 December 2018, the disposal group, TBG Biotechnology (Xiamen) Inc. comprised the following assets and liabilities. 2018 $ Assets classified as disposal group Cash and cash equivalents 1,087,770 Receivables 57,692 Inventories 376,531 Prepayments and other current assets 170,258 Property, plant and equipment 1,987,529 Intangible Asset 376,558 Other non-current assets 377,023
Total assets of disposal group held for sale 4,433,361
Liabilities directly associated with assets classified as held for sale Trade payables 201,305 Other current liabilities 442,197
Total liabilities of disposal group held for sale 643,502
Net assets of disposal group 3,789,859
For
per
sona
l use
onl
y
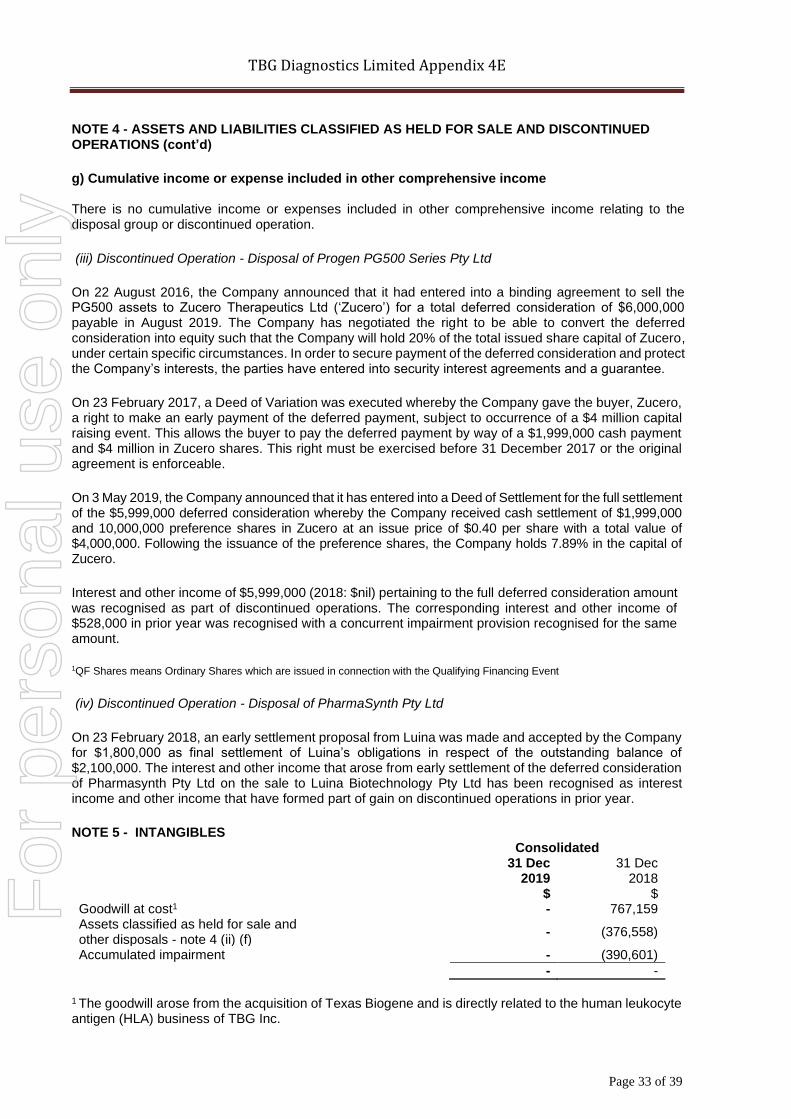
TBG Diagnostics Limited Appendix 4E
Page 33 of 39
NOTE 4 - ASSETS AND LIABILITIES CLASSIFIED AS HELD FOR SALE AND DISCONTINUED OPERATIONS (cont’d)
g) Cumulative income or expense included in other comprehensive income There is no cumulative income or expenses included in other comprehensive income relating to the disposal group or discontinued operation.
(iii) Discontinued Operation - Disposal of Progen PG500 Series Pty Ltd
On 22 August 2016, the Company announced that it had entered into a binding agreement to sell the PG500 assets to Zucero Therapeutics Ltd (‘Zucero’) for a total deferred consideration of $6,000,000 payable in August 2019. The Company has negotiated the right to be able to convert the deferred consideration into equity such that the Company will hold 20% of the total issued share capital of Zucero, under certain specific circumstances. In order to secure payment of the deferred consideration and protect the Company’s interests, the parties have entered into security interest agreements and a guarantee.
On 23 February 2017, a Deed of Variation was executed whereby the Company gave the buyer, Zucero, a right to make an early payment of the deferred payment, subject to occurrence of a $4 million capital raising event. This allows the buyer to pay the deferred payment by way of a $1,999,000 cash payment and $4 million in Zucero shares. This right must be exercised before 31 December 2017 or the original agreement is enforceable.
On 3 May 2019, the Company announced that it has entered into a Deed of Settlement for the full settlement of the $5,999,000 deferred consideration whereby the Company received cash settlement of $1,999,000 and 10,000,000 preference shares in Zucero at an issue price of $0.40 per share with a total value of $4,000,000. Following the issuance of the preference shares, the Company holds 7.89% in the capital of Zucero.
Interest and other income of $5,999,000 (2018: $nil) pertaining to the full deferred consideration amount was recognised as part of discontinued operations. The corresponding interest and other income of $528,000 in prior year was recognised with a concurrent impairment provision recognised for the same amount.
1QF Shares means Ordinary Shares which are issued in connection with the Qualifying Financing Event
(iv) Discontinued Operation - Disposal of PharmaSynth Pty Ltd
On 23 February 2018, an early settlement proposal from Luina was made and accepted by the Company for $1,800,000 as final settlement of Luina’s obligations in respect of the outstanding balance of $2,100,000. The interest and other income that arose from early settlement of the deferred consideration of Pharmasynth Pty Ltd on the sale to Luina Biotechnology Pty Ltd has been recognised as interest income and other income that have formed part of gain on discontinued operations in prior year.
NOTE 5 - INTANGIBLES Consolidated 31 Dec 31 Dec 2019 2018
$ $ Goodwill at cost1 - 767,159 Assets classified as held for sale and other disposals - note 4 (ii) (f)
- (376,558)
Accumulated impairment - (390,601)
- -
1 The goodwill arose from the acquisition of Texas Biogene and is directly related to the human leukocyte antigen (HLA) business of TBG Inc.
For
per
sona
l use
onl
y
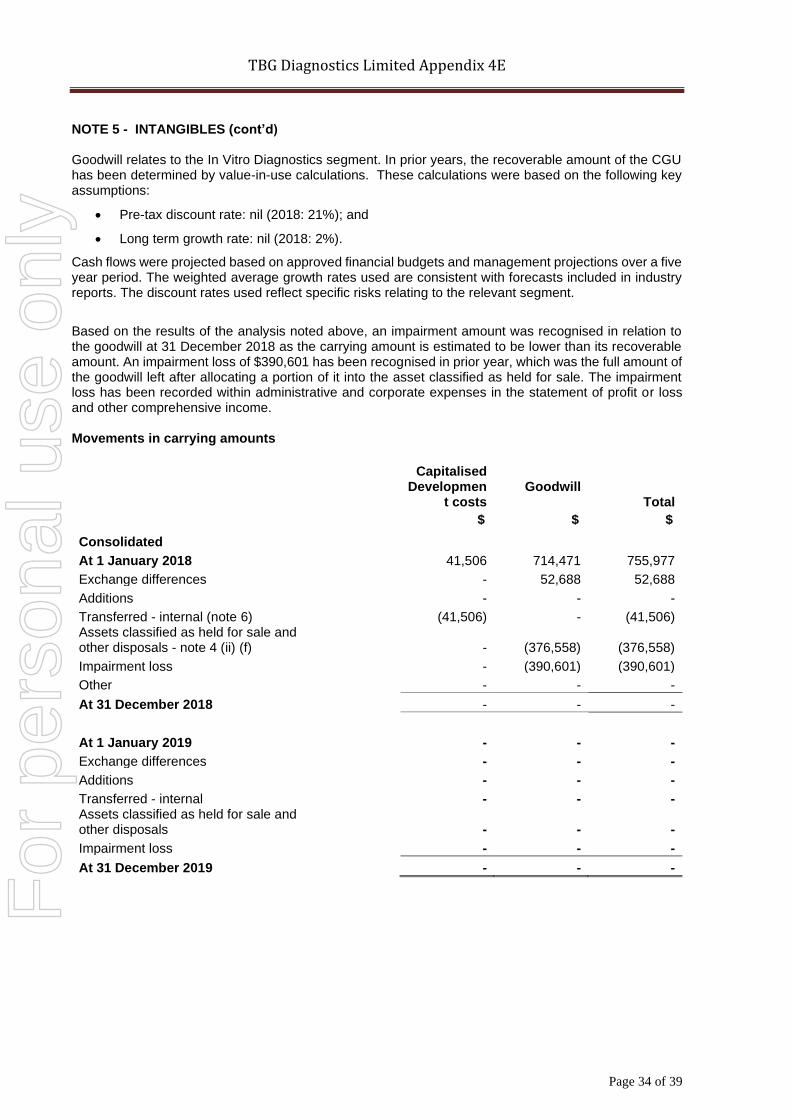
TBG Diagnostics Limited Appendix 4E
Page 34 of 39
NOTE 5 - INTANGIBLES (cont’d) Goodwill relates to the In Vitro Diagnostics segment. In prior years, the recoverable amount of the CGU has been determined by value-in-use calculations. These calculations were based on the following key assumptions:
• Pre-tax discount rate: nil (2018: 21%); and
• Long term growth rate: nil (2018: 2%).
Cash flows were projected based on approved financial budgets and management projections over a five year period. The weighted average growth rates used are consistent with forecasts included in industry reports. The discount rates used reflect specific risks relating to the relevant segment.
Based on the results of the analysis noted above, an impairment amount was recognised in relation to the goodwill at 31 December 2018 as the carrying amount is estimated to be lower than its recoverable amount. An impairment loss of $390,601 has been recognised in prior year, which was the full amount of the goodwill left after allocating a portion of it into the asset classified as held for sale. The impairment loss has been recorded within administrative and corporate expenses in the statement of profit or loss and other comprehensive income. Movements in carrying amounts
Capitalised
Development costs
Goodwill
Total
$ $ $
Consolidated
At 1 January 2018 41,506 714,471 755,977
Exchange differences - 52,688 52,688
Additions - - -
Transferred - internal (note 6) (41,506) - (41,506) Assets classified as held for sale and other disposals - note 4 (ii) (f) - (376,558) (376,558)
Impairment loss - (390,601) (390,601)
Other - - -
At 31 December 2018 - - -
At 1 January 2019 - - -
Exchange differences - - -
Additions - - -
Transferred - internal - - - Assets classified as held for sale and other disposals - - -
Impairment loss - - -
At 31 December 2019 - - -
F
or p
erso
nal u
se o
nly
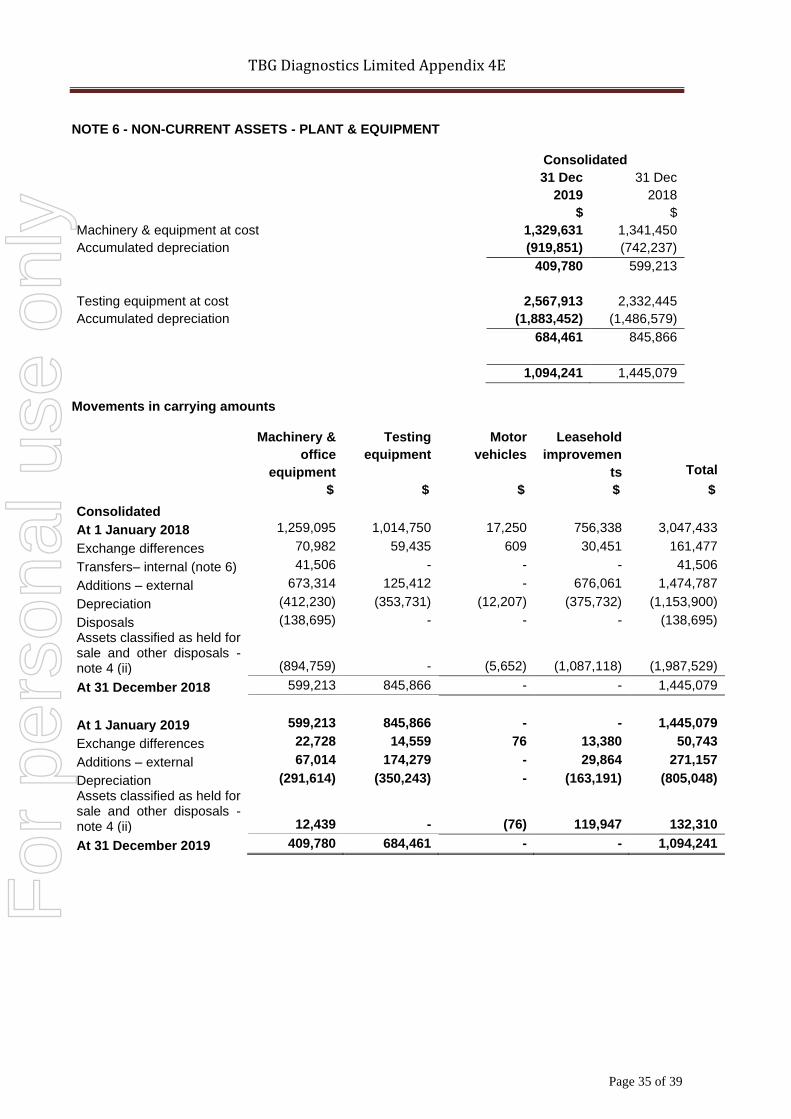
TBG Diagnostics Limited Appendix 4E
Page 35 of 39
NOTE 6 - NON-CURRENT ASSETS - PLANT & EQUIPMENT
Consolidated
31 Dec 31 Dec
2019 2018
$ $
Machinery & equipment at cost 1,329,631 1,341,450
Accumulated depreciation (919,851) (742,237)
409,780 599,213
Testing equipment at cost 2,567,913 2,332,445
Accumulated depreciation (1,883,452) (1,486,579)
684,461 845,866
1,094,241 1,445,079
Movements in carrying amounts
Machinery &
office
equipment
Testing
equipment
Motor
vehicles
Leasehold
improvemen
ts
Total
$ $ $ $ $
Consolidated
At 1 January 2018 1,259,095 1,014,750 17,250 756,338 3,047,433
Exchange differences 70,982 59,435 609 30,451 161,477
Transfers– internal (note 6) 41,506 - - - 41,506
Additions – external 673,314 125,412 - 676,061 1,474,787
Depreciation (412,230) (353,731) (12,207) (375,732) (1,153,900)
Disposals (138,695) - - - (138,695)
Assets classified as held for sale and other disposals - note 4 (ii) (894,759) - (5,652) (1,087,118) (1,987,529)
At 31 December 2018 599,213 845,866 - - 1,445,079
At 1 January 2019 599,213 845,866 - - 1,445,079
Exchange differences 22,728 14,559 76 13,380 50,743
Additions – external 67,014 174,279 - 29,864 271,157
Depreciation (291,614) (350,243) - (163,191) (805,048)
Assets classified as held for sale and other disposals -note 4 (ii) 12,439 - (76) 119,947 132,310
At 31 December 2019 409,780 684,461 - - 1,094,241
F
or p
erso
nal u
se o
nly
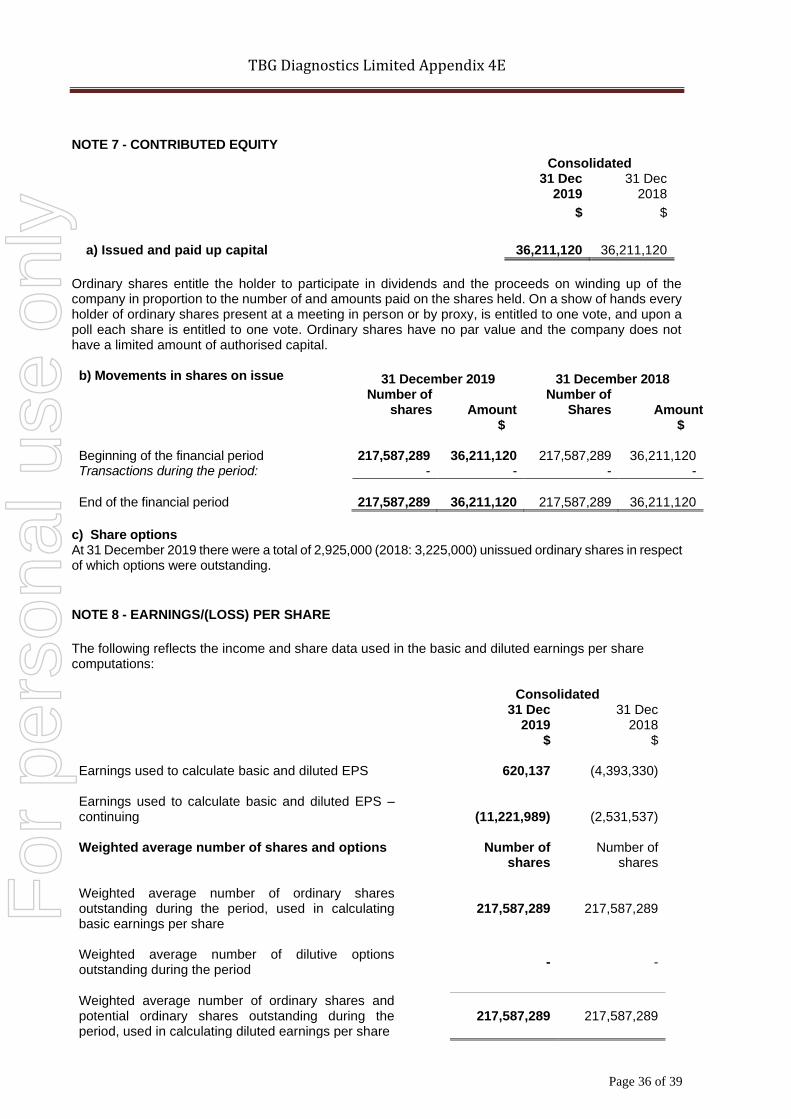
TBG Diagnostics Limited Appendix 4E
Page 36 of 39
NOTE 7 - CONTRIBUTED EQUITY
Consolidated
31 Dec
2019 31 Dec
2018
$ $
a) Issued and paid up capital 36,211,120 36,211,120
Ordinary shares entitle the holder to participate in dividends and the proceeds on winding up of the company in proportion to the number of and amounts paid on the shares held. On a show of hands every holder of ordinary shares present at a meeting in person or by proxy, is entitled to one vote, and upon a poll each share is entitled to one vote. Ordinary shares have no par value and the company does not have a limited amount of authorised capital. b) Movements in shares on issue 31 December 2019 31 December 2018
Number of shares
Amount
Number of Shares
Amount
$ $ Beginning of the financial period 217,587,289 36,211,120 217,587,289 36,211,120 Transactions during the period: - - - -
End of the financial period
217,587,289
36,211,120
217,587,289
36,211,120
c) Share options At 31 December 2019 there were a total of 2,925,000 (2018: 3,225,000) unissued ordinary shares in respect of which options were outstanding.
NOTE 8 - EARNINGS/(LOSS) PER SHARE
The following reflects the income and share data used in the basic and diluted earnings per share computations:
Consolidated 31 Dec 31 Dec 2019 2018 $ $
Earnings used to calculate basic and diluted EPS 620,137 (4,393,330) Earnings used to calculate basic and diluted EPS – continuing
(11,221,989) (2,531,537)
Weighted average number of shares and options
Number of
shares Number of
shares Weighted average number of ordinary shares outstanding during the period, used in calculating basic earnings per share
217,587,289 217,587,289
Weighted average number of dilutive options outstanding during the period
- -
Weighted average number of ordinary shares and potential ordinary shares outstanding during the period, used in calculating diluted earnings per share
217,587,289 217,587,289
For
per
sona
l use
onl
y
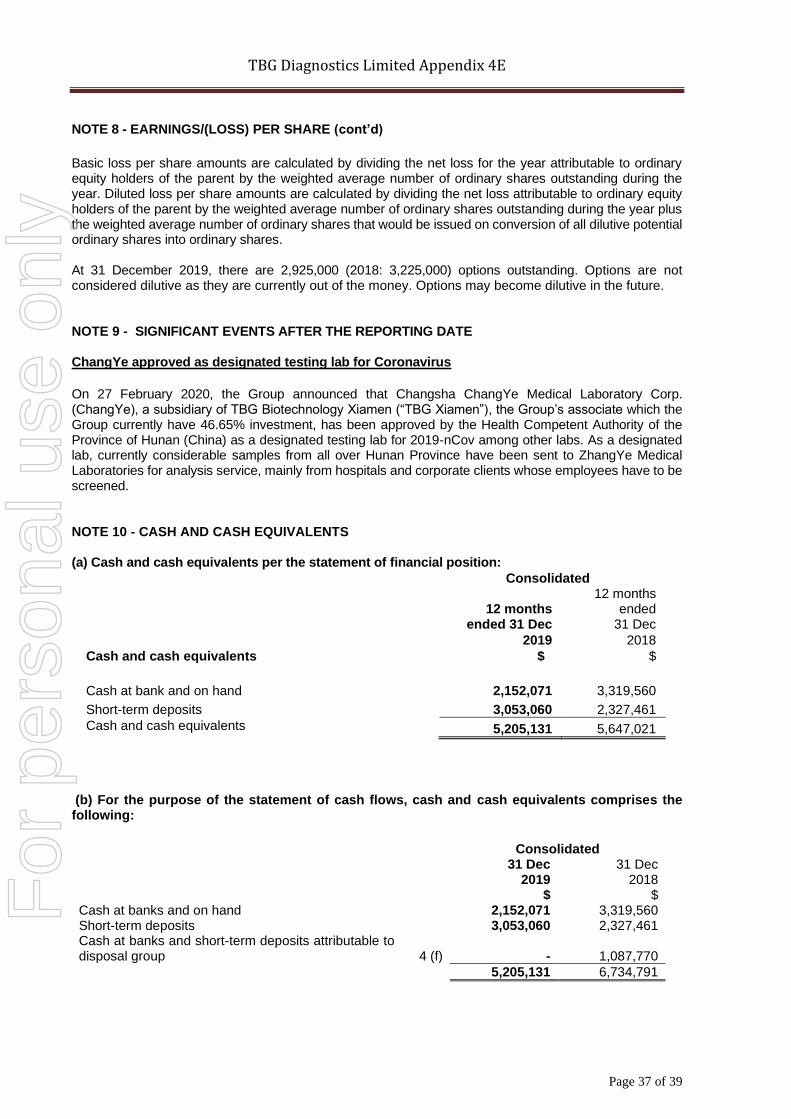
TBG Diagnostics Limited Appendix 4E
Page 37 of 39
NOTE 8 - EARNINGS/(LOSS) PER SHARE (cont’d)
Basic loss per share amounts are calculated by dividing the net loss for the year attributable to ordinary equity holders of the parent by the weighted average number of ordinary shares outstanding during the year. Diluted loss per share amounts are calculated by dividing the net loss attributable to ordinary equity holders of the parent by the weighted average number of ordinary shares outstanding during the year plus the weighted average number of ordinary shares that would be issued on conversion of all dilutive potential ordinary shares into ordinary shares. At 31 December 2019, there are 2,925,000 (2018: 3,225,000) options outstanding. Options are not considered dilutive as they are currently out of the money. Options may become dilutive in the future. NOTE 9 - SIGNIFICANT EVENTS AFTER THE REPORTING DATE ChangYe approved as designated testing lab for Coronavirus
On 27 February 2020, the Group announced that Changsha ChangYe Medical Laboratory Corp. (ChangYe), a subsidiary of TBG Biotechnology Xiamen (“TBG Xiamen”), the Group’s associate which the Group currently have 46.65% investment, has been approved by the Health Competent Authority of the Province of Hunan (China) as a designated testing lab for 2019-nCov among other labs. As a designated lab, currently considerable samples from all over Hunan Province have been sent to ZhangYe Medical Laboratories for analysis service, mainly from hospitals and corporate clients whose employees have to be screened. NOTE 10 - CASH AND CASH EQUIVALENTS (a) Cash and cash equivalents per the statement of financial position:
Consolidated
12 months
ended 31 Dec
12 months ended
31 Dec
2019 2018
Cash and cash equivalents $ $
Cash at bank and on hand 2,152,071 3,319,560
Short-term deposits 3,053,060 2,327,461
Cash and cash equivalents 5,205,131 5,647,021
(b) For the purpose of the statement of cash flows, cash and cash equivalents comprises the following:
Consolidated 31 Dec 31 Dec 2019 2018 $ $
Cash at banks and on hand 2,152,071 3,319,560 Short-term deposits 3,053,060 2,327,461 Cash at banks and short-term deposits attributable to disposal group
4 (f) - 1,087,770
5,205,131 6,734,791
For
per
sona
l use
onl
y
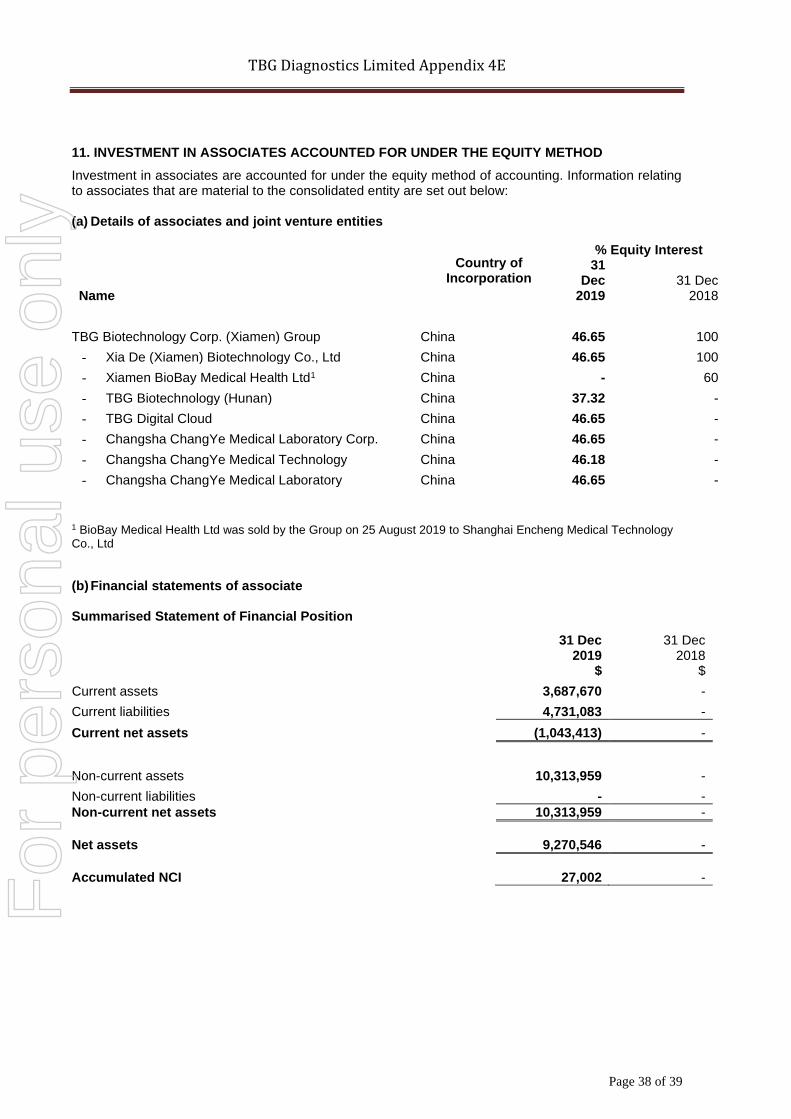
TBG Diagnostics Limited Appendix 4E
Page 38 of 39
11. INVESTMENT IN ASSOCIATES ACCOUNTED FOR UNDER THE EQUITY METHOD
Investment in associates are accounted for under the equity method of accounting. Information relating to associates that are material to the consolidated entity are set out below: (a) Details of associates and joint venture entities
1 BioBay Medical Health Ltd was sold by the Group on 25 August 2019 to Shanghai Encheng Medical Technology Co., Ltd
(b) Financial statements of associate Summarised Statement of Financial Position
Name
Country of Incorporation
% Equity Interest 31
Dec 2019
31 Dec 2018
TBG Biotechnology Corp. (Xiamen) Group China 46.65 100
- Xia De (Xiamen) Biotechnology Co., Ltd China 46.65 100
- Xiamen BioBay Medical Health Ltd1 China - 60
- TBG Biotechnology (Hunan) China 37.32 -
- TBG Digital Cloud China 46.65 -
- Changsha ChangYe Medical Laboratory Corp. China 46.65 -
- Changsha ChangYe Medical Technology China 46.18 -
- Changsha ChangYe Medical Laboratory China 46.65 -
31 Dec
2019 $
31 Dec 2018
$
Current assets 3,687,670 -
Current liabilities 4,731,083 -
Current net assets (1,043,413) -
Non-current assets 10,313,959 -
Non-current liabilities - -
Non-current net assets 10,313,959 -
Net assets 9,270,546 -
Accumulated NCI 27,002 - F
or p
erso
nal u
se o
nly
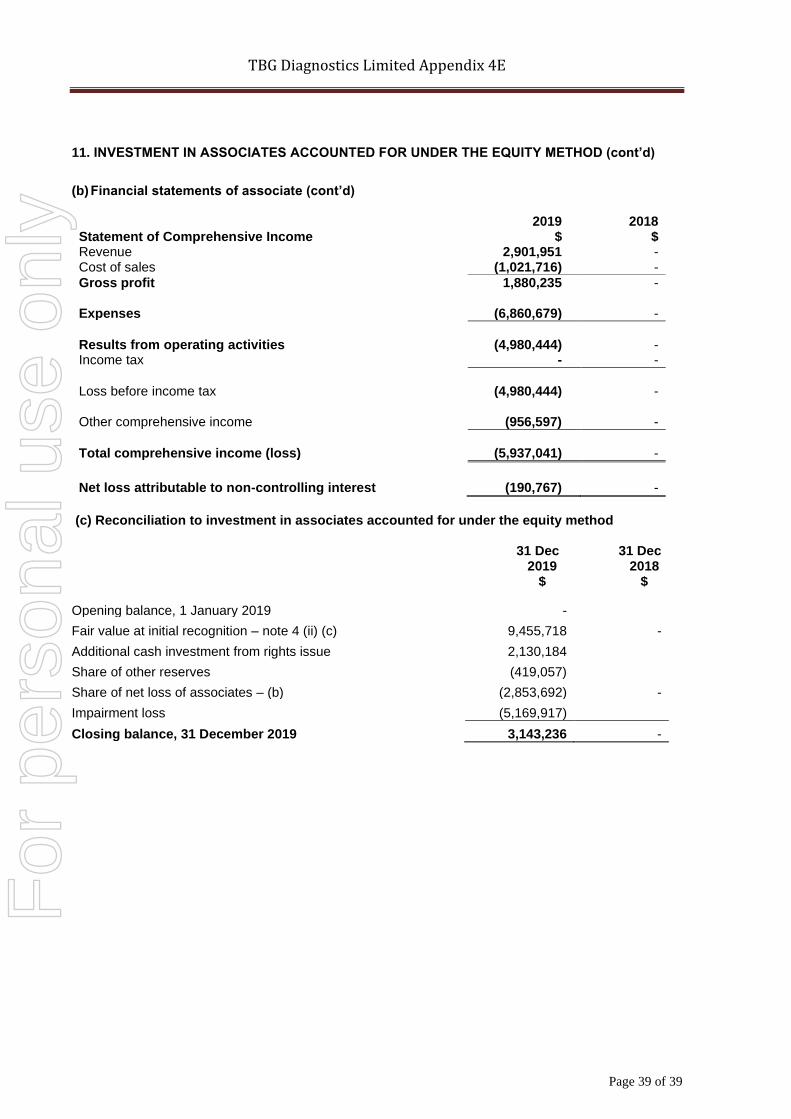
TBG Diagnostics Limited Appendix 4E
Page 39 of 39
11. INVESTMENT IN ASSOCIATES ACCOUNTED FOR UNDER THE EQUITY METHOD (cont’d)
(b) Financial statements of associate (cont’d) 2019 2018 Statement of Comprehensive Income $ $ Revenue 2,901,951 - Cost of sales (1,021,716) -
Gross profit 1,880,235 - Expenses (6,860,679) -
Results from operating activities (4,980,444) - Income tax - -
Loss before income tax
(4,980,444)
-
Other comprehensive income (956,597) -
Total comprehensive income (loss) (5,937,041) -
Net loss attributable to non-controlling interest (190,767) -
(c) Reconciliation to investment in associates accounted for under the equity method 31 Dec 31 Dec 2019 2018 $ $
Opening balance, 1 January 2019 -
Fair value at initial recognition – note 4 (ii) (c) 9,455,718 -
Additional cash investment from rights issue 2,130,184
Share of other reserves (419,057)
Share of net loss of associates – (b) (2,853,692) -
Impairment loss (5,169,917)
Closing balance, 31 December 2019 3,143,236 -
For
per
sona
l use
onl
y