application of remote sensing, gis and topographical data ... · the vietnam standard tcvn...
TRANSCRIPT
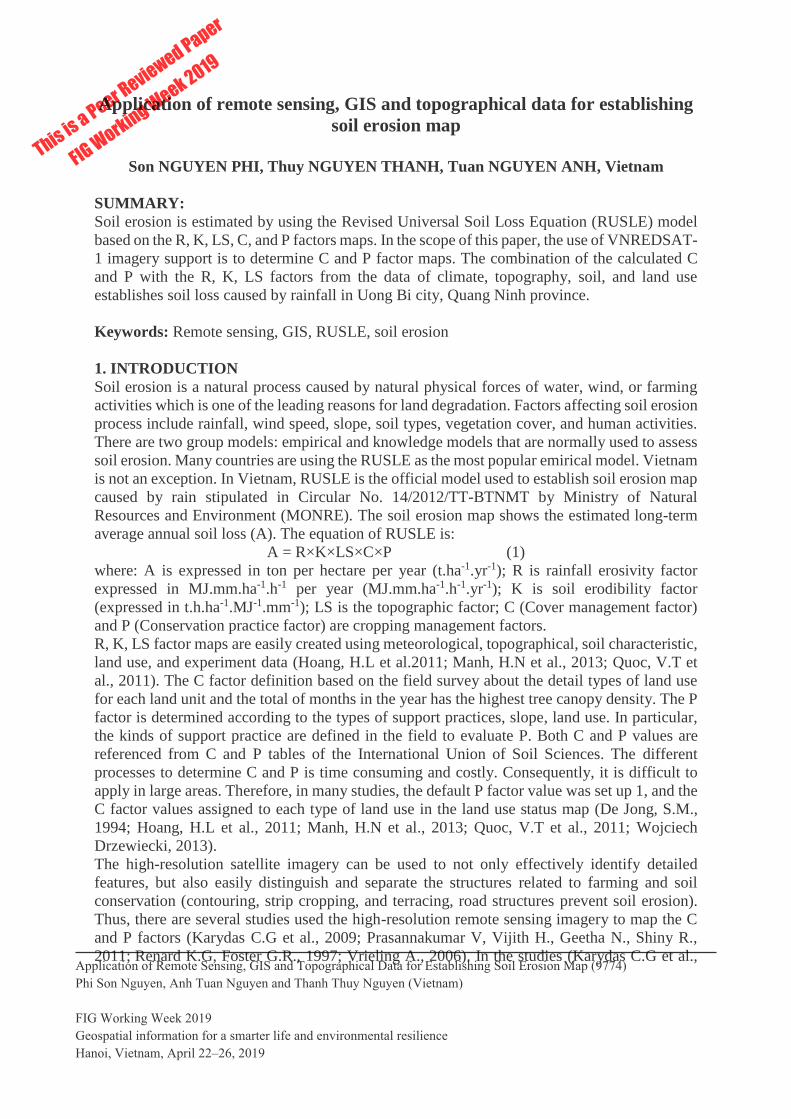
This is a Peer Reviewed Paper
FIG W
orking Week 2019
Application of Remote Sensing, GIS and Topographical Data for Establishing Soil Erosion Map (9774)
Phi Son Nguyen, Anh Tuan Nguyen and Thanh Thuy Nguyen (Vietnam)
FIG Working Week 2019
Geospatial information for a smarter life and environmental resilience
Hanoi, Vietnam, April 22–26, 2019
Application of remote sensing, GIS and topographical data for establishing
soil erosion map
Son NGUYEN PHI, Thuy NGUYEN THANH, Tuan NGUYEN ANH, Vietnam
SUMMARY:
Soil erosion is estimated by using the Revised Universal Soil Loss Equation (RUSLE) model
based on the R, K, LS, C, and P factors maps. In the scope of this paper, the use of VNREDSAT-
1 imagery support is to determine C and P factor maps. The combination of the calculated C
and P with the R, K, LS factors from the data of climate, topography, soil, and land use
establishes soil loss caused by rainfall in Uong Bi city, Quang Ninh province.
Keywords: Remote sensing, GIS, RUSLE, soil erosion
1. INTRODUCTION
Soil erosion is a natural process caused by natural physical forces of water, wind, or farming
activities which is one of the leading reasons for land degradation. Factors affecting soil erosion
process include rainfall, wind speed, slope, soil types, vegetation cover, and human activities.
There are two group models: empirical and knowledge models that are normally used to assess
soil erosion. Many countries are using the RUSLE as the most popular emirical model. Vietnam
is not an exception. In Vietnam, RUSLE is the official model used to establish soil erosion map
caused by rain stipulated in Circular No. 14/2012/TT-BTNMT by Ministry of Natural
Resources and Environment (MONRE). The soil erosion map shows the estimated long-term
average annual soil loss (A). The equation of RUSLE is:
A = R×K×LS×C×P (1)
where: A is expressed in ton per hectare per year (t.ha-1.yr-1); R is rainfall erosivity factor
expressed in MJ.mm.ha-1.h-1 per year (MJ.mm.ha-1.h-1.yr-1); K is soil erodibility factor
(expressed in t.h.ha-1.MJ-1.mm-1); LS is the topographic factor; C (Cover management factor)
and P (Conservation practice factor) are cropping management factors.
R, K, LS factor maps are easily created using meteorological, topographical, soil characteristic,
land use, and experiment data (Hoang, H.L et al.2011; Manh, H.N et al., 2013; Quoc, V.T et
al., 2011). The C factor definition based on the field survey about the detail types of land use
for each land unit and the total of months in the year has the highest tree canopy density. The P
factor is determined according to the types of support practices, slope, land use. In particular,
the kinds of support practice are defined in the field to evaluate P. Both C and P values are
referenced from C and P tables of the International Union of Soil Sciences. The different
processes to determine C and P is time consuming and costly. Consequently, it is difficult to
apply in large areas. Therefore, in many studies, the default P factor value was set up 1, and the
C factor values assigned to each type of land use in the land use status map (De Jong, S.M.,
1994; Hoang, H.L et al., 2011; Manh, H.N et al., 2013; Quoc, V.T et al., 2011; Wojciech
Drzewiecki, 2013).
The high-resolution satellite imagery can be used to not only effectively identify detailed
features, but also easily distinguish and separate the structures related to farming and soil
conservation (contouring, strip cropping, and terracing, road structures prevent soil erosion).
Thus, there are several studies used the high-resolution remote sensing imagery to map the C
and P factors (Karydas C.G et al., 2009; Prasannakumar V, Vijith H., Geetha N., Shiny R.,
2011; Renard K.G, Foster G.R., 1997; Vrieling A., 2006). In the studies (Karydas C.G et al.,

2009; Prasannakumar V, Vijith H., Geetha N., Shiny R., 2011), the C factor is calculated by
using Normalized Difference Vegetation Index (NDVI), and the P factor is calculated based on
each landscape structures classified using object-based image analysis method.
VNREDSAT-1 is the first optical Earth Observing Satellite of Vietnam, was launched on 7
May 2013 to monitor and study the effects of climate change and to predict, take measures for
natural disaster prevention and the country natural resources' management optimization.
VNREDSAT-1 captures images at
2.5m in the panchromatic mode, and
10m in the multi-spectral mode (4
bands: R, G, B, NIR) with three-day
revisit time. Hence, the objective of
this paper is to use VNREDSAT-1
images calculating C and P factors in
combination with R, K, SL factors to
map soil erosion caused by rainfall.
2. STUDY AREA
Uong Bi is a city in western Quang
Ninh province (25,546.41ha) with
elevation from 1 to 1.068m above the
sea level. There are two-thirds of hills
and mountains slope from the North to
South of the city with featuring three
main landforms: the high mountains
(65.04%), valley (1.2%), and flat
(26.9%) (Figure1). As the
geographical location and terrain lie in
the bow of Dong Trieu - Mong Cai,
there are both mountainous and
coastal climates in the city. The annual
average temperature is 22.20C, the
highest 34-360C, the lowest 7-120C.
The average relative humidity is 81%,
the lowest relative humidity is 50.8%.
Total annual rainfall is 1,600mm, and
the highest is 2,200mm. The city's broad range of elevation with a diversity climate, land use,
and land cover changes are typical conditions for soil erosion study.
3. METHODOLOGY
3.1. Data
The data of Uong Bi used to calculate average annual soil loss (A) in this study include: 3
VNREDSAT-1 scenes captured on 9 October 2013 and 11 November 2013 at 2.5m and 10m
corresponding with panchromatic and multi-spectral modes; digital elevation model (DEM)
interpolated from terrain data of topographic maps at scales 1:2.000, 1:5.000, 1:10.000 with cell
size 5m×5m; meteorological data (rainfall) in 2013; land mapping unit in 2013.
3.2. Cover management map
Cover management factor measures the combined effect of all interrelated vegetative cover and
management variables. According to RUSLE, C is the most important factor that shows the
Figure 1. The location of Uong Bi
Application of Remote Sensing, GIS and Topographical Data for Establishing Soil Erosion Map (9774)
Phi Son Nguyen, Anh Tuan Nguyen and Thanh Thuy Nguyen (Vietnam)
FIG Working Week 2019
Geospatial information for a smarter life and environmental resilience
Hanoi, Vietnam, April 22–26, 2019

conditions for preventing soil erosion. The C map is established based on De Jong's formula
(De Jong, 1994) as follows:
C = 0.431- 0.805 × NDVI (2)
Where: NDVI = (NIR-RED)/(NIR+RED), NIR and RED correspond with the spectral
reflectance measurements acquired near infrared and red regions. NDVI range from -1 to 1.
3.3. Conservation practice map
The RUSLE's P factor reflects the impact of support practices an annual erosion rate, which is
the ratio of soil loss with contouring and strip cropping to that with straight row farming up and
downslope.
The Vietnam standard TCVN 5299:2009 (MOST, 2009) indicates a table (Appendix B) of
popular empirical values of P associated with each type of support practices and slope
steepness. The problem is how to be solved how to define the support practices for the large
areas rapidly. The high-resolution VNREDSAT-1 images, three days repeated time, which
could be applied for classifying and interpreting the structures such as contouring, terracing
cultivations, forest, and others. All of these structures are divided into the strip and none-strip
cropping cultivations. The slope steepness is made from DEM. Each combination of support
practices and slope steepness provides a P value referenced in Appendix B.
3.4. Establishing rainfall erosivity map
This paper uses Ha Nguyen Trong's formula proposed using linear regression (Ha, T. N., 1996)
to calculate the correlation coefficient between R and P, as follows:
R = 0,5485×Ra - 59,9 (3)
Where: R is rainfall erosivity factor (J/m2); Ra is average annual rainfall (mm/year) interpolated
from meteorological data.
3.5. Establishing soil erodibility map
Each type of soils has differential erodibility. The degree of soil erodibility depends on the
linkage of soil components presented by K factor. The K factor defined by Wischmeier and
Smith's formula (Wischmeier WH, Smith DD., 1978):
100K= 2.1 × 10⁻⁴M1.14 × (12 - OS) + 3.25 × (Ssi - 2) + 2.5 × (D - 3) (4)
where: K is soil erodibility factor; M = (% silt + % very fine sand) × (100% - % clay); OS is
organic matter content (%); Ssi is soil structure index, D is soil permeability index.
3.6. Slope length and steepness map
SL factor represents the effects of topography on soil erosion. Where slope length (L)
is the distance from the point of origin of overland flow to place with a velocity of slope
decreases, and material occurs deposition. Slope steepness (S) shows that the higher slope, the
greater soil loss. There are many ways to define LS factor in previous studies however this
paper uses the Helena Mitasova's formula at a point r = (x,y) (Mitasova, H., Mitas, L., 1999) as
follows:
LS(r) = (m + 1) × [A(r)/a0]m × [sin b(r)/b0]
n (5)
where: A is upslope contributing area per unit contour width; b (in degree) is the slope; m, n
are experimental parameters; and a0 = 22.1m is the length and b0 = 0.09 = 9% = 5.16 degree is
the slope of the standard USLE plot. Values of m = 0.6, n = 1.3 are results that is consistent
Application of Remote Sensing, GIS and Topographical Data for Establishing Soil Erosion Map (9774)
Phi Son Nguyen, Anh Tuan Nguyen and Thanh Thuy Nguyen (Vietnam)
FIG Working Week 2019
Geospatial information for a smarter life and environmental resilience
Hanoi, Vietnam, April 22–26, 2019
with the RUSLE. The formula (6) expanded from (5) used for GIS software.
LS =1.6 × ([Flowacc] × Resolution/22.13)0.6 × ((Sin([Slope]×0.01745))/0.09)1.3 (6)
Where: Flowacc shows the Flow Accumulation; Resolution is the size of a cell.
4. RESULTS
Estimating the long-term average annual soil loss can be implemented by using GIS for
overlying, integrating, and calculating the input factor data mentioned in RULSE. This study
used ArcGIS for analyzing and presenting maps.
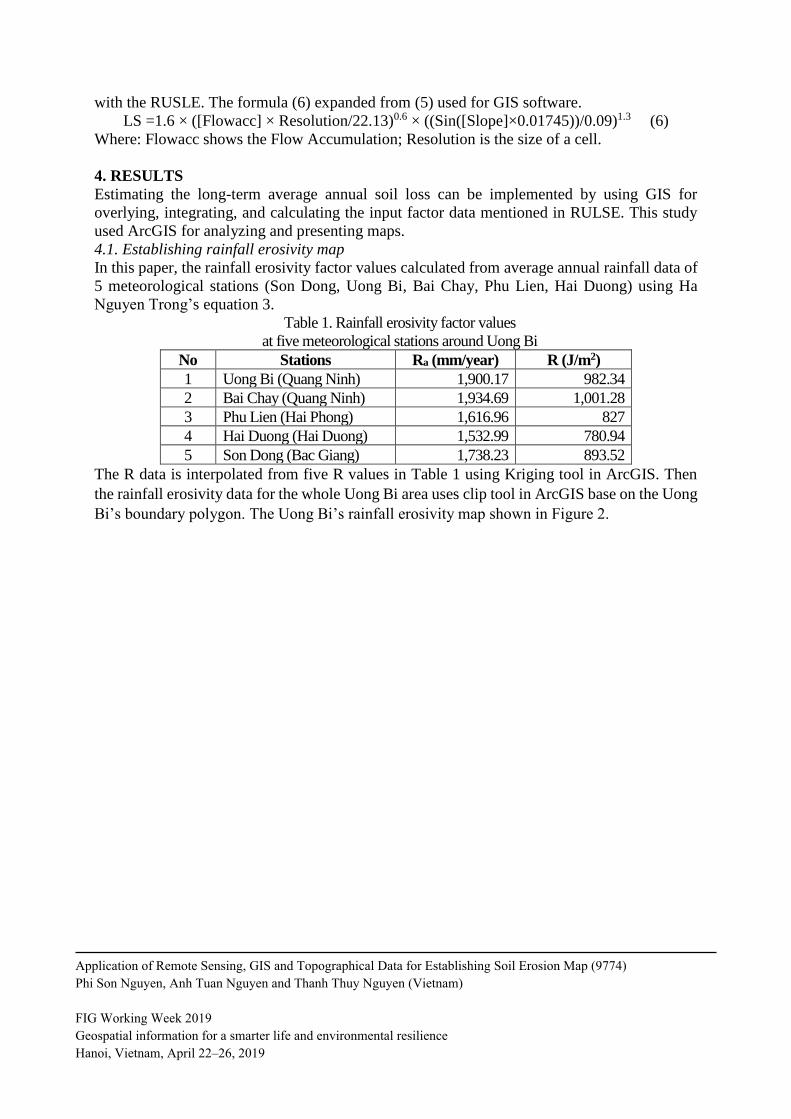
4.1. Establishing rainfall erosivity map
In this paper, the rainfall erosivity factor values calculated from average annual rainfall data of
5 meteorological stations (Son Dong, Uong Bi, Bai Chay, Phu Lien, Hai Duong) using Ha
Nguyen Trong’s equation 3.
Table 1. Rainfall erosivity factor values
at five meteorological stations around Uong Bi
No Stations Ra (mm/year) R (J/m2)
1 Uong Bi (Quang Ninh) 1,900.17 982.34
2 Bai Chay (Quang Ninh) 1,934.69 1,001.28
3 Phu Lien (Hai Phong) 1,616.96 827
4 Hai Duong (Hai Duong) 1,532.99 780.94
5 Son Dong (Bac Giang) 1,738.23 893.52
The R data is interpolated from five R values in Table 1 using Kriging tool in ArcGIS. Then
the rainfall erosivity data for the whole Uong Bi area uses clip tool in ArcGIS base on the Uong
Bi’s boundary polygon. The Uong Bi’s rainfall erosivity map shown in Figure 2.
Application of Remote Sensing, GIS and Topographical Data for Establishing Soil Erosion Map (9774)
Phi Son Nguyen, Anh Tuan Nguyen and Thanh Thuy Nguyen (Vietnam)
FIG Working Week 2019
Geospatial information for a smarter life and environmental resilience
Hanoi, Vietnam, April 22–26, 2019

Figure 2. Uong Bi's rainfall erosivity map
4.2. Establishing soil erodibility map
To establish soil erodibility map, all parcels in the land mapping unit must contain the
infomation about M, OS, Ssi, D in formula 4. In that, M and OS (percentages of silt, sand, and
clay) value derived from analysing soil samples; Ssi calculated using soil texture angle (USDA,
2018), and D referenced from the empirical permeability for each soil structure (USDA, 1983).
This paper uses the extracted information from 21 analyzed soil samples and using ArcGIS to
assign that to all the same characteristic parcels in the land mapping unit and calculating K.
Then convert land mapping unit from polygon to raster, base on K value field, with cell size is
5m×5m to prepaire for estimating long-term average annual soil loss (A). Soil erodibility map
Application of Remote Sensing, GIS and Topographical Data for Establishing Soil Erosion Map (9774)
Phi Son Nguyen, Anh Tuan Nguyen and Thanh Thuy Nguyen (Vietnam)
FIG Working Week 2019
Geospatial information for a smarter life and environmental resilience
Hanoi, Vietnam, April 22–26, 2019

shown in Figure 3.
Figure 3. Uong Bi's soil erodibility map
4.3. Slope length and steepness map
SL is defined from flow accumulation, slope, and cell size. In this study case in Uong Bi, both
of them are created from DEM using ArcGIS tools such as Flow Direction, Flow Accumulation
(Spatial Analyst), and Slope (3D Analyst) with cell size 5m×5m. After that, SL surface built by
Raster Calculator in ArcGIS Spatial Analyst tool based on the equation 6. The results show in
Figure 4 and 5.
Application of Remote Sensing, GIS and Topographical Data for Establishing Soil Erosion Map (9774)
Phi Son Nguyen, Anh Tuan Nguyen and Thanh Thuy Nguyen (Vietnam)
FIG Working Week 2019
Geospatial information for a smarter life and environmental resilience
Hanoi, Vietnam, April 22–26, 2019
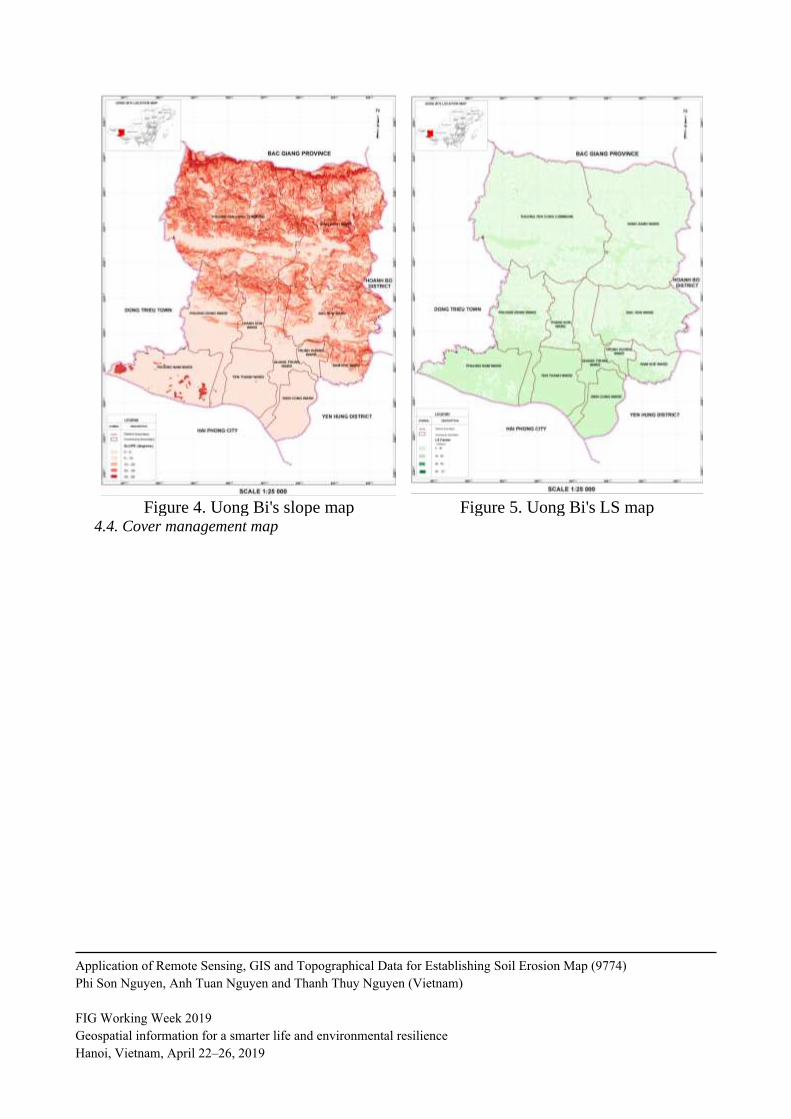
Figure 4. Uong Bi's slope map Figure 5. Uong Bi's LS map
4.4. Cover management map
Application of Remote Sensing, GIS and Topographical Data for Establishing Soil Erosion Map (9774)
Phi Son Nguyen, Anh Tuan Nguyen and Thanh Thuy Nguyen (Vietnam)
FIG Working Week 2019
Geospatial information for a smarter life and environmental resilience
Hanoi, Vietnam, April 22–26, 2019
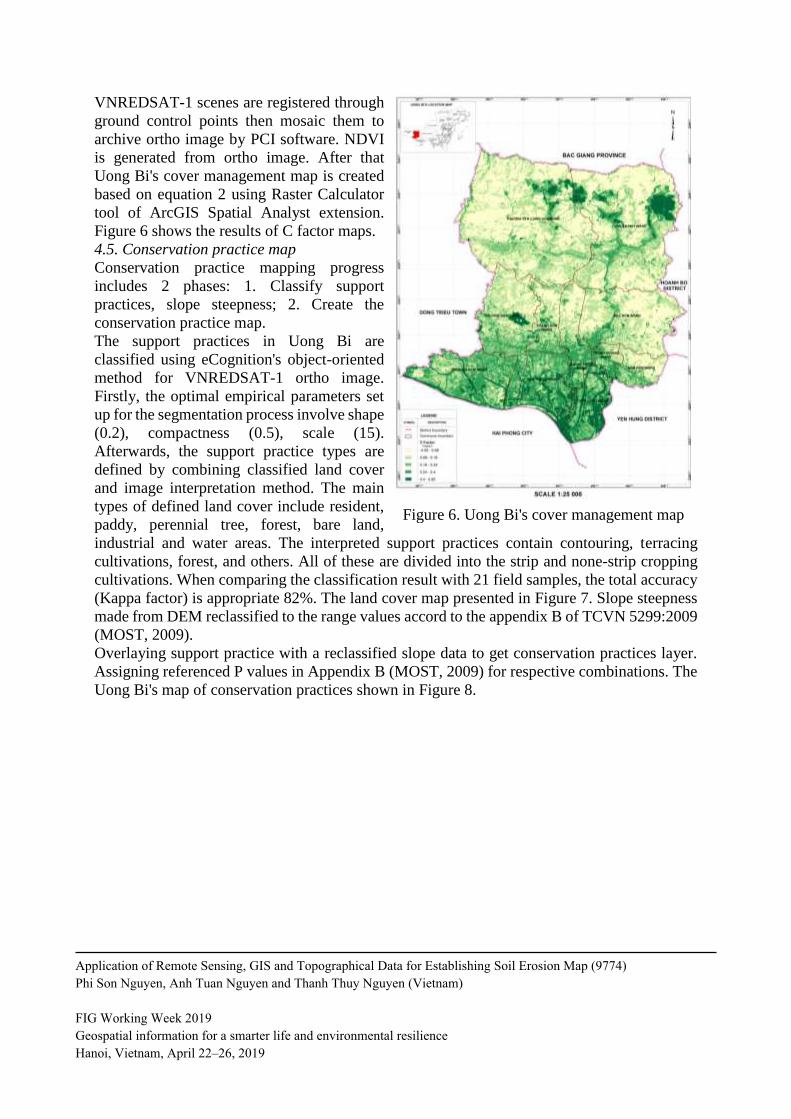
VNREDSAT-1 scenes are registered through
ground control points then mosaic them to
archive ortho image by PCI software. NDVI
is generated from ortho image. After that
Uong Bi's cover management map is created
based on equation 2 using Raster Calculator
tool of ArcGIS Spatial Analyst extension.
Figure 6 shows the results of C factor maps.
4.5. Conservation practice map
Conservation practice mapping progress
includes 2 phases: 1. Classify support
practices, slope steepness; 2. Create the
conservation practice map.
The support practices in Uong Bi are
classified using eCognition's object-oriented
method for VNREDSAT-1 ortho image.
Firstly, the optimal empirical parameters set
up for the segmentation process involve shape
(0.2), compactness (0.5), scale (15).
Afterwards, the support practice types are
defined by combining classified land cover
and image interpretation method. The main
types of defined land cover include resident,
paddy, perennial tree, forest, bare land,
industrial and water areas. The interpreted support practices contain contouring, terracing
cultivations, forest, and others. All of these are divided into the strip and none-strip cropping
cultivations. When comparing the classification result with 21 field samples, the total accuracy
(Kappa factor) is appropriate 82%. The land cover map presented in Figure 7. Slope steepness
made from DEM reclassified to the range values accord to the appendix B of TCVN 5299:2009
(MOST, 2009).
Overlaying support practice with a reclassified slope data to get conservation practices layer.
Assigning referenced P values in Appendix B (MOST, 2009) for respective combinations. The
Uong Bi's map of conservation practices shown in Figure 8.
Figure 6. Uong Bi's cover management map
Application of Remote Sensing, GIS and Topographical Data for Establishing Soil Erosion Map (9774)
Phi Son Nguyen, Anh Tuan Nguyen and Thanh Thuy Nguyen (Vietnam)
FIG Working Week 2019
Geospatial information for a smarter life and environmental resilience
Hanoi, Vietnam, April 22–26, 2019

Figure 7. Uong Bi's land cover map Figure 8. Uong Bi's conservation practice map
4.6. Establishing soil erosion map
Uong Bi's soil erosion map is created by integrating all maps of R, K, LS, C, P according to
formula 1. The degree of soil erosion in the study area is divided into five ranges (MOST, 2009).
Table 2 indicates the soil loss, the distribution of soil erosion in Uong Bi in 2013 shown in
Figure 9.
Table 2. Statistic of Uong Bi' soil erosion in 2013
Soil
erosion
degree
The loose soil
(Ton/ha/year) Description
Area
(ha)
Percent
(%)
I 0-1 No erosion 7611.42 29.77
II > 1-5 Moderate erosion 14557.38 56.94
III > 5-10 Average erosion 805.55 3.15
IV > 10-50 Strong erosion 358.56 1.4
V >50 Extreme erosion 247.68 0.97
Total 23580.58 92.24
The results in Table 2 and Figure 9 show that:
- The areas of strong erosion and extreme erosion are mainly distributed in the high slope and
elevation mountains (2.37% of total area);
- The average erosion areas in the relatively high hills occupy about 3.15% of total area;
- The moderate erosion areas distribute in the low hills and relatively flat terrain (56.94% of
total area);
- The no erosion areas are in the delta, low landforms (29.77%).
Application of Remote Sensing, GIS and Topographical Data for Establishing Soil Erosion Map (9774)
Phi Son Nguyen, Anh Tuan Nguyen and Thanh Thuy Nguyen (Vietnam)
FIG Working Week 2019
Geospatial information for a smarter life and environmental resilience
Hanoi, Vietnam, April 22–26, 2019

The remaining percentage (7.76%) are non-argricultrural lands such as residential land; non-
agricultural production, and business; and land for production of building materials, and
pottery. These areas are not considered in this study.
5. DISCUSSION AND CONCLUSION
The study uses the RUSLE model, satellite
images data, topographic data, and GIS to
produce the component factor maps (R, K,
LS, C, P) which are then integrated to map
soil erosion in Uong Bi. C and P maps
produced from VNREDSAT-1 satellite
images, topographic data combine with the
experimental standard (MOST, 2009)
indicate the ability of remote sensing
technology, especially using high-resolution
and very high-resolution satellite imagery
that could meet the requirements of soil
erosion map for the large areas. The soil
erosion map using remote sensing data for
establishing is better in comparison with that
produced by the traditional method.
The results of the project (coded
BDKH.10/16-20) "Researching and applying
modern technologies for building natural
resource change management models,
completing the management tools and
improving the monitoring capacity in land
use change" greatly contributing to the fact
that the study on soil erosion using remote
sensing technology and GIS is efficient and vital.
Figure 10. Uong Bi's soil erosion map
Figure 9. Uong Bi's soil erosion map
Application of Remote Sensing, GIS and Topographical Data for Establishing Soil Erosion Map (9774)
Phi Son Nguyen, Anh Tuan Nguyen and Thanh Thuy Nguyen (Vietnam)
FIG Working Week 2019
Geospatial information for a smarter life and environmental resilience
Hanoi, Vietnam, April 22–26, 2019
REFERENCES
1. De Jong, S. M. (1994). Application of Reflective Remote Sensing for Land Degradation
Studies in a Mediterranean Environment. Netherlands Geographical Studies, University of
Utrecht.
2. Ha, T. N. (1996). Define the factors produce soil erosion and the prediction ability that on
slope land. The thesis of Associate Doctor, Thuy Loi University, Ha Noi, 140 pages.
3. Hoang, H. L., Duy, L. N., Phuoc, M. T., Kim, L. K. (2011). Assessing soil erosion in Tam
Da watershed, Lam Dong province using GIS technique. National conference on GIS
applications.
4. Karydas C.G, Sekuloska T, Sillieos G.T. (2009). Quantification and site-specification of the
support practice factor when mapping soil erosion risk associated with olive plantations in the
Mediterranean island of Crete Environmental Monitoring and Assessment, 149, 19–28.
5. Manh, H. N., Van, D. N., Huyen, N. H. (2013). Application of USLE and GIS tool to predict
soil erosion potential and proposal land cover solutions to reduce soil loss in Tay Nguyen.
Journal of Earth Sciences, No 35(4), pages 403-410.
6. Ministry of Science and Technology (MOST). (2009). Vietnam Standard TCVN 5299:2009:
Soil quality - Methodology for estimating soil erosion caused by rainfall.
7. Mitasova, H. & Mitas, L. (1999). Modeling soil detachment with RUSLE 3d using GIS. The
University of Illinois at Urbana-Champaign.
8. Prasannakumar V, Vijith H., Geetha N., Shiny R. (2011). Regional Scale Erosion Assessment
of a Sub-tropical Highland Segment in the Western Ghats of Kerala, South India. Water
Resource Management, 25, 3715–3727.
9. Quoc, V. T., Dang, V. D., Chau, T. D. (2011). Application of Remote Sensing and
Geographic Information System in evaluating soil erosion. A case study in Tam Nong district,
Phu Tho province. Journal of Science and Development, Volum 9, No 5: 823-833.
10. Renard K.G, Foster G.R. (1997). Predicting Soil Erosion by Water: A Guide to Conservation
Planning with the Revised Universal Soil Loss Equation (RUSLE). USDA.
11. USDA (1983). National Soil Survey Handbook.
12. USDA (2018). Soil Texture Calculator.
https://www.nrcs.usda.gov/wps/portal/nrcs/detail/soils/survey/?cid=nrcs142p2_054167 (accessed
28/12/2018)
13. Vrieling A. (2006). Satellite remote sensing for water erosion assessment: A review.
Catena, 65, 2–18.
14. Wischmeier WH, Smith DD. (1978). Predicting rainfall erosion losses—a guide to
conservation planning. Agriculture Handbook No. 537. US Department of Agriculture Science
and Education Administration, Washington, p 163
15. Wojciech Drzewiecki. (2013). Quantitative and Qualitative Assessment of Soil Erosion Risk
in Małopolska (Poland), Supported by an Object-Based Analysis of High-Resolution Satellite
Images.
Application of Remote Sensing, GIS and Topographical Data for Establishing Soil Erosion Map (9774)
Phi Son Nguyen, Anh Tuan Nguyen and Thanh Thuy Nguyen (Vietnam)
FIG Working Week 2019
Geospatial information for a smarter life and environmental resilience
Hanoi, Vietnam, April 22–26, 2019

CONTACTS
Dr. Son Nguyen Phi
Vietnam Institute of Geodesy and Cartography
Address: No 479, Hoang Quoc Viet street
City: Hanoi
COUNTRY: Vietnam
Tel: +84912308694
Email: [email protected]
Website: www.vigac.vn
Application of Remote Sensing, GIS and Topographical Data for Establishing Soil Erosion Map (9774)
Phi Son Nguyen, Anh Tuan Nguyen and Thanh Thuy Nguyen (Vietnam)
FIG Working Week 2019
Geospatial information for a smarter life and environmental resilience
Hanoi, Vietnam, April 22–26, 2019