application of swat model in eco-hydrological assessment ... · what is the aim of this study? to...
TRANSCRIPT
Application of SWAT Model in Eco-hydrological Assessment of the Clariano River
Hamed Vagheei, PhD Student, Politecnico di Torino
Co-authors:
Prof. Fulvio Boano, PoliTo, Italy
Prof. Paolo Vezza, PoliTo, Italy
Prof. Guillermo Palau-Salvador, UPV, Spain
2019 SWAT Conference - Vienna, Austria
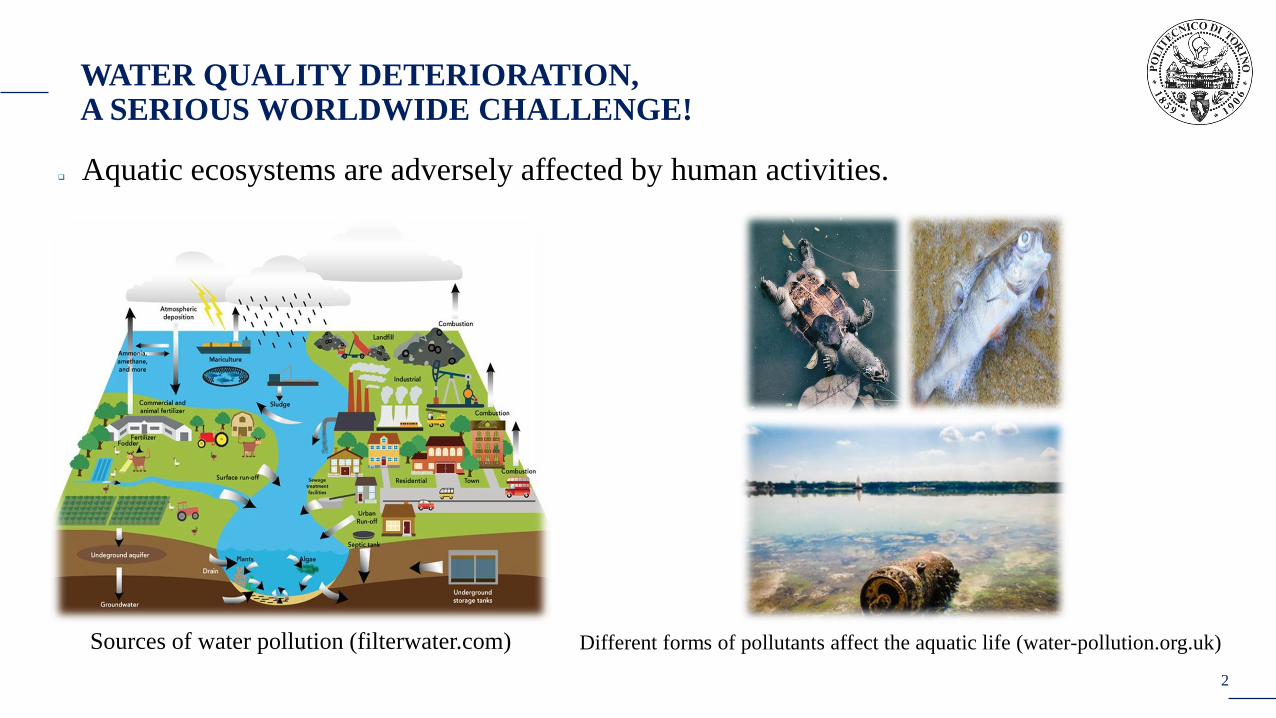
WATER QUALITY DETERIORATION, A SERIOUS WORLDWIDE CHALLENGE!
Aquatic ecosystems are adversely affected by human activities.
2
Different forms of pollutants affect the aquatic life (water-pollution.org.uk) Sources of water pollution (filterwater.com)

WHAT IS THE AIM OF THIS STUDY?
To investigate aquatic ecosystem responses to water quality deterioration
3
The location of Clariano River Basin
The region is characterized by a
semi-arid climate.
The mean annual precipitation is
about 450 mm.
The mean monthly maximum
temperature ranges from 15°C in
January to 30°C in August.
The mean monthly minimum
temperature ranges from 5°C in
January to 20°C in August.

THE CLARIANO RIVER IS UNDER PRESSURE!
4
Pou Clar, the source of Clariano River WWTPs effluents entering directly to the river!
The water quality has been affected by human activities just a few kilometres downstream of Pou Clar

SWAT WAS SELECTED FOR THE PRESENT STUDY…
SWAT is used for:
Hydrological modeling of the river basin
Sediment load simulation along the river
Nutrients (nitrogen and phosphorus) movement simulation
For SWAT simulations, the following data had to be aggregated:
Topography data
Weather data
Land use map
Soil classification map
Streamflow, sediment and nutrient loads are also required for calibration and validation. 5

TOPOGRAPHY DATA
6
USGS 30-meter Digital Elevation Model (DEM)
Watershed area is about 500 𝑘𝑚2.
Watershed elevation:
Min elevation: 118 m
Max elevation: 1136 m
Mean elevation: 419.8 m
Watershed slope:
Min slope: 0.00
Max slope: 218 % ≈ 65.35°
Mean slope: 16.1 % ≈ 9.15°

LAND USE AND SOIL TYPE MAPS
The 300-meter GlobCover 2009 land cover map was used.
This map was developed by UCLouvain & ESA:
UCL: Universite catholique de Louvain
ESA: European Space Agency
The Digital Soil Map of the World, the FAO-UNESCO soil map, was used.
7

CLIMATIC DATA
The daily data of five weather stations were used.
Daily climatic data (2002-2017):
Precipitation
Minimum and maximum air temperature
Solar radiation
Wind speed
Relative humidity
Data source: Valencian Institute for Agriculture Research
8
The location of weather stations

WASTEWATER TREATMENT PLANTS DATA
Monthly data of five WWTPs were used:
Aielo de Malferit
Albaida
Alfarrasi
Guadasequies
Ontinyent
The source of data:
EPSAR: La Entidad Pública de Saneamiento de Aguas (the public entity for water sanitation)
9
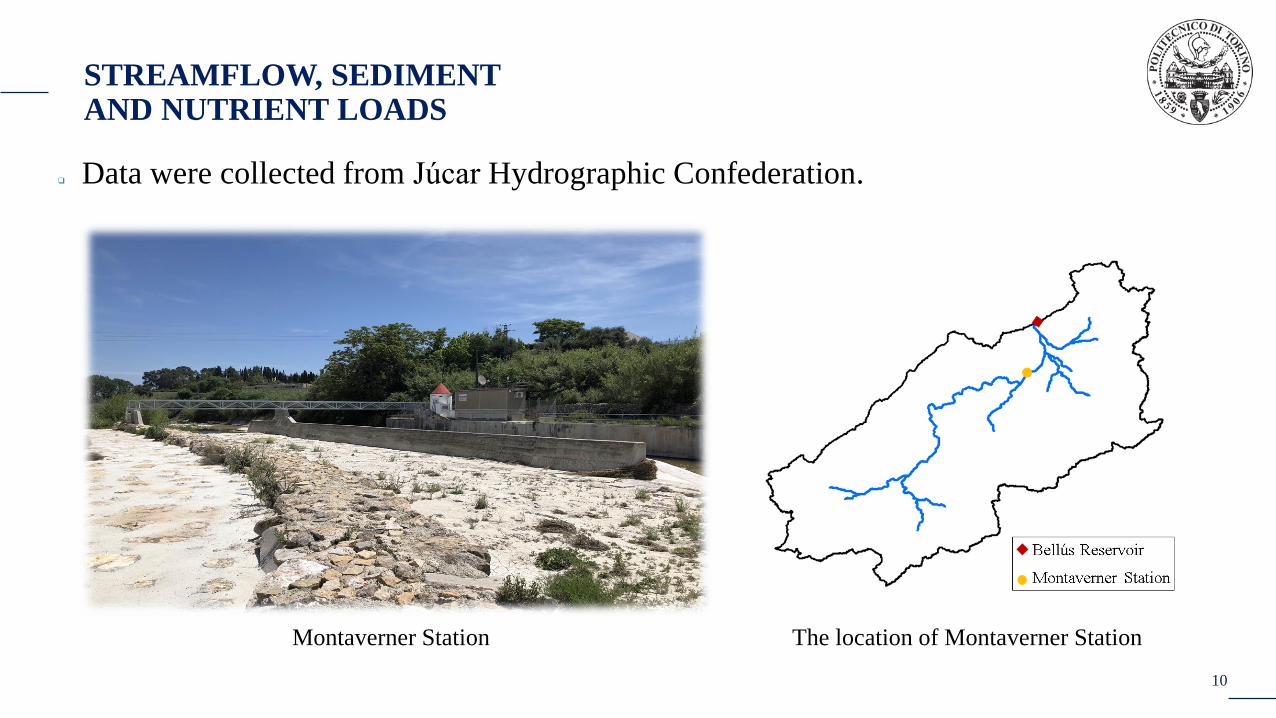
STREAMFLOW, SEDIMENT AND NUTRIENT LOADS
Data were collected from Júcar Hydrographic Confederation.
10
Montaverner Station The location of Montaverner Station
SOME GENERAL INFORMATION
Warm-up period: 2002-2004
Calibration period: 2005-2012
Validation period: 2013-2017
SWAT-CUP-SUFI2 was used for calibration of SWAT model.
Water abstraction from the river for irrigation has been estimated based on water need of local crops.
11
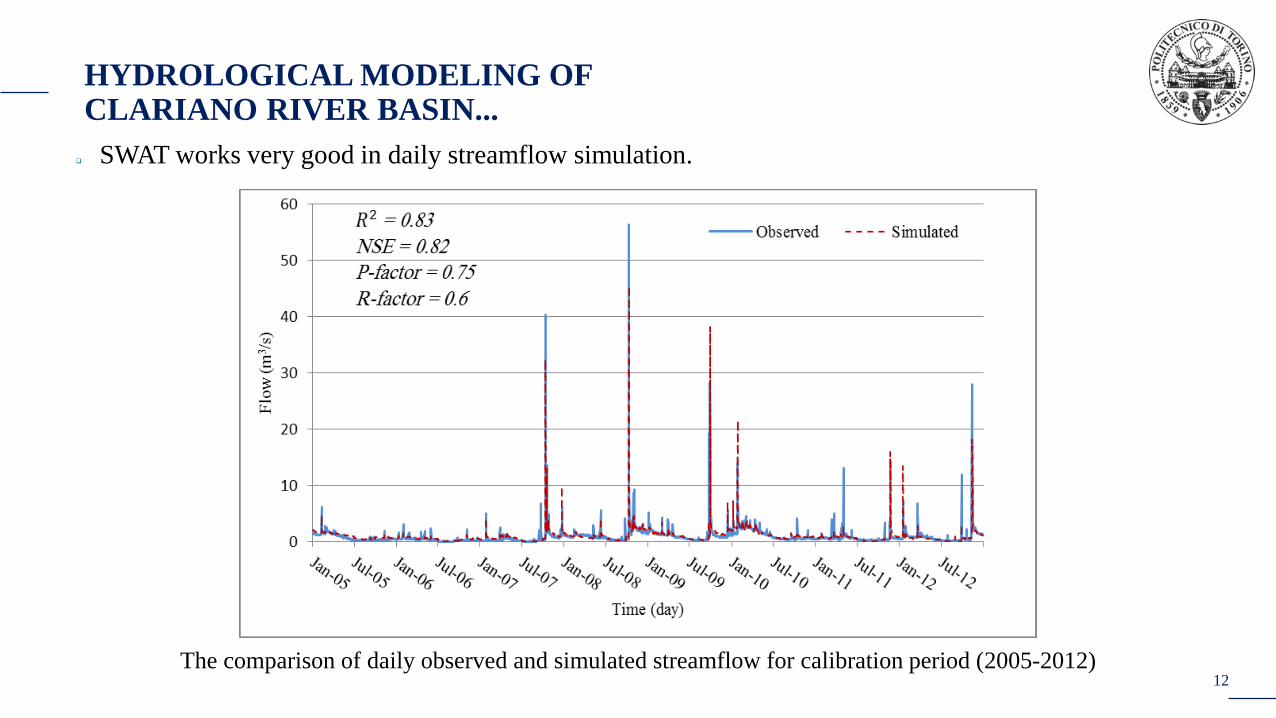
HYDROLOGICAL MODELING OF CLARIANO RIVER BASIN...
12
SWAT works very good in daily streamflow simulation.
The comparison of daily observed and simulated streamflow for calibration period (2005-2012)

HYDROLOGICAL MODELING OF CLARIANO RIVER BASIN...
13
The comparison of daily observed and simulated streamflow for validation period (2013-2017)
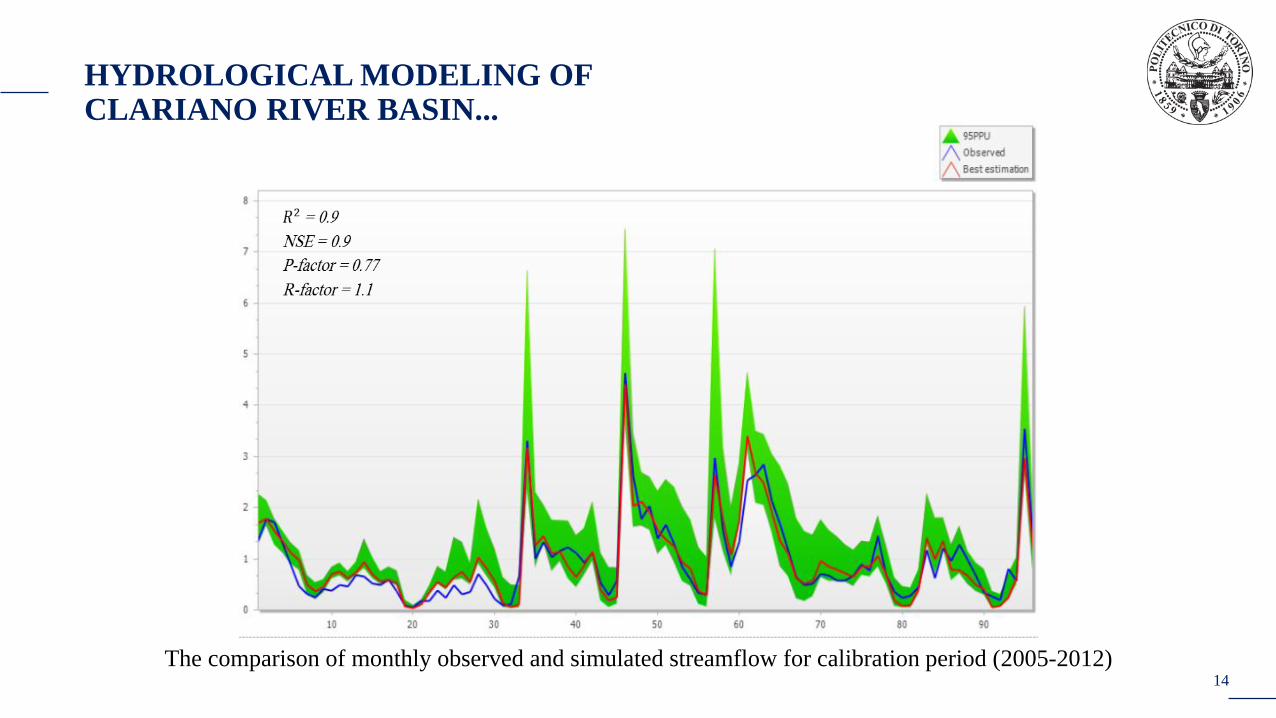
HYDROLOGICAL MODELING OF CLARIANO RIVER BASIN...
14
The comparison of monthly observed and simulated streamflow for calibration period (2005-2012)

HYDROLOGICAL MODELING OF CLARIANO RIVER BASIN...
15
The comparison of monthly observed and simulated streamflow for validation period (2013-2017)
WHAT ARE THE FOLLOWING STEPS?
The improvement of the model
The simulation of sediment and nutrient loads along the river
The identification of appropriate techniques able to describe ecological responses to water quality changes.
16

Thank You!