application of theoretical methods to predict overload effects on fracture toughness of a533b
TRANSCRIPT

Int. J. Pres. Ves. & Piping 41 (1990) 333-357
Application of Theoretical Methods to Predict Overload Effects on Fracture Toughness of A533B
D. J. Smi th* & S. J. G a r w o o d ~
Engineering Department, The Welding Institute, Abington Hall, Abington, Cambridge CB1 6AL, UK
(Received 29 August 1989; accepted 8 September 1989)
ABSTRACT
In the past a number of theoretical models have been proposed in an attempt to predict the effects of prior overload sequence on the fracture performance of ferritic steel components. This paper examines two models based on plastic superposition of stresses and displacements, and also in the context of continuum modelling of crack tip behaviour for cyclic loading. An analytical solution is obtained for the stress superposition model, whereas the displacement-based model requires a numerical solution.
It is proposed that a reference stress approach can be adopted where the prior overload is automatically limited by the yield (or flow) stress.
Comparison with the experimental data for A533B steel shows that neither the stress- nor displacement-based models can predict the variation in the benefit in toughness at -170°C after prior overloading at 20°C. It is also shown that the models are unable to predict the observed differences in fracture behaviour after prior overload between the L -T and T-L orientations. An approximate equation is proposed to predict the increase in toughness or load-bearing capacity after prior overload. The approximation is found to be adequate in view of the experimental scatter.
1 I N T R O D U C T I O N
Earlier studies, including some of the experimental work presented in Smith and Garwood (this vol., pp. 297-331), 1 have shown that a prior overload
* Present address: Department of Mechanical Engineering, University of Bristol, Bristol BS8 1TR, UK.
To whom correspondence should be addressed. 333
Int. J. Pres. Ves. & Piping 0308-0161/90/$03"50 © 1990 Elsevier Science Publishers Ltd, England. Printed in Great Britain

334 D. J. Smith, S. J. Garwood
sequence has beneficial effects on the fracture toughness of ferritic steels. The subject of the effects of the prior overload (or warm prestressing) has been extensively reviewed, particularly by Nichols 2 up to 1968, Harrop 3 up to 1979, and more recently by Pickles and Cowan ¢ and Smith and Garwood (this vol., pp. 255-96). 5 In the review of Pickles and Cowan, it was pointed out that experiments conducted on simple fracture toughness specimens demonstrated almost without exception a beneficial effect on the low- temperature toughness. However, in the experimental study presented by Smith and Garwood (this vol., pp. 297-331), ~ it was found that this general statement is not always true. In particular, even when cleavage was the predominant mode of fracture, a loss of benefit was obtained for deep cracks.
The aim of this paper is to examine the experimental data 1 in terms of the theories available for prediction of the effects of prior overloading. First, the theoretical basis for examination of crack tip behaviour is presented. This is followed by an examination of the proposed predictive models. An alternative approach for predicting the prior overload effects for brittle and ductile behaviour is also proposed, based on a reference stress approach.
2 C O N T I N U U M DESCRIPTION OF CRACK TIP BEHAVIOUR
The theoretical framework for the continuum analysis of the deformation behaviour ahead of crack tips is well established. 6'7 Following Rice, 6 the stress o-~j, strain e~j and displacement ui fields ahead of a finite crack in a large body (see Fig. 1) subjected to monotonic loading and exhibiting elastic- plastic behaviour can be generally represented in the form
aijj = Zi J Jr~a, O, a~/O'v] (1) O'y
= E j[r/a, 0, (2) /2y
u-A-i = Ui[r /a , O, a~/t~v] (3) EytT/
where r and 0 are polar co-ordinates centred at the crack tip, a is the half crack length, o% is a remotely applied stress, o- v and e v are a representative yield strength and strain, and ~ij, Eij and Ui are dimensionless functions of their arguments. The square brackets represent function statements. If the components of the stress and strain tensors remain in constant proportion to

Prediction of overload effects on fracture toughness 335
L_ f
~ G - - . . . . . . . ~
t"
j X
Fig. 1. Crack tip co-ordinate scheme.
each other, 8 it is possible to provide a general t reatment for the response to cyclic loading th rough the plastic superposi t ion method. 9'1°
The background used in examining the effects of prior overloading lies in the earlier analytical models of fatigue crack growth. 9 Rice, 9 in describing the response of an elastic-perfectly plastic material subjected to cyclic loading, used the principle of plastic superposition. In particular, following through the loading events depicted in Fig. 2, the effect of unloading by an amoun t AP is to reverse the direction of stresses within the region of compressive flow, wi thout affecting their magni tude or distr ibution (i.e. propor t ional loading). The subsequent state, depicted in Fig. 2(c), is merely a summat ion of the states given in Fig. 2(a) and (b). Clearly, such an approach is one of mathematical convenience, as no account is taken of the Bauschinger effect, 6 or of the effect of crack closure or even of non- propor t ional loading during the sequence of events. I f complete unloading takes place, crack closure will intervene before complete load reversal so that the stress distr ibution ahead of the crack tip, shown in Fig. 2(b), will be modified, as some part of the crack now transmits a compressive stress.
The above cyclic behaviour has also been examined by Chell and co- workers 1°'11 in the context of a prior overload at a high temperature (say, room temperature) followed by unloading and subsequent cooling and reloading at the lower temperature, as shown in Fig. 3. For the L U C F ( load- unload-cool - f rac ture) cycle, the stress, strain and displacements after
Reversed flow I O)JX, OJ "
-20o~ / I plastic zone
(a) (b) (c) /
Fig. 2. Crack tip plasticity during cyclic, loading: (a) stress distribution ahead of crack for load P; (b) stress distribution ahead of crack for an unloading -AP, with a yield stress 2tro;
(c) net result by superposition at load P - AP.

336 D.J. Smith, S. J. Garwood
Case I
Case II
Lood
load
pr
p,
T2 n
T 1 letup.
Plastic zones
R I R 2 R 3
R 3 -R I -R 2
r~ i ,,0 R,@ R,@
r 1 Q1 -@ -R2
Case III P!
" I TO ¢;; _--- R1 "R2 ~R3
r2 T1
Fig. 3. Loading sequence and relative formation of plastic zones.
loading at temperature T1 with a yield strength of 0.Vl are given by eqns 0)-(3), where the boundary tractions are given through 0.o° = 0-1- Complete unloading at T 1 gives the following in terms of stresses:
0.ij 20.v 1 - ~ u [r/a, 0, 0-1/2avl] (4)
Similar expressions can be written for the strains and displacements. The crack tip state after the final loading step 0- 2 will be dependent on the magnitude of 0-2. There are three cases, each dependent on the extent of the plastic zone R (and thus 0-2) relative to the original monotonic plastic zone R 1 and the unloaded plastic z o n e R 2. Each case will be considered in decreasing order of the final plastic zone size.
If the final load step is sufficient to create a plastic z o n e R 3 larger than the zones R 1 and R 2 shown in Fig. 3(a), then the stress state is given by a2, where
0.u = Y'u [r/a, 0, 0-2/0-v2] (5) 0-Y2
The next smallest plastic zone size from the final load 0- 2 is that which lies between the initial plastic zone R1 and the reversed plastic z o n e R2, as shown in Fig. 3(b). The unloaded plastic zone is wiped out, and the stress field is

Prediction of overload effects on fracture toughness 337
dependent on the differences between the loadings and the yield strengths, so that the stresses are given by
aiJ =Zi j [r/a, O, (0" 2 - ax)/(trv2 - try1)] av2 -- aVl
(6)
The final stress state is given by adding eqns (1) and (6) (where, in eqn (1), the yield strength is aVl).
In the third case, when the final load is small enough such that the final plastic z o n e R 3 is within the reversed plastic zone R2, as shown in Fig. 3(c), the stress state for a 2 is given by
aiJ - Zij Jr~a, O, a2/(crv2 + crvl)] try2 + trvx
(7)
The final state is found by adding eqns (1) (again with trv = ay1 ) and (7) and subtracting eqn (4) (the last represents unloading). These descriptions can be extended to any loading and temperature cycle in a systematic manner provided account is taken of the changes in yield stress. Chell and Curry 1° provided a more detailed description for the case of partial unloading. The intentionhere has been to concentrate on the load cycle (LUCF) relevant to most proof testing circumstances.
3 PREDICTION OF FRACTURE
The continuum descriptions above are incomplete in so far as they describe the continuum features of the behaviour ahead of a crack tip subjected to cyclic loading and temperatures. To predict fracture, whether it be cleavage or fibrous, requires a critical local criterion. To model cleavage fracture a criterion was proposed by Ritchie et al. 12 It is assumed that cleavage fracture will occur when the local tensile stress exceeds the material's cleavage fracture stress, tr*, over some microstructurally determined characteristic distance Xo. The model can be considered analytically by considering the small-scale yielding and strain hardening solution for the plane strain tension distribution around a stationary crack. 13Aa The normal stress tryy is given by
av L E-~V-ev ~--j~ J °Yr[0' n] (8)
where n is the exponent in the Ramberg-Osgood constitutive law, in which
338 D.J. Smith, S. J. Garwood
the equivalent plastic strain e~ as a function of the equivalent stress tre is given by
- - = (9) ev kay /
The factor/~ in eqn (8) has been tabulated by Hutchinson 13 as a function ofn. By applying the Ritchie, Knott and Rice (RKR) criterion that K = Kit
when ayy exceeds a* over the characteristic distance r = X o directly ahead of the crack tip, an expression for the fracture toughness is obtained:
1/2// O'f* x~ (n+l}/2 K,< _-(Xo~vO'v)t ~v-v ) (10)
where ~ is given by
(1--V2"~ l/(n + 1) = \ - - ~ , / ayy[O, n] (11)
The applicability of this model to predicting failure has been well established (see, for example, Ritchie et al}5).
For complex loading circumstances such as those appertaining to prior overloading, Chell and co-workers ~L16 proposed a failure criterion to describe fracture in the presence of plastic and residual stress zones whereby a critical force is achieved on the region where plastic flow can occur. The critical force is evaluated using the J-integral in which the integrand contains only the elastic components, where Je is given by
J. = f ( W d x - a,flpjdFl i) (12)
where [31' ) is the elastic distortion tensor, and
W = f aij dfl,'~ (13)
The contour H lies only in the elastic regions, and encloses those regions where plastic flow can occur. An example of the evaluation of Je can be gauged by considering a contour which encompasses a crack tip but passes through a yield zone (a yielded strip). For this model of strip yielding, the J- integral for a contour shrunk on to the yielded region is given by
Je = avz{U[a] - - U[X]} (14)
where u[a] is the displacement at the crack tip and u[x] the displacement

Prediction of overload effects on fracture toughness 339
across the yielded region at the point x. When x = R, the extent of the yielded region, u[x] = 0, and J is equal to the path-independent J-integral. More details of the use of eqn (14) as proposed by Chell and co-workers ~L~6 are given below. It should be noted that cleavage failure will occur when Je is K ( J E '. As with the R K R model, an additional physical parameter is required to be able to predict K~c.
4 PREDICTION OF PRIOR OVERLOAD EFFECTS
A number of models have been proposed for predicting prior overload effects. In particular, the models proposed by Chell et al. 11 and Curry 17 are examined. Both models use as a basis the plastic superposition principles and the cleavage fracture criterion outlined above. These two models have been reviewed by Pickles and Cowan 4 and Chell and Curry, 1° and it has been shown that both models appear to produce good predictions for lower shelf behaviour. Nevertheless, as pointed out by Curry, iv the equivalence between the models is not clear. The intention here is to explore the similarities.
4.1 Superposition of stresses
The basis of the model by Curry 17 is the superposition of the stresses at the crack tip. For the LUCF cycle described above, the stresses for each part of the cycle are given by a combination ofeqns (1) and (4}-(7), depending on the final loading state (Cases I-III). The equations for each case (see Fig. 3) are summarised below, where the variable r /a is fixed at Xo at each stress state and 0 is zero, i.e. directly ahead of the crack. It should be noted that for failure to occur following the RKR model given earlier, ais = Oy r = a*.
Case I - - N o effect from the prior overload, R3 > R~ > R2:
o* = av2 E~, [o'dov2] (15)
Case I I - -No effect from the reversed plastic zone, R 1 > R 3 > R2:
O'f ~ = O ' y 1 E y y [O' l /0"y1 ] 21- (O'y2 - - O'y1 ) ]~yy [(Of - - 1)/(o'v2 - avl)] (16)
Case I I I - -An effect from both the initial monotonic and the reversed
340 D. J. Smith, S. J. Garwood
plastic zones, R~ > R 2 > R3:
O'g = O'y1 )"~yy [O'l /O'yl ] - - 20"y1Y~yy [0"1/20"Vl ]
+ ( Y2 + :cy,. + (17)
In considering these three cases, Curry iv appears to have used a graphical superposition of the stress distributions obtained from finite element stress analysis. The results from Tracey 18 for near-tip conditions and from Ostergren 19 for stresses at larger distances ahead of the crack tip are used for the case when n = 10. However, by using the singular nonlinear stress distribution given by eqn (8) in eqns (15)-(17), an analytical solution for each load case and each stress exponent n can be obtained. Below, each case is considered in turn. For Case I, where there is no effect from the prior overload, the result is trivial and Kf = KI~, where Kf is the failure stress intensity factor at temperature T 2 after preload T 1.
For Case II, it is necessary to explore the valid range for loadings (and temperatures) for which eqn (16) can apply. As there is no effect from the reversed plastic zone R 2 but some effect from the initial plastic zone R1, the following inequality can be stated:
Kf < O-y2 (18) K1 avx
Similarly, it can be shown that
KI ~v 1 < (19)
K k O'y2
A solution for Kr can be found by substituting eqn (8) into (16) and rearranging, so that
K1 K r - ( - ° v z ~ " / q ~ l - ( a v ' ~ " ( K ' Y ~ l / q + - (20) KI~ \O 'v2 - - O'vl/1 {. \ O ' Y Z f \Kic/ ) Kit
where
and m = (n - 1)/(n + 1) (21)
q = 2/(n + 1) (22)
It is assumed that the characteristic distance X o is unchanged during the loading processes, and that the stress component n does not change with temperature.

Prediction of overload effects on fracture toughness 341
For Case III, where the final plastic zone R 2 lies within the initial R1 and reversed plastic zone R a, as shown in Fig. 3, the equivalent inequality to eqn (18) is
gf < O"y2 + O'vl (23) K1 2avl
The valid region for the preload condition, K1/K~c, can be found by solving eqn (17) using eqns (8) and (23):
__K, cK~ > \try2 } ( ° v ' ~- m/'~(1Y(O'v2 + O'V' ) ( . \ 2 } \ O'V, + 1 -- 2")~'-]-1/' (24,
This equation provides the minimum values for which eqn (17) is valid. Finally, to obtain a solution for Kf, substitution ofeqn (8) into eqn (17) gives
To explore the results that can be obtained from using eqns (19), (20), (24) and (25), the yield strength is required as a function of temperature. As it is pertinent to consider below the results obtained from the experimental study presented by Smith and Garwood (this vol., pp. 297-331) 1 the experimental yield stress data are used. It was shown that the yield stress is given by
V~ trv = ao + /~ ai Ti - 1 9 6 ° C < T<20°C (26)
i=1
where ai are polynomial coefficients. Using eqns (19) and (24), together with eqn (26), the minimum values of the
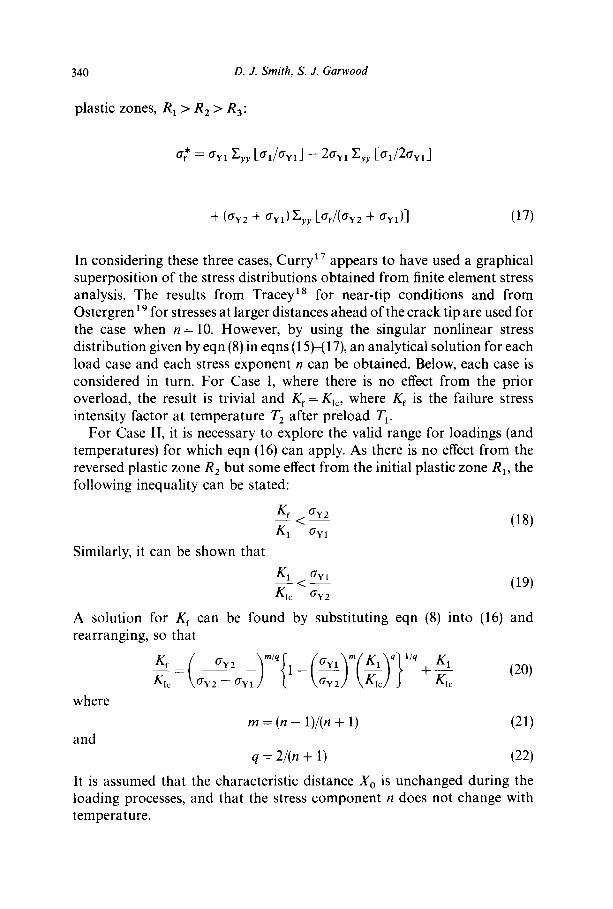
prior overload stress intensity K 1 at 20°C (relative to the fracture toughness K~c at T:) are shown in Fig. 4. Because, for Case II, the plastic zone R 3 at failure (Kf) is intended to be larger than the reversed yielding plastic zone R2 (but smaller than the initial plastic zone following the prior overload) the minimum values of Kl/Klc are lower than those for Case III. Clearly, from eqn (19), the Case II result is independent of the stress exponent n. For Case III, the minimum values of KI/K1c are dependent on n, but as can be seen from Fig. 4 the dependence is weak. It can be seen from comparing the minimum values of K1/KI~ that the range of application of the Case II condition is relatively small; for example, at -196°C and for n = 10, this range is 0.541-0.736.
The range of application of Case III is much more extensive, assuming small-scale yielding and that the crack tip stresses can be described by the singular stresses (eqn (8)), substituting for values of I(I/KI~ and using eqn (26)
342 D. J. Smith, S. J. Garwood
1.3 t i I i ~ i i i i
Case 171, displacement superoosifion l.Z
~ 1.1
~ ~0
~ 0.9
g ~ o.8
" / ' / CaseIl stress superposltion 0-7
Y 0.6
-200 -180 -160 -11,0 -120 -100 -80 -60 -Z,O -2 0 20
Temperefure, *C
Fig. 4. Min imum values of the prior overload level at 20°C with respect to the fracture toughness at T 2.
gives solutions to eqn (25) as shown in Fig. 5. In Fig. 5(a) the stress
component n remains constant and the temperature T 2 is varied. It can be seen that in general there is a dependence on temperature. However, at K~/KI~ = 3.25 the curves converge and a c o m m o n value o f Kr/Kl~ = 1"75 is obtained. In Fig. 5(b) the final fracture temperature is constant at - 170°C and the stress exponent n is varied. It can be seen that eqn (25) is relatively
3"0
E
2'6
10
i i i i
Case I Z1 %
-60°C
t a
t ~
30 Ease HI
26
1-0
i I I I 0 I I I I 0 2 3 Z, 5 / 2 3 4, 5
(a) Preload stress mtenslty factor ratio (b) Preload stress intensity factor raho K7/x~c <%) K,/K~c (%)
Fig. 5. Predic ted increase in the stress in tensi ty fac tor at failure af ter a p r ior ove r load K at 20°C acco rd ing to the stress supe rpos i t ion model : (a) for n = 10 and var ious low
t empera tu r e s T2; (b) for T 2 = - 1 7 0 ° C and var ious n.

Prediction of overload effects on fracture toughness 343
insensitive to n, and for the practical range of n = 5-100 there is little difference in the predicted final fracture toughness Kf after preloading at 20°C.
4.2 Discrete yielding
A number of a u t h o r s 2°-22 have proposed approximate treatments of crack tip plasticity based on the premise that flow can be modelled as either slip or tensile yielding on discrete surfaces emanating from the crack tip. The influence of yielding is viewed as effectively extending the crack a distance R ahead of its tip with the yield stress av acting to restrain the extended crack surface. The displacements u of the extended crack surface within R for small-scale yielding can be shown 23 to be given by
where
and
/# u[x] = a ~ FIx~R]
X FIx~R]= { - ~ l n ( 1
+
(27)
(28)
,,2 ,29,
The extent of the plastic zone R is given by
R - 8 (30)
Chell and co-workers 1°'11 have used this model to evaluate the Je-integral using eqn (14), and in principle the model is based on the superposition of displacements u. For the LUCF case, in which the final plastic zone R3 at failure occurs within the reversed plastic zone R2, the contour used to evaluate Je encompasses the final zone at x = R 3. Following Chell et al., ~ ~ the contributions to the displacements u[a] and u [ R 3 ] from each loading for the LUCF cycle for Case III (R 1 > R 2 > R3) are given by
u[a] = u [ o ' l / o ' y 1 ] - u[trff2avl ] + u[trff(trv2 + trvl)] (31)
u [ R 3 ] = u[R3/R 1, trl/trvl ] - u[R3/R2, a f f2avl] (32)
At the crack tip, small-scale yielding x /R = 0 and u[a] from eqn (27) for the preload is given by
# 2 K1 u[a] - (33)
avE'

344 D.J. Smith, S. J. Garwood
Equation (31) for the LUCF cycle becomes
E'u[a] = K~ K? ~ K~ (34) O'Vl 2•Vl O'y2 --[- O'y1
At x = R 3 the extent of R in eqn (27) is governed by the sequence of loading. Equation (31) becomes
E'u[R3]=~K~ F~R3]~-~ K2 F[R3]~ (35) ta¥1 LR, dJ t.2avl LR2AJ
Using eqn (30), the ratios Ra/R1 and R3/R2 are given by
R3=(Kf~2(. _avl - )2 (36) R, \ & / \av2 + ~rvl
R3_3_.(gf~2(. 2o.yl )2 (37) R2 \/(1/ \~v2 + ~1
Combining eqns (34) and (35) and substituting into eqn (14) gives
Ki{ K? {1_FI-R31-{, K? {I_F[-R3-It KF {38) , : " v : - 0 - , , ~ LR1JJ 2ow. LR.,JJ + (ov, + ov2)
As the function F includes terms involving Kr, a solution for K r from eqn (38) can only be found numerically.
The minimum values of KffK k for which the model can be applied can be obtained directly from eqn (38). Using the limiting value of Kf/KI given by eqn (23) and substituting into eqn (38) gives
K,~> (39) Cry2 (~v2 + °'v0/4~vl] - 0"0368
Substituting for the yield strengths Ov~ at 20°C and Cry2 at T2, the minimum values of K1/KIc are shown in Fig. 4. For KI/KI~ values greater than those given by eqn (39), the values of Kf/Kl~ obtained numerically from eqn (38) are shown in Fig. 6 for various temperatures T 2. As with the stress superposition model the results shown in Fig. 6 illustrate a weak temperature dependence in the prediction of Kf/K~. The greatest differences between different temperatures arise at high values of the preload K~/Kxc.
Chell za has presented an approximate solution to eqn (38) by assuming that eqn (28) is approximated by
FIR]'= (1 -- R) 2 (40)

Prediction of overload effects on fracture toughness 345
Fig. 6.
3
~...2
~ ,
&
' ' ' ' "c ~1
Case III re -loo
-60% _~
[ I I I 0 I 2 3 4 5 Preload stress intensity factor ratio
K,/K c t r e)
Predicted increase in the stress intensity factor at failure at T 2 after a prior overload K~ at 20°C according to the displacement superposition model.
Substitution into eqn (23) leads to a quadratic equation in (gf/Klc) 2, given by
0 = d2(g~c) 4 - d t ( K f ) 2 - d O \ K I c , ] (41)
where coefficients d2, d 1 and d o are given by
and
d2=(-av--- 1 ~'7av___2z(KI___s~ 2 \ O ' y 2 -'~ O'yl ,/ 0"Vl \Kx/
\0"V2 -~ O'y1 \0"V2 "~- 0"y1// O'Vl
(42a)
(42b)
d o = 1 (42c)
can be solved algebraically. A comparison between the Equation (41) approximate solution (eqn (41)) and a numerical solution to eqn (38) is given in Fig. 7. At low temperatures the differences between the two solutions are not large. However, at higher temperatures (for example, 60°C) the approximate solution deviates significantly from the exact solution.
It is worth bearing in mind that Chell and co-workers ~°'11 used the flow stress 6 at the different temperatures rather than the yield strength a v as presented here. The A533B material used in the present study exhibited low strain hardening, and the use o f# in eqn (38), rather than o" v, gave negligible differences.

346 D. J. Smith, S. J. Garwood
Fig. 7.
\ 3,C ~2
20
2
~ 1.0
U..
/ f x O (
_ _ 796°C _ _ _ 6 0 ° E
[ i I I
1 2 3 Z, 5 Preload s t ress in tens i t y fac tor raho
/Xlc r2J Comparison of the predicted increase in Kf based on a numerical and an
approximation solution to the displacement superposition model.
4.3 A reference stress approach
Previously, the local crack tip cont inuum fields during load and temperature cycling have been examined in detail. Here the intention is to take a simplified approach and examine the global behaviour across the net section ahead of the crack. When singular crack tip stress distributions are examined in detail, it can be observed 24 that at some point (say, x = XR) the stress is approximately independent of the hardening exponent n. As in creep analysis, this stress will be called the reference stress and its position in space the reference stress point. The role of the reference stress in creep analysis is to be able to perform a uniaxial test and measure the reference strain eR at reference stress a R. A measure of the overall deformation of the component can then be established. 25 In the present context the reference stress is not used to predict fracture but merely to describe approximately the global behaviour that leads to differences between the response of components with and without preload. An upper bound reference stress is given by
a R >_ 2a v (43)
where 2 is a scalar. As aR is a measure of the global response, no account is taken of the angle and position ahead of the crack tip as in eqn (1). Equation (43) merely states that the reference stress (for proportional loading only) is

Prediction of overload effects on fracture toughness 347
on a trajectory within the yield surface in stress space. It is conventional to equate 2 to the ratio of the load P to the limit load PL of the component.
Using the earlier analysis of superposition of stresses, eqn (43) can be substituted directly into eqn (25), where the ratio K1/Klc is replaced by the ratio %l/ORe:
O'R~f- ( - -O'Y 2 - ) m / ~ l ( 1 - - ( f f y l ~ r a ( ( T R l ~ q ( 1 - - 2 r n ) } l / q (44)
%¢ kaY2 + avl \Or2,/ \ aRc /
The advantage of the reference stress approach lies in applying the limiting conditions
O'Rf ~ O 'y2 (45a) and
%1 -< aYl (45b)
Equation (44) cannot be applied outside the limits imposed by eqns (45a) and (45b), whereas eqn (25) and similarly eqn (38), derived from the superposition of displacements, are unbounded.
A comparison of the three models is given in Fig. 8. There are two sets of axes given: the stress intensity factor ratio axes are used to scale the results from eqns (25) and (38), whereas the reference stress ratio axes are used to scale the result from eqn (44). The results obtained from eqns (25) and (44) are therefore the same when depicted in the manner shown in Fig. 8. It can be seen that at K~/KIc > 4 the stress- and displacement-based models are in general agreement. However, at lower values of KI/K1~ the stress
Fig. 8.
,,• 3"0
~ e o
10
Y.
_ _bis l odel n'umericol: [ -.. Stress model (n = 1001 [
_ Approximation . . ,~
. . / ' " %1 o'~
0 I I I I 0 1 2 3 4 5 Equivalent preload rat io K 1 /Kzc ,
~R, %c Comparison of theoretical predictions for the benefit gained at - 170°C from a prior
overload sequence at 20°C for A533B steel.

348 D. Z Smi~, S. Z Garwood
superposition model predicts lower values than does the displacement model. In using the reference stress model it can be seen directly from Fig. 8 that the range of application of ~RI/~Rc is relatively limited. As the temperature increases and ~rR¢ increases, the range of application will decrease.
5 COMPARISON WITH EXPERIMENTAL DATA
In this section the models will be compared directly with the experimental data given by Smith and Garwood (this vol., pp. 297-331). 1 Curry ~v applied the stress superposition model to a particular set of data. Chell and co-workers ~°'1~'23 have applied their model to other data. However, in neither case have both the models been applied to the same data set. Furthermore, it is not clear in some of the examples examined by Chell and co-workers l°'a L23 whether the numerical or the approximate solutions were used. In the following, the models are applied without ambiguity. In the first instance, the variability in proof loading and subsequent fracture at - 170°C is examined, followed by a more general application of the models to the complete temperature range examined experimentally.
5.1 Var iab i l i ty at - 1 7 0 ° C
The results of the tensile tests conducted at 20°C and - 170°C, to examine the yield variability, can be used directly in the models. From Smith and Garwood (this vol., pp. 297-331) 1 the median a v at 20°C was 510 MPa, with a variation of approximately _+ 11 MPa at the 90% confidence intervals. The median av at - 170°C was 788 MPa, and at the 90% confidence interval the variation is approximately _+ 17 MPa. Using the two median values of av in the stress superposition model (eqn (25)) produced predictions which were no different from those using the extreme values (at the 90% confidence intervals) of av. When a median value of av (510 MPa) at 20°C was used in the model, together with the lower confidence value of a v (770 MPa) at -170°C, the difference in predictions from that obtained when using the median a v (788 MPa) at -170°C was c. 0.5% at high values of K1/K1c. Similar results were obtained from the displacement superposition model.
The variability in the experimental fracture toughness data is shown in Fig. 9(a) and (b) in terms of stress intensity factor K ratios where the data have been normalised with respect to the median value o fK c. As discussed in Smith and Garwood (this vol., pp. 297-331), ~ the distribution of the prior overload fracture data was bimodal. There was also a slight bimodality in the normalised prior overload level. However, the data points for Ki/K¢ do

Prediction o f overload effects on fracture toughness 349
0:99 0.98
~95
0.90
0.80
6 0.70 0.60 oso ~ 0 036
= 0'20
0.10
0O5
0.02 0.01
0
Kt/Ktc K~IK/c
/: /-
0.7
~ 3 - 0
¢:
m
(a) Ln normalised, K (b)
I 1 i I I I I
Experimental
Mode/ ~ D i s p l a c e m e n f superposifion - - - - S t r e s s superposifion
f
I I i i i i [ i i 1. 06 08 t0 13 14 F5 18 20 2.2 21. 36 28
Preload normahsed stress intensify factor, K I /K Ic
Fig. 9. Normalised preload and failure fracture toughness of A533B steel in the L-T orientation at - ! 70°C: (a) distribution of experimental data; (b) comparison of experiment
and prediction.
not correspond to those for Kr/K ~. It is apparent that the two curves, which each exhibit two linear regions, are unrelated.
The data shown in Fig. 9(a) are also shown in Fig. 9(b), where the 90% confidence intervals for KI/K¢ and Kr/K ~ are shown as error bars extending from the median values of 1-51 and 1.71 respectively. The predictions from the displacement (eqn (38)) and stress superposition (eqn (25)) models are shown in Fig. 9(b) as a function of K1/K ¢. Both models predict lower Kf/K~ values than the experimental median values. The error in prediction for the stress-based model is about 22% and for the displacement model is about 14%. Neither of the models predicts the variation in the fracture toughness after prior overloading simply from the variation in the yield stress.
5.2 Fracture toughness transition curves
The influence of prior overload on the measured fracture toughness in terms of CTOD has been expressed as an equivalent stress intensity factor ratio ~(&r/6o). For valid Kit tests this ratio is equal to the ratio Kf/K w The proposed models for predicting prior overload effects provide solutions for Kf in terms of the ratio Kf/KIc. To compare the predictions with the experimental data over the fracture transition regime, the theoretical models are normalised with respect to Ko, which is a generalisation for K~c, and the experimental data are expressed as an equivalent stress intensity factor ratio given by ~(Jf/Jo) (or equally ~(6f/6o) ). Figure 10 illustrates experimental

350 D. J. Smith, S. J. Garwood
Fig. 10.
34 3.2 s.o
7O
2.6
2.4
~I 2'2 ~ 2.O
-~ 1.8 ~ o ~ ~ 1.6
~ "~ 1.4
~ 1.2
~ 1.o
0.8 0.6
0.4
o i
- tO0~ ~ Preloaded~
m ~ 6 o o c p r e d i c t i ° n
~ remp °( T 2
o : :,gg x -60 No preload effect
1.0 70 30 40 5.0 6.0 70 80 90
Preload equivalent s tress intensify factor ratio. ~ ¢ ~ 7 - ~ o J
10-0
Comparison of experimental and predicted increase in fracture toughness from the displacement superposition model at various temperatures.
data at various temperatures for the ratio x/@/6o) as a function of the preload equivalent stress intensity factor x/(61/6o).
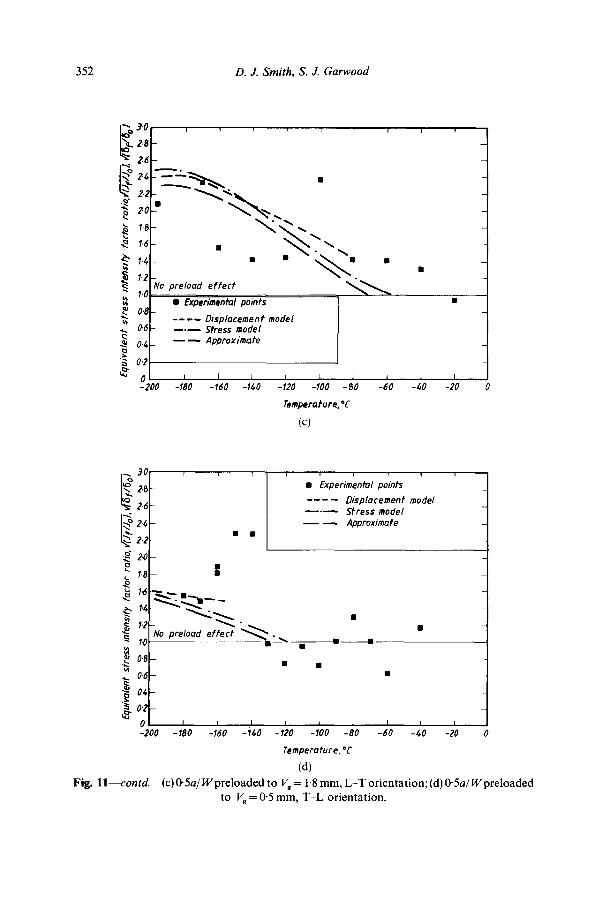
Also shown in Fig. 10 are predictions obtained from the displacement superposition model (eqn (38)). It will be seen that there is considerable scatter in the experimental data. To provide a reasonable means of comparison, values of 60 at a particular temperature obtained from a fitted curve (see eqn (6)) from Smith and Garwood (this vol., pp. 297-331) ~ have been used as input to the predictive models. The average value of the preload 61 (or J~) for a particular case (such as specimens with a / W = 0"5) has also been used as an input to the models. With these inputs, together with the appropriate yield strength for the temperature under consideration, the value ofKf/K o can be predicted. Figures 1 l(a)-I l(e) illustrate the predictions for each initial crack length, preload level and orientation, and can be compared with the normalised experimental data. For all conditions of initial crack length and a low preload level the models predict a benefit only up to temperatures around -120°C, whereas at a higher preload level the models predict a benefit up to about -60°C.
For short crack lengths (a/W=0.2) Fig. ll(a) shows that the models overestimate the benefits on the lower shelf, whereas the experimental data indicate a benefit over a larger range of temperatures. At greater crack lengths (a/W= 0"5) and in the same orientation (L-T), the models appear to underestimate the benefit obtained, particularly at the lower temperatures,

Prediction of overload effects on fracture toughness 351
3 . 0 •
, .~ e.a I - - - - - - ~ ' ~ a o , , . . , t m~el ~6 I l l l Stress model
~ Approximate
~ 2.z 2.O
18 •
1"~mm-m~ ~ "~" " m -.~,,,,~.
1 . 0 ~ " • • • •
02 a J -200 -180 -160 -160 - 1 2 0 -100 -80 -60 -60 -20
Tempera lure, °C
(a)
34
~ 2.2 2.0
I I I I
• •
1 I I I i
• Experimental po ints
- - - - - Oisplacement model m . ~ Stress model m ~ Approximate
Vo preload e f fec t ~ m -
l "" O.2 1 I I I I I I I I I
-200 -@BO -160 -160 -120 -100 -90 -60 -40 -20 0
Temperature, * C
(b)
• •
Fig. 11. Comparison of experimental data and predictions for A533B SENB specimens: (a) 0.2a/W preloaded to Vg = 0"2 ram, L-T orientation; (b) 0.5a/W preloaded to V s = 0-5 mm, L-T
orientation.
352 D. J. Smi th , S. J. Garwood
2.8
2.~ .~" "~ 2" G
• .~ 1.4
1.2
1.0
0.8
O6
0.4
0.2
0 _2001
Vo pre/oad ef fect
• Experimental points
. . . . Displacement model - - , ~ Stress mode/ n ~ Approximate
L - 1 8 0 - 1 6 0
~ m
-f40 -120 -100 -80
Temperafure,*E
(c)
-60 -~0 -20
~ 3.0
2.8
2.6
~ 2.4
2.2
2.0
1.8
~ 1.4
Fig. l l - - c o n t d .
i i r ~ i =
• Experimental points
. . . . Displacement mode/ ~ . ~ Stress model ~ Approximate
,.o I 0.8
0.6
0"4
0"2
0 -200
I
-
No pre/oad effect " ~ l . ~ ,m mm
(c) 0 " 5 a / W p r e l o a d e d to V~ = 1-8 mm, L - T orientation; (d) 0 " 5 a / W p r e l o a d e d to V, = 0.5 mm, T - L orientation.
I I ~ I i I I I I
-180 -160 -160 -120 -100 -80 -60 -40 -20 0
Temperature, =C
(d)

Prediction of overload effects on fracture toughness 353
~ 2 . 8 ~ ~ • Experin~ental points I~ . . I ~ . . . . Displacement model t~ z'o~ ~ . ~ - - ' - - Stress model ~ ~.4F - - - ~ . " - .-- . . [ - - - ~ p ~ o x i m o t e
1 :.2.21- I
~ 11.; topre loadef fec f
0"~ • • • •
0~
0"~
• ~ 0.2
-200 -180 -160 -1~0 -120 -100 -80 -60 -60 -20
Tempera lure, *C
(e)
~ . 2.8i
"f 2.~ 2.2
~ 2.0
I'51
1.4
t~ t~
4
1.2
I.C ~E
06 I O4
o.2 i 0 -200
• Experimental points . . . . Displacement model J l 1 Stress mode/ - - - - Approximate
"No pre/oad e f f e c t " ~ L ~
-180 -160 -160 -120 -100 -80 -60 -/,0 -20 0
Tempera fure,*E
(f) Fig. l l--contd. (e) 0.5a/Wpreloaded to V~ = 1-8 mm, T - L or ientat ion; (f) 0"7a/Wpreloaded
to V~ = 0.7 mm, L - T orientat ion.

354 D.J. Smith, S. J. Garwood
as shown in Fig. l l(b). Individual data points indicated a sharp loss of benefit at around - 140°C. However, at a higher temperature, - 100°C, there was again a benefit.
At a higher preload level, for the same crack length and orientation, a benefit was obtained over a wider temperature range. Figure I l(c) shows that the models and the experimental data were in general agreement, although the experimental data suggested that a benefit can be obtained at higher temperatures than those predicted from the models.
In contrast to the results obtained in the L-T orientation, the experimental data from the T-L orientation (Figs 1 l(d) and 1 l(e)) showed a loss of benefit for temperatures above that at which tearing began to occur, -80°C. Whereas, at the low preload level, the models predict benefits for temperatures below initiation of tearing, -80°C, as shown in Fig. 1 l(d), at a higher preload level the models predict a benefit for temperatures above initiation of tearing, as can be seen in Fig. 1 l(e).
For temperatures higher than that at which tearing initiates, it can be seen from Figs 1 l(d) and 1 l(e) that there is a loss of benefit.
For crack lengths ofa/W= 0"7, the models predict a benefit up to - 130°C, whereas the experimental data show a distinct loss of benefit for temperatures greater than -130°C (see Fig. 1 l(f)).
The evidence presented here is contrary to that presented by Chel123 and Curry37 Both authors have indicated that their models were in reasonable agreement with experimental data. Although there is, in the present study, limited evidence of agreement between theory and experimental results on the lower shelf, there is also considerable scatter.
5.3 An approximation for lower shelf behaviour
It was shown earlier that the displacement and the stress superposition models give only an approximate prediction of the experimental results. In particular, as shown in Fig. 10, there is considerable scatter x/(6~/3o) over a range of temperatures, compared with the predictions of the two models. It is proposed that a more representative parameter for the load-bearing capacity is the reference stress. In this section this parameter is examined and an approximation to the reference stress model proposed earlier is presented.
The predictions according to the stress superposition models using eqns (25) and (44) require a knowledge of the yield strength at temperatures T 1 and T2, and the stress exponent n (assuming that n is the same at T 1 and T2). The predictions using the displacement superposition model not only require a knowledge of the yield stress variation with temperature but also require a numerical solution for (Kr/KIc) from eqn (38). A certain degree of
Prediction of overload effects on fracture toughness 355
approximation can be considered to circumvent the need for solving the complex equations. An approximation is given by
Kf ( ~v2 . ' ~ l + a v l K l ~ KI~ \O'y2 + a v l / ( av2 Kic)
(46)
This equation can also be expressed in terms of reference stress by replacing Kf/Klc with gRf/aR¢ and K~/KIc. The approximation is shown in Fig. 8, where it can be seen that for t~R~/O'R¢ < O'VI/~Rc the approximation is a lower bound on both the stress superposition and the displacement superposition models. This lower bound can also be observed in Figs 1 l(a)-I l(e). Bearing in mind the amount of scatter shown in these figures, it appears that the approximation given by eqn (46) is adequate for predicting the effect of proof loading on fracture toughness and load-bearing capacity in the lower shelf regime.
6 CONCLUSIONS
The basic principles behind the continuum modelling of crack tip behaviour for cyclic loading have been reviewed. Two models based on plastic superposition of stresses and displacements proposed earlier to predict the influence of prior overloading (LUCF cycle) on cleavage have been reviewed. Whereas, in earlier studies, only a graphical technique was used to provide solutions for the stress superposition model of Curry, in this paper a complete analytical solution has been presented. The displacement-based model requires a numerical solution, but earlier suggested approximation has been shown in certain circumstances to produce large errors when compared with the numerical solution. It has been proposed that a reference stress approach can be adopted where the prior overload level is automatically limited by the yield (or flow) strength.
Comparison with the experimental data described by Smith and Garwood (this vol., pp. 297-331) 1 has illustrated that neither the Curry nor Chell models can predict the variation in the benefit in toughness at - 170°C after prior overloading at 20°C using as input to the models the variation in the yield strength at -170 and 20°C.
Contrary to earlier evidence, the theoretical models provide only an approximate prediction of the benefit in toughness up to a limited temperature. They are unable to predict the observed differences in fracture behaviour between the L-T and T-L orientation.
For lower shelf fracture toughness, a proposed approximation provides solutions which are easier to obtain that those from the more complicated

356 D. J. Smith, S. J. Garwood
models of Chell and Curry. The predictions of the approximation are comparable with the scattered experimental data.
A C K N O W L E D G E M E N T S
The work was funded jointly by research members of The Welding Institute and the Minerals and Metals Division of the U K Department of Trade and Industry. The authors would like to thank their colleagues in the fracture department for helpful discussions and comments. The laboratory staff are thanked for conducting the large number of tests, particularly Mr Neaves for supervising the tests.
R E F E R E N C E S
1. Smith, D. J. & Garwood, S. J., Experimental study of effects of prior overload on fracture toughness of A533B steel. Int. J. Pres. Ves. & Piping, 41 (1990)297-331.
2. Nichols, R. W., The use of overstressing techniques to reduce the risk of subsequent brittle fracture. Parts 1 and 2. Br. Welding J. (January, February 1968).
3. Harrop, L. P., Warm prestressing during severe thermal shock loading of a pressure vessel. Int. J. Pres. lies. & Piping, 7(6) (1979) 463-82.
4. Pickles, B. W. & Cowan, A., A review of warm prestressing studies. Int. J. Pres. Ves. & Piping, 14 (1983) 95 131.
5. Smith, D. J. & Garwood, S. J., The significance of prior overload on fracture resistance: A critical review. Int. ,I. Pres. Ves. & Piping, 41 (1990) 255-96.
6. Rice, J. R., Mathematical analysis in the mechanics of fracture in mathematical fundamentals. In Fracture I1"ol. 2. Academic Press, New York, 1968, pp. 191-3i 1.
7. Hellen, K., An Introduction to Fracture Mechanics. McGraw-Hill, New York, 1985.
8. lllyushin, A. A., The theory of small elastic-plastic deformations. Prikadnaia Mat. Mekh., 10 (1946) 347-54.
9. Rice, J. R., Mechanics of crack tip deformation and extension by fatigue. In Fatigue Crack Propagation. STP415. American Society for Testing and Materials, Philadelphia, PA, 1967, pp. 247-309.
10. Chell, G. G. & Curry, D. A., Mechanics and mechanisms of cleavage fracture. In Developments in Fracture Mechanics--2. The Mechanics and Mechanisms of Fracture in Metals, ed. G. G. Chell. Applied Science Publishers, London, 1981, pp. 101-92.
11. Chell, G. G., Haigh, J. R. & Vitek, V., A theory of warm prestressing: experimental validation and the implications for elastic-plastic failure criteria. CEGB CERL Report RD/L/N63/79, 1979.
12. Ritchie, R. O., Knott, J. F. & Rice, J. R., On the relationship between critical tensile stress and fracture toughness in mild steel. J. Mech. Phys. Solids, 21 (1973) 395 410.
Prediction of overload effects on fracture toughness 357
13. Hutchinson, J. W., Plastic stress and strain fields at a crack tip. J. Mech. Phys. Solids, 16 (1968) 337.
14. Rice, J. R. & Rosengren, G. E, Plane strain deformation near a crack tip in a power-law hardening material. J. Mech. Phys. Solids, 16 (1968) 1-12.
15. Ritchie, R. O., Server, W. L. & Wullaert, R. A., Critical fracture stress and fracture strain models for the prediction of lower and upper shelf toughness of nuclear pressure vessel steels. Met. Trans., A, 10A (1979) 1557-70.
16. Chell, G. G. & Vitek, V., The J-integral as a fracture criterion: Perhaps it doesn't mean what you thought it meant. Int. J. Fract., 13 (1977) 882.
17. Curry, D. A., A micromechanistic approach to the warm prestressing of ferritic steels. Int. J. Fract., 17(3) (1981) 335-43.
18. Tracey, D. M., J. Engng Mater. Technol., 98 (1976) 146-51. 19. Ostergren, W. J., MSc thesis, Brown University, 1969. (Quoted by Curry. 17) 20. Barenblatt, G. I., Mathematical theory of equilibrium cracks in brittle fracture.
In Advances in Applied Mechanics, Vol. VIII. Academic Press, New York, 1962. 21. Dugdale, D. S., Yielding of steel sheets containing slits. J. Mech. Phys. Solids, 8
(1960) 103~. 22. Bilby, B. A., Cottrell, A. H. & Swinden, K. H., The spread of plastic yield from a
notch. Proc. R. Soc., A, 272 (1963) 304-14. 23. Chell, G. G., Some fracture mechanics applications of warm prestressing to
pressure vessels. In Proc. 4th Int. Conf. Pressure Vessel Technology. Institution of Mechanical Engineers, Paper C22/80, pp. 117-24.
24. Smith, D. J., Creep crack growth in low alloy steels under steady and cyclic loading. PhD thesis, University of London, 1983.
25. Boyle, J. T. & Spence, J., Stress Analysis for Creep. Butterworths, London, 1983.