applying opportunity mapping to social justice goals and policy jason reece, aicp kirwan institute...
TRANSCRIPT

Applying Opportunity Applying Opportunity Mapping to Social Justice Mapping to Social Justice
Goals and PolicyGoals and Policy
Jason Reece, AICPJason Reece, AICPKirwan InstituteKirwan Institute
Opportunity Mapping WorkshopOpportunity Mapping WorkshopNovember 30November 30thth 2007 2007

Similar Models Used ElsewhereSimilar Models Used Elsewhere
The concept of using neighborhood based data to The concept of using neighborhood based data to assess neighborhood opportunities and challenges is not assess neighborhood opportunities and challenges is not unprecedented and is used in various sectors unprecedented and is used in various sectors (examples)(examples)
Business: Site selection analysis by firms such as ClaritasBusiness: Site selection analysis by firms such as Claritas Community Development: Criteria used to identify areas for Community Development: Criteria used to identify areas for
targeted investment or areas targeted for specific community targeted investment or areas targeted for specific community development initiativesdevelopment initiatives
Housing: Models that try to connect affordable housing to areas Housing: Models that try to connect affordable housing to areas of job growth “work force housing initiatives”of job growth “work force housing initiatives”
The use of neighborhood based indicators for measuring The use of neighborhood based indicators for measuring sustainability is well established in the Austin regionsustainability is well established in the Austin region
Opportunity mapping adds an additional analytical lens to this Opportunity mapping adds an additional analytical lens to this significant body of existing work in the regionsignificant body of existing work in the region

What has opportunity mapping What has opportunity mapping been used for in other regions?been used for in other regions?
The Kirwan Institute has conducted opportunity The Kirwan Institute has conducted opportunity mapping in approximately a dozen metropolitan mapping in approximately a dozen metropolitan regions, some prominent examples of this work regions, some prominent examples of this work informing action can be found in three regionsinforming action can be found in three regions ChicagoChicago BaltimoreBaltimore ClevelandCleveland AustinAustin Ohio (Education)Ohio (Education) African American MalesAfrican American Males

ChicagoChicago
Chicago:Chicago: The Kirwan Institute worked with the The Kirwan Institute worked with the Leadership Council for Metropolitan Open Communities Leadership Council for Metropolitan Open Communities and the Institute of Race and Poverty to conduct an and the Institute of Race and Poverty to conduct an opportunity mapping analysis in the Chicago region opportunity mapping analysis in the Chicago region
The opportunity maps produced as part of the Chicago research The opportunity maps produced as part of the Chicago research were utilized by the Leadership Council for advising inner-city were utilized by the Leadership Council for advising inner-city voucher holders looking to relocate to higher opportunity voucher holders looking to relocate to higher opportunity neighborhoods in Chicago neighborhoods in Chicago
In addition, the research was utilized to inform inclusionary In addition, the research was utilized to inform inclusionary housing advocacy in the Chicago region, focusing on housing advocacy in the Chicago region, focusing on inclusionary zoning advocacy and to assess the impacts of the inclusionary zoning advocacy and to assess the impacts of the Low Income Housing Tax Credit program on expanding access Low Income Housing Tax Credit program on expanding access to opportunity in the Chicago region to opportunity in the Chicago region

Chicago’sChicago’sCommunities of Communities of
OpportunityOpportunity
This example is a 6 This example is a 6 county Communities county Communities of Opportunity map for of Opportunity map for the Chicago regionthe Chicago region Red = Lowest Red = Lowest
OpportunityOpportunity Blue = Highest Blue = Highest
OpportunityOpportunity
Source: Report published by the Leadership Council for Metropolitan Open Communities 2005

Baltimore (Litigation)Baltimore (Litigation)
Baltimore:Baltimore: Opportunity mapping in the Opportunity mapping in the Baltimore region was conducted as part of the Baltimore region was conducted as part of the Thompson v. HUDThompson v. HUD fair housing litigation fair housing litigation Plaintiffs used opportunity mapping to frame their Plaintiffs used opportunity mapping to frame their
remedial proposal, in response to a liability ruling that remedial proposal, in response to a liability ruling that found the U.S. Department of Housing and Urban found the U.S. Department of Housing and Urban Development in violation of the Fair Housing Act Development in violation of the Fair Housing Act
The plaintiffs have proposed establishing 7,000 The plaintiffs have proposed establishing 7,000 affordable housing units in the region’s high- affordable housing units in the region’s high- opportunity communities, available to volunteers who opportunity communities, available to volunteers who wish to relocate out of the City of Baltimore’s public wish to relocate out of the City of Baltimore’s public housinghousing

Proposed remedy identifies Proposed remedy identifies Communities of Opportunity Communities of Opportunity
Used 14 indicators of Used 14 indicators of neighborhood opportunity to neighborhood opportunity to designate high and low designate high and low opportunity neighborhoods in opportunity neighborhoods in the regionthe region Neighborhood Quality/HealthNeighborhood Quality/Health
• Poverty, Crime, Vacancy, Poverty, Crime, Vacancy, Property Values, Population Property Values, Population TrendsTrends
Economic Opportunity Economic Opportunity • Proximity to Jobs and Job Proximity to Jobs and Job
Changes, Public TransitChanges, Public Transit Educational OpportunityEducational Opportunity
• School Poverty, School Test School Poverty, School Test Scores, Teacher QualificationsScores, Teacher Qualifications

African American’s African American’s are generally are generally clustered in the clustered in the Baltimore region’s Baltimore region’s lowest opportunity lowest opportunity neighborhoodsneighborhoods
Opportunity and Race

Subsidized housing Subsidized housing opportunities in opportunities in Baltimore are Baltimore are generally clustered generally clustered in the region’s in the region’s lowest opportunity lowest opportunity neighborhoodsneighborhoods
Conditions in Baltimore

Follow Up Work Follow Up Work with Maryland with Maryland
ACLUACLU Outside of the trial we Outside of the trial we
have worked on follow have worked on follow up activities with the up activities with the ACLUACLU
Looking at foreclosure Looking at foreclosure and rental housing in and rental housing in high opportunity areas high opportunity areas (identifying potential (identifying potential locations to secure locations to secure affordable housing)affordable housing)
Looking at the Looking at the movement of partial movement of partial consent decree moversconsent decree movers

ClevelandCleveland
Cleveland:Cleveland: Opportunity mapping and GIS analysis were Opportunity mapping and GIS analysis were used in the Cleveland region to assess economic used in the Cleveland region to assess economic opportunities in the region, in relation to Minority opportunities in the region, in relation to Minority Business concentrationsBusiness concentrations
Most MBE's in the region were clustered in neighborhoods with Most MBE's in the region were clustered in neighborhoods with declining economic opportunity, producing potential impediments declining economic opportunity, producing potential impediments to business networking and access to marketsto business networking and access to markets
Additional opportunity analysis was used to inform Additional opportunity analysis was used to inform regional growth and development policy regional growth and development policy recommendations formulated by the Presidents’ Council recommendations formulated by the Presidents’ Council of Cleveland, a committee of leading political, civic and of Cleveland, a committee of leading political, civic and business leaders in the African American community business leaders in the African American community

MBE and Projected Job Change 2000-2030MBE and Projected Job Change 2000-2030

MBE and Population Change 1990 to 2000MBE and Population Change 1990 to 2000

Cleveland opportunity analysis & raceCleveland opportunity analysis & race

Austin, TX Austin, TX

Background on the Austin InitiativeBackground on the Austin Initiative
The Central Texas Opportunity initiative was initiated by The Central Texas Opportunity initiative was initiated by Community Partnership for the Homeless and involved a Community Partnership for the Homeless and involved a steering committee representing a diverse array of steering committee representing a diverse array of organizations in the Central Texas regionorganizations in the Central Texas region
The committee included representatives from The committee included representatives from PeopleFund, a regional community development financial PeopleFund, a regional community development financial
institution; institution; Envision Central Texas, a regional planning body; Envision Central Texas, a regional planning body; Capital Metro, the region’s public transit authority; Capital Metro, the region’s public transit authority; the Indigent Care Collaborative, a non-profit health organization the Indigent Care Collaborative, a non-profit health organization
focused on public health issues for the poor; focused on public health issues for the poor; Capitol Area Council of Governments; Capitol Area Council of Governments; United Way Capital Area; United Way Capital Area; Habitat for Humanity; Habitat for Humanity; and several professors from the University of Texas’ Community and several professors from the University of Texas’ Community
& Regional Planning and Public Health Departments & Regional Planning and Public Health Departments
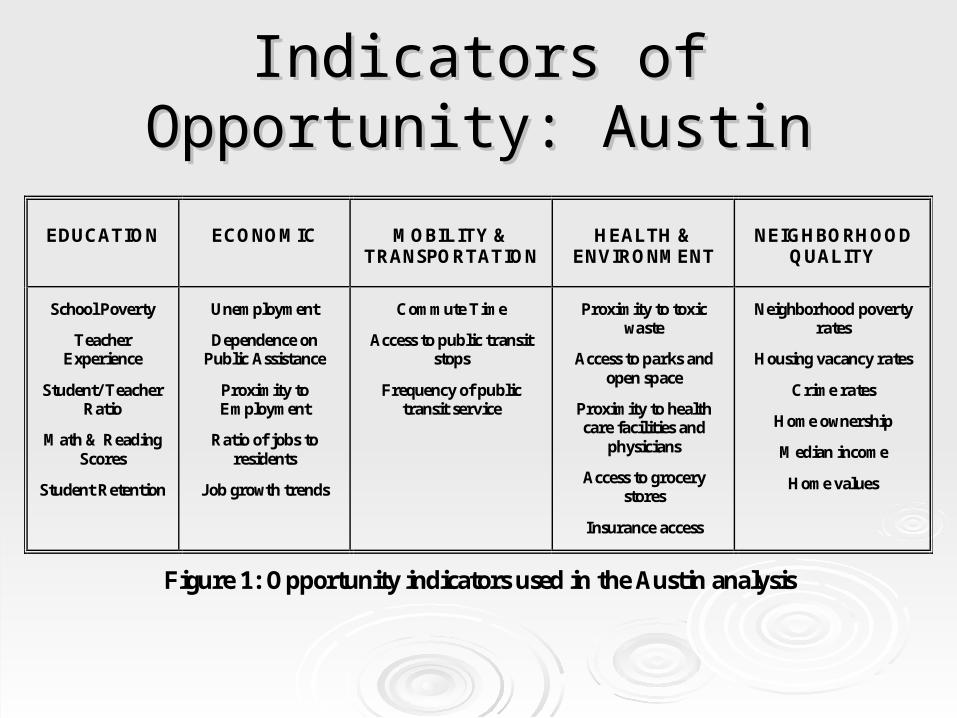
Indicators of Opportunity: AustinIndicators of Opportunity: Austin
EDUCATION ECONOMIC MOBILITY & TRANSPORTATION
HEALTH & ENVIRONMENT
NEIGHBORHOOD QUALITY
School Poverty
Teacher Experience
Student/ Teacher Ratio
Math & Reading Scores
Student Retention
Unemployment
Dependence on Public Assistance
Proximity to Employment
Ratio of jobs to residents
Job growth trends
Commute Time
Access to public transit stops
Frequency of public transit service
Proximity to toxic waste
Access to parks and open space
Proximity to health care facilities and
physicians
Access to grocery stores
Insurance access
Neighborhood poverty rates
Housing vacancy rates
Crime rates
Home ownership
Median income
Home values
Figure 1: Opportunity indicators used in the Austin analysis

How is Opportunity Distributed in a Hot
Market City?
(Austin, TX)
Opportunity in the Austin region is more
centralized (not a hollow region like Cleveland or
Baltimore). Although, opportunity is more centralized it is still
spatially segregated.

An in-depth view of the distribution
of high and low opportunity areas in and around the
City of Austin

Linguistically Isolated People and the Comprehensive Opportunity Map for
the Austin Region

Children of Color and Educational OpportunityChildren of Color and Educational Opportunity

Public Health and Environmental
Quality
Opportunity Map
(based on indicators of public health and
environmental quality)

Using Opportunity Mapping Data to Using Opportunity Mapping Data to Explore LinkagesExplore Linkages
Example: How is the region’s public transit Example: How is the region’s public transit infrastructure connected to the region’s infrastructure connected to the region’s health care facilities (clinics, physicians health care facilities (clinics, physicians offices, hospitals)offices, hospitals) Public transit lines are well connected to Public transit lines are well connected to
public health resources in the City of Austin, public health resources in the City of Austin, but transit access gaps exist with regard to but transit access gaps exist with regard to health care resources directly to the west and health care resources directly to the west and north of the City of Austin north of the City of Austin


Shared Challenges: Shared Challenges: Viewing Areas of Viewing Areas of
Educational Educational Opportunity in the Opportunity in the
State of OhioState of OhioThe following map
presents areas of high (dark colors) and low
(light colors) educational opportunity in the State.
(Based on index of school quality and
assessment of barriers to educational attainment).
Note that many rural and urban communities face similar education
challenges. Map Prepared by the Kirwan Institute for The
Ohio State Economic Access Initiative

Neighborhoods of Opportunity Neighborhoods of Opportunity and African American Malesand African American Males
A Case Study of Seven Metropolitan A Case Study of Seven Metropolitan RegionsRegions


FindingsFindings 2 out of 3 African American males in the 2 out of 3 African American males in the
seven metropolitan areas were found in seven metropolitan areas were found in low opportunity communitieslow opportunity communities Compared to 1 out 5 White malesCompared to 1 out 5 White males
Neighborhood Type
% of Total AfricanAmerican Male
Population% of Total White Male
Population
% of Total AfricanAmerican Female
Population
Very Low Opportunity 36.8% 6.9% 37.6%Low Opportunity 29.6% 14.1% 30.0%Moderate Opportunity 16.6% 21.4% 16.4%High Opportunity 10.6% 25.2% 10.4%Very High Opportunity 6.3% 32.4% 5.6%Outside Study Area 0.1% 0.0% 0.0%
Opportunity Analysis and Location of African American Males,White Males and African American Females in Seven Major Metros:
(Atlanta, Chicago, Detroit, Houston, Los Angeles, New York, Washington DC

Youth 14 and YoungerYouth 14 and Younger Similar results were found for younger males, Similar results were found for younger males,
61% of African American males under 14 were 61% of African American males under 14 were found in low opportunity communitiesfound in low opportunity communities
Black and White Males 14 and Younger by Opportuntiy Level
1=Very Low Opp; 5=Very High Opp
466,365 492,715
640,880
334,357
185,070
66,297117,673
953,132
336,874
198,213
0
200,000
400,000
600,000
800,000
1,000,000
1,200,000
1 2 3 4 5
Black Males; 0-14 White Males; 0-14

Future DirectionsFuture Directions
More statewide projectsMore statewide projects More explicit analysis of identifying declining and More explicit analysis of identifying declining and
“threshold” neighborhoods“threshold” neighborhoods Where are “turning point” communitiesWhere are “turning point” communities Where are critical interventions neededWhere are critical interventions needed
• Tie directly to researchTie directly to research
More on-line mapping applicationsMore on-line mapping applications Linking more directly into planning processes Linking more directly into planning processes
(statewide planning, regional planning, (statewide planning, regional planning, comprehensive planning)comprehensive planning)