approach and methodology for economic impact assessment of ... · council study_economic assessment...
TRANSCRIPT
MRC Council Study Cumulative impact assessment of water resource development scenarios
Economic assessment methodology
Council Study_Economic Assessment Methodology NEW_SH.docx
THE COUNCIL STUDY
Study on the sustainable management and development of the Mekong river, including impacts of mainstream hydropower projects
Approach and methodology for economic impact assessment of development scenarios
Working draft
Prepared by:
Alex Smajgl, Mekong Region Futures Institute
November 2016
Mekong River Commission
Office of the Secretariat in Vientiane 184 Fa Ngoum Road, Ban Sithane Neua, P.O. Box 6101, Vientiane, Lao PDR Tel: (856-21) 263 263 Fax: (856-21) 263 264
Office of the Secretariat in Phnom Penh 576 National Road, no. 2, Chok Angre Krom, P.O. Box 623, Phnom Penh, Cambodia Tel: (855-23) 425 353 Fax: (855-23)425 363
[email protected] www.mrcmekong.org
ii
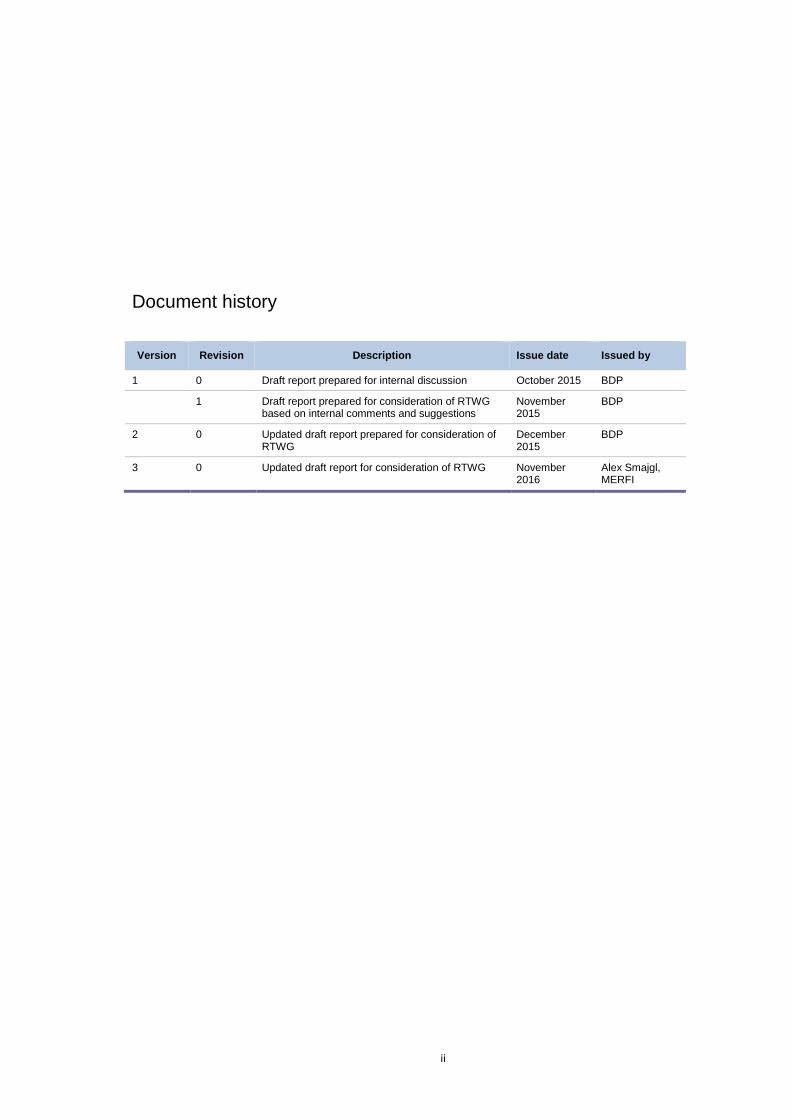
Document history
Version Revision Description Issue date Issued by
1 0 Draft report prepared for internal discussion October 2015 BDP
1 Draft report prepared for consideration of RTWG based on internal comments and suggestions
November 2015
BDP
2 0 Updated draft report prepared for consideration of RTWG
December 2015
BDP
3 0 Updated draft report for consideration of RTWG November 2016
Alex Smajgl, MERFI

MRC Council Study Cumulative impact assessment of water resource development scenarios
Economic assessment methodology
i
Contents
Abbreviations and acronyms
1 Introduction 1 1.1 Purpose of report and main tasks 1 1.2 Report contents 2
2 Main objectives and general approach 3 2.1 Main objectives 3 2.2 Key economic indicators 3 2.3 General approach 5
3 Methodology for economic assessment of direct benefits, costs and impacts 10 3.1 Overview of assessment methodology 10 3.2 Economic valuation 16 3.3 Economic assessment of development scenarios 17
4 Data requirements for economic assessment 29 4.1 Overview 29 4.2 Hydropower data 33 4.3 Irrigated agriculture data 34 4.4 Flood protection data 35 4.5 Navigation data 37 4.6 Fisheries data 38 4.7 Wetlands and wildlife biodiversity data 39 4.8 Riverbank erosion data 41 4.9 Saline intrusion data 42 4.10 Recession agriculture, lowland crop productivity and riverbank garden data 43 4.11 Forestry data 44 4.12 Sand mining data 44 4.13 Drought impact data 45
Tables
Table 4-1 Data required for economic assessment of hydropower development 33
Table 4-2 Data required for economic assessment of irrigation development 34
Table 4-3 Data required for economic assessment of flood protection measures 36
Table 4-4 Data required for economic assessment of navigation development 37
Table 4-5 Data required for economic assessment of capture and culture fisheries 38

ii
Table 4-6 Data required for economic assessment of impact on wetlands and wildlife 40
Table 4-7 Data required for economic assessment of the impact of riverbank erosion 41
Table 4-8 Data required for economic assessment of the impact of saline intrusion 42
Table 4-9 Data required for economic assessment of the impact on recession agriculture, floodplain
productivity and riverbank gardens 43
Table 4-10 Data required for economic assessment of forestry development 44
Table 4-11 Data required for economic assessment of sand mining 45
Table 4-12 Data required for economic assessment of drought prone areas 45
Figures
Figure 2-1 Linkages between assessment indicators and monitoring parameters 9
Figure 3-1 Overview of economic assessment methodology 10
Figure 3-2 Incremental approach to cost-benefit analysis 13

MRC Council Study Cumulative impact assessment of water resource development scenarios
Economic assessment methodology
iii
Abbreviations and acronyms
ADB Asian Development Bank
BDP Basin Development Programme
BDP1 BDP Phase 1
BDP2 BDP Phase 2
CV Contingent Valuation
DSF Decision Support Framework
DMP Drought Management Programme
EP Environment Programme
EPC Engineering, Procurement and Construction
FMMP Flood Management and Mitigation
Programme
FP Fisheries Programme
GIS Geographical Information System
GW Gigawatt = 1,000 MW
GWh Gigawatt-hour = 1,000 MWh
HEP Hydroelectric Power
IBFM Integrated Basin Flow Management
IKMP Information and Knowledge Management
Programme
ISH Initiative for Sustainable Hydropower
IWRM Integrated Water Resources Management
IWT Inland Water Transport
KW Kilowatt
KWh Kilowatt-hour
LMB Lower Mekong Basin
MRC Mekong River Commission
MRCS Mekong River Commission Secretariat
MW Megawatt = 1,000 KW
MWh Megawatt-hour = 1,000 KWh
NAP Navigation Programme
NMC National Mekong Committee
NPV Net Present Value
PV Present Value
RTWG Regional Technical Working Group
SEA Strategic Environmental Assessment
TCU Technical Co-ordination Unit
TEV Total Economic Value
ToR Terms of Reference
UMB Upper Mekong Basin
WB World Bank

iv
Blank page
MRC Council Study Cumulative impact assessment of water resource development scenarios
Economic assessment methodology
1
1 Introduction
1.1 Purpose of report and main tasks
The main purpose this report is to describe the approach and methodology being adopted for the economic assessment of direct benefits, costs and impacts1 to be undertaken for the Council Study. The Inception Report of the Council Study 2 was the main guidance document.
The report forms part of a larger main report on the “Approach and methodology for the cumulative impact assessment of water resource development scenarios” (December 2015) to which this report is also appended.
For future reference, this report will also provide a record of the analytical techniques used in the economic assessment. In the preparation of the economic assessment methodology, the main tasks comprised:
establishment of a clear approach and analytical framework for the economic assessment;
description of the analytical tools which will be used in the economic assessment to quantify the assessment indicators;
consultation with other discipline teams as well as thematic teams of the Council Study, including a mini-workshop, in order to identify data sources and information gaps;
detailing of data requirements including data sources as well as the thematic/discipline teams and technical experts responsible for providing the information; and
identification of key activities to be undertaken during the economic assessment, and preparation of a work plan and staff schedule.
1 The term “macro-economic” assessment (as referred to in the Council Study Inception Report) has been replaced in this report by “economic assessment” in order to clearly distinguish between the assessment of the direct economic benefits,
costs and impacts resulting from water resource developments with indirect economic benefits and impacts at the macro level which are discussed separately (see Appendix C: Economic assessment of Indirect Benefits and Impacts). Furthermore this distinction also reflects the terminology used in the MRC Indicator Framework.
2 Inception Report of the MRC Council Study, Draft Final, 27 October 2014.

2
1.2 Report contents
The main objectives and general approach to the economic assessment are described in Chapter 2. The economic assessment indicators which will be used in the analysis are also presented.
The detailed methodology of the economic assessment is then presented in Chapter 3. Firstly, an overview of analytical methods used to assess the direct benefits, costs and impacts of water resource developments are outlined. This is followed by a discussion on economic valuation techniques. Finally the economic assessment of development scenarios is described with respect to the development of hydropower, irrigated agriculture, flood protection, navigation, aquaculture and forestry, as well as the impact of proposed water resource developments on capture fisheries, wetlands/wildlife biodiversity, riverbank erosion, saline intrusion, recession cropping, floodplain crop productivity, and riverbank gardens.
Chapter 4 details the data requirements for the economic assessment and is divided by development sector and topic/issue. The data sources are specified together with the thematic/discipline teams and technical experts responsible for providing the information.
A work plan for the economic assessment is given Chapter 5 and this specifies the main tasks to be undertaken, the proposed work schedule and consultancy requirements.
MRC Council Study Cumulative impact assessment of water resource development scenarios
Economic assessment methodology
3
2 Main objectives and general approach
2.1 Main objectives
The main objectives of the economic assessment of direct benefits, costs and impacts are to:
Estimate the direct economic benefits and costs of the early development scenario (2007), the definite future scenario (2020) and the planned development scenario (2040);
Estimate the direct economic benefits and costs of the sub-scenarios FPF2, FPF3, IRR1, DIW1, DIW2, and ALU3 (as defined in the Implementation Plan of the Council Study)
Evaluate the economic impacts of existing and planned interventions (both positive and negative);
Determine the distribution of economic benefits and costs, as well as impacts, between LMB countries; and
Estimate the impact on employment and livelihoods (both positive and negative).
2.2 Key economic indicators
The promotion of economic development is key aim of the national plans for water resource development in LMB countries as well as the MRC’s planning efforts. MRC operates in defined sectors and it is important to monitor and assess the economic performance of MRC sectors with respect to current and future development plans, as well as to assess their contribution to the overall basin economy. To guide the monitoring and assessment process, the MRC Indicator Framework3, comprising strategic and assessment indicators as well as monitoring parameters (discipline-specific indicators), was established for five dimensions, i.e. social, environment, economic, climate change and cooperation.
In order to evaluate the strategic economic indicators, namely: (i) economic performance of MRC sectors, and (ii) contribution to the overall basin economy, a series of assessment indicators have been specified in the MRC Indicator Framework. These assessment indicators are presented in Table 2.1 and they will be evaluated in the assessment of the direct benefits, costs and impacts of water resource developments.
3 MRC Indicator Framework for managing the Mekong Basin (draft), June 2015.

4
With respect to social dimension of the MRC framework, employment in MRC sectors is one of the strategic social indicators. In order to assist with evaluation of the employment indicators, estimates of the job opportunities created in the agriculture, fisheries, hydropower, navigation and forestry sectors, through the implementation of water resource development interventions, will also be undertaken in the economic assessment.
Table 2-1 Economic dimension: strategic and assessment indicators
Strategic Indicators
Assessment Indicators Unit
Economic performance of MRC sectors
Economic value of irrigated agriculture:
Economic value of recession agriculture
Economic value of lowland rain fed agriculture
Economic value of hydropower production
Economic value of mainstream navigation
Economic value of flood damage
Economic value of drought damage
Economic value of capture fisheries
Economic value of reservoir fisheries
Economic value of aquaculture
Economic value of river bank gardens
Economic value of upland forestry
Economic value of flooded forests
Economic value of wetlands, key habitats and conservation areas
Economic value of sand mining
Economic value of productive activities in areas affected by salinity
Economic value of assets in locations affected by river bank erosion
Economic expenditure on tourism and recreation
Aggregate economic value (from above)
US$M/year US$M/year US$M/year US$M/year US$M/year US$M/year US$M/year US$M/year US$M/year US$M/year US$M/year US$M/year US$M/year US$M/year US$M/year US$M/year US$M/year US$M/year US$M/year US$M/year
US$M/year
US$M/year

MRC Council Study Cumulative impact assessment of water resource development scenarios
Economic assessment methodology
5
Contribution to basin economy
Proportion of MRC sectors contribution to overall basin GDP
Food security: % of national food grain demand met from basin resources
Food security: % of national protein demand met from basin resources
Energy security: % national demand met from hydropower generation
Economic value of investments in MRC sectors
percent
percent
percent
percent
US$M/year
2.3 General approach
The first part of this assessment is focused on the impacts of the three development scenarios on the economic performance of MRC sectors, which is largely based on the economic assessment methodology employed during the BDP study in 2009-11 to ensure consistency. This approach implements conventional analytical methods for the economic valuation of benefits and costs, which have been well established by the major donor agencies (e.g. World Bank and ADB) over many years. This approach will be used in the economic assessment of impacts in form of direct benefits and costs of the three development scenarios considered.
MRC databases (e.g. hydropower, irrigation) and information and assessment results from the discipline teams (i.e. BioRA, hydrology, socio-economic and climate change) and the thematic teams (i.e. hydropower, agriculture and land use, flood protection, domestic and industrial water use, and transportation) of the Council Study will be used in the economic assessment.
Discussions were held with the thematic and discipline teams in order to: (i) determine the type of information which will be made available during the course of the study, and (ii) identify data gaps which will require further data collection and analysis by the economic assessment team. In addition, a mini-workshop was held on 24th October 2015 to further improve the assessment approach. The workshop was attended by country delegates, Council Study Team management and BDP team members. Feedback from the workshop is reflected in this report.
The design of the broader Coucil Study has implications for the economic assessment as it specifies 1985-2008 as the main timeframe for disciplinary assessments. The hydrological modelling work uses hydrological flow data for this period and overlays this time series with assumptions for future climate signals and with the various scenarios of water infrastructure. The other disciplinary teams calibrate their models for the same period and develop their baseline by adjusting parameters for the past period with a set of exogenous factors that introduce expected future pressures or changes (i.e. overfishing). The economic assessment related to MRC sector performance is processing results from disciplinary teams. This imposes a time-related challenge as provided results are largely static comparative results for the end of the selected 23-year period. Thus, we understand the

6
selected timeframe as an abstract period that could equally represent the time until 2040 as exogenous drivers try to capture main future changes.
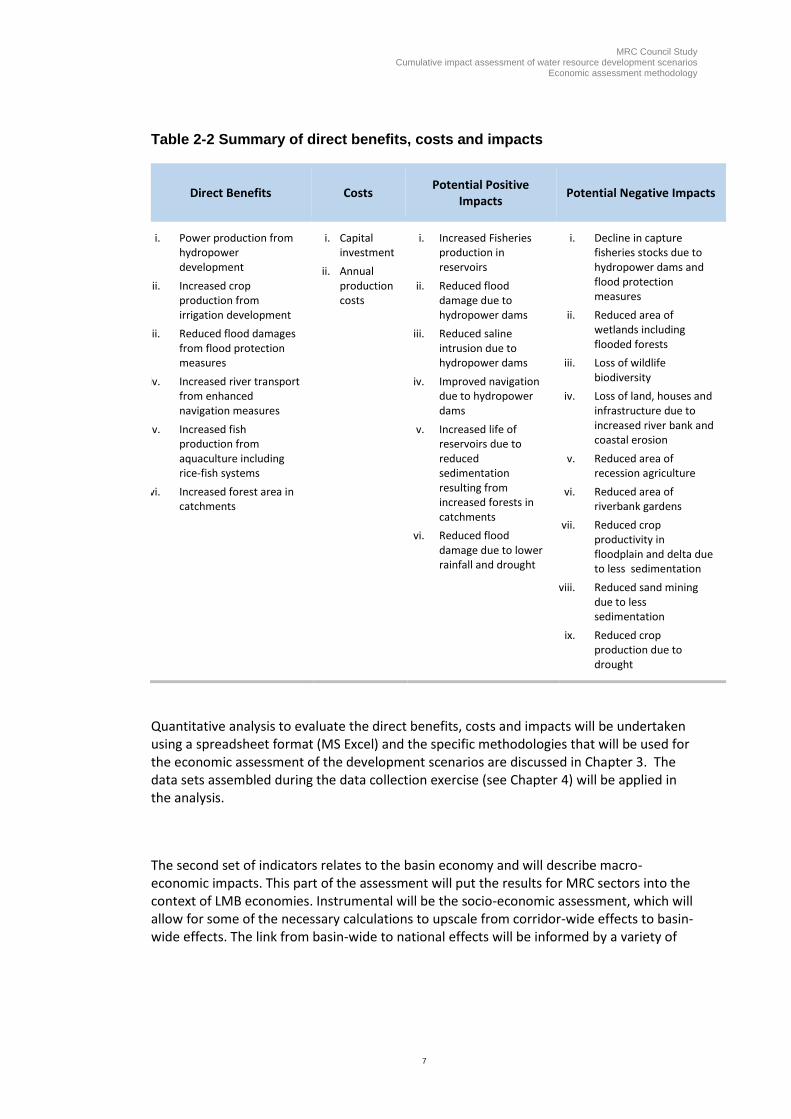
The direct benefits, costs and potential impacts (both positive and negative) which will be evaluated during the economic assessment of the development scenarios are summarised in Table 2-2. It can be seen that the direct benefits, as well as the capital and recurrent costs, of the various water resource developments, i.e. hydropower, irrigated agriculture, flood protection, navigation, aquaculture and forestry, will be evaluated in the economic assessment.
In addition, the potential impacts of water resource developments are also listed in Table 2-2 and the positive impacts are expected to include increased reservoir fisheries production, reduced flood damage, reduced saline intrusion, improved navigation, and reduced sedimentation. With regard to potential negative impacts, it is anticipated that these will include a decline in capture fisheries stocks, reduced environmental assets/ecosystem services (e.g. wetlands, wildlife biodiversity), reduced recession agriculture and riverbank gardens, reduced crop productivity in floodplain and delta, as well as increased riverbank and coastal erosion. This study aims to establish robust predictions of the nature and scale of likely impacts. At this stage it should be noted that it is yet to be confirmed whether some of these potential impacts will be positive or negative.
The economic indicators to be adopted in the assessment have been based on the MRC Indicator Framework. Economic assessment indicators will be quantified by applying economic values to the physical interventions, outputs and impacts of water resource developments within the development scenarios, as specified in the monitoring parameters of the MRC Indicator Framework.
The linkages between assessment indicators and monitoring parameters, together with the sources of data required to evaluate the assessment indicators and monitoring parameters, are illustrated in Figure 2.1.
MRC Council Study Cumulative impact assessment of water resource development scenarios
Economic assessment methodology
7
Table 2-2 Summary of direct benefits, costs and impacts
Direct Benefits Costs Potential Positive
Impacts Potential Negative Impacts
i. Power production from hydropower development
ii. Increased crop production from irrigation development
iii. Reduced flood damages from flood protection measures
iv. Increased river transport from enhanced navigation measures
v. Increased fish production from aquaculture including rice-fish systems
vi. Increased forest area in catchments
i. Capital investment
ii. Annual production costs
i. Increased Fisheries production in reservoirs
ii. Reduced flood damage due to hydropower dams
iii. Reduced saline intrusion due to hydropower dams
iv. Improved navigation due to hydropower dams
v. Increased life of reservoirs due to reduced sedimentation resulting from increased forests in catchments
vi. Reduced flood damage due to lower rainfall and drought
i. Decline in capture fisheries stocks due to hydropower dams and flood protection measures
ii. Reduced area of wetlands including flooded forests
iii. Loss of wildlife biodiversity
iv. Loss of land, houses and infrastructure due to increased river bank and coastal erosion
v. Reduced area of recession agriculture
vi. Reduced area of riverbank gardens
vii. Reduced crop productivity in floodplain and delta due to less sedimentation
viii. Reduced sand mining due to less sedimentation
ix. Reduced crop production due to drought
Quantitative analysis to evaluate the direct benefits, costs and impacts will be undertaken using a spreadsheet format (MS Excel) and the specific methodologies that will be used for the economic assessment of the development scenarios are discussed in Chapter 3. The data sets assembled during the data collection exercise (see Chapter 4) will be applied in the analysis.
The second set of indicators relates to the basin economy and will describe macro-economic impacts. This part of the assessment will put the results for MRC sectors into the context of LMB economies. Instrumental will be the socio-economic assessment, which will allow for some of the necessary calculations to upscale from corridor-wide effects to basin-wide effects. The link from basin-wide to national effects will be informed by a variety of

8
data published by the four riparian Governments or by international agencies such as OECD, ADB, and World Bank.
The key macro-economic impact domains will include GDP and GDP growth, food and energy security, and investment and asset related dimensions. Each of these three domains allows for the assessment of important dependencies between the national economies and the resources affected by the three development scenarios and the relevant sub-scenarios. Thereby, some important ripple effects can be quantified to further inform the economic persepctive of development-focused decision making.

MRC Council Study Cumulative impact assessment of water resource development scenarios
Economic assessment methodology
9
Figure 2-1 Linkages between assessment indicators and discipline-specific indicators
Strategic
IndicatorAssessment indicator
Assessment
functionsData source Discipline specific indicators
Tota l i rrigated area and cropped area
Economic returns from i rrigated crop production
Tota l lowland ra infed area and cropped area
Economic returns from ra infed crop production
Tota l recess ion agric. area and cropped area
Economic returns from recess ion crop production
Tota l riverbank garden area and cropped area
Economic returns from riverbank gardens
Tota l upland area forestry area and production
Economic returns from upland forests
Mean and fi rm annual energy production
Domestic and export tari ffs at generation level
Navigable days by class (cargo and passenger)
Economic returns from navigation
Area affected by floods and depth of flooding
Economic va lue of flood damage and losses
Area affected by drought
Economic va lue of drought losses
Capture fi sheries production
Economic returns from capture fi sheries
Reservoir fi sheries production
Economic returns from reservoir fi sheries
Aquaculture production
Economic returns from aquaculture
Channel and floodpla in vegetation
Microinvertebrates , herpetofauna, mammals & birds
Key habitats and conservation areas
Geomorphology
Economic va lue of MRC sectors in bas in economy
National GDP of member countries
Food gra in production in bas in
National foodgra in demand of member countries
Protein production in bas in (l ivestock, fi sh, veg)
National protein demand of member countries
Hydropower production in bas in
National energy demand of member countries
Capita l investment in MRC sectors in bas in economy
Expenditure on tourism by member country
Economic
performance
of MRC
sectors
Economic value of:
Irrigated agriculture
Agriculture and
forestryLowland rainfed agriculture
Recession agriculture
Riverbank gardens
Upland forestry
Hydropower productionHydropower
Mainstream navigation
Capture fisheries
Navigation
Reservoir fisheries
Macro-economic
assessment
Flood damage and losses
Drought losses
Flooded forests
Aquaculture
Sand mining
MRC sectors
contribution
to basin
economy
% overall basin GDP
% national foodgrain demand
% national protein demand
% national energy demand
Investment in MRC sectors
Wetlands and key habitats
Flood & drought
management
Fisheries and
ecosystem
services
Flow and water
quality modelling
Relevant s tatis tics covering water levels , flow rates ,
extent of flooded areas and hydrograph timings
derived from s imulation of flows
Tourism and recreationRelevant s tatis tics covering sa l ine intrus ion,
sediment and nutrient flow rates and morphologica l
trends derived from s imulation of flows under
di fferent scenarios
Riverbank erosion areas
Saline affected areas

10
3 Methodology for economic assessment of direct benefits, costs and impacts
3.1 Overview of assessment methodology
An overview of the methodology to be used to estimate the direct economic benefits, costs and impacts of water resource developments is given in Figure 3.1.
Figure 3-1 Overview of economic assessment methodology
3.1.1 Capital costs of sector developments
The cumulative capital cost for each type of water resource development (e.g. hydropower, irrigated agriculture, flood protection, navigation, aquaculture and forestry), which have taken place in the LMB during the 1900s and in the early 2000s up to 2015, will be estimated. The capital cost required for the planned infrastructure will then be determined for the on-going and planned water resource developments up to 2020 (i.e. definite future scenario) and 2040 (i.e. planned development scenario).
MRC Council Study Cumulative impact assessment of water resource development scenarios
Economic assessment methodology
11
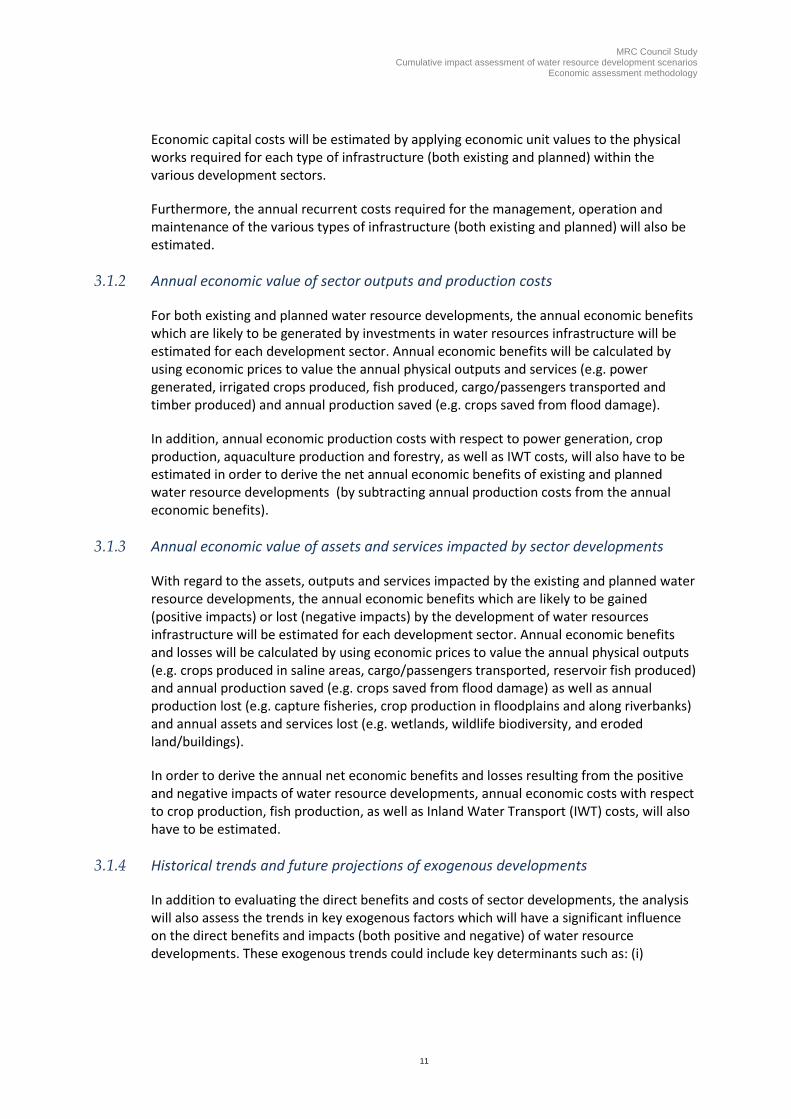
Economic capital costs will be estimated by applying economic unit values to the physical works required for each type of infrastructure (both existing and planned) within the various development sectors.
Furthermore, the annual recurrent costs required for the management, operation and maintenance of the various types of infrastructure (both existing and planned) will also be estimated.
3.1.2 Annual economic value of sector outputs and production costs
For both existing and planned water resource developments, the annual economic benefits which are likely to be generated by investments in water resources infrastructure will be estimated for each development sector. Annual economic benefits will be calculated by using economic prices to value the annual physical outputs and services (e.g. power generated, irrigated crops produced, fish produced, cargo/passengers transported and timber produced) and annual production saved (e.g. crops saved from flood damage).
In addition, annual economic production costs with respect to power generation, crop production, aquaculture production and forestry, as well as IWT costs, will also have to be estimated in order to derive the net annual economic benefits of existing and planned water resource developments (by subtracting annual production costs from the annual economic benefits).
3.1.3 Annual economic value of assets and services impacted by sector developments
With regard to the assets, outputs and services impacted by the existing and planned water resource developments, the annual economic benefits which are likely to be gained (positive impacts) or lost (negative impacts) by the development of water resources infrastructure will be estimated for each development sector. Annual economic benefits and losses will be calculated by using economic prices to value the annual physical outputs (e.g. crops produced in saline areas, cargo/passengers transported, reservoir fish produced) and annual production saved (e.g. crops saved from flood damage) as well as annual production lost (e.g. capture fisheries, crop production in floodplains and along riverbanks) and annual assets and services lost (e.g. wetlands, wildlife biodiversity, and eroded land/buildings).
In order to derive the annual net economic benefits and losses resulting from the positive and negative impacts of water resource developments, annual economic costs with respect to crop production, fish production, as well as Inland Water Transport (IWT) costs, will also have to be estimated.
3.1.4 Historical trends and future projections of exogenous developments
In addition to evaluating the direct benefits and costs of sector developments, the analysis will also assess the trends in key exogenous factors which will have a significant influence on the direct benefits and impacts (both positive and negative) of water resource developments. These exogenous trends could include key determinants such as: (i)

12
population growth, (ii) industrial/urban development, (iii) sand mining, (iv) rising per capita incomes, (v) increasing demand for food and agricultural products, (vi) greater energy consumption, (vii) declining capture fisheries stocks, (viii) deforestation, and ( ix) fluctuating commodity prices (particularly energy prices).
The integration of past trends and future projections of exogenous developments into the economic assessment will provide a more reliable estimate of the direct benefits as well as a better understanding of the positive and negative impacts. It is therefore important that these exogenous development trends are taken into account when evaluating the economic benefits and costs of water resource developments.
3.1.5 Economic cost-benefit analysis
The economic cost–benefit analyses will be undertaken on an incremental basis by contrasting the annual net economic benefits4 in the “future with” water resource developments and “future without” water resource developments projected over a 50 year period. The future with development will include the capital and annual recurrent costs of the interventions/measures, e.g. hydropower, irrigation, flood protection, navigation infrastructure, aquaculture and forestry. Incremental net economic benefit streams will then be derived for each development scenario over the selected 23-year period by subtracting the annual net economic benefits in “future without” situation from the annual net economic benefits in “future with” situation.
The “future without” situation represents the likely trend in the development of resources without the specific intervention. For example, without irrigation development, rainfed crop productivity is likely to increase with the adoption of improved crop varieties and better management techniques and this trend will need to be taken into account in the analysis. Similarly, without the construction of hydropower dams, there could still be a decline in capture fisheries production due to overfishing or a reduction in wetland areas due to increasing urbanisation, so these exogenous trends will also be included in the economic assessment. By adopting this incremental approach over a given time period, it will therefore be possible to incorporate a number of exogenous trends in the analysis of both the “future with” and “future without” development situations.
To illustrate the incremental approach being adopted for the cost-benefit analysis, two hypothetical examples are given below.
The first diagram of Figure 3-2 shows the annual net benefits generated by a water resource intervention (e.g. irrigation development) over a 50 year period in both the “future with” and “future without” development situations. In the cost-benefit analysis, the difference between the “future with” and “future without” development situations, which takes account of exogenous trends (e.g. increasing rainfed crop yields), will be used to estimate the incremental annual net benefit stream. It can be seen from Figure 3-2 that, if
4 Annual net economic benefits = annual economic value of sector outputs minus annual production costs

MRC Council Study Cumulative impact assessment of water resource development scenarios
Economic assessment methodology
13
exogenous trends were not taken into account, the incremental net benefits would be overestimated.
Figure 3-2 Incremental approach to cost-benefit analysis
The second diagram shows the annual losses resulting from an adverse impact of a water resource development (e.g. decline in capture fisheries resulting from a hydropower dam). The difference between the “future with” and “future without” development situations, which takes account of exogenous trends (e.g. decline in capture fisheries due to overfishing), will then be used to estimate the incremental annual losses. If exogenous trends are excluded, the incremental annual losses would be significantly higher.
This analysis will also permit further assessment of environmental conservation and sustainability issues by exploring changes in relative economic values over time. For
90
100
110
120
130
140
150
201720182019202020212022202320242025202620272028202920302031203220332034203520362037203820392040
AnnualbenefitsEconomicvalue%
Withoutwaterresourcedevelopment&Withoutexogenousimpacts
Withoutwaterresourcedevelopment
&Withexogenousimpacts
Withwaterresourcedevelopment&Withexogenousimpacts
50
60
70
80
90
100
110
201720182019202020212022202320242025202620272028202920302031203220332034203520362037203820392040
AnnuallossesEconomicvalue%
Withoutwaterresourcedevelopment&Withoutexogenousimpacts
Withoutwaterresourcedevelopment
&WithexogenousimpactsWithwaterresourcedevelopment&Withexogenousimpacts

14
example, if capture fish stocks, wetlands, or wildlife biodiversity become increasingly scarce over time (and of greater importance to future, wealthier generations), higher economic values can be assigned to capture fisheries, wetlands and wildlife in the future relative to the value of energy or irrigated crops.
The estimation of annual net economic benefits and impacts over the selected 23-year time period also permits the scheduling of capital investment during the construction period as well as the phasing of annual net economic benefit streams in the “future with” and “future without” development situations with respect to agriculture, fisheries, energy, navigation and forestry sectors. Based on the annual net economic benefit streams in the “future with” and “future without” situations, annual incremental net benefit streams will then be derived for each development sector. By using incremental annual net benefits streams, the contribution of the proposed interventions to economic development within each sector will be evaluated for the three development scenarios, the six selected sub-scenarios, and the two climate change scenarios.
This approach will significantly enhance the value of the economic assessment and will provide a greater insight into the relative economic benefits of the existing, ongoing and planned development interventions in the context of medium and long term trends in key economic, social and environmental indicators within the LMB. Furthermore, the analysis will permit the distribution of the annual incremental net benefits between development sectors and between the four riparian countries.
In addition to estimating the annual benefits, costs and impacts, the incremental annual net benefit streams will be also be used to calculate the net present values for each development sector using an appropriate discount rate which reflects the overall opportunity cost of capital in the LMB. Net present values convert future benefits into today’s value. This involves the application of a social discount rate when converting future benefits. Such a conversion into net present value considers the fact that people have a strong preference for present consumption. The longer the benefit is placed in the future the less people value these benefits or costs. However, experiments have shown that the rate by which people discount future benefits drops the further one steps into the future. This means that people see a lot of difference between receiving a benefit now or in one year (hence the need to discount in the first place). But people do not distinguish (much) between receiving a benefit in twelve years or in thirteen years. Therefore, the social discount rate decreases the further we step into the future.This type of social discounting is referred to as hyperbolic discounting.
By using incremental net benefits streams and hyperbolic discounting to determine NPVs, the economic viability of the proposed interventions and their contribution to overall economic development will be evaluated for each development scenario.

MRC Council Study Cumulative impact assessment of water resource development scenarios
Economic assessment methodology
15
3.1.6 Climate change
Climate change is likely to have a significant impact on the direct benefits and costs of water resource developments, especially with respect to agricultural and natural resources. Therefore, in addition to the three main development scenarios and the six sectoral variants (sub-scenarios) this study will also consider two climate change scenarios.
3.1.7 Distribution analysis
Poverty reduction and the equitable distribution of benefits are the broad aims of water resource developments within the LMB. For each development scenario, a distributional analysis will therefore be undertaken in order to determine the likely distribution of incremental annual net economic benefits between the four member countries. This distribution analysis will also show the overall division of incremental net economic benefits for each development sector, e.g. energy, agriculture, fisheries, navigation and forestry.
It can be expected that the annual incremental net benefits will not be equally distributed among LMB countries. However, to aid discussion on the results of the scenario assessments, supporting information will be provided on: (i) present annual net benefits from water resource developments, and (ii) existing and planned capital investment in each LMB country.
The present annual net benefits of water resource developments will also be evaluated by sector for each riparian country and this will then be compared to the incremental annual net economic benefits that will accrue to each country. This will clearly show the present distribution of annual net benefits between LMB countries, and the extent to which the different countries will benefit from the planned interventions relative to their present level of water resource development (and whether this leads to a more even distribution of the economic benefits across the countries). In addition, the distribution of historical investment in water resource developments between the riparian countries i, as well as public and private capital investment required for the planned water resource developments in each country, will be estimated. The distribution across development sectors will also be determined.
3.1.8 Macro-ecnomic impacts
In addition to the economic cost-benefit analysis of natural resources, impacts on macro-economic indicators will also be estimated with respect to the selected water resource development scenarios. This macro-ecnomic prspective will include impacts on basin-wide GDP and on food and energy security, which links to the national economies of the four riparian countries.
Changes in GDP will be estimated based on a combination of income and production changes in the particular sectors considering trends in productivity changes. Food security

16
will compare the changes in domestic production and the expected income changes with expected population changes. Similarly, energy security will be estimated based on demand forecasts and increases in production levels. The third macro-economic assessment pillar will investigate changes in investments and assets. This assumes the widely acknowledged link between asssets (or stocks) of input factors relevant for the various production processes of the four economies. Changes in assets over time due to investment changes will provide an important set of green growth indicators.
3.1.9 Indirect macro-economic impacts of water resource developments
It should be noted that this document only discusses the methodology for estimating the direct economic benefits, costs and impacts of water resource developments. The assessment of wider, indirect benefits to the macro-economy through linkages with other sectors (e.g. industry and services), which could be induced by the planned water sector investments, are examined separately.
3.2 Economic valuation
The economic valuation of benefits and costs will generally adopt conventional market price techniques for commodities with a direct use value (e.g. energy, crops and fish) as well as resources which have alternative uses, e.g. land, labour and capital. Some market prices will need to be adjusted to reflect their opportunity cost within the overall basin economy. For example, the economic pricing of electricity will require the estimation of the costs of power generation by a thermal plant using fossil fuel, which is the least cost alternative to hydropower generation.
With respect to irrigated agriculture, the economic prices of crops will be derived from their internationally traded prices adjusted for shipping, processing and transport. For capture fish, there are a number of alternative methods to estimate the economic price, e.g. (i) market price at landing site, and (ii) replacement cost (i.e. unit production costs of culture fish). In the analysis, both methods will be considered.
In determining economic prices, taxes and government subsidies will also be omitted from the financial prices of goods and services, as these are transfer payments and not real resource costs. Furthermore, to reflect high levels of underemployment in the LMB, the economic value of rural labour (both family and hired labour) will be estimated by applying a shadow wage rate factor to the prevailing financial price of labour.
For environmental benefits and losses which result from significant ecosystem changes caused by water resource developments, it is problematic to identify suitable opportunity cost values for a wide range of environmental assets and ecosystem services. For example, wetland benefits can comprise: (i) direct use benefits include fishing, reed collection and recreation; (ii) indirect use benefits include flood mitigation, water storage and toxin reduction; (iii) option benefits relating to the additional premium given to wetlands for future use; and (iv) non-use benefits which are intrinsic values derived from the existence of wetlands and often relate to cultural and/or spiritual values.
MRC Council Study Cumulative impact assessment of water resource development scenarios
Economic assessment methodology
17
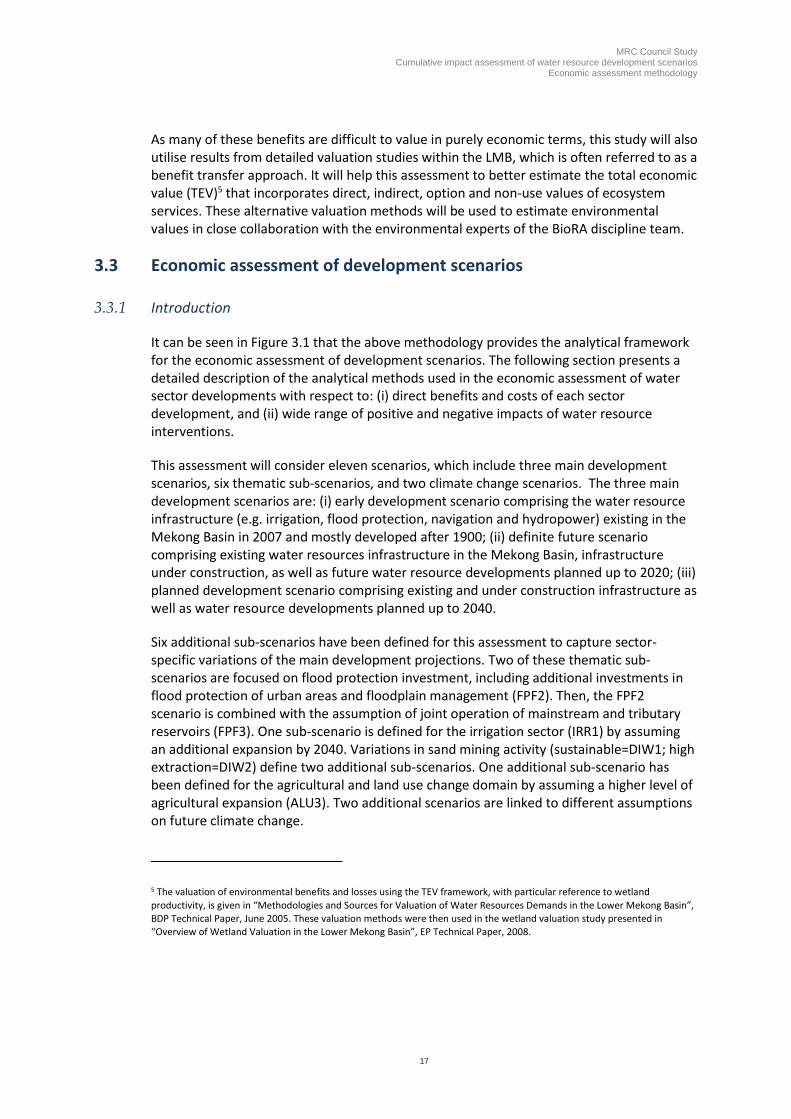
As many of these benefits are difficult to value in purely economic terms, this study will also utilise results from detailed valuation studies within the LMB, which is often referred to as a benefit transfer approach. It will help this assessment to better estimate the total economic value (TEV)5 that incorporates direct, indirect, option and non-use values of ecosystem services. These alternative valuation methods will be used to estimate environmental values in close collaboration with the environmental experts of the BioRA discipline team.
3.3 Economic assessment of development scenarios
3.3.1 Introduction
It can be seen in Figure 3.1 that the above methodology provides the analytical framework for the economic assessment of development scenarios. The following section presents a detailed description of the analytical methods used in the economic assessment of water sector developments with respect to: (i) direct benefits and costs of each sector development, and (ii) wide range of positive and negative impacts of water resource interventions.
This assessment will consider eleven scenarios, which include three main development scenarios, six thematic sub-scenarios, and two climate change scenarios. The three main development scenarios are: (i) early development scenario comprising the water resource infrastructure (e.g. irrigation, flood protection, navigation and hydropower) existing in the Mekong Basin in 2007 and mostly developed after 1900; (ii) definite future scenario comprising existing water resources infrastructure in the Mekong Basin, infrastructure under construction, as well as future water resource developments planned up to 2020; (iii) planned development scenario comprising existing and under construction infrastructure as well as water resource developments planned up to 2040.
Six additional sub-scenarios have been defined for this assessment to capture sector-specific variations of the main development projections. Two of these thematic sub-scenarios are focused on flood protection investment, including additional investments in flood protection of urban areas and floodplain management (FPF2). Then, the FPF2 scenario is combined with the assumption of joint operation of mainstream and tributary reservoirs (FPF3). One sub-scenario is defined for the irrigation sector (IRR1) by assuming an additional expansion by 2040. Variations in sand mining activity (sustainable=DIW1; high extraction=DIW2) define two additional sub-scenarios. One additional sub-scenario has been defined for the agricultural and land use change domain by assuming a higher level of agricultural expansion (ALU3). Two additional scenarios are linked to different assumptions on future climate change.
5 The valuation of environmental benefits and losses using the TEV framework, with particular reference to wetland
productivity, is given in “Methodologies and Sources for Valuation of Water Resources Demands in the Lower Mekong Basin”, BDP Technical Paper, June 2005. These valuation methods were then used in the wetland valuation study presented in “Overview of Wetland Valuation in the Lower Mekong Basin”, EP Technical Paper, 2008.

18
The economic assessment of the three development scenarios will focus on estimating the potential annual net benefits from:
hydropower development in the mainstream of the LMB;
irrigation development in the Vietnam delta, Cambodia floodplains, NE Thailand and Lao lowlands;
flood protection infrastructure in Vietnam delta, Cambodia floodplains, NE Thailand and Lao lowlands;
navigation infrastructure along the mainstream of Mekong river;
aquaculture development, particularly in Vietnam delta and NE Thailand; and
forestry development in vulnerable catchments of the LMB.
These water resource developments will also have a number of potential positive and negative impacts. The potential positive impacts include:
fisheries production in LMB reservoirs;
reduced flood losses and damage to crops, houses and infrastructure;
reduced saline intrusion in the Mekong delta;
enhanced navigation along the mainstream of the Mekong river;
the construction of water resources infrastructure will also have a number of potentially adverse impacts such as:
decline in capture fisheries stocks;
reduction in the wetland areas (including flooded forests) resulting from a decline in flooding;
loss of key habitats, wildlife biodiversity and conservation areas;
loss of land, houses and infrastructure due to increased river bank erosion;
reduction in the area of recession agriculture and riverbank gardens;
reduction in agricultural productivity in the lowland floodplains;
reduction in sand mining
3.3.2 Direct benefits and costs of water resource developments
(i) Hydropower production
The economic assessment of the existing and planned hydropower projects in the LMB will be primarily based on the updating of the cost-benefit analyses that has been prepared for a wide range of the projects6. In the economic analysis of the hydropower projects,
6 “Hydropower Sector Review for the Joint Sector Planning Process” (draft), BDP, February 2009.

MRC Council Study Cumulative impact assessment of water resource development scenarios
Economic assessment methodology
19
dependable HEP capacity and annual power production have been estimated for each hydropower project. The capital investments in existing hydropower projects, as well as the capital required for development of future hydropower projects (including transmissions lines), are also available in the hydropower database which is currently being updated by the hydropower thematic team. Furthermore, the respective operation and maintenance costs have been calculated for both existing and planned hydropower developments.
The annual net economic benefits of the hydropower projects have also been estimated based on the costs of generating power from alternative thermal sources (i.e. diesel, natural gas and coal) in the consuming country. For the host country, the annual net benefit of hydropower is the sum of the benefits from power supply to domestic consumers and from exports to neighbouring countries less annual production costs. For importing countries, the annual net benefit of hydropower is the replacement value of imported power (calculated at the proxy trade price) less import costs. In addition, the assessment of alternative power generation options for each country will also be updated by the hydropower thematic team.
In the cost-benefit analysis, NPVs were also calculated in order to assess the economic viability of hydropower projects in terms of energy production.
In addition to updating the benefits and costs of hydropower production, the costs of resettling/compensating households displaced by reservoirs, as well as the costs of environmental mitigation measures, e.g. fish ladders, will also be estimated.
(ii) Irrigated agriculture
The historical trends and future projections of irrigated areas in the LMB will be derived from the MRC irrigation database, which is currently being updated by the irrigation thematic team. The location of the existing and planned irrigated areas (based on national plans) will then be mapped following the integration of the irrigation database into the GIS. Future irrigation development in the LMB will be made possible by an increased supply of water during the dry season made available by increased storage capacity in the hydropower reservoirs.
Capital investment in existing irrigation infrastructure, as well as the investment required to construct the planned irrigation infrastructure, will be based on data available in the irrigation database and irrigation project reports. Furthermore, the annual costs of operating and maintaining the irrigation systems, will be estimated for different types of irrigation schemes.
The phasing of the irrigation development will also be undertaken and this will include the areas within the LMB that would be developed over the next 25 years (2020 and 2040 scenarios) in accordance with national planning. This extent and phasing of future irrigation development will also take account of the likely implementation constraints such as the capital investment required from government and the availability of skilled labour.
20
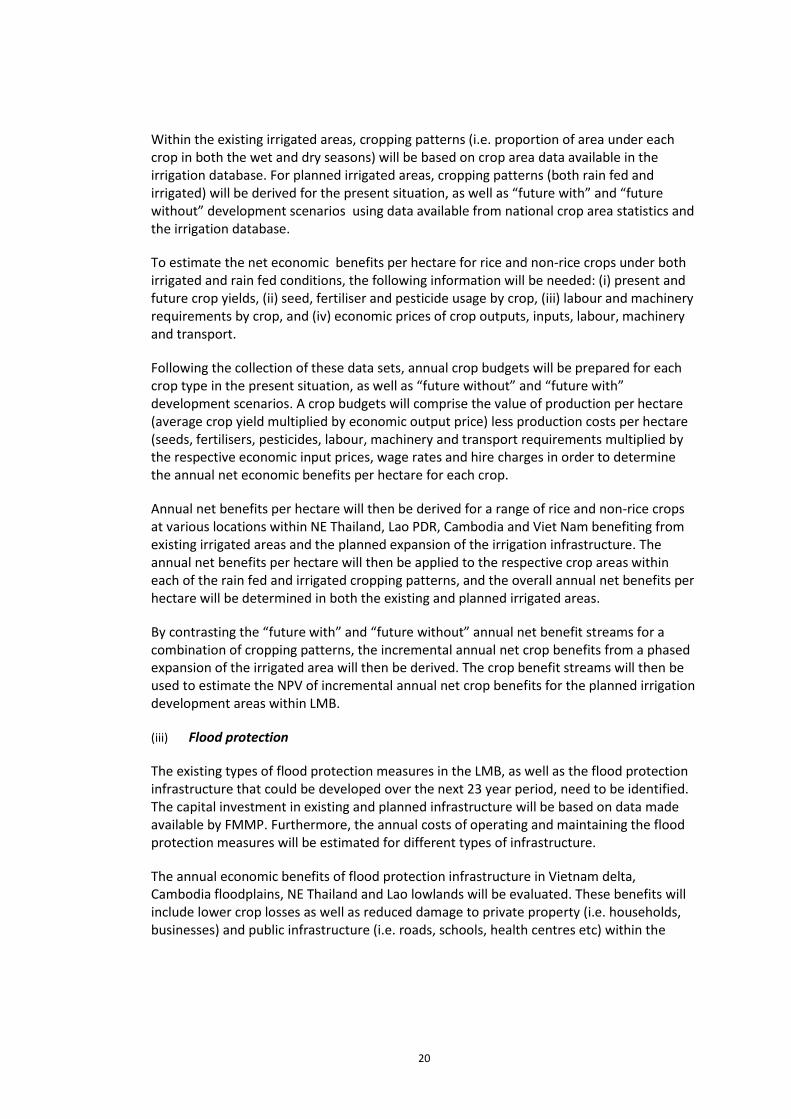
Within the existing irrigated areas, cropping patterns (i.e. proportion of area under each crop in both the wet and dry seasons) will be based on crop area data available in the irrigation database. For planned irrigated areas, cropping patterns (both rain fed and irrigated) will be derived for the present situation, as well as “future with” and “future without” development scenarios using data available from national crop area statistics and the irrigation database.
To estimate the net economic benefits per hectare for rice and non-rice crops under both irrigated and rain fed conditions, the following information will be needed: (i) present and future crop yields, (ii) seed, fertiliser and pesticide usage by crop, (iii) labour and machinery requirements by crop, and (iv) economic prices of crop outputs, inputs, labour, machinery and transport.
Following the collection of these data sets, annual crop budgets will be prepared for each crop type in the present situation, as well as “future without” and “future with” development scenarios. A crop budgets will comprise the value of production per hectare (average crop yield multiplied by economic output price) less production costs per hectare (seeds, fertilisers, pesticides, labour, machinery and transport requirements multiplied by the respective economic input prices, wage rates and hire charges in order to determine the annual net economic benefits per hectare for each crop.
Annual net benefits per hectare will then be derived for a range of rice and non-rice crops at various locations within NE Thailand, Lao PDR, Cambodia and Viet Nam benefiting from existing irrigated areas and the planned expansion of the irrigation infrastructure. The annual net benefits per hectare will then be applied to the respective crop areas within each of the rain fed and irrigated cropping patterns, and the overall annual net benefits per hectare will be determined in both the existing and planned irrigated areas.
By contrasting the “future with” and “future without” annual net benefit streams for a combination of cropping patterns, the incremental annual net crop benefits from a phased expansion of the irrigated area will then be derived. The crop benefit streams will then be used to estimate the NPV of incremental annual net crop benefits for the planned irrigation development areas within LMB.
(iii) Flood protection
The existing types of flood protection measures in the LMB, as well as the flood protection infrastructure that could be developed over the next 23 year period, need to be identified. The capital investment in existing and planned infrastructure will be based on data made available by FMMP. Furthermore, the annual costs of operating and maintaining the flood protection measures will be estimated for different types of infrastructure.
The annual economic benefits of flood protection infrastructure in Vietnam delta, Cambodia floodplains, NE Thailand and Lao lowlands will be evaluated. These benefits will include lower crop losses as well as reduced damage to private property (i.e. households, businesses) and public infrastructure (i.e. roads, schools, health centres etc) within the

MRC Council Study Cumulative impact assessment of water resource development scenarios
Economic assessment methodology
21
LMB. In addition, other benefits of mitigating flooding, such as reduced rescue/relocation costs and lower disruption losses, will also be taken into account.
The area of land benefiting from flood risk reduction will be estimated from the assessment of hydrological changes resulting from the construction of the flood protection infrastructure in each development scenario. The location of specific areas directly benefiting from flood protection in terms of reduced flood damages will be mapped using the GIS database. Within areas where flooding risk has been reduced, information on the numbers of households and types of land use (i.e. crop production, forestry, lakes/ponds, settlements, infrastructure and wetlands) will be obtained from the GIS database.
The annual economic value of the direct benefits of flood protection, as well as the reduction in the annual flood benefits, which have been estimated by FMMP as part of their study on flood damage and flood risk in vulnerable areas of LMB, will then be applied to population and land use data within each location in LMB benefiting from flood protection measures.
By contrasting the “future with” and “future without” annual net benefit streams within the areas benefiting from flood protection, the incremental annual net benefits from the construction of flood protection infrastructure will then be derived. The annual net benefit streams will then be used to estimate the NPV of the incremental annual net benefits for each specific location benefiting from flood protection as well as the LMB as a whole.
(iv) Mainstream navigation
The existing types of navigation infrastructure along the mainstream of the Mekong river, as well as the planned developments over the next 23 years, is being identified by the navigation thematic team. The capital investment and annual operation/maintenance costs of the existing and planned infrastructure will be based on data made available by the navigation programme (NAP).
The potential economic benefits from navigation infrastructure will also be assessed. These benefits mainly derive from an increase in the volume and value of cargo utilising the Mekong mainstream that can be directly attributed to the improvements in navigation infrastructure. Furthermore, there is also likely to be increase in the number of passengers using inland water transport (IWT) which will generate further revenue.
In addition, mitigation measures may also be required to divert IWT vessels around the hydropower dams. The capital investment required to construct the civil infrastructure (canals and locks), as well as the annual costs of operating and maintaining the navigation system, will be estimated by the navigation thematic team.
These capital and O&M cost will be deducted from the incremental benefit stream. The incremental net benefit stream will then be used to estimate the NPV of incremental annual net navigation benefits for each river reach/zone and the mainstream Mekong as a whole.

22
(v) Aquaculture production
Aquaculture production systems have rapidly expanded in the LMB over the past 15 to 20 years, particularly in the Vietnam delta and NE Thailand. It is also anticipated that aquaculture production will continue to expand in all LMB countries over the next 23 years. For all LMB countries, historical trends in aquaculture development, as well as future projections of annual aquaculture production over the next 23 years, will be estimated by the agriculture/land use thematic group in consultation with the Fisheries Programme (FP). Production data will be derived from estimates of the fish pond areas and the annual yields per hectare of fish pond.
In addition, past trends and future projections (up to 2040) of the rice-fish production systems will also be determined with respect to rice-fish areas and annual fish yields.
With regard to economic valuation, current market prices for culture fish species will be used as these closely reflect their economic value under relatively free and competitive market conditions. Production costs, as well as marketing expenses, will also be determined and these data will then be used to estimate the annual net economic value of aquaculture and rice-fish systems in the present and future development situations. The economic NPV of aquaculture production and rice-fish systems for each country, as well as the LMB as a whole, will also be calculated.
(vi) Upland forestry
Past trends in upland forestry development and watershed management in the catchments of the LMB, as well as future projections of annual forestry development over the next 23 years, will be estimated by the agriculture and land use thematic group. Past and future trends in the annual area of deforestation within the catchments, as well as the annual volumes of timber production, will be assessed.
Current timber log prices for different tree species will be used to estimate the annual economic value of timber. Production costs will then be deducted in order to estimate the annual net economic value of timber production in the present and future development situations. The economic NPVs of timber production will also be calculated.
3.3.3 Positive impacts of water resource developments
(i) Development of reservoir fisheries
The hydropower reservoirs created in the LMB will provide an opportunity to develop both capture and culture fisheries. The past and on-going development of reservoir fisheries, with respect to location, area and fish production, will be determined. The phasing of the future development of reservoir fisheries over a 23 year period up to 2040 will then be undertaken, and the annual production of fish will be estimated for each reservoir.
With regard to economic valuation, current market prices will be used. Production and marketing costs will also be determined which will be then be used to estimate the annual

MRC Council Study Cumulative impact assessment of water resource development scenarios
Economic assessment methodology
23
net economic value of reservoir fish production in the present and future situations. The economic NPV of reservoir fisheries production will also be calculated.
(ii) Reduced flood damage
The annual economic benefits of mitigating floods during the wet season due to the improved regulation of river flows (as a consequence of the hydropower dams) will be evaluated. These benefits will primarily include lower crop losses as well as reduced damage to private property and public infrastructure. In addition, reduced disruption and relocation costs will also be taken into account.
The area of land benefiting from flood risk reduction will be estimated from the assessment of hydrological changes resulting from the construction of the hydropower dams. At locations where flooding risk will be reduced, information on the numbers of households and types of land use (i.e. crop production, forestry, settlements and infrastructure) will be obtained from district statistics. The annual economic value of flood mitigation will then be applied to population and land use data within each location benefiting from a reduction in flooding.
By contrasting the “future with” and “future without” annual net benefit streams, the incremental annual benefits of flood mitigation due to the construction of dams will then be derived. The NPV of incremental annual net flood reduction benefits will then be calculated for each specific area and the LMB as a whole.
(iii) Increased productive activities in areas affected by salinity
The annual economic benefits of reducing saline intrusion, due to the increased river flows during the dry season, will also be evaluated. These benefits will include higher crop productivity and improved capture fisheries within areas in the Mekong Delta which currently experiences saline intrusion.
The area of land that is likely to benefit from reduced saline intrusion will be based on the assessment of hydrological changes which will result from the construction of hydropower dams, sea level rise, land subsidence, and sand mining (mining pits trap bedload). The location of specific areas directly benefiting from reduced salinity will be mapped using the GIS database. Within areas where salinity is likely to been reduced, information on the types of land use and cropping patterns will be obtained from district statistics.
The annual economic value of crop benefits will then be applied to crop patterns benefiting from a reduction in saline intrusion. By contrasting the “future with” and “future without” annual benefit streams within the areas benefiting from a reduction in salinity, the incremental annual net benefits will then be derived and this will then be used to estimate the NPV of salinity reduction benefits.
(iv) Enhanced mainstream navigation

24
The potential economic benefits for navigation and river transport due to an increase in the depth and duration of flooding (as a result improved regulation of river flows by hydropower dams) will also be assessed. These benefits mainly derive from an increase in the number of days per annum in which the river system is navigable due to an increase in the depth and duration of river flows during critical periods in the year.
However, a clear relationship between changes in river flows and the value of additional river transport will be difficult to determine. It is generally the case that higher flows will facilitate the passing of larger boats, but it is not clear how total volumes and unit costs might be altered as a result of changes in flow.
Nevertheless, it may be possible to focus on specific river reaches that have high potential for future growth according to the emerging Navigation Regional Master Plan. Based on the minimum safe draft requirements for different types of vessel and data from the hydrological assessment, experts from the navigation programme should be able to estimate number of days per annum when the river systems are navigable by river reach/zone for both the present situation and in the future when hydropower dams are operational.
The increase in the number of days of navigation will then be converted into an economic benefit by estimating the annual volume of IWT cargo trade in both the “future with” and “future without” dams situations for each river reach/zone. The economic value of the incremental IWT cargo trade will then be estimated by applying the net value (i.e. gross value less haulage costs) per tonne to the tonnage of incremental cargo. The incremental annual economic benefits will then be used to estimate the NPV of navigation benefits.
3.3.4 Negative impacts of water resource developments
(i) (i) Decline in capture fisheries
The annual economic losses associated with a decline in capture fisheries which can be directly related to the construction of hydropower dams and flood protection infrastructure will also be evaluated. The annual economic losses of capture fisheries will comprise the direct losses in terms of the decline in the net value of capture fisheries output that is likely to result from a barrier to stop the migration of certain fish species to their breeding, spawning and feeding grounds. Changes in water levels can also have an impact on capture fisheries both positive (as dry season flows increase) and negative (as wet season flows decrease), and this also will be taken into account in the economic assessment.
Future changes in the annual fish catch, with and without the construction of water resource infrastructure, will be estimated by the biological resources assessment team. The type of fish species that will be affected will also be specified. Annual economic losses will then be calculated for a number of river reaches by applying economic prices of different fish species to the annual fish catch with and without hydropower dams and flood protection infrastructure.

MRC Council Study Cumulative impact assessment of water resource development scenarios
Economic assessment methodology
25
Annual economic values will then be estimated for the present situation, as well as “future without” and “future with” development scenarios (including exogenous developments such as overfishing) in order to determine the incremental economic value of fisheries losses due to hydropower dams and flood protection infrastructure for each riparian country and the LMB as a whole. Based on the incremental annual value of economic losses, the NPV of the decline in capture fisheries, due to water resources infrastructure, will then be calculated.
(ii) Reduction in wetland areas, key habitats and wildlife biodiversity
The economic losses associated with a reduction in wetland areas (including flooded forests), as well as their composition in terms of biodiversity of ecosystems, which can be directly related to lower river flows in the wet season due to the construction of dams and flood protection infrastructure, will be evaluated. The area of wetlands and flooded forests expected to be lost, and the annual rate of decline, will be estimated by the BioRA discipline team. The types of wetland likely to be affected and the location of specific wetland areas which are likely to be lost should also be mapped using the GIS. This assessment will also include estimates of past reductions in wetland area which have be very substantial. In 2003, the proportion of wetland areas already lost were estimated at 99% in Vietnam, 96% in Thailand, 45% in Cambodia and 30% in Lao PDR. These wetland losses were mainly due to agricultural development and urbanisation.
The annual economic value of wetland areas already lost and likely to be lost at each location will be estimated by applying unit values to different wetland types. The valuation of different types of wetlands will primarily be based on the wetland valuation studies conducted by EP (as discussed in Section 3.4: Economic valuation) as well as an analysis of the valuations undertaken for different types of wetland throughout South East Asia.
By contrasting the “future with” and “future without” annual value of wetland areas , the incremental annual wetland losses due to agriculture, urbanization, and changes in the flow regime due to irrigation and hydropower dams and flood protection structures will then be derived. The wetland loss streams will then be used to estimate the NPV of incremental wetland losses for each specific area and the LMB as a whole.
Similarly, the economic losses associated with a reduction in key habitats and wildlife biodiversity (micro-invertebrates, herpetofauna, mammals and birds) that can be directly related to the development of agriculture and the construction of water resources infrastructure, will also be evaluated. A significant proportion of ‘pristine’ wildlife biodiversity has been lost during the past 100 years and the number of threatened species has increased from 327 in 1996 to 1,525 in 2014. This decline can mainly be attributed to agricultural development, urbanisation and the expansion of transport infrastructure.
The populations of different wildlife species are expected to fall in the future (both with and without water resource developments).Estimates of the reduction in wildlife populations, as well as the annual rates of decline, will be determined by the BioRA discipline team. The types of wildlife species likely to be affected and the location of
26
specific sites of high wildlife biodiversity which will probably be lost should also be mapped using the GIS.
The incremental annual wildlife losses due to water resource developments will then be derived. The wildlife loss streams will also be used to estimate the NPV of incremental wildlife losses for each specific area and the LMB as a whole. It should, however, be noted that protected areas with high environmental value, e.g. Ramsar sites and world heritage sites, will not be adversely affected as appropriate mitigation measures will be include in the development costs.
(iii) Loss of economic assets in locations affected by riverbank erosion
The economic losses associated with increased riverbank erosion (such as loss of agricultural land and infrastructure) which can be directly related the construction of hydropower dams through a reduction in sediment transport in the river systems will also be evaluated. The annual economic losses of riverbank erosion during the wet season will include both direct losses (e.g. agricultural land, forest, private property and public infrastructure) as well as the costs of relocation and resettlement.
The area of land expected to be lost to riverbank erosion and the rate of erosion will be estimated by the biological resources assessment team as part of their geomorphological assessment. The location of specific areas which are likely to be eroded will also be mapped using the GIS.
Within areas vulnerable to erosion, information on the numbers of households and types of assets (e.g. land, houses, shops, schools, health centres, roads etc) which could be lost would be obtained from the GIS database and maps. The annual economic value of assets likely to be lost at each location will be estimated by applying unit values to a wide range of assets. For different types of land use (i.e. agriculture, forest, wetlands etc), the present value (PV) of annual benefits will be used, while replacement cost estimates will be used to value buildings and infrastructure.
Relocation and resettlement costs will be based on the unit costs of transporting goods and equipment from the houses, businesses and public facilities which are vulnerable to riverbank erosion.
By contrasting the “future with” and “future without” annual losses within the areas vulnerable to erosion, the incremental annual riverbank erosion losses from the construction of hydropower dams will then be derived. The annual loss streams will then be used to estimate the NPV of incremental riverbank erosion losses for each specific area and the LMB as a whole.
(iv) Decline in recession agriculture, lowland crop productivity, and riverbank gardens

MRC Council Study Cumulative impact assessment of water resource development scenarios
Economic assessment methodology
27
The economic losses associated with a reduction in the areas of recession cropping and riverbank gardens, as well as a decline in floodplain crop productivity, which can be directly attributed to lower river and sediment flows in the wet season (due to the construction of dams and flood protection infrastructure) will be evaluated. The areas of recession cropping and riverbank gardens expected to decline, and the annual rate of decline, will be estimated by the hydrological discipline team in association with the agriculture/land use thematic team. Similarly, areas of the floodplain likely to be adversely affected and the anticipated decline in crop productivity will also be determined. The areas and location of recession cropping, riverbank gardens and floodplain cropping should also be mapped using the GIS.
The annual net economic value of recession cropping and riverbank gardens likely to decline at each location will be estimated by applying net economic values per hectare to the areas of recession cropping and riverbank gardens in both the “future with” and “future without” development situations. Similarly, the reduction in floodplain crop yields will be determined by applying economic crop prices per tonne to the annual crop production in the affected floodplain areas (both with and without water resource developments).
By contrasting the “future with” and “future without” annual economic value of recession cropping, riverbank gardens and floodplain crop productivity, the incremental annual reduction in the value of crop production (due to the construction of hydropower dams and flood protection structures) will then be derived. The economic loss streams will then be used to estimate the NPV of incremental crop losses for each specific location of recession cropping, riverbank gardens and floodplain cropping, as well as the LMB as a whole.
(v) Deforestation
Past trends in forestry development and watershed management in the catchments of the LMB, as well as future projections of annual forestry development over the next 23 years, will be estimated by the agriculture and land use thematic group. Past and future trends in the annual area of deforestation within the catchments, as well as the annual volumes of timber production, will be assessed.
Current timber log prices for different tree species will be used to estimate the annual economic value of timber. Production costs will then be deducted in order to estimate the annual net economic value of timber production in the present and future development situations. The economic NPVs of timber production will also be calculated.
(vi) Reduction in crop production due to drought
The economic losses associated with changes in crop production due to drought will be evaluated. The areas likely to be affected by drought and the expected decline in crop yields will be determined. The location of drought affected areas should also be mapped using the GIS. The annual net economic value of crop losses will then be estimated by applying net economic values per hectare to the areas likely to be affected by drought in both the “future with” and “future without” development situations.

28
By contrasting the “future with” and “future without” development situations, the incremental annual reduction in the value of crop production (due to water resource developments) will be derived. The economic loss streams will then be used to estimate the NPV of incremental crop losses for each drought affected location as well as the LMB as a whole.
3.3.5 Indirect macro-economic impacts of water resource developments
It should be noted that this document only discusses the methodology for estimating the direct economic benefits, costs and impacts of water resource developments. The assessment of wider, indirect benefits to the macro-economy through linkages with other sectors (e.g. industry and services), which could be induced by the planned water sector investments, are examined separately.

MRC Council Study Cumulative impact assessment of water resource development scenarios
Economic assessment methodology
29
4 Data requirements for economic assessment
4.1 Overview
The economic assessment of the development scenarios will require comprehensive and reliable data sets. The main sources for data are:
Council study thematic groups: (i) land use, agriculture, aquaculture and forestry; (ii) irrigation development; (iii) domestic and industrial water use; (iii) flood protection and flood plain infrastructure, (iv) hydropower development, and (v) navigation;
Council study discipline teams: (i) biological resources assessment, (ii) climate change assessment, (iii) hydrological assessment, and (iv) socio-economic assessment;
MRC databases, e.g. (i) hydropower database, (ii) irrigation database, and (iii) socio-economic database, which have been developed in recent years;
Government statistics, economic studies and socio-economic surveys.
Data collection comprises the gathering of all documents, maps and databases available from the above sources as well as other relevant information available from the four riparian countries. The main data requirements for the economic assessments are summarised below and detailed in Tables 4.1 to 4.10.
(i) Hydropower
Historical development of hydropower in LMB (installed capacity and location) up to 2015;
Installed capacity (MW) and location of hydropower plants under construction and planned up to 2040;
Power generation (kWh) of existing, under construction and planned plants;
Capital investment and annual recurrent costs of hydropower plants;
Scheduling of construction and construction periods of planned plants;
Economic price of electricity based on production costs of alternative power sources (e.g. thermal power plants) including an assessment of alternative power generation options for each country
Annual economic value of power generation for domestic consumption and export by producer country;
Annual economic value of imported power by consumer country.

30
(ii) Irrigated Agriculture
Historical development of irrigated agriculture in LMB (irrigated area and location) from 1900 to 2015;
Area and location of irrigation schemes under construction and planned up to 2040;
Capital investment and annual recurrent costs of irrigation development;
Irrigated/rainfed cropping patterns and crop yields by location;
Annual crop production costs per hectare (inputs, labour and machinery) of irrigated and rainfed crops by location;
Annual economic benefits per hectare of irrigated and rainfed land by crop.
(iii) Flood protection
Historical development of flood protection infrastructure in LMB (type and location) from 1900 to 2015;
Type and location of flood protection works under construction and planned up to 2040;
Capital and annual recurrent costs of flood protection works;
Extent and value of damage and losses due to flooding – crops, houses and infrastructure – with and without flood protection measures;
Projected increases in the future asset values (land, housing and infrastructure) vulnerable to flooding with and without flood protection measures;
Annual economic benefits of flooding, e.g. increased crop yields and capture fisheries;
(iv) Navigation
Historical development of navigation works along the Mekong river (type and location) from 1900 to 2015;
Type and location of mainstream navigation works under construction and planned up to 2040;
Capital and annual recurrent costs of mainstream navigation works including navigation canal and locks;
Quantity of cargo and number of passengers transported by river reach;
Annual economic benefits and costs of cargo/passengers transported both with and without navigation works;
Capital and recurrent costs of alternative modes of transport, i.e. road and rail.
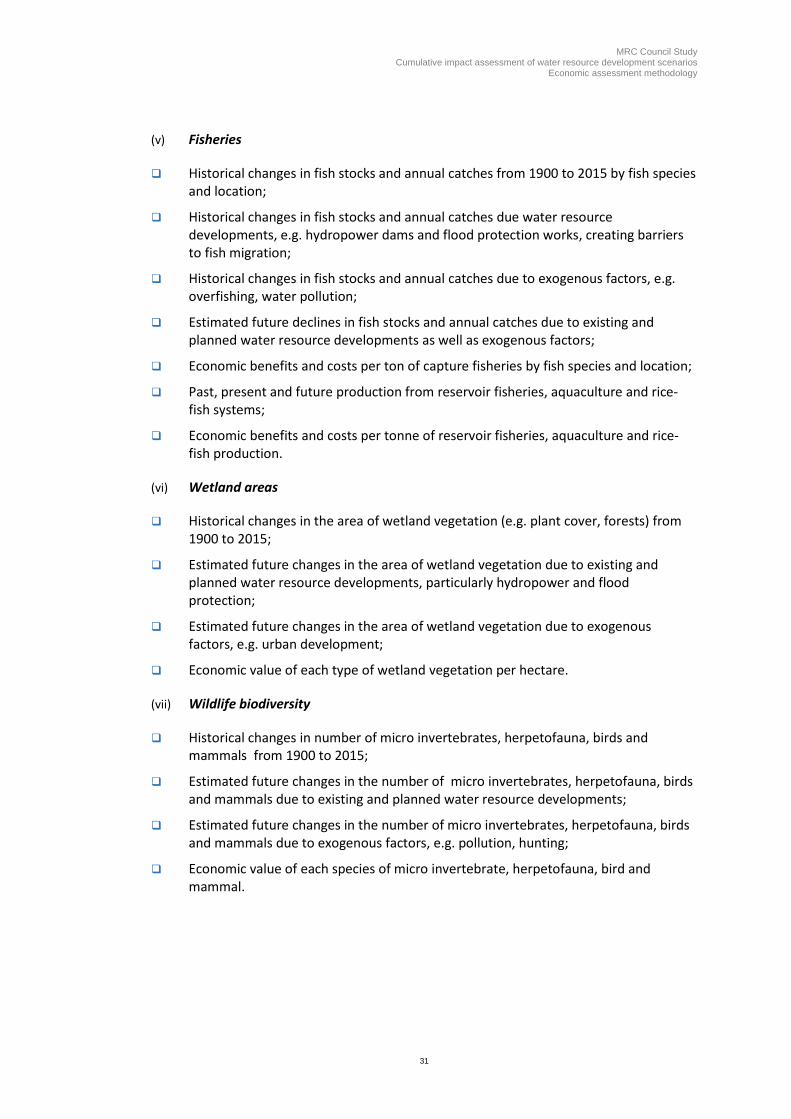
MRC Council Study Cumulative impact assessment of water resource development scenarios
Economic assessment methodology
31
(v) Fisheries
Historical changes in fish stocks and annual catches from 1900 to 2015 by fish species and location;
Historical changes in fish stocks and annual catches due water resource developments, e.g. hydropower dams and flood protection works, creating barriers to fish migration;
Historical changes in fish stocks and annual catches due to exogenous factors, e.g. overfishing, water pollution;
Estimated future declines in fish stocks and annual catches due to existing and planned water resource developments as well as exogenous factors;
Economic benefits and costs per ton of capture fisheries by fish species and location;
Past, present and future production from reservoir fisheries, aquaculture and rice-fish systems;
Economic benefits and costs per tonne of reservoir fisheries, aquaculture and rice-fish production.
(vi) Wetland areas
Historical changes in the area of wetland vegetation (e.g. plant cover, forests) from 1900 to 2015;
Estimated future changes in the area of wetland vegetation due to existing and planned water resource developments, particularly hydropower and flood protection;
Estimated future changes in the area of wetland vegetation due to exogenous factors, e.g. urban development;
Economic value of each type of wetland vegetation per hectare.
(vii) Wildlife biodiversity
Historical changes in number of micro invertebrates, herpetofauna, birds and mammals from 1900 to 2015;
Estimated future changes in the number of micro invertebrates, herpetofauna, birds and mammals due to existing and planned water resource developments;
Estimated future changes in the number of micro invertebrates, herpetofauna, birds and mammals due to exogenous factors, e.g. pollution, hunting;
Economic value of each species of micro invertebrate, herpetofauna, bird and mammal.

32
(viii) Geomorphology
Historical changes in the location and extent of riverbank erosion and saline intrusion from 1900 to 2015;
Estimated future changes in the location and extent of riverbank erosion and saline intrusion due to existing and planned water resource developments, particularly hydropower dams;
Estimated future changes in the location and extent of river bank erosion and saline intrusion due to exogenous factors, e.g. sand mining, deforestation;
Annual economic losses (land, houses and infrastructure) associated with increased riverbank erosion;
Annual economic gains/losses (crop and fish production) associated with changes in saline intrusion.
(ix) Recession agriculture, lowland crop productivity and riverbank gardens
Historical changes in the areas of recession cropping, floodplain crop productivity and riverbank gardens from 1900 to 2015;
Estimated future changes in the areas of recession cropping, floodplain crop productivity and riverbank gardens and due to existing and planned water resource developments as well as exogenous factors;
Annual economic losses associated with a reduction in the areas of recession cropping and riverbank gardens as well as the crop productivity in the floodplains.
(x) Forestry and watershed management
Historical development of forestry and watershed management in LMB (area and location) from 1900 to 2015;
Area and location of forestry and watershed management interventions under implementation and planned up to 2040;
Capital costs of forestry and watershed management interventions;
Annual economic benefits and costs of forestry and watershed management per hectare.
(xi) Sand mining
Historical development of sand mining in the Mekong mainstream (area and location) from 1900 to 2015;
Estimated future changes in sand mining activities due to planned water resource developments as well as exogenous factors;
Annual economic benefits/losses associated with changes in sand mining activities.
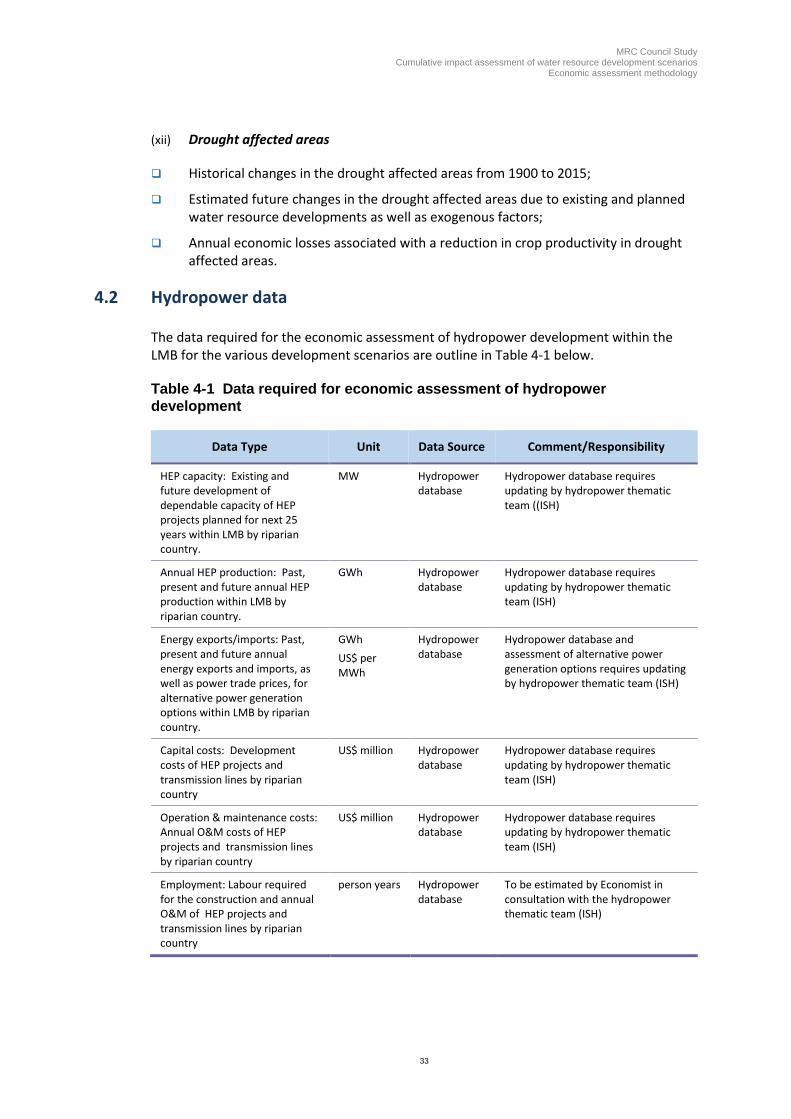
MRC Council Study Cumulative impact assessment of water resource development scenarios
Economic assessment methodology
33
(xii) Drought affected areas
Historical changes in the drought affected areas from 1900 to 2015;
Estimated future changes in the drought affected areas due to existing and planned water resource developments as well as exogenous factors;
Annual economic losses associated with a reduction in crop productivity in drought affected areas.
4.2 Hydropower data
The data required for the economic assessment of hydropower development within the LMB for the various development scenarios are outline in Table 4-1 below.
Table 4-1 Data required for economic assessment of hydropower
development
Data Type Unit Data Source Comment/Responsibility
HEP capacity: Existing and future development of dependable capacity of HEP projects planned for next 25 years within LMB by riparian country.
MW Hydropower database
Hydropower database requires updating by hydropower thematic team ((ISH)
Annual HEP production: Past, present and future annual HEP production within LMB by riparian country.
GWh Hydropower database
Hydropower database requires updating by hydropower thematic team (ISH)
Energy exports/imports: Past, present and future annual energy exports and imports, as well as power trade prices, for alternative power generation options within LMB by riparian country.
GWh
US$ per MWh
Hydropower database
Hydropower database and assessment of alternative power generation options requires updating by hydropower thematic team (ISH)
Capital costs: Development costs of HEP projects and transmission lines by riparian country
US$ million Hydropower database
Hydropower database requires updating by hydropower thematic team (ISH)
Operation & maintenance costs: Annual O&M costs of HEP projects and transmission lines by riparian country
US$ million Hydropower database
Hydropower database requires updating by hydropower thematic team (ISH)
Employment: Labour required for the construction and annual O&M of HEP projects and transmission lines by riparian country
person years Hydropower database
To be estimated by Economist in consultation with the hydropower thematic team (ISH)

34
Data Type Unit Data Source Comment/Responsibility
Costs of resettlement and compensation for households displaced by reservoirs and structures
No. households
US$ per household
HEP project documents
To be estimated by Economist and Social Scientist in consultation with the hydropower thematic team (ISH)
Costs of mitigation adverse environmental impacts, e.g. fish passes for capture fisheries.
US$ million per HEP project
HEP project documents
To be estimated by the hydropower thematic team (ISH) based on mitigation measures undertake for other HEP projects
4.3 Irrigated agriculture data
The data required for the economic assessment of irrigation development within the LMB for the various development scenarios are outline in Table 5.2.
Table 4-2 Data required for economic assessment of irrigation development
Data Type Unit Data Source Comment/Responsibility
Irrigated areas: Past and present area of existing irrigation schemes, as well as area of new irrigation schemes planned for next 25 years within LMB by riparian country
ha MRC irrigation database
Existing and planned irrigated areas to be updated and locations mapped by irrigation thematic team (AIP)
Irrigated cropping patterns: Proportion of area under each crop (rice and non-rice) for variety of irrigated cropping patterns within each riparian country1/
% of cultivated area
MRC irrigation database
Existing cropping patterns to be updated by irrigation thematic team (AIP)
Economist to derive future irrigated cropping patterns in consultation with irrigation thematic team (AIP)
Rain fed cropping patterns: Proportion of area under each crop (rice and non-rice) for variety of rain fed cropping patterns within each riparian country
% of cultivated area
Based on existing cropping patterns available in MRC database
To be derived by Economist in consultation with agriculture/land use thematic team (AIP)
Crop yields: Past, present and future annual crop yields (with & without irrigation project over 25 years) for different rice and non-rice crops within each rain fed and irrigated cropping pattern
tonne per ha District level govt. statistics within each country
MRC Irrigation Sector Review - National Reports
Past and present crop yield data need to be collected from national statistics
Future crop yields (with and without irrigation) to be estimated by Economist in consultation with irrigation thematic team (AIP)
Crop inputs: Past, present and future (with & without
kg per ha Govt statistics within each
Past and present crop inputs to be estimated based on national

MRC Council Study Cumulative impact assessment of water resource development scenarios
Economic assessment methodology
35
Data Type Unit Data Source Comment/Responsibility
project) use of seed, fertilisers and pesticides for different rice and non-rice crops within each rain fed and irrigated cropping pattern
riparian country
statistics
Future crop inputs (with and without irrigation) to be estimated by Economist in consultation with irrigation thematic team (AIP)
Labour and machinery requirements: Past, present and future (with & without irrigation) labour and machinery/equipment requirements for different rice and non-rice crops within each rain fed and irrigated cropping pattern
person days per ha
machinery hours per ha
Irrigation and agricultural project reports
Past and present labour and machinery requirements based on available statistics
Future labour and machinery requirements (with and without irrigation) to be estimated by Economist in consultation with irrigation thematic team (AIP)
Output and input prices: Farm gate and market prices for farm produce (rice and non-rice crops), seeds, fertilisers, pesticides, as well as rural wage rates and hire charges for machinery/equipment and transport within each riparian country.
US$/tonne
US$/person day
US$/ mach. hour
US$/tonne/km
Govt statistics within each riparian country.
World Bank commodity price projections
Financial prices to be collected by Economist.
Economic prices to be derived by Economist.
Capital costs: Costs of civil works and equipment for different types of irrigation/drainage scheme, e.g. gravity and pumping (low lift , high lift) by riparian country
US$ million per ha
MRC irrigation database
Irrigation project reports
To be estimated by Economist in consultation with irrigation thematic team (AIP)
Operation & maintenance costs: Annual O&M costs of different types of irrigation scheme, e.g. gravity, pumping (low lift , high lift) by country
US$ per hectare
Irrigation project documents
To be estimated by Economist in consultation with irrigation thematic team (AIP)
Employment: Labour required for the construction and annual O&M of irrigation projects by country
person years Irrigation project documents
To be estimated by Economist in consultation with irrigation thematic team (AIP)
4.4 Flood protection data
The data required for the economic assessment of flood protection and mitigation measures for the various development scenario are outline in Table 4-3 below.
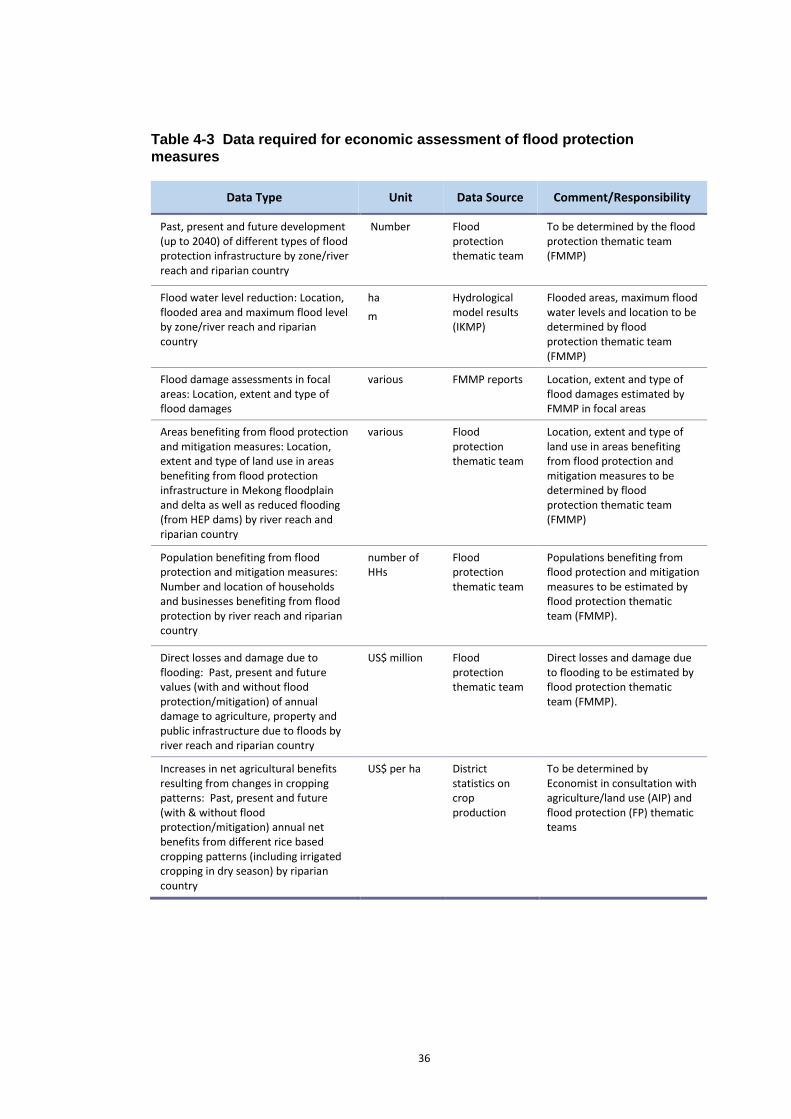
36
Table 4-3 Data required for economic assessment of flood protection
measures
Data Type Unit Data Source Comment/Responsibility
Past, present and future development (up to 2040) of different types of flood protection infrastructure by zone/river reach and riparian country
Number Flood protection thematic team
To be determined by the flood protection thematic team (FMMP)
Flood water level reduction: Location, flooded area and maximum flood level by zone/river reach and riparian country
ha
m
Hydrological model results (IKMP)
Flooded areas, maximum flood water levels and location to be determined by flood protection thematic team (FMMP)
Flood damage assessments in focal areas: Location, extent and type of flood damages
various FMMP reports Location, extent and type of flood damages estimated by FMMP in focal areas
Areas benefiting from flood protection and mitigation measures: Location, extent and type of land use in areas benefiting from flood protection infrastructure in Mekong floodplain and delta as well as reduced flooding (from HEP dams) by river reach and riparian country
various Flood protection thematic team
Location, extent and type of land use in areas benefiting from flood protection and mitigation measures to be determined by flood protection thematic team (FMMP)
Population benefiting from flood protection and mitigation measures: Number and location of households and businesses benefiting from flood protection by river reach and riparian country
number of HHs
Flood protection thematic team
Populations benefiting from flood protection and mitigation measures to be estimated by flood protection thematic team (FMMP).
Direct losses and damage due to flooding: Past, present and future values (with and without flood protection/mitigation) of annual damage to agriculture, property and public infrastructure due to floods by river reach and riparian country
US$ million Flood protection thematic team
Direct losses and damage due to flooding to be estimated by flood protection thematic team (FMMP).
Increases in net agricultural benefits resulting from changes in cropping patterns: Past, present and future (with & without flood protection/mitigation) annual net benefits from different rice based cropping patterns (including irrigated cropping in dry season) by riparian country
US$ per ha District statistics on crop production
To be determined by Economist in consultation with agriculture/land use (AIP) and flood protection (FP) thematic teams
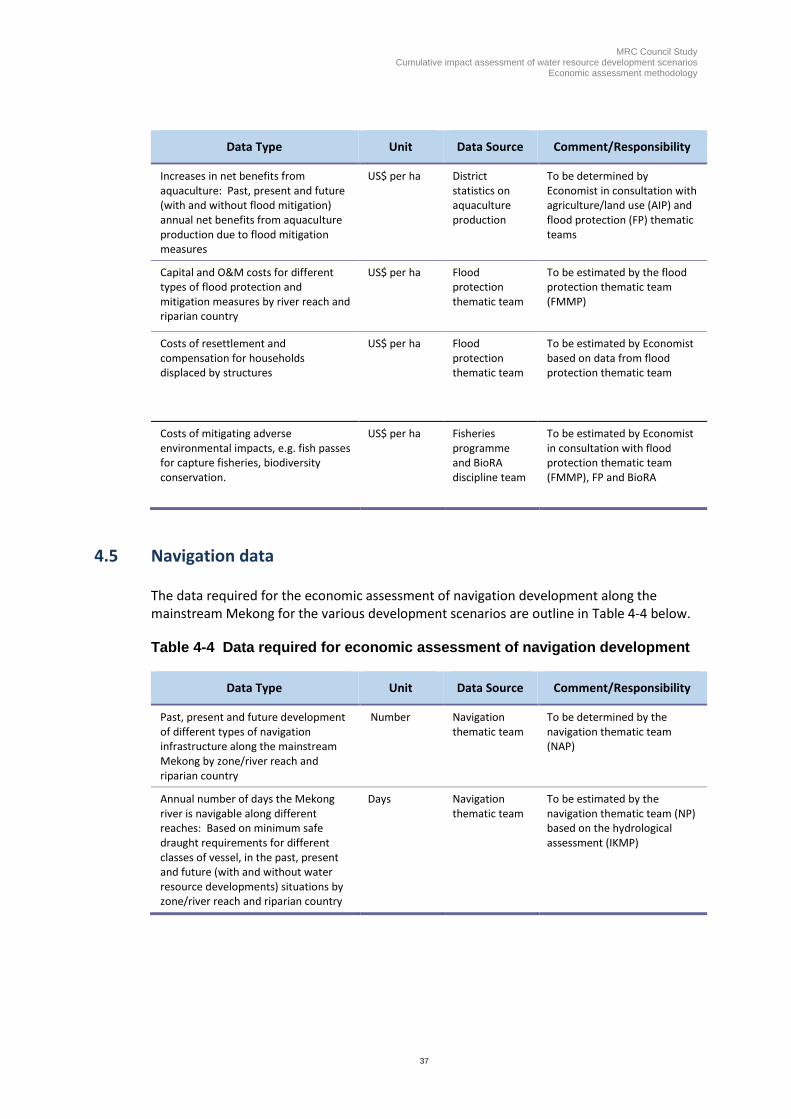
MRC Council Study Cumulative impact assessment of water resource development scenarios
Economic assessment methodology
37
Data Type Unit Data Source Comment/Responsibility
Increases in net benefits from aquaculture: Past, present and future (with and without flood mitigation) annual net benefits from aquaculture production due to flood mitigation measures
US$ per ha District statistics on aquaculture production
To be determined by Economist in consultation with agriculture/land use (AIP) and flood protection (FP) thematic teams
Capital and O&M costs for different types of flood protection and mitigation measures by river reach and riparian country
US$ per ha Flood protection thematic team
To be estimated by the flood protection thematic team (FMMP)
Costs of resettlement and compensation for households displaced by structures
US$ per ha Flood protection thematic team
To be estimated by Economist based on data from flood protection thematic team
Costs of mitigating adverse environmental impacts, e.g. fish passes for capture fisheries, biodiversity conservation.
US$ per ha Fisheries programme and BioRA discipline team
To be estimated by Economist in consultation with flood protection thematic team (FMMP), FP and BioRA
4.5 Navigation data
The data required for the economic assessment of navigation development along the mainstream Mekong for the various development scenarios are outline in Table 4-4 below.
Table 4-4 Data required for economic assessment of navigation development
Data Type Unit Data Source Comment/Responsibility
Past, present and future development of different types of navigation infrastructure along the mainstream Mekong by zone/river reach and riparian country
Number Navigation thematic team
To be determined by the navigation thematic team (NAP)
Annual number of days the Mekong river is navigable along different reaches: Based on minimum safe draught requirements for different classes of vessel, in the past, present and future (with and without water resource developments) situations by zone/river reach and riparian country
Days Navigation thematic team
To be estimated by the navigation thematic team (NP) based on the hydrological assessment (IKMP)
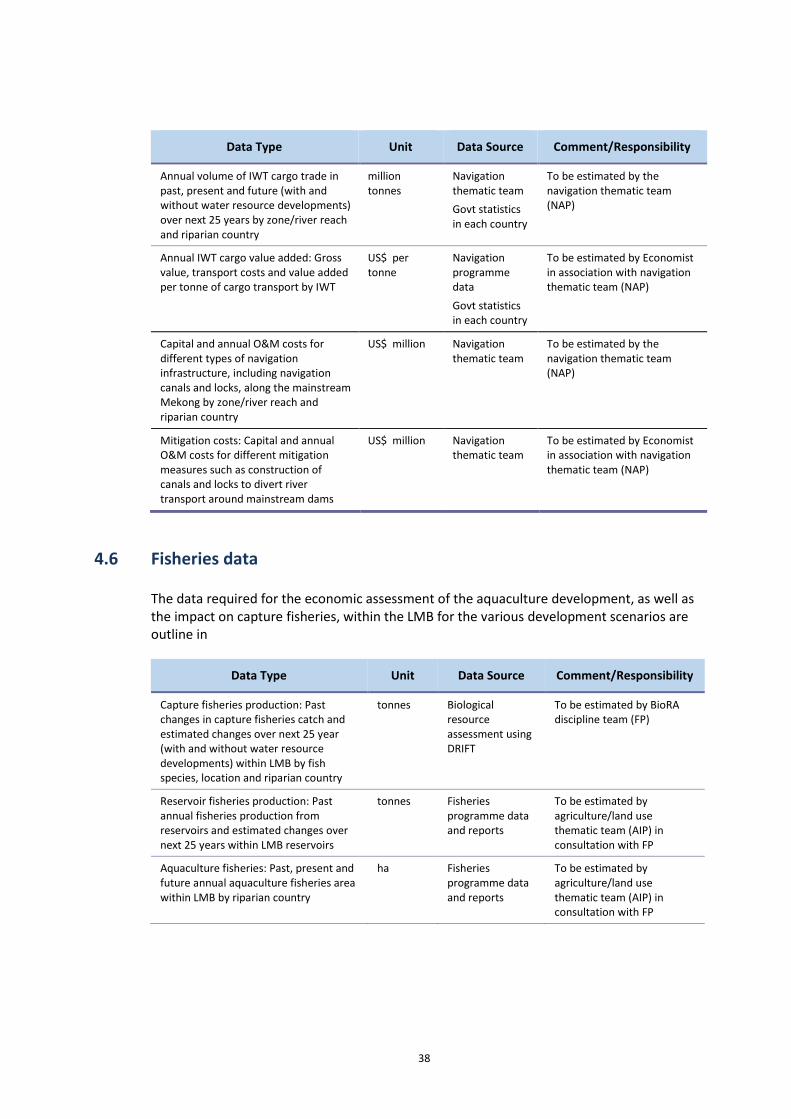
38
Data Type Unit Data Source Comment/Responsibility
Annual volume of IWT cargo trade in past, present and future (with and without water resource developments) over next 25 years by zone/river reach and riparian country
million tonnes
Navigation thematic team
Govt statistics in each country
To be estimated by the navigation thematic team (NAP)
Annual IWT cargo value added: Gross value, transport costs and value added per tonne of cargo transport by IWT
US$ per tonne
Navigation programme data
Govt statistics in each country
To be estimated by Economist in association with navigation thematic team (NAP)
Capital and annual O&M costs for different types of navigation infrastructure, including navigation canals and locks, along the mainstream Mekong by zone/river reach and riparian country
US$ million
Navigation thematic team
To be estimated by the navigation thematic team (NAP)
Mitigation costs: Capital and annual O&M costs for different mitigation measures such as construction of canals and locks to divert river transport around mainstream dams
US$ million Navigation thematic team
To be estimated by Economist in association with navigation thematic team (NAP)
4.6 Fisheries data
The data required for the economic assessment of the aquaculture development, as well as the impact on capture fisheries, within the LMB for the various development scenarios are outline in
Data Type Unit Data Source Comment/Responsibility
Capture fisheries production: Past changes in capture fisheries catch and estimated changes over next 25 year (with and without water resource developments) within LMB by fish species, location and riparian country
tonnes Biological resource assessment using DRIFT
To be estimated by BioRA discipline team (FP)
Reservoir fisheries production: Past annual fisheries production from reservoirs and estimated changes over next 25 years within LMB reservoirs
tonnes Fisheries programme data and reports
To be estimated by agriculture/land use thematic team (AIP) in consultation with FP
Aquaculture fisheries: Past, present and future annual aquaculture fisheries area within LMB by riparian country
ha Fisheries programme data and reports
To be estimated by agriculture/land use thematic team (AIP) in consultation with FP
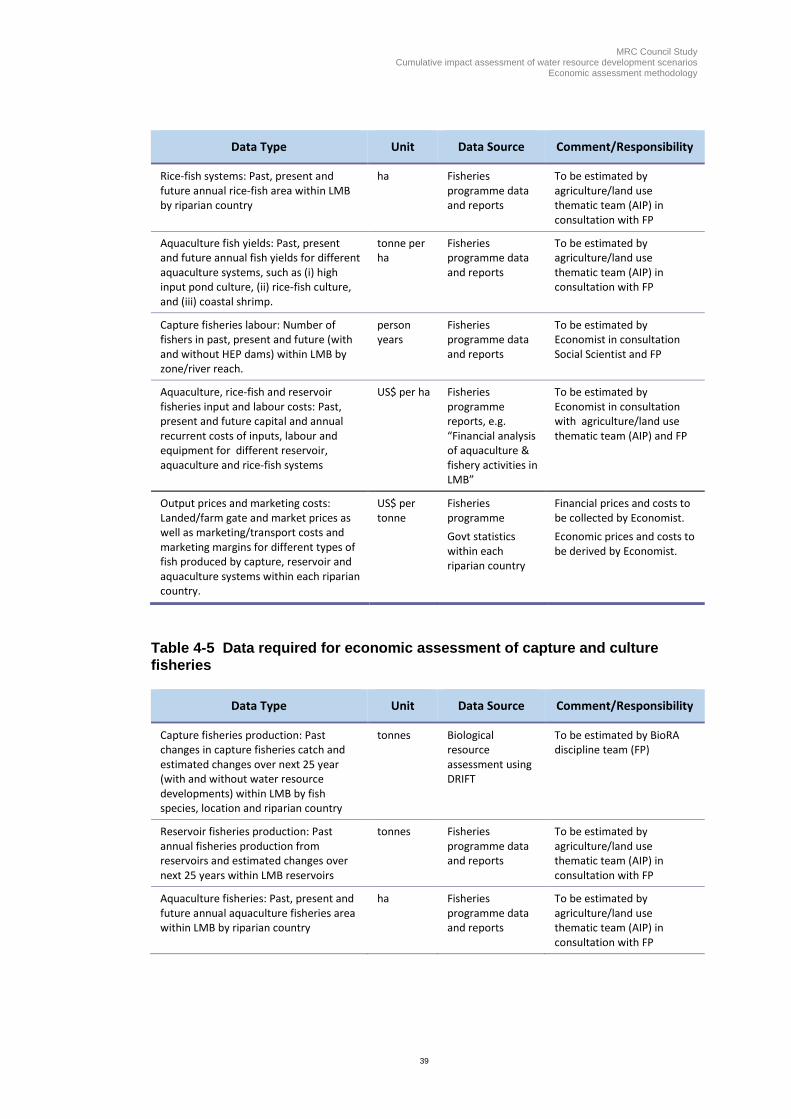
MRC Council Study Cumulative impact assessment of water resource development scenarios
Economic assessment methodology
39
Data Type Unit Data Source Comment/Responsibility
Rice-fish systems: Past, present and future annual rice-fish area within LMB by riparian country
ha Fisheries programme data and reports
To be estimated by agriculture/land use thematic team (AIP) in consultation with FP
Aquaculture fish yields: Past, present and future annual fish yields for different aquaculture systems, such as (i) high input pond culture, (ii) rice-fish culture, and (iii) coastal shrimp.
tonne per ha
Fisheries programme data and reports
To be estimated by agriculture/land use thematic team (AIP) in consultation with FP
Capture fisheries labour: Number of fishers in past, present and future (with and without HEP dams) within LMB by zone/river reach.
person years
Fisheries programme data and reports
To be estimated by Economist in consultation Social Scientist and FP
Aquaculture, rice-fish and reservoir fisheries input and labour costs: Past, present and future capital and annual recurrent costs of inputs, labour and equipment for different reservoir, aquaculture and rice-fish systems
US$ per ha Fisheries programme reports, e.g. “Financial analysis of aquaculture & fishery activities in LMB”
To be estimated by Economist in consultation with agriculture/land use thematic team (AIP) and FP
Output prices and marketing costs: Landed/farm gate and market prices as well as marketing/transport costs and marketing margins for different types of fish produced by capture, reservoir and aquaculture systems within each riparian country.
US$ per tonne
Fisheries programme
Govt statistics within each riparian country
Financial prices and costs to be collected by Economist.
Economic prices and costs to be derived by Economist.
Table 4-5 Data required for economic assessment of capture and culture
fisheries
Data Type Unit Data Source Comment/Responsibility
Capture fisheries production: Past changes in capture fisheries catch and estimated changes over next 25 year (with and without water resource developments) within LMB by fish species, location and riparian country
tonnes Biological resource assessment using DRIFT
To be estimated by BioRA discipline team (FP)
Reservoir fisheries production: Past annual fisheries production from reservoirs and estimated changes over next 25 years within LMB reservoirs
tonnes Fisheries programme data and reports
To be estimated by agriculture/land use thematic team (AIP) in consultation with FP
Aquaculture fisheries: Past, present and future annual aquaculture fisheries area within LMB by riparian country
ha Fisheries programme data and reports
To be estimated by agriculture/land use thematic team (AIP) in consultation with FP

40
Data Type Unit Data Source Comment/Responsibility
Rice-fish systems: Past, present and future annual rice-fish area within LMB by riparian country
ha Fisheries programme data and reports
To be estimated by agriculture/land use thematic team (AIP) in consultation with FP
Aquaculture fish yields: Past, present and future annual fish yields for different aquaculture systems, such as (i) high input pond culture, (ii) rice-fish culture, and (iii) coastal shrimp.
tonne per ha
Fisheries programme data and reports
To be estimated by agriculture/land use thematic team (AIP) in consultation with FP
Capture fisheries labour: Number of fishers in past, present and future (with and without HEP dams) within LMB by zone/river reach.
person years
Fisheries programme data and reports
To be estimated by Economist in consultation Social Scientist and FP
Aquaculture, rice-fish and reservoir fisheries input and labour costs: Past, present and future capital and annual recurrent costs of inputs, labour and equipment for different reservoir, aquaculture and rice-fish systems
US$ per ha Fisheries programme reports, e.g. “Financial analysis of aquaculture & fishery activities in LMB”
To be estimated by Economist in consultation with agriculture/land use thematic team (AIP) and FP
Output prices and marketing costs: Landed/farm gate and market prices as well as marketing/transport costs and marketing margins for different types of fish produced by capture, reservoir and aquaculture systems within each riparian country.
US$ per tonne
Fisheries programme
Govt statistics within each riparian country
Financial prices and costs to be collected by Economist.
Economic prices and costs to be derived by Economist.
4.7 Wetlands and wildlife biodiversity data
The data required for the economic assessment of the impact on wetlands areas and wildlife biodiversity within the LMB for various development scenarios are outline in Table 4-6 below.
Table 4-6 Data required for economic assessment of impact on wetlands and
wildlife
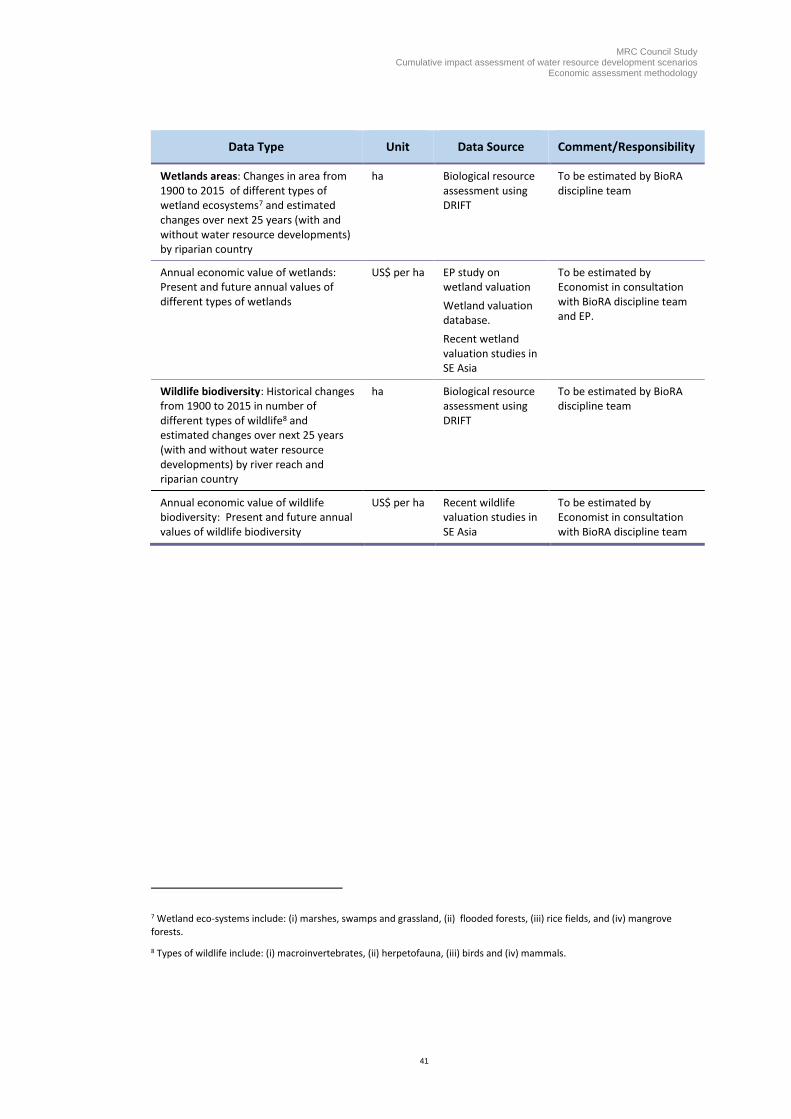
MRC Council Study Cumulative impact assessment of water resource development scenarios
Economic assessment methodology
41
Data Type Unit Data Source Comment/Responsibility
Wetlands areas: Changes in area from 1900 to 2015 of different types of wetland ecosystems7 and estimated changes over next 25 years (with and without water resource developments) by riparian country
ha Biological resource assessment using DRIFT
To be estimated by BioRA discipline team
Annual economic value of wetlands: Present and future annual values of different types of wetlands
US$ per ha EP study on wetland valuation
Wetland valuation database.
Recent wetland valuation studies in SE Asia
To be estimated by Economist in consultation with BioRA discipline team and EP.
Wildlife biodiversity: Historical changes from 1900 to 2015 in number of different types of wildlife8 and estimated changes over next 25 years (with and without water resource developments) by river reach and riparian country
ha Biological resource assessment using DRIFT
To be estimated by BioRA discipline team
Annual economic value of wildlife biodiversity: Present and future annual values of wildlife biodiversity
US$ per ha Recent wildlife valuation studies in SE Asia
To be estimated by Economist in consultation with BioRA discipline team
7 Wetland eco-systems include: (i) marshes, swamps and grassland, (ii) flooded forests, (iii) rice fields, and (iv) mangrove forests.
8 Types of wildlife include: (i) macroinvertebrates, (ii) herpetofauna, (iii) birds and (iv) mammals.

42
4.8 Riverbank erosion data
The data required for the economic assessment of the impact on riverbank erosion within the LMB for each of development scenarios are outline in Table 4-7.
Table 4-7 Data required for economic assessment of the impact of riverbank
erosion
Data Type Unit Data Source Comment/Responsibility
Areas affected by riverbank erosion: Location, extent and type of assets, e.g. land, property and infrastructure, expected to be lost to riverbank erosion within vulnerable areas in present and future (with and without water resource developments) by riparian country
ha BioRA’s geomorphology assessment
Land us mapping
Areas affected by river bank erosion to be estimated by BioRA discipline team.
Land use mapping of areas vulnerable to riverbank erosion by agriculture/land use thematic team
Population vulnerable to riverbank erosion: Number and location of households and businesses vulnerable to riverbank erosion in LMB by riparian country
number of HHs
Socio-economic data
Mapping of populations vulnerable to riverbank erosion by socio-economic discipline team
Value of assets vulnerable to riverbank erosion: Past, present and future unit value of land, property and infrastructure vulnerable to riverbank erosion in the LMB over next 25 year period by riparian country.
US$/ha
US$/property
US$/km infra-structure
District level govt. statistics
To be estimated by Economists
Relocation and resettlement costs: Relocation and resettlement costs per household in areas affected by riverbank erosion
US$ per HH
District level govt. statistics
To be estimated by Economists
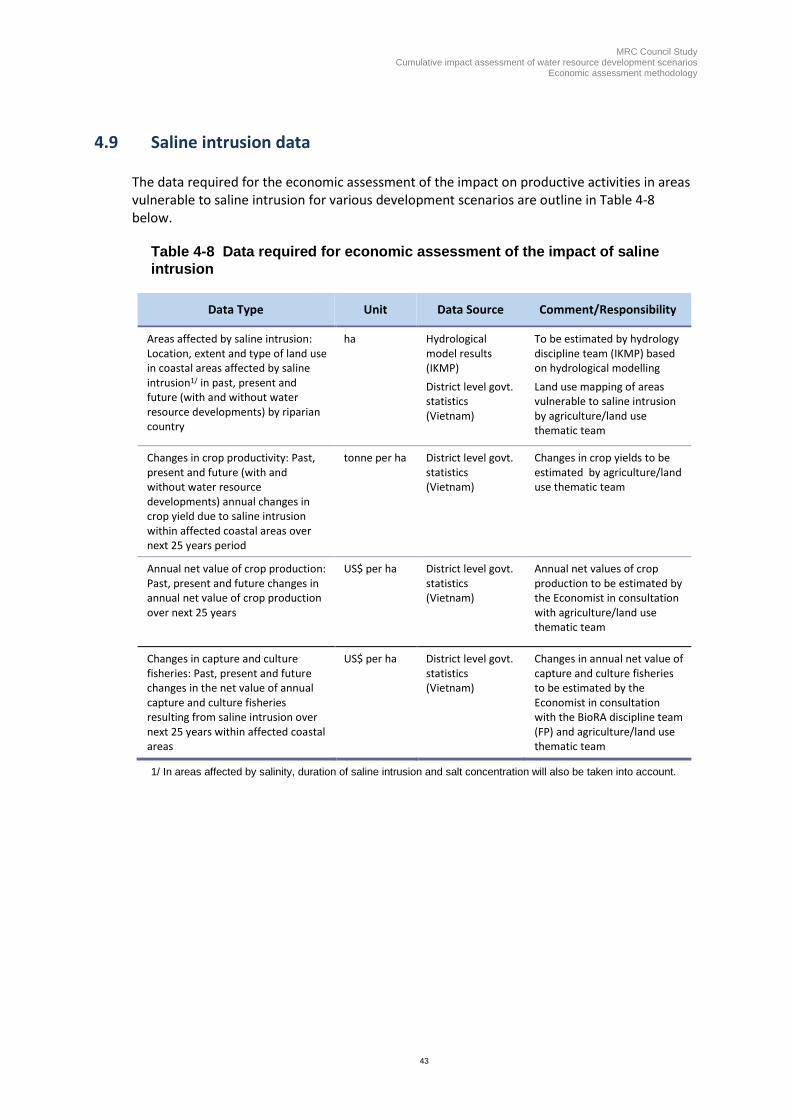
MRC Council Study Cumulative impact assessment of water resource development scenarios
Economic assessment methodology
43
4.9 Saline intrusion data
The data required for the economic assessment of the impact on productive activities in areas vulnerable to saline intrusion for various development scenarios are outline in Table 4-8 below.
Table 4-8 Data required for economic assessment of the impact of saline
intrusion
Data Type Unit Data Source Comment/Responsibility
Areas affected by saline intrusion: Location, extent and type of land use in coastal areas affected by saline intrusion1/ in past, present and future (with and without water resource developments) by riparian country
ha Hydrological model results (IKMP)
District level govt. statistics (Vietnam)
To be estimated by hydrology discipline team (IKMP) based on hydrological modelling
Land use mapping of areas vulnerable to saline intrusion by agriculture/land use thematic team
Changes in crop productivity: Past, present and future (with and without water resource developments) annual changes in crop yield due to saline intrusion within affected coastal areas over next 25 years period
tonne per ha
District level govt. statistics (Vietnam)
Changes in crop yields to be estimated by agriculture/land use thematic team
Annual net value of crop production: Past, present and future changes in annual net value of crop production over next 25 years
US$ per ha
District level govt. statistics (Vietnam)
Annual net values of crop production to be estimated by the Economist in consultation with agriculture/land use thematic team
Changes in capture and culture fisheries: Past, present and future changes in the net value of annual capture and culture fisheries resulting from saline intrusion over next 25 years within affected coastal areas
US$ per ha District level govt. statistics (Vietnam)
Changes in annual net value of capture and culture fisheries to be estimated by the Economist in consultation with the BioRA discipline team (FP) and agriculture/land use thematic team
1/ In areas affected by salinity, duration of saline intrusion and salt concentration will also be taken into account.

44
4.10 Recession agriculture, lowland crop productivity and riverbank garden data
The data required for the economic assessment of the impact on recession cropping, floodplain crop productivity, and riverbank gardens are outline in Table 4-9 below.
Table 4-9 Data required for economic assessment of the impact on recession
agriculture, floodplain productivity and riverbank gardens
Data Type Unit Data Source Comment/Responsibility
Recession cropping: Area and location of recession cropping in past, present and future (with and without water resource developments) over next 25 years by riparian country
ha Hydrological model results (IKMP)
District level govt. statistics
Recession cropping area to be estimated by hydrology discipline team (IKMP)
Land use mapping of recession cropping areas by agriculture/land use team
Crop productivity: Past, present and future (with and without water resource developments) annual crop yields in recession cropping areas over next 25 years by riparian country
tonne per ha
District level govt. statistics
Crop yields to be estimated by agriculture/land use thematic team
Annual net value of crop production: Past, present and future changes in annual net value of crop production in recession cropping areas over next 25 years by riparian country
US$ per ha
District level govt. statistics
Annual net values of crop production to be estimated by Economist in consultation with agriculture/land use thematic team
Lowland crop productivity: Area and location of floodplains vulnerable to a reduction in sediment deposits in past, present and future (with and without water resource developments) over next 25 years by riparian country
ha Hydrological model results (IKMP)
District level govt. statistics
Floodplain area to be estimated by hydrology discipline team (IKMP)
Land use mapping of areas with declining sedimentation by agriculture/land use team
Crop productivity: Past, present and future (with and without water resource developments) annual crop yields in areas with declining sedimentation over next 25 years by riparian country
tonne per ha
District level govt. statistics
Crop yields to be estimated by agriculture/land use thematic team
Annual net value of crop production: Past, present and future changes in annual net value of crop production in areas with declining sedimentation over next 25 years by riparian country
US$ per ha
District level govt. statistics
Annual net values of crop production to be estimated by Economist in consultation with agriculture/land use thematic team

MRC Council Study Cumulative impact assessment of water resource development scenarios
Economic assessment methodology
45
Data Type Unit Data Source Comment/Responsibility
River garden areas: Past, present and future area (with and without water resource developments) of river gardens over next 25 years by river reach and riparian country
ha National statistics and land use maps
Riverbank garden area to be estimated by agriculture/land use thematic team
Annual net value of river gardens: Present and future annual net values of river gardens
US$ per ha
District level govt. statistics
To be estimated by Economist in consultation with agriculture/land use thematic team
4.11 Forestry data
The data required for the economic assessment of forestry development are outline in Table 4-10 below.
Table 4-10 Data required for economic assessment of forestry development
Data Type Unit Data Source Comment/Responsibility
Area and location of forestry developments in past, present and future over next 25 years by riparian country
ha District level govt. statistics
Forest area to be estimated, and locations mapped, by agriculture/land use thematic team
Timber production: Past, present and future annual yields of timber logs over next 25 years by riparian country
Cu m per ha
District level govt. statistics
Timber log yields to be estimated by agriculture/land use thematic team
Capital investment in forestry development in past, present and future over next 25 years
US$ million District level govt. statistics
Capital investment to be estimated by agriculture/land use thematic team
Annual net value of timber production in past, present and future over next 25 years by riparian country
US$ per ha
District level govt. statistics
Annual net values of timber production to be estimated by Economist in consultation with agriculture/land use thematic team
4.12 Sand mining data
The data required for the economic assessment of sand mining are outline in Table 4-11 below.
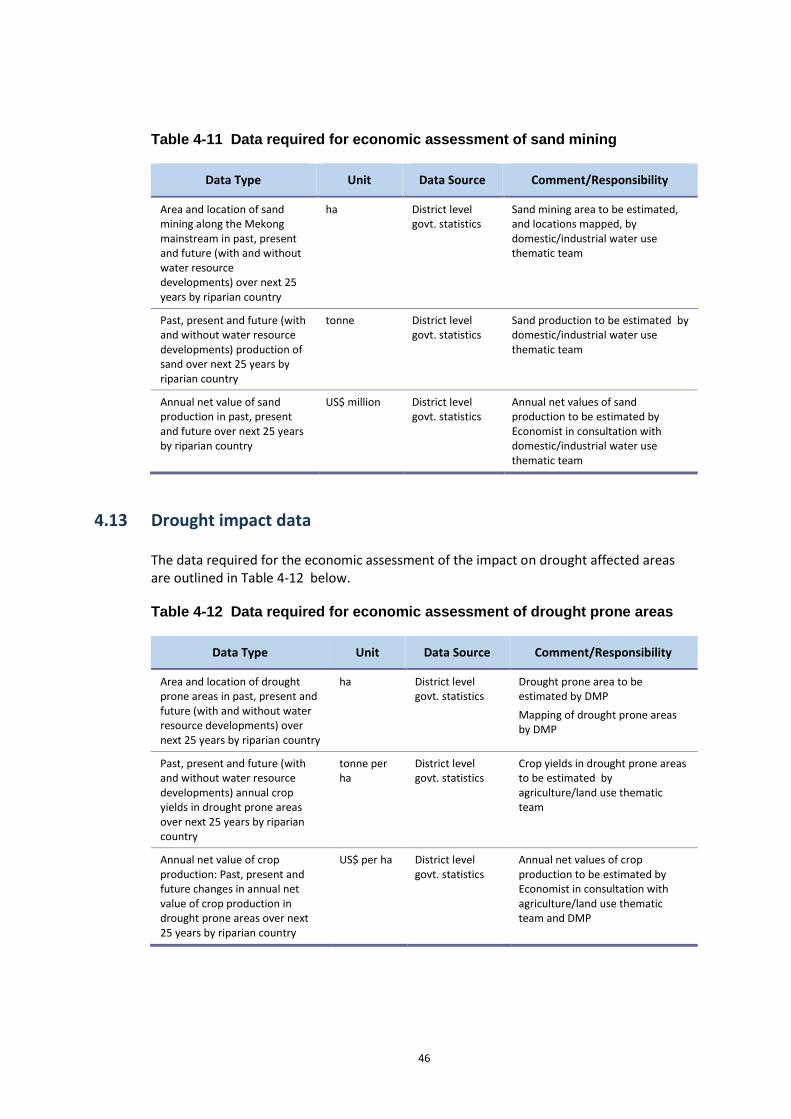
46
Table 4-11 Data required for economic assessment of sand mining
Data Type Unit Data Source Comment/Responsibility
Area and location of sand mining along the Mekong mainstream in past, present and future (with and without water resource developments) over next 25 years by riparian country
ha District level govt. statistics
Sand mining area to be estimated, and locations mapped, by domestic/industrial water use thematic team
Past, present and future (with and without water resource developments) production of sand over next 25 years by riparian country
tonne
District level govt. statistics
Sand production to be estimated by domestic/industrial water use thematic team
Annual net value of sand production in past, present and future over next 25 years by riparian country
US$ million
District level govt. statistics
Annual net values of sand production to be estimated by Economist in consultation with domestic/industrial water use thematic team
4.13 Drought impact data
The data required for the economic assessment of the impact on drought affected areas are outlined in Table 4-12 below.
Table 4-12 Data required for economic assessment of drought prone areas
Data Type Unit Data Source Comment/Responsibility
Area and location of drought prone areas in past, present and future (with and without water resource developments) over next 25 years by riparian country
ha District level govt. statistics
Drought prone area to be estimated by DMP
Mapping of drought prone areas by DMP
Past, present and future (with and without water resource developments) annual crop yields in drought prone areas over next 25 years by riparian country
tonne per ha
District level govt. statistics
Crop yields in drought prone areas to be estimated by agriculture/land use thematic team
Annual net value of crop production: Past, present and future changes in annual net value of crop production in drought prone areas over next 25 years by riparian country
US$ per ha
District level govt. statistics
Annual net values of crop production to be estimated by Economist in consultation with agriculture/land use thematic team and DMP