april 2016 volume 17 no. 1 issn 2347 - 4912 shelter · mmrda rental housing scheme inside t h e m e...
TRANSCRIPT
THEME
Publication
ISSN 2347 - 4912Volume 17 No. 1April 2016
SHELTERTheme Paper Policy Review Case Studies
AFFORDABLE HOUSING

Vol 17 No. 1 April 2016
www.hudco.org
ISSN 2347 - 4912
SHELTER is an official publication ofHUDCO/HSMI, distributed free ofcharge. It deals with issues related tohousing, urban development andother themes relevant to the habitatsector. Contributions, comments andcorrespondence are most welcomeand should be forwarded to:
EDITORSHELTERHUDCO’s Human Settlement Management InstitueHUDCO House, Lodhi RoadNew Delhi- 110 003Tel: 011 -24308600/638Fax: 011-24365292Email: [email protected]
BOARD OF DIRECTORSChairman & Managing DirectorDr. M. Ravi Kanth, IAS (r )
DirectorsShri N. L. ManjokaShri Rakesh Kumar AroraShri Rajiv Ranjan Mishra, IASSmt. Jhanja Tripathy
Company SecretaryShri Harish Kumar Sharma
EDITORIAL TEAMChief Editor: Rajiv SharmaCo-Editor: Dr. Akshaya SenDr. D. Ravi ShankarMs Nila PandianCover Design: Quip DesignCover Photo Credit: Rajiv Sharma
Nila Pandian
Registered Office:HUDCO Bhawan, Core-7-A,India Habitat Centre,Lodhi Road,New Delhi - 110 003Tel(EPABX) :011-24649610-23,24627113-15,24627091,92,95After Office Hours: 24648193-95Fax:011-24625308CIN:U74899DL1970GOI005276E-Mail: [email protected]
Affordability is measured in terms of disposable income and affordablehousing is categorized in terms of cost of a house, as a proportion to the totalincome of a household. For the urban poor, the cost of affordable house shouldnot exceed five times the household gross annual income and the EMI/rentshould not exceed 30 per cent of the household’s gross monthly income. As aresult, providing affordable housing is a daunting task, particularly when thecost of building material and land prices are on the rise. The gap betweensupply and demand of low cost housing for this income category is increasing,since it is impossible to construct a house within affordable limits for thisgroup. If left to the market forces, builders will target the groups with apredictable and regular disposal income. Thus, middle income and highincome groups become an obvious choice, since they are considered bankable.Lack of market support in favour of poor households, limits the supply ofhousing for them and blocks the opportunity of aspiring households, resultingin increasing financial stress, personal underachievement and societal costs.
This is where the role of government becomes significant. Government shouldprepare a strategy to take this challenge head-on and boost the supply ofdiverse housing options. The solution is to incentivize market forces to deliverhouses for these categories. For this a three-fold strategy is needed. First is toallow private sector to construct houses for the poor on ownership basis. Thesubsidy should be passed directly to the occupants in their accounts, as donein the case of cooking gas. Second is to promote construction of rentalhousing of different sizes. The rent should be pooled to create a fund formaintenance of these complexes. Subsidies may be given to those who are inneed, again through their accounts. The choice of the occupants to move to abigger house would depend on their ability to pay and their past defaultrecord. The third is to also consider low income houses for senior citizens,destitute, single women, working men & women, daily wage earners etc. sincetheir requirements and affordability differ. The strategy of government wouldneed to address urban poor belonging to all categories, as mentioned above.
This issue of shelter addresses the issue of affordable housing through twelvearticles. Each article highlights issues pertaining to the theme, policies, casestudies and statistical review with a view to critically analyze existing policiesand prepare a roadmap to move ahead. The theme papers by Shri AK Jain,Ramakrishna Nallathiga (et.al.) and Rajiv Sharma (et.al.) highlight importantaspects of affordable housing including redensification approaches for creatingmore housing stock, rental housing and housing for vulnerable groups such assenior citizens. Prof. (Dr.) Amitabh Kundu, has shared his vision on wideranging issues relating to affordable housing. Prof. Abdul Shaban (et.al.),Anushree Deb and Dr. Mahavir Singh have reviewed three different policiespertaining to urbanization & city planning, public private partnership inaffordable housing and smart cities. The section on housing situation analysisputs forward the proportions of access to housing and basic services inmetropolitan cities, non-metropolitan cities and the national capital region.These articles cover important elements of affordable housing and I hope thatyou will enjoy reading this volume.
FROM THE CHIEF EDITOR
I N S I D ET
hem
e
AFFORDABLEHOUSING
Theme
THEME
Publication
ISSN 2347 - 4912Volume 17 No. 1April 2016
SHELTERTheme Paper Policy Review Case Studies
AFFORDABLE HOUSING
The views expressed in this publication are the personal views of authors and do not necessarily reflect the official views and policies of HUDCO/HSMI. Articles or any other material in the publication may be reproduced so long as credit is given and tear sheets are provided to the editor.All photo credits are by the authors unless otherwise specified.
Theme Paper
HOUSING FOR ALL-Optimising Planning and Development Controls
- A.K. Jain
MMRDA RENTAL HOUSING SCHEME-A Case of Affordable Housing
SENIOR CITIZEN HOUSING-A Road Less Travelled
- Dr. Akshaya Kumar Sen
Housing Situation Analysis
My Opinion
Case Studies
MOVED TO THE FRINGES-Resettlement and its Impact
on the Urban Poor in India
- Maartje Van Eerd
APPLICABILITY OF SOFT SYSTEMMETHODOLOGY IN PROBLEMANALYSING IN THE FIELD OFAFFORDABLE HOUSING
- Sukanya Ghosh
CHALLENGES FOR PROVIDING SHELTER TO EVERY HOUSEHOLD
- Dr. Amitabh Kundu
-
- Debolina Kundu- Pragya Sharma- Arpita Banerjee
IN THE BOX
Policy Review
VIABILITY OF PUBLIC-PRIVATEPARTNERSHIP IN BUILDING AFFORDABLE HOUSING IN INDIA
- Anushree Deb
PLANNING FOR SMART CITIESIN THE INDIAN CONTEXT
- Dr. Mahavir Singh
- Prof. Abdul Shaban
- Ramakrishna Nallathiga- Ginen G Dharmasi
CRITICAL REFLECTION ON CONTEMPORARY URBANIZATION IN INDIA
- Sanjukta Sattar
- Rajiv Sharma
- Rajeev Malhotra
- Souvanic Roy- Manas Kumar Sanyal
HUDCO AwardedBest Practices
Surat Municipal Corporation
VIRTUAL CIVIC CENTER & CITIZEN’s CONNECT –
HOUSING AND BASIC INFRASTRUCTURE-Differential Access acrossMetropolitan and Non-metropolitanClass I cities of India
INITIATIVES FOR AFFORDABLE HOUSING IN NATIONAL CAPITAL REGION
- R.B. Suryavanshi- V.G. Jana
HOUSING FOR ALL BY 2022 -Assessing the Benefits of Precast Technology
CONSTRUCTION WORKER WELFARE PROGRAMMES AT INDIAN INSTITUTE OF TECHNOLOGY GANDHINAGAR
“Affordability” is a relative term which means different things to different people. In the context of housing, affordability means the financial capacity of an individual to buy or rent a house. In 2008, the High Level Task Force on Affordable Housing for All, setup by the Government of India, defined affordability as a measure of household gross annual income and the size of a housing unit. It recommended that for economically weaker section and low income groups, the suggested affordability is cost not exceeding four times of the household gross annual income and EMI/ rent not exceeding 30% of the household’s gross monthly income for a unit with carpet area not exceeding 300 and 600 sq.ft. For middle income category of houses, the cost was recommended as five times the household gross annual income and EMI/ rent not exceeding 40%, for a prescribed carpet area not exceeding 1200 sq.ft. This definition was revised in 2012 and again when guidelines for Pradhan Mantri Awas Yojana (PMAY) were launched in 2015. While ensuring the affordability of housing solutions is a prime concern, reaching the houses to the correct target group is equally imperative.
�e Real Estate (Regulation and Development) Act, 2016- Salient Features
46General Guidelines for Submissions of Articles
76Union Budget 2016-17: A Boost for A�ordable Housing
100Book Review - Towards Clean and Hygienic Cities and Village
107Habitat III Conference
01
17
10
02
31
40
51
47
26
63
82
91
101
104
77
April 2016 Volume 17 No.1- SHELTER | 1
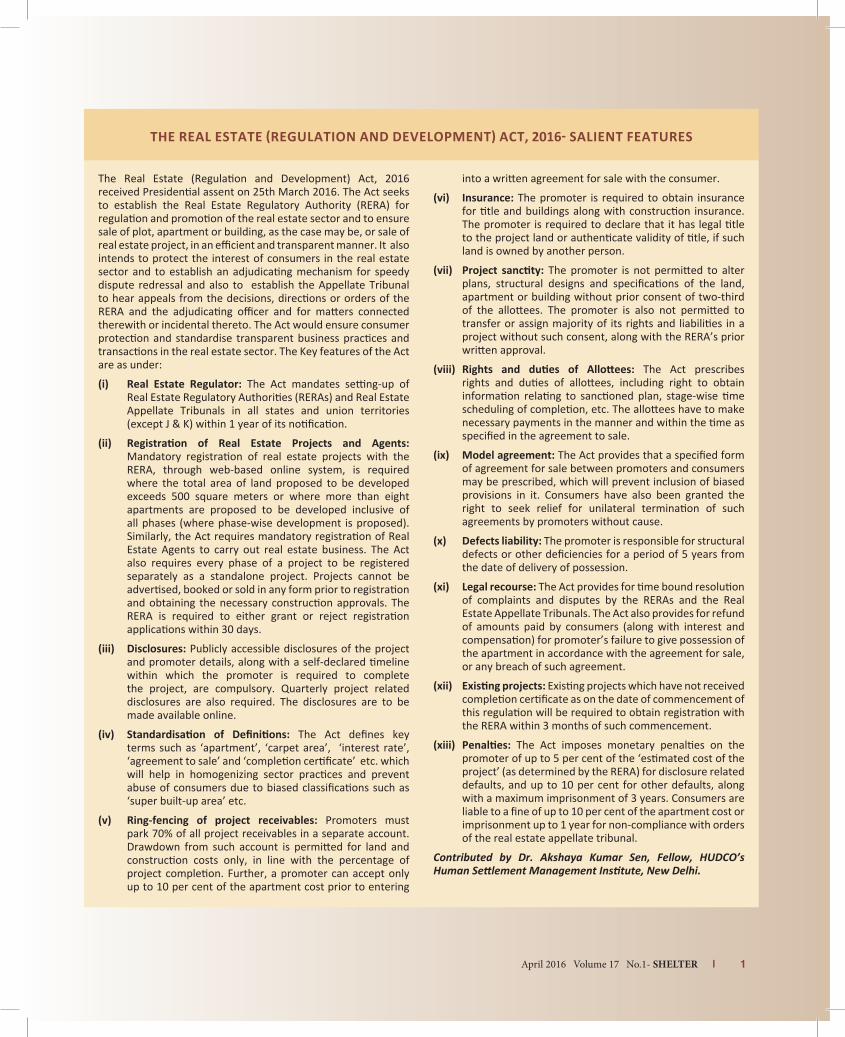
The Real Estate (Regulation and Development) Act, 2016 received Presidential assent on 25th March 2016. The Act seeks to establish the Real Estate Regulatory Authority (RERA) for regulation and promotion of the real estate sector and to ensure sale of plot, apartment or building, as the case may be, or sale of real estate project, in an efficient and transparent manner. It also intends to protect the interest of consumers in the real estate sector and to establish an adjudicating mechanism for speedy dispute redressal and also to establish the Appellate Tribunal to hear appeals from the decisions, directions or orders of the RERA and the adjudicating officer and for matters connected therewith or incidental thereto. The Act would ensure consumer protection and standardise transparent business practices and transactions in the real estate sector. The Key features of the Act are as under:
(i) Real Estate Regulator: The Act mandates setting-up of Real Estate Regulatory Authorities (RERAs) and Real Estate Appellate Tribunals in all states and union territories (except J & K) within 1 year of its notification.
(ii) Registration of Real Estate Projects and Agents: Mandatory registration of real estate projects with the RERA, through web-based online system, is required where the total area of land proposed to be developed exceeds 500 square meters or where more than eight apartments are proposed to be developed inclusive of all phases (where phase-wise development is proposed). Similarly, the Act requires mandatory registration of Real Estate Agents to carry out real estate business. The Act also requires every phase of a project to be registered separately as a standalone project. Projects cannot be advertised, booked or sold in any form prior to registration and obtaining the necessary construction approvals. The RERA is required to either grant or reject registration applications within 30 days.
(iii) Disclosures: Publicly accessible disclosures of the project and promoter details, along with a self-declared timeline within which the promoter is required to complete the project, are compulsory. Quarterly project related disclosures are also required. The disclosures are to be made available online.
(iv) Standardisation of Definitions: The Act defines key terms such as ‘apartment’, ‘carpet area’, ‘interest rate’, ‘agreement to sale’ and ‘completion certificate’ etc. which will help in homogenizing sector practices and prevent abuse of consumers due to biased classifications such as ‘super built-up area’ etc.
(v) Ring-fencing of project receivables: Promoters must park 70% of all project receivables in a separate account. Drawdown from such account is permitted for land and construction costs only, in line with the percentage of project completion. Further, a promoter can accept only up to 10 per cent of the apartment cost prior to entering
into a written agreement for sale with the consumer.
(vi) Insurance:The promoter is required to obtain insurance for title and buildings along with construction insurance. The promoter is required to declare that it has legal title to the project land or authenticate validity of title, if such land is owned by another person.
(vii) Project sanctity: The promoter is not permitted to alter plans, structural designs and specifications of the land, apartment or building without prior consent of two-third of the allottees. The promoter is also not permitted to transfer or assign majority of its rights and liabilities in a project without such consent, along with the RERA’s prior written approval.
(viii) Rights and duties of Allottees: The Act prescribes rights and duties of allottees, including right to obtain information relating to sanctioned plan, stage-wise time scheduling of completion, etc. The allottees have to make necessary payments in the manner and within the time as specified in the agreement to sale.
(ix) Modelagreement: The Act provides that a specified form of agreement for sale between promoters and consumers may be prescribed, which will prevent inclusion of biased provisions in it. Consumers have also been granted the right to seek relief for unilateral termination of such agreements by promoters without cause.
(x) Defectsliability:The promoter is responsible for structural defects or other deficiencies for a period of 5 years from the date of delivery of possession.
(xi) Legalrecourse:The Act provides for time bound resolution of complaints and disputes by the RERAs and the Real Estate Appellate Tribunals. The Act also provides for refund of amounts paid by consumers (along with interest and compensation) for promoter’s failure to give possession of the apartment in accordance with the agreement for sale, or any breach of such agreement.
(xii) Existingprojects: Existing projects which have not received completion certificate as on the date of commencement of this regulation will be required to obtain registration with the RERA within 3 months of such commencement.
(xiii) Penalties: The Act imposes monetary penalties on the promoter of up to 5 per cent of the ‘estimated cost of the project’ (as determined by the RERA) for disclosure related defaults, and up to 10 per cent for other defaults, along with a maximum imprisonment of 3 years. Consumers are liable to a fine of up to 10 per cent of the apartment cost or imprisonment up to 1 year for non-compliance with orders of the real estate appellate tribunal.
Contributed by Dr. Akshaya Kumar Sen, Fellow, HUDCO’s Human Settlement Management Institute, New Delhi.
ThEREALESTATE(REguLATIonAnDDEvELoPMEnT)AcT,2016-SALIEnTFEATuRES

THEME PAPER
| HUDCO - HSMI Publication 2
A.K. JAin The planning norms and development controls play a critical role in access of the poor to affordable housing and infrastructure services. There is a need to think beyond the public-private binary and open up a collective community sector to help realise the mission of Housing for All by 2022.
The Pradhan Mantri Awas Yojana (2015) envisages to provide housing to all by 2022. The mission seeks to provide 20 million housing units and take up slum rehabilitation projects. According to the mission guidelines, an ‘affordable housing project’ shall have a minimum of 35% of the houses for the Economically Weaker Section (EWS) category. EWS households are those having an annual income up to Rs. 3,00,000 and a dwelling with a carpet area of up to 30 sq.m. Low Income Group (LIG) is defined as having an annual income between Rs. 300,001 up to Rs. 600,000 and a dwelling unit having carpet area up to 60 sq.m. Slum is defined as a compact area of at least 300 population or about 60-70 households of poorly built, congested tenements in unhygienic environment, usually with inadequate infrastructure and lacking in proper sanitary and drinking water facilities.
The program provides an interest subsidy of 6.5 per cent on housing loans with tenure of up to 15 years for EWS and LIG, which works to
nearly Rs 100,000 to Rs 230,000 per unit. It mandates house in the name of women, or joint ownership. To make all statutory towns slum free, it is envisaged to prepare Slum Free City Plan of Action (SFCPoA) for in-situ redevelopment of slums.
The planning, design and construction of 20 million dwelling units in next six years would not be possible in ‘business as usual’ way. This would require innovations in land assembly and development, planning, design and construction. This is also a unique opportunity to introduce state of art processes, such as digital planning, spatial data infrastructure for land management and land pooling, benchmarking, infill development, single window approval, intelligent and smart services, electronic property transactions, e-governance and capacity building of housing organizations together with the legal reforms in land acquisition, stamp duty, property registration, rent control, and building bye-laws.
The Key Levers Availability of land for social housing is a major and critical issue. According to the Town and Country Planning Organisation (TCPO) estimates, to meet the current housing shortage, 84,724 hectares to 1,20,882 hectares of additional land would be required. Land is
HOUSING FOR ALL Optimising Planning and Development Controls
A. K. Jain ([email protected]) is Ex Commissioner Planning, Delhi Development Authority, Member MOUD Committee on Review of Delhi Development Act & Consultant UN Habitat.
It is not always true that higher FAR can help in creating a higher quantity of housing. Sometimes increased FAR has led to creation of vacant, speculative, luxury housing, with no relation to the social needs and poverty. As such the Floor Area Ratio has to be seen in combination with plot coverage, density and housing form which involves a balanced trade-off between open and built-up spaces.
THEME PAPER
April 2016 Volume 17 No.1- SHELTER | 3
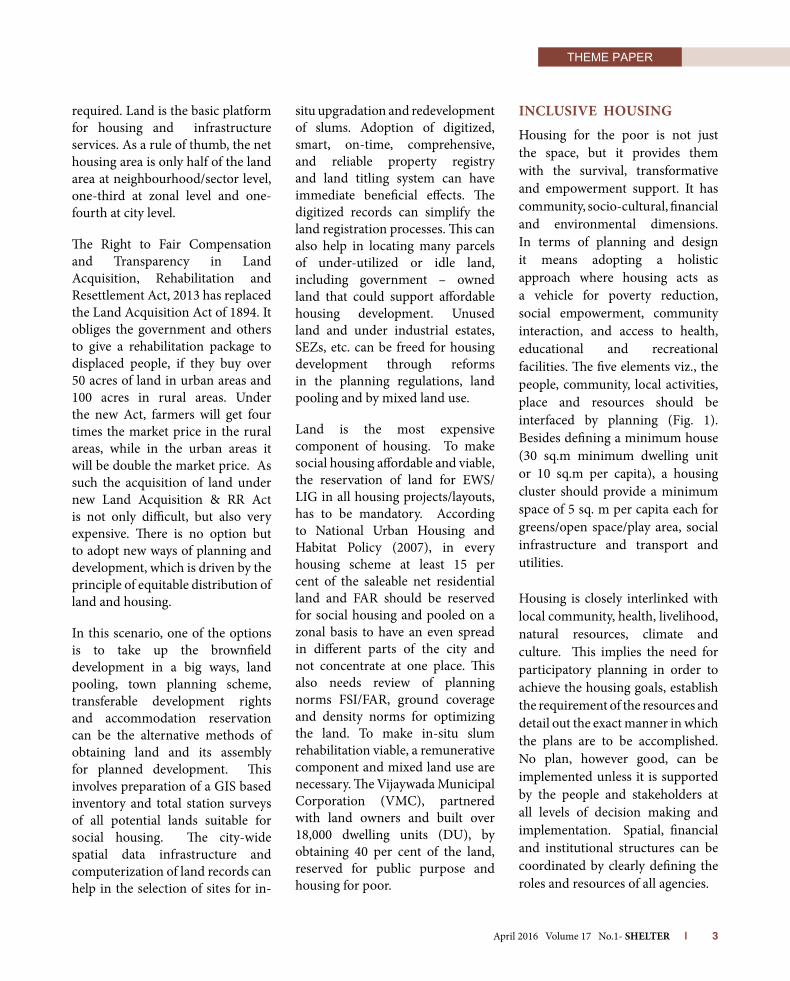
the basic platform for housing and infrastructure services. As a rule of thumb, the net housing area is only half of the land area at neighbourhood/sector level, one-third at zonal level and one-fourth at city level.
The Right to Fair Compensation and Transparency in Land Acquisition, Rehabilitation and Resettlement Act, 2013 has replaced the Land Acquisition Act of 1894. It obliges the government and others to give a rehabilitation package to displaced people, if they buy over 50 acres of land in urban areas and 100 acres in rural areas. Under the new Act, farmers will get four times the market price in the rural areas, while in the urban areas it will be double the market price. As such the acquisition of land under new Land Acquisition & RR Act is not only difficult, but also very expensive. There is no option but to adopt new ways of planning and development, which is driven by the principle of equitable distribution of land and housing.
In this scenario, one of the options is to take up the brownfield development in a big ways, land pooling, town planning scheme, transferable development rights and accommodation reservation can be the alternative methods of obtaining land and its assembly for planned development. This involves preparation of a GIS based inventory and total station surveys of all potential lands suitable for social housing. The city-wide spatial data infrastructure and computerization of land records can help in the selection of sites for in-
situ upgradation and redevelopment of slums. Adoption of digitized, smart, on-time, comprehensive, and reliable property registry and land titling system can have immediate beneficial effects. The digitized records can simplify the land registration processes. This can also help in locating many parcels of under-utilized or idle land, including government – owned land that could support affordable housing development. Unused land and under industrial estates, SEZs, etc. can be freed for housing development through reforms in the planning regulations, land pooling and by mixed land use.
Land is the most expensive component of housing. To make social housing affordable and viable, the reservation of land for EWS/LIG in all housing projects/layouts, has to be mandatory. According to National Urban Housing and Habitat Policy (2007), in every housing scheme at least 15 per cent of the saleable net residential land and FAR should be reserved for social housing and pooled on a zonal basis to have an even spread in different parts of the city and not concentrate at one place. This also needs review of planning norms FSI/FAR, ground coverage and density norms for optimizing the land. To make in-situ slum rehabilitation viable, a remunerative component and mixed land use are necessary. The Vijaywada Municipal Corporation (VMC), partnered with land owners and built over 18,000 dwelling units (DU), by obtaining 40 per cent of the land, reserved for public purpose and housing for poor.
IncLusIve housIngHousing for the poor is not just the space, but it provides them with the survival, transformative and empowerment support. It has community, socio-cultural, financial and environmental dimensions. In terms of planning and design it means adopting a holistic approach where housing acts as a vehicle for poverty reduction, social empowerment, community interaction, and access to health, educational and recreational facilities. The five elements viz., the people, community, local activities, place and resources should be interfaced by planning (Fig. 1). Besides defining a minimum house (30 sq.m minimum dwelling unit or 10 sq.m per capita), a housing cluster should provide a minimum space of 5 sq. m per capita each for greens/open space/play area, social infrastructure and transport and utilities.
Housing is closely interlinked with local community, health, livelihood, natural resources, climate and culture. This implies the need for participatory planning in order to achieve the housing goals, establish the requirement of the resources and detail out the exact manner in which the plans are to be accomplished. No plan, however good, can be implemented unless it is supported by the people and stakeholders at all levels of decision making and implementation. Spatial, financial and institutional structures can be coordinated by clearly defining the roles and resources of all agencies.
THEME PAPER
April 2016 Volume 17 No.1- SHELTER | 3
required. Land is the basic platform for housing and infrastructure services. As a rule of thumb, the net housing area is only half of the land area at neighbourhood/sector level, one-third at zonal level and one-fourth at city level.
The Right to Fair Compensation and Transparency in Land Acquisition, Rehabilitation and Resettlement Act, 2013 has replaced the Land Acquisition Act of 1894. It obliges the government and others to give a rehabilitation package to displaced people, if they buy over 50 acres of land in urban areas and 100 acres in rural areas. Under the new Act, farmers will get four times the market price in the rural areas, while in the urban areas it will be double the market price. As such the acquisition of land under new Land Acquisition & RR Act is not only difficult, but also very expensive. There is no option but to adopt new ways of planning and development, which is driven by the principle of equitable distribution of land and housing.
In this scenario, one of the options is to take up the brownfield development in a big ways, land pooling, town planning scheme, transferable development rights and accommodation reservation can be the alternative methods of obtaining land and its assembly for planned development. This involves preparation of a GIS based inventory and total station surveys of all potential lands suitable for social housing. The city-wide spatial data infrastructure and computerization of land records can help in the selection of sites for in-
situ upgradation and redevelopment of slums. Adoption of digitized, smart, on-time, comprehensive, and reliable property registry and land titling system can have immediate beneficial effects. The digitized records can simplify the land registration processes. This can also help in locating many parcels of under-utilized or idle land, including government – owned land that could support affordable housing development. Unused land and under industrial estates, SEZs, etc. can be freed for housing development through reforms in the planning regulations, land pooling and by mixed land use.
Land is the most expensive component of housing. To make social housing affordable and viable, the reservation of land for EWS/LIG in all housing projects/layouts, has to be mandatory. According to National Urban Housing and Habitat Policy (2007), in every housing scheme at least 15 per cent of the saleable net residential land and FAR should be reserved for social housing and pooled on a zonal basis to have an even spread in different parts of the city and not concentrate at one place. This also needs review of planning norms FSI/FAR, ground coverage and density norms for optimizing the land. To make in-situ slum rehabilitation viable, a remunerative component and mixed land use are necessary. The Vijaywada Municipal Corporation (VMC), partnered with land owners and built over 18,000 dwelling units (DU), by obtaining 40 per cent of the land, reserved for public purpose and housing for poor.
IncLusIve housIngHousing for the poor is not just the space, but it provides them with the survival, transformative and empowerment support. It has community, socio-cultural, financial and environmental dimensions. In terms of planning and design it means adopting a holistic approach where housing acts as a vehicle for poverty reduction, social empowerment, community interaction, and access to health, educational and recreational facilities. The five elements viz., the people, community, local activities, place and resources should be interfaced by planning (Fig. 1). Besides defining a minimum house (30 sq.m minimum dwelling unit or 10 sq.m per capita), a housing cluster should provide a minimum space of 5 sq. m per capita each for greens/open space/play area, social infrastructure and transport and utilities.
Housing is closely interlinked with local community, health, livelihood, natural resources, climate and culture. This implies the need for participatory planning in order to achieve the housing goals, establish the requirement of the resources and detail out the exact manner in which the plans are to be accomplished. No plan, however good, can be implemented unless it is supported by the people and stakeholders at all levels of decision making and implementation. Spatial, financial and institutional structures can be coordinated by clearly defining the roles and resources of all agencies.

THEME PAPER
| HUDCO - HSMI Publication 4
The overall responsibility for provision of land and trunk services lies with the government which should devise ways of collaboration with the community and private agencies. The communities should be facilitated to link together and survey their housing problems, and enter into a collaborative process with the housing boards, municipal bodies and service agencies to jointly develop the programmes which the communities can take up. The Housing & Urban Development Corporation Ltd. and some NGOs are already working in this field, which provide a useful experience.
The organization of urban space that allows the formation of ‘communities’ and ‘neighbourhoods’ is a key to cross-sectoral spatial coalition of social, economic and environmental systems (fig. 2, 3, 4).
As such social housing projects need to focus on the following:
• Infrastructure improvement:roads, drains, water, sanitation, street lighting and community halls;
• Health: promotional andpreventive via maternal and child health clinics, health awareness and facilities;
• Education: pre-schools, non-formal education and literacy;
• Facilitating community basedparticipatory planning;
• Community development:institution building, gender awareness, vocational training and economic support;
• Encouraging small home-basedoccupations;
• Promoting micro-creditfacilities; and
• Networking among slumcommunities.
25
0.0
0m
250.00m. Common green Nur. school
VehicularRoads
HIG onPeriphery
Conv.shops pedestrian spine
Small groups(about 6 families)constitute basicres. community
Vehicular roads Pedestrian pathPop.5000
p.s
Figure 1:Ecosystem Model of a Neighbourhood: Five Elements of Planning-People, Community, Activities, Place and Environment
Figure 2: Housing Clusters as Module of a Sector
Figure 3: Hierarchy of Relationships and Community Associations Figure 4: Typical Sector Comprised of 4
Neighbourhoods

THEME PAPER
April 2016 Volume 17 No.1- SHELTER | 5
Housing development should aim to drive economic growth and improve the quality of life of people by better citizen services, governance and urban mobility. It should trigger the process of transforming existing housing areas, including slums, into better planned ones, thereby improving livability. This would be possible by the preparation of Service Level Improvement Plan (SLIP), Action Plan and DPRs which focus upon water supply, sewerage, sanitation, drains, urban transport, development of greens and parks and other amenities, which are integral to housing development.
DeveLopmenT conTroLs anD housIng Form
In a scenario of diminishing urban land and increasing urban growth, social housing development has to make optimum use of land, its equitable distribution, city wide spread of social housing and its integration with livelihoods, jobs mobility, green physical and social infrastructure. It is necessary that in all developments, reservation of lands for public greens, transport corridors, social facilities and social housing is ensured.
Planning norms, land use zoning, density, Floor Area Ratio (FAR), and building controls have direct implications in the housing affordability and costs. It is essential to optimise utilization of land by rationalizing the FAR and residential density( figs. 5 & 6). A fixed density and FAR could lead to under-utilization of land potential and imposition of artificial limits to optimal use of scarce urban land.
However, it is not always true that higher FAR can help in creating a higher quantity of housing. Sometimes increased FAR has led to creation of vacant, speculative, luxury housing, with no relation to the social needs and poverty. As such the FAR has to be seen in combination with plot coverage, density and housing form which involves a balanced trade-off between open and built-up spaces, and between land and social and physical infrastructure development.
The regulatory framework, including land use controls, housing density, FAR and building bye-laws should be based on certain parameters, which include the following:
a. Whether higher density and FAR are relevant to needs and resources of the poor?
b. Whether these facilitate self-build housing?
c. Whether these promote livelihoods and income generation?
d. Whether these commodify land and social housing?
e. Whether these are equitable and enable access to housing for all?
f. Whether these make housing more expensive, unsafe and involve higher levels of maintenance?
g. Whether these facilitate incremental housing?
h. Whether these make legal land development difficult for the poor?
i. Whether these allow rental tenure or constrain access to shelter?
j. What are the gender implications and whether women and children have safe and useful common/open space?
k. How economical is the provision of basic services-toilets, sanitation, waste disposal and recycling, water, electricity, drainage, sewerage, etc.?
l. What are the densities and FAR that can meet the target of housing for all in a city?
m. Is the regulatory framework too complex and opaque community based development?
n. Does the regulatory framework differentiate and provide the
..........................................................................................................................................................................................................................................................................................................................................................................................................................................................................................................................................................................................................................................................................................................................................................................................................................................
..............................................................................................................................................................................................................................................................................................................................................................................................................................................................................................................................................................................................................................................................................................................................
..........................................................................................................................................................................................................................................................................................................................................................................................................................................................................................................................................................................................................................................................................................................................................................................................................................................
45% 65% 100%
FAR=1or
FSI=1
FAR=2or
FSI=2
FAR=3or
FSI=3
Source: Acioly, Claudio & Forbes Davidson, Density in Urban Development, Building Issues, Vol. 8, 1996, Lund Centre for Habitat Studies, Sweden.
Figure 5: Different Plot Coverage-Horizontal Densification Figure 6:
Different Floor Area Ratios - Vertical Densification

THEME PAPER
| HUDCO - HSMI Publication 6
choices and options according to local culture, climate, geography, land values, housing demand and level of technology?
Various types of existing housing forms available to the EWS and LIG categories can be evaluated against the above given parameters. These include slum clusters, chawl, traditional/inner city, urban villages, unauthorized colonies, site and services, public sector built-up apartments, private sector housing, cooperative housing, etc. It is often found that while unplanned housing developments meet most of the needs of the poor, the planned developments fail to address most of the parameters. This means learning and adopting the positive aspects of existing developments, such as chawls in Mumbai, which provide cluster/courtyard walk-ups, compact, high density and affordable housing.
Since about 8 per cent of housing shortage pertains to inadequate, congested and dilapidated units, upgradation and retrofitting has to be the main focus of the housing for all mission. The planning norms, regulatory building controls, which often focus on greenfield development, should facilitate easier and simplified ways of redevelopment of existing areas. This may require various changes and exemptions from the conventional planning provisions and building approval process, such as submission of earlier approved building plans, various clearances, amalgamation and sub-division of properties, vertical ownership
rights, minimum standards of roads and parking, TDR and accommodation reservation, etc.
Densities as high as 600 dwelling units per hectare can be achieved in walk-ups (15 m height). A pyramidal structure can be followed i.e. walk-ups, low rise- high density for those at the bottom of pyramid, that is low income groups, mid-rise (upto 12 storied) for middle income group, while high rise only for higher income groups. The main principle that has to be followed is affordability, which includes cost of land, construction and services. These costs increase with the height. High rise building also restricts growth and expansion of individual units and mixed land use, which is one of the essential needs of the poor. The notion that high-rise housing leads to larger densities may not be true as it needs proportionately a higher amount of open space, community facilities and more distance between the
buildings for light and ventilation.
Compact, high density-low rise housing can give a range of environmental benefits, reduce travel distances and transmission losses and reduce the pressure on land, public transport and services. The Twelfth Five Year Plan (2012) cites a World Bank study explaining how FSI and ground coverage can be combined to make optimum use of land and a compact and dense pattern of development (fig.7).
While deciding the FAR, a balance has to be struck between the cost of land per unit and construction cost. While higher density and FAR may reduce the cost of land, the cost of construction increases steeply beyond walk ups (say 15 m height). As a thumb rule it would increase by 20 per cent beyond walk up height due to lifts, foundation, fire sprinkler system, services, generator, etc., and thereafter 5 per cent per floor. It also has
No. of stories
Ground CoverageFSI/FAR
25
30
75
50
5
8
16
40
32
4.02.0
1.33
8.0
10.0
Source: India Urbanisation Review: Urbanisation beyond Municipalities (2012), World Bank.
Figure 7: FSI, Density and Housing form: FSI has to be used in Combination with Lot Coverage. Commercial and Residential Areas would have a different Lot Coverage for the same FSI
THEME PAPER
April 2016 Volume 17 No.1- SHELTER | 7
implications with respect to safety of women, elderly and children, home based occupations, community interaction and communications. Also high rise living has negative environment consequences, heat island effect, air pollution, increase is carbon foot print and is danger prone. Much higher energy is spent on lifts, pumps and air-conditioning in high rise housing, which is also technology intensive and more fire and earthquake prone.
However, in the areas with paucity of land, horizontal development may
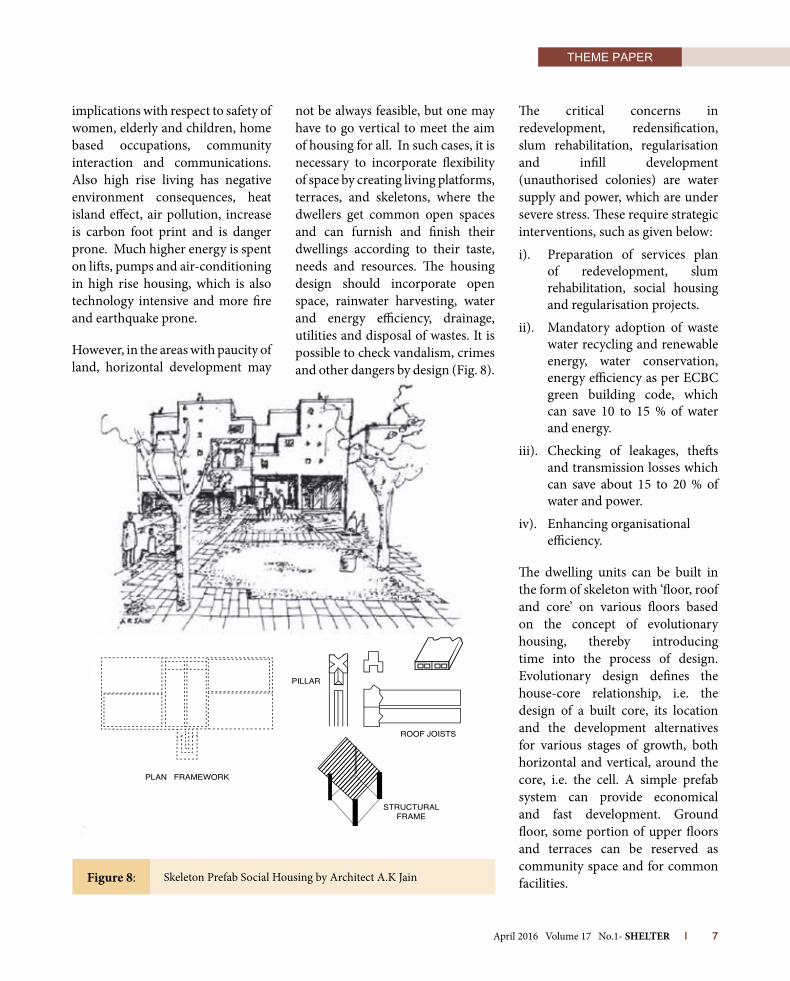
not be always feasible, but one may have to go vertical to meet the aim of housing for all. In such cases, it is necessary to incorporate flexibility of space by creating living platforms, terraces, and skeletons, where the dwellers get common open spaces and can furnish and finish their dwellings according to their taste, needs and resources. The housing design should incorporate open space, rainwater harvesting, water and energy efficiency, drainage, utilities and disposal of wastes. It is possible to check vandalism, crimes and other dangers by design (Fig. 8).
The critical concerns in redevelopment, redensification, slum rehabilitation, regularisation and infill development (unauthorised colonies) are water supply and power, which are under severe stress. These require strategic interventions, such as given below:
i). Preparation of services plan of redevelopment, slum rehabilitation, social housing and regularisation projects.
ii). Mandatory adoption of waste water recycling and renewable energy, water conservation, energy efficiency as per ECBC green building code, which can save 10 to 15 % of water and energy.
iii). Checking of leakages, thefts and transmission losses which can save about 15 to 20 % of water and power.
iv). Enhancing organisational efficiency.
The dwelling units can be built in the form of skeleton with ‘floor, roof and core’ on various floors based on the concept of evolutionary housing, thereby introducing time into the process of design. Evolutionary design defines the house-core relationship, i.e. the design of a built core, its location and the development alternatives for various stages of growth, both horizontal and vertical, around the core, i.e. the cell. A simple prefab system can provide economical and fast development. Ground floor, some portion of upper floors and terraces can be reserved as community space and for common facilities.Figure 8: Skeleton Prefab Social Housing by Architect A.K Jain

| HUDCO - HSMI Publication 8
communITy DeveLopmenT
Each housing and slum re-development plan should address specific local issues and provide flexible choices of in-situ upgrading, relocation, land sharing or re-blocking. The local area plan should network all the settlements, where the local stakeholders plan together. Uniform standards that are set too high can price poor households out of formal housing. It may be better to provide basic shelter in appropriate locations, even with limited space as dormitories, hostels, etc., if it can house lowest-income households until their incomes rise. Existing housing, even in poor condition, may serve residents better by placing them where they have social connections and access to employment. Cities need to provide housing where residents can flourish, whether by building new units or supporting refurbishment, repairs, and upgrading of existing stock.
opTImIzIng housIng DeveLopmenT anD consTrucTIon
The main objective of optimizing the housing development and construction is to achieve quality, productivity and flexibility, together with reducing time and costs. Technological interface is necessary with respect to standards and specifications, infrastructure, construction, maintenance, together with energy and environment
concerns. There is a need to adopt new contracting procedures for efficiency, quality of service and sustained maintenance. Automation and robotics give precision to building construction and components and enable accuracy. Computer- Aided Manufacturing (CAM) and Computer-Integrated Manufacturing (CIM) for pre-fabricated components, viz. ceilings, walls, roofs, etc. are integral to the process of industrialized construction. The simulation of construction process enables better control of time, machine, expenditure and the manpower, which could be reduced at least by half to one-third in comparison to the conventional construction.It is necessary to adopt state of art, appropriate, industrialized building systems for efficient and economical housing delivery.
According to McKinsey Global Institute (2014), the critical housing cost reduction strategies at design and construction stage include the following:
• Pre-manufacturing: buildcomponents off-site using industrial processes, deliver parts as needed.
• Planning optimization: applycritical path management techniques to optimize overall plan; translate into realistic scheduling.
• In-site lean execution: uselean techniques to standardize procedures that eliminate
waste in individual activities and improve construction flow balancing.
• Process step productivity:eliminate low value added activities and wasted time to optimize process efficiency.
• De-specification of structuraldesign: Avoid over specification of non-value-added components.
• Standardization of micro-design: Identify substitutes and use design-to-cost to set specifications.
• Determinesourcingstrategyforeach category of construction activity, detail out sub-contractor management.
• Commercial optimizationby volume increase through bundling and purchasing practices, and use low-cost country sourcing.
• Technical optimization:Standardize and identify substitutes with advanced costing tools.
For an appropriate delivery of affordable housing project, the selection of developers and operational model is critical. It involves the following:
a) Developer qualification: Qualify set of developers through structural criteria and build competitive market.
b) Land scoring: Score land parcels for potential development and qualification for appropriate
THEME PAPER

THEME PAPER
April 2016 Volume 17 No.1- sheLTer | 9
incentives.
c) Public-private partnership framework: develop operating model, tendering process and legal and contractual structure for public private partnerships.
d) Reverse tendering: for government lands with all approvals in place to developers, who return maximum number of affordable EWS/ LIG dwelling units.
opTImIzIng The capacITy
Housing development involves a host of organisations, developers, financers, and communities and coordinated implementation, time-bound planning and monitoring. To meet the huge urban housing targets there is no option, but to optimize and harness the resources of both public and private sectors, that would synergize the advantages of both the government and private sectors toward a gradual transition.
It is essential to optimize the capacity of housing boards, financial companies, private developers, and housing cooperatives. Besides private sector, the communities and cooperatives should be strengthened and mobilized that would help in multiplying social housing out-put.
In order to streamline the land market and transactions, it is necessary to make property registration, mutation and transfer digital, simple, transparent and
quick. In this endeavor the Real Estate (Regulation & Development) Act, 2016 aims to bring in accountability in real estate sector, rating of developers and projects and licensing of real estate agents/brokers/realtors. To deal with the problem of property titling, it is necessary to introduce Torrens System of property title certification by the government, which would avoid litigations on the question of property titles. It is also necessary to put in place a unified regulatory mechanism, simplifying the procedures for fast track project approval.
To curb the resale of social housing and its speculation, it is necessary to review the tenure system and adopt smart/digital electronic land and property registers and Aadhar based transactions. The shelter units can be initially given on rental basis, which can be converted into ownership, title/ tenure after 10 years, or so. Alternatively, the tenure can be given jointly to husband and wife/parents, or to the co-operatives/residents associations.
concLusIon
India’s housing sector is one of the largest in the world. In order to emerge as one of the best in terms of equity, access to the poor, affordability, innovations, speed and quality, it has to embrace a new vision of equitable access resources, optimsing the land, financial and natural resources, and build the capacities of public, private and collective community sector.
reFerences Census of India, (2011), Census Report,
Government of India, New Delhi
Census of India (2012), H-Series Tables on Census Houses, Household Amenities and Assets, 2011, Registrar General and Census Commissioner, India, Ministry of Home Affairs, New Delhi.
Dupont, V. (2008), Slum Demolition in Delhi Since the 1990s: An Appraisal, Economic and Political Weekly, Vol. 43, 28, (2008), p. 79-8
Jain, A K., (2010), Urban Housing and Slums, Readworthy Publications, New Delhi.
Jain, A. K., 2011, the Informal City, Readworthy Publishers, New Delhi,
Jain A.K (2014), Revisiting Land Acquisition and Urban Process, Readworthy Publication, New Delhi
Jain A.K., (2009), Planning for inclusive Community and Social Infrastructure, New Delhi.
Jain, A. K., (2015), Smart Cities: Vision and Action, Discovery Publishers, New Delhi,
Jain, A. K., (2015), Conservation of Cultural Heritage, Discovery Publishers, New Delhi,
Jain A.K., (2015) Transforming Delhi, Bookwell, New Delhi
McKinsey Global Institute, (2010), India’s Urban Awakening: Building Inclusive Cities, SustainingEconomic Growth, Mumbai,
McKinsey Global Institute (2014), “A Blueprint for addressing the global affordable housing challenge”, New York.
Ministry of Urban Development, (2015): PradhanMantriAwaasYojana (Mission on Housing for All Guidelines, Government of India, New Delhi.
NBO (2012), Urban Housing Shortage, 2012-17, MOHUPA New Delhi.
MOHUPA, (NBO) 2013, State of Housing in India: A Statistical Compendium, New Delhi.
MOHUPA, (NBO) 2013, State of Slums in India, A Statistical Compendium, New Delhi.
UN-Habitat (2011),Cities and Climate Change,Global Report on Human Settlements, Earthscan, UK/USA/Nairobi.
UN Habitat, (2003), The Challenge of Slums - Global Report on Human Settlements, London,
THEME PAPER
| HUDCO - HSMI Publication 10
RamakRishna nallathiga
ginen g DhaRmasi
Housing is an essential need of citizens and the provision of housing has been set as an important objective by successive governments in India. After some initial under-attention, the successive policies began to recognise the importance of urban housing, but much of the focus of planning and programmes has been on providing house ownership. However, much of the housing built for owning is not within the reach of low income immigrant population, which is rising due to ongoing urbanisation. Rental housing in urban areas received little or no attention for decades and rent control legislations further strangulated it. There is some attempt made now to revive it through the creation of rental housing stock with the participation of private sector. This case paper showcases the features and details of one such rental housing scheme being offered and implemented by the Mumbai Metropolitan Region Development Authority (MMRDA) in the Mumbai Metropolitan Region (MMR).
BackgroundHousing is an essential requirement of every citizen. Therefore, providing housing assumed an important policy objective of all successive Governments in India – both at central and state levels. The focus on housing was made in the economic planning through the five-year plans through fund allocations. The public policy also emphasized on housing development by giving it priority in terms of schemes and setting physical and financial targets in them. There has been a shift in the housing policy over a course of time, which has set the stage for
the current housing scenario in India, which can be captured under the following (Nallathiga 2006):
• In the initial stages of economic planning (during 1960s), the focus was on house building, but most of such housing went to MIG households rather than LIG/EWS households due to collusion of administration and political system;
• In the subsequent phase (during 1970s), the policy emphasis was made on providing ‘sites and services’, which also was not very successful as LIG people sold the allotted sites to MIG/HIG households;
• Subsequently (during 1980s), the emphasis was on upgradation/improvement of housing services, which met limited success due to its targeting of existing houses only;
• During 1990s, the housing policy in India envisaged that the government would move away from ‘direct provision of housing’ to ‘enabling housing development’, which led to the strengthening of private house construction sector;
• After 2000s, the successive governments gave incentives for home ownership (through mortgage tax relief), which
MMRDA RENTAL HOUSING SCHEMEA Case of Affordable Housing
Prof. Ramakrishna Nallathiga ([email protected]) is Associate Professor, National Institute of Construction Management and Research, Pune. Shri Ginen G Dharmasi is pursuing post-graduate programme in construction management at the same Institute.
The MMrda rental housing scheme is based on the incentivisation of housing development through premium Floor Space Index (FSI) or Transferable development rights (Tdr) for undertaking the development of rental housing stock by land owners/ private developers. Higher FSI/Tdr is allowed to be used by the developers towards cross-subsidisation of rental houses with other developments on the plots.
Key Words : Rental housing, affordability, development, operation & maintenance
THEME PAPER
April 2016 Volume 17 No.1- SHELTER | 11
promoted home owning and rental housing lost the ground.
The provision of urban housing in India has assumed significance since the last two decades due to increasing urbanization (more than one-third of the population is urban now). Urban housing also underwent policy changes with formulation of the National Urban Housing and Habitat Policy 2007, emphasizing a multi-pronged approach towards promotion of increased urban housing stock in India. Apart from private house building, it emphasized on house building with partnerships between the central and state governments through public-funded programmes and also on leveraging private sector participation in planning, execution and finance (GoI 2007). In the process, there has been a shift in priority towards ownership housing in urban areas while neglecting the potential of rental housing.
renTal HouSIngA major disadvantage of ownership housing is its high cost, which makes it an option only for already existing as well as affluent households. Rental housing, on the other hand, is considered to be more inclusive and it can accommodate new up-coming workforce migrating to the cities in the wake of urbanization. Renting has the advantage of treating housing as a consumption good rather than investment good. Rental housing also gives flexibility to move to the house suiting to the life stage and income level of an individual. In fact, the lack of rental housing options is one of the reasons why slums and squatter settlements
are seen all across most of the cities in India. Yet, the government, instead of promoting rental housing, has actually perpetrated the fall of it through the nefarious rent control acts in major cities, which made the development of rental housing unattractive (Nallathiga 2005).
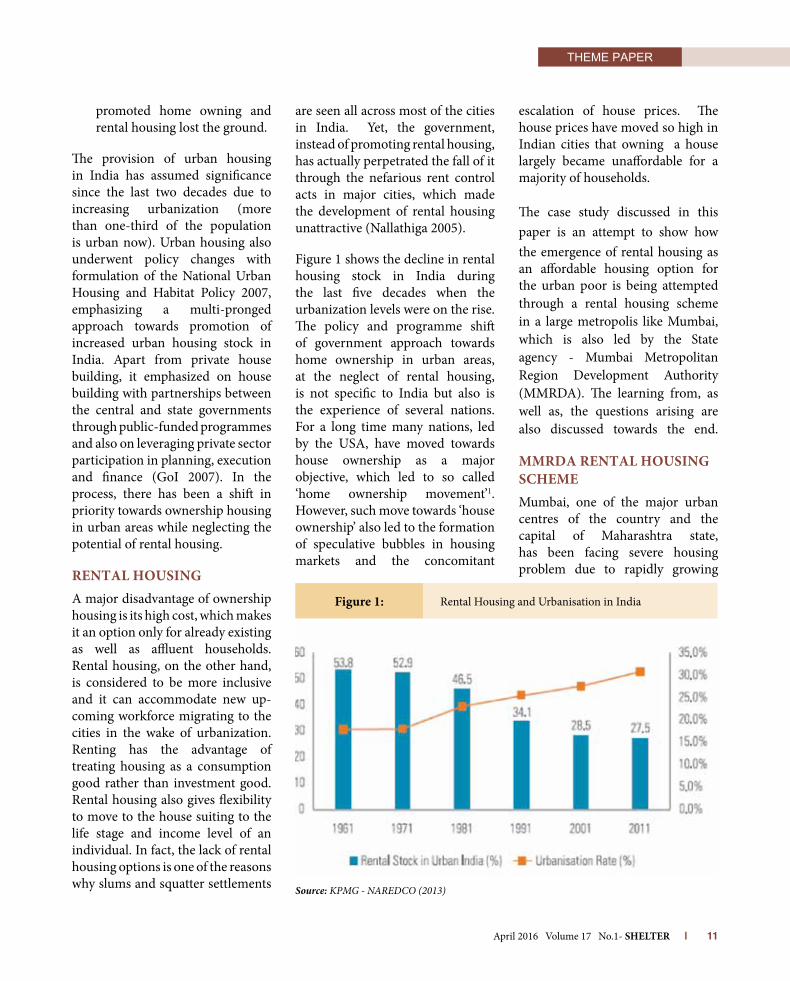
Figure 1 shows the decline in rental housing stock in India during the last five decades when the urbanization levels were on the rise. The policy and programme shift of government approach towards home ownership in urban areas, at the neglect of rental housing, is not specific to India but also is the experience of several nations. For a long time many nations, led by the USA, have moved towards house ownership as a major objective, which led to so called ‘home ownership movement’1. However, such move towards ‘house ownership’ also led to the formation of speculative bubbles in housing markets and the concomitant
escalation of house prices. The house prices have moved so high in Indian cities that owning a house largely became unaffordable for a majority of households.
The case study discussed in this paper is an attempt to show how the emergence of rental housing as an affordable housing option for the urban poor is being attempted through a rental housing scheme in a large metropolis like Mumbai, which is also led by the State agency - Mumbai Metropolitan Region Development Authority (MMRDA). The learning from, as well as, the questions arising are also discussed towards the end.
MMrda renTal HouSIng ScHeMeMumbai, one of the major urban centres of the country and the capital of Maharashtra state, has been facing severe housing problem due to rapidly growing
Source: KPMG - NAREDCO (2013)
Figure 1: Rental Housing and Urbanisation in India
THEME PAPER
| HUDCO - HSMI Publication 12
city population (both due to natural growth and in-migration) and the consequent higher house prices. Whereas the city needs more and more workforce to function, the poorer workforce does not find a place to stay in order to provide such service. The operation of Bombay Rent Control Act, 1947 has impacted on the decline and non-development of rental housing in Mumbai2 , which is evident from the housing share structure (Dharmasi 2013):
• Home ownership is dominant in about 62 per cent of population
• Formal rental dwelling segment constitutes only 5 per cent of housing in Mumbai
• Much of the remaining population lives in informal rental housing which constitutes 25 per cent
The Mumbai Metropolitan Region (MMR) is the second largest urban conglomeration in India with a population of more than 20.5 million by 2011. Mumbai and Thane are the major cities that are located within MMR. MMR is spread over 4,355 sq km and it consists of 8 Municipal Corporations viz. Greater Mumbai, Thane, Kalyan-Dombivali, Navi Mumbai, Ulhasnagar, Bhiwandi- Nizamapur, Vasai-Virar and Mira-Bhayandar; and 9 Municipal Councils viz. Ambarnath, Kulgaon-Badalapur, Matheran, Karjat, Panvel, Khopoli, Pen, Uran, and Alibaug, along with more than 1,000 villages in Thane and Raigad Districts. The Mumbai Metropolitan Region Development Authority (MMRDA) is a special planning authority created by the
Government of Maharashtra to oversee the development of MMR.
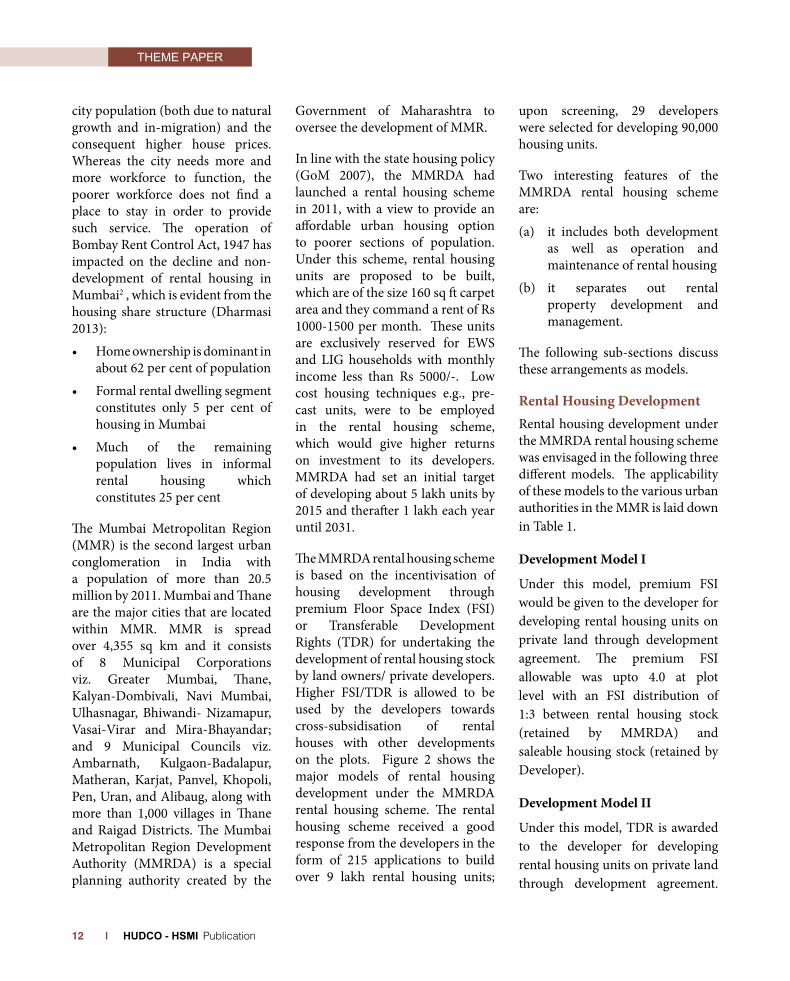
In line with the state housing policy (GoM 2007), the MMRDA had launched a rental housing scheme in 2011, with a view to provide an affordable urban housing option to poorer sections of population. Under this scheme, rental housing units are proposed to be built, which are of the size 160 sq ft carpet area and they command a rent of Rs 1000-1500 per month. These units are exclusively reserved for EWS and LIG households with monthly income less than Rs 5000/-. Low cost housing techniques e.g., pre-cast units, were to be employed in the rental housing scheme, which would give higher returns on investment to its developers. MMRDA had set an initial target of developing about 5 lakh units by 2015 and therafter 1 lakh each year until 2031.
The MMRDA rental housing scheme is based on the incentivisation of housing development through premium Floor Space Index (FSI) or Transferable Development Rights (TDR) for undertaking the development of rental housing stock by land owners/ private developers. Higher FSI/TDR is allowed to be used by the developers towards cross-subsidisation of rental houses with other developments on the plots. Figure 2 shows the major models of rental housing development under the MMRDA rental housing scheme. The rental housing scheme received a good response from the developers in the form of 215 applications to build over 9 lakh rental housing units;
upon screening, 29 developers were selected for developing 90,000 housing units.
Two interesting features of the MMRDA rental housing scheme are:
(a) it includes both development as well as operation and maintenance of rental housing
(b) it separates out rental property development and management.
The following sub-sections discuss these arrangements as models.
rental Housing development Rental housing development under the MMRDA rental housing scheme was envisaged in the following three different models. The applicability of these models to the various urban authorities in the MMR is laid down in Table 1.
development Model I
Under this model, premium FSI would be given to the developer for developing rental housing units on private land through development agreement. The premium FSI allowable was upto 4.0 at plot level with an FSI distribution of 1:3 between rental housing stock (retained by MMRDA) and saleable housing stock (retained by Developer).
development Model II
Under this model, TDR is awarded to the developer for developing rental housing units on private land through development agreement.

THEME PAPER
April 2016 Volume 17 No.1- SHELTER | 13
The FSI allowable on such plot is upto 3.0. The developer would get TDR equivalent to the plot area, which can either be consumed or sold in the market. He/she is also entitled to construction/ development TDR, which is a fraction of the plot level FSI.
development Model III
Under this model, the construction/development of rental housing units is to be done on the MMRDA land. The FSI allowable is upto 4.0 at plot level. The FSI is distributed as 1:3 between rental housing stock (retained by MMRDA) and commercial housing stock (retained by Developer).
rental Housing operation & Maintenance
As rental housing involves multiple occupants and frequent change of hand of the properties, apart from the development of housing stock, the operation and maintenance of these stocks is also very important
for long term performance. In view of this, property management of the rental housing stock is required with clear definition of function and arrangements. Property management of rental
housing involves: collection of rent; addressing maintenance problems; manpower for facility /services; and evacuation of defaulters etc. ;
Recognizing the importance of property management for the long term performance of housing stock, the MMRDA has come up with the following three different Property Management Models for managing rental housing stocks:
Management Model I This model is ‘Facilities Management Model’, under which a facility management company is given contract for the property management function of rental housing stock. Figure 3 shows the structural arrangements made under this model.
Rental Housing Models Applicability to Urban Areas in MMR
Figure 2 : MMRDA Rental Housing Scheme Development Models
Zone ULBs/ UAs in MMR covered Type of Development Model
1 • MunicipalCouncilsofKarjat,Pen,Uran,AlibaghandKhopoli.
• MunicipalCorporationsofThane,Kalyan-Dombivali,Mira-Bhayander,Bhiwandi-Nizampur.
• SpecialPlanningAuthorityAreasatVasai-VirarSubregion
• Ambernath,Kulgaon,BadlapurandSurroundingNotifiedArea
• MunicipalCouncilofPanvel• UrbanisableZone-1(U1)andUrbanis-
ableZone-2(U2)withinMMR
Model-1(FSIMODEL)(Pri-vateLand)
2 • MunicipalCorporationsofGreaterMumbai,Thane,Kalyan-Dombivali,Mira-Bhayander,Bhiwandi-Nizampur
• SpecialPlanningAuthorityAreasatVasai-VirarSubregion.
• Ambernath,Kulgaon,BadlapurandSurroundingNotifiedAreas
• MunicipalCouncilofPanvel
Model-2(TDRMODEL)(Pri-vateLand)
3 AnyunencumberedlandsvestedwithMMRDAinMumbaiMetropolitanRegion
Model-3(MMRDALand)
Source: Drawn by Authors
Table 1:
THEME PAPER
| HUDCO - HSMI Publication 14
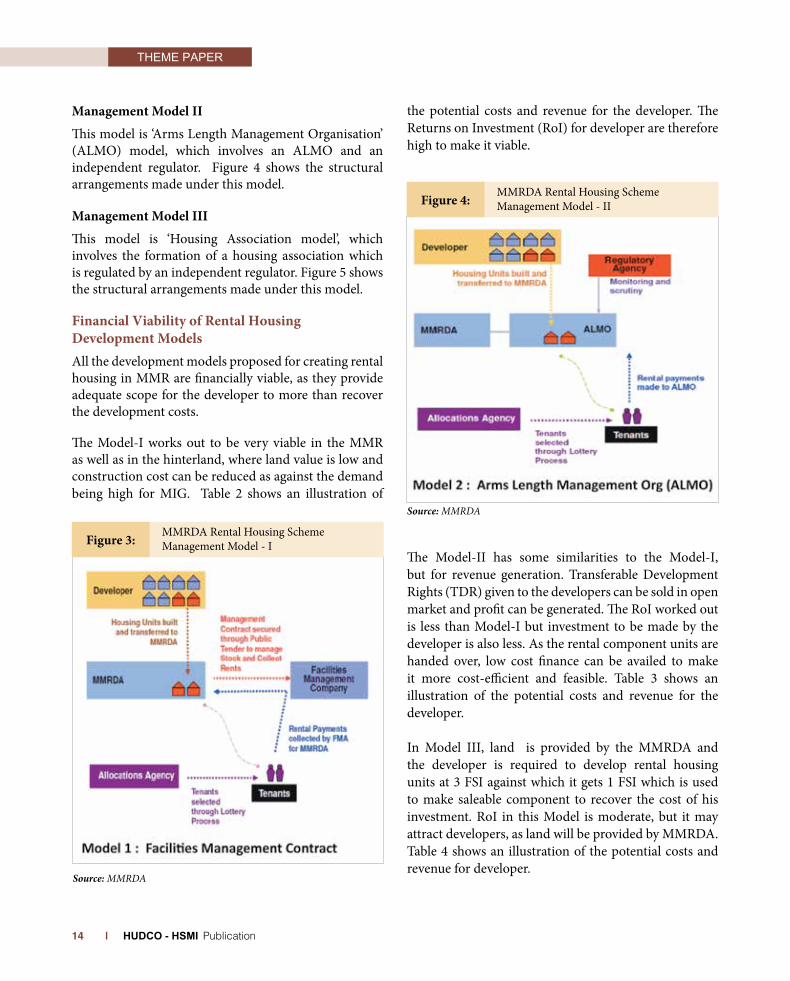
Management Model II
This model is ‘Arms Length Management Organisation’ (ALMO) model, which involves an ALMO and an independent regulator. Figure 4 shows the structural arrangements made under this model.
Management Model III
This model is ‘Housing Association model’, which involves the formation of a housing association which is regulated by an independent regulator. Figure 5 shows the structural arrangements made under this model.
Financial Viability of rental Housing development ModelsAll the development models proposed for creating rental housing in MMR are financially viable, as they provide adequate scope for the developer to more than recover the development costs.
The Model-I works out to be very viable in the MMR as well as in the hinterland, where land value is low and construction cost can be reduced as against the demand being high for MIG. Table 2 shows an illustration of
the potential costs and revenue for the developer. The Returns on Investment (RoI) for developer are therefore high to make it viable.
The Model-II has some similarities to the Model-I, but for revenue generation. Transferable Development Rights (TDR) given to the developers can be sold in open market and profit can be generated. The RoI worked out is less than Model-I but investment to be made by the developer is also less. As the rental component units are handed over, low cost finance can be availed to make it more cost-efficient and feasible. Table 3 shows an illustration of the potential costs and revenue for the developer.
In Model III, land is provided by the MMRDA and the developer is required to develop rental housing units at 3 FSI against which it gets 1 FSI which is used to make saleable component to recover the cost of his investment. RoI in this Model is moderate, but it may attract developers, as land will be provided by MMRDA. Table 4 shows an illustration of the potential costs and revenue for developer.
Source: MMRDA
Source: MMRDA
MMRDA Rental Housing Scheme Management Model - IIFigure 4:
MMRDA Rental Housing Scheme Management Model - IFigure 3:

THEME PAPER
April 2016 Volume 17 No.1- SHELTER | 15
concluSIonGiven the rising levels of urbanisation and rising shortages of urban housing in India, rental housing assumes a lot of importance in urban India, as it forms a major relief to in-migrant population. Affordable housing initiatives like MMRDA rental housing scheme are a good beginning to take housing as a reality for the vast majority of the poor. The experiment of different rental housing development models in different urban areas of the MMR is an interesting feature but more interesting are the arrangements for property management and detailing of structural arrangements under these models. Therefore, the MMRDA rental housing scheme can also be replicated in other major metropolitan regions like the National Capital Region (NCR) and Kolkata Metropolitan Region
(KMR).
However, the MMRDA rental housing scheme did not generate the expected response from developers and the number of units being developed is much smaller than the initial target set for five years. The MMRDA rental housing scheme clearly raises hopes but also brings some issues of whether the MMRDA is ready to handle the scheme and administer it on a continuous basis. Rental housing units are prone to damages due to maintenance and repairs over a period of time and would require replacement after the design life, for which annual sinking fund contribution needs to be raised. Therefore, questions may arise why sinking fund arrangement has not been incorporated into the operation of rental housing
Source: MMRDA
MMRDA Rental Housing Scheme Management Model - IIIFigure 5:
Source: Dharmasi (2013)
Viability Analysis of Rental Housing Development under Model 1Table 2:

THEME PAPER
| HUDCO - HSMI Publication 16
scheme. Also, more hazardous is the intervention of political parties and other vested interest groups, which needs to be avoided in the allocation of rental housing units.
noTeS1 Home ownership movement emphasizes on the wealth dimension house as an ‘equity’ and the followers of it argue that property ownership will lead to the prosperity of an individual as well as the community.2 A detailed discussion on the impact of Rent Control Act can be found in Wadhva (2002)
reFerenceSDharmasi, G. G. (2013), ‘Affordable Housing in
MMR: A Study of MMRDA Rental Housing Scheme’, Post Graduate Programme in Construction Management Thesis, National Institute of Construction Management and Research, Pune.
GoI (2007), National Urban Habitat and Housing Policy 2007, Ministry of Housing and Urban Poverty Alleviation, Government of India (GoI), New Delhi
GoM (2007), Maharashtra State Housing Policy 2007, Government of Maharashtra (GoM), Mumbai
KPMG-NAREDCO (2013), Key Recommendations – Sustainable Housing for Masses, Proceedings of the 11th Annual Convention of National Real Estate Developers Council (NAREDCO) held at Vigyan Bhawan, New Delhi on December 7-8, 2012
Nallathiga, R (2006), ‘Housing in India: Status, Policy and Interventions’, In P S N Rao (ed): Urban Governance: Indian Initiatives [Section IV: Shelter and Services], Kanishka Publishers, Delhi, pp 166-188
Nallathiga (2005), ‘Regulatory impacts on land and housing markets in Mumbai’, Nagarlok XXXVII (3): 50-65
Wadhva, K. (2002), ‘Maharashtra Rent Control Act 1999: An Unfinished Agenda’, Economic and Political Weekly of India, Volume XXXVII, No. 25, pp 2471-85
Source: Dharmasi (2013)
Source: Dharmasi (2013)
Viability Analysis of Rental Housing under Model 2Table 3:
Viability Analysis of Rental Housing under Model 3Table 4:

THEME PAPERs
April 2016 Volume 17 No.1- SHELTER | 17
Rajiv SHaRmaDR. akSHaya kumaR SEn
KEYWORDS : Senior citizen, homes, elderly, assisted living
The longevity of human is increasing resulting in the increase in the number of senior citizens in the society. The national Institute of Aging (USA) estimated the senior population (above 60 years) as 506 million in 2008. Their population is projected to reach 1.3 billion by 2040. It is estimated that more than 12 per cent of world’s senior citizen lives in India. Research shows that with age the income decreases, while expenditure on health increases. As a result, urban managers and policy makers need to address the socio-economic, health, security, income and housing related problems associated with senior citizen and work out a solution to address them. This paper flags the issue of senior citizen housing, specifically from a planning, financing and management perspective.
BaCkGROunD
A well known sociologist, Robert Lynd, has worked on the issue of senior citizen for over 20 years. In one of his writings, Lynd says
The stress upon mobility rather than upon deep-rooted continuity, upon action and scientific technique rather than wisdom, upon change rather than growth, upon winning and holding status rather than receiving it freely granted at the hands of one’s fellows, tends to displace men and women of advance years in favour of their juniors. In such a culture, ‘venerability’ has lost its meaning and old age its function. (Lynd, 1939, p 93).
The visibility of seniors is increasing in the society, thanks
to the advancement in medical science which has contributed to increasing the longevity and decreasing mortality rate. This has resulted in a skewed demographic profile, in favour of the elderly. A major increase has been reported in the age groups of 80 years and above. As per the Census 2011, the total number of elderly population (above 60 years of age) in India has increased from 76.62 million in 2001 to 103.85 million in 2011 (consisting of 73.3 million in rural areas and 30.85 million in urban areas), an increase of 35.5 per cent over the previous decade, the fastest growing demographic segment in India. In the urban areas, the share of elderly population in total urban population was 8.10 per cent in 2011, in comparison to 6.7 per cent in 2001.
The demographic profile estimates that during 2000-2050, while the national population in India will grow by 55 per cent, the population of people above 60 years will increase by 326 per cent and those in the age group of 80+ by 700 per cent. A consultancy firm, Jones Lang LaSalle (JLL), estimates that by 2050, the number of dependent adults in India will be at par with the number of dependent children(JLL, 2011). This growth in elderly population calls for a range of socio-economic provisions for this segment.
SENIOR CITIZEN HOUSINGA Road Less Travelled
Rajiv Sharma ([email protected]) and Dr. Akshaya Kumar Sen are faculty at HUDCOs Human Settlement Management Institute, New Delhi.
Estimates indicate that more than 12 per cent of the world’s senior citizens live in india. With the senior population of 100 million persons, the estimated demand for the senior citizen housing is 3,12,000 units. it has been realised that there is a need to develop special policies and programs for providing adequate support particularly to access good housing and health care for the elderly people.

THEME PAPER
| HUDCO - HSMI Publication 18
HOuSinG FOR SEniOR CiTiZEn
According to consultancy firm JLL, senior citizen housing is US$ 25 billion industry worldwide. In USA alone there are over 2,000 senior citizen homes with over 500,000 residents. The Association of Senior Living India (ASLI), a voluntary organisation that operates in senior citizen housing estimates one senior in every 10,000 is engaged in some form of senior living in India, as compared to 12 in every 100 in the USA and 4 in every 100 in Australia.
Estimates indicate that more than 12 per cent of the world’s senior citizens live in India. With the senior population of 100 million persons, the estimated demand for the senior citizen housing is 312,000 units. The senior citizen housing have been valued as over US$ 1 billion.
Jones Lang Lasalle (JLL), has conducted an analysis of 135 urban cities/ towns in India, having a population of 223 million and 52 million households. As per this analysis, households with seniors represent 12.8 million, which is 24.6 per cent of the total number of 52 million households in 135 urban cities/towns. The total demand for senior citizen housing, in different income categories has been estimated by JLL as about 312,000. The demand of senior housing in
different typology of cities/ towns is given in Table-1.
There are more than 1000 senior citizens houses in India and most of them offer free accommodation. As a result, the services are poor and many eligible persons do not avail these facilities. However, some private and also PPP initiatives have been taken-up in recent past in India. Good quality homes have come up in Coimbatore, Dehradun, Goa, Delhi and in some cities of Kerala, Maharashtra and West Bengal etc. making them well-known retirement destinations.
JLL has also worked out the market price tag for each category. The ticket price for high income senior units ranges between Rupees 5 to 7.5 million or more, mid-income for Rupees 2.5 to 5 million and low income between 1.0 to 2.5 million and Bottom of Pyramid (BoP) below Rupees 1.0 million. In addition, senior citizen homes also carry an additional monthly instalment for maintenance. Thus, senior citizen housing offers a great opportunity for planning agencies, financing agencies and management agencies.
Therefore, government intervention is needed to provide access to houses to the senior citizen, in the same way as housing for the poor. Ministry of Social Justice and Empowerment has schemes to provide grant
for construction, operation and maintenance of specialized homes for senior citizens. However, the grant is just seed money and implementing agencies need to provide for additional funds from other sources. Projects for different income categories must be designed, using various financing models. Further, government should be convinced to earmark a certain percentage of houses for urban and rural lower income senior citizens.
SEniOR CiTiZEn HOmES- kEy CHaLLEnGES
The increasing growth in elderly population in India along with the diminishing affordability, pose a serious challenge for accessing a decent and affordable living for the senior citizens in the country. It has been realised that there is a need to develop special policies and programs for providing adequate support particularly to access good housing and health care for the elderly people. Based on the discussions with stakeholders and visits to some senior citizen housing projects, the challenges pertaining to senior citizen housing have been clustered into three broad categories, namely, planning & design; financing; and management. Box- 1 illustrates the type of assistance required, with the age of senior citizen.
Planning and design principles
There are many design criteria adopted by different countries in the planning of Senior Citizens Housing. Such designs include anti-skid floor, hand rails, soft areas, curved corners, alarm bells
High income2 Mid income Low income BoP
Tier-I cities 11,505 13,810 19,171 48,457
Tier-II cities 4,154 6,449 9,229 30,751
Tier-III towns 10,561 19,570 33,156 105,643
Source: JLL, 2011.
Pan India Senior Living demand of urban hh per city typologyTable 1 :

THEME PAPER
April 2016 Volume 17 No.1- SHELTER | 19
in rooms and bathrooms, support in bathrooms, ramps for wheel chairs etc. In addition, the housing is linked to indoor and outdoor activities so that the residents are able to share their joys and sorrows with each other. In some cases, senior citizens homes are linked to schools of differently abled and or mentally retarted children, music schools, floriculture etc., to keep the occupants engaged.
Senior citizen homes should be equipped with entertainment and communication facilities like TV Lounge, Bar, Wi-Fi connection, Video Conference facility etc., so that residents are able to keep in touch with their loved ones.
While planning these homes, building orientation should be such that the complex derives maximum benefit from sunlight and air for ventilation and lighting. The construction material used should be environmentally friendly, have no sharp edge, light weight and reduce external noises. The rooms should have good insulation for peaceful sleep of residents.
Emergency lights should be installed in house and in common areas. Fixtures in rooms and bathroom should be at a height that minimises bending. The steps in house and
in the corridor should be avoided. All spaces should preferably be at the same level. If steps are unavoidable, the difference in floor levels should be distinguished by using contrasting strips. Ramps should invariably be provided with adequate gradient (1:15 ) for moving wheelchairs.
All residences should have emergency devices and such devices should be connected to a 24 hour control room. All calls, alarms should be so configured that the location of the person can be ascertained from the alarm itself and problem can be addressed immediately. To minimize use of many keys, single key entrance or biometric entrance should be encouraged.
Building should have different colours to separate floors, complexes, common facilities, rooms etc. Smoke and fire alarm system should be installed and connected to the control room, to help trace the exact location of fire in case of emergency.
Senior citizen housing projects needs detailed design for home or independent unit and circulation area/common facilities in and around building. Common design principles of these elements are given below:
The Home or independent unit
Square rooms are generally preferred, as it is easy to furnish. Mats should be avoided in rooms, corridors and staircase to avoid slipping.
Rooms should have a balcony or
verandah to provide space for sitting and eating meals or snacks. Bathroom should be attached to bedroom and its doors should open outwards or slide. Door should be large enough to allow entry to wheelchair. Bathroom walls should be strong enough to hold support fixtures near toilet seat and in wash area. Bathtubs should be avoided. Locks in bathrooms should be openable from inside and outside.
Light points should be close to the bed. Bedside side tables should be provided to keep medicines and other equipments. Wireless dimmers and audio control system is becoming a pre-requisite these days. Even if a common kitchen is provided in the project, a fully equipped kitchenette should be additionally provided for each unit. Internal doors should be so designed that they are easy to break open, during emergency.
Common Facilities and Circulation area
The infrastructure and common areas which makes the building functional also plays an important role. Staircase, corridors, balconies, common areas should be designed to allow mobility of residents in all conditions. These areas should be well illuminated during day and night. Closed circuit TV should be installed in common areas, lift, park, parking etc. The floors should be easily washable and use anti-slip material. Lifts should have transparent doors and communication from lift to the control room should be possible.
Age Living
Age 58 – 65 years Independent living
Age 65 – 75 years Assisted living
Age 75 onwards Skilled Nursing Care
Age and Assistance requiredBox 1 :
Source: JLL, 2011.
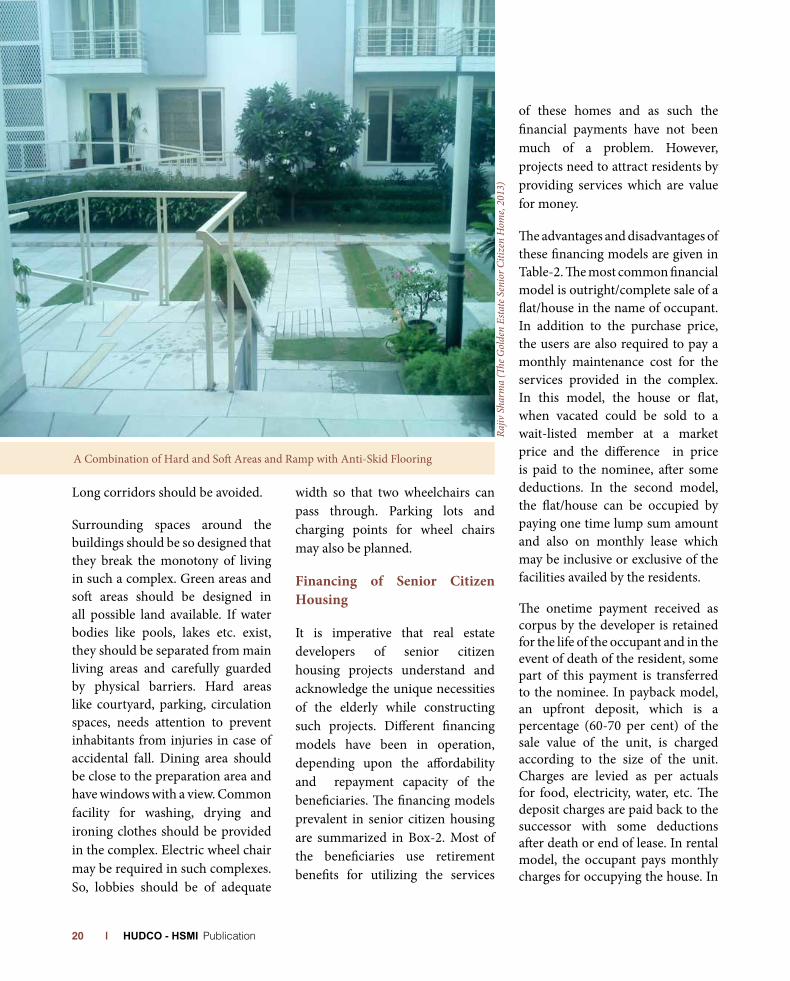
THEME PAPER
| HUDCO - HSMI Publication 20
Long corridors should be avoided.
Surrounding spaces around the buildings should be so designed that they break the monotony of living in such a complex. Green areas and soft areas should be designed in all possible land available. If water bodies like pools, lakes etc. exist, they should be separated from main living areas and carefully guarded by physical barriers. Hard areas like courtyard, parking, circulation spaces, needs attention to prevent inhabitants from injuries in case of accidental fall. Dining area should be close to the preparation area and have windows with a view. Common facility for washing, drying and ironing clothes should be provided in the complex. Electric wheel chair may be required in such complexes. So, lobbies should be of adequate
width so that two wheelchairs can pass through. Parking lots and charging points for wheel chairs may also be planned.
Financing of Senior Citizen Housing
It is imperative that real estate developers of senior citizen housing projects understand and acknowledge the unique necessities of the elderly while constructing such projects. Different financing models have been in operation, depending upon the affordability and repayment capacity of the beneficiaries. The financing models prevalent in senior citizen housing are summarized in Box-2. Most of the beneficiaries use retirement benefits for utilizing the services
of these homes and as such the financial payments have not been much of a problem. However, projects need to attract residents by providing services which are value for money.
The advantages and disadvantages of these financing models are given in Table-2. The most common financial model is outright/complete sale of a flat/house in the name of occupant. In addition to the purchase price, the users are also required to pay a monthly maintenance cost for the services provided in the complex. In this model, the house or flat, when vacated could be sold to a wait-listed member at a market price and the difference in price is paid to the nominee, after some deductions. In the second model, the flat/house can be occupied by paying one time lump sum amount and also on monthly lease which may be inclusive or exclusive of the facilities availed by the residents.
The onetime payment received as corpus by the developer is retained for the life of the occupant and in the event of death of the resident, some part of this payment is transferred to the nominee. In payback model, an upfront deposit, which is a percentage (60-70 per cent) of the sale value of the unit, is charged according to the size of the unit. Charges are levied as per actuals for food, electricity, water, etc. The deposit charges are paid back to the successor with some deductions after death or end of lease. In rental model, the occupant pays monthly charges for occupying the house. In
A Combination of Hard and Soft Areas and Ramp with Anti-Skid Flooring
Rajiv
Sha
rma
(The G
olde
n Es
tate
Sen
ior C
itize
n H
ome,
2013
)

THEME PAPER
April 2016 Volume 17 No.1- SHELTER | 21
this situation the occupants have a choice to live in the apartment as long as they want without any legal obligations. In this case, the rent is slightly higher than the market value since some common facilities are included in the rent.
incentive for Developing affordable Senior Citizen Housing
The senior citizen housing in India is poised for significant growth in the coming years due to increasing requirement of senior citizens, particularly for low income and abandoned homeless segments.
Almost all of the senior citizen housing projects undertaken in the country cater to the high-end and luxury segments on outright sale and in some cases lease rental basis. Long-tenure and cheaper funds are required for housing providers in both public and private sector to construct and operate these projects. The following financing options could be considered for making senior citizen homes affordable:
(i) using Land as Resource
Construction of affordable housing for senior citizens can become a feasible target only if land is made
available by the land-owning public agencies or government at pre-determined prices (not at market prices) or free of charge. The government may use the available land more effectively by using land as a resource. Towards this, Government can enter into joint ventures with developers with land as equity. Land banking, i.e. purchase of large strips by state governments/agencies, land reservation etc. are other measures for construction of affordable senior citizen housing.
(ii) incentivizing private sector
Affordable senior citizen housing could be provided through Public-Private- Partnership (PPP) approach. The P-P-P models experimented within the country involve making land available to the private sector by the Government, while allowing the private sector to develop the land for permitted uses with the condition that a certain percentage of housing will be for the EWS and the same will be made available to the poor at government-determined prices. Similar kind of PPP arrangements for developing affordable senior citizen housing projects could be tried. For incentivizing private developers, grant of higher FAR in already built up areas together with Transferable Development Rights (TDRs) could be considered. Apart from this, developers could also be given incentives in the form of income-tax exemption under IT sections 24 and 35AD, waiver of stamp duty, sales tax and other fees.
Types of Senior Citizens Financing Models
High Income with less or no family support Outright Sale / Lease Deposit
High Income having short time stay requirements
Lease Deposit / Rental
Middle income Lease Deposit / Rental
Low income / abandoned homeless Subsidized
Requiring Specialized Nursing Subsidized / rental
Financing OptionsBox 2:
Disposal Model Advantages Disadvantages
Complete Sale Quick Financial startReturnsMortgageable
Speculative buyersLow occupancyLack of control
Lease Deposit (Upfront + Rent)
Allows flexibilityLower Price Entry PointsCapital appreciation
Lower returns
Payback scheme Deposit amount paid back to successor after death
Lump-sum upfront amount (60%-70% )
Pure Rental Occupancy AssuranceControl on the ProjectCapital appreciation
Lowest returnHigher switchingRisk of Capital Investment
Models of financing Senior Citizen HousingTable 2:
Source: Senior Living Sector in India, Jones Lang Lasalle, 2011
Source: JLL, 2011.
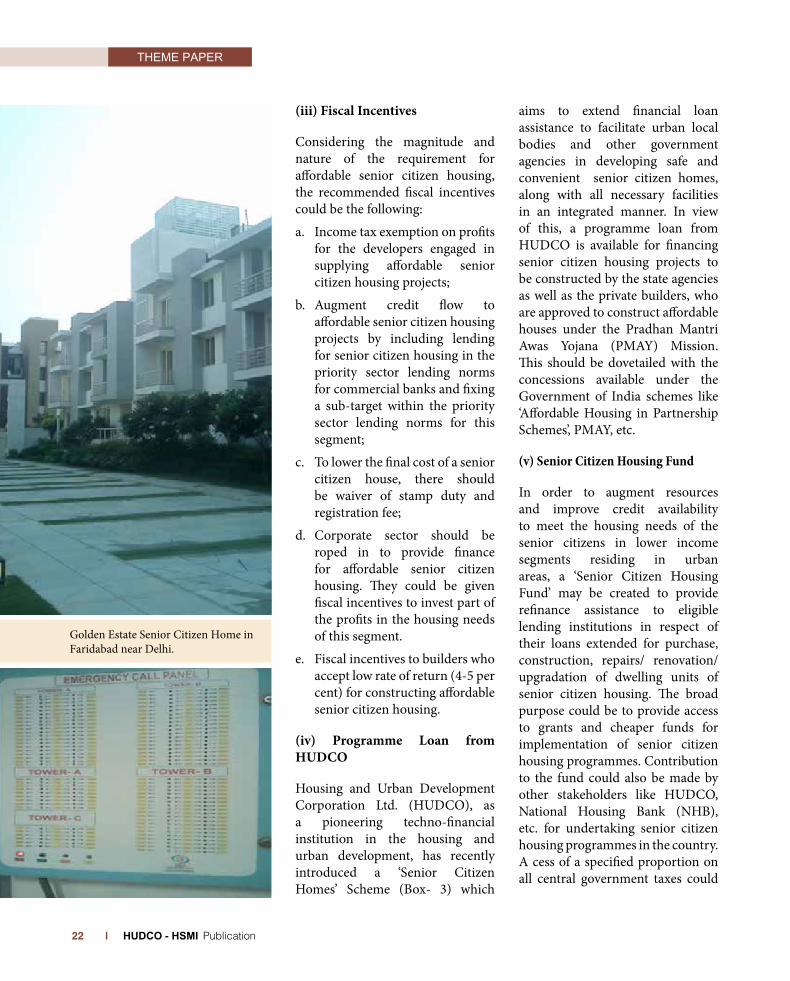
THEME PAPER
| HUDCO - HSMI Publication 22
(iii) Fiscal incentives
Considering the magnitude and nature of the requirement for affordable senior citizen housing, the recommended fiscal incentives could be the following:
a. Income tax exemption on profits for the developers engaged in supplying affordable senior citizen housing projects;
b. Augment credit flow to affordable senior citizen housing projects by including lending for senior citizen housing in the priority sector lending norms for commercial banks and fixing a sub-target within the priority sector lending norms for this segment;
c. To lower the final cost of a senior citizen house, there should be waiver of stamp duty and registration fee;
d. Corporate sector should be roped in to provide finance for affordable senior citizen housing. They could be given fiscal incentives to invest part of the profits in the housing needs of this segment.
e. Fiscal incentives to builders who accept low rate of return (4-5 per cent) for constructing affordable senior citizen housing.
(iv) Programme Loan from HuDCO
Housing and Urban Development Corporation Ltd. (HUDCO), as a pioneering techno‐financial institution in the housing and urban development, has recently introduced a ‘Senior Citizen Homes’ Scheme (Box- 3) which
aims to extend financial loan assistance to facilitate urban local bodies and other government agencies in developing safe and convenient senior citizen homes, along with all necessary facilities in an integrated manner. In view of this, a programme loan from HUDCO is available for financing senior citizen housing projects to be constructed by the state agencies as well as the private builders, who are approved to construct affordable houses under the Pradhan Mantri Awas Yojana (PMAY) Mission. This should be dovetailed with the concessions available under the Government of India schemes like ‘Affordable Housing in Partnership Schemes’, PMAY, etc.
(v) Senior Citizen Housing Fund
In order to augment resources and improve credit availability to meet the housing needs of the senior citizens in lower income segments residing in urban areas, a ‘Senior Citizen Housing Fund’ may be created to provide refinance assistance to eligible lending institutions in respect of their loans extended for purchase, construction, repairs/ renovation/ upgradation of dwelling units of senior citizen housing. The broad purpose could be to provide access to grants and cheaper funds for implementation of senior citizen housing programmes. Contribution to the fund could also be made by other stakeholders like HUDCO, National Housing Bank (NHB), etc. for undertaking senior citizen housing programmes in the country. A cess of a specified proportion on all central government taxes could
Golden Estate Senior Citizen Home in Faridabad near Delhi.
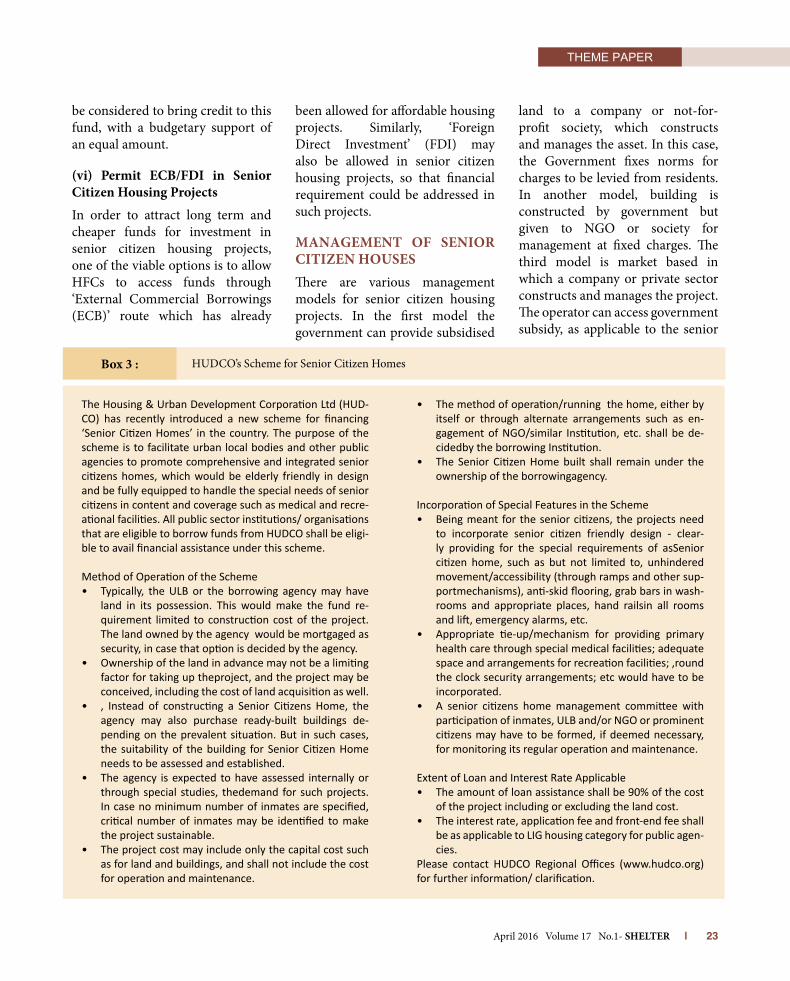
THEME PAPER
April 2016 Volume 17 No.1- SHELTER | 23
be considered to bring credit to this fund, with a budgetary support of an equal amount.
(vi) Permit ECB/FDi in Senior Citizen Housing Projects
In order to attract long term and cheaper funds for investment in senior citizen housing projects, one of the viable options is to allow HFCs to access funds through ‘External Commercial Borrowings (ECB)’ route which has already
been allowed for affordable housing projects. Similarly, ‘Foreign Direct Investment’ (FDI) may also be allowed in senior citizen housing projects, so that financial requirement could be addressed in such projects.
manaGEmEnT OF SEniOR CiTiZEn HOuSESThere are various management models for senior citizen housing projects. In the first model the government can provide subsidised
land to a company or not-for-profit society, which constructs and manages the asset. In this case, the Government fixes norms for charges to be levied from residents. In another model, building is constructed by government but given to NGO or society for management at fixed charges. The third model is market based in which a company or private sector constructs and manages the project. The operator can access government subsidy, as applicable to the senior
The Housing & Urban Development Corporation Ltd (HUD-CO) has recently introduced a new scheme for financing ‘Senior Citizen Homes’ in the country. The purpose of the scheme is to facilitate urban local bodies and other public agencies to promote comprehensive and integrated senior citizens homes, which would be elderly friendly in design and be fully equipped to handle the special needs of senior citizens in content and coverage such as medical and recre-ational facilities. All public sector institutions/ organisations that are eligible to borrow funds from HUDCO shall be eligi-ble to avail financial assistance under this scheme.
Method of Operation of the Scheme• Typically, the ULB or the borrowing agency may have
land in its possession. This would make the fund re-quirement limited to construction cost of the project. The land owned by the agency would be mortgaged as security, in case that option is decided by the agency.
• Ownership of the land in advance may not be a limiting factor for taking up theproject, and the project may be conceived, including the cost of land acquisition as well.
• , Instead of constructing a Senior Citizens Home, the agency may also purchase ready-built buildings de-pending on the prevalent situation. But in such cases, the suitability of the building for Senior Citizen Home needs to be assessed and established.
• The agency is expected to have assessed internally or through special studies, thedemand for such projects. In case no minimum number of inmates are specified, critical number of inmates may be identified to make the project sustainable.
• The project cost may include only the capital cost such as for land and buildings, and shall not include the cost for operation and maintenance.
• The method of operation/running the home, either by itself or through alternate arrangements such as en-gagement of NGO/similar Institution, etc. shall be de-cidedby the borrowing Institution.
• The Senior Citizen Home built shall remain under the ownership of the borrowingagency.
Incorporation of Special Features in the Scheme• Being meant for the senior citizens, the projects need
to incorporate senior citizen friendly design ‐ clear-ly providing for the special requirements of asSenior citizen home, such as but not limited to, unhindered movement/accessibility (through ramps and other sup-portmechanisms), anti‐skid flooring, grab bars in wash-rooms and appropriate places, hand railsin all rooms and lift, emergency alarms, etc.
• Appropriate tie‐up/mechanism for providing primary health care through special medical facilities; adequate space and arrangements for recreation facilities; ,round the clock security arrangements; etc would have to be incorporated.
• A senior citizens home management committee with participation of inmates, ULB and/or NGO or prominent citizens may have to be formed, if deemed necessary, for monitoring its regular operation and maintenance.
Extent of Loan and Interest Rate Applicable• The amount of loan assistance shall be 90% of the cost
of the project including or excluding the land cost.• The interest rate, application fee and front‐end fee shall
be as applicable to LIG housing category for public agen-cies.
Please contact HUDCO Regional Offices (www.hudco.org) for further information/ clarification.
HUDCO’s Scheme for Senior Citizen HomesBox 3 :

THEME PAPER
| HUDCO - HSMI Publication 24
citizen housing. Golden Estate is a high end senior citizen housing project in Faridabad near Delhi. It is a market based project, as envisaged in the last model, and all services are paid for by the residents (Refer Box 4).
Such homes need to be integrated with creative activities in the neighbourhood. They should act as resource centres and be linked to crèche for working parents, art & culture centre for children, school for mentally retarted, organic farming, horticulture etc.
Some important issues pertaining to management of such projects are given below:
management by a nGO/ Professional BodyIt is pertinent to mention that management of such a housing
complex requires a multi-disciplinary team. Management involves issues like civil maintenance of buildings, operation & maintenance of services, liasoning with local police, security agency, hospitality industry, event managers, private sector and NGOs. Therefore, a management team comprising of trained planners, advocates, designers, nursing, event planner, psychologist etc. should be commissioned. The rules may be formulated for eligibility age of residents, visit of relatives/ family, transfer of deposit/ asset in case of death, maintenance charge, medical charge etc.
A reception area should be created to receive visitors, liaison with other agencies, finance, handling complaints etc. Special guest house and canteen should be provided for visitors. Where there is more than one block, the reception can be
provided centrally to avoid wasteful duplication.
Housekeeping and SecurityStrategy should be to associate leaders in housekeeping, waste management, laundry, food service etc. Round the clock security should be provided in the complex to check infiltration of unauthorised entry. Parking for residents and visitors may be created, with special place for disabled. The parking area should be well lit and covered so as to protect users from cold, heat and rain. A workshop may be established to carry out small jobs related to electrician, plumbing masonry, stitching, carpentry etc.
Rejuvenation WorkshopThe most important design factor is to incorporate psychological needs of the occupants. Many retired persons want to travel, follow hobbies, spend time with friends etc. Thus, worskshops may be planned to give an opportunity to residents to follow their hobbies. Such workshops may be open to others in the neighbourhood. This will improve integration with society, generate some funds for the O&M of the project and also provide skilled learning to children and others in the vicinity. Interested residents within the group, may be identified as leaders to teach others.
Wellness networkRound the clock medical first-aid is a pre-requisite to run such a housing complex. Hence, the medical facilities in senior citizen housing should be developed in consultation with a reputed hospital. The driving distance to hospital should not be more than 30 minutes, in order to
Senior citizen Housing project located near NIT in Faridabad, Haryana. This project has been developed by a private entrepreneur under the banner- The Golden Es-tate. The project is developed in close association with Fortis Hospital.
Project Details
The project has 75 units with an area ranging from 250 to 440 sq.ft. The project is envisaged as a rental property and beneficiaries are above the age of 60 years. Each beneficiary is asked to pay a security amount ranging from Rs. 1.5million to Rs. 2.75million depending on the size of unit opted by them. In addition to the security deposit, the couple has to additionally pay common service charge and consumption charge. Service charge is levied to pay for the maintenance, security, repair or replacement of gadgets, medical facility and maintenance of club and oth-er common facilities. The common service charge is about Rs. 15,000 per month. The consumption charge depends on the use of service and facilities like electricity, laundry, food etc. and works out to be another Rs. 15000/‐ per couple approxi-mately. Three‐fourth or 75 per cent of the security deposit is refunded to the next of kin in case of death of the Senior Citizen or to the couple in case they choose to vacate the flat. The medial emergency is available as a tie‐up with Fortis Hospital which is about 10 minute drive from the project site. The expenses on medical treatment is adjusted in the medical insurance or deducted from security deposit.
Senior Citizen Housing Project, Faridabad
Based on the visit to “The Golden Estate”, Faridabad on October 21, 2013
Box 4 :

THEME PAPER
April 2016 Volume 17 No.1- SHELTER | 25
attend to emergencies.
amenities and ServicesAmenities like physiotherapy centre, massage, sauna, panchkarma and other healing facilities, restaurant, swimming pool etc. are aspired by residents living in senior citizen housing. However, these amenities may not be viable for senior citizens alone. Hence, these amenities may also be open to those living in vicinity, thus integrating this complex with neighbourhood.Space for the carrying out of religious activities either dedicated or multi-use should also be planned. Such spaces could be used for celebrating birthdays, anniversaries etc.
COnCLuSiOnDue to change in societal structure and shift from joint family structure to a nuclear family structure, the family feels constrained to support the elderly at home. At the same time the family exhibits the feeling of guilt for sending elderly to isolated elderly homes. Thus, societal responsibility becomes important and needs to be exhibited to take care of senior citizens.The demand for urban dwelling units for senior citizens will increase and planners should devise policies to accommodate this demand by promoting projects with senior citizen homes for different income groups and of different size options. The role of private sector becomes important and policies must be devised to support this initiative. Planners must work to make senior citizen housing as part of zonal plan. They must ensure that housing for senior citizens is located close to community facilities, within
existing residential locations, near young people and within the reach of transportation network.The USP of senior citizen housing should be that they should feel safe and free from the annual rental increase. Second issue is that all residents should not only have good company but also activities to perform so that they do not feel isolated. The third and important aspect is that such houses should be affordable to the residents. To make it happen, the scheme should converge various programmes of the government of India, for the benefit of the residents.The realization of need for affordable senior citizen homes, with special policies and programs for providing adequate support particularly health care for the elderly people, are gaining ground in India. The Housing and Urban Development Corporation (HUDCO) has already announced a new scheme for financing Senior Citizen Homes. Recently, the Delhi Development Authority (DDA) has introduced a senior citizen housing scheme and it is hoped that other agencies would follow. There is a lot of opportunity in this sector but many complexes are not meeting the expectations. While it may not be possible to replicate the senior living concepts of the west in India, it is certainly important to understand the needs of this population and try to adapt the good practices to the Indian context.
nOTES1. The paper assumes 60 or above as senior citizen.
2. High Income (annual income > Rs. 1.5 m), Mid Income (Rs. 0.75 - 1.5 m annual income),
Low Income (Rs. 0.3 - 0.75 m annual income) and BoP (annual income below Rs. 0.3 m).
REFEREnCESCensus (2011), “Census of India”, Office of the
Registrar General & Census Commissioner, Ministry of Home Affairs, Government of India, 2011.
CSO, “Situation Analysis of the Elderly in India”, Central Statistics Office, Ministry of Statistics & Programme Implementation, Government of India, Delhi, 2011.
Jerome L. Kaufman, “Planning and an Aging Population”, American society of Planning Officials, Information Report No. 148, Illinois, July 1961.
JLL (2011), “Senior Living Sector in India”, Jones Lang Lasalle, 2011.
Lynd, Robert (1931), “Knowledge for What?”, Princeton University Press, New Jersey, 1939.
United Nations, “World Population Ageing- 1950-2050”, Department of Economic and Social Affairs, Population Division, New York, 2002.
WEBSiTES https://www.helpageindia.org/programs/old-
age-homes.html
https://www.brighton-hove.gov.uk/content/housing/general-housing/welhops-welfare-housing-policies-senior-citizens-0
http://www.thegoldenestate.com/
http://www.livemint.com/Money/dvN4ue8SccGtAB0vRXLthI/Whats-the-real-cost-of-retirement-homes.html
http://www.dnaindia.com/money/report-tata-housing-lines-up-rs-1200-crore-senior-citizen-home-project-1966618
http://www.businesstoday.in/moneytoday/cover-story/tips-to-buy-property-for-post-retirement-years/story/18851.html
http://www.ageventuresindia.org/retirementhomeinindia
http://indianexpress.com/article/india/india-others/retirement-apartments-senior-living-in-india-comes-of-age/
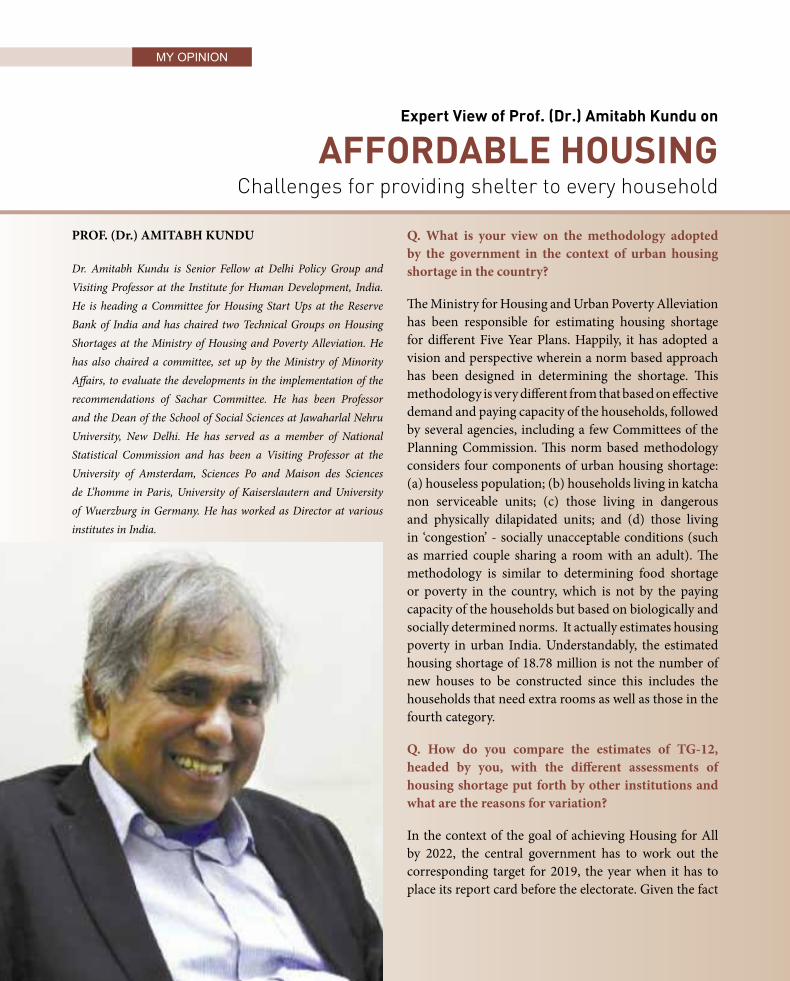
| HUDCO - HSMI Publication 26
PROF. (Dr.) AMITABH KUNDU
Dr. Amitabh Kundu is Senior Fellow at Delhi Policy Group and Visiting Professor at the Institute for Human Development, India. He is heading a Committee for Housing Start Ups at the Reserve Bank of India and has chaired two Technical Groups on Housing Shortages at the Ministry of Housing and Poverty Alleviation. He has also chaired a committee, set up by the Ministry of Minority Affairs, to evaluate the developments in the implementation of the recommendations of Sachar Committee. He has been Professor and the Dean of the School of Social Sciences at Jawaharlal Nehru University, New Delhi. He has served as a member of National Statistical Commission and has been a Visiting Professor at the University of Amsterdam, Sciences Po and Maison des Sciences de L’homme in Paris, University of Kaiserslautern and University of Wuerzburg in Germany. He has worked as Director at various institutes in India.
Q. What is your view on the methodology adopted by the government in the context of urban housing shortage in the country?
The Ministry for Housing and Urban Poverty Alleviation has been responsible for estimating housing shortage for different Five Year Plans. Happily, it has adopted a vision and perspective wherein a norm based approach has been designed in determining the shortage. This methodology is very different from that based on effective demand and paying capacity of the households, followed by several agencies, including a few Committees of the Planning Commission. This norm based methodology considers four components of urban housing shortage: (a) houseless population; (b) households living in katcha non serviceable units; (c) those living in dangerous and physically dilapidated units; and (d) those living in ‘congestion’ - socially unacceptable conditions (such as married couple sharing a room with an adult). The methodology is similar to determining food shortage or poverty in the country, which is not by the paying capacity of the households but based on biologically and socially determined norms. It actually estimates housing poverty in urban India. Understandably, the estimated housing shortage of 18.78 million is not the number of new houses to be constructed since this includes the households that need extra rooms as well as those in the fourth category.
Q. How do you compare the estimates of TG-12, headed by you, with the different assessments of housing shortage put forth by other institutions and what are the reasons for variation?
In the context of the goal of achieving Housing for All by 2022, the central government has to work out the corresponding target for 2019, the year when it has to place its report card before the electorate. Given the fact
Expert View of Prof. (Dr.) Amitabh Kundu on
AFFORDABLE HOUSINGChallenges for providing shelter to every household
MY OPINION
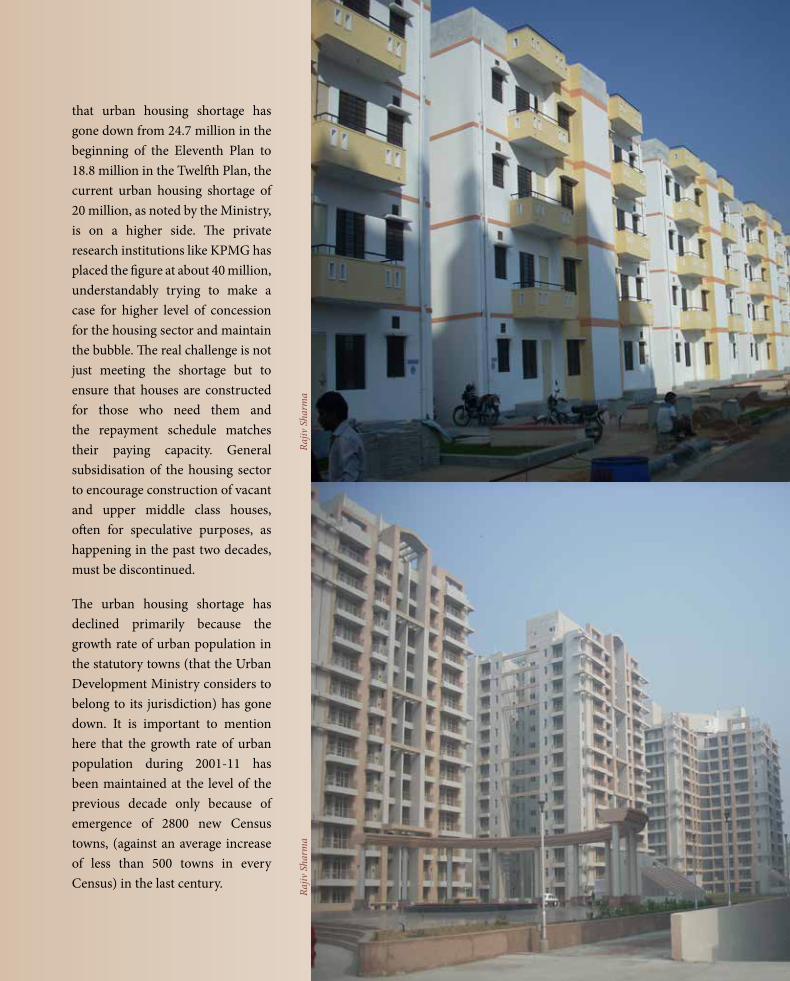
that urban housing shortage has gone down from 24.7 million in the beginning of the Eleventh Plan to 18.8 million in the Twelfth Plan, the current urban housing shortage of 20 million, as noted by the Ministry, is on a higher side. The private research institutions like KPMG has placed the figure at about 40 million, understandably trying to make a case for higher level of concession for the housing sector and maintain the bubble. The real challenge is not just meeting the shortage but to ensure that houses are constructed for those who need them and the repayment schedule matches their paying capacity. General subsidisation of the housing sector to encourage construction of vacant and upper middle class houses, often for speculative purposes, as happening in the past two decades, must be discontinued.
The urban housing shortage has declined primarily because the growth rate of urban population in the statutory towns (that the Urban Development Ministry considers to belong to its jurisdiction) has gone down. It is important to mention here that the growth rate of urban population during 2001-11 has been maintained at the level of the previous decade only because of emergence of 2800 new Census towns, (against an average increase of less than 500 towns in every Census) in the last century.
Rajiv
Sha
rma
Rajiv
Sha
rma

| HUDCO - HSMI Publication 28
Q. Around 96 per cent of housing shortage pertains to EWS/LIG category. What are the challenges to finance a programme of this scale?
The allocation for the Ministry of Housing & Urban Poverty Alleviation for the year 2016-17 is Rs.54 billion. The government sources claim a jump in spending, compared to that in the last year since the initial allocation in the latter was drastically revised downwards to less than Rs. 20 billion. The media has reported that the Ministry has spent less than 30 per cent of its allocation in the first nine months, in the last financial year. The government sources claim that the total fund to be spent for ‘Housing for All 2022’ Mission is Rs. 3 trillion. By the present rate of spending, the public expenditure on housing would then be less than 6 per cent of the total amount. The major concern should, therefore, be how with more than 90 per cent funds coming from private sector, the present strategy would meet the housing shortage, since around 96 percent of the units are required for EWS and LIG categories. Even with land and interest subsidies, as envisaged in the four verticals in the housing mission (PMAY), can the poor households pay the required monthly installment of such PPP projects?
Q. How realistic is the PMAY target of constructing 20 million houses by 2022 and how do you think it can be achieved?
Technologically, it is not difficult at all to meet the need for new houses which is likely to be less than 20 million. It would not be a major challenge in terms of resource commitment as well, for a country predicted to grow at 7 to 8 per cent per year in real terms. Our Committee has noted that about 15 million households suffer from the problem of ‘congestion’. Of these, about 6 million need only an extension of one or two rooms, to meet their normative requirement
of housing. Also, over 11 million units are vacant. Finally, the growth in the housing stock during the past decade has been significantly higher than that of households in urban areas, as per the information both from the Census and National Sample Survey (NSS). With interest and tax subsidies proposed, the supply in real estate market can easily be increased. The key challenge would be of targeting
house construction to the needs of the poor and design appropriate institutional control over the building companies so that the units become affordable to them.
Q. As per Census of India 2011 figures, around 11 million houses are lying vacant in urban areas. Do you think bringing the vacant houses into the market would help to bridge the demand-supply gap of affordable housing in the country? If so, what are the viable mechanisms to bring these houses into use?
In case we include the occupied houses that are kept locked, the total
number of vacant houses would go up to 11.8 million in 2011. A general overview of the vacant stock with various builders suggests that the number has gone up further over the past half-decade. It is not difficult to have a taxation policy which could force the owners to bring these units into use/market. Our Committee on Housing Shortage has proposed a series of such measures. The
The real challenge is not just meeting the shortage but to ensure that houses are constructed for those who need them and the repayment schedule matches their paying
capacity. General subsidisation of the housing sector to encourage construction of vacant and upper middle class houses, as happening in the past two decades, must be discontinued.
MY OPINION

April 2016 Volume 17 No.1- SHELTER | 29
question is whether the central and state governments will muster the determination and political will to adopt these measures and withstand the pressure from the urban middle class. Not raising exemption limits for income tax along with several other such proposals and increasing allocation for employment generation and rural infrastructure in the present budget reflects a pro-poor stand of the government. The withdrawal of the tax on EPF funds, on the other hand, reflects the muscle power of the middle class.
Q. Recently, the Government of India has circulated a draft National Urban Rental Housing Policy (NURHP). Do you think this initiative by the GoI would
help in promoting affordable rental housing market in the country?
Under the second five-year plan in India, there was public sector creation of rental housing. But soon the government realized that managing rental housing is a difficult option from the point of view of recovering rents or getting re-possession of the rental units, given the democratic set up we have in our country. Since the sixties, there has been no major public sector intervention with regard to rental housing. The current institutional and legal system cannot support government managing rental housing. The private sector would not come in a big way for rental housing at the
lower end of the spectrum, unless incentivized adequately. Neither the central nor the state governments would like to be seen to be working in tandem with private sector, facilitating functioning of the rental market through recovery of dues and eviction of non-paying tenants. However, we cannot shy away from the fact that rental housing has been an important instrument for provision of housing services at affordable prices to general public in many countries across the world. In this context, I would commend the Government of India for recognizing the need for affordable rental housing and bringing out a draft National Urban Rental Housing policy as an initiative to find a solution.
Rajiv
Sha
rma

MY OPINION
| HUDCO - HSMI Publication 30
Q. There is a huge demand for skilled labour in the construction sector. How can we cater to this demand?
With less than 3 per cent growth in agriculture, there would be huge labour surplus in rural areas. Given the demographic dividend, it is estimated that about 420 million people will have to be shifted from agriculture to non-agriculture by 2050, if we do not want any further increase in rural urban disparity in per capita income or consumption expenditure. A labour intensive technology in housing can absorb a part of this labourforce and, at the same time, help in making the houses affordable. This would involve a massive programme of skill development which can be built into the ongoing missions such as National Skill Development Mission, National Urban Livelihood Mission and Shyama Prasad Mukherjee Rurban Mission.
Q. How do you see the present budget in the context of affordable housing, particularly for the urban poor?
The Union Budget 2016-17 has made some key announcements, which I think, would help significantly in meeting the national goal of ‘Affordable Housing for All’. Particularly, provisions such as giving 100 per cent deduction from profits to an undertaking from a housing project for flats up to 30 sq. m. in metro cities and 60 sq. m. in other cities; and service tax exemption on construction of affordable houses up to 60 sq. m.
under any scheme of the central or state government including PPP schemes, would incentivize developers for constructing affordable houses across the country.
However, my suggestion is that before pumping in massive subsidies between Rs. 100,000 to 325,000 per household, under PM Awas Yojana, the government has to design an institutional arrangement to target these to the poor. Unfortunately, raising of the built up area from 30 sq. m. to 60 sq. m. and cost of the unit from Rupees 300,000 to 600,000, have made it easier for the middle class to enter the heavily subsidized segment of the housing market. Adhar card can only help in better identification of a person but cannot bring about social transformation and attitudinal change. The NSS data reveals that the bottom 30 per cent of the urban households cannot pay an installment more that Rs 1200 per month. The loan amount and the built up area of the units must be designed in such a manner that the poor do not get trapped by money lenders for loan repayment or forced to transfer the houses legally or illegally to others.
Q. Do you think that the Real Estate (Regulation and Development)Act, 2016 will boost the delivery of affordable housing stock in the country?
Indeed, this is a positive step in activating the housing market and boosting private sector participation. This would also help the middle class in getting a fair
deal as it promises to strengthen the regulatory framework and bring in greater transparency. However, the real question is how to ensure the dwelling units with built up area of 30 sq. m., whose installments, backed up by government subsidy, are affordable to the poor, would be brought under the purview of the Act .
Q. What do you think will be the impact of the recent government initiatives of SMART Cities, AMRUT and HRIDAY on the future of India’s cities?
The government may not be able to sustain the promised level of commitment to these missions as there appears to be a distinct shift of planned priorities towards the goal of employment generation, rural development, poverty alleviation and inflation control. The current budget has not talked of the urban sector. Also, the share of this sector, including urban housing, has remained constant over the past couple of years and this is not very high. The very fact that the government has chosen only 20 smart cities to be launched in the first year shows that it wants to learn from the experience and move forward cautiously. The compulsions of democracy and impending elections would make the government give greater attention to stabilising rural economy and increasing the incomes in the farm sector. I believe rurban, sanitation and health linked interventions would receive greater attention than in the past.

POLICY REVIEW
April 2016 Volume 17 No.1- SHELTER | 31
InTRoducTIon
Since late 1980s, a considerable emphasis has been placed on the role of urban centres in propelling economic growth in India (Sharma and Shaban 2006; Planning Commission 2008; Mckinsey and Company 2010). The initial neglect of the urban centres in planning processes are increasingly being addressed through enhanced market oriented reforms and budgetary allocation of resources for urban development. The Eleventh Five Year Plan document of Government of India refers to urban centres as characterised by ‘in-complete
devolution of function’ for effective local governance; ‘lacking adequate financial resources’; ‘growing homelessness’; ‘outdated’ method of urban planning (like, master plans) and ‘property taxation’; hesitation in levying ‘user charges’ for urban services like ‘water supply’ and ‘sanitation’ (Planning Commission of India 2008: 394-95). To make the reforms effective, the Central Government has started financial rewards to the state governments adopting the market oriented reforms related to removal of real estate regulatory control like Urban Land Ceiling Regulation Act (ULCRA), 1976, allowing private developers to legally purchase land for conversion into urban habitats and townships, and 100 per cent foreign direct investment (FDI) in real estate sector. These policies and conditions, among others, have become a part of the Government of India’s mega urban development plan like the Jawaharlal Nehru Urban Renewal Mission (JnNURM) initiated in 2005-06 and Smart City project launched in 2015. Hundred smart cities are being planned across India and scores of these cities will be developed with technical and financial help from Japan. Besides, 11 mega-urban development corridors like Delhi
CRITICAL REFLECTION ON CONTEMPORARY URBANIZATION
IN INDIA
Abdul Shaban ([email protected]) is Professor in School of Development Studies, Tata Institute of Social Sciences, Mumbai and Sanjukta Sattar is Associate Professor in the Department of Geography, University of Mumbai, Mumbai.
A complex role of the state in city development and planning has emerged in recent times. Where, on the one hand, it is considered that state has receded and given way to the private entrepreneur in development of cities, on the other hand, the state is accused of conniving with the private sector in forcible land acquisition and plundering of environmental resources and granting the status of planning authority to the private sector, which was a field of state action till recent years.
AbduL SHAbAnSAnjukTA SATTAR
We live in a time of transition. An order is dying and the new is yet to completely replace it. Everything, especially the socio-spatial order that gave a sense of continuity to the established form of life is changing, mutating and getting transformed. In recent years, cities have come to increased onslaught of private capital. It has changed the ways city, city life and politics was imagined. In India, also, revolutionary changes are taking place in social organisation within cities, spatial organisation of cities, relationship of cities with non-city-dwellers/non-city spaces, between cities within the national territory and outside the national boundaries, and between cities and the State. This paper attempts to discuss these rapid changes in cities in general and in India in particular.

| HUDCO - HSMI Publication 32
Mumbai Corridor, which runs about 1500 kms, have been identified for development by the current central government. In this regard, the present paper attempts (1) to discuss the contemporary form of urbanism in India and its global and local linkages; (2) to examine central and the state government policies that have been designed and implemented in recent years to facilitate private urbanism; and (3) to understand the nature and character of the private urbanism including implication for and relation with emerging inbeyonds and carceral cities. This paper does not discuss critical issues related to distortion in size-class and regional distortion in urbanization but rather focusses on ideological, policy, livelihood and belonging issues.
conTEmpoRARy uRbAnISm ‘Urbanism’ has been used to cover one too many aspects of city life or
even to define the totality of city life such as ‘urbanism as a mode of life’ (Wirth 1938). Wirth goes beyond the cities even to include how technological developments in transportation and communication have changed mode of living beyond the confines of cities. Aestheticization of everyday life in cities led by consumerism (Knox 2010) is another hallmark of contemporary urbanism. The global-local dialectics in production of urbanism has become important. What happens in rest of the world also become important for the destiny of regional cities. The cities are being shaped around new global economy that revolves around producer services (finance, legal services, design and innovation, insurance, information and the like), entertainment, etc, which are referred to as information economy (Castells 1989), post-industrial economy (Sassen 2001) or post-modern economy (Hardt 1999). The contemporary cities create their own internal peripheries
(both geographic and socio-economic) and the ‘inbeyonds’ are continuously reproduced. This post-Fordist urbanism in India produces space and citizens with both its economic and cultural logic, and is characterized by multi-scalarity, from neighbourhood in a city, to private city of intermediate levels, to global cities.
The changes that politico-economic order (neoliberalism) in India aims at are, among others, manifesting themselves in (a) valorisation of economic relations, (b) plutocracy in the garb of democratic governance, (c) secession of successful in new space making process, (d) bypass development, and (e) unhinging of the cities from local context, regional and national economies.
There has been a significant change in the way one now looks at the urban relations. Cities have been placed at the centre stage of the economic thinking and as business model - driver of the spatial and
Raj
iv S
harm
a

POLICY REVIEW
April 2016 Volume 17 No.1- SHELTER | 33
national economies (Mckinsey and Company 2010). This has valorised ‘economy’ and spaces of wealth, i.e. urban over rural; efficiency over equity, private over public; exclusive and gated development over inclusive development. In fact, economic ‘efficiency’, on which neoliberal polices hinge upon has become a catchword for facilitating entry of private capital (Banerjee-Guha 2009:98) or investment of public resources for facilitating private gains. To facilitate making of smart cities in India, consultants around the world are being imported at enormous public costs for facilitating the accumulation by private national and global capital. These cities are being developed with furious speed, for instance Gujarat International Finance-Tec City (GIFT) city (which is made on the model of Shenzhen) and Dholera in Gujarat. These smart cities discursively and through their glossy designs are expected to produce modernity and urban efficiency and considered to be the cure of all social and economic ills of the country. However, these are utopian expectations: as the logics of their production runs counter to what is expected. These cities attempt to relocate the power among capitalist and higher classes.
RISIng pLuTocRAcy Current city making processes in India has created a socio-political condition in which ‘power’ is again shifting and relocating in the hands of economically powerful. The government has got embedded in agentic1 chains wherein powerful nations, global economic institutions and multinational
corporations play major role in shaping economic and political priorities. The efforts of the governments/states in this process have not only been to subdue the critical thinking and opposition of this process, but also through its governmentality (process and act of governing) create and reproduce citizens to follow this paradigm. It is not surprising that exclusion, polarization (economic and political) and disarticulation remain major characteristics, though deepening of democracy, enhanced political participation and empowerments of citizens are talked by it in the same breath. The poor are often reduced to ‘vote bank’, and decision about their interests is pejoratively interpreted. The club of the rich has become prominently organized, defining their class interests, separating themselves from prolitarianizing masses.
This has, in many ways, compromised the local democracy and shifted the power more in favour of those with economic resources. The private organisations often combine together and act as growth coalitio, which is mainly characterised by dispossession of the peasants, tribals and working classes in cities and accumulation by the upper class undermining the distributive justice. These private groups, who do not directly remain answerable to public through electoral link, wield substantial influence and guide government decision making.
Typically growth coalitions attempt to put their case as a ‘value-free’ one at the political level, whilst
mobilising local media interests and backing pro-growth politicians and strategies. In this, community development and redistributive issues are relegated to the margins.
nEW SpAcE mAkIng pRocESS The neoliberalism in Indian is also leading to reconfiguration of space. The upper class is engaged in new urban space making, spatially and also socially, caging themselves in fortified neighbourhoods and distancing themselves from the lower class, who are often getting amassed at the urban peripheries and slums. This bourgeois urbanism (Keil 2002) signifies late capitalist urban space, what Soja (2000) terms as post-metropolis landscape – characterized by splintered cities/neighbourhoods on class and ethnic lines, ‘privatopias’ of the rich, and ‘exopolis’. McKenzie (1994) argues that by the privatopias, there is “secession of the successful” (p.196). The successful are creating their own gated communities in all mega cities and there are a few instances of creation of new separate cities like that of Aamby Valley and Lavasa.
Since the liberalization of the economy in the country in 1992, one has also seen spurt in new town building activities mainly led by corporate sectors in PPP arrangements. These new town planning are partially carried out as imperative for decongesting the existing mega cities (Wang, Kundu and Chen 2010), and are being created along major urban centres and corridor of speed rail, road and air mobilities. These new towns are economically, culturally and
POLICY REVIEW
| HUDCO - HSMI Publication 34
administratively different from the towns made after the independence. These “new towns culturally secede from their national and cultural locations and align themselves with global cities” (Bhattacharya and Sanyal 2011:41). The upper class is seceding to private gated spaces created in/through these towns. There are historical and structural conditions that enable the making of private spaces. The upper class would like to go back to its feudalistic values and would like to govern the larger masses as such. The ‘gated’ spaces/cities are considered as ‘marker of prestige’ (Glasze, Webster and Frantz 2006). In India, the gated development does not seem to be emerging from the ‘culture of fear’ as in Latin American and African countries (Blakely and Snyder 1997; Clardeira 2000). In other words the fear and security are not the main driving factors for ‘privatopolises’ but the ‘markers of status’. These spaces rather house ‘predators’ of public resources, and lead to loss of social diversity and further social segregation.
cITy In REgIon To gLobAL And pREdAToRy cITyThe relationship between city and city region has got drastically changed in the neoliberal times. The unhinging of the cities from their regional or national economies has taken place. It was considered in earlier development literature that cities act as growth poles to their peripheral regions. However, the new development shows that a city can exist as cul-de-sac without much exchange with periphery except using its environmental resources,
but connected to the rest of world or cities of global north and/or world cities. The new strategic cities (e.g. Lavasa and Aamby Valley cities) show their weak and reverse linkage with periphery and exploitative chain through acquisition and command and control over public goods, like roads and environment (water resources, scenic beauties, etc.).
Many also see this disassociation of strategic and new towns as a hegemony of immaterial labour2
(those engaged in higher-end service sector) over material labour (those engaged in material production). As Bhattacharya and Sanyal state, “this unhinging of the cities from their regional or national economies manifests in the dissociation of the new class of workers engaged in immaterial production from regional lifestyles and prevalent social modes of reproduction” (2011:44).
uRbAn pLAnnIng And gEnTRIfIcATIon A complex role of the state in city development and planning has emerged in recent times. Where, on the one hand, it is considered that state has receded and given way to the private entrepreneur in development of cities, on the other hand, the state is accused of conniving with the private sector in forcible land acquisition and plundering of environmental resources (often around the peripheries of major cities) and granting the status of planning authority to the private sector (as in Lavasa), which was a field of state action till recent years. The
state has also, by various provisions, invigorated corporate actions in gentrification of towns and cities. Thus, one sees three interlinked processes in city making in recent years: (a) rediscovery of city core, (b) expansion of adjacent margins, and (c) development in periphery with environmental advantage.
This corporatisation of cities and city planning results in ‘two-track’ development (Houghton and Williams 1996: xiv), within as well as between cities. Within the cities, some can share the success of the cities while others can be side-lined – displaced, unemployed, under-employed, underpaid, and work in exploitative conditions. These developments as such represent “after-Fordist search for a new sustainable regime for capitalist accumulation” (Houghton 1996:19). In a dominant market economy, the corporate identities help cities to sell themselves effectively to the neo-rich within countries and the global players from other countries.
The new private and smart cities have their own socio-economic implications. The new cities are developed in the image of ‘global economy’ privileging immaterial labour rather than the need of population living in their peripheries.
The towns often unhinge themselves from local, regional, economic and cultural contexts. The land is acquired or brought in control through state actions at various levels including the local civic bodies and municipal corporations. For example, City
POLICY REVIEW
April 2016 Volume 17 No.1- SHELTER | 35
and Industrial Development Corporation (CIDCO) in Navi Mumbai has been appointed as special planning authority for around 10 to 25 km peripheral area of the proposed Navi Mumbai International Airport at Panvel. This means, that for any development or construction in the area, one has to seek CIDCO’s permission. This has started intense land speculation by the private sector and resulted in land scams in which many of the developers are fighting among themselves to control the land and get maximum favour from Navi Mumbai Municipal Corporation and CIDCO3 . Importantly, due to land acquisition, the local agricultural labour and dependent service providers are thrown out to an economy in which their skills become irrelevant. In other words, this set of population become surplus, not effectively integrated with the economy, except offering some menial jobs. In this way, the political economy of urban India manifests subsistence-accumulation duality (Bhattacharya and Sanyal 2011:42). Once the accumulation economy breaks the subsistence economy, the population depending on it becomes surplus and survives on residual resources and menial jobs, like that of housemaids or petty businesses.
These surplus population force themselves into the hugely informalised and segmented labour market, and negotiate with the state to secure conditions for their social reproduction, often outside the bounds of legalities, through ‘political society’4 (Chatterjee 2004, 2008) distant from ‘civil society’
where the demand of aspiration of middle class is often articulated (Bhattacharya and Sanyal 2011:42).
AdvAncE And RETREAT of SuRvIvAL And AccumuLATIon Economy Today’s urban economy in India is a product of advance and retreat of the survival and accumulation circuit of the economy and they chase each other. The intense conflict between the peasantry and associated service class with the capitalist class and local governments is generated in this process of accumulation. Navi Mumbai (Maharashtra), Gugaon (Haryana), NOIDA (Uttar Pradesh), Rajarhat New Town (West Bengal) remain suitable examples in this regard. As such “each new town is born out of a violent, blood stained conflict between the compulsion of accumulation and imperative of subsistence” (Bhattacharya and Sanyal 2011:47) and upper middle class hiding themselves in gated, guarded and defended neighbourhoods. Thus, utopia of new towns and development also generates dystopia -such as pollution, poverty, local societal collapse and political repression.
AccumuLATIon pRocESS AT THE uRbAn pERIpHERIESThere are two prominent circuits of exploitation of people and creation of surplus population along the city margins and peri-urban areas of existing megapolises in India. First, through land acquisition for urban development. This involves the capture and command of the commons used by the rural
communities by the government and growth coalitions. The rural communities lose their land and often lack skill sets, which the formal urban economy needs, land up in informal markets of the slums. Second, the compensation that is provided for the land and other immovables to the rural communities is often spent in conspicuous consumption which these communities are often taught to consume by the city. Often, in a very short time, the money thus received is also transferred by these communities to the mainstream market and capitalist class. This results in pauperisation of self-sufficient rural communities. Lacking effective skills to adapt to the market, almost the generation concerned remains surplus to the urban centres. These changes are well seen in Navi Mumbai. The villages acquired by CIDCO for planning of Navi Mumbai are still struggling to adapt to the economic changes, and many from these villages remain in informal trading of leftover vegetables and fish. Both these circuits work in favour of capitalist class and help in further accumulation through urbanisation and city building processes.
bypASSEd And fLyovER-dEvELopmEnTThe neoliberal development is also characterised by bypassed development, both in literal and symbolic terms. The schemes invented for easing the city transport problems have specifically ignored the social and economic consequences on the marginalised and minority cultural and social groups. It has often been seen
POLICY REVIEW
| HUDCO - HSMI Publication 36
that flyovers and bypasses are constructed to bypass the congested areas of such social groups. This impacts the economy of such areas which have emerged because of the access to transport networks that supported everyday economy of these groups of population. The bazaars and small markets located at transport nodes also provided a point where everyday interaction with the majority and mainstreamed groups took place, helping and supporting the multicultural fabrics and respect for each other. The bypass and flyover development on such areas not only economically deprives the marginalised and cultural ethnic groups but may have larger consequences for the minorities and cultural ethos of cities. It is assumed that meeting and seeing generate more awareness and respects for ‘other’ culture and social groups. However, these bypasses and flyovers essentially reduce and negate such possibilities. Although instances of these are abound, but a suitable example in this regard is about 2.2 km long JJ-Flyover from Byculla to CST station in Mumbai that effectively bypasses the market and community living in this area. The flyover may have brought fast mobility but may compromise the social and cultural diversity, bondage and understanding among communities. The planner must understand that the spatial manipulation must be especially done after clear understanding of their larger social impacts. The alternative strategies must be employed to avoid fly-over and bypass development, as this sort of development only bypasses and flies over the marginalised communities and cultural groups.
STATE-WISE InITIATIvES on pRIvATE ToWnSHIpSThe new town building in India has picked up quite fast. It is estimated that more than 200 new towns ranging hundreds to thousands of acres around the four megapolises, Mumbai, Delhi, Chennai and Kolkata, are being constructed and/or waiting approvals (Joshi 2009). Many states have brought their own specific attractive corporate oriented policies for city development and new towns. The Government of Gujarat (2007) through its Integrated Township Policy, 2007, facilitates development of towns based on information technology, education-base, medical/healthcare, logistics parks and residential etc. The Government of Maharashtra in 2002 has allowed private sector companies to act as ‘planning authority’ devolving the powers that were earlier vested only with the government. The Lavasa township is being built under this provision. In 2005-06, Government of Maharashtra modified the Regional Plan of Mumbai Metropolitan Region and Pune Metropolitan Region to permit special townships on contiguous pockets of land (Government of Maharashtra 2005, 2006). These townships are to be self-sufficient with respect to social and physical infrastructure with the condition that the area should not be less than 40 hectare (100 acre). Such towns are provided 50 per cent stamp duty concession by Government of Maharashtra. In 2009, the Urban Development Department, Government of Maharashtra notified the setting of ‘Megacity’ projects for a contiguous area of 100 hectare. The floor
space index (FSI) for this was set as one. Similar notifications and enactments have been done in other states, such as Rajasthan, West Bengal and Karnataka.
These policies have given way to two types of privatized and corporatized development. (a) private and corporate towns, such as Lavasa, Magarpatta, New Town Rajarhat, Naya Raipur, and many satellite township on peripheries of the megacities, and (b) private or gated colonies/communities. The Second Administrative Reform Commission (SARC) justifies these developments saying, “these townships are an inevitable part of the process of increasing urbanisation and fulfil a need that the public institutions are unable to provide” (2007:306). However, this is also a fact that the development of many new towns and neighbourhoods within and around major mega cities has been stopped due to vibrant ‘political society’ which resist the restructuring of the cities as per the middle and upper class aspirations (Bhattacharya and Sanyal 2011:42).
jnnuRm And SmART cITIES And THEIR nEoLIbERAL conTEnTSSmart city project (Government of India 2014) of the current Central Government (launched in 2014) is now replacing the similar urban development project called Jawaharlal Nehru Urban Renewal Mission (JnNURM). Similar to utopian objectives of smart cities, JnNURM was launched in December 2005 to overcome the so called urban evils - poverty, decay, lack of housing, congestion,
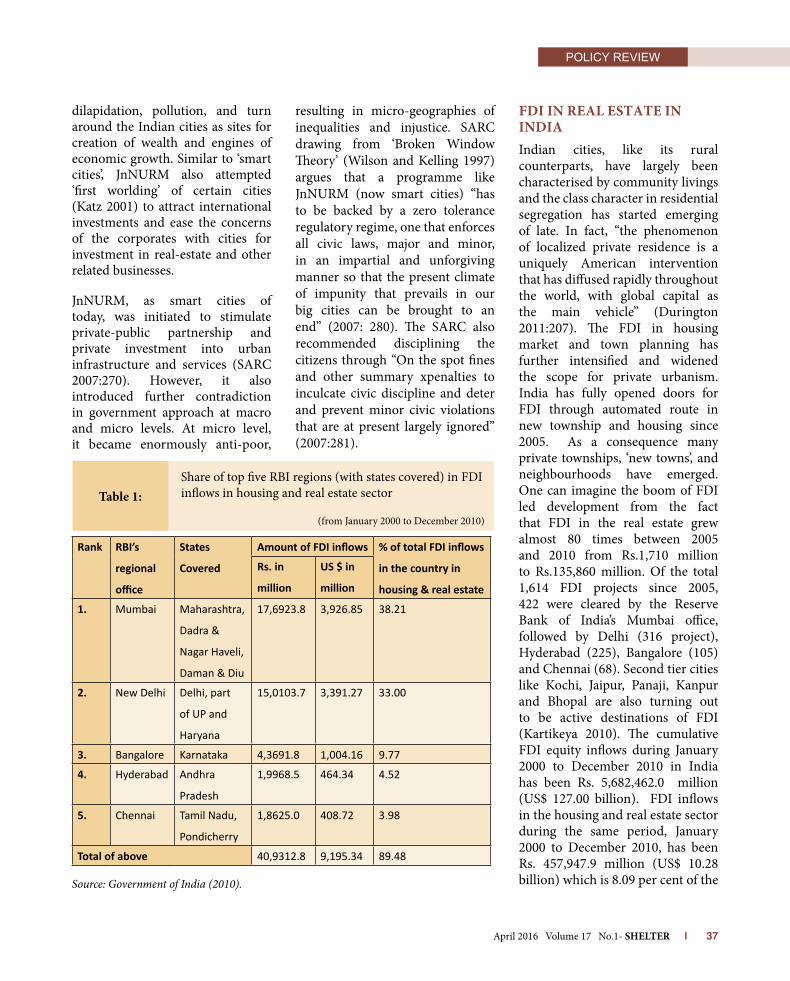
POLICY REVIEW
April 2016 Volume 17 No.1- SHELTER | 37
dilapidation, pollution, and turn around the Indian cities as sites for creation of wealth and engines of economic growth. Similar to ‘smart cities’, JnNURM also attempted ‘first worlding’ of certain cities (Katz 2001) to attract international investments and ease the concerns of the corporates with cities for investment in real-estate and other related businesses.
JnNURM, as smart cities of today, was initiated to stimulate private-public partnership and private investment into urban infrastructure and services (SARC 2007:270). However, it also introduced further contradiction in government approach at macro and micro levels. At micro level, it became enormously anti-poor,
resulting in micro-geographies of inequalities and injustice. SARC drawing from ‘Broken Window Theory’ (Wilson and Kelling 1997) argues that a programme like JnNURM (now smart cities) “has to be backed by a zero tolerance regulatory regime, one that enforces all civic laws, major and minor, in an impartial and unforgiving manner so that the present climate of impunity that prevails in our big cities can be brought to an end” (2007: 280). The SARC also recommended disciplining the citizens through “On the spot fines and other summary xpenalties to inculcate civic discipline and deter and prevent minor civic violations that are at present largely ignored” (2007:281).
fdI In REAL ESTATE In IndIAIndian cities, like its rural counterparts, have largely been characterised by community livings and the class character in residential segregation has started emerging of late. In fact, “the phenomenon of localized private residence is a uniquely American intervention that has diffused rapidly throughout the world, with global capital as the main vehicle” (Durington 2011:207). The FDI in housing market and town planning has further intensified and widened the scope for private urbanism. India has fully opened doors for FDI through automated route in new township and housing since 2005. As a consequence many private townships, ‘new towns’, and neighbourhoods have emerged. One can imagine the boom of FDI led development from the fact that FDI in the real estate grew almost 80 times between 2005 and 2010 from Rs.1,710 million to Rs.135,860 million. Of the total 1,614 FDI projects since 2005, 422 were cleared by the Reserve Bank of India’s Mumbai office, followed by Delhi (316 project), Hyderabad (225), Bangalore (105) and Chennai (68). Second tier cities like Kochi, Jaipur, Panaji, Kanpur and Bhopal are also turning out to be active destinations of FDI (Kartikeya 2010). The cumulative FDI equity inflows during January 2000 to December 2010 in India has been Rs. 5,682,462.0 million (US$ 127.00 billion). FDI inflows in the housing and real estate sector during the same period, January 2000 to December 2010, has been Rs. 457,947.9 million (US$ 10.28 billion) which is 8.09 per cent of the
Rank RBI’s
regional
office
States
Covered
Amount of FDI inflows % of total FDI inflows
in the country in
housing & real estate
Rs. in
million
US $ in
million
1. Mumbai Maharashtra,
Dadra &
Nagar Haveli,
Daman & Diu
17,6923.8 3,926.85 38.21
2. New Delhi Delhi, part
of UP and
Haryana
15,0103.7 3,391.27 33.00
3. Bangalore Karnataka 4,3691.8 1,004.16 9.77
4. Hyderabad Andhra
Pradesh
1,9968.5 464.34 4.52
5. Chennai Tamil Nadu,
Pondicherry
1,8625.0 408.72 3.98
Total of above 40,9312.8 9,195.34 89.48
Source: Government of India (2010).
Share of top five RBI regions (with states covered) in FDI inflows in housing and real estate sector
(from January 2000 to December 2010)
Table 1:

POLICY REVIEW
| HUDCO - HSMI Publication 38
total FDI inflows in the country. In the financial year 2011-12, the FDI inflows to the township, housing, built-up infrastructure sector was Rs. 152,360 million (US $ 3,141 million) (Government of India 2012).
ASSAuLT on And THE poLITIcS of nATuREThe marketization and commodification has led to an enormous assault on natural environment in India in recent years. The ethical environmental concerns have changed to Bourgeois Environmentalism (Baviskar 2002) and ecological modernization- golf courses (over house) and parks. There has been widespread manipulation of nature, especially control of water resources, manipulation of forest land, constructions in coastal zones and plunder of minerals. The vast acquired land has gone to create such modified environments rather than preservation of original environment, flora and fauna or land to for the mass housing. Though tougher laws attempt to promote and safeguard environmental resources, but the market could only promote the grudging respect for nature, resulting in a careless unrolling of the carpet of urbanization over the natural landscape like that in western ghats. This is also leading to air pollution, habitat loss and dangerous encounters between human and other animals, as in Mumbai where expanding frontier of city interferes with animals in the forest and Sanjay Gandhi National Park. The economic view of environment is rising and the
pristine environment destroyed by the development are replaced with modified artificial ones with the amazing concept like ‘biomimicry’, as in Lavasa. With the rise in income, the demand for clean environment is rising but it often is in the nature of demand for reservation of land and protection of nature where poor earn their livelihood or need for their survival. As such, this bourgeoisie environmentalism remains destructive to the survival and wellbeing of the poor and serves the desires of the rich who in their own have destroyed and modified the environment they are settled in.
concLuSIonThe cotemporary urbanism and city making in India is quite distinct from the Fordist urbanism. The urban centres have become sites of creation of private wealth. They exacerbate economic and social distance between their residents that often lead to discrete spatial concentration of rich and the poor. That in turn creates volatile micro-geographies in the cities – the gated, guarded and fortress spaces of the upper classes at the one hand, and the peripheralised informal spatial development of the marginalized on the other hand. The fortress urbanism by the rich is made possible through multiscaler politics and interaction of state and global and local corporates, developers and civil society groups. The new private towns and segregated urban development within existing cities in India are quite prominent developments led by these processes. Globally, the capture and
command instruments have been used by the agentic State to acquire land and resources needed for the new and existing mega cities forcing the peasants and tribals depending on them into urban survival/subsistence economy. India, since early 1990s has come under assault of this form of urbanism and of late these are intensified by the state sponsored programmes like ‘smart cities’, JnNURM, FDI in private townships and real estate, and changes in existing town planning rules. These in turn are creating urban inbeyonds, carceral cities and bypassed development.
noTES1Agentic state is a condition in which governments/states are under the control of someone else (here, powerful western nations, global economic institutions like the World Bank, IMF and WTO, and MNCs including the corporate groups with the country) and obey their order even if that causes distress to their citizens and are against their economic interests.
2Labour that creates immaterial products, such as, knowledge, information, communication, a relationship or emotional response (Hardt and Negri 2004; Bhattacharya and Sanyal 2011:43)
3Sunil Lahoria, a developer in Navi Mumbai was killed on 16 February 2013 by criminalised youth gangs involving one retired police officer allegedly hired by Suresh Bijlani, another developer from the same city (Ali 2013; Rao and Ali 2013). Sunil Lahoria had informed the Navi Mumbai Municipal Corporation and State Government about how various builders were involved in illegal construction (in about 600 illegal buildings) and violation of FSI rules in the city. He had also questioned the role of Navi Mumbai Municipal Corporation and CIDCO which were allowing the illegal constructions to happen (Singh 2013).
4This is not uncommon to see the public land grabs by these section of population and carrying out the informal illegal industrial works through their semi-criminal political
POLICY REVIEW
April 2016 Volume 17 No.1- SHELTER | 39
leaderships and organization. The resistance by such association in Dharavi to the state of Maharashtra and Municipal Corporation of Greater
REfEREncESAli, S. A. (2013): “Navi Mumbai builder murder
case: Two more arrested”, The Times of India, Mumbai, 6 March. Viewed on 13 May 2013 (http://articles.timesofindia.indiatimes.com/2013-03-06/mumbai/37498482_1_navi-mumbai-bui lder-cr ime-branch-absconder).
Banerjee-Guha, Swapna (2008): “Space Relation of Capital and Significance of New Economic Enclaves: SEZs in India”, Economic and Political Weekly, XLIII(47) :51-59.
Banerjee-Gupa, S. (2009): “Neoliberalising the ‘Urban’: New Geographies of Power and Injustice in Indian Cities”, Economic and Political Weekly, XLIV(22): 95-107.
Baviskar, Amita (2002): “The Politics of the City”, Seminar, viewed on 17 February 2013 (http://www.india-seminar.com/2002/516/516%20amita%20baviskar.htm).
Bhattacharya, R. and K. Sanyal (2011): “Bypassing the Squalor: New Towns, Immaterial Labour and Exclusion in Post-colonial Urbanisation”, Economic and Political Weekly, 46(31):41-48.
Blakely, E.J. and M.G. Snyder (1997): Fortress America: Gated Communities in the United States, (Washington D.C.: Brookings Institution Press).
Chatterjee, Partha (2004): The Politics of the Governed (New York: Columbia University Press).
Chatterjee, Partha (2008): “Democracy and Economic Transformation in India”, Economic & Political Weekly, 43 (16): 53-62.
Cladeira, T.P.R. (2000): City of Walls: Crime, Segregation, and Citizenship in São Paulo (Los Angeles: University of California Press).
Durington, M. (2011): “Review Essay – Gated Communities: Perspectives on Privatized Spaces”, International Journal of Urban and Regional Research, 35(1):207-210.
Glasze, G., C. Webster and K. Frantz, ed. (2006): Private Cities: Global and Local Perspectives (Abingdon, Oxon: Routledge).
Government of Gujarat (2007): “Gujarat Integrated Town-ship Policy”, Gujarat Urban Development Company, Gandhinagar, Viewed on 3 August 2013 (http://www.gihed.org/down-load/Township%20Policy%20
Aug% 202007.pdf).
Government of India (2010): “Annual Report 2009-10”, Department of Industrial Policy and Promotion, Ministry of Commerce and Industry, Government of India, New Delhi, Viewed on 26 July 2013 (http://www.dipp.nic.in/English/Publications/SIA_NewsLetter/AnnualReport2010/Chapter6.2.iii.pdf).
Government of India (2012): “Fact Sheet on Foreign Direct Investment”, Department of Industrial Policy and Promotion, Ministry of Commerce and Industry, Government of India, New Delhi., Viewed on 26 July 2013 (http://www.dipp.nic.in/English/Publications/SIA_NewsLetter/AnnualReport2010/Chapter6.2.iii.pdf).
Government of India (2014). Smart City: Mission Statement and Guideline. Ministry of Urban Development, New Delhi
Government of Maharashtra (2005): “Notification no. No. TPS 1804/ Pune R.P.DCR/UD-13 : dated 16/11/2005”, Viewed on 10 December 2012 (http://www.scribd.com/doc/97172813/Township-Policy).
Govt. of Maharashtra (2006): “Notification no. TPS. 1205/MMR DCR/CR-48/06/UD-12 dated 10/3/2006”, Viewed on 10 December 2012 (http://regionalplan-mmrda.org/N-Modifications.pdf).
Hardt, Michael (1999): “Affective Labor”, Boundary, 2, 26 (2): 89-100.
Hardt, Michael and Antonio Negri (2004): Multitude: War and Democracy in the Age of Empire (New York: Penguin)
Houghton, G. (1996): “Local Leedership and Economic Regeneration in Leeds”, in G. Haughton, and Colin C. Williams (eds), Corporate City? Partnership, Participation and Partition in urban development in Leeds (Aldershot, UK: Avebury): 19-40.
Joshi, Ravikant (2009): “Integrated Townships as a Policy Response to Changing Supply and Demand Dynamics of Urban Growth”, in India Infrastructure Report 2009 (New Delhi: Oxford University Press).
Kartikeya (2010): “Real estate FDI up 80 times in five years”, Viewed on 17 January 2013. (http://mobilepaper.timesofindia.com/mobile.aspx?article=yes&pageid=1§id=edid=&2010&pubname=Times+of+India+-+Ahmedabad&edname=&articleid=Ar00101&publabel=TOI)
Katz, Cindi (2001): “Hiding the Target: Social Reproduction in the Privatised Urban Environment” in C. Minca (ed.), Post-modern Geography (London: Basil Blackwell) 93-112.
Keil, Roger (2002): “Common Sense
Neoliberalism: Progressive Conservative Urbanism in Toronto, Canada”, Antipode, 34 (3): 578-601.
Knox, Paul L. (2010): Cities and Design (London: Routledge).
Mckenzie, E. (1994): Privatopia: Homeowner Associations and the Rise of Residential Private Government (New Haven: Yale University Press).
Mckinsey & Company (2010): India’s Urban Awakening: Building Inclusive Cities, Sustaining Economic Growth. New Delhi: McKinsey Global Institute.
Planning Commission (2008): “Eleventh Five Year Plan”, Government of India, New Delhi.
Rao, Y. and S. A. Ali (2013): “Lahoria murder accused Suresh Bijlani surrenders”, The Times of India, Mumbai, 23 July. Viewed on 15 August 2013 (http://articles.timesofindia.indiatimes.com/2013-07-23/mumbai/40748574_1_builder-suresh-bij lani-emmanuel-amolik-venkatesh-shettiar).
SARC (Second Administrative Reform Commission) (2007): Sixth Report -- Local Governance: An Inspiring Journey into Future (Government of India, New Delhi).
Sassen, Saskia (2001): The Global City: New York, London, Tokyo (New Jersey: Princeton University Press).
Sharma, R.N, and A. Shaban (2006): “Metropolitanisation of Indian Economy: Lessons in Urban Development”, The ICFAI Journal of Governance and Public Policy, 1(2): 17-35.
Singh, V. (2013). “Lahoria’s expose of illegal buildings led to murder?”, The Times of India, Mumbai, 10 April. Viewed on 15 August 2013 (http://articles.timesofindia.indiatimes.com/2013-04-10/mumbai/38433304_1_cidco-raigad-palm-beach-road).
Soja, E. (2000): Postmetropolis: Critical Studies of Cities and Regions (Wiley-Blackwell, New York).
Weinstein, Liza (2011): “Democracy in the Globalizing Indian City: Engagements of Political Society and the State in Globalizing Mumbai”, Politics and Society, 37(3): 397-427.
Wilson, J. and G. Kelling (1997): “Broken Windows”, in R Dunham and G Alper (eds), Critical Issues in Policing (Illinoi: Waveland Press) 424-37.
Wirth, Louis (1938): Urbanism as a Way of Life, The American Journal of Sociology, 44(1): 1-24.

POLICY REVIEW
| HUDCO - HSMI Publication 40
Anushree Deb Affordable housing built under the public-private partnership model is facing limited success in achieving its purpose, i.e., reducing the existing urban housing shortage. Lack of physical and social infrastructure, coupled with limited mobility and employment opportunities, add to the existing vulnerabilities of the economically weaker sections of society for whom such housing is being constructed. Current modes of policy formulation, along with the affordable housing policies of various states, continue to promote this model of delivery which enables the use of vacant peripheral land for creating affordable housing stock. In the light of a growing urban housing shortage estimated at 18.78 million units, the viability of such modes of production need to be re-examined. Housing cannot be delinked from mobility and employment as people utilise their dwelling units not just as places to reside but also as spaces to work and generate livelihoods.
urbAn housing shortAge in inDiA According to the Report of the Technical Group on Urban Housing Shortage by the Ministry of Housing and Poverty Alleviation (MoHUPA), 80 per cent of India’s urban housing shortage is in the form of existing but inadequate housing that is also congested (Kundu, 2012). Seen across income categories, it is found that almost 96 per cent of this housing shortage is faced by the economically weaker sections (EWS) and low-
income group (LIG) categories, i.e., households that earn up to two lakhs a year (Fig. 1 & 2). The Ministry also states that, in order to be considered ‘affordable housing’; a housing unit must not cost more than five times the annual income of the household (MoHUPA, 2011). Using this definition, affordable housing for the EWS and LIG is housing that does not cost more than 10 lakhs. Current demand and supply mechanisms of housing do not adhere to these spectrums of affordability1. Housing provided by private developers often ends up catering to the remaining four per cent for whom the housing is affordable and adequate2. Besides the physical unit, the nature of affordable housing cannot be separated from its “location”. Majority parameters while conceptualising affordable housing restrict themselves to the price and affordability of the unit, leaving the question of making such housing viable through adequate physical & social infrastructure and appropriate location unanswered. (JLL, 2012). Low occupancy rates are often an outcome of affordable housing projects that are not cognisant of the needs and vulnerabilities of their intended buyers. Viability in affordable housing is then understood in
VIABILITY OF PUBLIC PRIVATE PARTNERSHIP IN BUILDING AFFORDABLE
HOUSING IN INDIA
Well-located land parcels coupled with financial assistance for land acquisition make Public-Private Partnerships capable of constructing financially viable and resident friendly affordable housing units. As government owned land- whether Central, state or uLb, is serviced land located well within city limits, projects constructed on them become financially viable for the developer and socially viable for future residents.
Ms. Anushree Deb ([email protected]) is Associate (academics & research) with Indian Institute for Human Settlements, Bengaluru.

POLICY REVIEW
April 2016 Volume 17 No.1- SHELTER | 41
terms of distance from place of work, mobility in terms of access to public transport, social and physical infrastructure in the form of schools, medical facilities, electricity, roads and other aspects that make the projects liveable. It is equally important to consider such aspects at the time of project conceptualisation as inability to sell units turns such projects into loss-incurring examples of unprofitable capital investment and underutilised land.
Oversight in understanding and therefore incorrectly addressing the question of housing shortage is not a recent trend but has been exhibited through not only privately-built but also state-provided affordable housing3. EWS and LIG housing built in remote locations with no access to schools, transportation and places of employment often remain unoccupied or have extremely low occupancy rates as residents have
very little to gain by residing in such ‘formal housing’ that has close to little or no services. It is here where questions of location and mobility are paramount in determining the viability of such affordable housing projects.
housing, LoCAtion & MobiLityThe existing spatial distribution of work, housing, recreation, commerce, etc., makes the provision of adequate transport a prerequisite; as its absence leads to development consequences. (Levy, 2013) Affordable housing projects are more often than not developed on peripheral land as high land costs in the core of the city make it financially unviable (Table 1). As seen in Figure 3, many affordable housing projects in Mumbai, NCR and other major cities in India are located almost 65–75 km away from the city centre. (JLL, 2012) This
raises daily commuting costs and other expenditures at the household level. Housing location affects the social and economic lives of individuals and plays an important role in undermining or enhancing their economic capacities. (Moser 1987, cited in (Makaya2006).
According to National Sample Survey Office (NSSO) data, households across urban India spend more on conveyance next to only food; expenditures on rent, education and other requirements being significantly lesser (Refer Table 2). Particularly for the urban poor, such data validates the complex relationship between housing, its location and mobility. In the absence of private means of transport, housing location impacts the mobility of the urban poor. Conversely, mobility is often an important factor while choosing housing location in order to minimise travel time and
Source: Report of the Technical Group on Urban Housing Shortage, MoHUPA 2012
Urban Housing Shortage across Income Categories Urban Housing ShortageFigure 1: Figure 2:
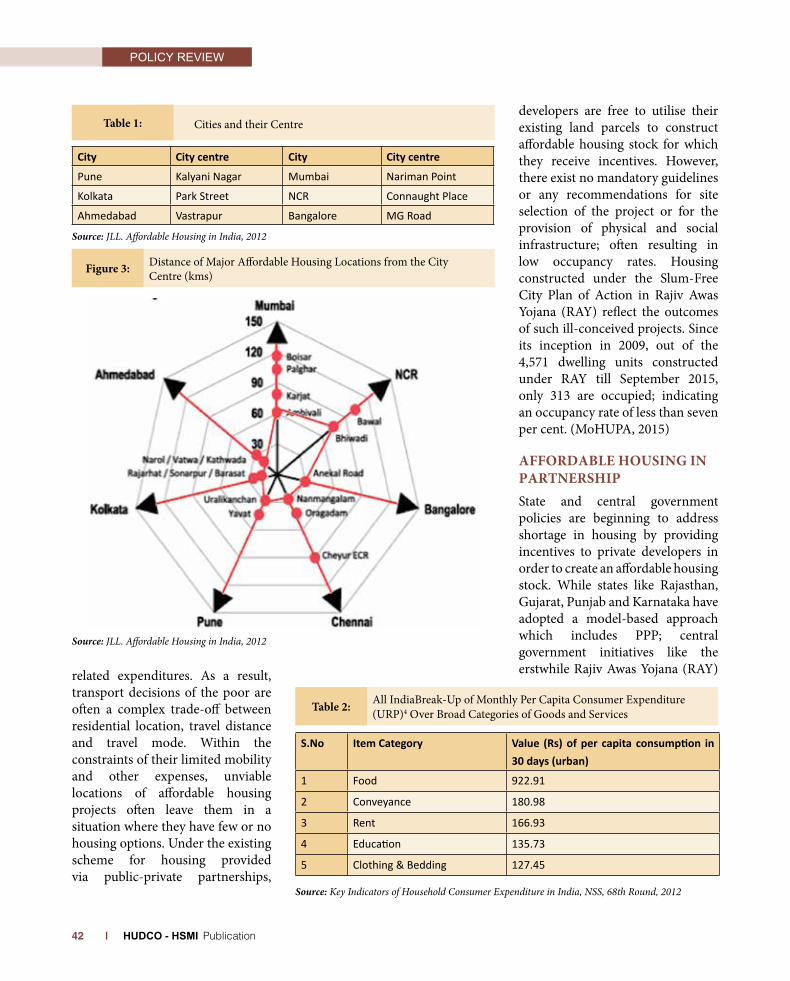
POLICY REVIEW
| HUDCO - HSMI Publication 42
related expenditures. As a result, transport decisions of the poor are often a complex trade-off between residential location, travel distance and travel mode. Within the constraints of their limited mobility and other expenses, unviable locations of affordable housing projects often leave them in a situation where they have few or no housing options. Under the existing scheme for housing provided via public-private partnerships,
developers are free to utilise their existing land parcels to construct affordable housing stock for which they receive incentives. However, there exist no mandatory guidelines or any recommendations for site selection of the project or for the provision of physical and social infrastructure; often resulting in low occupancy rates. Housing constructed under the Slum-Free City Plan of Action in Rajiv Awas Yojana (RAY) reflect the outcomes of such ill-conceived projects. Since its inception in 2009, out of the 4,571 dwelling units constructed under RAY till September 2015, only 313 are occupied; indicating an occupancy rate of less than seven per cent. (MoHUPA, 2015)
AFForDAbLe housing in PArtnershiPState and central government policies are beginning to address shortage in housing by providing incentives to private developers in order to create an affordable housing stock. While states like Rajasthan, Gujarat, Punjab and Karnataka have adopted a model-based approach which includes PPP; central government initiatives like the erstwhile Rajiv Awas Yojana (RAY)
Source: JLL. Affordable Housing in India, 2012
City City centre City City centre
Pune Kalyani Nagar Mumbai Nariman Point
Kolkata Park Street NCR Connaught Place
Ahmedabad Vastrapur Bangalore MG Road
Source: JLL. Affordable Housing in India, 2012
S.No Item Category Value (Rs) of per capita consumption in 30 days (urban)
1 Food 922.91
2 Conveyance 180.98
3 Rent 166.93
4 Education 135.73
5 Clothing & Bedding 127.45
Source: Key Indicators of Household Consumer Expenditure in India, NSS, 68th Round, 2012
Cities and their Centretable 1:
Distance of Major Affordable Housing Locations from the City Centre (kms)Figure 3:
All IndiaBreak-Up of Monthly Per Capita Consumer Expenditure (URP)4 Over Broad Categories of Goods and Servicestable 2:
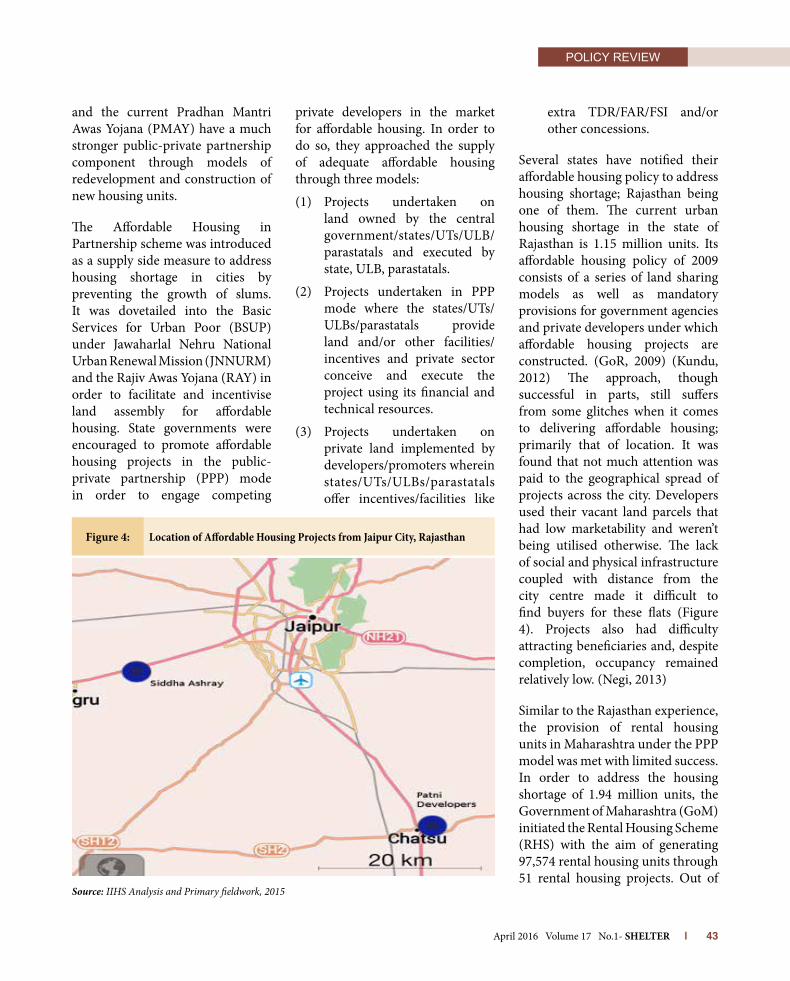
POLICY REVIEW
April 2016 Volume 17 No.1- SHELTER | 43
and the current Pradhan Mantri Awas Yojana (PMAY) have a much stronger public-private partnership component through models of redevelopment and construction of new housing units.
The Affordable Housing in Partnership scheme was introduced as a supply side measure to address housing shortage in cities by preventing the growth of slums. It was dovetailed into the Basic Services for Urban Poor (BSUP) under Jawaharlal Nehru National Urban Renewal Mission (JNNURM) and the Rajiv Awas Yojana (RAY) in order to facilitate and incentivise land assembly for affordable housing. State governments were encouraged to promote affordable housing projects in the public-private partnership (PPP) mode in order to engage competing
private developers in the market for affordable housing. In order to do so, they approached the supply of adequate affordable housing through three models:
(1) Projects undertaken on land owned by the central government/states/UTs/ULB/parastatals and executed by state, ULB, parastatals.
(2) Projects undertaken in PPP mode where the states/UTs/ ULBs/parastatals provide land and/or other facilities/incentives and private sector conceive and execute the project using its financial and technical resources.
(3) Projects undertaken on private land implemented by developers/promoters wherein states/UTs/ULBs/parastatals offer incentives/facilities like
extra TDR/FAR/FSI and/or other concessions.
Several states have notified their affordable housing policy to address housing shortage; Rajasthan being one of them. The current urban housing shortage in the state of Rajasthan is 1.15 million units. Its affordable housing policy of 2009 consists of a series of land sharing models as well as mandatory provisions for government agencies and private developers under which affordable housing projects are constructed. (GoR, 2009) (Kundu, 2012) The approach, though successful in parts, still suffers from some glitches when it comes to delivering affordable housing; primarily that of location. It was found that not much attention was paid to the geographical spread of projects across the city. Developers used their vacant land parcels that had low marketability and weren’t being utilised otherwise. The lack of social and physical infrastructure coupled with distance from the city centre made it difficult to find buyers for these flats (Figure 4). Projects also had difficulty attracting beneficiaries and, despite completion, occupancy remained relatively low. (Negi, 2013)
Similar to the Rajasthan experience, the provision of rental housing units in Maharashtra under the PPP model was met with limited success. In order to address the housing shortage of 1.94 million units, the Government of Maharashtra (GoM) initiated the Rental Housing Scheme (RHS) with the aim of generating 97,574 rental housing units through 51 rental housing projects. Out of
Source: IIHS Analysis and Primary fieldwork, 2015
Location of Affordable Housing Projects from Jaipur City, RajasthanFigure 4:

POLICY REVIEW
| HUDCO - HSMI Publication 44
the 51 projects, 32 were located in Municipal areas, except for Navi Mumbai and Matheran Municipal Council areas, and the remaining 19 were in the Urbanisable Zone-1 and Urbanisable Zone-2 areas of the Mumbai Metropolitan Region. Private developers were offered incentives in the form of FSI in return for providing self-contained tenements of 160/320 sq. ft. carpet area. However, in August 2014, the rental housing scheme was turned into an ‘Affordable Housing Scheme’, where the constructed rental units were sold to beneficiaries. (MMRDA) Several of the units constructed under the Rental Housing Scheme remain unoccupied and are yet to be either sold or allotted to future residents.
Numerous reasons can be attributed for conversion of the rental housing
scheme into an affordable housing project. Rental housing requires access to livelihoods, social and physical infrastructure in the same manner as housing made for ownership. As can be seen in Figure 5, the projects were located far away from the city, requiring several hours of travel to reach respective destinations of work. As majority of the projects were not located even within Navi Mumbai and Matheran corporation limits, it can be inferred that the physical and social infrastructure present would have been inadequate for the number of households planned, if not entirely absent. The FSI/FAR allowed in these projects was too high, resulting in the creation of ‘vertical slums’. No effective rental housing management system was put in place, thereby making the collection of monthly rent and
maintenance of the project highly problematic.
Using appropriately located land parcels with innovative incentives for public agencies as well as private developers can mitigate shortcomings of the PPP model as it is conceived right now. In Kota and Jodhpur, certain models under the Rajasthan State Affordable Housing Policy, 2015 are structured on a 75:25 land sharing basis between the private developer and the government agency. Under such a model, a private developer constructs affordable housing units on 75% of a land parcel that is owned by the Central/State/Local government but is currently vacant and not in use. The remaining 25% of the land is given to the developer to be developed by him for free sale housing units or
Source: MMRDA
Location of Rental Housing Scheme Projects in MMRFigure 5:
POLICY REVIEW
April 2016 Volume 17 No.1- SHELTER | 45
commercial areas. Currently, the Jodhpur Development Authority and the Urban Improvement Trust Kota have successfully constructed about 5,000 affordable housing units under this model that have sustained high occupancy rates since their completion. (GoR, 2009)
International experiences also present successful examples of affordable housing projects financed through PPP models. In Malaysia, the “Wangsa Maju Township, Kuala Lumpur” demonstrates how public-private partnership (PPPs) can enable the urban poor to enter the formal housing market while balancing the commercial priorities of the project. (Aziz, Hani, & Musa, 2007). The 2,000 acre Wangsa Maju Township was designed to accommodate approximately a population of 1, 20,000 people, leading to a total of about 25,970 dwelling units. Located close to the city centre, the township comprised of various types of housing units varying from G+ 5 apartment flats to medium and low-cost integrated housing. A total of 7,791 units of low cost housing were developed initially in the township that today has a population of over 4, 00,000 people, including commercial centres and high end real estate. It is important to note that the City Hall of Kuala Lumpur (CHKL) acquired centrally located land in the city for the project. In the absence of land acquisition by the CHKL, the same project constructed on peripheral land might have yielded different result. Other than the location, the project was also considered successful owing to its mixed income housing that put commercial centres in the midst
of affordable housing. The housing units for the poorer sections were also not segregated from the other housing units constructed. As a result, post occupancy studies of the project have indicated sustained levels of occupancy that have only increased since the completion of the project. (Aziz, Hani, & Musa, 2007).
As can be seen from Malaysia and Rajasthan, well-located land parcels coupled with financial assistance for land acquisition make Public-Private Partnerships capable of constructing financially viable and resident friendly affordable housing units. As government owned land- whether Central, State or ULB, is serviced land located well within city limits, projects constructed on them become financially viable for the developer and socially viable for future residents. Affordable housing units constructed under such a model are more likely to be occupied and retained by the intended target group as residents are able to mitigate potential vulnerabilities through mobility and economic opportunities.
ConCLusion It is not possible to eliminate urban housing shortage completely as market forces coupled with migration and population growth will always leave a certain percentage of the population with housing that is either inadequate or unaffordable. However, it is possible to ensure the formulation of systems and practices that are cognisant of the diverse nature of this housing demand and are capable of adapting themselves to it. It is crucial to intervene at this particular point
in time as several states are either in the process of formulating or are rethinking their approach towards addressing urban housing shortage. Guidelines for affordable housing projects need to be reframed to include incentives not just from the supply side but also for potential future residents. A way to do this is to ensure appropriate site selection for the construction of new housing units as much as possible. In order to mitigate negative externalities, sites proposed for affordable housing projects should not be on terrain that is hazardous or uninhabitable. Proximity to an existing urban settlement, coupled with public transport facilities, should be maintained as it enables employment opportunities. Sites provided with adequate physical infrastructure services such as electricity, water supply and sanitation lines, and social infrastructure in the form of schools and health facilities help in creating liveable conditions that often result in high occupancy rates.
notes1Kailash Babar. 2015. Two-third of Mumbai’s unsold homes over Rs 1 crore, beyond most home-buyers’ reach. The Economic Times. http://economictimes.indiatimes.com/wealth/real-estate/news/two-third-of-mumbais-unsold-homes-over-rs-1-crore-beyond-most-home-buyers-reach/articleshow/49040565.cms
2Sunainaa Chadha. 2015.Average cost of a Mumbai flat is Rs 3.03 cr: Affordable housing remains a myth in India. First Post. http://www.firstpost.com/business/average-cost-of-a-mumbai-flat-is-rs-3-03-cr-affordable-housing-remains-a-myth-in-india-2080551.html
3RuhiBhasin. 2014. Dream home a far cry, allottees still slum it out for EWS houses. The Indian Express. http://indianexpress.com/article/cities/delhi/dream-home-a-far-cry allottees-still-slum-it-out-for-ews-houses/4Uniform Refrence Period

POLICY REVIEW
| HUDCO - HSMI Publication 46
ACKnoWLeDgeMentThe author would like to thank Shri Swastik Harish for his inputs.
reFerenCesAziz, W. N., Hani, N. R., & Musa, Z. N. (2007).
Public-private partnerships approach: A success story in achieving democracy in the home ownership for urban inhabitants in Kuala Lumpur Malaysia. Kuala Lumpur: University of Malaya.
Deb, A. (2014). Urban Housing and Exclusion. In India Exclusion Report (pp. 77-108). Books for Change.
GoI. (2011). Census of India. New Delhi: GoI.
GoR. (2009). Rajasthan State Affordable Housing Policy.
JLL. (2012). Affordable Housing in India.
Kundu, A. (2012). Report of the Technical Group on Urban Housing Shortage (TG-12).
Levy, C. (2013). Travel Choice Reframed:
“Deep Distribution” and Gender in Urban Transport. Environment and Urbanization .
MMRDA. (n.d.). Retrieved August 29, 2015, from https://mmrda.maharashtra.gov.in/rental-housing
MoHUPA. (2011). Guidelines for Affordable Housing in Partnership.
Negi, M. (2013, April). Way forward for PPP in Affordable Housing. Shelter .
Sen, K. M., & Bhan, G. (2008). Swept off the Map. New Delhi: Yoda Press.
The following checklist should be used when preparing an article for submission Please be sure to follow the specifications exactly and completely to ensure that your article is reviewed timely manner and any delays avoided further along in the publishing process should your article be accepted for publication.
1. The paper should be created using a word-processing program (such as Mi-crosoft Word) and should be between 3,000 and 5,000 words in length. The file may be in .docx or .doc format.
2. The paper is typewritten, dou-ble-spaced, and formatted to print on 8.5” x 11” (or A4) size paper. It is writ-ten in the third person in a clear style, free of jargon.
3. The first page of the article includes the following:i. the paper’s title andii. an approximately 200-word ab-
stract that emphasizes the paper’s contribution to the field and its practical architectural/ planning social/ economic implications.
iii. the name(s), position(s), profes-sional or academic affiliation(s), and email address(es) of the au-thor(s), as well as the full postal address of the corresponding au-thor;
4. The body of the paper should include the following:i. an introduction to the subject,ii. background information,iii. discussion of procedure,iv. results,v. conclusions,vi. implications for practice and ad-
vancement of research,vii. references,viii. acknowledgments (optional; if
funding for the research was re-ceived from non-personal sources, the sources must be identified in this section), and
ix. an autobiographical sketch.
5. Please ensure that: i. References are complete, have
been arranged alphabetically by author surname and checked for accuracy.
ii. Reference citations in the text are referred to by author name and year. If there are more than two authors, the name of the first au-thor followed by “, et al.” has been used.
iii. References contain the following information, in the order shown: names of all contributing authors (last name followed by first initial), date of publication, title of article, names of editors (edited books only), title of journal or book, vol-ume and issue numbers (journals only), location and name of pub-
lishing company (books only), and inclusive pages (journals and arti-cles in edited books).
iv. Figures/ pictures/ graphs submit-ted are:a. Large enough to be readable
when reduced to fit the jour-nal page size (approximately 5.25” x 8.25”).
b. A brief caption is provided for each figure/ picture/ graph.
c. The figure is cited in the text.d. Please ensure that scanned
images are of a high resolution to ensure good quality print-ing (not less than 640 x 480)
v. All tables are included either in the original manuscript file or as a separate Microsoft Word docu-ment and have been checked to ensure that they can be easily re-produced on the journal page size approximately 5.25” x 8.25”).a. A brief caption is provided for
each table.b. The table is cited in the text
6. If your paper is accepted for publica-tion, you will be provided with infor-mation on where to send the hard copies of any figures if required.
7. The manuscript and any table/pic-ture files should be sent via email to [email protected]. ONLY origi-nal works neither published nor under review elsewhere will be considered.
GENERAL GUIDELINES FOR SUBMISSIONS OF ARTICLES
POLICY REVIEW
April 2016 Volume 17 No.1- SHELTER | 47
Dr. MAHAVIR SINGH Cities are considered as engines of growth and people want to migrate to cities in search of work, for investment and to enjoy a better quality of life.Employment is generated and wealth is created in cities. Historically, all the developed countries traversed the rural-urban continuum and have reached a plateau in terms of urbanization. The paradigm shift in urban development in India was noticed with the launch of JNNURM whereby urban reforms gained momentum. The new initiative of SCM to build 100 smart cities with core infrastructure would provide decent quality of life to citizens, a clean & sustainable environment through application of smart solutions. However, planning for liveability and affordability of cities with focus on improvement in quality of life would necessarily call for bigger financial assistance from central government and supportive policy prescriptions from the state governments.
INTRODUCTIONIt has been estimated that cities occupy 0.5 per cent of earth’s surface but support 54 per cent of the world population (2014). Cities are considered as engines of growth and it is startling to note that cities contribute towards 80 per cent of global economic output. In Indian context, it is estimated that less than one third of the population living in urban areas (31.16 per cent as per Census 2011) generates more than two third of national GDP. Historically, all the developed countries traversed the rural-urban continuum and have reached a plateau in terms of urbanization. Following this trend, developing
countries are also on the trajectory of urban growth. It is estimated that 93 per cent of urban growth will occur in developing nations, with 80 per cent of urban growth occurring in Asia and Africa. Therefore, the significance of urban development cannot be undermined.
JNNURM – A PARADIGM SHIfT IN URbAN DEVELOPMENT IN INDIAIn line with global trends, India is also undergoing a process of rapid urbanisation with significant growth in the number of cities and towns, resulting in huge pressure on housing and urban infrastructure. The paradigm shift in urban development in India was noticed with the launch of Jawaharlal Nehru National Urban Renewal Mission (JNNURM) on 3rd December, 2005. This mission envisaged an investment of Rupees 1,000 billion over seven years in 65 identified cities. Under JNNURM, focus was on million plus cities, state capitals and cities of historical, tourist and religious importance. The launch of JNNURM has been considered a watershed in the history of urban development whereby urban reforms gained momentum. In fact, funds under JNNURM were predicated on to the cities which entered into a tripartite agreement to undertake reforms in stipulated timelines. Although urban
PLANNING FOR SMART CITIES IN THE INDIAN CONTEXT
Dr. Mahavir Singh, IAS([email protected]) is presently Principal Secretary Civil Aviation Department of Government of Haryana. He has earlier worked as Principal Secretary, Urban Local Bodies in the State and Director, Housing & Urban Development in Planning Commission of India.
for smart cities to become a reality in India, some emerging issues need to be addressed. The major issues are scaling-up of unproven newer technologies, limited technological capability in the city, ability of city managers to adapt and huge financial requirement for converting existing cities into smart cities.
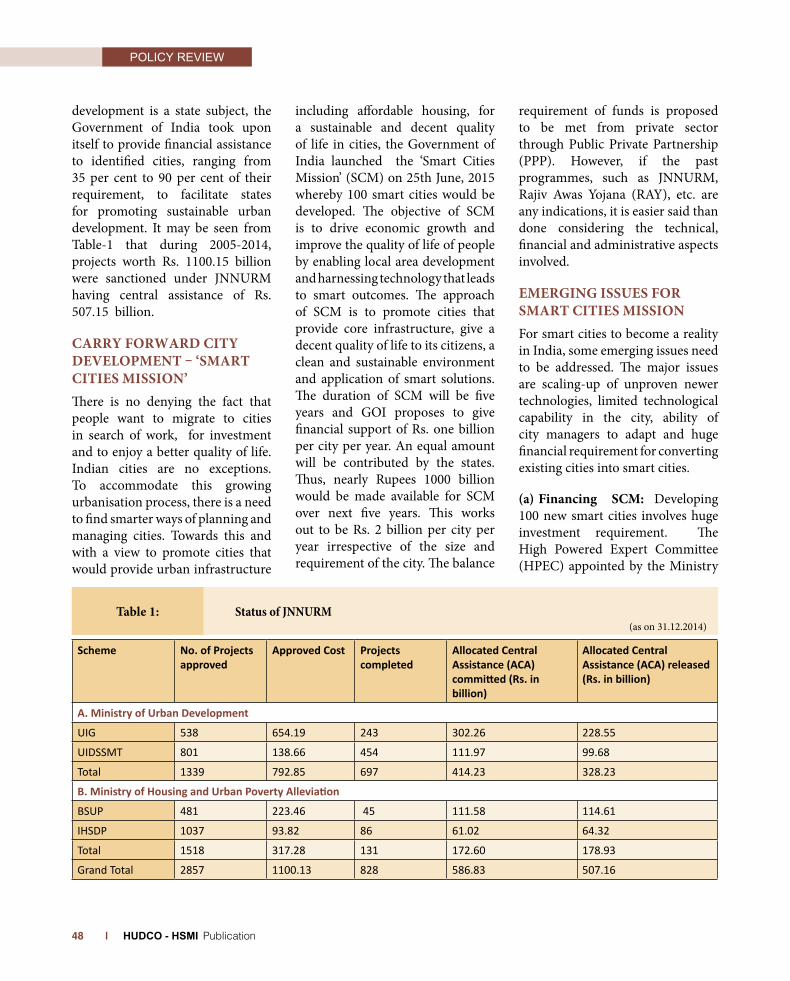
POLICY REVIEW
| HUDCO - HSMI Publication 48
development is a state subject, the Government of India took upon itself to provide financial assistance to identified cities, ranging from 35 per cent to 90 per cent of their requirement, to facilitate states for promoting sustainable urban development. It may be seen from Table-1 that during 2005-2014, projects worth Rs. 1100.15 billion were sanctioned under JNNURM having central assistance of Rs. 507.15 billion.
CARRy fORwARD CITy DEVELOPMENT – ‘SMART CITIES MISSION’There is no denying the fact that people want to migrate to cities in search of work, for investment and to enjoy a better quality of life. Indian cities are no exceptions. To accommodate this growing urbanisation process, there is a need to find smarter ways of planning and managing cities. Towards this and with a view to promote cities that would provide urban infrastructure
including affordable housing, for a sustainable and decent quality of life in cities, the Government of India launched the ‘Smart Cities Mission’ (SCM) on 25th June, 2015 whereby 100 smart cities would be developed. The objective of SCM is to drive economic growth and improve the quality of life of people by enabling local area development and harnessing technology that leads to smart outcomes. The approach of SCM is to promote cities that provide core infrastructure, give a decent quality of life to its citizens, a clean and sustainable environment and application of smart solutions. The duration of SCM will be five years and GOI proposes to give financial support of Rs. one billion per city per year. An equal amount will be contributed by the states. Thus, nearly Rupees 1000 billion would be made available for SCM over next five years. This works out to be Rs. 2 billion per city per year irrespective of the size and requirement of the city. The balance
requirement of funds is proposed to be met from private sector through Public Private Partnership (PPP). However, if the past programmes, such as JNNURM, Rajiv Awas Yojana (RAY), etc. are any indications, it is easier said than done considering the technical, financial and administrative aspects involved.
EMERGING ISSUES fOR SMART CITIES MISSIONFor smart cities to become a reality in India, some emerging issues need to be addressed. The major issues are scaling-up of unproven newer technologies, limited technological capability in the city, ability of city managers to adapt and huge financial requirement for converting existing cities into smart cities.
(a) financing SCM: Developing 100 new smart cities involves huge investment requirement. The High Powered Expert Committee (HPEC) appointed by the Ministry
Scheme No. of Projects approved
Approved Cost Projects completed
Allocated Central Assistance (ACA) committed (Rs. in billion)
Allocated Central Assistance (ACA) released (Rs. in billion)
A. Ministry of Urban Development
UIG 538 654.19 243 302.26 228.55
UIDSSMT 801 138.66 454 111.97 99.68
Total 1339 792.85 697 414.23 328.23
B. Ministry of Housing and Urban Poverty Alleviation
BSUP 481 223.46 45 111.58 114.61
IHSDP 1037 93.82 86 61.02 64.32
Total 1518 317.28 131 172.60 178.93
Grand Total 2857 1100.13 828 586.83 507.16
Status of JNNURM (as on 31.12.2014)
Table 1:

POLICY REVIEW
April 2016 Volume 17 No.1- SHELTER | 49
of Urban Development, which gave its recommendations in the year 2011, estimated an investment in urban infrastructure to the tune of Rupees 39200 billion at 2009-2010 prices over next 20 years. This comprises 44 per cent investment for urban roads, 20 per cent for water, sewerage, solid waste management, storm water drains & streetlights, 14 per cent for transport & traffic related infrastructure, 10.5 per cent for urban renewal including redevelopment of slums and 2.5 per cent for capacity building & urban governance. Surprisingly, urban roads which constituted 44 per cent of the requirements as per HPEC estimates, have been excluded from the purview of SCM.
While under JNNURM, funds were predicated on to those cities which were willing to undertake urban reforms, no such restriction has been proposed under SCM. It would be very difficult to enlist private sector participation without urban reforms. In this background, proposed funding may not be sufficient attraction for cities. In fact, one of the major drawbacks of JNNURM has been the poor response of private sector. It is also a common observation that private sector has been engaging itself in green-field projects and shying away from brown-field projects of urban redevelopment. However, urban development in Indian context can’t be accomplished without focus on redevelopment of core areas of cities where laying of infrastructure is not only difficult but also expensive. Development of periphery or the peri-urban area is not that difficult keeping in view the
possibility of better returns even if developed by Urban Local Bodies (ULB) themselves.
(b) Incentivizing Private Sector Involvement: Though the Government of India is banking upon the private sector for financing a large part of this investment requirement, it is not clear how incentives can be earmarked for the private sector to venture into smart cities projects without obvious tangible benefits. To enlist the support of private sector, we need to create an enabling environment focusing on urban reforms. The states must come out with policies on rental housing and affordable housing with in-built mechanism for providing land through innovative land pooling schemes, additional Floor Area Ratio (FAR), fast track approvals and low licensing and other levies. However, leaning heavily on private sector would not be pragmatic because private sector works on the principle where ‘profit is maximised’ while the ‘welfare is marginalised’. In PPP model, it has been observed that cost is socialised but the profit is privatised.
(c) Accommodating Migrant Population: Though India’s pace of urbanisation is slow yet rural urban migration has played a key role in the urbanisation process. Migration of people from rural to urban areas in search of employment, adds pressure on the existing urban infrastructure in cities which is already bursting at its seams. This incremental pressure would entail additional investment especially in the housing sector. The first and foremost requirement of people
moving into cities, is housing and it is appalling to note that none of the cities in India is capable of providing rental housing to the migrating people. International experiences have shown that rental housing can be an effective tool for addressing the shelter needs of all categories of people, especially migrant population, provided some of the key issues like financial viability of rental housing (due to low or frozen rents, increasing costs etc.) and legal framework (like rent control laws) are addressed effectively.
(d) Meeting the Housing shortage: At the beginning of the Twelfth Five Year Plan, the housing shortage was estimated to be 18.78 million units, 96 per cent of which pertains to households falling in the Economically Weaker Sections (EWS) and Lower Income Group (LIG) segments. Strangely, majority of housing schemes floated by banks, housing boards and housing finance companies cater to the needs of the Middle Income Group (MIG) and above, purely on account of better returns. Housing and Urban Development Corporation Ltd. (HUDCO) is the only housing finance institution which is promoting housing finance to EWS and LIG category at subsidized interest rates. Of the total housing units supported by HUDCO, more than 94 per cent belong to EWS and LIG category.
(e) Harnessing enormous potential of Digitalisation for ‘Smart Cities’: Since one has to develop quite a number of technologies in the area of wireless and fixed communications networks for smart
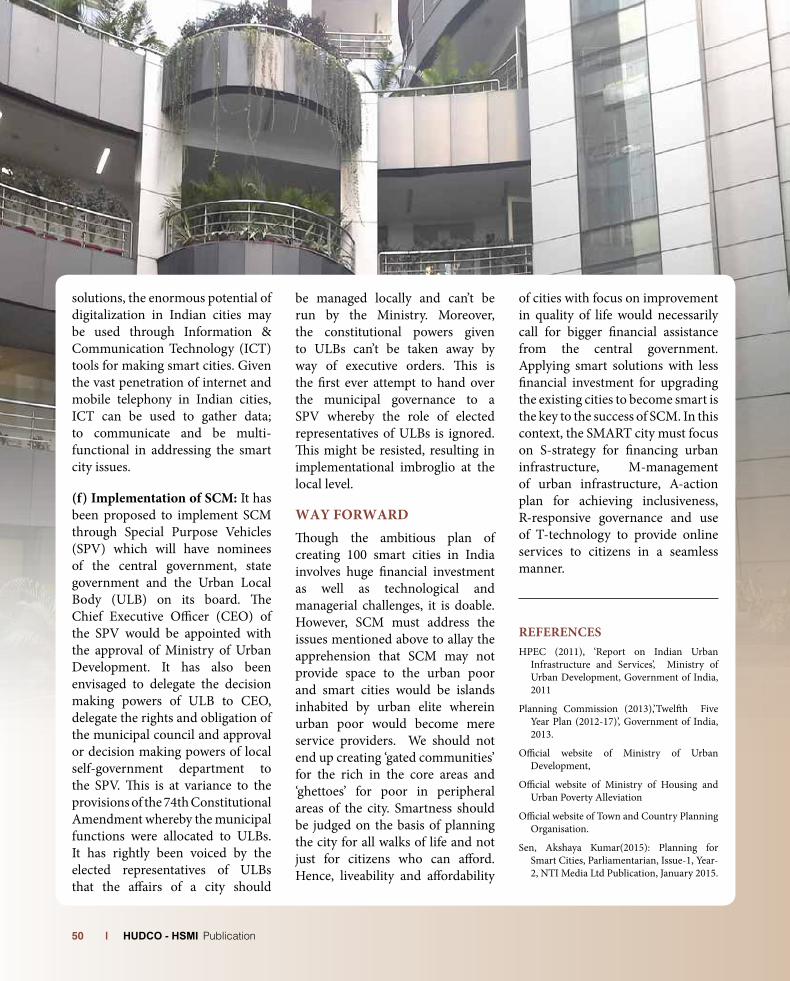
POLICY REVIEW
| HUDCO - HSMI Publication 50
solutions, the enormous potential of digitalization in Indian cities may be used through Information & Communication Technology (ICT) tools for making smart cities. Given the vast penetration of internet and mobile telephony in Indian cities, ICT can be used to gather data; to communicate and be multi-functional in addressing the smart city issues.
(f) Implementation of SCM: It has been proposed to implement SCM through Special Purpose Vehicles (SPV) which will have nominees of the central government, state government and the Urban Local Body (ULB) on its board. The Chief Executive Officer (CEO) of the SPV would be appointed with the approval of Ministry of Urban Development. It has also been envisaged to delegate the decision making powers of ULB to CEO, delegate the rights and obligation of the municipal council and approval or decision making powers of local self-government department to the SPV. This is at variance to the provisions of the 74th Constitutional Amendment whereby the municipal functions were allocated to ULBs. It has rightly been voiced by the elected representatives of ULBs that the affairs of a city should
be managed locally and can’t be run by the Ministry. Moreover, the constitutional powers given to ULBs can’t be taken away by way of executive orders. This is the first ever attempt to hand over the municipal governance to a SPV whereby the role of elected representatives of ULBs is ignored. This might be resisted, resulting in implementational imbroglio at the local level.
wAy fORwARDThough the ambitious plan of creating 100 smart cities in India involves huge financial investment as well as technological and managerial challenges, it is doable. However, SCM must address the issues mentioned above to allay the apprehension that SCM may not provide space to the urban poor and smart cities would be islands inhabited by urban elite wherein urban poor would become mere service providers. We should not end up creating ‘gated communities’ for the rich in the core areas and ‘ghettoes’ for poor in peripheral areas of the city. Smartness should be judged on the basis of planning the city for all walks of life and not just for citizens who can afford. Hence, liveability and affordability
of cities with focus on improvement in quality of life would necessarily call for bigger financial assistance from the central government. Applying smart solutions with less financial investment for upgrading the existing cities to become smart is the key to the success of SCM. In this context, the SMART city must focus on S-strategy for financing urban infrastructure, M-management of urban infrastructure, A-action plan for achieving inclusiveness, R-responsive governance and use of T-technology to provide online services to citizens in a seamless manner.
REfERENCESHPEC (2011), ‘Report on Indian Urban
Infrastructure and Services’, Ministry of Urban Development, Government of India, 2011
Planning Commission (2013),’Twelfth Five Year Plan (2012-17)’, Government of India, 2013.
Official website of Ministry of Urban Development,
Official website of Ministry of Housing and Urban Poverty Alleviation
Official website of Town and Country Planning Organisation.
Sen, Akshaya Kumar(2015): Planning for Smart Cities, Parliamentarian, Issue-1, Year-2, NTI Media Ltd Publication, January 2015.

CASE STUDY
April 2016 Volume 17 No.1- SHELTER | 51
Soft System Methodology (SSM) is conceived as an all-purpose approach of tackling complex problem situations and experiential learning. It uses systems modelling to structure thinking process. It is a multipurpose and flexible methodology and therefore has been interpreted in a variety of ways in different fields. In the present article, the soft systems framework has been utilized for analysing problems in the field of affordable housing.
With the help of a case study, the article has explored problems associated with implementation of governmental housing project for urban poor and has used the SSM framework to break down a complex and unstructured problem situation of housing project. The article shows that the issues associated with the problems of governmental housing project are dealing with qualitative data, besides quantitative data. The article provides illustrations of views and experiences of major players who are involved in the process and also explores issues and constraints faced by different players in implementing the housing project and logical steps to be followed in formulating similar housing projects.
InTRoducTIonImplementation of housing projects are associated with many problems and problem issues are difficult to be defined as they involve many stakeholders like owners/providers, users/beneficiaries etc. playing roles due to having varying interests to take part in the projects. Housing problems have different aspects like social,
political, cultural, strategic etc. Generally, quantitative approaches are applied to understand issues of housing based on Hard System Methodology (HSM) which assesses quantitative data and has limitation to assess subjective/qualitative issues connected to real life problems of housing. “Hard System” approaches involve selection of an appropriate means to achieve an end which is defined at the start. In real world, problems are neither straightforward nor inseparable from the situations and many complex problems cannot be solved using these hard methods (Davies L & Ledington P 1991, Information in Action: Soft Systems Methodology) .
In analysing and explaining issues, there is a need for better understanding of the problem situation by using suitable methodology. The key objective is to take a holistic view of the situation, learning and understanding the situation. The inadequacies of the hard systems approach to address problems having subjective/messy/i l l-posed/il l-structured problem issues i.e. qualitative and non-deterministic, led to seeking for ‘flexible’ models - in other words ‘soft models’. Soft System Methodology (SSM), published by
APPLICABILITY OF SOFT SYSTEM METHODOLOGY IN PROBLEM ANALYSING IN THE FIELD OF AFFORDABLE HOUSING
Ms. Sukanya Ghosh ([email protected]) is Dy. Gen-eral Manager (Projects) at HuDco Regional office, Ranchi & Doctoral Fellow at Department of Architecture Indian Institute of Engineering Sci-ence & Technology, (IIEST) ShibpurDr. Souvanic Roy is Professor at De-partment of Architecture, IIESTDr. Manas Kumar Sanyal is Professor at Department of Human Resource Management, IIEST.
Soft System Methodology tries to involve the problem owners - stakeholders, decision makers etc. in the analysis and work across the boundaries of stakeholders involving all of them within the system. So SSM would help to analyse the problems being in close contact with problem owners which would help to find out problem issues of housing projects.
Sukanya GHoSHSouvanIc RoyManaS kuMaR SanyaL
Keywords : Hard System Methodology (HSM), Soft System Methodology (SSM) and Affordable Housing

CASE STUDY
| HUDCO - HSMI Publication 52
Peter checkland in 1981 is a system approach that is used for analysis and problem solving in complex situations (checkland 1981 , 1985a , 1985b ,1988 , 1997 , 2000a , 2000b and 2000c ).
SSM uses “system thinking” in a cycle of action research, learning and reflection to understand the various perceptions that exist in the minds of different people involved in the situation. SSM offers guidelines and set of tools that can be used to understand complex problem situations. SSM is a process of learning and enquiry and refines the problems in an iterative manner and better refines the complex problem statement.
Broadly, in the SSM model, there are various stages which are to be dealt with sequentially and there is a line separating the “real world” from the “systems world”. The “real world” is the world where the problem is occurring and human activities take place. The “systems world” analyses context in which the information from the real world is scrutinised and dissected in the problem understanding process. Though SSM comprises of seven sequential stages as in Figure-1, applicability of all the stages is not necessarily included in a particular problem understanding situation.
Following are the features in general that strengthen the use of SSM in analyzing housing problems:
• SSM offers guidelines/framework and a set of tools to be used in analysing various situations as each housing project is unique and complex.
• Problems associated withhousing are dynamic as they change over time from formulation of housing projects to completion of projects and are never static and SSM addresses the dynamic situation.
• SSM analyses qualitative andsubjective data to interpret people’s ideas and preferences.
• The various perceptions thatexist in the minds of the different people/players involved in the situations can be expressed through the framework of SSM.
SSM as a Tool to understand Problems of Housing ProjectsA number of reasonable assumptions described below, strengthen the use of SSM aspects and techniques towards conceptualizing problems of housing projects and experiential learning:- First, problems related to housing projects are not generally well-defined that can be clearly solved.
Rather, they are faced with situations that are unique, complex, dynamic and having social, political and cultural issues. Moreover, the situations consist of changing events and ideas which unfold through time.
Second, problems include questions such as “What is to be done?”, “How should it operate?”, “Who would be the beneficiary?”, “Where should it head?” etc.
Third, effective problem solving requires a group of players within the systems to work together to generate ideas and reach solutions accommodating everyone’s interest.
The above assumptions ensure use of SSM to understand issues of housing projects as SSM would make best use of the in-depth first-hand knowledge of the problem. SSM would provide a structured way of identifying and capturing different points of view.
Seven Stages of SSMFigure 1:
CASE STUDY
April 2016 Volume 17 No.1- SHELTER | 53
Major aspects of SSM and its applicability in understanding Problems in Housing ProjectsMajor aspects of SSM which can be applicable to understand problems related to housing projects are summarized below:
Human activity Systems As mentioned by Khisty, c.J.(1995:91), SSM can be applied to problems concerned with rational intervention in human activity systems, where decision making entails dealing not only with planning and engineering elements but also with political and social entities. Housing projects have to address various issues due to involvement of large number of stakeholders, as an outcome of its linkages with varied human activities. SSM acknowledges that every situation is a human situation. People are attempting to take ‘purposeful activities’ which are meaningful for them. `Human activity systems’ are sets of linked activities. SSM analyses human activities as systems and address the whole situation and not just the specific problem. SSM has holistic and systemic approach to address problems. Given the complexity of housing projects, a number of human activity system models could be built by exploring the problem situation.
Learning SystemSSM models ‘purposeful activities’ proposed for exploring actual (real-world) situations. While modelling, many interpretations of any declared ̀ purpose’ is possible. There will be a huge number of human activity system models which could
be built. So the first choice is to explore towards the most relevant problem situation. After that choice is made, it is necessary to decide for each selected purposeful activity, the perspective or viewpoint from which the model will be built. The methodology is essentially a learning system.
Holistic System SSM encourages the process of iteration and repeating stages as much as necessary. The initial choice of the first handful of models, when put to the real situation, leads to new knowledge and insights concerning the problem situation. This leading to further ideas for relevant models and as such it is made clear that the learning process is principally on-going. Instead of approaching problems with pre-determined goals, SSM could help to grasp problem situation of housing projects as holistic as possible.
Participatory System SSM tries to involve the problem owners - stakeholders, decision makers etc. in the analysis and work across the boundaries of stakeholders involving all of them within the system. So, SSM would help to analyse the problems being in close contact with problem owners which would help to find out problem issues of housing projects.
a caSE STudy vaMBay Scheme at Nonadanga, Kolkata Municipal Corporation, West BengalThis paper analyses a case from the perspective of providing affordable housing to urban poor under governmental housing programme
namely Valmiki Ambedkar Awas Yojana (VAMBAY). The study identifies certain problems from the perspective of urban poor and the governmental institutions in case of Affordable Housing Project (AHP).
vaMBayThe Valmiki Ambedkar Awas Yojana (VAMBAY), launched during the financial year 2001-2002 by government of India, aimed at providing subsidies for construction/upgradation of housing and sanitation for urban slum dwellers living Below Poverty Line (BPL)1 in different towns/cities all over India. The objective of VAMBAY was primarily to provide affordable shelter or upgrade the existing shelter for BPL people in urban slums, with a view to achieve the goal of “Shelter for All” by government of India. The construction of VAMBAY house was for a housing unit of an area of not less than 15 square metre, inclusive of provision for sanitary latrine. 50 per cent cost of the housing unit was to be met through government of India subsidy and the remaining 50 per cent either through grant from state governments or loan. As per the VAMBAY guidelines, the target group included all slum dwellers falling under BPL category in urban areas, who did not possess adequate shelter.
Pre-implementation Scenario
kolkata Metropolitan area and kolkata Municipal corporation
Kolkata Metropolitan Area (KMA), the largest urban agglomeration in eastern India, extends over 1886.67
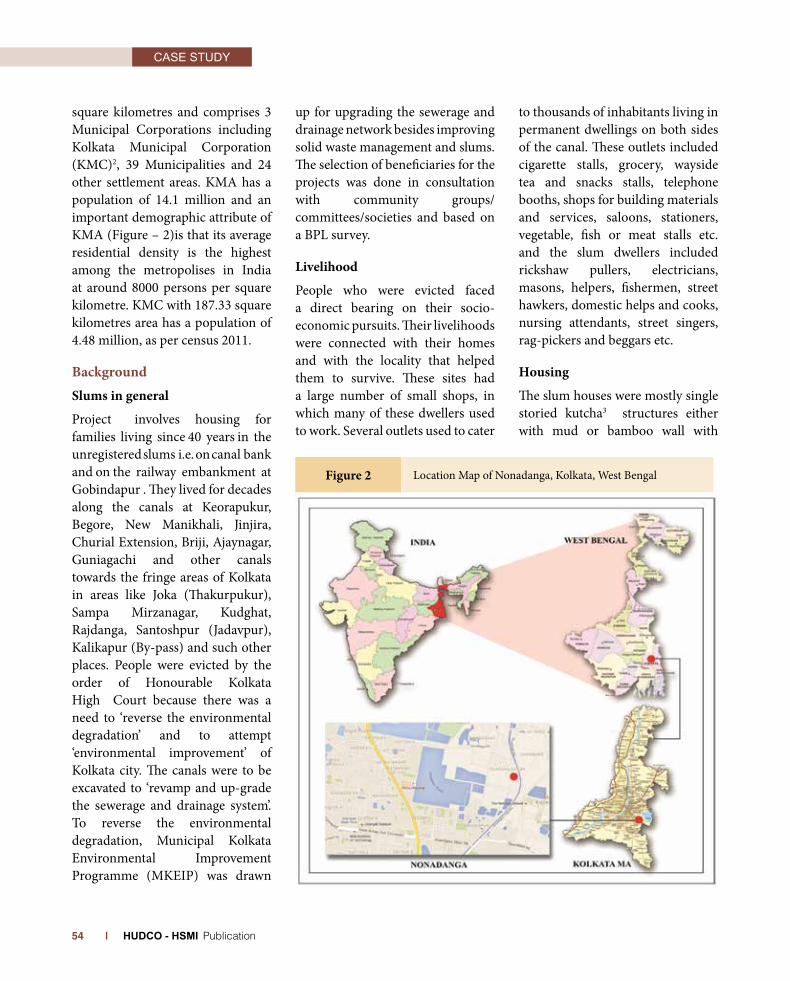
CASE STUDY
| HUDCO - HSMI Publication 54
square kilometres and comprises 3 Municipal corporations including Kolkata Municipal corporation (KMc)2, 39 Municipalities and 24 other settlement areas. KMA has a population of 14.1 million and an important demographic attribute of KMA (Figure – 2)is that its average residential density is the highest among the metropolises in India at around 8000 persons per square kilometre. KMc with 187.33 square kilometres area has a population of 4.48 million, as per census 2011.
BackgroundSlums in general
Project involves housing for families living since 40 years in the unregistered slums i.e. on canal bank and on the railway embankment at Gobindapur . They lived for decades along the canals at Keorapukur, Begore, New Manikhali, Jinjira, churial Extension, Briji, Ajaynagar, Guniagachi and other canals towards the fringe areas of Kolkata in areas like Joka (Thakurpukur), Sampa Mirzanagar, Kudghat, Rajdanga, Santoshpur (Jadavpur), Kalikapur (By-pass) and such other places. People were evicted by the order of Honourable Kolkata High court because there was a need to ‘reverse the environmental degradation’ and to attempt ‘environmental improvement’ of Kolkata city. The canals were to be excavated to ‘revamp and up-grade the sewerage and drainage system’. To reverse the environmental degradation, Municipal Kolkata Environmental Improvement Programme (MKEIP) was drawn
up for upgrading the sewerage and drainage network besides improving solid waste management and slums. The selection of beneficiaries for the projects was done in consultation with community groups/committees/societies and based on a BPL survey.
Livelihood
People who were evicted faced a direct bearing on their socio-economic pursuits. Their livelihoods were connected with their homes and with the locality that helped them to survive. These sites had a large number of small shops, in which many of these dwellers used to work. Several outlets used to cater
to thousands of inhabitants living in permanent dwellings on both sides of the canal. These outlets included cigarette stalls, grocery, wayside tea and snacks stalls, telephone booths, shops for building materials and services, saloons, stationers, vegetable, fish or meat stalls etc. and the slum dwellers included rickshaw pullers, electricians, masons, helpers, fishermen, street hawkers, domestic helps and cooks, nursing attendants, street singers, rag-pickers and beggars etc.
Housing
The slum houses were mostly single storied kutcha3 structures either with mud or bamboo wall with
Figure 2 Location Map of Nonadanga, Kolkata, West Bengal
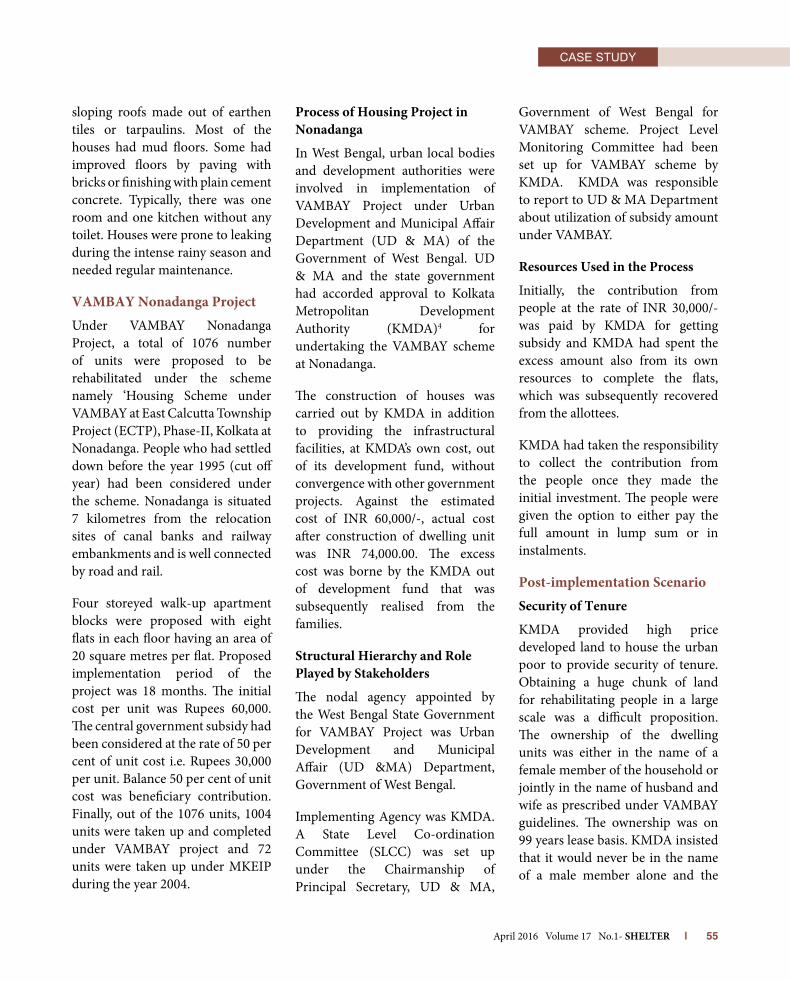
CASE STUDY
April 2016 Volume 17 No.1- SHELTER | 55
sloping roofs made out of earthen tiles or tarpaulins. Most of the houses had mud floors. Some had improved floors by paving with bricks or finishing with plain cement concrete. Typically, there was one room and one kitchen without any toilet. Houses were prone to leaking during the intense rainy season and needed regular maintenance.
vaMBay nonadanga Project
under VAMBAY Nonadanga Project, a total of 1076 number of units were proposed to be rehabilitated under the scheme namely ‘Housing Scheme under VAMBAY at East calcutta Township Project (EcTP), Phase-II, Kolkata at Nonadanga. People who had settled down before the year 1995 (cut off year) had been considered under the scheme. Nonadanga is situated 7 kilometres from the relocation sites of canal banks and railway embankments and is well connected by road and rail.
Four storeyed walk-up apartment blocks were proposed with eight flats in each floor having an area of 20 square metres per flat. Proposed implementation period of the project was 18 months. The initial cost per unit was Rupees 60,000. The central government subsidy had been considered at the rate of 50 per cent of unit cost i.e. Rupees 30,000 per unit. Balance 50 per cent of unit cost was beneficiary contribution. Finally, out of the 1076 units, 1004 units were taken up and completed under VAMBAY project and 72 units were taken up under MKEIP during the year 2004.
Process of Housing Project in nonadanga
In West Bengal, urban local bodies and development authorities were involved in implementation of VAMBAY Project under urban Development and Municipal Affair Department (uD & MA) of the Government of West Bengal. uD & MA and the state government had accorded approval to Kolkata Metropolitan Development Authority (KMDA)4 for undertaking the VAMBAY scheme at Nonadanga.
The construction of houses was carried out by KMDA in addition to providing the infrastructural facilities, at KMDA’s own cost, out of its development fund, without convergence with other government projects. Against the estimated cost of INR 60,000/-, actual cost after construction of dwelling unit was INR 74,000.00. The excess cost was borne by the KMDA out of development fund that was subsequently realised from the families.
Structural Hierarchy and Role Played by Stakeholders
The nodal agency appointed by the West Bengal State Government for VAMBAY Project was urban Development and Municipal Affair (uD &MA) Department, Government of West Bengal.
Implementing Agency was KMDA. A State Level co-ordination committee (SLcc) was set up under the chairmanship of Principal Secretary, uD & MA,
Government of West Bengal for VAMBAY scheme. Project Level Monitoring committee had been set up for VAMBAY scheme by KMDA. KMDA was responsible to report to uD & MA Department about utilization of subsidy amount under VAMBAY.
Resources used in the Process
Initially, the contribution from people at the rate of INR 30,000/- was paid by KMDA for getting subsidy and KMDA had spent the excess amount also from its own resources to complete the flats, which was subsequently recovered from the allottees.
KMDA had taken the responsibility to collect the contribution from the people once they made the initial investment. The people were given the option to either pay the full amount in lump sum or in instalments.
Post-implementation ScenarioSecurity of Tenure
KMDA provided high price developed land to house the urban poor to provide security of tenure. obtaining a huge chunk of land for rehabilitating people in a large scale was a difficult proposition. The ownership of the dwelling units was either in the name of a female member of the household or jointly in the name of husband and wife as prescribed under VAMBAY guidelines. The ownership was on 99 years lease basis. KMDA insisted that it would never be in the name of a male member alone and the

CASE STUDY
| HUDCO - HSMI Publication 56
documents would be transferred only after the beneficiaries made the full payment. Even though in normal course, a leasehold property cannot be sold, KMDA anticipated that transfer of property cannot be resisted. KMDA also insisted on forming housing co-operatives of owners to play a proactive role in ensuring that the families do not sell their units to outsiders.
Housing and InfrastructureThe buildings were four-storeyed, with each floor having eight flats. Each flat had one room which was 5 metres x 3 metres. There was a 2 metres x 1 metre balcony and a toilet. The room height was 3 metres. The flats had electric connections with separate meters and water connection. Notably, there was no separate kitchen in the unit. Each building had an overhead tank on the terrace and a few blocks together had a water pump. External infrastructure like roads, drainage, water supply, sanitation etc. had been provided by KMDA at its own cost from their development fund. Later, balconies had been converted into kitchens by the residents and in ground floor houses, people had
converted balconies into shops. As there was no grill, people had to arrange for grills for safety of the kids.
Issues, conflicts/constraints EmergedKMDA tried to implement VAMBAY project with a target of completing maximum no. of units with basic facilities like water supply, sanitation, road, drainage, electricity etc. so that people could be rehabilitated. The aim was to provide security of tenure to all households taken up under the project. KMDA also formed housing co-operatives by the affected families for operation and maintenance of flats, after handing over the individual units with infrastructure within their premises.
The people were repeatedly told by KMDA that they had got a chance of getting flats instead of their ‘illegal tenure’ and if they did not cooperate, they would be forcibly evicted. They were told that they could obtain ‘legal ownership’ only if they accepted the resettlement scheme being offered to them. So people had no option but to accept the project. They preferred the project with provision of security of tenure. They expected improvements like pucca5 houses, paved streets, water supply, drains and streetlights.
But the project was unaffordable for many poor families. People below poverty level could not avail the project as they could not arrange for their contribution. Government subsidy amount was considered inadequate to attract
beneficiaries. In general, people did not have regular income to repay instalments of loan and hence could not avail finance from any financial institution. only families who could afford to pay the balance were allotted units under the project. Hence target achievement and beneficiary contribution became the primary criteria for allocation.
KMDA thought that unit cost under the project was kept quite low. It was difficult to construct units within the stipulated cost due to time overrun. In the process unit cost exceeded the estimated cost and people had to contribute more. It became far more difficult for KMDA to collect users’ contribution. The project suggests loan from financial institutions as an alternative source of funding. But loan was not available as financial institution insisted for state government guarantee against security of loan which the government was reluctant to provide. Moreover, the rate of interest charged by financial institution was not affordable to the poor. Institutions were reluctant to offer loan to people not having a regular source of income. In addition, people were not willing to contribute their share of the housing cost beforehand. KMDA had to deposit users’ contribution from their own resources. Therefore, KMDA had to approach the state government for a contribution of Rupees 5000 per unit as gap funding, since people’s contribution was to come later. But the Government did not approve the fund.
Most of the families had not deposited the amount payable at
VAMBAY Housing at Nonadanga
Figure 3:

CASE STUDY
April 2016 Volume 17 No.1- SHELTER | 57
their end. Some of them, who had paid up, did not want to shift. Some of them who had shifted were also thinking about returning to their erstwhile dwelling place. This was a concerted rejection of the package offered by KMDA. KMDA felt that the project guidelines were too rigid to be followed universally. There was very little scope for flexibility in project formulation to suit the local needs.
Loss of job was a common feature for the urban poor who were rehabilitated. The nature of their economic pursuits was such that in most of the cases, proximity to their homes was a must. The evicted families were earlier mostly employed as house-maids, rickshaw-pullers, auto-rickshaw drivers or shop-workers. Since Nonadanga is far away from the heart of the city where they used to live earlier, the employment opportunities had shrunk drastically. It was difficult to obtain jobs by competing with other poor people who were already rendering services in the nearby exiting settlement areas. Those who used to work as maids in five houses now only got time to work in two, because of the time wasted in commuting. Before they were relocated to Nonadanga, they used to return home between two to five times a day since their job timings were staggered. Specially, women needed to be back repeatedly in order to take care of their children and elderly. As they were now required to travel 4-6 km to their workplace, the occupations had become unsustainable.
The total number of adults in the family and the total size of the family were ignored in the project.
A single-room flat was allotted to each family irrespective of its size or number of adults. Even families with 5-10 members, who used to live together, were given one room to stay in. People having older parents faced difficulties to share single room. There was no option to make any expansion in one roomed unit. In the process, there was breaking up of families. The family members, who used to support each other in the time of distress, were not staying together. Though they preferred to stay together with their community and relatives, they were forced to stay apart.
There was no hospital or health centre around the places of rehabilitation. The privately owned hospitals located in nearby area were too expensive for them. They preferred to rely on the far-away government run hospitals or get treated by local quacks and homoeopaths. Many families had to travel long distance to procure food from public distribution system. Many families whose kids used to go to school earlier were forced to discontinue simply because there was no affordable school in the neighbourhood. The children had to travel for miles to reach the schools they used to study in.
one of the reasons for people to squat in their earlier places was cheaper cost of living which had now increased a lot due to their relocation in the new rehabilitation settlement colony. Moreover, cost of living had increased due to change of lifestyle from individual single storeyed structure to apartments. People who used to have earthen ovens for cooking were now forced to buy kerosene as cooking fuel and those who raised domestic animals like hen, goat etc. were now forced to stay without them.
aPPLIcaTIon oF SSM In THE caSE STudyAs observed in the case study, the implementation of the VAMBAY housing involved different players having different objectives. Problems are also multi-dimensional having qualitative and quantitative issues connected to real life problems. SSM has been applied to express the problems by using systemic thinking to understand the total system to express ‘what the real problem is’. Problems faced by all players have been looked into in an integrated manner to have a clearer understanding of issues by analysing the base level inherent complexities. The various perceptions that exist in the minds
Issues from the perspective of public agency (Housing Provider)
Issues from the perspective of urban poor
- Security of tenure to all with provision of affordable housing
- Unit with same area and design to all - Water supply and sanitation etc.- Integrated basic services
- Security of tenure/ legal ownership and affordable housing
- Proximity to occupation and to earn livelihood
- Minimum living cost - Proximity to own community/
relatives
Table 1: Formulation of Root Definition
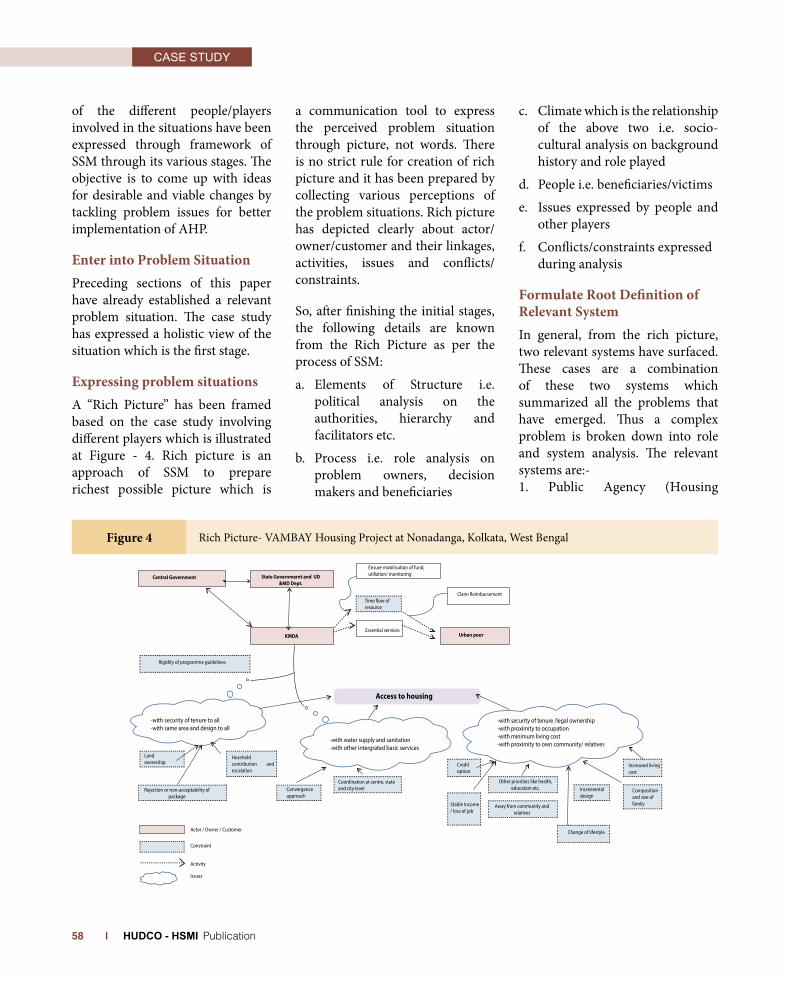
CASE STUDY
| HUDCO - HSMI Publication 58
of the different people/players involved in the situations have been expressed through framework of SSM through its various stages. The objective is to come up with ideas for desirable and viable changes by tackling problem issues for better implementation of AHP.
Enter into Problem Situation Preceding sections of this paper have already established a relevant problem situation. The case study has expressed a holistic view of the situation which is the first stage.
Expressing problem situationsA “Rich Picture” has been framed based on the case study involving different players which is illustrated at Figure - 4. Rich picture is an approach of SSM to prepare richest possible picture which is
a communication tool to express the perceived problem situation through picture, not words. There is no strict rule for creation of rich picture and it has been prepared by collecting various perceptions of the problem situations. Rich picture has depicted clearly about actor/owner/customer and their linkages, activities, issues and conflicts/constraints.
So, after finishing the initial stages, the following details are known from the Rich Picture as per the process of SSM:
a. Elements of Structure i.e. political analysis on the authorities, hierarchy and facilitators etc.
b. Process i.e. role analysis on problem owners, decision makers and beneficiaries
c. climate which is the relationship of the above two i.e. socio-cultural analysis on background history and role played
d. People i.e. beneficiaries/victims
e. Issues expressed by people and other players
f. conflicts/constraints expressed during analysis
Formulate Root definition of Relevant SystemIn general, from the rich picture, two relevant systems have surfaced. These cases are a combination of these two systems which summarized all the problems that have emerged. Thus a complex problem is broken down into role and system analysis. The relevant systems are:-1. Public Agency (Housing
Ensure mobilisation of fund,utiliztion/ monitoringState Governmernt and UD
&MD Dept.
KMDA
Central Government
Urban poor
Claim Reimbursement
Essential services
Time �ow ofresource
Rigidity of programme guidelines
-with security of tenure to all-with same area and design to all
-with water supply and sanitation-with other intergrated basic services
Access to housing
-with security of tenure /legal ownership-with proximity to occupation-with minimum living cost-with proximity to own community/ relatives
Creditoption
Stable Income/ loss of job
Other priorities like health,education etc.
Away from community andrelatives
Incrementaldesign
Change of lifestyle
Increased livingcost
Compositionand size of family
Coordination at centre, stateand city levelConvergence
approach
Hoseholdcontribution andescalation
Landownership
Rejection or non-acceptability ofpackage
Actor / Owner / Customer
Constraint
Activity
Issues
Rich PictureVAMBAY Housing project at Nonadanga, Kolkata, West Bengal
Figure 4 Rich Picture- VAMBAY Housing Project at Nonadanga, Kolkata, West Bengal

CASE STUDY
April 2016 Volume 17 No.1- SHELTER | 59
Provider) System has an established centralized system and are motivated primarily by the broad constitutional and legislative mandate for housing the poor.
2. urban Poor community Group System controls the major decision with reference to their own situation and are allowed to make their contribution to housing both in the process as well as in the house that is constructed.
As an outcome, the rich picture has developed access to certain issues and constraints of the case study. In the study, KMDA and urban poor have played their respective roles and taken part to achieve their own objectives. Rich picture has not only expressed the issues but also segregated them, from the perspective of KMDA and urban poor as given in Table 1. There could be further analysis of issues. Precise identification of issues is directly dependent on availability of detailed survey data.
The rich picture has explored constraints as timely flow of resource; rigidity of programme guidelines; land ownership; household contribution and escalation; rejection or non-acceptability of package; convergence approach; coordination at centre, state and city level; credit option; stable income/loss of job; other priorities like health, education etc.; away from community and relatives; change of lifestyle; incremental design; composition and size of family; increased living cost.
Now, according to SSM, ‘Root Definition’ and ‘conceptual Models’
can be formulated by detracting from the existing housing system. Elements of root definition and related questions on cATWoE are described in Table 2.
PRoBLEM anaLySIS
Public agency (Housing Provider) System The “Root Definition” of the urban local body system is –‘public agency as per its constitutional and legislative obligation for serving urban poor will follow provision of guidelines to prepare a plan for affordable housing programme for transforming unorganized housing development to organized housing development and will understand constraints, analyze resources and implement the programme (Refer Table 3)’.
urban Poor community Group System
The “Root Definition” of the urban poor community group system is - ‘urban poor community group will facilitate implementation of affordable housing programme for transforming improper housing to proper housing for better quality of life and will prepare plan, understand constraints, analyze resources and implement the programme (Refer Table 4)’.
FRaMInG concEPTuaL ModELSThe activities (as underlined verbs used in the root definitions) under both the definitions mentioned have been segregated and organised in sequential logic. conceptual models have been made of the activities that existed in the systems defined in the root definitions. conceptual model based on root definition mentioned under Public Agency (Housing Provider) System has been shown under Figure – 5.1a and conceptual model based on root definition mentioned under urban Poor community Group System has been shown under Figure – 5.2a.
Both the systems have been depicted by following SSM guidelines, as entities that receive some inputs and produce some outputs, in other words systems that have performed transformation process with some control elements. Accordingly, monitoring and control points have been derived by consulting the root definitions that helped in formulating conceptual models.
Now, both the systems have expressed versions as depicted under Figure – 5.1b for Public Agency (Housing
Elements for Development of Root Definition
C Customer Who would be beneficiaries of the system and who would lose?
A Actor Who would carry out the activities needed?
T Transformation What inputs are transformed to what output?
W Weltanschauung or World View
What image of the world makes the system meaningful?
O Owner Who can start or stop the processes?
E Environment What external constraint does this system take as given?
Table 2: Root Definition and Related Questions
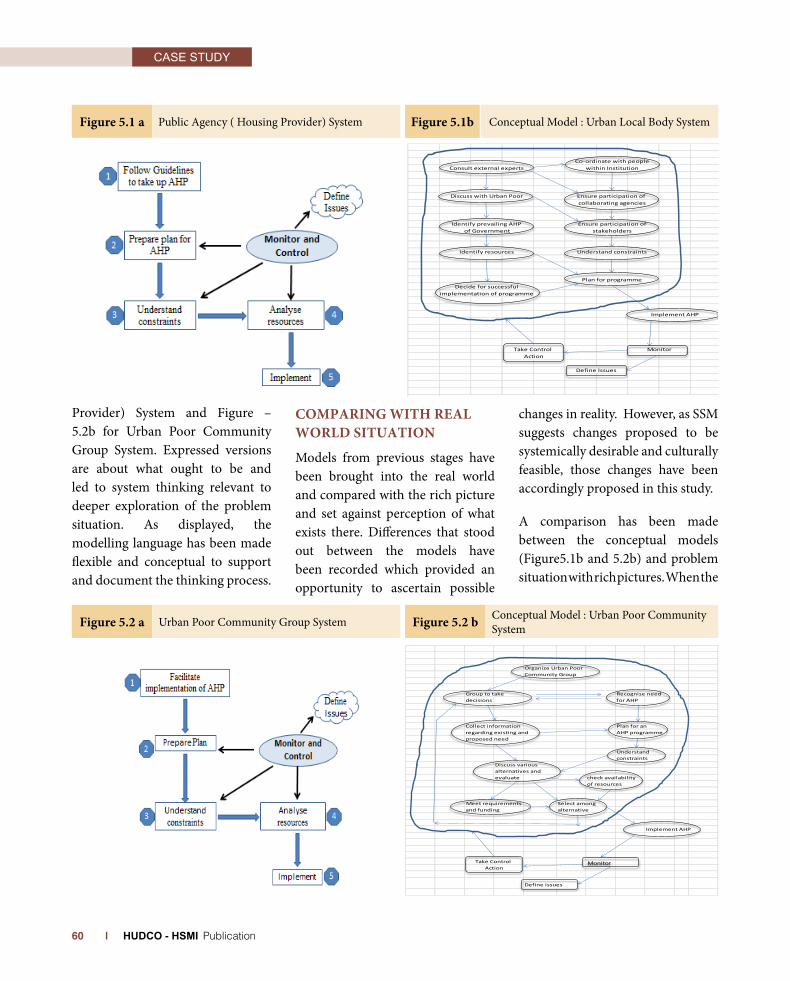
CASE STUDY
| HUDCO - HSMI Publication 60
Provider) System and Figure – 5.2b for urban Poor community Group System. Expressed versions are about what ought to be and led to system thinking relevant to deeper exploration of the problem situation. As displayed, the modelling language has been made flexible and conceptual to support and document the thinking process.
coMPaRInG wITH REaL woRLd SITuaTIon
Models from previous stages have been brought into the real world and compared with the rich picture and set against perception of what exists there. Differences that stood out between the models have been recorded which provided an opportunity to ascertain possible
changes in reality. However, as SSM suggests changes proposed to be systemically desirable and culturally feasible, those changes have been accordingly proposed in this study.
A comparison has been made between the conceptual models (Figure5.1b and 5.2b) and problem situation with rich pictures. When the
ConceptualModel:UrbanLocalBodySystem
implementationofprogramme
withinInstitutionCo-ordinatewithpeople
Ensureparticipationofcollaboratingagencies
Ensureparticipationofstakeholders
Understandconstraints
Planforprogramme
Consultexternalexperts
DiscusswithUrbanPoor
IdentifyprevailingAHPofGovernment
Identifyresources
Decideforsuccessful
ImplementAHP
MonitorAction
TakeControl
DefineIssues
Figure 5.1 a Public Agency ( Housing Provider) System Figure 5.1b conceptual Model : urban Local Body System
OrganizeUrbanPoorCommunityGroup
Grouptotake Recogniseneeddecisions forAHP
Collectinformation Planforanregardingexistingand AHPprogrammeproposedneed
Understandconstraints
Discussvariousalternativesandevaluate
ImplementAHP
Defineissues
ConceptualModel:UrbanPoorCommunitySystem
TakeControlAction
ofresourcescheckavailability
Meetrequirementsandfunding alternative
Selectamong
Monitor
Figure 5.2 a urban Poor community Group System Figure 5.2 b conceptual Model : urban Poor community System

CASE STUDY
April 2016 Volume 17 No.1- SHELTER | 61
detailed project reports were drawn and the actual implementation took place, the ground reality had undergone a phase transition. At the implementation stage, accommodating changes was difficult. The conflict situations were not properly taken into consideration as evidenced in conceptual models of two different systems.
dEFInInG cHanGEScomparison between the conceptual models (Figure 5.1b and 5.2b) and problem situation at rich picture shows that collection of information is important and to be considered while assessing need for affordable housing programme. Similarly, understanding constraints and analysing resources are also equally important to be taken care to check whether overall objectives are achievable.
changes have been indicated in “Modified Rich Picture”, illustrated at Figure - 6.There are only desirable and suitable procedural changes in activities in achieving goal. Basic steps have remained unaltered.
As envisaged under “Modified Rich Picture”, there are suggestive procedural changes in the activities towards better achievement of goal as the SSM usually suggests certain changes without altering basic steps.
Since there is no protocol given by SSM, alternative views of the situation could be developed and
there could be varied modifications of rich picture.
Instead of consulting external experts only, as done in the case study, need has been found for consulting four parties (as shown in steps 1, 2, 3 & 4). Similarly, collecting information from various sources (as revealed in sub-steps 5A
Elements for Development of Root Definition
C Elected members
A Staff of Public Agency
T Unorganized housing development to organized
housing development through provisions of prevalent
guidelines
W State agency has constitutional and legislative
obligation to serve poor
O Governments
E Constraints like human capacity & mechanism,
resources, norms/policies/guidelines
Elements for Development of Root Definition
C Urban Poor
A Urban Poor Community Group
T Improper housing to proper housing to have better quality of life
W Affordable Housing Programme will facilitate proper housing
O Central government, state government and other government authorities
E Income constraints, land constraints and priorities other than housing
Figure 6 Modified Rich Picture
1
2 67 8 9
3
4
5A
5B
Monitor and Control
Monitor and Control
Monitor and Control
Monitor and Control
Analyse constraints
Analyse constraints
Select alternative Implement AHP
De�ne issues
De�ne issues
De�ne issues
De�ne issues
Collect information on existing need and future requirement
Collect information on provision of guidelines
Assess the need for AHP
Prepare alternative plans for implementing AHP
Consult Urban Poor Community Group
Consult External Experts
Consult Inhouse Experts
Consult collaborting Agencies
Modified Rich Picture
Table 3: Problem Analysis for Public Agency System Table 4: Problem Analysis for urban Poor community Group System

CASE STUDY
| HUDCO - HSMI Publication 62
& 5B) will help to assess need for implementing affordable housing programme. Next four steps will have requirement of monitoring and control activities as these steps invite involvement of more than one party.
Monitoring and control points have been identified in the diagram. So the total system can adapt and survive via processes of monitoring and control which will remove the issues surrounding the problems. Monitoring and control activities will also help adjusting in a changing environment during the process of implementation of the programme.
concLuSIon
SSM has been used in a number of areas and often combined with other operation Research methods. Application areas include Information Systems, Ecosystem Approach, Applied Research, Project Management Evaluation Processes, Textual Analysis, and formal decision making. SSM has been used as a basis for formulating Knowledge Management Strategy (KMS) and can be used in a real-life urban planning application. certain very basic and important theoretical issues related to SSM have been applied in the context of urban planning; especially in the case of transport management. SSM has been used for presenting an actual approach towards handling unstructured data in environmental sciences. Some attempts have been made to apply SSM to address the environmental and resource planning.
As housing projects have complicated and sensitive issues due to different objectives of multiple players who are playing role in
the projects, SSM can be used to interpret issues in a variety of ways due to its flexible approach of tackling complex problem situations and experiential learning. Problems can be looked into through the process of iteration to understand the issues by using SSM guidelines and a set of tools. It is possible to apply SSM to have the process of enquiry, learning qualitative issue and problem analysis to understand issues. The most important advantage is that the decisions are based on the model situations and incidental outputs. one can search for alternative solutions through this methodology. Further, SSM can be simultaneously used with connections to other methodologies also. For example, HSM can be used in the economy side of housing, mathematical formule and empirical data while in case of behaviour, aspects like social, political and cultural etc., SSM can be used.
noTES1Below Poverty Line (BPL): BPL is estimated based on per capita income per month in urban areas and thus consumption expenditure per household is calculated.2Kolkata Municipal corporation (KMc):The calcutta Municipal corporation Act 1980 came into force on January 1984. The Act of 1980 thus formed the framework of the modern corporation. Subsequent to the renaming of the city in 2001, the corporation is now known as the Kolkata Municipal corporation. The city is divided into 141 administrative wards that are grouped into 15 boroughs. Available: https://www.kmcgov.in/3Kutcha house: Kutcha house is made up of mud or hay stacks or tiled roof.4Kolkata Metropolitan Development Authority (KMDA): KMDA is a statutory authority functioning under the administrative control of urban Development and Municipal Affair Department (uD & MA) of Government of West Bengal. KMDA, established in 1970, essentially as a development agency with the specific purpose of carrying out major infrastructure development in KMA. Some of the housing projects were undertaken for
housing of urban poor in slums.
Available at: http://www.kmdaonline.org/html/index.php5Pucca housing: Refers to dwellings that are designed to be solid and permanent. The term is applied to housing in South Asia built of substantial material such as stone, brick, cement, concrete, or timber. Available at : http://en.wikipedia.org/wiki/Pucca_housing
REFREncESDavies L &Ledington P 1991, Information in
Action: Soft Systems Methodology
checkland, P. (1981) Systems thinking, systems practice, Jhon Wiley and Sons, Inc., chichester, u.K.
checkland, P. (1985a) From optimizing Learning: A Development of System Thinking for the 1990s (pp.757-767), Journal of the operational Research Society, Volume No 36, Issue No 9.
checkland, P. (1985b), Achieving Desirable and Feasible changes: An Application of Soft System Methodology (pp. 821-831), Journal of the operational Research Society, Volume No. 36, Issue No. 9.
checkland, P. (1988), The case for “Holon” (pp. 235:238), Guest Editorial, Systems Practice, Vol.I, No.3, 1988.
checkland, P. (1997), Entry “Systems” in: International Encyclopaedia of Business & Management (pp. 667-673), London.
checkland, P. (2000a), The Relevance of Soft System Thinking (pp. 377–383), Human Resource Development International / 3:3.
checkland, P. (2000b), Soft System Methodology: A Thirty Year Retrospective. Systems Research and Behavioural Sciences (pp. S11 – S58), Volume No 17, Issue No 1.
checkland, P. (2000c), New Maps of Knowledge Some Animadversions (Friendly) on: Science(Reductionist), Social Science (Hermeneutic), Research (unmanageable) and universities (unmanaged) (pp. S59–S75), Systems Research and Behavioural Science Syst. Res. 17.
Maqsood T. et al, Five case studies applying Soft Systems Methodology to Knowledge Management.
Available at: http://eprints.qut.edu.au/27456/1/27456.pdf
Khisty, c.J. (1995), Soft-Systems Methodology as Learning and Management Tool (pp.91-107) , Journal of urban Planning and Development, September issue.
Valmiki Ambedkar Awas Yojana (VAMBAY), Guidelines of Ministry of urban Development Govt. of India, New Delhi.
Detailed Project Report of VAMBAY scheme at Nonadanga prepared by Kolkata Metropolitan Development Authority.

CASE STUDY
April 2016 Volume 17 No.1- SHELTER | 63
MaaRTjE van EERd This paper studies development induced displacement & resettlement in the urban context and specifically focuses on the impact of resettlement and rehabilitation policies on the project affected people. It will present the changes in approach with regard to the scale, the implementation and the impact of development induced displacement and resettlement since independence in India. The findings of this paper are based on literature review and in-depth interviews with resettlement experts and focused group discussions in India. It will specifically look into the approaches adopted in resettlement projects in Delhi and Chennai.
dEvELopMEnT inducEd diSpLacEMEnT and RESETTLEMEnTWorldwide there are three main causes for resettlement: conflict, natural disaster and development which in the literature are often categorized into: Development-Induced Displacement and Resettlement (DIDR), Conflict-Induced Displacement and Resettlement (CIDR) and Natural-Disaster-Induced Displacement and Resettlement (NIDR) (Muggah, 2008). A distinction has also been made between Voluntary Resettlement (VR) and Involuntary Resettlement (de Wet, 2001). In this study we look at involuntary DIDR in urban areas.
The most important causes of development induced displacement worldwide are: urban development,
infrastructure construction, construction of multi-purpose dams, agriculture expansion, mining activities like coal, population redistribution schemes etc. Expansion and rehabilitation of infrastructure is the principal cause for development-induced displacement worldwide and the trend is likely to accelerate (Courtland Robinson, 2003, pp. 15-23).
ScaLE and iMpacT of diSpLacEMEnT and RESETTLEMEnTThe scale of displacement due to development worldwide is enormous and on the rise. According to Cernea “increasingly, public and privately funded development projects are estimated to displace more than fifteen million people a year” (Oliver –Smith 2009, p. 3). Based on vast empirical evidence Cernea concluded that “the dominant outcome of displacement worldwide is not income restoration but impoverishment” (2009, p. 50).
The attention for development-induced displacement within the academic fields of sociology and anthropology arose in the 1990’s out of concern because of an enormous rise in development-induced displacement in the 1970s and 1980s stimulated by a global infrastructure boom, coupled with
MOVED TO THE FRINGES Resettlement and its Impact on the Urban Poor in India
Metropolitan cities have become more segregated as squatter settlements were systematically evicted from within the city and displaced to the periphery, often to accommodate large infrastructural and ‘beautification’ projects that overwhelmingly benefit the better-off sections of the urban populace. in transferring land from the poor to the well to do, these projects have created a segregated spatial pattern where gated enclaves are separated from the congested and unsanitary townships where the poor live.
Maartje van Eerd ([email protected]) is Senior Housing and Social Development Expert and faculty at the Institute for Housing and Urban Development Studies, Rotterdam, the Netherlands1.
CASE STUDY
| HUDCO - HSMI Publication 64
‘painful and disastrous outcomes in resettlement experiences’ (Dwivedi, 2002, p. 709). In the 1990s a lot of popular resistance emerged against those forms of displacements, and research revealed the scale and the negative impact on project affected people (Dwivedi, 2002).
Cernea’s Impoverishment Risks and Reconstruction (IRR) model arose in the 1990s in response to the recognition that the overall outcome of resettlement was impoverishment. The IRR model aims to identify the impoverishment risks intrinsic to forced resettlement and the processes necessary for reconstructing the livelihoods of the displaced. In particular, it stresses that, unless specifically addressed by targeted policies, forced displacement can cause impoverishment among the displaced. The model identifies the risks of resettlement and proposes strategies to mitigate impoverishment. It shows how displacement goes hand in hand with social, physical and economic exclusion, which culminate in a range of impoverishment risks. The model has received critique over time. According to Dwivedi (2002) there is a risk that it is interpreted as a planning tool and therefore it can lead to a standardized action plan. Mariotti (2012) has pointed out that it does not take into account the ‘endogenous process’ that plays a significant role in the local context.
But overall it has been widely acknowledged that the IRR model has contributed significantly in the development of the research on involuntary resettlement,
explicitly establishing a link with the impoverishment of the affected population, thereby providing new departure points for many studies by breaking down the different risks associated with resettlement both at the theoretical and the empirical level (Mariotti, 2012), and also contributing to finding viable solutions (Sharma, 2010).
The model rests on three basic concepts of risk, impoverishment and reconstruction. The major impoverishment risks related to displacement are: landlessness; joblessness; homelessness; marginalization; food insecurity and a decline in health; increased morbidity; loss of access to common property resources; social disarticulation; and risks to host populations. (Cernea, 2000, p. 22). Courtland Robinson (2003), based on work from Downing and Muggah has identified the loss of access to community services including lost or delayed opportunities for education, and the violation of human rights as additional risks of resettlement.
According to Cernea (2000), another important aspect to be taken into account is the difference in the intensity of the risks and the interconnectedness of the risks; the difference of risk intensity per individual depends on their particular socio-economic situation and the location. Depending on the particular site and particular sub-group, the intensity of the individual risks may vary. The starting point of the IRR models is the understanding that resettlement has an enormous impact on the livelihoods of the
poor, that it should be avoided as much as possible, that it leads to major losses and that it can violate the human rights if not conducted respecting the laws and principles of displacement and resettlement. Navarra points a criticism here in saying that the IRR model does not adequately ‘explain’ the differences of risks across households (Navarra, 2014, p. 58, unpublished).
The fact that most resettlement goes wrong and leads to impoverishment is, according to De Wet, due to what he calls ‘inadequate inputs’ such as the lack of national legal frameworks and policies, political will, funding, pre-displacement research, careful implementation and monitoring. Another problem is the time frame, which is often very tight particularly for complete reconstruction of livelihoods. In many infrastructure projects this is not incorporated in the project. Another problem is that many governments and companies see resettlement as a cost rather than an investment and therefore they try to limit their expenses (de Wet, 2001). Often no base line study is conducted before the affected people are resettled, which is an obstacle to the assessment of livelihood reconstruction.
Some scholars focus on the new forms of exclusion that are generated through resettlement and rehabilitation programs. These exclusion mechanisms stem from the design of most of these programs in urban areas, specifically their eligibility criteria: the application of the cut-off date of arrival in the settlement; and the financial contribution required from

CASE STUDY
April 2016 Volume 17 No.1- SHELTER | 65
households. Other exclusionary mechanisms stem from the way that the programs have been implemented, which also result in exclusion of households, both for owners and tenants (Dupont, 2011a, p. 88, van Eerd, 2008).
Lack of responsibility on the part of the implementing agencies and their officials, and absence of institutional and financial capacities are also major problems with regard to resettlement planning and implementation (Cernea, 2009).
RESETTLEMEnT aS a dEvELopMEnT oppoRTuniTy?With regard to housing interventions in slum areas the first step should always be to upgrade existing slums through an integrated participatory slum upgrading approach. In cases where this is impossible and no other option is possible only then resettlement should be adopted. The second golden rule is that resettlement should be minimized as the empirical evidence is overwhelming in proving that resettlement often leads to impoverishment.
Cernea (1988) has identified five factors contributing to the effectiveness of overall development performance in resettlement projects which are the existence of resettlement policy; legislation; pre-planning; public participation and; adequate compensation. Mathur (2006) mentions that in India successful cases of resettlement, although small in number, are coming to light. These are cases where access to employment, or
proximity to the city center and access to education, were considered important, or where the social fabric had not been disrupted because the entire village was resettled (p.70-71). Key informants to the study mention that resettlement can remove the stigma of slum people and can also improve security, give resettled people a new position in life where they are for instance now able to marry off their children in families with better status.
An empirical study on the process of resettlement in Thailand has identified a number of pre-requisites for achieving success and grouped them into internal and external factors related to the community. External factors, according to Viratkapan and Perera (2006), are the location of the new settlement and the award of compensation, and internal factors are unity of the community, availability of strong leadership, active participation and positive attitude of community members.
Mehta (2011) in her work on gender and displacement questions whether resettlement and rehabilitation in itself can ever be seen as a development opportunity, urges the need for a reconceptualization, which includes avoiding, and if not possible, minimizing the need for displacement. Mehta also argues that pre-conditions for resettlement to provide a development opportunity is to include women as full beneficiaries of compensation and as independent or co-owners of land; recognize and build on women’s livelihoods including housing and employment; recognize
and build on women’s informal rights in customary practices; avoid any violation of their rights; include strong gender analysis and gender sensitive data regarding the impacts of displacement; have special provision to include the full participation of women in decision-making processes around displacement of resettlement and build strong safeguards to facilitate women’s access to compensation and any other benefits (p. 39).
RESETTLEMEnT appRoacHES in india and iTS iMpacT on THE pooR SincE indEpEndEncEDevelopment induced displacement and resettlement has been prevalent in India for a very long time. According to Hemadri, the estimates in India are that since independence 21 to 50 million people have been displaced by large projects (Mehta, 2009, p. xxv). Fernandes (2008, p. 91) even estimates this to be about 60 million people since Independence until 2004, with a note that studies also show that most official figures are underestimates. Others, according to Fernandes, Rao and Das, estimated that over last 4 decades roughly as many as 75 percent of the 2 million people that were displaced by development projects have only been physically relocated, but not rehabilitated in a socio-economic sense (Mathur, 2006). World Bank studies in 1994 also reveal that the policy goal of restoration or rehabilitation in their own projects largely remains unfulfilled (Mathur, 2006).
During the rule of the first Prime
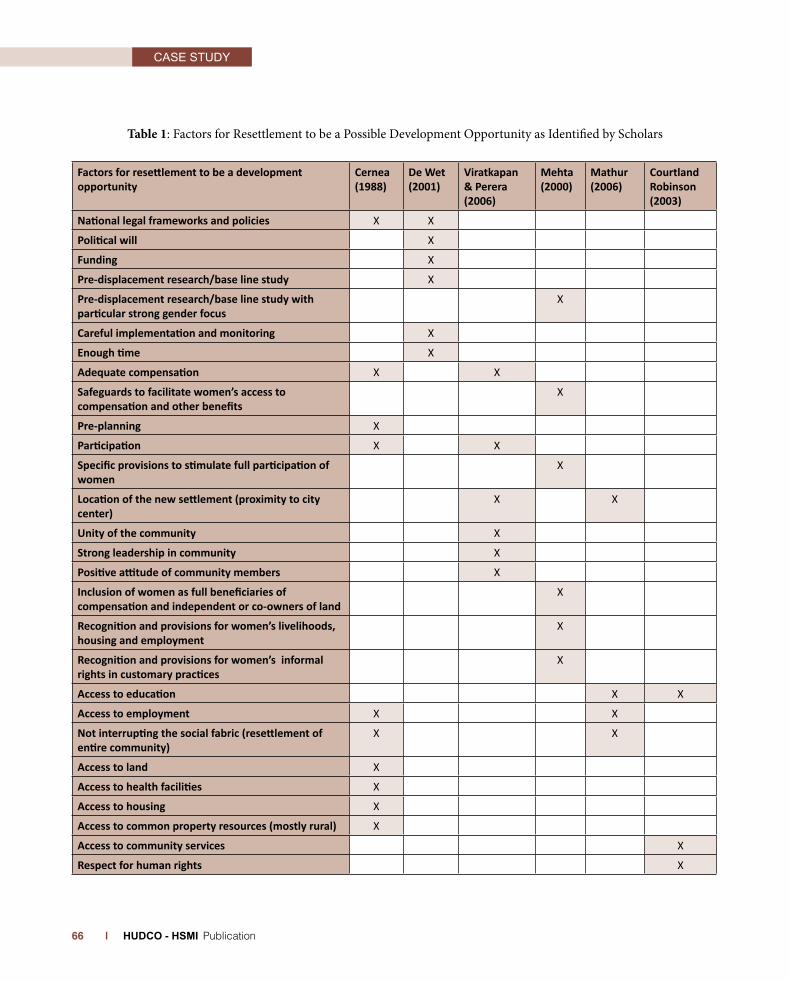
CASE STUDY
| HUDCO - HSMI Publication 66
Factors for resettlement to be a development opportunity
Cernea (1988)
De Wet (2001)
Viratkapan & Perera (2006)
Mehta (2000)
Mathur (2006)
Courtland Robinson (2003)
National legal frameworks and policies X X
Political will X
Funding X
Pre-displacement research/base line study X
Pre-displacement research/base line study with particular strong gender focus
X
Careful implementation and monitoring X
Enough time X
Adequate compensation X X
Safeguards to facilitate women’s access to compensation and other benefits
X
Pre-planning X
Participation X X
Specific provisions to stimulate full participation of women
X
Location of the new settlement (proximity to city center)
X X
Unity of the community X
Strong leadership in community X
Positive attitude of community members X
Inclusion of women as full beneficiaries of compensation and independent or co-owners of land
X
Recognition and provisions for women’s livelihoods, housing and employment
X
Recognition and provisions for women’s informal rights in customary practices
X
Access to education X X
Access to employment X X
Not interrupting the social fabric (resettlement of entire community)
X X
Access to land X
Access to health facilities X
Access to housing X
Access to common property resources (mostly rural) X
Access to community services X
Respect for human rights X
Table 1: Factors for Resettlement to be a Possible Development Opportunity as Identified by Scholars

CASE STUDY
April 2016 Volume 17 No.1- SHELTER | 67
Minister of independent India, Pandit Jawaharlal Nehru, the principal discourse was on nation building. This was the time when large industries were coming up, and power plants and big dams were constructed. Nehru called dams the ‘temples of modern India’. According to Sharma (2010, p. 505) ‘over-optimism prevailed and people believed that a few had to sacrifice for the good of the majority. And although there were protests, the suffering of PAPs remained mainly unattended.
The first milestone and a turning point in thinking about displacement and resettlement in India, as identified also by the key informants, emerged with the struggle against the construction of the Narmada dam Project, which started in the mid-1960s. Medha Patkar, the founder of the Narmada Bachao Andolan, in 1986 led the protests against the displacement and resettlement. Her chief concern was that displaced villagers should be resettled in an equitable, humane way (Roy, 1999). The protests eventually led the World Bank to set up an independent review mission in 1991 to review the project, which in itself was already a huge achievement, and finally this led to the withdrawal of the World Bank from the project in 1993.
The agitations against the construction of the dam project influenced the World Bank and later other financing agencies like Asian Development Bank (ADB) and others to start developing their safeguard policies, while implementing projects in India.
It also led to the establishment of the World Commission on Dams (WCD) in 1989 that had to review the effectiveness of large dams and to develop standards, criteria and guidelines to advise future decision making (Dwivedi, 2006). Also the industries like the thermal power industry, started to develop their own safeguards and relocation policy.
cHangES in govERnancE and iTS iMpacT on diSpLacEMEnT and RESETTLEMEnTIn India changes in governance were initiated in the 1990’s through changes in policies of economic liberalization, partly stimulated by international funding agencies. These policies, according to Stoker, lead to an increased role of the market, and the introduction of stakeholder participation and public private partnerships. Institutional reforms were introduced to support, sustain and manage micro-and macro level economic restructuring, and the state slowly withdrew (Ellis, 2013, p. 257). The shortage of funds in the public sector was addressed through private sector involvement, particularly in improving infrastructure. (Banerjee-Guha, 2009). Administrative decentralization was stimulated through the 74th Amendment Act, ‘which redefined the distribution of functions and resources between different levels of government and promoted local self-government’ (Ruet and Tawa Lama-Rewal, 2009, p. 10). Therewith India entered the era of the neoliberal paradigm and this has had an effect on the urban development policies and
particularly on dealing with the urban poor.
Scholars observed that since the 1990s “metropolitan cities have become more segregated as squatter settlements were systematically evicted from within the city and displaced to the periphery, often to accommodate large infrastructural and ‘beautification’ projects that overwhelmingly benefit the better-off sections of the urban populace”. In transferring land from the poor to the well to do, these projects have created a segregated spatial pattern where gated enclaves are separated from the congested and unsanitary townships where the poor live (Baviskar, 2013, p. 307).
Also, the economic liberalization in India has led to particular redevelopment practices in the 2000s. During this period, according to Doshi (2012, p. 847) “state interventions in slums shifted from welfare accommodations distributed through patronage to neoliberal resettlement practices aiding the proliferation of new land markets and lucrative redevelopment opportunities”. New policies and partnerships for redevelopment and resettlement came into being. This opened up the market for private developers to get into the business of slum re-development and resettlement, by offering these private developers part of the original slum for private development in exchange for the construction of housing for the original slum dwellers. In this model, according to Dupont (2011a, p. 80) “it is likely that housing for the poor will be developed in the

CASE STUDY
| HUDCO - HSMI Publication 68
urban peripheries, which would require an efficient and affordable transport system to enable them to access employment centers located in more central parts of the city.”
Many sources report the increased number of evictees in urban areas. COHRE (2006) reports that between December 2004 and March 2005, about 90,000 homes were demolished by the Mumbai authorities affecting 350,000 slum and pavement dwellers; in 2005 over 30,000 residents living along the railways in Kolkata were evicted and in 2004 approximately 130,000 residents of Yamuna Pushta were forcibly evicted in Delhi (COHRE, 2006, pp. 72-75). Bhan (2009, p. 127) mentions that “between 1990 and 2003, approximately 51,461 houses were demolished in Delhi under the “slum clearance” schemes. Between 2004 and 2007 alone, at least 45,000 homes were demolished, and since the beginning of 2007, eviction notices have been served on at least three other large settlements. Fewer than 25 per cent of the households evicted in this period have received any alternative resettlement site”.
Also, the developments in India with regard to turning cities into world class cities are increasingly leading to displacements, which is referred to in a number of studies (Zerah et al., 2011; Birkinshaw and Harris, 2009; Dupont, 2011), or slum dwellers being pushed to the fringes under resettlement programmes (Sharma, 2010). Many scholars question the new urban development paradigm leading to more segregation and exclusion and the impact it has on the poor, many
of whom are residing in slum areas (o.a. Bhide, 2009; Dupont, 2011; Banerjee Guha, 2009; Fernandes, 2004; Kundu et al., 2013; Roy, 2011). Bhide (2009, p. 375) speaks of the voice of the upward mobile middle and elite class citizens which has emerged in the last decade spearheading projects partnering with local government stimulating an ‘anti-slum’ agenda, which she sees as a ‘new threat’. Rao (2013, p. 763) speaks of the ‘dream of an ordered city being accompanied by unrestrained fantasies of segregation’. Cities have to become orderly and contain clean spaces for the middle and upper classes, and those that do not fall under these categories will have to go.
LEgaL and govERnancE STRucTuRES foR dEvELopMEnT inducEd diSpLacEMEnT and RESETTLEMEnT in indiaAlthough there is a Land Acquisition Rehabilitation and Resettlement Act2 , this only applies to cases where land of a particular size has to be acquired, for amongst, others development purposes. This law does not apply to the urban cases. The central government has however set out a National Housing and Habitat Policy to be a guide for state governments. The first National Housing Policy was formulated by the Ministry of Housing and Urban Poverty Alleviation in 1988, which was revised in 1994 and in 1998. This policy war generic for both rural and urban areas. In 2007 a new National Housing and Habitat Policy was announced for urban areas, specifically addressing the nation-wide urban housing
shortage and measures to overcome this shortage through nation-wide programmes like Jawaharlal Nehru National Urban Renewal Mission (JNNURM) and Rajiv Awas Yojana (RAY), which aimed at a ‘slum free India’. The policy was intended to tackle the housing shortage and severe shortage of basic services and intended to promote sustainable development of habitat in the country through a ‘regional planning approach’ and also by further deepening the role of government as a ‘facilitator’ and ‘regulator’(Dupont, 2008, p. 80). This policy stated that the majority of slum dwellers should benefit from in-situ upgrading and restricts resettlement (Cummings, 2012, p. 44). Kundu (2013) observes that the trend is that under the national programmes like JNNURM3 and RAY, slums dwellers are being shifted to the peripheries, where land is cheaper, while the land thus vacated in the center of the city is being used for high-rise apartments for MIG4 and HIG5 housing and commercial developments.
HouSing and Land dELivERyThe Indian federation compromises of a three tier hierarchical structure of governance, with the union government as the top tier, governments of states and union territories as the second tier and urban and rural bodies as the third tier (Nandi and Gamkar, 2013). The Constitution delineates the powers and responsibilities between the union or central government and the states in the ‘Seventh Schedule’, which is commonly referred to as the ‘Union List’ or ‘List 1’, and the ‘State
CASE STUDY
April 2016 Volume 17 No.1- SHELTER | 69
List’ or ‘List II’ and the ‘Concurrent List’ or ‘List III’, containing subjects over whom both Parliament and the state legislatures have power, although the central government has overriding powers in all matters (van Eerd, 2008).
In principle, land and housing (and urban governance) are state subjects. The central government however gives directions and can incentivize states through national programmes in those cases. States can only access the budget when they meet the specific requirements. The Jawaharlal Nehru National Urban Renewal Mission (JNNURM) is an example of a central government programme through which the national government tries to stimulate governance devolution at state level as recommended by the 74th Constitutional Amendment. It also, for instance, tries to facilitate effective private sector participation in infrastructure development and also has removed many restrictions on foreign direct investments in the sector through new guidelines and model legislation (Nandi and Gamkar, 2013).
RoLE of judiciaRy: iS THERE a nEw TREnd THRougHouT india?After an analysis of the record of the Supreme Court of India, Rajagopal (2007) concludes that the Court has increasingly shown a bias against the poor in its rulings because of the emergence of the judiciary as an organ of governance and because of the internally biased nature of the rights based discourse which tends to ‘reproduce binary arguments for either increasing state capacity
or increasing choice of goods in the marketplace’. According to Rajagopal the courts increasingly rule in favor of the rich and the urban middle class. Dupont and Ramanathan (2007) also refer to the increasingly hostile attitude of the courts towards slums dwellers that already started in the 1980s.
poLiciES, govERnancE STRucTuRES and RESETTLEMEnT in dELHiThe approach favored by the Delhi administration towards squatter settlements from the late 1950s was eviction combined with demolition and relocation in resettlement colonies. This did not involve rehousing schemes but simply resettlement on developed plots, in colonies theoretically provided with basic infrastructure. The first scheme that was implemented in the 1960’s was the jhuggi-jhompri removal scheme, which was relatively generous, allocating to each eligible squatter family an 80 sq m plot, initially complete with a 99 year lease. Between 1960 and 1970, 44 resettlement colonies were constructed for relocating inhabitants of the old slums and demolished squatter settlements, almost all located at the periphery of the urban agglomeration. Of these 44 resettlement colonies, 18 were established before 1975 and were expected to accommodate approximately 50.000 families; 26 were established during the emergency between 1975 and 1976 alone, to accommodate more than 150,000 displaced families (Jain, 1990, in Dupont and Ramanathan, 2007, p. 316-317).
The current guiding policy for Delhi is the master plan called Vision 2021. The concerned departments develop their strategic plans accordingly. According to the master plan, no more plots should be given out. There is a change in thinking, to encourage the construction of apartments. A lot of speculation in flats is being observed: there are approximately 20,000 apartments lying vacant in Delhi because they are not well located.
The policy of 2013 stipulated that Delhi Urban Slum Improvement Board (DUSIB) would be the nodal agency for relocation for all agencies of state and local government. Delhi Development Authority (DDA) is the nodal agency for the central government dealing with relocation and resettlement for those located on central government land. 48 per cent of the Juggi jhopri or squatter settlements are located on DDA land.
DUSIB is planning to construct 300,000 houses, and 60,000 flats. The agency prefers to move people within a range of 0 to 5 Km, and develop through ‘telescopic development’ where in one free plot of land housing is being developed where people move to, which will free up land which is then again being developed. But access to land is the major problem of the agency as they hardly have any land; most land in Delhi comes under DDA. The only land that DUSIB has access to is 40 to 50 Km away from the city center. It is observed that over the last 10 years, organizations like DUSIB have been dismantled
CASE STUDY
| HUDCO - HSMI Publication 70
and are not constructing any more. More and more is left to the market and the private sector is not interested in constructing social housing.
The new model that DUSIB is currently working on is near the Maharani Bagh, which is a Public Private Partnership (PPP) project. In this project DUSIB offered a vacant piece of land to the developer to construct housing for the Economically Weaker Section (EWS) clusters and the arrangement is that the developer gets premium land, now occupied by slum community, for commercial/residential development for elite groups.
On similar lines, DDA has also come forward to rehabilitate slum dwellers living in Kathputli colony through PPP. In this model people will be moved into transit camps, after which the land thus free will be developed, for high income development while some portion of land will be earmarked for social housing in which the original inhabitant will be accommodated. So far the majority of the people are refusing to move into the transit camps as amongst others they fear a negative impact on their livelihoods as access to the streets is of major importance for their livelihoods, which they will loose once they move into apartments. Such models, primarily promoting the use of land as a resource are being promoted in other locations in Delhi as well as in other cities.
poLiciES, govERnancE STRucTuRES and RESETTLEMEnT in cHEnnaiChennai is the oldest municipal corporation in India. It was created in 1688 by the British. Its limits were extended lastly in 2011, in order to integrate 42 local bodies. The expanded corporation now comprises of 200 wards and the area under the Corporation has been increased from 174 sq km to 426 sq. km (Dupont and Dhanalakshmi, 2013, p. 42). The Madras Metropolitan Development Authority (now CMDA) was set up as an ad-hoc body in 1972 in charge of the Madras Metropolitan Area (CMA). It became statutory in 1975 under the Tamil Nadu Town and Country Planning Act, 1971) (Dupont and Dhanalakshmi, 2013, p. 42).
The Tamil Nadu Slum Areas (Improvement and Clearance) Act was passed in 1971 and was the first and only piece of legislation on how the state government should intervene in slums. The act established the Tamil Nadu Slum Clearance Board (TNSCB) (section 34). Through this act areas can be declared slums by the government. After that they become the responsibility of the Tamil Nadu Slum Clearance Board, which can then improve, clear and redevelop the declared slums.
In terms of governance structure, the TNSCB falls under the state’s Department for Housing and Urban Development (HUD) which determines the TNSCB’s budget and general objectives (Cummings, 2012).
The three strategies that have been applied by TNSCB are:1. In-situ development whereby
the basic infrastructure, amenities like water supply, road and sanitation facilities are made available in the slums on site.
2. In-situ reconstruction – for constructing dwelling units (multi-storied tenements) at the same location without any relocation of the inhabitant.
3. Rehabilitation and resettlement - provision of houses (or plots) at alternative locations along with infrastructure and livelihood programmes (Dupont and Dhanalakshmi, 2013).
In order to evict a slum area, it has to be first notified and declared a slum (under section 3) by the government after which the TNSCB has the right to evict (Tamil Nadu Slum Areas (Improvement and Clearance) Act, 1971). According to Raman (2011) the World Bank has strongly influenced slum policies in Tamil Nadu since they had started to support urban projects in Chennai (then Madras) since 1972. Its investments were guided by a series of policy documents that articulated its ideas on urban problems and recommended solutions like sites and services etc. It attempted to impose these policies and reforms in all its urban-sector projects. Chennai was one of the bank’s first urban-sector project, through the Madras Urban Development Project I (1977), MUDP II (1980-1988) and the third specifically for shelter through the Tamil Nadu Urban Development Project ( TNUDP) from 1988-1997 (Raman, 2011, p. 77).

CASE STUDY
April 2016 Volume 17 No.1- SHELTER | 71
Before the intervention of the World Bank, the slums policies of the TNSCB were mostly oriented towards the political agenda of government in respect of commitment to the urban poor. They tried to avoid politically sensitive approaches like clearance and resettlement. The World Bank’s intervention in Chennai changed shelter policies through: trying to promote local shelter strategies from in-situ tenement construction to sites and services and slum improvements schemes; trying to alter the role of the TNSCB from shelter providers to only slum upgrading efforts, and; trying to undermine the existing emphasis on subsidies for public housing and stressed cost-recovery (Raman, 2011).
diSpLacEMEnT and RESETTLEMEnT in cHEnnai, a cHangE in appRoacH ? The observed trend, as described in the literature and acknowledged by key informants, is that on the one hand resettlement since the early 2000 is increasing and predominantly taking place in large scale resettlement sites far from the city center. Another trend is that instead of providing sites and services, nowadays people are being moved into apartments.
Another trend identified in the literature is evicting people from water bodies in Tamil Nadu. The High Court in 2006 directed the Government to remove all types of encroachment under the control of the Public Works Department or the local bodies before the start
of the monsoon (Adaikalam, 2010, p. 37). Written petitions submitted to the Madras High Court in 1993 and 2006 (WP 17915/1993 and WP 25776/2006) were instrumental in supporting the evictions.
The new Public Works and Water Bodies Conservation Act, 2008 on tank encroachments stimulated government to remove encroachers from the catchment area of water bodies. Also, a new body, the Chennai River Restoration Trust, was established by the government in 2010, with the objective of restoring Chennai rivers including Adyar, Buckingham canal and Cooum River, and turning the areas along the river into parks, roads or walkways. According to Adaikalam (2010, p. 39), the people affected by this restoration was insignificant.
An interesting new development in Chennai has happened with the emergence of critical NGOs like Transparent Chennai and fact finding teams comprising of NGO’s working in the field of human rights, environmental issues and academics who conduct research, organize public meetings and conduct fact finding missions in cases of forced evictions, and in resettlement sites to assess the impact.
In 2010, the Principal Secretary of the Home Department, Government of Tamil Nadu (GoTN) in a response to the huge resettlement schemes in Kannagi Nagar and Semmancheri had declared that such concentrations of slum population is not desirable and called for schemes which are smaller in nature and mixed. Subsequently,
a high level committee was set up to prepare a policy or set of guidelines and norms, to be adopted whenever rehabilitation and resettlement of around 5000 households is to be provided (HLRN & IRCDUC, 2014). So far Tamil Nadu does not have a state resettlement and rehabilitation policy.
Currently the TNSCB’s activities are almost exclusively oriented towards building large-scale resettlement colonies on the outskirts of Chennai, Raman (2011) in the last decade the number and scale of slum evictions in Chennai seems to be on the rise. This is a departure from the early years when the TNSCB, set up in 1971, primarily built a small number of tenements in the same place where the slums were. The TNSCB in the early days was dominated by the priorities of the state and the state level political parties. As a result, shelter strategies were heavily influenced by politics of patronage, and had a formal orientation away from eviction and resettlement, towards in-situ tenement construction, and an informal tendency to protect and reward, particularly to those groups of the urban poor that political parties were trying to court for their votes, such as the fishermen (Raman, 2008, pp. 23-24). After the World Bank came in and began lending to Tamil Nadu, the policy focus shifted from in-situ upgrading to resettlement due to loan conditionalities imposed by the Bank. This attempted to minimize the effects of politics on agency behavior (Raman, 2008, p. 62).

CASE STUDY
| HUDCO - HSMI Publication 72
Raman argues that the policies of the TNSCB nowadays result from a combination of local (influence of the Bank, institutional changes that delink TNSCB to politics of patronage protecting the poor), national (seek grant from national government through JNNURM, RAY, the Mega City programme, Vambay etc.) and international politics and policies (attracting FDI) (2008, p. 62).
The argument used by the TNSCB to justify the relocation of inner/city slum dwellers to the outskirts is the lack of availability of land, while, according the NGO Transparent Chennai, an RTI filed on excess lands available under the Urban Land Ceiling Act reveals that the government has 10.42 sq. kilometers of unused land available to them under the Act throughout Chennai district (Raman, 2012, p.1).
Also, as observed by Raman (2012), the status of a slum, recognized-not recognized, is not of any influence on whether and how the inhabitants are resettled. Eviction procedures and eligibility for resettlement seem to be set on an ad hoc basis, dependent on the slums location, the type of infrastructure project that displaces them, and how the project is funded. This has as a result always left slum dwellers in the dark about their entitlements. As an example she mentions the case of Ambattur Lake, which at the time of evictions, was outside the corporation boundaries. People were evicted by the Public Works Departments and left out in the open for before they were finally given access to land at Morai.
a resettlement project from the early 1990’s, 15 kilometres from the city center at that time, people were moved to plots, which they would own after installments were paid.
Maa
rtje
van
Eer
d, D
ecem
ber 2
014
Maa
rtje
van
Eer
d, D
ecem
ber 2
014
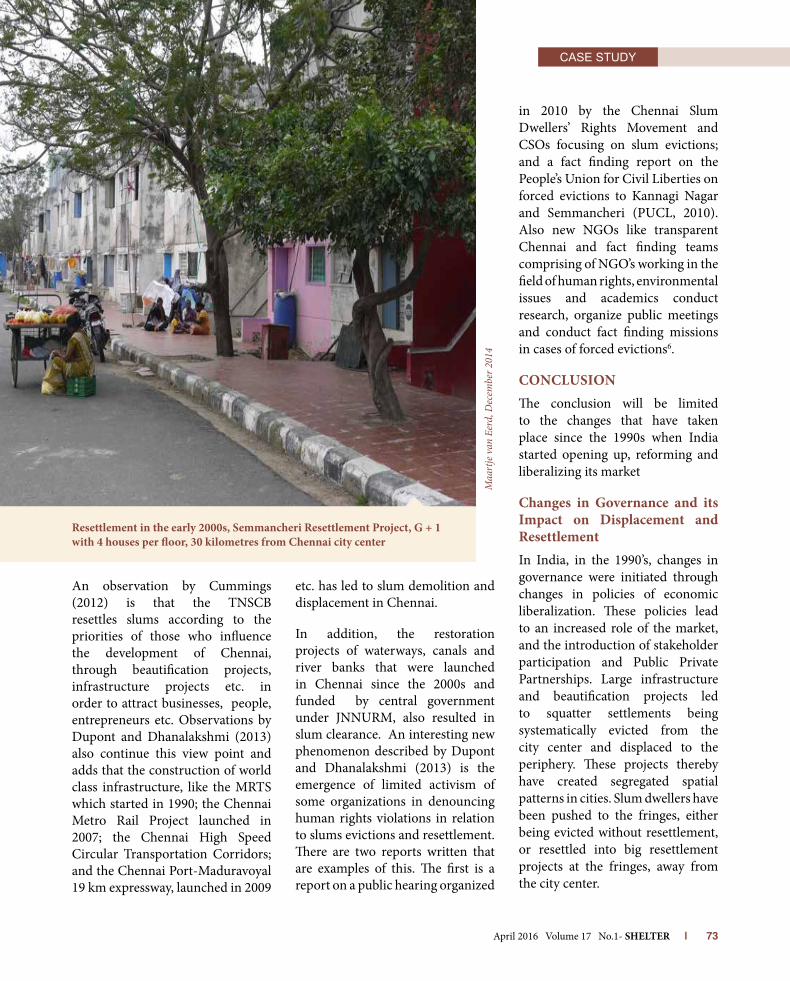
CASE STUDY
April 2016 Volume 17 No.1- SHELTER | 73
An observation by Cummings (2012) is that the TNSCB resettles slums according to the priorities of those who influence the development of Chennai, through beautification projects, infrastructure projects etc. in order to attract businesses, people, entrepreneurs etc. Observations by Dupont and Dhanalakshmi (2013) also continue this view point and adds that the construction of world class infrastructure, like the MRTS which started in 1990; the Chennai Metro Rail Project launched in 2007; the Chennai High Speed Circular Transportation Corridors; and the Chennai Port-Maduravoyal 19 km expressway, launched in 2009
etc. has led to slum demolition and displacement in Chennai.
In addition, the restoration projects of waterways, canals and river banks that were launched in Chennai since the 2000s and funded by central government under JNNURM, also resulted in slum clearance. An interesting new phenomenon described by Dupont and Dhanalakshmi (2013) is the emergence of limited activism of some organizations in denouncing human rights violations in relation to slums evictions and resettlement. There are two reports written that are examples of this. The first is a report on a public hearing organized
in 2010 by the Chennai Slum Dwellers’ Rights Movement and CSOs focusing on slum evictions; and a fact finding report on the People’s Union for Civil Liberties on forced evictions to Kannagi Nagar and Semmancheri (PUCL, 2010). Also new NGOs like transparent Chennai and fact finding teams comprising of NGO’s working in the field of human rights, environmental issues and academics conduct research, organize public meetings and conduct fact finding missions in cases of forced evictions6.
concLuSionThe conclusion will be limited to the changes that have taken place since the 1990s when India started opening up, reforming and liberalizing its market
changes in governance and its impact on displacement and ResettlementIn India, in the 1990’s, changes in governance were initiated through changes in policies of economic liberalization. These policies lead to an increased role of the market, and the introduction of stakeholder participation and Public Private Partnerships. Large infrastructure and beautification projects led to squatter settlements being systematically evicted from the city center and displaced to the periphery. These projects thereby have created segregated spatial patterns in cities. Slum dwellers have been pushed to the fringes, either being evicted without resettlement, or resettled into big resettlement projects at the fringes, away from the city center.
Resettlement in the early 2000s, Semmancheri Resettlement project, g + 1 with 4 houses per floor, 30 kilometres from chennai city center

CASE STUDY
| HUDCO - HSMI Publication 74
changes with Regard to the Role of the judiciary and ngos The middle class is growing in India, and thereby their power is also increasing. Research has shown that the judiciary is also increasingly ruling in favor of this group, and an increasingly hostile attitude of the courts towards slum dwellers has been observed.
On the other hand it can also be observed that more NGOs, supported by scholars, are emerging to lobby and work on behalf of the poor. They try to mobilize and support poor groups that are under threat of eviction, displacement and are denied their rights.
changes in Scale and impactThe scale of the resettlement projects is increasing and because of the scarcity of land more and more projects are going for high-rise thereby seriously impacting livelihood opportunities.
As the trend for resettlement is
increasingly going towards the fringe of urban areas, the negative impact is likely to increase.
noTES1Another version of this paper will be published in: Unfolding city governance in complex environments. Eds. M.P van Dijk, J. Edelenbos & K. van Rooijen, Practical Action (forthcoming).2Officially named as the Right to Fair Compensation and Transparency in Land Acquisition, Rehabilitation and Resettlement Act, 2013, Gazette of India.3The Jawaharlal Nehru National Urban Renewal Mission - JNNURM - was a very ambitious plan for urban renewal that was launched in 2005-2006, and planned to bring about radical transformations of urban spaces and urban economies. JNNURM made funds available to 65 cities that are inhabited by more than a million people under two sub-missions : Urban Infrastructure and Governance (UIG), administered by the Ministry of Urban Development (MoUD) and the Basic Services for the Poor (BSUP), administered by the Ministry of Housing and Urban Poverty Alleviation (HUPA). Chennai with its population of almost 8 million inhabitants was considered a ‘mega-city’ under the programme.4Middle Income Group 5High Income Group6See for instance the Stranded in Ruins report on evictions and demolitions in Ambattur.
acknowLEdgEMEnTThe author wishes to thank the following persons for providing valuable inputs: Neelima Risbud, Banashree Banerjee, S.K. Mahajan, Partha Mukhopadhyay, Mukta Naik, Shahana Sheikh, Kimberly M. Noronha, A.K. Jain, A.N. Krishnamurthy, Sundar Burra, Karen Coelho, Rekha Vicharya, B. Selvasundaram, R. Anbu and R. Dhanalakshmi. The views expressed in this paper are not necessarily those of the experts interviewed and should be attributed to the author only. REfEREncESAdaikalam, V. F., 2010, Eviction, housing and
livelihood in Chennai. Refugee Watch 36, Dec 2010, pp. 31-52.
Banerjee-Guha, S. 2009, Neoliberalising the ‘urban’: new geographies of power and injustice in Indian Cities. Economic and Political Weekly, Vol. XLIV, no. 22, pp. 95-107.
Baviskar, A. 2013, Participolis: protest and participation in the city, pp. 306-308. In: Coelho, K., Kamath, L., & Vijayabaskar, M. 2013, Participolis, consent and contention in Neoliberal urban India. Routledge, New Delhi.
Bhan, G. 2009. “This is no longer the city I once knew”. Evictions, the urban poor and the right to the city in millennium Delhi. Environment and Urbanization, 2009, vol. 21(1): pp.127-142.
Bhide, A. 2009, Shifting terrains of communities and community organization: reflections on organizing for housing rights in Mumbai. Community Development Journal, vol.44,
The latest resettlement project: perumbakkam resettlement project, g+7, 30 kilometers from the city centre, occupation started early 2015
CASE STUDY
April 2016 Volume 17 No.1- SHELTER | 75
no.3, pp.367-381. Birkinshaw. M., Harris, V. 2009, The right to the
“world class city”? City visions and evictions in Mumbai. The Urban Reinventors. www.urbanreinventors.net [accessed 3 Feb 2014].
Cernea, M. 1988, Involuntary resettlement in development projects: policy guidelines in World Bank financed projects. Washington D.C., World Bank.
Cernea, M.M. 2000, Risks, safeguards and reconstruction, a model for population displacement and resettlement. Economic and Political Weekly, XXXXV, 41, pp. 3659-3678.
Cernea, M. M. 2009, Financing for development. Benefit-sharing mechanisms in population resettlement, pp. 49-77. In: Oliver-Smith, A., Development and dispossession, the crisis of forced displacement and resettlement. School of Advanced Research Press, Santa Fe, New Mexico.
COHRE, 2006, Forced evictions, violations of human rights. Global survey on forced evictions No. 10. Centre on Housing Rights and Evictions, Geneva, Switzerland.
Courtland Robinson, W., 2003. Risks and rights: the causes, consequences, and challenges of development-induced displacement, an occasional paper. The Brookings Institution – SAIS Project on Internal Displacement, May 2003.
Cummings, C. 2012, Contesting the governance of slum resettlement. Power, interest and relations in the resettlement and rehabilitation of slum dwellers in Chennai, South India. Master Thesis in International Development Studies, University of Amsterdam.
De Wet, C, 2001, Economic development and population displacement, can everybody win? Economic and Political Weekly, pp. 4637-4646, Dec 15, 2001.
Doshi, S. 2012, The politics of the evicted: redevelopment, subjectivity, and difference in Mumbai’s slum frontiers. Antipode, Vol. 45, No. 2, pp.844-865.
Dupont, V., and Ramanathan, U., 2007. The courts and the squatter settlements in Delhi, pp. 312-343. In: Baud, I.S.A and De Wit, J., 2007. New forms of urban governance in India. Sage publications, New Delhi, India.
Dupont, V., and Dhanalakshmi R, 2013, Chennai, India, in: Addressing sub-standard settlements, WP 3, Settlement Fieldwork Report, Chance2Sustain.
Dupont, V. 2008, Slum demolitions in Delhi since the 1990s: an appraisal, in: Economic and Political Weekly, July 12, 2008.
Dupont, V. 2011a, The challenge of slums and forced evictions, pp. 76-97. In: Urban policies and the right to the city in India, rights, responsibilities and citizenship. UNESCO, New Delhi.
Dupont, V. 2011, The dream of Delhi as a global city. International Journal of Urban and Regional Research, Vol. 35.3, May 2011, pp. 533-545.
Dwivedi, R. 2002, Models and methods in development-induced displacement (Review article). Development and change 33(4): 709-732.
Dwivedi, R., 2006, Conflict and collective action. The Sardar Sarovar Project in India. Routledge, New Delhi.
Ellis, R. 2013, Public performances: enacting citizenship through public consultation for Chennai’s second Masterplan, pp. 256-275. In: Coelho, K., Kamath, L., & Vijayabaskar, M. 2013, Participolis, consent and contention in Neoliberal urban India. Routledge, New Delhi.
Fernandes, W, 2004, Rehabilitation as a right: where is the policy? Paper presented at the International Seminar on Development and Displacement: Afro-Asian Perspectives, Osmania University, Hyderabad, November 27-29.
Fernandes, W., 2008, Sixty years of development-induced displacement in India, scale, impacts and the search for alternatives, pp. 89-102. In: Council for Social Development, 2008. Indian Social Development Report, 2008. Oxford University Press, New Delhi.
Gazette of India, Sept. 27, No. 40, Part II-section 1. http://indiacode.nic.in/acts-in-pdf/302013.pdf [accessed 26-6-2015].
HLRN & IRCDUC, 2014, Forced to the fringes. Disasters of resettlement in India, report 2, Kannagi Nagar, Chennai.
Kundu, A., Mohanan, P.C., & Vargese, K. 2013, Spatial and social inequalities in human development: India in the global context. UNDP, India.
Kundu, A. 2013, Making Indian cities slum-free, vision and operationalization. Economic and Political Weekly, Vol 48, No. 17.
Mariotti, C. 2012, Displacement, resettlement and adverse incorporation in Andhra Pradesh. The case of the Polavaram Dam. PhD thesis in Economics, Department of Economics, School of Oriental and African studies, University of London.
Viratkapan, V., Perera, R. 2006, Slum relocation projects in Bangkok: what has contributed to their success or failure? Habitat International, Vol. 30, pp. 157-174.
Mathur, H.M. ed. 2006, Managing resettlement in India, approaches, issues, experiences. Oxford University Press, New Delhi.
Mehta, L. 2011, The settler and his wife, gender and the politics of displacement, pp. 25-43. DEP, No. 17.
Mehta, L., (ed.). 2009, Displaced by development, confronting marginalization and gender injustice. Sage Publications, New Delhi.
Muggah, R. 2008, Relocation failures in Sri Lanka, a short history of internal displacement and resettlement. London, Zed Books
Nandi, S., and Gamkar, S., 2013, Urban challenges in India: a review of recent policy measures. Habitat International, vol. 39, pp. 55-61.
Navarra, M. Quetulio. 2014, Mending new communities after involuntary resettlement in the Philippines and Indonesia. PhD thesis Wageningen, unpublished.
Oliver-Smith, A. (ed.). 2009, Development and dispossession, the crisis of forced displacement and resettlement. School of Advanced Research Press, Santa Fe, New Mexico.
Pierre, J.E., 1998. Partnerships in urban governance: European and American Experience. Mac Millan, London.
PUCL 2010, Report of PUCL fact finding team on forced evictions and rehabilitation of slum dwellers in Chennai. Fact finding report organized by people’s union for Civil Liberties – Tamil Nadu and Puducherry, 2010. http://www.ids-uva.nl/wordpress/wp-content/uploads/2011/08/7-PUCL-Report.pdf [accessed 4-2-2015]
Rajagopal, B., 2007, Pro-human rights but anti-poor? A critical evaluation of the Indian Supreme Court from a social movement perspective. Human Rights Review, Vol 18, No 3, pp.157-187.
Raman, N., 2008, The politics and anti-politics of shelter-policy in Chennai, India. Master in Planning Thesis MIT, USA.
Raman, N.V. 2011, The board and the bank: changing policies towards slums in Chennai. Economic and Political Weekly, Vol. 46, No. 31, pp. 74-80.
Raman, N.V. 2012, Summary Analysis of slum policies in Chennai and their implementation. Transparent Chennai, document prepared by Transparent Chennai for workshop on July 21, 2012.
Rao, U. 2013, Tolerated encroachment: resettlement policies and the negotiation of the licit/illicit divide in an Indian

CASE STUDY
| HUDCO - HSMI Publication 76
metropolis. Cultural Anthropology, Vol. 28, Issue 4, pp.760-779.
Roy, A., 1999, The greater common good. India Book Distributors, Bombay.
Roy, A. 2011, The blockage of the world-class city: dialectical images of Indian urbanism, chapter 10, pp. 258-278. In: Roy, A., Ong, A (eds.). Worlding cities, Asian experiments and the art of being global. Wiley, Blackwell, UK.
Ruet, J., Tawa Lama-Rewal, S. 2009. Governing India’s metropolises. Routledge: New Delhi.
Sharma, R.N., 2010, Changing facets of involuntary displacement and resettlement. Social Change, Vol 40, No. 4, pp. 503-524.
Stranded in Ruins. Fact finding visit to the sites of evictions and demolitions in Ambattur Municipality.
Tamil Nadu Slum Areas (Improvement and Clearance) Act, 1971.
Van Eerd. M., 2008, Local initiatives in relocation, the state and the NGOs as partners? From research to action. Manohar Publishers, New Delhi.
Zerah, M-H. Dupont, V, Tawa Lama-Rewal, S. Faetenini, M. 2011, Urban policies and the right to the city in India: rights, responsibilities and citizenship. UNESCO, New Delhi, India.
wEbSiTEShttp://www.ifad.int/sla/ [accessed 9-9-2014]http://www.cmdachennai.gov.in/ [accessed 27
January 2014]. http://www.cmdachennai.gov.in/ [accessed 27
January 2014].
UNIoN BUdgEt 2016-17: A Boost for Affordable Housing
Provision of affordable housing has been a priority area of the Government of In-dia since Independence. In order to fulfill the national goal of ‘Affordable Housing for All’ by 2022, the Government of In-dia has come out with a mission in the name of Pradhan Mantri Awas Yojana(P-MAY)-Housing for All (Urban) to facilitate construction of 20 million houses by 2022, especially for urban poor in a time bound manner. Towards this, the Union Budget 2016-17 has made some key provisions that will boost the housing finance sector in general and affordable housing in par-ticular. Some of the key measures regard-ing housing are as under:
(i) In order to fuel activity in the housing sector, it is proposed to give 100 per cent deduction for profits to an un-dertaking from a housing project for flats up to 30 sqm. in four metro cities and 60 sqm. in other cities, approved during June 2016 to March 2019, and is completed within three years of the approval. Minimum Alternate Tax will, however, apply to these undertakings.
(ii) Service tax on construction of afford-able houses up to 60 sqm. under any scheme of the Central or State Gov-ernment including PPP Schemes has been exempted. This will help in re-ducing the cost of affordable housing units. Further, excise duty exemption, presently available to Concrete Mix manufactured at site for use in con-struction work has been extended to Ready Mix Concrete as well.
(iii) In order to encourage the small home loan borrowers, the Union Budget 2016-17 has provided additional inter-est deduction of Rs.50,000 per annum for first time home buyers for loans up to Rs. 35 lakh sanctioned during the next financial year, provided the value of the house does not exceed Rs.50 lakh. With this, the total fiscal incen-tive on a home loan is now Rs. 4 lakh, through deduction of interest (Rs. 2.5 lakh) and principal (Rs. 1.5 lakh). For a loan of Rs. 35 lakh for 20 years availed at 9 per cent interest rate, the inter-est outgo in the first year would be Rs. 3.12 lakh. So, the buyer will save Rs.75,000, if s/he is in the 30 per cent income tax bracket, bringing down the effective interest rate in the first year to 6.8 per cent. This measure is ex-pected to encourage first-time home buyers to invest in housing market, thereby increasing the flow of funds to the housing sector.
(iv) Another significant step taken in the Union Budget 2016-17 is stimulating investment in housing sector through encouraging investments in Real Es-tate Investment Trusts (REITs). As per the Budget provisions, any distribu-tion made out of income of project to the REITs and Infrastructure Invest-ment Trusts (InvITs) having specified shareholding will not be subjected to Dividend Distribution Tax, which is at present 17 per cent. This measure would help in making REITs to become
a reality in India. Such Trusts are ex-pected to garner required investment in the real estate sector by providing regular income stream diversification and long-term capital appreciation to investors.
(v) The 2016-17 Union Budget also pro-vides tax relief on interest payment on home loan if the property bought, or under construction, is complet-ed within 5 years from the end of the financial year in which the loan was availed, instead of the current 3 years. This relief under section 24 of IT Act, could help tax saving of up to Rs.60,000 per annum.
(vi) For employees who do not get House Rent Allowance (HRA) benefits, the Union Budget raised the deduction against house rent from Rs.2,000 per month to Rs. 5,000/-. This would result in tax saving in the range of Rs.3,708 to Rs.12,204 depending upon the income slab of the employees.
All these tax concessions and rebates an-nounced in this year’s union budget would go a long way in meeting the longstanding demand of the housing sector to be given infrastructure status as well as serving the national goal of ‘Affordable Housing for All’ by 2022.
Contributed by Dr. Akshaya Kumar Sen and Ms. Nila Pandian, faculty, HUDCO’s Human Settlement Management Institute, New Delhi.

CASE STUDY
April 2016 Volume 17 No.1- SHELTER | 77
R. B. SuRyavanSHiv. G. Jana
The urban housing shortage today is pegged at over 18.78 million and to overcome this shortfall, colossal efforts, out-of-box thinking and adoption of innovative technology by the construction industry in our country would be required. Prefab systems are time tested and proven technology throughout the world. However, they should be appropriately chosen to suit the geographic, climatic and seismic conditions of India. Dedicated implementation team at state and district levels, headed by the highest authority, would ensure its implementation as per approved timelines.
Industrialized ‘3-S’ prefab technology, was developed by Padma Shri B.G. Shirke about 45 years ago. It has stood the test of time and has proven successful for the construction of residential buildings of 24 storeys, as on date. The technology comes loaded with a variety of technological advantages and financial benefits, besides sustainable features. The wide acceptance of the technology by numerous government and semi-government organizations has placed ‘3-S’ prefab technology as the most reliable solution to construct mass housing projects in various states of our country.
PM’S MiSSiOn - HOuSinG FOR aLLThe report of the Technical Group on Urban Housing Shortage (TG-12) states that there is total shortage of 18.78 million houses in urban areas. About 95 per cent of this shortage pertains to the Economically Weaker Section (EWS) and Low Income Group
(LIG). This is mainly because there has been extremely slow progress in providing affordable housing to this segment.
On 25th June 2015, the Hon’ble Prime Minister, while launching the “Pradhan Mantri Awas Yojana”-the affordable housing scheme, declared that 50 million houses will be built for the poor by 2022, out of which 30 million houses will be in rural areas and 20 million houses will be in the urban sector.
Fulfilling this ambitious programme of the Government, particularly for EWS & LIG categories, cannot be met by conventional methods and materials alone, because apart from being costly and scarce, they have to a larger extent outlived their technical and commercial usefulness. As a result, they have no capacity to touch even the fringe of the massive demand and supply situation prevailing in India, today. In order to meet this demand of housing, the country would require over 300 construction agencies, each having the capability to deliver at least 25,000 to 30,000 houses annually.
In several seminars at governmental and institutional levels held in the past, experts, have also come to the
HOUSING FOR ALL BY 2022Assessing the Benefits of Precast Technology
Shri R. B. Suryavanshi ([email protected]) and Shri V. G. Jana are working as Senior Chief Executive at B. G .Shirke Construction Technology Pvt. Ltd., Pune.
Precast technology becomes an optimal choice due to reduced construction time and lifecycle cost of buildings. it provides both speed and quality of construction and also capitalizes on the advantages that these large scale projects offer in terms of volume, turnover and repetition.

CASE STUDY
| HUDCO - HSMI Publication 78
unanimous conclusion that by use of prefab technology at least 70 to 80 per cent requirement of housing in urban areas, where multistoried structures are involved, can be met.
To fulfill the ambitious target of providing 20 million houses in urban areas and 30 million houses in rural areas by 2022, expeditious action is needed in all respects from the government bodies and institutions in selecting capable construction agencies, fast tracking statutory permissions through “single window”, identifying vacant land in DPR1 for housing of urban poor and timely disbursement of funds. To achieve this, all departments and construction agencies should work together in a time bound manner, thereby avoiding time and cost overruns.
Since this is a gigantic task, therefore a dedicated implementation team of concerned department and a separate monitoring team in every state and district should be constituted, to assess the progress against the planned time frame. At state level, the monitoring team may be headed by the Chief Minister or Minister in-charge and at district level, it may be headed by the respective MP or MLA.
PRECaST TECHnOLOGy: a Cost Effective Solution to Housing Shortage
With the increase in cost of material and labour, there is a need to adopt cost effective construction methods either by up-gradation of traditional technologies which sources local materials or by applying modern
construction materials and techniques which optimises inputs, leading to cost-effective solutions.
Precast technology becomes an optimal choice due to reduced construction time and lifecycle cost of buildings. It provides both speed and quality of construction and also capitalizes on the advantages that these large scale projects offer in terms of volume, turnover and repetition. Though, precast building construction industry is still in its nascent stage in India, it is rapidly emerging as the most sought after cost effective technology and is gradually replacing conventional technology that exist in India and all over the world. So far, precast technology has been mostly used in construction of large scale projects, like bridges, flyovers, tunnels and metro rails in India, but one can now witness its use in mass housing projects and, to some extent, in other commercial projects, such as hotels, hospitals, car parks, school buildings etc. The prefab technology can be attributed to conservation of fast depleting natural resources, environmental protection, ecological balance and sustainable development in line with the concept of green building. Precast concrete construction has been globally accepted as a faster, superior & cleaner building system.
Broadly, there are following 3 types of prefab systems being practiced in the world:A. Precast columns, beams, slabs
and walls.B. Precast long walls with hollow
core slabs.
C. Steel Structures (PEB Structures). –generally used for industrial structures.
Construction with precast concrete is sustainable, economical, high quality and earthquake-resistant. Thus, the only definite solution providing affordable mass housing, particularly for EWS2 & LIG3
categories, is to adopt tried, tested and proven prefab system.
The authorities in different states have also realized that awarding work on Lump Sum Turnkey (LSTK) basis using prefab technology is the only solution for executing mass housing schemes. Various authorities & housing boards from the states of Maharashtra, Delhi, Karnataka, Tamil Nadu, Bihar, Gujarat and Rajasthan etc. are inviting tenders on LSTK basis using prefab technology.
3-S PREFaB TECHnOLOGy
(a) Tried and Tested TechnologySHIRKE group is the pioneer in prefab building system and has
a Building Constructed for DDa
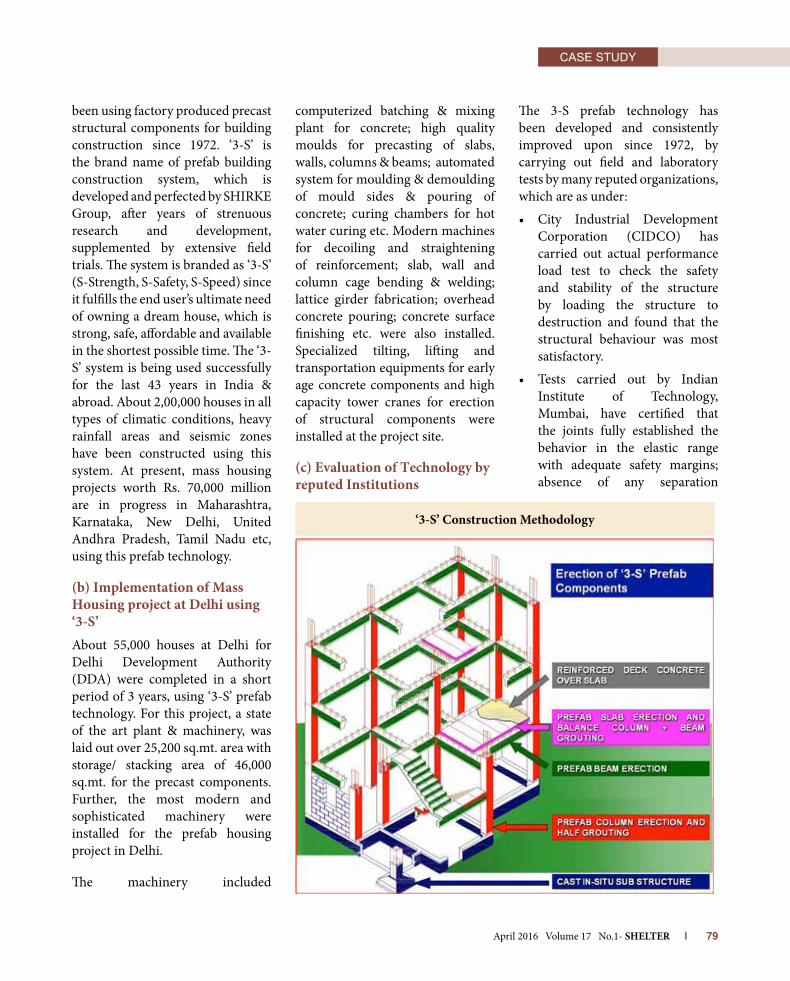
CASE STUDY
April 2016 Volume 17 No.1- SHELTER | 79
been using factory produced precast structural components for building construction since 1972. ‘3-S’ is the brand name of prefab building construction system, which is developed and perfected by SHIRKE Group, after years of strenuous research and development, supplemented by extensive field trials. The system is branded as ‘3-S’ (S-Strength, S-Safety, S-Speed) since it fulfills the end user’s ultimate need of owning a dream house, which is strong, safe, affordable and available in the shortest possible time. The ‘3-S’ system is being used successfully for the last 43 years in India & abroad. About 2,00,000 houses in all types of climatic conditions, heavy rainfall areas and seismic zones have been constructed using this system. At present, mass housing projects worth Rs. 70,000 million are in progress in Maharashtra, Karnataka, New Delhi, United Andhra Pradesh, Tamil Nadu etc, using this prefab technology.
(b) implementation of Mass Housing project at Delhi using ‘3-S’About 55,000 houses at Delhi for Delhi Development Authority (DDA) were completed in a short period of 3 years, using ‘3-S’ prefab technology. For this project, a state of the art plant & machinery, was laid out over 25,200 sq.mt. area with storage/ stacking area of 46,000 sq.mt. for the precast components. Further, the most modern and sophisticated machinery were installed for the prefab housing project in Delhi.
The machinery included
computerized batching & mixing plant for concrete; high quality moulds for precasting of slabs, walls, columns & beams; automated system for moulding & demoulding of mould sides & pouring of concrete; curing chambers for hot water curing etc. Modern machines for decoiling and straightening of reinforcement; slab, wall and column cage bending & welding; lattice girder fabrication; overhead concrete pouring; concrete surface finishing etc. were also installed. Specialized tilting, lifting and transportation equipments for early age concrete components and high capacity tower cranes for erection of structural components were installed at the project site.
(c) Evaluation of Technology by reputed institutions
The 3-S prefab technology has been developed and consistently improved upon since 1972, by carrying out field and laboratory tests by many reputed organizations, which are as under:
• City Industrial DevelopmentCorporation (CIDCO) has carried out actual performance load test to check the safety and stability of the structure by loading the structure to destruction and found that the structural behaviour was most satisfactory.
• Tests carried out by IndianInstitute of Technology, Mumbai, have certified that the joints fully established the behavior in the elastic range with adequate safety margins; absence of any separation
‘3-S’ Construction Methodology

CASE STUDY
| HUDCO - HSMI Publication 80
State of art Precast Component Manufacturing Factory
cracks or any structural distress in the joints; adequacy of the bare portal to offer resistance to horizontal forces; ultimate load is on the higher side and ductility ratio is more than what is specified and required; joints of the beam column connections have behaved as monolithic, as designed.
• TORSteelResearchFoundationof India has carried out the tests and concluded that there is no distress feature in any of the joints and assembly of precast units is safe for resisting the loads for which they were designed.
• Tests carried out by CivilEngineering Department,
Stanford University, certified that the design calculations & detailing of the structure were such that the buildings should provide safe and desired performance for vertical loads, seismic loads & the wind loads.
• Central Building ResearchInstitute (CBRI), Roorkee, has also carried out tests on full scale building structure and established the desired performance and behaviour of ‘3-S prefab building system under all design load conditions (including seismicity of Zone-IV category) for high rise buildings. CBRI has also certified that protective treatment given to steel reinforcement in Siporex is quite effective compared to corrosion of steel in normal conventional concrete.
(d) advantages of Precast Technology
Technical
•Reduction indeadweightdue tolight weight prefab components is beneficial from seismic considerations.
• Use of fire resistant Siporexproducts enhances the safety of the buildings
•Thermal insulation properties ofSiporex products leads to increased comfort levels inside the buildings.
•Precaststructuralmembersreducethe cycle time required for each floor is reduced substantially.
• Elimination of plaster on precastunits, such as slab, wall panel etc., since these components are form finished.
• Quality is ensured as structuralunits are manufactured in permanent/ site factories and adhere to the norms of BIS(ISI).
• Considerable reduction in thequantities of natural resources, such as sand, metal, water, wood etc.
Financial
• Saving in planning& design fee,due to turnkey projects.
•Reduction indeadweight resultsin saving in foundation and frame work cost.
•Savingdue toeliminationof slaband wall panel plaster.
•Fastandearlycompletionyieldthefollowing financial benefits:
➢ Saving in interest on investment.
➢ Saving in escalation cost
➢ Saving in establishment cost
➢ Early return on investments
•Costsavinginmaintenanceduetoquality construction.
In case tangible and intangible financial benefits are quantified, this technology results in time saving of 15 to 20 per cent and cost saving of about 30 to 40 per cent.
(d) Environment Friendly Technology:
‘3-S’ prefab technology is eco-friendly due to judicious use of construction materials, reduction in wastage, use of durable materials & energy efficient materials and use of products that contribute to a safe and healthy built environment. Further
Precast Beam Casting (1800 Rmt /Day)
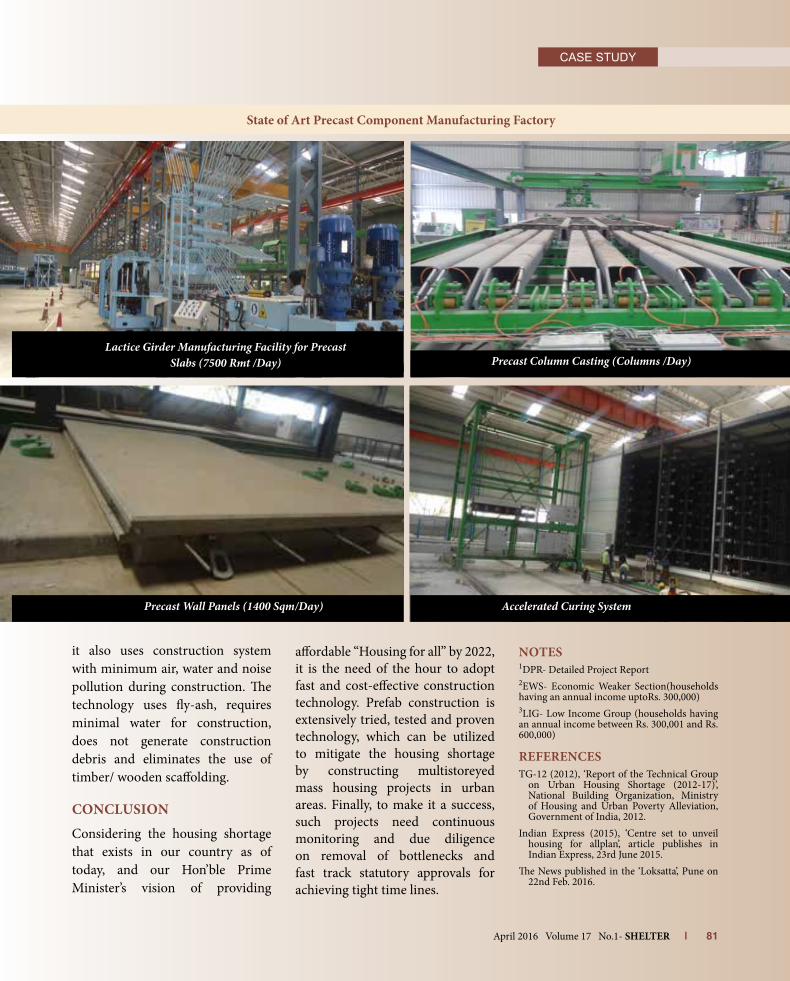
CASE STUDY
April 2016 Volume 17 No.1- SHELTER | 81
it also uses construction system with minimum air, water and noise pollution during construction. The technology uses fly-ash, requires minimal water for construction, does not generate construction debris and eliminates the use of timber/ wooden scaffolding.
COnCLuSiOn
Considering the housing shortage that exists in our country as of today, and our Hon’ble Prime Minister’s vision of providing
affordable “Housing for all” by 2022, it is the need of the hour to adopt fast and cost-effective construction technology. Prefab construction is extensively tried, tested and proven technology, which can be utilized to mitigate the housing shortage by constructing multistoreyed mass housing projects in urban areas. Finally, to make it a success, such projects need continuous monitoring and due diligence on removal of bottlenecks and fast track statutory approvals for achieving tight time lines.
nOTES1DPR- Detailed Project Report2EWS- Economic Weaker Section(households having an annual income uptoRs. 300,000)3LIG- Low Income Group (households having an annual income between Rs. 300,001 and Rs. 600,000)
REFEREnCESTG-12 (2012), ‘Report of the Technical Group
on Urban Housing Shortage (2012-17)’, National Building Organization, Ministry of Housing and Urban Poverty Alleviation, Government of India, 2012.
Indian Express (2015), ‘Centre set to unveil housing for allplan’, article publishes in Indian Express, 23rd June 2015.
The News published in the ‘Loksatta’, Pune on 22nd Feb. 2016.
State of art Precast Component Manufacturing Factory
Lactice Girder Manufacturing Facility for Precast Slabs (7500 Rmt /Day) Precast Column Casting (Columns /Day)
Precast Wall Panels (1400 Sqm/Day) Accelerated Curing System

Housing situation analysis
| HUDCO - HSMI Publication 82
DEBOLINA KUNDU PRAGYA SHARMA ARPITA BANERJEE
A spatial overview on availability of housing and urban basic services reveals severe disparities across the country at the city level. Although the government launched several programmes for provisioning of basic services to urban dwellers during different plan periods, the coverage has been far from satisfactory. The growing urban population creates a serious deficiency of urban infrastructure. There are marked differences in access to housing and basic infrastructure across metropolitan and non-metropolitan Class I cities. This happens because of big city bias of the programmes. Moreover, large cities have the capacity to avail loans from financial institutions. The small towns are generally not in a position to obtain state government’s guarantee or avail institutional finance due to weak economic base and uncertain financial position. This definitely affects the overall level of services in these towns.
INTRODUcTIONUrbanization plays an important role in the growth of the country’s economy. The level of urbanization in India is one of the lowest in the world and in 2014, only 32.4 per cent of the country’s population lived in urban areas as compared to 54.4 per cent in China, 93 per cent in Japan, 82.4 per cent in Republic of Korea etc (UNDESA, 2012). Also, the country followed a moderate pace of urbanization with exponential growth rate of 2.73 per cent in 1991-2001 which increased
slightly to 2.76 per cent in 2001-2011. However, this slow growth rate is obscured when an increase in actual number of population is taken into account. In 1991, 215.8 million population were urban dwellers which increased to 286.1 million in 2001 and to 377.1 million in 2011 (Census of India). In the last decade (2001-2011), in metropolitan cities the proportion of urban population has increased from 37.8 to 42.3 per cent whereas, in non-metropolitan Class I cities1, the share of population declined from 30.8 to 27.9 per cent. Not merely in terms of population, metropolitan and non-metropolitan Class I cities markedly differ in terms of access to housing and basic infrastructure also. For example, the status of basic services in the metropolitan cities in India in terms of safe drinking water, latrine within premises etc is uniformly better than non-metropolitan Class I cities, suggesting a direct linkage between size of the city and level of civic services.
Existing literature suggests that higher level of poverty and deprivation in terms of quality of life is noted in small towns as compared to large cities. Further, globalisation has opened up several possibilities of resource mobilization for large cities strengthening their internal
HOUSING AND BASIC INFRASTRUCTURE Differential access across Metropolitan and Non-metropolitan
Class I Cities of India
Debolina Kundu ([email protected]) is Associate Professor at the National Institute of Urban Affairs, New Delhi. Ms. Pragya Sharma and Ms. Arpita Banerjee are both working as Research Fellow in the same institute.
Amongst the eight big metros, Greater Mumbai has an acute adequate housing problem and lack of space, with 7.7 per cent having no exclusive room and a further 57.3 per cent living in just one room. The situation of adequate housing is also quite critical in Kolkata and chennai
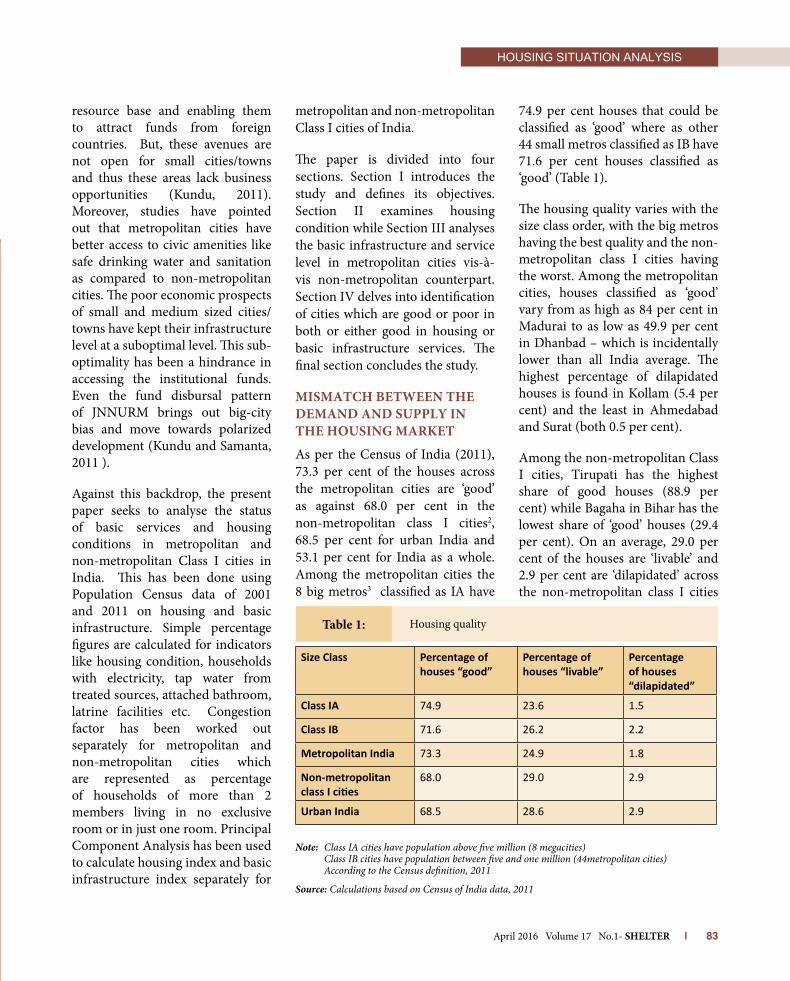
Housing situation analysis
April 2016 Volume 17 No.1- SHELTER | 83
resource base and enabling them to attract funds from foreign countries. But, these avenues are not open for small cities/towns and thus these areas lack business opportunities (Kundu, 2011). Moreover, studies have pointed out that metropolitan cities have better access to civic amenities like safe drinking water and sanitation as compared to non-metropolitan cities. The poor economic prospects of small and medium sized cities/towns have kept their infrastructure level at a suboptimal level. This sub-optimality has been a hindrance in accessing the institutional funds. Even the fund disbursal pattern of JNNURM brings out big-city bias and move towards polarized development (Kundu and Samanta, 2011 ).
Against this backdrop, the present paper seeks to analyse the status of basic services and housing conditions in metropolitan and non-metropolitan Class I cities in India. This has been done using Population Census data of 2001 and 2011 on housing and basic infrastructure. Simple percentage figures are calculated for indicators like housing condition, households with electricity, tap water from treated sources, attached bathroom, latrine facilities etc. Congestion factor has been worked out separately for metropolitan and non-metropolitan cities which are represented as percentage of households of more than 2 members living in no exclusive room or in just one room. Principal Component Analysis has been used to calculate housing index and basic infrastructure index separately for
metropolitan and non-metropolitan Class I cities of India.
The paper is divided into four sections. Section I introduces the study and defines its objectives. Section II examines housing condition while Section III analyses the basic infrastructure and service level in metropolitan cities vis-à-vis non-metropolitan counterpart. Section IV delves into identification of cities which are good or poor in both or either good in housing or basic infrastructure services. The final section concludes the study.
MISMATcH BETwEEN THE DEMAND AND SUPPLY IN THE HOUSING MARKET
As per the Census of India (2011), 73.3 per cent of the houses across the metropolitan cities are ‘good’ as against 68.0 per cent in the non-metropolitan class I cities2, 68.5 per cent for urban India and 53.1 per cent for India as a whole. Among the metropolitan cities the 8 big metros3 classified as IA have
74.9 per cent houses that could be classified as ‘good’ where as other 44 small metros classified as IB have 71.6 per cent houses classified as ‘good’ (Table 1).
The housing quality varies with the size class order, with the big metros having the best quality and the non-metropolitan class I cities having the worst. Among the metropolitan cities, houses classified as ‘good’ vary from as high as 84 per cent in Madurai to as low as 49.9 per cent in Dhanbad – which is incidentally lower than all India average. The highest percentage of dilapidated houses is found in Kollam (5.4 per cent) and the least in Ahmedabad and Surat (both 0.5 per cent).
Among the non-metropolitan Class I cities, Tirupati has the highest share of good houses (88.9 per cent) while Bagaha in Bihar has the lowest share of ‘good’ houses (29.4 per cent). On an average, 29.0 per cent of the houses are ‘livable’ and 2.9 per cent are ‘dilapidated’ across the non-metropolitan class I cities
Size Class Percentage of houses “good”
Percentage of houses “livable”
Percentage of houses “dilapidated”
Class IA 74.9 23.6 1.5
Class IB 71.6 26.2 2.2
Metropolitan India 73.3 24.9 1.8
Non-metropolitan class I cities
68.0 29.0 2.9
Urban India 68.5 28.6 2.9
Note: Class IA cities have population above five million (8 megacities) Class IB cities have population between five and one million (44metropolitan cities) According to the Census definition, 2011
Source: Calculations based on Census of India data, 2011
Housing quality Table 1:
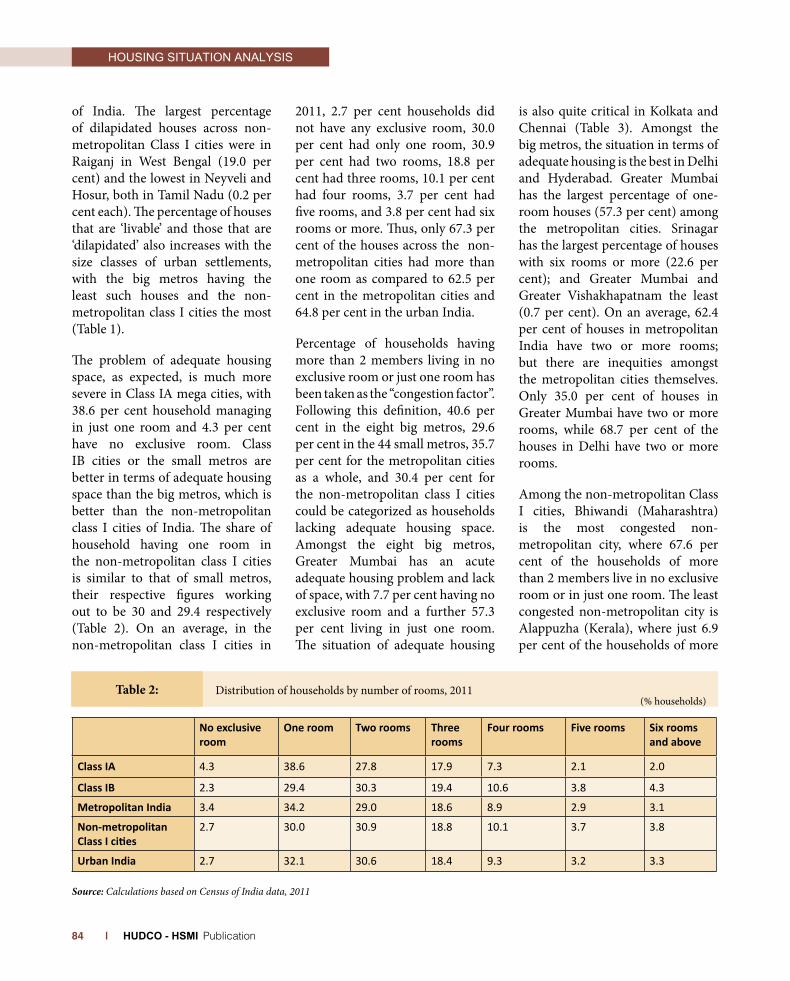
Housing situation analysis
| HUDCO - HSMI Publication 84
of India. The largest percentage of dilapidated houses across non-metropolitan Class I cities were in Raiganj in West Bengal (19.0 per cent) and the lowest in Neyveli and Hosur, both in Tamil Nadu (0.2 per cent each). The percentage of houses that are ‘livable’ and those that are ‘dilapidated’ also increases with the size classes of urban settlements, with the big metros having the least such houses and the non-metropolitan class I cities the most (Table 1).
The problem of adequate housing space, as expected, is much more severe in Class IA mega cities, with 38.6 per cent household managing in just one room and 4.3 per cent have no exclusive room. Class IB cities or the small metros are better in terms of adequate housing space than the big metros, which is better than the non-metropolitan class I cities of India. The share of household having one room in the non-metropolitan class I cities is similar to that of small metros, their respective figures working out to be 30 and 29.4 respectively (Table 2). On an average, in the non-metropolitan class I cities in
2011, 2.7 per cent households did not have any exclusive room, 30.0 per cent had only one room, 30.9 per cent had two rooms, 18.8 per cent had three rooms, 10.1 per cent had four rooms, 3.7 per cent had five rooms, and 3.8 per cent had six rooms or more. Thus, only 67.3 per cent of the houses across the non-metropolitan cities had more than one room as compared to 62.5 per cent in the metropolitan cities and 64.8 per cent in the urban India.
Percentage of households having more than 2 members living in no exclusive room or just one room has been taken as the “congestion factor”. Following this definition, 40.6 per cent in the eight big metros, 29.6 per cent in the 44 small metros, 35.7 per cent for the metropolitan cities as a whole, and 30.4 per cent for the non-metropolitan class I cities could be categorized as households lacking adequate housing space. Amongst the eight big metros, Greater Mumbai has an acute adequate housing problem and lack of space, with 7.7 per cent having no exclusive room and a further 57.3 per cent living in just one room. The situation of adequate housing
is also quite critical in Kolkata and Chennai (Table 3). Amongst the big metros, the situation in terms of adequate housing is the best in Delhi and Hyderabad. Greater Mumbai has the largest percentage of one-room houses (57.3 per cent) among the metropolitan cities. Srinagar has the largest percentage of houses with six rooms or more (22.6 per cent); and Greater Mumbai and Greater Vishakhapatnam the least (0.7 per cent). On an average, 62.4 per cent of houses in metropolitan India have two or more rooms; but there are inequities amongst the metropolitan cities themselves. Only 35.0 per cent of houses in Greater Mumbai have two or more rooms, while 68.7 per cent of the houses in Delhi have two or more rooms.
Among the non-metropolitan Class I cities, Bhiwandi (Maharashtra) is the most congested non-metropolitan city, where 67.6 per cent of the households of more than 2 members live in no exclusive room or in just one room. The least congested non-metropolitan city is Alappuzha (Kerala), where just 6.9 per cent of the households of more
No exclusive room
One room Two rooms Three rooms
Four rooms Five rooms Six rooms and above
Class IA 4.3 38.6 27.8 17.9 7.3 2.1 2.0
Class IB 2.3 29.4 30.3 19.4 10.6 3.8 4.3
Metropolitan India 3.4 34.2 29.0 18.6 8.9 2.9 3.1
Non-metropolitan Class I cities
2.7 30.0 30.9 18.8 10.1 3.7 3.8
Urban India 2.7 32.1 30.6 18.4 9.3 3.2 3.3
Source: Calculations based on Census of India data, 2011
Distribution of households by number of rooms, 2011(% households)
Table 2:
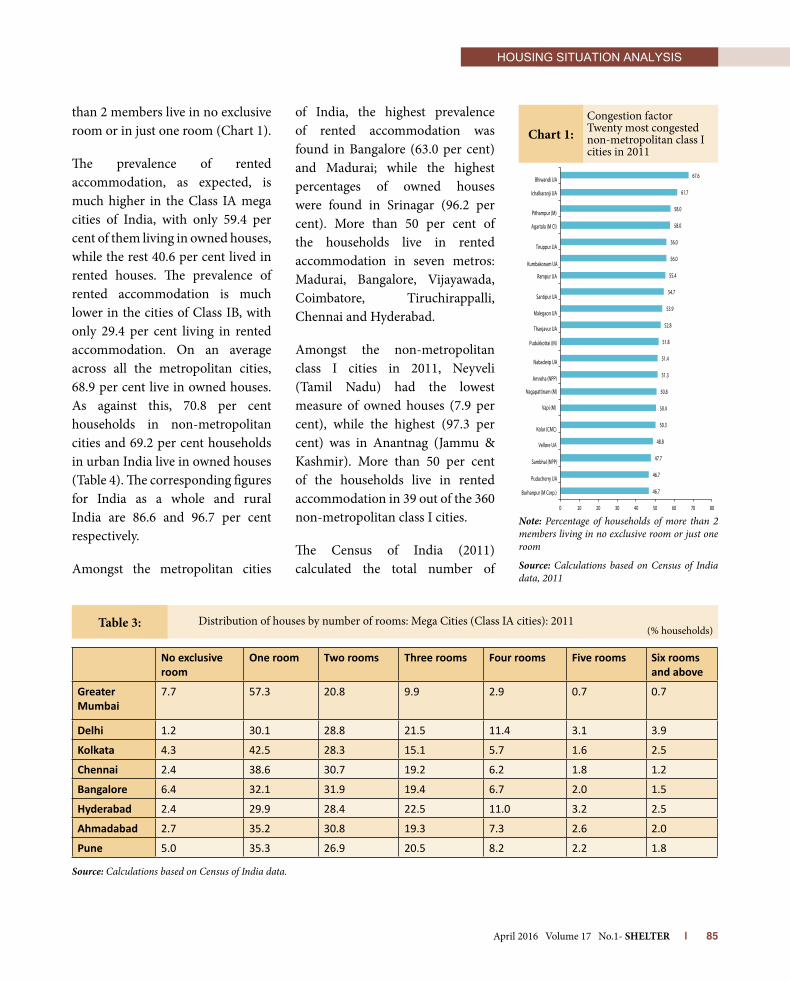
Housing situation analysis
April 2016 Volume 17 No.1- SHELTER | 85
than 2 members live in no exclusive room or in just one room (Chart 1).
The prevalence of rented accommodation, as expected, is much higher in the Class IA mega cities of India, with only 59.4 per cent of them living in owned houses, while the rest 40.6 per cent lived in rented houses. The prevalence of rented accommodation is much lower in the cities of Class IB, with only 29.4 per cent living in rented accommodation. On an average across all the metropolitan cities, 68.9 per cent live in owned houses. As against this, 70.8 per cent households in non-metropolitan cities and 69.2 per cent households in urban India live in owned houses (Table 4). The corresponding figures for India as a whole and rural India are 86.6 and 96.7 per cent respectively.
Amongst the metropolitan cities
of India, the highest prevalence of rented accommodation was found in Bangalore (63.0 per cent) and Madurai; while the highest percentages of owned houses were found in Srinagar (96.2 per cent). More than 50 per cent of the households live in rented accommodation in seven metros: Madurai, Bangalore, Vijayawada, Coimbatore, Tiruchirappalli, Chennai and Hyderabad.
Amongst the non-metropolitan class I cities in 2011, Neyveli (Tamil Nadu) had the lowest measure of owned houses (7.9 per cent), while the highest (97.3 per cent) was in Anantnag (Jammu & Kashmir). More than 50 per cent of the households live in rented accommodation in 39 out of the 360 non-metropolitan class I cities.
The Census of India (2011) calculated the total number of
chart 1:
No exclusive room
One room Two rooms Three rooms Four rooms Five rooms Six rooms and above
Greater Mumbai
7.7 57.3 20.8 9.9 2.9 0.7 0.7
Delhi 1.2 30.1 28.8 21.5 11.4 3.1 3.9
Kolkata 4.3 42.5 28.3 15.1 5.7 1.6 2.5
Chennai 2.4 38.6 30.7 19.2 6.2 1.8 1.2
Bangalore 6.4 32.1 31.9 19.4 6.7 2.0 1.5
Hyderabad 2.4 29.9 28.4 22.5 11.0 3.2 2.5
Ahmadabad 2.7 35.2 30.8 19.3 7.3 2.6 2.0
Pune 5.0 35.3 26.9 20.5 8.2 2.2 1.8
Source: Calculations based on Census of India data.
Note: Percentage of households of more than 2 members living in no exclusive room or just one room
Source: Calculations based on Census of India data, 2011
Distribution of houses by number of rooms: Mega Cities (Class IA cities): 2011
Congestion factorTwenty most congested non-metropolitan class I cities in 2011
(% households)Table 3:
46.7
46.7
47.7
48.8
50.3
50.4
50.8
51.3
51.4
51.8
52.8
53.9
54.7
55.4
56.0
56.0
58.0
58.0
61.7
67.6
0 10 20 30 40 50 60 70 80
Bhiwandi UA
Ichalkaranji UA
Pithampur (M)
Agartala (M Cl)
Tiruppur UA
Kumbakonam UA
Rampur UA
Vellore UA
Kolar (CMC)
Vapi (M)
Nagapattinam (M)
Amroha (NPP)
Nabadwip UA
Pudukkottai (M)
Thanjavur UA
Malegaon UA
Santipur UA
Burhanpur (M Corp.)
Puducherry UA
Sambhal (NPP)

Housing situation analysis
| HUDCO - HSMI Publication 86
census houses in urban India as 110.14 million, of which 11.09 million were vacant and a further 0.73 million were occupied but locked. The 360 non-metropolitan class I cities had 24.61 million census houses (22 per cent of the total urban India), of which 2.30 million (9.2 per cent) were vacant and 0.16 million were occupied but locked during the survey. Against this, the 52 metropolitan cities in India have a total of 33.70 million census houses, of which 3.40 million are vacant and 0.28 million were occupied but locked during the survey. This shows the large mismatch between demand and supply in the housing market.
According to the data on housing stock, amenities and assets in slums (Census 2011), total number of households in urban India is 78.9 million, out of which 13.7 million are slum households while the rest (65.2 million) are non-slum households. In terms of population, 60.3 million people live in slums in 2,543 statutory towns4 which constitute 16 per cent of the total
population living in the 7933 towns and cities. Out of the total number of 13.7 million slum households, 5.1 million (37 per cent) are located in metropolitan cities. The Class IA mega cities (group of eight) have a marginally higher proportion of slum population (22.89 per cent) compared to that in the Class IB cities (19.41 per cent).
Amongst the metros, Greater Vishakhapatnam has the highest percentage of households living in slums at 44.14 per cent, followed by Jabalpur (43.26 per cent) and Greater Mumbai (41.33 per cent). Thiruvananthapuram has the least percentage of households living in slums at just 0.71 per cent. Out of the non-metropolitan class I cities, only 307 have reported slums. An astonishing 97.6 per cent of the population of Siddipet (now in Telangana) has been reported to be living in slums. This is followed by Kamptee (Maharashtra), in which 91.6 per cent lives in slums, and Jagtial (now in Telangana), where 90.0 per cent lives in slums. Out of the total 370 non-metropolitan class
I cities, 31 cities have reported more than 50 per cent of its population living in slums. Andhra Pradesh has 10 such cities, Telangana has 8, Maharashtra and West Bengal have four and three such cities respectively (Chart 2).
BASIc INfRASTRUcTURE AND SERvIcE DELIvERY
Basic services are the key determinants of quality of life in urban areas. The state of infrastructure in India has undergone significant changes in the past decade. India has made substantial investment in improving the infrastructure and basic amenities through various schemes and programmes but a wide gap still exists between the demand and supply of basic services.
Table 5 brings out the strong relationship between the size of the cities and availability of civic services. The access to civic services is higher in larger cities as compared to smaller cities. The status of basic services in the metropolitan cities as a group, as also separately for the class IA and IB cities, is uniformly better than the non-metropolitan class I cities of India. While the percentage of households having access to safe drinking water from the tap situated within premises is 51.4 per cent for the non-metropolitan class I cities on an average, for metropolitan cities it is as high as 68.1 per cent (census 2011). Among the metropolitan cities, 74.0 per cent
Owned House Rented House
Class IA 59.4 40.6
Class IB 70.6 29.4
Metropolitan India 68.9 31.1
Non-metropolitan Class I cities
70.83 29.17
Urban India 69.2 30.8
Source: Calculations based on Census of India data.
Distribution of houses by ownership, 2011(% of houses)
Table 4:

Housing situation analysis
April 2016 Volume 17 No.1- SHELTER | 87
of the households in class IA cities have access to treated tap water as compared to 57.4 per cent in class IB.
The access to latrine facility within premises is similar for both metropolitan and non-metropolitan class I cities. However, the access to flush latrine facility with piped sewer within the premises, was quite starking between the big and small cities. While 62.1 per cent of the households in the metropolitan cities (70.0 per cent in class IA and 46.8 per cent in class IB) have access to flush latrine facility with piped sewer within the premises, the coverage for the non-metropolitan class I cities was alarmingly low at
28.2 per cent. This figure of access to flush latrine with piped sewer within premises is even lower than the urban India figure of 32.7 per cent as a whole.
In terms of the household access to waste water outlet connected to closed drainage, the same pattern was observed, with just 38.4 per cent of the households being connected in the non-metropolitan class I cities, as against 74.2 per cent in the metropolitan cities (85.3 per cent in IA and 57.9 per cent in IB) and 44.5 per cent of the households in urban India as a whole.
In terms of access to electricity, both metropolitan and non-metropolitan class I cities fair better with 97.5 per
Indicators India Urban India
IA IB Metropolitan cities
Non-metropolitan Class I cities
Source of drinking water tap water from treated source within premises
32.0 62.0 74.0 57.4 68.1 51.4
Electricity as the main source of lighting
67.2 92.7 98.2 96.6 97.5 93.3
Households having latrine facility within the premises
46.9 81.4 88.1 89.7 87.7 84.5
Households having flush latrine facility with piped sewer within the premises
11.9 32.7 70.0 46.8 62.1 28.2
Households having bathroom within the premises
42.0 77.5 91.2 85.7 88.7 79.4
Households having waste water outlet connected to closed drainage
18.1 44.5 85.3 57.9 74.2 38.4
Source: Calculation based on Census of India data, 2011
Source: Calculations based on Census of India data, 2011
Basic infrastructure in metropolitan and non-metropolitan class I cities (2011)Table 5:
(% households)
Non-metropolitan Cities with Slum Population of more than 50 per cent (2011)chart 2:
97.691.6
90.0
84.0
79.0
75.2
72.0
69.0
68.9
67.9
67.6
66.7
66.0
65.8
64.8
63.9
62.8
57.6
56.9
56.7
55.9
55.1
55.0
53.7
53.2
52.7
52.2
52.1
51.8
51.6
50.5
0 10 20 30 40 50 60 70 80 90 100
Narasaraopet UA
Dharmavaram (M)
Achalpur (M Cl)
Nizamabad (M Corp.)
Rajnandgaon (M Corp.)
Sehore UA
Adoni UA
Eluru UA
Machilipatnam (M)
Ongole UA
Etah UA
Korba UA
Tenali (M)
Ramagundam UA
Chirala UA
Dankuni UA
Malegaon UA
Hathras UA
Mancherial UA
Sitamarhi UA
Bid (M Cl)
Jangipur UA
Adilabad UA
Nandyal UA
Suryapet UA
Guntakal (M)
Dhulian UA
Kothagudem UA
Jagtial UA
Kamptee UA
Siddipet UA
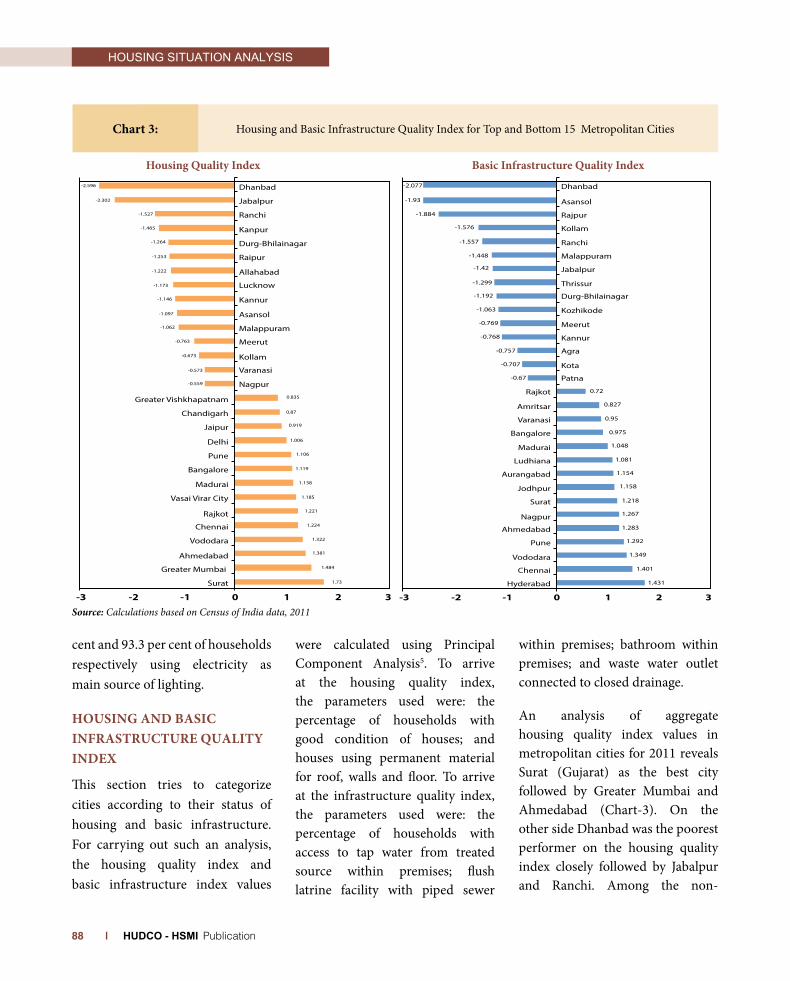
Housing situation analysis
| HUDCO - HSMI Publication 88
cent and 93.3 per cent of households respectively using electricity as main source of lighting.
HOUSING AND BASIc INfRASTRUcTURE QUALITY INDEx
This section tries to categorize cities according to their status of housing and basic infrastructure. For carrying out such an analysis, the housing quality index and basic infrastructure index values
were calculated using Principal Component Analysis5. To arrive at the housing quality index, the parameters used were: the percentage of households with good condition of houses; and houses using permanent material for roof, walls and floor. To arrive at the infrastructure quality index, the parameters used were: the percentage of households with access to tap water from treated source within premises; flush latrine facility with piped sewer
within premises; bathroom within premises; and waste water outlet connected to closed drainage.
An analysis of aggregate housing quality index values in metropolitan cities for 2011 reveals Surat (Gujarat) as the best city followed by Greater Mumbai and Ahmedabad (Chart-3). On the other side Dhanbad was the poorest performer on the housing quality index closely followed by Jabalpur and Ranchi. Among the non-
2 310-1-2-3
Surat
Greater Mumbai
Ahmedabad
Vododara
Chennai
Rajkot
Vasai Virar City
Madurai
Bangalore
Pune
Delhi
Jaipur
Chandigarh
Greater Vishkhapatnam
Nagpur
Varanasi
Kollam
Meerut
Malappuram
Asansol
Kannur
Lucknow
Allahabad
Raipur
Durg-Bhilainagar
Kanpur
Ranchi
Jabalpur
Dhanbad
-1.465
-2.596
-2.302
-1.527
-1.264
-1.253
-1.222
-1.173
-1.146
-1.097
-1.062
-0.763
-0.673
-0.573
-0.559
0.835
0.87
0.919
1.006
1.106
1.119
1.138
1.185
1.221
1.224
1.322
1.381
1.484
1.73
2 310-1-2-3
Hyderabad
Chennai
Vododara
Pune
Ahmedabad
Nagpur
Surat
Jodhpur
Aurangabad
Ludhiana
Madurai
Bangalore
Varanasi
Amritsar
Rajkot
Patna
Kota
Agra
Kannur
Meerut
Kozhikode
Durg-Bhilainagar
Thrissur
Jabalpur
Malappuram
Ranchi
Kollam
Rajpur
Asansol
Dhanbad
-1.93
-2.077
-1.884
-1.576
-1.557
-1.448
-1.42
-1.299
-1.192
-1.063
-0.769
-0.768
-0.757
-0.707
-0.67
0.72
0.827
0.95
0.975
1.048
1.081
1.154
1.158
1.218
1.267
1.283
1.292
1.349
1.401
1.431
Housing Quality Index Basic Infrastructure Quality Index
Source: Calculations based on Census of India data, 2011
Housing and Basic Infrastructure Quality Index for Top and Bottom 15 Metropolitan Citieschart 3:
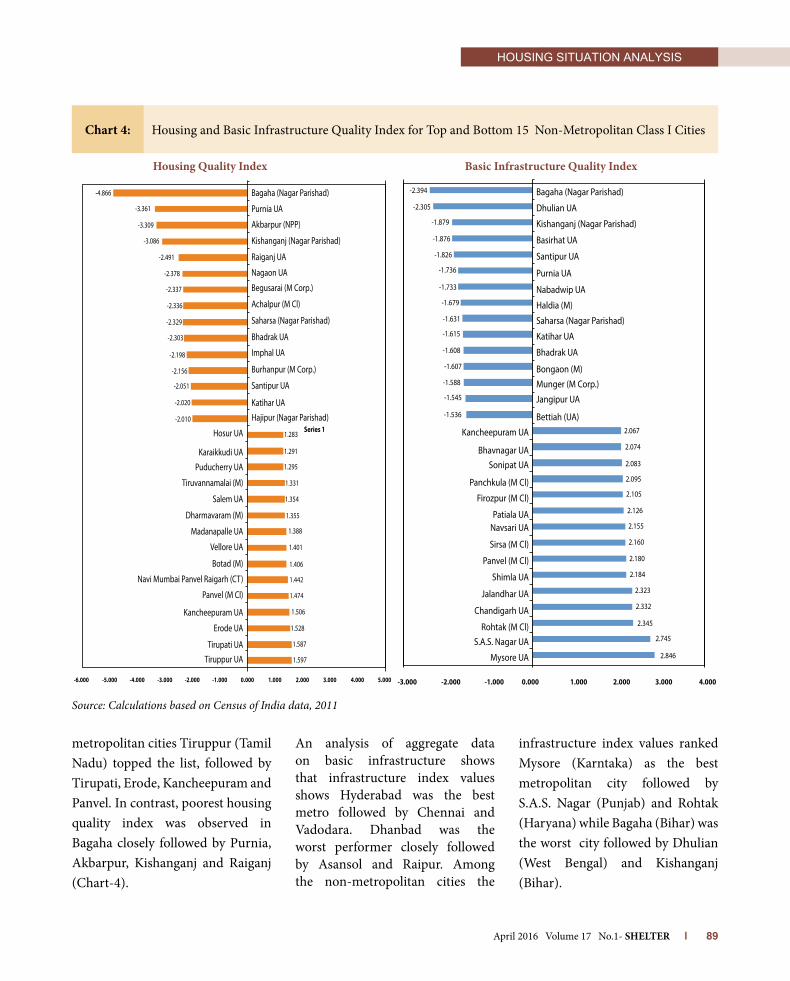
Housing situation analysis
April 2016 Volume 17 No.1- SHELTER | 89
metropolitan cities Tiruppur (Tamil Nadu) topped the list, followed by Tirupati, Erode, Kancheepuram and Panvel. In contrast, poorest housing quality index was observed in Bagaha closely followed by Purnia, Akbarpur, Kishanganj and Raiganj (Chart-4).
An analysis of aggregate data on basic infrastructure shows that infrastructure index values shows Hyderabad was the best metro followed by Chennai and Vadodara. Dhanbad was the worst performer closely followed by Asansol and Raipur. Among the non-metropolitan cities the
infrastructure index values ranked Mysore (Karntaka) as the best metropolitan city followed by S.A.S. Nagar (Punjab) and Rohtak (Haryana) while Bagaha (Bihar) was the worst city followed by Dhulian (West Bengal) and Kishanganj (Bihar).
Source: Calculations based on Census of India data, 2011
Tiruppur UATirupati UA
Erode UA
Kancheepuram UA
Panvel (M Cl)
Navi Mumbai Panvel Raigarh (CT)
Botad (M)
Vellore UA
Madanapalle UA
Dharmavaram (M)
Salem UA
Tiruvannamalai (M)
Puducherry UA
Karaikkudi UA
Hosur UA
Hajipur (Nagar Parishad)Katihar UA
Santipur UA
Burhanpur (M Corp.)
Imphal UA
Bhadrak UA
Saharsa (Nagar Parishad)
Achalpur (M Cl)
Begusarai (M Corp.)
Nagaon UA
Raiganj UA
Kishanganj (Nagar Parishad)
Akbarpur (NPP)
Purnia UA
Bagaha (Nagar Parishad)
0.000 1.000 2.000 3.000 4.000 5.000-1.000-2.000-3.000-4.000-5.000-6.000
Series 1
-4.866
-3.361
-3.309
-3.086
-2.491
-2.378
-2.337
-2.336
-2.329
-2.303
-2.198
-2.156
-2.051
-2.020
-2.010
1.283
1.291
1.295
1.331
1.354
1.355
1.388
1.401
1.406
1.442
1.474
1.506
1.528
1.587
1.597 Mysore UA
S.A.S. Nagar UARohtak (M Cl)
Chandigarh UA
Jalandhar UA
Shimla UA
Panvel (M Cl)
Sirsa (M Cl)
Navsari UAPatiala UA
Firozpur (M Cl)
Panchkula (M Cl)
Sonipat UABhavnagar UA
Kancheepuram UA
Bettiah (UA)
Jangipur UA
Munger (M Corp.)Bongaon (M)
Bhadrak UA
Katihar UA
Saharsa (Nagar Parishad)
Haldia (M)
Nabadwip UA
Purnia UA
Santipur UA
Basirhat UA
Kishanganj (Nagar Parishad)
Dhulian UA
Bagaha (Nagar Parishad)
0.000 1.000 2.000 3.000 4.000-1.000-2.000-3.000
2.846
2.745
2.345
2.332
2.323
2.184
2.180
2.160
2.155
2.126
2.105
2.095
2.083
2.074
2.067
-1.536
-1.545
-1.588
-1.607
-1.608
-1.615
-1.631
-1.679
-1.733
-1.736
-1.826
-1.876
-1.879
-2.305
-2.394
Housing Quality Index Basic Infrastructure Quality Index
Housing and Basic Infrastructure Quality Index for Top and Bottom 15 Non-Metropolitan Class I Citieschart 4:

Housing situation analysis
| HUDCO - HSMI Publication 90
cONcLUSION
The policies and programmes on housing and basic amenities needs to take into consideration the size of the city. Metropolitan cities in India are better off than their non-metropolitan counterparts. Also, it would be erroneous to treat all non-metropolitan cities as a homogeneous group as wide disparities exist even in this group with regard to their access to housing and basic amenities.
The cities that are good in both housing and basic infrastructure can be considered as ‘’good practice group’’ which can be replicated by other cities. All these cities have a governance structure, good economic base and infrastructure service delivery mechanism in place. Similar cities among the non-metropolitan group have the potential to improve the level of services further through better policies, planning, financing and incentive structures. Strategic planning and development of these cities can help in decongesting metropolitan cities.
The cities which are visibly deficient in the housing and basic infrastructure can be classified as ’laggered’. The current service level is extremely low compared to that required to sustain the economic productivity of these cities in the coming years. The cumulative gap of urban service delivery over the past many years has to be
compensated by larger investments in the coming years. The urban local bodies in such cities do not have the capacity to invest in augmenting the level of services. Therefore, additional central and state assistance is required to address these deficiencies.
Either housing quality or basic infrastructure is low in average category of cities. These cities are finding it difficult to improve the shortfall as they do not have the repaying capacity. Strengthening the local tax base of the ULBs in these cities may help in improving the overall scenario. Centrally sponsored schemes could improve the level of housing and infrastructure in these cities. Also, institutional funds are needed to be chanellised to these cities through housing and infrastructure finance companies at a low rate of interest to overcome the shortfall.
NOTES
1 Metropolitan cities have population of 1 million or more. In non-metropolitan class I cities population ranges between 1 lakh or more but less than 1 million.
2 The Census of India 2011 does not provide data for housing conditions and households amenities for all 416 non-metropolitan class I cities/UAs. Thus in this chapter the analysis is limited to 360 non-metropolitan class I cities/UAs for which the data was available in Census of India 2011.
3 The 8 big metros are Greater Mumbai, Delhi, Kolkatta, Chennai, Bangalore, Hyderabad, Ahmadabad and Pune.
4 All urban areas with a municipality, corporation, cantonment board or notified town area committee, etc are called as statutory towns.
5 Principal component analysis (PCA) is a mathematical procedure that uses orthogonal transformation to convert a set of observations of possibly correlated variables into a set of values of linearly uncorrelated variables called principal components. PCA is the simplest of the true eigenvector-based multivariate analyses. Often, its operation can be thought of as revealing the internal structure of the data in a way that best explains the variance in the data. It is a commonly used method of factor analysis, used to develop indices from a set of possibly correlated variables. It is supposed to be one of the better ways of indexation, because this method derives its weightages from the sets of data; instead of the researcher extraneously supplying with the set of weightages based on understanding of the data sets and assumptions.
AcKNOwLEDGEMENT
This paper is based on the research study” Status of Demographic, Economic, Social Structures Housing and Basic Infrastructure of the different size classes of urban settlements in India” conducted at the National Institute of Urban Affairs (NIUA), New Delhi, under the HUDCO Chair project during the period 2012-15.
REfERENcESKundu, A. 2011. ‘Trends and Processes of
Urbanization in India’, Urbanization and Emerging Population Issues -6, Human Settlements Group (IIED) and Population and Development Branch, UNFPA. Accessed from from http://pubs.iied.org/10597IIED.html. Accessed on 25/4/2012.
Kundu, Debolina and Dibyendu Samanta (2011) “Redefining the Inclusive Urban Agenda in India” Economic & Political Weekly, Vol xlvi no 5
Registrar General of India, Census of India 2001 and 2011
United Nations Department of Economic and Social Affairs (UNDESA, 2012), World Urbanization Prospects: The 2014 Revision.
Housing situation analysis
RAJEEV MALHOTRA The Government of India brought out the National Urban Housing & Habitat Policy 2007 which sought to earmark land for EWS/LIG groups in new housing projects for the provision of affordable housing. Subsequently, schemes like JNNURM, RAY etc. were launched to address the housing related issues. Further, looking at the shortage of housing, Government of India launched a Mission “PMAY-Housing for All (Urban) by 2022” in 2015 and proposed to provide several incentives for affordable housing to the urban poor. In the National Capital Region, the NCR participating states have also brought out policies related to affordable housing which are under implementation. This paper examines the existing policies at the level of central government as well as at the level of NCR states, with a view to estimate the requirement of housing in NCR. Assessment of demand supply gap of housing in NCR has been done using Census-2011 data. The paper proposes to review the affordable housing policies of the states in the NCR region.
BAckgROundHousing is a basic necessity and an important component of human settlement planning & development, as it provides security and increases household and national income. It has become a top priority of the government to address the issue of housing demand. According to the 2011 census, India has a population of 1.2 billion, out of which around 31.1per cent or 377 million people reside in urban areas. The level of
urbanization is expected to reach the 50 per cent mark in the next 2-3 decades due to the factors of rural-urban migration, urban-urban migration and natural growth.
On one hand, urban India has high housing shortage, on the other hand there is a massive and rapidly growing stock of vacant houses (MOSPI, 2013). The Report of the Technical Group on Urban Housing Shortage (MHUPA, 2012) has estimated that about 18.78 million households grapple with housing shortage in urban India. It is evident that demand for affordable housing and urban infrastructure/ services is increasing and cities are struggling to cope with the demand. On the demand side, factors like growing middle class, income levels of the people, high urbanization, etc. and on the supply side, factors like lack of availability of land, finance at reasonable rate, infrastructure, legal/ regulatory framework, limitations of the private sector and other stakeholders to provide low income housing, etc. play a major role. Addressing these factors require appropriate funding models, robust regulatory framework and pro-active participation of all the stakeholders so as to improve the availability as well as quality of housing in India.
INITIATIVES FOR AFFORDABLE HOUSING IN NATIONAL CAPITAL REGION
Rajeev Malhotra ([email protected]) is Advisor to National Capital Region Planning Board, Ministry of Urban Development, Government of India and former Chief Regional Planner with the same organisation.
The highest number of vacant houses is in ncT-delhi sub-region (11.1 per cent) and the least is in Rajasthan sub-region (8.5 per cent). In the urban areas of ncR, Rajasthan sub-region has the highest proportion of vacant houses accounting for 16.2 per cent, followed by uttar Pradesh and Haryana where the percentage of vacant houses was 12.9 per cent and 12.5 per cent respectively.
April 2016 Volume 17 No.1- SHELTER | 91

Housing situation analysis
| HUDCO - HSMI Publication 92
Being one of the most dynamic urban regions in India, the National Capital Region (NCR) is also faced with the problem of housing. Despite the planning efforts and provisions of infrastructure services, the paying capacity of individuals does not match the prevalent real estate prices. Hence, the availability of houses at reasonable prices has become a vital issue and has invited the attention of policy makers, planners and implementation authorities, so as to make urbanization a positive force in economic development.
AFFORdABLE HOuSIng In IndIAn cOnTEXTAffordable housing is a generic concept and corresponds to the income level of individuals. Globally, accepted definition of affordable housing is that the cost of housing should not be more than 30 percent of a household’s gross income. This includes taxes and insurance for owners, and utility costs.
As per the task force on Affordable Housing for All, headed by Shri Deepak Parekh, if the cost does not exceed four times the household gross annual income or if EMI/ rent
does not exceed 30 percent of the household’s gross monthly income, it can be categorised as affordable housing for the Economically Weaker Section (EWS)/ Low Income Group (LIG) category. Similarly, for MIG category the cost shall be within five times the household gross annual income or EMI/ rent should not exceed 40 per cent of the household’s gross monthly income to categorise it as affordable.
In India the issue of affordable housing is largely associated with EWS and LIG categories of the society. Until the announcement of the new housing mission, the prevailing income definition of an EWS category household was Rs. 1,00,000 per household per annum, whereas a household with annual income between Rs.1,00,001 to Rs.2,00,000 was identified as an LIG household. Recognizing the demand for housing and the need to ensure its affordability, the government of India launched a Mission “Housing for All (Urban) by 2022” in June 2015 under the “Pradhan Mantri Awas Yojana” and this mission has redefined the income levels of EWS and LIG categories. As per the mission guidelines, households having an annual income up to Rs.3,00,000 come under the category of EWS and those with an annual income between Rs.3,00,001 and Rs.6,00,000 come under the category of LIG (MoHUPA, Revised Pradhan Mantri Awas Yojana Guidelines, 2016) in order to give a wider coverage of beneficiaries under the programme. States/UTs have been given the freedom and flexibility in the guidelines to redefine the annual income
Constituent Areas of National Capital RegionMap 1:
Source: Regional Plan-2021 for NCR

Housing situation analysis
April 2016 Volume 17 No.1- SHELTER | 93
criteria as per local conditions, in consultation with the central government.
HOuSIng ScEnARIO OF ncR NCR is a unique example of inter-state regional planning and development with NCT-Delhi as its core. NCR Planning Board prepared a regional plan for NCR with the perspective year 2021, which was notified in 2005. NCR covers an area of 33,578 sq. kms. (Map-1)1 and includes nine districts of Haryana sub-region, six districts of UP sub-region and one district of Rajasthan sub-region, apart from NCT-Delhi. The proposed population for the year 2021 as per the Regional Plan 2021 is 64.14 million (NCRPB, 2005).
Housing StockAn analysis to assess the demand supply gap in housing for the National Capital Region (NCR) has been carried out, based on census data. Out of the total census houses,
89.5 per cent were occupied and the remaining 10.5 per cent were vacant, as shown in Table 1.
The highest number of vacant houses is in NCT-Delhi sub-region (11.1 per cent) and the least is in Rajasthan sub-region (8.5 per cent). In the urban areas of NCR, Rajasthan sub-region has the highest proportion of vacant houses accounting for 16.2 per cent, followed by Uttar Pradesh and Haryana where the percentage of vacant houses was 12.9 per cent and 12.5 per cent respectively. In the NCR’s rural areas, NCT-Delhi has the highest percentage of vacant houses (18.1 per cent), followed by Haryana and Uttar Pradesh Sub-Region, where the percentage of vacant houses was 8.6 per cent and 7.5 per cent respectively. Sub-region wise occupancy details of houses is given in Table-1. The figures conclude that as much as 10.5 per cent of the housing stock is lying vacant in NCR, which needs to be pooled into the market, especially for rental usage.
condition of HousesQualitative analysis of the housing stocks used for residential purposes in NCR reveals that while 58.9 per cent of these houses are in good condition, 37.9 per cent are in livable condition and 3.2 per cent houses are in dilapidated condition. Proportion of good2 houses in NCR is more in the urban areas (64.7 per cent) whereas the proportion of livable3 houses (48.0 per cent) is more in rural areas. NCT Delhi has the highest percentage of good quality houses in NCR (66 per cent). A sub-region wise detail about condition of housing stock is given in Table 2.
The percentage of dilapidated4 houses is more in rural areas (4.2 per cent) as compared to urban areas (2.6 per cent) in NCR. About 54 per cent houses in Haryana and U.P sub-regions have been classified as good quality housing.
Housing OwnershipCensus 2011 data on the status of ownership of houses reveal that 79.3 per cent of the houses in NCR are self-owned houses, whereas 18.2 per cent fall under ‘rented’ category (Table 3). The Technical Group on Urban Housing Shortage (MHUPA, 2012) has added “any other” category in the status of ownership to include those living in employer provided housings, etc. If 2.5 per cent of ‘any other’ category is added to the rented category, than the percentage of rented category will increase to 20.7 per cent. The percentage of owned houses is the highest in Rajasthan sub-region (94.6 per cent) and the lowest in NCT-Delhi sub-region (68.2 per
Sub-region No of Census Houses
Vacant Census Houses & %
Occupied Census Houses & %
NCT-Delhi 46,05,555(100%)
5,12,691(11.1%)
40,92,864(88.9%)
Haryana 30,77,746(100%)
3,20,333(10.4%)
27,57,413(89.6%)
Rajasthan 9,95,261(100%)
84,473(8.5%)
9,10,788(91.5%)
Uttar Pradesh 37,01,439(100%)
3,80,509(10.3%)
33,20,930(89.7%)
NCR 1,23,80,001(100%)
12,98,006(10.5%)
1,10,81,995(89.5%)
Source: Census of India, 2011 & Author’s Analysis
Number of Census Houses and their OccupancyTable 1:

Housing situation analysis
| HUDCO - HSMI Publication 94
cent). It is seen that 28.2 per cent of the houses in Delhi fall under the rented category.
dEMAnd And SuPPLy gAPAs mentioned earlier the total number of census houses in 2011 out-numbers the households in absolute terms, but in fact 68.8 per cent houses are used primarily for residential purposes. The demand-supply gap has been calculated based on the census data 2011 and methodology given in Box-1.
Sub-region wise details and break-up of urban-rural housing stock, along with analysis is given in Table-4. Perusal of the analysis reveals that there is an overall excess of 815,586 houses in NCR. The break-up being 640,520 housing units in NCR urban area and 175,066 housing units in NCR rural area. In Delhi sub-region, the number of houses in excess is 403,347 units; in Haryana sub-region it is 178,330 units; in UP sub-region it is 259,962 units and in Rajasthan sub-region it is 53,521 units.
SlumsIn India, about 65.4 million people were living in the slums in 2613 towns in 2011, out of which 6.1 percent were living in NCR (2.7 percent in NCT Delhi). Delhi continued to face the problem of mushrooming growth of Jhuggi-Jhopri (JJ) Clusters and 14.4 percent of the total HHs in Delhi Municipal Corporation were living in slums, in 2011. The slums occupy land pockets belonging to government departments, Delhi Cantonment
Board, Departments of Delhi Government and other autonomous organizations. Sub-Region wise slum population of NCR in 2011 is given in Table 5. This table indicates the demand for affordable housing for the slum population, which is about 13.9 per cent of the total urban population in NCR.
gOVERnMEnT OF IndIA InITIATIVES FOR HOuSIng
The National Urban Housing & Habitat Policy- 2007 (MOHUPA, 2007) sought to earmark land for EWS/LIG groups in new housing projects for provision of affordable housing for this segment of the population with the following key
Sub-regionHouses used primarily for residential purpose
No. of Good houses and %
No. of Liveable houses and %
Dilapidated houses and %
NCT-Delhi
Total 33,40,538 21,96,865(65.80%)
10,50,216(31.40%)
93,457(2.80%)
Rural 79,115 43,703(55.20%)
32,432(41.00%)
2,980(3.80%)
Urban 32,61,423 21,53,162(66.00%)
10,17,784(31.20%)
90,477(2.80%)
Haryana
Total 20,44,045 11,00,800(53.90%)
8,57,712(42.00%)
85,533(4.20%)
Rural 10,84,069 5,07,728(46.80%)
5,21,166(48.10%)
55,175(5.10%)
Urban 9,59,976 5,93,072(61.80%)
3,36,546(35.10%)
30,358(3.20%)
Rajasthan
Total 6,28,913 3,73,320(59.40%)
2,35,448(37.40%)
20,145(3.20%)
Rural 5,05,266 2,87,255(56.90%)
1,99,830(39.50%)
18,181(3.60%)
Urban 1,23,647 86,065(69.60%)
35,618(28.80%)
1,964(1.60%)
Uttar Pradesh
Total 25,04,632 13,49,401(53.90%)
10,84,373(43.30%)
70,858(2.80%)
Rural 12,21,758 5,40,235(44.20%)
6,35,293(52.00%)
46,230(3.80%)
Urban 12,82,874 8,09,166(63.10%)
4,49,080(35.00%)
24,628(1.90%)
NCR
Total 85,18,128 50,20,386(58.90%)
32,27,749(37.90%)
2,69,993(3.20%)
Rural 28,90,208 13,78,921(47.70%)
13,88,721(48.00%)
1,22,566(4.20%)
Urban 56,27,920 36,41,465(64.70%)
18,39,028(32.70%)
1,47,427(2.60%)
Source: Census of India, 2011 & Author’s Analysis
Condition of Housing Stock-2011Table 2 :

Housing situation analysis
April 2016 Volume 17 No.1- SHELTER | 95
features:
i) Focus on affordable housing for all, with an emphasis on inclusive urban planning thus increasing the supply of land and addressing the housing shortages;
ii) Reservation of 10-15 per cent of land in every new public/ private housing projects or 20-25 per cent of Floor Area Ratio (FAR) for Economically Weaker Sections (EWS)/Lower Income Group (LIG);
iii) Emphasis on private sector participation through the
use of tools like Transferable Development Rights (TDR), additional FAR, and mechanisms to facilitate land assembly by the private sector;
iv) Recognition of the need for subsidy coupled with suitable financial instruments to establish a flow of institutional finance to the poor for housing.
Sub-regions Status Urban % of status of ownership Rural % of status of
ownership Total % of status of ownership
NCT-Delhi
Owned 22,14,621 67.9% 64,682 81.8% 22,79,303 68.2%
Rented 9,29,112 28.5% 12,347 15.6% 9,41,459 28.2%
Any Other 1,17,690 3.6% 2,086 2.6% 1,19,776 3.6%
Total 32,61,423 100.0% 79,115 100.0% 33,40,538 100.0%
Haryana
Owned 6,94,301 72.3% 10,37,661 95.7% 17,31,962 84.7%
Rented 2,40,185 25.0% 33,301 3.1% 2,73,486 13.4%
Any Other 25,490 2.7% 13,107 1.2% 38,597 1.9%
Total 9,59,976 100.0% 10,84,069 100.0% 20,44,045 100.0%
Rajasthan
Owned 98,741 79.9% 4,96,412 98.2% 5,95,153 94.6%
Rented 22,821 18.5% 4,778 0.9% 27,599 4.4%
Any Other 2,085 1.7% 4,076 0.8% 6,161 1.0%
Total 1,23,647 100.0% 5,05,266 100.0% 6,28,913 100.0%
U.P.
Owned 9,67,073 75.4% 11,80,816 96.6% 21,47,889 85.8%
Rented 2,82,158 22.0% 25,781 2.1% 3,07,939 12.3%
Any Other 33,643 2.6% 15,161 1.2% 48,804 1.9%
Total 12,82,874 100.0% 12,21,758 100.0% 25,04,632 100.0%
NCR
Owned 39,74,736 70.6% 27,79,571 96.2% 67,54,307 79.3%
Rented 14,74,276 26.2% 76,207 2.6% 15,50,483 18.2%
Any Other 1,78,908 3.2% 34,430 1.2% 2,13,338 2.5%
Total 56,27,920 100.0% 28,90,208 100.0% 85,18,128 100.0%
Source: Housing Census Data Tables, Census of India, 2011 & Author’s Analysis
Ownership of Census HousesTable 3 :
i) Total number of houses available for accommodation has been calculated by reducing the total dilapidated houses from the total available housing stock given by Census of India, 2011. [Total housing stock available for accommodation = (Total number of houses used primarily for Residential purpose -Total number of dilapidated houses) + Total vacant Census houses.]
ii) Gap in housing demand is calculated by deducting the number of houses required from the number of houses available for accommodation.
[Housing Gap = Total housing stock available – Number of houses required]
Methodology Used for Calculating the Demand-Supply Gap of HousingBox 1 :

Housing situation analysis
| HUDCO - HSMI Publication 96
Government of India has been addressing the issue of housing shortage by launching housing schemes, focused on socially and economically deprived persons living in urban and rural areas. The Jawaharlal Nehru National Urban Renewal Mission (JNNURM) was launched by the Government of India in December 2005 for a period of 7 years with two components: ‘Basic Services to Urban Poor’ (BSUP); and ‘Integrated Housing and Slum Development Programme’ (IHSDP) to deal with housing, slum development, urban poverty and improving access to water, sanitation, health, education, etc. (JNNURM, 2005 & 2011). BSUP and IHSDP were subsumed in Rajiv
Awas Yojana (RAY) in the Twelfth five year plan, with the following main features:
i) It was based on a holistic approach envisaging in-situ rehabilitation of slums so that the livelihood opportunities of the beneficiaries are not disrupted.
ii) It mandated giving property rights to slum dwellers by enacting suitable legislation which earmarks 20-25 percent of developed land in real estate projects for constructing houses for the EWS/ LIG category and also earmarking of atleast 25 per cent of municipal budget for the benefit of urban poor.
Rajiv Awas Yojana (RAY) envisaged a “Slum Free India” by creating inclusive and equitable cities in which every citizen has access to basic civic infrastructure and social amenities and decent shelter (MOHUPA, 2012). Affordable Housing in Partnership scheme, launched by GOI in 2009, was also merged with RAY subsequently.
The Government of India launched “PMAY-Housing for All (urban) by 2022” mission with the objective that every family will have access to a pucca house with water connection, toilet facilities and 24x7 electricity supply by the time the nation completes 75 years of its independence (PIB, 2015). The mission, which covers all statutory
Sub-Region wise Ur-ban/rural/ Total
Sub-re-gion wise Census Population 2011 (In Lakhs)
No. of House-holds or No. of Houses required
Total no. of census houses available
Total Occupied houses
No. of houses primarily used for residential purpose
Total no of Vacant houses
Total Di-lapidated Houses
Total Dwelling Units available( 6+7-8 )
Housing demand/ excess( 9-3 )
1 2 3 4 5 6 7 8 9 10
Delhi- U 163.69 3356425 4,481,133 3,990,998 3,261,423 490,135 90,477 3,661,081 304,656
Delhi- R 4.19 79574 1,24,422 101,866 79,115 22,556 2,980 98,691 19,117
Delhi- T 167.88 3356425 4,605,555 4,092,864 3,340,538 512,691 93,457 3,759,772 403,347
Haryana- U 47.73 985120 1,431,048 1,252,293 959,976 178,755 30,358 1,108,373 123,253
Haryana- R 62.58 1115395 1,646,698 1,505,120 1,084,069 141,578 55,175 1,170,472 55,077
Haryana- T 110.31 2100515 3,077,746 2,757,413 2,044,045 320,333 85,533 2,278,845 178,330
Rajasthan-U 6.54 128203 212,967 178,362 123,647 34,605 1,964 156,288 28,085
Rajasthan-R 30.2 511517 782,294 732,426 505,266 49,868 18,181 536,953 25,436
Rajasthan-T 36.74 639720 995,261 910,788 628,913 84,473 20,145 693,241 53,521
U.P. - U 70.39 1317514 1,889,173 1,645,379 1,282,874 243,794 24,628 1,502,040 184,526
U.P. - R 75.37 1236807 1,812,266 1,675,551 1,221,758 136,715 46,230 1,312,243 75,436
U.P. - T 145.76 2554321 37,01,439 3,320,930 2,504,632 380,509 70,858 2,814,283 259,962
NCR- U 288.35 5787262 8,014,321 7,067,032 5,627,920 947,289 147,427 6427782 640,520
NCR- R 172.34 2943293 4,365,680 4,014,963 2,890,208 350,717 122,566 3,118,359 175,066
NCR- T 460.69 8730555 12,380,001 11,081,995 8,518,128 1,298,006 269,993 9,546,141 815,586
Sub-Region wise Demand and Supply Gap of Houses in NCRTable 4 :
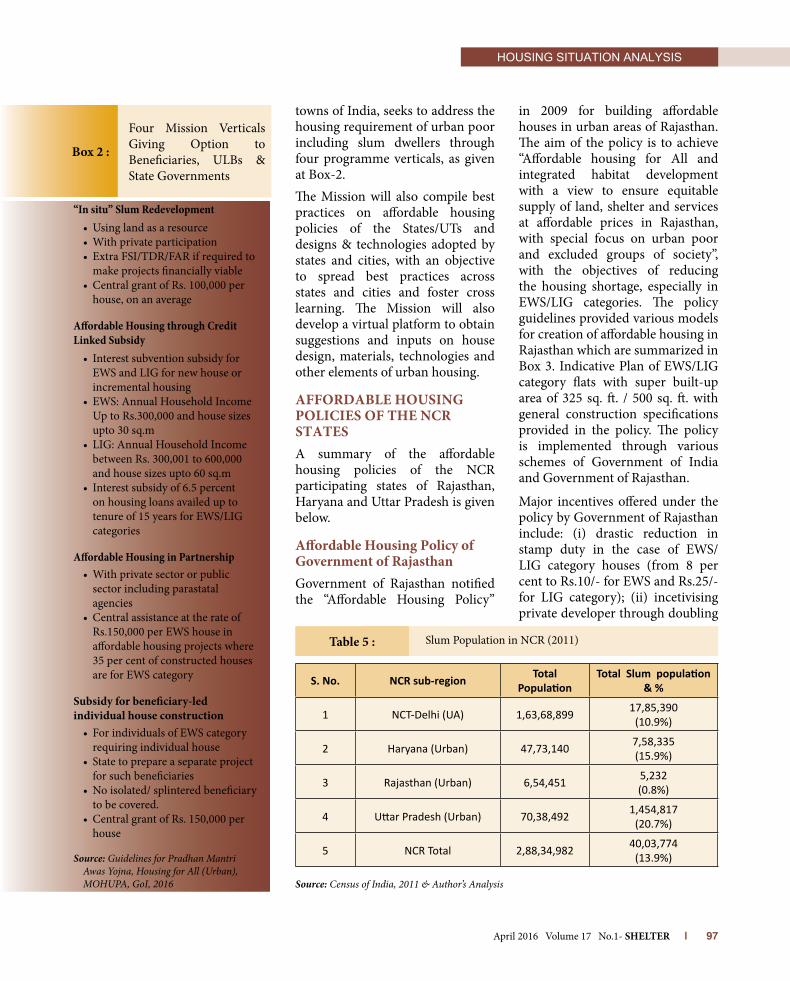
Housing situation analysis
April 2016 Volume 17 No.1- SHELTER | 97
towns of India, seeks to address the housing requirement of urban poor including slum dwellers through four programme verticals, as given at Box-2. The Mission will also compile best practices on affordable housing policies of the States/UTs and designs & technologies adopted by states and cities, with an objective to spread best practices across states and cities and foster cross learning. The Mission will also develop a virtual platform to obtain suggestions and inputs on house design, materials, technologies and other elements of urban housing.
AFFORdABLE HOuSIng POLIcIES OF THE ncR STATESA summary of the affordable housing policies of the NCR participating states of Rajasthan, Haryana and Uttar Pradesh is given below.
Affordable Housing Policy of government of RajasthanGovernment of Rajasthan notified the “Affordable Housing Policy”
in 2009 for building affordable houses in urban areas of Rajasthan. The aim of the policy is to achieve “Affordable housing for All and integrated habitat development with a view to ensure equitable supply of land, shelter and services at affordable prices in Rajasthan, with special focus on urban poor and excluded groups of society”, with the objectives of reducing the housing shortage, especially in EWS/LIG categories. The policy guidelines provided various models for creation of affordable housing in Rajasthan which are summarized in Box 3. Indicative Plan of EWS/LIG category flats with super built-up area of 325 sq. ft. / 500 sq. ft. with general construction specifications provided in the policy. The policy is implemented through various schemes of Government of India and Government of Rajasthan.
Major incentives offered under the policy by Government of Rajasthan include: (i) drastic reduction in stamp duty in the case of EWS/LIG category houses (from 8 per cent to Rs.10/- for EWS and Rs.25/- for LIG category); (ii) incetivising private developer through doubling
S. No. NCR sub-region Total Population
Total Slum population & %
1 NCT-Delhi (UA) 1,63,68,899 17,85,390(10.9%)
2 Haryana (Urban) 47,73,140 7,58,335(15.9%)
3 Rajasthan (Urban) 6,54,451 5,232(0.8%)
4 Uttar Pradesh (Urban) 70,38,492 1,454,817(20.7%)
5 NCR Total 2,88,34,982 40,03,774(13.9%)
Source: Census of India, 2011 & Author’s Analysis
Slum Population in NCR (2011)Table 5 :
“In situ” Slum Redevelopment• Usinglandasaresource•Withprivateparticipation• ExtraFSI/TDR/FARifrequiredto
make projects financially viable• CentralgrantofRs.100,000per
house, on an average
Affordable Housing through Credit Linked Subsidy • Interestsubventionsubsidyfor
EWS and LIG for new house or incremental housing
• EWS:AnnualHouseholdIncomeUp to Rs.300,000 and house sizes upto 30 sq.m
• LIG:AnnualHouseholdIncomebetween Rs. 300,001 to 600,000 and house sizes upto 60 sq.m
• Interestsubsidyof6.5percenton housing loans availed up to tenure of 15 years for EWS/LIG categories
Affordable Housing in Partnership •Withprivatesectororpublic
sector including parastatal agencies
• CentralassistanceattherateofRs.150,000 per EWS house in affordable housing projects where 35 per cent of constructed houses are for EWS category
Subsidy for beneficiary-led individual house construction • ForindividualsofEWScategory
requiring individual house • Statetoprepareaseparateproject
for such beneficiaries • Noisolated/splinteredbeneficiary
to be covered. • CentralgrantofRs.150,000per
house
Source: Guidelines for Pradhan Mantri Awas Yojna, Housing for All (Urban), MOHUPA, GoI, 2016
Four Mission Verticals Giving Option to Beneficiaries, ULBs & State Governments
Box 2 :
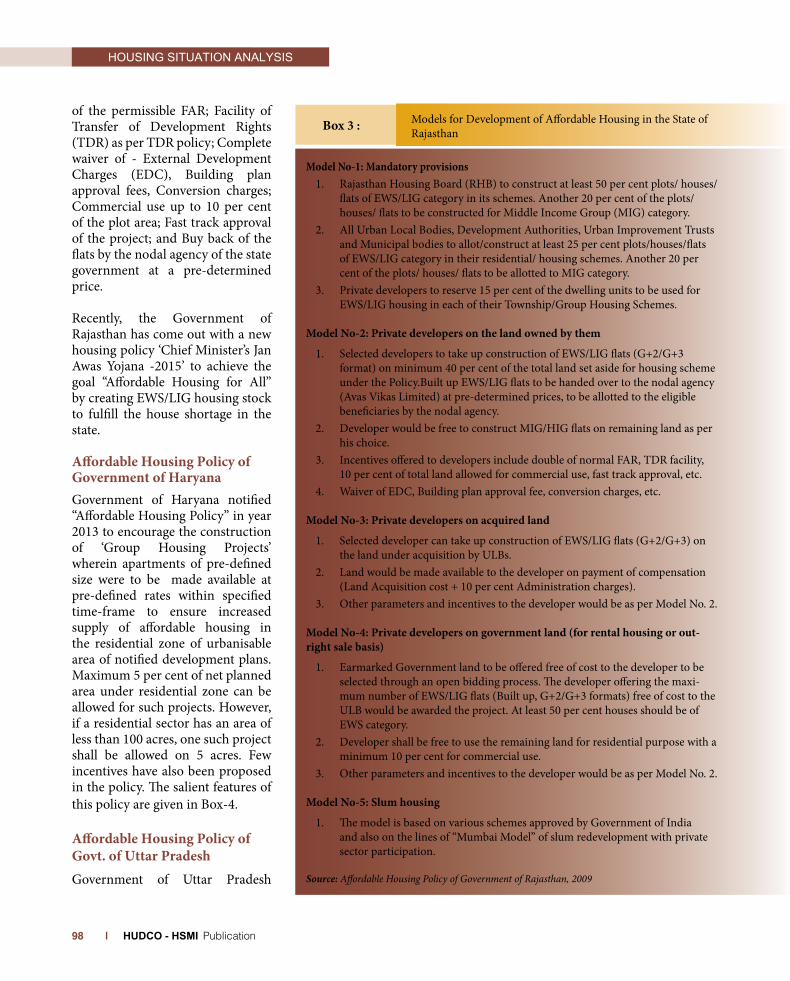
Housing situation analysis
| HUDCO - HSMI Publication 98
of the permissible FAR; Facility of Transfer of Development Rights (TDR) as per TDR policy; Complete waiver of - External Development Charges (EDC), Building plan approval fees, Conversion charges; Commercial use up to 10 per cent of the plot area; Fast track approval of the project; and Buy back of the flats by the nodal agency of the state government at a pre-determined price.
Recently, the Government of Rajasthan has come out with a new housing policy ‘Chief Minister’s Jan Awas Yojana -2015’ to achieve the goal “Affordable Housing for All” by creating EWS/LIG housing stock to fulfill the house shortage in the state.
Affordable Housing Policy of government of HaryanaGovernment of Haryana notified “Affordable Housing Policy” in year 2013 to encourage the construction of ‘Group Housing Projects’ wherein apartments of pre-defined size were to be made available at pre-defined rates within specified time-frame to ensure increased supply of affordable housing in the residential zone of urbanisable area of notified development plans. Maximum 5 per cent of net planned area under residential zone can be allowed for such projects. However, if a residential sector has an area of less than 100 acres, one such project shall be allowed on 5 acres. Few incentives have also been proposed in the policy. The salient features of this policy are given in Box-4.
Affordable Housing Policy of govt. of uttar PradeshGovernment of Uttar Pradesh
Models for Development of Affordable Housing in the State of RajasthanBox 3 :
Model No-1: Mandatory provisions1. Rajasthan Housing Board (RHB) to construct at least 50 per cent plots/ houses/
flats of EWS/LIG category in its schemes. Another 20 per cent of the plots/ houses/ flats to be constructed for Middle Income Group (MIG) category.
2. All Urban Local Bodies, Development Authorities, Urban Improvement Trusts and Municipal bodies to allot/construct at least 25 per cent plots/houses/flats of EWS/LIG category in their residential/ housing schemes. Another 20 per cent of the plots/ houses/ flats to be allotted to MIG category.
3. Private developers to reserve 15 per cent of the dwelling units to be used for EWS/LIG housing in each of their Township/Group Housing Schemes.
Model no-2: Private developers on the land owned by them
1. Selected developers to take up construction of EWS/LIG flats (G+2/G+3 format) on minimum 40 per cent of the total land set aside for housing scheme under the Policy.Built up EWS/LIG flats to be handed over to the nodal agency (Avas Vikas Limited) at pre-determined prices, to be allotted to the eligible beneficiaries by the nodal agency.
2. Developer would be free to construct MIG/HIG flats on remaining land as per his choice.
3. Incentives offered to developers include double of normal FAR, TDR facility, 10 per cent of total land allowed for commercial use, fast track approval, etc.
4. Waiver of EDC, Building plan approval fee, conversion charges, etc.
Model no-3: Private developers on acquired land
1. Selected developer can take up construction of EWS/LIG flats (G+2/G+3) on the land under acquisition by ULBs.
2. Land would be made available to the developer on payment of compensation (Land Acquisition cost + 10 per cent Administration charges).
3. Other parameters and incentives to the developer would be as per Model No. 2.
Model no-4: Private developers on government land (for rental housing or out-right sale basis)
1. Earmarked Government land to be offered free of cost to the developer to be selected through an open bidding process. The developer offering the maxi-mum number of EWS/LIG flats (Built up, G+2/G+3 formats) free of cost to the ULB would be awarded the project. At least 50 per cent houses should be of EWS category.
2. Developer shall be free to use the remaining land for residential purpose with a minimum 10 per cent for commercial use.
3. Other parameters and incentives to the developer would be as per Model No. 2.
Model no-5: Slum housing
1. The model is based on various schemes approved by Government of India and also on the lines of “Mumbai Model” of slum redevelopment with private sector participation.
Source: Affordable Housing Policy of Government of Rajasthan, 2009

Housing situation analysis
April 2016 Volume 17 No.1- SHELTER | 99
prepared “Affordable Housing Policy” in year 2014 to encourage the construction of ‘Affordable Housing’ for the EWS and LIG category in the State. Some of the incentives proposed in the policy are given in Box-5.
cOncLuSIOnIt is evident that various types of policies, guidelines and missions have been formulated by the central government and NCR participating state governments to address the housing related issues and to provide good quality houses at affordable rates. As the implementation of such policies is a long drawn process, the objectives of the policies and earlier mission could not be achieved fully. In view of this the new Mission “Housing
for All by 2022” was launched by the Government of India in 2015-16 and the results of the same will be visible after 4-5 years. Analysis of census 2011 data for housing has indicated that surplus housing is available in the region in the MIG and higher category. However, there is an urgent need to expedite efforts to achieve the targets as envisaged in the central and state level polices and guidelines towards the creation of good quality housing at affordable rates. Following recommendations emerge out of the earlier mentioned facts and analysis:i) The implementing agencies
like Development Authorities, Housing Boards, Urban Local Bodies, Slums/ Shelter
Improvement Boards, etc. working in districts/ towns of the NCR should join hands and make concerted efforts in providing affordable housing in a time bound manner.
ii) Looking at the availability of surplus housing of MIG and higher category in NCR, it is recommended that the component of affordable housing should be increased to meet the demand for this category.
iii) The draft rental housing policy should be brought into effect at the earliest to fill the demand supply gap in this category because everybody may not be interested in owning a house due to various reasons and prefer rental housing.
i) Projects to be allowed only in residential zone of notified Development Plans.
ii) Maximum project areas fixed as 300 acres for Gurgaon, Faridabad, Panchkula, Panchkula Extension & Pinjore-Kalka; 150 acres for Sonipat, Panipat, Karnal, Dharuhera, Bahadurgarh & Sohna and 75 acres for rest of the towns/cities within the urbanisable area limits of development plans.
iii) Licenses to be issued on First-Come-First-Serve basis.iv) Maximum 5 per cent of net planned area under residential
zone can be allowed for such projects.v) If a residential sector has an area of less than 100 acres,
one such project shall be allowed on 5 acres.vi) Maximum area permitted in each residential sector is 10
acres.vii) Such projects can be allowed beyond the 20 per cent
group housing limit in a sector viii) Commercial component of 4 per cent is allowed in the
project ix) Maximum rate for the apartment units already fixed. x) Up to 5 per cent of the total number can be allotted by a
licensee to its employees/ associates/ friends/ relatives etc. Source: Affordable Housing Policy of Government of Haryana, 2013
i) Affordable houses to be constructed in public, private and cooperative sectors for EWS and LIG category families with providing cross subsidy of 10 per cent in each category in all new residential schemes.
ii) Centrally sponsored ‘Affordable Housing in Partnership Scheme’ to be implemented to provide housing for urban poor at economical rate.
iii) Density to be increased in the projects where affordable housing is to be provided.
iv) Maximum 5 per cent of net planned area under residential zone can be allowed for such projects.
v) Affordable housing to be constructed with Private Sectors by the Awas Vikas Parishad and Development Authorities.
vi) Low cost material and technological innovative ways may be used for such housing.
vii) In order to implement the EWS and LIG housing projects, convergence of resources under various central and state government schemes of various departments may be done.
viii) Incentives will be given to the EWS and LIG category people in the form of rebate in the change of landuse charges, development charges, stamp duty, etc. at the time of purchase of houses.
Source: Affordable Housing Policy of Government of U.P. 2013
Box 4 : Salient Features for Development of Affordable Housing in the State of Haryana
Salient Features for Development of Affordable Housing in the State of UP
Box 5 :

Housing situation analysis
| HUDCO - HSMI Publication 100
nOTES1covers the area in the Regional Plan 2021 for NCR, as notified in 2005. This does not include the newly added districts.2Such census houses which do not require any repair and are in fairly good condition. 3Census houses which need minor repairs are recorded in this category. 4Such census houses which show signs of decay or those breaking down and required major repairs and are far from being in condition that can be restored or repaired are considered as dilapidated.
REFEREncESDeptt., H. T. (2013), Affordable Housing
Policy. Retrieved Feb. 25, 2016, from Town and Country Planning Department, Government of Haryana: http://tcpharyana.gov.in/notifications%20&%20judgements/Notification_AFFORDABLE_HOUSING_POLICY_2013_Finalised%2018.08.2013.pdf
Deptt., R. U. (2009), Affordable Housing Policy, 2009. Retrieved Feb. 25, 2016, from Department of Urban Development, Housing and Local Self Government, Government of Rajasthan: https://www.jaipurjda.org/pdf/others/Affordable_Housing_PolicyDec2009.pdf
Deptt., U. H. (2014). Affordable Housing Policy.
Retrieved Feb. 25, 2016, from Housing and Urban Planning Department, Government of U.P.: http://awas.up.nic.in/
JNNURM (2005 & 2011), Jawaharlal Nehru National Urban Renewal Mission. Retrieved Feb. 28, 2016, from Jawaharlal Nehru National Urban Renewal Mission, The Ministry of Urban Development, Government of India: http://jnnurm.nic.in/wp-content/uploads/2011/01/PMSpeechOverviewE.pdf
KPMG. (2010), KPMG Affordable Housing in India. Retrieved Feb. 25, 2016, from KPMG Pvt. Ltd.: http://www.kpmg.com/IN/en/IssuesAndInsights/ThoughtLeadership/Affordable_Housing.pdf
MHUPA. (2012), Report of the Technical Group on Urban Housing Shortage (TG-12) (2012-17). Retrieved March 01, 2016, from The Ministry of Housing and Urban Poverty Alleviation, Government of India: http://www.nbo.nic.in/Images/PDF/urban-housing-shortage.pdf
MOHUPA. (2007), National Urban Housing and Habitat Policy. Retrieved Feb. 28, 2016, from The Ministry of Housing & Urban Poverty Alleviation, Government of India: http://mhupa.gov.in/writereaddata/NUHHP_2007.pdf
MOHUPA (2012), Rajiv Awas Yojana (RAY). Retrieved Feb. 28, 2016, from The Ministry of Housing and Urban Poverty Alleviation,
Government of India: http://mhupa.gov.in/writereaddata/02-RAY-Guidelines.pdf
MOHUPA (2016, 03), Revised Pradhan Mantri Awas Yojana Guidelines. Retrieved March 2016, from The Ministry of Housing and Urban Poverty Alleviation, Government of India: http://mhupa.gov.in/writereaddata/HFA_guidelines_March2016-English.pdf
MORD. (1985), Indira Awas Yojana. Retrieved Feb. 25, 2016, from Ministry of Rural Development, Government of India: http://iay.nic . in/net iay/IAY%20revised%20guidelines%20july%202013.pdf
MOSPI. (2013). Statistical Report, Chapter-28 on Housing. Retrieved March 01, 2016, from The Ministry of Statistics and Programme Implementation, Government of India: http://mospi.nic.in/Mospi_New/upload/SYB2013/CH-28-HOUSING/HOUSING%20-%20WRITEUP.pdf
NCRPB. (2005), Regional Plan-2021 for NCR. Retrieved Feb. 02, 2016, from National Capital Region Planning Board, Ministry of Urban Devlopment, Government of India: http://ncrpb.nic.in/regionalplan2021.php
PIB. (2015), Housing for All by 2022” Mission. Retrieved March 02, 2016, from Press Information Bureau, Government of India: http://pib.nic.in/newsite/PrintRelease.aspx?relid=122576
BOOk ReVIew TOwaRDS CLeaN aND HyGIeNIC CITIeS aND VILLaGe By a.k.JaIN
Discovery Publishing House, New Delhi, ISBN-978-93-5056-787-6, p.236, Price Rs. 2,500
The Government of India has launched the Swachh Bharat Abhiyan (Clean India Campaign), which aims to achieve cleanliness by better solid and liquid waste management in 4041 cities and 600,000 villages in the country. The campaign aims to build 1 million individual toilets, 256,000 public toilet seats and plans to help the people by a better solid waste management. The total expenditure envisaged for urban mission is Rs. 630 billion.
The book ‘Towards Clean and Hygienic Cities and Villages’ by A.K. Jain provides a roadmap in making the environment cleaner, hygienic and sustainable.
The author advocates a comprehensive and integrated approach for toilets and sanitation, solid waste management, liquid waste treatment and cleaning the, rivers and water bodies. According to him the technical solutions are inadequate by themselves, which need to be related to socio-cultural, financial, legal and institutional frameworks are integrated
with the mission.
The book explores innovative solutions in urban solid and liquid waste management, waste to energy technology, water less toilets, pneumatic waste collection etc.
The author states that to implement Swachh Bharat Abhiyan, there is an urgent need for capacity building and skill development of the municipalities. There is a limitation to public-private partnerships. Other options, like the compulsory and competitive tendering, where the municipalities also compete with the private
sector may be explored.
The book ‘Towards Clean and Hygienic Cities and Villages’ is an indispensable resource for capacity building and skill development, particularly for all those involved with planning of cities, sanitation and environment.
Book reviewed by: Shri. D.k Saluja,([email protected]), Former Director, Delhi Development authority, Delhi.

HUDCO AWARDED BEST PRACTICES
April 2016 Volume 17 No.1- SHELTER | 101
BACKGROUNDConsistent with its mission to produce graduate students that are sensitive to their community and societal needs, the institute actively pursues community outreach programs. One such community outreach activity is the welfare of temporary construction workers and their families through decent housing, sanitation and educational programs for their children through the group “Nyasa”. “Nyasa” in Sanskrit means “trust” and at Indian Institute of Technology, Gandhi Nagar (IITGN), the word means stretching out our “trustworthy” hands to help little children and their families dream of a better life under their temporary thatched huts.
Started in 2011, Nyasa primarily aims to support and educate the children of migrant construction workers in and around the campus neighborhoods. The collective strength of IITGN in education was used as a platform to bring the children from dusty environs to an open air school within their temporary campus in Chandkheda. This provided the children quality time through education and entertainment while their parents were away at work. The children were taught the basic alphabets, script, rhymes, songs and arithmetic. Music, fun events,
periodic health camps, etc. were part of the routine. Between 20-30 children of construction workers were served by Nyasa programmes at the temporary campus. Buoyed by the support of students and IITGN, Nyasa has implemented the same model at the Institute’s permanent campus, which is presently under construction. Two Nyasa schools at the permanent campus in Palaj cater to the needs of nearly 200 children of construction workers.
Nyasa’s second mission is to cater to the housing needs of the migrant workers for the duration of construction. To achieve this mission, respectable and sanitary housing for the families of construction workers and a safe environment for their children to play and learn, was provided at the construction site.
ESTABLISHMENT OF PRIORITIESIITGN is seeking to build an innovative campus in Palaj village in Gandhinagar District. The institute resolved that promoting the welfare of the construction workers involved in the building of the campus would be among the innovative practices, it would implement, both at the new campus as well as on its current temporary campus. Even before construction began, provision
of housing and basic sanitation facilities for the construction workers along with education and support to their children was prioritized. The children’s education was focused on exposing them to general awareness, skill building and interactive learning sessions.
MOBILISATION OF RESOURCESThe staff, students and faculty have all contributed their time, skills and financial resources to support Nyasa activities as voluntary community service. Currently Nyasa has 55 active volunteers and steadfast support from the IITGN governing body. Nyasa receives donations of money and goods from well-wishers, alumni, friends, family of staff and students. Sarva Shiksha Abhiyan also supported the IITGN endeavor by providing an additional teacher for the welfare of these kids. Under various governmental schemes, children are being provided lunch, snacks (like seasonal fruits, biscuits, etc.,) everyday through IITGN community.
The Institute also undertook special initiatives for construction worker welfare through policy decisions and construction rules
CONSTRUCTION WORKER WELFARE PROGRAMMES AT INDIAN INSTITUTE OF
TECHNOLOGY GANDHINAGAR

HUDCO AWARDED BEST PRACTICES
| HUDCO - HSMI Publication 102
it developed for its new campus. Provision of satisfactory housing for construction workers was made an explicit condition of the contracts
issued by the Institute and this was implemented as a required condition in all construction activities.
PROCESS
Initially, IITGN volunteers initiated outreach efforts through door-to-door campaign to encourage migrant construction workers to allow their children to receive education through Nyasa. Various
attractions such as play time, toys, snacks, mid-day meals etc. were used as tools. After receiving parental approval, the IITGN community members started weekly open air classes.
The challenge of this initiative was to accumulate adequate volunteering time of IITGN members. Further, IITGN has members from all over the country with limited Gujarati knowledge. Time and language thus proved to the biggest hurdles in implementing this initiative. To accomplish this, a teacher with good knowledge of Hindi and Gujarati was appointed to assist the team. Strategies were developed and constantly refined with experience and the advice of active volunteers of Nyasa.
These steps turned the weekend school into a regular open-air school. Depending on the age group, activities like life skill building, sports, arts, singing, drama, etc., were organized, in addition to education. The IITGN community also celebrated various festivals like Uttarayan, kite flying, Diwali, Holi etc., with the children.
As the construction of the new IITGN campus began, many more
temporary workers became involved with Nyasa. For smooth and speedy progression of the campus, workers were provided accommodation near the construction site. Good quality semi-permanent housing, electricity, pure drinking water (RO water) facility, common sanitation and disposal facilities were provided at no cost to them. This was achieved by obligating and binding construction companies to provide decent housing to the migrant workers.
IITGN imposed a special condition in the tender document, which required the bidder to construct clean, hygienic and well ventilated housing for workers, together with adequate potable water supply, electricity and sanitation facilities etc., at no additional cost to IITGN. The land for housing shall be provided free by IITGN for this purpose. Housing for 150 ±10% workers shall be constructed within one month from the date of start, failing which a recovery will
A ‘real’ roadside housing colony of migrant construction workers
Good quality roofed housing near the construc-tion site.
Accessible clean drinking water and sani-tation facilities.
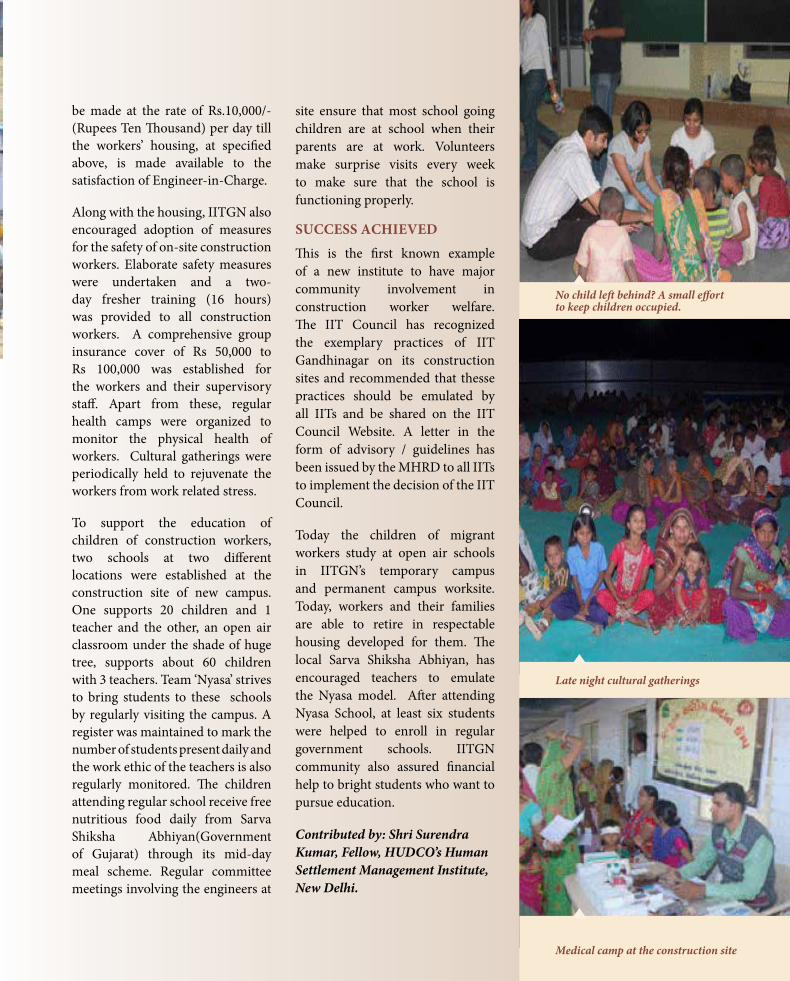
103Medical camp at the construction site
be made at the rate of Rs.10,000/- (Rupees Ten Thousand) per day till the workers’ housing, at specified above, is made available to the satisfaction of Engineer-in-Charge.
Along with the housing, IITGN also encouraged adoption of measures for the safety of on-site construction workers. Elaborate safety measures were undertaken and a two-day fresher training (16 hours) was provided to all construction workers. A comprehensive group insurance cover of Rs 50,000 to Rs 100,000 was established for the workers and their supervisory staff. Apart from these, regular health camps were organized to monitor the physical health of workers. Cultural gatherings were periodically held to rejuvenate the workers from work related stress.
To support the education of children of construction workers, two schools at two different locations were established at the construction site of new campus. One supports 20 children and 1 teacher and the other, an open air classroom under the shade of huge tree, supports about 60 children with 3 teachers. Team ‘Nyasa’ strives to bring students to these schools by regularly visiting the campus. A register was maintained to mark the number of students present daily and the work ethic of the teachers is also regularly monitored. The children attending regular school receive free nutritious food daily from Sarva Shiksha Abhiyan(Government of Gujarat) through its mid-day meal scheme. Regular committee meetings involving the engineers at
site ensure that most school going children are at school when their parents are at work. Volunteers make surprise visits every week to make sure that the school is functioning properly.
SUCCESS ACHIEVEDThis is the first known example of a new institute to have major community involvement in construction worker welfare. The IIT Council has recognized the exemplary practices of IIT Gandhinagar on its construction sites and recommended that thesse practices should be emulated by all IITs and be shared on the IIT Council Website. A letter in the form of advisory / guidelines has been issued by the MHRD to all IITs to implement the decision of the IIT Council.
Today the children of migrant workers study at open air schools in IITGN’s temporary campus and permanent campus worksite.Today, workers and their families are able to retire in respectable housing developed for them. The local Sarva Shiksha Abhiyan, has encouraged teachers to emulate the Nyasa model. After attending Nyasa School, at least six students were helped to enroll in regular government schools. IITGN community also assured financial help to bright students who want to pursue education.
Contributed by: Shri Surendra Kumar, Fellow, HUDCO’s Human Settlement Management Institute, New Delhi.
Late night cultural gatherings
No child left behind? A small effort to keep children occupied.
HUDCO AWARDED BEST PRACTICES
| HUDCO - HSMI Publication 104
VIRTUAL CIVIC CENTER & CITIZEN’s CONNECT
Surat Municipal Corporation
BACKGROUNDSurat Municipal Corporation (SMC) has harnessed the power of IT before it became ubiquitous and a necessity for an organization of its size. SMC is one of the very few local self-governments to adopt computerization in its early phase and initiated its use for better governance. SMC was the first urban local self-government to start computerization in 1979. The corporation had developed and implemented computerized payroll, property tax, vehicle tax and pension systems between 1982-85. The corporation adopted a computerized accrual based double entry accounting system in 1992 and formulated its own information technology policy and plan.
SMC has adopted and implemented information technology based tools in the area of e-Governance and m-Governance with a view to improve service delivery and bring in efficiency and transparency in municipal operations. SMC has a portfolio of over 45 applications including several municipal services like birth & death registration, shops & establishment licenses, marriage registration building plan approval and property tax & other revenue collection.
The corporation has taken various initiatives and has adopted innovative practices spanning across the functions of municipal corporation with a view to provide best in class civic amenities including. The various citizen centric initiatives includes city civic centers (citizen facilitation center), mobile tax collection van, touch screen based information kiosk, and single number helpline.
SMC has started city civic center or citizen facilitation center for rendering citizen centric services to the citizens in the year 2003. There were 16 such centers. The usage of these centers increased steadily over a period of time. It was also observed that the number of transactions increases substantially during the rebate period and billing period. During this period, citizens need to stand in queue to pay their dues. As a practice, the number of collection counters are increased during this period so as to handle the rush and reduce the transaction processing time. Despite opening additional counters, the city civic center staff faced difficulty in meeting the expectations of the people.
Moreover, the working hours of SMC’s civic center and other
business/offices are similar, which sometimes makes it difficult for citizens to visit SMC offices. Citizen has to either keep the business closed or take leave from work to get the work done at SMC.
The virtual civic center was planned to overcome the limitation of conventional physical civic center/ citizen facilitation centers and acts as an add-on service delivery channel.
ESTABLISHMENT OF PRIORITIESTo overcome the geographical, demographical and time barriers attached with the conventional physical city civic center (CSC/CFC) it was thought to explore alternate channel of service delivery which provides convenient mode of obtaining services to citizen. With the emerging technologies and increasing use of ICT devices among citizens, SMC planned to utilize the existing IT infrastructure available for civic centers and started a virtual civic center in April 2012.
Virtual Civic Center (Anywhere – Anytime Civic Center) is a web based portal accessible through SMC’s website www.suratmunicipal.gov.in. Virtual Civic Center provides most of the services offered through

HUDCO AWARDED BEST PRACTICES
April 2016 Volume 17 No.1- SHELTER | 105
Homepage - www.suratmunicipal.gov.in
physical civic centers. With a virtual civic center, citizens can avail various services from anywhere at any time, without physically visiting any SMC offices.
MOBILISATION OF RESOURCESSMC has the in-house development team which was deployed with a view to take care of various IT requirements of SMC. The past experience and setup helped in development of the application and interface for virtual civic center. Resources from this team were mobilized to carry out necessary front-end and back-end development and to integrate them with existing IT applications. For the purpose of providing the services through physical civic centers, SMC had created the applications and databases for various applications. These desktop based applications are used by SMC employees to render services. To make these services available through virtual civic center a web based portal was created wherein all the transactions related activities are now done directly by the citizen. To enable collection of taxes and charges, the payment gateway is securely integrated with
corporation’s website and database. It was required to integrate the payment gateway to enable online payment of taxes and service charges for obtaining service. Instead of tying with only one bank, SMC has taken an approach of tying with an aggregator so that maximum no. of banks and debit/credit cards can be covered and thus the larger citizen base can be covered under the facility.
Necessary security has been placed at server, database and Network level. Other aspects such as user friendly user interface, local language support, user intimation, system security and sanctity were also of prime importance.
PROCESSThe Virtual Civic Center completely removes manual interventions of SMC employees for service delivery which is now completely automated and electronic in nature. Services are offered on-the-spot from SMC’s

| HUDCO - HSMI Publication 106
website. Various measures were taken to make the virtual civic center services easily accessible and popular amongst the citizen without any additional cost attached to it.
Several administration process reforms were carried out so that the services offered through virtual civic center do not require SMC employee intervention and are offered on-the-spot.
CITIzEN’S CONNECT-SMC Mobile ApplicationWith the increased penetration of smart phones, SMC thought of developing a Mobile App and launched its mobile application in August 2013 and became the first Municipal Corporation of India to have its mobile application. The mobile application enables the service delivery and information sharing using the latest mobile technology. It is an Android Application and can be downloaded from Google Play store free of
cost. Since, the in-house team was involved in mobile app development, no additional budgetary provisions were required to be made.
During the flood like situation in September 2013, the mobile application was used for accessing authentic and timely information
regarding rainfall and discharge from Ukai dam. Due to this application, people could access important information and services from a convinient place.
SUCCESS ACHIEVEDThis successful initiative has a high penetration and popularity among
Navigation to Virtual Civic Centre (Online Centre)
Virtual Civic Centre Homepage
HUDCO AWARDED BEST PRACTICES
HUDCO AWARDED BEST PRACTICES
April 2016 Volume 17 No.1- SHELTER | 107
citizens and is of immediate and lasting public benefit. It is low cost, easy to access and the system is replicable and scalable. The implementation of these initiatives offers satisfaction both to the organization and citizens far greater than the effort and cost.
The virtual civic center has been well received by the citizens as they can now obtain various services which were earlier rendered only through physical civic enter during working hours. These services are now accessible at citizen’s home / office located anywhere within the city, outside city from anywhere in
country and out of country at their convenient time. The virtual civic center, an extension to the physical civic center has offered an alternate channel of service which is very convenient and completely free, with no additional cost attached to it. Moreover, the service is being offered to large sections of society with extensive coverage of over 55 banks for internet banking, around 65 Debit Cards issued by various institutes/banks and Credit Cards issued by Master and Visa.
The cost of recovery is also considerably low compared to the visits to a physical city civic center,
as this mode does not require the intervention of SMC employees for rendering the service. Moreover, the employees working at the City Civic Center can provide better services due to reduced foot fall and they can be utilized for other functions also. The exhaustive portfolio of services offered along with various other features makes the Virtual Civic Center one of the best initiative in country.
Contributed by: Shri Surendra Kumar, Fellow, HUDCO’s Human Settlement Management Institute, New Delhi.
Habitat III is the United Nations Conference on Housing and Sustainable Urban Development to take place in Quito, Ecuador, from 17-20 October 2016. In resolution 66/207 and in line with the bi-decennial cycle (1976, 1996 and
2016), the United Nations General Assembly decided to convene the Habitat III Conference to reinvigorate the global commit-ment to sustainable urbanization, to focus on the implementa-tion of a New Urban Agenda, building on the Habitat II Agenda of Istanbul in 1996. Habitat III will be the first UN global summit after the adoption of the Post-2015 Development Agenda and, hopefully, a new climate change agreement. The Conference will result in a concise, focused, forward-looking and action-oriented outcome document: the New Urban Agenda.
The Conference welcomes the participation of all Member States and relevant stakeholders, including parliamentarians, civil so-ciety organizations, regional and local government and munici-pality representatives, professionals and researchers, academia, foundations, women and youth groups, trade unions, and the private sector, as well as organizations of the United Nations system and intergovernmental organizations. Habitat III offers a unique opportunity to discuss the important challenge of how cities, towns and villages are planned and managed, in order to fulfill their role as drivers of sustainable development, and hence
shape the implementation of new global development and cli-mate change goals.
THE CONFERENCE
The Conference shall be composed of eight plenary meetings, on the basis of two meetings a day, and six high-level round-table sessions to be held concurrently with the plenary meetings. The Conference will embrace parallel meetings and other events, in-cluding multi-stakeholder segments, which will constitute an of-ficial part of the Conference. Special events, including briefings, seminars, workshops, and panel discussions on issues related to housing and sustainable urban development, will be organized by Member States, organizations of the United Nations system, and accredited institutional and non-institutional stakeholders for the benefit of the participants in the Conference.
Details of this conference are available at the following websites:
Process towards Habitat III: Issue Papers and Policy Units - http://unhabitat.org/issue-papers-and- policy-units,
[email protected], www.Habitat3.org, #Habitat3, #NewUrbanAgenda
CONTACT- Habitat III Secretariat +1 (917) 367-4355
HabiTaT iii CONFERENCE

Vol 17 No. 1 April 2016
www.hudco.org
ISSN 2347 - 4912
SHELTER is an official publication ofHUDCO/HSMI, distributed free ofcharge. It deals with issues related tohousing, urban development andother themes relevant to the habitatsector. Contributions, comments andcorrespondence are most welcomeand should be forwarded to:
EDITORSHELTERHUDCO’s Human Settlement Management InstitueHUDCO House, Lodhi RoadNew Delhi- 110 003Tel: 011 -24308600/638Fax: 011-24365292Email: [email protected]
BOARD OF DIRECTORSChairman & Managing DirectorDr. M. Ravi Kanth, IAS (r )
DirectorsShri N. L. ManjokaShri Rakesh Kumar AroraShri Rajiv Ranjan Mishra, IASSmt. Jhanja Tripathy
Company SecretaryShri Harish Kumar Sharma
EDITORIAL TEAMChief Editor: Rajiv SharmaCo-Editor: Dr. Akshaya SenDr. D. Ravi ShankarMs Nila PandianCover Design: Quip DesignCover Photo Credit: Rajiv Sharma
Nila Pandian
Registered Office:HUDCO Bhawan, Core-7-A,India Habitat Centre,Lodhi Road,New Delhi - 110 003Tel(EPABX) :011-24649610-23,24627113-15,24627091,92,95After Office Hours: 24648193-95Fax:011-24625308CIN:U74899DL1970GOI005276E-Mail: [email protected]
Affordability is measured in terms of disposable income and affordablehousing is categorized in terms of cost of a house, as a proportion to the totalincome of a household. For the urban poor, the cost of affordable house shouldnot exceed five times the household gross annual income and the EMI/rentshould not exceed 30 per cent of the household’s gross monthly income. As aresult, providing affordable housing is a daunting task, particularly when thecost of building material and land prices are on the rise. The gap betweensupply and demand of low cost housing for this income category is increasing,since it is impossible to construct a house within affordable limits for thisgroup. If left to the market forces, builders will target the groups with apredictable and regular disposal income. Thus, middle income and highincome groups become an obvious choice, since they are considered bankable.Lack of market support in favour of poor households, limits the supply ofhousing for them and blocks the opportunity of aspiring households, resultingin increasing financial stress, personal underachievement and societal costs.
This is where the role of government becomes significant. Government shouldprepare a strategy to take this challenge head-on and boost the supply ofdiverse housing options. The solution is to incentivize market forces to deliverhouses for these categories. For this a three-fold strategy is needed. First is toallow private sector to construct houses for the poor on ownership basis. Thesubsidy should be passed directly to the occupants in their accounts, as donein the case of cooking gas. Second is to promote construction of rentalhousing of different sizes. The rent should be pooled to create a fund formaintenance of these complexes. Subsidies may be given to those who are inneed, again through their accounts. The choice of the occupants to move to abigger house would depend on their ability to pay and their past defaultrecord. The third is to also consider low income houses for senior citizens,destitute, single women, working men & women, daily wage earners etc. sincetheir requirements and affordability differ. The strategy of government wouldneed to address urban poor belonging to all categories, as mentioned above.
This issue of shelter addresses the issue of affordable housing through twelvearticles. Each article highlights issues pertaining to the theme, policies, casestudies and statistical review with a view to critically analyze existing policiesand prepare a roadmap to move ahead. The theme papers by Shri AK Jain,Ramakrishna Nallathiga (et.al.) and Rajiv Sharma (et.al.) highlight importantaspects of affordable housing including redensification approaches for creatingmore housing stock, rental housing and housing for vulnerable groups such assenior citizens. Prof. (Dr.) Amitabh Kundu, has shared his vision on wideranging issues relating to affordable housing. Prof. Abdul Shaban (et.al.),Anushree Deb and Dr. Mahavir Singh have reviewed three different policiespertaining to urbanization & city planning, public private partnership inaffordable housing and smart cities. The section on housing situation analysisputs forward the proportions of access to housing and basic services inmetropolitan cities, non-metropolitan cities and the national capital region.These articles cover important elements of affordable housing and I hope thatyou will enjoy reading this volume.
FROM THE CHIEF EDITOR
