aquascan tm - side scan sonars
TRANSCRIPT

AquaScan TMPrecision Side Scan Sonar
AquaScan TMPrecision Side Scan Sonar

AquaScan Overview
The AquaScan TM is a portable high‐resolution, precision side scan sonar. It is designed exclusively for shallow water seafloor surveys
up to 250 meters of slant range.
Ease of use, portability, and cost efficiency make the AquaScan TM
a perfect choice for side scan marine survey applications.
The sensor unit is extremely compact, interfaces directly to a standard laptop PC and comes complete with sensor unit and
Windows ® PC based Software

AquaScan Components
•Towfish and 50m of transmission cable weigh a total of 28lbs(12.7Kg)• 49”(124cm) in length•13”in(32.4cm) diameter at maximum diameter
•The Sensor unit weighs 2lbs(.9kgs) and is 10” x 8.6” x 2.5”(LxWxH)•The Sensor unit weighs 2lbs(.9kgs) and is 10” x 8.6” x 2.5”(LxWxH)

AquaScan Interconnection Diagram
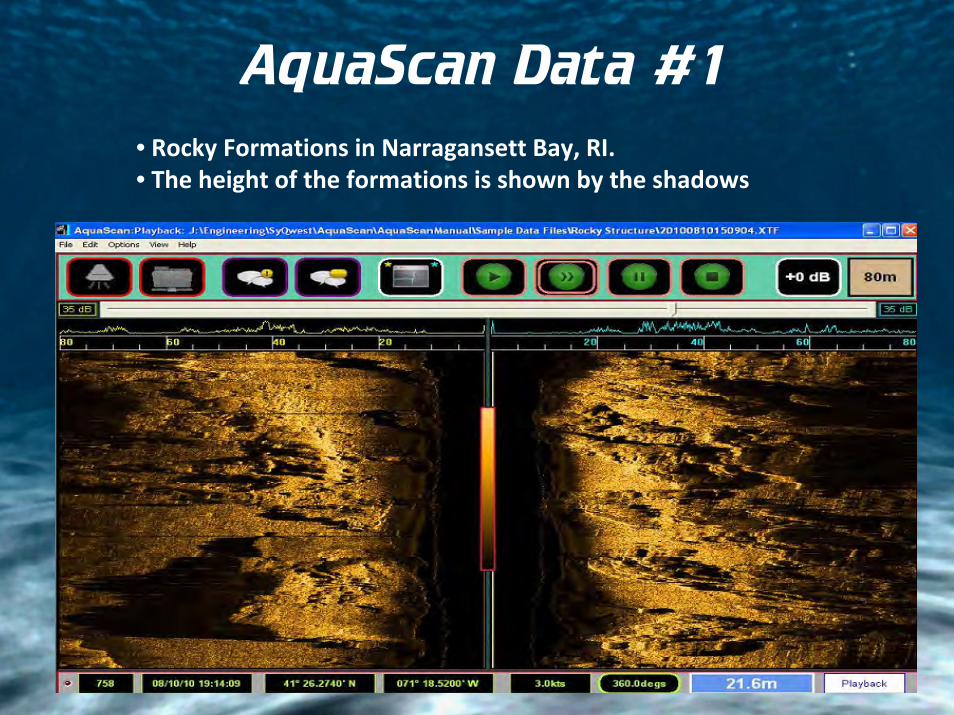
AquaScan Data #1• Rocky Formations in Narragansett Bay, RI. • The height of the formations is shown by the shadows
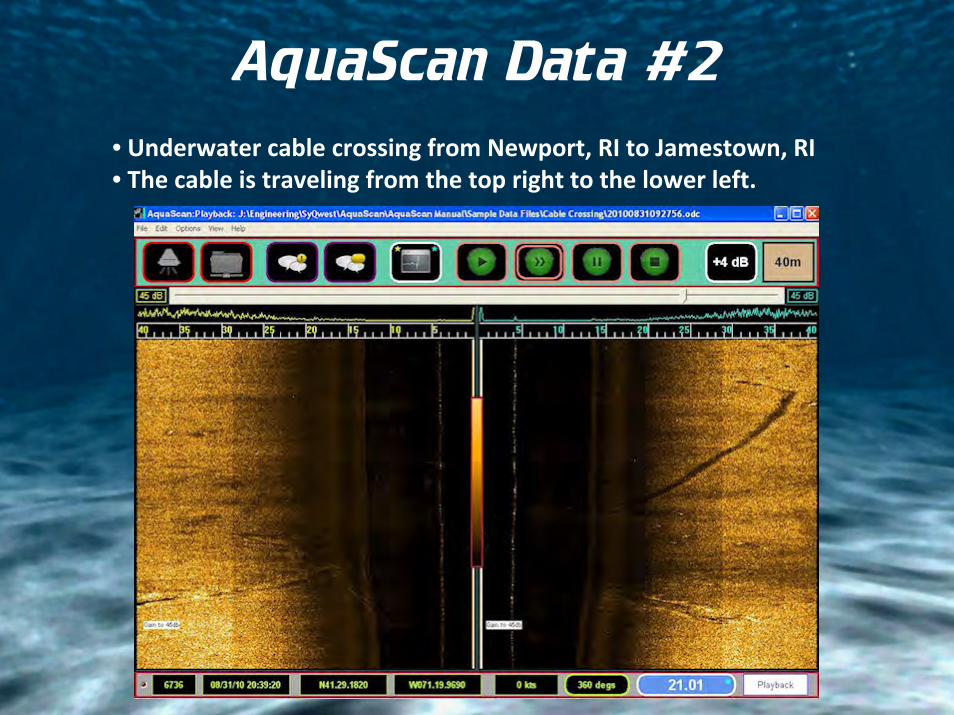
AquaScan Data #2• Underwater cable crossing from Newport, RI to Jamestown, RI• The cable is traveling from the top right to the lower left.

AquaScan Data #3
•The textured ripples recorded on the seabed show the direction of the water current.• This allows for wave attenuators to be place in the most efficient manner.•The Intensity of the current can be measured by the height and length of the sand waves.• Being able to detect the sandy bottom from the rocky bottom allows the user to plan a better route for underwater cables and structures.

The Cape Fear was a concrete‐hull freight vessel that was built in World War I. It measured 267’/46’/25’ (length/beam/draft). On October 29 1920 the Cape Fear sank to depth of 180’ in Narragansett Bay in Rhode Island after a collision with another freight ship. On August 31, 2010 SyQwest Inc. sailed into Narragansett Bay to record Images of the Cape Fear using the AquaScan.
Cape Fear

CAPE FEAR DATA #1
•This data was recorded while towing the AquaScan at a shallow depth at 3 knots.
• The Shadow of the image clearly outlines the shape of the vessel and confirms it is intact and upright.
• The Cape Fear is located 180’ below the sea surface.
• The image of the Cape Fear can be seen on the left hand side of the data acquisition screen.
•This data was recorded while towing the AquaScan at a shallow depth at 3 knots.
• The Shadow of the image clearly outlines the shape of the vessel and confirms it is intact and upright.

CAPE FEAR DATA #2
The cargo holds towards the bow of the Cape Fear are visible and approximate measurements of them are 21’x14’.
• The holes in the center of the wreck are the remnants of the bridge and measure approximately 35’x17’ .
On the Right hand side of the data acquisition screen the image of the Cape Fear is visible.The image was captured by lowering the depth of the AquaScan, using the zoom option and towing at 3 knots.
The cargo holds towards the bow of the Cape Fear are visible and approximate measurements of them are 21’x14’.
• The holes in the center of the wreck are the remnants of the bridge and measure approximately 35’x17’ .